
Federal Register/Vol. 63, No. 147/Friday, July 31, 1998/Notices

Editorial Team Editor-in-Chief
Michael Brooks, North Carolina A&T State University, United States
Associate Editors Jamie E. L. Spinney, Saint Mary's University, Canada
Kim Stansbury, Eastern Washington University, United States
Patricia Wiener, C.E.H.N. La Paz-Bolivia, Bolivia
Troy Lovata, Honors College, The University of New Mexico, United States
Editorial Assistant James Young, Redfame Publishing, United States
Editorial Board Members
Anna Maria Mouza, Greece
Anne-Marie McAlinden, United Kingdom
Aprinalistria Aprinalistria, Indonesia
Begoña Montero-Fleta, Spain
Caroline Mellgren, Sweden
Daniele Schiliro', Italy
Deirdre Warren, United States
Dimitra Anastasiou, Germany
Federica Palumbo, Italy
Iván Fumadó Ortega, Spain
Jasmine Harvey, United Kingdom
Jianquan Cheng, United Kingdom
Joan Garcia Garriga, Spain
Jorge Morales Pedraza, Cuba
Jose Antonio Amozurrutia, Mexico
Joy D. Patton, United States
Kareen N Tonsing, Singapore
Katja Eman, Slovenia
Laura K. Taylor, United States
Lee Pugalis, United Kingdom
Linda A. Chernus, United States
Ludmila M L Ribeiro, Brazil
Luigi Andrea Berto, United States
Luigia Simona Sica, Italy
Maja Gori, Germany
Mariano D. Perelman, Argentina
Matthew S. Dabros, United States
Máximo Ernesto Jaramillo Molina, Mexico
Mei-Se Chien, Taiwan
Michael Brooks, United States
Mohammed Ismail Nasarat, Jordan
Mónica Martínez, Spain
Ofer Katchergin, Israel
Paulito Valeriano Hilario, Philippines
Raymond K H Chan, China
Reem Mahmood Ramadan, Syrian Arab Republic
Remigiusz Janusz Kijak, Poland
Robert Costello, United States
Roberto Franzini Tibaldeo, Italy
Robertson Tengeh, South Africa
Satya Paul Kumar PP, India
Shahadat HOSSAIN, Germany
Sirpa Pietilä Rosendahl, Sweden
Sudershan Pasupuleti, United States
Wendy Dossett, United Kingdom
Xue Bai, China
Yaghoob Foroutan, Iran
Zitha Mokomane, South Africa
International Journal of Social Science Studies Vol. 2, No. 3; July 2014
ISSN 2324-8033 E-ISSN 2324-8041 Published by Redfame Publishing
URL: http://ijsss.redfame.com
I
Contents
Discourse Coalitions in the Controversy around the HydroAysen Project in the Patagonia Region of Chile
María Eugenia Merino, María Elena Bello 1-11
Successful Aging: Multiple Trajectories and Population Heterogeneity
Fengyan Tang 12-22
Exile as Source of Spanish Moderate Political Thinking during the First Half of Nineteenth Century
Rebeca Viguera Ruiz 23-37
Perspectives on Diversity in the Military: A Comparison between Belgium and the Netherlands
Rudy Richardson, Delphine Resteigne, Mathias Bonneu 38-49
Advancing Social Change by Synergizing Nonprofit Organizations with Common Missions
Syed Aftab Hayat 50-55
Openness, Economic Development, and the Environment in Post-Reform China: A Model with Empirical Analysis
Yanqing Jiang 56-66
Perceptions of Air Quality and Sense of Place among Women in Northeast Hamilton, Ontario, Canada
Melissa Gallina, Allison Williams 67-77
Effects of Mentoring and Assertiveness Training on Adolescents’ Self-Esteem in Lagos State Secondary Schools
Bola O. Makinde, Akin Jonathan Akinteye 78-88
Obstructive Sleep Apnea and Multiple Anthropometric Indices of General Obesity and Abdominal Obesity among Young Adults
Xiaoli Chen, Wipawan C. Pensuksan, Vitool Lohsoonthorn, Somrat Lertmaharit, Bizu Gelaye, Michelle A. Williams
89-99
Holocaust in Kolozsvar: 1944
Gabriel Mayer 100-108
Climate Change and Public Health Situations in the Coastal Areas of Bangladesh
Russell Kabir, Hafiz T.A. Khan, Emma Ball, Kay Caldwell 109-116
Reductions in HIV Stigma as Measured by Social Distance: Impact of a Stigma Reduction Campaign in a Historically Black University
Emily Locke, Angela Meshack, Ruth Githumbi, Glenn Urbach, Beau Miller, Ron Peters, Michael W. Ross
International Journal of Social Science Studies Vol. 2, No. 3; July 2014
ISSN 2324-8033 E-ISSN 2324-8041 Published by Redfame Publishing
URL: http://ijsss.redfame.com
1
Discourse Coalitions in the Controversy around the HydroAysen Project in the Patagonia Region of Chile María Eugenia Merino1 & María Elena Bello2
1 Faculty of Education, Universidad Católica de Temuco, Chile. 2 Institute of International Studies, Universidad de Chile, Chile. Correspondence : María Eugenia Merino, Faculty of Education, Universidad Católica de Temuco, Chile. Received: February 16, 2014 Accepted: March 17, 2014 Available online: April 22, 2014 doi:10.11114/ijsss.v2i3.395 URL: http://dx.doi.org/10.11114/ijsss.v2i3.395 Abstract This paper explores the discourse coalitions that became evident during the conflict around the HydroAysen hydroelectric megaproject in the Patagonia region of Chile. We explore three nodal concepts around which the coalitions were constructed and the argumentative and rhetoric strategies used. The analysis, inspired by a socio constructivist approach and based on Hajer’s argumentative method (2005), studies 40 discourse allocutions from relevant leaders and social actors publically available through national press releases and web pages between 2011 and 2012. Findings reveal the presence of two discourse coalitions holding competing views. The first coalition includes the President of the Republic of Chile and the Ministry of Energy, together with the proposing hydroelectric company. This coalition displays a neoliberal socioeconomic-oriented argumentation based on the proposition that the Chilean energy crisis can be resolved through hydroelectricity, a natural resource abundant in the Patagonia, which would bring more development and connectivity to the Aysen region. The second coalition, made up of social and environmental groups ‘Patagonia Without Dams’ and ‘Aysenines against HidroAysen’ exhibits a more socio-environmental oriented argumentation. Their narrative revolves around the absence of a national energy policy which makes the country economically vulnerable to the establishment of mega projects such as the HydroAysen project that may benefit only a few enterprises but ruin unique environments such as that in Patagonia. We conclude that these antagonistic coalitions run along assymetric processes of discursive institutionalization. Furthermore, the HydroAysen case analysis contributes to explain the way discourse coalitions contribute to the failure of Chilean democracy to build social consensus on contentious issues. Keywords: discourse coalitions: hydroelectric mega project: citizens’ voices 1. Introduction The aim of this paper is describe the discourse coalitions arising from the controversy around the proposed construction of the HydroAysen megaproject in the Patagonia region of Chile. We first explore the relevance of the problem and discuss pertinent scholarship, theoretical orientations, and our research strategy. The method section describes sample selection, size and data collection. The analysis of the data, inspired by Hajer’s argumentative method (2005), is described. This approach explores how a particular sociopolitical problem is related to the type of narrative which is problematized, discussed and argued about. Finally, in the discussion section we interpret the results of our analysis and discuss the implications of antagonistic discourse coalitions in the current debate on hydroelectricity in Chile. In Chile there is a lack of clarity about the environmental issues that concern the country, how they affect and how they are perceived by citizens (Hajek et. al, 1990). Furthermore, there is lack of regulatory regulations, no framework for environmental use, and little knowledge about the ecological effects that various ways in which water resources are used may cause (Monreal et. al., 2012). In recent years there has been widespread sociopolitical debate about the nature of the most appropriate energy matrix in Chile. The government of President Piñera, which was in power until March 2014 affirmed that by the year 2020 electricity consumption will increase by a projected 6%, meaning that an increase of 100,000 GWh of electricity will be demanded per year. In this context hydroelectric mega-project, HydroAysen from ENDESA [(National Electricity Enterprise Public Corporation.) and Colbun enterprises was proposed, entailing the
International Journal of Social Science Studies Vol. 2, No. 3; 2014
2
building of five dams in the Aysen region. This project would generate 18.430 GWh per year, however it would bring with it various negative outcomes. Six thousand hectares of Patagonic valleys would be flooded, and the impact on virgin flora and fauna would negatively impact eco-tourism, which is one of the region’s main economic activities (Castilla & Leyton, 2010). In addition to this damage to the eco-system, the destruction of natural landscape, the local population displacement, and the impediments to fish migration patterns would affect the region's population's health (Montoya-Aguilar, 2009). While the Aysen region is vulnerable to this particular proposal, it has been suggested that 45% of Chile is at risk of exposure to large projects of this type (Fuenzalida & Quiroz, 2011). In 2012 President Piñera’s government launched the ‘National Energy Strategy Plan 2012-2030’ which identified hydroelectricity as one of the pillars of the Chilean energetic matrix, and subsequently the local governmental Commission for Environmental Evaluation at Aysen approved the HydroAysen project. However, this was not supported by the general public with surveys such as that conducted by a national paper, La Tercera (2011), indicating that up to 74 % of the population opposed the project. Environmental groups that opposed the project, particularly ‘Patagonia without Represas’ and ‘Ayseninos against H.A’ argued that no opportunity to negotiate alternative solutions had been offered, so they prepared the ‘National Plan for Energy Development’, a less environmentally interventionist alternative that contemplates the introduction of nonconventional renewable energy (www.patagoniasinrepresas.cl). In the context of the lack of a national energy policy with specific regulations regarding hydroelectricity (La Nacion national paper, 2012) and the tensions between the government and ENDESA on the one side, and environmental groups on the other, since 2012 the HydroAysen hydroelectric project has been paralyzed. HydroAysen's associated enterprises are uncertain about the project's implementation (www.biobiochile.cl; Tuesday, January 28, 2014), although the project has not been discarded from the company budget. The future of the project was further muddied when there was a change of government in March 2014, and the new government, led by President Michelle Bachellet, declared that hydroelectricity and the future of HydroAysen will be subjected to ample public debate before a decision is reached. Nevertheless, in the recent debate leading up to the election, President Bachellet declared that the HydroAysen project is not feasible (The Financial Paper; Monday, June 24, 2013). Understanding discourse coalitions in the sociopolitical controversy of the HydroAysen project has theoretical and practical implications. The formulation of energy policies necessarily needs to consider the socioeconomic and political interests of the involved actors who, by means of their discourse, shape and define the problem from their particular view of reality. In the majority of cases different models of reality in interaction may generate conflicts because they may not be compatible, and one vision excludes the other. This can be observed in the current political conflict around HydroAysen whose relational dynamic leads to one coalition, that with governmental support, dominating the political arena. This however over-rides citizens and the locals’ demands so, in order to make themselves heard they use social pressure such as street demonstrations and sometimes violent actions. Finally the study of HydroAysen conflict may contribute with new knowledge to highlight and explain the failure of Chilean democracy to build social consensus on contentious matters, and at the same time it may also offer information to other democratic systems of the region on how to address institutional weaknesses and conflict, and advance toward more stable and richer democracies. Conflicts in global and local contexts World environmental problems are generally based on economic issues, where anthropocentric neoliberal logic understands natural resources as commodities and services (Tietenberg, 2001), thereby engendering conflicts between local communities and big enterprises (Folchi, 2001;Toledo et al, 2009). Routledge (2003) argued that evolving modernist governments in developing countries, as in Chile, tend to reinvent modes of coercive state legitimacy through developmental discourses that reveal practices and power strategies of elite actors. One example of this is when a government acts as a donor of national resources to powerful companies. Citizens in these countries are seen as "witnesses" whose political identity is regularly neutralized and neglected by a more technical type of discourse of development, which allows no counter voice in the political and economic arena. The importance of water, one of the most precious resources, and the struggles to dominate it (physically and discursively) has generated numerous socio-environmental conflicts. This is particularly the case when the construction of mega dam projects is proposed. This can be seen, for example in the construction of the Sanxia dam or ‘Three Gorges’ project in China. When directly affected the locals voiced their concerns, they were silenced by the Chinese government (Edmonds, 1992; Hvistendahl, 2008; SacaleWatts, 2011). In India, an organized resistance was articulated by academic technical analysis, peasant testimonials and slogans in opposition to the Sardar Sarovar mega dam built in Narmada River Valley Their opposition was overridden by the government (Rigg, 1991; Routledge, 2003) which used its narratives about water scarcity as a discursive tool to legitimize the dam, and at the same time neglect the needs of the deprived in water-limited areas (Mehta, 2001). The Ethiopian case of the Gabe dam cascade reflects a similar socio-environmental narrative pattern in which part of the affected tribes (the Omo) built rights-based discourse around
International Journal of Social Science Studies Vol. 2, No. 3; 2014
3
their cultural and heritage traditions that clashed with the government’s economic development based discourse (Abbink, 2012). Further, struggles for water resources have caused conflicts between neighboring countries, as the case of Gabcikovo and Nagymaros dams on the Danube river between Slovakia and Hungary. In the latter country a movement against the dam (the Danube Circle) was founded, demanding that the communist government release information and open debate on the dam's environmental impact. This group discursively redefined the social understanding of the dam, shifting it into a symbol of the old communist regime (Williams, 1994). A similar case involved Turkey, Syria and Iraq, when the former used the dam ‘GAP’ as a tool of political and military strategy against the latter countries (Jongerden, 2010). Clearly, conflicts arising from large scale dam projects have their origin in the polarized narratives that depict opposed world views and development models (Khagram, 2004; Abbink, 2012). To understand this Bingham (2010) analyzed in detail the conflict between the Amazon indigenous people and the proponents of the Belomonte dam in Brazil. By using Hajer´s analysis of argumentative discourse he showed that such socio environmental conflicts have their roots in opposite narratives, one holding a socio-economic based development view and the other a socio-environmental perspective, each conceptualizing reality in a different way. In other Latin America countries this dynamic is not far different. Large hydroelectric mega projects have been built in drainage areas mainly inhabited by rural aboriginal people. Such projects often threaten to reshape indigenous local territories, their economy and culture. This logic of modernization and economic development collides with the worldview of locals who share discourses and common interpretative schemas about nature, and especially water (Svampa, 2012). This can be observed in numerous countries, including El Salvador, where ‘Frente Social para un Nuevo País’ opposed the Cimarron hydroelectric project (Pérez, 2009), and Mexico, where the ‘Council of Ejidos’ and communities opposed the hydroelectric La Parota dam project’ (Landa, 2012). Conflict has also been evident in Guatemala and Panama. In Guatemala the hydroelectric DEORSA and DEOCSA projects have been opposed by the ‘National movement of indigenous rural communities’ (Hirsh & Utreras, 2010), and in Panamá there is a conflict between the Chan-75 hydroelectric project and the Ngöbe aboriginal people. In this case, Ngöbe aboriginal people have not been consulted about the dam construction, therefore violating collective indigenous rights (AIDA, 2009). In a similar line there are conflicts between countries such as Argentina and Paraguay where the binational Yacyretá project has caused serious cultural and environmental damage to indigenous Mbya people and local Argentinean fishermen (AIDA, 2009). The above cases highlight the fact that socio-environmental conflicts around the globe share a similar pattern: enterprises, generally supported by the government, make alliances with heterogeneous actors including politicians and bureaucrats (Khagram, 2004). They promulgate the idea that, despite the apparent contradictions between public and private agents, both are promoting the advancement and consolidation of entrepreneurial forms of water management. Their case is grounded on merely formal and not substantive democratic governance (Castro, 2008). In most cases socio environmental conflicts are based on weak legal and environmental policies that omit the right of consultation, participation, determination and information of the affected communities (Khagram, 2004; Castro, 2008; Ascelrad, 2010; Landa, 2012). Finally as these mega projects are generally constructed without local approval, it seems unavoidable that environmental groups and locals make alliances to fight against issues of injustice, inequity, sustainability and violations of indigenous rights. These coalitions make their opposition public and impose their vision as an alternative to dam monopolies (Shiva et al, 1991; McCully, 2001; Khagram, 2004). 2. The Current Study The epistemological basis of the present study is social constructionist (Foucault, 1984; Gergen, 1996, Hajer & Versteeg, 2005; among others) which claims that social and public phenomena are creatively, flexibly and contextually constructed by social actors in interaction. The analytic attention then moves towards the role of discourse as social practice in cognitive, evaluative and categorization processes (Edwards, 1997;Potter, 2005). From the perspective of discourse analysis, Laclau et al. (1985) and Howarth et al. (2000) state that reality cannot be directly presented but it is made through discourse which constructs a ‘representation’ of reality. Language then has the capacity to ‘make’ politics, ‘create’ signs and symbols that shift power balances, ‘render’ events harmless or, on the contrary, ‘create’ political conflicts. Our research strategy uses Hajer’s approach (1995) which studies from a discursive perspective the nature of problems of modern societies such as urban planning, technologic development policies, and environmental and energy policies. Hajer applies a discursive perspective to the formulation of political and public issues, focusing on their origin and the role of diverse actors with different backgrounds, who do not necessarily share ideological or values coherence. This approach offers greater flexibility and breadth to the study of sociopolitical phenomena such as political/environmental conflicts. The richness and innovative focus of the method lies in the fact that sociopolitical controversies are not directly derived from the complexity of ideologies and positions of involved actors but are a result of the dispute of attaching particular meanings to ideas through narrative lines. For Hajer (1993), politics is first given
International Journal of Social Science Studies Vol. 2, No. 3; 2014
4
in the language space, being manifested in discourse, and then it becomes embedded in public policies, projects and regulations. Hajer’s argumentative method (1995) postulates that in a narrative the actor builds a particular problem by constructing his own version about facts and events in the shape of a story or narrative lines. These are used within particular situations and contexts and become the argument through which actors try to impose their own view of reality on others. For Hajer, argumentative analysis is not centered on the coherence of an argument but on its interpretative reading and understanding. Thus, the reader or hearer reflects whether the argument ‘sounds credible’. When a group of actors share the same set of practices (routines, rules and norms that give coherence to social life) and also use the same or similar narrative lines to reproduce and transform specific discourses, a discourse coalition is built. Discourse coalitions are then the ‘making’ and ‘doing’ of a public and discursive phenomenon, contingent on local and contextual conditions of production. Furthermore, Hajer (2006) points out that in analyzing political discourse, attention must be paid to power relations, institutions and domination. This brings up the concept of discursive institutionalization which arises when a particular discourse is solidified into specific institutional plans, regulations or laws. The study of discourse reveals how diverse actors actively engage in defining a public phenomenon and develop a deep understanding of what a problem is about. This is why discourse analysis fulfils a prominent role in the study of environmental politics and policy making because understanding how a problem is conceptualized by particular discourses may provide the solution for such problems. So, illuminating discourses allows for a better understanding of controversies, not in terms of rational argumentation, but in terms of the argumentative rationality that people bring to a discourse (Hajer, 2005). We approach our study by analyzing discourse samples from relevant social and political leaders involved in the HydroAysen conflict available from Chilean national press releases and web pages between 2011 and 2012. To do this we focus on Hajer’s analytical categories: nodal concepts, story lines, discourse coalitions, and discursive institutionalization. We also focus on argumentation and the discursive and semantic strategies that build it, such as descriptions, generalizations, polarizations, and metaphors as a rhetoric tool. In order to identify and describe the discourse coalitions that emerged from the conflict around the HydroAysen hydroelectric megaproject in the Patagonia region, we pose the following main questions: Which are the main nodal concepts displayed in the allocutions and which narrative lines sustain them? Which discursive coalitions emerged around the HydroAysen project proposal and how is the political arena structured? How does discursive institutionalization operate in the controversy? 3. Method The data for the current study is part of a larger research developed between 2011 and 2012, a particularly relevant period of time in which the local governmental Commission on Environmental Evaluation at Coyhaique, Aysen region, approved the HydroAysen project. This caused citizens to unleash an outburst of social demonstrations and public allocutions in defense of the region's natural environment. The total data gathered consisted of 60 discourse allocutions in national press releases and web pages emanating from 9 relevant political leaders and 9 social and environmental groups and actors. Actors identification was on the basis of an exhaustive review of the high impact popular media including national newspapers ‘La Nación’, ‘El Mercurio’ (on line version Emol), ‘El Magallanes’ (Aysen regional newspaper), ‘El Divisadero’ (Aysen regional newspaper), radio interview programmes at ‘Cooperativa’ (national radio), government official web pages, HydroAysen official web page, and web pages of national and local environmental groups. For the present study we have selected 40 narratives and their actors who have publicly expressed their positions regarding the HydroAysen project. For ethics consideration persons’ names have been removed and replaced by their respective honorific titles. These include the President of the Republic, the Minister of Energy, HydroAysen executives, and environmental groups ‘Patagonia Without Dams’ and ‘Aysenines Against HidroAysen’. The method for analysis considered the following sequence: a) revealing nodal concepts from allocutions b) depicting story lines, argumentation, discursive and semantic strategies and metaphors c) grouping storylines around similar representations of reality d) confirmation of discourse coalitions e) establishment of discursive institutionalization. Symbols being used in the citings below are: (…) shows that the extract is the continuation of a previous discourse, […] indicates that some non relevant parts of the discourse have been omitted to avoid unnecessary extension of the text (Jefferson, 2004). 5. Findings Two discourse coalitions about the HydroAysen project proposal were revealed. The first group comprises the President of the Republic, the Ministry of Energy, and representative executives of the HydroAyse project. The second coalition is made up of various local (Aysen region) and national socio-environmental groups. The two coalitions display opposing story lines but build their discourse around three nodal concepts: ‘representations of the energy situation of the
International Journal of Social Science Studies Vol. 2, No. 3; 2014
5
country’, ‘views about the economic and environmental development of Aysen region’, and ‘the role of citizens in decision making concerning the project’. The main story lines of the government/ HydroAysen executives coalition relates to the 'crisis' in the country’s energy situation and the HydroAyse project being the solution. Story lines on the part of ‘Aysenines against HydroAysen’ and ‘Patagonia without Dams’ argue that the lack of a national energy strategy plan affects local communities whose development is based on tourism and the natural environment. Furthermore, they hold that the HydroAysen project favors only a few elite businessmen from the capital of the country. 5.1 Representations of the Energy Situation of the Country Representations of the country’s energy state of affairs and the direction of its future energy policy give birth to two different narrative lines regarding the economic development of the country. On the one hand, the government and HydroAysen share the vision that hydroelectricity is synonymous to development. This is seen on HydroAysen's web page where Europe, Australia and the USA are used to illustrate the case of developed countries that have taken hydroelectricity as one of their energy pillars. (…) for example hydroelectric development in Europe, North America and Australia reach the 75% whereas Latin America has only developed 33% of its total resources. The meaning underlying this narrative line reveals the argument that Latin American developing countries need to take the example of those that are already developed. By using the strategy of comparison HydroAysen presents these as successful models emphasizing that Latin American countries are far behind (“only 33%”). Similarly in La Nacion daily the President of the Republic emphasizes the above belief affirming that “Chile is a hydroelectric possibility” so “we have to use water because it is energy” and we “have to use it to the benefit of the nation’s development”. It is interesting to note that the government and HydroAysen display dramatic narratives in order to convince citizens about the benefits of approving the proposed project. In El Mercurio Emol daily an executive spokesman of HydroAysen states: (…) if we end up without constructing HydroAysen you’ll get half of the SIC with no future at all […] the situation then becomes more critical. In this excerpt the executive presents the energy issue as critical and argues that HydroAysen is essential to reinforce Chilean SIC (Interconnected energy system) which currently links the south with the central part of the country. HydroAysen construction would eventually expand to connect the north and ensure that the energy demand of the whole country can be met. The speaker uses an extreme formulation (with no future at all) to describe the prospective bleak future of the country without HydroAysen., causing a more vivid effect on the hearer (the situation then becomes more critical). This argument is particularly effective in the context of a country like Chile whose long and varied geography makes interconnection difficult and expensive. Likewise, the President of the Republic in a Cooperativa radio programme expresses his concerns about the uncertainty of H.A. construction. (…) if we do not take decisions now we are condemning our country to a blackout at the end of the decade […]. The President’s argument aims to convince citizens that it is today’s generation's responsibility to decide the energy future of the country. His narrative is supported by the warning metaphor ‘condemn the country to a blackout’ displaying a dramatic vision of the country’s future energy. If the energy crisis is not addressed now the country is likely to subside into complete darkness in the near future. On the other hand, ‘Patagonia Without Dams’ and ‘Aysenines against H.A.’ hold the vision that the HydroAysen project does not contribute to an equitable development of the country, because it benefits only an elite group of entrepreneurs in Santiago. In its web page ‘Patagonia without Dams’ declares: (…) more than 2.235 kilometers of cables in order to inject cheap energy to the already saturated and overpopulated capital of the country […] all this in impairment of the regions. The above story line displays a vivid narrative of a prospective view of Aysen's deteriorated landscape if HydroAysen installed 2.235 kilometers of cables, and positions the capital and its citizens as the only beneficiaries of the new project. The underlying meaning of this narrative pictures the capital as a ‘greedy big brother who eats his siblings’ food’. At ‘El Magallanes’ daily ‘Aysenines against H.A’ reinforce the above story lines. (…) Hydroaysen does not fit the necessary factors […]for the development we long for since the very fact of its implementation will deviate us from the real aim, which is […] that may light illuminate us all and not only a few.
International Journal of Social Science Studies Vol. 2, No. 3; 2014
6
HydroAysen’s company aims are perceived by Aysenines as divergent from locals’ wishes for regional development. Furthermore it is seen as favoring only the capital’s energy needs. By using the metaphor ‘may light illuminate us all, and not only a few’ Aysenines also display their representation of the capital of the country as the ‘big greedy brother who eats his siblings’ food’. This representation acquires validity in the regions since it is a fact that Santiago has historically consumed most of budget distribution and made political decisions for the country and its citizens. In a similar way, another metaphor recreates the above argument at local paper ‘El Magallanes’. (…) we cannot become ‘el pato de la boda’ (the marriage party duck) and allow us be sacrificed due to the wrong management of Chilean energy policy. The metaphor ‘the marriage party duck’ connotes situations in which somebody has to be sacrificed in order to benefit others because there is no other choice. Metaphorically, Aysenines present themselves as the ‘duck’ of the government ‘energy dinner’ to which they have not been invited. Neither have they been consulted about the political decisions regarding the HydroAysen project. 5.2 Views about the Economic and Environmental Development of Aysen Region However, both groups share the need for more connectivity between the Aysen region and the rest of the country. For HydroAysen and the government, connectivity is synonymous to economic development, as it is stated on the HydroAysen web page. (…) from its beginnings H.A. has declared that benefiting its citizens is one of its main priorities […]benefiting its inhabitants through the offer of more work posts, training programes […] these are important connectivity opportunities[…] that will allow Aysenines a better integration with the rest of the country. HydroAysen’s narrative in this excerpt emphasizes that its main focus is on benefiting Aysen citizens through the provision of more jobs and technical training, and connectivity to the rest of the country. Likewise in El Mercurio Emol daily, the President of the Republic backs up the above declaration by using a vivid description of the Aysen region, highlighting its natural beauty and size. (…) we´ll benefit Aysen citizens […] we´ll be integrating this marvelous territory that represents an important part of the national territory for more development and opportunities. In his declaration the President personalizes his intentions by presenting himself as an active participant in the project (we’ll) and attaching important value to Aysen natural territory; however the President’s representation of the problem is clearly anthropocentric which can be seen in his narratives where people are more important than the environment, as he declares in an interview at Cooperativa national radio program. (…) I am more worried about Chileans, because people deserve more protection than trees. The President’s statement together with HydroAysen's above reveal that both share the view that the development of the HydroAysen project to benefit the people of the region through more work posts and job training is more important than any preoccupation with the natural environment of the territory. On the other hand, ‘Patagonia without Dams’ holds a more conservationist perspective on regional development based on nature conservation. For example, in its webpage this group declares. (…) we want to develop our region on the basis of conserving its environmental attributes and territorial integrity […] the touristic potential of the Patagonia is directly dependent on its exceptional natural resources and environmental beauty which would be irreversibly damaged by H.A. In this storyline it becomes clear that Aysenines’ main aspirations are nature preservation and the touristic potential of their region, and the HydroAysen construction represents an end to their notion and hopes for regional development. The mental state of ‘wanting’ (we want to develop) is a cognitive resource that displays the speakers’ positioning of beliefs and desires, in this case a balanced interrelationship between natural beauty and touristic potential. Aysenines’ view of HydroAysen’s intervention is highlighted by the term "irreversibly damaged" that provides dramatization to the argument. To the above environmental concerns of Aysenines, the government has proposed some mitigation measures. For example, in the National Strategy Plan 2012-2030 the Ministry of Energy states: (…) a special plan will be developed to fully protect the Chilean Patagonia, allowing the extension of protection and exclusion of generation and transmission initiatives within large zones of resources of exceptional condition. The vagueness and ambiguity of the above declaration is noticeable. Vague descriptions allow the speaker to divert attention from sensitive points of the argument, in this case what type of protection will be provided, what type of initiatives will be excluded, and what is meant by ‘large zones of resources of exceptional condition’. Furthermore, by
International Journal of Social Science Studies Vol. 2, No. 3; 2014
7
stating that there will be a ‘special’ plan to protect the Patagonia excludes other natural zones of exceptional beauty like ´Torres del Paine’ in the south and the geysers at ‘San Pedro de Atacama’ in the north. This reveals that the government Strategy Plan has been developed compelled by the contingency of environmental issues that have arisen in the recent years and not from a long term, wider and inclusive perspective. In the same way, in its web page HydroAysen offers a set of measures to mitigate the potential eventual harm, being its discourse more technical and concrete. (…) an area of conservation of 11.560 hectares will be created, more than 4.500 forest hectares will be reforested, native fish species in danger will be cared for by controlling predator introduced species (like salmon and trout) recuperating their population will allow their artificial reproduction. This narrative displays a pseudo convincing argument. The creation of large conservation areas and reforestation would require in fact a long term period, a decade at least. In the meantime the touristic potential of the region would suffer the damage, with the HydroAysen construction affecting locals’ source of income. Protection of endangered indigenous fish by controlling the introduced predator species would also take considerable time. Through the strategy of corroboration and consensus, the argumentation aims at convincing the reader by using technical and scientific language that is cognitively associated to veracity and objectivity, a type of truth. 5.3 The Role of Citizens in Decision Making This nodal concept displays the role of citizens in HydroAysen project conflict. Depending on how each group represents the concept of citizen participation, their narrative lines attribute actors an active or passive role in decision making. For example, in its web page HydroAysen states its position about citizens’ role in the development of the project. (…) we get every home involved by informing about the various activities that we develop and the advance of our project. HydroAysen assigns the citizen a unidirectional passive and receptor role: information is passed on to the citizen but there is an absence of active interaction in decision making which creates an asymmetric relational pattern between citizens and HydroAysen. The argument displayed by HydroAysen uses the emotional resource of proximity and empathy (“we get every home”) whose underlying effect is to make the reader believe that HydroAysen executives are actually visiting the locals at their places to talk about the project, which was not the case. Similarly, the Ministry of Energy in the National Strategy Plan 2012-2030 reveals the government’s stand on the level of citizen participation in environmental projects. (…) the aim is to deepen dialogue instances and antecedents that are delivered to the citizenship […] this will allow improving environmental management of the sector, improve decisions about the location of projects, protect our environmental patrimony and generate informed debates. Although the introductory statement “to deepen dialogue instances” announces an eventual participation of citizens in environmental projects, the supporting argument sets the citizen in a passive role since the “antecedents that are delivered to the citizenship” have already been structured. Generating “informed debates” would discuss topics previously settled by the Ministry of Energy, and citizens representatives are expected to improve decisions already taken, for example, the ‘location’ of the projects. Hence, citizens are left without input into the original decision about environmental projects in relation to their regional welfare. On the other hand ‘Patagonia without Dams’ and ‘Ayseninos without dams’ attribute the citizen and the locals an active and central role in the discussion of the type of electricity development that Chile requires, and uphold the concept of ‘citizenship consultation’. This is clearly expressed by one of the leaders of ‘Patagonia without Dams’ in an interview given to ‘El Mercurio Emol’ daily. (…) the government must look for instances for citizenship participation […] and of the regions in order to reach consensus on where, when and how the country electric development will be done. In the same line, ‘Aysenines without Dams’ demand from the government a more active role for the affected communities, as read at ‘El Mercurio Emol’. (…) what is primary concern is that the people of the Patagonia speak, we have never been asked if we are in favour or against this or other projects. This story line highlights the need the voice of the people to be heard and demands more citizenship participation in the political process.
International Journal of Social Science Studies Vol. 2, No. 3; 2014
8
Finally, it is worth noting that the government and HydroAysen, and ‘Patagonia without Dams’ have held some roundtables to try to resolve the conflict; however no agreement has been reached. ‘Patagonia without Dams’ subsequently announced its withdrawal from the discussions as it can be read in the following declaration. (…) nonetheless some meetings have been held with the authorities, we realize that our counterpart, the government, has no interest in considering our opinion, of those who live in the territory that are the target of project intervention […] the government’s actions and attitudes towards Colbun petition of suspending the studies of H.A. impact, are not only shameful but also transforms the negotiation process of citizen consultation into a fake. This argument displays the resource of polarization through the use of keywords such as ‘counterpart’, ‘shameful’ and ‘fake’. There is a perceived negative harmful counterpart that is indifferent to the needs of the locals (citizens consultation and participation) whose decision (of suspending the studies of H.A. impact) is seen as a political fake, generating a deep distrust scenario on the part of ‘Patagonia without Dams’. The above perceptions are reaffirmed by ‘Aysenines against H.A.’ who declare at a local digital daily: (…)today the powerful ones […], in detriment of the citizens, have ignored a whole region and its citizens who have witnessed on their own nose how they were being cheated and overpassed. It is interesting how the perception of being cheated by HydroAysen enterprises is displayed by the Chilean metaphor ‘on their own nose’ which connotes a disrespectful and brazen action that is done directly to somebody. Aysenines perceive HydroAysen to be a tricky opponent that takes advantage of locals´ disadvantaged position in decision making. 6. Discussion The aim of this study was to reveal the discourse coalitions arising during the controversy around the proposed construction of the HydroAysen megaproject in the Patagonia region of Chile. Our analyses of public allocutions from various media identified two groups of actors. One group comprises the government, represented by the President of the Republic and the Ministry of Energy, and HidroAysen enterprise executives, and the other, citizens associations ‘Patagonia without Dams’ and ‘Aysenines against HidroAysen’. These actors build their narratives around three nodal concepts and each displays affinities with their respective story lines. The first nodal concept relates to the actors’ representations of the energy situation of the country. In this node HidroAysen and the government argue that there is an existing energy crisis in the country that can only be solved by the completion of the HidroAysen project. On the other hand, ‘Patagonia without Dams’ and ‘Aysenines against HidroAysen’ share the argument that the HidroAysen project is a measure to enrich entrepreneurs in the national capital, Santiago, to the detriment of the small and distant regions in the south of Chile. The lack of an adequate national energy policy creates an urgency that fosters the perception that the project is needed, and thereby fosters this perceived favoritism. With regard to the views about the economic and environmental development of the Aysen region, HidroAysen executives and the government claim that the hydroelectric project will enable Aysen regional development and its connectivity to the country. This group narrative is based on an anthropocentric ideology in which nature is subjected to man’s economic activity, and therefore becomes a replaceable capital or, as Tietenberg (2001) calls, a commodity or service. This ideology is reflected in the act of offering the locals mitigation measures such as more work opportunities and control of predator fish species to allow stocks of threatened native fish to replenish, but do not protect the integrity of Patagonic natural and cultural heritage. On the other hand, the discourse coalition of ‘Patagonia without Dams’ and ‘Aysenines against HidroAysen’ advocates an economic development based on the conservation of Patagonic nature and culture which is perceived to be interdependent from human intervention. This ideology states that nature and the human being sustain a horizontal relationship of reciprocal respect and care. For ‘Patagonia Without Dams’ tourism represents an essential pillar for Aysenine development. Notwithstanding this activity may cause some harm to the natural environment, particularly the building of touristic infrastructure, for this group it is an industry directly dependent on the local resources, positioning natural environment above human economic activity. The third nodal concept concerns the role of citizens in society's decision making. Both the government and HidroAysen assign the public a passive role, as mere recipients of information. This role is of unidirectional character, there is information passed on from the government and HydroAysen executives to the citizen without the opportunity for an active participation in decision making. This asymmetric relational pattern is to the detriment of citizens. On the other hand, the ‘Patagonia without Dams’ and ‘Aysenines against HydroAysen’ discourse coalition demand an active role for citizens in policy and decision making, at both regional and national levels. The situation described above makes it hard for actors of two antagonistic coalitions to agree and reach consensus due to the absence of mutual trust. Moreover, ‘Patagonia without Dams’ and ‘Aysenines against HidroAysen’ coalition lacks concrete and effective channels for participation in decision making, and this keystone of democracy is
International Journal of Social Science Studies Vol. 2, No. 3; 2014
9
overlooked and obstructed by the government and HidroAysen. The overriding of citizen rights is a repetitive pattern in Latin America (Khagram, 2004; Castro, 2008; Ascelrad, 2010; Landa, 2012), where the pattern underlying the HidroAysen conflict can be observed in various countries in which local communities collide with big enterprises (Folchi, 2001; Khagram, 2004; Toledo et al, 2009; Perez, 2009; Bingham, 2010; Landa, 2012; Abbink, 2012; OLCA, 2013). The above asymmetry results in the discursive institutionalization of the government and HidroAysen coalition which was operationalized by the establishment of hydroelectricity as one of the pillars of the Chilean energy matrix in the ‘National Energy Strategy Plan 2012-2030’ in 2012. This coalition is able to reach institutionalization because the government holds the political and administrative tools for power imposition, making its institutionalized discourse credible and necessary (Hajer, 1995). The dominated coalition is then left with little active participation and argumentative resources to incorporate their alternative proposal, which centers on non conventional renewable energy, into the ‘National Plan for Energy Development’. However this proposal has gained ample public support. Similar discursive institutionalizations are reported in the cases of the Sardar Sarovar dam in India (Mehta, 2001), the Gabe dam in Ethiopia (Abbink, 2012), and the Danube Circle in Hungary (Williams, 1994). Our study shows that from a sociopolitical perspective no consensus between groups has been reached and citizens’ voices in this important issue, particularly Aysenines, are marginalized. Moreover, Chilean institutional channels for citizens’ rights in decision making are weak and many times obstructed. As a result, social actors are currently organized and have generated their own mechanisms to exert their rights (Shiva et al, 1991; McCully, 2001; Khagram, 2004). Street demonstrations have become their method of having their voices heard in the hope that they can eventually become institutionalized. These activities draw together a diverse group of interested actors such as indigenous communities, academics and local community members, thereby generating an alternative political force. This ‘bottom-up’ sociopolitical phenomenon seems to be a social action that may persist through various generations until a real and substantive democracy is installed in Chile. From the discourse analysis perspective our analysis demonstrates how metaphors are used as a rhetoric tool in the construction of persuasive arguments to dramatize and produce more vivid, exemplifying and convincing effects on the public. Furthermore the HydroAysen case contributes to our knowledge by highlighting and explaining the role discourse coalitions may play in contributing to the failure of Chilean democracy to build social consensus on contentious issues. References Abbink. J (2012). Dam controversies: contested governance and developmental discourse on Ethiopian Oms River Dam.
Social Anthropology/Anthropologie Sociale (2012) 20, 2 125–144. C 2012 European Association of Social Anthropologists. http://dx.doi.org/10.1111/j.1469-8676.2012.00196.x
AIDA. (2009). Grandes Represas en América: ¿Peor el remedio que la enfermedad? [Large dams in America: medicine worse than illness?]. ISBN 978-0-9823143-1-9. Copyright Asociación Interamericana para la Defensa Ambiental.
Ascelrad, H., Bezerra. G., Gavira, E. (2010). Inserción económica internacional y ‘resolución negociada’ de conflictos ambientales en Latina [international economic insertion]. EURE. 36 (107). 27-47.
Bingham, A. (2010). Discourse of Dammed. Polis. 4. 1-47. Castilla, F., & Leyton, M (2010). Turismo en la región de Aysén y la Patagonia chilena [Tourism in Aysen region and
Chilean Patagonia]. Revista Interamericana de Ambiente y Turismo. 6 (2). RIAT Revista Interamericana de Ambiente y Turismo. 6 (2). 92-97.
Castro, J. (2008). Water struggles, Citizenship and Governance in Latin America Development, 51, (72–76) r 2008 Society for International Development 1011-6370/08. www.sidint.org/development.
Diario La Nación. (Miércoles 30 de Mayo, 2012). Colbún paraliza su proyecto de transmisión para HidroAysén.[Colbun stops its transmission project to Hydroaysen]. Retrieved from http://www.lanacion.cl/colbun-paraliza-su-proyecto-de-transmision-para-hidroaysen/noticias/2012-05-30/185752.html
De la Maza. G. (2012). Responsabilidad social empresarial, política e internacionalización. El caso del ‘conflicto de los cisnes’ en Valdivia, Chile. [Sociopolitical and entrepreneurship responsibility and internationalization. The case of the ‘Swans conflict’]. 12 (70) 167-201.
Edmonds, R. (1992). The Sanxia (Three Gorges) Project: The Environmental Argument Surrounding China's Super Dam. Global Ecology and Biogeography Letters, 2(4).105-125.
Edwards, D. (1997). Discourse and Cognition. London: Sage.
International Journal of Social Science Studies Vol. 2, No. 3; 2014
10
Folchi. M. (2001). Conflictos de contenido ambiental y ecologismo de los pobres: no siempre pobres, ni siempre ecologistas. Ecología Política, 22. 79-100.
Fuenzalida. M., & Quiroz. R. (2012). La dimensión espacial de los conflictos ambientales en Chile [Spatial dimensión in environmental conflicts in Chile]. Polis. 31.
Foucault, M. (1984). The archaeology of Knowledge. London: Tavistock Publications. Hvistendahl, M. (2008). China´s Three Gorges Dam: An Environmental Catastrophe? Scientific American, March 25. Hajek, E., & Camus, P. (1990). Historia Ambiental de Chile. [Environmental History of Chile], Editorial Pontificia
Universidad Católica de Chile. Hajer, M. (1995). The Politics of Environmental Discourse: Ecological Modernization and the Policy Process. Oxford:
Oxford University Press. Hajer, M. (2005). Coalitions, practice and meaning in environmental politics: from acid rain to BSE. In Howarth
&Torfing Discourse Theory in European politics, identity, Policy and Governance. Editorial Matter and Selection, 297-315.
Hajer, M., & Versteeg, W. (2005). A decade of Discourse Analysis of environmental politics: Achievements, challenges, perspectives. Journal of Environmental Policy Planning, 7(3) 175-184.
Hirsh, C., & Utreras, M. (2010). Hidroeléctricas, los derechos de los pueblos indígenas y resistencia popular en Guatemala. [Hydroelectic, indigenous peolples’ rights and citizens’ opposition in Guayemala] La Asociación de Estudios Internacionales de Agua (FIVAS). Osterhausgate 27, N-0183 Oslo, Noruega. Tel: +47 22 98 93 25 correo: [email protected].
Howarth, D., Norval, A., & Stavrakakis, Y. (2000). Discourse Theory and Political Analysis. Identities, Hegemonies and Social Change. Manchester & New York: Manchester University Press.
Jefferson, G. (2004). Glossary of transcript symbols with an introduction. In G. Lerner (Ed.), Conversation Analysis: Studies from the First Generation. Amsterdam: John Benjamins.
Jongerden, J. (2010). Dams and Politics in Turkey: Utilizing Water, Developing conflict. Journal Compilation 2010, Middle East Policy Council. Article first published online: 15 MAR 2010. http://dx.doi.org/10.1111/j.1475-4967.2010.00432.
Khagram, S. (2004). Dams and development transitional struggles for water and power. Cornell University Press. Laclau, E., & Mouffe, C. (1985). Hegemony and Socialist Strategy: Towards Radical Democratic Politics. London. Landa. O. (2012). La lucha legal por la justicia hídrica: México en el Tribunal Latinoamericano del Agua. [Legal
struggle for hydric justice: Mexico in Latinamerican Court for Water]. El Cotidiano 173. Latta, A. (2010). Generating consent mega-hidro and the post neoliberal corporations. The case of Hydroaysen.
Presented at the WATERLAT International Conference. São Paulo, Brazil, October 2010. Retrieved from http://my-test-wiki-2010.wikispaces.com/file/view/GENERATING+CONSENT--Latta.pdf
Diario La Tercera. (2011). 74% rechaza HidroAysén. Retrieved from http://diario.latercera.com/2011/05/15/01/contenido/reportajes/25-69083-9-74-rechaza-hidroaysen.shtml
McCully, P. (2001). Silenced Rivers: The Ecology and Politics of Large Dams. Zed Books, Dec 7, 2001 -Business & Economics.
Ministerio de Energía de Chile. (2012). Estrategia Nacional de Energía 2012-2030 [National Energy Strategy 2013-2030]. Retrieved from http://www.minenergia.cl/estrategia-nacional-de-energia-2012.html
Montoya-Aguilar, C. (2009). Salud, cambio climático y contaminación. Actualización acerca de las fuentes alternativas de energía en Chile. [Health, climate change and contamination. Updating alternative sources of energy in Chile]. Cuadernos Medico Sociales, 49(4). 235-237.
Montreal, P., Diaz, O., Córdova, H., Gerber, E., Gonzalez, L., Liberona, F., Namuncura, D., Urrutia, E., Rodriguez, A., Rodriguez, P., Scantlebury, M., Silva, P., & Varas, A. (2012). A mitad de camino. Punto de no retorno [In midway. No return point] Fundación Equitas y Fundación Friedrich Ebert.
OLCA. (2013). (12 de Diciembre de 2013) Los mundurukú se levantan contra megaproyecto hidroeléctrico. [Munduruku raise against hydroelectric megaproject] Retrieved from http://olca.cl/articulo/nota.php?id=103885
Rigg, J. (1991). Nam Choan Dam Project, Thailand. Global Ecology and Biogeography Letters, 1(2). 42-54.
International Journal of Social Science Studies Vol. 2, No. 3; 2014
11
Routledge, P. (2003) Voices of the dammed: discursive resistance. Political Geography 22 (2003) 243–270. © 2003 Elsevier Science Ltd. All rights reserved. http://dx.doi.org/10.1016/S0962-6298(02)00095-1.
Salinas. R., & Carmona. A. (2009). Conflictos por el agua en Chile: el gran capital contra las comunidades locales. Análisis comparativo de las cuencas de los ríos Huasco (desierto de Atacama) y Baker (patagonia austral). Espacio Abierto: Cuaderno Venezolano de Sociología, 18(4), 695-708.
Shiva, V. (1991). Ecology and politics of survival: conflict over natural resources in India. Research Foundation for Science, Technology and Ecology, New Delhi.
Svampa, M. (2012). Consenso de los Commodities, Giro Ecoterritorial y Pensamiento crítico en América Latina.[Commodities consensus, ecoterritorial and critical thought in Latin America]. OSAL. 13 (32).
Tietenberg, T. (2001). Emissions trading programs. Published by Ashgate Publishing Limited Gower House Croft Road Aldershot Hants GU11 3HR England, Ashgate.
Toledo, H., Aravena, H., & Olivares, X. (2009). Agua, poder y discursos: Conflictos socio territoriales por la construcción de centrales Hidroeléctricas en la Patagonia chilena. [Water, power and discourses: Socioterritorial conflicts around the building of Hydroelectrics in Chilean Patagonia]. Anuario de Estudios Americanos. 66 (2). 81-103.
Plan Nacional de Desarrollo Energético. Retrieved from http://www.patagoniasinrepresas.cl/final/contenido.php?seccion=nuestrapropuesta
Potter, J. (2005). Making Psycology Relevant. Discourse & Society, 16(5), 739-747. Radio Biobio. (Enero 28, 2014) Endesa deja de mostrar HidroAysén como su proyecto estrella a
inversionistas.[National Enterprise of energy development. Retrieved from http://www.biobiochile.cl/2014/01/07/endesa-deja-de-mostrar-hidroaysen-como-su-proyecto-estrella-a-inversionistas.shtml
Williams, P. (1994). Environmental Dispute Resolution: The dispute between Slovakia and Hungary concerning construction of the Gabcikovo and Nagymaros Dams. Columbia Journal of Environmental Law, 19(1), 1-57.
This work is licensed under a Creative Commons Attribution 3.0 License.

International Journal of Social Science Studies Vol. 2, No. 3; July 2014
ISSN 2324-8033 E-ISSN 2324-8041 Published by Redfame Publishing
URL: http://ijsss.redfame.com
12
Successful Aging: Multiple Trajectories and Population Heterogeneity Fengyan Tang
Correspondence: Fengyan Tang, School of Social Work, 2217C Cathedral of Learning, University of Pittsburgh, Pittsburgh, PA, 15260, USA. E-mail: [email protected] Received: March 20, 2014 Accepted: April 16, 2014 Available online: April 23, 2014 doi:10.11114/ijsss.v2i3.372 URL: http://dx.doi.org/10.11114/ijsss.v2i3.372 Abstract Following Rowe and Kahn’s successful aging model, this study identified successful aging as a distinctive aging trajectory and examined gender differences in the aging process. Using the Health and Retirement Study data (2000-2008), this study applied group-based trajectory analysis to identify multiple aging trajectories in a sample of older Americans aged 65 and over (N=9,226). Six dimensions were analyzed in the multi-trajectory model: chronic disease, physical functional limitation, disability, depressive symptom, cognitive functioning, and active engagement with life. Three aging trajectory groups were identified: successful aging, usual aging, and pathological aging in both samples of men and women. About one third of women and 40 percent of men fell into the successful aging trajectory. Women were more likely than men to experience functional limitations and disability over time, thus less likely to age successfully. Younger age and higher levels of education and income were related to the likelihood of successful aging. Findings provide support for a multidimensional model of successful aging that emphasizes the heterogeneity in physical, cognitive, and social functioning among the older population. Future research need incorporate subjective assessments of successful aging, examine the potential transitions among different aging trajectories, and assess the impacts of health behavior and resource variables on the aging outcomes. Keywords: successful aging, aging trajectory, gender difference 1. Introduction Successful aging has been a subject of increasing public interests and research efforts since Rowe and Kahn proposed this aging model in the late 1980s. Although there is no consensus on how to define and measure successful aging, the three-component model developed by Rowe and Kahn (1997) has been widely accepted. The model provides a multidimensional conceptualization of successful aging, including low risk of disease and disability, high physical and cognitive functional capacity, and active engagement with life (Rowe & Kahn, 1997). Based on these dimensions, at least three distinct pathways in the aging process could be postulated: pathologic, usual, and successful aging. Older adults with specific diseases or disability may experience pathologic aging; their lives have been affected by the diseases since adulthood or even earlier. In contrast, older adults without major diseases or disability may experience either usual aging (non-pathologic but high risk for specific diseases) or successful aging (low risk and high function) (Rowe & Kahn, 1987; 1997). Previous research focused on the prevalence estimate of successful aging in the United States. Surprisingly, a huge difference existed in the prevalence estimates from the studies of the past three decades. For example, using a national sample from the Health and Retirement Study (1998–2004), McLaughlin and colleagues (2010) estimated that no greater than 11.9 percent of adults aged 65 and over aged successfully at four time points of observation. Strawbridge and colleagues (2002) estimated that 18.8 percent were aging successfully in a sample of adults aged 65 and over from Alameda County Study. When using both objective and subjective assessments, Pruchno and colleagues (2010) found that over 80 percent in the sample of a relatively well-educated, younger cohort (50-74) were classified as successful agers. As indicated in a meta-analysis of 28 studies, the prevalence varied greatly from 0.4 to 95 percent, with an average of 35.8 percent of the study subjects being classified as successful agers (Depp & Jeste, 2009). This considerable variability likely resulted from the sample composition and the different criteria used to operationalize successful aging (Depp & Jeste, 2009; McLaughlin, Connell, Heeringa, Li, & Roberts, 2010). Another line of research documented changes in a single indictor over time (e.g., Andreescu, Chang, Mulsant, & Ganguli, 2008; Dodge, Du, Sazton, & Ganguli, 2008; Liang et al., 2008; Thomas, 2012), or examined multiple indicators of successful aging with cross-sectional research designs (e.g., Ng, Broekman, Niti, Gwee, & Kua, 2009; von
International Journal of Social Science Studies Vol. 2, No. 3; 2014
13
Faber et al., 2001). These studies suggested older adults maintaining high levels of physical, mental, and social functioning were able to age successfully. The longitudinal studies on a single indicator of successful aging have demonstrated heterogeneity in the aging process (e.g., Andreescu et al., 2008; Dodge et al., 2006; Liang et al., 2008; Thomas, 2012). Few studies, however, have examined multiple aging trajectories based on the multidimensional concept of successful aging. A study by Hsu and Jones (2012) is a notable exception. In a sample of older adults in Taiwan, they identified four aging trajectory groups: successful aging, usual aging, health decline, and care demanding; compared with members in other groups, successful agers had better physical and mental functioning, higher levels of social support, social participation, and economic satisfaction over time (Hsu & Jones, 2012). Prior studies also documented gender differences in aging trajectories. Generally, older women have less education achievement and less earned income than older men (McLaughlin et al., 2010; Yang, Hoshi, Wang, Nakayama, & Kong, 2013). Low socioeconomic status is one of the significant predictors of poor health in old age. Also older women are likely to have more chronic diseases and experience more physical function limitations than older men despite women’s longer lives (McLaughlin et al., 2010; Yang et al., 2013). Therefore, women are less likely to age successfully (Pruchno et al., 2010) or may experience different pathways to successful aging. However, findings are inconsistent in the existent literature. Similarly, there is limited evidence that supports socio-demographic profiles of successful aging, that is, higher levels of education, income and wealth, currently marital status, and White ethnicity are related to the likelihood of aging successfully (e.g., Depp & Jeste, 2009; McLaughlin et al., 2010). This literature is thus limited by the use of various operational definitions of successful aging, lack of examining changes in multiple aging dimensions, and inconsistent findings. Despite numerous studies generated from Rowe and Kahn’s model (e.g., Berkman et al., 1993; McLaughlin et al., 2010), to our knowledge, none of them have simultaneously modeled multiple dimensions of successful aging and examined the temporal changes on these dimensions among older Americans. Further, no studies to date have examined population heterogeneity or the differences in the aging pathways. Therefore, this study aims to (1) identify multiple aging trajectories using six dimensions of physical, mental, cognitive, and social functioning; (2) assess gender differences in aging trajectories; and (3) examine socio-demographic characteristics in relation to aging trajectories. 2. Methods 2.1 Data Source and Study Sample Analyses used data from five consecutive waves of the Health and Retirement Study (HRS: 2000, 2002, 2004, 2006, and 2008). The HRS consists of a multistage stratified area probability sample of adults over age 50 living in the contiguous United States (Servais, 2010). Respondents are interviewed every two years, and age-eligible people from younger birth cohorts are added at certain point of time to make the total sample representative of the target population (Servais, 2010). This study used a subset of respondents 65 years of age and older. Proxy respondents were excluded at baseline (n=2,062). Missing cases were imputed for the included samples in the SAS procedure of Proc Traj via maximum likelihood estimation (Nagin, 2005). The final sample size was 9,226, with 3,740 men (40.5%) and 5,486 women (59.5%). Listwise deletion was applied in the multinomial logistic regression analyses, resulting in a total of 9,068 respondents (3,649 men and 5,419 women). Most variables used in the analyses were retrieved from a special file distributed by the RAND Center for the Study of Aging. The complied data contains cleaned and processed variables with linkage across survey waves (St. Clair et al., 2011). Measures of active engagement were retrieved from five consecutive survey years (2000-2008). 2.2 Measures Guided by Rowe and Kahn’s model (1987; 1997) and previous research (e.g., Hsu & Johns, 2012; McLaughlin et al., 2010), this study used the following six measures to identify successful aging trajectory: (1) chronic diseases, (2) activity of daily living (ADL) disability, (3) physical functioning, (4) depressive symptoms, (5) cognitive functioning, and (6) activity engagement. Chronic diseases. One of the criteria of successful aging was “no major disease”. Thus the diagnoses of five important chronic diseases were assessed, i.e., cancer, chronic lung disease, diabetes, heart disease, and stroke, because these diseases are major causes of death among older adults (McLaughlin et al., 2010). Each disease was scored, and the summary score could range from 0 (no major chronic disease) to 5 (all the chronic diseases). Disability. Consistent with the MacArthur Studies of Successful aging (Berkman et al., 1993) and previous research (McLaughlin et al., 2010; Strawbridge et al., 2002), this study assessed disability using self-reported difficulties with activities of daily living (ADLs). The assessed activities included walking across a room, dressing, bathing or showering, eating, getting in or out of bed, and using the toilet (McLaughlin et al., 2010). Binary responses (yes/no) were provided to each item. The overall score ranged from 0 (no difficulty) to 6 (difficulties in all six activities).
International Journal of Social Science Studies Vol. 2, No. 3; 2014
14
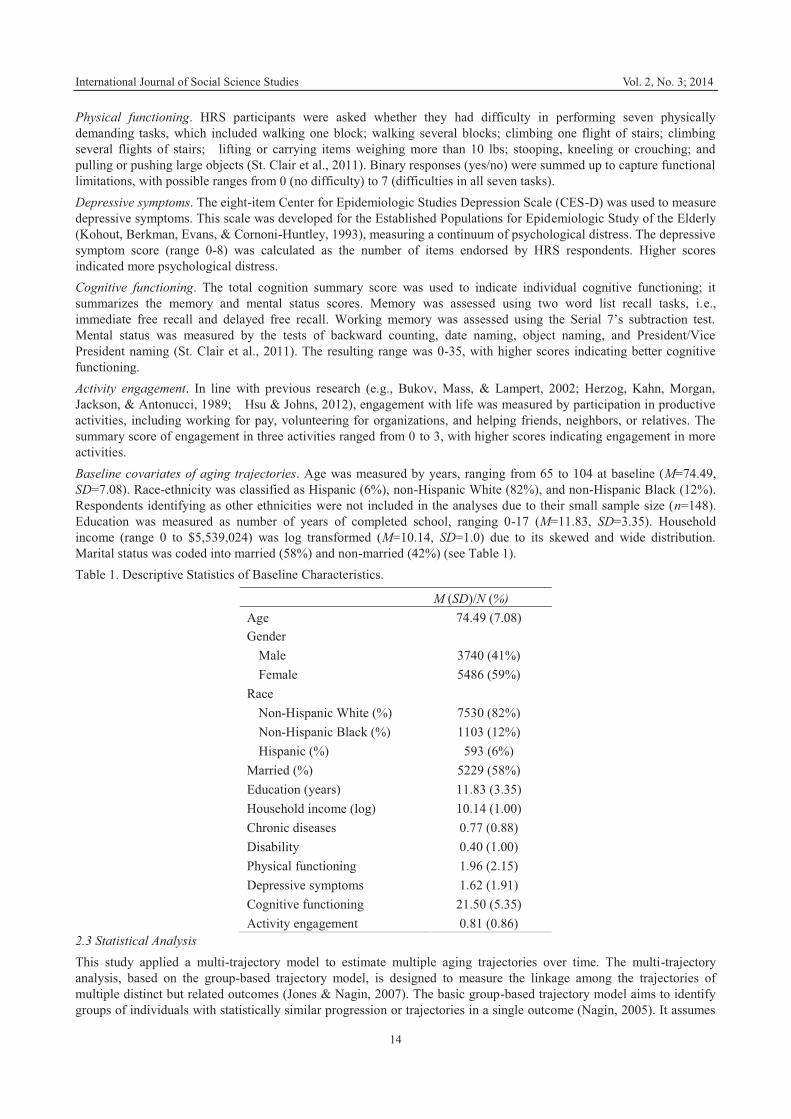
Physical functioning. HRS participants were asked whether they had difficulty in performing seven physically demanding tasks, which included walking one block; walking several blocks; climbing one flight of stairs; climbing several flights of stairs; lifting or carrying items weighing more than 10 lbs; stooping, kneeling or crouching; and pulling or pushing large objects (St. Clair et al., 2011). Binary responses (yes/no) were summed up to capture functional limitations, with possible ranges from 0 (no difficulty) to 7 (difficulties in all seven tasks). Depressive symptoms. The eight-item Center for Epidemiologic Studies Depression Scale (CES-D) was used to measure depressive symptoms. This scale was developed for the Established Populations for Epidemiologic Study of the Elderly (Kohout, Berkman, Evans, & Cornoni-Huntley, 1993), measuring a continuum of psychological distress. The depressive symptom score (range 0-8) was calculated as the number of items endorsed by HRS respondents. Higher scores indicated more psychological distress. Cognitive functioning. The total cognition summary score was used to indicate individual cognitive functioning; it summarizes the memory and mental status scores. Memory was assessed using two word list recall tasks, i.e., immediate free recall and delayed free recall. Working memory was assessed using the Serial 7’s subtraction test. Mental status was measured by the tests of backward counting, date naming, object naming, and President/Vice President naming (St. Clair et al., 2011). The resulting range was 0-35, with higher scores indicating better cognitive functioning. Activity engagement. In line with previous research (e.g., Bukov, Mass, & Lampert, 2002; Herzog, Kahn, Morgan, Jackson, & Antonucci, 1989; Hsu & Johns, 2012), engagement with life was measured by participation in productive activities, including working for pay, volunteering for organizations, and helping friends, neighbors, or relatives. The summary score of engagement in three activities ranged from 0 to 3, with higher scores indicating engagement in more activities. Baseline covariates of aging trajectories. Age was measured by years, ranging from 65 to 104 at baseline (M=74.49, SD=7.08). Race-ethnicity was classified as Hispanic (6%), non-Hispanic White (82%), and non-Hispanic Black (12%). Respondents identifying as other ethnicities were not included in the analyses due to their small sample size (n=148). Education was measured as number of years of completed school, ranging 0-17 (M=11.83, SD=3.35). Household income (range 0 to $5,539,024) was log transformed (M=10.14, SD=1.0) due to its skewed and wide distribution. Marital status was coded into married (58%) and non-married (42%) (see Table 1). Table 1. Descriptive Statistics of Baseline Characteristics.
M (SD)/N (%) Age 74.49 (7.08) Gender
Male 3740 (41%) Female 5486 (59%)
Race Non-Hispanic White (%) 7530 (82%) Non-Hispanic Black (%) 1103 (12%) Hispanic (%) 593 (6%)
Married (%) 5229 (58%) Education (years) 11.83 (3.35) Household income (log) 10.14 (1.00) Chronic diseases 0.77 (0.88) Disability 0.40 (1.00) Physical functioning 1.96 (2.15) Depressive symptoms 1.62 (1.91) Cognitive functioning 21.50 (5.35) Activity engagement 0.81 (0.86)
2.3 Statistical Analysis This study applied a multi-trajectory model to estimate multiple aging trajectories over time. The multi-trajectory analysis, based on the group-based trajectory model, is designed to measure the linkage among the trajectories of multiple distinct but related outcomes (Jones & Nagin, 2007). The basic group-based trajectory model aims to identify groups of individuals with statistically similar progression or trajectories in a single outcome (Nagin, 2005). It assumes
International Journal of Social Science Studies Vol. 2, No. 3; 2014
15
that the population comprises of a finite mixture of underlying, distinctive developmental trajectories. In the multi-trajectory model, each trajectory group is defined by the multiple trajectories of related outcomes (Nagin, 2005). The size of the trajectory group is measured by the probability of group membership, which can be linked to individual characteristics. The model also computes probabilities that link membership in trajectory groups across outcomes, thus providing a more detailed and varied summary of the developmental connections among multiple outcomes (Nagin, 2005). The likelihood for each individual i given the number of groups j is
where k is an index of the number of different outcome trajectories in each trajectory group j (k=6 in this study); πj is the probability of membership in group j; and f (*) defines the distribution for each outcome by trajectory group (Jones & Nagin, 2007). In this study, the aging trajectories were modeled using the Proc Traj Poisson and censored normal options. For the outcomes of chronic diseases, disability, physical functioning, and activity engagement, the Poisson models were used (Jones, Nagin, & Roeder, 2001):
log( ) =
Depressive symptoms and cognitive functioning were normally distributed, thus the censored normal models were used (Jones et al., 2001):
) = + εit
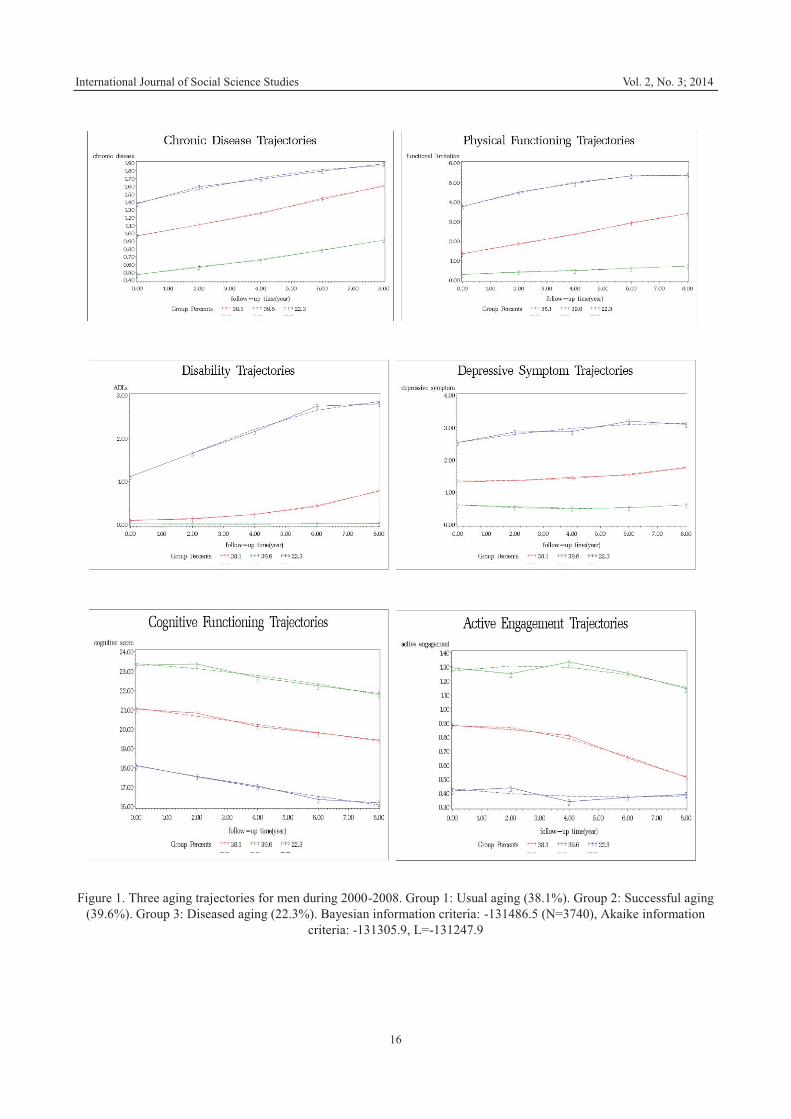
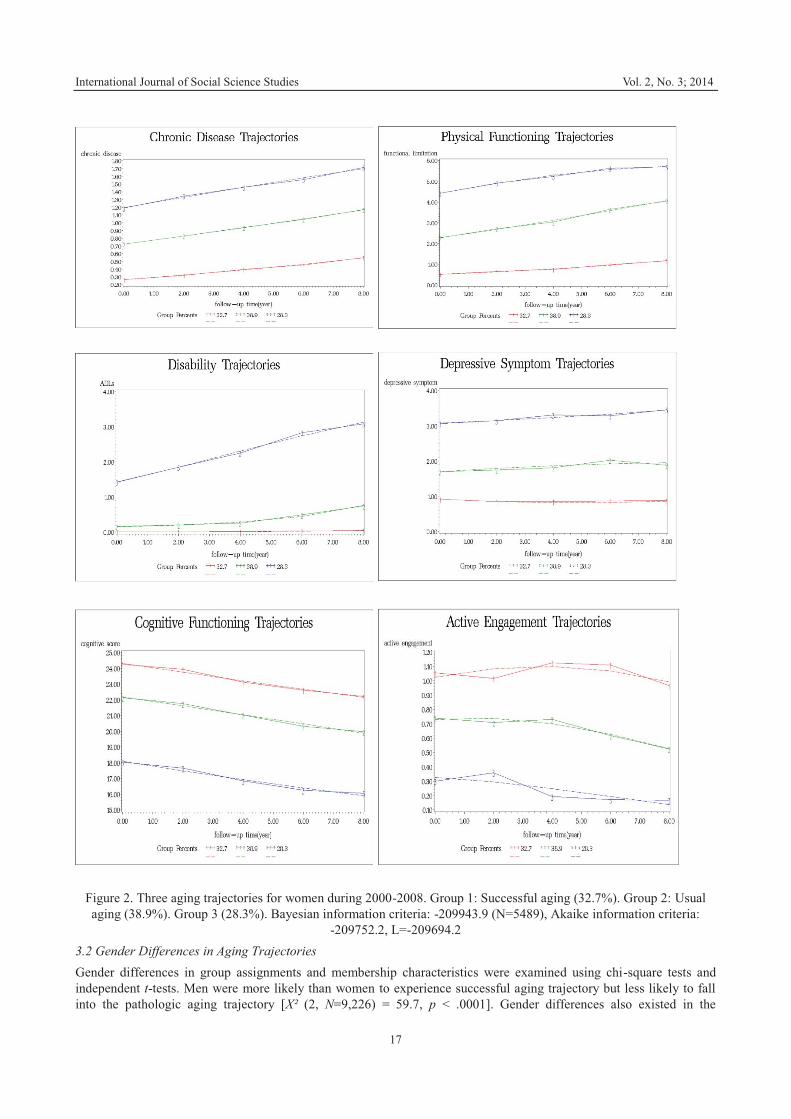
The basic models provide a predicted shape of each trajectory. In application of these models, iterative testing of the data suggested the need to consider only linear and quadratic specifications of time (also see Zimmer, Martin, Nagin & Jones, 2012). Separate trajectory models were estimated for men and women. The Proc Traj procedure in SAS program can model up to six outcomes variables simultaneously for multiple trajectories (Hsu & Jones, 2012). The Bayesian Information Criterion (BIC) is a fit index used to compare competing models with different numbers of trajectories. Theoretical fitness, parsimony principle, and the substantive importance of the groups are also important in determining the optimal trajectory group number (Hsu & Jones, 2012). Once the aging trajectory groups were derived from the multi-trajectory model, the group assignment based on posterior probabilities of group membership was used in the multinomial logistic regression analyses to examine the relationship between the aging trajectory groups and the demographic characteristics at baseline in the samples men and women, respectively. One group served as the reference category (successful aging, see below). 3. Results 3.1 Three Aging Trajectories Numerous specifications of the models were assessed and compared, including those with quadratic and cubic function of time. As a result, a three-group model was selected and fit the data best in both samples of males and females. Figure 1 displayed the trajectory plots for the three groups in the sample of men. Group 1 (38.1% of the sample, n =1,423) was usual aging group, characterized by the moderate levels of chronic diseases, disability, and physical functional limitation that increased over years, steadily lower level of depressive symptoms, and relatively high levels of cognitive functioning and activity engagement that decreased over time. Group 2 (39.6% of the sample, n =1,482) was successful aging group. Members in this group had few but increasing chronic diseases over time, steadily low levels of disability and physical functional limitation, steadily few depressive symptoms, and high levels of cognitive functioning and activity engagement that decreased over time. Group 3, the pathological aging group, contained 22.3% of the sample (n = 835). Members in this group exhibited the highest levels of chronic diseases, disability, and physical functional limitation that increased over time, steadily high level of depressive symptoms, and lowest levels of cognitive functioning and activity engagement. Figure 2 displayed the trajectory plots for the three groups in the sample of women. Group 1 (32.7% of the sample, n =1,797) was classified as successful aging group; Group 2 (38.9% of the sample, n =2,143) was usual aging group; and Group 3 (28.3% of the sample, n =1,546) was identified as pathological aging group. The three groups in women exhibited similar characteristics in physical, mental, cognitive, and social functioning as did the sample of men.
International Journal of Social Science Studies Vol. 2, No. 3; 2014
16
Figure 1. Three aging trajectories for men during 2000-2008. Group 1: Usual aging (38.1%). Group 2: Successful aging (39.6%). Group 3: Diseased aging (22.3%). Bayesian information criteria: -131486.5 (N=3740), Akaike information
criteria: -131305.9, L=-131247.9
International Journal of Social Science Studies Vol. 2, No. 3; 2014
17
Figure 2. Three aging trajectories for women during 2000-2008. Group 1: Successful aging (32.7%). Group 2: Usual aging (38.9%). Group 3 (28.3%). Bayesian information criteria: -209943.9 (N=5489), Akaike information criteria:
-209752.2, L=-209694.2 3.2 Gender Differences in Aging Trajectories Gender differences in group assignments and membership characteristics were examined using chi-square tests and independent t-tests. Men were more likely than women to experience successful aging trajectory but less likely to fall into the pathologic aging trajectory [X² (2, N=9,226) = 59.7, p < .0001]. Gender differences also existed in the
International Journal of Social Science Studies Vol. 2, No. 3; 2014
18
membership indicators and characteristics across three groups (Table 2). In general, older women reported fewer diagnosed chronic diseases, but more physical functional limitations and depressive symptoms across three groups. As to ADL disability, women in the successful aging group were not different than their male counterparts at earlier observation periods, but reported more disabilities at later observation periods. In contrast, women in the usual and pathologic aging groups had more disabilities at earlier periods but no gender difference was observed at later times. Women in the successful aging and the usual aging groups usually had higher cognitive functioning scores than male counterparts, but no gender difference was observed in the pathologic aging group. Older men were generally more actively engaged with life across three groups. Women had less household income and were less likely to be married than men across three groups. Table 2. Gender differences in three aging trajectory groups and membership characteristics.
Groups Successful aging Usual aging Pathologic aging Gender Men Women Men Women Men Women Age (in 2000) 71.24 71.67 * 74.71 74.80 77.70 78.53 * Non-Hispanic White 0.87 0.85 0.84 0.81 * 0.75 0.74 Non-Hispanic Black 0.08 0.10 0.10 0.12 0.15 0.17 Hispanic 0.05 0.05 0.05 0.07 0.09 0.09 Married 0.84 0.57 *** 0.75 0.45 *** 0.66 0.30 *** Education (years) 13.05 12.61 *** 11.82 11.81 10.73 10.51 Income (log) 10.67 10.32 *** 10.33 9.98 *** 9.99 9.53 *** Chronic diseases
2000 0.46 0.26 *** 0.98 0.73 *** 1.38 1.19 *** 2002 0.56 0.32 *** 1.12 0.83 *** 1.59 1.35 *** 2004 0.65 0.40 *** 1.26 0.94 *** 1.68 1.47 *** 2006 0.78 0.46 *** 1.45 1.03 *** 1.79 1.57 ** 2008 0.91 0.55 *** 1.61 1.17 *** 1.88 1.72
Physical functioning 2000 0.28 0.50 *** 1.34 2.28 *** 3.79 4.44 *** 2002 0.41 0.64 *** 1.87 2.72 *** 4.52 4.92 *** 2004 0.48 0.75 *** 2.31 3.03 *** 4.96 5.26 ** 2006 0.61 0.97 *** 2.94 3.68 *** 5.34 5.64 * 2008 0.71 1.16 *** 3.42 4.07 *** 5.38 5.70 *
Disability 2000 0.01 0.01 0.09 0.15 *** 1.12 1.44 *** 2002 0.01 0.01 0.13 0.20 *** 1.66 1.85 * 2004 0.01 0.02 ** 0.22 0.25 2.16 2.27 2006 0.02 0.04 * 0.43 0.49 2.75 2.86 2008 0.03 0.04 * 0.77 0.75 2.84 3.10
Depressive symptoms 2000 0.59 0.90 *** 1.31 1.71 *** 2.57 3.07 *** 2002 0.55 0.85 *** 1.35 1.75 *** 2.87 3.15 * 2004 0.50 0.85 *** 1.45 1.81 *** 2.88 3.30 ** 2006 0.52 0.86 *** 1.52 2.03 *** 3.21 3.30 2008 0.60 0.89 *** 1.76 1.88 3.09 3.47
Cognitive functioning 2000 23.35 24.30 *** 20.96 22.13 *** 18.11 17.98 2002 23.39 23.98 *** 20.79 21.73 *** 17.53 17.64 2004 22.67 23.13 ** 20.11 21.01 *** 17.10 16.79 2006 22.26 22.63 * 19.74 20.31 ** 16.42 16.19 2008 21.87 22.20 19.34 19.96 * 16.22 16.03
Activity engagement 2000 1.30 1.06 *** 0.87 0.74 *** 0.42 0.30 *** 2002 1.25 1.02 *** 0.85 0.71 *** 0.44 0.35 ** 2004 1.34 1.12 *** 0.80 0.73 * 0.34 0.19 *** 2006 1.26 1.11 *** 0.65 0.62 0.37 0.17 *** 2008 1.15 0.97 *** 0.51 0.52 0.39 0.16 ***
*p<.05, **p<.01, ***p<.001

International Journal of Social Science Studies Vol. 2, No. 3; 2014
19
3.4 Socio-demographics of Aging Trajectories Multinomial logistic regressions were used to examine the relationship between socio-demographics at baseline and the trajectory groups. The results indicated that the successful aging group was significantly different than the other two groups (Table 3). In both genders, compared with the successful aging group, members in other groups were more likely to be older, less educated, and with less household income. Race/ethnicity and marital status were generally not related to group memberships, except that non-Hispanic Black women were more likely to be in the pathologic aging group than non-Hispanic White women. Table 3. Results of Multinomial Logistic Regression Analyses.
Men Women Predictors in baseline
Usual aging group (n=1383)
Pathologic aging group (n=816)
Usual aging group (n=2111)
Pathologic aging group (n=1534)
Age 1.10*** 1.17*** 1.08*** 1.15*** Non-Hispanic Black 0.96 1.30 1.23 1.41** Hispanic 0.69 1.08 0.96 0.83 Education 0.92*** 0.89*** 0.93*** 0.87*** Household income 0.71*** 0.54*** 0.76*** 0.55*** Married 0.87 0.83 1.05 0.98 -2 Log likelihood =7804 df=12 -2 Log likelihood =11814 df=12 Note: The reference group of the dependent variable was the successful aging group for both men (n=1450) and women (n=1774) samples. The reference groups of independent variables were Non-Hispanic White (race-ethnicity), and not married (marital status). *p<.05, **p<.01, ***p<.001 4. Discussion 4.1 Finding Implications Findings of this study provide support for a multidimensional model of successful aging that emphasizes multiple pathways in the aging process, as proposed by Rowe and Kahn (1987; 1997). Through examining temporal changes in six dimensions of physical, mental, cognitive, and social functioning, this study identified three distinct aging trajectories among older Americans. Consistent with the meta-analysis done by Depp and Jeste (2009), the study documented that a sizable proportion (over one third) of older Americans were at low risk of disease and disability, had high physical and cognitive functional capacity, and were actively engaged in society. Differentiated from the successful aging group, about 40 percent of older adults falling in the usual aging group demonstrated certain risk of disease and disability, but were still functioning mentally, cognitively, and socially. In contrast, over one fifth of males and one quarter of females in the study sample were classified into the pathologic aging group. They might have experienced disease-related declines, with least functional capacity in all six domains among the three groups. The distinctions among three aging trajectories indicate population heterogeneity in the aging process, providing a relatively comparative and holistic picture of the aging pathways. Gender differences exist in the aging trajectories and this study contributes to clarifying previous equivocal findings (e.g., McLaughlin et al., 2010; Newman et al., 2003). Given that older women reported more functional limitations and depressive symptoms as well as lower levels of social engagement, they were less likely than men to age successfully but more likely to fall into the pathologic aging trajectory. Even within the successful aging group, women had lower physical, mental, and social functioning than men. On the contrary, this study documents that women reported fewer diagnosed chronic diseases than men, probably due to the fact that men had higher rates of some chronic diseases (e.g., cancer, coronary and pulmonary disease) (McLaughlin et al., 2010; Murtagh & Hubert, 2004). However, when examining nonfatal disabling conditions (e.g., fractures, osteoporosis, back problems, osteoarthritis, and depression), old women consistently reported more functional limitations and physical disability, and diminished quality of life than older men (Murtagh & Hubert, 2004). Gender differences in physical capacity due to primary or comorbid conditions may affect how to define and measure successful aging. Future research need develop gender-specific measures to profile aging trajectories. Consistent with previous research (e.g., McLaughlin et al., 2010), this study found that younger age and higher levels of education and income were related to the likelihood of aging successfully. Obviously, younger age is related to lower risk of disease and disability or age-related losses. Higher education and income would enable older adults to have great access to health promotion resources, cognitive resources, and psychosocial resources, which in turn help eliminate the adverse effects in later life and increase the likelihood of aging successfully (Beatty, Kamarck, Matthews, & Shiffman,
International Journal of Social Science Studies Vol. 2, No. 3; 2014
20
2011; McLaughlin et al., 2010). Also socioeconomic status is related to health-promoting behaviors, such as physical activity, avoidance of tobacco, and nutritious diets during the life course (Pampel, Krueger, & Denney, 2010). Older adults with healthy behaviors and lifestyle are likely to age successfully. This study contributes to the literature on successful aging in several ways. Through the use of nationally representative, longitudinal data and the application of the multiple trajectory analysis technique, this study improves our understanding of the multidimensional concept of successful aging and population heterogeneity in the aging process. Although a number of studies were generated in accordance with Rowe and Kahn’s model, few of them have incorporated multiple dimensions (i.e., physical, mental, cognitive, and social functioning) of successful aging, and at the same time, examined temporal changes in these dimensions. Besides, most studies assumed population homogeneity in the aging process without investigating the distinction between successful aging and other possible aging trajectories. Static, rigid criteria of successful aging that were used in cross-sectional design studies may mask our understanding of the dynamic nature in the aging process. These criteria may be changeable conditional on chronological age, gender, or other cultural specific contexts. The current study captures the mutable outcomes and classifies older adults with similar trajectory trends in the aging process through the use of multi-trajectory modeling. This dynamic approach helps identify and summarize multi-period aging trajectories, demonstrating individual probabilities or memberships in each identified trajectory. This study also provides strong evidence for gender differences in successful aging and the socioeconomic impacts on the aging trajectory patterns, thus clarifying the mixed findings in the literature. We can never underestimate the salience of social statuses in predicting later life well-being. 4.2 Limitations There are limitations in this study. First, the measures of successful aging used in this study only included objective assessments. As widely debated in the literature, both objective criteria and subjective evaluations are important to assess various aging trajectories (e.g., Pruchno et al., 2010; Strawbridge et al., 2002). The inclusion of subjective components would likely result in different typologies of successful aging trajectory (Pruchno et al., 2010). It is important for future research to incorporate both components to identify and compare different successful aging trajectories. Second, the six dimensions selected in this study may not be exclusive or valid. For example, although social connection was used to measure activity engagement in previous research (e.g., McLaughlin et al., 2010), the preliminary analysis in this study indicated that it did not distinguish the specific aging trajectories, probably due to the lack of clear conceptualization or valid measures in the HRS. Furthermore, activity engagement was limited to only three types of productive activity: paid work, organizational volunteering, and informal help to friends or relatives. Definitely, other activities such as church attendance, family caregiving, and participation in social clubs or groups would fall within the realm of social engagement and have influences on older adults’ health (Thomas, 2012). Further efforts are needed to develop valid measurement of activity engagement and evaluate its role in distinguishing aging trajectories. Third, transitions among aging trajectories were not examined in this study. It is common that age-relate losses of function lead to transition “from successful to usual, usual to diseased, diseased to impaired” in the aging process (Rowe & Kahn, 1987, p.148). In addition, extrinsic factors such as life style, diet, exercise and psychosocial factors may affect successful aging trajectories and transitions. Lastly, this analysis may overestimate the overall probability of successful aging, in part due to the lack of consistent criteria across observation periods and in part due to the exclusion of proxy respondents as well as nursing residents. 4.3 Conclusion Despite these limitations, this study contributes to research on successful aging by identifying distinctive aging trajectories, contrasting successful aging with usual and pathologic aging trajectories, and illustrating heterogeneity in the aging process based on within-person functional change and between-person differences in socio-demographic characteristics. Findings provide support for Rowe and Kahn’s successful aging model and multiple aging pathways (1987; 1997). Also this study documents gender difference in the aging trajectories and the socioeconomic impacts on the aging trajectory patterns, clarifying equivocal findings in the literature. Future research need improve measurement of successful aging, model transitions among different aging trajectories, and incorporate health behavior and resource variables that have direct effects on the aging outcomes. Given the rapid growth of the older population and the prolonged life expectancy, it is important to promote successful aging through decreasing chronic diseases and the associated disabilities, and improving physical, cognitive, and social functioning in the older population. Acknowledgements This work was supported by the Lois and Samuel Silberman Fund and the Steven Manners Faculty Development Award, University of Pittsburgh Center for Social and Urban Research.
International Journal of Social Science Studies Vol. 2, No. 3; 2014
21
References Andreescu, C., Chang, C. C., Mulsant, B. H., & Ganguli, M. (2008). Twelve-year depressive symptom trajectories and
their predictors in a community sample of older adults. International Psychogeriatrics, 20, 221-236. http://dx.doi.org/10.1017/S1041610207006667
Beatty, D. L., Kamarck, T. W., Matthews, K. A., & Shiffman, S. (2011). Childhood socioeconomic status is associated with psychosocial resources in African Americans: The Pittsburgh Healthy Heart Project. Health Psychology, 30, 472-480.
Berkman, L. F., Seeman, T. E., Albert, M., Blazer, D., Kahn, R., Mohs, R., Finch, C., Schneider, E., Cotman, C., McClearn, G. et al. (1993). High, usual and impaired functioning in community-dwelling older men and women: Findings from the MacArthur Foundation Research Network on Successful Aging. Journal of Clinical Epidemiology, 46, 1129-1140.
Bukov, A., Mass, I., & Lampert, T. (2002). Social participation in very old age: Cross-sectional and longitudinal findings from BASE. Journal of Gerontology, Series B: Psychological Sciences and Social Sciences, 57, 510-517. http://dx.doi.org/10.1093/geronb/57.6.P510
Depp, C.A. & Jeste, D.V. (2009). Definitions and predictors of successful aging: A comprehensive review of larger quantitative studies. Focus: The Journal of Lifelong Learning in Psychiatry, VII, 137-150.
Dodge, H. H., Du, Y., Saxton, J. A., & Ganguli, M. (2006). Cognitive domains and trajectories of functional independence in nondemented elderly persons. Journal of Gerontology, Series A: Biological Sciences and Medical Sciences, 61, 1330-1337.
Herzog, A. R., Kahn, R. L., Morgan, J. N., Jackson, J. S., & Antonucci, T. C. (1989). Age differences in productive activities. Journal of Gerontology: Social Sciences, 44, S129-S138. http://dx.doi.org/10.1093/geronj/44.4.S129
Hsu, H.C. & Jones, B.L. (2012). Multiple trajectories of successful aging of older and younger cohorts. The Gerontologist, 52, 843-856. http://dx.doi.org/10.1093/geron/gns005
Jones, B. L., & Nagin, D. S. ( 2007). Advances in group-based trajectory modeling and an SAS procedure for estimating them. Sociological Methods and Research, 35, 542-571. http://dx.doi.org/10.1177/0049124106292364
Jones, B. L., Nagin, D. S., & Roeder, K. (2001). A SAS procedure based on mixture models for estimating developmental trajectories. Sociological Methods and Research, 29, 374-393. http://dx.doi.org/10.1177/0049124101029003005
Kohout, F.J., Berkman, L.F., Evans, D.A., & Cornoni-Huntley, J. (1993). Two shorter forms of the CES-D (Center for Epidemiological Studies Depression) depression symptoms index. Journal of Aging and Health, 5, 179-193.
Liang, J., Bennett, J. M., Shaw, B. A., Quiñones A. R., Ye, W., Xu, X., et al. (2008). Gender differences in functional status in middle and older age: Are there any age variations? Journal of Gerontology, Series B: Psychological Sciences and Social Sciences, 63, S282-S292.
McLaughlin, S.J., Connell, C.M., Heeringa, S.G., Li, L.W., & Roberts, L.S. (2010). Successful aging in the United States: Prevalence estimates from a national sample of older adults. Journal of Gerontology: Social Sciences, 65(B), 213-226. http://dx.doi.org/10.1093/geronb/gbp101
Murtagh, K.N. & Hubert, H.B. (2004). Gender differences in physical disability among an elderly cohort. American Journal of Public Health, 94, 1406-1411.
Nagin, D. S. (2005). Group-based modeling of development. Cambridge, MA: Harvard University Press. Newman, A.B., Arnold, A.M., Naydeck, B.L. et al. (2003). Successful aging: Effect of subclinical cardiovascular
disease. Arch Intern Med., 163, 2315-2311. Ng, T.P., Broekman, B.F.P., Niti,M., Gwee, X., & Kua, E.H. (2009). Determinants of successful aging using a
multidimensional definition among Chinese elderly in Singapore. The American Journal of Geriatric Psychiatry, 17, 407-416. http://dx.doi.org/10.1097/JGP.0b013e31819a808e
Pampel, F.C., Krueger, P.M., & Denney, J.T. (2010). Socioeconomic disparities in health behaviors. Annual Review of Sociology, 36, 349-370.
Pruchno, R. A., Wilson-Genderson, M., Rose, M., & Cartwright, F. (2010). Successful aging: Early influences and contemporary characteristics. The Gerontologist, 50, 821-833. http://dx.doi.org/10.1093/geront/gnq041
Rowe, J. W., & Kahn, R. L. (1987). Human aging: Usual and successful. Science, 237, 143–149. Rowe, J. W., & Kahn, R. L. (1997). Successful aging. The Gerontologist, 37, 433–440.
International Journal of Social Science Studies Vol. 2, No. 3; 2014
22
Servais, M. A. (2010). Overview of HRS public data files for cross-sectional and longitudinal analysis. Ann Arbor: Survey Research Center, Institute for Social Research, University of Michigan. Retrieved from http://hrsonline.isr.umich.edu/sitedocs/dmgt/OverviewofHRSPublicData.pdf.
St. Clair, P., Bugliari, D., Campbell, N., Chien, S., Hayden, O., Hurd, M. et al. (2011). RAND HRS data documentation, version L. Labor & Population Program, RAND Center for the Study of Aging. Retrieved from www.rand.org/content/dam/rand/www/external/labor/aging/dataprod/randhrsL.pdf.
Strawbridge, W. J., Wallhagen, M. I., & Cohen, R. D. (2002). Successful aging and well-being: Self-rated compared with Rowe and Kahn. The Gerontologist, 42, 727–733.
Thomas, P.A. (2012). Trajectories of social engagement and mortality in late life. Journal of Aging and Health, 24, 547-568. http://dx.doi.org/10.1177/0898264311432310
Von Faber M, Bootsma-van der Wiel A, van Exel E, Gussekloo L, Lagaay AM, van Dongen E, et al. (2001). Successful aging in the oldest old: Who can be characterized as successfully aged? Archives of Internal Medicine, 161, 2694–2700.
Yang, S., Hoshi, T., Wang, S., Nakayama, N., & Kong, F. (2013). Socioeconomic Status, Comorbidity, Activity Limitation, and Healthy Life Expectancy in Older Men and Women: A 6-Year Follow-Up Study in Japan. Journal of Applied Gerontology. http://dx.doi.org/10.1177/0733464813503041
Zimmer, Z., Martin, L.G., Nagin, D.S., & Jones, B.L. (2012). Modeling disability trajectories and mortality of the oldest-old in China. Demography, 49, 291-314.
This work is licensed under a Creative Commons Attribution 3.0 License.

International Journal of Social Science Studies Vol. 2, No. 3; July 2014
ISSN 2324-8033 E-ISSN 2324-8041 Published by Redfame Publishing
URL: http://ijsss.redfame.com
23
Exile as Source of Spanish Moderate Political Thinking during the First Half of Nineteenth Century
Considerations on English case after 1823 Rebeca Viguera Ruiz1
1Department of History, University of La Rioja, La Rioja, Spain & Visiting Scholar at CEMS, New York University, New York, United States Correspondence: Rebeca Viguera Ruiz, Departamento de Ciencias Humanas, Universidad de La Rioja, Calle Luis de Ulloa, s/n, 2004-Logrono, La Rioja, España. Received: March 5, 2014 Accepted: March 25, 2014 Available online: May 22, 2014 doi:10.11114/ijsss.v2i3.366 URL: http://dx.doi.org/10.11114/ijsss.v2i3.366 Abstract This article seeks to analyze the moderate political thinking of those exiled during the postrevolutionary stage, as a conservative solution that many new elites of the Spanish liberalism tried to perform within the difficult context Spain was going through by the first decades of 19th century. A new moderate constitutionalism was common in the 30s in this country, and it was considered a necessary step mean the transition towards liberalism was being completed. The main goal herein is to review some previous assumptions and provide new insights on the role that the exile played during the first half of nineteenth century as a source of moderate political thinking in Spain. This will be an effort to understand the influence of the exile in their new identities paying special attention to their lives overseas. It implies a study about how that experience had a bi g impact in the new Spanish political project. Keywords: Liberalism, conservatism, postrevolutionary stage, local politics, parliamentary regime, exile, Spain 1. Perspectives of Exile as a Source of Political Thinking Changes in the 19th Century In History all particular causes lead to particular consequences, and even small causes can be said to have very significant consequences.i These ideas can make us to consider that, in order to come with some initial assumptions about the role that the exile played during the first half of nineteenth century as a source of moderate political thinking in Spain, it is important to have in mind which was the historical context in that country, as well as the new reality exiles experienced in their new destination. The effort to understand the role of the exile in the shaping of their new identities demands a central focus on their lives overseas, and a recognition of the way that experience had been driven by and reflected in their new political project; as “borders have crossed lives as often as bodies have crossed borders.”ii On March 19, 1812, the first political Constitution of the Spanish Monarchy was enacted in Cadiz with a clear liberal content. This let a whole new political class participate in the decisions of the Cortes and the Government, and gave sovereignty to the people, something unknown for them until then. It implied, in short, a triumph over the monarchist absolutism and, simultaneously, was the culmination of the country´s struggle that had been held since 1808 against the Imperial Army of Napoleon. Despite the initial success of the legislative text, all the strong political commitments expected as consequence of this constitutional progress disappeared once Ferdinand VII ascended the throne. After the negotiations of Valençay by the end of 1813, the monarch was able to return to Spain in February 1814, supported by most of the people who had fought for its legitimacy during the last years. Despite the hopes of the Spanish people to maintain the rights and freedom that the Constitution of Cádiz had granted, Ferdinand VII ordered its abolition on May 4, 1814. It was the start point of a six years period of absolutistm along with a widespread repression against liberals, francophiles and any military official who had defended Joseph I Bonaparte. It would be the first liberal exile of the century. Nevertheless, the ideological and political pillars of a liberal state had been settled, and it did not take long for them to reappear; wich could mean the decadence of the Ancien Regime as an effective political system. This is why the insurrection of Rafael de Riego triumphed on January 1, 1820, in Las Cabezas de San Juan. This rebellion resulted in
International Journal of Social Science Studies Vol. 2, No. 3; 2014
24
the promulgation of the Constitution of 1812 that led the nation to a second period of constitutional political exercise known as “Trieno Liberal”. The liberal principles and the representative constitutional system were again confirmed as overcoming the anachronistic absolutism, that had not succeeded in imposing its power over the people and their demands for change since 1812. “From 1820 to 1823, everything was about consolidating the constitutional government and promoting its advantageous consequences: at giving reverence and respect to the throne, as well as unity and stability to the administrative machine.”iii It resulted in a very brief triumph again, though. Ferdinand VII had been forced to recognize the Constitution, but he never really accepted its contents. For this reason he sought help from Europe, and in 1823 the Holy Alliance entered Spain through the Pyrenees to help to restore his power. Those regiments and the enterprise were supported by European powers, who had decided during the Congress of Viena to support an international intervention in domestic politics of Spain “for the purpose of preserving the old kingdom in order to reconcile it to Europe.” iv This response from the absolutist monarchs facing the liberal movements in the continent put an end to the second Spanish liberal experience. In consequence, the absolute monarchy was restaured in government, which let Ferdinand VII begin a new persecution against all the liberal men that might put his authority at risk. He condemned to death a large part of the deputies. Some leaders of the military forces defending the emerging liberalism were prosecuted, everyone helding a political responsibility during the years of the Trienio was condemned, and thousands were forced to exile because of their liberal beliefs. A second liberal exile started then, with France and England as main destinations for many individuals from all social classes departing, mainly, from Cadiz, Gibraltar and La Coruña.v This new exile would make those who suffered it reconsider their ideas in favor of more moderate political changes in Spain rather than the first radical approaches of 1812. Thus, this article aims to reflect on the concrete experience of the exile some Spanish political actors lived through in England after 1823, in order to better understand why so many of them performed such ideological moderation back in Spain. Although France continued to be a common destination for migrants, the new European atmosphere after the Napoleonic Wars motivated them “to seek refuge in the bustling London to an elite group of liberal intellectuals, conspirators, politicians, artists, senior government officials, police officers and persecuted, Spanish or European, whose countries were ruled by absolutist regimes.”vi It is not the purpose of this article to focus on the private lives of the characters mentioned, nor study their careers. More specifically it attempts to be an approach to the way some exiles tended to moderate ideas after the 1820s seeking to adapt themselves and Spanish politics to a new social and political reality. The situation in Spain was complex, trying to pass over the Ancien Regime in order to establish a liberal political system toward democracy. After some revolutionary attempts coming from the Constitution of 1812, a new moderate constitutionalism was settled in the 1820s and the 1830s. This was considered by a majority to be a necessary step of transition towards liberalism. Although some of the “exaltados” tried to perform a more radical liberalism during the first decades of the century, both the exile experience after the absolutist repression and the character of Spanish people convinced them to moderate their struggle. Their experience of the exile made them to get in touch with other political solutions and new social environments where they could develop their professional or political training. Many eventually realized that moderatism was an option which will let them keep their economic privileges, hold their network of patronage, and move forward into national politics and liberal institutions. The following pages seek to show some of the key points that support this idea, taking in consideration the experience of renowned politicians together with the observation and emotions from the displacement.vii The liberals who supported a new representative type of government during the first half of the nineteenth century were part of a romantic generation crossed by repression and a long exile background.viii 2. First Constitutional Experiences of a New Liberal Political Class in the Beginning of the Nineteenth Century. Brief Review As outlined above, the foreign invasion of the Península by the end of 1807 resulted in fundamental changes and the first contact with contemporary European political thought. During this period, some signs of imminent political changes coming can be observed during the War of Independence. The fact that it all began as a result of an armed conflict meant that the occupation of the troops accelerated the succession of events. From then on, the definitive collapse of the absolute regime could not be stoped, as it was no longer useful in Spain. This originated the appearance of the first attempts to set up a modern liberal state in the country, which actually took place gradually in a constant process of feedback from the old institutions and new ideas, and from new institutions and old privileges. ix Thus, the two first decades of the nineteenth century provided a background of permanent instability and constant upsets due to the war and the bicephalous power in the country: the Napoleonic solution giving the throne to his brother José and the proliferation of Juntas everywhere in the country. The Cortes also approved the Constitution of Cádiz in 1812, which
International Journal of Social Science Studies Vol. 2, No. 3; 2014
25
was supposed to be a model of liberties and the gateway to liberalism in Spain. Concepts like representativeness, individual rights and freedoms, separation of powers or rationality became common interests among Spanish people and politics. Many of the members who played an important role working for public institutions at the beginning of the century were landowners who showed strong roots in provincial politics, as well as a high level of education; both essential requirements to understand their personal and professional growth together with their concerns on public affairs. In those days, public officials should have been elected, but the real practice showed the persistence of vertical relationships of influence that meant the perpetuation of nepotism. Many of them, although formed under enlightened ideas, became supporters of the new liberal ideas. The latter would lead the country to ensure a parliamentary political solution which tried to solve the problems generated by the lack of strong public authorities after the royal family abandoned the country due to the French invasion. It was a political measure that would allow both the economic recovery of the nation and its cultural progress toward the “ideas of freedom.”x At first, most men who supported liberalism did so from a rather revolutionary position, as almost any attitude opposed to absolutism would be considered rebellious at that time. This is something that cannot be understood without taking notice of the difficult political situation in Spain and its permanent instability. People constantly cried out for measures to solve their problems once and for all. Hence, although almost every person in the country wanted changes, many people tended to look for innovative but also cautious and conservative ideas. These were the ideas of a new generation, who suffered the consequences of the national events and demanded reforms. Most of the time reforms cannot be considered progressive, as coming along with those demands for change was a widespread search of the best way to maintain their economic interests and their heritage. Thus, even though liberals were typically more radicals, those then spectators of the national political scene ended up being much more prudent and more conservative in practice. This first liberal experience in Spain lasted only from 1812 to 1814. After the institutional and political reorganization that Ferdinand VII performed between 1814 and 1820, the next triumph of liberal ideas would be in January 1820, when the Constitution of Cádiz was again passed and the second period of liberal government, the Trienio, started. It is possible now to see how the two attempts to restore the absolute monarchy in Spain failed. The experience of 1812 and the Trienio had prepared the way for a change which could not be reversed. Despite those who dissented the new principles, the liberal cause and a more democratic government were permanently on the minds of the people. Politicians, furthermore, never ceased then to defend the two basic pillars of the Nation: the monarchy and religion. Over the years most of the public authorities became committed to the new constitutional advances, acting together against those who caused offense to property rights and national morale or endangered the stability of the Nation. It became evident that the achievement of the necessary public to make any progress toward the consolidation of a liberal state needed to be based on a constitutional monarchy, away from radicalism and extreme positions in any form.xi Nonetheless, as pointed out before, despite all the improvements achieved and some preventive measures, absolutism was restored in April of 1823, thanks to the European intervention in the Península.xii The following liberal turn-around of institutions and government that took place implied a new exile for many political figures and intellectuals. Ferdinand VII did not hesitate to act immediately imprisoning those whom he was able to capture, and forcing others to take up exile. As a consequence of all these regime changes and institutional, legal and economic processes in the country, Spanish liberals –while exiled- started to realize they needed to readapt themselves to the time and context they were living in. There was a gradual transformation in their way of seeing and practicing politics as they had to live through a whole series of historic changes. Excited once by the new liberal ideas, the experience of exile and the failure of absolutism in Spain made them lean towards moderate positions in the next stage of their political life; a moderation which could be the solution for the problems of the nation.xiii Tracing their lives throughout their exile would give us a sense of how crucial it was and why it is said the exile changed the life and spirit of the exiled. In some sense, the approach of this paper seeks to understand the significance of that experience to them, and how they lived far from their homes. It is neccesary to interpret the careers of people in their changing personal context –as it was the exile for all of them-, so as to look at their actions through the prism of their economic, political and socio-cultural actions. Moving beyond the nation also provided a new geographical scene from which national identity and political thoughts could be articulated anew. While each person was unique, the lives of these men were interconnected in an effort to integrate themselves into a new world overseas.
International Journal of Social Science Studies Vol. 2, No. 3; 2014
26
3. The Experience of Exile The exile was an essential part of nineteenth century politics and the life of many liberals. It was an experience that modified the life and beliefs of all those who suffered it as both personal and political perspective. In the case of Spanish exiles, it was the process that put them into a direct contact with the European liberalism and that greatly contributed to the forging of a new generation of men committed to the new ideals. How was life of these men in London on a daily basis? And, what were their experiences or learning environment? It is worth mentioning, succinctly, some of its characteristics in order to understand how the experience of exile and the way it was carried out affected these men.xiv At the same time they were always aware of the Spanish problems within a context of crisis, they showed great admiration of English prosperity. Some exiles were already famous politicians before arriving in London. Nonetheless, many others revealed not to be renowned political leaders nor men who devoted their life only to the parliamentary cause. They were men who did not produce ideological theories and did not write a long list of works or speeches in Congress that could let us to know more about their rhetoric and eloquence. Some of them did, some did not. Some accomplished leading political positions, and some did not. Regardless which the case was, together they represent a true portrait of enlightened, educated men, involved in their businesses, dedicated to their profession and, in their personal ascent, willing and able to take advantage of the new political and historical circumstances of the contemporary Spain on the cusp of the eighteenth and nineteenth centuries. There was no doubt London had become one of the biggest meeting points for immigrants from both Europe and other cities in England. Together with the population growth, that caused significant changes in London´s society, culture and administration.xv Spanish exiles were direct witnesses to this England which offered a totally diferent picture and experiences than the one they were used to living in Spain. ¿Were they able to understand the meaning of these changes and realities? Could they integrate and assimilate them to their culture? Mention must be made of this, however briefly, to really understand what the experience of exile meant to them. Whatever came to pass, no one could escape the stamp that those years impressed on their lives.xvi 3.1 Life in London The first problem that Spanish exiles had to confront was the departure and the trip away from home and family. Ramón Alesón Alonso de Tejada claimed that “it was an unpleasant sensation to feel alone, without anyone to talk to, and being suspicious to a government that is leery not only of you but of all Spaniards and Portuguese.”xvii José María Blanco White was also of that opinion, remembering how he, “with too little clothing for the English winter, cold…,” felt nostalgia and homesickness in that country “so completely different from his adored sun from Andalucia and the light of its landscapes.”xviii These testimonies place the subjects in their most specific dimension in time and space, which is helpful to understand their lives and thoughts. Longing for their country and the unfamiliarity with the English language caused them not just the painful experience of migration itself, but also the personal upheaval of being torn from their homes. This represents “how hard subjects had to work to create communal spaces of belongings based on the perceived reproduction of traditions.”xix The language barrier was a major obstacle for them, so they needed to find common spaces to meet, familiar places to share, and friends or entertainment to help them cope with their stay in England. Nonetheless, in addition to these inherent nuances in any socio-cultural change imposed by a forced exile, it is necessary to refer to the most original and fascinating circumstances that they could experience in the first person. 3.1.1 London, the Richest City in the World During the first decades of the nineteenth century England went through a period of great splendor, and London became the heart of the country. A flourishing trade, the development and progress of scientific knowledge, along with increasing social classes differentiation, made London to be the most influential and prestigious city in Europe. Trade was the center of gravity for its economy, as it brought about true admiration.xx For exiles this city was immense and boundless. This is why Blanco White describes it as the richest, happiest and most civilized city widely known throughout history.xxi Everything was expensive, and nothing was more appreciated than gold and wealth.xxii For each of the characters mentioned, as well as others such us Ángel Saavedra, Espronceda, Ruiz de la Vega or José Joaquín de Mora, it was a place where money seemed to appear everywhere and every last detail could arouse great admiration from all who had been there.xxiii By the midcentury Henry Colman pointed out this same idea drawing attention to the fact that it was “absolutely imposible to communicate to one who has not seen it any just idea of it.”xxiv This immense wealth has to be understood in relation to the opportunities offered by the English industry. The latter was able to satify the demand on the domestic market whilst ensuring large surpluses to export by “a rising standard of living, a growing population and an expanding demand from the colonies provided a market for a wide variety of consumer goods.”xxv
International Journal of Social Science Studies Vol. 2, No. 3; 2014
27
Spanish exiles were able to witness such a prosperous and healthy economy, which really struck them. This was not only because they could experience new liberties related to politics, religion or economy, but also because of an atmosphere of liberty in all spheres of public and social life. There was freedom of religion without fear of retaliation, freedom of the press, and freedom to take an acting part in the representative government. Additionally, it was also possible to trade freely and bank easily, as “during the 19th century London became the world´s greatest money market, the supreme international centre of banking, commercial credit, overseas loans, commodity transactions, share-dealing and insurance.”xxvi It was suggested that new constructions, the rehabilitation of different urban areas and an extension of some parts of the city were perfomed to include and accommodate the new social reality, generating further jobs with the addition of a sustained expansion and growth. Despite these positive developments and challenges, there were very important outstanding problems that were inherent to British society such as poverty, misery, alcohol abuse and social conflicts.xxvii Anyone could observe both sides of the spectrum while walking around London: on the one hand, the beautiful well-mantained buildings in the City of Westminster along with its gardens and squares. On the other hand, exclusion, poverty and social destitution which proliferated in Southwark or Bethnal Green. While the life at Court, the activities at Parliament or the habits and attitudes of the high society offered a kind face of London, a very different reality provided a picture of epidemic diseases, corruption and criminality, prostitution or even dirt and agglomeration.xxviii However, this poverty was not directly linked to the Spanish exiles in any case, as they were living among the wealthy groups of individuals in London. 3.1.2 Facilities in the City It is also important to draw attention to another element among the ones that exile experienced: transport infrastructures in England, with a predominance of canals, roads and railways. The former was the most developed by the beginning of 19th century. Canals, together with navigable rivers, made both exports and domestic trade easier, as well as connections between cities.xxix It was probably by the second half of the century that the city and port of London started competing successfully with other English cities whose commercial opportunities arose slowly: Lancashire, Liverpool, West Riding, and so on. However, despite the key importance of these new trading or business cities, London clearly played out an economic superiority as a distribution center for goods such as: tea, wool, rubber, copper, tin, diamonds, platinum, spices, carpets, furs, feathers, ivory, silk, and many other products coming from the East and the colonies. This is the reason why exiles admired so much this system of transportation which contributed to English economic growth. There were, however, economic problems associated with these maritime routes such as high investment of materials and skilled labor. These extra costs, together with the expansion of distribution networks, revealed the need to promote road networks instead of financing new canals.xxx It became clear that an improvement of the transport system and its diversity was necessary to expand markets resulting from industrial change. The real implementation of these initiatives reached its peak of development during the nineteenth century, when the Parliament authorized private companies to start-up some projects for the construction of roads which had a small toll which allowed them to redeem part of the money invested. This profit was spent then on road construction, repairs and maintenance. These efforts led to the upgrading of roads linking the capital with other territories, at the same time that new construction techniques led to more fluency, speed and accessibility for roads. Even though canals remained for a while the most dominant mode of transportation, roads would be essential in making London the most important city of the British Empire. Streets throughout the city were narrow and curved with pavements in poor condition, which made it difficult to pass through them.xxxi Major initiatives were undertaken between 1810 and 1820 to improve some important roads and streets. The Soho area was outfitted for the upper class in London society, the nobility and the gentry.xxxii The embellishment of this part of the city encouraged the exiles to settle in the area setting up there their residence, meeting points or even amenities and leisure zones. They witnessed its public utility implying both social and cultural benefits. In words of Blanco White it was amazing how easy it was to move from one place to another within England: “cien coches de diligencia salen aproximadamente de Londres en el espacio de sol a sol. Y están construidos de tal manera que además de cuatro o seis pasajeros puedan dar asiento a nueve personas fuera.”xxxiii Like Blanco White, Ramón Alesón also mentioned to his family the possibilities this transportation offered: “este modo de viajar es general en Inglaterra y viajan así mujeres, hombres, ricos y no ricos y aun los marineros van en las diligencias, que las hay en todas las ciudades del reino y en muchísimos pueblos y llevan cada una 18 o 20 personas.”xxxiv However, even though roads were an important symbol of prosperity, “steam railways were the arteries of Victorian England’s economic power. Without them the infinitely intricate tissues of nineteenth century urban society and the commerce and industry which they generated would have assumed a very different pattern.”xxxv The railway lines were
International Journal of Social Science Studies Vol. 2, No. 3; 2014
28
the best mode of transportation to cover long distances, and they involved a growing demand for coal, iron, wood, bricks and labor. For this reason its development was essential to the safe transportation of people and goods, but also to create jobs in a society undergoing major demographic and industrial expansion. The train became “el elemento indispensable para los transportes interiores y exteriores; principalísimos factores de la actividad intelectual, industrial y mercantil del mundo entero.”xxxvi However, it was a reality not yet developed in Spain. In fact, by the mid-1820s, there were no railroads planned in Spain. A few years passed before any project could be started and finally accomplished in the 1850s. 3.2 New Spaces of Sociability: a Point of Reference for Spanish Exiles In this particular context characters such as Mendíbil, Felipe Bauzá, Ramón Alesón, Torrijos, or Espoz y Mina lived in London; but also many others who were well-known politicians at the time such as Argüelles, Toreno, Alcalá Galiano, Flórez Estrada or Javier Istúriz, among others. They were all men who played an important political and cultural role during the first decades of the nineteenth century in Spain; men who promoted the spread of liberal and democratic ideas from Europe throughout the country. Accompanying them were also peasants, artisans, small shopkeepers or other liberal professions, which illustrates the wide spectrum of social backgrounds of the exiles. Without any doubt they assembled a remarkable variety of occupations and self-representations: “In 1823 London was peopled with exiles of every kind and every country; constitutionalists who would have wanted just one chamber, constitutionalists who wanted two; constitutionalists that admired the French model, the Spanish, or the American; generals, dismissed presidents of republics, presidents of parliaments dissolved at the point of the bayonet, presidents of cortes dispersed by the bomb-shell; [...] journalists, poets and men of letters.xxxvii Spanish men had to learn how to adapt themselves to live in a different country, in the city of gold and richness. They went through different individual experiences that defined their lives in England, in which it is possible to detect “the relevance of the exile´s contacts with foreign intellectuals and foreign political and economic models.”xxxviii The richness of their experiences and learning in London had a great impact on their exile, as well as in their subsequent evolution in politics and socio-cultural thinking. The lively political discussions they held and the cafés, social lounges or new meeting points they frequented played an important role in their further careers and the political future of Spain. Along with high levels of population growth there were changes in the entertainment customs within English society. It continued to be common for upper classes walking around the gardens and attending coffee houses to meet other members of high English society. But new activities and amenities also became common among them, especially circus events, theaters, concert halls or other music performances, which generated a dynamic cultural atmosphere.xxxix Closely related to these questions and events, exiles had the opportunity to attend special programs, exhibits and performances of great importance for the power and prosperity of England during the century. In this sense, it was the way they could be contacted by other exiles while learning how the social life worked in London. Habits and life style linked to aristocratic well-educated society let Spanish exiles cultivate their moral values and good manners, as they were seen as moderate pleasures of who enjoyed a status of privilege.xl Most of Spanish exile were displaced because of their political positions when Ferdinand VII re-established the absolutism. They were part of a group whose privileges had been substantially modified. Saurin de la Iglesia wrote that they were “forced to live as if tomorrow was not for them to see”, kept aware of “their belonging to an intellectual elite with social responsibilities.”xli All of these men, more or less politically engaged, took part in clubs or cafe meetings, as did the group attending the sessions in Lord Holland House. While in there, they spent their time in talks, being informed about Spain on a daily basis, and sharing political thoughts or ideas.xlii Many influential characters came together at these houses: Meléndez Valdés, Martínez de la Rosa, Juan Álvarez Mendizábal, Flórez Estrada, Agustín Argüelles, Ramón Alesón, Antonio Alcalá Galiano or Canga Argüelles, as well as other renowned figures like Blanco White, Valentín Llanos, José Muñoz Sotomayor, Álvaro Agustín de Liaño, José Manuel Vadillo, Joaquín Lorenzo & Jaime Villanueva, José Espronceda, Llorente, Moratín, Clemente Zulueta, Pablo Mendíbil, Pablo Montesinos, José Joaquín and Juan José de Mora or Mateo Seoane, among others.xliii Tertulias, as frequent places to meet, were reading and learning places for those in exile, places to exchange ideas, opinions or concerns. Throughout the entire nineteenth century they were the most renowned intellectual and literacy centers for the upper class to meet as a symbol of success and prestige. There is no doubt Spanish exiles could attended them at the same time they learned more about the English political system; a moderate parliamentarism which was highly respectful of the English crown and social traditions. It implied a kind of government they could easily admire, as it proved to them being extremely useful and flexible to be adapted in the Spanish system in order to overcome the general crisis experienced for years in the country. A country which had been unable to perform the step-by-step advance required to achieve a more liberal political changexliv.
International Journal of Social Science Studies Vol. 2, No. 3; 2014
29
4. Political and Ideological Changes after the Exile Taking the events of 1823 and the progresses accomplished in English society as a starting point, together with the series of the experiences exiles lived through there, it is time to reflect on the reasons why this situation caused such an impact on these men and the way it was an exceptional vital and political learning opportunity for them.xlv It is not always possible to acknowledge their political impressions or thoughts while in exile. Spanish government frequently confiscated the mail to prevent conspiracies and ensure the fidelity to the crown and the new regime. One of these men confirmed the precautions that needed to be taken in a letter sent to his wife from London. In this letter he wrote to her: “Your letter arrives opened in London, it brings the stamp of Najera (where you probably put it on the mail), and also brings the approval from Bilbao signed in the verso. This make me believe that it had been sent there to some government commissioner in order to recognize it.”xlvi Despite all these difficulties and setbacks, a slow but steady ideological advance can be seen in these subjects when they were back in Spain and appeared to be, more or less, recognized as public figures. In England they could observe, study and assimilate customs and readings that made them aware of the need for essential political changes in Spain. English political and cultural programmes had begun to have some impact in the Spanish context since the final decades of the 18th century, as it presented a political program which exiles could later experience first-hand during their time in London. A time when they did not let emigration take up all their energy, but rather managed to establish the largest possible number of personal and financial relations or learn the most about the English political system. It was a phase of permanent instabilty and constant upsets in Europe. There were indeed major ruptures and changes throughout the continent during this period; ruptures and changes which made the people be consciuous of living through a time of transition in Europe between two great eras, in which the torrent of civilization needed to destroy all the institutions which belonged to the past. They were also part of a period of deep political changes along which civil liberties had been fundamentally redefined.xlvii A huge amount of experiences had been influencing their lives. On the one hand, the new ideas that sprang up and spread in Spain as a consequence of the crisis of the Ancien Régime over decades. On the other, the events lived in their public existence that were happening simultaneously to the historical evolution of national political life. All of this helped to shape their attitudes and cultural baggage that partially determined their actions and thinking. These circumstances took place in a space and a time in which many public men were exposed to a gradual process of personal and political adaptation that finally would place them into the ranks of the moderate movement; generally the moderatism project. This analysis allow us to leave aside reductionisms which swing from one extreme to another. One extreme that would understood that only radical breaks with the Ancien Regime could be the correct basis for the establishment of a liberal regime giving the power to the people. And the other extreme, in which the supporters of absolutism defended the perpetuation in power of those who refused to give up their political and economic influence. It is necessary the combination of both, because individuals continually readapted themselves to the changing circumstances imposed by the historical moment and their personal experiences. 4.1 Transition to Political Renewal during the Exile An overview of their exile is the only way to understand how they were able to re-imagine their socio-political and cultural thoughts throughout difficult moments. The exile provided them an acknowledgement of new values and the political adaptation involved, which took place as a consequence of the contact of exiles with new realities and foreign influences. Many Spanish had to emigrate to England because of their liberal positions and thoughts; and they would later have a main role when back in their mother land. As they took part in the politics of the first liberalism, to which they belonged and therefore formed part of, they contributed to the final support for the social and political local networks in the country. From moderate points of view it was possible to change the mentality of the Spanish people by those who showed themselves to be closer to them and in whom they could see their own interests reflected. This situation of exile made them to react with fear and rejection towards any radical political demands because they understood perhaps conservative policies were more particularly appropriate for Spain.xlviii Alcalá Galiano is one of the most interesting example of those who alternated from “liberal” ideas to ultraconservative ones during the first decades of 19th century.xlix It is also the case of Manuel García Herreros; one of the most radical individuals during the Cortes of Cádiz (Regional Assembly of Cádiz) who had to revise his political projects and concepts to adapt himself to the new regime and survive.l Alesón, Mendíbil, Istúriz, Canga Argüelles or Villanueva brothers were, along with the former, some of the ones finally defending monarchical conservatism. From the enlightened ideas of the Ancien Regime they took the leap to the liberal system on the path of moderate reforms. After the second re-establishment of absolutism in 1823 they felt let down and disappointed by the King, being more conscious then that Spain needed to adapt her political system to the frame shaped by liberal movements at the time. A
International Journal of Social Science Studies Vol. 2, No. 3; 2014
30
parliamentary system of government based on constitutional principles, similar to the British example they observed, was urgently needed. María Sierra pointed out that this necessity led Spanish politicians to look for political models in Europe, being the exile the perfect scenario for that purpose.li They wanted to reconfigure the government as long as they could keep their privileges, and their moderation was an attempt to overcome the revolutionary period of 1812 in order to achieve it. While in London they verified the success of a monarchical system where sovereignty was shared between Parliament and the King, and a limited suffrage was practiced. Therefore, their experience in England provided Spanish exiles the knowledge of European and British liberal ideas. It was a long hard experience to go through for all of them. And they needed to hold back their spirit and revolutionary actions to avoid suffering further punishments. Various factors can explain why they finally moved from ideas of freedom towards moderation. Standing out among them there were a permanent fear of repression, many difficulties experienced during their stay in England and a desire of conservating the privileges and possessions they had. Here, it is necessary to add they were encouraged by the strong belief in British Parliament operations. A clear positioning among the ranks of moderate liberalism could be perceived after those life experiences, an option toward which they had been moving since the Trienio and after their return from England. It is important, though, to point out the fact that Moderate Party –so named- was founded in 1836, as a reaction to the government presided by Mendizábal once Ferdinand VII was not king any more.lii During the 1820s, some sources still defined liberal as a “jealous supporter of the Constitution, King, Religion and the prosperity of the Motherland.”liii We should keep in mind that during the 1820s, 1830s and 1840s, there was an “enormous difficulty of establishing clear boundaries” between the different political branches in Spain and its projects or programmes.liv After the 1830s the two big parties of the first Spanish liberalism, progresistas and moderados, consolidated themselves as such. But it was not until 1845 that a certain stability in the new parliamentary system began to be appreciated, once the moderados were elected to form a new government and the so-called “Moderate Decade” started.lv Because all of this, the consolidation of liberalism in Spain, unlike in France or other European countries, did not start as much as a revolutionary process as after a long process over an extended period of time, scattered with hurdles to overcome.lvi By the end of the 1820s, the men defending constitutional governments presented a specific ideological and political evolution which present themselves as a group of early liberals who found themselves in a context of adaptation and transition in the process of shaping political parties –which were not clearly differentiated until the second half of nineteenth century. This is why it is better to refer to moderate tendencies rather than talk about members of the Moderate Party, strictly speaking. Their professional, economic and political interests always went hand by hand with the defense of the well-being of the Nation, its progress and prosperity, and a recognized loyalty to the new representative system built around the monarchy. This is why they always defended a government based on social order and the observance of the law. An institution should respond to the acclamations of the people to their right to be “well-governed”.lvii The common good needed to prevail over any partisan interest, and the people interests had to be guaranteed regardless of political ambitions. Bernardino Núñez de Arenas, contemporary of those suffering exile in London, expressed his opinion saying that political parties existed as a necessity in a constitutional system, and it should be their main goal to promote freedom of speech and thought to find a proper balance in which to experience the people rights.lviii During these years in which the new liberal regime was trying to succeed, it was understood the parties had the duty of achieving the balance between their programs and the work of legislators and government, in order to adapt the system to the specific circumstances of Spain. They payed attention to the need to fight for the proper rule of the country at the same time that the interests of the people and their welfare were guaranteed. On that purpose it was necessary to deal with the historical evolution and the constant changes happening in politics, economics and society rate in the first half of the nineteenth century. Reforms were essential for the prosperity of the nation; they had to be moderate and well-defined changes in order to achieve social and political harmony and national stability. Their expectations of peace and tranquillity for the country meant to them preventing armed or political conflicts in the years to come. They had finally understood this was the only way for liberal governments and concepts to succeed. The months lived in London made them define their political position from that moment on. Only a moderate political affiliation seemed to help achieve the equilibrium they claimed between their economic privileges and their political concerns, positions or relationships. 4.2 Consequences of that Ideological and Political Adjustment As previously discussed, the experience of exile changed the life of all those who suffered it. Their stay in England showed them a unique sight; a new world of social rights, political liberties and economic opportunities. But that ought not mean that somehow we also must talk about negative feelings of loneliness, confusion and disillusionment, which were likely at the foundation of their ideological redefinition. Istúriz wrote to Ramón Alesón in 1840 about the trace of

International Journal of Social Science Studies Vol. 2, No. 3; 2014
31
time, the longing for the political dreams of the past and the liberal excitement during the first decade of that century: “hopes are gone and it is late for them to come back. The era of Greed Street is at an end”. Alcalá Galiano also said of his youthful years: “Those happy hours! We surely can called them so, as we remember now later disillusionments, hopes dissipated or even our own errors!.”lix It should not be seen as a contradictory or pejorative attitude that they adapted their thoughts to moderatism. It is rather the ultimate reality of men who had struggled to survive and had witnessed the decadence of the absolutist political system. Ramón Alesón, for whom one of his biggest achievements was the advance he managed to make from the local to national power in government, understood the necessity of a change: “After a few years examining Spanish people, I came to the conclusion that the Monarchy should be a national institution, and the King a representative of the willingness of all Spaniards.”lx Throughout this entire transitional process, the most outstanding value of Spanish Liberalism was its effort to establish a constitutional government, firstly attempted in 1812 and 1820.lxi Exile was the gateway to moderatism as the more pragmatic solution to preserve economic privileges, cultural principles and political convictions. I already pointed out that the 1812 Constitution was an international model of liberties during the first two decades of nineteenth century. However, it had shown itself, by the 1830s, ineffective as a tool for new governments. Many of the Spanish exiles confessed their tendency to another more monarchical and moderate constitution, as “with a new one we can advance a little, with the other, nothing.” Traditional local oligarchies, still struggling to maintain their economic and social powers, and a young political generation, more connected to meritocracy and liberal values, found themselves sharing the new political scenario. Looking at this reality, alongside the ideological manifestations from both sides, we can understand the climate of understanding and negotiations, as well as moderate principles of adaptation, which took place by the mid-decades of the century.lxii Once back in Spain, they changed their minds and attitudes. But it was not a quick process of adaptation to the new liberal ideas. Thereafter, the conservative shift in their political approaches to the government did not mean they rejected reforms, but these reforms neded to be perfomed throughout a peaceful and ordered process. Only order and moderation could ensure the victory of a liberal and representative government in a Spain claiming for institutional, economic, social and political reorganization since the beginning of the nineteenth century. And in that context, leaders in national and local politics played a key role in establishing new cultural, intellectual and further political trends.lxiii To name a concrete example, the same conservative ideas developed by Alcalá Galiano, Martínez de la Rosa or Alesón, aforementioned, can be seen in other public –although not politicians- individuals such as Pascual Gayangos or Mora.lxiv In the case of Alesón, as in many others, it is not a coincidence that he won a position as a Deputy of the Spanish Parliament from 1836 to 1840 as a moderate representative of Logroño. 1836 was the year when moderatism triumphed in most of the Spanish provinces, and it was then that Alesón, exiled in London from 1823 until 1826, reached that position. At no time did he fail to watch out for the monarchic and religious cause. He desired for “el gobierno mas libre que sea posible”, a representative monarchical government which could look for freedom and civil liberties and rights for Spanish people and nation.lxv Such was the political tendencies followed by many of the members around Lord Holland while in England: Alcalá Galiano, Istúriz, Ramón Gil de la Cuadra, Argüelles, Valdés, Bauzá, and so on. A different political project than the more “progrestista” one promoted by individuals such as Espoz y Mina or Torrijos, and which could be a topic for a different article. 5. Conclusions As it has been described in the preceding pages, hundreds of Spanish intellectuals and politicians were forced into exile during the 1810s and 1820s after the drastic repression which followed the return of Ferdinand VII to the throne of Spain. Britain was then a country whose asylum policy remained fairly liberal, so it became the destination for many of these Spanish liberals. Once in London, they were confronted with a very different economic situation and radically new politics and culture than the ones they had known in Spain. Although most of them tended to stay in England within Spanish groups and were mostly isolated, a few individuals became involved in British culture, politics and social life. In both cases they witnessed the reality of a new world while suffering the consequences of being away from their homeland. These men came into contact and formed closer links in London, which then had a significant impact on the course of their careers. In those critical years, clubs, tertulias and cafés provided a perfect platform to analyze and absorbe the British social networks and politics of the moment. These links among exiles were very important for them to learn about the efficient functioning of the British Parliament. It was a representative power shared by the King and Parliament, a system who had been established by moderate measures since the final decades of the seventeenth century.
International Journal of Social Science Studies Vol. 2, No. 3; 2014
32
They had the opportunity of reconsidering their characters and political thoughts, and made them evolve from just “liberal” plans for Spanish Government toward moderate liberal ones which let the country overcome the crisis it was living through, at the time it could start the path for the triumph of Liberalism. In any case did they fail either to watch out for the monarchic and religious cause, with their ultimate aspiration being the welfare and progress of Spain. They were men who moved, both at a political and professional levels, easily within the networks of sociability of the local and national contexts. Through these links, it was possible to establish the definitive changes at the basic political level that would help to make the Liberal Regime triumph in the country in the midcentury. They lived their lives between two centuries and, more particularly, between two great moments in the political history of Spain: the Ancien Régime and Liberalism. The exile meant to them the opportunity of finding the balance necessary between the possibility of advancement that was open to them thanks to their socio-economic origins and the new opportunities which the liberal culture offered.lxvi Taking into consideration their constant search for prosperity and liberties for Spanish people and government, most of them saw it necessary to tend towards conservative measures, instead of revolutionary ones, to achieve their goals. It was an ideological readjustment and professional retraining as a consequence of their years in England and the knowledge acquired through influences absorbed there. Some would opt for a progresista path after the 1830s, but most understood during the 1820s that the critical situation of Spain demanded a political atmosphere of tranquillity which let them start long term successful liberal reforms. Their first ideas of a free popular education, the welfare of the nation and a good government came from the eighteenth century. First liberals assimilated and learned them to later start the way claiming for liberal and representative institutions in the beginning of nineteenth century. They were the nexus beteween the old regime and the new. And moderatism was their political response to the evolution and expectations of the country, along with their own social and economic interests. Acknowledgements This essay has been achieved thanks to the academic and financial support of the National Research Project “Retórica e Historia. Los discursos parlamentarios de Salustiano de Olózaga (1847-1871)”, Ref. FFI2011-23519/FILO from the Ministry of Economics and Competitiveness, Spain. P.I. José Antonio Caballero López. References Adán Poza, M.J. (1998). El exilio de los liberales españoles. Historia 16, 270, 80-89. Amunátegui, M.L. (1888). Don José Joaquín de Mora. Apuntes biográficos. Santiago de Chile: Imprenta Nacional. Argüelles, A. (1834). Apéndice a la sentencia pronunciada en 11 de mayo de 1823 por la Audiencia de Sevilla contra
sesenta y tres diputados de las Cortes de 1822 y 1823. Londres: C. Word e hijo. Aub, M. (2008). Escritos sobre el exilio. Sevilla: Editorial Renacimiento Biblioteca del Exilio. Bautista Vilar, J. (2006). La España del exilio. Las emigraciones políticas españolas en los siglos XIX y XX. Madrid:
Síntesis. Biagini, E.F. (2006). Liberty, Class and Nation-Building. Ugo Foscolo’s ‘English’ Constitutional Thought, 1816-1827.
European Journal of Political Theory 1, V. 5, 34-49. http://dx.doi.org/10.1177/1474885106059063 Blanco, A., & Thompson, G.. (2008). Visiones del liberalismo. Política, identidad y cultura en la España del siglo XIX.
Valencia: Publicacions de la Universitat de València. Bowle, J. (1969). England. A portrait. London: Ernest Benn Limited. Briggs, A. (1967). The age of improvement, 1783-1867. London: Longmans. Burdiel, I., & Romeo, M.C. (1996). Los sujetos del proceso revolucionario español del s. XIX. Historia Contemporánea
13-14, 149-156. Canal, J. (2007). Exilios. Exodos políticos en la Historia de España. Siglos XV-XX. Madrid: Sílex. Castells, I. (2001). La resistencia liberal contra el absolutismo fernandino (1814-1833). Ayer 4, 43-62. Cela, C.J. (2009). Correspondencia con el exilio. Barcelona: Destino. Colman, H. (1849). European life and manners. vol. I. London: John Petherham. Comellas J.L. (2006). Del absolutismo a la monarquía constitucional. In Nación y constitución: de la Ilustración al
Liberalismo. Sevilla: C. Cantarela, Consejería de Innovación, Ciencia y Empresa, Universidad Pablo de Olavide y Sociedad Española de Estudios del Siglo XVIII.
International Journal of Social Science Studies Vol. 2, No. 3; 2014
33
Cooke, P. (2008). Siete Cartas desde Londres: aspectos de autonomía y moralidad en Ocios de españoles emigrados. In Blanco, A. y Thompson, G. (eds.). Visiones del liberalismo. Política, identidad y cultura en la España del siglo XIX. Valencia: Publicacions de la Universitat de València.
Corner, J. (1843). The history of England. From the earliest period to the present time. London: Dean and Munday. Deacon, D., Russell, P., & Woollacott, A. (2010). Transnational Lives. Biographies of Global Modernity, 1700-Present.
New York: Palgrave MacMillan. Delgado, J.M. y Ollero, J.L. (eds.) (2009). El liberalismo europeo en la época de Sagasta. Madrid: Biblioteca
Nueva-Fundación Práxedes Mateo-Sagasta. - (dir.) (2013). Un Viaje Sobre Raíles. La Rioja (1863-2013). Logroño: Instituto de Estudios Riojanos. Fernández Sarasola, I. (2009). Los partidos políticos en el pensamiento español de la Ilustración a nuestros días.
Madrid: Marcial Pons Historia. Fernández Sebastián, J., & Francisco Fuentes, J. (2002). Diccionario político y social del siglo XIX. Madrid: Alianza. Fontana J. (2006). De en medio del tiempo: la Segunda Restauración española, 1823-1834. Barcelona: Crítica. Franck Bright, J. M. A. (1878). A History of England. v. III. London: Rivingtons, among others. Freitag, S. (ed.). (2003). Exiles from European Revolutions. Refugees in Mid-Victorian England. New York, Oxford:
Bregan. Garside, P.L. (1990). London and the home counties. In.Thompson, E.M.L. The Cambridge Social History of Britain
1750-1950. Cambridge: Cambridge University Press. Hamnett, B. (2003). Joaquín Lorenzo Villanueva (1757-1837): de católico ilustrado a católico liberal. El dilema de la
transición. In Blanco y Thompson, Visiones del liberalismo. Política, identidad y cultura en la España del siglo XIX. Valencia: Publicacions de la Universitat de València.
Harris Willson, D. (1976). A History of England. USA: Holt, Rinehart and Winston, 619-639. Hilton. (2006). A mad, bad, dangerous people? England 1783-1846. Oxford: Oxford University Press. Hone, J.A. (1982). For the cause of truth. Radicalism in London 1796-1821. Oxford: Clarendon Press. Inwood, S. (2000). A history of London. London: Papermac. Jolluck´s, K.R. (2002). Exile and identity. California: University of Pittsburg Press. Kamen, H. (2007). Los desheredados. España y la huella del exilio. Madrid: Santillana. - The disinherited: the exiles who created Spanish culture. London: Allen Lane. La Parra, E. (2011). El legado político del Antiguo Régimen. Alicante: Biblioteca Virtual Miguel de Cervantes. - (2007). Los Cien Mil Hijos de San Luis. El Ocaso del primer impulso liberal en España. Madrid: Síntesis. La Parra E., & Ramírez, G. (2003). El primer liberalismo. España y Europa, una perspectiva comparada. Valencia:
Generalitat Valenciana-Biblioteca Valenciana. Langford, P. (1989). A polite and commercial people. England 1727-1783. Oxford: Clarendon Press. Livingston, R., & Ausubel, H. (1952). The Making of English History. USA: Holt, Rinehart and Winston. Llorens, V. (1979). Liberales y románticos. Una emigración española en Inglaterra (1823-1834). Madrid: Castalia. López, D. (2005). José María Blanco White o la conciencia errante. Sevilla: Fundación José Manuel Lara. Luis, J.P. (2001). La década ominosa (1823-1833). Una etapa desconocida en la construcción de la España
Contemporánea. Ayer 41, 85-111. Mackay, C. (1838). A history of London. From its fundation by the romans to the accession of Queen Victoria. London:
John W. Parker, West Strand. Marshall, D. (1962). Eighteenth Century England. London: Longmans. Martínez de Pisón, J.M. (2009). José Mª Blanco White: la palabra desde un destiero lúcido. Logroño: Perla Ediciones. Moreno Alonso, M. (1998). Blanco White. La obsesión de España. Sevilla: Alfar. Nicol, J.L. (2011). One mind, two languages. Bilingual language processing. Oxford: Blackwell Publishers. Nuñez de Arenas, B. (1840). De nuestra situación. Moderados, exaltados, tercer partido. Madrid: Imprenta de Mellado. Portier, A.M. (2000). Migrant Belongings. Memory, Space, Identity. Oxford: Berg.
International Journal of Social Science Studies Vol. 2, No. 3; 2014
34
Preservativo contra El Bú de El Piloto, o sea defensa de los liberales. (1839). Zaragoza: Impr. del Coso, nº 116, D. M. Peiro.
Ramos Domingo, J. (2008). Crónica e información en el sermonario español del siglo XIX. Salamanca: Universidad Pontificia de Salamanca.
Reinares, E. (2006). García Herreros "El Numantino": emigrantes, judíos, clérigos y otras vidas riojanas insólitas en la revolución liberal. Logroño: Colegio Oficial de Aparejadores y Arquitectos Técnicos de La Rioja.
Rivadulla, D., Raúl Navarro, J., & Berruezo, Mª.T. (1992). El exilio español en América en el siglo XIX, Madrid: Mapfre.
Romeo, M.C. (2005). De patricios y nación. Los valores de la política liberal en la España de mediados del siglo XIX. Melanges de la Casa Velázquez 35.
Rubin Suleiman, S. (1998). Exile and creativity. Signposts, travelers, otusiders, backward glandes. London: Duke University Press.
Ruiz, M. (1821). Aplicación de las voces de serviles y liberales con alguna cosilla sobre la causa del diez de marzo en Cádiz. Jerez de la Frontera.
Sánchez García, R. (2003). Textos y discursos políticos (Antonio Alcalá Galiano), Madrid: Biblioteca Nueva. Sánchez Mantero, R. (1982). Gibraltar, refugio de liberales exiliados. Revista de Historia Contemporánea 1, 81-107. - (2002). Exilio liberal e intrigas políticas. Ayer 47, 17-33. - (2005). Liberales fuera de España. El exilio político en la crisis del Antiguo Régimen. In Casas Sánchez, J.L. and
Durán Alcalá, F. (coords.). III Congreso sobre republicanismo. Los exilios en España. Córdoba: Patronato Niceto Alcalá Zamora y Torres.
Santirso, M. (2008) Progreso y libertad: España en la Europa liberal (1830-1870). Barcelona: Ariel. Saurin de la Iglesia, M.R. (1997). Variaciones sobre un tema goethiano: Ocios de españoles emigrados (1824-1827).
Spagna Contemporanea 11, 31-50. Sierra, M. (2009). El espejo inglés de la modernidad española: el modelo electoral británico y su influencia en el
concepto de representación política. Historia y Política 21, 139-167. Suárez Cortina, M. (2003). Las máscaras de la libertad. El liberalismo español 1808-1950. Madrid: Marcial
Pons-Fundación Práxedes Mateo-Sagasta. Stroinskat, M., & Cecchetto, L. (2003). Exile, language and identity, Frankfurt: Peter Lang. Thompson, D. (1964). England in the ninetheenth century (1815-1914). London: Ebenezer Baylis and son. Varela Suanzes-Carpegna, J. (1983-84). La constitución española de 1837: una constitución transacional. Revista de
derecho político 20, 95-106. Viguera Ruiz, R. (2012). El exilio de Ramón Alesón Alonso de Tejada. Experiencia de un liberal en Londres
(1823-1826). New York: Edwin Mellen Press. - (2010). El liberalismo en primera persona. Ramón Alesón y la representatividad política en los orígenes de la
España contemporánea, 1781-1846. Logroño: Universidad de La Rioja-IER. - & Reinares, E. (2012). Manuel García Herreros: un liberal camerano en las Cortes de Cádiz. Logroño:
Asociación Amigos de San Román de Cameros. Vivero, P. (2001). La transición al liberalismo: de las formas administrativas a las reformas políticas (1823-1833). Ayer
44, 175-196. Notes i Translation from Comellas J.L. (2006). Del absolutismo a la monarquía constitucional. In Nación y constitución: de la Ilustración al Liberalismo. Sevilla: C. Cantarela, Consejería de Innovación, Ciencia y Empresa, Universidad Pablo de Olavide y Sociedad Española de Estudios del Siglo XVIII, 108. All translations in this document correspond as closely as posible with the style and conventions, including spelling, capitalization, punctuation, and the use of italics and other devices, of the texts as originally printed. ii Deacon, D., Russell, P. and Woollacott, A. (2010) reported these considerations in Transnational Lives. Biographies of Global Modernity, 1700-Present. New York: Palgrave MacMillan, 5. iii Preservativo contra El Bú de El Piloto, o sea defensa de los liberales. (1839). Zaragoza: Impr. del Coso, nº 116, D. M. Peiro, 8.
International Journal of Social Science Studies Vol. 2, No. 3; 2014
35
iv Fontana J. (2006). De en medio del tiempo: la Segunda Restauración española, 1823-1834. Barcelona: Crítica, 33. It is also interesting the approach of the text: La Parra, E. (2007). Los Cien Mil Hijos de San Luis. El Ocaso del primer impulso liberal en España. Madrid: Síntesis. v The following authors examine and explore more in detail this topic: Kamen, H. (2007). Los desheredados. España y la huella del exilio. Madrid: Santillana; Bautista Vilar, J. (2006). La España del exilio. Las emigraciones políticas españolas en los siglos XIX y X. Madrid: Síntesis; Llorens, V. (1979). Liberales y románticos. Una emigración española en Inglaterra (1823-1834). Madrid: Castalia; Moreno Alonso, M. (1998). Blanco White. La obsesión de España. Sevilla: Alfar; Rivadulla, D., Raúl Navarro, J. and Berruezo, Mª.T. (1992). El exilio español en América en el siglo XIX, Madrid: Mapfre; or the classic ones from Sánchez Mantero, R. (1982). Gibraltar, refugio de liberales exiliados. Revista de Historia Contemporánea 1, 81-107, (2005). Liberales fuera de España. El exilio político en la crisis del Antiguo Régimen. In Casas Sánchez, J.L. and Durán Alcalá, F. (coords.). III Congreso sobre republicanismo. Los exilios en España. Córdoba: Patronato Niceto Alcalá Zamora y Torres, and (2002). Exilio liberal e intrigas políticas. Ayer 47, 17-33, among others. vi Adán Poza, M.J. (1998). El exilio de los liberales españoles. Historia 16 270, 80-89, 80. vii Identities based on exile experiences are studied, for instante, in Canal, J. (2007). Exilios. Exodos políticos en la Historia de España. Siglos XV-XX. Madrid: Sílex; Viguera Ruiz, R. (2012). El exilio de Ramón Alesón Alonso de Tejada. Experiencia de un liberal en Londres (1823-1826). New York: Edwin Mellen Press; López, D. (2005). José María Blanco White o la conciencia errante. Sevilla: Fundación José Manuel Lara; Martínez de Pisón, J.M. (2009). José Mª Blanco White: la palabra desde un destiero lúcido. Logroño: Perla Ediciones; Aub, M. (2008). Escritos sobre el exilio. Sevilla: Editorial Renacimiento Biblioteca del Exilio; Cela, C.J. (2009). Correspondencia con el exilio. Barcelona: Destino; or the mentioned Liberales y románticos..., among others. viii Castells, I. (2001). La resistencia liberal contra el absolutismo fernandino (1814-1833). Ayer 4, 43-62. ix References in La Parra, E. (2011). El legado político del Antiguo Régimen. Alicante: Biblioteca Virtual Miguel de Cervantes. x The book from Fernández Sebastián, J. and Francisco Fuentes, J. (2002). Diccionario político y social del siglo XIX. Madrid: Alianza, is an essential reference. xi More information in Viguera Ruiz, R. (2010). El liberalismo en primera persona. Ramón Alesón y la representatividad política en los orígenes de la España contemporánea, 1781-1846. Logroño: Universidad de La Rioja-IER. xii An interesting compendium of contemporary reflections can be read in Ramos Domingo, J. (2008). Crónica e información en el sermonario español del siglo XIX. Salamanca: Universidad Pontificia de Salamanca. xiii Varela Suanzes-Carpegna, J. (1983-84). La constitución española de 1837: una constitución transacional. Revista de derecho político 20: 95-106. Santirso, M. also insisted on this idea in (2008) Progreso y libertad: España en la Europa liberal (1830-1870). Barcelona: Ariel. xiv Stroinskat, M. and Cecchetto, L. (2003). Exile, language and identity, Frankfurt: Peter Lang, 13. It is also interesting to consider the following texts: Burke, C. (2011). Exile from the inner self or from socitey? A dilemma in the Works of Max Fish; Stroinskat, M. The role of language in re-constrution of identity in exile; Nicol, J.L. (2011). One mind, two languages. Bilingual language processing. Oxford: Blackwell Publishers; or Jolluck´s, K.R. (2002). Exile and identity. California: University of Pittsburg Press. The situation of exile “implies the idea of forced displacement (as opposed to voluntary expatriation) that occurs for political or religious reasons rather than economic ones.” In Rubin Suleiman, S. (1998). Exile and creativity. Signposts, travelers, otusiders, backward glandes. London: Duke University Press, 1-2. xv Inwood, S. (2000). A history of London. London: Papermac, 419. For more information about English history of Britain: Besant, W. (1909). London in the nineteenth century. London: Adam & Charles Black, Sheppard, F. London 1808-1870..., or Franck Bright, J. M. A. (1878). A History of England. v. III. London: Rivingtons, among others. xvi England as a destination for exiled is studied in Freitag, S.(ed.). (2003). Exiles from European Revolutions. Refugees in Mid-Victorian England. New York, Oxford: Bregan. Other studies on England by the middle of nineteenth century are: Harris Willson, D. (1976). A History of England. USA: Holt, Rinehart and Winston, 619-639; Marshall, D. (1962). Eighteenth Century England. London: Longmans; Bowle, J. (1969). England. A portrait. London: Ernest Benn Limited; Mackay, C. (1838). A history of London. From its fundation by the romans to the accession of Queen Victoria. London: John W. Parker, West Strand; Corner, J. (1843). The history of England. From the earliest period to the present time. London: Dean and Munday, 121 ff.; Livingston, R. and Ausubel, H. (1952). The Making of English History. USA: Holt, Rinehart and Winston, 478-493; Briggs, A. (1967). The age of improvement, 1783-1867. London: Longmans; Thompson, D. (1964). England in the ninetheenth century (1815-1914). London: Ebenezer Baylis and son; Garside, P.L. (1990). London and the home counties. In.Thompson, E.M.L. The Cambridge Social History of Britain 1750-1950. Vol. 1. Cambridge: Cambridge University Press; or Hone, J.A. (1982). For the cause of truth. Radicalism in London 1796-1821. Oxford: Clarendon Press, and Langford, P. (1989). A polite and commercial people. England 1727-1783. Oxford: Clarendon Press, 417-423, among others. xvii Archivo Histórico Provincial de La Rioja (La Rioja Provincial Historical Archive, henceforth AHPLR), P-A, correspondence from London, Cipriana, October 17, 1823. xviii Moreno Alonso, M. Blanco White. La obsesión de España…, 44-45. xix Portier, A.M. (2000). Migrant Belongings. Memory, Space, Identity. Oxford: Berg, 1. xx Garside, P.L. (1992). London and the home counties..., 474. Fox, C. compiled the work London-World City 1800-1840. New Haven-London: Yale University Press-Museum of London, in which she draws attention to this idea along Chapter 1. A visitor´s guide to London World City, 1800-1840, 11-20. xxi M. Moreno Alonso, Blanco White. La obsesión de España, 52. xxii Expressions from María Franzero, C. (1977). A life in Exile. Ugo Foscolo in London, 1816-1827. London: W.H. Allen and Co, 12, and AHPLR, P-A, correspondence from London, Manuela, September 8, 1823.
International Journal of Social Science Studies Vol. 2, No. 3; 2014
36
xxiii Cooke analyzes this in Cooke, P. (2008). Siete Cartas desde Londres: aspectos de autonomía y moralidad en Ocios de españoles emigrados. In Blanco, A. y Thompson, G. (eds.). Visiones del liberalismo. Política, identidad y cultura en la España del siglo XIX. Valencia: Publicacions de la Universitat de València, 43-64. xxiv Colman, H. (1849). European life and manners. vol. I. London: John Petherham, 151-155. xxv Hilton. (2006). A mad, bad, dangerous people? England 1783-1846. Oxford: Oxford University Press. xxvi Inwood, S. A history of London..., 475. xxvii Langford, P. A polite and commercial people, 150-162. It was necessary an Act of Parliament to regulate public spaces uses and practices. Although it was a progress, the problems were not completely solved. xxviii Hollen Lees, L. (1988) Poverty and pauperism in nineteenth-century London. Leicester: University of Leicester, 2. Other books on these matters: Engels, F. (1969). The condition of the working class in England, 1845. Ed. E. J. Hobswam; Briggs, A. (1968). Victorian Cities. Harmondsworth: Penguin; Gladstone, D. (dir.). (1996). Poverty and social Welfare. v. I. London: Routledge-Thoemmes Press; Brodie, M. (2004). The politics of the poor. The East of London (1885-1914). Oxford: Clarendon Press; Davey Smith, G., Dorling, D. and Shaw, M. (2001). Poverty, inequality and health in Britatin: 1800-2000. Bristol: Policy Press, or Gatrell, V.A.C. (1990). Crime, authority and the policeman-state. In Thompson, E.M.L. The Cambridge Social History of Britain 1750-1950. Vol. 3, Cambridge: Cambridge University Press, 243. xxix For a more detailed exploration of this issue Willson, D.H. (1967). A History of England. USA: Holt, Rinehart and Winston; or Langford, P. A polite and commercial people, 410-417. xxx More information in Langford, P. A polite and commercial people, 391-410. xxxi Inwood, S. A history of London, 541. For related information, see C. Mackay, A history of London, 387-389. xxxii Adán Poza, M.J. (1998). El exilio de los liberales españoles. Historia 16 270, 80-89, 82. xxxiii Moreno Alonso, M. Blanco White. La obsesión, 53. xxxiv AHPLR, Fondo P-A, correspondence from London, Cipriana, October 21, 1823. xxxv White, J. (2007). London in nineteenth century. London: Jonhatan Cape, 37-46. xxxvi “Caminos de Hierro”, in La Rioja, January 16th, 1909, 2. Some works can be pointed out as a complement: Artola, M. (1978). Los ferrocarriles en España, 1844-1943. Madrid: Banco de España; Pascual Doménech, P. (1978). El ferrocarril de Barcelona a Mataró (1848-1856). Hacienda Pública 55, 313-338, and Ibidem (1984). Ferrocarriles y colapso financiero (1843-1866). Moneda y crédito ClXIX, 31-68, or Gómez Mendoza, A. (1989). Ferrocarril, industria y mercado en la modernización de España. Madrid: Espasa Calpe; and Delgado Idarreta, J.M. (dir.) (2013). Un Viaje Sobre Raíles. La Rioja (1863-2013). Logroño: IER, among many others. xxxvii Pecchio, G. (1978). Osservazioni semi-serie di un esule sull´Inghilterra. In Pecchio, G. Scritti Politici. Roma: P. Bernardelli ed., 404. xxxviii Biagini, E.F. (2006). Liberty, Class and Nation-Building. Ugo Foscolo’s ‘English’ Constitutional Thought, 1816-1827. European Journal of Political Theory 1, V. 5, 34-49, 35. xxxix Thompson, E.M.L. The Cambridge Social History of Britain 1750-1950. vol. 2, 294-320. xl More details in Inwood, S. A history of London, 669-671 and Besant, W. London in the nineteenth, 176-183. xli Saurin de la Iglesia, M.R. (1997). Variaciones sobre un tema goethiano: Ocios de españoles emigrados (1824-1827). Spagna Contemporanea 11, 31-50, 46. xlii News from Spain arrived quickly and easily in England as consequence of speed of communications. Pablo Mendíbil y Alesón pointed out as “desde el puerto de Santa María venían las noticias por el telégrafo en 7 u 8 días; por el correo ordinario en 12 o 13 días. De Madrid vienen en 11 días, y tenemos aquí ya noticias de Barcelona de 31 de octubre, que es decir, de hace 8 días”, Fondo P-A, correspondence from London, Cipriana, November 7, 1823. xliii Hamnett, B. (2003). Joaquín Lorenzo Villanueva (1757-1837): de católico ilustrado a católico liberal. El dilema de la transición. In Blanco y Thompson, Visiones del liberalismo, 19-42. Further discussion can be found in Viguera Ruiz, R. El exilio de Ramón Alesón, just as an example. Some other “Tertulias” during this period were the ones held at “Librería Clásica y Española”, owned by Vicente Sardá in Regent Street, and at “Imprenta Española,” a property of Marcelino Calero in Frederich Place (Goswell road). Together with them cultural, political and social meetings were held near Somers Town, in D. Agustín Argüelles´ house. He was also a member of the Lord Holland´s group, and shared the house with Cayetano Valdés and Ramón Gil de la Cuadra. Istúriz, Alcalá Galiano, the Villanueva Brothers and others who attended those sessions. See Argüelles, A. (1834). Apéndice a la sentencia pronunciada en 11 de mayo de 1823 por la Audiencia de Sevilla contra sesenta y tres diputados de las Cortes de 1822 y 1823. Londres: C. Word e hijo. He, together with Mendizábal, went back to Spain during the 1830s after some years in England and France. xliv Viguera Ruiz, R. El liberalismo en primera persona, conclusion pages. xlv Butrón Prida, G. El exilio liberal y afrancesado en el reinado de Fernando VII: un breve estado de la cuestión. In Casas Sánchez, J.L. y Durán Alcalá, F. III Congreso sobre republicanismo, 75. xlvi AHPLR, Fondo P-A, correspondence from London, Cipriana, September 10, 1824. xlvii As K. Mckenzie has argued in: Opportunists and Impostors in the British Imperial World. The tale of John Dow, Convict, and Edward, Viscount Lascelles. In Deacon, D., Russell, P. and Woollacott, A. Transnational Lives, 71.
International Journal of Social Science Studies Vol. 2, No. 3; 2014
37
xlviii Further discussions on the matter of the profound impact of exile in identities and politics in Kamen, H. (2007). The disinherited: the exiles who created Spanish culture. London: Allen Lane, and Fuentes, J.F., Rojas Friend, A. and Rubio, D. (1998). Aproximación sociológica al exilio liberal en la década ominosa (1823-1833). España Contemporánea 13, VII, 7-19. xlix More details in Sánchez García, R. (2003). Textos y discursos políticos (Antonio Alcalá Galiano), Madrid: Biblioteca Nueva, and (2011). Alcalá Galiano. Política y literatura en el exilio. In Muñoz Sempere, D. and Alonso García, G. (eds.) Londres y el liberalismo hispánico. Vervuert: Iberoamericana, 17-33. l References about this character: Reinares, E. (2006). García Herreros "El Numantino": emigrantes, judíos, clérigos y otras vidas riojanas insólitas en la revolución liberal. Logroño: Colegio Oficial de Aparejadores y Arquitectos Tecnicos de La Rioja, and Reinares, E. and Viguera Ruiz, R. (2012). Manuel García Herreros: un liberal camerano en las Cortes de Cádiz. Logroño: Asociación Amigos de San Román de Cameros. li Sierra, M. (2009). El espejo inglés de la modernidad española: el modelo electoral británico y su influencia en el concepto de representación política. Historia y Política 21, 139-167, 141. lii A great work on this topic to complete these ideas is: Fernández Sarasola, I. (2009). Los partidos políticos en el pensamiento español de la Ilustración a nuestros días. Madrid: Marcial Pons Historia. liii “El soldado adulador”. Manuel Ruiz, D. (1821). Aplicación de las voces de serviles y liberales con alguna cosilla sobre la causa del diez de marzo en Cádiz. Jerez de la Frontera, 6. For related information see Gómez Ochoa, F. (2003). Pero ¿hubo alguna vez once mil vírgenes?. In Suárez Cortina, M. Las máscaras de la libertad. El liberalismo español 1808-1950. Madrid: Marcial Pons-Fundación Práxedes Mateo-Sagasta. liv For further discussion on this issue see Blanco and Thompson. (2008). Visiones del liberalismo. Política, identidad y cultura en la España del siglo XIX; Romeo, M.C. (2005). De patricios y nación. Los valores de la política liberal en la España de mediados del siglo XIX. Melanges de la Casa Velázquez 35; Burdiel, I. (2003). La consolidación del liberalismo y el punto de fuga de la monarquía (1843-1870). In Suárez Cortina, M. Las máscaras de la libertad., or Suárez Cortina, M. (2009). Las culturas políticas del liberalismo español (1808-1931). In Delgado, J.M. y Ollero, J.L. (eds.), El liberalismo europeo en la época de Sagasta. Madrid: Biblioteca Nueva-Fundación Práxedes Mateo-Sagasta. lv It has been stressed by Professor Gómez Ochoa, F. (2002). Manuel Orovio y el liberalismo conservador español. Graccurris 13, 23-64, 31 ff. lvi Several authors have insisted on this point, amongst the ones it could be highlighted Vivero, P. (2001). La transición al liberalismo: de las formas administrativas a las reformas políticas (1823-1833). Ayer 44, 175-196, Fontana, J. (1979). La Crisis del Antiguo Régimen, 1808-1833. Barcelona: Crítica, as well as Luis, J.P. (2001). La década ominosa (1823-1833). Una etapa desconocida en la construcción de la España Contemporánea. Ayer 41, 85-111, among many others. lvii Many specialists have studied this matter. Amongst them is Gómez Ochoa, F. (2002). Manuel de Orovio, or (2004). Problemas sociales y conservadurismo político durante el siglo XIX. Historia contemporánea 29, 591-624, for example. lviii Nuñez de Arenas, B. (1840). De nuestra situación. Moderados, exaltados, tercer partido. Madrid: Imprenta de Mellado. lix Alcalá Galiano, A. (1955). Recuerdos de un anciano. Madrid: BAE. lx AHPLR, Fondo P-A, 032/18... lxi There are many works on the connections between Spain and Europe in that period, as for example are Santirso, M. (2008). Progreso y libertad: España en la Europa liberal (1830-1837). Barcelona: Ariel; La Parra E. and Ramírez, G. (2003). El primer liberalismo. España y Europa, una perspectiva comparada. Valencia: Generalitat Valenciana-Biblioteca Valenciana, or Casmirri, S. (1998). La Europa del sur en la época liberal: España, Italia y Portugal: una perspectiva comparada. Santander: Universidad de Cantabria-Università de Cassino, among others. lxii Romeo, M.C. (2001). Tras los escombros de la revolución. El moderantismo y las estrategias políticas y culturales de dominación. In Fuentes, J.F. and Roura i Aulinas, L. Sociabilidad y liberalismo en la España del siglo XIX. Homenaje al profesor Alberto Gil Novales. Lleida: Milenio, 239-260. lxiii Ginger, A. Exile, return and the fashioning of the liberal self: Jacinto Salas y Quiroga and others. In Muñoz Sempere, D. and Alonso García G. (eds.), Londres y el liberalismo, 189-202, 189. lxiv Escribano, F. El extraño exilio de Pascual de Gayangos en Londres. In Muñoz Sempere and Alonso García (eds.). Londres y el liberalismo, 75-94; Monguió, L. (1965). Don José Joaquín de Mora en Buenos Aires en 1827. Revista Hispánica Moderna 31, 1: 317-318 or Amunátegui, M.L. (1888). Don José Joaquín de Mora. Apuntes biográficos. Santiago de Chile: Imprenta Nacional, 10-11. lxv All these references are contained in AHPLR, P-A, 032/11, “escritos, documentación y borradores para intervenciones de Ramón Alesón en las Cortes como Diputado por la provincia de Logroño”. lxvi It was a background shared by many nineteenth century liberals, as studied by Burdiel, I. and Romeo, M.C. (1996). Los sujetos del proceso revolucionario español del s. XIX. Historia Contemporánea 13-14, 149-156.
This work is licensed under a Creative Commons Attribution 3.0 License.
International Journal of Social Science Studies Vol. 2, No. 3; July 2014
ISSN 2324-8033 E-ISSN 2324-8041 Published by Redfame Publishing
URL: http://ijsss.redfame.com
38
Perspectives on Diversity in the Military: A Comparison between Belgium and the Netherlands
Rudy Richardson1, Delphine Resteigne2, & Mathias Bonneu 1Stoas University of Applied Sciences, Netherlands Defence Academy, The Netherlands 2 Chair of Sociology, Royal Military Academy, Belgium Correspondence: Rudy Richardson, NLDA, De La Reijweg 120, P.O. Box 4818 BB Breda, The Netherlands. E-mail: [email protected] Received: February 18, 2014 Accepted: March 17, 2014 Available online: May 22, 2014 doi:10.11114/ijsss.v2i3.421 URL: http://dx.doi.org/10.11114/ijsss.v2i3.421 Abstract In a comparative way, this article analyses the dimensions of cultural diversity in the military context of Belgium and the Netherlands, and describes how these organizations may be comparable or differ in their acceptance towards cultural diversity. To do this, we start by stressing the importance of dealing with cultural diversity in both the Belgian and Dutch military, and by depicting the main cultural traits of the two countries regarding major cultural groups. Multicultural attitudes, Muslim attitudes and Acculturation orientations are the main theoretical concepts we used in this research to elaborate ‘the perspectives on cultural diversity’ in the Belgian and Dutch military. We compared the results of a similar quantitative survey conducted in the Belgian and Dutch military. We discuss how cultural diversity is perceived among both organizations and the dimensions on which the subgroups tend to differentiate themselves. Keywords: cultural diversity, acculturation, multicultural attitudes, Muslim attitudes 1. Introduction Cultural diversity refers to the questions whether different cultures respect each other's cultural (ethnic, gender, racial, religious and socioeconomic) differences in a situation, institution, or group. It is still regarded as an important issue in society in general and in the Armed Forces in particular. At the societal level, a greater degree of cultural diversity can be a liability for civic engagement and social connectedness so that more homogeneous communities could arise (Quillan, 1995; Liu, 2007). Regarding the Armed Forces, firstly, most western politicians often requires their Forces to reflect society regarding gender, socio-economic status/education level, religion, sexually orientation and ethnic culturally origin or, at the latest, to be open and tolerant regarding various forms of diversity (Winslow & Dunn; Dansby & Landis, 2007; Bosman, Richardson & Soeters, 2007) This “discrimination-and-fairness” perspective is characterized by: “a belief in a culturally diverse workforce as a moral imperative to ensure justice and the fair treatment of all members of society”, (Ely & Thomas, 2001). Secondly, it has been argued that cultural diversity in the Armed Forces may increase the effectiveness in humanitarian missions and the cooperation between the military and local civilians in (former) conflict areas, but also for military personnel working in multinational operations (Miller & Moskos, 1995; Bosman, 2008; Soeters & Van der Meulen, 2007; Resteigne & Soeters, 2010). Since 2001, Armed Forces were mostly deployed in Islamic countries like Bosnia, Iraq and Afghanistan. This requires their employees to effectively deal with eastern (most of them Islamic) cultures in the interaction with civilian local organizations and governments, in training local governmental armies and police, in coordination and support of elections, and in humanitarian support of the local population. Earlier research showed that, when deployed with gender, religious and ethnic diversity, unions are better able to take into account the values and cultural habits of the society and its population, and to communicate more easily with the local population. To attract staff from different backgrounds, it seems of utmost importance that the military adopt an open mind towards cultural diversity (Dansby, Stewart & Webb, 2001). Negative attitudes may cause majority members in the company to put pressure on minority members to adjust themselves to the dominant culture of the company. Ethnic minorities, religious minorities as well as women still do not always feel comfortable in the military and feel accepted as person. These minorities have generally the feeling that they have to completely adapt to the dominant culture and habits (e.g., practical jokes) and they experience difficulties in educational opportunities and possibilities for professional growth in
International Journal of Social Science Studies Vol. 2, No. 3; 2014
39
the military organization. On the other hand, in some countries, like the United States, military organizations can also be an important channel of social integration. Following a process of ‘institutionally established’ social mobility, lower ranks are able to reach upper positions and to mix with other minority groups (Moskos & Butler, 1995). In some ways, it seems that the integration of newcomers in a host country and the integration of minorities in a military organization is a two-way process: on the one hand, the military organization needs to create or adapt its policies so that possible barriers in order ‘to feel at home’ can be removed and, on the other hand, minorities must follow the military organizational values and guidelines (Scoppio, 2009). In general the “quality of the diversity climate” is an important factor to feel comfortable or not in military organizations (Richardson, Op den Buijs, Van der Zee, 2011). In this context, we studied the diversity climate in the Dutch and Belgium Armed Forces. In this article, we have focused our analysis on those two countries because, on the military side, they are already working in close collaboration since several years, notably in the Navy. However such cooperation is not really new as the history of the two countries is closely intertwined. With similar budgetary issues, both countries are increasing their cooperation, among other for the training of their military personnel. Facing important problems of recruitment, they also both have tried to be more open to less traditional categories of personnel and, among them, to ethnic minorities. In this article, we will look more carefully at the way followed by both nations in order to integrate them and, when comparing the two, how organizational policies can have a major impact in those so-called “uniformed organizations”. This leads to the following central research question in our study: What are differences between the attitudes towards cultural diversity of military and civilian employees of the Dutch and the Belgian Armed Forces? In this study, we focus on the ‘multicultural’ dimension of cultural diversity, i.e, the attitude towards ethnic groups and Muslims in particular. We start, firstly, with elaborating the theoretical framework we used to study the different attitudes in both military organizations. We, secondly, will describe the external environment of the Belgian and the Dutch military organizations and by depicting the main cultural traits of the two countries regarding the multicultural dimension of cultural diversity. Furthermore, thirdly, we will describe which methods and instruments we used in our study. Fourthly, we will present the most interesting results of our study and will, lastly, end with some conclusions and discussion. 2. Multicultural and Muslim attitudes As we argued above, it is important for military organizations that majority members have a positive attitude towards cultural diversity. This is mainly the case for organizations which are facing important problems of recruitment and, as we have seen in Afghanistan, who are operating in culturally complex environments (Manigart & Resteigne, 2013). A military organization which has an open mind towards cultural diversity can lead to minority members feeling more accepted, attracts more of them and, at the long run, increases the effectiveness in missions and civil-military cooperation (Van der Meulen & Soeters, 2007). Cox (1993) defines cultural diversity as: “The representation, in one social system, of people with distinctly different group affiliations of cultural significance”. Those differences can be physical (e.g. skin color), biological (e.g. gender), religious (e.g. Muslim) or stylistic (e.g. clothing). In the present study, we will focus on the ‘multicultural dimension’ of cultural diversity. We operationalize this ‘multicultural dimension’ into three main concepts, i.e., the attitudes towards ‘Multiculturalism’, the ‘Muslim attitude’and the ‘acculturation orientation’ (Bosman, Richardson & Soeters, 2007; Richardson, Op den Buijs & van der Zee, 2011). The main concept of interest here concerned multicultural attitudes. This can be defined as the attitude of employees towards the (integration of) ethnic minorities in an organization (Berry & Kalin, 1995; Berry, Poortinga, Segall & Darren, 1992; Bosman, Richardson & Soeters, 2007; Richardson, Op den Buijs & Van der Zee, 2011). Cooperation and integration among different ethnic groups improves when this attitude is positive, while a negative attitude puts a restraint on mutual relations and therefore can become a source of conflict. According to Arends-Tóth and Van de Vijver (2003), Multicultural attitude (MCA) can be divided into two dimensions. On the one hand, a positive evaluation of ethnic diversity and support for multiculturalism will ensure a positive MCA, illustrating respect and understanding for the ethnic background of ethnic groups. On the other hand, a negative evaluation of ethnic diversity will ensure a negative MCA. We also used the Muslim attitude (MA) to examine the attitudes towards Muslims within the Belgium and the Dutch military organizations. As we will outlined later in this article, the attitude towards Muslims will be studied in this research as a special aspect of multiculturalism, because of recent societal developments in Western countries and missions of service members in Islamic countries. The term Muslim attitude is defined as the attitude towards a social group, in this case Muslims, or individual members in that social group (Strabac & Listhaug, 2008). 3. Acculturation Attitudes According to Berry et al. (1992) and Van de Vijver and Phalet (2004), diverse groups in society and in an organization are involved in a process of mutual adaptation described as acculturation: “those phenomena which result when groups
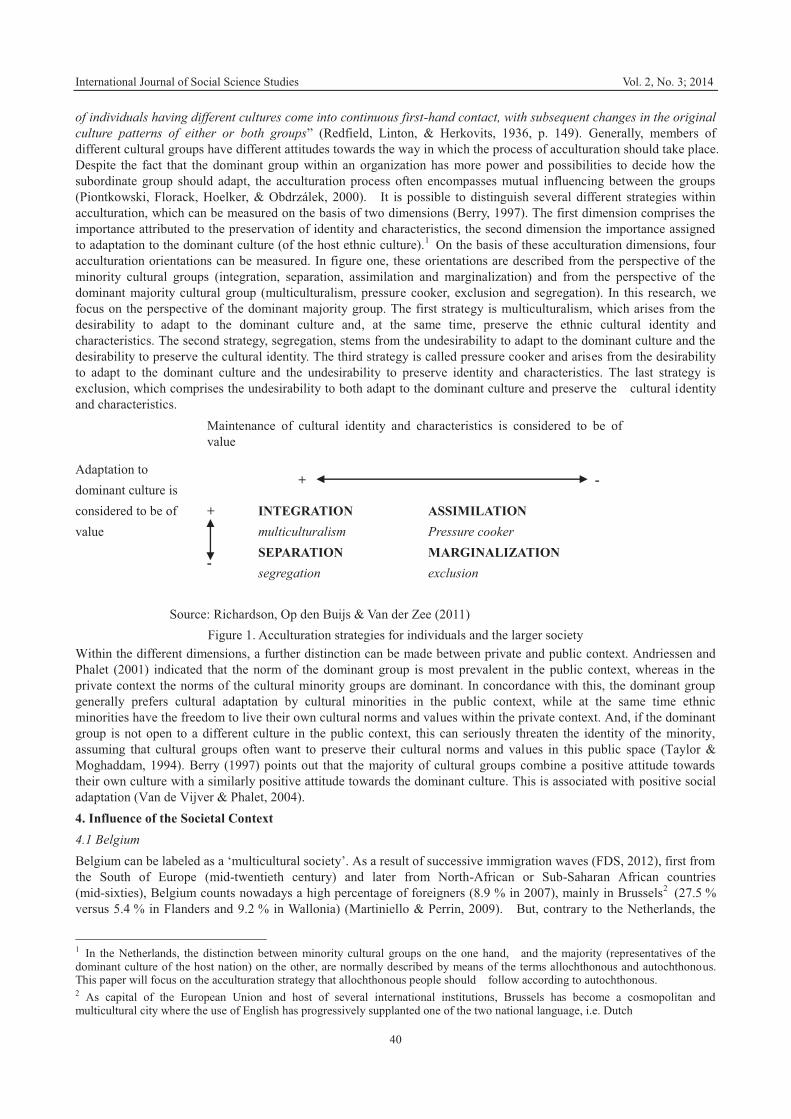
International Journal of Social Science Studies Vol. 2, No. 3; 2014
40
of individuals having different cultures come into continuous first-hand contact, with subsequent changes in the original culture patterns of either or both groups” (Redfield, Linton, & Herkovits, 1936, p. 149). Generally, members of different cultural groups have different attitudes towards the way in which the process of acculturation should take place. Despite the fact that the dominant group within an organization has more power and possibilities to decide how the subordinate group should adapt, the acculturation process often encompasses mutual influencing between the groups (Piontkowski, Florack, Hoelker, & Obdrzálek, 2000). It is possible to distinguish several different strategies within acculturation, which can be measured on the basis of two dimensions (Berry, 1997). The first dimension comprises the importance attributed to the preservation of identity and characteristics, the second dimension the importance assigned to adaptation to the dominant culture (of the host ethnic culture).1 On the basis of these acculturation dimensions, four acculturation orientations can be measured. In figure one, these orientations are described from the perspective of the minority cultural groups (integration, separation, assimilation and marginalization) and from the perspective of the dominant majority cultural group (multiculturalism, pressure cooker, exclusion and segregation). In this research, we focus on the perspective of the dominant majority group. The first strategy is multiculturalism, which arises from the desirability to adapt to the dominant culture and, at the same time, preserve the ethnic cultural identity and characteristics. The second strategy, segregation, stems from the undesirability to adapt to the dominant culture and the desirability to preserve the cultural identity. The third strategy is called pressure cooker and arises from the desirability to adapt to the dominant culture and the undesirability to preserve identity and characteristics. The last strategy is exclusion, which comprises the undesirability to both adapt to the dominant culture and preserve the cultural identity and characteristics.
Maintenance of cultural identity and characteristics is considered to be of value
Adaptation to dominant culture is considered to be of value
+ -
+ INTEGRATION multiculturalism
ASSIMILATION Pressure cooker
- SEPARATION segregation
MARGINALIZATION exclusion
Source: Richardson, Op den Buijs & Van der Zee (2011) Figure 1. Acculturation strategies for individuals and the larger society
Within the different dimensions, a further distinction can be made between private and public context. Andriessen and Phalet (2001) indicated that the norm of the dominant group is most prevalent in the public context, whereas in the private context the norms of the cultural minority groups are dominant. In concordance with this, the dominant group generally prefers cultural adaptation by cultural minorities in the public context, while at the same time ethnic minorities have the freedom to live their own cultural norms and values within the private context. And, if the dominant group is not open to a different culture in the public context, this can seriously threaten the identity of the minority, assuming that cultural groups often want to preserve their cultural norms and values in this public space (Taylor & Moghaddam, 1994). Berry (1997) points out that the majority of cultural groups combine a positive attitude towards their own culture with a similarly positive attitude towards the dominant culture. This is associated with positive social adaptation (Van de Vijver & Phalet, 2004). 4. Influence of the Societal Context 4.1 Belgium Belgium can be labeled as a ‘multicultural society’. As a result of successive immigration waves (FDS, 2012), first from the South of Europe (mid-twentieth century) and later from North-African or Sub-Saharan African countries (mid-sixties), Belgium counts nowadays a high percentage of foreigners (8.9 % in 2007), mainly in Brussels2 (27.5 % versus 5.4 % in Flanders and 9.2 % in Wallonia) (Martiniello & Perrin, 2009). But, contrary to the Netherlands, the
1 In the Netherlands, the distinction between minority cultural groups on the one hand, and the majority (representatives of the dominant culture of the host nation) on the other, are normally described by means of the terms allochthonous and autochthonous. This paper will focus on the acculturation strategy that allochthonous people should follow according to autochthonous. 2 As capital of the European Union and host of several international institutions, Brussels has become a cosmopolitan and multicultural city where the use of English has progressively supplanted one of the two national language, i.e. Dutch
International Journal of Social Science Studies Vol. 2, No. 3; 2014
41
Belgian colonial past did not have a large impact on those immigration waves as relatively few people have migrated from Congo, Burundi or Rwanda after the independence. If one adds to these foreigners Belgians who have received the Belgian nationality and Belgians who have at least one parent who is foreign-born, the proportion is even higher and reaches 19.4 % of Belgium’s total population (Centrum voor Gelijkheid van Kansen en voor Racismebestrijding, 2009). Contrary to a largely held perception, however, the important majority of the foreigners living in Belgium comes either from another EU country (Italy, France and The Netherlands occupying the top three positions), or from another industrial Western country. One should add that, in Belgium, it is far from easy to compare data on that matter as we have significant divergences between the two –Flemish and Walloon-linguistic communities on the implemented integration policies but also, on the used statistical categories (Jacobs & Rea, 2006). Inspired by the French ‘assimilationist-republican’ model, the French-speaking side tends to deny the ethnic origin of immigrants and, using the distinction Belgians/ foreigners, tends in his policies to encourage newcomers to adopt the Belgian-French-speaking culture. Because of the Belgian history and the French-speaking domination during the past century, the Flemish side, however, is more similar to the Dutch ‘multiculturalist’ system where ethno-cultural minorities or “allochthonous” are recognized and supported (even if, in the Belgian - Flemish- case, there is no official recognition of some specific ethnic groups). As we see, both linguistic communities refer to separate classifications and accepted meanings which not only allow few academic assessments but also complicate the policy monitoring at the federal and regional level. Despite some obvious divides on other political-linguistic topics, the country found a consensus in April 2010 on Islamic face-covering veils. After Belgium’s lower house of Parliament has -almost unanimously with 134 MPs in support of the law and two abstentions- voted for a law banning the burqa from all public venues, Belgium drew a huge international attention for being, at that time, the first European country initiating such a ban. Consequently, a strong signal was not only sent to Belgian’s population but was also immediately heard by some Islamists who replied with a video posted on the Internet containing threats to attack the country. As the number of affected women remains very low, many comments reported that this law could primarily contribute to increase the “Islamophobia” among the country. 4.2 The Netherlands Like her southern neighbor, also Dutch society can be marked as a ‘multicultural’ society. According to the most recent figures (CBS, 2012). 1.8 million people from ethnic minority groups live in the Netherlands.3 As a matter of fact, 40-50% of these minority groups is born in the Netherlands and can be defined as “second generation” ethnic minority. Dutch policy on ethnic minorities began in the early eighties, targeted on ethnic groups stemming from former colonies as the former Dutch West Indies (Indonesia) and the Caribbean (Surinam, and the Netherlands Antilles and Aruba) on the one hand, and those coming from Morocco and Turkey as a result of labor immigration on the other. Demographic prognosis already made clear that these ethnic groups were going to constitute a growing share of the Dutch population, as a dual effect of family-reunion and birthrate. In a near future, approximately 50% of the new generation from the most important economic region in the Netherlands (Amsterdam-Rotterdam-The Hague-Utrecht), will stem from ethnic minority group (CBS, 2012). Until 2001 relative few tensions and outbreaks were visible between ethnic groups in this expanding Dutch multicultural society. However, since September 11th 2001 serious tensions entered Dutch society, especially between majority allochtonous groups on the one hand and especially Dutch-Moroccan and Dutch-Turkish groups, but also Dutch-Antilles groups on the other. The murder of Dutch prominent politician Fortuyn in 2002 and of Dutch filmmaker Van Gogh in 2005, who both overtly critiqued Islamic religion, were the most obvious signs of these tensions. But also a Dutch 18 year old boy was beaten to death in Tilburg by a group of Dutch-Antilles youngsters in 2007 and serious tensions were visible in city districts with most Dutch Moroccan groups like in Gouda in 2009. These events gave rise to accentuating severe policy measurements in the media and politics against the weak societal position of ethnic minority groups and the growing criminality within this group. As a result, the Party For Freedom run by Geert Wilders, a political party that continuously accentuates problems society would have with Islam religion in general and with Islamic groups in particular, has become one of the most important political parties in the Netherlands, nowadays. On the other hand, ethnic minority groups, especially the youngsters amongst them, plead for a broad discourse in Dutch society on the topic of their backward labor market and educational position, integration and 3 An ethnic minority in the Netherlands (‘Allochtoon’) is defined as follows: (a) A person born in Turkey, Morocco, Surinam, Netherlands Antilles, Aruba, former Yugoslavia, or other countries in South- or Central America, Africa or Asia with the exception of Japan and the former Dutch East Indies. Thus, people born after December 27th 1949 in Indonesia belong to the ethnic minority group. (b) A person who can be found in the register, referred to as in article 1, of de Wet Rietkerk-payment.* (c) Children of people denominated in a and b. * The Mollucan population group is included in this definition as well. Although they cannot be registered according to the principle of native country, they are included if they are entered in the register that has been used in the scope of the Wet Rietkerk- payment. This register recorded people who have been brought to the Netherlands in 1951 and 1952. Children of those registered are included in the definition as well.
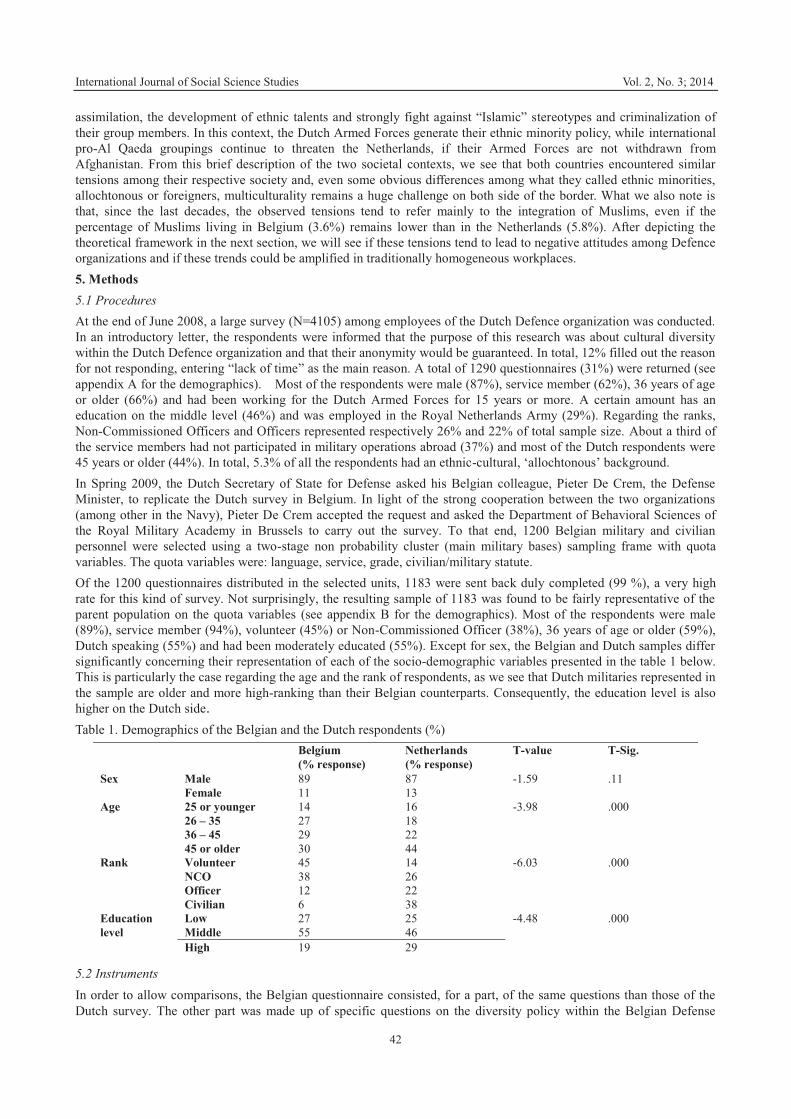
International Journal of Social Science Studies Vol. 2, No. 3; 2014
42
assimilation, the development of ethnic talents and strongly fight against “Islamic” stereotypes and criminalization of their group members. In this context, the Dutch Armed Forces generate their ethnic minority policy, while international pro-Al Qaeda groupings continue to threaten the Netherlands, if their Armed Forces are not withdrawn from Afghanistan. From this brief description of the two societal contexts, we see that both countries encountered similar tensions among their respective society and, even some obvious differences among what they called ethnic minorities, allochtonous or foreigners, multiculturality remains a huge challenge on both side of the border. What we also note is that, since the last decades, the observed tensions tend to refer mainly to the integration of Muslims, even if the percentage of Muslims living in Belgium (3.6%) remains lower than in the Netherlands (5.8%). After depicting the theoretical framework in the next section, we will see if these tensions tend to lead to negative attitudes among Defence organizations and if these trends could be amplified in traditionally homogeneous workplaces. 5. Methods 5.1 Procedures At the end of June 2008, a large survey (N=4105) among employees of the Dutch Defence organization was conducted. In an introductory letter, the respondents were informed that the purpose of this research was about cultural diversity within the Dutch Defence organization and that their anonymity would be guaranteed. In total, 12% filled out the reason for not responding, entering “lack of time” as the main reason. A total of 1290 questionnaires (31%) were returned (see appendix A for the demographics). Most of the respondents were male (87%), service member (62%), 36 years of age or older (66%) and had been working for the Dutch Armed Forces for 15 years or more. A certain amount has an education on the middle level (46%) and was employed in the Royal Netherlands Army (29%). Regarding the ranks, Non-Commissioned Officers and Officers represented respectively 26% and 22% of total sample size. About a third of the service members had not participated in military operations abroad (37%) and most of the Dutch respondents were 45 years or older (44%). In total, 5.3% of all the respondents had an ethnic-cultural, ‘allochtonous’ background. In Spring 2009, the Dutch Secretary of State for Defense asked his Belgian colleague, Pieter De Crem, the Defense Minister, to replicate the Dutch survey in Belgium. In light of the strong cooperation between the two organizations (among other in the Navy), Pieter De Crem accepted the request and asked the Department of Behavioral Sciences of the Royal Military Academy in Brussels to carry out the survey. To that end, 1200 Belgian military and civilian personnel were selected using a two-stage non probability cluster (main military bases) sampling frame with quota variables. The quota variables were: language, service, grade, civilian/military statute. Of the 1200 questionnaires distributed in the selected units, 1183 were sent back duly completed (99 %), a very high rate for this kind of survey. Not surprisingly, the resulting sample of 1183 was found to be fairly representative of the parent population on the quota variables (see appendix B for the demographics). Most of the respondents were male (89%), service member (94%), volunteer (45%) or Non-Commissioned Officer (38%), 36 years of age or older (59%), Dutch speaking (55%) and had been moderately educated (55%). Except for sex, the Belgian and Dutch samples differ significantly concerning their representation of each of the socio-demographic variables presented in the table 1 below. This is particularly the case regarding the age and the rank of respondents, as we see that Dutch militaries represented in the sample are older and more high-ranking than their Belgian counterparts. Consequently, the education level is also higher on the Dutch side. Table 1. Demographics of the Belgian and the Dutch respondents (%)
Belgium (% response)
Netherlands (% response)
T-value
T-Sig.
Sex Male 89 87 -1.59 .11 Female 11 13
Age 25 or younger 14 16 -3.98 .000 26 – 35 27 18 36 – 45 29 22 45 or older 30 44
Rank Volunteer 45 14 -6.03 .000 NCO 38 26 Officer 12 22 Civilian 6 38
Education level
Low 27 25 -4.48 .000 Middle 55 46 High 19 29
5.2 Instruments In order to allow comparisons, the Belgian questionnaire consisted, for a part, of the same questions than those of the Dutch survey. The other part was made up of specific questions on the diversity policy within the Belgian Defense
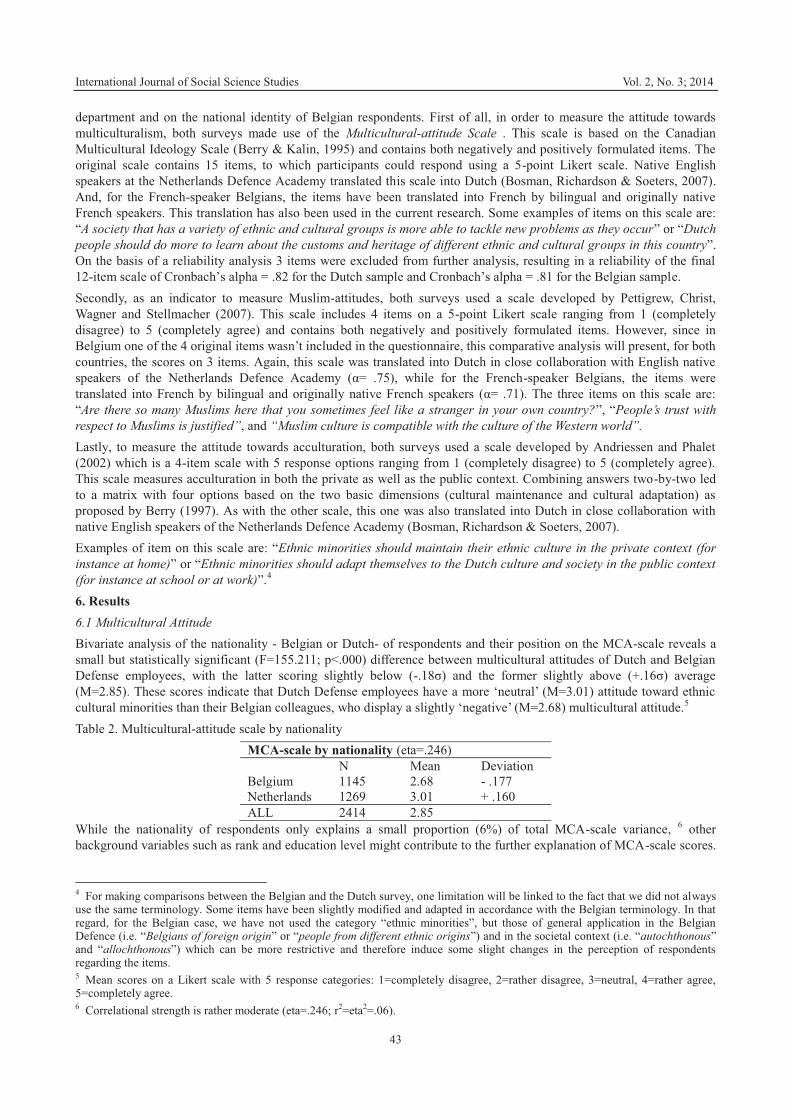
International Journal of Social Science Studies Vol. 2, No. 3; 2014
43
department and on the national identity of Belgian respondents. First of all, in order to measure the attitude towards multiculturalism, both surveys made use of the Multicultural-attitude Scale . This scale is based on the Canadian Multicultural Ideology Scale (Berry & Kalin, 1995) and contains both negatively and positively formulated items. The original scale contains 15 items, to which participants could respond using a 5-point Likert scale. Native English speakers at the Netherlands Defence Academy translated this scale into Dutch (Bosman, Richardson & Soeters, 2007). And, for the French-speaker Belgians, the items have been translated into French by bilingual and originally native French speakers. This translation has also been used in the current research. Some examples of items on this scale are: “A society that has a variety of ethnic and cultural groups is more able to tackle new problems as they occur” or “Dutch people should do more to learn about the customs and heritage of different ethnic and cultural groups in this country”. On the basis of a reliability analysis 3 items were excluded from further analysis, resulting in a reliability of the final 12-item scale of Cronbach’s alpha = .82 for the Dutch sample and Cronbach’s alpha = .81 for the Belgian sample. Secondly, as an indicator to measure Muslim-attitudes, both surveys used a scale developed by Pettigrew, Christ, Wagner and Stellmacher (2007). This scale includes 4 items on a 5-point Likert scale ranging from 1 (completely disagree) to 5 (completely agree) and contains both negatively and positively formulated items. However, since in Belgium one of the 4 original items wasn’t included in the questionnaire, this comparative analysis will present, for both countries, the scores on 3 items. Again, this scale was translated into Dutch in close collaboration with English native speakers of the Netherlands Defence Academy (α= .75), while for the French-speaker Belgians, the items were translated into French by bilingual and originally native French speakers (α= .71). The three items on this scale are: “Are there so many Muslims here that you sometimes feel like a stranger in your own country?”, “People’s trust with respect to Muslims is justified”, and “Muslim culture is compatible with the culture of the Western world”. Lastly, to measure the attitude towards acculturation, both surveys used a scale developed by Andriessen and Phalet (2002) which is a 4-item scale with 5 response options ranging from 1 (completely disagree) to 5 (completely agree). This scale measures acculturation in both the private as well as the public context. Combining answers two-by-two led to a matrix with four options based on the two basic dimensions (cultural maintenance and cultural adaptation) as proposed by Berry (1997). As with the other scale, this one was also translated into Dutch in close collaboration with native English speakers of the Netherlands Defence Academy (Bosman, Richardson & Soeters, 2007). Examples of item on this scale are: “Ethnic minorities should maintain their ethnic culture in the private context (for instance at home)” or “Ethnic minorities should adapt themselves to the Dutch culture and society in the public context (for instance at school or at work)”.4 6. Results 6.1 Multicultural Attitude Bivariate analysis of the nationality - Belgian or Dutch- of respondents and their position on the MCA-scale reveals a small but statistically significant (F=155.211; p<.000) difference between multicultural attitudes of Dutch and Belgian Defense employees, with the latter scoring slightly below (-.18σ) and the former slightly above (+.16σ) average (M=2.85). These scores indicate that Dutch Defense employees have a more ‘neutral’ (M=3.01) attitude toward ethnic cultural minorities than their Belgian colleagues, who display a slightly ‘negative’ (M=2.68) multicultural attitude.5 Table 2. Multicultural-attitude scale by nationality
MCA-scale by nationality (eta=.246) N Mean Deviation Belgium 1145 2.68 - .177 Netherlands 1269 3.01 + .160 ALL 2414 2.85
While the nationality of respondents only explains a small proportion (6%) of total MCA-scale variance, 6 other background variables such as rank and education level might contribute to the further explanation of MCA-scale scores.
4 For making comparisons between the Belgian and the Dutch survey, one limitation will be linked to the fact that we did not always use the same terminology. Some items have been slightly modified and adapted in accordance with the Belgian terminology. In that regard, for the Belgian case, we have not used the category “ethnic minorities”, but those of general application in the Belgian Defence (i.e. “Belgians of foreign origin” or “people from different ethnic origins”) and in the societal context (i.e. “autochthonous” and “allochthonous”) which can be more restrictive and therefore induce some slight changes in the perception of respondents regarding the items. 5 Mean scores on a Likert scale with 5 response categories: 1=completely disagree, 2=rather disagree, 3=neutral, 4=rather agree, 5=completely agree. 6 Correlational strength is rather moderate (eta=.246; r2=eta2=.06).
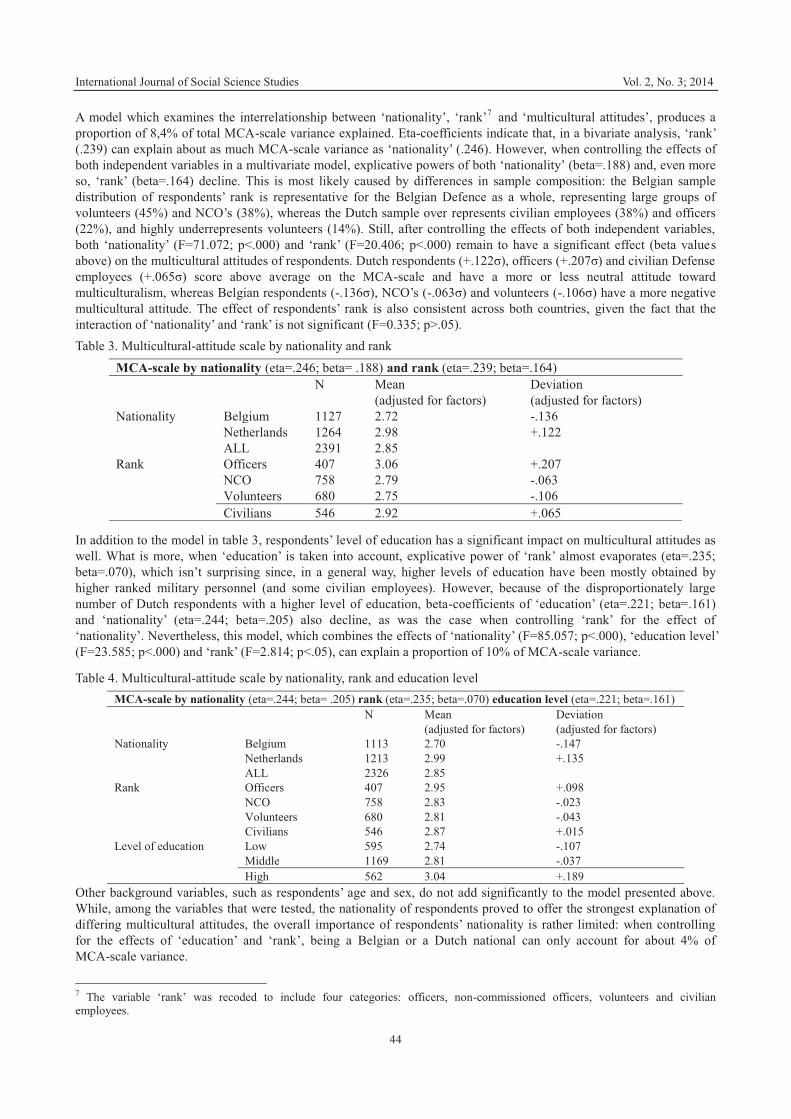
International Journal of Social Science Studies Vol. 2, No. 3; 2014
44
A model which examines the interrelationship between ‘nationality’, ‘rank’7 and ‘multicultural attitudes’, produces a proportion of 8,4% of total MCA-scale variance explained. Eta-coefficients indicate that, in a bivariate analysis, ‘rank’ (.239) can explain about as much MCA-scale variance as ‘nationality’ (.246). However, when controlling the effects of both independent variables in a multivariate model, explicative powers of both ‘nationality’ (beta=.188) and, even more so, ‘rank’ (beta=.164) decline. This is most likely caused by differences in sample composition: the Belgian sample distribution of respondents’ rank is representative for the Belgian Defence as a whole, representing large groups of volunteers (45%) and NCO’s (38%), whereas the Dutch sample over represents civilian employees (38%) and officers (22%), and highly underrepresents volunteers (14%). Still, after controlling the effects of both independent variables, both ‘nationality’ (F=71.072; p<.000) and ‘rank’ (F=20.406; p<.000) remain to have a significant effect (beta values above) on the multicultural attitudes of respondents. Dutch respondents (+.122σ), officers (+.207σ) and civilian Defense employees (+.065σ) score above average on the MCA-scale and have a more or less neutral attitude toward multiculturalism, whereas Belgian respondents (-.136σ), NCO’s (-.063σ) and volunteers (-.106σ) have a more negative multicultural attitude. The effect of respondents’ rank is also consistent across both countries, given the fact that the interaction of ‘nationality’ and ‘rank’ is not significant (F=0.335; p>.05). Table 3. Multicultural-attitude scale by nationality and rank
MCA-scale by nationality (eta=.246; beta= .188) and rank (eta=.239; beta=.164) N Mean
(adjusted for factors) Deviation (adjusted for factors)
Nationality Belgium 1127 2.72 -.136 Netherlands 1264 2.98 +.122 ALL 2391 2.85
Rank Officers 407 3.06 +.207 NCO 758 2.79 -.063 Volunteers 680 2.75 -.106 Civilians 546 2.92 +.065
In addition to the model in table 3, respondents’ level of education has a significant impact on multicultural attitudes as well. What is more, when ‘education’ is taken into account, explicative power of ‘rank’ almost evaporates (eta=.235; beta=.070), which isn’t surprising since, in a general way, higher levels of education have been mostly obtained by higher ranked military personnel (and some civilian employees). However, because of the disproportionately large number of Dutch respondents with a higher level of education, beta-coefficients of ‘education’ (eta=.221; beta=.161) and ‘nationality’ (eta=.244; beta=.205) also decline, as was the case when controlling ‘rank’ for the effect of ‘nationality’. Nevertheless, this model, which combines the effects of ‘nationality’ (F=85.057; p<.000), ‘education level’ (F=23.585; p<.000) and ‘rank’ (F=2.814; p<.05), can explain a proportion of 10% of MCA-scale variance.
Table 4. Multicultural-attitude scale by nationality, rank and education level MCA-scale by nationality (eta=.244; beta= .205) rank (eta=.235; beta=.070) education level (eta=.221; beta=.161) N Mean
(adjusted for factors) Deviation (adjusted for factors)
Nationality Belgium 1113 2.70 -.147 Netherlands 1213 2.99 +.135 ALL 2326 2.85
Rank Officers 407 2.95 +.098 NCO 758 2.83 -.023 Volunteers 680 2.81 -.043 Civilians 546 2.87 +.015
Level of education Low 595 2.74 -.107 Middle 1169 2.81 -.037 High 562 3.04 +.189
Other background variables, such as respondents’ age and sex, do not add significantly to the model presented above. While, among the variables that were tested, the nationality of respondents proved to offer the strongest explanation of differing multicultural attitudes, the overall importance of respondents’ nationality is rather limited: when controlling for the effects of ‘education’ and ‘rank’, being a Belgian or a Dutch national can only account for about 4% of MCA-scale variance.
7 The variable ‘rank’ was recoded to include four categories: officers, non-commissioned officers, volunteers and civilian employees.
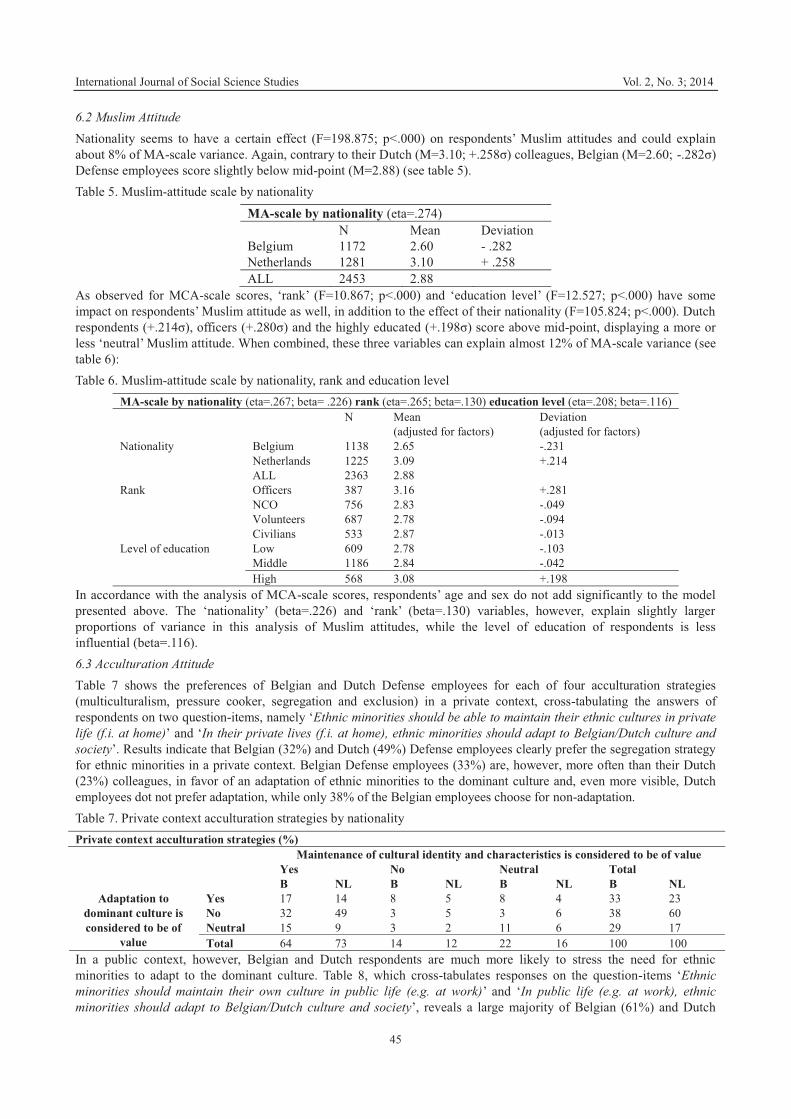
International Journal of Social Science Studies Vol. 2, No. 3; 2014
45
6.2 Muslim Attitude Nationality seems to have a certain effect (F=198.875; p<.000) on respondents’ Muslim attitudes and could explain about 8% of MA-scale variance. Again, contrary to their Dutch (M=3.10; +.258σ) colleagues, Belgian (M=2.60; -.282σ) Defense employees score slightly below mid-point (M=2.88) (see table 5). Table 5. Muslim-attitude scale by nationality
MA-scale by nationality (eta=.274) N Mean Deviation Belgium 1172 2.60 - .282 Netherlands 1281 3.10 + .258 ALL 2453 2.88
As observed for MCA-scale scores, ‘rank’ (F=10.867; p<.000) and ‘education level’ (F=12.527; p<.000) have some impact on respondents’ Muslim attitude as well, in addition to the effect of their nationality (F=105.824; p<.000). Dutch respondents (+.214σ), officers (+.280σ) and the highly educated (+.198σ) score above mid-point, displaying a more or less ‘neutral’ Muslim attitude. When combined, these three variables can explain almost 12% of MA-scale variance (see table 6): Table 6. Muslim-attitude scale by nationality, rank and education level
MA-scale by nationality (eta=.267; beta= .226) rank (eta=.265; beta=.130) education level (eta=.208; beta=.116) N Mean
(adjusted for factors) Deviation (adjusted for factors)
Nationality Belgium 1138 2.65 -.231 Netherlands 1225 3.09 +.214 ALL 2363 2.88
Rank Officers 387 3.16 +.281 NCO 756 2.83 -.049 Volunteers 687 2.78 -.094 Civilians 533 2.87 -.013
Level of education Low 609 2.78 -.103 Middle 1186 2.84 -.042 High 568 3.08 +.198
In accordance with the analysis of MCA-scale scores, respondents’ age and sex do not add significantly to the model presented above. The ‘nationality’ (beta=.226) and ‘rank’ (beta=.130) variables, however, explain slightly larger proportions of variance in this analysis of Muslim attitudes, while the level of education of respondents is less influential (beta=.116). 6.3 Acculturation Attitude Table 7 shows the preferences of Belgian and Dutch Defense employees for each of four acculturation strategies (multiculturalism, pressure cooker, segregation and exclusion) in a private context, cross-tabulating the answers of respondents on two question-items, namely ‘Ethnic minorities should be able to maintain their ethnic cultures in private life (f.i. at home)’ and ‘In their private lives (f.i. at home), ethnic minorities should adapt to Belgian/Dutch culture and society’. Results indicate that Belgian (32%) and Dutch (49%) Defense employees clearly prefer the segregation strategy for ethnic minorities in a private context. Belgian Defense employees (33%) are, however, more often than their Dutch (23%) colleagues, in favor of an adaptation of ethnic minorities to the dominant culture and, even more visible, Dutch employees dot not prefer adaptation, while only 38% of the Belgian employees choose for non-adaptation. Table 7. Private context acculturation strategies by nationality Private context acculturation strategies (%) Maintenance of cultural identity and characteristics is considered to be of value
Yes No Neutral Total B NL B NL B NL B NL
Adaptation to dominant culture is considered to be of
value
Yes 17 14 8 5 8 4 33 23 No 32 49 3 5 3 6 38 60 Neutral 15 9 3 2 11 6 29 17 Total 64 73 14 12 22 16 100 100
In a public context, however, Belgian and Dutch respondents are much more likely to stress the need for ethnic minorities to adapt to the dominant culture. Table 8, which cross-tabulates responses on the question-items ‘Ethnic minorities should maintain their own culture in public life (e.g. at work)’ and ‘In public life (e.g. at work), ethnic minorities should adapt to Belgian/Dutch culture and society’, reveals a large majority of Belgian (61%) and Dutch
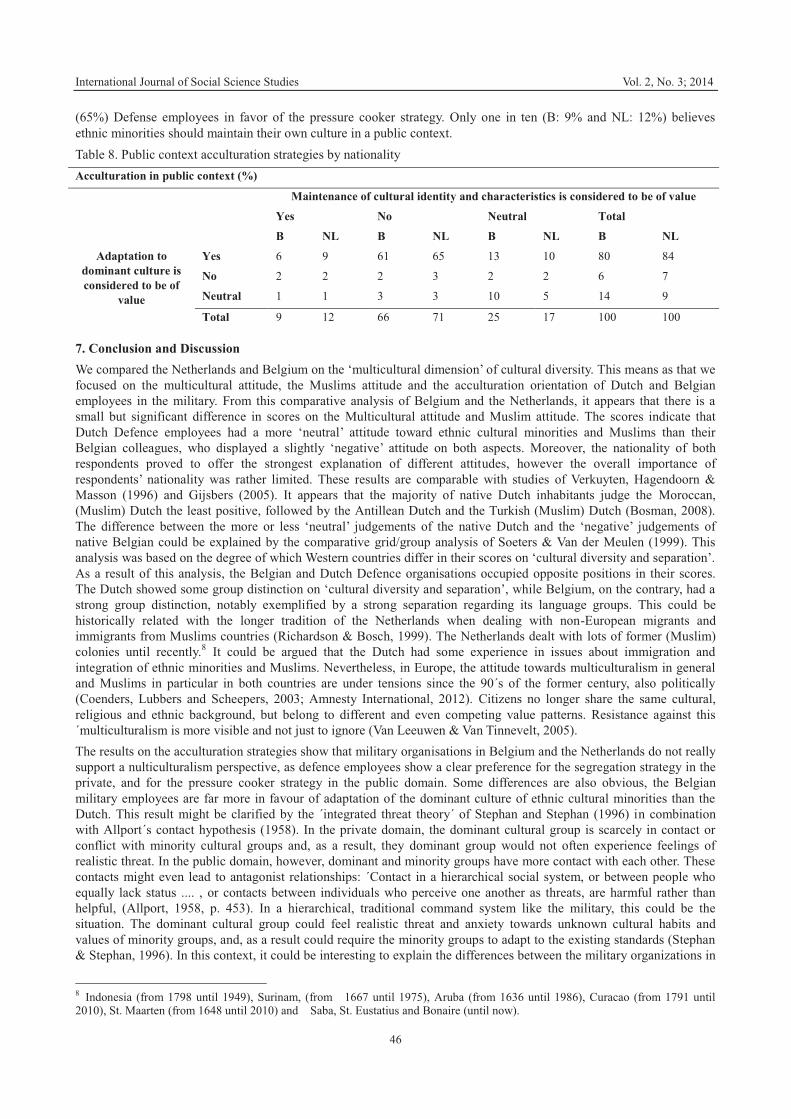
International Journal of Social Science Studies Vol. 2, No. 3; 2014
46
(65%) Defense employees in favor of the pressure cooker strategy. Only one in ten (B: 9% and NL: 12%) believes ethnic minorities should maintain their own culture in a public context. Table 8. Public context acculturation strategies by nationality Acculturation in public context (%)
Maintenance of cultural identity and characteristics is considered to be of value
Yes No Neutral Total
B NL B NL B NL B NL Adaptation to
dominant culture is considered to be of
value
Yes 6 9 61 65 13 10 80 84
No 2 2 2 3 2 2 6 7
Neutral 1 1 3 3 10 5 14 9
Total 9 12 66 71 25 17 100 100
7. Conclusion and Discussion We compared the Netherlands and Belgium on the ‘multicultural dimension’ of cultural diversity. This means as that we focused on the multicultural attitude, the Muslims attitude and the acculturation orientation of Dutch and Belgian employees in the military. From this comparative analysis of Belgium and the Netherlands, it appears that there is a small but significant difference in scores on the Multicultural attitude and Muslim attitude. The scores indicate that Dutch Defence employees had a more ‘neutral’ attitude toward ethnic cultural minorities and Muslims than their Belgian colleagues, who displayed a slightly ‘negative’ attitude on both aspects. Moreover, the nationality of both respondents proved to offer the strongest explanation of different attitudes, however the overall importance of respondents’ nationality was rather limited. These results are comparable with studies of Verkuyten, Hagendoorn & Masson (1996) and Gijsbers (2005). It appears that the majority of native Dutch inhabitants judge the Moroccan, (Muslim) Dutch the least positive, followed by the Antillean Dutch and the Turkish (Muslim) Dutch (Bosman, 2008). The difference between the more or less ‘neutral’ judgements of the native Dutch and the ‘negative’ judgements of native Belgian could be explained by the comparative grid/group analysis of Soeters & Van der Meulen (1999). This analysis was based on the degree of which Western countries differ in their scores on ‘cultural diversity and separation’. As a result of this analysis, the Belgian and Dutch Defence organisations occupied opposite positions in their scores. The Dutch showed some group distinction on ‘cultural diversity and separation’, while Belgium, on the contrary, had a strong group distinction, notably exemplified by a strong separation regarding its language groups. This could be historically related with the longer tradition of the Netherlands when dealing with non-European migrants and immigrants from Muslims countries (Richardson & Bosch, 1999). The Netherlands dealt with lots of former (Muslim) colonies until recently.8 It could be argued that the Dutch had some experience in issues about immigration and integration of ethnic minorities and Muslims. Nevertheless, in Europe, the attitude towards multiculturalism in general and Muslims in particular in both countries are under tensions since the 90´s of the former century, also politically (Coenders, Lubbers and Scheepers, 2003; Amnesty International, 2012). Citizens no longer share the same cultural, religious and ethnic background, but belong to different and even competing value patterns. Resistance against this ´multiculturalism is more visible and not just to ignore (Van Leeuwen & Van Tinnevelt, 2005). The results on the acculturation strategies show that military organisations in Belgium and the Netherlands do not really support a nulticulturalism perspective, as defence employees show a clear preference for the segregation strategy in the private, and for the pressure cooker strategy in the public domain. Some differences are also obvious, the Belgian military employees are far more in favour of adaptation of the dominant culture of ethnic cultural minorities than the Dutch. This result might be clarified by the ´integrated threat theory´ of Stephan and Stephan (1996) in combination with Allport´s contact hypothesis (1958). In the private domain, the dominant cultural group is scarcely in contact or conflict with minority cultural groups and, as a result, they dominant group would not often experience feelings of realistic threat. In the public domain, however, dominant and minority groups have more contact with each other. These contacts might even lead to antagonist relationships: ´Contact in a hierarchical social system, or between people who equally lack status .... , or contacts between individuals who perceive one another as threats, are harmful rather than helpful, (Allport, 1958, p. 453). In a hierarchical, traditional command system like the military, this could be the situation. The dominant cultural group could feel realistic threat and anxiety towards unknown cultural habits and values of minority groups, and, as a result could require the minority groups to adapt to the existing standards (Stephan & Stephan, 1996). In this context, it could be interesting to explain the differences between the military organizations in
8 Indonesia (from 1798 until 1949), Surinam, (from 1667 until 1975), Aruba (from 1636 until 1986), Curacao (from 1791 until 2010), St. Maarten (from 1648 until 2010) and Saba, St. Eustatius and Bonaire (until now).
International Journal of Social Science Studies Vol. 2, No. 3; 2014
47
both countries on the bases of societal differences level like stability of democracy and ratings of integration policy (Bourhis, Moïse, Perreault, & Senécal, 1997) or societal values (Breughelmans, Van de Vijver & Schalk-Soekar, 2007). It also appears in the results that the Belgian employees are more neutral towards their climate, while the Dutch are slightly positive towards it. This could be explained by the fact that the implementation of the Dutch defence diversity policy is much more developed than in Belgium. Started in 1997 as “emancipation policy”, the Dutch ministry of defence, however often troublesome and stopped in 2012, developed a “Gender and Diversity” policy in 2008 (Richardson, 2010). The Belgian, however, started a diversity policy in 2003. One could imagine that the communication and implementation of central issues of the diversity policy in Belgium is not yet developed as it is in the Netherlands. As a result, Belgian employees could less be able to see results of the ministry’s policy in their working environment as the Dutch could see them. Lastly, the perception of the direction of the diversity policy is quite the same in Belgium and the Netherlands. Both accentuate the deficit approach followed by the prejudice and the differentiation approach in their perception of the direction of the diversity policy the ministries should make predominant. This reflects the results on the acculturation strategies; employees in both military organisations accentuate the adaptation to the dominant culture in the public domain. The responsibility for this adaptation, however, is laid by the cultural minorities themselves; they must follow courses and training sessions to reach the level that the native Dutch and Belgian have reached. This means that diversity policy should, in first instance, be focussed on the delays cultural minority groups must make up. References Amnesty International. (2012). Choice and prejudice: Discrimination against Muslims in Europe. Amnesty
International: Index: EUR 01/001/2012. Allport, G.W. (1958). The Nature of Prejudice. A comprehensive and penetrating study of the origin and nature of
prejudice. New York: Anchor Books. Andriessen, I., & Phalet, K. (2002). Acculturation and school success: a study among minority youth in the Netherlands.
Intercultural Education, 13 (I), 21-36. Arends-Tóth, J.V., & van de Vijver, F.J.R. (2003). Multiculturalism and acculturation: Views of Dutch and
Turkish-Dutch. European Journal of Social Psychology, 33, 249-266. Avery, D.R., McKay, P.F., Wilson, D.C., & Tonidandel, S. (2007). Unequal attendance: The relationship between race,
organizational diversity cues and Absenteeism, Personnel Psychology 60 , 875–902. Beck, U. (2002). The cosmopolitan society and its enemies. Theory, culture and society, 19, 17-44. Berry, J.W. (2005). Acculturation: living successfully in two cultures. International Journal of Intercultural Relations,
29, 697-712. Berry, J. W. (1997). Lead article Immigration, Acculturation and Adaption. Applied Psychology: An International
Review, 46, 5-68. Berry, J.W., & Kalin, R. (1995). Multicultural and ethnic attitude in Canada: an overview of the 1991 national survey.
Canadian Journal of Behavioral Science, 27, 301-320. Berry, J. W., Poortinga, Y. H., Segall, M. H., & Daren, P. R. (1992). Cross cultural psychology. Research and
Applications. Cambridge: Cambridge University Press. Bosman, F., Richardson, R., & Soeters, J. (2007). Multicultural tensions in the military? Evidence from the Netherlands
Armed Forces. International Journal of Intercultural Relations 31,3, 339-362. Bosman, F. (2008). Uniformed Diversity. A multifaceted approach towards the diversity climate in the Netherlands
defense organization. Tilburg: Tilburg University Press. Bourhis, R.Y., Moïse, L.C., Perreault, S., & Senécal, S. (1997). Towards an Interactive Acculturation Model: A Social
Psychological Approach, International Journal of Psychology 32, 6, 359-386. Breughelmans, S.M., Van de Vijver, F.J., & Schalk-Soekar, S.G.S. (2009). Stability of Majority Attitudes toward
Multiculturalism in the Netherlands between 1999 and 2007. Applied Psychology 58, 4, 653-671. Brubaker, R. & Cooper, F. (2000). Beyond identity. Theory and Society 29 (1), 1-47. CBS (2012). Jaarrapportage Integratie report [Annual Integration report 2012]. The Hague: CBS. Centrum voor Gelijkheid van Kansen en voor Racismebestrijding (2009). Migraties en migrantenpopulaties in België
[Migrations and Migrant populations in Belgium]. Brussels: CGKR. Coenders, M., Lubbers, M., & Scheepers, P. (2003). Majority populations’ attitudes towards migrants and minorities.
Report for the Eropean Monitoring centre on Racism and Xenophobia. (NO 2003/04/01).
International Journal of Social Science Studies Vol. 2, No. 3; 2014
48
Cox, T. (1994). Diversity in Organizations, theory, research and practice. San Francisco: Berrett-Koehler publishers Inc.
Dansby, M.R., Stewart, J.B., & Webb, S.C. (2001, Eds.). Managing diversity in the military. Research perspectives from the defense equal opportunity management Institute. New Brunswick: Transaction Publishers.
Dansby, M. & Landis, D. (1996). Intercultural training in the military. In D. Landis & R.S. Bhagat, Handbook of international training (2nd edition), Thousand Oaks: Sage, 203 – 216.
FPS Economy (2012). Directorate- general Statistics and Economic Information, Service Demography. Brussels. (http://www.statbel.fgov.be).
Ely, R.J., & Thomas, D.A. (2001). Cultural diversity at work: The effects of diversity perspectives on work group processes and outcomes. Administrative Science Quarterly, 46,2, 229–273.
Gijsbers, M. (2005). Opvattingen van autochtonen over de multi-etnische samenleving. (views of native Dutch and ethnic minorities on the Multi-ethnic society). In SCP, WODC & CBS (Eds.), Jaarrapport Integratie 2005 (annula report Integration 2005) (PP. 189-205). Den Haag, Voorburg: SCP, WODC, CBS.
Hooghe, M., Reeskens, T., Stolle, D., & Trappers, A. (2006). Ethnic diversity, trust and ethnocentrism and Europe. A multilevel analysis of 21 European countries. Paper presented at the 102nd annual meeting of the APSA, Philadelphia, August 31-September 3, 2006.
Hooghe, M. (2006). The challenge of diversity: different answers and solutions,In L. d’Haenens, M. Hooghe, D. Vanheule & H. Gezduci (Eds.) New citizens, new policies? Developments in diversity policy in Canada and Flanders, Ghent, Academia press, 3-10.
IPSOS (2009). Sondage: Dans quelle mesure les Belges sont-ils tolérants par rapport aux minorités ethniques? [Survey : To what extent are Belgians tolerant regarding ethnic minorities?] Brussels: IPSOS, technical report.
Jacobs, D., & Rea, A. (2006). Construction and import of ethnic categorizations: “allochtones” in the Netherlands and in Belgium. Conference Paper, EURODIV conference, Milano.
Moskos, C.C., & Butler, J.S. (1996). All That We Can Be: Black Leadership and Racial Integration The Army Way. New York: Basic Books.
Kruithof, H. (2001). Multiculturele persoonlijkheidseigenschappen en effectiviteit van allochtone medewerkers in de Nederlandse werkorganisatie [Multicultural personality and effectivity of allochthonous employees in Dutch Labour Organizations]. Master thesis, Groningen, University of Groningen.
Liu, S. (2007). Living with others: Mapping the routes to acculturation in a multicultural society. International Journal of Intercultural Relations 31, 6, 761-778.
Manigart, P., & Resteigne, D. (2013). Sortir du rang : la gestion de la diversité à la Défense Belge [Exit Row the management of diversity at the Belgian defence]. Brussels: L’Académie en poche.
Martiniello, M., & Perrin, N. (2009). Immigration et diversité en Belgique. [Immigration and diversity in Belgium]. In J. Beaufays & G. Matagne (2009) La Belgique en mutation : Systèmes politiques et politiques publiques (1968-2008) [Belgium in mutation : Political systems and public policies (1968-2008), Brussels: Bruylant,217-251.
Miller, L., & Moskos, C. (1995). Humanitarians or Warriors? Race, gender, and combat status in operation ‘Restore Hope’. Armed Forces & Society, 21, 4, 615–637.
Pettigrew, T.F., Christ, O., Wagner, U., & Stellmacher, J. (2007). Direct and indirect intergroup contact effects on prejudice: a normative interpretation. International Journal of Intercultural relations, 31, 411-425.
Piontkowski, U. Florack, A., Hoelker, P., & Obdrzálek, P. (2000). Predicting acculturation-attitudes of dominant and non-dominant groups. International Journal of Intercultural Relations, 24, 1-26.
Putnam, R.D. (2007). E Pluribus Unum: diversity and community in the twenty-first century. The 2006 Johan Skytte prize lecture. Scandinavian Political Studies, 30, 137-174.
Redfield, R., Linton, R., & Herkovits, M. J. (1936). Memorandum for the study of acculturation. American Anthropologist, 38, (1), 149-152.
Resteigne, D., & Soeters, J. (2010). Différenciation culturelle et stratégies de coopération en milieux militaires multinationaux. Cultures & Conflits, 77, 59-76.
Richardson, R., & Bosch, J. (1999). The Diversity Climate in the Dutch Armed Forces. In J. Soeters & J. van der Meulen (1999, Eds.). Managing Diversity in the Armed Forces. Tilburg: TUP, 127-155.
Richardson, R. (2010). Recruitment and Retention of Ethnic Cultural Minorities in the Dutch Armed Forces. In T. S.
International Journal of Social Science Studies Vol. 2, No. 3; 2014
49
Tresch & C. Leuprecht. (2010, Eds.). Europe Without Soldiers? Recruitment And Retention Across The Armed Forces Of Europe. Montreal, Kingston & London: McGill-Queen's University Press, 21-35.
Richardson, R., Op Den Buijs, T., & Van der Zee, K. (2011). Changes in Multicultural, Muslim and Acculturation attitudes in the Netherlands armed forces. International Journal of Intercultural Relations, 35, 580–591.
Quillian, L. (1995). Prejudice as a response to perceived group threat: Population composition and anti-immigrant and racial prejudice in Europe. American Sociological Review 60,4, 586–611.
Scoppio, G. (2009). Diversity best practices in military organizations in Canada, Australia, the United Kingdom, and the United States. Canadian military journal 9,3, 17-30.
Soeters, J. & Van der Meulen, J. (1999). Managing diversity in the armed forces. Experiences from nine countries. Tilburg University Press.
Soeters, J. & Van der Meulen, J. (2007, Eds.). Cultural diversity in the Armed Forces: An international comparison. London: Routledge.
Stephan, W.G., & Stephan, C.W. (1996). Predicting prejudice. International Journal of Intercultural relations, 20(3/4), 409-426.
Strabac, Z., & Listhaug, O. (2008). Anti-Muslim prejudice in Europe: A multilevel analysis of survey data from 30 countries. Social Science Research, 37, 268-286.
Taylor, M. D., & Moghaddam, F. M. (1994). Theories of Intergroup Relations: International Social Psychological Perspectives. Westport: Praeger Publishers.
Van de Vijver, F. J. R., & Phalet, K. (2004). Assesment in multicultural groups: The role of acculturation. Applied Psychology: An International Review, 53, 215-223.
Van der Meulen, J, & Soeters, J. (2007). Introduction. In J. Soeters & J. van der Meulen (Eds.) Cultural diversity in the Armed Forces: An international comparison, London: Routledge. 1-14.
Van Leeuwen, B., & Van Tinnevelt, R. (2005, Eds.). De Multiculturele Samenleving in Conflict: Interculturele spanningen, Multiculturalisme en Burgerschap. [The Multicultural Society: Intercultural tensions, Multiculturalism and Citizenship]. Leuven: Acco.
Verkuyten, M., Hagendoorn, L., & Masson, K. (1996). The Ethnic Hierarchy Among Majority and Minority Youth in The Netherlands. Journal of Applied Psychology, 26(12), 1104-1118.
Winslow, D., & Dunn, J. (2002). Women in the Canadian Forces: Between legal and social integration. Current Sociology 10, 5, 641–667.
Wolff, S. (2008). Ethnic minorities in Europe: the basic facts. Report prepared for a workshop at the European Centre for Minority Rights, Center for the International Crisis Management and Conflict Resolution, University of Nottingham, UK.
This work is licensed under a Creative Commons Attribution 3.0 License.
International Journal of Social Science Studies Vol. 2, No. 3; July 2014
ISSN 2324-8033 E-ISSN 2324-8041 Published by Redfame Publishing
URL: http://ijsss.redfame.com
50
Advancing Social Change by Synergizing Nonprofit Organizations with Common Missions
Syed Aftab Hayat Project Team: Syed Aftab Hayat, Nick Colicchio and David Laux Correspondence: Syed Aftab Hayat, School of Business, Maryville University, St. Louis, MO, USA. Received: February 19, 2014 Accepted: March 7, 2014 Available online: June 2, 2014 doi:10.11114/ijsss.v2i3.350 URL: http://dx.doi.org/10.11114/ijsss.v2i3.350 Abstract The aim of this study is to advance the efforts of nonprofit organizations in achieving their missions. In the form of a case study, the paper discusses how this can be achieved by bringing together the resources of different nonprofit and for profit organizations that serve a common cause/mission. An endeavor is made for helping an eye care charity organization by impacting it in both a positive and sustainable manner. The effort reaches to various organizations related to eye healthcare in order to seek out the common cause they all are working for. It is found out that the more closely related the missions of the organizations are the stronger and more effective will be the resultant synergies of their collaboration. Although the work of this study is preliminary however it serves as a good model for any nonprofit to reap benefit from and significantly enhance its effectiveness towards reaching its goals. The research hopes that it can fundamentally advance and impact how social work is being done on a global platform. Keywords: improving social work, synergizing nonprofits, common missions of nonprofit, not-for-profit collaboration, advancing social welfare, enhancing nonprofit effectiveness 1. Background and Motivation The study is being undertaken as part of a social change project initiated during an ethics course in the graduate studies of the team. The aim is to bring about a positive social change for a nonprofit organization. An important characteristic of this change is that it should have an impact and be sustainable so as to benefit it beyond the duration of this project. It is pertinent to mention that the success of any project is based upon the commitment and motivation of its team. One must stop and think about giving back to the community whose resources like roads, hospitals and education we use everyday for our personal needs. The opportunity provided by this project was a source behind the motivation and ethical intent of the group members who tried to reach out by helping a nonprofit working for the community. 2. Related Work Several collaborations techniques were reviewed to find ways to impact an organization. To have a high impact, all sectors of a society must be mobilized - government, businesses, nonprofits, and public (Grant, Crutchfield, 2007). Collaboration can be attained through varied models using cyber strategies (Brainard, Siplon, 2004), overhead minimization (Mitchell 2013), operational reviews (Reider, 2001), improving grant seeking (Zweibel, Golden, 2007), dismantling barriers between organizations (Nambisan, 2009) or capping fostering public-private partnerships (Grubbs, 2000). Successful examples of partnerships among nonprofits serving the society include providing homes for the homeless using networking (Wei-Skillem, Marciano, 2008), child care and education using interagency variations (Sally, Sowa, Sandfort, 2006), prevention of child maltreatment using administrative and frontline operations (Elizabeth, 1997), religion using people of different faiths (Rogers, 2009). Concepts from outside the nonprofit realm have used multi agent systems (Wooldridge, 2009) to improve collaboration in foraging (Hayat, Niazi, 2005) and situation management (Kovalenko, Velev, 2012). InnoCentive is mentioned by (Nambisan, 2009) as an innovation intermediary that brokers relationships between those with questions and those with answers. Nambisan further illustrates an example of how InnoCentive reaches out to 160,000 individuals worldwide to solve a question for a foundation which it could not have solved on its own. This case demonstrates the power of collaboration and its significance in improving the effectiveness of organizations. The virtually untapped potential of networks in the philanthropic sector paints a hopeful picture of what the sector has the power to achieve (Wei-Skillem, Silver, 2013). This paper uses some of the concepts from these techniques and proposes
International Journal of Social Science Studies Vol. 2, No. 3; 2014
51
a novel way to rapidly impact a nonprofit. 3. Introduction 3.1 Selecting and Formulating a Strategy for the Collaborating Partner The first thing requiring collaboration is to identify a target peer to seek help from. These peers can be classified into two broad groups. 1) For-Profit organizations 2) Nonprofit organizations (including government and foundations) 3.1.1 For-Profit Organizations The goal of the for-profit organizations in general is to maximize shareholder value of the investors and be at least profitable. Two ways were found most effective in seeking help from such organizations a) using their mission statement b) using their community service obligations. Every organization whether profit or nonprofit has a mission statement. The mission statement rises above the profitability goal of the organization and generally addresses a need in the industry or forming a positioning strategy within its industry. Management of for-profit companies should be more willing to help if an entity seeking their help can outline to them how it is related to the mission of the company? Once a nonprofit can make the management of for-profit company understand that their contribution of helping the nonprofit is a part of the company’s mission statement then it gets much easier to draw them to help. Similarly many companies are required to give back to their communities under state and county regulations. They earn credits and good will which may help them in expansion and projecting a good image for the company. It is only natural for a company to first help its local community or target clientele before reaching out to other sector of the societies. The human resource at the for-profit company is primarily engaged in making value for the company and hence these companies find it easy to help others through financial means. Although such relationships are difficult to foster but once established, they can have significant financial impact. Even if not under any obligations many companies are becoming more socially aware and include community service programs as part of their operations. Hence it is very easy to reach to companies that are working in a related domain or with similar missions. 3.1.2 Nonprofit Organizations These organizations are mostly running on funds and grants and have limited financial resources. The nonprofit status of the organization represents its dedication in achieving its mission/cause. It has already defined its mission to carry out the requisite objectives and doesn’t need anything in return to help someone falling within its domain. The existence of most nonprofits is based on the concept of helping somebody. Although the application area in which these organizations work is sometimes very narrow but nonprofits work for a greater cause and are very motivated to help. Approaching through the ‘common mission statement’ technique discussed in the previous section can be used to seek help from such organizations as well. Most nonprofits will only have the service or item it is working for to offer to others, hence relationship with such organizations can be made fruitful based on the concept of ‘barter’. That is to identify nonprofits that can mutually benefit from the services or products and both have something they can give to each other. 4. Methodology The selection of the nonprofit for the choice of this case study played an important role in the success of the social change project. Selection was based on two main criterions: 1) There should either be a prevailing need at the nonprofit that the group should address or propose suggestions to
the nonprofit that should positively impact it 2) The task goals should be kept realistic. Focus of need identification for the nonprofit was kept on improving areas
for which the team could add value through its skills, knowledge or technical abilities rather relying on capital and financial means.
Organizations were reviewed by searching through online and published directories and listings. The organizations were contacted through phone calls and emails. After getting in touch with various nonprofits, the group finally came across Eye Care Charity of Mid America (ECCOMA). Upon learning that ECCOMA had four Core Assistance Programs that touched domestic and international people in need, the utilitarianism approach (Dennis, 2012) was adopted in which the group believed that helping this particular non for profit would benefit the greatest number of people and in theory knew that this was the best decision in lieu of available options. This formed the basis of the ethical and social motivation behind the selection criterion. Also, from the preliminary meetings with the stakeholders at ECCOMA, the team figured out that they just might have the requisite skill sets to be able to fulfill the needs for this particular
International Journal of Social Science Studies Vol. 2, No. 3; 2014
52
organization and selected ECCOMA fort this social change. Other organizations that were narrowed down but a match could not be made during the search process were dealing with physiological care and Sudden Infant Death Syndrome (Hogberg & Bergstorm, 2000). 4.1 Understanding the Nonprofit and Its Mission It is important to develop an understanding of the work the nonprofit is doing before identifying potential improvement areas. An excerpt from the mission statement of ECCOMA sets a good outline of its work “Eye Care Charity of Mid-America is dedicated to enhancing quality of life by providing vision improvement and access to a bright future in our society”. They thrive to accomplish their mission on a local and international level. They are dedicated to improve access to vision care through eye care services and eye health education through Core Assistance Programs such as the Care-mobile, World Missions, Pro-bono Surgeries and local Clinics. The largest program they offered was the “Care-Mobile” (Munz, 2013), whose focus area is the 14 counties throughout the metro St Louis region. The Care Mobile is a fully equipped optometric office which includes an optical lab where workers can produce eyeglasses on-the spot. ECCOMA serves approximately 20 children per day and over 2100 annually (“Vision Program”, 2014). Each child receives a comprehensive eye exam and if needed a new pair of eyeglasses with case and eye health education. Another powerful assistance they offer is Pro-bono surgeries. These surgeries include Lasik and retinal detachment. Having established an understanding the work of ECCOMA, requirements were gathered by conducting meetings with the stakeholders and employees at ECCOMA and listening to their problems. Potential improvement areas were found using gap analysis (Mikoluk, 2013). The plan included decreasing expenses, enhancing effectiveness and increasing exposure by identifying and forming strategic partnerships with all those willing to help ECCOMA and its mission. This resulted in several successful accomplishments which we discuss in the next section. 5. Impacting the Nonprofit Sustainably 5.1 Improving Material Sourcing Need: ECCOMA identified the need of not having eye glass wipe cloths to give to children with a new pair of subscription glasses. Effort: Local eye care goods distributors were approached along with creative design studios (logo design companies) who were involved in doing custom printing of company logos on varying products. These logo design companies would be able to print the logo of ECCOMA on the wipe cloths as well. Impact: The effort resulted in over $1,000 of donated products of wipe cloths from Amcon Labs-an eye care supply center in St. Louis. ECCOMA now has better access to material and service which will ultimately help them financially and their patients/clients physically. Sustainability: A relationship has been developed between the organizations. They can now build upon it and improve it in future as well. 5.2 Decreasing Maintenance Costs of Care Mobile Need: The Care-Mobile had no existing maintenance being carried out. As ECCOMA had mostly volunteers working for it, the current person incharge of the vehicle could only put enough hours to cover the driving requirements of the Care-Mobile was not prepared to take on the additional job of fully maintaining the vehicle. Effort: The vehicle was recently purchased and currently did not have much maintenance requirement. The project team realizing that maintenance will be a cause of concern in the future as the vehicle got older, looked for a sustainable ways to provision for this need. Impact: A partnership with a local truck center was established. The local truck center was willing to help ECCOMA as part of its welfare contribution. The collaboration resulted in prevailing a bi-annual maintenance on the Care-Mobile at no cost. Measuring the old expenditure it was estimated that this effort would equate to roughly $600 in savings per year Sustainability: This service has no time duration and can be enjoyed by ECCOMA in the coming years as well. 5.3 Developing Strategic Partnership for Pro-Bono Surgeries Need: During the Care-Mobile events when eye exams would take place at different schools, children are seen by volunteering optometrists on board the Care-Mobile who perform an eye exam before they are prescribed or given any eye glasses. In some of these cases, the children might be suffering from different eye diseases which are causing the eye sight deficiency which cannot be remedied through prescription eye glasses alone. These children might need to be
International Journal of Social Science Studies Vol. 2, No. 3; 2014
53
referred to ophthalmologists for advanced diagnostics or surgeries. Effort: Following clinics and associations were reached out to help ECCOMA in providing pro-bono surgeries for patients that required additional care. Volunteers in Medicine (VIM), St. Louis. A nonprofit health clinic approached through Mr. Abdul Wadood Peppose Eye Vision Institute, St. Louis. An eye clinic approached through Dr. Mujtaba Qazi Wildwood Vision Specialists (WVS), St. Louis. An eye clinic approached through Dr. Christy Hayes Impact: VIM: VIM provides for healthcare primarily to the uninsured between the ages of 18 and 60 who are not generally covered by schemes under the US federal government like Medicaid and Medicare. On the other hand ECCOMA although doesn’t deny eye glasses to anybody coming to them but generally caters for children under the age of 18 years old. Due to this stark difference in the target patient profiles that both addressed, no immediate arrangement could be developed that would be mutually beneficial to both the companies. Peppose Eye Vision Institute: ECCOMA would provide potential nurse candidate through the resume database that it maintained. It will also send surgery candidates that it comes across to Peppose who can look at those patients during the time set aside for pro-bono surgeries. Peppose through its affiliates will provide help with clinical opportunities for medical students and volunteering optometrists during care-mobile events. ECCOMA will look into catering requests of mobile eye clinics in schools identified by Peppose. WVS: Eye doctors here were committed to providing social-welfare to the community and look forward to helping patients being referred by ECCOMA who required advanced eye care. Sustainability: Through meetings and communications facilitated by the project team, important point of contacts were established between the organizations and ECCOMA. Although nothing substantial could be achieved with VIM but all the organizations were very excited over the preliminary meetings and hoped to look into ways of developing long term relationships in the future. 5.4 Increasing Social Media Presence (Print and Electronic) Need: The welfare work of ECCOMA needed to be spread out and projected so that it could gain critical media exposure needed to develop a good image and spread the cause to those who needed it in the community. Effort: The team gained key exposure for ECCOMA in the Optometrist community by placing ECCOMA in the St Louis Optometrist Society (SLOS) newsletter. Generic templates were developed to serve the current requirements of the newsletter, they can also be improved to incorporate future changes as well. Creation of a LinkedIn account and placement on the Wildwood Vision website will add to the media reach of ECCOMA. Furthermore, talks were initiated with a potential resource for spreading ECCOMA’s mission to KSDK (a local news channel) for potential focus in upcoming months. Volunteer appreciation certificates templates were also developed individually by the group as well. Impact: The enhanced media exposure will continue to prevail with ECCOMA having a space in each issue of St. Louis Optometrist Society newsletter. This will also increase ECCOMA outreach to potential donors as all nonprofits can benefit from external funding and donations. Sustainability: Extended media outreach will give access to new avenues the organization did not have access to before. The effort of developing generic template and certificates, acknowledges volunteers, which will be a continuous source of motivation and inspiration. 5.5 Conducting a Green Study for the Care-Mobile Need: The Care-Mobile currently uses diesel for its fuel but has the provision to run on bio-diesel. It was decided to conduct a ‘going green’ study by doing a cost-benefit analysis for using bio-diesel fuel. Effort: Rates were taken of different types of bio-diesel provided by MFO Oil, a company dealing in bio-diesel fuel for St. Louis market. Cost comparisons along with direct bio-diesel delivery options were reviewed. Impact: It was found that bio-diesel fuel becomes very viscous in winters owing to its properties and requires increases maintenance on the vehicle. Along with that the cost of shifting to bio-diesel fuel was slightly higher than conventional fuel. It was also found out that for the amount of consumption, delivery of bio-diesel fuel to the location of the truck was not feasible. Sustainability: It was not recommended to shift the Care-Mobile bio-diesel. The green initiative would only be sustainable if it found an adequate sponsor in the form of a supply company that could benefit from providing sales to a nonprofit and could somehow translate that into a financial benefit by subsidizing the cost of bio-diesel fuel supplied to ECCOMA.
International Journal of Social Science Studies Vol. 2, No. 3; 2014
54
5.6 Improvement in Information Technology (IT) Architecture Need: The Care-Mobile had the patient database and the software required to access the records. Each time patient information was required, someone from the ECCOMA staff would have to physically go the van and look up the information there. Effort: IT architecture was improved by suggesting fixes to the Local Area Network (LAN) ports on board the truck. Also diagnostics were performed on the software to see the best method of accessing it and it was found out that connecting the Care-Mobile with a wireless internet connection would be the best option. This will enable them to access information remotely without physically going to the van. During the project informational accuracy of ECCOMA website was enhanced by pointing out key flaws such as typographical errors and grammar mistakes. Impact: This resulted in reduced load on staffing and increased office productivity. The effort would further enable optometrists on board the Care-Mobile to be able to play online instructional and eye exercise videos for the patients as well. Sustainability: The improvements were made to the architecture and will last beyond the duration of the project time. 5.7 Other Efforts and Limitations Other efforts included assistance in providing grant information from Laclede Gas Company the local gas supply company for ECCOMA. Some attempts were not successful as well. Due to lack of time reaching out to the school board at University of Missouri St. Louis (UMSL) for providing optometrists could not be fully pursued. Volunteering optometrists to help on board the Care-Mobile during its operational days visiting and making eye glasses was a key need of ECCOMA which went unmet. Providing help in this matter remains a key area for future work with ECCOMA. 6. Conclusion Analyzing the results of this study for the nonprofit, it was found that, more closely the related the missions of the organizations are, stronger will be the collaboration between them. This can further supplement towards development of effective and sustainable relationships between them. Great benefits can be reaped through aligning and bringing together both non-for-profit and for profit organizations in order to serve the community by adhering more closely towards their respective missions. The exercise proved beneficial in mainly achieving three things for ECCOMA- decreased expenses, increased exposure and enhanced effectiveness. This was demonstrated successfully by formation of key strategic partnerships along with individual efforts towards reaching out to organizations with the methodology of common missions proposed in this paper. The short duration of this project suggests that this model can be used to improve a nonprofit’s effectiveness when rapid results are required. This might by suitable in war like or hostile environments where time might be a constraint due to safety or other reasons. This study serves as a platform for much greater synergies to be accomplished by advancing social welfare initiatives at a global level. A Personal Note from the Project Team There is always an unmet need. For a child undergoing eye treatment, there is still the need to get a pair of eye glasses (Diana, 2008). As a child or young adult who is generally in good health, it is far too easy to take the gift of sight for granted. At one point in our lives we have all be exposed to an individual in desperate need for help. During these times, we may have good intentions in our hearts as well as empathy for those before us. But more often than not, we pass up the opportunity to help and move on with our daily lives with little to no regret. ECCOMA had their hands full in trying to help everyone. Unfortunately, they lacked the resources to really be firing on all pistons, which, also provided an opportunity to help us identify its need areas. The thought kept su us motivated and transformed the individuals of the team into a functioning group. We were met with different obstacles throughout this project, our largest being time. After our initial meeting, we divided our ideas amongst the group based upon our individual knowledge and expertise. It did not take long for disappointment to set in when all of our ideas fell flat and it seemed like we were not making any progress. Despite our struggles and challenges, everything started to come together near the end. During the past several weeks we have been given the opportunity to give back to the community. The pride we have felt as a group and individuals during this endeavor has far exceeded any of our expectations. The amazing drive to help others became intoxicating and made us want to become better people. Acknowledgement With the grace of God, the author would like to thank his father and mother and beloved family for their continuous support and motivation. The project team found some great friends amongst them while working for this cause.
International Journal of Social Science Studies Vol. 2, No. 3; 2014
55
References Brainard, L. A., & Siplon, P. D. (2004). Toward nonprofit organization reform in the voluntary spirit: Lessons from the
internet. Nonprofit and Voluntary Sector Quarterly, 33(3), 435-457. http://dx.doi.org/10.1177/0899764004266021 Dennis, C. (2012). Business Ethics: How to Design and Manage Ethical Organizations, Wiley. Diana, A. (2008). We had laser eye surgery but still need our specs. The reality of the permanent sight cure.
http://www.dailymail.co.uk/health/article-1051575/We-laser-eye-surgery-need-specs--The-reality-permanent-sight-cure.html (accessed on 20 Jan, 2014)
Elizabeth, A., & Mulroy, S. S. (1997). Nonprofit organizations and innovations: A model of neighborhood-based collaboration to prevent child maltreatment. Social Work, 42(5), 515-24. http://dx.doi.org/10.1093/sw/42.5.515
Grant, H. M., & Crutchfield, L. R. (2007, Fall). CREATING HIGH-IMPACT NONPROFITS. Stanford Social Innovation Review, 5, 32-41
Grubbs, J. W. (2000). Can agencies work together? collaboration in public and nonprofit organizations. Public Administration Review, 60(3), 275-280. http://dx.doi.org/10.1111/0033-3352.00087
Hayat, S. A. & Niazi, M. (2005), Multi-agent foraging – taking a step further Q-learning with search. Proceedings of IEEE international conference on emerging technologies. (ICET05) pp. 215-220, September 2005, Islamabad, Pakistan.
Hogberg, U., & Bergstrom, E. (2000). Suffocated prone: The iatrogenic tragedy of SIDS. American Journal of Public Health, 90(4), 527-31. http://dx.doi.org/10.2105/AJPH.90.4.527
Kovalenko, Oleksiy E., Velev, & Dimiter G. (2012). Integration of Information Services in Agent-Oriented Situation Management System. International Conference on Applicatoin of Information and Communication Techonology and Statistics in Economoy and Education (ICAICTSEE–2012) pp 132, October 5-6th 2012, UNWE, Sofia, Bulgaria.
Mikoluk, K. (2013). Gap Analysis Template: The 3 Key Elements of Effective Gap Analysis. https://www.udemy.com/blog/gap-analysis-template/ (accessed on 25 Jul, 2013)
Mitchell, G. E. (2013). The construct of organizational effectiveness: Perspectives from leaders of international nonprofits in the united states. Nonprofit and Voluntary Sector Quarterly, 42(2), 324. http://dx.doi.org/10.1177/0899764011434589
Munz, M. (2013). Students grateful for eyeglasses from area's first mobile vision clinic. http://www.stltoday.com/lifestyles/health-med-fit/health/health-matters/students-grateful-for-eyeglasses-from-area-s-first-mobile-vision/article_3ed49aba-eb9e-5bdf-82d3-f0000353abf5.html (accessed on 5 Mar, 2014)
Nambisan, S. (2009, Summer). Platforms for collaboration. Stanford Social Innovation Review, 7, 44-49. Reider, R (2001). Improving the economy, efficiency, and effectiveness of not-for profits; conducting operational
reviews. Reference and Research Book News, 16(3) Retrieved from http://search.proquest.com/docview/199580250?accountid=40561
Rogers, R. K. (2009). Community collaboration: Practices of effective collaboration as reported by three urban faith-based social service programs. Social Work and Christianity, 36(3), 326-345
Sally, C. S., Sowa, J. E., & Sandfort, J. (2006). The impact of nonprofit collaboration in early child care and education on management and program outcomes. Public Administration Review, 66(3), 412. http://dx.doi.org/10.1111/j.1540-6210.2006.00598.x
Stripling, B. (2003). Working across boundaries: Making collaboration work in government and nonprofit organizations. PM.Public Management, 85(6), 28.
Vision Program-Eye Care Charity of Mid America (ECCOMA). http://eccoma.org/eccoma-vision-programs/(accessed on 5 Mar, 2014)
Wei-Skillern, J., & Marciano, S. (2008, Spring). The NETWORKED NONPROFIT. Stanford Social Innovation Review, 6, 38-43
Wei-Skillern, J., & Silver, N., PhD. (2013). Four network principles for collaboration success. The Foundation Review, 5(1), 121-129, 12. http://dx.doi.org/10.4087/FOUNDATIONREVIEW-D-12-00018.1
Wooldridge, M. (2009). An Introduction to Multi Agent Systems. ISBN-13: 978-0470519462. Zweibel, N. R., & Golden, R. L. (2007). What foundations and nonprofits can do to foster productive relationships.
Generations, 31(2), 41-46. Retrieved from http://search.proquest.com/docview/212229477?accountid=40561
This work is licensed under a Creative Commons Attribution 3.0 License.

International Journal of Social Science Studies Vol. 2, No. 3; July 2014
ISSN 2324-8033 E-ISSN 2324-8041 Published by Redfame Publishing
URL: http://ijsss.redfame.com
56
Openness, Economic Development, and the Environment in Post-Reform China: A Model with Empirical Analysis
Yanqing Jiang School of Economics and Finance, Shanghai International Studies University, Shanghai, P. R. China Correspondence: Yanqing Jiang, School of Economics and Finance, Shanghai International Studies University, No. 1550 Wenxiang Rd., Shanghai 201620, P. R. China Received: May 2, 2014 Accepted: May 19, 2014 Available online: June 2, 2014 doi:10.11114/ijsss.v2i3.403 URL: http://dx.doi.org/10.11114/ijsss.v2i3.403 Abstract In this study, based on the Environmental Kuznets Curve (EKC) framework, we empirically examine the effects of trade openness and the level of economic development on pollution emission across the Chinese provinces. Our regression analysis shows that increasing trade openness contributes to higher pollution emission, where the effect of the former may be realized through its impacts on total factor productivity and the industry mix. Our analysis also shows that with the continuous growth of output and per capita output, pollution emission and pollution emission intensity both first rise and then fall, which gives support to the EKC hypothesis. Keywords: openness, environment, pollution emission, development, China 1. Introduction Thanks to the market-oriented reforms initiated in the late 1970s, China has achieved spectacular growth in the past several decades, and its economic structure has experienced great transformation. In the meantime, the whole country has also gradually opened up to foreign trade and foreign direct investment, transforming itself from a virtually completely closed economy into a major trading nation and the largest developing-country destination for foreign direct investment in the world. The ratio of foreign trade to GDP quadrupled from 9 percent in 1980 to 36 percent in 2000, over a period of twenty years. However, it is argued that the rapid processes of industrial development and opening up have been relying heavily on increasing inputs of environmental resources. Unsustainable environmental practices are posing serious threats to China’s forests, water, air, biodiversity, and energy and food supplies (Co, Kong and Lin, 2008). In 2007, for example, China replaced the United States and became the largest greenhouse gas emitter in the world. Direct damages from environmental pollution have stayed as high as 8 to 10 percent of total annual GDP of China (The Economist, 2004). Environmental pollution accompanying China’s rapid economic growth, opening up and development has become a serious concern that calls for the rethinking of government policies (Zhang, 2012). The linkages between foreign trade, economic development and the environment have been widely discussed in the literature. They have been mostly investigated within the framework of the Environmental Kuznets Curve (EKC hereinafter), which postulates an inverted U-shaped relationship between environmental pollution and per capita income (Grossman and Krueger, 1993, 1995). In the EKC framework, increased incomes are associated with an increase in pollution in poor economies but a decline in pollution in rich economies. Foreign trade may affect pollution outcomes through a variety of channels. One channel is the scale effect considered harmful to the environment, which describes the situation where the expansion of domestic production driven by increasing trade openness leads to more environmental pollution. Another channel is the technique effect considered conducive to the environment: domestic firms could enjoy the spillovers introduced by foreign trade and have access to more advanced technologies that are less pollutive. Through this channel, trade openness could improve the environmental quality. A third channel is the composition effect, which is related to structural changes that occur in the economy: foreign trade shapes the pattern of production specialization between the country and the rest of the world, and therefore, by driving the reallocation of resources across different domestic sectors, affects the overall pollution intensity of the various production activities within the country. Still one more channel is the income channel: along with the income gains allowed by foreign trade, the country may desire higher environmental standards, more stringent
International Journal of Social Science Studies Vol. 2, No. 3; 2014
57
regulations, and better enforcement by the government, which are all beneficial to the environment. Early studies within the EKC framework focused on the effect of economic development on environmental degradation (Grossman and Krueger, 1993, 1995; Selden and Song, 1994; Vincent, 1997; Gale and Mendez, 1998). However, the relationship between income growth and the environment may vary with the source of income growth, as different types of economic activities have different pollution intensities (Abdulai and Ramcke, 2013). In other words, the pollution consequences of economic growth depend on the underlying sources of growth (Antweiler, Copeland and Taylor, 2001). Further, the simplest EKC framework does not account for the effects of foreign trade on the environment. In fact, trade patterns may partially explain reductions in pollution in high-income countries and meanwhile increases in pollution in low-income countries. Specifically, the pollution haven hypothesis postulates that disparities in the stringency of environmental regulations between developed and developing countries will generally lead to increased pollution-intensive production in the developing countries (Cole, 2004). The factor endowment hypothesis, in comparison, argues that determined by trade and specialization patterns, countries that are relatively abundant in factors used intensively in polluting industries will generate more pollution as trade barriers are lifted (Mani and Wheeler, 1998). We are interested in uncovering the environmental implications of China’s processes of opening up and economic development. In this paper, therefore, we empirically examine the effects of trade openness and the level of development on pollution emission across the Chinese provinces. Environmental resources are unpaid factors of production in an unregulated market, as the cost of pollution is not internalized. Pollution emission thus can be viewed as an additional factor of production (besides labor, capital, etc.) into the aggregate production function (Tzouvelekas, Vouvaki and Xepapadeas, 2006). To examine the effects of foreign trade and economic development on pollution emission in China is effectively to see whether China is contributing a substantial amount of environmental resources to the production of its total economic output. Under a green Solow growth framework (see, for example, Brock and Taylor, 2004), environmentally sustainable development in China requires that while technological progress in goods production is necessary to generate per capita income growth in the Chinese regions, technological progress in these regions in terms of emission reduction must exceed growth in output in order for pollution to fall and the environment to improve (Jiang, 2013). This paper is organized as follows. In Section 2, we present our basic model. In Section 3, we discuss issues related to the sample, data and variables. In Section 4, we present and discuss our regression results. Section 5 extends our analysis to incorporate the possibility of strategic interaction among provinces into our regression model. Finally, Section 6 concludes. 2. The Basic Model To consider the theoretical model, we assume that aggregate output of a given single-sector economy at time t is linked its various production factors by an aggregate production function of the form
)](),(),(),([)( tAtNtLtKFtY � (1) where K is the level of physical capital stock, L is the amount of human labor, N is the quantity of natural resources used in the production process, and A stands for the level of technology or total factor productivity. The simple idea behind our theoretical model is that the production process itself generates pollution emission, which means that the amount of pollution emitted is not directly related to the level of aggregate output, but to the quantities of the various production factors (including total factor productivity) employed in the production process. Therefore, the amount of pollution emitted can be treated as a function of the various arguments in (1). Formally, for this given economy, we can write
)](),(),(),([)( tAtNtLtKtE �� (2) where )(tE stands for pollution emitted at time t . Since the level of total factor productivity )(tA is not directly observable, we can write it as
)](),(),(),([)( tNtLtKtYtA �� (3) which is implicitly determined by the functional relationship in (1). Plugging (3) into (2) yields
)]}(),(),(),([),(),(),({)( tNtLtKtYtNtLtKtE ��� (4) )](),(),(),([~ tNtLtKtYE�
where the second equality redefines the function. Equation (4) shows that pollution emission )(tE can be written as a function of four arguments, which are output )(tY , physical capital )(tK , labor )(tL and natural resources )(tN . It is now straightforward to consider the situation of an economy with m different sectors. Pollution emission of the jth sector (j = 1, 2, …, m) is determined by
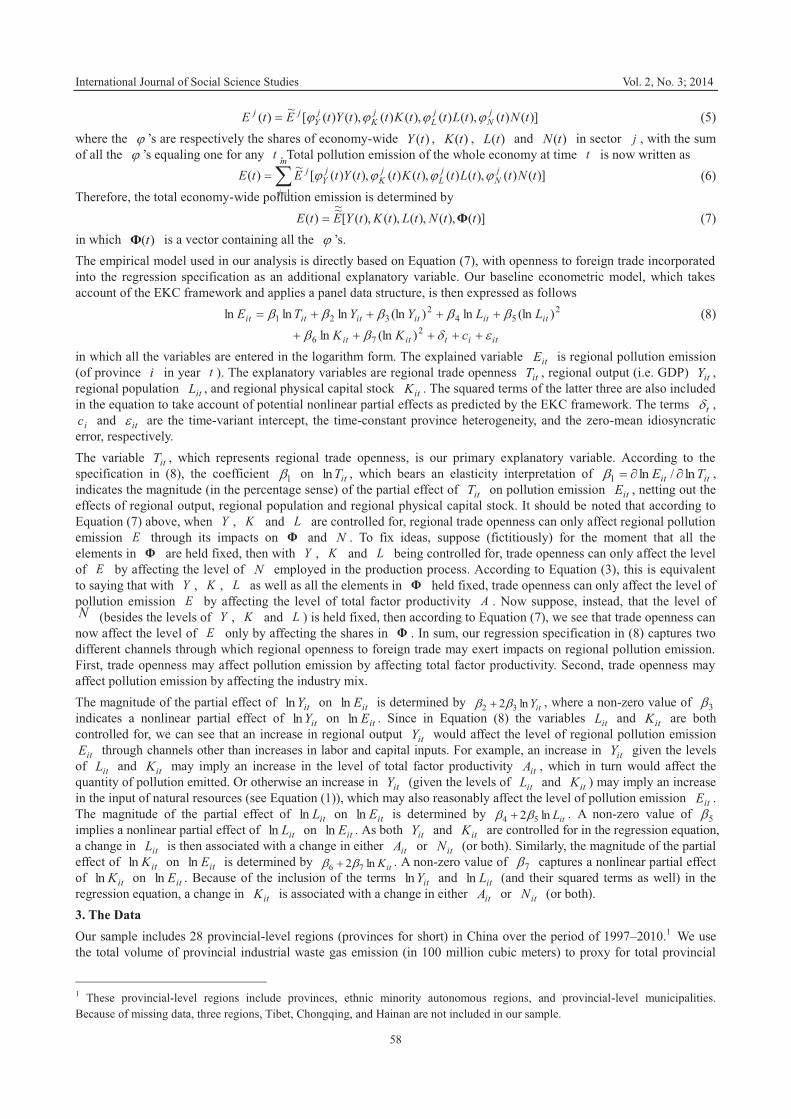
International Journal of Social Science Studies Vol. 2, No. 3; 2014
58
)]()(),()(),()(),()([~)( tNttLttKttYtEtE jN
jL
jK
jY
jj ����� (5) where the � ’s are respectively the shares of economy-wide )(tY , )(tK , )(tL and )(tN in sector j , with the sum of all the � ’s equaling one for any t . Total pollution emission of the whole economy at time t is now written as
��
�m
j
jN
jL
jK
jY
j tNttLttKttYtEtE1
)]()(),()(),()(),()([~)( ���� (6) Therefore, the total economy-wide pollution emission is determined by
)](),(),(),(),([~~)( ttNtLtKtYEtE Φ� (7)
in which )(tΦ is a vector containing all the � ’s. The empirical model used in our analysis is directly based on Equation (7), with openness to foreign trade incorporated into the regression specification as an additional explanatory variable. Our baseline econometric model, which takes account of the EKC framework and applies a panel data structure, is then expressed as follows
254
2321 )(lnln)(lnlnlnln itititititit LLYYTE ����� ����� (8)
itititit cKK ��� ����� 276 )(lnln
in which all the variables are entered in the logarithm form. The explained variable itE is regional pollution emission (of province i in year t ). The explanatory variables are regional trade openness itT , regional output (i.e. GDP) itY , regional population itL , and regional physical capital stock itK . The squared terms of the latter three are also included in the equation to take account of potential nonlinear partial effects as predicted by the EKC framework. The terms t ,
ic and it� are the time-variant intercept, the time-constant province heterogeneity, and the zero-mean idiosyncratic error, respectively. The variable itT , which represents regional trade openness, is our primary explanatory variable. According to the specification in (8), the coefficient 1� on itTln , which bears an elasticity interpretation of itit TE ln/ln1 �� , indicates the magnitude (in the percentage sense) of the partial effect of itT on pollution emission itE , netting out the effects of regional output, regional population and regional physical capital stock. It should be noted that according to Equation (7) above, when Y , K and L are controlled for, regional trade openness can only affect regional pollution emission E through its impacts on Φ and N . To fix ideas, suppose (fictitiously) for the moment that all the elements in Φ are held fixed, then with Y , K and L being controlled for, trade openness can only affect the level of E by affecting the level of N employed in the production process. According to Equation (3), this is equivalent to saying that with Y , K , L as well as all the elements in Φ held fixed, trade openness can only affect the level of pollution emission E by affecting the level of total factor productivity A . Now suppose, instead, that the level of N (besides the levels of Y , K and L ) is held fixed, then according to Equation (7), we see that trade openness can now affect the level of E only by affecting the shares in Φ . In sum, our regression specification in (8) captures two different channels through which regional openness to foreign trade may exert impacts on regional pollution emission. First, trade openness may affect pollution emission by affecting total factor productivity. Second, trade openness may affect pollution emission by affecting the industry mix. The magnitude of the partial effect of itYln on itEln is determined by itYln2 32 �� � , where a non-zero value of 3� indicates a nonlinear partial effect of itYln on itEln . Since in Equation (8) the variables itL and itK are both controlled for, we can see that an increase in regional output itY would affect the level of regional pollution emission
itE through channels other than increases in labor and capital inputs. For example, an increase in itY given the levels of itL and itK may imply an increase in the level of total factor productivity itA , which in turn would affect the quantity of pollution emitted. Or otherwise an increase in itY (given the levels of itL and itK ) may imply an increase in the input of natural resources (see Equation (1)), which may also reasonably affect the level of pollution emission itE . The magnitude of the partial effect of itLln on itEln is determined by itLln2 54 �� � . A non-zero value of 5� implies a nonlinear partial effect of itLln on itEln . As both itY and itK are controlled for in the regression equation, a change in itL is then associated with a change in either itA or itN (or both). Similarly, the magnitude of the partial effect of itKln on itEln is determined by itKln2 76 �� � . A non-zero value of 7� captures a nonlinear partial effect of itKln on itEln . Because of the inclusion of the terms itYln and itLln (and their squared terms as well) in the regression equation, a change in itK is associated with a change in either itA or itN (or both). 3. The Data Our sample includes 28 provincial-level regions (provinces for short) in China over the period of 1997–2010.1 We use the total volume of provincial industrial waste gas emission (in 100 million cubic meters) to proxy for total provincial
1 These provincial-level regions include provinces, ethnic minority autonomous regions, and provincial-level municipalities. Because of missing data, three regions, Tibet, Chongqing, and Hainan are not included in our sample.

International Journal of Social Science Studies Vol. 2, No. 3; 2014
59
pollution emission itE of a Chinese province (province i ) in any given year (year t ). Cross-sectional data on provincial industrial waste gas emission for each year in 1997–2010 are available from the Chinese Statistical Yearbook (the issues of 1997–2011) so that the panel of data on itE can be obtained. Cross sections of provincial population for each year in 1997–2010 can also be found in the Yearbook (1997–2011) so that the panel of data on itL can be directly obtained. Cross sections of nominal Gross Regional Product (GRP) and GRP indices for each year in 1997–2010 are also available from the Yearbook (1997–2011), so that the panel of data on real provincial GRP can be calculated for itY . However, the various issues of the Chinese Statistical Yearbook do not directly record data on provincial physical capital stock itK for the Chinese provinces. Therefore, to calculate the levels of provincial physical capital stock, we opt for the procedure of Zhang (2008), who applies a perpetual inventory method (PIM) to calculate physical capital stock data for the Chinese provinces. The PIM procedure of Zhang (2008) leads to an annual rate of depreciation for fixed capital formation of 9.6% across all the provinces over the period 1952–2004. In our current analysis, by following the same procedure, we therefore assume that the annual depreciation rates of physical capital are uniformly 9.6% for all the 28 provinces throughout our sample period 1997–2010.2 The trade openness variable itT is constructed as the ratio of provincial foreign trade (exports plus imports) to provincial GRP, where data on the values of provincial exports and imports are also available from the Chinese Statistical Yearbook (the issues of 1997–2011). In a broader sense, regional openness to foreign trade can be understood as a proxy for the general level of regional openness to overall international economic activities. In fact, it may be more interesting to investigate the effect of regional openness to overall international economic activities (rather than openness to foreign trade in the narrow sense) on regional pollution emission. However, using trade openness to proxy for openness to overall international economic activities may give rise to a problem. A large province (in terms of output or population) may tend to have relatively less foreign trade, as there is a larger scope for trade within the province. In addition, a rich province (one with a high level of per capita output) may be biased toward having a lower level of trade-to-output ratio, because as the province develops, the share of the service sector tends to increase while the service sector is largely non-tradable (Low, Olarreaga and Suarez, 1998). One way to tackle this problem is to adjust the trade openness variable (i.e. the trade-to-output ratio) so as to take account of disparities in region size and the level of regional development. We can consider a regression such as the following one, in which we regress the regional trade-to-output ratio (in the log form) on a set of variables measuring the region size (in terms of both output and population) and the level of regional development
243
2210 )(lnln)(lnlnln ititititit LLYYT ����� ����� (9)
ititititit vLYLY ��� 265 )]/[ln()/ln( ��
ititit LYY ln)(lnln 32
210 ���� ���� itititit vLYL � �� )ln(ln)(ln 52
4 �� where itv is the error term of this regression, and 511 ��� �� , 622 ��� �� , 533 ��� �� , 644 ��� �� and
65 2�� �� . We run a pooled ordinary least squares (OLS) regression according to (9) and construct the corresponding fitted value, denoted itT̂ , such that
)]ln(lnˆ)(lnˆlnˆ)(lnˆlnˆˆexp[ˆ5
243
2210 ititititititit LYLLYYT ������ ������ (10)
where the �̂ ’s are the values of the intercept and slopes in (9) estimated from our pooled OLS regression. The fitted value itT̂ , calculated according to (10), indicates what the “normal” or average degree of openness of a Chinese province would have, given the level of regional output and the size of regional population. Based on this idea, the adjusted regional openness variable can be constructed as
ititit TTT ˆ/��� (11) Or equivalently
itititit vTTT ˆˆlnlnln ����� (12) which shows that the adjusted regional openness variable itT��ln (in the log form) is actually the residual itv̂ obtained from our pooled OLS regression based on (9). We should note that our baseline regression specification in (8) already has itYln , itLln and their squared terms
2)(ln itY and 2)(ln itL as independent variables: the only independent variable that appears in (9) but not in (8) is the interaction term )ln(ln itit LY . We can now expand Equation (8) to include this interaction term as an additional explanatory variable
2 See Zhang (2008) for more details.
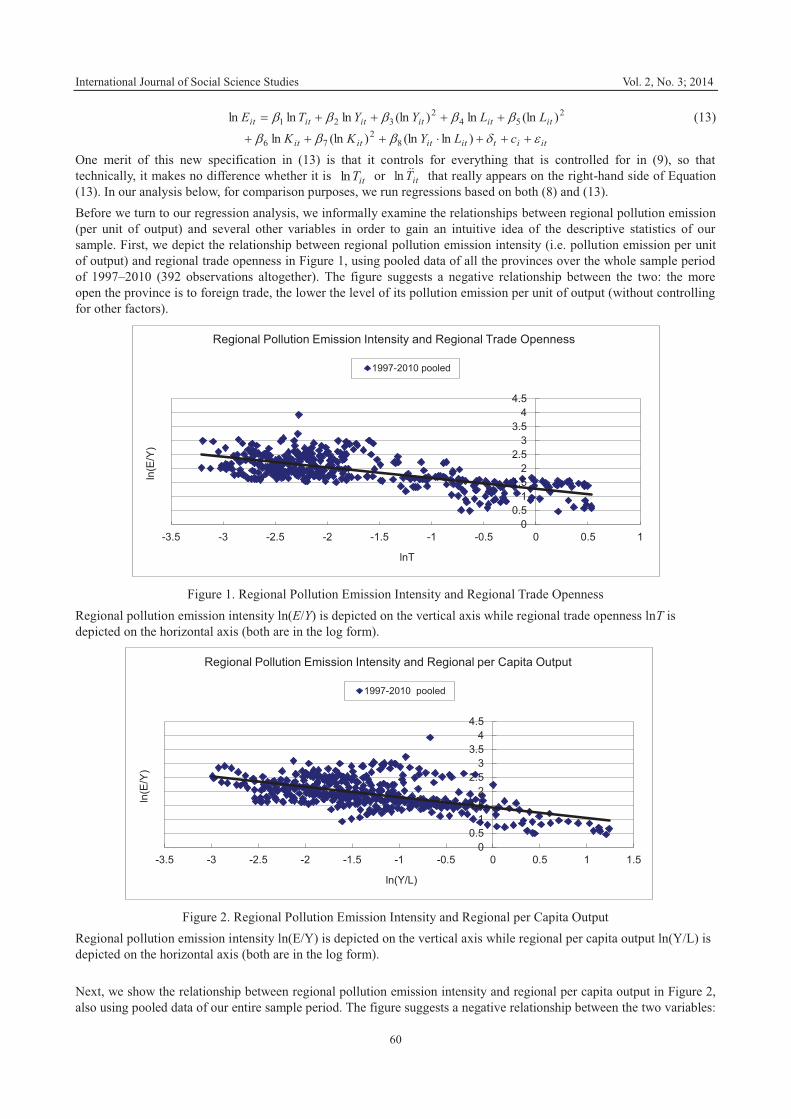
International Journal of Social Science Studies Vol. 2, No. 3; 2014
60
254
2321 )(lnln)(lnlnlnln itititititit LLYYTE ����� ����� (13)
itititititit cLYKK ���� ��� ��� )ln(ln)(lnln 82
76 One merit of this new specification in (13) is that it controls for everything that is controlled for in (9), so that technically, it makes no difference whether it is itTln or itT��ln that really appears on the right-hand side of Equation (13). In our analysis below, for comparison purposes, we run regressions based on both (8) and (13). Before we turn to our regression analysis, we informally examine the relationships between regional pollution emission (per unit of output) and several other variables in order to gain an intuitive idea of the descriptive statistics of our sample. First, we depict the relationship between regional pollution emission intensity (i.e. pollution emission per unit of output) and regional trade openness in Figure 1, using pooled data of all the provinces over the whole sample period of 1997–2010 (392 observations altogether). The figure suggests a negative relationship between the two: the more open the province is to foreign trade, the lower the level of its pollution emission per unit of output (without controlling for other factors).
Figure 1. Regional Pollution Emission Intensity and Regional Trade Openness Regional pollution emission intensity ln(E/Y) is depicted on the vertical axis while regional trade openness lnT is depicted on the horizontal axis (both are in the log form).
Figure 2. Regional Pollution Emission Intensity and Regional per Capita Output Regional pollution emission intensity ln(E/Y) is depicted on the vertical axis while regional per capita output ln(Y/L) is depicted on the horizontal axis (both are in the log form). Next, we show the relationship between regional pollution emission intensity and regional per capita output in Figure 2, also using pooled data of our entire sample period. The figure suggests a negative relationship between the two variables:
00.5
11.5
22.5
33.5
44.5
-3.5 -3 -2.5 -2 -1.5 -1 -0.5 0 0.5 1
ln(E
/Y)
lnT
Regional Pollution Emission Intensity and Regional Trade Openness
1997-2010 pooled
00.5
11.5
22.5
33.5
44.5
-3.5 -3 -2.5 -2 -1.5 -1 -0.5 0 0.5 1 1.5
ln(E
/Y)
ln(Y/L)
Regional Pollution Emission Intensity and Regional per Capita Output
1997-2010 pooled
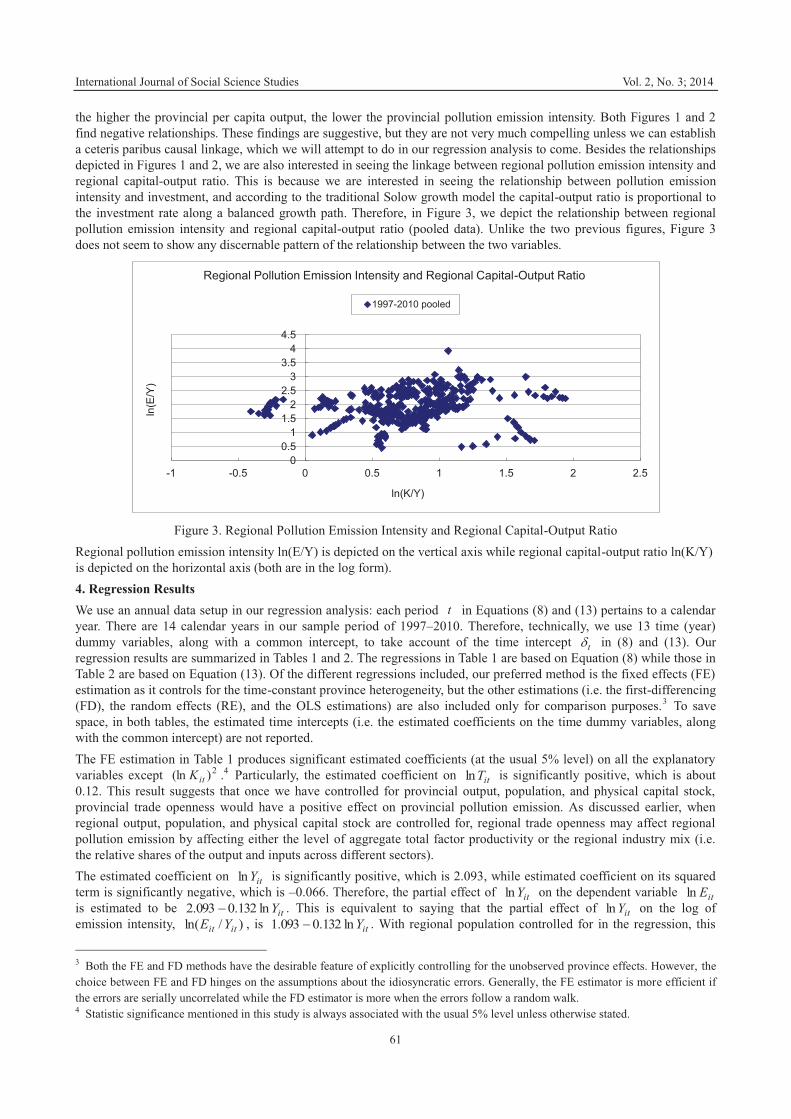
International Journal of Social Science Studies Vol. 2, No. 3; 2014
61
the higher the provincial per capita output, the lower the provincial pollution emission intensity. Both Figures 1 and 2 find negative relationships. These findings are suggestive, but they are not very much compelling unless we can establish a ceteris paribus causal linkage, which we will attempt to do in our regression analysis to come. Besides the relationships depicted in Figures 1 and 2, we are also interested in seeing the linkage between regional pollution emission intensity and regional capital-output ratio. This is because we are interested in seeing the relationship between pollution emission intensity and investment, and according to the traditional Solow growth model the capital-output ratio is proportional to the investment rate along a balanced growth path. Therefore, in Figure 3, we depict the relationship between regional pollution emission intensity and regional capital-output ratio (pooled data). Unlike the two previous figures, Figure 3 does not seem to show any discernable pattern of the relationship between the two variables.
Figure 3. Regional Pollution Emission Intensity and Regional Capital-Output Ratio Regional pollution emission intensity ln(E/Y) is depicted on the vertical axis while regional capital-output ratio ln(K/Y) is depicted on the horizontal axis (both are in the log form). 4. Regression Results We use an annual data setup in our regression analysis: each period t in Equations (8) and (13) pertains to a calendar year. There are 14 calendar years in our sample period of 1997–2010. Therefore, technically, we use 13 time (year) dummy variables, along with a common intercept, to take account of the time intercept t in (8) and (13). Our regression results are summarized in Tables 1 and 2. The regressions in Table 1 are based on Equation (8) while those in Table 2 are based on Equation (13). Of the different regressions included, our preferred method is the fixed effects (FE) estimation as it controls for the time-constant province heterogeneity, but the other estimations (i.e. the first-differencing (FD), the random effects (RE), and the OLS estimations) are also included only for comparison purposes.3 To save space, in both tables, the estimated time intercepts (i.e. the estimated coefficients on the time dummy variables, along with the common intercept) are not reported. The FE estimation in Table 1 produces significant estimated coefficients (at the usual 5% level) on all the explanatory variables except 2)(ln itK .4 Particularly, the estimated coefficient on itTln is significantly positive, which is about 0.12. This result suggests that once we have controlled for provincial output, population, and physical capital stock, provincial trade openness would have a positive effect on provincial pollution emission. As discussed earlier, when regional output, population, and physical capital stock are controlled for, regional trade openness may affect regional pollution emission by affecting either the level of aggregate total factor productivity or the regional industry mix (i.e. the relative shares of the output and inputs across different sectors). The estimated coefficient on itYln is significantly positive, which is 2.093, while estimated coefficient on its squared term is significantly negative, which is –0.066. Therefore, the partial effect of itYln on the dependent variable itEln is estimated to be itYln132.0093.2 � . This is equivalent to saying that the partial effect of itYln on the log of emission intensity, )/ln( itit YE , is itYln132.0093.1 � . With regional population controlled for in the regression, this
3 Both the FE and FD methods have the desirable feature of explicitly controlling for the unobserved province effects. However, the choice between FE and FD hinges on the assumptions about the idiosyncratic errors. Generally, the FE estimator is more efficient if the errors are serially uncorrelated while the FD estimator is more when the errors follow a random walk. 4 Statistic significance mentioned in this study is always associated with the usual 5% level unless otherwise stated.
00.5
11.5
22.5
33.5
44.5
-1 -0.5 0 0.5 1 1.5 2 2.5
ln(E
/Y)
ln(K/Y)
Regional Pollution Emission Intensity and Regional Capital-Output Ratio
1997-2010 pooled
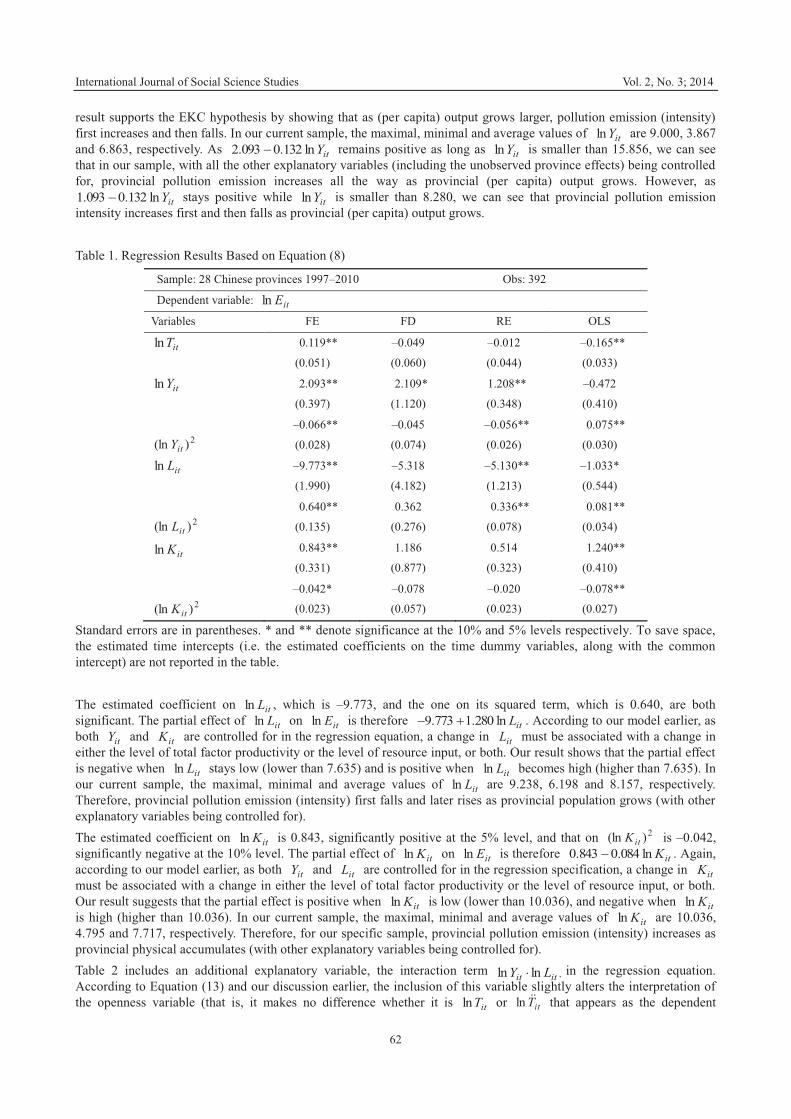
International Journal of Social Science Studies Vol. 2, No. 3; 2014
62
result supports the EKC hypothesis by showing that as (per capita) output grows larger, pollution emission (intensity) first increases and then falls. In our current sample, the maximal, minimal and average values of itYln are 9.000, 3.867 and 6.863, respectively. As itYln132.0093.2 � remains positive as long as itYln is smaller than 15.856, we can see that in our sample, with all the other explanatory variables (including the unobserved province effects) being controlled for, provincial pollution emission increases all the way as provincial (per capita) output grows. However, as
itYln132.0093.1 � stays positive while itYln is smaller than 8.280, we can see that provincial pollution emission intensity increases first and then falls as provincial (per capita) output grows. Table 1. Regression Results Based on Equation (8)
Sample: 28 Chinese provinces 1997–2010 Obs: 392
Dependent variable: itEln
Variables FE FD RE OLS
itTln
0.119**
(0.051)
–0.049
(0.060)
–0.012
(0.044)
–0.165**
(0.033)
itYln
2.093**
(0.397)
2.109*
(1.120)
1.208**
(0.348)
–0.472
(0.410)
2)(ln itY
–0.066**
(0.028)
–0.045
(0.074)
–0.056**
(0.026)
0.075**
(0.030)
itLln
–9.773**
(1.990)
–5.318
(4.182)
–5.130**
(1.213)
–1.033*
(0.544)
2)(ln itL
0.640**
(0.135)
0.362
(0.276)
0.336**
(0.078)
0.081**
(0.034)
itKln
0.843**
(0.331)
1.186
(0.877)
0.514
(0.323)
1.240**
(0.410)
2)(ln itK
–0.042*
(0.023)
–0.078
(0.057)
–0.020
(0.023)
–0.078**
(0.027)
Standard errors are in parentheses. * and ** denote significance at the 10% and 5% levels respectively. To save space, the estimated time intercepts (i.e. the estimated coefficients on the time dummy variables, along with the common intercept) are not reported in the table. The estimated coefficient on itLln , which is –9.773, and the one on its squared term, which is 0.640, are both significant. The partial effect of itLln on itEln is therefore itLln280.1773.9 �� . According to our model earlier, as both itY and itK are controlled for in the regression equation, a change in itL must be associated with a change in either the level of total factor productivity or the level of resource input, or both. Our result shows that the partial effect is negative when itLln stays low (lower than 7.635) and is positive when itLln becomes high (higher than 7.635). In our current sample, the maximal, minimal and average values of itLln are 9.238, 6.198 and 8.157, respectively. Therefore, provincial pollution emission (intensity) first falls and later rises as provincial population grows (with other explanatory variables being controlled for). The estimated coefficient on itKln is 0.843, significantly positive at the 5% level, and that on 2)(ln itK is –0.042, significantly negative at the 10% level. The partial effect of itKln on itEln is therefore itKln084.0843.0 � . Again, according to our model earlier, as both itY and itL are controlled for in the regression specification, a change in itK must be associated with a change in either the level of total factor productivity or the level of resource input, or both. Our result suggests that the partial effect is positive when itKln is low (lower than 10.036), and negative when itKln is high (higher than 10.036). In our current sample, the maximal, minimal and average values of itKln are 10.036, 4.795 and 7.717, respectively. Therefore, for our specific sample, provincial pollution emission (intensity) increases as provincial physical accumulates (with other explanatory variables being controlled for). Table 2 includes an additional explanatory variable, the interaction term itit LY lnln , in the regression equation. According to Equation (13) and our discussion earlier, the inclusion of this variable slightly alters the interpretation of the openness variable (that is, it makes no difference whether it is itTln or itT��ln that appears as the dependent
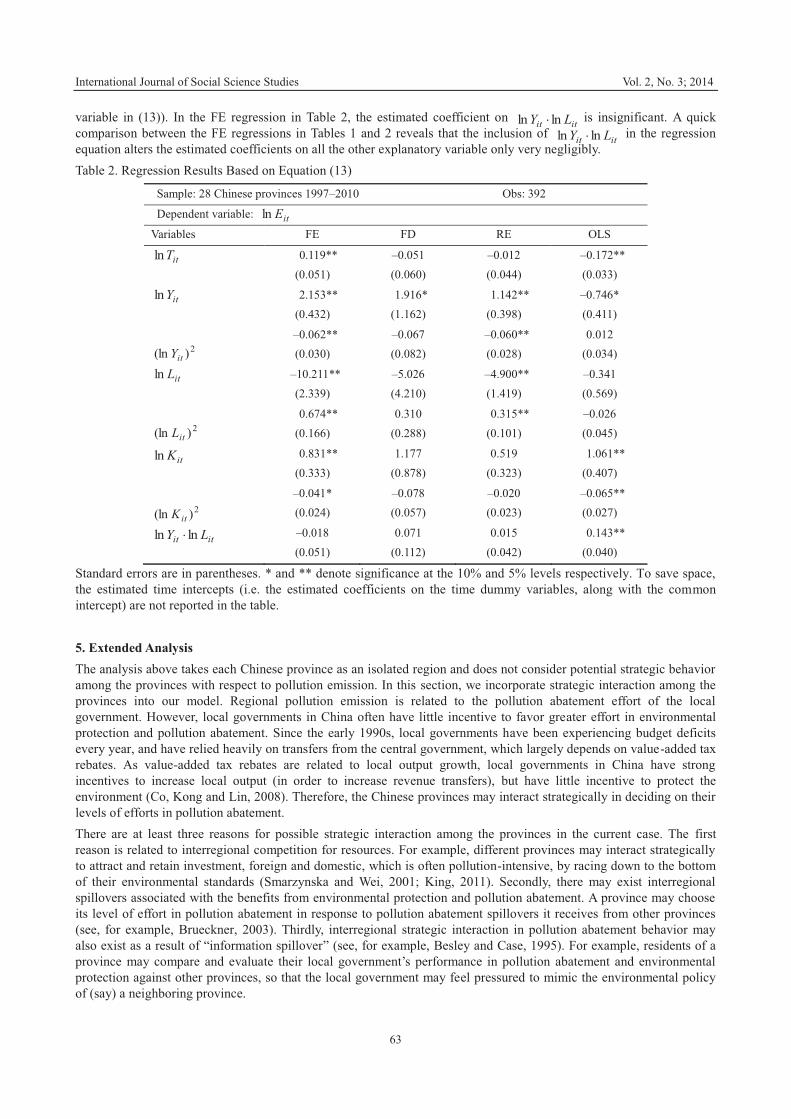
International Journal of Social Science Studies Vol. 2, No. 3; 2014
63
variable in (13)). In the FE regression in Table 2, the estimated coefficient on itit LY lnln is insignificant. A quick comparison between the FE regressions in Tables 1 and 2 reveals that the inclusion of itit LY lnln in the regression equation alters the estimated coefficients on all the other explanatory variable only very negligibly. Table 2. Regression Results Based on Equation (13)
Sample: 28 Chinese provinces 1997–2010 Obs: 392
Dependent variable: itEln
Variables FE FD RE OLS
itTln
0.119** (0.051)
–0.051 (0.060)
–0.012 (0.044)
–0.172** (0.033)
itYln
2.153** (0.432)
1.916* (1.162)
1.142** (0.398)
–0.746* (0.411)
2)(ln itY –0.062**
(0.030) –0.067 (0.082)
–0.060** (0.028)
0.012 (0.034)
itLln
–10.211** (2.339)
–5.026 (4.210)
–4.900** (1.419)
–0.341 (0.569)
2)(ln itL 0.674**
(0.166) 0.310
(0.288) 0.315**
(0.101) –0.026 (0.045)
itKln
0.831**
(0.333) 1.177
(0.878) 0.519
(0.323) 1.061**
(0.407)
2)(ln itK –0.041* (0.024)
–0.078 (0.057)
–0.020 (0.023)
–0.065** (0.027)
itit LY lnln
–0.018 (0.051)
0.071 (0.112)
0.015 (0.042)
0.143** (0.040)
Standard errors are in parentheses. * and ** denote significance at the 10% and 5% levels respectively. To save space, the estimated time intercepts (i.e. the estimated coefficients on the time dummy variables, along with the common intercept) are not reported in the table. 5. Extended Analysis The analysis above takes each Chinese province as an isolated region and does not consider potential strategic behavior among the provinces with respect to pollution emission. In this section, we incorporate strategic interaction among the provinces into our model. Regional pollution emission is related to the pollution abatement effort of the local government. However, local governments in China often have little incentive to favor greater effort in environmental protection and pollution abatement. Since the early 1990s, local governments have been experiencing budget deficits every year, and have relied heavily on transfers from the central government, which largely depends on value-added tax rebates. As value-added tax rebates are related to local output growth, local governments in China have strong incentives to increase local output (in order to increase revenue transfers), but have little incentive to protect the environment (Co, Kong and Lin, 2008). Therefore, the Chinese provinces may interact strategically in deciding on their levels of efforts in pollution abatement. There are at least three reasons for possible strategic interaction among the provinces in the current case. The first reason is related to interregional competition for resources. For example, different provinces may interact strategically to attract and retain investment, foreign and domestic, which is often pollution-intensive, by racing down to the bottom of their environmental standards (Smarzynska and Wei, 2001; King, 2011). Secondly, there may exist interregional spillovers associated with the benefits from environmental protection and pollution abatement. A province may choose its level of effort in pollution abatement in response to pollution abatement spillovers it receives from other provinces (see, for example, Brueckner, 2003). Thirdly, interregional strategic interaction in pollution abatement behavior may also exist as a result of “information spillover” (see, for example, Besley and Case, 1995). For example, residents of a province may compare and evaluate their local government’s performance in pollution abatement and environmental protection against other provinces, so that the local government may feel pressured to mimic the environmental policy of (say) a neighboring province.
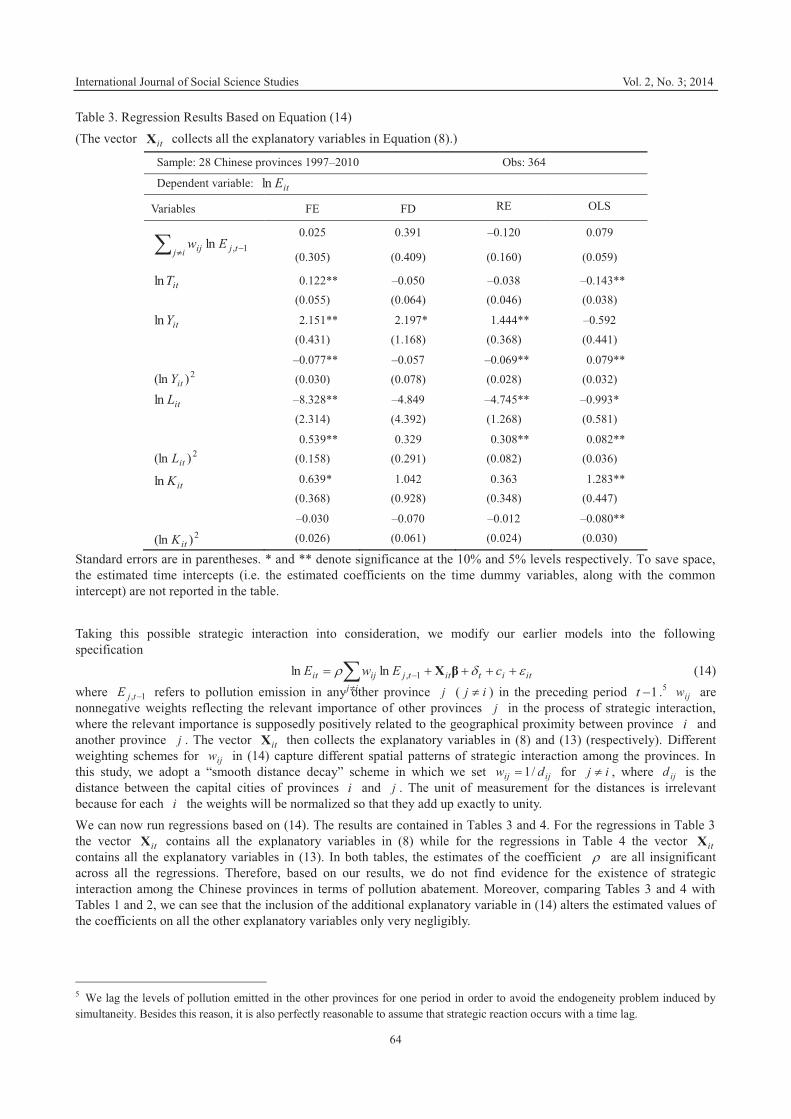
International Journal of Social Science Studies Vol. 2, No. 3; 2014
64
Table 3. Regression Results Based on Equation (14) (The vector itX collects all the explanatory variables in Equation (8).)
Sample: 28 Chinese provinces 1997–2010 Obs: 364
Dependent variable: itEln
Variables FE FD RE OLS
� � �ij tjij Ew 1,ln 0.025
(0.305)
0.391
(0.409)
–0.120
(0.160)
0.079
(0.059)
itTln
0.122** (0.055)
–0.050 (0.064)
–0.038 (0.046)
–0.143** (0.038)
itYln
2.151** (0.431)
2.197* (1.168)
1.444** (0.368)
–0.592 (0.441)
2)(ln itY –0.077**
(0.030) –0.057 (0.078)
–0.069** (0.028)
0.079** (0.032)
itLln
–8.328** (2.314)
–4.849 (4.392)
–4.745** (1.268)
–0.993* (0.581)
2)(ln itL 0.539**
(0.158) 0.329
(0.291) 0.308**
(0.082) 0.082**
(0.036)
itKln
0.639* (0.368)
1.042 (0.928)
0.363 (0.348)
1.283** (0.447)
2)(ln itK –0.030 (0.026)
–0.070 (0.061)
–0.012 (0.024)
–0.080** (0.030)
Standard errors are in parentheses. * and ** denote significance at the 10% and 5% levels respectively. To save space, the estimated time intercepts (i.e. the estimated coefficients on the time dummy variables, along with the common intercept) are not reported in the table. Taking this possible strategic interaction into consideration, we modify our earlier models into the following specification
itititij
tjijit cEwE �� ����� ��
� βX1,lnln (14) where 1, �tjE refers to pollution emission in any other province j ( ij � ) in the preceding period 1�t .5 ijw are nonnegative weights reflecting the relevant importance of other provinces j in the process of strategic interaction, where the relevant importance is supposedly positively related to the geographical proximity between province i and another province j . The vector itX then collects the explanatory variables in (8) and (13) (respectively). Different weighting schemes for ijw in (14) capture different spatial patterns of strategic interaction among the provinces. In this study, we adopt a “smooth distance decay” scheme in which we set ijij dw /1� for ij � , where ijd is the distance between the capital cities of provinces i and j . The unit of measurement for the distances is irrelevant because for each i the weights will be normalized so that they add up exactly to unity. We can now run regressions based on (14). The results are contained in Tables 3 and 4. For the regressions in Table 3 the vector itX contains all the explanatory variables in (8) while for the regressions in Table 4 the vector itX contains all the explanatory variables in (13). In both tables, the estimates of the coefficient � are all insignificant across all the regressions. Therefore, based on our results, we do not find evidence for the existence of strategic interaction among the Chinese provinces in terms of pollution abatement. Moreover, comparing Tables 3 and 4 with Tables 1 and 2, we can see that the inclusion of the additional explanatory variable in (14) alters the estimated values of the coefficients on all the other explanatory variables only very negligibly.
5 We lag the levels of pollution emitted in the other provinces for one period in order to avoid the endogeneity problem induced by simultaneity. Besides this reason, it is also perfectly reasonable to assume that strategic reaction occurs with a time lag.
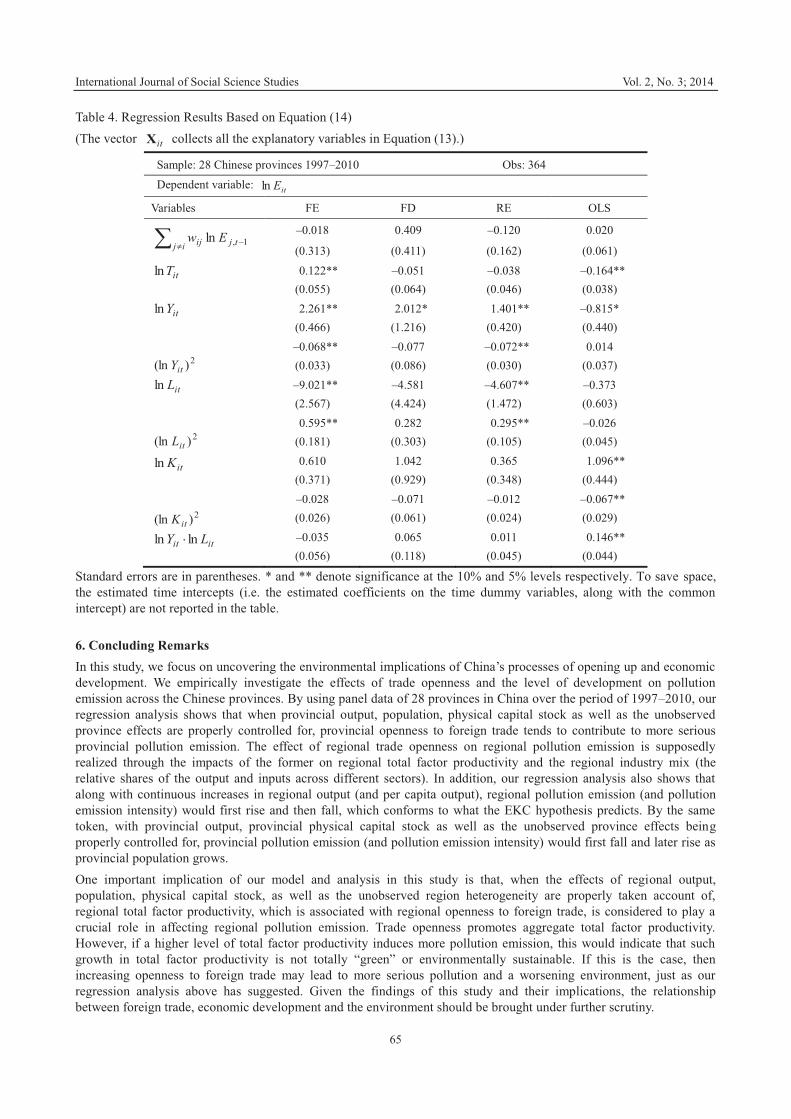
International Journal of Social Science Studies Vol. 2, No. 3; 2014
65
Table 4. Regression Results Based on Equation (14) (The vector itX collects all the explanatory variables in Equation (13).)
Sample: 28 Chinese provinces 1997–2010 Obs: 364
Dependent variable: itEln
Variables FE FD RE OLS
� � �ij tjij Ew 1,ln –0.018
(0.313)
0.409
(0.411)
–0.120
(0.162)
0.020
(0.061)
itTln
0.122** (0.055)
–0.051 (0.064)
–0.038 (0.046)
–0.164** (0.038)
itYln
2.261** (0.466)
2.012* (1.216)
1.401** (0.420)
–0.815* (0.440)
2)(ln itY –0.068**
(0.033) –0.077 (0.086)
–0.072** (0.030)
0.014 (0.037)
itLln
–9.021** (2.567)
–4.581 (4.424)
–4.607** (1.472)
–0.373 (0.603)
2)(ln itL 0.595**
(0.181) 0.282
(0.303) 0.295**
(0.105) –0.026 (0.045)
itKln
0.610
(0.371) 1.042
(0.929) 0.365
(0.348) 1.096**
(0.444)
2)(ln itK –0.028 (0.026)
–0.071 (0.061)
–0.012 (0.024)
–0.067** (0.029)
itit LY lnln
–0.035 (0.056)
0.065 (0.118)
0.011 (0.045)
0.146** (0.044)
Standard errors are in parentheses. * and ** denote significance at the 10% and 5% levels respectively. To save space, the estimated time intercepts (i.e. the estimated coefficients on the time dummy variables, along with the common intercept) are not reported in the table. 6. Concluding Remarks In this study, we focus on uncovering the environmental implications of China’s processes of opening up and economic development. We empirically investigate the effects of trade openness and the level of development on pollution emission across the Chinese provinces. By using panel data of 28 provinces in China over the period of 1997–2010, our regression analysis shows that when provincial output, population, physical capital stock as well as the unobserved province effects are properly controlled for, provincial openness to foreign trade tends to contribute to more serious provincial pollution emission. The effect of regional trade openness on regional pollution emission is supposedly realized through the impacts of the former on regional total factor productivity and the regional industry mix (the relative shares of the output and inputs across different sectors). In addition, our regression analysis also shows that along with continuous increases in regional output (and per capita output), regional pollution emission (and pollution emission intensity) would first rise and then fall, which conforms to what the EKC hypothesis predicts. By the same token, with provincial output, provincial physical capital stock as well as the unobserved province effects being properly controlled for, provincial pollution emission (and pollution emission intensity) would first fall and later rise as provincial population grows. One important implication of our model and analysis in this study is that, when the effects of regional output, population, physical capital stock, as well as the unobserved region heterogeneity are properly taken account of, regional total factor productivity, which is associated with regional openness to foreign trade, is considered to play a crucial role in affecting regional pollution emission. Trade openness promotes aggregate total factor productivity. However, if a higher level of total factor productivity induces more pollution emission, this would indicate that such growth in total factor productivity is not totally “green” or environmentally sustainable. If this is the case, then increasing openness to foreign trade may lead to more serious pollution and a worsening environment, just as our regression analysis above has suggested. Given the findings of this study and their implications, the relationship between foreign trade, economic development and the environment should be brought under further scrutiny.
International Journal of Social Science Studies Vol. 2, No. 3; 2014
66
Acknowledgements The author thanks the anonymous Reviewer and the Editor of the Journal for their helpful comments. Of course, all remaining errors are the author’s alone. References Abdulai, A., & Ramcke, L. (2013). The Impact of Trade and Economic Growth on the Environment: Revisiting the
Cross-Country Evidence. Journal of International Development, 25(2), 180–205. http://dx.doi.org/10.1002/jid.1789 Anselin, L. (1988), Spatial Econometrics. Dordrecht: Kluwer Academic Publishers. Antweiler, W., Copeland, B. R., & Taylor, M. S. (2001). Is Free Trade Good for the Environment? American Economic
Review, 91(4), 877–908. http://dx.doi.org/10.1257/aer.91.4.877 Besley, T. J., & Case, A. C. (1995). Incumbent Behavior: Vote Seeking, Tax Setting and Yardstick Competition.
American Economic Review, 85, 25–45. Brueckner, J. K. (2003). Strategic Interaction Among Governments: An Overview of Empirical Studies. International
Regional Science Review, 26(2), 175–188. http://dx.doi.org/10.1177/0160017602250974 Co, C. Y., Kong, F., & Lin, S. (2008). Pollution across Chinese Provinces. Development Economics Working Papers
22148, East Asian Bureau of Economic Research. Cole, M. A. (2004). Trade, the Pollution Haven Hypothesis and the Environmental Kuznets Curve: Examining the
Linkages. Ecological Economics, 48, 71–81. http://dx.doi.org/10.1016/j.ecolecon.2003.09.007 Economist, The. (2004). China’s Environment: A Great Wall of Waste. August 19, 2004. Gale, L. R., & Mendez, J. A. (1998). The Empirical Relationship between Trade, Growth and the Environment.
International Review of Economics and Finance, 7(1), 53–61. http://dx.doi.org/10.1016/S1059-0560(99)80016-1 Grossman, G. M., & Krueger, A. B. (1993). Environmental Impacts of the North American Free Trade Agreement. In
The U.S.-Mexico Free Trade Agreement, Garber, P. Massachusetts Institute of Technology, The MIT Press, Cambridge, MA., 13–56.
Grossman, G. M., & Krueger, A. B. (1995). Economic Growth and the Environment. Quarterly Journal of Economics, 110(2), 353–377. http://dx.doi.org/10.3386/w4634
Jiang, Y. (2013). Total Factor Productivity, Pollution and “Green” Economic Growth in China. Journal of International Development, available online July 2013. http://dx.doi.org/10.1002/jid.2944
King, J. (2011). Foreign Direct Investment and Pollution Havens. Journal of Economics and Econometrics, 54(1), 39–47. Low, P., Olarreaga M., & Suarez, J. (1998). Does Globalization Cause a Higher Concentration of International Trade
and Investment Flow? WTO Staff Working Paper ERAD-98-08 (August 1998), Economic Research and Analysis Division, World Trade Organization.
Mani, M., & Wheeler, D. (1998). In Search of Pollution Havens? Dirty Industry in the World Economy, 1960–1995. Journal of Environment and Development, 7(3), 215–247.
Selden, T. M., & Song, D. (1994). Environmental Quality and Development: Is There a Kuznets Curve for Air Pollution Emissions? Journal of Environmental Economics and management, 27, 147–162. http://dx.doi.org/10.1006/jeem.1994.1031
Smarzynska, B. K., & Wei, S. J. (2001). Pollution Havens and Foreign Direct Investment: Dirty Secret or Popular Myth? NBER Working Papers 8465, National Bureau of Economic Research, Inc.
Tzouvelekas, E., Vouvaki, D., & Xepapadeas, A. (2006). Total Factor Productivity Growth and the Environment: A Case for Green Growth Accounting. Working Papers 0617, University of Crete, Department of Economics.
Vincent, J. R. (1997). Testing for Environmental Kuznets Curves within a Developing Country. Environment and Development Economics, 2, 417–431. http://dx.doi.org/10.1017/S1355770X97000223
Zhang, J. (2008). Estimation of China’s Provincial Capital Stock (1952–2004) with Applications. Journal of Chinese Economic and Business Studies, 6(2), 177–196. http://dx.doi.org/doi:10.1080/14765280802028302
Zhang, J. (2012). Delivering Environmentally Sustainable Economic Growth: The Case of China. Asia Society Report, September 2012.
This work is licensed under a Creative Commons Attribution 3.0 License.
International Journal of Social Science Studies Vol. 2, No. 3; July 2014
ISSN 2324-8033 E-ISSN 2324-8041 Published by Redfame Publishing
URL: http://ijsss.redfame.com
67
Perceptions of Air Quality and Sense of Place among Women in Northeast Hamilton, Ontario, Canada
Melissa Gallina & Allison Williams Correspondence: Melissa Gallina, McMaster University, Canada Received: May 8, 2014 Accepted: May 23, 2014 Available online: June 2, 2014 doi:10.11114/ijsss.v2i3.412 URL: http://dx.doi.org/10.11114/ijsss.v2i3.412 Abstract Research on environmental health risks suggests that public perceptions of risk may be greater than quantitative health risk assessments, especially amongst vulnerable groups such as women and immigrants. This study uses the environmental stress and coping framework to examine individual perceptions of air quality amongst Canadian-born and immigrant women in Northeast Hamilton, Ontario, Canada. Furthermore, the study aims to determine the influence of sense of place on local environmental perceptions. Quantitative survey results suggest that Canadian-born residents have a higher absolute value of sense of place than immigrants. Qualitative focus group discussions suggest that, compared to immigrant women, Canadian-born women may be more aware, knowledgeable and concerned about larger-scale air quality issues; however, the tension between economic and environmental needs hinders their sense of control. Bringing the quantitative and qualitative data together suggests that sense of place may inform environmental perceptions. Keywords: Sense of Place, Environmental Perceptions, Immigrant, Women, Hamilton 1. Introduction 1.1 Literature Review Poor air quality in Northeast Hamilton can be attributed to a combination of factors, including: industrial emissions; traffic emissions; and, temperature inversions resulting from proximity to Lake Ontario and the Niagara Escarpment (Buzzelli & Jerrett, 2004; Adams et al., 2012). Past studies in Hamilton have shown a negative relationship between socio-economic status and exposure to air pollution (Jerrett et al., 2001; Buzzelli et al., 2003; Buzzelli & Jerrett, 2004). Some evidence suggests that certain visible minority groups may also be disproportionately exposed (Buzzelli & Jerrett, 2004). Research on environmental health risks suggests that white males tend to rate risks lower than all other groups (white women and non-whites), providing a rationale for this research (Flynn et al., 1994; Finucane et al., 2000). According to the postmaterialist thesis, the environmental perceptions of immigrants might differ from that of the dominant social group (Lovelock et al., 2013). The postmaterialist thesis suggests that individuals from richer, more developed countries have higher levels of environmental concern than those from poorer, less developed countries (Inglehart, 1995; Lovelock et al., 2013). The postmaterialist thesis reasons that individuals residing in developing countries are preoccupied with meeting basic needs; and therefore are less concerned about the environment (Inglehart, 1995; Lovelock et al., 2013). However, it is suggested that immigrants from less developed countries may experience increased levels of environmental concern once they become settled in a more developed country (Inglehart, 1995; Lovelock et al., 2013). Furthermore, women exhibit greater concern for environment and health compared to men, due to their traditional role as caregivers (Stern et al., 1993; Momsen, 1999). Past geographical studies have used the environmental stress and coping theory as a framework for examining individual perceptions and resulting coping strategies associated with environmental risk (Elliott et al., 1997; Wakefield et al., 2001). Within this theoretical approach, stress is defined as “the process by which environmental events or forces, called stressors, threaten an organism’s existence and well-being and by which the organism responds to this threat”
(Baum & Singer, 1982, 15). Environmental pollution is recognized as a stressor (Shankardass, 2012). The environmental stress and coping theory involves three main components: perceptions or appraisals of the stressor; coping with the stressor; and, adapting to the stressor (Baum & Singer, 1982; Bell & Fisher, 1990). This study will focus on individual perceptions and chosen coping strategies related to air pollution.
International Journal of Social Science Studies Vol. 2, No. 3; 2014
68
A number of factors have been found to influence individual perceptions of air quality including: knowledge and awareness (Crowe, 1968; Swan, 1970; Evans & Jacobs, 1982; Bickerstaff & Walker, 2001); perceived control and coping abilities (Baum & Singer, 1982; James & Eyles, 1999); concern and perception of risk (Baum & Singer, 1982; Elliott et al., 1999; Bush et al., 2001); and, sense of place and place attachment (Kaltenborn, 1998; Bickerstaff & Walker, 2001; Bush et al., 2001; Vaske & Kobrin, 2001; Vorkinn & Riese, 2001). Public knowledge of air pollution tends to be limited to suspected causes and observed effects, rather than knowledge about its actual composition (Evans & Jacobs, 1982). However, individuals with a higher level of education or higher socioeconomic status are more likely to define air pollution in terms of its causal agents and complex nature (Crowe, 1968). Individual awareness of air pollution often results from sensory information such as, poor visibility, odours, or discoloration of property (Evans & Jacobs, 1982; Bickerstaff & Walker, 2001). Studies have shown that lower socioeconomic status groups tend to be less aware of air pollution (Swan, 1970). Individuals with a strong sense of control feel that they can effectively cope with a stressor; therefore, perceived control is recognized as a mediator of stress (Baum & Singer, 1982). Comparatively, individuals with a weak sense of control are less likely to take action against the stressor (Baum & Singer, 1982). Studies have shown that, in general, individuals perceive low levels of control over the environment; this is especially true for those in vulnerable groups (Baum & Singer, 1982; James & Eyles, 1999). Evaluation of a stressor is dependent upon the perception of risk associated with the stressor (Baum & Singer, 1982). Within the context of air pollution, public perceptions of risk may be greater than quantitative health risk assessments, or individuals may choose to disassociate themselves from apparent health risks (Elliott et al., 1999; Bush et al., 2001). Coping with an environmental stressor can be either problem-focused or emotion-focused (Lazarus & Folkman, 1984). Problem-focused strategies involve attempts to manipulate the relationship between the individual and the stressor by generating solutions and taking action, such as, forming a local citizen’s group (Baum & Singer, 1982; Lazarus & Folkman, 1984; Wakefield et al., 2001). Examples of active coping mechanisms associated with air pollution include: seeking information or voicing complaints about air pollution; altering transportation behaviour or reducing outdoor activities during periods of high air pollution concentration (Lazarus & Folkman, 1984). In contrast, emotion-focused strategies do not involve changing objective situations (Lazarus & Folkman, 1984). Instead, individuals alter their internal environment, for example through avoidance or reassessing the situation as non-threatening, in order to lessen emotional distress (Lazarus & Folkman, 1984; Baum & Singer, 1982; Bell & Fisher, 1990). For example, individuals may acknowledge a linkage between air pollution and health, but deny personal risk (Bickerstaff & Walker, 2001). Furthermore, this research explores whether perceptions of air quality and chosen coping strategies are informed by individual evaluations of sense of place (SoP). SoP has been described as: “the attitudes and feelings that individuals and groups hold vis-à-vis the geographical areas in which they live. It further commonly suggests intimate, personal and emotional relationships between self and place” (Wylie, 2009, 676). The physical environment is largely absent in SoP literature, providing further rationale for this study (Stedman, 2003). This research builds on earlier work, which found that immigrants in Hamilton had lower evaluations of SoP than their Canadian-born counterparts (Galling & Williams, 2014). Lower evaluations of SoP amongst immigrant respondents may be attributed to: a ‘disruption’ of SoP during the immigration process; younger age distribution; and/or, lower median incomes (Gallina & Williams, 2014). Place attachment, a concept closely linked with SoP, has been related to environmental perceptions (Vaske & Kobrin, 2001). Place attachment refers to “the affective link that people establish with specific settings, where they tend to remain and where they feel comfortable and safe” (Hernandez et al., 2007, 310). For example, a study conducted in Norway determined that residents with higher levels of place attachment were more likely to have negative attitudes towards development causing environmental harm (Vorkinn & Riese, 2001). Kaltenborn (1998) suggests that individuals with a strong SoP are more committed to solving problems associated with local environmental issues. Conversely, studies have also identified a ‘neighbourhood halo effect’ where individuals are reluctant to acknowledge local pollution due to a strong commitment to place (Bickerstaff & Walker, 2001; Bush et al., 2001; Vaske & Kobrin, 2001). Furthermore, there is a gender dimension to SoP. Past research has shown that women are more “neighbourhood dependent” than men and tend to exhibit higher levels of place attachment (Hidalgo and Hernandez, 2001; Meegan and Mitchell, 2001). This paper addresses the following research question: How do perceptions of air quality vary between immigrant and Canadian-born women living in Northeast Hamilton, and are they informed by SoP? There are three objectives associated with this research question: (1) to compare perceptions of air quality between immigrant and Canadian-born women; (2) to investigate coping strategies associated with poor air quality among these two groups; and, (3) to determine if evaluations of SoP inform perceptions of air quality. Following a description of the field site, the quantitative and qualitative methods employed in this research are outlined. Results are presented from the SoP survey and the focus group discussions. This is followed by a discussion and conclusions.
International Journal of Social Science Studies Vol. 2, No. 3; 2014
69
1.2 Area Description Hamilton is a mid-sized Canadian city located in Southwestern Ontario, approximately 75 km west of Toronto (2 & Kitchen, 2012). In 2011, Hamilton’s population was just under 520 000 (Statistics Canada, 2012). The city, once a hub of industrial activity and steel production, has experienced economic restructuring in recent years, with development in the health and education sectors (Eby et al., 2012; 2 & Kitchen, 2012). This reduction in manufacturing has resulted in economic decline within the city’s inner core (Eby et al., 2012; 2 & Kitchen, 2012). In 2005, Hamilton’s poverty rate was 18%, compared to 15% for the province as a whole (Mayo & Fraser, 2009). However, poverty in Hamilton is unevenly distributed and income inequality continues to grow (Mayo & Fraser, 2009; Mayo & Pike, 2013). Residents living below the poverty line are concentrated among several neighbourhoods within the downtown core, with poverty rates reaching up to 46% (Mayo & Pike, 2013). Certain vulnerable groups, such as women and recent immigrants, are more likely to live under the poverty line (Mayo & Fraser, 2009). 2. Methods This study contains qualitative analysis, supplemented by quantitative analysis. The methods and results are discussed in chronological order, beginning with a description of the quantitative methods. A more in-depth quantitative analysis is provided in the earlier work (Gallina & Williams, 2014). 2.1 Quantitative Data for this project was obtained from a household-based telephone survey conducted in Hamilton during the summer of 2012 (n=716), as part of a larger quality of life study funded by the Social Sciences and Humanities Research Council of Canada (SSHRC). The response rate for the larger survey, which included three Canadian cities, was 23%; households within each of the cities were selected randomly. The survey respondents were split between immigrants (those not born in Canada) and Canadian-born residents; approximately 60% of survey respondents were born outside of Canada. Approximately 60% of the respondents were female and 40% were male. Sample size, for both the number of households and the size of the immigrant population, were informed by the 2006 census; households were randomly selected to participate in the survey. Participants were asked to complete a 16-item SoP scale, developed by Williams et al. (2010) (Appendix A). The survey evaluates individual perceptions of four SoP factors: neighbourhood rootedness; neighbourhood sentiment; neighbours; and, environment and health using a 5-point likert scale. The SoP scale was developed from a larger survey of 46 items shown to influence neighbourhood SoP; Williams et al., (2010) selected the 16 most influential items, which were then separated into four factors using a principal components analysis (a more thorough description of this analysis is provided by Williams et al., 2010). An established SoP formula (Williams et al., 2010) was employed to calculate individual evaluations of SoP (Equation 1). Due to the nature of the SoP formula, any records with a missing response to one of the sixteen SoP questions were eliminated from the analysis; a total of 631 responses were used in the analysis. Further information on the SoP scale and its analysis can be found in the earlier work (Gallina & Williams, 2014).
(1)
Individual evaluations of SoP were used to calculate mean SoP values for: (1) Canadian-born women; (2) immigrant women; (3) Canadian-born men; and, (4) immigrant men. A total of 631 telephone survey responses were included in the analysis. SAS statistical software was used to analyze the telephone survey data. The resulting SoP values were triangulated with the qualitative results of this study. Qualitative focus group data was used to provide depth to the discussion of SoP within the quantitative data. 2.2 Qualitative Two focus groups were conducted during the summer of 2013 (n=2). The first focus group was comprised of Canadian-born women (n=8); the second group was comprised of immigrant women from a variety of ethnic backgrounds (n=8). The majority of immigrant women originated from the Middle East and Africa. Recruitment of the focus group participants was completed with the assistance of local community organizations. Participants were selected based on: their gender (female); immigrant status; and neighbourhood of residence (Northeast Hamilton). For the purpose of this study, immigrants are defined as those who currently reside in Canada but were born outside of the country. In order to participate in this study, individuals were required to have a working knowledge of the English language; therefore, translation services were not provided. Ethics approval was obtained via the McMaster University Research Ethics Board in 2013.
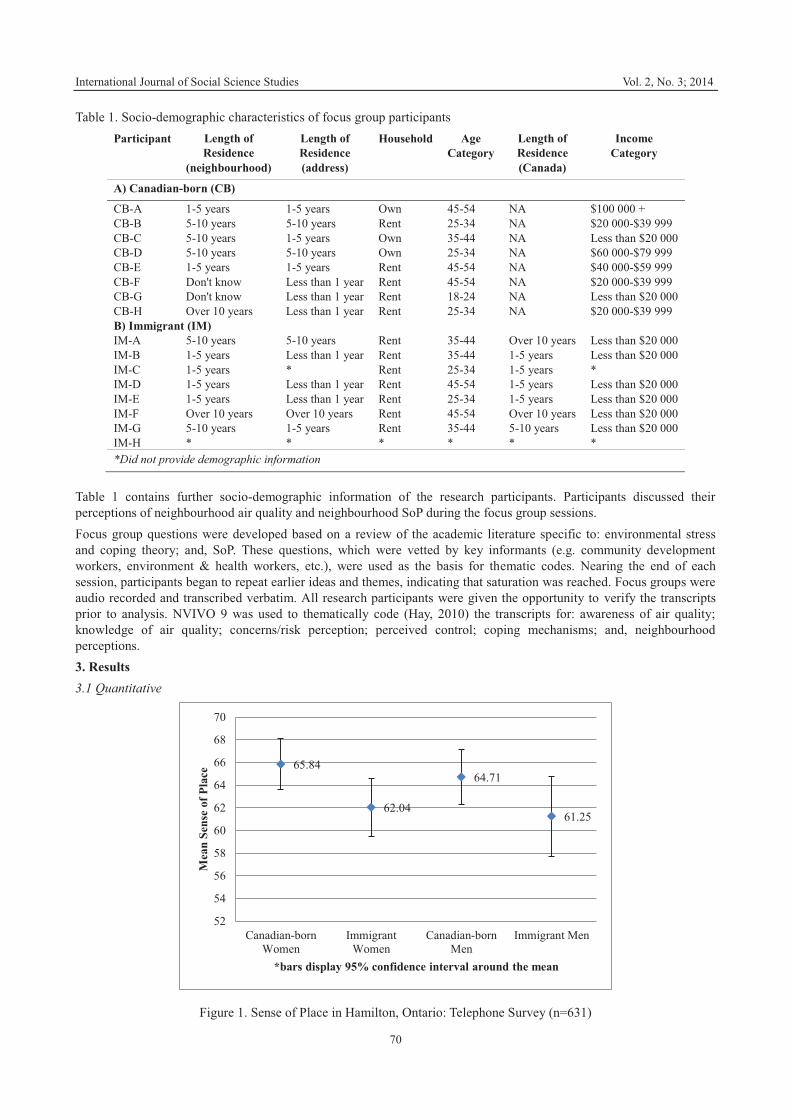
International Journal of Social Science Studies Vol. 2, No. 3; 2014
70
Table 1. Socio-demographic characteristics of focus group participants Participant Length of
Residence (neighbourhood)
Length of Residence (address)
Household Age Category
Length of Residence (Canada)
Income Category
A) Canadian-born (CB)
CB-A 1-5 years 1-5 years Own 45-54 NA $100 000 + CB-B 5-10 years 5-10 years Rent 25-34 NA $20 000-$39 999 CB-C 5-10 years 1-5 years Own 35-44 NA Less than $20 000 CB-D 5-10 years 5-10 years Own 25-34 NA $60 000-$79 999 CB-E 1-5 years 1-5 years Rent 45-54 NA $40 000-$59 999 CB-F Don't know Less than 1 year Rent 45-54 NA $20 000-$39 999 CB-G Don't know Less than 1 year Rent 18-24 NA Less than $20 000 CB-H Over 10 years Less than 1 year Rent 25-34 NA $20 000-$39 999 B) Immigrant (IM) IM-A 5-10 years 5-10 years Rent 35-44 Over 10 years Less than $20 000 IM-B 1-5 years Less than 1 year Rent 35-44 1-5 years Less than $20 000 IM-C 1-5 years * Rent 25-34 1-5 years * IM-D 1-5 years Less than 1 year Rent 45-54 1-5 years Less than $20 000 IM-E 1-5 years Less than 1 year Rent 25-34 1-5 years Less than $20 000 IM-F Over 10 years Over 10 years Rent 45-54 Over 10 years Less than $20 000 IM-G 5-10 years 1-5 years Rent 35-44 5-10 years Less than $20 000 IM-H * * * * * * *Did not provide demographic information
Table 1 contains further socio-demographic information of the research participants. Participants discussed their perceptions of neighbourhood air quality and neighbourhood SoP during the focus group sessions. Focus group questions were developed based on a review of the academic literature specific to: environmental stress and coping theory; and, SoP. These questions, which were vetted by key informants (e.g. community development workers, environment & health workers, etc.), were used as the basis for thematic codes. Nearing the end of each session, participants began to repeat earlier ideas and themes, indicating that saturation was reached. Focus groups were audio recorded and transcribed verbatim. All research participants were given the opportunity to verify the transcripts prior to analysis. NVIVO 9 was used to thematically code (Hay, 2010) the transcripts for: awareness of air quality; knowledge of air quality; concerns/risk perception; perceived control; coping mechanisms; and, neighbourhood perceptions. 3. Results 3.1 Quantitative
Figure 1. Sense of Place in Hamilton, Ontario: Telephone Survey (n=631)
65.84
62.04
64.71
61.25
52
54
56
58
60
62
64
66
68
70
Canadian-bornWomen
ImmigrantWomen
Canadian-bornMen
Immigrant Men
Mea
n Se
nse
of P
lace
*bars display 95% confidence interval around the mean
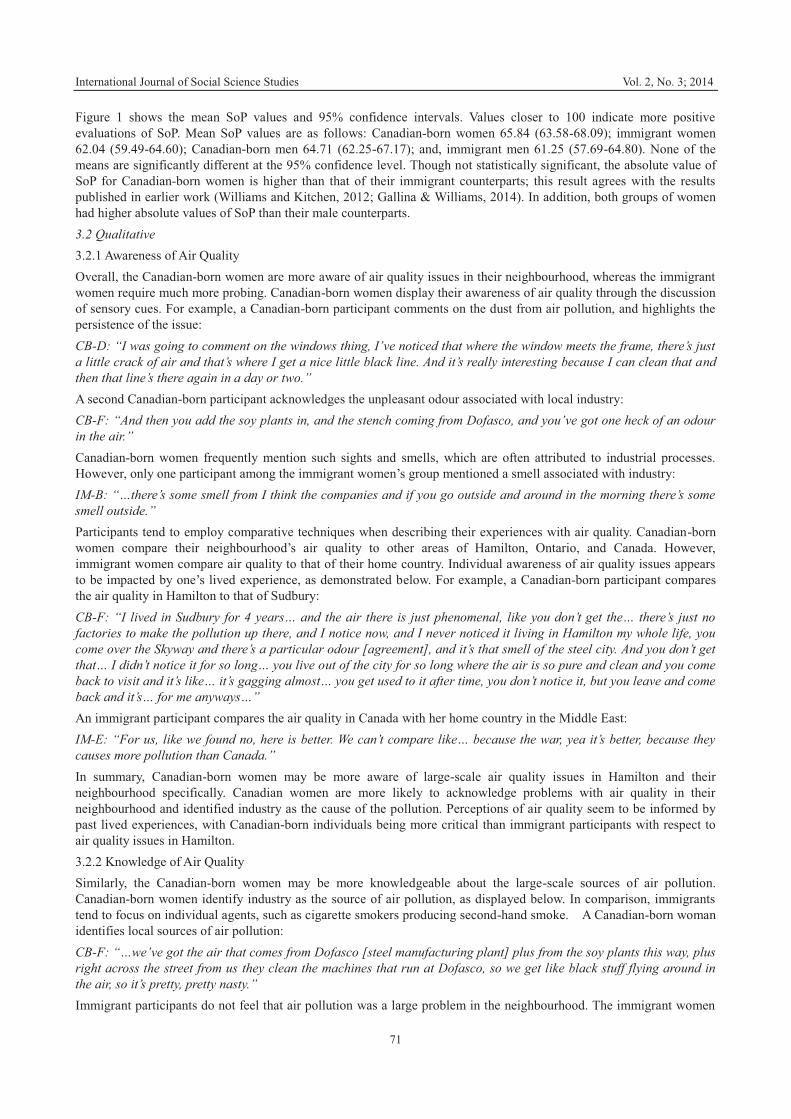
International Journal of Social Science Studies Vol. 2, No. 3; 2014
71
Figure 1 shows the mean SoP values and 95% confidence intervals. Values closer to 100 indicate more positive evaluations of SoP. Mean SoP values are as follows: Canadian-born women 65.84 (63.58-68.09); immigrant women 62.04 (59.49-64.60); Canadian-born men 64.71 (62.25-67.17); and, immigrant men 61.25 (57.69-64.80). None of the means are significantly different at the 95% confidence level. Though not statistically significant, the absolute value of SoP for Canadian-born women is higher than that of their immigrant counterparts; this result agrees with the results published in earlier work (Williams and Kitchen, 2012; Gallina & Williams, 2014). In addition, both groups of women had higher absolute values of SoP than their male counterparts. 3.2 Qualitative 3.2.1 Awareness of Air Quality Overall, the Canadian-born women are more aware of air quality issues in their neighbourhood, whereas the immigrant women require much more probing. Canadian-born women display their awareness of air quality through the discussion of sensory cues. For example, a Canadian-born participant comments on the dust from air pollution, and highlights the persistence of the issue: CB-D: “I was going to comment on the windows thing, I’ve noticed that where the window meets the frame, there’s just a little crack of air and that’s where I get a nice little black line. And it’s really interesting because I can clean that and then that line’s there again in a day or two.” A second Canadian-born participant acknowledges the unpleasant odour associated with local industry: CB-F: “And then you add the soy plants in, and the stench coming from Dofasco, and you’ve got one heck of an odour in the air.” Canadian-born women frequently mention such sights and smells, which are often attributed to industrial processes. However, only one participant among the immigrant women’s group mentioned a smell associated with industry: IM-B: “…there’s some smell from I think the companies and if you go outside and around in the morning there’s some smell outside.” Participants tend to employ comparative techniques when describing their experiences with air quality. Canadian-born women compare their neighbourhood’s air quality to other areas of Hamilton, Ontario, and Canada. However, immigrant women compare air quality to that of their home country. Individual awareness of air quality issues appears to be impacted by one’s lived experience, as demonstrated below. For example, a Canadian-born participant compares the air quality in Hamilton to that of Sudbury: CB-F: “I lived in Sudbury for 4 years… and the air there is just phenomenal, like you don’t get the… there’s just no factories to make the pollution up there, and I notice now, and I never noticed it living in Hamilton my whole life, you come over the Skyway and there’s a particular odour [agreement], and it’s that smell of the steel city. And you don’t get that… I didn’t notice it for so long… you live out of the city for so long where the air is so pure and clean and you come back to visit and it’s like… it’s gagging almost… you get used to it after time, you don’t notice it, but you leave and come back and it’s… for me anyways…” An immigrant participant compares the air quality in Canada with her home country in the Middle East: IM-E: “For us, like we found no, here is better. We can’t compare like… because the war, yea it’s better, because they causes more pollution than Canada.” In summary, Canadian-born women may be more aware of large-scale air quality issues in Hamilton and their neighbourhood specifically. Canadian women are more likely to acknowledge problems with air quality in their neighbourhood and identified industry as the cause of the pollution. Perceptions of air quality seem to be informed by past lived experiences, with Canadian-born individuals being more critical than immigrant participants with respect to air quality issues in Hamilton. 3.2.2 Knowledge of Air Quality Similarly, the Canadian-born women may be more knowledgeable about the large-scale sources of air pollution. Canadian-born women identify industry as the source of air pollution, as displayed below. In comparison, immigrants tend to focus on individual agents, such as cigarette smokers producing second-hand smoke. A Canadian-born woman identifies local sources of air pollution: CB-F: “…we’ve got the air that comes from Dofasco [steel manufacturing plant] plus from the soy plants this way, plus right across the street from us they clean the machines that run at Dofasco, so we get like black stuff flying around in the air, so it’s pretty, pretty nasty.” Immigrant participants do not feel that air pollution was a large problem in the neighbourhood. The immigrant women
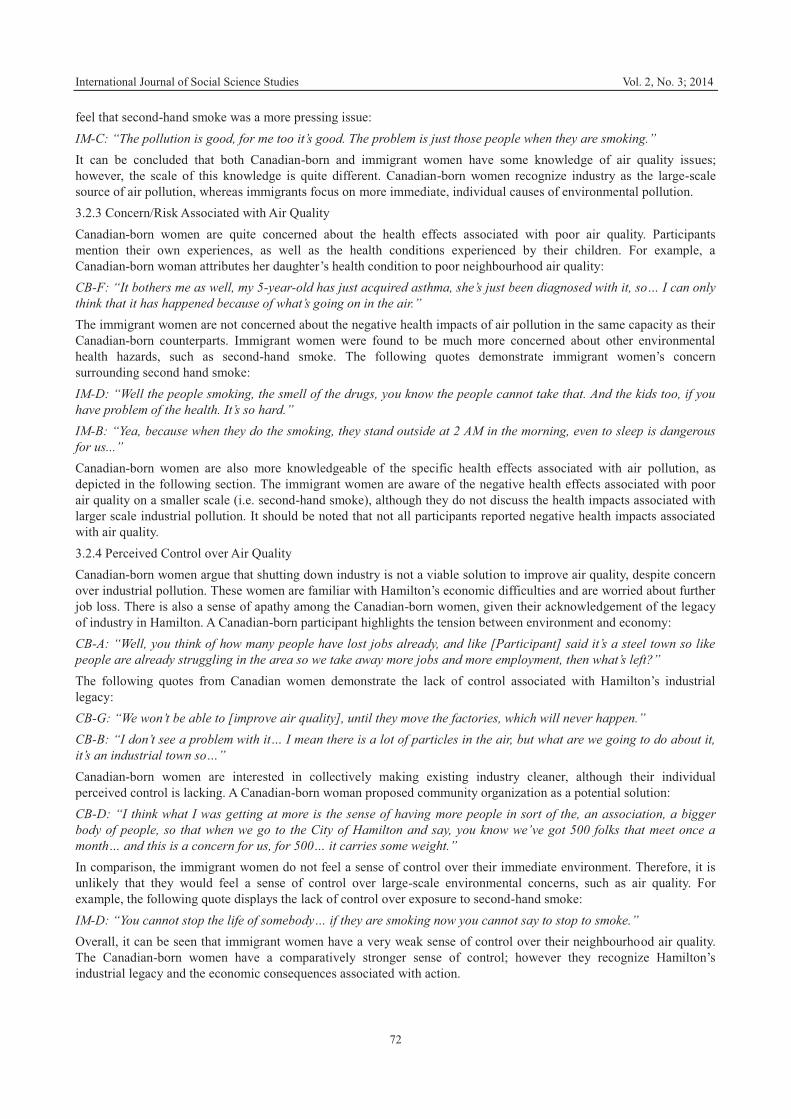
International Journal of Social Science Studies Vol. 2, No. 3; 2014
72
feel that second-hand smoke was a more pressing issue: IM-C: “The pollution is good, for me too it’s good. The problem is just those people when they are smoking.” It can be concluded that both Canadian-born and immigrant women have some knowledge of air quality issues; however, the scale of this knowledge is quite different. Canadian-born women recognize industry as the large-scale source of air pollution, whereas immigrants focus on more immediate, individual causes of environmental pollution. 3.2.3 Concern/Risk Associated with Air Quality Canadian-born women are quite concerned about the health effects associated with poor air quality. Participants mention their own experiences, as well as the health conditions experienced by their children. For example, a Canadian-born woman attributes her daughter’s health condition to poor neighbourhood air quality: CB-F: “It bothers me as well, my 5-year-old has just acquired asthma, she’s just been diagnosed with it, so… I can only think that it has happened because of what’s going on in the air.” The immigrant women are not concerned about the negative health impacts of air pollution in the same capacity as their Canadian-born counterparts. Immigrant women were found to be much more concerned about other environmental health hazards, such as second-hand smoke. The following quotes demonstrate immigrant women’s concern surrounding second hand smoke: IM-D: “Well the people smoking, the smell of the drugs, you know the people cannot take that. And the kids too, if you have problem of the health. It’s so hard.” IM-B: “Yea, because when they do the smoking, they stand outside at 2 AM in the morning, even to sleep is dangerous for us...” Canadian-born women are also more knowledgeable of the specific health effects associated with air pollution, as depicted in the following section. The immigrant women are aware of the negative health effects associated with poor air quality on a smaller scale (i.e. second-hand smoke), although they do not discuss the health impacts associated with larger scale industrial pollution. It should be noted that not all participants reported negative health impacts associated with air quality. 3.2.4 Perceived Control over Air Quality Canadian-born women argue that shutting down industry is not a viable solution to improve air quality, despite concern over industrial pollution. These women are familiar with Hamilton’s economic difficulties and are worried about further job loss. There is also a sense of apathy among the Canadian-born women, given their acknowledgement of the legacy of industry in Hamilton. A Canadian-born participant highlights the tension between environment and economy: CB-A: “Well, you think of how many people have lost jobs already, and like [Participant] said it’s a steel town so like people are already struggling in the area so we take away more jobs and more employment, then what’s left?” The following quotes from Canadian women demonstrate the lack of control associated with Hamilton’s industrial legacy: CB-G: “We won’t be able to [improve air quality], until they move the factories, which will never happen.” CB-B: “I don’t see a problem with it… I mean there is a lot of particles in the air, but what are we going to do about it, it’s an industrial town so…” Canadian-born women are interested in collectively making existing industry cleaner, although their individual perceived control is lacking. A Canadian-born woman proposed community organization as a potential solution: CB-D: “I think what I was getting at more is the sense of having more people in sort of the, an association, a bigger body of people, so that when we go to the City of Hamilton and say, you know we’ve got 500 folks that meet once a month… and this is a concern for us, for 500… it carries some weight.” In comparison, the immigrant women do not feel a sense of control over their immediate environment. Therefore, it is unlikely that they would feel a sense of control over large-scale environmental concerns, such as air quality. For example, the following quote displays the lack of control over exposure to second-hand smoke: IM-D: “You cannot stop the life of somebody… if they are smoking now you cannot say to stop to smoke.” Overall, it can be seen that immigrant women have a very weak sense of control over their neighbourhood air quality. The Canadian-born women have a comparatively stronger sense of control; however they recognize Hamilton’s industrial legacy and the economic consequences associated with action.
International Journal of Social Science Studies Vol. 2, No. 3; 2014
73
3.2.5 Neighbourhood Perceptions Both groups of women appear to be satisfied with their neighbourhood, mentioning safety, convenience, and services as important factors. For example, a Canadian-born participant explains that she is proud to live in the neighbourhood due to the number of resources available: CB-F: “So that tells you, like the area is slowly up and coming and I would say that I’m fairly proud of the neighbourhood …with the community centres that we have and the resources for the people in the community, how close we are, the barbeques at the park where the whole neighbourhood’s invited. You can live as far as Sherman and be able to come over this way. You know it’s a nice thing to be part of a neighbourhood that has so many resources.” An immigrant participant highlights the importance of neighbourhood safety: IM-E: “Yea, the safety and the community centre here.” The Canadian-born women seem fairly connected with their neighbours, despite issues with transience. The immigrant women are very connected within their ethnic communities, but not as connected with the Canadian population as a whole. A Canadian-born woman describes her close connections within the neighbourhood: CB-F: “And, you know we kind of watch out for each other and keep an eye, and you know who’s coming on the street, you know the regular vehicles that drive up and down so if you see a vehicle that you don’t know…” A second Canadian-born participant describes transiency as a barrier to forming neighbourhood connections: CB-D: “I wouldn’t have a clue about the names of any of my neighbours… ‘Cause of the transient nature of the building I’m in.” The following quote shows a lack of connection between the immigrant women and Canadian-born population: IM-A: “So many years I am in Canada, I don’t have any Canadian friend.” In summary, both groups have generally positive perceptions of their neighbourhood. However, both groups mention issues with neighbourhood connectedness. This was especially prevalent within the immigrant women’s focus group, highlighting a lack of connection with Canadian-born individuals. 3.2.6 Coping Mechanisms Both the Canadian-born and immigrant groups tend to employ problem-focused coping in response to their environmental perceptions. Coping mechanisms are often changes in individual behaviours, rather than reporting to higher authorities. A Canadian-born woman explains how she painted her house to cope with air quality issues: CB-A: “And it’s just the dust, like the front of my house, that’s why I painted it green. When I first moved there it was white and stuff like that and then I was done. And I have OCD [obsessive compulsive disorder] so I like to clean and I just, I quit, I couldn’t do it, I couldn’t keep up [laughter].” An immigrant participant alters her behaviour in response to poor air quality: IM-D: “We choose the place where to sit if the smell is at the front of the house, we choose to go in the back.” A number of participants in each group indicate that they had taken more proactive coping approaches by reporting to higher authorities; however, behaviour changes are much more prevalent. Three of the Canadian-born women acknowledge reporting air quality issues to the local government (bylaws), while one immigrant women reports air quality issues to her landlord. 4. Discussion Overall, the focus group discussions suggest that Canadian-born women may be more knowledgeable and aware of large-scale air quality issues in their neighbourhood. Furthermore, the Canadian-born women appear to be more concerned about air pollution and associated health impacts. Immigrant women were likely unaware of large-scale air quality issues due to their focus on more immediate environmental concerns. The majority of immigrant participants have low incomes, as shown in Table 1. Therefore, it can be reasoned that these individuals are also preoccupied with meeting basic needs. These findings support previous research, which suggested that individuals with low socioeconomic status are less likely to be aware of air quality and associated issues (Swan, 1970). Furthermore, these results support the postmaterialist thesis for environmental concern (Inglehart, 1995; Lovelock et al., 2013). It should also be noted that immigrant women compared the air quality in Canada to that of their home country, with some women acknowledging that the air is cleaner in Canada. The immigrant women might not recognize air quality as problematic in Canada since air quality issues are more salient in their home country (Schultz et al., 2000). Both groups tended to employ problem-focused coping mechanisms. In both cases, these mechanisms tended to be reactive (i.e. altering individual behaviours) rather than preventative (i.e. taking action to address the source of
International Journal of Social Science Studies Vol. 2, No. 3; 2014
74
pollution). It can be argued that their motivations for these actions differ, though both groups of women used similar coping mechanisms. It can be reasoned that immigrants are unaware of the sources of air pollution (i.e. industry) and thus cannot take preventative action. In comparison, the Canadian-born women are knowledgeable about the sources of pollution; however they are wary of the economic consequences associated with preventative action. Bringing the qualitative and quantitative analyses, it appears that individuals with a higher SoP (i.e. Canadian-born respondents) may be more aware, knowledgeable, and concerned about higher-level environmental issues in their neighbourhood (i.e. air quality). Based on this finding, it may be suggested that SoP informs environmental perceptions. This is in keeping with the known evidence described above, with respect to both research on the postmaterialist thesis (where it is suggested that immigrants have lower levels of environmental concern when compared to native residents) and SoP (where, again, immigrants are found to have lower evaluations when compared to native residents). Gallina and Williams (2014) suggest that increases in length of neighbourhood residence, median income, and age distribution would lead to stronger feelings of place amongst immigrant respondents. Therefore, assuming that immigrants follow the same trend as their Canadian-born counterparts, it may be expected that one would see an associated increase in environmental awareness, knowledge, and concern amongst immigrants if their SoP evaluations improve. This may translate into an increased commitment to address local environmental issues, as suggested by Kaltenborn (1998). Conversely, it is feasible that this could be a reciprocal relationship, where environmental perceptions also inform SoP. This relationship could be the focus of further research. 5. Conclusion This study addressed three research objectives: (1) to compare perceptions of air quality between immigrant and Canadian-born women; (2) to investigate coping strategies associated with poor air quality among these two groups; and, (3) to determine if evaluations of SoP inform perceptions of air quality. Canadian-born women had higher evaluations of SoP than immigrant women. Differences in air quality perceptions across the two sample populations may be attributed to: lower socioeconomic status among immigrant women; comparative views of air quality; and, relative variation in levels of environmental concern across countries (i.e. country of origin versus country of residence). It is concluded that SoP and environmental perceptions might inform one another in a reciprocal manner; however, it is likely that there are other factors that shape this relationship. There are a number of limitations to this study. One limitation of the study is that the focus groups were conducted in different neighbourhood areas due to difficulties with recruitment. The Canadian-born women were a more accessible population; a second neighbourhood was added to the recruitment strategy in order to reach the immigrant population, there may be other contextual factors influencing individual perceptions, even though the neighbourhood were near one another and similarly impacted by air pollution sources. It is recognized that those who have lived in Canada for a longer period of time might have different perceptions than those newly arriving in Canada. For the purposes of this study, immigrants are not sorted based on length of residence; however, it is noted that the majority of immigrants have lived in Canada for less than 10 years (Table 1). The respondents involved in the quantitative analysis were split between both genders; however, the focus groups involved only women. Originally, the researcher attempted to recruit both men and women for the focus groups; however, the male population was much more difficult to reach. As suggested in previous research, women may be more interested and concerned about the natural environmental and the potential impacts on their family (Stern et al., 1993; Momsen, 1999). Nevertheless, it is recognized that the results of this research are unique to the female population. Finally, it is very likely that emotion-focused strategies were not discussed in the focus group, possibly due to the lack of familiarity and comfort with the other participants. Greater emphasis is needed on immigrants’ environmental education and the relationship between environmental issues and human health so that they may cope with exposures accordingly. It is noted that, within the Canadian-born focus group, women acknowledged that when addressing local environmental issues, there is “power in numbers”, implying that there is an increased sense of control over such issues when working as a group, when compared to individuals themselves. Bringing this idea together with the recommendations above, it is suggested that Canadian-born individuals actively include immigrants in such efforts. The inclusion of immigrants in such efforts not only increases awareness of environmental issues, but may also increase immigrant commitment to place. Furthermore, the immigrants would add a unique perspective to community efforts, making such a proposition mutually beneficial. Further research could explore the motivations for chosen coping mechanisms, whether problem-focused (reactive or preventative) or emotion-focused, as mentioned above. Further research may also compare immigrants’ environmental perceptions based on their country of origin. Acknowledgements The authors would like to thank the research participants and the community members who made this research possible:
International Journal of Social Science Studies Vol. 2, No. 3; 2014
75
Ted Hodkinson, The Eva Rothwell Resource Centre, and, The Keith Neighbourhood Hub; David Derbyshire, The McQuesten Community Centre, and, The McQuesten Planning Team; and, Mission Services of Hamilton. The authors would also like to recognize the entire project team for their support: Nazeem Muhajarine, Bruce Newbold, James Randall, and Kathleen Wilson. This study was supported by the Social Sciences and Humanities Research Council of Canada (SSHRC), SSHRC Immigration and the Metropolis (No. 808-2011-0005). References Adams, M. D., DeLuca, P. F., Corr, D., & Kanaroglou, P. S. (2012). Mobile air monitoring: Measuring change in air
quality in the city of Hamilton, 2005–2010. Social Indicators Research, 108(2), 351-364. http://dx.doi.org/10.1007/s11205-012-0061-5
Baum, A., & Singer, J. E. (1982). Environment and health. Hillsdale, N.J.: L. Erlbaum Associates. Bell, P. A., & Fisher, J. D. (1990). Environmental psychology (3rd ed.). Fort Worth: Holt Rinehart and Winston. Bickerstaff, K., & Walker, G. (2001). Public understandings of air pollution: The ‘localisation’ of environmental risk.
Global Environmental Change, 11(2), 133-145. http://dx.doi.org/10.1016/S0959-3780(00)00063-7 Bush, J., Moffatt, S., & Dunn, C. (2001). ‘Even the birds round here cough’: Stigma, air pollution and health in Teesside.
Health & Place, 7(1), 47-56. http://dx.doi.org/10.1016/S1353-8292(00)00037-X Buzzelli, M., & Jerrett, M. (2004). Racial gradients of ambient air pollution exposure in Hamilton, Canada.
Environment and Planning, 36, 1855-1876. http://dx.doi.org/10.1068/a36151 Buzzelli, M., Jerrett, M., Burnett, R., & Finklestein, N. (2003). Spatiotemporal perspectives on air pollution and
environmental justice in Hamilton, Canada, 1985–1996. Annals of the Association of American Geographers, 93(3), 557-573. http://dx.doi.org/10.1111/1467-8306.9303003
Crowe, M. J. (1968). Toward a “Definitional model” of public perceptions of air pollution. Journal of the Air Pollution Control Association, 18(3), 154-157. http://dx.doi.org/10.1080/00022470.1968.10469106
Eby, J., Kitchen, P., & Williams, A. (2012). Perceptions of quality life in Hamilton’s neighbourhood hubs: A qualitative analysis. Social Indicators Research, 108(2), 299-315. http://dx.doi.org/10.1007/s11205-012-0067-z
Elliott, S., Cole, D., Krueger, P., Voorberg, N., & Wakefield, S. (1999). The power of perception: Health risk attributed to air pollution in an urban industrial neighbourhood. Risk Analysis, 19(4), 621-634. http://dx.doi.org/10.1111/j.1539-6924.1999.tb00433.x
Elliott, S. J., Taylor, S. M., Hampson, C., Dunn, J., Eyles, J., Walter, S., & Streiner, D. (1997). ‘It’s not because you like it any better...’: Residents' reappraisal of a landfill site. Journal of Environmental Psychology, 17(3), 229-241. http://dx.doi.org/10.1006/jevp.1997.0055
Evans, G. W., & Jacobs, S. V. (1982). Air pollution and human behavior. In G. W. Evans (Ed.), (pp. 105-132). Cambridge: Cambridge University Press.
Finucane, M. L., Slovic, P., Mertz, C. K., Flynn, J., & Satterfield, T. A. (2000). Gender, race, and perceived risk: The 'white male' effect. Health, Risk & Society, 2(2), 159-172. http://dx.doi.org/10.1080/713670162
Flynn, J., Slovic, P., & Mertz, C. K. (1994). Gender, race, and perception of environmental health risks. Risk Analysis, 14(6), 1101-1108. http://dx.doi.org/10.1111/j.1539-6924.1994.tb00082.x
Gallina, M., & Williams, A. (2014) Variations in Sense of Place across Immigrant Status and Gender in Hamilton, Ontario; Saskatoon, Saskatchewan; and, Charlottetown, Prince Edward Island, Canada. Social Indicators Research, DOI: 10.1007/s11205-014-0636-4. http://dx.doi.org/10.1007/s11205-014-0636-4
Hay, I. (2010). Qualitative Research Methods in Human Geography (3rd ed.). New York, NY: Oxford University Press. Hernández, B., Carmen Hidalgo, M., Salazar-Laplace, M. E., & Hess, S. (2007). Place attachment and place identity in
natives and non-natives. Journal of Environmental Psychology, 27(4), 310-319. http://dx.doi.org/10.1016/j.jenvp.2007.06.003
Hidalgo, M. C., & Hernandez, B. (2001). Place attachment: Conceptual and empirical questions. Journal of Environmental Psychology, 21(3), 273-281. http://dx.doi.org/10.1006/jevp.2001.0221
Inglehart, R. (1995). Public support for environmental protection: Objective problems and subjective values in 43 societies. PS: Political Science and Politics, 28(1), 57-72. http://dx.doi.org/10.1017/S1049096500056080
James, J., & Eyles, J. (1999). Perceiving and representing both health and the environment: An exploratory
International Journal of Social Science Studies Vol. 2, No. 3; 2014
76
investigation. Qualitative Health Research, 9(1), 86-104. http://dx.doi.org/10.1177/104973299129121712 Jerrett, M., Burnett, R. T., Kanaroglou, P., Eyles, J., Finkelstein, N., Giovis, C., & Brook, J. R. (2001). A GIS -
environmental justice analysis of particulate air pollution in Hamilton, Canada. Environment and Planning, 33(6), 955-973. http://dx.doi.org/10.1068/a33137
Kaltenborn, B. P. (1998). Effects of sense of place on responses to environmental impacts: A study among residents in Svalbard in the Norwegian high Arctic. Applied Geography, 18(2), 169-189. http://dx.doi.org/10.1016/S0143-6228(98)00002-2
Lazarus, R. S., & Folkman, S. (c1984). Stress, appraisal, and coping. New York: Springer Pub. Co. Lovelock, B., Jellum, C., Thompson, A., & Lovelock, K. (2013). Could immigrants care less about the environment? A
comparison of the environmental values of immigrant and native-born New Zealanders. Society & Natural Resources, 26(4), 402-419. http://dx.doi.org/10.1080/08941920.2012.697979
Mayo, S., & Fraser, M. (2009). Incomes and poverty in Hamilton. Hamilton, ON: Social Planning & Research Council of Hamilton.
Mayo, S., & Pike, D. (2013). The rich and the rest of us. Hamilton, ON: Social Planning & Research Council of Hamilton.
Meegan, R., & Mitchell, A. (2001). 'It's Not Community Round Here, It's Neighbourhood': Neighbourhood Change and Cohesion in Urban Regeneration Policies. Urban Studies, 38(12), 2167-2194. http://dx.doi.org/10.1080/00420980120087117
Momsen, J. H. (2000). Gender differences in environmental concern and perception. Journal of Geography, 99(2), 47-56. http://dx.doi.org/10.1080/00221340008978956
Schultz, P. W., Unipan, J. B., & Gamba, R. J. (2000). Acculturation and ecological worldview among Latino Americans. The Journal of Environmental Education, 31(2), 22-27. http://dx.doi.org/10.1080/00958960009598635
Shankardass, K. (2012). Place-based stress and chronic disease: A systems view of environmental determinants. In P. O'Camps, & J. R. Dunn (Eds.), Rethinking social epidemiology: Towards a science of change (pp. 113-136) Springer Science & Business. http://dx.doi.org/10.1007/978-94-007-2138-8_6
Statistics Canada. (2012). Hamilton, Ontario (Code 3525005) and Hamilton, Ontario (Code 3525) (table). Census Profile. 2011 Census. Statistics Canada Catalogue no. 98-316-XWE. Ottawa. Released May 29, 2012. http://www12.statcan.gc.ca/census-recensement/2011/dp-pd/prof/index.cfm?Lang=E. Accessed July 27 2012.
Stedman, R. (2003). Is it really just a social construction?: The contribution of the physical environment to sense of place. Society & Natural Resources, 16(8), 671-685. http://dx.doi.org/10.1080/08941920309189
Stern, P. C., Dietz, T., & Kalof, L. (1993). Value orientations, gender, and environmental concern. Environment and Behavior, 25(5), 322-348. http://dx.doi.org/10.1177/0013916593255002
Swan, J. (1970). Response to air pollution. Environment and Behavior, 2(2), 127-152. http://dx.doi.org/10.1177/001391657000200201
Vaske, J. J., & Kobrin, K. C. (2001). Place attachment and environmentally responsible behavior. The Journal of Environmental Education, 32(4), 16-21. http://dx.doi.org/10.1080/00958960109598658
Vorkinn, M., & Riese, H. (2001). Environmental concern in a local context the significance of place attachment. Environment and Behavior, 33(2), 249-263. http://dx.doi.org/10.1177/00139160121972972
Wakefield, S. E., Elliott, S. J., Cole, D. C., & Eyles, J. D. (2001). Environmental risk and (re) action: Air quality, health, and civic involvement in an urban industrial neighbourhood. Health & Place, 7(3), 163-177. http://dx.doi.org/10.1016/S1353-8292(01)00006-5
Williams, A., Kitchen, P., DeMiglio, L., Eyles, J., & Newbold, B. (2010). Sense of place in Hamilton, Ontario: Empirical results of a neighbourhood-based survey. Urban Geography, 31(7), 905-931. http://dx.doi.org/10.2747/0272-3638.31.7.905
Williams, A., & Kitchen, P. (2012). Sense of place and health in Hamilton, Ontario: A case study. Social Indicators Research, 108(2), 257-276. http://dx.doi.org/10.1007/s11205-012-0065-1
Wylie, J. (2009). Sense of place. In D. Gregory, R. Johnston, G. Pratt, M. J. Watts & S. Whatmore (Eds.), The dictionary of human geography (5th ed., pp. 676). Chichester, UK: Wiley-Blackwell.
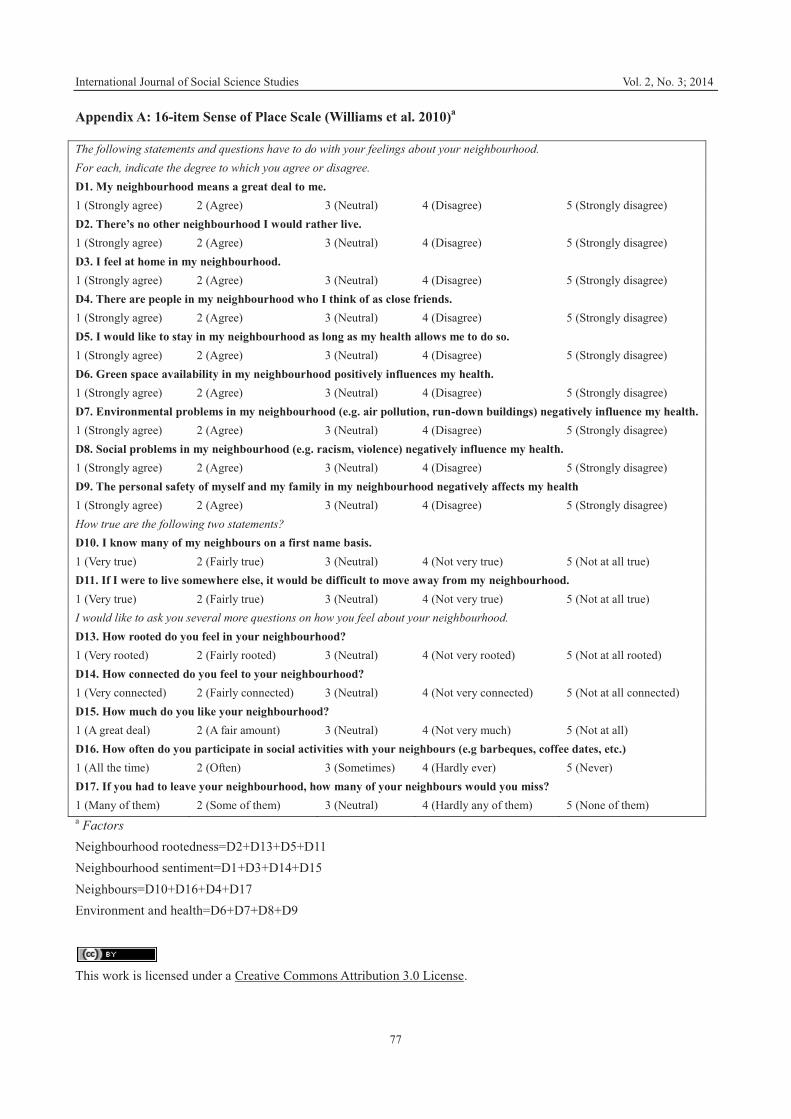
International Journal of Social Science Studies Vol. 2, No. 3; 2014
77
Appendix A: 16-item Sense of Place Scale (Williams et al. 2010)a The following statements and questions have to do with your feelings about your neighbourhood. For each, indicate the degree to which you agree or disagree. D1. My neighbourhood means a great deal to me. 1 (Strongly agree) 2 (Agree) 3 (Neutral) 4 (Disagree) 5 (Strongly disagree) D2. There’s no other neighbourhood I would rather live. 1 (Strongly agree) 2 (Agree) 3 (Neutral) 4 (Disagree) 5 (Strongly disagree) D3. I feel at home in my neighbourhood. 1 (Strongly agree) 2 (Agree) 3 (Neutral) 4 (Disagree) 5 (Strongly disagree) D4. There are people in my neighbourhood who I think of as close friends. 1 (Strongly agree) 2 (Agree) 3 (Neutral) 4 (Disagree) 5 (Strongly disagree) D5. I would like to stay in my neighbourhood as long as my health allows me to do so. 1 (Strongly agree) 2 (Agree) 3 (Neutral) 4 (Disagree) 5 (Strongly disagree) D6. Green space availability in my neighbourhood positively influences my health. 1 (Strongly agree) 2 (Agree) 3 (Neutral) 4 (Disagree) 5 (Strongly disagree) D7. Environmental problems in my neighbourhood (e.g. air pollution, run-down buildings) negatively influence my health. 1 (Strongly agree) 2 (Agree) 3 (Neutral) 4 (Disagree) 5 (Strongly disagree) D8. Social problems in my neighbourhood (e.g. racism, violence) negatively influence my health. 1 (Strongly agree) 2 (Agree) 3 (Neutral) 4 (Disagree) 5 (Strongly disagree) D9. The personal safety of myself and my family in my neighbourhood negatively affects my health 1 (Strongly agree) 2 (Agree) 3 (Neutral) 4 (Disagree) 5 (Strongly disagree) How true are the following two statements? D10. I know many of my neighbours on a first name basis. 1 (Very true) 2 (Fairly true) 3 (Neutral) 4 (Not very true) 5 (Not at all true) D11. If I were to live somewhere else, it would be difficult to move away from my neighbourhood. 1 (Very true) 2 (Fairly true) 3 (Neutral) 4 (Not very true) 5 (Not at all true) I would like to ask you several more questions on how you feel about your neighbourhood. D13. How rooted do you feel in your neighbourhood? 1 (Very rooted) 2 (Fairly rooted) 3 (Neutral) 4 (Not very rooted) 5 (Not at all rooted) D14. How connected do you feel to your neighbourhood? 1 (Very connected) 2 (Fairly connected) 3 (Neutral) 4 (Not very connected) 5 (Not at all connected) D15. How much do you like your neighbourhood? 1 (A great deal) 2 (A fair amount) 3 (Neutral) 4 (Not very much) 5 (Not at all) D16. How often do you participate in social activities with your neighbours (e.g barbeques, coffee dates, etc.) 1 (All the time) 2 (Often) 3 (Sometimes) 4 (Hardly ever) 5 (Never) D17. If you had to leave your neighbourhood, how many of your neighbours would you miss? 1 (Many of them) 2 (Some of them) 3 (Neutral) 4 (Hardly any of them) 5 (None of them) a Factors Neighbourhood rootedness=D2+D13+D5+D11 Neighbourhood sentiment=D1+D3+D14+D15 Neighbours=D10+D16+D4+D17 Environment and health=D6+D7+D8+D9
This work is licensed under a Creative Commons Attribution 3.0 License.
International Journal of Social Science Studies Vol. 2, No. 3; July 2014
ISSN 2324-8033 E-ISSN 2324-8041 Published by Redfame Publishing
URL: http://ijsss.redfame.com
78
Effects of Mentoring and Assertiveness Training on Adolescents’ Self-Esteem in Lagos State Secondary Schools
Bola O. Makinde & Akin Jonathan Akinteye Faculty of Education, University of Lagos, Nigeria Correspondence: Bola O. Makinde, Faculty of Education, University of Lagos, Nigeria Received: July 22, 2013 Accepted: August 5, 2013 Available online: June 12, 2014 doi:10.11114/ijsss.v2i3.438 URL: http://dx.doi.org/10.11114/ijsss.v2i3.438 Abstract The study investigated the effects of Mentoring and Assertiveness Training on Adolescents’ self-esteem in Lagos State secondary schools. A total of 96 adolescents (48males and 48 females) drawn from three public schools randomly selected from three Education Districts in Lagos State constituted the final sample. The dependent variables for this study were self-worth and gender. Descriptive survey and quasi-experimental design using the pre-test post-test control group design were adopted for the study. Two instruments used to generate data for the study were: Adolescents’ Personal Data Questionnaire (APDQ) and Rosenberg Self-Esteem Scale (RSE. Two research questions were raised and two corresponding hypotheses were formulated to guide the study. The two hypotheses were tested using the one-way Analysis of Covariance (ANCOVA) at 0.05 levels of significance. Hypotheses 1 was rejected while hypothesis 2 was accepted. The findings revealed that mentoring and assertiveness training were efficacious in raising adolescents’ self-esteem. The study also found that the significant effect of mentoring and assertiveness training on adolescents’ self-esteem was not due to gender. In the light of these findings, a number of recommendations were made, one of which is that teachers and schools’ management should promote peer-mentoring programme in schools because of the numerous advantages it has over traditional mentoring. Keywords: mentoring, assertiveness training, self-Esteem 1. Introduction/Background Adolescence is the period of transition from childhood to adulthood that is usually accompanied by rapid physiological changes and demands for new social roles. Due to these changes, particularly when an adolescent is unable to transit successfully, he tends to manifest some unhelpful psychological, emotional and behavioural consequences such as low self-worth, lack of self-confidence, unassertiveness, social-anxiety, depression, eating disorder and others. Therefore, understanding self-esteem is basic to understanding adolescence because the level of self- esteem affects all aspects of a person’s life and the ability to maximize one’s potential (Coopersmith, 2002). Branden (1969) defined self-esteem as the experience of being competent to cope with the basic challenges of life and being worthy of happiness. It is in line with this definition that Mruk (2006) concluded that it is the relationships between competence and worthiness that is at the heart of self-esteem. Going by the definition and description above, self-esteem has cognitive, affective and evaluative elements. The affective component is delineated by the fact that self-esteem is both directional (negative or positive) and variant in its intensity, while the underlying thought process towards the self-either specifically or in totality- form the cognitive component of self-esteem. According to Mruk (2006), high self-esteem correlates positively with rationality, realism, intuitiveness, creativity, independence, flexibility, ability to manage change, willingness to admit mistakes, benevolence and cooperation. Low self-esteem correlates with irrationality, blindness to reality, rigidity, fear of the new and unfamiliar, low self-worth, lack of self- confidence, social-anxiety, depression, feelings of inadequacy, inappropriate conformity or inappropriate rebelliousness, defensiveness, an overly compliant or controlling behaviour and fear of or hostility toward others. Going by Branden and Mruk’s view on self-esteem, the focus of any intervention to raising self- esteem should be on increasing worthiness and competence. It is on this note that the researcher considered mentoring and assertiveness training as possible intervention strategies for raising adolescent self-esteem (worthiness and competence) of adolescents.
International Journal of Social Science Studies Vol. 2, No. 3; 2014
79
Mentoring, which is a neglected technique for increasing low self-esteem is a relationship in which the adult provides ongoing guidance, instruction and encouragement aimed at developing the competence and character of the protégé (Rhodes, 2002).. Akinteye, (2012) posits that mentoring can be traditional, group, peer, electronic or reverse. He also noted that in peer-mentoring, mentees often feel freer to express ideas, ask questions and take risks because peers are closer in age, knowledge, authority and cognitive development than adult mentors. These similarities often make it easier for mentors to understand personal problems that the mentee may be experiencing and present solutions in a more empathetic, understanding and relevant way. Judging from the above assertions, peer-mentoring can impact on the adolescents in terms of increased academic achievement, improved interpersonal skills, personal development and increased opportunity to learn by imitation. Assertiveness training on the other hand has been explained by Okoli (2002) as a form of communication in which needs or wishes are stated clearly with respect for oneself and the other person in an interaction. Okoli (2002) further explained that assertiveness training is a training used in helping people to reduce their fear of acting appropriately in social and interpersonal situations. Assertiveness training techniques include broken records, fogging, free information, self-disclosure, negative assertion, transactional analysis, role-playing and modeling. Although the concept of self-esteem has its origin in American culture (James, 1890; Branden, 1969; Rosenberg, 1965), it has become a common feature in Nigerian literature and settings. According to Osarenren, Ubangha & Oke (2008), study of self- esteem has become necessary because of the implications of high and low self-esteem has on individuals. Youth restiveness, violent behaviour, hooliganism, gangsterism, poor academic performance are some of the problems associated with low self-esteem and are prevalent among adolescents in Nigerian secondary schools, hence the need to investigate the effectiveness of mentoring and assertiveness training for treating the problems of low self-esteem and its attendant consequences. 2. Statement of the Problem To persons with low self-esteem, many things come into play and many things appear as consequences of this condition. These include low self-worth, lack of self- confidence, social- anxiety, depression, eating disorder, poor communication, poor performance and poor social life (Mecca, Smelser & Vasconcellos, 1989). It is also disturbing to note that people with low self-esteem are always hyper-vigilant, as they are constantly anxious and fearful of making mistakes and overtly anxious of the behaviour of others. They are rarely assertive, as they are often too fearful of upsetting others, to tell the truth, ask for what they want, or share their feelings. Instead, they become passive until their anger builds up at points which they become aggressive, defensive, sarcastic, rude or violent as it is the case with domestic, gang and teen violence (Baumeister, Campbell, Krueger and Vohs (2003). Equally worrisome are other problems associated with low self-esteem such as eating disorder, mind reading and projection, obsessive and addictive behaviour, overly critical of self and others, reactionary, rigidity, self-focused and unreasonable expectations (Baumeister, et. al, 2003). 3. Theoretical Framework There are three theoretical considerations to this study, namely: 1. Psychosocial Development Theory by Erikson 1968) 2. Self- Discrepancy Theory by Higgins (1987) 3. Social Development Theory by Lev - Vygostky (1978). 4. Erikson’s Psychosocial Development Theory Erikson (1968) believed that personality develops in a series of stages. Erikson's theory describes the impact of social experience across the whole lifespan. One of the main elements of Erikson's psychosocial stage theory is the development of ego identity. Ego identity is the conscious sense of self that we develop through social interaction. In addition to ego identity, Erikson also believed that a sense of competence motivates behaviours and actions. Erikson (1968) outlined eight stages of psychosocial development in his theory. The goal of the first four stages—trust, autonomy, initiative and industry—is to create the foundation for the successful negotiation of the fifth stage in which the adolescent must form a stable identity and achieve a sense of self. While social issues such as "fitting in with the group" are important at this point, Erikson (1968) emphasizes the importance of achieving an individual identity based on self-knowledge and continuity of experience. The core concept of Erikson's theory is the acquisition of an ego-identity and the identity crisis is the most essential characteristic of adolescence. Although a person's identity is established in ways that differ from culture to culture, the
International Journal of Social Science Studies Vol. 2, No. 3; 2014
80
accomplishment of this developmental task has a common element in all cultures. In order to acquire a strong and healthy ego-identity, the child must receive consistent and meaningful recognition of his achievements and accomplishments. In other words, if the adolescent is not supported in his transition drive, instead of identity formation, the individual will have identity confusion leading to low self-worth, lack of self-confidence and social-anxiety. The adolescents in the current study who failed to achieve developmental task of identity formation as postulated by Erikson (1968) often develop low self-esteem which this study sought to address through mentoring and assertiveness training. 5. Self-Discrepancy Theory Self-discrepancy theory, according to Higgins (1987) states that people compare themselves to internalized standards called self-guide. This different representation of the self can be contradictory and result in emotional discomfort such as low self-evaluation and anxiety in social situations. Self-discrepancy is the gap between two of this self-presentations. Higgins theorized that self-esteem depends on self-guides or personal standards that individuals like to meet. Discrepancies between self-guides and how things are actually going for an individual cause negative emotions such as anxiety or sadness and possibly low self-esteem. Higgins (1987) describes three types of self-domains: (1) the “actual self” which is one's representation of the attributes that are believed (by oneself or another) to be possessed by an individual; (2) the “ideal self” which is one's representation of the attributes that someone (either oneself or another) would like one to possess; and (3) the “ought self” which refers to the attributes that someone (oneself or another) believes one should possess. When the gap between the actual self and the ideal self is wide and the individual is unable to satisfy that domain of contingencies, there is bound to be a general discontent and internal crisis leading to low self-esteem. This position is in line with the concept of low self-esteem which is a subjective self-evaluation of self. This evaluation is usually based on perceived conflict between ideal self and actual self. The current study attempts to remediate low self-esteem developed by adolescents which could have been caused by self-discrepancies. 6. Social Development Theory The work of Lev Vygotsky (1978) has become the foundation of much research and theory in cognitive development over the past several decades, particularly of what has become known as Social Development Theory. Vygotsky's theories stress the fundamental role of social interaction in the development of cognition (Vygotsky, 1978), as he believed strongly that community plays a central role in the process of "making meaning." In order to gain an understanding of Vygotsky's theories on cognitive development, one must understand two of the main principles of Vygotsky's work: the More Knowledgeable Other (MKO) and the Zone of Proximal Development (ZPD). 7. More Knowledgeable Other The more knowledgeable other (MKO) refers to someone who has a better understanding or a higher ability level than the learner with respect to a particular task, process, or concept. Although the implication is that the MKO is a teacher or an older adult, this is not necessarily the case. Many times, a child's peers or an adult's children may be the individuals with more knowledge or experience. Nevertheless, the MKO need not be a person at all because electronic tutors have also been used in educational settings to facilitate and guide students through the learning process. The key to MKOs is that they must have (or be programmed with) more knowledge about the topic being learned than the learner does. 8. Zone of Proximal Development The concept of the More Knowledgeable Other is integrally related to the second important principle of Vygotsky's work, the Zone of Proximal Development. This is an important concept that relates to the difference between what a child can achieve independently and what a child can achieve with guidance and encouragement from a skilled partner. Vygotsky (1978) sees the Zone of Proximal Development as the area where the most sensitive instruction or guidance should be given - allowing the child to develop skills they will then use on their own - developing higher mental functions. Vygotsky (1978) also views interaction with peers as an effective way of developing skills and strategies. He suggests that teachers use cooperative learning exercises where less competent children develop with help from more skillful peers - within the zone of proximal development. Vygotsky's theories also feed into current interest in collaborative learning, suggesting that group members should have different levels of ability so more advanced peers help the less advanced peers. The two principles of Vygostky’s theory which are learning involving a more knowledgeable other (MKO) and the Zone of Proximal Development (ZPD) describes peer-mentoring which the researcher used as intervention strategy for modifying low self- esteem.
International Journal of Social Science Studies Vol. 2, No. 3; 2014
81
9. Purpose of the Study The primary purpose of the study is to determine the effect of mentoring and assertiveness training on adolescents’ self-esteem in Lagos State secondary schools. Specifically, the purpose of the study is to: 1. Evaluate the effect of experimental conditions (mentoring, assertiveness training and control) on participants’ post-test self-esteem. 2. Examine the effect of experimental conditions on participants’ self-esteem due to gender. 10. Research Questions The following questions were raised to guide the study: 1. Would there be any significant difference in the post-test self-esteem of participants in the three experimental groups (mentoring, assertiveness training and control group)? 2. Would there be any significant difference in post-test self-esteem of participants in the three experimental groups due to gender? 11. Research Hypotheses The following hypotheses were formulated: 1. There is no significant difference in the post-test mean scores of participants’ self- esteem in the three experimental conditions (mentoring, assertiveness training and control group). 2. There is no significant difference in post-test mean scores of participants’ self-esteem in the three experimental groups due to gender. 12. Significance of the Study 1. The findings of this study would be of immense benefits to the adolescents because it would equip them with the strategies for dealing with problems of low self-esteem and its related consequences. 2. The findings will exposed the need for peer-mentoring and assertiveness training programmes in secondary schools as tools for assisting adolescents in coping with challenges associated with developmental transition from childhood to adulthood. 13. Scope of the Study The study covered a sample of Nigerian adolescents whose ages ranged between 12 and 20 years who are resident in Lagos State. The participants were drawn from senior secondary schools from three of the six education districts in Lagos State. This study was delimited to gender and self-esteem (self-worth). In addition, the treatment of low self-esteem was restricted to the use of peer-mentoring and assertiveness training. 14. Literature Review 14.1 Self-Concept and Self-Esteem Teachers, administrators and parents commonly express concerns about students’ self-esteem. Its significance is often exaggerated to the extent that low self-esteem is viewed as the cause of all evil and high self-esteem as the cause of all good (Manning, Bear & Minke, 2006). Promoting high self-concept is important because it relates to academic and life success, but before investing significant time, money and effort on packaged programmes, principals should understand why such endeavours have failed and what schools can do to effectively foster students’ self-esteem and self-concept. Although the terms self-concept and self-esteem are often used interchangeably, they represent different but related constructs. Self-concept refers to a student’s perceptions of competence or adequacy in academic and nonacademic (such as social, behavioural and athletic) domains and is best represented by a profile of self-perceptions across domains. Self-esteem is a student’s overall evaluation of himself or herself, including feelings of general happiness and satisfaction (Harter, 1999). Simply put, self-concept is the descriptive aspect of the self, while self-esteem is the evaluative part of the self. 15. Effects of Gender on Adolescents’ Self-Esteem Gender is generally assumed to impact upon the growth, demonstration and manifestation of self-esteem. Several researchers studied self-esteem and gender among students and found that there is a significant difference in self-esteem between male and female students (Sar Abadani Tafreshi, 2006). Several studies indicate that sex differences exist among adolescents’ self-esteem (Groer, Thomas & Shoffner, 2002; Cooper & Sheldom, 2002). More specifically, girls tend to report significantly more negative self-esteem life than boys
International Journal of Social Science Studies Vol. 2, No. 3; 2014
82
across all ages of adolescence as well as higher levels of stress. Consistent with this finding, Plunkett, Radmacher & Moll-Phanara (2000) studied among 207 high school students and they found that adolescent girls reported higher levels of self-esteem and more use of coping strategies than boys. Block and Robins (1993) discovered gender differences in self-esteem. They found that self-esteem was interpersonally oriented for adolescent girls, while for boys self-esteem was person-oriented. Thus, while self-esteem was related to the masculine trait of unique superiority for boys, high self-esteem was related to interconnectedness with others for adolescent girls (Joseph, Marcus & Tafarodi, 2006). According to Greenberg (2001), the loss of self-esteem for adolescent females is directly connected to their academic achievement and career goals. This finding is corroborated by Niregi (2000) that gender differences in student self-concept toward science learning were related to their actual success in science courses. He also found that female students possessed greater feelings of inadequacy for achievement than did their male classmates. In another research conducted by Taylor, Peplau & Sears (2000), it was found that there are no significant differences in academic self-esteem between adolescence boys and girls. 16. The Concept of Mentoring and Peer-mentoring According to Donaldson, Ensher and Grant-Vallone (2000), mentoring is a term generally used to describe a relationship between a less experienced individual called a mentee or protégé and a more experienced individual known as a mentor. Donaldson et al. (2000) viewed mentoring as a dyadic, face-to-face, long-term relationship between a supervisory adult and a novice student that fosters the mentee’s professional, academic or personal development. Stephen and Gareth (1999) described mentoring as a process where one person offers help, guidance, advice and support to facilitate the learning or development of another person. Inerhumwunwa (2009) opined that mentoring relationship is between a mentor and a mentee or protégé (a person guided and protected by a more experienced person). It is important to acknowledge that the term “mentor” is borrowed from the male guide, Mentor, in Greek mythology, and this historical context has informed traditional manifestations of mentoring. Akinteye, (2012) hinted that peer mentors should not be confused with prefects (students who have been given limited, trusty-type authority over other students). Peer-mentoring is a good way of practising social skills for the mentor and helps the mentee adapt to a new setting. Most peer mentors are picked for their sensibility, confidence, social skills and reliability (Bozeman & Feeney, 2007). 17. The Concept of Assertiveness and Assertiveness Training According to Sully and Dallas (2005), assertiveness is the ability to express one’s feeling and assert one’s right while respecting the feelings and right of others and the core of interpersonal behaviour and a key to human relations. Okoli (2002) defined assertiveness as the proper expression of emotion other than anxiety, openness, directness, spontaneity and appropriateness. Olayinka and Omoegun (2001) described assertiveness as standing up for one’s right and expressing one’s thoughts as well as feelings in a direct, honest and appropriate manner. It is the ability to represent to the world what you really are, to express what you feel when you feel it is necessary. It is the ability to express your feelings and your rights, respecting the feelings and rights of others. Akinteye (2012) opined that if well-taught, assertiveness training can help the adolescent to recognize when they are being abused or maneuvered for someone else's benefit and how to resist such treatment effectively without becoming angry and aggressive. It emphasizes the value of clear, calm, frank communication as a means of establishing relationships in which everyone knows where they stand and no-one feels ill-used. 18. Methodology 18.1 Research Design The research designs adopted for this study are descriptive survey (comparison of the pre and post-test) and quasi- experimental pretest- post-test control group design. Quasi-experimental design is a design in which experimental participants are assigned randomly from a common population to the experimental and the control groups. 18.2 The Study Area The study was carried out in Lagos State. The research area was chosen because Lagos is a metropolitan city with high density population of adolescents from all parts of the country. According to the Lagos State Digest of Statistics (2011), Lagos State has 20 Local Government Areas, 37 Local Council Development Areas (LCDA) and 254,238 students in the 305 Senior Secondary Schools in the State (125,350 male; 129, 238 female).
International Journal of Social Science Studies Vol. 2, No. 3; 2014
83
18.3 Population The target population comprised all the adolescents in Senior Secondary School two (SS2) in Lagos State. SS 2 students were used for this study because they are considered to be free from the pressure associated with the Senior Secondary School Examinations and other examinations. 18.4 Sample and Sampling Procedure Participants for the study were randomly drawn from three of the six Education Districts in Lagos State. Multistage simple random sampling technique was used to select participants for this study 18.5 Instrumentation Adolescents Personal Data Questionnaire (APDQ) and Rosenberg Self-Esteem Scale (RSE) were used to gather data for this study. 18.6 Data Collection Procedure The pre-test was carried out two weeks before the experimental treatments. All experimental participants were exposed to 6 treatment sessions spread over 6weeks with an average of two hours per session. The post treatment session was carried out two weeks after the last treatment session, making eight weeks in all per treatment. 19. Treatment Programme 19.1 Mentoring Session I – Matching of the Mentors with mentees and introduction to mentoring. The researcher matched the mentors with mentees. Socio-gram was used to do the matching. The researcher discussed the concept of mentoring and self-esteem with both the mentors and the participants. Rules and regulations guiding the programme were reinforced during this meeting. Questions were asked and the researcher responded appropriately. Session II: Use of Role-Model/Peer-Model. Researcher met with the mentors to discuss the content of their log book. Mentors discussed and role-played some of the steps for increasing self-esteem with the participants. Self help handout containing steps for raising self-esteem were given to the participants. Mentors served as role-play partners. Mentees were instructed to start conversation with an unfamiliar person in anxiety provoking social situation. Mentees were instructed to concentrate on both verbal and non verbal aspects of the role models as they demonstrate eye contact and engage in communication. Session III: Social-skills training. The researcher met with the mentors before the mentors met with the mentees. The mentor introduced the mentees to the concept of social skills. Its meaning, examples of social skills and characteristics of people who lack social skills were discussed. It was an interactive session. Session IV: Increasing competence through problem Solving. The researcher met with the mentors to assess and review the activities of the previous week. The researcher also used the platform to discuss some problem-solving techniques with the mentors ahead of the activities of session. Mentors discussed and role-played problem solving techniques with the mentees. Session V: Increasing worthiness by removing self-esteem traps. The researcher met with the mentors to assess and review the activities of the previous sessions. The mentors used the opportunity to discuss how to increase worthiness by removing negative thoughts that can cause low self- esteem. Mentees were asked to describe who they are as individuals (Self- disclosure). Session VI: Summary and Revision: The mentors reviewed the activities of the previous sessions with the mentees. Mentors gave mentees opportunity to comment on the mentoring sessions and how they have benefited from it. Mentees were asked to make contributions with examples of self-esteem traps. The treatment session was terminated. 19.2 Assertiveness Training Session I: The researcher introduced the concept of assertiveness, described some misconceptions about assertiveness, reasons why individuals become unassertive, effects of not being assertive and what factors stop people from being assertive. Session II: The goal of this session was to show the participants how to recognize the differences between passive, aggressive and assertive communication and introduced the verbal and non-verbal characteristics of each communication style. The researcher demonstrated assertive behaviour in a role- playing situation. Session III: The researcher introduced the concept of how adolescents’ thinking can stop them from being assertive. He
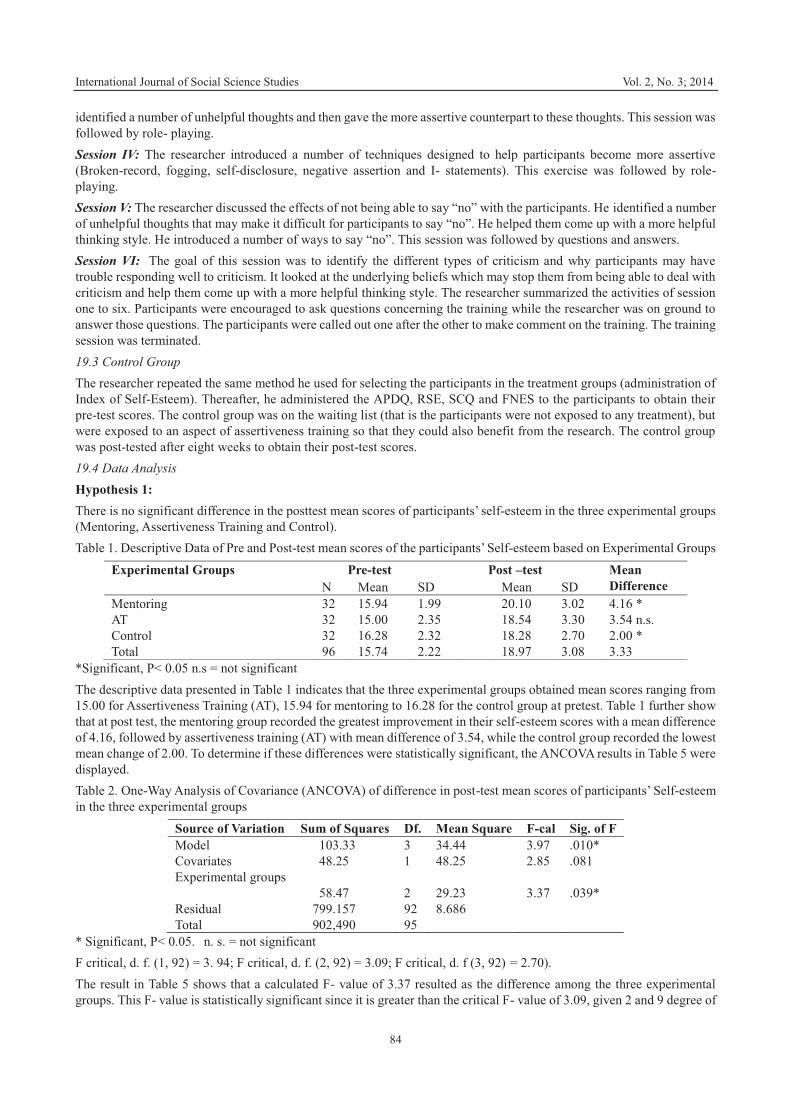
International Journal of Social Science Studies Vol. 2, No. 3; 2014
84
identified a number of unhelpful thoughts and then gave the more assertive counterpart to these thoughts. This session was followed by role- playing. Session IV: The researcher introduced a number of techniques designed to help participants become more assertive (Broken-record, fogging, self-disclosure, negative assertion and I- statements). This exercise was followed by role- playing. Session V: The researcher discussed the effects of not being able to say “no” with the participants. He identified a number of unhelpful thoughts that may make it difficult for participants to say “no”. He helped them come up with a more helpful thinking style. He introduced a number of ways to say “no”. This session was followed by questions and answers. Session VI: The goal of this session was to identify the different types of criticism and why participants may have trouble responding well to criticism. It looked at the underlying beliefs which may stop them from being able to deal with criticism and help them come up with a more helpful thinking style. The researcher summarized the activities of session one to six. Participants were encouraged to ask questions concerning the training while the researcher was on ground to answer those questions. The participants were called out one after the other to make comment on the training. The training session was terminated. 19.3 Control Group The researcher repeated the same method he used for selecting the participants in the treatment groups (administration of Index of Self-Esteem). Thereafter, he administered the APDQ, RSE, SCQ and FNES to the participants to obtain their pre-test scores. The control group was on the waiting list (that is the participants were not exposed to any treatment), but were exposed to an aspect of assertiveness training so that they could also benefit from the research. The control group was post-tested after eight weeks to obtain their post-test scores. 19.4 Data Analysis Hypothesis 1: There is no significant difference in the posttest mean scores of participants’ self-esteem in the three experimental groups (Mentoring, Assertiveness Training and Control). Table 1. Descriptive Data of Pre and Post-test mean scores of the participants’ Self-esteem based on Experimental Groups
Experimental Groups Pre-test Post –test Mean Difference N Mean SD Mean SD
Mentoring 32 15.94 1.99 20.10 3.02 4.16 * AT 32 15.00 2.35 18.54 3.30 3.54 n.s. Control 32 16.28 2.32 18.28 2.70 2.00 * Total 96 15.74 2.22 18.97 3.08 3.33
*Significant, P< 0.05 n.s = not significant The descriptive data presented in Table 1 indicates that the three experimental groups obtained mean scores ranging from 15.00 for Assertiveness Training (AT), 15.94 for mentoring to 16.28 for the control group at pretest. Table 1 further show that at post test, the mentoring group recorded the greatest improvement in their self-esteem scores with a mean difference of 4.16, followed by assertiveness training (AT) with mean difference of 3.54, while the control group recorded the lowest mean change of 2.00. To determine if these differences were statistically significant, the ANCOVA results in Table 5 were displayed. Table 2. One-Way Analysis of Covariance (ANCOVA) of difference in post-test mean scores of participants’ Self-esteem in the three experimental groups
Source of Variation Sum of Squares Df. Mean Square F-cal Sig. of F Model 103.33 3 34.44 3.97 .010* Covariates 48.25 1 48.25 2.85 .081 Experimental groups
58.47 2
29.23
3.37
.039*
Residual 799.157 92 8.686 Total 902,490 95
* Significant, P< 0.05. n. s. = not significant F critical, d. f. (1, 92) = 3. 94; F critical, d. f. (2, 92) = 3.09; F critical, d. f (3, 92) = 2.70). The result in Table 5 shows that a calculated F- value of 3.37 resulted as the difference among the three experimental groups. This F- value is statistically significant since it is greater than the critical F- value of 3.09, given 2 and 9 degree of
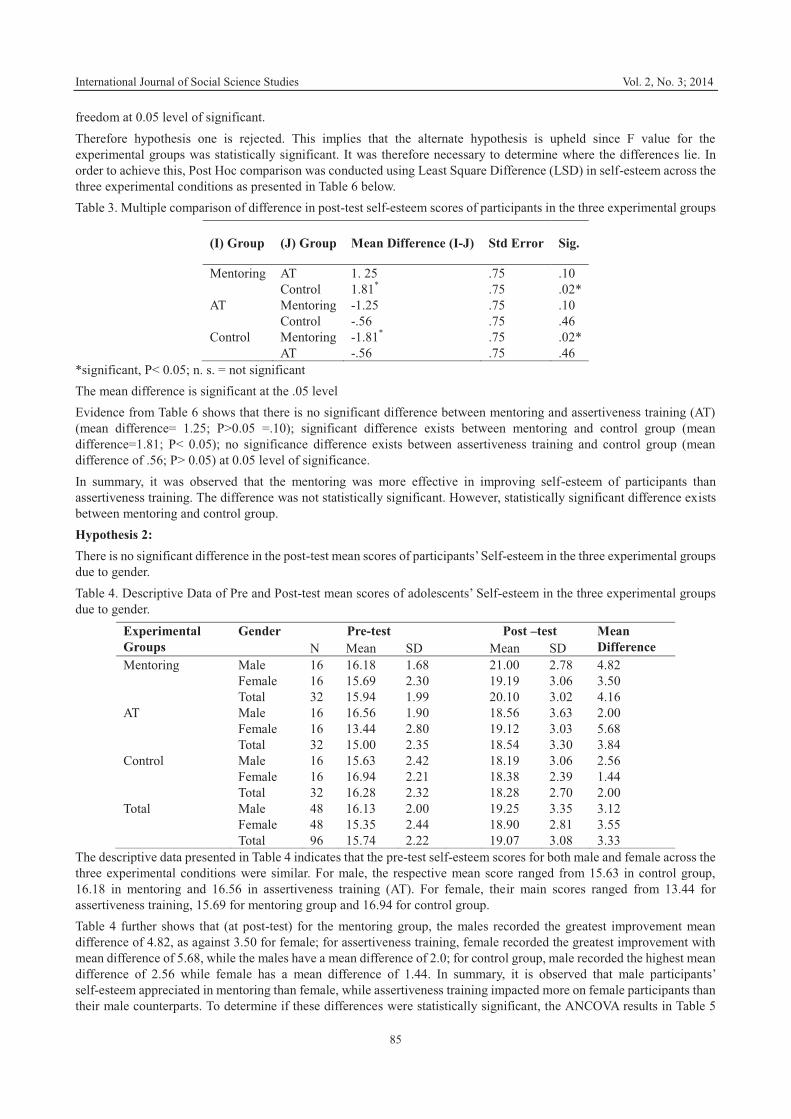
International Journal of Social Science Studies Vol. 2, No. 3; 2014
85
freedom at 0.05 level of significant. Therefore hypothesis one is rejected. This implies that the alternate hypothesis is upheld since F value for the experimental groups was statistically significant. It was therefore necessary to determine where the differences lie. In order to achieve this, Post Hoc comparison was conducted using Least Square Difference (LSD) in self-esteem across the three experimental conditions as presented in Table 6 below. Table 3. Multiple comparison of difference in post-test self-esteem scores of participants in the three experimental groups
(I) Group (J) Group Mean Difference (I-J) Std Error Sig.
Mentoring AT Control
1. 25 1.81*
.75
.75 .10 .02*
AT Mentoring Control
-1.25 -.56
.75
.75 .10 .46
Control Mentoring AT
-1.81* -.56
.75
.75 .02* .46
*significant, P< 0.05; n. s. = not significant The mean difference is significant at the .05 level Evidence from Table 6 shows that there is no significant difference between mentoring and assertiveness training (AT) (mean difference= 1.25; P>0.05 =.10); significant difference exists between mentoring and control group (mean difference=1.81; P< 0.05); no significance difference exists between assertiveness training and control group (mean difference of .56; P> 0.05) at 0.05 level of significance. In summary, it was observed that the mentoring was more effective in improving self-esteem of participants than assertiveness training. The difference was not statistically significant. However, statistically significant difference exists between mentoring and control group. Hypothesis 2: There is no significant difference in the post-test mean scores of participants’ Self-esteem in the three experimental groups due to gender. Table 4. Descriptive Data of Pre and Post-test mean scores of adolescents’ Self-esteem in the three experimental groups due to gender.
Experimental Groups
Gender Pre-test Post –test Mean Difference N Mean SD Mean SD
Mentoring Male Female Total
16 16 32
16.18 15.69 15.94
1.68 2.30 1.99
21.00 19.19 20.10
2.78 3.06 3.02
4.82 3.50 4.16
AT Male Female Total
16 16 32
16.56 13.44 15.00
1.90 2.80 2.35
18.56 19.12 18.54
3.63 3.03 3.30
2.00 5.68 3.84
Control Male Female Total
16 16 32
15.63 16.94 16.28
2.42 2.21 2.32
18.19 18.38 18.28
3.06 2.39 2.70
2.56 1.44 2.00
Total Male Female Total
48 48 96
16.13 15.35 15.74
2.00 2.44 2.22
19.25 18.90 19.07
3.35 2.81 3.08
3.12 3.55 3.33
The descriptive data presented in Table 4 indicates that the pre-test self-esteem scores for both male and female across the three experimental conditions were similar. For male, the respective mean score ranged from 15.63 in control group, 16.18 in mentoring and 16.56 in assertiveness training (AT). For female, their main scores ranged from 13.44 for assertiveness training, 15.69 for mentoring group and 16.94 for control group. Table 4 further shows that (at post-test) for the mentoring group, the males recorded the greatest improvement mean difference of 4.82, as against 3.50 for female; for assertiveness training, female recorded the greatest improvement with mean difference of 5.68, while the males have a mean difference of 2.0; for control group, male recorded the highest mean difference of 2.56 while female has a mean difference of 1.44. In summary, it is observed that male participants’ self-esteem appreciated in mentoring than female, while assertiveness training impacted more on female participants than their male counterparts. To determine if these differences were statistically significant, the ANCOVA results in Table 5
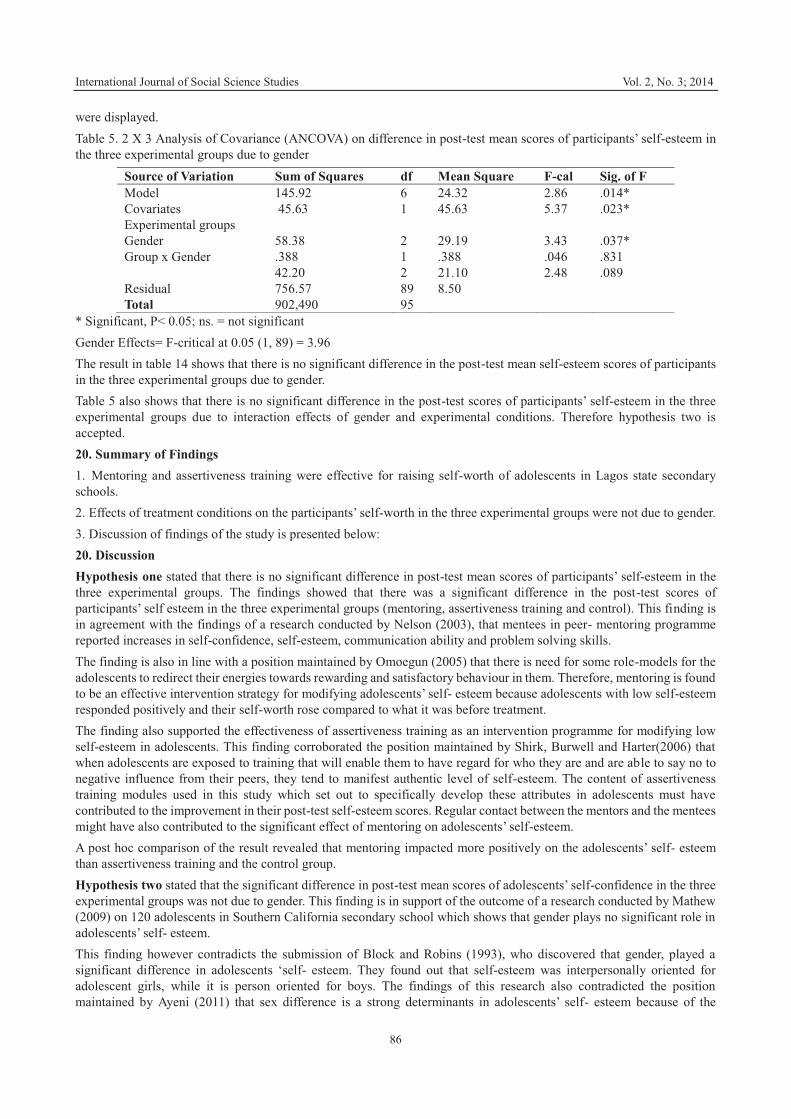
International Journal of Social Science Studies Vol. 2, No. 3; 2014
86
were displayed. Table 5. 2 X 3 Analysis of Covariance (ANCOVA) on difference in post-test mean scores of participants’ self-esteem in the three experimental groups due to gender
Source of Variation Sum of Squares df Mean Square F-cal Sig. of F Model 145.92 6 24.32 2.86 .014* Covariates 45.63 1 45.63 5.37 .023* Experimental groups Gender Group x Gender
58.38 .388 42.20
2 1 2
29.19 .388 21.10
3.43 .046 2.48
.037* .831 .089
Residual 756.57 89 8.50 Total 902,490 95
* Significant, P< 0.05; ns. = not significant Gender Effects= F-critical at 0.05 (1, 89) = 3.96 The result in table 14 shows that there is no significant difference in the post-test mean self-esteem scores of participants in the three experimental groups due to gender. Table 5 also shows that there is no significant difference in the post-test scores of participants’ self-esteem in the three experimental groups due to interaction effects of gender and experimental conditions. Therefore hypothesis two is accepted. 20. Summary of Findings 1. Mentoring and assertiveness training were effective for raising self-worth of adolescents in Lagos state secondary schools. 2. Effects of treatment conditions on the participants’ self-worth in the three experimental groups were not due to gender. 3. Discussion of findings of the study is presented below: 20. Discussion Hypothesis one stated that there is no significant difference in post-test mean scores of participants’ self-esteem in the three experimental groups. The findings showed that there was a significant difference in the post-test scores of participants’ self esteem in the three experimental groups (mentoring, assertiveness training and control). This finding is in agreement with the findings of a research conducted by Nelson (2003), that mentees in peer- mentoring programme reported increases in self-confidence, self-esteem, communication ability and problem solving skills. The finding is also in line with a position maintained by Omoegun (2005) that there is need for some role-models for the adolescents to redirect their energies towards rewarding and satisfactory behaviour in them. Therefore, mentoring is found to be an effective intervention strategy for modifying adolescents’ self- esteem because adolescents with low self-esteem responded positively and their self-worth rose compared to what it was before treatment. The finding also supported the effectiveness of assertiveness training as an intervention programme for modifying low self-esteem in adolescents. This finding corroborated the position maintained by Shirk, Burwell and Harter(2006) that when adolescents are exposed to training that will enable them to have regard for who they are and are able to say no to negative influence from their peers, they tend to manifest authentic level of self-esteem. The content of assertiveness training modules used in this study which set out to specifically develop these attributes in adolescents must have contributed to the improvement in their post-test self-esteem scores. Regular contact between the mentors and the mentees might have also contributed to the significant effect of mentoring on adolescents’ self-esteem. A post hoc comparison of the result revealed that mentoring impacted more positively on the adolescents’ self- esteem than assertiveness training and the control group. Hypothesis two stated that the significant difference in post-test mean scores of adolescents’ self-confidence in the three experimental groups was not due to gender. This finding is in support of the outcome of a research conducted by Mathew (2009) on 120 adolescents in Southern California secondary school which shows that gender plays no significant role in adolescents’ self- esteem. This finding however contradicts the submission of Block and Robins (1993), who discovered that gender, played a significant difference in adolescents ‘self- esteem. They found out that self-esteem was interpersonally oriented for adolescent girls, while it is person oriented for boys. The findings of this research also contradicted the position maintained by Ayeni (2011) that sex difference is a strong determinants in adolescents’ self- esteem because of the
International Journal of Social Science Studies Vol. 2, No. 3; 2014
87
important roles played by the female in child growth and development. The findings of this study did not show any gender difference in the effects of treatment conditions on the self-esteem of adolescents in secondary schools possibly because the content of the treatment package in both mentoring and assertiveness training group did not give any consideration to the gender of the participants. Participants were given equal treatment regardless of their gender. 21. Conclusion Based on the findings of this study, the following conclusions were reached: 1. Mentoring and assertiveness training were effective for raising self-esteem of adolescents in Lagos state secondary schools. 2. Effects of treatment conditions on the participants’ self-esteem in the three experimental groups were not due to gender. 22. Implications for Counseling Findings of this study have the following implications for counseling: 1. Adolescents with low self-esteem hardly seek treatment, it is therefore imperative for counsellors to increase the general public’s awareness of this problem in adolescents. 2. Based on the favourable treatment results, it is important for counsellors who work with children and adolescents to take advantage of mentoring and assertiveness training as treatment strategy for assisting adolescents with low self-esteem. 23. Recommendations Based on the findings of the study, the following recommendations were made: 1. Mentoring and assertiveness training were found to be efficacious for raising adolescents’ self-esteem; therefore these two programmes should be adopted by management of schools. 2. Assertiveness training for adolescents should focus not only on how to increase their self-esteem but on how adolescents can be assertive and say no to sex, drug and bullies. 3. Teachers and schools management should promote peer-mentioning in schools, because of its numerous advantages over traditional mentoring. References Akinteye, A. J. (2012). Effect of Mentoring and Assertiveness Training on Adolescents’ Self- esteem in Lagos State
Secondary Schools. Lagos. Unpublished PhD Thesis. Aneke, C. I. (2009). Effects of Reality Therapy and Assertiveness Training on Psycho-social Adjustment of Female
Prisoners. Lagos. Unpublished Ph.D Thesis. Ayeni, E. A. (2011). Assessment and management of anxiety in some Lagos adolescents. An Unpublished PhD Thesis,
Department of Psychology, University of Lagos. Baumeister, R. F., Campbell, J. D., Krueger, J. I., & Vohs, K. D. (2003). Does High Self-Esteem Cause Better performance,
Interpersonal success, happiness or healthier life-style? Psychological Science in the Public Interest, 4(1), 1-44. http://dx.doi.org/10.1111/1529-1006.01431
Block, J., & Robins, R. (1993). A longitudinal study of consistency and changes in self-esteem from early adolescence to early adulthood. Child Development, 64, 909-923. http://dx.doi.org/10.2307/1131226
Bozeman, B., & Feney, M. K. (October 2007). “Toward a useful theory of mentoring; A Conceptual analysis and critique”. Administration and society, 39(6), 719-739. http://dx.doi.org/10.1177/0095399707304119
Branden, N. (1969). The psychology of self-esteem. New York. Bantum. Coopersmith, S. (2002). Coopersmith Self-Esteem Inventories: Manual. Palo Alto, CA: Mindgarden. Donaldson, S. I., Ensher, E. A., & Grant-Vallone, E. J. (2000). Longitudinal Examination of Mentoring Relationships
on Organizational Commitment and Citizenship Behavior. Journal of Career Development, 26, 233-249. http://dx.doi.org/10.1177/089484530002600401
Erikson, E. H. (1968). Identity Formation: Youth and Crisis. New York: W. W. Norton. Groer, M. W., Thomas, S. P., & Shoffner, D. (2002). Adolescent stress and coping: A longitudinal study. Research in
Nursing and Health, 15, 209-217. http://dx.doi.org/10.1002/nur.4770150307 Higgins, E. T. (1987). Self- discrepancy: A theory relating to self and affect. Psychological Review, 94, 319- 340.
International Journal of Social Science Studies Vol. 2, No. 3; 2014
88
http://dx.doi.org/10.1037/0033-295X.94.3.319 Inerhumwunwa, I. (2009). Formal mentoring initiative as a likely panacea to students’ maladaptive behaviour. Edo
Journal of Psychology, 2(1), 75-80. James, W. (1890). The principles of psychology. Cambridge, MA: Harvard University Press.
http://dx.doi.org/10.1037/11059-000 Joseph, R. A, Marus, H. Z., & Tafarrodi, R. W. (2006). Gender and self esteem. Journal of Personality and Social
Psychology, 63(3), 391-402. http://dx.doi.org/10.1037/0022-3514.63.3.391 Mathew, S. J. (2006). Etiology and Social Anxiety Disorder. Journal of Clinical Psychiatry, 67(12), 9-13. Mecca, A. M., Smelser, N.J., & Vasoconcellos, J. (1989). The Social Importance of Self-Esteem. Berkely: University of
California Press. Mruk, C. (2006). Self-Esteem: Research, Theory, and Practice. New York: Springer Publishing Company. Nelson, A. (2003). Peer Mentoring. A Citizenship Entitlement at Tanfield School. Pastoral Care in Education, 21(4), 34-41.
http://dx.doi.org/10.1111/j.0264-3944.2003.00276.x Okoli, C. E. (2002), Techniques of behaviour modification. Lagos: Behenu Press and Publishers. Olayinka, M. S., & Omoegun, O. M. (2001). Principles and practice of guidance and counseling. Lagos: Babsheriff
Limited. Osarenren, N., Ubangha, M. B., & Oke, T. D. (2008). Family characteristics as correlates of self-esteem among young
adults. International Journal of Educational Research, 4(1), 17- 25. Plunkett, S. W. Radmacher, K. A., Moll-Phanara, D. (2000). Adolescent life events, stress and coping: A comparison of
communities and genders. Professional school Counselling, 3(5), 356-367. Rhodes, J. E. (2002). Stand by Me: The Risk and Rewards of Mentoring Today's Youth. London: Harvard University
Press. Rosenberg, M. (1965). Society and the Adolescents' self-image. Princeton, NJ: Prince University Press SarAbadani, T. L. (2006). The relationship between academic achievement, self-esteem and gender with anxiety of
computer among postgraduate students in the University of Tabeiyat Moallem Tehran. University of Tabeiyat Moallem Theran. Iran.
Shirk, S., & Burwell, R. (2006). Strategies to Modify Low Self- Esteem in Adolescents. The Guilford Press, New York London.
Smith, M. J. (1975). When I Say no, I feel Guilty. New York: The Dial Press. Stephen, G., & Gareth, L. (1999). Successful mentoring in a week. London: Hodder and Stonghton Educational. Taylor, S. E., Peplau, L. A., & Seara, D. O. (2006). Social psychology. London: John Murray Publishers Ltd. Vygotsky. L. S. (1978). Mind and Society: The Development of Higher Mental Processes. Cambridge, MA:
Harvard University Press.
This work is licensed under a Creative Commons Attribution 3.0 License.
International Journal of Social Science Studies Vol. 2, No. 3; July 2014
ISSN 2324-8033 E-ISSN 2324-8041 Published by Redfame Publishing
URL: http://ijsss.redfame.com
89
Obstructive Sleep Apnea and Multiple Anthropometric Indices of General Obesity and Abdominal Obesity among Young Adults
Xiaoli Chen1, Wipawan C. Pensuksan2, Vitool Lohsoonthorn3, Somrat Lertmaharit3,4, Bizu Gelaye1, & Michelle A. Williams1
1Department of Epidemiology, Harvard School of Public Health, Boston, MA 02115, USA 2School of Nursing, Walailak University, Nakhon Si Thammarat 80160, Thailand 3Department of Preventive and Social Medicine, Faculty of Medicine, Chulalongkorn University, Bangkok 10330, Thailand 4College of Public Health Sciences, Chulalongkorn University, Bangkok 10330, Thailand Correspondence: Xiaoli Chen, MD, PhD, MPH, Department of Epidemiology, Harvard School of Public Health, 677 Huntington Ave, Kresge 500, Boston, MA 02115, USA. E-mail: [email protected] Received: May 2, 2014 Accepted: May 17, 2014 Available online: June 13, 2014 doi:10.11114/ijsss.v2i3.439 URL: http://dx.doi.org/10.11114/ijsss.v2i3.439 Abstract Objective: To examine the associations between obstructive sleep apnea (OSA) and obesity among young adults. Design and Methods: A total of 2911 college students in Thailand participated in the study. Anthropometric measurements and blood pressure were taken by trained research staff. Results: Overall, 6.3% of college students had OSA determined by the Berlin Questionnaire, 9.6% were overweight (BMI: 25-29 kg/m2), 4.5% were obese (BMI≥30 kg/m2); 12.4% had abdominal obesity (men: waist circumference≥90 cm; women: waist circumference≥80 cm). There were significant associations between OSA and overweight (odds ratio (OR)=1.72; 95% confidence interval (CI)=1.04-1.85) and obesity (OR=24.23; 95% CI=15.20-38.61), independent of demographic and lifestyle factors, blood pressure, and psychological distress. Students with OSA were more likely to have abdominal obesity than those without OSA (OR=2.09; 95% CI=1.19-3.67). OSA was significantly related to joint effects of general and abdominal obesity. The OSA-obesity associations were robust and evident for both genders, individuals with normal and elevated blood pressure, and those with and without psychological distress. Conclusions: This study shows independent associations of OSA with general and abdominal obesity among young adults. OSA could be a risk factor for obesity and consequent cardiovascular morbidities; OSA screening and treatment might be important for young adults. Keywords: obstructive sleep apnea; general obesity; abdominal obesity; college student; Asia; Thailand 1. Introduction The obesity epidemic is a worldwide public health problem, with the prevalence of obesity up to 36% for US adults (Flegal et al., 2012). Obesity predicts various health outcomes such as diabetes, cardiovascular disease, and mortality, and is also related to increased health care costs, decreased productivity, and lower quality of life (Sullivan et al., 2008; Fontaine et al., 2001). Body mass index (BMI) has been employed widely for classifying general obesity (Flegal et al., 2012). Abdominal fat deposition measured by waist circumference (WC) or waist-to-hip ratio (WHR) has been suggested as a better indicator of obesity in relation to health outcomes than BMI (Janssen et al., 2004; Coutinho et al., 2013). The rapid economic growth in Asia has led to a rapid increase in the prevalence of obesity, especially abdominal obesity in Asia (Ke-You et al., 2001; Jitnarin et al., 2011). One of possible identifiable risks of obesity is obstructive sleep apnea (OSA), a common disorder characterized by repetitive episodes of upper airway obstruction that occur during sleep (Pillar et al., 2008). OSA may contribute to obesity or excess weight through increased sympathetic activation, sleep deprivation, and disrupted metabolism (Pillar et al., 2008; Wolk et al., 2003). Furthermore, OSA may be related to changes in leptin, ghrelin, and orexin levels, and thus may increase individuals’ appetite and caloric intake, which exacerbate obesity (Pillar et al., 2008). OSA is highly prevalent
International Journal of Social Science Studies Vol. 2, No. 3; 2014
90
among middle-aged and older adults (Kripke et al., 1997; Stradling et al., 1991; Peppard et al., 2000), but remains underdiagnosed in the general population. A recent systematic review has highlighted the lack of data regarding the prevalence of OSA in Asia (Mirrakhimov et al., 2013). A growing body of evidence suggests that OSA is independently associated with health outcomes (e.g., hypertension, cardiovascular disease) (Nieto et al., 2000; Young et al., 2000). It has been reported that untreated OSA is associated with increased mortality (Yaggi et al., 2005), and successful treatment has been shown to reduce mortality (Campos-Rodriguez et al., 2005). It is unclear whether OSA is associated with obesity. Two earlier small longitudinal studies found no statistically significant correlations between change in OSA and change in BMI (Pendlebury et al., 1997; Sforza et al., 1994), whereas several recent epidemiologic studies have demonstrated significant associations between OSA and obesity (Wilsmore et al., 2012; Kim et al., 2013). There is a paucity of research evaluating OSA and its related general and abdominal obesity among young adults, especially among healthy college students in Asian countries. To our knowledge, only one study examined OSA and its association with general and abdominal obesity concurrently but focused on middle-aged adults in Korea (Kim et al., 2013). To fill the research gap, we examined the associations of OSA with general and abdominal obesity in a large cross-sectional study of college students in Thailand. 2. Materials and Methods 2.1 Study Population This cross-sectional study was conducted between December 2010 and February 2011 at seven colleges in Thailand. The study procedures have been described elsewhere (Lohsoonthorn et al., 2013). A total of 3000 full-time undergraduate students participated in the study. Students with incomplete questionnaires and missing data for OSA were excluded (n=89). These students were similar to the total population with regards to their demographic and lifestyle characteristics. The final analyzed sample included 2911 (97.0%) college students (964 males and 1947 females) with complete information on OSA, demographic and lifestyle factors, anthropometric measurements, and psychological distress. All the completed questionnaires were anonymous, and no personal identifiers were collected. All study procedures were approved by the institutional review boards of the Faculty of Medicine Chulalongkorn University and Walailak University in Thailand, and the University of Washington, USA. The Harvard School of Public Health Office of Human Research Administration, USA, granted approval to use the anonymous data set for analysis. 2.2 Measures Recruitment flyers were posted on each campus to invite college students to participate in the study. Students who expressed an interest in participating were asked to meet in a large classroom or an auditorium where they were informed the purpose of the study. Students who consented to participate were asked to complete a self-administered questionnaire survey regarding demographic information, psychological distress status, lifestyle factors, as well as sleep related questions including the Berlin Questionnaire. Measurements of height, weight, waist circumference (WC), hip circumference (HC), and blood pressure (BP) were taken by trained researchers. 2.3 General Obesity Measured weight and height were used to calculate body mass index (BMI) and to define normal weight (BMI<25 kg/m2), overweight (BMI: 25-29.9 kg/m2), and obesity (BMI≥30 kg/m2). Students were divided into the non-obese group and obese group if their BMI was <30 kg/m2 or ≥30 kg/m2, respectively. We also used the Asian criteria of overweight and obesity (Chieraku et al., 2007), and further grouped students into normal weight (BMI<23 kg/m2), overweight (BMI: 23-26 kg/m2), obesity (BMI≥27 kg/m2). Study participants were divided into the non-obese group and obese group if their BMI was <27 kg/m2 or ≥27 kg/m2, respectively ( Chieraku et al., 2007). 2.4 Abdominal Obesity Abdominal obesity was defined based on the new International Diabetes Federation (IDF) criteria for the use in South Asia: WC≥90cm for men and WC≥80cm for women (Lenfant et al., 2003). WC, HC, and waist-to-hip ratio (WHR) were categorized by quartile distribution. Abdominal obesity was also determined as WHR equal or higher than the top quartile (WHR≥0.83). 2.5 OSA We used the Berlin Questionnaire for the assessment of OSA. The Berlin Questionnaire has been validated and widely used in previous studies (Hiestand et al., 2006; Netzer et al., 1999). The questionnaire is divided into three sections. Section 1 is about snoring behavior. Section 2 is about individuals’ feelings of fatigue, tiredness, and daytime sleepiness,

International Journal of Social Science Studies Vol. 2, No. 3; 2014
91
and section 3 ascertains the presence of obesity or hypertension. In sections 1 and 2, high risk for OSA is considered when there is a persistent symptom (more than 3-4 times/week). In section 3, high risk for OSA is defined when there is a history of hypertension or BMI≥30 kg/m2. Individuals are considered at a high risk for OSA if they are qualified as high risk in two or three sections. 2.6 Covariates Students’ demographic information were age, sex, and education level. Lifestyle factors were cigarette smoking, participation in moderate or vigorous physical activity, alcohol consumption, and use of energy drinks. Energy drinks or stimulant beverages are a group of beverages used to provide an extra boost in energy, promote wakefulness, and provide cognitive and mood enhancement (Lohsoonthorn et al., 2013). Participants were first asked whether they consumed more than one stimulant or energy drink per week every month during the current academic semester/quarter. Energy drinks were summarized and categorized as dichotomous variables (yes vs. no) (Lohsoonthorn et al., 2013). Psychological distress was evaluated by the General Health Questionnaire 12-item scale (GHQ-12). The GHQ-12 is a self-report instrument for the detection of psychological distress in the community and in primary care settings (Goldberg et al., 1997). The GHQ scoring method (0-0-1-1) was used, with the sum scores ranging from 0 to 12. Participants with the total GHQ-12 score ≥2 were considered to have psychological distress (Goldberg et al., 1997). 2.7 Statistical Analysis Unpaired t-tests and χ2 tests were conducted to evaluate the differences in covariates on either a continuous or discrete scale across the OSA status. Linear regression analyses were conducted to evaluate the associations of OSA with BMI, WC, HC, and WHR. Multinomial logistic regression models were used to assess associations of OSA with overweight and obesity; those with normal weight served as the reference group. Odds ratios (ORs) and 95% confidence intervals (95% CIs) were estimated using the logistic regression models. We also evaluated whether individuals with OSA had a high risk of joint effects of having general and abdominal obesity compared to those without OSA in logistic regression analyses. Potential confounders included age, sex, education, cigarette smoking, physical activity participation, alcohol consumption, use of energy drinks, BP, and psychological distress. Stratified analyses were conducted to examine whether these associations varied by sex, BP level, and psychological distress. All tests were performed by using Statistical Analysis Software (SAS, version 9.3; SAS Institute, Cary, NC). The significance levels were set at P<0.05 for two-sided analyses. 3. Results Of 2911 college students, 33.1 % were men and the average age was 20.3 years (standard deviation: 1.3). Overall, 6.3% of college students reported having OSA. Demographic and lifestyle characteristics of participants by OSA status are shown in Table 1. A total of 8.5 % of college students reported smoking cigarettes. More than half (54.9 %) of students regularly participated in recreational physical activity. Overall, 9.6% of students were overweight (BMI: 25-29 kg/m2) and 4.5% were obese (BMI≥30 kg/m2) according to the WHO definition. When the Asian criteria were applied, 18.4% were overweight and 8.0% were obese. Based on the IDF criteria of abdominal obesity, 12.4% of students were centrally obese. The factors associated with OSA were male gender, older age, alcohol consumption, cigarette smoking, use of energy drinks, and higher BP. Students with OSA had a higher BMI, WC, HC, and WHR, and a higher percentage of general and abdominal obesity than those without OSA. Table 1. Characteristics of 2911 college students in Thailand, according to obstructive sleep apnea status
Characteristic Total OSA P (n=2911) No (n=2728) Yes (n=183) valuea
Demographic characteristics Age, year, mean (SD) 20.3 (1.3) 20.3 (1.3) 20.6 (1.5) 0.005 Men, % 33.1 31.7 54.6 <0.001 Education (college), % First year 24.5 25.0 16.9 0.034 Second year 31.9 31.8 35.5 Third year 26.8 26.9 26.8 Senior 16.7 16.4 20.8 Lifestyle factors Recreational PA participation, % 54.9 54.8 55.2 0.926 Alcohol consumption, % 16.3 15.6 25.1 <0.001 Cigarette smoking, % 8.5 7.9 17.5 <0.001
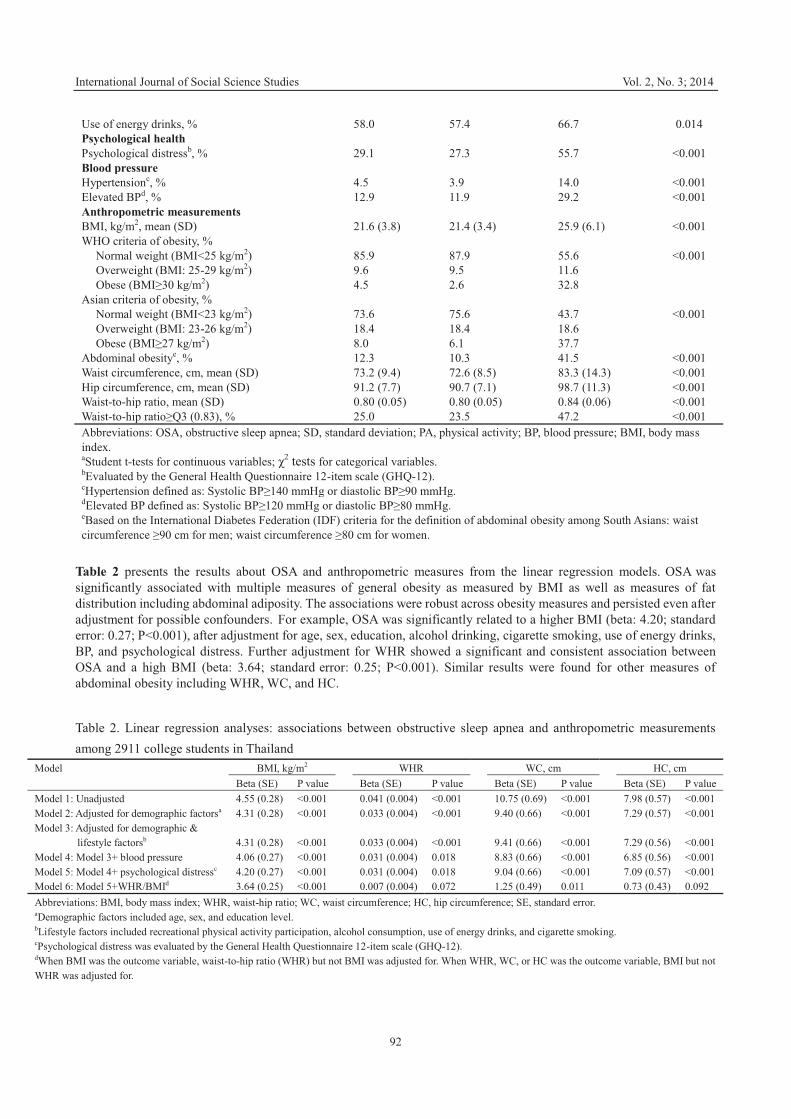
International Journal of Social Science Studies Vol. 2, No. 3; 2014
92
Use of energy drinks, % 58.0 57.4 66.7 0.014 Psychological health Psychological distressb, % 29.1 27.3 55.7 <0.001 Blood pressure Hypertensionc, % 4.5 3.9 14.0 <0.001 Elevated BPd, % 12.9 11.9 29.2 <0.001 Anthropometric measurements BMI, kg/m2, mean (SD) 21.6 (3.8) 21.4 (3.4) 25.9 (6.1) <0.001 WHO criteria of obesity, % Normal weight (BMI<25 kg/m2) 85.9 87.9 55.6 <0.001 Overweight (BMI: 25-29 kg/m2) 9.6 9.5 11.6 Obese (BMI≥30 kg/m2) 4.5 2.6 32.8 Asian criteria of obesity, % Normal weight (BMI<23 kg/m2) 73.6 75.6 43.7 <0.001 Overweight (BMI: 23-26 kg/m2) 18.4 18.4 18.6 Obese (BMI≥27 kg/m2) 8.0 6.1 37.7 Abdominal obesitye, % 12.3 10.3 41.5 <0.001 Waist circumference, cm, mean (SD) 73.2 (9.4) 72.6 (8.5) 83.3 (14.3) <0.001 Hip circumference, cm, mean (SD) 91.2 (7.7) 90.7 (7.1) 98.7 (11.3) <0.001 Waist-to-hip ratio, mean (SD) 0.80 (0.05) 0.80 (0.05) 0.84 (0.06) <0.001 Waist-to-hip ratio≥Q3 (0.83), % 25.0 23.5 47.2 <0.001 Abbreviations: OSA, obstructive sleep apnea; SD, standard deviation; PA, physical activity; BP, blood pressure; BMI, body mass index. aStudent t-tests for continuous variables; χ2 tests for categorical variables. bEvaluated by the General Health Questionnaire 12-item scale (GHQ-12). cHypertension defined as: Systolic BP≥140 mmHg or diastolic BP≥90 mmHg. dElevated BP defined as: Systolic BP≥120 mmHg or diastolic BP≥80 mmHg. eBased on the International Diabetes Federation (IDF) criteria for the definition of abdominal obesity among South Asians: waist circumference ≥90 cm for men; waist circumference ≥80 cm for women.
Table 2 presents the results about OSA and anthropometric measures from the linear regression models. OSA was significantly associated with multiple measures of general obesity as measured by BMI as well as measures of fat distribution including abdominal adiposity. The associations were robust across obesity measures and persisted even after adjustment for possible confounders. For example, OSA was significantly related to a higher BMI (beta: 4.20; standard error: 0.27; P<0.001), after adjustment for age, sex, education, alcohol drinking, cigarette smoking, use of energy drinks, BP, and psychological distress. Further adjustment for WHR showed a significant and consistent association between OSA and a high BMI (beta: 3.64; standard error: 0.25; P<0.001). Similar results were found for other measures of abdominal obesity including WHR, WC, and HC.
Table 2. Linear regression analyses: associations between obstructive sleep apnea and anthropometric measurements among 2911 college students in Thailand
Model BMI, kg/m2 WHR WC, cm HC, cm Beta (SE) P value Beta (SE) P value Beta (SE) P value Beta (SE) P value Model 1: Unadjusted 4.55 (0.28) <0.001 0.041 (0.004) <0.001 10.75 (0.69) <0.001 7.98 (0.57) <0.001 Model 2: Adjusted for demographic factorsa 4.31 (0.28) <0.001 0.033 (0.004) <0.001 9.40 (0.66) <0.001 7.29 (0.57) <0.001 Model 3: Adjusted for demographic &
lifestyle factorsb 4.31 (0.28) <0.001 0.033 (0.004) <0.001 9.41 (0.66) <0.001 7.29 (0.56) <0.001 Model 4: Model 3+ blood pressure 4.06 (0.27) <0.001 0.031 (0.004) 0.018 8.83 (0.66) <0.001 6.85 (0.56) <0.001 Model 5: Model 4+ psychological distressc 4.20 (0.27) <0.001 0.031 (0.004) 0.018 9.04 (0.66) <0.001 7.09 (0.57) <0.001 Model 6: Model 5+WHR/BMId 3.64 (0.25) <0.001 0.007 (0.004) 0.072 1.25 (0.49) 0.011 0.73 (0.43) 0.092 Abbreviations: BMI, body mass index; WHR, waist-hip ratio; WC, waist circumference; HC, hip circumference; SE, standard error. aDemographic factors included age, sex, and education level. bLifestyle factors included recreational physical activity participation, alcohol consumption, use of energy drinks, and cigarette smoking. cPsychological distress was evaluated by the General Health Questionnaire 12-item scale (GHQ-12). dWhen BMI was the outcome variable, waist-to-hip ratio (WHR) but not BMI was adjusted for. When WHR, WC, or HC was the outcome variable, BMI but not WHR was adjusted for.
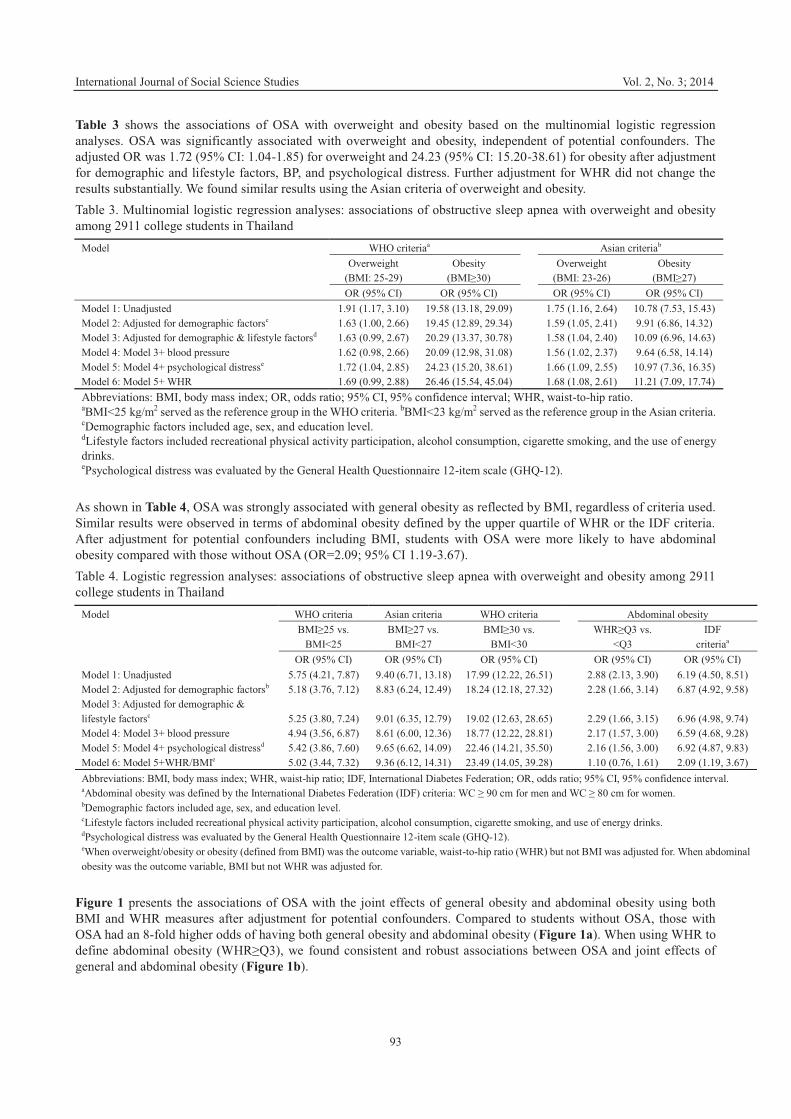
International Journal of Social Science Studies Vol. 2, No. 3; 2014
93
Table 3 shows the associations of OSA with overweight and obesity based on the multinomial logistic regression analyses. OSA was significantly associated with overweight and obesity, independent of potential confounders. The adjusted OR was 1.72 (95% CI: 1.04-1.85) for overweight and 24.23 (95% CI: 15.20-38.61) for obesity after adjustment for demographic and lifestyle factors, BP, and psychological distress. Further adjustment for WHR did not change the results substantially. We found similar results using the Asian criteria of overweight and obesity. Table 3. Multinomial logistic regression analyses: associations of obstructive sleep apnea with overweight and obesity among 2911 college students in Thailand
Model WHO criteriaa Asian criteriab Overweight Obesity Overweight Obesity (BMI: 25-29) (BMI≥30) (BMI: 23-26) (BMI≥27) OR (95% CI) OR (95% CI) OR (95% CI) OR (95% CI) Model 1: Unadjusted 1.91 (1.17, 3.10) 19.58 (13.18, 29.09) 1.75 (1.16, 2.64) 10.78 (7.53, 15.43) Model 2: Adjusted for demographic factorsc 1.63 (1.00, 2.66) 19.45 (12.89, 29.34) 1.59 (1.05, 2.41) 9.91 (6.86, 14.32) Model 3: Adjusted for demographic & lifestyle factorsd 1.63 (0.99, 2.67) 20.29 (13.37, 30.78) 1.58 (1.04, 2.40) 10.09 (6.96, 14.63) Model 4: Model 3+ blood pressure 1.62 (0.98, 2.66) 20.09 (12.98, 31.08) 1.56 (1.02, 2.37) 9.64 (6.58, 14.14) Model 5: Model 4+ psychological distresse 1.72 (1.04, 2.85) 24.23 (15.20, 38.61) 1.66 (1.09, 2.55) 10.97 (7.36, 16.35) Model 6: Model 5+ WHR 1.69 (0.99, 2.88) 26.46 (15.54, 45.04) 1.68 (1.08, 2.61) 11.21 (7.09, 17.74) Abbreviations: BMI, body mass index; OR, odds ratio; 95% CI, 95% confidence interval; WHR, waist-to-hip ratio. aBMI<25 kg/m2 served as the reference group in the WHO criteria. bBMI<23 kg/m2 served as the reference group in the Asian criteria. cDemographic factors included age, sex, and education level. dLifestyle factors included recreational physical activity participation, alcohol consumption, cigarette smoking, and the use of energy drinks. ePsychological distress was evaluated by the General Health Questionnaire 12-item scale (GHQ-12).
As shown in Table 4, OSA was strongly associated with general obesity as reflected by BMI, regardless of criteria used. Similar results were observed in terms of abdominal obesity defined by the upper quartile of WHR or the IDF criteria. After adjustment for potential confounders including BMI, students with OSA were more likely to have abdominal obesity compared with those without OSA (OR=2.09; 95% CI 1.19-3.67). Table 4. Logistic regression analyses: associations of obstructive sleep apnea with overweight and obesity among 2911 college students in Thailand
Model WHO criteria Asian criteria WHO criteria Abdominal obesity
BMI≥25 vs.
BMI<25 BMI≥27 vs.
BMI<27 BMI≥30 vs.
BMI<30 WHR≥Q3 vs.
<Q3 IDF
criteriaa OR (95% CI) OR (95% CI) OR (95% CI) OR (95% CI) OR (95% CI) Model 1: Unadjusted 5.75 (4.21, 7.87) 9.40 (6.71, 13.18) 17.99 (12.22, 26.51) 2.88 (2.13, 3.90) 6.19 (4.50, 8.51) Model 2: Adjusted for demographic factorsb 5.18 (3.76, 7.12) 8.83 (6.24, 12.49) 18.24 (12.18, 27.32) 2.28 (1.66, 3.14) 6.87 (4.92, 9.58) Model 3: Adjusted for demographic & lifestyle factorsc 5.25 (3.80, 7.24) 9.01 (6.35, 12.79) 19.02 (12.63, 28.65) 2.29 (1.66, 3.15) 6.96 (4.98, 9.74) Model 4: Model 3+ blood pressure 4.94 (3.56, 6.87) 8.61 (6.00, 12.36) 18.77 (12.22, 28.81) 2.17 (1.57, 3.00) 6.59 (4.68, 9.28) Model 5: Model 4+ psychological distressd 5.42 (3.86, 7.60) 9.65 (6.62, 14.09) 22.46 (14.21, 35.50) 2.16 (1.56, 3.00) 6.92 (4.87, 9.83) Model 6: Model 5+WHR/BMIe 5.02 (3.44, 7.32) 9.36 (6.12, 14.31) 23.49 (14.05, 39.28) 1.10 (0.76, 1.61) 2.09 (1.19, 3.67) Abbreviations: BMI, body mass index; WHR, waist-hip ratio; IDF, International Diabetes Federation; OR, odds ratio; 95% CI, 95% confidence interval. aAbdominal obesity was defined by the International Diabetes Federation (IDF) criteria: WC ≥ 90 cm for men and WC ≥ 80 cm for women. bDemographic factors included age, sex, and education level. cLifestyle factors included recreational physical activity participation, alcohol consumption, cigarette smoking, and use of energy drinks. dPsychological distress was evaluated by the General Health Questionnaire 12-item scale (GHQ-12). eWhen overweight/obesity or obesity (defined from BMI) was the outcome variable, waist-to-hip ratio (WHR) but not BMI was adjusted for. When abdominal obesity was the outcome variable, BMI but not WHR was adjusted for.
Figure 1 presents the associations of OSA with the joint effects of general obesity and abdominal obesity using both BMI and WHR measures after adjustment for potential confounders. Compared to students without OSA, those with OSA had an 8-fold higher odds of having both general obesity and abdominal obesity (Figure 1a). When using WHR to define abdominal obesity (WHR≥Q3), we found consistent and robust associations between OSA and joint effects of general and abdominal obesity (Figure 1b).
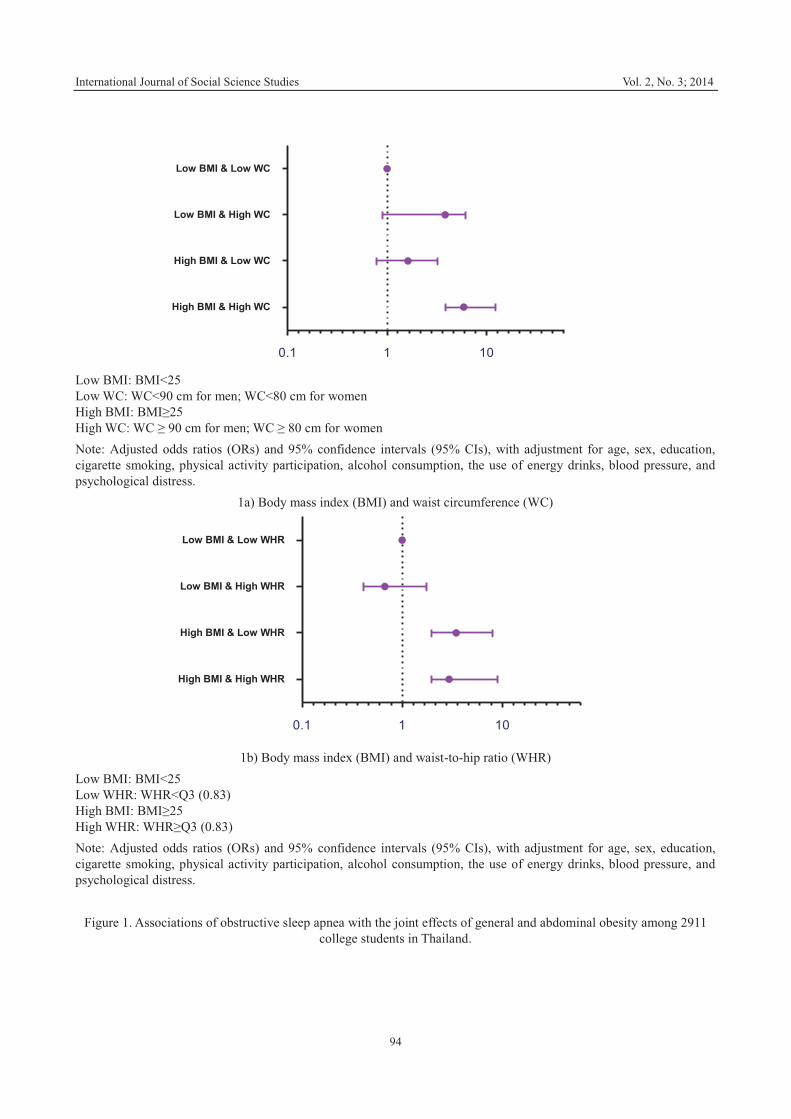
International Journal of Social Science Studies Vol. 2, No. 3; 2014
94
Low BMI: BMI<25 Low WC: WC<90 cm for men; WC<80 cm for women High BMI: BMI≥25 High WC: WC ≥ 90 cm for men; WC ≥ 80 cm for women Note: Adjusted odds ratios (ORs) and 95% confidence intervals (95% CIs), with adjustment for age, sex, education, cigarette smoking, physical activity participation, alcohol consumption, the use of energy drinks, blood pressure, and psychological distress.
1a) Body mass index (BMI) and waist circumference (WC)
1b) Body mass index (BMI) and waist-to-hip ratio (WHR) Low BMI: BMI<25 Low WHR: WHR<Q3 (0.83) High BMI: BMI≥25 High WHR: WHR≥Q3 (0.83) Note: Adjusted odds ratios (ORs) and 95% confidence intervals (95% CIs), with adjustment for age, sex, education, cigarette smoking, physical activity participation, alcohol consumption, the use of energy drinks, blood pressure, and psychological distress.
Figure 1. Associations of obstructive sleep apnea with the joint effects of general and abdominal obesity among 2911 college students in Thailand.
0.1 1 10
High BMI & High WC
High BMI & Low WC
Low BMI & High WC
Low BMI & Low WC
0.1 1 10
High BMI & High WHR
High BMI & Low WHR
Low BMI & High WHR
Low BMI & Low WHR
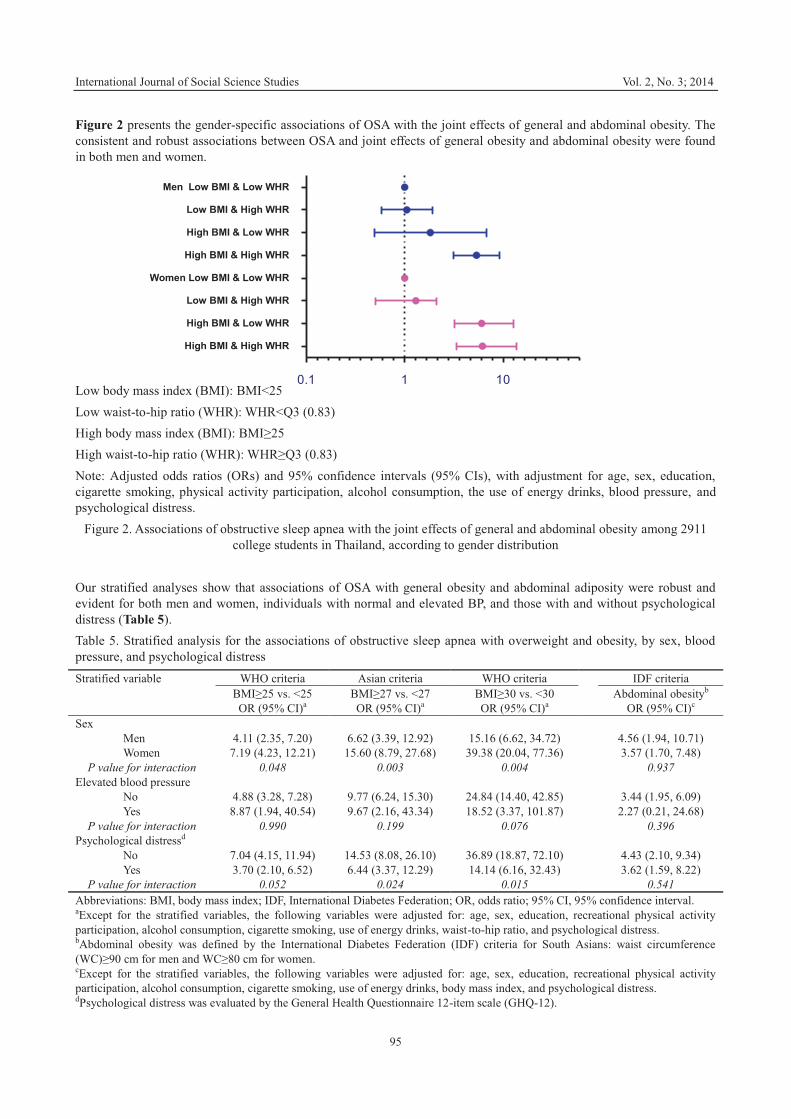
International Journal of Social Science Studies Vol. 2, No. 3; 2014
95
Figure 2 presents the gender-specific associations of OSA with the joint effects of general and abdominal obesity. The consistent and robust associations between OSA and joint effects of general obesity and abdominal obesity were found in both men and women. Low body mass index (BMI): BMI<25 Low waist-to-hip ratio (WHR): WHR<Q3 (0.83) High body mass index (BMI): BMI≥25 High waist-to-hip ratio (WHR): WHR≥Q3 (0.83) Note: Adjusted odds ratios (ORs) and 95% confidence intervals (95% CIs), with adjustment for age, sex, education, cigarette smoking, physical activity participation, alcohol consumption, the use of energy drinks, blood pressure, and psychological distress.
Figure 2. Associations of obstructive sleep apnea with the joint effects of general and abdominal obesity among 2911 college students in Thailand, according to gender distribution
Our stratified analyses show that associations of OSA with general obesity and abdominal adiposity were robust and evident for both men and women, individuals with normal and elevated BP, and those with and without psychological distress (Table 5). Table 5. Stratified analysis for the associations of obstructive sleep apnea with overweight and obesity, by sex, blood pressure, and psychological distress Stratified variable WHO criteria Asian criteria WHO criteria IDF criteria BMI≥25 vs. <25 BMI≥27 vs. <27 BMI≥30 vs. <30 Abdominal obesityb OR (95% CI)a OR (95% CI)a OR (95% CI)a OR (95% CI)c Sex
Men 4.11 (2.35, 7.20) 6.62 (3.39, 12.92) 15.16 (6.62, 34.72) 4.56 (1.94, 10.71) Women 7.19 (4.23, 12.21) 15.60 (8.79, 27.68) 39.38 (20.04, 77.36) 3.57 (1.70, 7.48)
P value for interaction 0.048 0.003 0.004 0.937 Elevated blood pressure
No 4.88 (3.28, 7.28) 9.77 (6.24, 15.30) 24.84 (14.40, 42.85) 3.44 (1.95, 6.09) Yes 8.87 (1.94, 40.54) 9.67 (2.16, 43.34) 18.52 (3.37, 101.87) 2.27 (0.21, 24.68)
P value for interaction 0.990 0.199 0.076 0.396 Psychological distressd
No 7.04 (4.15, 11.94) 14.53 (8.08, 26.10) 36.89 (18.87, 72.10) 4.43 (2.10, 9.34) Yes 3.70 (2.10, 6.52) 6.44 (3.37, 12.29) 14.14 (6.16, 32.43) 3.62 (1.59, 8.22)
P value for interaction 0.052 0.024 0.015 0.541 Abbreviations: BMI, body mass index; IDF, International Diabetes Federation; OR, odds ratio; 95% CI, 95% confidence interval. aExcept for the stratified variables, the following variables were adjusted for: age, sex, education, recreational physical activity participation, alcohol consumption, cigarette smoking, use of energy drinks, waist-to-hip ratio, and psychological distress. bAbdominal obesity was defined by the International Diabetes Federation (IDF) criteria for South Asians: waist circumference (WC)≥90 cm for men and WC≥80 cm for women. cExcept for the stratified variables, the following variables were adjusted for: age, sex, education, recreational physical activity participation, alcohol consumption, cigarette smoking, use of energy drinks, body mass index, and psychological distress. dPsychological distress was evaluated by the General Health Questionnaire 12-item scale (GHQ-12).
0.1 1 10
High BMI & High WHR
High BMI & Low WHR
Low BMI & High WHR
Women Low BMI & Low WHR
High BMI & High WHR
High BMI & Low WHR
Low BMI & High WHR
Men Low BMI & Low WHR
International Journal of Social Science Studies Vol. 2, No. 3; 2014
96
4. Discussion In this large cross-sectional study, 6.3% of college students in Thailand were at a high risk of OSA. Although the prevalence of obesity in our study population was lower than that in US adults (Flegal et al., 2012), we found consistent and robust associations of OSA with general and abdominal obesity, regardless of the obesity criteria used. To our knowledge, this is the first study to evaluate OSA and its association with both general obesity and abdominal obesity concurrently among young adults in Asia. 4.1 OSA Prevalence and OSA Related Risk Factors OSA is a common disorder and remains underdiagnosed in the general population. The prevalence of OSA in our Thai college students was relatively low when compared with middle-aged and old adults in the US (Hiestand et al., 2006) but higher than other populations such as young college students in Hong Kong (Hui et al., 1999). In the 2005 Sleep in America Poll of the National Sleep Foundation, the prevalence of OSA among middle-aged adults (mean age: 49 years) was 26% (men: 31%; women: 21%) (Hiestand et al., 2006). The prevalence of OSA was 6% in a large, relatively healthy, community-based cross-sectional study of 22,389 volunteer blood donors aged 16-84 years in New Zealand (Wilsmore et al., 2012). A study conducted in a university student population in Hong Kong found that 25.7% of first-year college students reported snoring, while the estimated prevalence of sleep-disordered breathing (SDB) was only 0.1% among college students (Hui et al., 1999). Although snoring was prevalent, SDB was uncommon in this Chinese college student population. The Hong Kong study reported that neck circumference did not predict the occurrence of SDB (Hui et al., 1999). Predictors of high risk for OSA have been reported, including male gender, older age, alcohol consumption, and cigarette smoking (Koyama et al., 2012). Consistent with previous research, we found similar results. We also found that the use of energy drinks was related to a higher risk of OSA, which has not been reported substantially in the literature. The fact that most of the risk factors for OSA such as energy drinks and cigarette smoking are modifiable indicates the need to develop appropriate intervention programs among college students. 4.2 The Association between OSA and Obesity Although obesity has been reported as a risk factor of OSA (Peppard et al., 2000; Wilsmore et al., 2012), the bidirectional association between OSA and obesity is unclear. The Wisconsin Sleep Cohort Study of 690 middle-aged US adults reported that obesity was associated with a significantly increased prevalence of OSA (Peppard et al., 2000). A small cross-sectional survey of 370 young adults and adults in Nigeria (Adewole et al., 2009) reported that overall 19% of participants had a high risk of OSA defined by the Berlin Questionnaire, and adults with OSA were more likely to be obese (Adewole et al., 2009). Another cross-sectional study in Korea reported that middle-aged adults with OSA had a higher BMI, WC, and percent body fat than those without OSA (Kim et al., 2013). Consistent with the Korean study reporting a significant and independent association between OSA and visceral obesity (Kim et al., 2013), we found that Thai college students with OSA were more likely to have abdominal obesity than those without OSA independent of potential confounders. Furthermore, we found that OSA was related to a much higher risk of being both general obesity and abdominal obesity, indicating that early screening, diagnosis, and treatment of OSA could be important in reducing obesity and related comorbidities among young adults. 4.3 Potential Mechanism of the OSA-Obesity Association Data from animal and human studies provide a biological plausibility to the notion that OSA may activate pathways that lead to obesity, insulin resistance, atherosclerosis, hypertension, and cardiovascular disease (Pillar et al., 2008). OSA is associated with increased sympathetic activity, sleep disturbance, oxidative stress, systemic inflammation, insulin resistance, and changes in leptin, ghrelin, and orexin levels, which potentially lead to excess weight or obesity (Pillar et al., 2008; Wolk et al., 2003). Obesity can increase fat deposits around the upper airway, narrow the upper airway, and diminish the activity of the muscles in this region, collapsing the airway during sleep (Pillar et al., 2008; Dempsey et al., 2010). Hormonal changes, changes in neuromuscular tone, and lifestyle factors such as energy drinks and alcohol consumption may contribute to the development of OSA among young adults (Singh et al., 2012; Pullman et al., 2009). The lack of early diagnosis and treatment of OSA and obesity might form a vicious cycle where each aggravates the other (Pillar et al., 2008). 4.4 Clinical and Public Health Implications Our findings suggest that clinical and public health programs that target screening and treatment of OSA may help reduce the risk of obesity and its related cardiovascular morbidity among college students and other young adults. Identifying individuals at a high risk of OSA and targeting them for cardiovascular disease control may be important to
International Journal of Social Science Studies Vol. 2, No. 3; 2014
97
mitigate risk for future morbidity and premature mortality (Yaggi et al., 2005; Campos-Rodriguez et al., 2005). Effectively treated OSA was associated with a significant decline in health care use when compared to OSA patients who were not effectively treated (Bahammam et al., 1999), and undiagnosed OSA patients incurred much higher medical costs than controls without OSA (Kapur et al., 1999). Given the fact that OSA is an independent risk factor for many chronic diseases, our study emphasizes the need for recognition and appropriate management of OSA among young adults to reduce the prevalence of obesity and other cardiovascular diseases. 4.5 Strengths and Limitations of the Study Our study has several strengths. First, this is a large population-based cross-sectional study of college students conducted in Thailand. Second, although polysomnography is the gold standard test for OSA diagnosis in clinical settings (Goncalves et al., 2007; Lavie et al., 2000), it is expensive and time consuming, and is not available at most primary care centers or in general populations (Pang et al., 2006). The Berlin Questionnaire is a validated instrument that has been used widely to identify individuals who are at risk for OSA (Hiestand et al., 2006). The measure of internal reliability, Cronbach’s alpha coefficient, was 0.84, indicating good reliability in our study population. Third, we used several robust statistical approaches and different definitions of obesity to evaluate the associations between OSA and general obesity and abdominal obesity. We also conducted stratified analyses and found strong and significant associations between OSA and obesity varied little by sex, blood pressure level and mental health status. Our study has limitations. First, we did not use random sampling, but instead considered subjects who were willing to participate in the study, so it was a convenient sample. Hence, our findings may be subject to volunteer bias. Second, our study only included full-time Thai college students and did not include students taking classes in correspondence, extension, or night school programs. Thus, the results might not be generalized to those students. Third, as this was a cross-sectional study, we were unable to determine the causal association between OSA and obesity. In addition, although the Berlin Questionnaire has been validated as a screening tool for OSA in general and clinical populations, some researchers have reported a lower sensitivity for screening health care workers for OSA (Geiger-Brown et al., 2013). It is possible that the Berlin Questionnaire might have a high proportion of false negatives, the prevalence of OSA may have been underestimated in our study population. Future prospective studies are warranted to thoroughly elucidate bi-directional associations between OSA and obesity among college students and other young adults. In conclusion, our study shows significant and independent associations of OSA with general and abdominal obesity among Thai college students, suggesting that OSA could be a risk factor for obesity and related cardiovascular morbidities. These findings have clinical and public health implications for OSA screening and treatment among young adults. Our findings showing significant and independent associations of OSA with general and abdominal obesity highlight the need for increased awareness of OSA and its adverse health consequences among young adults. Acknowledgements This work was supported by National Institutes of Health (NIH) and National Institute on Minority Health and Health Disparities (NIMHD) grants (T37-MD001449) and NIH/NCRR/NCATS (8UL1TR000170). References Adewole, O. O., Hakeem, A., Fola, A., Anteyi, E., Ajuwon, Z., & Erhabor, G. (2009). Obstructive sleep apnea among
adults in Nigeria. J Natl Med Assoc 101(7), 720-725. Bahammam, A., Delaive, K., Ronald, J., Manfreda, J., Roos, L., & Kryger, M. H. (1999). Health care utilization in
males with obstructive sleep apnea syndrome two years after diagnosis and treatment. Sleep 22(6), 740-747. Campos-Rodriguez, F., Pena-Grinan, N., Reyes-Nunez, N., De la Cruz-Moron, I., Perez-Ronchel, J., De la
Vega-Gallardo, F., & Fernandez-Palacin, A. (2005). Mortality in obstructive sleep apnea-hypopnea patients treated with positive airway pressure. Chest 128(2), 624-633. http://dx.doi.org/10.1378/chest.128.2.624
Chieraku,l N., Chaipattarapol, C., Ruttanaumpawan, P., Nana, A., Naruman, C., & Tangchityongsiva, S. (2007). Comparison of clinical and polysomnographic characteristics of non-obese and obese patients with obstructive sleep apnea. J Med Assoc Thai 90 Suppl 2, 48-53.
Coutinho, T., Goel, K., Correa, de. Sa. D., Carter, R. E., Hodge, D. O., Kragelund, C., Kanaya, A. M., Zeller, M., Park, J. S., Kober, L., Torp-Pedersen, C., Cottin, Y., Lorgis, L., Lee, S. H., Kim, Y. J., Thomas, R., Roger, V. L., Somers, V. K., & Lopez-Jimenez, F. (2013). Combining body mass index with measures of central obesity in the assessment of mortality in subjects with coronary disease: role of "normal weight central obesity". J Am Coll Cardiol 61(5), 553-560. http://dx.doi.org/10.1016/j.jacc.2012.10.035
Dempsey, J. A., Veasey, S. C., Morgan, B. J., & O'Donnell, C. P. (2010). Pathophysiology of sleep apnea. Physiol Rev 90(1), 47-112. http://dx.doi.org/10.1152/physrev.00043.2008
International Journal of Social Science Studies Vol. 2, No. 3; 2014
98
Flegal, K. M, Carroll, M. D., Kit, B. K., & Ogden, C. L. (2012). Prevalence of obesity and trends in the distribution of body mass index among US adults, 1999-2010. JAMA 307(5), 491-497. http://dx.doi.org/10.1001/jama.2012.39
Fontaine, K. R., & Barofsky, I. (2001). Obesity and health-related quality of life. Obes Rev 2(3), 173-182. http://dx.doi.org/10.1046/j.1467-789x.2001.00032.x
Geiger-Brown, J., Rogers, V. E., Han, K., Trinkoff, A., Bausell, R. B., & Scharf, S. M. (2013). Occupational screening for sleep disorders in 12-h shift nurses using the Berlin Questionnaire. Sleep Breath 17(1), 381-388. http://dx.doi.org/10.1007/s11325-012-0705-3
Goldberg, D. P., Gater, R., Sartorius, N., Ustun, T. B., Piccinelli, M., Gureje, O., & Rutter, C. (1997). The validity of two versions of the GHQ in the WHO study of mental illness in general health care. Psychol Med 27(1), 191-197.
Goncalves, S. C., Martinez, D., Gus, M., de Abreu-Silva, E. O., Bertoluci, C. , Dutra, I., Branchi, T., Moreira, L. B., Fuchs, S. C., de Oliveira, A. C., & Fuchs, F. D. (2007). Obstructive sleep apnea and resistant hypertension: a case-control study. Chest 132(6), 1858-1862. http://dx.doi.org/10.1378/chest.07-1170
Hiestand, D. M., Britz, P., Goldman, M., & Phillips, B. (2006). Prevalence of symptoms and risk of sleep apnea in the US population: Results from the national sleep foundation sleep in America 2005 poll. Chest 130(3), 780-786. http://dx.doi.org/10.1378/chest.130.3.780
Hui, D. S., Chan, J. K., Ho, A. S., Choy, D. K., Lai, C. K., & Leung, R. C. (1999). Prevalence of snoring and sleep-disordered breathing in a student population. Chest 116(6), 1530-1536. http://dx.doi.org/10.1378/chest.116.6.1530
Janssen, I., Katzmarzyk, P. T., & Ross, R. (2004). Waist circumference and not body mass index explains obesity-related health risk. Am J Clin Nutr 79(3), 379-384.
Jitnarin, N., Kosulwat, V., Rojroongwasinkul, N., Boonpraderm, A., Haddock, C. K., & Poston, W. S. (2011). Prevalence of overweight and obesity in Thai population: results of the National Thai Food Consumption Survey . Eat Weight Disord 16(4), e242-249. http://dx.doi.org/10.1007/BF03327467
Kapur, V., Blough, D. K., Sandblom, R. E., Hert, R., de Maine, J. B., Sullivan, S. D., & Psaty, B. M. (1999). The medical cost of undiagnosed sleep apnea. Sleep 22(6), 749-755.
Ke-You, G., & Da-Wei, F. (2001). The magnitude and trends of under- and over-nutrition in Asian countries. Biomed Environ Sci 14(1-2), 53-60.
Kim, N. H., Lee, S. K., Eun, C. R., Seo, J. A., Kim, S. G., Choi, K. M., Baik, S. H., Choi, D. S., Yun, C. H., & Shin, C. (2013). Short Sleep Duration Combined with Obstructive Sleep Apnea is Associated with Visceral Obesity in Korean Adults. Sleep 36(5), 723-729.
Koyama, R. G., Esteves, A. M., Oliveira, E. S. L., Lira, F. S., Bittencourt, L. R., Tufik, S., & de Mello, M. T. (2012). Prevalence of and risk factors for obstructive sleep apnea syndrome in Brazilian railroad workers. Sleep Med 13(8), 1028-1032. http://dx.doi.org/10.1016/j.sleep.2012.06.017
Kripke, D. F., Ancoli-Israel, S., Klauber, M. R., Wingard, D. L., Mason, W. J., & Mullaney, D. J. (1997). Prevalence of sleep-disordered breathing in ages 40-64 years: a population-based survey. Sleep 20(1), 65-76.
Lavie, P., Herer, P., & Hoffstein, V. (2000). Obstructive sleep apnoea syndrome as a risk factor for hypertension: population study. BMJ 320(7233), 479-482. http://dx.doi.org/10.1136/bmj.320.7233.479
Lenfant, C., Chobanian, A. V., Jones, D. W., & Roccella, E. J. (2003). Seventh report of the Joint National Committee on the Prevention, Detection, Evaluation, and Treatment of High Blood Pressure (JNC 7): resetting the hypertension sails. Hypertension 41(6), 1178-1179. http://dx.doi.org/10.1161/01.HYP.0000075790.33892.AE
Lohsoonthorn, V., Khidir, H., Casillas, G., Lertmaharit, S., Tadesse, M. G., Pensuksan, W. C., Rattananupong, T., Gelaye, B., & Williams, M. A. (2013). Sleep quality and sleep patterns in relation to consumption of energy drinks, caffeinated beverages, and other stimulants among Thai college students. Sleep Breath 17(3), 1017-28 http://dx.doi.org/10.1007/s11325-012-0792-1
Mirrakhimov, A. E., Sooronbaev, T., & Mirrakhimov, E. M. (2013). Prevalence of obstructive sleep apnea in Asian adults: a systematic review of the literature. BMC Pulm Med 13, 10. http://dx.doi.org/10.1186/1471-2466-13-10
Netzer, N. C., Stoohs, R. A., Netzer, C. M., Clark, K., & Strohl, K. P. (1999). Using the Berlin Questionnaire to identify patients at risk for the sleep apnea syndrome. Ann Intern Med 131(7), 485-491. http://dx.doi.org/10.7326/0003-4819-131-7-199910050-00002
Nieto, F. J., Young, T. B., Lind, B. K., Shahar, E., Samet, J. M., Redline, S., D'Agostino, R. B., Newman, A. B.,
International Journal of Social Science Studies Vol. 2, No. 3; 2014
99
Lebowitz, M. D., & Pickering, T. G. (2000). Association of sleep-disordered breathing, sleep apnea, and hypertension in a large community-based study. Sleep Heart Health Study. JAMA 283(14), 1829-1836. http://dx.doi.org/10.1001/jama.283.14.1829
Pang, K. P., & Terris, D. J. (2006). Screening for obstructive sleep apnea: an evidence-based analysis. Am J Otolaryngol 27(2), 112-118. http://dx.doi.org/10.1016/j.amjoto.2005.09.002
Pendlebury, S. T., Pepin, J. L., Veale, D., & Levy, P. (1997). Natural evolution of moderate sleep apnoea syndrome: significant progression over a mean of 17 months. Thorax 52(10), 872-878. http://dx.doi.org/10.1136/thx.52.10.872
Peppard, P. E., Young, T., Palta, M., Dempsey, J., & Skatrud, J. (2000). Longitudinal study of moderate weight change and sleep-disordered breathing. JAMA 284(23), 3015-3021. http://dx.doi.org/10.1001/jama.284.23.3015
Pillar, G., & Shehadeh, N. (2008). Abdominal fat and sleep apnea: the chicken or the egg? Diabetes Care 31 Suppl 2, S303-309. http://dx.doi.org/10.2337/dc08-s272
Pullman, A. W., Masters, R. C., Zalot, L. C., Carde, L. E., Saraiva, M. M., Dam, Y. Y., Randall Simpson, J. A., & Duncan, A. M. (2009). Effect of the transition from high school to university on anthropometric and lifestyle variables in males. Appl Physiol Nutr Metab 34(2), 162-171. http://dx.doi.org/10.1139/H09-007
Sforza, E., Addati, G., Cirignotta, F., & Lugaresi, E. (1994). Natural evolution of sleep apnoea syndrome: a five year longitudinal study. Eur Respir J 7(10), 1765-1770. http://dx.doi.org/10.1183/09031936.94.07101765
Singh, V., Pandey, S., Singh, A., Gupta, R., Prasad, R., & Singh Negi, M. P. (2012). Study pattern of snoring and associated risk factors among medical students. Biosci Trends 6(2), 57-62.
Stradling, J. R., & Crosby, J. H. (1991). Predictors and prevalence of obstructive sleep apnoea and snoring in 1001 middle aged men. Thorax 46(2), 85-90. http://dx.doi.org/10.1136/thx.46.2.85
Sullivan, P. W., Ghushchyan, V., & Ben-Joseph, R. H. (2008). The effect of obesity and cardiometabolic risk factors on expenditures and productivity in the United States. Obesity (Silver Spring) 16(9), 2155-2162. http://dx.doi.org/10.1038/oby.2008.325
Wilsmore, B. R., Grunstein, R. R., Fransen, M., Woodward, M., Norton, R., & Ameratunga, S. (2012). Sleep, blood pressure and obesity in 22,389 New Zealanders. Intern Med J 42(6), 634-641. http://dx.doi.org/10.1111/j.1445-5994.2012.02753.x
Wolk, R., Shamsuzzaman, A. S., & Somers, V. K. (2003). Obesity, sleep apnea, and hypertension. Hypertension 42(6), 1067-1074. http://dx.doi.org/10.1161/01.HYP.0000101686.98973.A3
Yaggi, H. K., Concato, J., Kernan, W. N., Lichtman, J. H., Brass, L. M., & Mohsenin, V. (2005). Obstructive sleep apnea as a risk factor for stroke and death. N Engl J Med 353(19), 2034-2041. http://dx.doi.org/10.1056/NEJMoa043104
Young, T., & Peppard, P. (2000). Sleep-disordered breathing and cardiovascular disease: epidemiologic evidence for a relationship. Sleep 23 Suppl 4, S122-126.
This work is licensed under a Creative Commons Attribution 3.0 License.
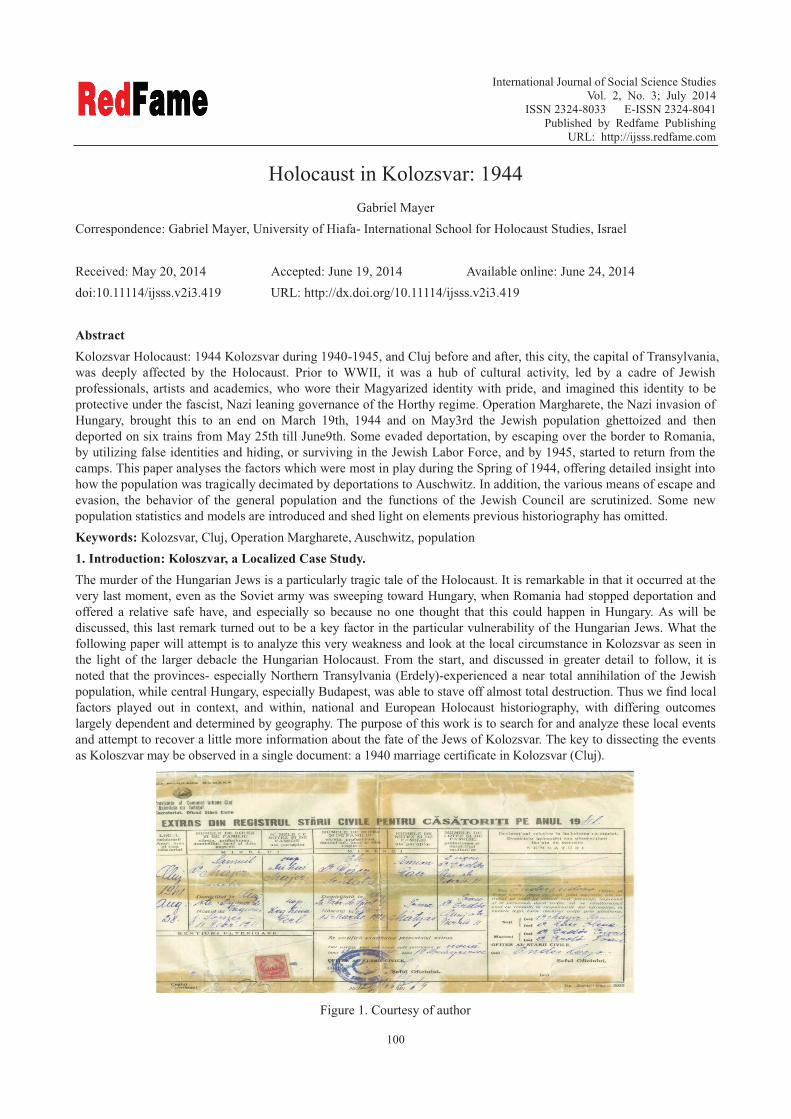
International Journal of Social Science Studies Vol. 2, No. 3; July 2014
ISSN 2324-8033 E-ISSN 2324-8041 Published by Redfame Publishing
URL: http://ijsss.redfame.com
100
Holocaust in Kolozsvar: 1944 Gabriel Mayer
Correspondence: Gabriel Mayer, University of Hiafa- International School for Holocaust Studies, Israel Received: May 20, 2014 Accepted: June 19, 2014 Available online: June 24, 2014 doi:10.11114/ijsss.v2i3.419 URL: http://dx.doi.org/10.11114/ijsss.v2i3.419 Abstract Kolozsvar Holocaust: 1944 Kolozsvar during 1940-1945, and Cluj before and after, this city, the capital of Transylvania, was deeply affected by the Holocaust. Prior to WWII, it was a hub of cultural activity, led by a cadre of Jewish professionals, artists and academics, who wore their Magyarized identity with pride, and imagined this identity to be protective under the fascist, Nazi leaning governance of the Horthy regime. Operation Margharete, the Nazi invasion of Hungary, brought this to an end on March 19th, 1944 and on May3rd the Jewish population ghettoized and then deported on six trains from May 25th till June9th. Some evaded deportation, by escaping over the border to Romania, by utilizing false identities and hiding, or surviving in the Jewish Labor Force, and by 1945, started to return from the camps. This paper analyses the factors which were most in play during the Spring of 1944, offering detailed insight into how the population was tragically decimated by deportations to Auschwitz. In addition, the various means of escape and evasion, the behavior of the general population and the functions of the Jewish Council are scrutinized. Some new population statistics and models are introduced and shed light on elements previous historiography has omitted. Keywords: Kolozsvar, Cluj, Operation Margharete, Auschwitz, population 1. Introduction: Koloszvar, a Localized Case Study. The murder of the Hungarian Jews is a particularly tragic tale of the Holocaust. It is remarkable in that it occurred at the very last moment, even as the Soviet army was sweeping toward Hungary, when Romania had stopped deportation and offered a relative safe have, and especially so because no one thought that this could happen in Hungary. As will be discussed, this last remark turned out to be a key factor in the particular vulnerability of the Hungarian Jews. What the following paper will attempt is to analyze this very weakness and look at the local circumstance in Kolozsvar as seen in the light of the larger debacle the Hungarian Holocaust. From the start, and discussed in greater detail to follow, it is noted that the provinces- especially Northern Transylvania (Erdely)-experienced a near total annihilation of the Jewish population, while central Hungary, especially Budapest, was able to stave off almost total destruction. Thus we find local factors played out in context, and within, national and European Holocaust historiography, with differing outcomes largely dependent and determined by geography. The purpose of this work is to search for and analyze these local events and attempt to recover a little more information about the fate of the Jews of Kolozsvar. The key to dissecting the events as Koloszvar may be observed in a single document: a 1940 marriage certificate in Kolozsvar (Cluj).
Figure 1. Courtesy of author
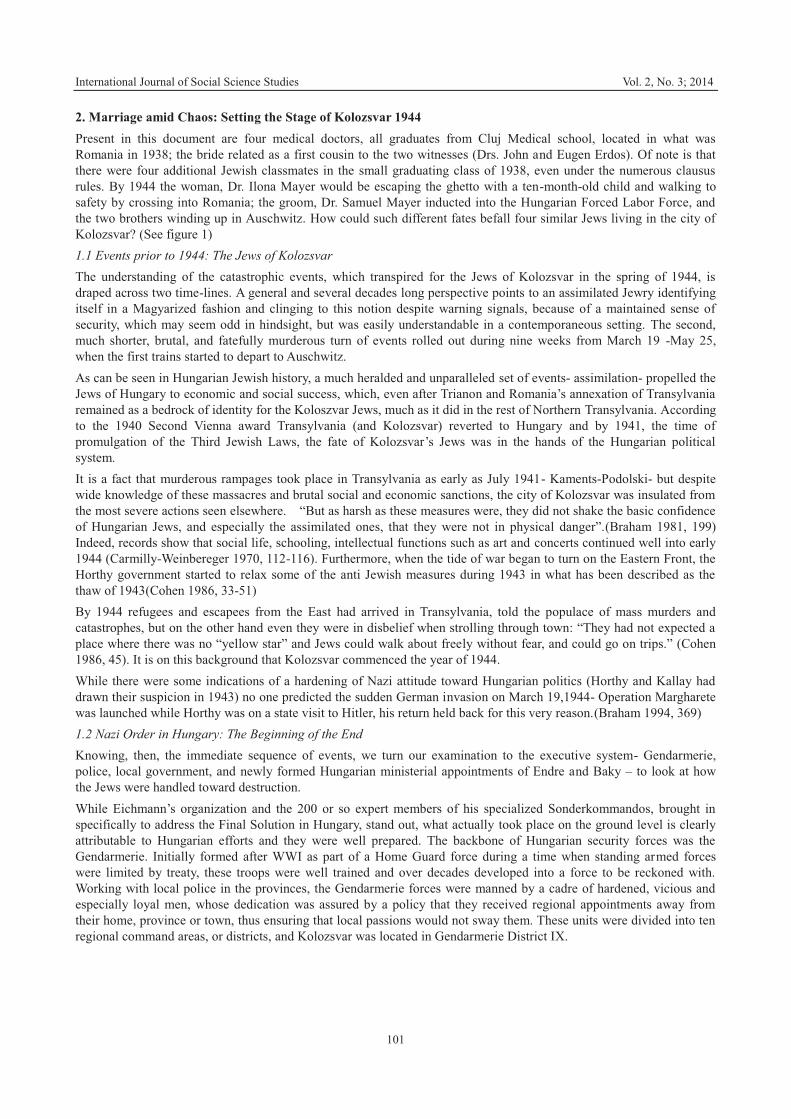
International Journal of Social Science Studies Vol. 2, No. 3; 2014
101
2. Marriage amid Chaos: Setting the Stage of Kolozsvar 1944 Present in this document are four medical doctors, all graduates from Cluj Medical school, located in what was Romania in 1938; the bride related as a first cousin to the two witnesses (Drs. John and Eugen Erdos). Of note is that there were four additional Jewish classmates in the small graduating class of 1938, even under the numerous clausus rules. By 1944 the woman, Dr. Ilona Mayer would be escaping the ghetto with a ten-month-old child and walking to safety by crossing into Romania; the groom, Dr. Samuel Mayer inducted into the Hungarian Forced Labor Force, and the two brothers winding up in Auschwitz. How could such different fates befall four similar Jews living in the city of Kolozsvar? (See figure 1) 1.1 Events prior to 1944: The Jews of Kolozsvar The understanding of the catastrophic events, which transpired for the Jews of Kolozsvar in the spring of 1944, is draped across two time-lines. A general and several decades long perspective points to an assimilated Jewry identifying itself in a Magyarized fashion and clinging to this notion despite warning signals, because of a maintained sense of security, which may seem odd in hindsight, but was easily understandable in a contemporaneous setting. The second, much shorter, brutal, and fatefully murderous turn of events rolled out during nine weeks from March 19 -May 25, when the first trains started to depart to Auschwitz. As can be seen in Hungarian Jewish history, a much heralded and unparalleled set of events- assimilation- propelled the Jews of Hungary to economic and social success, which, even after Trianon and Romania’s annexation of Transylvania remained as a bedrock of identity for the Koloszvar Jews, much as it did in the rest of Northern Transylvania. According to the 1940 Second Vienna award Transylvania (and Kolozsvar) reverted to Hungary and by 1941, the time of promulgation of the Third Jewish Laws, the fate of Kolozsvar’s Jews was in the hands of the Hungarian political system. It is a fact that murderous rampages took place in Transylvania as early as July 1941- Kaments-Podolski- but despite wide knowledge of these massacres and brutal social and economic sanctions, the city of Kolozsvar was insulated from the most severe actions seen elsewhere. “But as harsh as these measures were, they did not shake the basic confidence of Hungarian Jews, and especially the assimilated ones, that they were not in physical danger”.(Braham 1981, 199) Indeed, records show that social life, schooling, intellectual functions such as art and concerts continued well into early 1944 (Carmilly-Weinbereger 1970, 112-116). Furthermore, when the tide of war began to turn on the Eastern Front, the Horthy government started to relax some of the anti Jewish measures during 1943 in what has been described as the thaw of 1943(Cohen 1986, 33-51) By 1944 refugees and escapees from the East had arrived in Transylvania, told the populace of mass murders and catastrophes, but on the other hand even they were in disbelief when strolling through town: “They had not expected a place where there was no “yellow star” and Jews could walk about freely without fear, and could go on trips.” (Cohen 1986, 45). It is on this background that Kolozsvar commenced the year of 1944. While there were some indications of a hardening of Nazi attitude toward Hungarian politics (Horthy and Kallay had drawn their suspicion in 1943) no one predicted the sudden German invasion on March 19,1944- Operation Margharete was launched while Horthy was on a state visit to Hitler, his return held back for this very reason.(Braham 1994, 369) 1.2 Nazi Order in Hungary: The Beginning of the End Knowing, then, the immediate sequence of events, we turn our examination to the executive system- Gendarmerie, police, local government, and newly formed Hungarian ministerial appointments of Endre and Baky – to look at how the Jews were handled toward destruction. While Eichmann’s organization and the 200 or so expert members of his specialized Sonderkommandos, brought in specifically to address the Final Solution in Hungary, stand out, what actually took place on the ground level is clearly attributable to Hungarian efforts and they were well prepared. The backbone of Hungarian security forces was the Gendarmerie. Initially formed after WWI as part of a Home Guard force during a time when standing armed forces were limited by treaty, these troops were well trained and over decades developed into a force to be reckoned with. Working with local police in the provinces, the Gendarmerie forces were manned by a cadre of hardened, vicious and especially loyal men, whose dedication was assured by a policy that they received regional appointments away from their home, province or town, thus ensuring that local passions would not sway them. These units were divided into ten regional command areas, or districts, and Kolozsvar was located in Gendarmerie District IX.
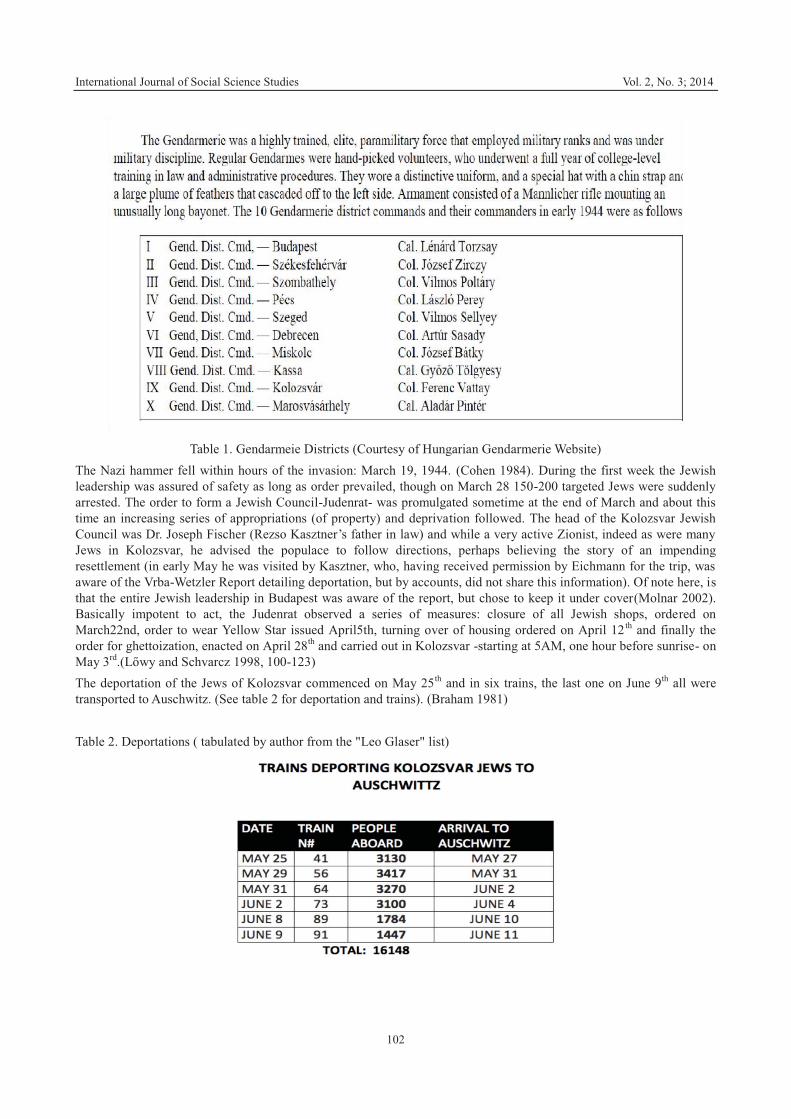
International Journal of Social Science Studies Vol. 2, No. 3; 2014
102
Table 1. Gendarmeie Districts (Courtesy of Hungarian Gendarmerie Website) The Nazi hammer fell within hours of the invasion: March 19, 1944. (Cohen 1984). During the first week the Jewish leadership was assured of safety as long as order prevailed, though on March 28 150-200 targeted Jews were suddenly arrested. The order to form a Jewish Council-Judenrat- was promulgated sometime at the end of March and about this time an increasing series of appropriations (of property) and deprivation followed. The head of the Kolozsvar Jewish Council was Dr. Joseph Fischer (Rezso Kasztner’s father in law) and while a very active Zionist, indeed as were many Jews in Kolozsvar, he advised the populace to follow directions, perhaps believing the story of an impending resettlement (in early May he was visited by Kasztner, who, having received permission by Eichmann for the trip, was aware of the Vrba-Wetzler Report detailing deportation, but by accounts, did not share this information). Of note here, is that the entire Jewish leadership in Budapest was aware of the report, but chose to keep it under cover(Molnar 2002). Basically impotent to act, the Judenrat observed a series of measures: closure of all Jewish shops, ordered on March22nd, order to wear Yellow Star issued April5th, turning over of housing ordered on April 12th and finally the order for ghettoization, enacted on April 28th and carried out in Kolozsvar -starting at 5AM, one hour before sunrise- on May 3rd.(Lőwy and Schvarcz 1998, 100-123) The deportation of the Jews of Kolozsvar commenced on May 25th and in six trains, the last one on June 9th all were transported to Auschwitz. (See table 2 for deportation and trains). (Braham 1981) Table 2. Deportations ( tabulated by author from the "Leo Glaser" list)
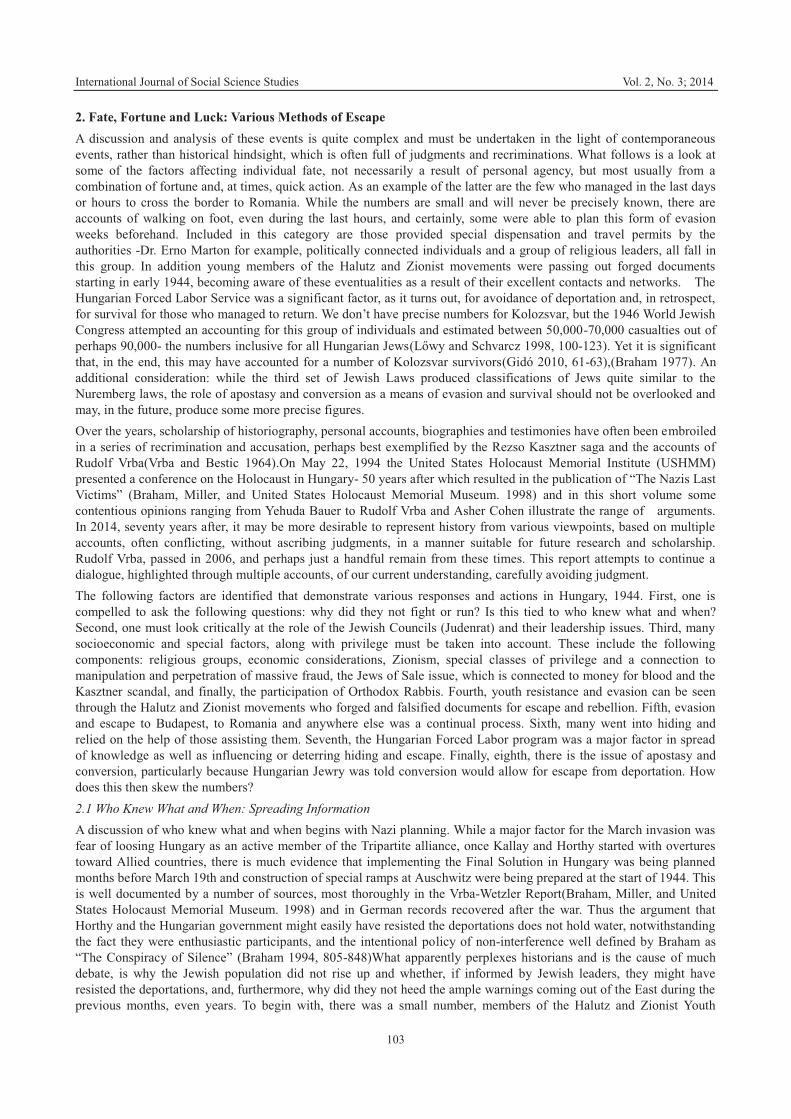
International Journal of Social Science Studies Vol. 2, No. 3; 2014
103
2. Fate, Fortune and Luck: Various Methods of Escape A discussion and analysis of these events is quite complex and must be undertaken in the light of contemporaneous events, rather than historical hindsight, which is often full of judgments and recriminations. What follows is a look at some of the factors affecting individual fate, not necessarily a result of personal agency, but most usually from a combination of fortune and, at times, quick action. As an example of the latter are the few who managed in the last days or hours to cross the border to Romania. While the numbers are small and will never be precisely known, there are accounts of walking on foot, even during the last hours, and certainly, some were able to plan this form of evasion weeks beforehand. Included in this category are those provided special dispensation and travel permits by the authorities -Dr. Erno Marton for example, politically connected individuals and a group of religious leaders, all fall in this group. In addition young members of the Halutz and Zionist movements were passing out forged documents starting in early 1944, becoming aware of these eventualities as a result of their excellent contacts and networks. The Hungarian Forced Labor Service was a significant factor, as it turns out, for avoidance of deportation and, in retrospect, for survival for those who managed to return. We don’t have precise numbers for Kolozsvar, but the 1946 World Jewish Congress attempted an accounting for this group of individuals and estimated between 50,000-70,000 casualties out of perhaps 90,000- the numbers inclusive for all Hungarian Jews(Lőwy and Schvarcz 1998, 100-123). Yet it is significant that, in the end, this may have accounted for a number of Kolozsvar survivors(Gidó 2010, 61-63),(Braham 1977). An additional consideration: while the third set of Jewish Laws produced classifications of Jews quite similar to the Nuremberg laws, the role of apostasy and conversion as a means of evasion and survival should not be overlooked and may, in the future, produce some more precise figures. Over the years, scholarship of historiography, personal accounts, biographies and testimonies have often been embroiled in a series of recrimination and accusation, perhaps best exemplified by the Rezso Kasztner saga and the accounts of Rudolf Vrba(Vrba and Bestic 1964).On May 22, 1994 the United States Holocaust Memorial Institute (USHMM) presented a conference on the Holocaust in Hungary- 50 years after which resulted in the publication of “The Nazis Last Victims” (Braham, Miller, and United States Holocaust Memorial Museum. 1998) and in this short volume some contentious opinions ranging from Yehuda Bauer to Rudolf Vrba and Asher Cohen illustrate the range of arguments. In 2014, seventy years after, it may be more desirable to represent history from various viewpoints, based on multiple accounts, often conflicting, without ascribing judgments, in a manner suitable for future research and scholarship. Rudolf Vrba, passed in 2006, and perhaps just a handful remain from these times. This report attempts to continue a dialogue, highlighted through multiple accounts, of our current understanding, carefully avoiding judgment. The following factors are identified that demonstrate various responses and actions in Hungary, 1944. First, one is compelled to ask the following questions: why did they not fight or run? Is this tied to who knew what and when? Second, one must look critically at the role of the Jewish Councils (Judenrat) and their leadership issues. Third, many socioeconomic and special factors, along with privilege must be taken into account. These include the following components: religious groups, economic considerations, Zionism, special classes of privilege and a connection to manipulation and perpetration of massive fraud, the Jews of Sale issue, which is connected to money for blood and the Kasztner scandal, and finally, the participation of Orthodox Rabbis. Fourth, youth resistance and evasion can be seen through the Halutz and Zionist movements who forged and falsified documents for escape and rebellion. Fifth, evasion and escape to Budapest, to Romania and anywhere else was a continual process. Sixth, many went into hiding and relied on the help of those assisting them. Seventh, the Hungarian Forced Labor program was a major factor in spread of knowledge as well as influencing or deterring hiding and escape. Finally, eighth, there is the issue of apostasy and conversion, particularly because Hungarian Jewry was told conversion would allow for escape from deportation. How does this then skew the numbers? 2.1 Who Knew What and When: Spreading Information A discussion of who knew what and when begins with Nazi planning. While a major factor for the March invasion was fear of loosing Hungary as an active member of the Tripartite alliance, once Kallay and Horthy started with overtures toward Allied countries, there is much evidence that implementing the Final Solution in Hungary was being planned months before March 19th and construction of special ramps at Auschwitz were being prepared at the start of 1944. This is well documented by a number of sources, most thoroughly in the Vrba-Wetzler Report(Braham, Miller, and United States Holocaust Memorial Museum. 1998) and in German records recovered after the war. Thus the argument that Horthy and the Hungarian government might easily have resisted the deportations does not hold water, notwithstanding the fact they were enthusiastic participants, and the intentional policy of non-interference well defined by Braham as “The Conspiracy of Silence” (Braham 1994, 805-848)What apparently perplexes historians and is the cause of much debate, is why the Jewish population did not rise up and whether, if informed by Jewish leaders, they might have resisted the deportations, and, furthermore, why did they not heed the ample warnings coming out of the East during the previous months, even years. To begin with, there was a small number, members of the Halutz and Zionist Youth
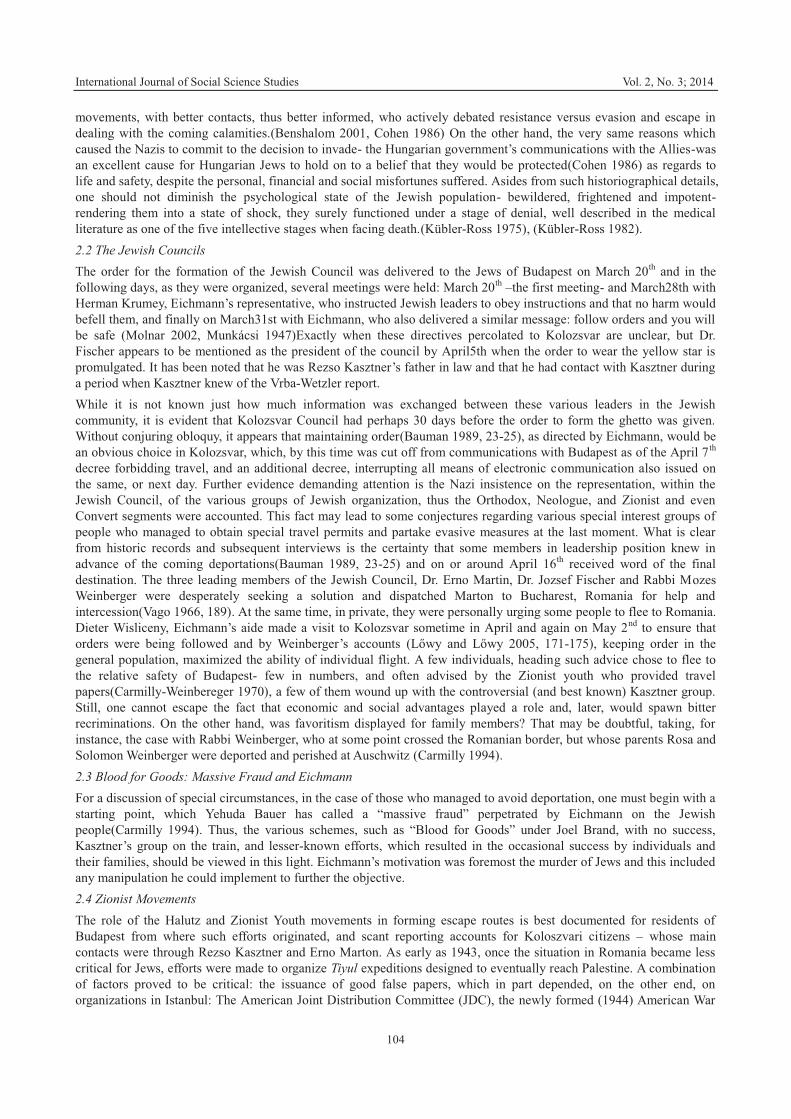
International Journal of Social Science Studies Vol. 2, No. 3; 2014
104
movements, with better contacts, thus better informed, who actively debated resistance versus evasion and escape in dealing with the coming calamities.(Benshalom 2001, Cohen 1986) On the other hand, the very same reasons which caused the Nazis to commit to the decision to invade- the Hungarian government’s communications with the Allies-was an excellent cause for Hungarian Jews to hold on to a belief that they would be protected(Cohen 1986) as regards to life and safety, despite the personal, financial and social misfortunes suffered. Asides from such historiographical details, one should not diminish the psychological state of the Jewish population- bewildered, frightened and impotent- rendering them into a state of shock, they surely functioned under a stage of denial, well described in the medical literature as one of the five intellective stages when facing death.(Kübler-Ross 1975), (Kübler-Ross 1982). 2.2 The Jewish Councils The order for the formation of the Jewish Council was delivered to the Jews of Budapest on March 20th and in the following days, as they were organized, several meetings were held: March 20th –the first meeting- and March28th with Herman Krumey, Eichmann’s representative, who instructed Jewish leaders to obey instructions and that no harm would befell them, and finally on March31st with Eichmann, who also delivered a similar message: follow orders and you will be safe (Molnar 2002, Munkácsi 1947)Exactly when these directives percolated to Kolozsvar are unclear, but Dr. Fischer appears to be mentioned as the president of the council by April5th when the order to wear the yellow star is promulgated. It has been noted that he was Rezso Kasztner’s father in law and that he had contact with Kasztner during a period when Kasztner knew of the Vrba-Wetzler report. While it is not known just how much information was exchanged between these various leaders in the Jewish community, it is evident that Kolozsvar Council had perhaps 30 days before the order to form the ghetto was given. Without conjuring obloquy, it appears that maintaining order(Bauman 1989, 23-25), as directed by Eichmann, would be an obvious choice in Kolozsvar, which, by this time was cut off from communications with Budapest as of the April 7th decree forbidding travel, and an additional decree, interrupting all means of electronic communication also issued on the same, or next day. Further evidence demanding attention is the Nazi insistence on the representation, within the Jewish Council, of the various groups of Jewish organization, thus the Orthodox, Neologue, and Zionist and even Convert segments were accounted. This fact may lead to some conjectures regarding various special interest groups of people who managed to obtain special travel permits and partake evasive measures at the last moment. What is clear from historic records and subsequent interviews is the certainty that some members in leadership position knew in advance of the coming deportations(Bauman 1989, 23-25) and on or around April 16th received word of the final destination. The three leading members of the Jewish Council, Dr. Erno Martin, Dr. Jozsef Fischer and Rabbi Mozes Weinberger were desperately seeking a solution and dispatched Marton to Bucharest, Romania for help and intercession(Vago 1966, 189). At the same time, in private, they were personally urging some people to flee to Romania. Dieter Wisliceny, Eichmann’s aide made a visit to Kolozsvar sometime in April and again on May 2nd to ensure that orders were being followed and by Weinberger’s accounts (Lőwy and Lőwy 2005, 171-175), keeping order in the general population, maximized the ability of individual flight. A few individuals, heading such advice chose to flee to the relative safety of Budapest- few in numbers, and often advised by the Zionist youth who provided travel papers(Carmilly-Weinbereger 1970), a few of them wound up with the controversial (and best known) Kasztner group. Still, one cannot escape the fact that economic and social advantages played a role and, later, would spawn bitter recriminations. On the other hand, was favoritism displayed for family members? That may be doubtful, taking, for instance, the case with Rabbi Weinberger, who at some point crossed the Romanian border, but whose parents Rosa and Solomon Weinberger were deported and perished at Auschwitz (Carmilly 1994). 2.3 Blood for Goods: Massive Fraud and Eichmann For a discussion of special circumstances, in the case of those who managed to avoid deportation, one must begin with a starting point, which Yehuda Bauer has called a “massive fraud” perpetrated by Eichmann on the Jewish people(Carmilly 1994). Thus, the various schemes, such as “Blood for Goods” under Joel Brand, with no success, Kasztner’s group on the train, and lesser-known efforts, which resulted in the occasional success by individuals and their families, should be viewed in this light. Eichmann’s motivation was foremost the murder of Jews and this included any manipulation he could implement to further the objective. 2.4 Zionist Movements The role of the Halutz and Zionist Youth movements in forming escape routes is best documented for residents of Budapest from where such efforts originated, and scant reporting accounts for Koloszvari citizens – whose main contacts were through Rezso Kasztner and Erno Marton. As early as 1943, once the situation in Romania became less critical for Jews, efforts were made to organize Tiyul expeditions designed to eventually reach Palestine. A combination of factors proved to be critical: the issuance of good false papers, which in part depended, on the other end, on organizations in Istanbul: The American Joint Distribution Committee (JDC), the newly formed (1944) American War
International Journal of Social Science Studies Vol. 2, No. 3; 2014
105
Rescue Board (WRB), the Jewish Agency in Palestine and the International Red Cross who often served as the agent of funds transfers. Kolozsvar, along with Nagyvarad and Bekescsaba were the usual Tiyulim departure points from Transylvania and even after Nazi occupation there were a few instances of departures from Kolozsvar- where Dror-Habonim would account for the major efforts(Bauer 1994). Individual rescue efforts were not common in Kolozsvar, but are documented, as in the case of Dr. Rudolf Hainal- head of the internal medicine department in the Koloszvar Medical University – who kept several people hidden as patients on a ward for the duration of the occupation(Cohen 1986, 81-105). 2.5 Religious Conversion as a Means for Escape Kolozsvar is 32km from Torda, and there are even shorter routes to crossing the Romanian border, all within reasonable walking distance. During the three months from March-May the estimated crossings, not necessarily originating from Kolozsvar (but inclusive for Hungary), provided by several sources, account for 2,000 crossings aided by resistance organizations, another 5,000 individually- aided by the fact that most locals spoke Romanian well- and perhaps additional unreported numbers(Herzberger 2005, 345), (Lőwy and Lőwy 2005, 281). The role of religious conversion is also to be considered a factor as far as survival and evasion, though the numbers may be difficult to pin down for the exact reason they worked and, furthermore, what figures are available tend to reflect the whole of Hungary and less so in the provinces, hence Kolozsvar. What we do know is that in 1941 a new Hungarian census was conducted and the initial printing of the polling sheets omitted the questions formulated through the third set of Jewish Laws- Act XV of Hungarian Parliament, effective August 8, 1941(Cohen 1986, 99)- which necessitated the addition of questions about grandparents and thus treated many converted Christians as Jews according to these “Nuremberg Laws style” of definition. Thus, while 62,000 admitted to being Jewish by ancestry, it is estimated that the actual numbers were over 100,000- noted in one section of the sampling (Magyar Statisztikai Szemle p.96 reported by Kovacs) This census was promulgated in the 1944/45 Magyar Statisztikai Szemle and, while some of the numbers differ widely from each other(Gidó 2010, 61), by examinations of the raw data, there is a general consensus of figures which counts approximately 786,555 Total Jews- made up from a totaling of Jews classified by religion and Jews who became classified by ethnicity as determined by one or more grandparent. However, other estimates and calculations place the total number of Jews reported -determined by including those defined by religion, those defined by ethnicity- and an estimated number of those not counted but who might have fit via either of the previous as 949,934, a number which agrees with other estimates which emerge(Don 1983) (Agency 1945) (Agency-Archives 1944), including the current Jewish Agency For Israel web page (Lambert 1974). These figures require future statistical attention, especially where it concerns Kolozsvar- with a census figure of 18,600 Jews. Nonetheless, it is evident that apostasy and conversion yielded much better survival rates. Our work seems to indicate that additional 9% of the actual number of Jews fitting into any of the census categories went undetected, hidden by undisclosed identities. (See Tables 3. and 4.)
Table 3. (Tabulated by author)
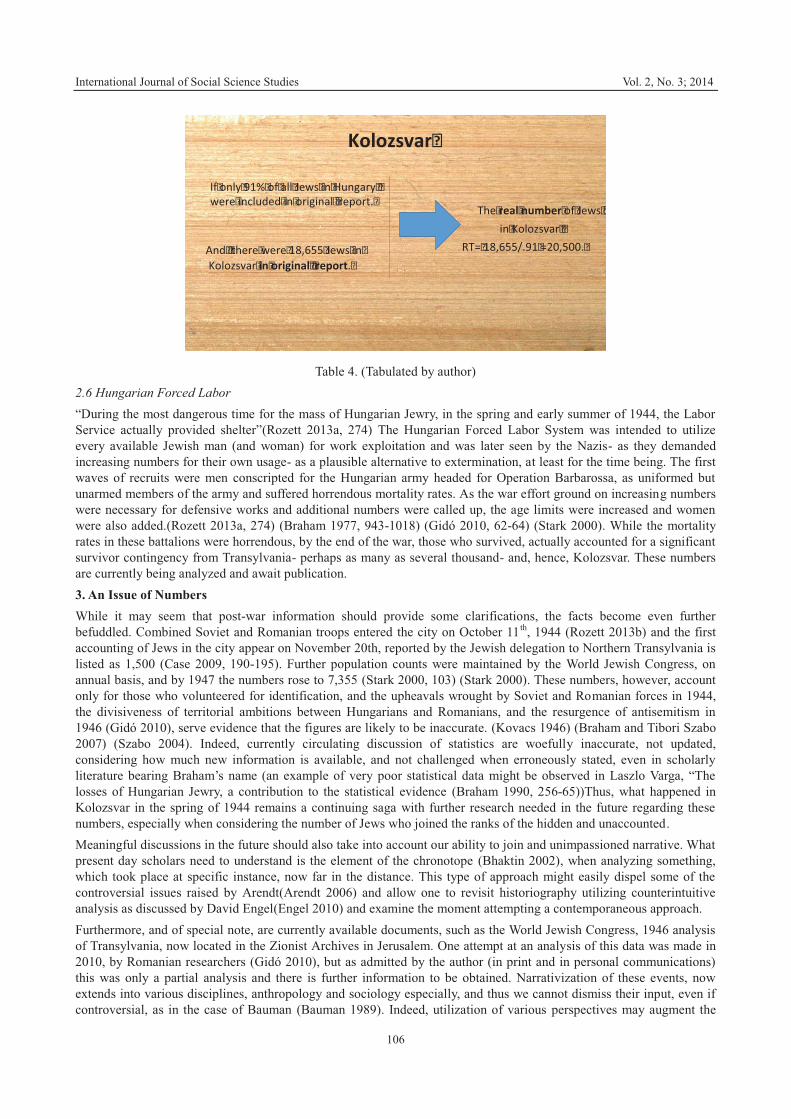
International Journal of Social Science Studies Vol. 2, No. 3; 2014
106
Table 4. (Tabulated by author) 2.6 Hungarian Forced Labor “During the most dangerous time for the mass of Hungarian Jewry, in the spring and early summer of 1944, the Labor Service actually provided shelter”(Rozett 2013a, 274) The Hungarian Forced Labor System was intended to utilize every available Jewish man (and woman) for work exploitation and was later seen by the Nazis- as they demanded increasing numbers for their own usage- as a plausible alternative to extermination, at least for the time being. The first waves of recruits were men conscripted for the Hungarian army headed for Operation Barbarossa, as uniformed but unarmed members of the army and suffered horrendous mortality rates. As the war effort ground on increasing numbers were necessary for defensive works and additional numbers were called up, the age limits were increased and women were also added.(Rozett 2013a, 274) (Braham 1977, 943-1018) (Gidó 2010, 62-64) (Stark 2000). While the mortality rates in these battalions were horrendous, by the end of the war, those who survived, actually accounted for a significant survivor contingency from Transylvania- perhaps as many as several thousand- and, hence, Kolozsvar. These numbers are currently being analyzed and await publication. 3. An Issue of Numbers While it may seem that post-war information should provide some clarifications, the facts become even further befuddled. Combined Soviet and Romanian troops entered the city on October 11th, 1944 (Rozett 2013b) and the first accounting of Jews in the city appear on November 20th, reported by the Jewish delegation to Northern Transylvania is listed as 1,500 (Case 2009, 190-195). Further population counts were maintained by the World Jewish Congress, on annual basis, and by 1947 the numbers rose to 7,355 (Stark 2000, 103) (Stark 2000). These numbers, however, account only for those who volunteered for identification, and the upheavals wrought by Soviet and Romanian forces in 1944, the divisiveness of territorial ambitions between Hungarians and Romanians, and the resurgence of antisemitism in 1946 (Gidó 2010), serve evidence that the figures are likely to be inaccurate. (Kovacs 1946) (Braham and Tibori Szabo 2007) (Szabo 2004). Indeed, currently circulating discussion of statistics are woefully inaccurate, not updated, considering how much new information is available, and not challenged when erroneously stated, even in scholarly literature bearing Braham’s name (an example of very poor statistical data might be observed in Laszlo Varga, “The losses of Hungarian Jewry, a contribution to the statistical evidence (Braham 1990, 256-65))Thus, what happened in Kolozsvar in the spring of 1944 remains a continuing saga with further research needed in the future regarding these numbers, especially when considering the number of Jews who joined the ranks of the hidden and unaccounted. Meaningful discussions in the future should also take into account our ability to join and unimpassioned narrative. What present day scholars need to understand is the element of the chronotope (Bhaktin 2002), when analyzing something, which took place at specific instance, now far in the distance. This type of approach might easily dispel some of the controversial issues raised by Arendt(Arendt 2006) and allow one to revisit historiography utilizing counterintuitive analysis as discussed by David Engel(Engel 2010) and examine the moment attempting a contemporaneous approach. Furthermore, and of special note, are currently available documents, such as the World Jewish Congress, 1946 analysis of Transylvania, now located in the Zionist Archives in Jerusalem. One attempt at an analysis of this data was made in 2010, by Romanian researchers (Gidó 2010), but as admitted by the author (in print and in personal communications) this was only a partial analysis and there is further information to be obtained. Narrativization of these events, now extends into various disciplines, anthropology and sociology especially, and thus we cannot dismiss their input, even if controversial, as in the case of Bauman (Bauman 1989). Indeed, utilization of various perspectives may augment the
Kolozsvar�
If�only�91%�of�all�Jews�in�Hungary��were�included�in�original��report.�
And��there�were�18,655�Jews�in�Kolozsvar�in�original��report.�
The�real�number�of�Jews��in�Kolozsvar��
RT=�18,655/.91�=20,500.�
32�
International Journal of Social Science Studies Vol. 2, No. 3; 2014
107
real historiography of the time. 4. Conclusion As has been amply pointed out, the various aspects of survival, even if analyzed in a methodic fashion, demonstrate a fragmented pattern. As far as Kolozsvar, the exact survival rates and the fate of some individuals, gets lost in the maelstrom of the Holocaust. However it is also likely that some people chose to become lost. Once the war was over, and faced with new turmoil, as the East and the West slugged it out for European hegemony, identity became a convenience for survival or advancement. For some, Communism offered a refuge, and they chose to part with their Jewish identity, while others, especially during the immediate period following the installation of Communism in Hungary and Romania, decided to emigrate, headed to Palestine, or fleeing the region to other locations. Thus revisiting the Holocaust in Koloszvar serves more than a scholarly exercise; it may shed light onto ongoing identity and personhood issues, and pose renewed significance for current generations of survivor offspring. References Agency, J. T. (1945). 600,000 of Hungary's 900,000 Jews Killed During Occupation, Swedish Diplomat Reports. JTA
Archives. Agency-Archives, J. T. (1944). "Jewish Leaders in England Urge Governmnet Action to Resuce Jews from Hungary.
JTA Atchives, March 22,1944. Arendt, H. (2006). Eichmann in Jerusalem : a report on the banality of evil, Penguin classics. New York, N.Y.:
Penguin Books. Bauer, Y. (1994). Jews for sale? : Nazi-Jewish negotiations, 1933-1945. New Haven: Yale University Press. Bauman, Z. (1989). Modernity and the Holocaust. Ithaca, N.Y.: Cornell University Press. Benshalom, R. (2001). We struggled for life : the Hungarian Zionist youth resistance during the Nazi Era. Jerusalem ;
Hewlett, N.Y.: Gefen Pub. House. Bhaktin, M. M. (2002). "Forms of Time and of the Chronotrope in the Novel:Notes toward a Historical Poetics". Edited
by Brian Richardson, "Marrative Dynamics: Essays on time, plot,closure and frames: Ohio Stae University Press. Braham, R. L. (1977). The Hungarian labor service system, 1939-1945, East European monographs. Boulder Colo.
New York: East European quarterly; distributed by Columbia University Press. Braham, R. L. (1981). The politics of genocide: the Holocaust in Hungary. 2 vols. Vol. 1. New York: Columbia
University Press. Braham, R. L. (1990). Studies on the Holocaust in Hungary. Boulder: Social Science Monographs and the Csengeri
Institute for Holocaust Studies of the Graduate School and University Center of the City University of New York. Braham, R. L. (1994). The politics of genocide : the Holocaust in Hungary. Rev. and enl. ed. 2 vols. Vol. 2, East
European monographs. New York. Boulder: Rosenthal Institute for Holocaust Studies Social Science Monographs; Distributed by Columbia University Press.
Braham, R. L., & Scott, M. (1998). United States Holocaust Memorial Museum. The Nazis' last victims : the Holocaust in Hungary. Detroit: Wayne State University Press.
Braham, R. L., & Zolta n Tibori Szabo. (2007). A magyarországi holokauszt földrajzi enciklopédiája. Budapest: Park Könyvkiadó.
Carmilly, M. (1994). The road to life : the rescue operation of Jewish refugees on the Hungarian-Romanian border in Transylvania, 1936-1944, Bibliotheca Judaica. New York: Shengold.
Carmilly-Weinbereger, M. (1970). Memorial Volume for the Jews of Kolozsvar A Kolozsvari Zsidosag Emlekkonyve. New York: Shhulsinger Bros.
Case, H. (2009). Between states : the Transylvanian question and the European idea during World War II. Stanford, Calif.: Stanford University Press. http://dx.doi.org/10.11126/stanford/9780804759861.001.0001
Cohen, A. (1984). Continuity in the Change: Hungary, 19 March 1944. Jewish Social Studies, 131-144. Cohen, A. (1986). The Halutz Resistance in Hungary, 1942-1944, East European monographs. Boulder Colo. New
York: Social Science Monographs; Institute for Holocaust Studies of the City University of New York : Distributed by Columbia University Press.
Don, Y., & George, M. (1983). The Demographic Development of Hungarian Jewry. Jewish Social Studies, 189-216. Engel, D. (2010). Historians of the Jews and the Holocaust. Stanford, Calif.: Stanford University Press.
International Journal of Social Science Studies Vol. 2, No. 3; 2014
108
Gidó, A., & Sólyom, Z. (2010). The Surviving Jewish Inhabitants of Cluj, Carei and Oradea. The Survey of the World Jewish Congress in 1946. In Working Papers in Romanian Minority Studies. Cluj-Napoca: Romanian Institute for Research on National Minorities.
Herzberger, M. (2005). Survival. Austin, Texas: Groundbreaking Press. Kovacs, J. (1946). Neo-Antisemitism in Hungary. Jewish Social Studies Published by: Indiana University Press, 8(3),
147-160. Kübler-Ross, E. (1975). Death: the final stage of growth, Human development books. Englewood Cliffs, N.J.:
Prentice-Hall. Kübler-Ross, E. (1982). Living with death and dying. 1st Macmillan paperbacks ed. New York: Macmillan. Lambert, G. (1974). Operation Hazalah. Indianapolis,: Bobbs-Merrill. Lőwy, D., & Dániel, L. (2005). A Kálváriától a tragédiáig : Kolozsvár zsidó lakosságának története. 2., jelentősen
bőv. ́es átdolg. kiad. ed. Kolozsvár: Koinónia. Lőwy, D., & Réka, S. (1998). A téglagyártól a tehervonatig : Kolozsvár zsidó lakosságának története. Kolozsvár:
Erdélyi Szépmíves Céh. Molnar, J. (2002). The Foundfation and Activities of the Hungarian Jewsih Council, March20-July7, 1944. Yad Vashem
Studies XXX, 93-124. Munkácsi, E. (1947). Hogyan történt? Adatok és okmányok a magyar zsidóság tragédiájához. Budapest,: Renaissance
Kiadás. Rozett, R. (2013a). Conscripted Slaves: Hungarian Jewish Forced Laborers on the Eastern Front during the Second
World War. Jerusalem: Yad Vashem. Rozett, R. (2013b). Coscripted Slaves. Jerusalem: Yad Vashem. Stark, T. S. (2000). Hungarian Jews during the Holocaust and after the Second World War, 1939-1949 : a statistical
review. Boulder: East European Monographs. Szabo, Z. T. (2004). Transylvanian Jewry During the Postwar Period, 1945-48 (Part 1). East European Perspectives:
October 1, 6(18). Vago, B. (1966). The Destruction of the Jews Transylvania (Erdely Zsidosaganak Elpusztitasa). Edited by Randolp L.
Braham, Hungarian-Jewish Studies. New York: World Federation of Hungarian Jews. Vrba, R., & Alan, B. (1964). I cannot forgive. New York: Grove Press.
This work is licensed under a Creative Commons Attribution 3.0 License.
International Journal of Social Science Studies Vol. 2, No. 3; July 2014
ISSN 2324-8033 E-ISSN 2324-8041 Published by Redfame Publishing
URL: http://ijsss.redfame.com
109
Climate Change and Public Health Situations in the Coastal Areas of Bangladesh
Russell Kabir1, Hafiz T.A. Khan1, Emma Ball2, Kay Caldwell3 1Department of Economics and International Development, Middlesex University, London, UK 2Department of Product Design and Mathematics, Middlesex University, London, UK 3 Department of Health and Education, Middlesex University, London, UK Correspondence: Russell Kabir, Department of Economics and International Development, Middlesex University, London NW4 4BT, UK. Received: May 31, 2014 Accepted: June 12, 2014 Available online: July 4, 2014 doi:10.11114/ijsss.v2i3.426 URL: http://dx.doi.org/10.11114/ijsss.v2i3.426 Abstract This study aims to investigate the population health of climate change affected people in the coastal areas of Bangladesh. The relationship between climate change and health lacks clarity in the existing literature. This study uses data collected from the area affected by cyclone Sidr in 2009. Results show that climate change triggered natural disasters such as Sidr can is affect the physical and mental health of this population. The prevalence of diarrhoea, skin diseases, dengue fever, hepatitis (jaundice) and other infectious diseases has increased after the natural disaster. The risk of injury and death also increased during the time of natural disaster. Children and older adults are the most vulnerable groups facing serious health problems including mental health. The majority of the health professionals, service providers and local community of coastal areas are more aware of the health impacts of climate change, yet their knowledge is limited regarding health protection measures. Keywords: Climate Change, Bangladesh, Cyclone, Health Impact, Infectious diseases, vulnerable population I. Introduction Human health depends on the natural environment and its ecosystem and our environment is changing rapidly at global, national and local level. The quality and the quantity of our natural environment have been deteriorating and the main reasons for these changes are anthropogenic. According to IPCC (2007) anthropogenically the driven climate change will increase the rate of environmental change, worsening the situation. On World Health Day 2008 the theme highlighted “protecting health from climate change” and which stated that changing patterns of climate are likely to affect the human health including vector borne diseases, safe drinking water, secure shelter, food supply and social relations (WHO, 2008). According to McMicheal et al. (2009:2123) “climate change arises in the context of a world that is now experiencing systemic disruptions to environment- and hence risk to health, wellbeing and social functioning. To address climate change, public health should therefore consider risks at whole population level.” The health of populations depends on the constant steadiness and execution of the planet`s ecological and physical systems, commonly denoted as life-support systems (McMichaeal, 2003). The United Nations Environment Programme (UNEP) suggests “poor environmental quality is directly responsible for some 25 per cent of all preventable ill health worldwide” (UNEP, 2002:306). The World Health Organization (WHO) reports that every year “about 1.2 million people die from causes attributable to urban air pollution, 2.2 million from diarrhoea largely resulting from lack of access to clean water supply and sanitation, and from poor hygiene, 3.5 million from malnutrition, and approximately 60,000 in natural disasters” (WHO, 2009:2). Research also showed evidence of climate change effects on vector-borne and other infectious diseases (Haines et al., 2006). It is now evident that vector borne diseases are responding to recent climate change in Europe (Purse et al., 2005). Due to latitudinal shifts there is growth of tick-borne encephalitis in northern Europe (Lindgren et al., 2000; Skarphedinsson et al., 2005). In 2003, a heat wave in Europe was an extreme event and the summer of the same year was probably the hottest in Europe since 1500 (Luterbacher et al., 2004). According to the climatologists human induced global climate change was responsible for such a heat wave in 2003 (Stott et al., 2003). Increases in the intensity of tropical cyclones are also due to climate change (Emanuel, 2005; Webster et al., 2005). Recently Japan was hit by earthquake and tsunami across the enfolds of its eastern coast and The
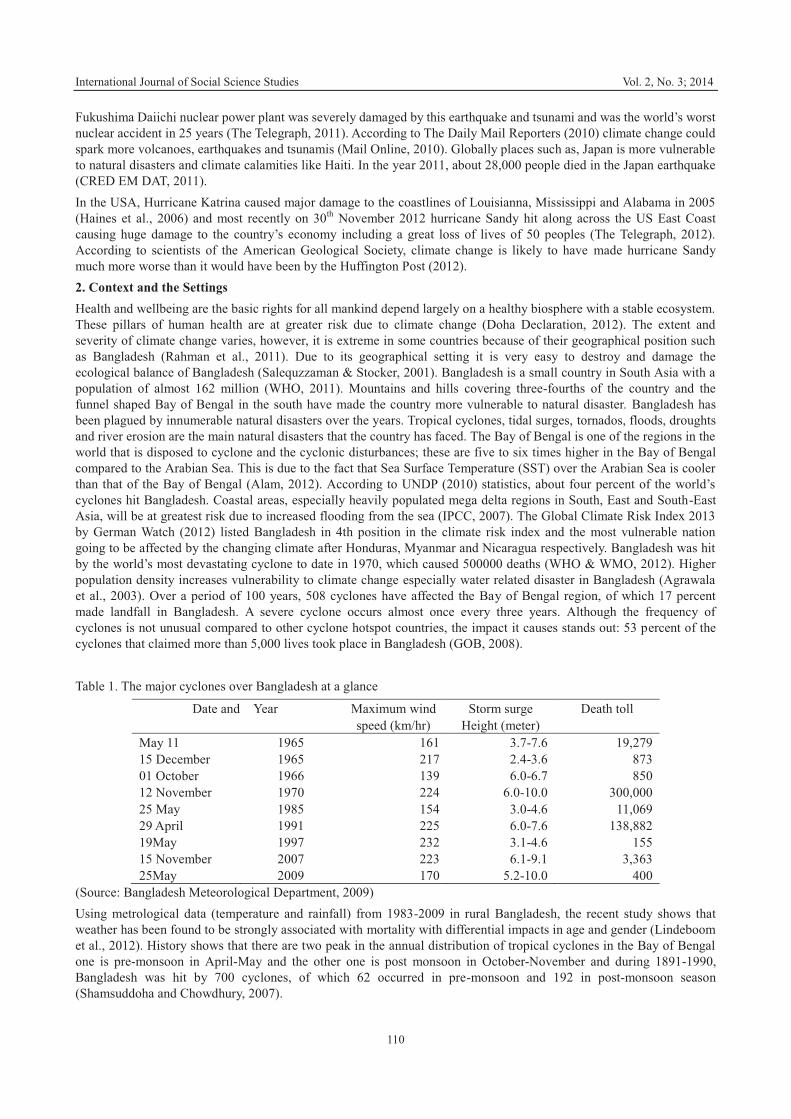
International Journal of Social Science Studies Vol. 2, No. 3; 2014
110
Fukushima Daiichi nuclear power plant was severely damaged by this earthquake and tsunami and was the world’s worst nuclear accident in 25 years (The Telegraph, 2011). According to The Daily Mail Reporters (2010) climate change could spark more volcanoes, earthquakes and tsunamis (Mail Online, 2010). Globally places such as, Japan is more vulnerable to natural disasters and climate calamities like Haiti. In the year 2011, about 28,000 people died in the Japan earthquake (CRED EM DAT, 2011). In the USA, Hurricane Katrina caused major damage to the coastlines of Louisianna, Mississippi and Alabama in 2005 (Haines et al., 2006) and most recently on 30th November 2012 hurricane Sandy hit along across the US East Coast causing huge damage to the country’s economy including a great loss of lives of 50 peoples (The Telegraph, 2012). According to scientists of the American Geological Society, climate change is likely to have made hurricane Sandy much more worse than it would have been by the Huffington Post (2012). 2. Context and the Settings Health and wellbeing are the basic rights for all mankind depend largely on a healthy biosphere with a stable ecosystem. These pillars of human health are at greater risk due to climate change (Doha Declaration, 2012). The extent and severity of climate change varies, however, it is extreme in some countries because of their geographical position such as Bangladesh (Rahman et al., 2011). Due to its geographical setting it is very easy to destroy and damage the ecological balance of Bangladesh (Salequzzaman & Stocker, 2001). Bangladesh is a small country in South Asia with a population of almost 162 million (WHO, 2011). Mountains and hills covering three-fourths of the country and the funnel shaped Bay of Bengal in the south have made the country more vulnerable to natural disaster. Bangladesh has been plagued by innumerable natural disasters over the years. Tropical cyclones, tidal surges, tornados, floods, droughts and river erosion are the main natural disasters that the country has faced. The Bay of Bengal is one of the regions in the world that is disposed to cyclone and the cyclonic disturbances; these are five to six times higher in the Bay of Bengal compared to the Arabian Sea. This is due to the fact that Sea Surface Temperature (SST) over the Arabian Sea is cooler than that of the Bay of Bengal (Alam, 2012). According to UNDP (2010) statistics, about four percent of the world’s cyclones hit Bangladesh. Coastal areas, especially heavily populated mega delta regions in South, East and South-East Asia, will be at greatest risk due to increased flooding from the sea (IPCC, 2007). The Global Climate Risk Index 2013 by German Watch (2012) listed Bangladesh in 4th position in the climate risk index and the most vulnerable nation going to be affected by the changing climate after Honduras, Myanmar and Nicaragua respectively. Bangladesh was hit by the world’s most devastating cyclone to date in 1970, which caused 500000 deaths (WHO & WMO, 2012). Higher population density increases vulnerability to climate change especially water related disaster in Bangladesh (Agrawala et al., 2003). Over a period of 100 years, 508 cyclones have affected the Bay of Bengal region, of which 17 percent made landfall in Bangladesh. A severe cyclone occurs almost once every three years. Although the frequency of cyclones is not unusual compared to other cyclone hotspot countries, the impact it causes stands out: 53 percent of the cyclones that claimed more than 5,000 lives took place in Bangladesh (GOB, 2008). Table 1. The major cyclones over Bangladesh at a glance
Date and Year Maximum wind speed (km/hr)
Storm surge Height (meter)
Death toll
May 11 1965 161 3.7-7.6 19,279 15 December 1965 217 2.4-3.6 873 01 October 1966 139 6.0-6.7 850 12 November 1970 224 6.0-10.0 300,000 25 May 1985 154 3.0-4.6 11,069 29 April 1991 225 6.0-7.6 138,882 19May 1997 232 3.1-4.6 155 15 November 2007 223 6.1-9.1 3,363 25May 2009 170 5.2-10.0 400
(Source: Bangladesh Meteorological Department, 2009) Using metrological data (temperature and rainfall) from 1983-2009 in rural Bangladesh, the recent study shows that weather has been found to be strongly associated with mortality with differential impacts in age and gender (Lindeboom et al., 2012). History shows that there are two peak in the annual distribution of tropical cyclones in the Bay of Bengal one is pre-monsoon in April-May and the other one is post monsoon in October-November and during 1891-1990, Bangladesh was hit by 700 cyclones, of which 62 occurred in pre-monsoon and 192 in post-monsoon season (Shamsuddoha and Chowdhury, 2007).
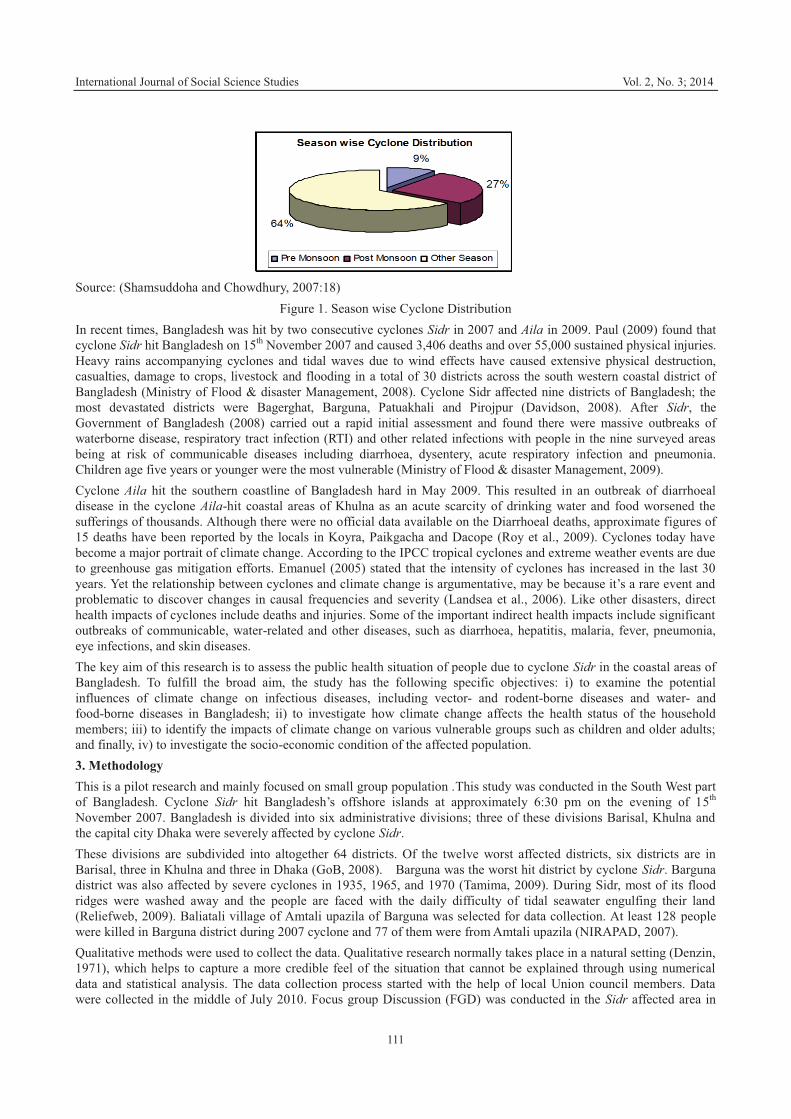
International Journal of Social Science Studies Vol. 2, No. 3; 2014
111
Source: (Shamsuddoha and Chowdhury, 2007:18)
Figure 1. Season wise Cyclone Distribution In recent times, Bangladesh was hit by two consecutive cyclones Sidr in 2007 and Aila in 2009. Paul (2009) found that cyclone Sidr hit Bangladesh on 15th November 2007 and caused 3,406 deaths and over 55,000 sustained physical injuries. Heavy rains accompanying cyclones and tidal waves due to wind effects have caused extensive physical destruction, casualties, damage to crops, livestock and flooding in a total of 30 districts across the south western coastal district of Bangladesh (Ministry of Flood & disaster Management, 2008). Cyclone Sidr affected nine districts of Bangladesh; the most devastated districts were Bagerghat, Barguna, Patuakhali and Pirojpur (Davidson, 2008). After Sidr, the Government of Bangladesh (2008) carried out a rapid initial assessment and found there were massive outbreaks of waterborne disease, respiratory tract infection (RTI) and other related infections with people in the nine surveyed areas being at risk of communicable diseases including diarrhoea, dysentery, acute respiratory infection and pneumonia. Children age five years or younger were the most vulnerable (Ministry of Flood & disaster Management, 2009). Cyclone Aila hit the southern coastline of Bangladesh hard in May 2009. This resulted in an outbreak of diarrhoeal disease in the cyclone Aila-hit coastal areas of Khulna as an acute scarcity of drinking water and food worsened the sufferings of thousands. Although there were no official data available on the Diarrhoeal deaths, approximate figures of 15 deaths have been reported by the locals in Koyra, Paikgacha and Dacope (Roy et al., 2009). Cyclones today have become a major portrait of climate change. According to the IPCC tropical cyclones and extreme weather events are due to greenhouse gas mitigation efforts. Emanuel (2005) stated that the intensity of cyclones has increased in the last 30 years. Yet the relationship between cyclones and climate change is argumentative, may be because it’s a rare event and problematic to discover changes in causal frequencies and severity (Landsea et al., 2006). Like other disasters, direct health impacts of cyclones include deaths and injuries. Some of the important indirect health impacts include significant outbreaks of communicable, water-related and other diseases, such as diarrhoea, hepatitis, malaria, fever, pneumonia, eye infections, and skin diseases. The key aim of this research is to assess the public health situation of people due to cyclone Sidr in the coastal areas of Bangladesh. To fulfill the broad aim, the study has the following specific objectives: i) to examine the potential influences of climate change on infectious diseases, including vector- and rodent-borne diseases and water- and food-borne diseases in Bangladesh; ii) to investigate how climate change affects the health status of the household members; iii) to identify the impacts of climate change on various vulnerable groups such as children and older adults; and finally, iv) to investigate the socio-economic condition of the affected population. 3. Methodology This is a pilot research and mainly focused on small group population .This study was conducted in the South West part of Bangladesh. Cyclone Sidr hit Bangladesh’s offshore islands at approximately 6:30 pm on the evening of 15th November 2007. Bangladesh is divided into six administrative divisions; three of these divisions Barisal, Khulna and the capital city Dhaka were severely affected by cyclone Sidr. These divisions are subdivided into altogether 64 districts. Of the twelve worst affected districts, six districts are in Barisal, three in Khulna and three in Dhaka (GoB, 2008). Barguna was the worst hit district by cyclone Sidr. Barguna district was also affected by severe cyclones in 1935, 1965, and 1970 (Tamima, 2009). During Sidr, most of its flood ridges were washed away and the people are faced with the daily difficulty of tidal seawater engulfing their land (Reliefweb, 2009). Baliatali village of Amtali upazila of Barguna was selected for data collection. At least 128 people were killed in Barguna district during 2007 cyclone and 77 of them were from Amtali upazila (NIRAPAD, 2007). Qualitative methods were used to collect the data. Qualitative research normally takes place in a natural setting (Denzin, 1971), which helps to capture a more credible feel of the situation that cannot be explained through using numerical data and statistical analysis. The data collection process started with the help of local Union council members. Data were collected in the middle of July 2010. Focus group Discussion (FGD) was conducted in the Sidr affected area in
International Journal of Social Science Studies Vol. 2, No. 3; 2014
112
Amtali upazila of Barguna District. For data collection, different government and non-government institutions were informed beforehand, care was taken to find a convenient time and place for the meeting and research purpose was made clear to the participants and full consent was taken prior to the discussion. The researcher moderated the sessions and two other associates were involved in note taking and recording the conversation. The qualitative data were collected by using focus group discussion (FGD) from the following two groups of respondents. Group 1: Consists of only service providers from Upazila and Union level (a union has on average 20,000 people). The target participants were Upazila organizer of NGOs, Executive Director of Emergency Response, Technical Officer of Dhaka Ahsania Mission, Cluster Team Leader of Notun Jibon Programme (Social Development Foundation), and Registered Medical Officer of Upazila Health complex, Upazila Agricultural Officer, Upazila Administrator, Health Assistant of Union, and Junior Assistant Director of Bangladesh Red Crescent Society- Cyclone Preparedness Programme. Group 2: This consists of former and current UP (Union Porishod) members, farmers, businessmen, social workers, fishermen, BRAC (Bangladesh Rural Advancement Committee) health workers and housewives. Several government and non-government organizations are working in the cyclone affected area. For each FGD a maximum of 10 persons, one from each organization working in the affected area was selected. As the participants were non-English speakers, the interview guide was translated into Bengali. Written consent was taken from the participants before recording the interviews and played back to them. During the interviews the researcher used the Bengali language, which was again translated into English by the researcher for the purpose of analysis. Respondents were found to have tremendous memories of the Sidr experience. The following steps insured the validity and reliability of the data collection instrument. Firstly a thorough literature review has been carried out related to climate change, health and natural disasters. Secondly the experts in the field of climate change and public health verified the interview guide for the Focus Group Discussion. To attain accuracy and reliability of the data, care and caution were taken during data collection. The participants were found to be co-operative and simple language was used for smooth flow of the discussion. The present research being a pilot one has of course some limitations, for example, in selecting small number of respondents and selection of qualitative method. However, future research may focus on a larger sample which will help avoiding selection bias in the results. 4. Main Results The collected data were analyzed through the thematic analysis. Four themes were developed as follows: The first theme proposes climate change and its impact on health. The second theme influences of infectious diseases due to climate change, the third theme discussed the impact of climate change on the vulnerable people of the community and the fourth theme highlighting about the socio-economic situation of affected population. 4.1 Climate Change and Its Impact on Health The FGD started with the question on the impact of climate change on the health of the community. Specifically, the main aim was to get information from the participants about the cyclone had impact on health (such as the general health situation, mental health and wound) during Sidr and after Sidr. To understand the magnitude of the problem, information on the health condition of the community people before Sidr was also gathered for comparison. Several participants gave their opinions on the issue and these include: During Sidr the people of Amtali, Barguna suffered from various diseases such as diarrhoea, dysentery, virus fever, cough, cold, skin disease, eye problem, pain, paralysis, Jaundice, lack of nutrition, waterborne diseases, typhoid, anaemia, high blood pressure, severe headache were the most common. When questions on the current general health situation of the community were raised vast majority of the participants mentioned that the health situation of the community people were reasonably better now compared to immediately after Sidr. The health situation has improved because of different program interventions by different agencies but it has taken long time to reach this situation. According to, the participants the health situation has become normal as before Sidr. When, questioned about the mental health situation of the community and the majority of the participants reported that after Sidr the mental health situation was back to normal but their livelihood had not been improved. Their mental health situation is now better than it was during Sidr. According to one participant from the community, “A 50 year old lady and 3 females of 30-40 years age had become mentally instable after the incident of cyclone. They have lost all their family members, households, personal belongings.” The majority of people mentioned that injuries were common during Sidr. In Amtali, many people were struck by tin (which is used to build houses in rural area), trees and as a result many broke their legs, hands, cut different parts of the body, and injured their head. Some people even died after being hit on the head by tin or falling tree. The number of wounded persons was high during Sidr. During, Sidr high volume of water washed away people and boats and other hard objects wounded them. Currently many of the wounded persons are suffering from different kinds of side effects. Some of them became disabled due to the injury at the time of the cyclone.
International Journal of Social Science Studies Vol. 2, No. 3; 2014
113
Illnesses like diarrhoea, food poisoning, skin diseases, respiratory problem, pneumonia, and dengue fever are now seen were rare before the occurrence of Sidr but are now more prevalent. The diseases are being observed after the occurrence of cyclone Sidr that has caused by the climate change in the area. Women members of the family had to face so much hardship during this time. Adolescent girls are having menstrual period as early as 11 years old than before informed by the registered medical officer of the upazila health complex. These diseases were less in the past than it is seen now. 4.2 Climate Change and Infectious Disease The participants in the FGD mentioned that the infectious diseases increased after the occurrence of Sidr. The most commonly seen infectious diseases in the area are diarrhoea, typhoid, skin disease, and chicken pox. After Sidr lack of clean water and unclean environment caused skin diseases, water borne disaeses and chicken pox. However, chicken pox is also a seasonal disease. During winter cough cold, pneumonia cases were common and during the rainy seasons skin diseases, cold and cough are also common. The participants in the FGD also mentioned that about 20-30 % people suffered from these diseases. They also mentioned that about 15% people suffered from diarrhoea and chicken pox just immediately after Sidr. Among the affected people about 3% were children aged less than five years old who were dying of diarrhoea. All the participants agreed that number of affected people was higher after the occurrence of Sidr than it was pre Sidr. At, present the situation has improved because of different interventions taken by both Government Organizations (GO) and Non-government Organization (NGOs). Diarrhoeal diseases are now under control. According to the participants the main sources of these infectious diseases are polluted and high salinity of water, unhealthy sanitation, unclean environment, unclean food, excessive hot weather and vector borne insects. Due to climate change natural calamity is now common in these areas, which changes natural the environment and more viral diseases are emerging that were not common 20 years ago in the area. For the prevention of the diseases both GO and NGOs are working in the affected area. They introduced new deep tube wells for safe drinking water, constructed hygienic toilets, distributed of water purifying tablets, bleaching powder, cleaned pond water were undertaken by different agencies. They also distributed general medicines to the people of the community. The above-mentioned services to the community the health situation is returning to where it was before the cyclone hit the area. Generally people go to hospital for treatment of Pneumonia, diarrhoea, viral fever, jaundice, chicken pox, sexual disease, dysentery, skin disease, peptic ulcer, eye problem, malnutrition, typhoid, stomach upset and physical wound. These ailments were also common before the occurrence of Sidr but the prevalence was lower than it is now after Sidr. 4.3 Climate Change and Vulnerable Population One of the participants from the officials said: “Children aged less than five years old and people aged 60 years and above are most at risk due to climate change”. They are now surviving somehow against the adverse environment after the occurrence of Sidr. In some areas, the health situation has deteriorated due to Sidr. Many children and aged people have become disabled due to injury during the cyclone. They are now in a helpless situation. During the tidal surge, many children died and aged people are in worse condition than they were before the occurrence of Sidr. Many are surviving against adverse situation but their health situation is getting worse day by day especially the older ones. One of the participants from the service providers said: ‘Because of the occurrence of Sidr, many elderly people are now suffering from eyesight problem, back pain, virus fever, and physical weakness. Cough & cold, dysentery, skin disease, jaundice, common fever and typhoid are a regular feature in the Sidr affected areas’ As a result many people have cuts in hand and leg, broken hand and leg, cut in the head, injury to different parts of the body, wound in the waist etc. Many died as a result of injuries sustained by being hit by falling trees and houses collapsing. According to opinions of the participants, child death after the natural disaster has increased. These children died mainly from diarrhoea, Pneumonia, and injury related causes. The main reasons of elderly death were due to diabetes, hypertension and blood pressure. Vaccination coverage in the affected area was reasonably good because according to the participant’s immunization coverage was above 90% in their community. According to them, few percentages of children were not immunized because their parents were not motivated about the importance of child immunization. 4.4 Climate Change and Socio-economic Situation The participants stated that all agricultural products were damaged due to natural disaster. The riverbank erosion destroyed the farming lands, salinity in the water has increased and production of agriculture has declined tremendously. Houses are broken; poultry production totally wrecked, fishes in the ponds are dying, educational institutions shattered, due to the salinity of the water grasses are not growing and livestock were not getting enough food. There was a severe shortage of food; many were suffering from malnutrition especially the children and women. However, none died due to lack of food. Relief was available in abundance. Food scarcity in the area is still a major concern for the local community people. Following the occurrence of Sidr, there was lack of employment in the affected area. In some areas there were opportunity for work but working people were not available as they were busy rebuilding their own houses. The affected people also went through financial hardship. They lost their all valuables including the houses during the
International Journal of Social Science Studies Vol. 2, No. 3; 2014
114
disaster and the agricultural land was not suitable for growing crops immediately after Sidr. There is not enough employment opportunity in the area and most of the people in the area are farmers and fishermen. They are living in very poor conditions. However, many GO and NGOs are working to bring back normalcy. The economic condition of the affected area was at its worse just after the Sidr. The people were having a normal life before the cyclone hit the area. So many villagers went through mental trauma due to poverty after the occurrence of Sidr. Many were sick due to poverty because Sidr destroyed their house, agriculture production and they lost all kinds of household assets. So many members of the family died from the attack of Sidr. From the above findings; it is quite clear that the Sidr affected Amtali people of Barguna region went through some serious health problems. Losses of property and close relatives have made them mentally unstable. Lack of food and clean water has increased their sufferings. Many people were injured by the cyclone and the lack of job opportunities in the area has made their life more miserable after Sidr. The prevalence of infectious diseases and other diseases have increased dramatically after the climate change. Children and older people are the most affected group in this calamity. Things are improving for the people in Amtali. Various government organizations and non-government organizations are working hand in hand to return the normal life of these people and rates of poor health due to Sidr are coming down. Since all these poor health conditions have been observed after Sidr, it shows that the natural disaster like cyclone due to changing climate has some impact on the people of Amtali of Barguna. 5. Discussion and Conclusion The objective of this research has been to assess the impact of climate change on human health in Bangladesh. A large number of studies suggested that there is an impact of climate change on human health in Bangladesh. Climate change is a new concept in environmental health research. Bangladesh with its populated land close to sea level is at particular risk. The study revealed that affected the population by cyclone Sidr have faced many diseases like diarrhoea, typhoid fever, respiratory problem, pneumonia, hepatitis (jaundice), death and injury and mental health problems. The result of this study has shown consistency with the findings of other studies. For example just after the 1991 Bangladesh cyclone, UNICEF Cyclone Evaluation team has reported increase in diarrhoea incidence compared to pre-cyclone rates and almost all death in the affected areas occurred as a result of drowning from the tidal wave that accompanied the cyclone(UNICEF, 1991). Myint et al. (2011) reported diarrhoea, dysentery and acute respiratory infections (ARI) increased just after the Cylone Nargis affected areas in Myanmar. This study reveals that children and the older people are the most vulnerable group during the time of a natural disaster; the children and older adults are facing more serious health consequences due to climate change. Bhuiyan and Khan (2011) found with available evidence that the climate change is affecting the health of the older populations of Kazakhstan and making them sensitive to climate change. Some diseases are emerging in the affected community like dengue fever due to climate change in Bangladesh. Similar situation happened post cyclone Nargis period in Myanmar where the dengue incidence slightly raised (Myint et al., 2011). The socio-economic situation of the affected population was in poor state after the cyclone hit the area and due to lack of employment opportunities and infrastructural support these people had to face long term health consequences due to climate change. Waiyaki et al. (2012) found that the residents of Faza Island of Kenya has been struggling with their social and economic lives due to climate change which is effecting their local environment (both land and sea) and as a result they are finding it hard to meet their subsistence needs. Things are improving now as various local government and non-government organizations are working there and people are getting back to their normal life. A majority of the health professionals, service providers and local community of the coastal areas of Bangladesh are aware of the health impacts of climate change but their knowledge regarding health protection measures is limited. Government and other non-government organizations can take measure to control health related problems in the affected area. Coping with climate change related health problems at the rural is important for every individual so actions should be taken on building resilience and strengthening the health systems at all rural level. Various training programme can help the communicate people to get to know more about the climate change and its impact on human health. This research shows that it would be useful to investigate in greater detail with a large sample or from more diverse group about the other factors of climate change that have an impact on health. In addition, climate change is a complex phenomena and its impact on human health is obvious but to explore the relationship require further investigation. Acknowledgement I would like to thank Professor Dr. M. Kabir and Dr. M. Shahjahan for their influential guidance and support for this research project. References Agrawala, S., Ota, T., Ahmed, A. U., Smith, J., & Aalst, M. (2003). Development and Climate Change in Bangladesh:
Focus on the Coastal Flooding and Sundarban. OECD, Head of the publication service, 75775 Paris, Cedex 16, France.
International Journal of Social Science Studies Vol. 2, No. 3; 2014
115
Alam, M, S. (2012). Tropical Cyclones in Bangladesh. Edited By Ahmed, R., & Shamsuddin, S.D. in Climate Change: Issues and Perspective for Bangladesh. Shahitya Prakash, Dhaka, Bangladesh.
Bhuiyan, S. H., & Khan, T.A. (2011). Climate change and its impacts on older adults health in Kazakhstan. The Nispacee Journal of Public Administration and Policy, IV; 1, 97-119.
Cred-emdat (Centre For research on the epidemiology of disaster emergency events database). (2011): The OFDA/CRED International Disaster Database. Université Catholique de Louvain. Brussels, Belgium. [Online] Available at: http://www.emdat.be [Accessed date 09/12/2012]
Davidson, S. (2008). A Review of the IFRC-led Shelter Coordination Group Bangladesh Cyclone Sidr Response 2007-2008. [Online]. Available from: http://www.humanitarianreform.org/humanitarianreform/ [Accessed date 13/09/2011].
Denzin, N. K. (1971): The Logic of Naturalistic Inquiry. Social Force, 50, 166-182. Doha, D. (2012). Health must be central to climate action, COP18, December 2012. [Online]. Available from:
http://dohadeclaration.weebly.com [Accessed date 08/12/2012] Emanuel, K. (2005). Increasing destructiveness of tropical cyclones over the past 30 years. Nature; 436:686-88. German watch. (2012). Global Climate Risk Index 2013. Bonn,Germany. GoB. (2008). Cyclone Sidr in Bangladesh: Damage loss and Needs Assessment for Disaster Recovery and
Reconstruction. Dhaka, Bangladesh. GoB. (2008). Super Cyclone Sidr 2007: impacts and strategies for interventions. Dhaka. Haines, A., Kovats R., S., Campbell-Lendrum, D., & Corvalan, C. (2006).Climate change and human health: impacts ,
vulnerability and mitigation. The Lancet Series: 367:2101-09. [Online] Available from http://www.thelancet.com [Accessed date 02/07/2011]. http://dx.doi.org/10.1016/s0140-6736(06)68933-2
Huffington Post. (2012). Hurricane Sandy Damage Partly Caused By Climate Change, Scientists Say. [Online]. Available from: http://www.huffingtonpost.com/2012/11/06/hurricane-damage-climate-change_n_2081960.html [Accessed date 09/12/2012]
IPCC. (2007). Climate change 2007: Impacts, adaptation and vulnerability. Contribution of working group II to the Fourth Assessment Report of the Intergovernmental Panel on Climate Change. M.L. Parry, O.F. Canziani, J.P. Palutikof, P.J. van der Linden, C.E. Hansson (Eds.). Intergovernmental Panel on Climate Change (IPCC), Cambridge University Press, New York.
Landsea, C. W., Harper, B. A. Hoarau, K., & Knaff, J. A. (2006). Can We Detect Trends in Extreme Tropical Cyclones? Science. 313; 452 – 454. http://dx.doi.org/10.1126/science.1128448
Lindgren, E., Tälleklint, L., & Polfeldt, T. (2000). Impact of climatic change on the northern attitude limit and population density of the disease transmitting European tick Ixodes ricinus. Environmental Health Perspectives, 108, 119-23. http://dx.doi.org/10.1289/ehp.00108119
Lindeboom, W., Alam, N., Begum, D., & Streatfield, P.K. (2012). The association of metrological factors and mortality in rural Bangladesh, 1983-2009. Global Health Action, 5, 61-73. http://dx.doi.org/10.3402/gha.v5i0.19063
Luterbacher, J., Dietrich, D., Xoplaki, E., Grosjean, M., & Wanner, H. (2004). European seasonal and annual temperature variability, trends and extremes since 1500. Science, 303, 1499-1503. http://dx.doi.org/10.1126/science.1093877
Mail Online. (2010). Climate change could sparks more volcanoes, earthquakes and tsunamis. [Online] Available from: http://www.dailymail.co.uk/sciencetech/article-1267137/Climate-change-spark-volcanoes-earthquakes-tsunamis.html [Accessed date 09/12/2012]
McMichael, A. J (2003). Climate Change and Human Health. World Health Organization, 1-306. [Online] Available from http://www.who/climatechange.com [Accessed date 02/07/2011].
McMichael, A., Neira ,M., Bertollini, R., Campbell-Lendrum, D., & Hales., S. (2009). Climate change: a time of need and opportunity for the health sector. The Lancet: 374; 2123-25. [Online] Available from: http://www.thelancet.com. [Accessed date 02/07 /2011]. http://dx.doi.org/10.1016/s0140-6736(09)62031-6
Ministry of food and disaster management. (2009). Major natural disaster in Bangladesh [Online]. Available from: http://www.dmb.gov.bd/pastdisaster.html [Accessed date 25/09/2011].
NIRAPAD. (2007). Cyclone Sidr kills hundreds in Barisal and Khulna Division. [Online]. Available from: http://www.nirapad.org [Accessed date 19/12/2012]
Myint, N, W., Kaewkungwal, J., Singhasivanon, P., Chaisiri, K., Panjapiyakul, P., Siriwan, P, Malik, A, K., Nyein, S. L.,
International Journal of Social Science Studies Vol. 2, No. 3; 2014
116
& Mu, T. T. (2011). Are there any changes in burden and management of communicable diseases in areas affected by Cyclone Nargis? Conflict and Health, 5, 9. http://dx.doi.org/10.1186/1752-1505-5-9
Paul, B. K. (2009). Why relatively fewer people died? The case of Bangladesh’s cyclone Sidr. Natural Hazards, 50, 289–304. http://dx.doi.org/10.1007/s11069-008-9340-5
Purse, B. V., Mellor, P. S., Rogers, D. J., Samuel, A. R., Mertens, P. P., & Baylis,M. (2005). Climate Change and the recent emergence of bluetongue in Europe. Nature Reviews Microbiology; 3, 171-81. http://dx.doi.org/10.1038/nrmicro1366
Rahman, M. S., Haque, M. M., & Khan, M. B. K. (2011). Perception on Climate Change: An Exploratory Study on Urban Citizens. European Journal of Economics, Finance and Administrative Sciences, 31, 17-30.
Reliefweb. (2009). Bangladesh: Two years after Cyclone Sidr, survivors still seeking shelter [Online]. Available from: http://reliefweb.int/node/334287 [Accessed Date 17/09/2011].
Roy, K., Kumar, U., Mehedi, H., Sultana, T., & Ershad, D. M. (2009). Initial Damage Assessment Report of Cyclone AILA with focus on Khulna District. Unnayan Onneshan-Humanity Watch- Nijera Kori, Khulna, Bangladesh, June 23, 2009. pp-31.
Salequzzaman, M., & Stocker, L. (2001). The context and prospects for environmental education and environmental careers in Bangladesh. International Journal of Sustainability in Higher Education, 2(2), 104-127. http://dx.doi.org/10.1108/14676370110388309
Shamsuddoha, M., & Chowdhury, K. M. (2007). Climate change impact and disaster vulnerabilities in the coastal areas of Bangladesh. [Online] Available from: www.coastbd.org [Accessed date 25/01/2013]
Skarphedinsson, S., Jensen, P. M., & Kristiansen, K. (2005). Survey of tick borne infections in Denmark. Emerging Infectious Disease, 117, 1055-61.
Stott, P. A., Stone, D. A., & Allen, M. R. (2004). Human contribution to the European heat wave of 2003. Nature, 432, 610-14.
Tamima, U. (2009). Population Evacuation Need Assessment in Cyclone Affected Barguna District. Journal of Bangladesh Institute of Planners, 2, 145-157. http://dx.doi.org/10.3329/jbip.v2i0.9575
The Telegraph. (2011). Japan earthquake, tsunami and Fukushima nuclear disaster: 2011 review. [Online] Available from: http://www.telegraph.co.uk/news/worldnews/asia/japan/8953574/Japan-earthquaketsunami-and-Fukushima-nuclear-disaster-2011-review.html# [Accessed date 08/12/2012]
The Telegraph. (2012). Superstorm Sandy: Obama visits devastated New Jersey. [Online] Available from: http://www.telegraph.co.uk/news/worldnews/northamerica/usa/9642169/Hurricane-Sandy-live.html [Accessed date 26/11/2012]
UNDP. (2010). UNDP Bangladesh [Online]. Available from http://www.undp.org.bd/info/events.php?newsid=720. [Accessed date 13/09/2011].
UNEP (United Nations Environment Programme). (2002). Global Environment Outlook 3 Synthesis: Past, Present and Future Perspectives. London: EarthScan.
UNICEF. (1991). Health Effects of the 1991 Bangladesh Cyclone: Report of a UNICEF Evaluation Team. Disasters, 1993, 17, 153-165.
Waiyaki, E., Angwenyi H, O, R., & Muriuki, T. (2012). An assessment of the percieved socioeconomic impacts of cliamte change on the community of Faza Island, Lamu East Distrcit, Kenya. Social Science Report Series No-35, 83-118.
Webster, P. J., Holland, G. J., Curry, J. A., & Chang, H. R. (2005). Changes in the tropical cyclone number, duration and intensity in a warming environment. Science, 309, 1844-46. http://dx.doi.org/10.1126/science.1116448
WHO. (2008). Mental Health assistance to population affected by the Tsunami in Asia. Geneva, WHO. [Online] Available from: www.who.int/mentalhealth/resource/tsunami [Accessed date 11/02/2011]
WHO. (2009). Protecting Health from Climate Change: Connecting Science, Policy and People. Geneva, Switzerland: World Health Organization.
WHO. (2011). WHO Bangladesh. [Online] Available from: http://www.who.int/countries/bgd/en/ [Accessed date 12/09/2011]
WHO & WMO. (2012). Atlas of health and climate. Geneva, Switzerland, WHO.
This work is licensed under a Creative Commons Attribution 3.0 License.
International Journal of Social Science Studies Vol. 2, No. 3; July 2014
ISSN 2324-8033 E-ISSN 2324-8041 Published by Redfame Publishing
URL: http://ijsss.redfame.com
117
Reductions in HIV Stigma as Measured by Social Distance: Impact of a Stigma Reduction Campaign in a Historically Black University
Emily Locke1, Angela Meshack2, Ruth Githumbi3, Glenn Urbach3, Beau Miller3, Ron Peters1, and Michael W. Ross1
1Center for Health Promotion and Prevention Research, School of Public Health, University of Texas, PO Box 20126, Houston TX 77225, USA 2College of Pharmacy and Health Sciences, Texas Southern University, 3100 Cleburne, Houston TX 77004. 3LIVE Consortium, 1521 Branard, Houston, TX 77006. Correspondence: Dr Michael Ross, Center for Health Promotion and Prevention Research, School of Public Health, University of Texas, PO Box 20126, Houston TX 77225, USA. Received: April 11, 2014 Accepted: April 25, 2014 Available online: July 4, 2014 doi:10.11114/ijsss.v2i3.458 URL: http://dx.doi.org/10.11114/ijsss.v2i3.458 Abstract We evaluated the effectiveness of a small media campaign intervention on a historically African American college campus aimed to lower social distance (willingness to interact) for people with HIV. A modified version of the Bogardus Social scale was used to measure social distance. The survey included questions regarding HIV transmission knowledge and sympathy felt towards those with HIV. Time between pre-test (n= 207) and post-test (n=210) was 1 month. There was significant change in social distance from pre- to post-test only among women (p<.001). In a regression analysis transmission knowledge (p=.027), sympathy towards those with HIV (p=.000) and gender (p=.000) were significantly related to social distance. There was a significance difference between men and women for transmission knowledge (p=.001) and sympathy (p=.001). Small media campaigns can be effective at lowering social distance among female African American students but may need to be modified to be effective among males. 1. Introduction The issue of stigma and discrimination surrounding HIV/AIDS is one of the most difficult HIV barriers to address, but is an essential consideration to end the spread of the disease, and to ensure those living with the disease can live more healthy and full lives (Vanable, Carey, Blair, & Littlewood, 2006; Treisman & Angelino, 2004; Mann, 1987). HIV-related stigma has been found to lead to avoiding HIV testing (Eisenman, Cunningham, Zierler, Nakazono, & Shapiro, 2003; Fortenberry et al., 2002; Galvan, Bing, & Bluthenthal, 2000). Galvan et al. found in a survey among high-risk individuals in the U.S. that the 3 most common reasons for not getting HIV tested included: the fear of finding out they are positive (25%), belief that it is unlikely they have been exposed to HIV (18%), and the belief that they are HIV negative (13%). Other barriers given included the fear of stigma and discrimination if positive and the concerns surrounding privacy of HIV status (2000). Recently, the CDC reported that one-fourth of new HIV infections are among U.S. youth and young adults (13 to 24 years of age). Yet, in a national health survey given to 18-24 year olds, only 35% reported to have been tested for HIV (CDC, 2012). Since HIV infection rate among African Americans in the U.S. is highest of all ethnic groups, it reasonable to assume that on predominantly African American college campuses there will be a higher number of students living with HIV and who have been personally affected (know someone who is infected) by the disease, and a significant proportion who are untested. Hightow et al. (2005) in fact found that there are increasing rates of HIV infections among African American men attending college. The CDC (2008) reports that 21% of HIV infections in the African American population are undetected, and 31% of African Americans have never been tested for HIV. Among college students in the U.S., students feel that there is personal responsibility related to transmission of the disease, that fear of HIV/AIDS is a predictor of stigma and social distance to those that are HIV positive, and that HIV-related stigma and attributions of blame are largely associated with homosexuality and IV drug abuse (Henschel, 1999). Research also indicates that among college students who have more favorable attitudes towards those with HIV, there is a positive correlation with knowledge of HIV transmission and having a lower fear of being infected by HIV (Thompson, Geher, Stevens, Stem & Lintz, 2001; Handler, Lampman, Levy, & Weeks, 1994). Females tend to have a greater knowledge about HIV transmission and to be more tolerant of those with HIV compared to males (Lindley,
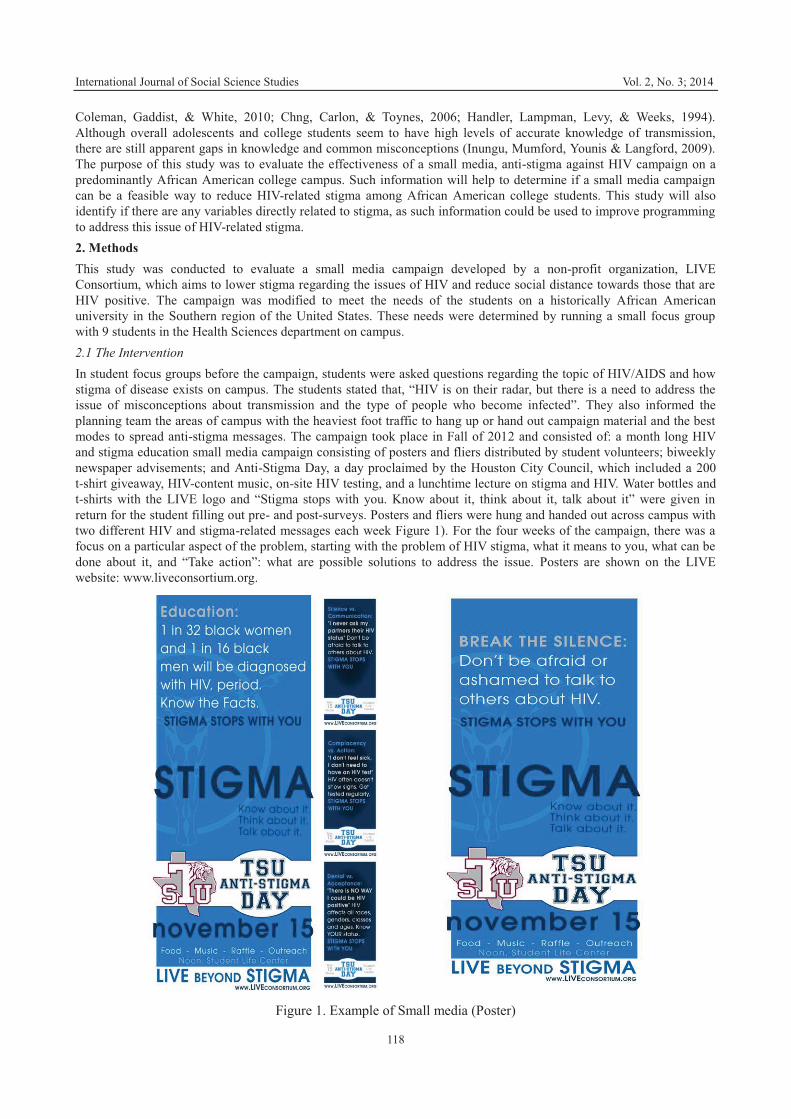
International Journal of Social Science Studies Vol. 2, No. 3; 2014
118
Coleman, Gaddist, & White, 2010; Chng, Carlon, & Toynes, 2006; Handler, Lampman, Levy, & Weeks, 1994). Although overall adolescents and college students seem to have high levels of accurate knowledge of transmission, there are still apparent gaps in knowledge and common misconceptions (Inungu, Mumford, Younis & Langford, 2009). The purpose of this study was to evaluate the effectiveness of a small media, anti-stigma against HIV campaign on a predominantly African American college campus. Such information will help to determine if a small media campaign can be a feasible way to reduce HIV-related stigma among African American college students. This study will also identify if there are any variables directly related to stigma, as such information could be used to improve programming to address this issue of HIV-related stigma. 2. Methods This study was conducted to evaluate a small media campaign developed by a non-profit organization, LIVE Consortium, which aims to lower stigma regarding the issues of HIV and reduce social distance towards those that are HIV positive. The campaign was modified to meet the needs of the students on a historically African American university in the Southern region of the United States. These needs were determined by running a small focus group with 9 students in the Health Sciences department on campus. 2.1 The Intervention In student focus groups before the campaign, students were asked questions regarding the topic of HIV/AIDS and how stigma of disease exists on campus. The students stated that, “HIV is on their radar, but there is a need to address the issue of misconceptions about transmission and the type of people who become infected”. They also informed the planning team the areas of campus with the heaviest foot traffic to hang up or hand out campaign material and the best modes to spread anti-stigma messages. The campaign took place in Fall of 2012 and consisted of: a month long HIV and stigma education small media campaign consisting of posters and fliers distributed by student volunteers; biweekly newspaper advisements; and Anti-Stigma Day, a day proclaimed by the Houston City Council, which included a 200 t-shirt giveaway, HIV-content music, on-site HIV testing, and a lunchtime lecture on stigma and HIV. Water bottles and t-shirts with the LIVE logo and “Stigma stops with you. Know about it, think about it, talk about it” were given in return for the student filling out pre- and post-surveys. Posters and fliers were hung and handed out across campus with two different HIV and stigma-related messages each week Figure 1). For the four weeks of the campaign, there was a focus on a particular aspect of the problem, starting with the problem of HIV stigma, what it means to you, what can be done about it, and “Take action”: what are possible solutions to address the issue. Posters are shown on the LIVE website: www.liveconsortium.org.
Figure 1. Example of Small media (Poster)
International Journal of Social Science Studies Vol. 2, No. 3; 2014
119
2.2 Participants and Procedure Individuals were recruited to voluntarily complete an anonymous questionnaire concerning their knowledge, attitudes and beliefs surrounding HIV in general and people with HIV. Pre-test surveys were distributed to students on campus and classes held in the Health Sciences department a week prior to the start of the campaign. There were in total 207 pre-test surveys filled out. Post-test surveys were then distributed at the end of campaign event (Anti-Stigma Day) held on campus plus given to students in some of the same classes the pre-surveys were given out at the start of the 30-day campaign. There were then 210 post surveys filled out (See in Table 1). The survey took about 5 minutes maximum to complete.
Table 1. Number of Surveys Administrated Location of Survey On-campus In-class Total Pre-Surveys (N) 43 164 207 Post-Survey (N) 120 90 210
Subjects were given a written statement regarding the research goals and advised that information would be kept confidential. By signing the consent page, the participants gave consent to voluntarily participate in this research. The consent page was detached from the survey immediately after turning in survey. The project protocol was approved by the Institutional Review Board of the sponsoring institution prior to the administration of the surveys. 2.3 Instrument and Measures To conduct this assessment, the project team modified a brief survey designed to measure HIV transmission knowledge, sympathy towards those with HIV, how much the individual is personally affected by HIV and degree of stigma felt towards those with HIV. The instrument was previously used in a similar study of a campus in the same city (Millimet, Miller, Ross, Samson & Churi, 2013). The instrument used to measure stigma was derived from the Bogardus scale which was modified to measure social distance towards people with HIV. The Bogardus scale is a scale originally developed in 1933 to measure people’s willingness to engage socially with different members of diverse racial and ethnic groups, and developed for HIV by Hunter and Ross (1991). It was further slightly modified to include situations that were common for university students in the U.S. The modified scale includes 14 questions regarding different social encounters with those with HIV using a 7-point Likert scale with 1 being not willing at all, 4 being maybe and 7 being very willing. The demographic information, including age, gender, race, and college major, was also gathered from participants. Transmission knowledge was measured by correctly answering various statements about ways to contract HIV with the options of “yes”, “no” and “don’t know” which was counted as a wrong answer. Sympathy towards those with HIV was also measured on a 7-point Likert scale with 1 being not at all and 7 being very much.. The data was analyzed using SPSSx (version 20). A bivariate analysis was performed (t-test for binary variables, and Pearson correlation coefficient for continuous variables) using pre- and post-test scores as independent variables, and then a multiple regression analysis to ascertain the multivariate contribution of these variables (gender, knowledge, number of family/friends with HIV known, sympathy for people with HIV) plus pre/post-test and data collection site (class/event) to social distance. 3. Results Demographics data appear in Table 1. All participants were students at the university, with a mean age of 22 years. Since the campus is a historically black college campus, all respondents of the survey identified themselves as African American or African. The students’ majors were asked and then broken into 6 groups by college. Pre-and post-differences for HIV/AIDS transmission knowledge, social distance, and sympathy for people with HIV appear in Table 3. Pre-and post-test differences were significant for social distance only among women, indicating an increase in willingness among women to engage in social situations with someone who is HIV positive after the intervention. The regression analysis examined the variables knowledge, gender, number of family or friends known with HIV, whether data collected at class or event, and pre- to post-test (which is the measure of the intervention) to social distance (See Table 4). The significant variables included: knowledge, gender, knowing family and friends with HIV, and pre- or post-test. The regression results also indicated that there was no significant difference in source of data (class or event) on the social distance measure.
International Journal of Social Science Studies Vol. 2, No. 3; 2014
120
Table 2. Demographic characteristics Gender N (Percent) Female Male Other Pre 99 (49.7%) 100 (48.8%) 1 (0.5%) Post 100 (50.3%) 105 (51.2%) 0 Age Mean Median Std. Dev. Pre 20.9 21 3.5 Post 23.4 21 4.3 Major N (Percent) Business 23 (11.1%) Health-Related 96 (46.2%) Science/Math 21 (10.1%) Education 10 (4.8%) Technology 10 (4.8%) General 31 (14.9%) Table 3. Variable Differences Between Pre and Post Test
Variable Pre-test Mean � SD (n)
Post-test Mean � SD (n)
t df p
Social Distance �� 62.23 � 21.92 (207)� 65.90 � 21.25 (209) -1.73 414 .04 Social Distance (males) 70.13 � 20.79 (99) 69.00 � 21.71 (99) -.39 196 .70
Social Distance (females) 53.48 � 20.21 (100) 61.85 � 19.54 (105) -3.01 203 .001 Knowledge 4.55 � 1.15 (210) 4.37 � 1.35 (207) 1.46 415 .15 Sympathy 5.17 � 1.75 (206) 5.05 � 1.75 (208) .65 412 .514
Table 4. Regression on Social Distance Scores
Variable �� t p Pre- or Post-test .204 4.15 .000
Gender .200 4.25 .000 Knowledge .156 3.35 .011 Class/Event .018 0.37 .711
Number family/friends know with HIV
.205 4.45 .000
R2 = .185 In order to examine the differences among females and males in more detail, t-tests were run by gender for social distance, knowledge, and sympathy (Table 5). Differences in variables between women and men were all found to be significant which included transmission knowledge, sympathy for people with HIV and social distance. In a breakdown of the questions regarding knowledge of HIV transmission, three of the six questions were found to be significantly different among females and males as seen in Table 6. The following statements answered correctly that were found to be statistically significant between females and males were “HIV can be spread by an infected mother breast-feeding her infant”, “HIV can be spread from sharing eating utensils with an infected person”, and “Now, HIV can be cured”. The rest of the statements were found to be statistically insignificant.
International Journal of Social Science Studies Vol. 2, No. 3; 2014
121
Table 5. Variable Differences Between Males and Females Variable Male
Mean � SD (n) Female
Mean � SD (n) t df p
Social Distance Pre 70.1 � 20.8 (100)� 53.3 � 20.2 (99) -5.70 197 .001 Post 69.0 � 21.7 (105) 61.9 � 19.5 (99) -2.46 202 .015
Knowledge Pre 4.33 � 1.23 (100) 4.79 � 1.04 (99) -2.83 197 .005 Post 4.16 � 1.50 (105) 4.63 � 1.13 (100) -2.52 203 .013
Sympathy Pre 4.86 � 1.79 (100) 5.45 � 1.71 (98) -2.37 196 .019 Post 4.78 � 1.86 (105) 5.33 � 1.60 (99) -2.27 202 .024
Table 6. Difference among gender of knowledge of HIV transmission Statement 1. HIV can be spread from an infected person by unprotected oral sex.
Gender Correct Incorrect Pearson chi-Square df p-value
Males Females
169 175
36 23 2.85 1 .09
Statement 2. HIV can be spread from an infected person by coughing. Males
Females 161 170
44 29 3.24 1 .07
Statement 3. HIV can be spread from an infected person by unprotected anal sex. Males
Females 187 188
17 10 1.74 1 .19
Statement 4. HIV can be spread from an infected mother breast-feeding her infant. Males
Females 130 149
75 50 6.21 1 .013
Statement 5. HIV can be spread from sharing eating utensils with an infected person. Males
Females 106 122
97 74 4.10 1 .043
Statement 5. Now, HIV can be cured. Males
Females 117 133
86 65 3.88 1 .049
4. Discussion The data, while limited by lack of a longitudinal design, indicate that there was a significant decrease in social distance comfort (likelihood of interaction) with those with HIV on a modified Bogardus social distance scale following the intervention. However, this decrease was only seen among female students. Other variables that showed a statistically significant association with social distance besides gender were knowledge of HIV transmission and sympathy felt towards those whom are HIV positive. In analyzing the difference between males and females in regards to knowledge of HIV transmission and sympathy towards those with HIV both variables were statistically significant. Females had a higher level of knowledge regarding HIV and felt more sympathetic towards people who are HIV positive. Both of these findings are congruent with previous research findings (Lindley, Coleman, Gaddist, White, 2010; Chng, Carlon, Toynes, 2006; Handler, Lampman, Levy, Weeks, 1994). The male students seemed to have a similar level of knowledge to the female students regarding well-known ways to of spreading HIV like unprotected vaginal and anal sex. However male’s knowledge fell short compared to females in statements regarding common misconceptions about HIV, which is similar to Inungu et. al’s findings among college students (2009). The limitations of the data include the lack of longitudinal design (not being able to reach all the same respondents for pre- and post-testing: the IRB did not approve use of identifiers). It is also hard to determine if the change seen in social distance (willingness to interact) with people with HIV is directly linked with the campaign or just the presence of a group people on campus openly talking about the issue of HIV. Our failure to ascertain what aspects of the campaign
International Journal of Social Science Studies Vol. 2, No. 3; 2014
122
participants saw is an additional limitation since we are unable to assess dose and its relationship to response. Despite the limitations of this campaign and evaluation, a small media campaign does seem to be a feasible and effective way to reduce social distance towards people with HIV and potentially reduce stigma regarding the disease. This evaluation also suggests that to make this type of programming more powerful in reducing stigma, the campaign should include information dismissing common misconceptions about HIV transmission and have a concept that allows students to emotionally feel sympathy towards those with HIV. Integrating these elements in this campaign could result in additional change. References American College Health Association. (2011). American College Health Association-National College Health
Assessment II: Reference Group Executive Summary Fall 2010. Linthicum, MD: American College Health Association.
Centers for Disease Control and Prevention. (2008). Persons tested for HIV—United States, 2006. MMWR 57(31), 845-49.
Center for Disease Control and Prevention. (2012). Vital Signs: HIV Infection, Testing, and Risk Behaviors Among Youths — United States. Morbidity and Mortality Weekly Report (MMWR), 61(47), 971-976.
Chng, C., Carlon, A., & Toynes, B. (2006). HIV on Historically Black Colleges and Universities (HBCU): A Study of Five Campuses in Texas, Oklahoma, Louisiana. College Student Journal, 40(1), 25-34.
Eisenman, D., Cunningham, W., Zierler, S., Nakazono, T., Shapiro, M. (2003). Effect of violence on utilization of services and access to care in persons with HIV. Journal of General Internal Medicine, 18, 125–127. http://dx.doi.org/10.1046/j.1525-1497.2003.20518.x
Fortenberry J., McFarlane, M., Bleakley, A., Bull, S., Fishbein, M., Grimley, D., Malotte, K., & Stoner, B. (2002). Relationships of stigma and shame to gonorrhea and HIV screening. American Journal of Public Health, 92, 378–381. http://dx.doi.org/10.2105/AJPH.92.3.378
Handler, A., Lampman, C., Levy, S., Weeks, K. (1994). Attitudes toward people with AIDS and implications for school-based youth AIDS education. AIDS Education and Prevention, 6, 175-83.
Henschel, P. (1997). Stigma and attributions of blame toward persons with AIDS (PWAs). Dissertation Abstracts International, 57, 4783.
Hightow, L., MacDonald, P., Pilcher, C. Kaplan, A. Foust, E., Nguyen, T. & Leone, P. (2005). The unexpected movement of the HIV epidemic in the Southeastern United States: transmission among college students. Journal of Acquired Immune Deficiency Syndrome, 38(5), 531-7. http://dx.doi.org/10.1097/01.qai.0000155037.10628.cb
Hunter, C.E., & Ross, M.W. (1991). Determinants of health care workers' attitudes toward people with AIDS. Journal of Applied Social Psychology, 21, 947-956. http://dx.doi.org/10.1111/j.1559-1816.1991.tb00452.x
Inungu, J, Mumford, V., Younis, M., & Langford, S. (2009). HIV Knowledge, Attitudes and Practices Among College Students in the United States. Journal of Health & Human Services Administration, 32(3), 259-277.
Lindley, L., Coleman, J., Gaddist, B., White, J. (2010). Informing faith-based HIV/AIDS interventions: HIV-related knowledge and stigmatizing attitudes at Project F.A.I.T.H. churches in South Carolina. Public Health Reports, 125(1), 12-20.
Millimet, S.A., Miller, B., Ross, M.W., Samson, P., & Churi, C. (2013). Results of an HIV stigma reduction intervention on a university campus. International Journal of Child and Adolescent Health, 6(3), in press.
Thompson, K., Geher, G., Stevens, K., Stem, S., Lintz, M. (2001). Psychological predictors of sexual behaviors related to AIDS transmission. Psychology Reports, 88, 51-67. http://dx.doi.org/10.2466/pr0.2001.88.1.51
Treisman, G. & Angelino, A. (2004). The psychiatry of AIDS: A guide to diagnosis and treatment. Baltimore, MD: Johns Hopkins University Press.
Vanable, P., Carey, M., Blair, D., Littlewood, R. (2006). Impact of HIV-related stigma on heath behaviors and psychological adjustment among HIV-positive men and women. AIDS and Behavior, 10(5), 473–482. http://dx.doi.org/10.1007/s10461-006-9099-1
This work is licensed under a Creative Commons Attribution 3.0 License.
������������� ��������������������� �������� ��� ��� ��� � �� �����
��������������� ����������������! "��#��� "�� $����%�� ! "��#��&�
'$()� #��*)++�,���������%���%�
�����
�%��-��%������.&��� � ���!�� ���/����.�0����.�������$��1��2���*�������3����4��5�&�6����
�$������#���#����7�*���%�������� �������� ��%�����2������6�'��/��������7#��8�����������-�� ����7�*���%�������� �������� ��%�����2������6�'��/��������7#��8����������9����*������)� $�� 1�� 2���*������ $������#� ��#���� 4���#��� -�8� �� -�!�� 7�*���%���� �� �� ����� ��� ��%�����2������6�'��/��������7#��8����$����/��)�� ������������ � � .���*���)�� ������������ � � ./���"������)�� ��:���������)��������+�,����/�����;�� � � '$()�#��*)++�<�����&+��������+�,����/�����;���Abstract�%�� ���%��%��� ���&� ���� �#��� �� #�������� ������ ��� �=>��� �#�� ���� *������� ���%�� ��� �#��8����?/��8#�%��&�%�,����� �� �#���� �%�� ���%�� ���� ������ ���.���� @�A>B� �8���"��.������ @�>B� ���� �*�� @�>B�� ���.�����9#������� �������#������#��8��C���%�����%��@�:�B��8���"���������1"�������������������������������%�����%�������/�*���� ��������8#����#�����������������������%�����%�������/�*��&�� ��������./���&�����%���D�����.��������.������ ��� ��;� #������� �%*����� �� ;A� #�������� ��� (����� .%������� �A� #�������� ��� �*�� ���� ���� #�������� ��� ���#�.%������� ���� �� �� ����� ��� ������ � ���&� �#�� ;���� A��� ���� ��� �#�� ����� ������ #�/�� ��/����� �#��� �#���� ��� ��� ��/������������#�*�"��8������D�������%������*�� ���/��������*��������8��������#����#���&����������*������-�����&��"��'���&��������������������%*��� �/���@���B�#�/��� **��������%���D������*�� ���/�����������#�*�� ��%�� ���%��#�/��"�����#��%������������������ ����������" ���%*�%���� ����������7��*���� �#������&�������������*�/����&������� ��������%����" ���%*�%�����������%�����%���&�%��������#�&#�*�� ���/����*����������%�����%�����������8��#���&���*����� ��������#��8�6����&"������������E4?����*��������� �#�����&��#��*�� ���/������ �%�� ���%�� #��� "���� ��������� "�� /��� �� �<*������0��� ���� �6�� *�/����&� %����� ���#�&��� ����%����� ����6�8��&�����"�������6��������<��������������#�/��"����� &&���������#�&#���*�� ���/�������%�����%����%�����%�������*����/��%�����������*����� **���"���#��1/���%����� �Keywords)� �%�� ���%��� *�������� ������ *�������� #���&��� ./���&�� ��D��� .&��� � ��� !�� ���/����� 9�**��&������������7�/������������3�(�/��#���1. Introduction4#������������ �����������" ���#��*����%��������&��� � �������������������.&��� � ���������#����#8�������#�����*�������*������ %�&�8�#�� ���&� �#��*������������- ��#��� �#���� ���������������"��8�����%*�%����&�8�#�����17!�&�8�#��4#����#���"������*�������**���#����&��� � ������������� ���&��#��������8����������1"�������� *������ � ���&� �#�� �:���� ���� *����� ���� � ���&�::��� ���� "����� #�/�� ��������%���� �#���&��� �����������&��� � �����%�����#������F �����������%*�������&"�����������������B��<*� ������%�������&��� � ������������������%*���������B�&�8�#�������&��� � ������������������%*��������%��������&��� � ���*�� �������B�'�"���%������������������#��&������ ���&������������&�����%*������%*�����/������������/���������������%������*�� ����������%��/B�������������&������������ **���#���������4#���%�� ���%����#�/�� �� ����� �#����*�"�%�� ��� �#��*���E4?����*���������4#��*�*��� ������ ��������� �#��/��� ����*��������%�� ���%�#���&��� �#���������&�#��� �#���#���&��� ������"���#�%������#��**�� ��������/���"����� �#����� � ���&�8�#������ �2. Objectives4#���������#�*�*���#����#���8��&�",����/��)��B 4�*�/�������%*��#����/������*� �����%��8�6�����#���%�����%�#���&����B 4���������#��"��������������%�����%�#���&�����&"����������������&�����/��� ��B 4����� ����#��������������*������������&�#�����������������#���&������%�����%���3. The Current Study4#���������#�*�"��8������D���������%�*�� ���/����#���"�������� ������������/���"���<*�����"��������#�����������#�
International Journal of Social Science Studies Vol. 2, No. 3; 2014
124
findings. Size and productivity are related inversely according to some researchers who attribute it to intensive cultivation with reduced cost of farm inputs and by using family labour. Large farms on the other hand involve greater amount of inputs and more manpower. It results in more operational time, more resource costs and investment in farm infrastructure. Small farms involve cost economies due to use of family labour and lesser involvement of inputs and infrastructure. A large number of studies during 1960s and 1970s have provided convincing evidence that crop productivity per unit of land declined with an increase in farm size ( Sen 1962, 1964, Muzumdar 1965,Khusro 1968, Hanumanth Rao 1966, Saini 1971, Bardhan 1973 and Berry 1972). Their arguments were advanced for supporting land reforms, land ceiling and other policies to support small holders on grounds of cost economy, efficiency and growth. Some recent studies too have affirmed the superiority of small farms particularly in the Indian context, Vandana Shiva (2007) has highlighted the significant role of small farmers who provide food security for one billion people as 80 per cent of farmers own less than 2 hectares of land. She has reflected the claim that small farms have limitations in improving agricultural productivity. Small bio-diverse farms have higher productivity than monocultures which are necessary aspects of industrial agriculture based on external inputs. She has rightly cited the examples of how higher biological productivity translates into higher incomes for small farmers. The examples of Pearl Millet in Rajasthan and other experiments in Uttaranchal and Sikkim have been cited. A UN report has been cited by Robert Evans (2011) in favour of small farms with better productivity. “Evidence has shown that for most crops of the optimal farm is small in scale and that is at this level that most gain in terms of both sustainable productivity increases and rural poverty reduction can be achieved”. The thrust of the UN Report is that Governments must work towards a major shift towards small scale farming if endemic food crisis are to be overcome and production boosted to support the global population. The NSS data has been cited in favour of small farms having higher productivity (Chand Ramesh et al., 2011). Small holdings in Indian agriculture still exhibit a higher productivity than large holdings. Small holdings have been found to exhibit many advantages as indicated by some in the Indian context. Some of the favourable and strong points of small holdings compared to the larger ones are worth noting. 4. The Method The study is macro analysis of small farms and agricultural productivity in the Indian context. The data is obtained through secondary sources and the analysis is based on secondary data. The data is obtained from published sources. The reports of Agricultural Census during 1976-77 to 210-11 and Input Survey during 1976-77 to 2006-07 published by Government of India are major source of data. Report of NSS 59th Round on Situation Assessment Survey of Farmers published by Government of India, publications of IFPRI, IFAD, World Bank, The Journal of Political Economy, The Economic and Political Weekly, etc have also been the other sources of secondary data and literature related to the study. The Government of India conducts Agricultural Census from 1970-71 and Input Survey from 1976-77 for every five years. But to study the decadal reports of agricultural census and input survey from 1976-77 are considered for comparative analysis of different aspects of agricultural holdings viz., size of farms, nature of farms, land use, usage os inputs, cropping intensity etc and their impact on agricultural productivity. The statistical tools like growth rates and percentages have been used for analysis and interpretation of the data. 5. Findings 5.1 The Conceptual Framework of Small Farms The conceptual approach to small farms is made from a variety of angles. Small scale farming is often used interchangeably with small holders-family-subsistence- resource poor-low income-low input or low technology farming. The following approaches indicate the diversity of the concept of small farming.
1) Family farms are operated units in which most labour and enterprise come from family which puts much of its working time in the farm(Lipton 2005).
2) Small holders are those with a low asset base operating less than 2 hectares of crop land (World Bank 2003). 3) Small farmers are those with limited resource endowments relative to other farmers in the sector.
(Dixon, et al 2003). 4) A smallholder is a farmer practicing a mix of commercial and subsistence production or either where the
family provides the majority of labour and the farm provides the principal source of income. (Narayan and Gulati 2002).
International Journal of Social Science Studies Vol. 2, No. 3; 2014
125
5) Small farms as those depending on household members for most of the labour or those with a subsistence orientation, where the primary aim of the farm is to produce the bulk of the households consumption of staple food (Hazell et al., 2007).
The above approaches indicate a lack of unanimity about the concept of small farms. It is however the most common measure to categorise small farms by number of international reports viz., IFPRI,IFAD,FAO etc., and national reports like Agricultural Census reports and Input Survey reports of GOI, the reports of RBI and planning commission etc., is that small farms and small holders are those farms of less than 2 hectares of owned or rented land. It is also assumed that the small farm family provides the primary source of labour and that farming constitutes a principal source of income to the family. 5.2 Dimensions of small Farms-Global and Regional Scenario There are approximately 500 million small farms.They constitute 85 per cent of the total farms. The overwhelming majority of these farms are located in Asia viz., 87% (IFPRI 2007) while Africa is for home another 8%, and Europe to approximately 4%. In Asia, China alone accounts for almost half the worlds small farms (193 million) followed by India with 117 million (23%). Others in the region are in descending order they include Indonesia, Bangladesh and Vietnam. 5.2.1 Trends in Farm size –Global view Global trends indicate divergent movement in the direction of size farm holdings in developing and developed countries. In the developing countries small farmers dominate the agricultural landscape especially in Africa and Asia for at least the next two to three decades. Historical trends from developed countries show that the size of farms increased during the second half of the 20th century while the number of small farms decreased. Table 1. Approximate farm size by World/Region
World/Region Average farm size (hectares) Africa 1.6 Asia 1.6 Latin America 67 Western Europe 27 North America 121
Source: Von Braun 2005,IFPRI As shown in the above Table 1, United States average farm size has grown from 157 hectares in 1969 to 179 hectares in 2002, peaking at almost 200 hectares in the mid 1990s. Similar trends can be observed in the United Kingdom, where the average farm size grew from 55 to 70 hectares during 1970-93. Farm size in North America currently averages 121 hectares and in Western Europe it averages 27 hectares. 5.2.2 Structural changes in Landholdings of India Table 2. Trends in Number , Operated area and Average size of holdings in India
Year Number of holdings(mn*) Area operated ( in mn ha)
Average area per holding (in ha*)
1976-77 81.60 163.34 2.00 1985-86 97.20 164.56 1.69 1995-96 115.60 163.36 1.41 2005-06 129.22 158.32 1.23 2010-11 138.35 159.59 1.15
% variation during 1976-77 to 2010-11 69.55 -2.30
Annual growth rate 1.99 -0.07 *mn:million ha: Hectare Source: GOI, Agricultural Census Reports from 1976-77 to 2010-11, All India Report on Number and Area of Operational Holdings, Agricultural Census Division, Department of Agricultural and Co-operation, Government of India, New Delhi
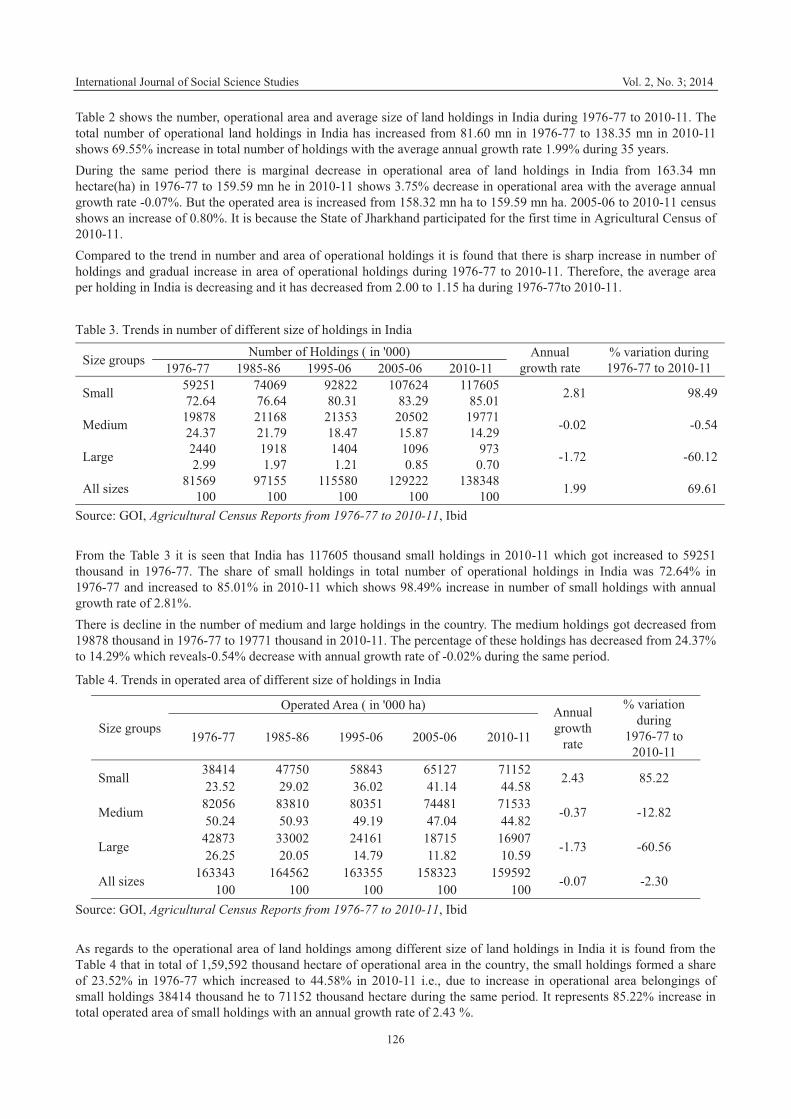
International Journal of Social Science Studies Vol. 2, No. 3; 2014
126
Table 2 shows the number, operational area and average size of land holdings in India during 1976-77 to 2010-11. The total number of operational land holdings in India has increased from 81.60 mn in 1976-77 to 138.35 mn in 2010-11 shows 69.55% increase in total number of holdings with the average annual growth rate 1.99% during 35 years. During the same period there is marginal decrease in operational area of land holdings in India from 163.34 mn hectare(ha) in 1976-77 to 159.59 mn he in 2010-11 shows 3.75% decrease in operational area with the average annual growth rate -0.07%. But the operated area is increased from 158.32 mn ha to 159.59 mn ha. 2005-06 to 2010-11 census shows an increase of 0.80%. It is because the State of Jharkhand participated for the first time in Agricultural Census of 2010-11. Compared to the trend in number and area of operational holdings it is found that there is sharp increase in number of holdings and gradual increase in area of operational holdings during 1976-77 to 2010-11. Therefore, the average area per holding in India is decreasing and it has decreased from 2.00 to 1.15 ha during 1976-77to 2010-11. Table 3. Trends in number of different size of holdings in India
Size groups Number of Holdings ( in '000) Annual growth rate
% variation during 1976-77 to 2010-11 1976-77 1985-86 1995-06 2005-06 2010-11
Small 59251 74069 92822 107624 117605 2.81 98.49 72.64 76.64 80.31 83.29 85.01
Medium 19878 21168 21353 20502 19771 -0.02 -0.54 24.37 21.79 18.47 15.87 14.29
Large 2440 1918 1404 1096 973 -1.72 -60.12 2.99 1.97 1.21 0.85 0.70
All sizes 81569 97155 115580 129222 138348 1.99 69.61 100 100 100 100 100 Source: GOI, Agricultural Census Reports from 1976-77 to 2010-11, Ibid From the Table 3 it is seen that India has 117605 thousand small holdings in 2010-11 which got increased to 59251 thousand in 1976-77. The share of small holdings in total number of operational holdings in India was 72.64% in 1976-77 and increased to 85.01% in 2010-11 which shows 98.49% increase in number of small holdings with annual growth rate of 2.81%. There is decline in the number of medium and large holdings in the country. The medium holdings got decreased from 19878 thousand in 1976-77 to 19771 thousand in 2010-11. The percentage of these holdings has decreased from 24.37% to 14.29% which reveals-0.54% decrease with annual growth rate of -0.02% during the same period.
Table 4. Trends in operated area of different size of holdings in India
Size groups
Operated Area ( in '000 ha) Annual growth
rate
% variation during
1976-77 to 2010-11
1976-77 1985-86 1995-06 2005-06 2010-11
Small 38414 47750 58843 65127 71152 2.43 85.22 23.52 29.02 36.02 41.14 44.58
Medium 82056 83810 80351 74481 71533 -0.37 -12.82 50.24 50.93 49.19 47.04 44.82
Large 42873 33002 24161 18715 16907 -1.73 -60.56 26.25 20.05 14.79 11.82 10.59
All sizes 163343 164562 163355 158323 159592 -0.07 -2.30 100 100 100 100 100 Source: GOI, Agricultural Census Reports from 1976-77 to 2010-11, Ibid As regards to the operational area of land holdings among different size of land holdings in India it is found from the Table 4 that in total of 1,59,592 thousand hectare of operational area in the country, the small holdings formed a share of 23.52% in 1976-77 which increased to 44.58% in 2010-11 i.e., due to increase in operational area belongings of small holdings 38414 thousand he to 71152 thousand hectare during the same period. It represents 85.22% increase in total operated area of small holdings with an annual growth rate of 2.43 %.
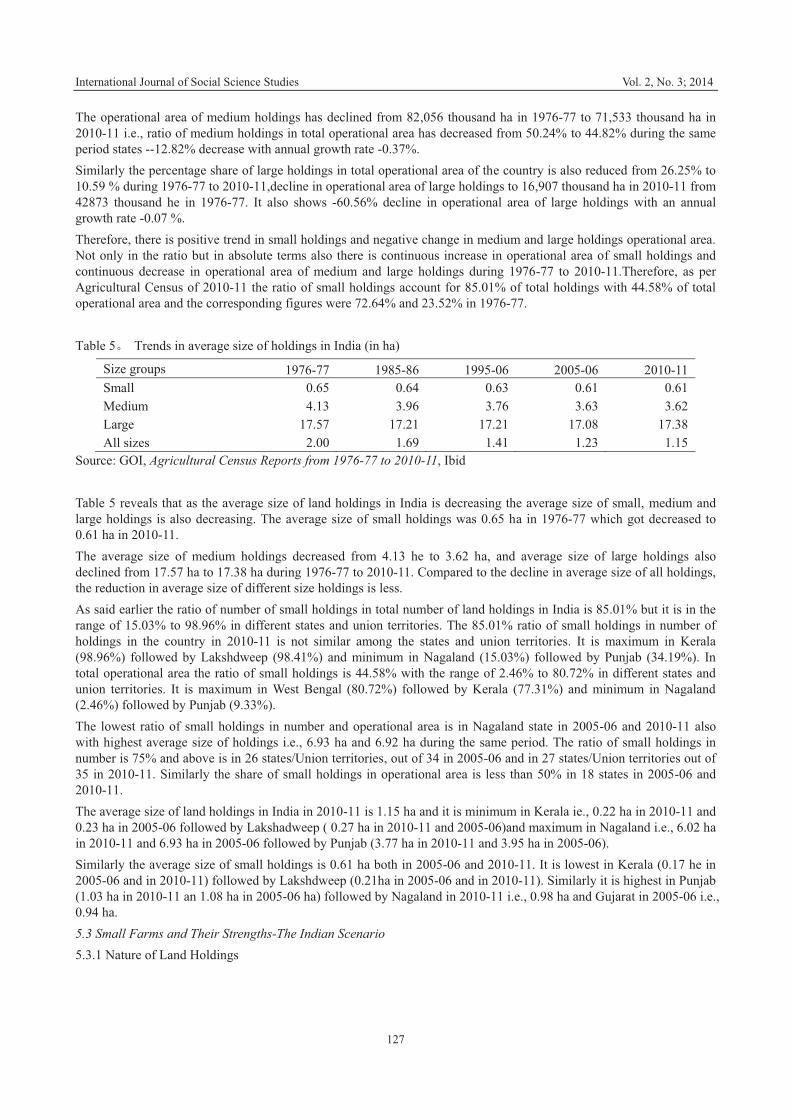
International Journal of Social Science Studies Vol. 2, No. 3; 2014
127
The operational area of medium holdings has declined from 82,056 thousand ha in 1976-77 to 71,533 thousand ha in 2010-11 i.e., ratio of medium holdings in total operational area has decreased from 50.24% to 44.82% during the same period states --12.82% decrease with annual growth rate -0.37%. Similarly the percentage share of large holdings in total operational area of the country is also reduced from 26.25% to 10.59 % during 1976-77 to 2010-11,decline in operational area of large holdings to 16,907 thousand ha in 2010-11 from 42873 thousand he in 1976-77. It also shows -60.56% decline in operational area of large holdings with an annual growth rate -0.07 %. Therefore, there is positive trend in small holdings and negative change in medium and large holdings operational area. Not only in the ratio but in absolute terms also there is continuous increase in operational area of small holdings and continuous decrease in operational area of medium and large holdings during 1976-77 to 2010-11.Therefore, as per Agricultural Census of 2010-11 the ratio of small holdings account for 85.01% of total holdings with 44.58% of total operational area and the corresponding figures were 72.64% and 23.52% in 1976-77. Table 5 Trends in average size of holdings in India (in ha)
Size groups 1976-77 1985-86 1995-06 2005-06 2010-11 Small 0.65 0.64 0.63 0.61 0.61 Medium 4.13 3.96 3.76 3.63 3.62 Large 17.57 17.21 17.21 17.08 17.38 All sizes 2.00 1.69 1.41 1.23 1.15
Source: GOI, Agricultural Census Reports from 1976-77 to 2010-11, Ibid Table 5 reveals that as the average size of land holdings in India is decreasing the average size of small, medium and large holdings is also decreasing. The average size of small holdings was 0.65 ha in 1976-77 which got decreased to 0.61 ha in 2010-11. The average size of medium holdings decreased from 4.13 he to 3.62 ha, and average size of large holdings also declined from 17.57 ha to 17.38 ha during 1976-77 to 2010-11. Compared to the decline in average size of all holdings, the reduction in average size of different size holdings is less. As said earlier the ratio of number of small holdings in total number of land holdings in India is 85.01% but it is in the range of 15.03% to 98.96% in different states and union territories. The 85.01% ratio of small holdings in number of holdings in the country in 2010-11 is not similar among the states and union territories. It is maximum in Kerala (98.96%) followed by Lakshdweep (98.41%) and minimum in Nagaland (15.03%) followed by Punjab (34.19%). In total operational area the ratio of small holdings is 44.58% with the range of 2.46% to 80.72% in different states and union territories. It is maximum in West Bengal (80.72%) followed by Kerala (77.31%) and minimum in Nagaland (2.46%) followed by Punjab (9.33%). The lowest ratio of small holdings in number and operational area is in Nagaland state in 2005-06 and 2010-11 also with highest average size of holdings i.e., 6.93 ha and 6.92 ha during the same period. The ratio of small holdings in number is 75% and above is in 26 states/Union territories, out of 34 in 2005-06 and in 27 states/Union territories out of 35 in 2010-11. Similarly the share of small holdings in operational area is less than 50% in 18 states in 2005-06 and 2010-11. The average size of land holdings in India in 2010-11 is 1.15 ha and it is minimum in Kerala ie., 0.22 ha in 2010-11 and 0.23 ha in 2005-06 followed by Lakshadweep ( 0.27 ha in 2010-11 and 2005-06)and maximum in Nagaland i.e., 6.02 ha in 2010-11 and 6.93 ha in 2005-06 followed by Punjab (3.77 ha in 2010-11 and 3.95 ha in 2005-06). Similarly the average size of small holdings is 0.61 ha both in 2005-06 and 2010-11. It is lowest in Kerala (0.17 he in 2005-06 and in 2010-11) followed by Lakshdweep (0.21ha in 2005-06 and in 2010-11). Similarly it is highest in Punjab (1.03 ha in 2010-11 an 1.08 ha in 2005-06 ha) followed by Nagaland in 2010-11 i.e., 0.98 ha and Gujarat in 2005-06 i.e., 0.94 ha. 5.3 Small Farms and Their Strengths-The Indian Scenario 5.3.1 Nature of Land Holdings
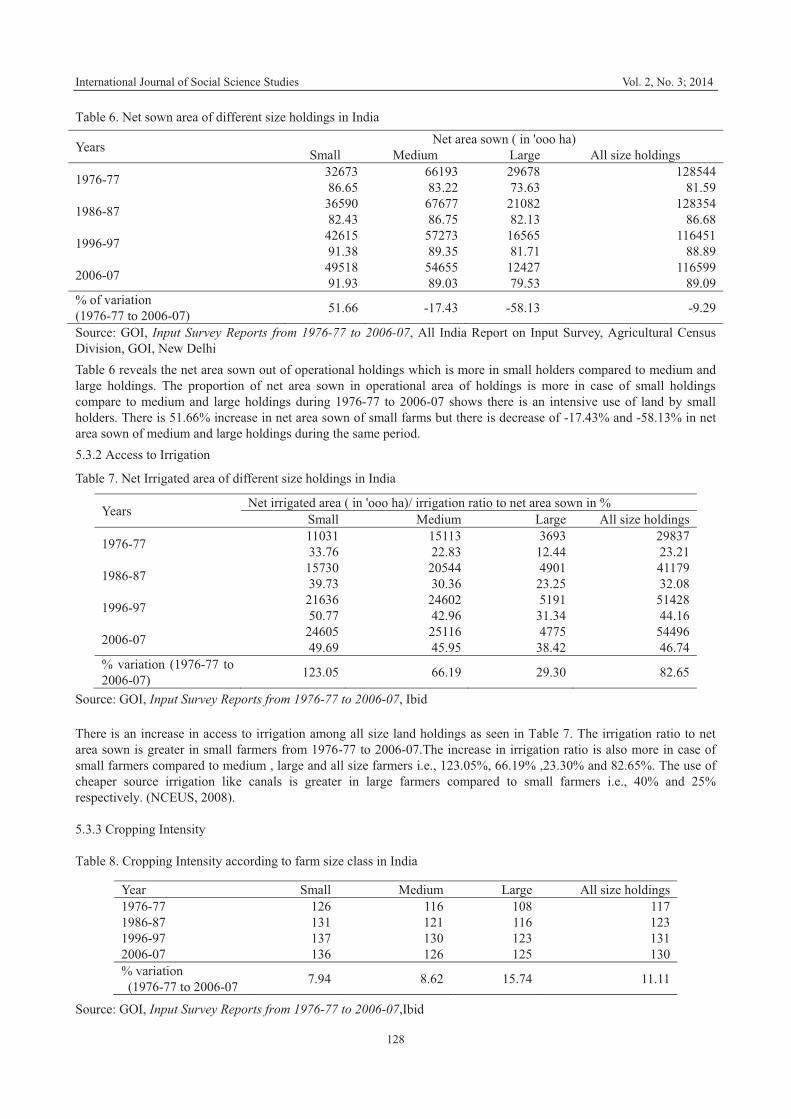
International Journal of Social Science Studies Vol. 2, No. 3; 2014
128
Table 6. Net sown area of different size holdings in India
Years Net area sown ( in 'ooo ha) Small Medium Large All size holdings
1976-77 32673 66193 29678 128544 86.65 83.22 73.63 81.59
1986-87 36590 67677 21082 128354 82.43 86.75 82.13 86.68
1996-97 42615 57273 16565 116451 91.38 89.35 81.71 88.89
2006-07 49518 54655 12427 116599 91.93 89.03 79.53 89.09
% of variation (1976-77 to 2006-07) 51.66 -17.43 -58.13 -9.29
Source: GOI, Input Survey Reports from 1976-77 to 2006-07, All India Report on Input Survey, Agricultural Census Division, GOI, New Delhi Table 6 reveals the net area sown out of operational holdings which is more in small holders compared to medium and large holdings. The proportion of net area sown in operational area of holdings is more in case of small holdings compare to medium and large holdings during 1976-77 to 2006-07 shows there is an intensive use of land by small holders. There is 51.66% increase in net area sown of small farms but there is decrease of -17.43% and -58.13% in net area sown of medium and large holdings during the same period. 5.3.2 Access to Irrigation
Table 7. Net Irrigated area of different size holdings in India
Years Net irrigated area ( in 'ooo ha)/ irrigation ratio to net area sown in % Small Medium Large All size holdings
1976-77 11031 15113 3693 29837 33.76 22.83 12.44 23.21
1986-87 15730 20544 4901 41179 39.73 30.36 23.25 32.08
1996-97 21636 24602 5191 51428 50.77 42.96 31.34 44.16
2006-07 24605 25116 4775 54496 49.69 45.95 38.42 46.74
% variation (1976-77 to 2006-07) 123.05 66.19 29.30 82.65
Source: GOI, Input Survey Reports from 1976-77 to 2006-07, Ibid There is an increase in access to irrigation among all size land holdings as seen in Table 7. The irrigation ratio to net area sown is greater in small farmers from 1976-77 to 2006-07.The increase in irrigation ratio is also more in case of small farmers compared to medium , large and all size farmers i.e., 123.05%, 66.19% ,23.30% and 82.65%. The use of cheaper source irrigation like canals is greater in large farmers compared to small farmers i.e., 40% and 25% respectively. (NCEUS, 2008). 5.3.3 Cropping Intensity Table 8. Cropping Intensity according to farm size class in India
Source: GOI, Input Survey Reports from 1976-77 to 2006-07,Ibid
Year Small Medium Large All size holdings 1976-77 126 116 108 117 1986-87 131 121 116 123 1996-97 137 130 123 131 2006-07 136 126 125 130 % variation (1976-77 to 2006-07 7.94 8.62 15.74 11.11
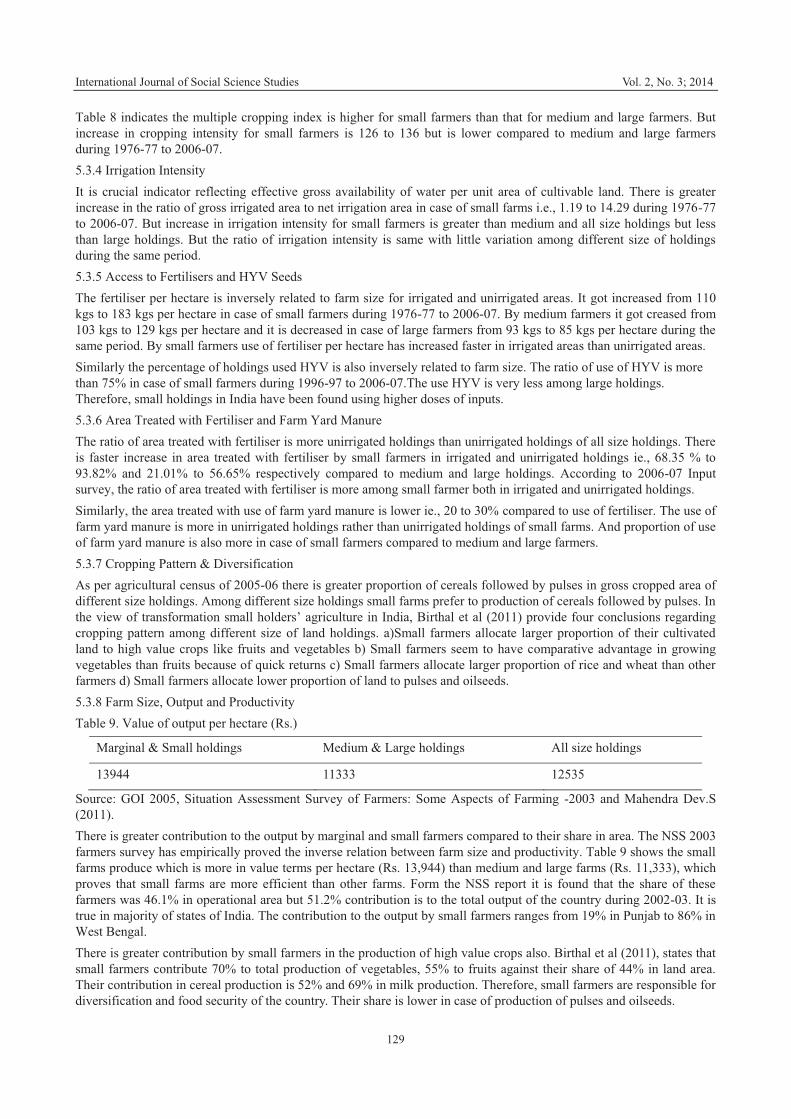
International Journal of Social Science Studies Vol. 2, No. 3; 2014
129
Table 8 indicates the multiple cropping index is higher for small farmers than that for medium and large farmers. But increase in cropping intensity for small farmers is 126 to 136 but is lower compared to medium and large farmers during 1976-77 to 2006-07. 5.3.4 Irrigation Intensity It is crucial indicator reflecting effective gross availability of water per unit area of cultivable land. There is greater increase in the ratio of gross irrigated area to net irrigation area in case of small farms i.e., 1.19 to 14.29 during 1976-77 to 2006-07. But increase in irrigation intensity for small farmers is greater than medium and all size holdings but less than large holdings. But the ratio of irrigation intensity is same with little variation among different size of holdings during the same period. 5.3.5 Access to Fertilisers and HYV Seeds The fertiliser per hectare is inversely related to farm size for irrigated and unirrigated areas. It got increased from 110 kgs to 183 kgs per hectare in case of small farmers during 1976-77 to 2006-07. By medium farmers it got creased from 103 kgs to 129 kgs per hectare and it is decreased in case of large farmers from 93 kgs to 85 kgs per hectare during the same period. By small farmers use of fertiliser per hectare has increased faster in irrigated areas than unirrigated areas. Similarly the percentage of holdings used HYV is also inversely related to farm size. The ratio of use of HYV is more than 75% in case of small farmers during 1996-97 to 2006-07.The use HYV is very less among large holdings. Therefore, small holdings in India have been found using higher doses of inputs. 5.3.6 Area Treated with Fertiliser and Farm Yard Manure The ratio of area treated with fertiliser is more unirrigated holdings than unirrigated holdings of all size holdings. There is faster increase in area treated with fertiliser by small farmers in irrigated and unirrigated holdings ie., 68.35 % to 93.82% and 21.01% to 56.65% respectively compared to medium and large holdings. According to 2006-07 Input survey, the ratio of area treated with fertiliser is more among small farmer both in irrigated and unirrigated holdings. Similarly, the area treated with use of farm yard manure is lower ie., 20 to 30% compared to use of fertiliser. The use of farm yard manure is more in unirrigated holdings rather than unirrigated holdings of small farms. And proportion of use of farm yard manure is also more in case of small farmers compared to medium and large farmers. 5.3.7 Cropping Pattern & Diversification As per agricultural census of 2005-06 there is greater proportion of cereals followed by pulses in gross cropped area of different size holdings. Among different size holdings small farms prefer to production of cereals followed by pulses. In the view of transformation small holders’ agriculture in India, Birthal et al (2011) provide four conclusions regarding cropping pattern among different size of land holdings. a)Small farmers allocate larger proportion of their cultivated land to high value crops like fruits and vegetables b) Small farmers seem to have comparative advantage in growing vegetables than fruits because of quick returns c) Small farmers allocate larger proportion of rice and wheat than other farmers d) Small farmers allocate lower proportion of land to pulses and oilseeds. 5.3.8 Farm Size, Output and Productivity Table 9. Value of output per hectare (Rs.)
Marginal & Small holdings Medium & Large holdings All size holdings
13944 11333 12535
Source: GOI 2005, Situation Assessment Survey of Farmers: Some Aspects of Farming -2003 and Mahendra Dev.S (2011). There is greater contribution to the output by marginal and small farmers compared to their share in area. The NSS 2003 farmers survey has empirically proved the inverse relation between farm size and productivity. Table 9 shows the small farms produce which is more in value terms per hectare (Rs. 13,944) than medium and large farms (Rs. 11,333), which proves that small farms are more efficient than other farms. Form the NSS report it is found that the share of these farmers was 46.1% in operational area but 51.2% contribution is to the total output of the country during 2002-03. It is true in majority of states of India. The contribution to the output by small farmers ranges from 19% in Punjab to 86% in West Bengal. There is greater contribution by small farmers in the production of high value crops also. Birthal et al (2011), states that small farmers contribute 70% to total production of vegetables, 55% to fruits against their share of 44% in land area. Their contribution in cereal production is 52% and 69% in milk production. Therefore, small farmers are responsible for diversification and food security of the country. Their share is lower in case of production of pulses and oilseeds.
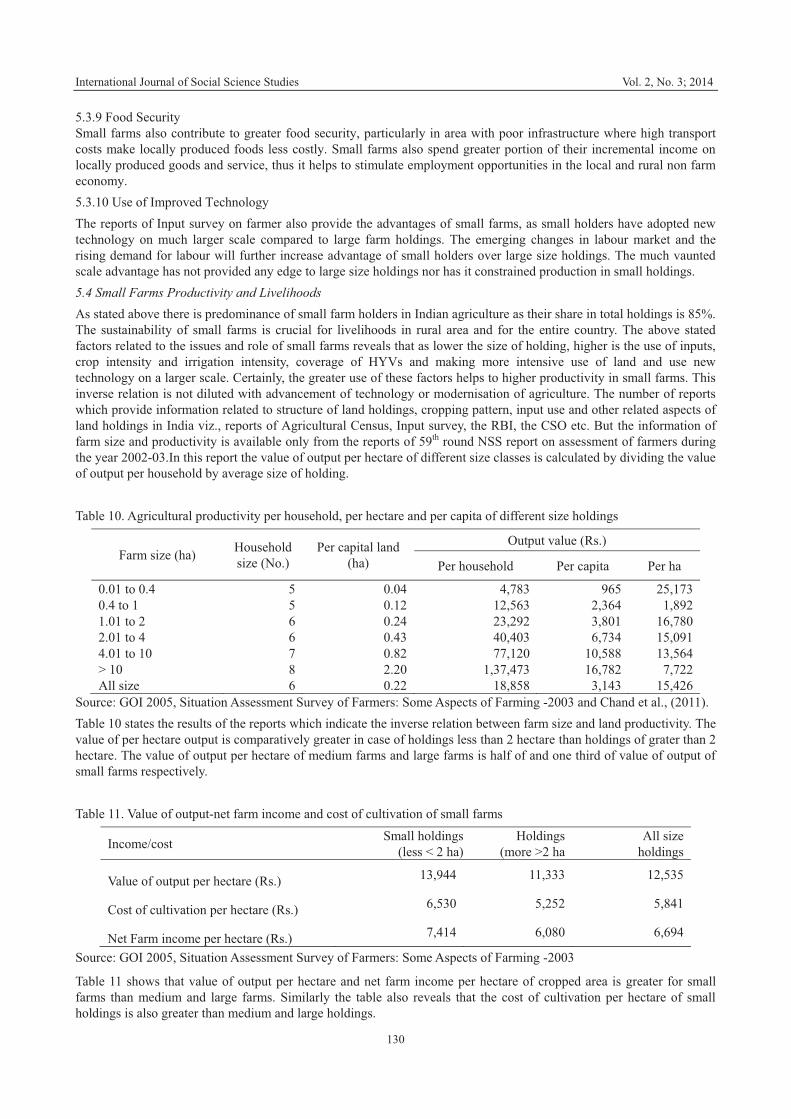
International Journal of Social Science Studies Vol. 2, No. 3; 2014
130
5.3.9 Food Security Small farms also contribute to greater food security, particularly in area with poor infrastructure where high transport costs make locally produced foods less costly. Small farms also spend greater portion of their incremental income on locally produced goods and service, thus it helps to stimulate employment opportunities in the local and rural non farm economy. 5.3.10 Use of Improved Technology The reports of Input survey on farmer also provide the advantages of small farms, as small holders have adopted new technology on much larger scale compared to large farm holdings. The emerging changes in labour market and the rising demand for labour will further increase advantage of small holders over large size holdings. The much vaunted scale advantage has not provided any edge to large size holdings nor has it constrained production in small holdings. 5.4 Small Farms Productivity and Livelihoods As stated above there is predominance of small farm holders in Indian agriculture as their share in total holdings is 85%. The sustainability of small farms is crucial for livelihoods in rural area and for the entire country. The above stated factors related to the issues and role of small farms reveals that as lower the size of holding, higher is the use of inputs, crop intensity and irrigation intensity, coverage of HYVs and making more intensive use of land and use new technology on a larger scale. Certainly, the greater use of these factors helps to higher productivity in small farms. This inverse relation is not diluted with advancement of technology or modernisation of agriculture. The number of reports which provide information related to structure of land holdings, cropping pattern, input use and other related aspects of land holdings in India viz., reports of Agricultural Census, Input survey, the RBI, the CSO etc. But the information of farm size and productivity is available only from the reports of 59th round NSS report on assessment of farmers during the year 2002-03.In this report the value of output per hectare of different size classes is calculated by dividing the value of output per household by average size of holding. Table 10. Agricultural productivity per household, per hectare and per capita of different size holdings
Farm size (ha) Household size (No.)
Per capital land (ha)
Output value (Rs.)
Per household Per capita Per ha
0.01 to 0.4 5 0.04 4,783 965 25,173 0.4 to 1 5 0.12 12,563 2,364 1,892 1.01 to 2 6 0.24 23,292 3,801 16,780 2.01 to 4 6 0.43 40,403 6,734 15,091 4.01 to 10 7 0.82 77,120 10,588 13,564 > 10 8 2.20 1,37,473 16,782 7,722 All size 6 0.22 18,858 3,143 15,426
Source: GOI 2005, Situation Assessment Survey of Farmers: Some Aspects of Farming -2003 and Chand et al., (2011). Table 10 states the results of the reports which indicate the inverse relation between farm size and land productivity. The value of per hectare output is comparatively greater in case of holdings less than 2 hectare than holdings of grater than 2 hectare. The value of output per hectare of medium farms and large farms is half of and one third of value of output of small farms respectively. Table 11. Value of output-net farm income and cost of cultivation of small farms
Income/cost Small holdings (less < 2 ha)
Holdings (more >2 ha
All size holdings
Value of output per hectare (Rs.) 13,944 11,333 12,535
Cost of cultivation per hectare (Rs.) 6,530 5,252 5,841
Net Farm income per hectare (Rs.) 7,414 6,080 6,694
Source: GOI 2005, Situation Assessment Survey of Farmers: Some Aspects of Farming -2003
Table 11 shows that value of output per hectare and net farm income per hectare of cropped area is greater for small farms than medium and large farms. Similarly the table also reveals that the cost of cultivation per hectare of small holdings is also greater than medium and large holdings.
International Journal of Social Science Studies Vol. 2, No. 3; 2014
131
The per capita output is low on smallholdings despite higher productivity (Chand et al 2011) due to lower per capital availability of land. Therefore tiny piece of land cannot generate enough income to take care of the livelihood needs of a small farm family. According to Tendulkar Committee norm, for the family dependent on agriculture income there is need of a minimum 0.8 ha of land area which is needed to keep a farm family above the poverty line. Therefore ¾ of smallholders’ population cannot meet their livelihood from farm income alone. NCEUS (2008) also reveals that the poverty for small holdings farmers is much higher than other farmers. There is need to increase productivity and income of small holdings and to promote non-farm employment opportunities for these farmers. 5.5 Productivity of Small Farms-Constraints and Challenges Faced by Small Holdings The inverse relationship between size and productivity of farms has been questioned on grounds of variation in soil quality. The assumption of inverse relationship of size of farms and productivity becomes invalid when soil variation is considered. The inverse relationship leased to hold in more dynamic zones. With the advances in the technology the inverse relationship would vanish (Chadha 1978). The productivity of small farms is largely due to desperate struggle of poor peasants for survival on below subsistence plots of land (Dyer 1997). Small farming does not alleviate poverty and create employment opportunities. Over intensive cultivation of small farms may result in exhaustion of soil productivity. The advantages of small holders disappear as countries develop. As per capital income rises, the economy diversifies and workers leave agriculture and the wage rate goes up (Hazell 2011). It then becomes more efficient to have progressively larger and more mechanised farms. Despite their significance in providing food security, family labour employment and economy in management and high productivity per acre small farms face a few challenges particularly in the wake of globalisation and WTO dispensation. Following are the major challenges faced by small farm. Constraints and Challenges for small farmers One of the paradoxes of the Indian economy is that decline in the share of agriculture and allied activities in occupational structure and GDP. But decline in share of agricultural workers is slower than decline in share of agriculture in GDP. The occupational share of agriculture declined from 72.1 % in 1950-51 to 53.02% in 2013 (FA0 2014). But there is sharp decline in share of agriculture and allied activities in GDP from 51.88% in 1950-51 to 13.69% in 2012-13 at 2004-05 prices. Similarly the share of agriculture in GDP declined from 41.83% to 11-65% during 1950-51 to 2012-13 at 2004-05 prices. As stated earlier there are 138 million landholdings in India, out of them 118 million holdings belong to small farmers. They constitute 85 % in land holdings and 45% in total operational area in the country. Hence, the average size of holdings in India declined to 1.15 ha and the average size of small holdings is 0.61 ha. The growth rate of agriculture and allied activities declined from 3.48% to 1.91% from 1060-01 in 2012-13, similarly the growth rate of agriculture in GDP got declined from 3.83% to 1.72% in 2012-13 at 2004-05 prices and it is some time negative also. With tiny piece of land, small farmers have number of constraints and challenges to manage their livelihood and food security of the country. There are many issues and challenges for small holdings agriculture in India. NSS Farmers’ survey 2003 reported number of issues related to small and marginal farmers. Based on this report, NCEUS(2008) states the common issues which concern the small farmers they are: imperfect markets for inputs/product leading to smaller value realisations,; absence of access to credit markets or imperfect credit markets leading to sub-optimal investment decisions or input applications; poor human resource base; smaller access to suitable extension services restricting suitable decisions regrading cultivation practices and technological know-how; poor access to public goods such as public irrigation, command area development, electricity grids; greater negative externalities from poor quality land and water management etc.Apart from these some other issues and challenges relating to small farmers are as follows: 5.5.1 Declining Size of Holdings Due to increasing number of land holdings and decreasing area of operational holdings there is declining per capita arable land in India. Therefore, it is difficult for small farms to become viable economic units especially in rainfed conditions. 5.5.2 Parcels of Land Holdings Fragmentation of holdings in Indian agriculture has always been a serious bottleneck in increasing agricultural productivity. As per 2006-07 Input Survey the number of parcels per holding is 1.87 in case of small farmers and 2.22 for all size holdings. Therefore, area per parcel per holdings will be minimum, it is 0.35 ha and 0.59 ha for small and all size holdings respectively. 5.5.3 Social Groups
International Journal of Social Science Studies Vol. 2, No. 3; 2014
132
The proportion of socially disadvantaged groups such as Scheduled Castes and Scheduled Tribes is higher among small farmers than that of medium and large farmers. Even after accounting for quantity and quality of land owned by socially deprived classes, their access to information, marketing, credit and publicity provided inputs and extension services are lower. This shows that they possibly suffer from discrimination in the delivery of public services as well as market (NCEUS, 2008) 5.5.4 Land and Tenancy Security Due to small size of landholding the small farmers are compelled to augment their operational area through tenancy or leasing-in land. Most tenants are landless or small landholders. Tenancy is not documented and remains founded on verbal contracts of cost and crop sharing. The informal tenurial system will be the cause for less intensive use of labour and other inputs, slower adoption of technology, lower investment for land improvement, leading to low levels of output. With no documentary-proof tenants will also be unable to access institutional credit and approach money lenders for purchase of inputs. By land reforms they own and cultivate some land but it is a limiting factor for getting resources. There is a need of tenancy security for small farmers. 5.5.5 Credit and Indebtedness Small farmers are at disadvantage in accessing credit. Small farmers require a credit package covering production, investment and consumption, some credit for repayment of previous debts. But such packages are not available to them in formal credit markets. Unregistered cultivators, tenants and tribal cultivators face difficulties to access institutional credit and other facilities available to farmers with land titles. 5.5.6 Globalisation Challenges Increasing globalisation has added to the problems of small farmers. Small farmers are facing inherent disadvantages with increasing market integration and globalisation. Among the most powerful forces working against the small farmers are - competition from other countries in respect of price, quality, nature of products, shift towards consumer-driven market, demand much more in terms of quality and food security etc. 5.5.7 Demand for High Value Agricultural Commodities Due to urbanisation, rising incomes, diet conscious, increased participation of women in urban jobs, impact of globalisation, etc, there is changing lifestyle of middle class households; there is higher demand for fruits, vegetable, milk. meat, egg, fish and sugar than food grains. Small farmers have the potential to raise their incomes by switching from grain based production system to high value agriculture products. Even though the production of high value agriculture products is labour intensive and more suitable for small holders, it has number of constraints like perishability, fragmented market, high variations in prices, etc. Therefore smallholders face high transaction costs and risks in production and marketing such commodities. 5.5.8 Increasing Demand for Processing Foods Small farmers are often forced to sell their surpluses at low prices or under stress sale. There is need of post harvest processing and value addition at farm level viz., fruit pulp making, pickle making, preservation of vegetables, etc. 5.5.9 Impact of Climate Change It is a major challenge for agriculture, food security and rural livelihoods in India. It’s adverse effect is more on small farmers. They are facing crop failure, loss of livestock and lives also. 5.5.10 Water Shortage and Water Management The demand for water for agricultural and non-agricultural uses in rising and water scarcity is becoming acute and it is limiting the future expansion of irrigation. Lack of water resource and inefficient water management etc., are becoming constraints for productivity of small holders by soil salinity and waterlogging. Small holdings are depending more on ground water compared to larger holdings but ground water is depleting in many parts of India. 5.5.11 Input Supply Constraints Small farmers are facing lack of access to inputs, inadequate availability, lack of quality inputs, non availability in affordable packages, lack of timely support, lack of knowledge and lack of location specific and small farmer friendly technologies. Subsidies on agricultural inputs compensate the poorest farmers to a small extent only, as they use few purchased inputs and underpricing of fertiliser causes overuse of subsidised nutrients and imbalance in NPK ratios. 5.5.12 Poor Access to Public Goods Poor access to ‘public goods’ such as public irrigation command area development, electricity grids, greater negative externalities from poor quality land and water management.
International Journal of Social Science Studies Vol. 2, No. 3; 2014
133
5.5.13 Low Level of Formal Education and Skills NSS reports on farmers and employment and Input Survey shows that literacy and mean years of education are lower for small holding farmers compared to medium and large farmers. There is less awareness among small farmers regarding bio-fertilisers, minimum support prices etc. Therefore, there is need for small farmers i.e., a reasonable level of awareness regarding information of agriculture. 5.5.14 Unorganised Small Farmers There is poor bargaining capacity among small farmers as they are scattered, unorganised, less educated, and ignorant. 5.5.15 Risk and Vulnerability Small farmers face number of risks at individual and household level, viz., health hazards- disease, injury-accidents-disability, employment and unemployment risks, injury and death of animals and common risks like drought, epidemic and economy wide shocks etc., leading malnutrition, disease, starvation, deaths, indebtedness, sale of assets, spending from saving, child labour, bonded labour, reduction of consumption and migration. 5.5.16 Smaller access to suitable extension services restricting suitable decisions regarding cultivation practices and technological know how. Therefore, small farmers typically face number of problems and challenges. If more small farmers are to have a viable future, there is need for a concerted effort by government and private sector enabling economic environment for their development. How to create more entrepreneur farmers? 6. Discussion In spite of the challenges there are many technological and institutional innovations which can enable small farmers to raise agricultural productivity and increase incomes through diversification and high value agriculture. The opportunities are created through research and extension for small farming. Technological innovations leading to better opportunities for small holdings involve: � Zero tillage � Public sector-led improved technologies � Nutrient management � Bio technology � Institutional innovations involves-land and water management-institutions like water user associations for water management of canal irrigation. � Small farmers have the potential to raise their incomes by switching from grain based production system to high value agriculture. Small farmers should be empowered by enhancing their access to production resources (land,water,energy and credit) appropriate technologies and skill development opportunities, information, fair market for products and inputs, healthcare and sanitation and most importantly to education and productive social services. There is need for diversification as a strategy to achieve output growth, employment generation and natural resources sustainability. Small farmers have tremendous scope for increase in productivity because of natural capital – the soil, the water for bio-diversity can be enhanced through conservation and rejuvenation. Small farmer can intensify bio-diversity, and higher the bio-diversity the higher the productivity and stability and sustainability of agriculture. It is essential to strengthen marketing chains and quality standards and enabling small farmers to have greater access to credits and grants in order to make them viable, especially in the face of tougher international competition. It is expedient to induct innovation in the management of small farms which needs creation accumulation, sharing and use of knowledge. The involvement of farmers in this process is key in building their capacity so that they can seek knowledge either in the form of information or new findings and process it into innovation. It is necessary to make more concerted and integrated efforts to bridge the gap between technology generated and affordability of smallholders by generating appropriate low cost water saving technologies and to promote awareness among the farmers about generating and use of already available irrigation techniques suitable for different types of crops. 7. Conclusion The intense debate about the relationship between farm size and productivity has largely conformed to the view that small holdings in India in agriculture exhibit a higher productivity than large holdings. The inverse relationship between farm size and productivity based on the aggregate of all crops has been quite pronounced in recent years. The findings
International Journal of Social Science Studies Vol. 2, No. 3; 2014
134
of National Sample Survey and other research have been quite supportive of this conclusion. It has been concluded by various research studies that advances in technology and the scale factor in production did not dilute the superior performance of small size holdings. References Bardhan, P. K. (1973). Size, Productivity and Returns to Scale-An Analysis of Farm Level Data in Indian Agriculture.
Journal of Political Economy, 81(6), 1370-86. http://dx.doi.org/10.1086/260132 Berry, R. A. (1972). Farm Size, Distribution, Income Distribution and the Efficiency of Agricultural Production.
Colombia-American Economic Review, 62(2), 403-08. Birthal, P. S., Joshi, P. K., & Narayanan, A. V. (2011). Agricultural Diversification in India: Trends, contribution to
growth and small farmer participation. A discussion paper 00814 of INCRISAT. Chadha, G. K. (1978). Farm Size and Productivity Revisited-Some Notes from Recent Experience Of Punjab.
Economics and Political Weekly, XIII(39),September. Chand, R., L., Prasanna, P. A., & Sing, A. (2011). Farm Size and Productivity-Understanding the Strength of Small
Holders and Improving their Livelihood. Economic and Political Weekly, XLVI(26&27), June. Dev, M. S. (2011). Small Farmers in India: Challenges and Opportunities. Paper presented at Emerging Economies
Research Dialogue. Organised by ICRIER. Beijing, China, 14-15 November. Dixon, J. K, Taniguchi., & Wattenbach.(Eds) (2003). Approaches to Assessing the Impact of Globalisation on African
smallholders: Household and village economy modelling. Proceedings of a working session on Globalisation and the African Smallhodler Study. FAO and World bank, Rome-FAO of UN.
Dyer, G. (1997). Class, State and Agricultural Productivity in Egypt-A Study of Inverse Relationship Between Farm Size and Land Productivity, London. Frank loss publishers.
Evans, R. (Eds) (2011). New green farming vital to end global hunger: U.N, Geneva. Available at http://www.reuters.com
FAO(Food and Agiculture Organisation of the United States), 2014, FAO data book, FAO Statistics Division. Government of India. All India Reports on Number and Area of Agricultural Holdings from
1976-77,1980-81,1990-91,2000-01,2005-06 and 2010-11.Agriucltural Census Division, Department of Agriculture and Co-operation, New Delhi.
Government of India. (2005). Situation Assessment Survey of Farmers: Some Aspects of Farming-2003. Reports of NSS 59th Round (January–December 2003), Report No. 496(59/33/3).Ministry of Statistics and Programme Implementation.
Government of India. (2013). Agricultural at a glance 2013. New Delhi. Ministry of Agriculture, Department of Agriculture and Co-operation.
Government of India. (2013). Agricultural Situation in India- February 2013. New Delhi. Directorate of Economics and Statitstics, Department of Agriculture and Co-operation.
Government of India. Reports on Input Survey from 1976-77, 1986-87, 1996-97 and 2006-07, Agriucltural Census Division, Department of Agriculture and Co-operation, New Delhi.
Hanumanth, R. (1966).Alternative Explanation of the Inverse Relationship Between Farm Size And Out Per Acre in India. Indian Economic Review, 1(2).
Hazel, P. (2011). Five Big Questions About Five Hundred Million Small Farms. Key note paper presented at the Confidence on New Directions for Small Holder Agriculture, IFAD. Rome, 24-25 January 2011.
Hazell, P. C., Poulton, S., Wiggins & Dorward, A. (2007). The Future of small farms for poverty reduction and growth. Discussion Paper 42-2020: Washington D.C: International Food Policy Research Institute (IFPRI).
Khusro, A. M. (Ed). (1968). Returns to scale in Indian Agriculture –Reading in Agricultural Development, New Delhi, Allied publishers.
Lipton, M. (2005). The Family Farm in a Globalising World: The Role of Crop Science in Alleviating Poverty.2020 vision for Food, Agriculture and the Enviornment Initiateve. Discussion Paper 40, Washington DC; IFPRI.
Muzumdar, D. (1965). Size of Farm and Productivity –A Problem of Indian Peasant Agriculture-Economics. Economica, 32(May), 161-173. http://dx.doi.org/10.2307/2552546
Narayanan, S., & Gulati, A. (2002). Globalisation and the Smallholders: A Review of Issues, Approaches and
International Journal of Social Science Studies Vol. 2, No. 3; 2014
135
Implications. Markets and Structural studies Division Discussion paper No.50, Washington D.C:IFPRI. NCEUS (The National Commission on Enterprises in the Unorganized Sector). (2008). Report on A Special Programme
for Marginal and Small Farmers. New Delhi. National Commission for Enterprises in the Unorganised Sector. available at www.nceus.gov.in
Saini, G. R. (1971). Holdings, Size Productivity and Some Related Aspects of India Agriculture. Eonomic and Political Weekly, VI(26), 79-85.
Sen, A. (1962).An Aspect of Indian Agriculture. Economic Weekly, Annual Number, February, 243-246. Sen, A. (1964). Size of Holdings and Productivity, Economic Weekly, Annual Number, February, P-323. Thapa, G. G., & Gaiha, R. (2011). Smallholder farming is Asia and the Pacific: Challenge and Opportunities.Paper
presented at the Confidence on New Directions For Small Holder Agriculture, IFAD. Rome ,24-25 January 2011. Vandana, S. (2007). India Needs Her Small Farmers. Counters Currents.Org, April. www.countercurrents.org World Bank. (2003). Reaching the Rural Poor-A Renewed Strategy for Rural Developmet. Washington DC.
This work is licensed under a Creative Commons Attribution 3.0 License.

Paper Selection and Publishing Process
a) Submission Acknowledgement
When you submit a manuscript online, you will receive a submission acknowledgement letter sent by the online system automatically. For email submission, the editor or editorial assistant sends an e-mail confirmation to the submission’s author within one to three working days. If you fail to receive this confirmation, please check your
bulk email box or contact the editorial assistant.
b) Basic Review
The editor or editorial assistant determines whether the manuscript fits the journal’s focus and scope. Next a
check for the similarity rate is done using CrossCheck, powered by iThenticate. Any manuscripts out of the journal’s scope or containing plagiarism, including self-plagiarism, are rejected.
c) Peer Review
We use a double-blind system for peer review; both reviewers’ and authors’ identities remain anonymous. The
submitted manuscript will be reviewed by at least two experts: one editorial staff member as well as one to three external reviewers. The review process may take two to four weeks.
d) Decision Is Made
The decision to accept or reject an article is based on the suggestions of reviewers. If differences of opinion occur between reviewers, the editor-in-chief will weigh all comments and arrive at a balanced decision based on all comments, or a second round of peer review may be initiated.
e) Notification of the Result of Review
The result of review will be sent to the corresponding author and forwarded to other authors.
f) Publication Fee Is Paid
If the submission is accepted, the authors revise paper and pay the publication fee.
g) Print Journals Are Mailed
After publication, two hard copies of the journal will be sent to the corresponding author. If you want more copies, please order at http://home.redfame.com/subscription-information/
h) Publication Notice
The authors and readers will be notified and invited to visit our website for the newly published articles.
Copyright © 2022 FDOKUMEN