Analytical Chemistry Vol.20 No.7 July 1948
98
-
Upload
khangminh22 -
Category
Documents
-
view
0 -
download
0
Transcript of Analytical Chemistry Vol.20 No.7 July 1948


"Communications to the Editor"
M ANY of the innovations added to ANALYTICAL CHEMISTRY over the past five years are the result of the active
participation of the Advisory Board. The editor welcomesthis opportunity to acknowledge publicly and with warm appreciation the interest and valuable assistance rendered byits members.
At the most recent meeting of the board, the suggestion wasmade by 1. M. Kolthoff that a section "Communications tothe Editor," devoted exclusively to scientific matters, beadded to the journal. We look with favor on this proposal,although we realize full well that such a department may addfurther trials and tribulations to the editor's daily life. Oursole objective is to publish a journal that meets the needs andrequirements of 'analytical chemists the world over. A fewmore responsibilities are welcomed by a loyal staff who derivemuch personal satisfaction from the services rendered theprofession of analytical chemistry.
Many research projects are pursued for years before the results are published. This is especially true of many forms ofresearch conducted in colleges and universities. A thesis for adoctorate usually is published after the candidate has receivedthe degree, and frequently publication is delayed for severalyears. During the course of such research discoveries oftenare made which are of wide interest to workers in the field.Occasionally research in fields other than analytical will dis-·close information of a fundamental nature that is of definiteinterest and value to analytical chemists,
During a research study for an advanceddegree frequentlynew reagents for qualitative detection and quantitative determination of inorganic and organic constituents are discovered, classical techniques are greatly improved, and newphysicochemical principles are used in quantitative analyses.These are but a few examples of many instances where theliterature could be enhanced by a "Communications to theEditor" section. After such discoveries have been made considerable time may elapse before an exhaustive study is completed and'sufficient results are compiled to warrant preparation of a detailed manuscript. We believe readers of ANALYTICAL CHEMISTRY will welcome an opportunity to be informed of new discoveries which can be appropriately reportedin the new department in the form of a brief but exact "Communication to the Editor." This new column will adhere tothe high scientific standards maintained throughout the journal. It is not intended to take the place of "Notes on Analytical Procedures" or "Aids for the Analyst," each of whichserves a most useful purpose.
Scientists in other fields of chemistry often obtain resultsthat are indirectly of great significance to analytical chemists. ANALYTICAL CHEMISTRY is usually not the most suitablemedium for the publication of studies on solubilities, oxidation-reduction reactions, acid-base reactions, catalyzed andinduced reactions, properties of precipitates, etc. Yet readers of ANALYTICAL CHEMJ.STRY would welcome an opportunityto get acquainted with the main results of such studies, whichare appropriate for the new column, especially when their importance to analytical chemistry is clearly emphasized.
The new column offers speedy publication of new discoveries of major analytical importan,ce. We must ask, however,that those who avail themselves of this opportunity use itwith discretion and always with the rights of others in mind.In order to maintain high quality, communications will behandled in a manner similar to that employed for morelengthy manuscripts. Frankly, the success or failure of th,iscolumn will depend upon the speed with which contributionsare reported on by reviewers and the care and wisdom theyuse in making their recommendations. Our highly favorableexperiences of the past indicate that we will have the loyalsupport of the army of reviewers in this new editorial venture.We have said time and again, and once more we repeat, thatwe believe no profession is more conscious of ethics than is thechemical profession. The structure of scientific publicationswould have crumbled years ago if scientists hadnot lived up tohighethical standards.
Many proffered communications will be rejected, just asmany manuscripts are rejected, for one or more reasons. Ofthose Who may receive rejection slips, we ask forbearance anda spirit of understanding. One of the most pleasant duties ofan editor is to write a letter accepting a manuscript or communication; perhaps his most unpleasant duty is to rejectone, for the editor appreciates the time and energy expendedin the research work; done and the effort devoted to the 'writingof a manuscript. No great writer has not produced his quotaof relatively mediocre work; no great actor is outstanding inevery part he po~trays. Similarly, a chemist must expect,at times, to receive critical analyses of his results. Noone isendowed with perfection, and editors are not exempt frominclusion among the fallible.
Thus we offer still another service to our authors and readers in our effort to provide a positive and dynamic approachto scientific and technical journalism in the broad fields of analytical chemistry. This is your journal and is edited to servethe best interests of analytical chemists.
597
DOUBLE, BOND INDEXA Correlation Useful for Classification of Aromatics and Olefins in
Petroleum Fractions
:VI. R. LIPKIN, ALBERT SANKIN, AND C. C. MARTIN
Sun Oil Company, Norwood, Pa.
Double bond index' is defined by the equation:
DBI = .;...(Il_-_9-=8)--=-(M_+",-,_1-=7)3190 Q
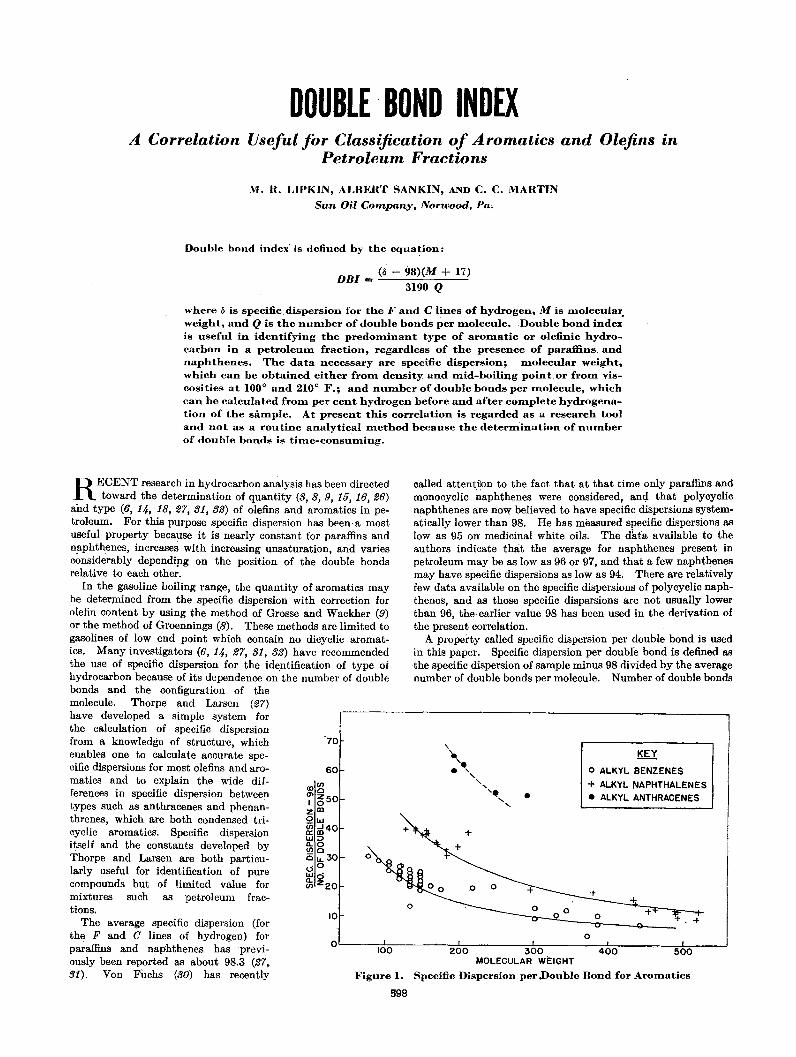
where Ii is specific,dispersion for the F and C lines of hydrogen, M is molecular,weight, and Q is the number of double bonds per molecule. .Double bond indexis useful in identifying the predOIninant type of aromatic or olefinic hydrocarbon in a petroleum fraction, regardless of the presence of paraffins. andnaphthenes. The data necessary are specific dispersion; molecular weight,which can be obtained either from density and mid-boiliqg point.or from viscosities at 100 0 and 210 0 F.; and number of double bonds per molecule, whichcan be calculated from per cent hydrogen before and after complete hydrogenation of the sample. At present this correlation is regarded as a research tooland not as a routine analytical method because the determination of numberof double bonds is tiDle-consuming.
KEYo ALKYL BENZENES
+ ALKYL NAPHTHALENES• ALKYL ANTHRACENES
o
+-"-----i0;-.._~:l-_.-:'t . -+
•
called attentoon to the fact that at that time only paraffins andmonocyclic ~aphthenes were considered, anQ. that polycyclicnaphthenes are now believed to have specific dispersions systematically lower than 98. He has measured specific dispersions aslow as 95 on medicinal white oils. The dltta available to theauthors indicate that the average for naphthenes present inpetroleum may be as low as 96 or 97, and that a few naphthenesmay have specific dispersions as low as 94. There are relativelyfew data available on the specific dispersions of polycyclic naphthenes, and as those specific dispersions are not usually lower'than 96, the·earlier value 98 has been used in the derivation ofthe present correlation.
A property called specific dispersion per double bond is usedin this paper. Specific dispersion per double bond is defined asthe specific dispersion of sample minus 98 divided by the averagenumber of double bonds per molecule. Number of double bonds
o
o
Figure 1.
0'----1~0;;;0;------;2:;-;OSO:;-----....,3:;-;0!;;;0~----470~0;;-------;;5-±:0=0--...J
MOLECULAR WEIGHT
Specific Dispersion per Double Bond for Aromatics
10
70
60
RECENT research in hydrocarbon analysis has been directedtoward the determination of quantity (3, 8, 9, 15, 16, 26)
and type (6, 14, 18, 27, 31, 32) of olefins and aromatics in petroleum. For this purpose specific dispersion has been-a mostuseful property because it is nearly constant for paraffins andn,aphthenes, increases with increasing unsaturation, and variesconsiderably dependipg on the position of the double bondsrelative to each other.
In the gasoline boiling range, the quantity of aromatics maybe deterJIlined from the specific dispersion with correction forolefin content by using the method of Grosse and Wackher (9)or the method of Groennings (8). These methods are limited togasolines of low end point which contain no dicyclic aromatics. Many investigators (6, 14, 27, 31, 32) have recommendedthe use of specific dispersion for the identification of type ofhydrocarbon because of its dependence on'the number of doublebonds and the configuration of themolecule. Thorpe and Larsen (27)have developed a simple system forthe calculation of specific dispersionfrom a knowledge of structure, whichenables one to calculate accurate specific dispersions for most olefins and aromatics and to explain the wide differe~ces in specific dispersion betweentypes such as anthracenes and phenanthrenes, which are both condensed tricyclic aromatics. Specific dispersionitself and the constants developed byThorpe and Larsen are both particularly useful for identification of purecompounds but of limited value formixtures such as petroleum fractions.
The average specific dispersion (forthe F and C lines of hydrogen) forparaffins andnaphthenes has 'previously been reported as about 98.3 (27,31), Von FUchs (30) has recently
598
VOL U M E 20, N O. 7, JU L Y 1 9 4 8 599
KEY(SEE TABLE I)
o ISOLATED OLEFINS, ISOLATED BENZENES
+ CONJUGATED ALKADIENES, NAPHTHALENES
o ANTHRACENES
2 3 4 5 6 1 7 3 8 9 10 .11 12 13
i i i iM+17 XIO
i i ico 1000 500 300 200 150 100 60
MOLECULAR WEIGHT, M
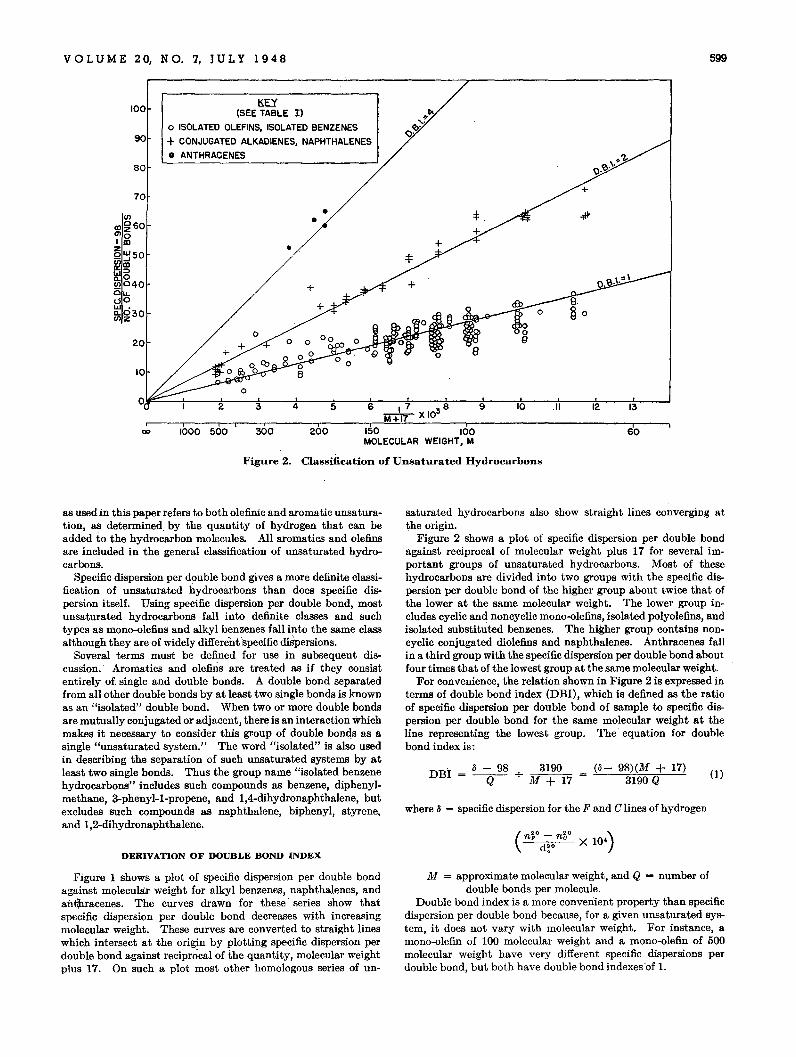
Figure 2. Classification of Unsaturated Hydrocarbons
90
100
80
70
•VI •CllOSOOlZ
I~
~"'50 •-...Jo:a1:::>Q.o!!!040 +Ou..0 0\.Ll.3;~30
20
10
saturated hydrocarbons also show straight lines converging atthe origin.
Figure 2 shows a plot of specific dispersion per double bondagainst reciprocal of molecular weight plus 17 for several important groups of unsaturated hydrocarbons. Most of thesehydrocarbons are divided into two groups with the specific dispersion per double bond of the higher group about twice that ofthe lower at the same molecular weight. The lower group includes cyclic and noncyclic mono-olefins, isolated polyolefins, andisolated substituted benzenes. The higher group contains noncyclic conjugated diolefins and naphthalenes. Anthracenes fallin a third group with the specific dispersion per double bond aboutfour times that of the lowest group at the same molecular weight.
For convenience, the relation shown in Figure 2 is expressed interms of double bond index (DBI), which is defined as the ratioof specific dispersion per double bond of sample to specific dispersion per double bond for the same molecular weight at theline representing the lowest group. The· equation for doublebond index is:
where Ii = specific dispersion for the F and C lines of hydrogen
(O. O. )np - no X 104
dO ••
as used in this paper refers to both olefinic and aromatic unsaturation, as determined by the quantity of hydrogen that can beadded to the· hydrocarbon molecules. All aromatics and olefinsare included in the general classification of unsaturated hydrocarbons.
Specific dispersion per double bond gives a more definite classification of unsaturated hydrocarbons than does specific dispersion itself. Using specific dispersion per double bond, mostunsaturated hydrocarbons fall into definite classes and suchtypes as mono-olefins and alkyl benzenes fall into the same classalthough they are of widely differenhpecific diSpersions.
Several terms must be defined for use in subsequent discussion. Aromatics and olefins are treated as if they consistentirely of single and double bonds. A double bond separatedfrom all other double bonds by at least two single bonds is knownas an "isolated" double bond. When two or more double bondsare mutually conjugated or adjacent, there is an interaction whichmakes it necessary to consider this gr.oup of double bonds as asingle "unsaturated system." The word "isolated" is also usedin describing the separation of such unsaturated systems by atleast two single bonds. Thus the group name "isolated benzenehydrocarbons" includes such compounds as benzene, diphenylmethane, 3-phenyl-l-propene, and 1,4-dihydronaphthalene, butexcludes such compounds as naphthalene, biphenyl, styrene,and 1,2-dihydronaphthalene.
DERIVATION OF DOUBLE BOND INDEX
DBI = Ii - 98-Q-3190
M + 17(0- 98)(M + 17)
3190 Q(1)
Figure 1 shows a plot of specific dispersion per double bondagainst molecular weight for alkyl benzenes, naphthalenes, andaiJ.¢racenes. The curves drawn for these· series show thatspecific dispersion per double bond decreases with increasingmolecular weight. These curves are converted to straight lineswhich intersect at the origin by plotting specific dispersion perdouble bond against reciprocal of the quantity, molecular weightplus 17. On such a plot most other homologous series of un-
M = approximate molecular weight, and Q = number ofdouble bonds per molecule.
Double bond index is a more converiient property than specificdispersion per double bond because, for a given unsaturated system, it does not vary with molecular weight. For instance, amono-olefin of 100 molecular weight and a mono-olefin of 500molecular weight have very different specific dispersions perdouble bond, but both have double bond indexes·of 1.
600 ANALYTICAL CHEMISTRY
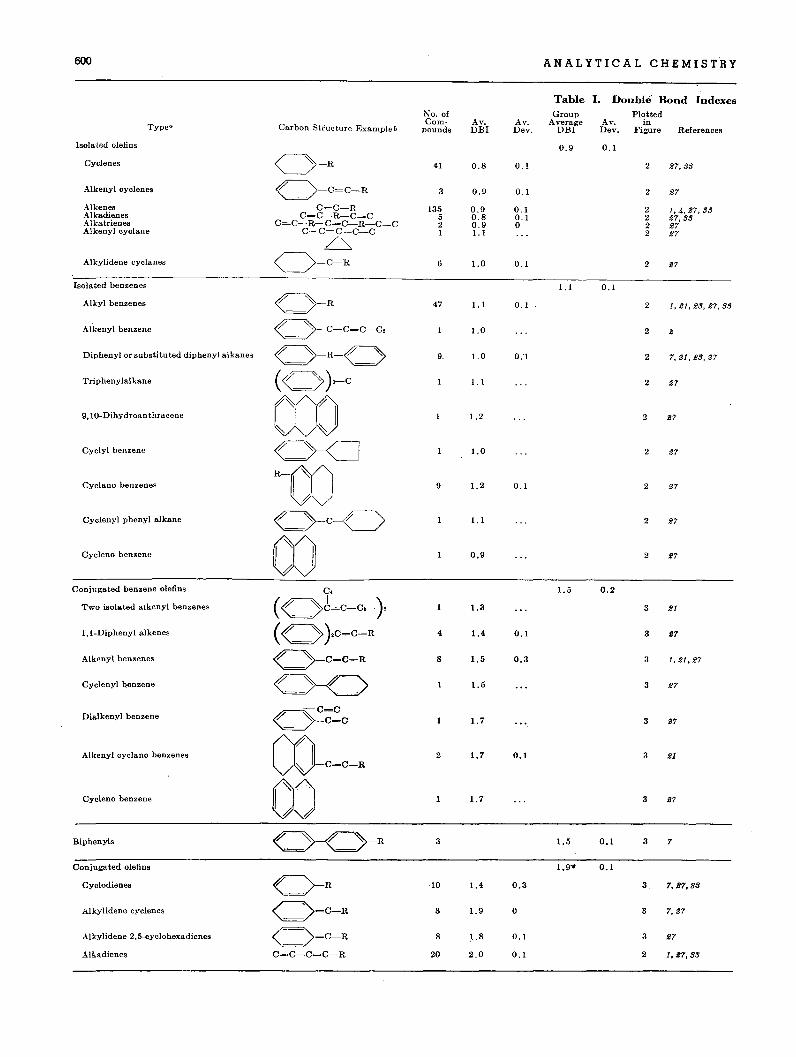
Table I. Double Bond IndexesNo. of Group Plotted
Carbon Structure Example bCom- Av. Av. Average Av. inTypea pounds DBI Dev. DBI Dev. Figure References
Isolated olefins 0.9 0.1
Cyclenes O-R 41 0.8 0.1 2 27,33
Alkenyl cyclenes O-C=C-R 3 0.9 0.1 2 27
Alkenes C=C-R 135 0.9 0.1 2 1,4,27,33Alkadienes C=C-R-C=C 5 0.8 0.1 2 27,33Alkatrienes C=C-R-C=C-R-C=C 2 0.9 0 2 27Alkenyl cyclane C-C=C-C-C I 1.1 2 27
/~
Alkylidene cyclanes O=C-R 6 1.0 0.1 2 27
Isolated benzenes 1.1 0.1
Alkyl benzenes « »-R 47 1.1 0.1 2 1,21,23,27,3.'
AI'kenyl benzene « )--C-C=C-C, 1.0 2 2
Diphenyl or substituted diphenyl alkanes « »-R-« » 9. 1.0 0.1 2 7,21,23,27
Triphenylalkane <<( »}-C 1.1 2 27
9,10-Dihydroanthracene coo 1.2 2 27
~ ~
Cyclyl benzene« )--CI 1.0 2 27
Cyclano benzenes R-OO 9 1.2 0.1 2 27
Cyclenyl phenyl alkane« »-C-C> 1.1 2 27
Cycleno benzene 00 0.9 2 27
Conjugated benzene olefins C. 1.5 0.2
Two isolated atkenyl benzenes ( « »J=c-c.-} 1.3 3 21
I,I-Diphenyl alkenes <<( )}C=C-R 4 1.4 0.1 3 17
Alkenyl benzenes « >--C=C-R 8 1.5 0.3 3 1,21.27
Cyclenyl benzene O-C> 1.5 3 27
-C=CDialkenyl benzene
« ~C=C 1.7 3 27
Alkenyl cyclano benzenes CO-C_C-R 2 1.7 0.1 3 21
CycLeno benzene OJ 1.7 3 27
Biphenyls 0-< )-R 3 1.5 0.1 3 7
Conjugated olefins 1.9'· 0.1
Cyclodienes «_ )-R 10 1.4 0.3 3 7,27..33
Alkylidene cyclenes (-=:>=C-R 3 1.9 0 3 7,27
Alkylidene 2,5-cyclohexadienes O=C-R 8 ~.8 0.1 3 27
Alkadienes C=C-C=C-R 20 2.0 0.1 2 1,27,33
VOL U M E 20, NO.7, J U L Y 1948
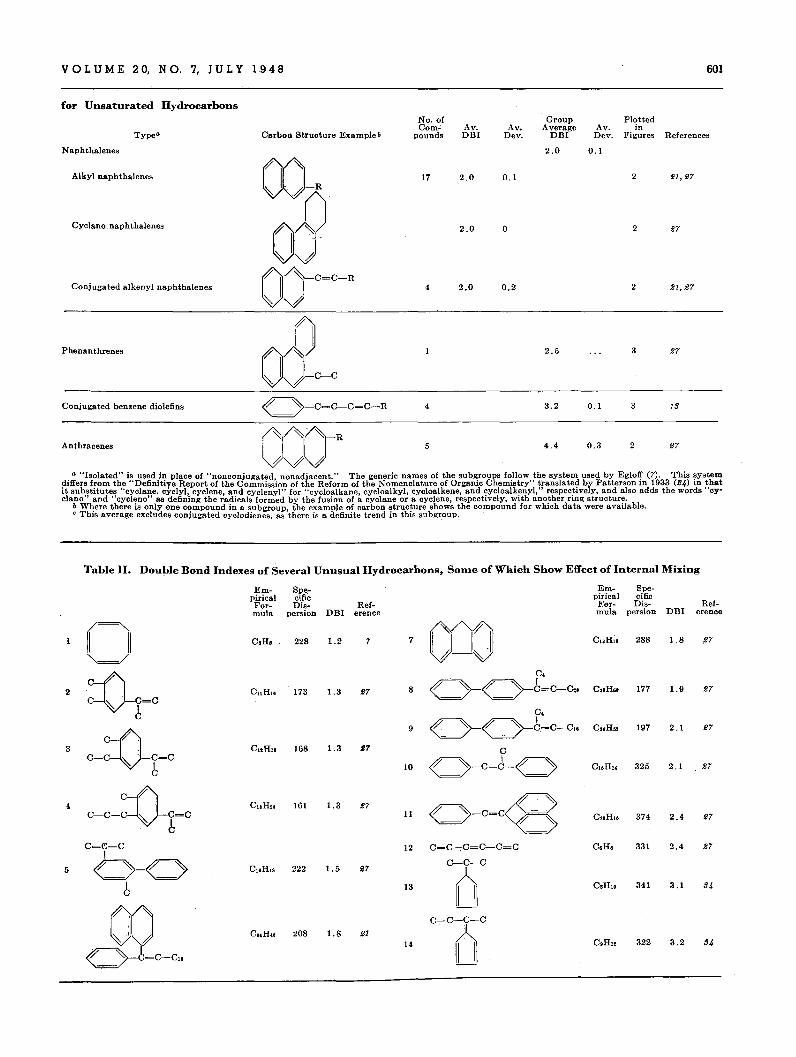
for Unsaturated Hydrocarbons
601
Type"
Naphthalenes
Carbon Structure Example b
No. ofCome
poundsAv.DB!
Av.Dev.
GroupAverage
DB!
2.0
PlottedAv. inDev. Figures References
0.1
Alkyl naphthalenes
Cyclano naphthalenes
Conjugated alkenyl naphthalenes
Phenanthrenes
Conjugated benzene diolefins
Anthracenes
o(X)-c~«.')-C=C-C=C-R
17
4
4
5
2.0
2.0
2.0
0.1
o
0.2
2.5
3.2
4.4
0.1
0.3
2
2
2
3
3
2
21,27
27
21,27
13
27
• "Isolated" is used in place of "nonconjugated nonadjacent." The generic names of the subgroups follow the system used by Egloff (7). This systemdiffers from the "Definitire Report of the Commiss'ion of the Reform of the Nomenclature of Organic Chemistry" translated by Patterson in 1933 (2,4) in thatit substitutes "cyclane. cyclyl, cyclene, and cyclenyl" for "cycloalkane, cycloalkyl, cycloalkene. and cycloalkenyl," respectively, and also adds the words IIcy_cIano" and "cycleno" as defining the radicals formed by the fusion of a cyclane or a cyclene, respectively, with another ring structure.
b Where there is only one compound in a subgroup, the example of carbon structure shows the compound for which data were available.c This average excludes conjugated cyclodienes, as there is a definite trend in this subg~oup. .
Table II. Double Bond Indexes of Several Unusual Hydrocarbons, Some of Which Show Effect of Internal Mixing
Em- Spe.- Em- Spe-piriesl cific piriesl eificFor- Dis- Ref- Fer- Dis- Ref-mula persian DB! erence mula persian DB! erence
(II C,H, 228 1.2 7 7 (jJJ CURIO 288 1.8 27
'" /
"=0c.
2 CUHII 173 1.3 S7 8 ( . ')-{ >-6=C-Cl' C..H.. 177 1.9 27
C ~ '-b=Cc.
9 { >-{ :>-6=c-clO C 34R62 197 2.1 27
"=03 CuRu 168 1.3 S7 CC-C ~ ·-b=C
10 ( ')-c~6-{ ') CURl4 325 2.1 27
4 c~~:VtC C UR20 161 1.3 re7 0O-C=C/ -11
- ~')C2oH16 374 2.4 27
c=e-c 12 C=C-,C=C-C=C C,H, 331 2.4 27I
{ >-( ') Cl6H18 222 1.5 27C-C-C
5
n\613 C,HlO 341 3.1 9,4
OJ C-C-C-C
C"H.. 208 1.8 21 n< )-6=C-C16
14 C,H" 322 3.2· 9,4
602 ANALYTICAL CHEMISTRY
13
\ '" \o.e..
•
12II107 , 8 3 9M+i7x 10
65
e•llK X
x •.to &0 •+ xl- •
m(SEE TABLE II
o CONJUGATED ALKYLIDENECYCLENES AND ALKYLIDENE
2,5 -CYCLOHEXADIENES
• CONJUGATED CYCLODIENES
X CONJUGATED BENZENE OLEFINS
A CONJUGATED BENZENE DIOLEFINSA A PHENANTHRENE
+ BIPHENYLS
70
90
100
80
lX)CII010I t;60'
ZaJQw!:1 alsow::>0..0ClIO
°LL40dOw·0.. 0
z30
Ico
i I1000 500
I200
i i150 100
MOLECuLAR WEIGHT
I60
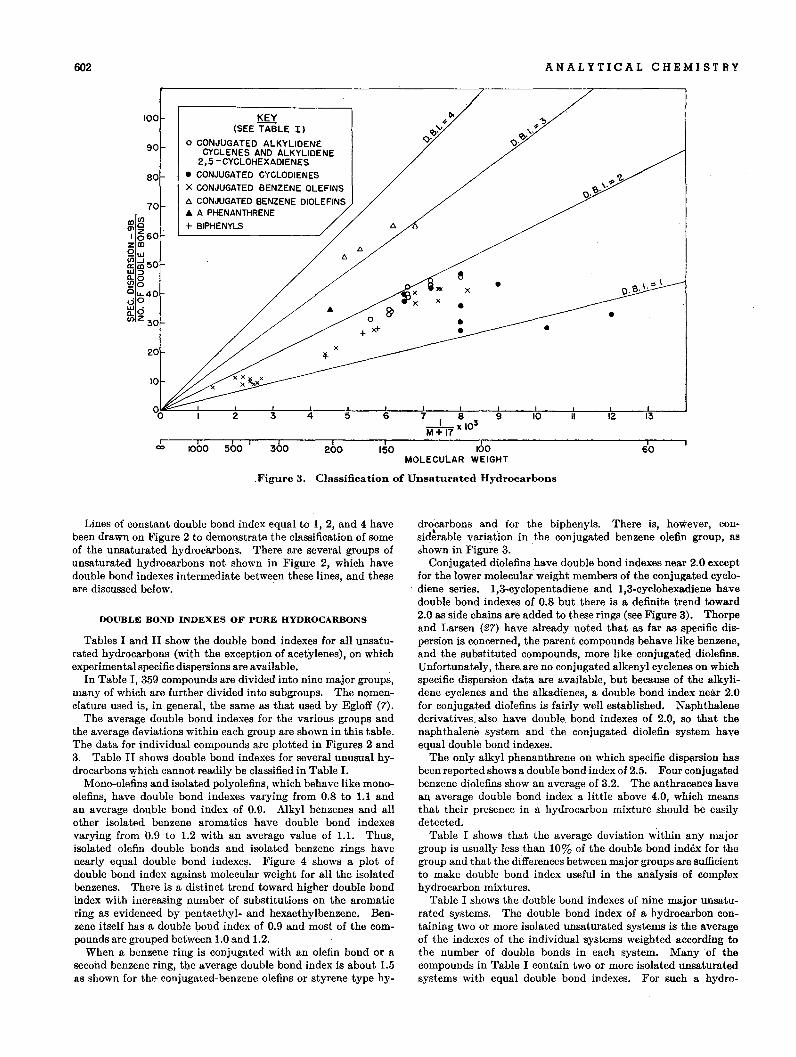
.Figure 3. Classification of Unsaturated Hydrocarbons
Lines of constant double bond index equal to I, 2, and 4 havebeen drawn on Figure 2 to demonstrate the classification of someof the unsaturated hydroc9.rbon~. There are several groups ofunsaturated hydrocarbons not shown in Figure 2, which havedouble bond indexes intermediate between these lines, and theseare discussed below.
DOUBLE BOND INDEXES OF PURE HYDROCARBONS
Tables I and II show the double bond indexes for all unsaturated hydrocarbons (with the exception of acetylenes), on whichexperimental specific dispersions are available.
In Table I, 359 compounds are divided into nine major groups,many of which are further divided into subgroups. The nomenclature used is, in general, the same as that used by Egloff (7).
The average double bond indexes for the various groups andthe average deviations within each group are shown in this table.The data for individual compounds are plotted in Figures 2 and3. Table II shows double bond indexes for several unusual hydrocarbons which cannot readily be classified in Table 1.
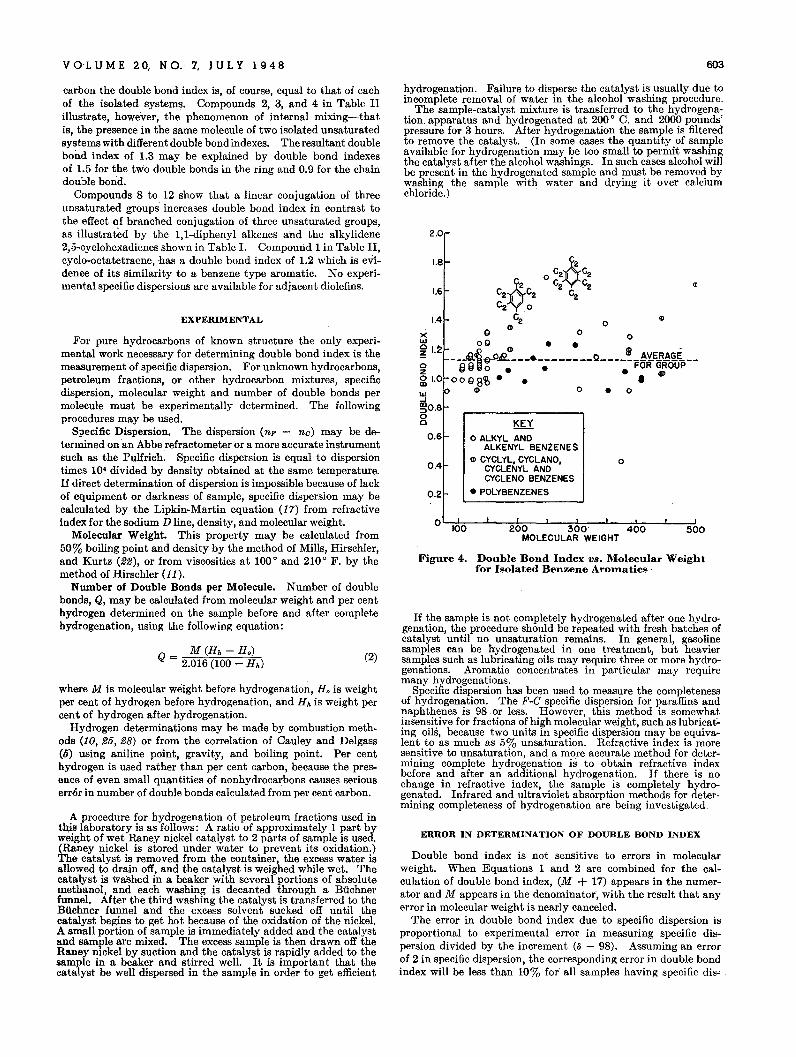
Mono-olelins and isolated polyolefins, which behave like mono@lefins, have double bond indexes varying from 0.8 to 1.1 andan average double bond index of 0.9. Alkyl benzenes and allother isolated benzene aromatics' have double bond indexesvarying from 0.9 to 1.2 with an average value of 1.1. Thus,isolated olefin double bonds and isolated benzene rings havenearly equal double bond indexes. Figure 4 shows a plot ofdouble bond index against molecular weight for all the isolatedbenzenes. There is a distinct trend toward higher double bondindex with increasing number of substitutions on the aromaticring as evidenced by pentaethyl- and hexaethylbenzene. Benzene itself has a double l;>ond index of 0.9 and most of the compounds are grouped between 1.0 and 1.2.
When a benzene ring is conjugated with an olefin bond or asecond benzene ring, tbe average double bond index is about 1.5as shown for the conjugated-benzene olefins or styrene type hy-
drocarbons and for the biphenyls. There is, however, consid~rable variation in the conjugated benzene olefin group, asshown in Figw-e 3. .
Conjugated diolefins have double bond indexes near 2.0 exceptfor the lower molecular weight members of the conjugated cyclodiene series. 1,3-cyclopentadiene and 1,3-cyclohexadiene havedouble bond indexes of 0.8 but there is a definite trend toward2.0 as side chains are added to these rings (see Figure 3). Thorpeand Larsen (27) have already noted that as far as specific dispersion is concerned, the parent compounds behave like benzene,and the substituted compounds, more like conjugated diolefins.Unfortunately, there. are no conjugated alkenyl cyclenes on whichspecific dispersion data are available, but because of the alkylidene cyclenes and the alkadienes, a double bond index near 2.0for conjugated diolefins is fairly well established. Naphthalenederivatives. also have double bond indexes of 2.0, so that thenaphthalene system and the conjugated diolefin system haveequal double bond indexes.
The only alkyl phenanthrene on which specific dispersion hasbeen reported shows a double bond index of 2.5. Four conjugatedbenzene diolefins show an average of 3.2. The anthracenes havean average double bond index a little above 4.0, which meansthat their presence in a hydrocarbon mixture should be easilydetected.
Table I shows that the average deviation within any majorgroup is usually less than 10% of the double bond index for thegroup and that the differences between major groups are sufficientto make double bond index useful in the analysis of complexhydrocarbon mixtures.
Table I shows the double bond indexes of nine major unsaturated systems. The double bond index of a hydrocarbon containing two or more isolated unsaturated systems is the averageof the indexes of the individual systems weighted according tothe number of double bonds in each system. Many of thecompounds in Table I contain two or more isolated unsaturatedsystems with equal double bond indexes. For such a hydro-
VOL U M E 20, N O. 7, J U L Y 1 9 4 8 603
EXPERIMENTAL
where M is molecular weight before hydrogenation, H o is weightper cent of hydrogen before hydrogenation, and H h is weight percent of hydrogen after hydrogenation.
Hydrogen deterrinations may be made by combustion methods (10, 25, 28) or from the correlation of Cauley and Delgass(5) using aniline point, gravity, and boiling point. Per centhydrogen is used rather than per cent carbon, because the presence of even small quantities of nonhydrocarbons causes seriouserror in number of double bonds calculated from per cent carbon.
A procedure for hydrogenation of petroleum fractions used int~is laboratory is as follows: A ratio of approximately 1 part byweight of wet Raney nickel catalyst to 2 parts of sample is used.(Raney nickel is stored under water to prevent its oxidation.)The catalyst is removed froni the container, the excess water isallowed to drain off, and the catalyst is weighed while wet. Thecatalyst is waShed in a beaker with several portions of absolutemethanol, and each washing is decanted through a Biichnerfunnel. After the third washing the catalyst is transferred to theBiichner funnel and the excess solvent sucked off until thecatalyst begins to get hot because of the oxidation of the nickel.A small portion of sample is immediately added and the catalystand sample are rixed. The excess sample is then drawn off theRaney nickel by suction and the catalyst is rapidly added to thesample in a beaker and stirred well. It is important that thecatalyst. be well dispersed in the sample in order to get efficient
500200 300' 400MOLECULAR WEIGHT
KEYo ALKYL AND
ALKENYL BENZENESCD CYCLYL. CYClANO, 0
CYCLENYl ANDCYClENO BENZENES
• POlYBENZENES
0.4
XLlJ
~ I.~
ozg 1.0
~~0.8oo
1.4
o 100
0.6
0.2
If the sample is not completely hydrogenated after one hydrogenation, the procedure should be repeated with fresh batches ofcatalyst until no unsaturation remains. In general, gasolinesaIP.ples can be hydrogenated in one treatment, but heaviersamples such as lubricating oils may require three or more hydrogenations. Aromatic concentrates in particular may requiremany hydrogenations.
Specific dispersion has been used to measure the cOIP.pletenessof hydrogenation. The F-C specific dispersion for paraffins andnaphthenes is 98.or less. However, this method is sOIP.ewhatinsensitive for fractions of high molecular weight, such as lubricating oils, because two units in specific dispersion IP.ay be equivalent to as much as 5% unsaturation. Refractive index is moresensitive to unsaturation, and a more accurate method for deterrining complete hydrogenation is to obtain refractive indexbefore and after an additional hydrogenation. If there is nochange in refractive index, the sample is completely hydrogenated. Infrared and ultraviolet absorption methods for determining completeness of hydrogenation are being investigated.
Figure 4. Double Bond Index VB. Molecular Weightfor Isolated Benzene Armnatics .
1.6
hydrogenation. Failure to disperse the catalyst is usually due toincomplete removal of water in the alcohol washing procedure.
The sample-catalyst rixture is transferred to the hydrogenation. apparatus and hydrogenated at 200 0 C. and 2000 pounds'pressure for 3 hours. After hydrogenation the sample is filteredto remove the catalyst. (In some cases the quantity of sampleavailable for hydrogenation may be too small to perrit washingthe catalyst after the alcohol washings. In such cases alcohol willbe present in the hydrogenated sample and must be removed bywashing the sample with water and drying it over calciumchloride.)
1.8
2.0
ERROR IN DETERMINATION OF DOUBLE BOND INDEX
Double bond index is not sensitive to errors in molecularweight. When Equations 1 and 2 are combined for the calculation of double bond index, (M + 17) appears in the numerator and M appears in the denominator, with the result that anyerror in molecular weight is nearly canceled.
The error in double bond index due to specific dispersion isproportional to experimental error in measuring specific dispersion divided by the increment (Il - 98). Assuming an errorof 2 in specific dispersion, the corresponding error in double bondindex will be less than 10% for all samples having specific dis"
(2)M (Hh - H o)
Q = 2.016 (100 - Hh)
carbon the double bond index is, of course, equal to that of eachof the isolated systems. Corp.pounds 2, 3, and 4 in Table IIillustrate, however, the phenorp.enon of internal rixing-thatis, the presence in the sarp.e rp.olecule of two isolated unsaturatedsystems with different double bond indexes. The resultant doublebond index of 1.3 rp.ay be explained by double bond indexesof 1.5 for the two double bonds in the ring and 0.9 for the chaindouble bond.
Corp.pounds 8 to 12 show that a linear conjugation of threeunsaturated groups increases double bond index in contrast tothe effect of branched conjugation of three unsaturated groups,as illustrated by the 1,1-diphenyl alkenes and the alkylidene2,5-cyclohexadienes shown in Table 1. Corp.pound 1 in Table II,cyclo-octatetraene, has a double bond index of 1.2 which is eVidence of its sirp.ilarity to a benzene type arorp.atic. No experirp.ental specific dispersions are available for adjacent diolefins.
For pure hydrocarbons of known structure the only experirp.ental work necessary for deterrp.ining double bond index is therp.easurerp.ent of specific dispersion. For unknown hydrocarbons,petroleuIP. fractions, or other hydrocarbon mixtures, specificdispersion, molecular weight and nUIP.ber of double bonds permolecule must be experiIP.entally determined. The followingprocedures may be used.
Specific Dispersion. The dispersion (np - no) may be determined on an Abbe refractometer or a more accurate instrumentsuch as the Pulfrich. Specific dispersion is equal to dispersiontimes 104 divided by density obtained at the same temperature.If direct determination of dispersion is impossible because of lackof equipment or darkness of sample, specific dispersion may becalculated by the Lipkin-Martin equation (17) from refractiveIndex for the sodium D line, density, and molecular weight.
Molecular Weight. This property may be calculated from50% boiling point and density by the method of Mills, Hirschler,and Kurtz (22), or from viscosities at 100 0 and 210 0 F. by themethod of Hirschler (11).
Number of Double Bonds per Molecule. Nurp.ber of doublebonds, Q, may be calculated froIP. molecular weight and per centhydrogen determined on the sample before and after completehydrogenation, using the following equation:
604 ANALYTICAL CHEMISTRY
0.4
q\ Ba \
3 \"'*'"w Q...J '0,::::>@ O.
,'q...J
0 \:::E \
~ \cr Q I-B-O~wa. 4 ~
(/),,
0 ,z ....,0 .... AlD ,Nw 5 0.2 ~...J '(0 "~AlD::::> I-D-B C*B C-III-0 ',A8 6 ~ ~o,
<l> A\p7 \~8 I-T-B e9 x10 0.1
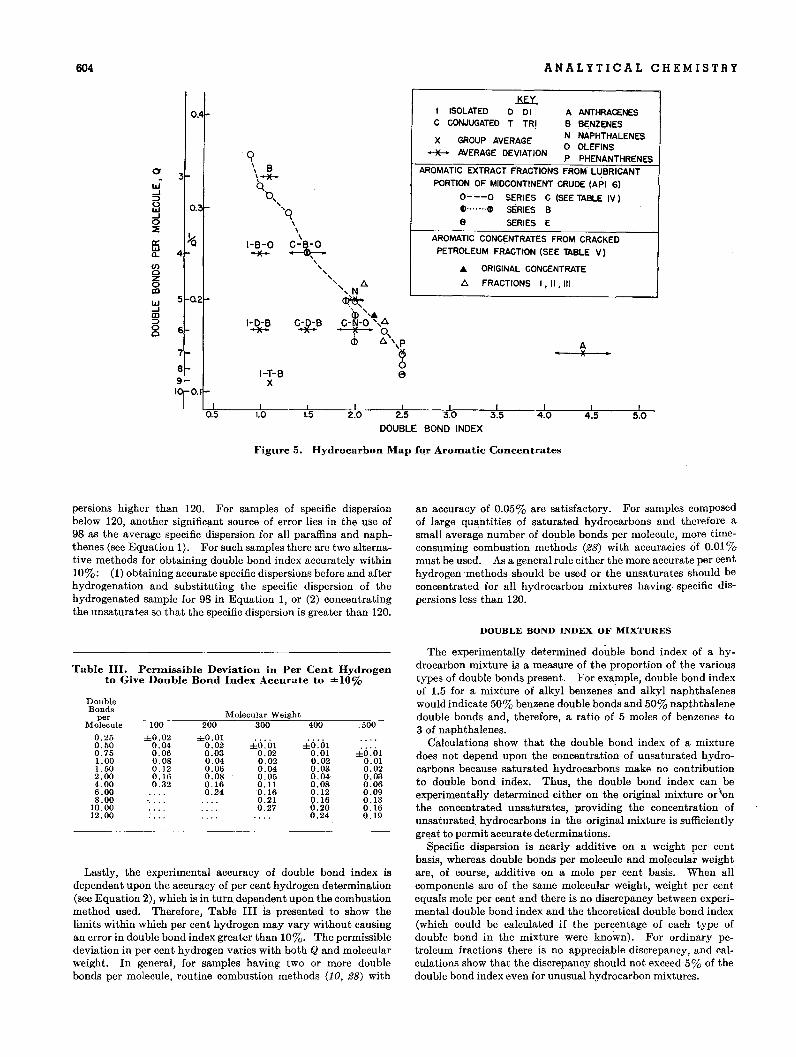
.KEY..I ISOLATED 0 01 A ANTHRACENESC CONJUGATED T TRI B BENZENES
X GROUP AVERAGE N NAPHTHALENES
~ AVERAGE DEVIATION0 OLEFINSP PHENANTHRENES
AROMATIC EXTRACT FRACTIONS FROM LUBRICANTPORTION OF MIDCONTINENT CRUDE (API 6)
0---0 SERIES C (SEE TABLE IV)1Il....... 1Il sERIES Be SERIES E
AROMATIC CONCENTRATES FROM CRACKEDPETROLEUM FRACTION (SEE TABLE V)
• ORIGINAL CONCENTRATE
A FRACTIONS 1,11.111
A)(
1.5 2.5 3.0 3.5
DOUBLE BOND INDEX4.0 4.5 5.0
Figure 5. Hydrocarbon Map for Aroll1atic Concentrates
persions higher than 120. For samples of specific dispersionbelow 120, another signific!J.nt source of error lies in the use of98 as the average specific dispersion for all paraffins and naphthenes (see Equation 1). For such samples there are two alternative methods for obtaining double bond index accurately within10%: (1) obtaining accurate specific dispersions before and afterhydrogenation and substituting the specific dispersion of thehydrogenated sample for 98 in Equation 1, or (2) concentratingthe unsaturates so that the specific dispersion is greater than 120.
Table III. Perll1issible Deviation in .Per Cent Hydrogento Give Double Bond Index Accurate to ± 10%
DoubleBonds
Molecular WeightperMolecule 100 200 300 400 .500
0.25 ±0.02 ±0.01±O:Ol ±O:Ol0.50 0.04 0.02
±O:Ol0.75 0.06 0.03 0.02 0.011.00 0.08 0.04 0.02 0.02 0.011.50 0.12 0.06 0.04 0.03 0.022.00 0.16 0.08 0.05 0.04 0.004.00 0.32 0.16 0.11 0.08 0.066.00 0.24 0.16 0.12 0.098.00 0.21 0.16 0.13
10.00 0.27 0.20 0.1612.00 0.24 0.19
Lastly, the experimental accuracy of double bond index isdependent upon the accuracy of per cent hydrogen determination(see Equation 2), which is in turn dependent upon the combustionmethod used. Therefore, Table III is presented to show thelimits within which per cent hydrogen may vary without causingan error in double bond index greater than 10%. The permissibledeviation in per cent hydrogen varies with both Q and molecularweight. In general, for samples having two or more doublebonds per molecule. routine combustion methods (10, 28) with
an accuracy of 0.05% are satisfactory. For samples composedof large quantities of saturated hydrocarbons and therefore asmall average number of double bonds per molecule, more timeconsuming combustion methods (28) with accuracies of 0.01 %must be used. As a general rule either the more accurate per centhydrogen methods should be used or the unsaturates should beconcentrated for all hydrocarbon mixtures having. specific dispersions less than 120.
DOUBLE BOND INDEX OF MIXTURES
The experimentally determined doirble bond index of a hydrocarbon mixture is a measure of the proportion of the varioustypes of double bonds present. For example, double bond indexof 1.5 for a mixture of alkyl benzenes' and alkyl naphthaleneswould indicate 50% benzene double bonds and 50% napththalenedouble bonds and, therefore, a ratio of 5 moles of benzenes to3 of naphthalenes.
Calculations show that the double bond index of a mixturedoes not depend upon the concentration of unsaturated hydrocarbons because saturated hydrocarbons make no contributionto double bond index. Thus, the double bond index can beexperimentally determined either on the original mixture or\mthe concentrated unsaturates, providing the concentration ofunsaturated. hydrocarbons in the original mixture is sufficientlygfl'lat to permit accurate determinations.
Specific dispersion is nearly additive on a weight per centbasis, whereas double bonds per molecule and molecular weightare, of course, additive on a mole per cent. basis. When allcomponents are of the same molecular weight, weight per centequals mole per cent and there is no discrepancy between experimental double bond index and the theoretical double bond index(which could be calculated if the percentage of each type ofdouble bond in the mixture were known). For ordinary petroleum fractions there is no appreciable discrepancy, and calculations show that the discrepancy should not exceed 5% of thedouble bond index even for unusual hydrocarbon mixtures.
VOL U M E 20, N O. 7, J U L Y 1 948 605
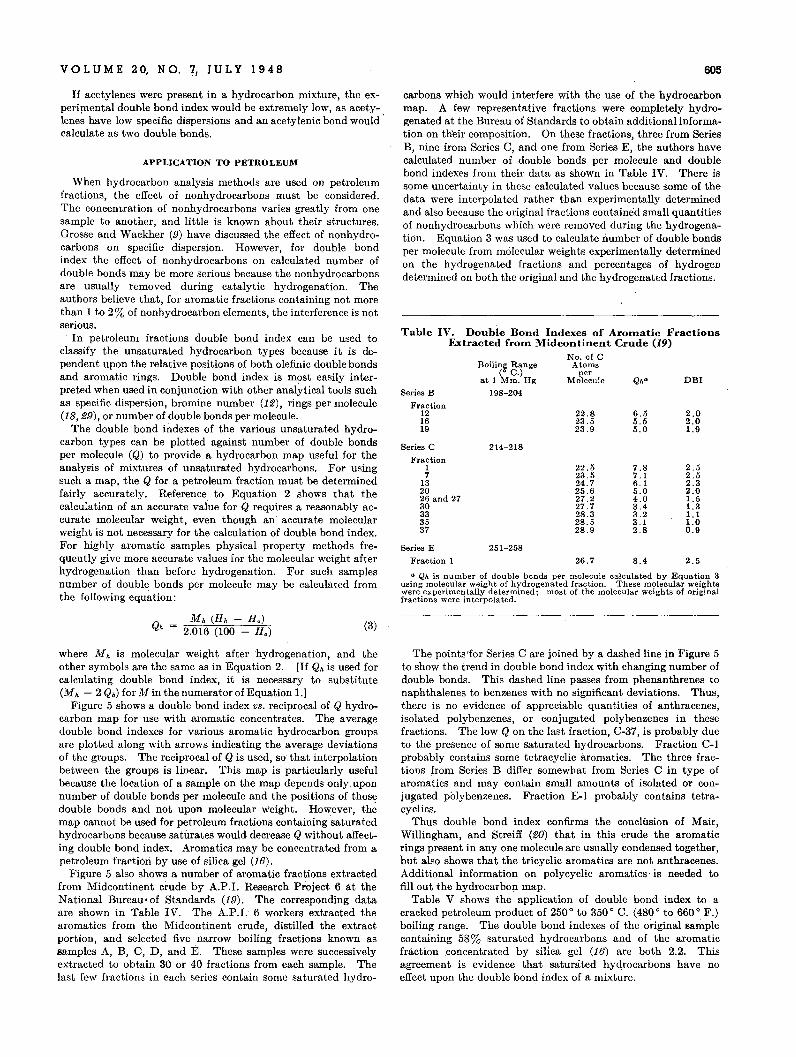
" Qh is number of double bends per molecule calculated by Equation 3using molecular weight of hydrogenated fraction. These molecular weightswere experimentally determined; most of the molecular weights of originalfractions were interpolated.
22.8 6.5 2.023.5 5.5 2.023.9 5.0 1.9
22.5 7.8 2.523.5 7.1 2.524.7 6.1 2.325.6 5.0 2.027.2 4.0 1.527.7 3.4 1.328.3 3.2 1.128.5 3.1 1.028.9 2.8 0.9
26.7 8.4 2.5
214-218
251-258Series E
Fraction 1
Series C
Fraction17
132026 and 2730333537
carbons which would interfere with the use of the hydrocarbonmap. A few representative fractions were completely hydrogenated at the Bureau of Standards to obtain additional information on their composition. On these fractions, three from SeriesB, nine from Series 0, and one from Series E, the authors havecalculated number of double bonds per molecule and doublebond indexes from their data as shown in Table IV. There issome uncertainty in these calculated values because some of thedata were interpolated rather than experimentally determinedand also because the original fractions contained small quantitiesof nonhydrocarbons which were removed during the hydrogenation. Equation 3 was used to calculate number of double bondsper molecule from molecular weights experimentally determinedon the hydrogenated fractions ap.d percentages of hydrogendetermined on both the original and the hydrogenated fractions.
Table IV. Double Bond Indexes of ArOinatic FractionsExtracted from Midcontinent Crude (19)
No. of CBoiling Range Atoms
(0 C.) perat 1 Mm. Hg Molecule Qh" DBI
Series B 198-204
Fraction121619
APPLICATION TO PETROLEUM
When hydrocarbon analysis methods are used on petroleumfractions, the effect of nonhydrocarbons must be considered.The concentration of nonhydrocarbons varies greatly from onesample to another, and little is known about their structures.Grosse and Wackher (9) have discussed the effect of nonhydrocarbons on specific' dispersion. However, for double bondindex the effect of nonhydrocarbons on calculated number ofdouble bonds may be more serious because the nonhydrocarbonsare usually removed during catalytic hydrogenation. Theauthors believe that, for aromatic fractions· containing not morethan 1 to 2% of nonhydrocarbon elements, the interference is notserious.
In petroleum fractions double bond index can be used toclassify the unsaturated hydrocarbon types because it is dependent upon the relative positions of both olefinic double bondsand aromatic rings. Double bond index is most easily interpreted when used in conjunction with other analytical tools suchas specific dispersion, bromine number (12), rings per molecule(18,29), or number of double bonds per molecule.
The double bond indexes of the various unsaturated hydrocarbon types can be plotted against number of double bondsper molecule (Q) to provide a hydrocarbon map useful for theanalysis of mixtures of unsaturated hydrocarbons. For usingsuch a map, the Q for a petroleum fraction must be determinedfairly accurately. Reference to Equation 2 shows that thecalculation of an accurate value for Q requires a reasonably accurate molecular weight, even though an accurate molecularweight is not necessary for the calculation of double bond index.For highly aromatic samples physical property methods frequently give more accurate values for the molecular weight afterhydrogenation than before hydrogenation. F.or such samplesnumber of double bonds per molecule may be calculated fromthe following equ~tion:
If acetylenes were present in a hydrocarbon mixture, the experiplental double bond index would be extremely low, as acetylenes have low specific dispersions and an acetylenic bond wouldcalculate as two double bonds.
Aih (Hh - HolQh = 2.016 (100 - Ho )
(3)
where M h is molecular weight after hydrogenation, and theother symbols are the same as in Equation 2. [If Qh is used forcalculating double bond index, it is necessary to substitute(Mh - 2 Qh) for M in the numerator of Equation 1.]
Figure 5 shows a double bond index vs. reciprocal of Q hydrocarbon map for use with aromatic concentrates. The averagedouble bond indexes for various aromatic hydrocarbon groupsare plotted along with arrows indicating the average deviationsof the groups. The reciprocal of Q is used, so that interpolationbetween the groups is linear. This map is particularly usefulbecause the location of a sample on the map depends only. uponnumber of double bonds per molecule and the positions of thosedouble bonds and not upon molecular weight. However, themap cannot be used for petroleum fractions containing saturatedhydrocarbons because saturates would decrease Q without affecting double bond index. Aromatics may be concentrated from apetroleum fraction by use of silica gel (16).
Figure 5 also shows a number of aromatic fractions extractedfrom Midcontinent crude by A.P.I. Research Project 6 at theNational Bureau· of Standards (19). The corresponding dataare shown in Table IV. The A.P.I. 6 workers extracted thearomatics from the Midcontinent crude, distilled the extractportion, and selected five narrow boiling fractions known assamples A, B, 0, D, and E. These samples were successivelyextracted to obtain 30 or 40 fractions from each sample. Thelast few fractions in each series contain some saturated hydro-
The points 'for Series 0 are joined by a dashed line in Figure 5to show the trend in double bond index with changing number ofdouble bonds. This dashed line passes from phenanthrenes tonaphthalenes to benzenes with no significant deviations. Thus,there is no evidence of appreciable quantities of anthracenes,isolated polybenzenes, or conjugated polybenzenes in thesefractions. The low Q on the last fraction, 0-37, is probably dueto the presence of some saturated hydrocarbons. Fraction 0-1probably contains some tetracyclic aromatics. The three fractions from Series B differ somewhat from Series 0 in type ofaromatics and may contain small amounts of isolated or conjugated polybenzenes. Fraction E-1 probably contains tetracYclics.
Thus double bond index confirms the concliIsion of Mail',Willingham, and Streiff (20) that in this crude the aromaticrings present in anyone molecule are usually condensed together,but also shows that the tricyclic aromatics are not anthracenes.Additional information on polycyclic aromatics' is needed tofill out the hydrocarbon map.
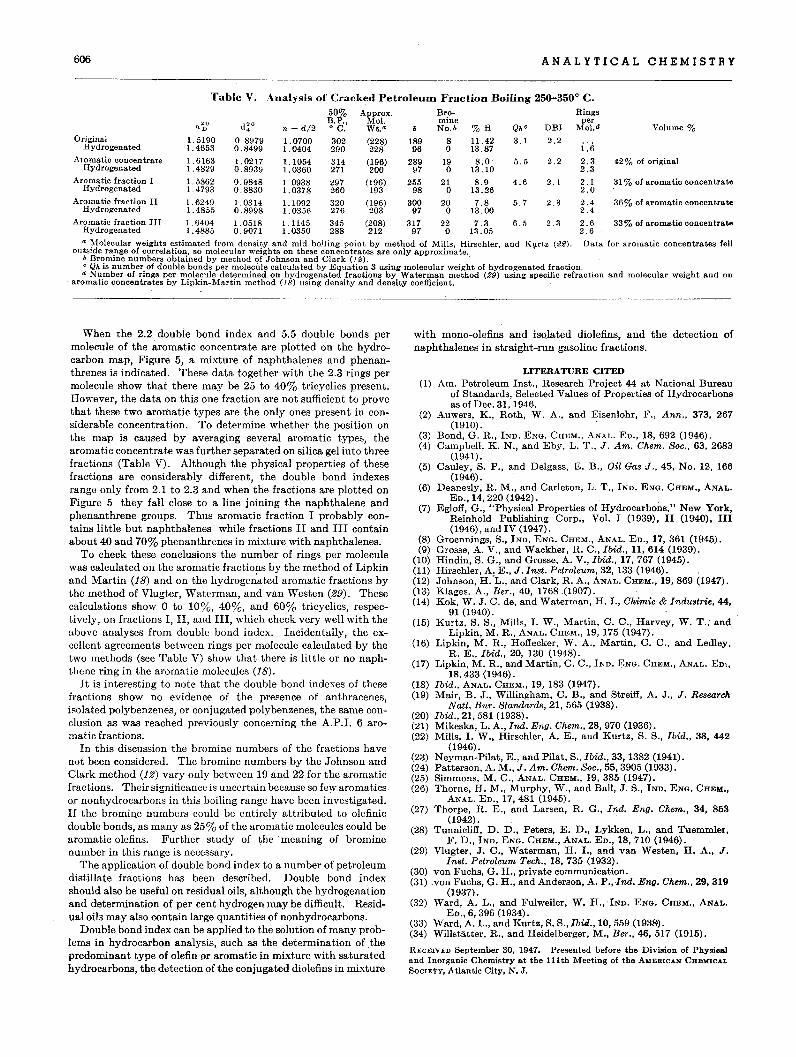
Table V shows the application of double bond index to acracked petroleum product of 250° to 350°0. (480° to 660° F.)boiling range. The double bond indexes of the original samplecontaining 58% saturated hydrocarbons and of the aromaticfraction concentrated by silica gel (16) are both 2.2. Thisagreement is evidence that satunited hydrocarbons have noeffect upon the double bond index of a mixture.
606 ANALYTICAL CHEMISTRY
Table V. Analysis of Cracked Petroleum Fraction Boiling 256-350 0 C.50% Approx. Bro- Rings
~o B,P'1 Mol. mine per"D d~o n - d/2 0C. Wt.a " No.b % H Qh c DBI Mol.d Volume %
Original 1.5190 0.8979 1.0700 302 (228) 189 8 11.42 3.1 2.2Hydrogenated 1. 4653 0.8499 1. 0404 290 228 96 0 13.87 i: (;
Aromatic concentrate 1.6163 1.0217 1.1054 314 (196) 289 19 8.0 5.5 2.2 2.3 42% of originalHydrogenated 1. 4829 0.8939 1. 0360 271 200 97 0 13.10 2.3
Aromatic fraction I 1.5862 0.9848 1 0938 297 (196) 255 21 8.9 4.6 2.1 2.1 31% of aromatic concentrateHydrogenated 1.4793 0.8830 1.0378 260 193 98 0 13.26 2.0
Aromatic fraction II 1. 6249 1. 0314 1.1092 320 (196) 300 20 7.8 5.7 2.3 2.4 36% of aromatic concentrateHydrogenated 1.4855 0.8998 1.0356 276 203 97 0 13.00 2.4
Aromatic fraction III 1.64041.05181.1145345 (208) 31722 7.3 6.52.32.6 33% of aromatic concentrateHydrogenated 1.4885 0.9071 1.0350 288 212 97 0 13.05 2.6
a .\lolecular weights estimated from density and mid boning point by method of Mills, Hirschler, and KVrtz (22). Data for aromatic concentrates felloutside range of correlation, so molecular weights on these concentrates are only approximate.
b Bromine numbers obtained by method of Johnson and Clark (12). .C Qh is number of double bonds per molecule calculated by Equation 3 using molecular weight of hydrogenated fraction.d Number of rings per molecule determined on hydrogenated fractions by Waterman method (29) using specific refraction and molecular weight and on
aromatic concentrates by Lipkin-Martin method (18) using density and density coefficient.
When the 2.2 double bond index and 5.5 double bonds permolecule of the aromatic concentrate are plotted on the hydrocarbon map, Figure 5, a mixture of naphthalenes and phenanthrenes is indicated. These data together with the 2.3 rings permolecule show that there may be 25 to 40% tricyclics present.However, the data on this one fraction are not sufficient to prC)vethat these two aromatic types are the only ones present in considerable concentration. To determine whether the position onthe map is caused by averaging several aromatic types, thearomatic concentrate was further separated on silica gel into threefractions (Table V). Although the physical properties of thesefractions are considerably different, the double bond indexesrange only from 2.1 to 2.3 and when the fractions are plotted onFigure 5 they fall close to a line joining the naphthalene andphenanthrene groups. Thus aromatic fraction I probably contains little but naphthalenes while fractions II and III containabout 40 and 70% phenanthrenes in mixture with naphthalenes,
To check these conclusions the number of rings per moleculewas calculated on the aromatic fractions by the method of Lipkinand Martin (18) and on the hydrogen:atedaromatic fractions bythe method of Vlugter, Waterman, and van Westen (29). Thesecalculations show 0 to 10%, 40%, and 60% tricyclics, respectively, on fractions I, II, and III, which check very well with theabove analyses from double bond index. Incidentally, the excellent agreements between rings per molecule calculated by thetwo methods (see Table V) show that there is little or no naphthene ring in the aromatic molecules (18).
It is interesting to note that the double bond indexes of thesefractions show no evidence of the presence of anthracenes,isolated polybenzenes, or conjugated polybenzenes, the same conclusion as was reached previously concerning the A.P.I. 6 aromatic fractions.
In this discussion the bromine numbers of the fractions havenot been considered. The bromine numbers by the Johnson andClark method (12) vary only between 19 and 22 for the aromaticfractions. Their significancc is uncertain because so few aromaticsor nonhydrocarbons in this boiling range have been investigated.If the bromil"\e numbers could be entirely attributed to olefinicdouble bonds, as many as 25% of the aromatic molecules could bearomatic olefins. Further study of the meaning of brominenumber in this range is necessary.
The application of double bond index to a number of petroleumdistillate fractions has been described. Double bond indexshould also be useful on residual oils, although the hydrogenationand determination of per cent hydrogen may be difficult. Residual oils may also contain large quantities of nonhydrocarbons.
Double bond index can be applied to the solution of many problems in hydrocarbon analysis, such as the determination of thepredominant type of olefin pr aromatic in mixture with saturatedhydrocarbons, the detection of the conjugated diolefins in mixture
with mono-olefins and iSQlated diolefins, and the detection ofnaphthalenes in straight-run gasoline fractions.
LITERATURE CITED
(1) Am. Petroleum Inst., Research Project 44 at National Bureauof Standards, Selected Values of Properties of Hydrocarbonsas of Dec. 31,1946.
(2) Auwers, K., Roth, W. A., and Eisenlohr, F., Ann., 373, 267(1910).
(3) Bond, G. R., IND. ENG. CHEM., A.NAL. ED., 18, 692 (1946).(4) Campbell, K. N., and Eby, L. T., J. Am. Chem. Soc., 63, 2683
(1941) ,(5) Cauley, S. P., and Delgass, E. B., Oil Gas J., 45, No. 12, 166
(1946).(6) Deanesly, R. M., and Carleton, L. T" IND. ENG. CHEM., ANAL.
ED., 14,220 (1942),(7) Egloff, G., "Physical Properties of Hydrocarbons," New York,
Reinhold Publishing Corp., Vol. I (1939), II (1940), III(1946), and IV (1947).
(8) Groennings, S., IND, ENG. CHEM., ANAL. ED., 17, 361 (1945).(9) Grosse, A. V., and Wackher, R. C., Ibid., 11, 614 (1939).
(10) Hindin, S. G., and Grosse, A. V., Ibid., 17,767 (1945).(ll) Hirschler, A. E., J. Inst. Petroleum, 32, 133 (1946).(12) Johnson, H:L., and Clark, R. A., ANAL. CHEM., 19,869 (1947).(13) Klages, A., Ber., 40, 1768(1907).(14) Kok, W. J. C. de, and Waterman, H. I., Chimie & Industrie, 44,
91 (1940).(15) Kurtz, S. S., Mills, 1. W., Martin, C. C., Harvey, W. T., and
Lipkin, M. R., ANAL. CHEM., 19, 175 (1947).(16) Lipkin, M. R., Hoffecker, W. A., Martin, C. C., and Ledley,
R. E., Ibid., 20, 130 (1948).(17) Lipkin, M. R., and Martin, C. C., IND. ENG. CHEM., ANAL. ED',
18,433 (1946).(18) Ibid., ANAL. CHEM., 19, 183 (1947),(19) Mair, B. J., Willingham, C, B., and Streiff, A. J., J. Research
Natl. Bur. Standards, 21, 565 (1938),(20) Ibid., 21, 581 (1938).(21) Mikeska,L. A" Ind. Eng. Chem., 28, 970 (1936).(22) Mills, 1. W., Hirschler, A. E., and Kurtz, S. S., Ibid" 38, 442
(1946).(23) Neyman-Pilat, E., and Pilat, S., Ibid., 33,1382 (1941).(24) Patterson, A. M., J. Am. Chem. Soc., 55, 3905 (1933).(25) Simmons, M, C., ANAL. CHEM" 19, 385 (1947).(26) Thorne, H. M., Murphy, W., and Ball, J. S., IND, ENG. CHEM.,
ANAL. ED., 17,481 (1945).(27) Thorpe, R. E., and Larsen, R. G., Ind. Eng. Chem., 34, 853
(1942).(28) Tunnicliff, D. D., Peters, E. D., Lykken, L., and Tuemmler,
F. D., IND, ENG. CHEM., ANAL, ED., 18,710 (1946).(29) Vlugter, J. C., Waterman, H, I., and van Westen, H. A., J.
Inst. Petroleum Tech" 18,735 (1932).(30) von Fuchs, G. H., private communication.(31) .von Fuchs, G. H., and Anderson, A. P.,Ind. Eng. Chem., 29, 319
(1937).(32) Ward, A. L., and Fulweiler, W. H.,·IND. ENG. CHEM., ANAL.
ED., 6, 396 (1934).(33) Ward, A. L., and Kurtz, S. S., Ibid., 10, 559 (1938).(34) Willstatter, R., and Heidelberger, M., Ber., 46, 517 (1915).
RECEIVED September 30, 1947. Presented before the Division of Physicaland Inorgariic ·Chemistry at the l1lth Meeting of the AMERICAN CHEMICALSOCIETY, Atlantic City, N. J.
Quantitative Analysis with the X-Ray. SpectrometerAccuracy and Reproducibility
HAROLD P. KLUG, LEROY ALEXANDER, AND ELIZABETH KUMMEHDepartment of Research in Chemicai Physics, Mellon Institute, Pittsburgh 13, Pa.
Preliminary performance tests are reported for the Norelco Geiger-counter x-rayspectroIl:leter with respect to reproducibility of measurements and accuracy inquantitative analysis of powder mixtures. Specimen preparation is discussed,and the necessity for avoiding large crystallites in the powder is indicated. Thereproducibility with the automatic recorder appears not to be good enough forprecise quantitative work. J\ilanual counting in a single scanning usually permits the determination of quartz, in mixtures containing more than 100/"quartz, with an average accuracy of about ±5% of the absolute amount present.Higher accuracy can be attained by several scannings.
B ECAUSE the x-ray powder diffraction pattern is a characteristic physical property of a crystalline compound, it lends
itself readily to the analytical problem of identification of the substance, both as the pure compound and as a component of a .powdel' mixture. Although this useful application of diffraction patterns was recognized by early workers (.4), it was not until thelatter half of the 1930's that suitable methods for its routineapplication were worked out. Clark and Reynolds (1) in 1936developed a method for quantitative analysis of mine dusts forquartz that utilized the x-ray powder patterns. Then, in 1938,qualitative identification by diffraction methods was put on aroutine basis by Hanawalt, Rinn, and Frevel (3).
The advent of the Norelco Geiger-counter x-ray spectrometer(iI) appeared to offer new possibilities for the analysis of powdermixtures. In addition to speedy qualitative identification procedures, it makes possible intensity measurements of high accuracy, which are so necessary in quantitative studies.
This laboratory has been interested recently in the whole problem of precise quantitative analysis with the spectrometer, and.has adapted to the recording spectrometer the internal standardtechnique of Clark and Reynolds (1) for quartz determination inindustrial dusts. Details and procedures have been reported (5).The fundamental problem of the precise quantitative analysis ofpowder mixtures in general is not a simple one. This communication reports preliminary results on reproducibility and accuracy for measurements made with the Norelco spectrometer.Many of the stiidies have been made on quartz because of the laboratory's special interest in dust analysis.
Early investigations had to do with' the reproducibility ofmeasurements' made on the instrument. A so-called standardsample of quartz (designated as NAP) was supplied with the instrument. It was soon found that the instrument reproduced theangular positions of the diffraction lines of the quartz patternwith good accuracy, but that intensity reproducibility was poor.If the standard sample of quartz was moved 1 mm. or so on thesample holder, the intensity of its strongest line at 3.33 A. mightdiffer by 20% from the' previous value, all other factors beingheld constant. Other quartz samples were available, and theywere found to give intensity values differing among themselvesand from that of the standard sample. Under constant instrumental conditions, of course, any pure compound should show thesame intensity for a given line of its pattern regardless of thesource of the compound. The above observations initiated thebi.vestigation of several compounds for constancy of line intensity,reproducibility of specimen preparation, and instrument stability.
SPECIMEN PREPARATION
An important part of the problem of reproducibility has to dowith specimen preparation. The observations with the standard
quartz sample obviously point to nonuniformity of the specimen.It was early realized that specimens flowed on a micr03cope slide,with the aid of a trace of binding agent, could not be used forserious work, as they are almost invariably too thin for optimumdiffraction intensities, and successive specimens are not of uniformthickness. In the present studies all specimens were mounted bypressing the powder gently into the cavity of an ordinary microscope drop slide (cavity depth 0.8' mm.) by means of a planeglass plate. This sufficed for all measurements except certainhigh-angle measurements on quartz, where it was necessary touse a drop slide with cavity depth of 1.75 mm. in order to have asample with effectively infinite thickness.
.!\.nother important factor affecting reproducibility is the statistical distr~butionof crystallite sizes in the specimen. Theoreticaland experimental stUdies, to be reported elsewhere, have indicated that a maximum crystallite size of less than 5 microns isneeded for good reproducibility in the case of quartz and presumably for most mineral silicates as well. In fact, it appears thatmany difficulties in specimen preparation previously attributed topreferred orientation effects are actually the result of the presenceof too large crystallites in the material. If the mateTial is not fineenough to yieid measurements of good accuracy, it must beground to the proper fineness by ball milling or other means. Itis not claimed that the method of mounting described abovedoes not lead to some orientation effects, but merely that it leadsto reproducible specimens of a given material.
INSTRUMENT STABILITY AND STANDARDIZATION
After considerable work had been done it became obvious thatit was necessary to standardize the spectrometer from day to dayin order to get comparable results. The instrument exhibited adrift (variable from day to day) such that a truly standard samplewould give a different intensity value from day to day, alt.l}oughmeasurements of the sample taken in any single day showed excellent constancy. This standardization can be done by adjusting slightly the slit-height wedge, so that the intensity of a selected line of the standard has the same value from day to day.Rather than readjust the instrument each day,. a simpler .procedure is to measure the intensity of the standardizing substance andcalculate a factor for use on subsequent measurements; Threemeasurements made at, say, the beginning, middle, and end ofthe day, suffice for calculation of the factor to be used on allmeasurements during that day.
The present studies have been made' without any elaboratechanges in the instrument. It was received with a damping andamplitude control for the signa] to the recorder 'consisting of aDaven attenuator (terminal impedance 500/500) with five 1000ohm steps of resistance in series. Thifl was replaced about February 1, 1947, with a control designed after the one used at thelaboratories of the American Cyanamid Company, Stamford,
607
608 ANALYTICAL CHEMISTRY
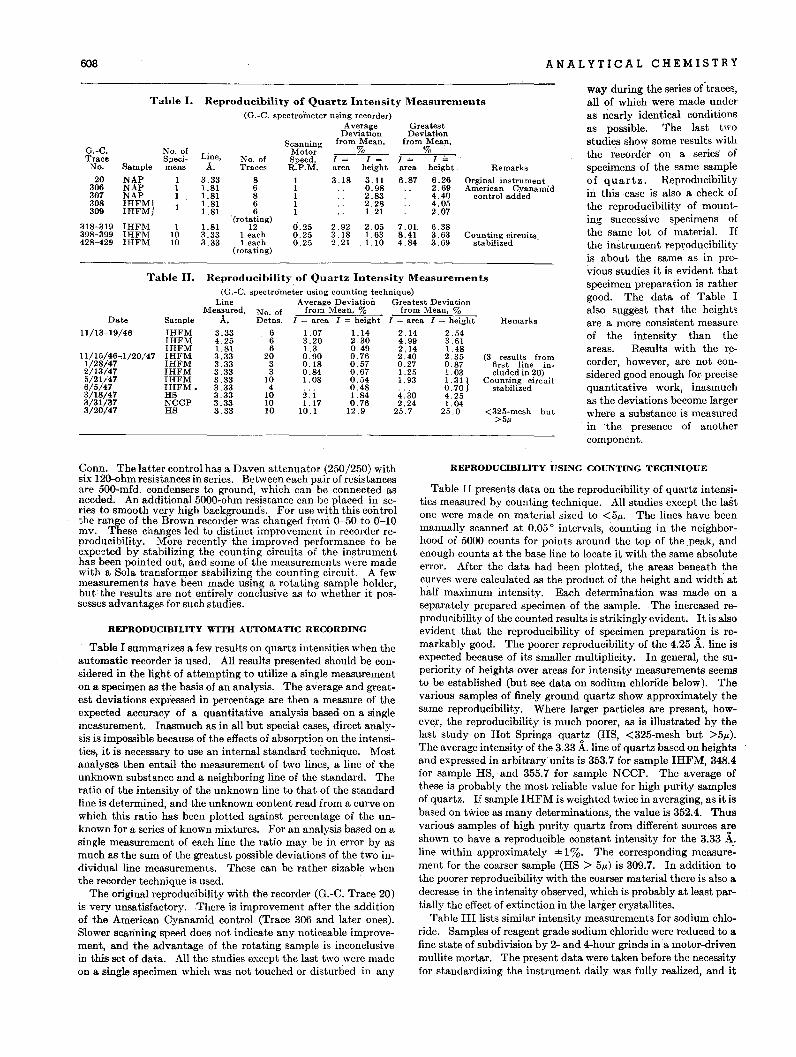
way during the series o(traces,all of which were made underas nearly identical conditionsas possible. The last twostudies show some results withthe recorder on a series' ofspecimens of the same sampleof quartz. ReproducibilityiIi this case is also a check ofthe reproducibility of mounting successive specimens ofthe same lot of material. Ifthe instrument rep~oducibility
is about the same as in previous studies it is evident thatspecimen preparation is rathergood. The data of Table Ialso suggest that the heightsare a more consistent measureof the intensity than theareas. Results with the recorder, however, are not considered good enough for precisequantitative work, inasmuchas the deviations become largerwhere a substance is measuredin the presence of anothercomponent.
Remarks
<325-mesh but>5"
(3 results fromfirst line included in 20)
Counting circuitstabilized
Remarks
Orginal instrumentAmerican Cyanamid
control added
Counting circuitsstabilized .
6.383.633.69
I ,;,height,
6.262.694.404.052.07
GreatestDeviation
from Mean,%
7.018.414.84
2.051.631.10
1= 1=area height area
3.18 3.11 6.870.982.832.281. 21
1-
2.923.182.21
0.250.250.25
ScanningMotorSpeed,R.P.M.
11111
No. ofTraces
86866
'(rotating)12
1 each1 each
(rotating)
Reproducibilityof Quartz Intensity Measurements(G.-C. spectrometer using counting technique)
Average Deviation Greatest Deviationfrom Mean, % from Mean, %
I - area I - height I = area I = height
1.07 1.14 2.14 2.543.20 2.30 4.99 3.611.3 0.49 2.14 1.480.90 0.76 2:40 2.350.18 0.57 0.27 0.870.84 0.67 1.25 1.031.08 0.54 1.93 1.311
0.48 0.,702.1 1.84 4.30 4.251.17 0.76 2.24 1.04
10.1 12.9 25.7 25.0
Reproducibility of Quartz Intensity Measurements(G.-C. spectrometer using recorder)
AverageDeviation
from Mean,%
Line,A.
3.331.811.811.811.81
1.813.333.33
11010
No. ofSpecimens
Table II.
Table I.
Sample
NAPNAPNAPIHFM}IHFM
IHFMIHFMIHFM
LineMeasured, No. of
Date Sample A. Detns.
11/13-19/46 IHFM 3.33 6IHFM 4.25 6IHFM 1.81 6
11/15/46-.1/20/47 IHFM 3.33 201/28/47 IHFM 3.33 32/13/47 IHFM 3.33 35/21/47 IHFM 3.33 106/5/47 IHFM. 3.33 43/18/47 HS 3.33 103/31/37 NCCP 3.33 103/20/47 HS 3.33 10
G.-C.Trace
:'<0.
20306367308309
318-319398-399428-429
qonn. The latter control has a Daven attenuatm (2!>0/250) withSIX I20-ohm resistances in series. Between each pair of resistancesare 500-mfd. condensers to ground, which can be connected asn.eeded. An additional 5000-ohm resistance can be placed in senes to smooth very high backgrounds. For use with this controlthe range of the Brown recorder was changed f~oni. 0-50 to Q"-IOmv. These changes led to distinct improvement in recorder reproducibility. More recently the improved performance to beexpected by stabilizing the counting circuits of the instrumenthas been pointed out, and some of the measurements were madewith a Sola transformer stabilizing the counting circuit. A fewmeasurements have been made using a rotating sample holderbut the results are not entirely conclusive as to whether it pos~sesses advantages for such studies.
REPRODUCIBILITY WITH AUTOMATIC RECORDING
Table I summarizes a few results on quartz intensities when theautomatic recorder is used. All results presented should be considered in the light of attempting to utilize a single measurementon a specimen as the basis of an analysis. The average and greatest deviations expressed in percentage are then a measure of theexpected accuracy of a quantitative analysis based on a singlemeasurement. Inasmuch as in all but special cases, direct analysis is impossible because of the effects of absorption on the intensities, it is necessary to use an internal standard technique. Mostanalyses then entail the measurement of two lines, a line of theunknown substance and a neighboring line of the standard. Theratio of the intensity of the unknown line to that, of the standardline is determined, and the unknown content read from a curve ~nwhich this ratio has been plotted against percentage of the unknown for a series of known mixtures. For an analysis based on asingle measurement of each line the ratio may be in error by asmuch as the sum of the greatest possible deviations of the two individual line measurements. These can be rather sizable whenthe recorder technique is used.
The original reproducibility with the recorder (G.-C. Trace 20)is very unsatisfactory. There is improvement after the additionof the American Cyanamid control (Trace 306 and later ones).Slower scanning speed does not indicate any noticeable improvement, and the advantage of the rotating sample is inconclusivein this set of data. All the studies except the last two were madeon a single specimen which was not touched or disturbed in any
REPRODUCIBILITY USING COUNTING TECHNIQUE
Table II presents data on the reproducibility of quartz intensities measured by counting technique. All studies except the lastone were made on material sized to <5/l. The lines have beenmanually scanned at 0.05 0 intervals, counting in the neighborhood of 5000 counts for points around the top of the .peak, andenough counts at the base line to locate it with the same absoluteerror. After the data had been plotted, the areas beneath thecurves were calculated as the product of the height and width athalf maximum intensity. Each determination was made on aseparately prepared specimen of the sample. .The increased reproducibility of the counted results is strikingly evident. It is alsoevident that the reproducibility of specimen preparation is remarkably good. The poorer reproducibility of the 4.25 A. line isexpected because of its smaller multiplicity. In general, the superiority of heights over areas for intensity measurements seemsto be established (but see data on sodium chloriae below). Thevarious samples of finely ground quartz show approximately thesame reproducibility. 'Where larger particles are present, however, the reproducibility is much poorer, as is illustrated by thelast study on Hot Springs quartz (HS, <325-mesh but >5/l).The average intensity of the 3.33 A.line of quartz based on heightsand expressed in arbitrary units is 353.7 for sample IHFM, 348.4for sample HS, and 355.7 for sample NCCP. The average ofthese is probably the most reliable value for high purity samplesof quartz. If sample IHFM is weighted twice in averaging, as it isbased on twice as many determinations, the value is 352.4. Thusvarious samples of high purity quartz from differe·nt sources areshown to have a reproducible constant intensity for the 3.33 A.line within approximately ± I %. The corresponding measure~
ment for the coarser sample (HS > 5/l) is 309.7. In addition tothe poorer reproducibility with the coarser material there is also adecrease in the intensity observed, which is probably at least partially the effect of extinction in the larger crystallites.
Table III lists similar intensity measurements for sodium chloride. Samples of reagent grade sodium chloride were reduced to afine state of subdivision by 2- and 4-hour grinds in a motor-drivenmullite mortar. The present data were taken before the necessityfor standardizing the instrument daily was fully realized, and it
VOL U M E 20, NO.7, J U L Y 1 948 609
" This sample of reagent grade NaCI always gave an extremely rough andpitted surface. Microscopic examination showed pr~sence of foreign material. Poorer reproducibility from such a sample is evident in percent.agedeviation.
Table IV. Analysis of Data for 14 Determinations of 60%Quartz Point on Standard Quartz Analysi's Curve
(Standardizing sub'-tance, CaF,)
Si02, 3.33 A. line CaF2, 3.16 A. line Ratio of Intensities1- Deviation I - Deviation . Deviation
Count height from lucan height from mean HQIHF from mea,n
1 137.0 -3.4 32.2 -1.3 4.25 +0.062 142.5 +2.1 ~3.2 -0.3 4.29 +0.103 148.0 +7.6 ~4"0 +0.5 4.35 +0.164 135.0 -5.4 34.8 +1.3 3.88 -0.315 136.5 -3.9 ~4.0 +0.5 4.01 -0.186 143.5 +3.1 33.3 -0.2 4.31 +0.127 136.0 -4.4 33.7 +0.2 4.04 -0.158 143.5 +3.1 33.3 -0.2 4.31 +0.129 139.7 -0.7 32.1 -1.4 4.38 +0.19
10 137.0 -3.4 32.7 -0.8 4.18 -0.0111 138.3 -2.1 33.3 -0.2 4.15 -0.0412 134.0 -6.4 33.9 +0.4 3.95 -0.2413 145.6 +5.2 34.0 +0.5 4.28 +~.09
14 148.5 +8.1 33.9 +0.4 4.38 +0.19Av. . 140.4 ±4.2 33."" ±0.6 4.19 ±0.14
Av. deviation, % 2.99 1. 79 3.34Greatest deviation, % 7.4
is believed the deviations would be somewhat less if they were repeated. The most remarkable observation here is that the areasproved more consistent than the heights as a measure of intensity.This is just the reverse of that for quartz, and is believed to berelated to the fact that investigators have experienced difficulty inattempting to grind sodium chloride to a fine state of subdivision.The samples are apparently mixtures of very fine and relativelycoarse particles. Some samples actually showed slight broadening of the line; hence the results on heights. alone would be expected to be less reliable. Because of the effects of line broadening, intensities based on heights alone are satisfactory only forcrystallite sizes above the colloidal range (>1000 A.). All studies of substances containing appreciable amounts of material inthe colloidal range must be based on areas, unless all samples canbe expected to have identical size distributions for the component in question.
ANALYTICAL PROCEDURES
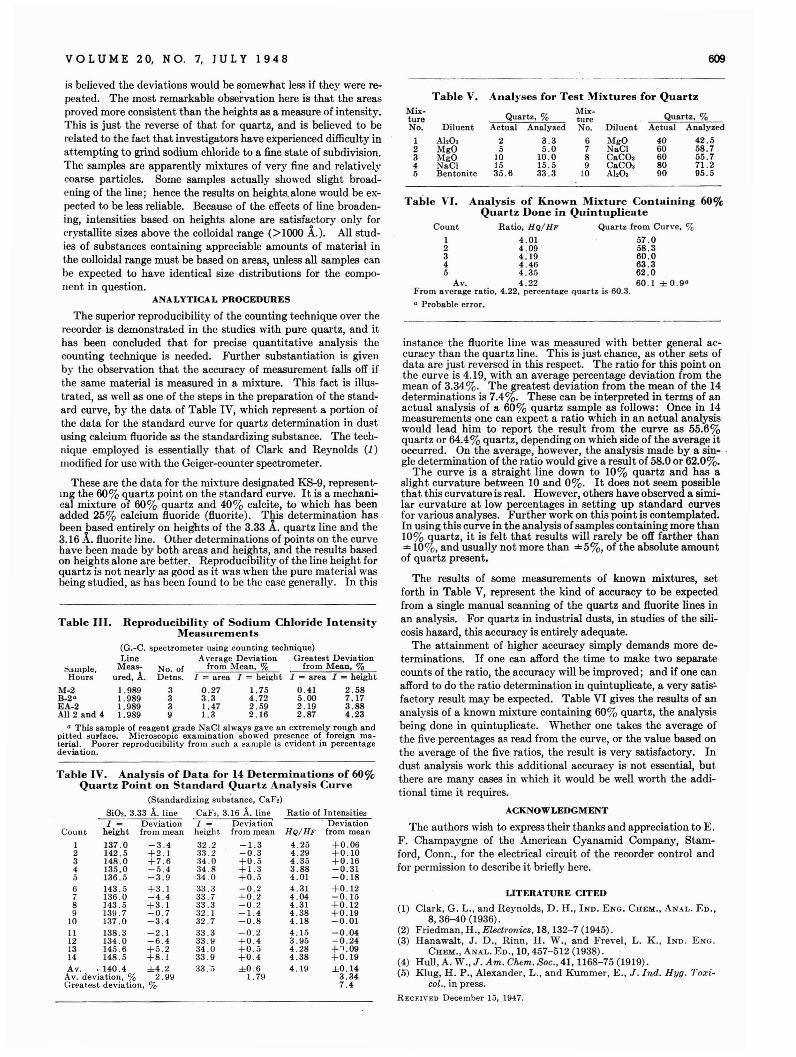
The superior reproducibility of the counting technique over therecorder is demonstrated in the studies with pure quartz, and ithas been concluded that for precise quantitative analysis thecounting technique is needed. Further substantiation is givenby the observation that the accuracy of measurement falls off ifthe same material is measured in a mixture. This fact is illustrated, as well as one of the steps in the preparation of the standard curve, by the data of Table IV, which represent a portion ofthe data for the standard curve for quartz determination in dustusing calcium fluoride as the standardizing substance. The technique employed is essentially that of Clark and Reynolds (1)modified for use with the Geiger-counter spectrometer.
These are the data for the mixture designated KS-9, representing the 60% quartz point on the standard curve. It is a mechanical mixture of 60% quartz and 40% calcite, to which has beenadded 25% calcium fluoride (fluorite). This determination hasbeen based entirely on heights of the 3.33 A. quartz line and the3.16 _t fluorite line. Other determinations of points on the curvehave been made by both areas and heights, and the results basedon heights alone are better, Reproducibility of the line height forquartz is not nearly as good as it was when the pure material wasbeing studied, as has been found to be the case generally. In this
Table V. Analyses for Test Mixtures for Quartz
Mix-Quartz, %
Mix-Quartz, %ture ture
No. Diluent Actual Analyzed No. Diluent Actual Analyzed
1 Aha, 2 3.3 6 MgO 40 42.52 MgO 5 5.0 7 NaCI 60 58.73 MgO 10 10.0 8 CaCO, 60 55.74 NaCl 15 15.5 9 CaCO, 80 71.25 Bentonit.e 35.6 33.3 10 Aha. 90 95.5
Table VI. Analysis of Known Mixture Containing 600/(;Quartz Done in Quintuplicate
Count Ratio, HQIHF Quartz from Curve, %1 4.01 M.O2 4.09 58.33 4.19 60.04 4.46 63.35 4.35 62.0
Av. 4.22 60.1 ±0.9a
From ayerage ratio, 4.22, percent,age quartz is 60.3.
a Probable error.
instance the fluorite line was measured with better general accuracy than the quartz line. This is just chance, as other sets ofdata are just reversed in this respect. The ratio for this point onthe curve is 4.19, with an average percentage deviation from themean of 3.34%. The greatest deviation from the mean of the 14determinations is 7.4%. These can be interpreted in terms of anactual analysis of a 60% quartz sample as follows: Once in 14measurements one can expect a ratio which in an actual analysiswould lead him to report the result from the curve as 55.6%quartz or 64.4% quartz, depending on which side of the average itoccurred. On the average, however, the analysis made by" a sin- .gle determination of the ratio would give a result of 58.0 or 62.0%.
The curve is a straight line down to 10% quartz and has aslight curvature between 10 and 0%. It does not seem possiblethat this curvature is real. However, others have observed a similar curvature at low percentages in setting up standard curvesfor various analyses. Further work on this point is contemplated.In using this curve in the analysis of samples containing more than10% quartz, it is felt that results will rarely be off farther than'" 10%, and usually not more than "'5%, of the absolute amountof quartz present.
The results of some measurements of known mixtures, setforth in Table V, represent the kind of accuracy to be expectedfrom a single manual scanning of the quartz and fluorite lines inan analysis. For quartz in industrial dusts, in studies of the silicosis hazard, this accuracy is entirely adequate.
The attainment of higher accuracy simply demands more determinations. If one can afford the time to make two separatecounts of the ratio, the accuracy will be improved; and if one canafford to do the ratio determination in quintuplicate, a very satis~
factory result may be expected. Table VI gives the results of ananalysis of a known mixture containing 60% quartz, the analysisbeing done in quintuplicate. Whether one takes the average ofthe five percentages as read from the curve, or the value based onthe average of the five ratios, the result is very satisfactory. Indust analysis work this additional accuracy is not essential, butthere are many cases in which it would be well worth the addit.ional time it requires.
ACKNOWLEDGMENT
The authors wish to express their thanks and appreciation to E.F. Champaygne of the American Cyanamid Company, Stamford, Conn., for the electrical circuit of the recorder control andfor permission to describe it briefly here.
LITERATURE CITED
(1) Clark, G. L., and Reynolds, D. H., IND. ENG. CHEM., ANAl•. ED.,8,36-40 (1936).
(2) Friedman, H., Electronics, 18, 132-7 (1945).(3) Hanawalt, J. D., Rinn, H. W., and Frevel, L. K., IND. ENG.
CHEM., ANAL. ED., 10,457-512 (1938).(4) Hull, A. W., J. Am. Chem. Soc., 41, 1168-75 (1919) .(5) Klug, H. P., Alexander, L., and Kummer, E., J. Ind. Hyg. Toxi
col., in press.RECEIVED December 15, 1947.
Reproducibilit), of Sodium Chloride IntensityMeasurements
(G.-C. spectrometer using counting technique)Line Average Deviation Greatest Deviation
Meas- No. of from Mean, % from Mean, %ured, A. Detns. I - area I - height I = area I = height
1.989 3 0.27 1.75 0.41 2.581.989 3 3.3 4.72 5.00 7.171.989 3 1.47 2.59 2.19 3.881.989 9 1.3 2.16 2.87 4.23
::,smple,Hours
Table III.
M-2B-2"EA-2All 2 and 4
Determination of Gamma-Benzene Hexachlorideby Partition ChromatographyOTIO T. AEPLI, PAUL A. MUNTER, AND JOHN F. GALL
Whitemarsh Research Laboratories, Pennsylvania Salt Manufacturi1!-g Company, W:yndmoor, Pa.
A partition chromatographic method for determining the gamma isomer content of benzene hexachloride products is described. The partition solvents arenitromethane and n-hexane and the supporting medium is silicic acid. Themethod is sufficiently convenient and rapid for routine production analysis, andrequires no 6xpensive equipOlent or specially trained personnel. The accuracyis about 2% based upon the actual gamma isomer content of synthetic Olixturesof the iSOOlers. The procedure appears to be adaptable to the determination ofsome of the other isomers and related constituents.
CO~LYIERCIAL benzene hexachloride, produced by thechlorination of benzene, is a complex mixture containing at
least five space isomers of 1,2,3,4,5,6-hexachlorocyclohexane,together with other closely related chlorinated materials (5, 6).It is known that the insecticidal activity of benzene hexachlorideproducts resides principally in the g'l.mma isomer of hexachlorocyclohexane (6). Heretofore, no completely satisfactory methodhas been available for the determination of this constituent.
Direct methods for dctermining the biological activity of insecticidal preparations are, of course, applicable to this material,but their accuracy is subject to statistical limitation, and themethods are time-consuming and require special laboratoryfacilities and stringent control of technique and environmentalconditions. :'.1ethods based on infrared absorption have beendescribed by Daasch (2) and by Kauer, DuVall, and Alquist (3),The infrared methods require expensive equipment, considerablepreliminary calibration, and a detailed qualitative knowledge ofthe eomposition of the material to be analyzed. The only othermethod which has been rcporkd for the analysis of benzenehexachloride produets is the cryoscopic method of Bowen andPogorelskin (1). This method, as described, requires substantialquantities of highly purified gamma isomer, and involves themethods of precision thermometry.
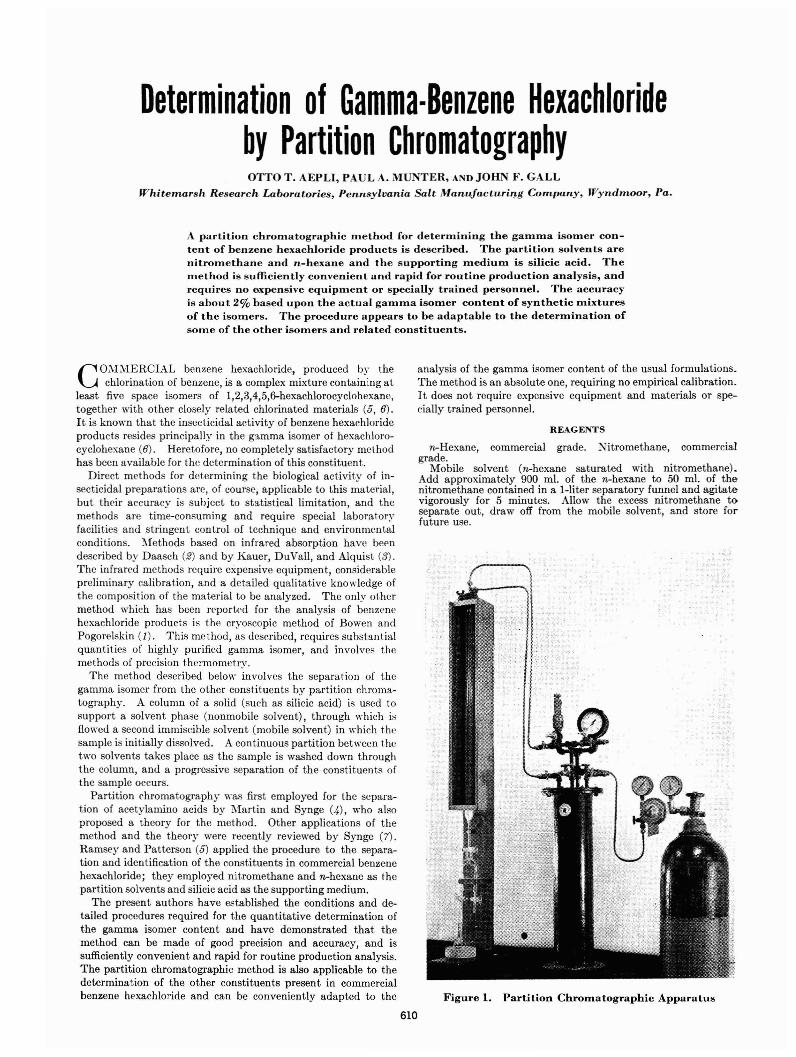
The method described below involves the separation of thegamma isomer from the other constituents by partition chromatography. A column of a solid (such as silicic acid) is used tosupport a solvent phase (nonmobile solvent), through which isflow'ed a second immiscible solvent (mobile solvent) in \\'hich thesample is initially dissolved. A continuous partition between thetwo solvents takes place as the sample is washed down throughthe column, and a progressive separation of the constituents ofthe sample occurs.
Partition ehromatography was first employed for the separation of aeetylamino acids by Martin and Synge (4), who alsoproposed a theory for the method. Other applications of themethod and the theory were recently reviewed by Synge en.Ramsey and Patterson (5) applied the procedure to the separation and identification of the constituents in commercial benzenehexachloride; they employed nit.romethane and n-hexane as thepartition solvents and silicic acid as the supporting medium.
The present authors have established the conditions and detailed procedures required for the quantitative determination ofthe gamma isomer content and have demonstrated that themethod can be made of good precision and accuracy, and issufficiently convenient and rapid for routine production analysis.The partition chromatographic method is also applicable to thedetermination of the other constituents present in commercialbenzene hexachloride and can be conveniently adapted to the
analysis of the gamma isomer content of the usual formulations.The method is an absolute one, requiring no empirical calibration,It does not require expensive equipment and materials or specially trained personnel.
REAGENTS
n-Hexane, commercial grade. Nitromethane, commercialgrade.
Mobile solvent (n-hexane saturated with nitromethane).Add approximately 900 m!. of the n-hexane to 50 m!. of thenitromethane contained in a I-liter separatory funnel and agitatevigorously for 5 minutes. Allow the excess nitromethane toseparate out, draw off from the mobile solvent, and store forfuture use.
Figure 1. Partition Chromatographic Apparatus
610
VOL U M E 20, N O. 7, JU L Y 1 94 8 611
The sample preparation involves the complete extraction of the gamma isomer fromthe bulk of the other constituents present inthe sample. By variation of the sampleweight, the optimum amount of gamma isomeris secured for addition to the chromatographiccolumn.
Figure 3.SantplePre par ation Apparatus
a. Kohlrauschtype flask, tocontain 100 mi.
at 20° C.b. Buchnerfunnel, fritleddisk type, medium porosity,Pyrex, 34-mm.inside dia.meterc. Vacuum con-
nection
Vs, keeping VI closed and V3 and v. open. Apply pressure to thereservoir by closing V2, V3, V., and Vs, adjusting the pressurereducing valve on the nitrogen gas cylinder to about 8 pounds'gage pressure, and carefully opening VI.
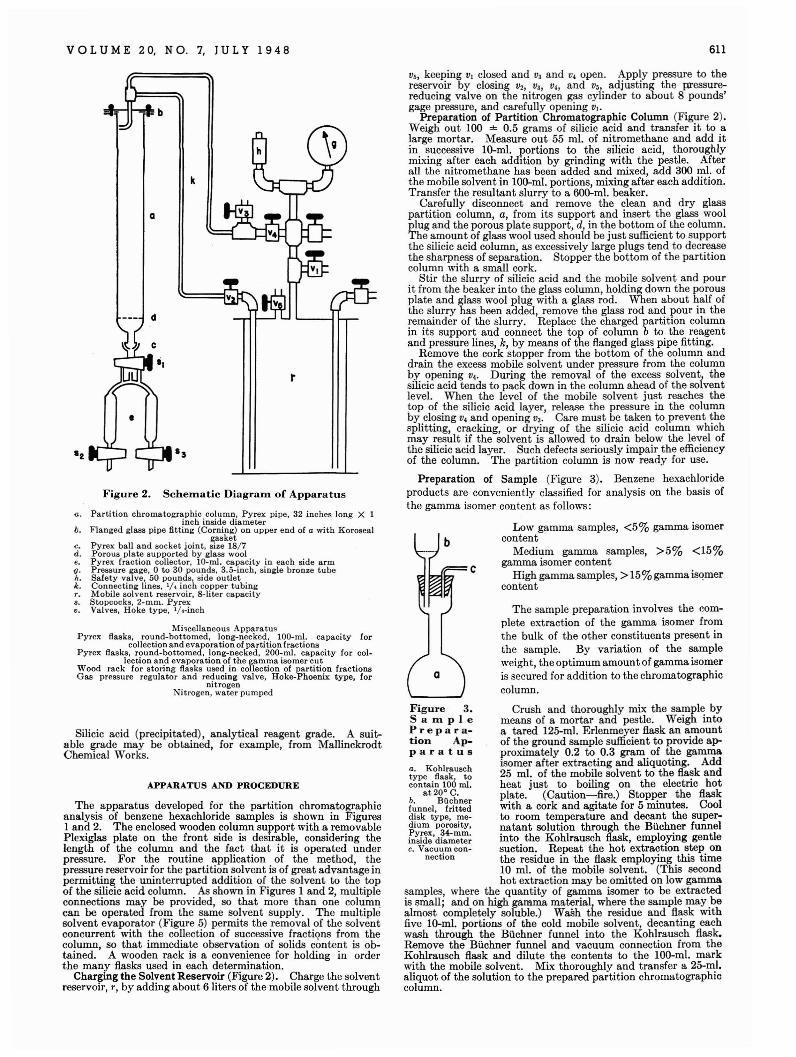
Preparation of Partition Chromatographic Column (Figure 2).Weigh out 100 ± 0.5 grams of silicic acid and transfer it to alarge mortar. Measure out 55 mI. of nitromethane and add itin successive 10-mI. portions to the silicic acid, thoroughlymixing after each addition by grinding with the pestle. Afterall the nitromethane has been added and mixed, add 300 m!. ofthe mobile solvent in 100-m!. portions, mixing after each addition.Transfer the resultant slurry to a 600-m!. beaker.
Carefully disconnect and remove the clean and dry glasspartition column, a, from its support and insert the glass woolplug and the porous plate support, d, in the bottom of the column.The amount of glass wool used should be just sufficient to supportthe silicic acid column, as excessively large plugs tend to decreasethe sharpness of separation. Stopper the bottom of the partitioncolumn with a small cork.
Stir the slurry of silicic acid and the mobile solvent and pourit from the beaker into the glass column, holding down the porousplate and glass wool plug with a glass rod. When about half ofthe slurry has been added, remove the glass rod and pour in theremainder of the slurry. Replace the charged partition columnin its support and connect the top of column b to the reagentand pressure lines, k, by means of the flanged glass pipe fitting.
Remove the cork stopper from the bottom of the column anddrain the excess mobile solvent under pressure from the columnby opening v.. During the removal of the excess solvent, thesilicic acid tends to pack down in the column ahead of the solventleve!. When the level of the mobile solvent just reaches thetop of the silicic acid layer, release the pressure in the columnby closing V. and opening V3. Care must be taken to prevent thesplitting, cracking, or drying of the silicic acid column whichmay result if the solvent is allowed to drain below the level ofthe silicic acid layer. Such defects seriously impair the efficiencyof the column. The partition column is now ready for use.
Preparation of Sample (Figure 3). Benzene hexachlorideproducts are conveniently classified for analysis on the basis ofthe gamma isomer content as follows:
Low gamma samples, <5% gamma isomercontent
Medium gamma samples, >5% <15%gamma isomer content
High gamma samples, > 15% gamma isqmercontent
Crush and thoroughly mix the sample bymeans of a mortar and pestle. Weigh intoa tared l25-mI. Erlenmeyer flask an amountof the ground sample sufficient to provide approximately 0.2 to 0.3 gram of the gammaisomer after extracting and aliquoting. Add25 mI. of the mobile solvent to the flask andheat just to boiling on the electric hotplate. (Caution-fire.) Stopper the flaskwith a cork and agitate for 5 minutes. Coolto room temperature and decant the supernatant solution through the Buchner funnelinto the Kohlrausch flask, employing gentlesuction. Repeat the hot extraction step onthe residue in the flask employing this time10 m!. of the mobile solvent. (This secondhot extraction may be omitted on low gamma
samples, where the quantity of gamma isomer to be extractedis small; and on high gamma material, where the sample may bealmost completely soluble.) WaSh the residue and flask withfive 10-mI. portions of the cold mobile solvent, decanting eachwash through the Buchner funnel into the Kohlrausch flask.Remove the BUchner funnel and vacuum connection from theKohlrausch flask and dilute the contents to the 100-m!. markwith the mobile solvent. Mix thoroughly and transfer a 25-ml.aliquot of the solution to the prepared partition chromatographiccolumn.
t
Silicic acid (precipitated), analytical reagent grade. A suitable grade may be obtained, for example, from MallinckrodtChemical Works.
Figure 2. Schentatic Diagrant of Apparatus
Mi,cellaneous ApparatusPyrex flasks, round-bottomed, long-necked, 100-ml. capacity for
collection and evaporation of partition fractionsPyrex flasks, round-bottomed, long-necked, 200-ml. capacity for col.
lection and evaporation of the gamma isomer cutWood rack for storing flasks used in collection of partition fractionsGas pressure regulator and reducing valve, Hoke-Phoenix type, for
nitrogenNitrogen, water pumped
a. Partition chromatographic column, Pyrex pipe, 32 inches long Xinch inside diameter
o. Flanged glass pipe fitting (Corning) on upper end of a with Korosealgasket
~. Pyrex ball and socket joint, size 18/7d. Porous plate supported by gla.. woole. Pyrex fraction collector, 10-ml. capacity in each side armg. Pressure gage, 0 to 30 pounds, 3.5-inch, single bronze tubeh. Safety valve, 50 pounds, side outletk. Connecting lines, 11, inch copper tubingT. Mobile solvent reservoir, 8-liter capacitys. Stopcocks, 2-mm. Pyrexv. Valves, Hoke type, l/,-inch
d
a
k
=lh-il-'"'!I!; b
APPARATUS AND PROCEDURE
The apparatus developed for the partition chromatographicanalysis of benzene hexachloride samples is shown in Figures1 and 2. The enclosed wooden column support with a removablePlexiglas plate on the front side is desirable, considering thelength of the column and the fact that it is operated underpressure. For the routine application of the method, thepressure reservoir for the partition solvent is of great advantage inpermitting the uninterrupted addition of the solvent to the topof the silicic acid column. Ail shown in Figures 1 and 2, multipleconnections may be provided, so that more than one columncan be operated from the same solvent supply. The multiplesolvent evaporator (Figure 5) permits the removal of the solventconcurrent with the collection of successive fractions from thecolumn, so that immediate observation of solids content is obtained. A wooden rack is a convenience for holding in orderthe many flasks used in each determination.
Charging the Solvent Reservoir (Figure 2). Charge the solventreservoir, T, by adding about 6 liters of the mobile solvent through
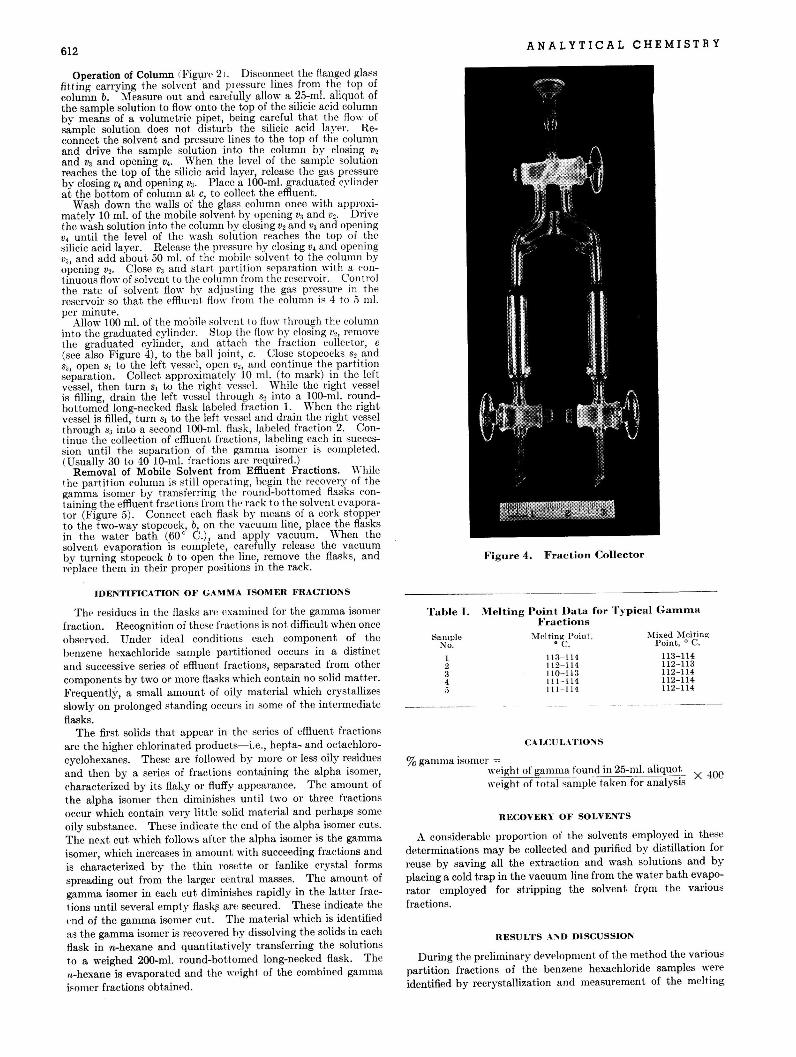
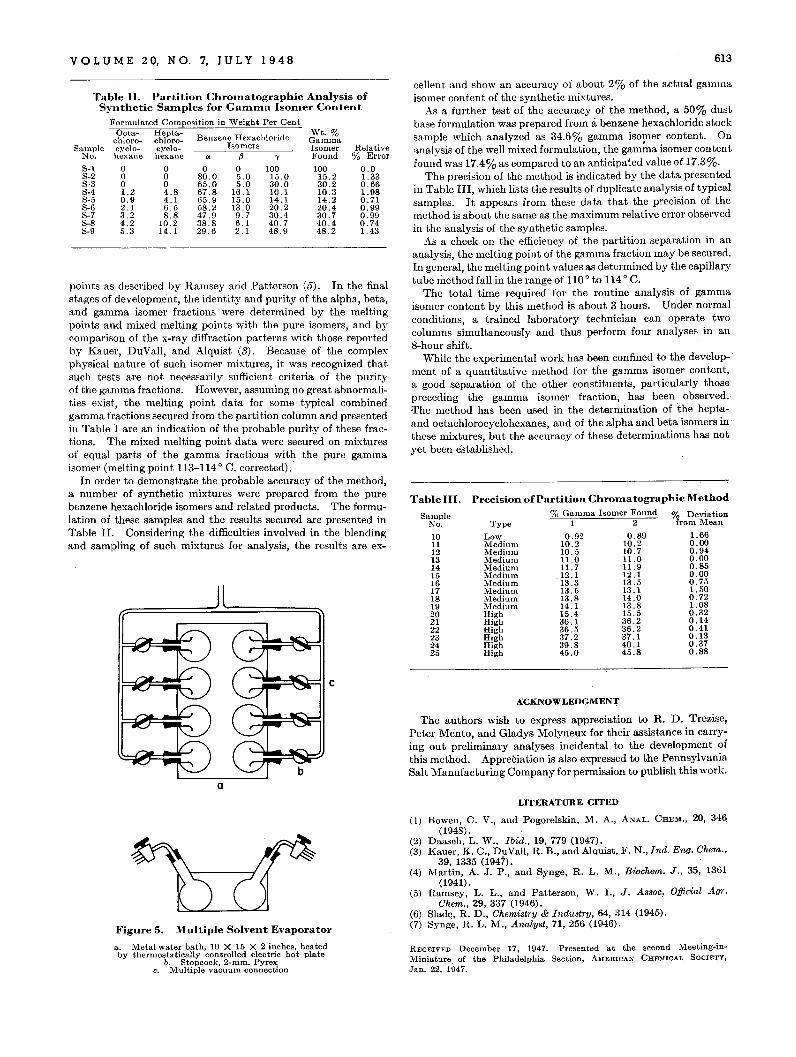
VOL U M E 2 0, N O. 7, JU L Y 1 9 4 8
Table II. Partition Chroll1atographic Analysis ofSynthetic Sall1ples for Gall1ll1a Isoll1er Content
Formulated Conlposition in Weight Per CentOcta- Hepta-
Benzene HexachlorideWt. %
chIoro- chloro- GammaSalnple cyclo- cyclo- Isomers Isomer Relative
No. hexane hexane {j -y Found %. Error
8-1 0 0 0 0 100 100 0.08-2 0 0 80.0 5.0 15.0 15.2 1.338-3 0 0 65.0 5.0 30.0 30.2 0.668-4 1.2 4.8 67.8 16.1 10.1 10.3 1.988-5 0.9 4.1 65.9 15.0 14.1 14.2 0.718-6 2.1 6.5 58.2 13.0 20.2 20.4 0.998-7 3.2 8.8 47.9 9.7 30.4 30.7 0.998-8 4.2 10.2 38.8 6.1 40.7 40.4 0.748-9 5.3 14.1 29.6 2.. 1 48.9 48.2 1.43
points as described by Ramsey arid Patterson (5). In the finalstages of development, the identity and purity of the alpha, beta,and gamma isomer fractions were determined by the meltingpoints ~nd mixed melting. points with the pure isomers, and bycompanson of the x-ray diffraction patterns with those reportedby Kauer, DuVall, and Alquist (3). Because of the complexphysical nature of such isomer mixtures, it was recognized thatsuch tests are not necessarily sufficient criteria of the purityof the gamma fractions. However, assuming no great abnormalities exist, the melting point data for some typical combinedgamma fractions secured from the partition column and presentedin Table I are an indication of the probable purity of these fractions. The mixed melting point data were secured on mixturesof equal parts of the gamma fractions with the pure gammaisomer (melting point 113-114 0 C. corrected).
In order to demonstrate the probable accuracy of the method,a number of synthetic mixtures were prepared from the purebenzene hexachloride isomers and related products. The formulation of these samples and the results secured are presented inTable II. Considering the difficulties involved in the blendingand sampling of such mixtures for analysis, the results are ex-
Figure 5. Multiple Solvent Evaporator
a. Metal wate~ bath, 10 X 15 X 2 inches, heatedby thermostatIcally controlled electric hot plate
b. 8topcock, 2-mm. Pyrexc. IHultiple vacuum connection
613
cellent and show an accuracy of about 2% of the actual gammaisomer content of the synthetic mixtures.
As a further test of the accuracy of the method, a 50% dustbase formulation was prepared from abenzene hexachloride stocksample which analyzed as 34.6% gamma isomer content. Onanalysis of the well mixed formulation, the gam~a isomer contentfound was 17.4% as compared to an anticipated value of 17,3%.
The precision of the method is indicatcd by the data presentedin Table III, which lists the results of duplicate analysis of typicalsamples. It appears from thcse data that the precision of themethod is about the same as the maximum relative error observedin the analysis of the synthetic samples.
As a check on the efficiency of the partition separation in ananalysis, the melting point of the gamma fraction may be secured.In general, the melting point values as determined by the capillarytube method fall in the range of 110 0 to 114 0 C.
The total time required for the routine analysis of gammaisomer content by this method is about 3 hours. Under normalconditions, a trained laboratory technician can operate twocolumns simultaneously and thus perform four analyses in an8-hour shift.
While the experimental work has been confined to the development of a quantitative method for the gamma isomer content,a good separation of the other constituents, particularly thosepreceding the gamma isomer fraction, has been observed.·:rhe method has been used in the determination of the heptaand octachlorocyclohexanes, and of the alpha and beta isomers inthese mixtures, but the accuracy of these determinations has notyet been established.
Table III. Precision ofPartition Chroll1atographic Method
Sample % Gaulma Isomer Found % DeviationNo. Type 1 2 from Mean
10 Low 0.92 0.89 1.6611 Medium 10.2 10.2 0.0012 Medium 10.5 10.7 0.9413 Medium 11.0 11.0 0.0014 Medium 11.7 11.9 0.8515 Medium 12.1 12.1 0.0016 Medium 13.3 13.5 0.7517 Medium 13.5 13.1 1. 5018 Medium 13.8 14.0 0.7219 Medium 14.1 13.8 1.0820 High 15.4 15.5 0.3221 High 36.1 36.2 0.1422 High 36.5 36.2 0.4123 High 37.2 37. 1 O. 1324 High 39.8 40. 1 0 . 3725 High 45.0 45.8 0.88
ACKNOWLEDGMENT
The authors wish to express appreciation to R. D. Trezise,Peter Mento, and Gladys Molyneux for their assistance in carrying out preliminary analyses incidental to the development ofthis method. Appreciation is also expressed to the PennsylvaniaSalt Manufacturing Company for permission to publish this work.
LITERATURE CITED
(1) Bowen, C. V., and Pogorelskin, M. A., ANAL. CHEM., 20, 341\(1948) .
(2) Daasch, L. W., Ibid., 19, 779 (1947).(3) Kauer, K. C., DuVall, R. B., and Alquist, F. N., Ind. Eng. Chem.,
39, 1335 (1947). .(4) Martin, A. J. P., and Synge, R. L. M., Biochem. J., 35, 1361
(1941). .(5) Ramsey, L. L., and Patterson, W. I., J. Assoc. Official A.yr,
Chem., 29, 337 (1946). .(6) SladEl , R. D., Chemistry & Industry, 64, 314 (1945),(7) Synge, R. L. M., Analyst, 71, 256 (1946).
RECEIVED December 17, 1947. Presented at the second Meeting-inl\JIiniature of the Philadelphia Section, AMERICAN CHEMICAL SOCIETY,Jan. 22. 1947. .. .
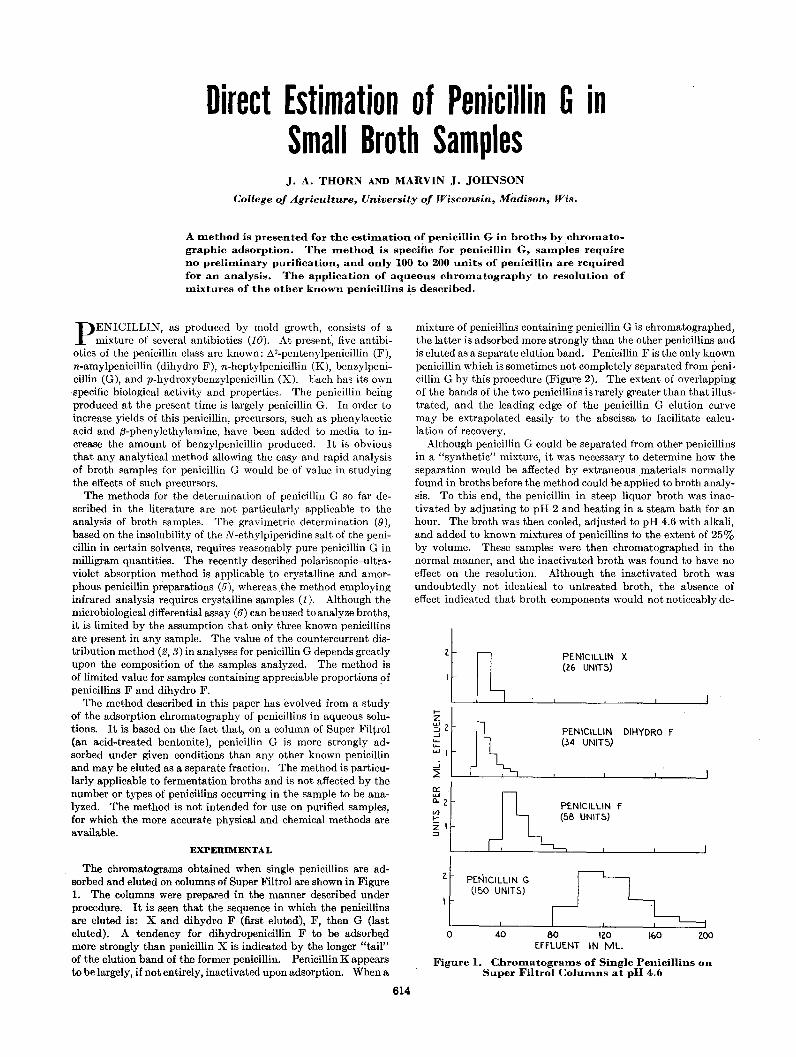
Direct Estimation of Penicillin GinSmall Broth SamplesJ. A. THORN AND MARVIN J. JOHNSON
College of Agriculture, University of Wisconsin, Madison, Wis.
A Illethod is presented for the estilllation of penicillin G in broths by chrolllatographic adsorption. The Illethod is specific for penicillin G, salllples requireno prelilllinary purification, and only 100 to 200 units of penicillin are requiredfor an analysis. The application of aqueous chrolllatography to resolution ofIllixtures of the other known penicillins is described.
200160
PENICILLIN X(Z6 UNITS)
PENICILLIN DIHYDRO f(34 UNITS)
PE.NICILLIN f(58 UNITS)
40o 80 120EffLUENT IN ML.
Figure 1. Chrolllatograllls of Single Penicillins onSuper Filtrol Colulllns at pH 4.6
z
2 PE.NICILLIN G(150 UNITS)
Iz~2..J........WI
cr:Wc..z</)
I-:21:J
mixture of penicillins containing penicillin G is chromatographed,the latter is adsorbed more strongly than the other penicillins andis eluted as a separate elution band. Penicillin F is the only knownpenicillin which is sometimes not completely separated from penicillin G by this procedure (Figure 2). The extent of overlappingof the bands of the two penicillins is rarely greater than that illustrated, and the leading edge of the penicillin G elution curvemay be extrapolated easily to the abscissa to facilitate calculation of recovery.
Although penicillin G could be separated from other penicillinsin a "synthetic" mixture, it was necessary to determine how theseparation would be affected by extraneous materials normallyfound in broths before the method could be applied to broth analysis. To this end,' the penicillin in steep liquor broth was inactivated by adjusting to pH 2 and heating in a steam bath for anhour. The broth was then cooled, adjusted to pH 4.6 with alkali,and added to known mixtures of penicillins to the extent of 25%by volume. These samples were then chromatographed in thenormal manner, and the inactivated broth was found to have noeffect on the resolution. Although the inactivated broth wasundoubtedly not, identical to untreated broth, the absence ofeffect indicated that broth components would not noticeably de-
EXPERIMENTAL
The chromatograms' obtained when single penicillins are adsorbed and eluted on columns of Super Filtrol are shown in Figure1. The columns were prepared in the manner described underprocedure. It is seen that the sequence in which the penicillinsare eluted is: X and dihydro F (first eluted), F, then G (lasteluted). A tendency for dihydropenicillin F to be adsorbedmore strongly than penicillin X is indicated by the longer "tail"of the elution band of the former penicillin. Penicillin K appearsto be largely, if not entirely, inactivated upon adsorption. When a
PENICILLIN, as produced by mold growth, consists of amixture of several antibiotics (10). At present', five antibi
otics of the penicillin class are known: LJ.z-pentenylpenicillin (F),n-amylpenicillin (dihydro F), n-heptylpenicillin (K), benzylpenicillin (G), and p-hydroxybenzylpenicillin (X). Each has its ownspecific biological activity and properties. The penicillin bei'ngproduced at the present time is largely penicillin G. In order toincrease yields of this penicillin, precursors, such as phenylaceticacid and j3-phenylethylamine, have been added to media to increase the amount of benzylpenicillin produced. It is obviousthat any analytical method allowing the easy and rapid analysisof broth samples for penicillin G would be of value in studyingthe effects of such precursors:
The methods for the determination of penicillin G so far described in the literature are not particularly applicable to theanalysis of broth samples. The gravimetric determination (9),based on the insolubility of the N-ethylpiperidine salt of the penicillin in certain solvents, requires reasonably pure penicillin G inmilligram quantities. The recently described polariscopic-ultraviolet absorption method is applicable to crystalline and amorphous penicillin preparations (5), whereas the method employinginfrared analysis requires crystalline samples (1). Although themicrobiological differential assay (6) can be used to analyze broths,it is limited by the assumption that only three known penicillinsare present in any sample. The value of the countercurrent distribution method (2, 3) in analyses for penicillin G depends greatlyupon the composition of the samples analyzed. The method isof limited value for samples containing appreciable proportions ofpenicillins F and dihydro F. '
The method described in this paper has evolved from a studyof the adsorption chromatography of penicillins in aqueous solutions. It is based on the fact that, on a column of Super Filtrol(an acid-treated bentonite), penicillin G is more strongly adsorbed under given conditions than any other known penicillinand may be eluted as a separate fraction. The method is particularly applicable to fermentation broths and is not affected by thenumber or types of penicillins occurring in the sample to be analyzed. The method is not intended for use on purified samples,for which the more accurate physical and chemical methods areavailable.
614
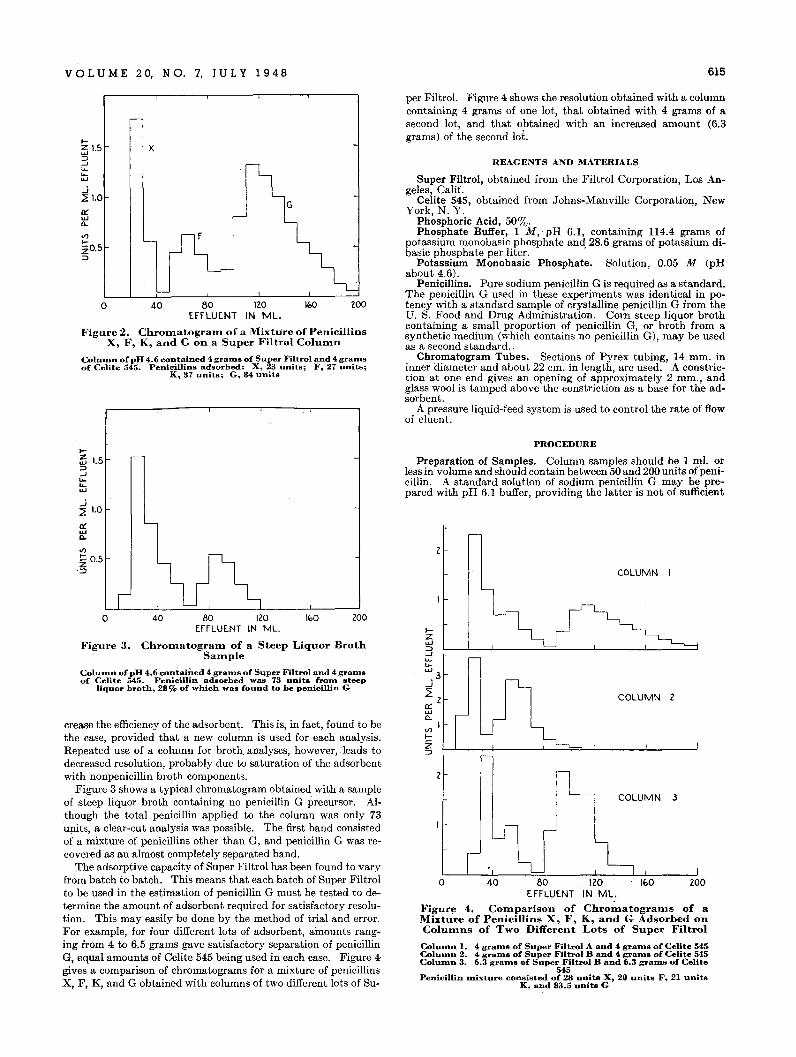
VOL U M E 20, N O. 7, J U L Y 1 948 615
Colu:m.n of pH 4.6 contained 4 gra:rns of Super Filtrol and 4 grantsof Celite 545. Penicillins adsorbed: X, 23 units; F, 27 units;
K, 37 units; G, 84 units
per Filtro!. Figure 4 shows the resolution obtained with a columncontaining 4 grams of one lot, that obtained with 4 grams of asecond lot, and that obtained with an increased amount (6.3grams) of the second lot.
REAGENTS AND MATERIALS
Super Filtrol, obtained from the Filtrol Corporation, Los An-geles, Calif. .
Celite 545, obtained from Johns-Manville Corporation, NewYork, N. Y.
Phosphoric Acid, 50%.Phosphate Buffer, 1M, pH 6.1, containing 114.4 grams of
potassium monobasic phosphate anq 28.6 grams of potassium dibasic phosphate per liter.
Potassium Monobasic Phosphate. Solution, 0.05 M (pHabout 4.6).
Penicillins. Pure sodium penicillin G is required as a standard.The penicillin G used in these experiments was identical in potency with a standard sample of crystalline penicillin G from theU. S. Food and Drug Administration. Corn steep liquor brothcontaining a small proportion of penicillin G, or broth from asynthetic medium (which contains no penicillin G), may be usedas a second standard..
Chromatogram Tubes. Sections of Pyrex tubing, 14mm. ininner diameter and about 22 ern:. in length, are used. A constriction at one end gives an opening of approximately 2 mm., andglass wool is tamped above the constriction as a base for the adsorbent.
A pressure liquid-feed system is used to control the rate of flowof eluent.
zooIbO40o 80 120EffLUE.NT IN ML.
Figure 2. ChrOlnatograIn of a Mixture of PenicillinsX, F, K, and G on a Super Filtrol ColUInn
....31.5 X:::::J....Ju...u...u.J
.J~ 1.0
0::uJ£L
<I)
~0.5:::::J
Colu:rnn of pH 4.6 contained 4 graInS of Super Filtrol and 4 graIn8of Celite 545. Penicillin adsorbed was 73 units fron1 steep
liquor broth, 28% of which was found to be penicillin G
200
COLUMN 2
40o 80 120 . 160EffLUE.NT IN ML.
Figure 4. COInparison of ChroInatograllls of aMixture of Penicillins X, F, K, and G Adsorbed onColuInns of Two Different Lots of Super FiltroI
COLUMN 3
ColuIlJ.n 1. 4 graIIJ.8 of Super Fil~rol A and 4 graIIJ.8 of Celi~e 545Colu:rnD 2a 4 gra:rns of Super Filtrol Band 40 gra:rns of Celite 545ColUIlJ.n 3. 6.3 graIIJ.8 of Super Filtrol Band 6.3 graIIJ.8 of Celi~e
. 545Penicillin JD.ixture cODsisted of 28 units X, 20 units F, 2'} units
K, and 83.5 nni~8 G
COLUMN I
PROCEDURE
Preparation of Samples. Column samples should be 1 m!. orless in volume and should contain between 50 and 200 units of penicillin. A standard solution of sodium penicillin G may be prepared with pH 6.1 buffer, providing the latter is not of sufficient
20016040 80 120EfFLUE.NT IN ML.
ChroInatograIn of a Steep Liquor BrothSaInple
o
Figure 3.
....3 1.5::>..J..........u.J
.J~ 1.0
0::uJ~
on~ 0.5
':::l
crease the efficiency of the adsorbent. This is, in fact, found to bethe case, provided that a new column is used for each analysis.Repeated use of a column for broth analyses, however, .leads todecreased resolution, probably due to saturation of the adsorbentwith nonpenicillin broth components.
Figure 3 shows a typical chromatogram obtained with a sampleof steep liquor broth containing no penicillin G precursor. Although the total penicillin applied to the column was only 73units, a clear-cut analysis was possible. The first band consistedof a mixture of penicillins other than G, and penicillin G was recovered as an almost completely separated band.
The adsorptive capacity of Super Filtrol has been found to varyfrom batch to batch. This means that each batch of Super Filtrolto be used in the estimation of penicillin G must be tested to determine the amount of adsorbent required for satisfactory resolution. This may easily be done by the method of trial and error.For example, for four different lots of adsorbent, amounts ranging from 4 to 6.5 grams gave satisfactory separation of penicillinG, equal amounts of Celite 545 being used in each case. Figure 4·gives a comparison of chromatograms for a mixture of penicillinsX, F, K, and G obtained with columns of two different lots of Su-
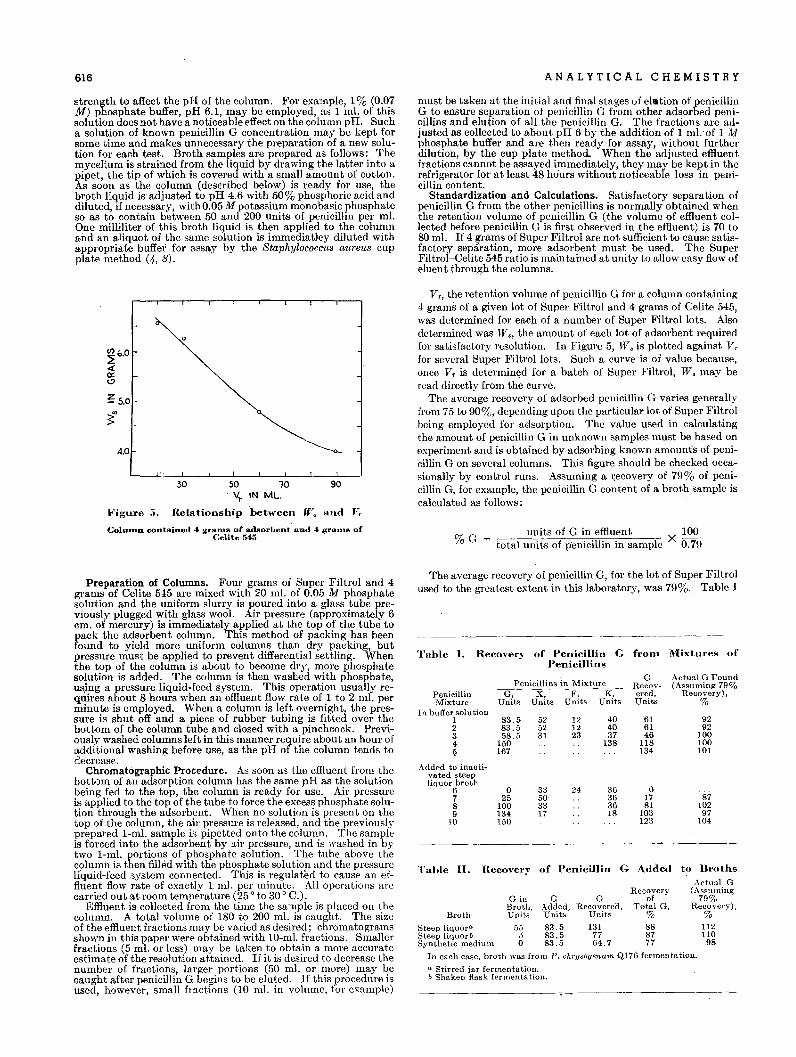
616 ANALYTICAL CHEMISTRY
strength to affect the pH of the column. For example, 1% (0.07llf) phosphate buffer, pH 6.1, may be employed, as 1 ml. of thissolution does not have a noticeable effect on the column pH. Sucha solution of known penicillin G concentration may be kept forsome time and makes unnecessary the preparation of a new solution for each test. Broth samples are prepared as follows: Themycelium is strained from the liquid by drawing the latter into apipet, the tip of which is covered with a small amount of cotton.As soon as the column (described below) is ready for use, thebroth liquid is adjusted to pH 4.6 with 50% phosphoric acid anddiluted, if necessary, withO.05llf potassium monobasic phosphateso as to contain between 50 and 200 units of penicillin per m!'One milliliter of this broth liquid is then applied to the columnand an aliquot of the same solution is immediatley diluted withappropriate buffer for assay by the Staphylococc118 au.re'us cupplate method (4, 8).
must be taken at the initial and final sta.ges of elation of penicillinG to ensure separation of penicillin G from other adsorbed penicillins and elution of all the penicillin G. The fractions are adjusted as collected to about pH 6 by the addition of 1 ml.of 1 Mphosphate buffer and are then ready·for assay, without furtherdilution, by the cup plate methoq. When the adjusted effluentfractions cannot be assayed immediately, they may be kept in therefrigerator for at least 48 hours without noticeable loss in penicillin content.
Standardization and Calculations. Satisfactory separation ofpenicillin G from the other penicillins is normally obtained whenthe retention volume of penicillin G (the volume of effluent collected before penicillin G is first observed in the effluent) is 70 to80 m!' If 4 grams of Super Filtrol are not sufficient to cause satisfactory sep:i'ration, more adsorbent must be used. The SuperFiltrol-Oelite 545 ratio is maintained at unity to allow easy flow ofeluent through the columns.
o
~".o<!0::<.:>
~ 5.0
~'"
4.0
Figure 5.
30 50, V..
Relationship
10 90IN ML
'between Jf', and Vr
V T, the retention volume of penicillin G for a column containing4 grams of a given lot of Super Filtrol and 4 grams of Oelite 545,was determined for each of a number of Super Filtrol lots. Alsodetermined was W" the amount of each lot of adsorbent requiredfor satisfactory resolution. In Figure 5, W, is plotted against V,for several Super Filtrol lots. Such a curve is of value because,once VT is determined for a batch of Super Filtrol, W, may beread directly from the curve.
The average recovery of adsorbed penicillin G varies generallyfrom 75 to 90%, depending upon the particular lot of Super Filtrolbeing employed for adsorption. The value used in calculatingthe amount of penicillin G in unknown samples must be based onexperiment and is obtained by adsorbing known amounts of penicillin G on several columns. This figure should be checked occa,sionally by controi runs. Assuming a recovery of 79% of penicillin G, for example, the penicillin G content of a broth sample iscalculated as follows:
COIUII1D contained 4 graJll.S of adsorbent and 4 grants ofCelite 545 %G
units of G in effluent X 100total units of p'enicillin in sample 0.79
The average recovery of penicillin G, for the lot of Super Filtrolused to the great.est extent in this laboratory, was 79%. Table I
to Broths
Actual G(Assuming
79%Recovery),
%112110
98
Recovery of Penicillin GAdded
RecoveryGin G G of
Broth. .-\.dded. Recovered. Total G.Broth Units Units Units %
Steep liquora 55 83.5 131 88Steep liquorb 5 83.5 77 87Synthetic medium 0 83.5 64.7 77
In each case, broth \yas from P. chrysogenum Q176 fermentation.
a Stirred jar fermentation.b Shaken flask fermentation.
Table n.
Table 1. Rec(,,-er)- of I'enicillin G from Mixtures ofPenicillins
Penicillins in ~HxtureG Actual G Found
Reeov- (Assuming 79%Penicillin G. X. F. K. ered, Recovery).Mixture Units Units Units Units Units %
In buffersolutioll1 83.5 52 12 40 61 922 83.5 52 12 40 61 923 58.5 31 23 37 46 1004 150 138 118 1005 167 134 101
Added to inacti-vated steepliquor broth
0 33 24 36 067 25 50 36 17 878 100 33 36 81 1029 134 17 18 103 97
10 150 123 104
----- -----_.
Preparation of Columns. Four grams of Super Filtrol and 4grams of Oelite 515 are mixed with 20 ml. of 0.05 M phosphatesolution and the uniform slurry is poured into a glass tube previously plugged with glass wool. Air pressure (approximately 6cm. of mercury) is immediately applied at the top of the tube topH.ck the adsorbent column. This method of packing has beenfound to yield more uniform columns than dry packing, butpressure must be applied to prevent differential settling. Whenthe top of the column is about to become dry, more phosphatesolution is added. The column is then washed with phosphate,uS,ing a pressure liquid-feed system. This operation usually requires about 8 hours when an effluent flow rate of 1 to 2 m!. perminute is employed. When a column is left overnight, the pressure is shut off and a piece of rubber tubing is fitted over thebottom of the column tube and closed with a pinchcock. Previously washed columns left in this manner require about an hour ofadditional washing before use, as the pH of the column tends todecrease.
Chromatographic Procedure. As soon as the effluent from thebottom of an adsorption column has the same pH as the solutionbeing fed to the top, the column is ready for use. Air pressureis applied to the top of the tube to force the excess phosphate solution through the adsorbent. 'When no solution is present on thetop of the column, the air pressure is released, and the previouslyprepared I-mI. sample is pipetted onto the column. The sampleis forced into the adsorbent by air pressure, and is washed in bytwo I-m!. portions of phosphate solution. The tube above thecolumn is then filled with the phosphate solution and the pressureliquid-feed system connected. This is regulated to cause an effluent flow rate of exacUy 1. m!' per minute. All operations arecarried out at room temperature (25 0 to 30 0 C.).
Effluent is collected from the time the sample is placed on thecolumn. A total volume of 180 to 200 ml. is caught. The sizeof the effluent fractions may be varied as desired; chromatogramsshown in this paper were obtained with lO-m!. fractions. Smallerfractions (5 ml. or less) may be taken to obtain a more accurateestimate of the resolution attained. If it is desired to decrease thenumber of fractions, larger portions (50 m!' or more) may becaught after penicillin G begins to be eluted. If this procedure isused, however, small fractions (10 m!' in volume, for example)
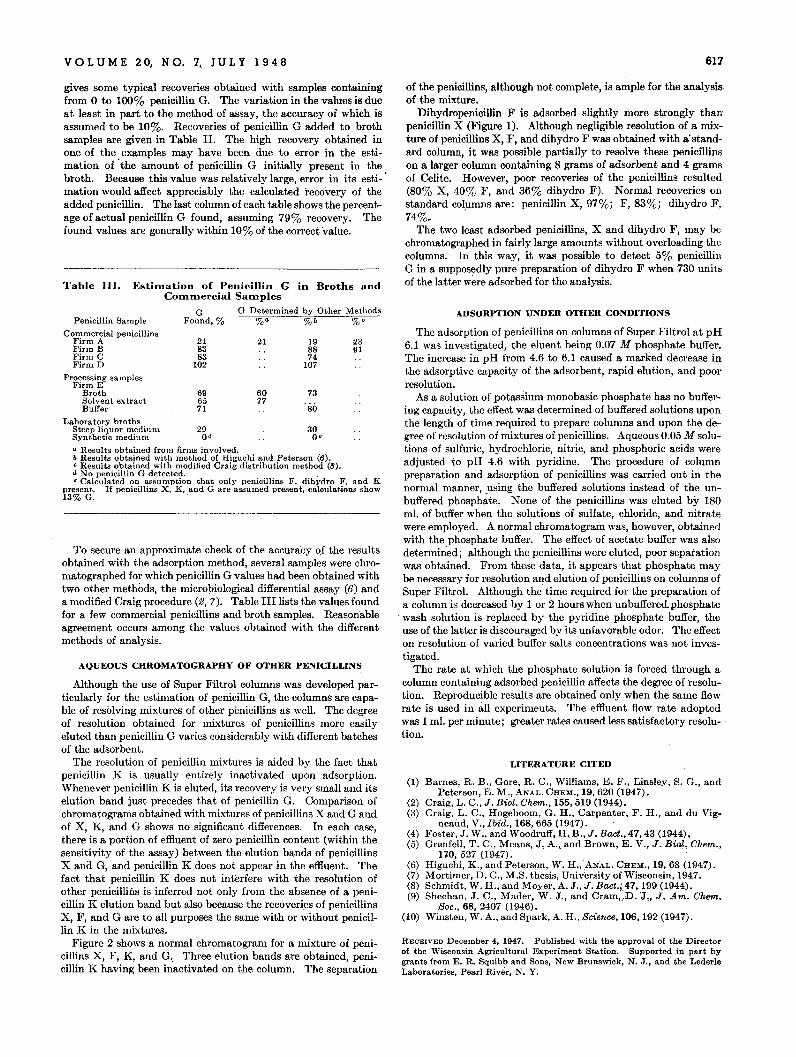
VOL U M E 2 0/ N O. 7/ J U L Y 1 9 4 8 617
To secure an approximate check of the accuracy o,f the resultsobtained with the adsorption method, several samples were chromatographed for which penicillin G values had been obtained withtwo other methods, the micropiological differential assay (6) anda modified Craig procedure (2, 7). Table III lists the values foundfor a few commercial penicillins and broth samples. Reasonableagreement occurs among the values obtained with the differentmethods of analysis.
(1) Barnes, R. B., Gore, R. C., Williams, E. F., Linsley, S. G., andPeterson, E. M., ANAL. CHEM., 19, 620 (1947).
(2) Craig, L. C., J. Bioi. Chem., 155,519 (1944). .(3) Craig, L. C., Hogeboom, G. H., Carpenter, F. H., and du'Vig
neaud, V.,Ibid., 168,665 (1947).(4) Foster. J. W., and Woodruff, H. B., J. Bact., 47/ 43 (1944),(5) Grenfell, T. C~, Means, J. A., and Brown, E. V., J. Biql. Chem.,
110, 527 (1947).(6) Higuchi, K., and Peterson, W. H., ANAL. CHEM., 19, 68 (1947).(7) Mortimer, D. C., M.S. thesis, Univ~rsityof Wisconsin, 1947.(8) Schmidt, W. H., and Moyer, A. J., J. Bact.;,47, 199 (1944).(9) Sheehan, J. C., Mader, W. J., and Cram, .. D. 'J .. J. Am. Chem.
Soc., 68, 2407 (1946).(10) Winsten, W. A., and Spark, A. H., Science,106,192 (1947).
LITERATURE CITED
of the penicillins, although not complete, is ample for the analysisof the mixture.
Dihydropenicillin F is adsorbed slightly more strongly thanpenicillin X (Figure 1). Although negligible resolution of a mixture of penicillins X, F, and dihydro F was obtained with a'standard column, it was possible partially to resolve these penicillinson a larger column containing 8 grams of adsorbent and 4 gramsof Celite. However, poor recoveries of the penicillins resulted(80% X, 40% F, and 36% dihydro F). Normal recoveries onstandard col).lmns are: penicillin X, 97%; F,83%; dihydro F,74%.
The two least adsorbed penicillins, X and dihydro F, may bechromatographed in fairly large amounts without overloading thecolumns. In this way, it was possible to detect 5% penicillinG in a supposedly pure preparation of dihydro F when 730 unitsof the latter were adsorbed for the analysis.
RECEIVED December 4, 1947. Published with the approval of the Directorof the Wisconsin Agricultural Experiment Station. Supported in part bygrants from E. R. Squibb and Sons, New Brunswick, N.J., and the LederleLaboratories, Pearl River. N. Y.
ADSORPTION UNDER OTHER CONDITIONS
The adsorption of penicillins on columns of Super Filtrol at pH6.1 was investigated, the eluent being 0.07 M phosphate buffer.The increase in pH from 4.6 to 6.1 caused a marked decrease inthe adsorptive capacity of the adsorbent, rapid elution, and poorresolution.
As a solution of potassium monobasic phosphate has no buffering capacity, the effect was determined of buffered solutions uponthe length of time required to prepare columns and upon the degree of resolution of mixtures of penicillins. Aqueous 0.05 M solutions of sulfuric, hydrochloric, nitric, and phosphoric acids wereadjusted to pH 4.6 with pyridine. The procedure of columnpreparation and adsOl'ption of penicillins was carried out in thenormal manner, using the buffered solutions instead of the unbuffered phosph~te. None of the penicillins was eluted by 180m!. of buffer when the solutions of sulfate, chloride, and nitratewere employed. A normal chromatogram was, however, obtainedwith the phosphate buffer. The effect of acetate buffer was alsodetermined; although the penicillins were eluted, poor separationwas obtained. From these data, it appears that phosphate maybe necessary for resolution and elution of penicillins on columns ofSuper Filtro!. Although the time required for the preparation ofa column is decreased by 1 or 2 hours when unbuffered. phosphate
'wash solution is replaced by the pyridine phosphate buffer, theuse of the latter is discouraged by its unfavorable odor. The effecton resolution of varied buffer salts concentrations was not investigated.
The rate at which the phosphate solution is forced through acolumn containing adsorbed penicillin affects the degree of resolution. Reproducible results are obtained only when the same flowrate is used in all experiments. The effluent flow rate adoptedwas 1 m!. per minute; greater rates caused less satisfactory resolution.
2391
73
30O'
198874
107
21
6077
696571
218383
102
Esthnation of Penicillin G in Broths andCOlllnlercial Salllples
G G Determined by Other MethodsFound, % %a %b %'Penicillin Sample
Commercial penicillinsFirmAFirm BFirm CFirmD
Table Ilr.
Processing samplesFirmE
BrothSolvent extractBuffer
Laboratory brothsSteep liquor mediulll 29Synthetic medium Orl
a Results obtained from firlus involved.b Results obtained with method of Higuchi and Peterson (6')., Results obtained with modified Craig distribution method (8).d No penicillin G detected.e Calculated on assumption that only penicillins F, dihydro F, and K
present. If penicillins X, K, and G are assumed present, calculations show13% G. '
gives some typical recoveries obtained with samples containingfrom 0 to 100% penicillin G. The variation in the values is dueat least in part to the method of assay, the accuracy of which isassumed to be 10%. Recoveries of penicillin G added to brothsamples are given in Table II. The high recovery obtained inone of the examples may have been due to error in the estimation of 'the amount of penicillin G initially present in thebroth. Because this value was relatively large, error· in its esti-'mation would affect appreciably the calculated recovery of theadded penicillin. The last column of each table shows the percentage of actual penicillin G found, assuming 79% recovery. Thefound values are generally within 10% of the correct value.
AQUEOUS CHROMATOGRAPHY OF OTHER PENICILLINS
Although the use of Super Filtrol columns was developed particularly for the estimation of penicillin G, the columns are capable of resolving mixtures of other penicillins as well. The degreeof resolution obtained for mixtures of penicillins more easilyeluted than penicillin G varies considerably with different batchesof the adsorbent.
The resolution of penicillin mixtures is aided by the fact thatpenicillin K is usually entirely inactivated upon adsorption.Whenever penicillin K is eluted, its recovery is very small and itselution band just precedes that of penicillin G. Comparison ofchromatograms obtained with mixtures of penicillins X and G andof X, K, and G shows no significant differences. In each case,there is a portion of effluent of zero penicillin content (within thesensitivity of the assay) between the elution bands of penicillinsX and G, and penicillin K does not appear in the effluent. Thefact that penicillin K does not interfere with the resolution ofother penicillins is inferred not only from the absence of a penicillin K elution band but also because the recoveries of penicillinsX, F, and G are to all purposes the same with or without penicillin K in the mixtures.
Figure 2 shows a normal chromatogram for a mixture of penicillins X, F, K, and G. Three elution bands are obtained, penicillin K having been inactivated on the column. The separation
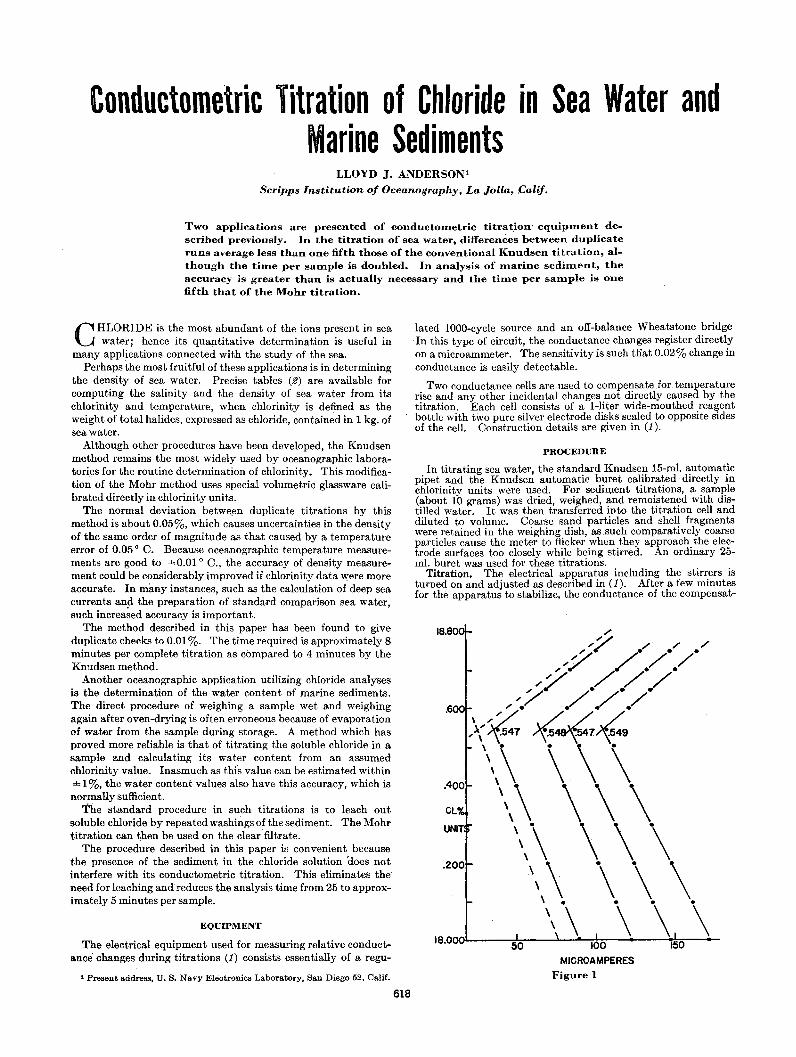
Conductometric Titration of Chloride in Sea Water andMarine Sediments
LLOYD J. ANDERSONlScripps Institution of Oceanography, La Jolla,Calif.
Two applications are presented of conductOinetric titration' equiplllent described previously. In the titration of sea water, differences between duplicateruns average less than one fifth those of the conventional Knudsen titration, although the tillle per salllple is doubled. In analysis of Illarine sedilllent, theaccuracy is greater than is actually necessary and the tiIlle per salllple is onefifth that of the Mohr titration.
CHLORIDE is the most abundant of the ions present in seawater; hence its quantitative determination is useful in
many applications connected with the study of the sea.Perhaps the most fruitful of these applications is in determining
the density of sea water. Precise tables (2) are available forcomputing the salinity and the density of sea water from itschlorinity and temperature, when chlorinity is defined as theweight of total halides, expressed as chloride, contained in 1 kg. ofsea water.
Although other procedures have been developed, the Knudsenmethod remains the most widely used by oceanographic laboratories for the routine determination of chlorinity. This modification of the Mohr method uses special volumetric glassware calibrated directly in chlorinity units.
The normal deviation betwe.en duplicate titrations by thismethod is about 0.05%, which causes uncertainties in the densityof the same order of magnitude as that caused by a temperatureerror of 0.05 0 C. Because oceanographic temperature measurements are good to ±O.Olo C., the accuracy of density measurement could be considerably improved if ehlorinity data were moreaccurate. In many instances, such as the calculation of deep seacurrents an? the preparation of standard comparison sea water,such increased accuracy is important.
The method described in this paper has been found to giveduplicate checks to 0.01 %. The time required is approximately 8minutes per complete titration as compared to 4 minutes by theKnudsen method.
Another oceanographic application utilizing chloride analysesis the determination of the water content of marine sediments.The direct procedure of weighing a sample wet and weighingagain after oven-drying is often erroneous because of evaporationof water from the sample during storage. A method which hasproved more reliable is that of titrating the soluble chloride in asample and calculating its water content from an assumedchlorinity value. Inasmuch as this value can be estimated within± 1%, the water content values also have this accuracy, which isnormally sufficient.
The standard procedure in such titrations is to leach outsoluble chloride by repeated washings of the sediment. The Mohrtitration can then be used on the clear' filtrate.
The procedure described in this paper is convenient becausethe presence of the sediment in the chloride solution does notinterfere with its conductometric titration. This eliminates theneed for leaching andreduces the analysis time from 25 to approximately 5 minutes per sample.
EQUIPMENT
The electrical equipment used for measuring relative conductance changes during titrations (1) consists essentially of a regu-
1 Present address, U. S. Navy Electronics Laboratory, San Diego 52, Calif.
618
lated lOOO-cycle source and an off-balance Wheatstone bridgeIn this type of circuit, the conductance changes register directlyon a microammeter. The sensitivity is such tnat 0.02% change inconductance is easily detectable.
Two conductance cells are used to compensate Jor. temperaturerise and any other incidental changes not directly caused by thetitration. Each cell consists of a I-liter wide-mouthed reagentbottle with two pure silver electrode disks sealed to opposite sidesof the cell. Construction details are given in (1).
PROCEDURE
In titrating sea water, the standard Knudsen 15-ml. automaticpipet and the Knudsen automatic buret calibrated' directly inchlorinity units were used. For sediqlent titrations, a sample(about 10 grams) was dried, weighed, and remoistened with distilled water. It was then transferred into the titration cell anddiluted to volume. Coarse sand particles and shell fragmentswere retained in the weighing dish, as .such comparatively coarseparticles cause the meter to flicker when they approach the electrode surfaces too closely while being stirred. An ordinary 25m!. buret was used for these titrations.
Titration. The electrical apparatus including the stirrers isturned on and adjusted as described in (1). After a few minutesfor the apparatus to stabilize, the conductance of the compensat-
16.6
.60
.400
CL
UNIT
.200
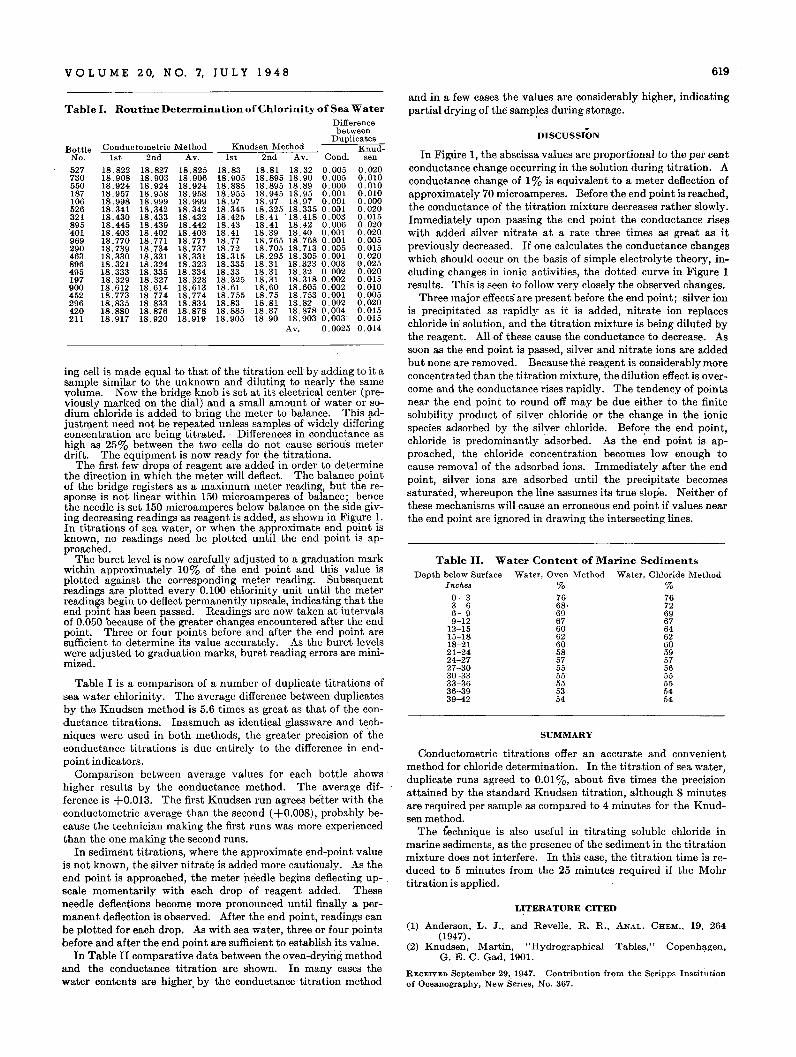
DISCUSSION
Table II. Water Content of Marine SediD1ents
619
RECEIVED September 29,. 1947. Contribution from the Scripps Instit~tion
of Oceanography, New Series, No. 367.
Water, Chloride Method·%7672696764626059575655555454
Water, Oven Method%7668·696760626058575555555354
Depth below SurfaceInches
0- 33- 66- 99-12
12-1515-1818-2121-2424-2727-3030-3333-3636-3939-42
LITERATURE CITED
(1) Anderson, L. J., and Revelle, R. R., ANAL. CHEM., 19, 264(1947) .
(2) Knudsen, Martin, "Hydrographical Tables," Copenhagen,G. E. C. Gad, 1901.
and in a few cases the values are considerably higher, indicatingpartial drying of the samp~esduring storage.
In FigUre 1, the abscissa values are proportional to the per centconductance change occurring in the solution during titration. Aconductance change of 1% is equivalent to a meter deflection ofapproximately 70 microamperes. Before the end point is reached,the conductance of the titration mixture decreases rather slowly.Immediately upon passing the end point the conductance riseswith added silver nitrate at a rate three times as great as itpreviously decreased. If one calculates the conductance changeswhich should occur on the basis of simple electrolyte theory, including changes in ionic activities, the dotted curve in Figure 1results. This is seen to follow very closely the observed changes.
Three major effects' are present before the end point; silver ionis precipitated as rapidly as it is added, nitrate ion replaceschloride in' solution, and the titration mixture is being diluted bythe reagent. All of these cause the conductance to decrease. Assoon as the end point is passed, silver and nitrate ions are addedbut none are removed. Because the reagent is considerably moreconcentrated than the titration mixture, the dilution effect is overcome and the conductance rises rapidly. The tendency of pointsnear the end point to round off may be due either to the finitesolubility product of silver chloride or the change in the ionicspecies adsorbed by the silver chloride. Before the end point,chloride is predominantly adsorbed. As the ~nd point is approached, the chloride concentration becomes low enough tocause removal of the adsorbed ions. Immediately after the endpoint, silver ions are adsorbed until the precipitate becomessaturated, whereupon the line assumes its true slope. Neither ofthese mechanisms will cause an erroneous end point if values nearthe end point are ignored in drawing the intersecting lines.
SUMMARY
Conductometric titrations offer an accurate and convenientmethod for chloride determination. In the titration of sea water,duplicate runs agreed to 0.01 %, about five times the precisionattained by the standard Knudsen titration, although 8 minutesare required per sample as compared to 4 minutes for the Knudsen method.
The technique is also useful in titrating soluble chloride inmarine sediments, as the presence of the sediment in the titrationmixture does not interfere. In this case, the titration time is reduced to 5 minutes from the 25 minutes required if the Mohrtitration is applied.
VOLUME 2O, NO. 7, JUL Y 1948
Table!. ROlltine DeterD1ination ofChlorinity ofSea WaterDifferencebetween
DuplicatesBottle Conductometric Method Knudsen Method Knud-
No. 1st 2nd Av. 1st 2nd Av. Condo sen
527 18.822 18.827 18.825 18.83 18.81 18.32 0.005 0.020730 18.908 18.903 18.906 18.905 18.895 18.90 0.005 0.010550 18.924 18.924 18.924 18.885 18.895 18.89 0.000 0.010187 18.957 18.958 18.958 18.955 18.945 18.95 0.001 0.010106 18.998 18.999 18.999 18.97 18.97 18.97 0.001 0.000526 18.341 18.342 18.342 18.345 18.325 18.335 0.001 0.020321 18.430 18.433 18.432 18.425 18.41 '18.4180.003 0.015895 18.445 18.439 18.442 18.43 18.41 18.42 0.006 0.020401 18.403 18.402 18.403 18.41 18.39 18.40 0.001 0.020969 18.770 18.771 18.771 18.77 18.765 18.768 0.001 0.005290 18.739 18.734 18.737 18.72 18.705 18.7130.005 0.015463 18.330 18.331 18.331 18.315 18.295 18.305 0.001 0.020896 18.321 18.324 18.323 18.335 18.31 18.323 0.003 0.025495 18.333 18.335 18.334 18.33 18.31 18.32 0.002 0.020197 18.329 18.327 18 ..328 18.325 18.31 18.318 0.002 0.015900 18.612 18.614 18.613 18.61 18.60 18.605 0.002 0.010452 18.773 18.774 18.774 18.755 18.75 18.753 0.001 0.005296 18.835 18.833 18.834 18.83 18.81 18.82 0.002 0.020420 18.880 18.876 18.878 18.885 18.87 18.878 0.004 0.015211 18.917 18.920 18.919 18.905 18.90 18.903 0.003 0.015
Av. 0.0025 0.014
ing cell is made equal to that of the titration cell by adding to it asample similar to the unknown and diluting to nearly the samevolume. Now the bridge knob is set at its electrical center (previously marked on the dial) and a small amount of water or sodium chloride is added to bring the meter to balance. This ~d
justment need not be repeated unless samples of widely differingconcentration are being titrated. Differences in conductance ashigh as 25% between the two cells do not cause serious meterdrift. The equipment is now ready for the titrations.
The first few drops of reagent are added in order to determinethe direction in which the meter will deflect. The balance pointof the bridge registers as a maximum meter reading, but the response is not linear within 150 microamperes of balance; hencethe needle is set 150 microamperes below balance on the side giving decreasing readings as reagent is added, as shown in Figure 1.In titrations of sea water, or when the approximate end point isknown, no readings need be plotted until the end point is approached.
The buret level is now carefully adjusted to a graduation markwithin approximately 10% of the end point and this value isplotted against the corresponding meter reading. Subsequentreadings are plotted every 0.100 chlorinity unit until the meterreadings begin to deflect permanently upscale, indicating that theend point has been passed. Readings are now taken at intervalsof 0.050 because of the greater changes encountered after the endpoint. Three or four points before and after the end point aresufficient to determine its value accurately. As the buret levelswere adjusted to graduation marks, buret reading errors are minimized.
Table I is a comparison of a number of duplicate titrations ofsea water chlorinity. The average difference between duplicatesby the Knudsen method is 5.6 times as great as that of the conductance titrations. Inasmuch as identical glassware and techniques were used in both methods, the greater precision of theconductance titrations is due entirely to the difference in endpoint indicators.
Comparison between average values for each bottle showshigher results by the conductance method. The average difference is +0.013. The first Knudsen run agrees better with theconductometric average than the second (+0.008), probably because the technician making the first runs was more experiencedthan the one making the second runs.
In sediment titrations, where the approximate end-point valueis not known, the silver nitrate is added more cautiously. As theend point is approached, the meter '!leedle begins deflecting upscale momentarily with each drop of reagent added. Theseneedle deflections become more pronounced until finally a permanent deflection is observed. After the end point, readings canbe plotted for each drop. As with sea water, three or four pointsbefore and after the end point are sufficient to establish its value.
In Table II comparative data between the oven-dr.ying methodand the conductance titration are shown. In many cases thewater contents are higher. by the conductance titration method
Determination of Chiorogenic Acid in CoffeeR. G. MOORES, DOROTHY L. McDERMOTT, AND T. R. WOOD'
Central Laboratories, General Foods Corporation, Hoboken, N. J.
A new Illethod for the rapid and precise detel'Illination of chlorogenic acid ingreen and roasted coffee is based upon the absorption of chlorogenic acid at 324IllilIiIllicrons. The chlorogenic acid is extracted froIll flaked coffee saIllples withwater, and for green coffee the ultraviolet absorption is Illeasured directly on theextract. For roasted coffee, the absorption is nleasured on the extract beforeand after precipitation of the chlorogenic acid with basic lead acetate. TheSlotta and Neisser iodOinetric oxidation nlethod for chlorogenic acid has been,investigated and inlp,·oved.
CHLOROGENIC acid, which occurs i~l green coffee to, theextent of 5 to 8%, is one of the major water-soluble con
'stituents of the bean. Its importance in coffee chemistry has longbeen recognized, and considerable attention has been devoted to itin the literature.
The compound was first isolated by Gorter (7), who found itwidely distributed in the leaves and seeds of numerous plants.Freudenberg (6) and Fischer (5) described the structure of thecompound as the quinic acid ester of caffeic acid.
Charaux (.4-) was one of the first workers to atteJ.Ilpt the measurement of chlorogenic acid in plant m!,terials. HIs me.tI~od ~"asbased upon the separation of the aCId by lead prec~pltatlOn,
regeneration of the free acid, saponification, am;! extr.actlOn of theresulting caffeic acid with ether. The caffeIC aCId ~as thenweighed directly. This metho~ can.have only preparatIV~valuebecause of losses during sapomficatlOn and ether extractIOn.
Hoepfner (8) in 1932 developed a method based upon the r.edcolor formed when chlorogenic acid is treated with nitrous aCId.Plucker and Keilholz (12) questioned the reliability of thismethod for roasted coffee, because catechol and protocatechuicacid, likely to be present in the r~asted product, give re~ colorsunder the conditions of the reactIOn. These authors devIsed allindirect method based upon the hydrolysis of the chlorogenicacid extraction of the resulting caffeic acid with ether, and a finalesti~1ation by the nitrite color reaction. Efforts to carry outthese steps quantitatively in this laboratory were unsuccessful.
Jurany (9) proposed a method based upon the separa~ion ofchlorogenic acid as its lead salt, regeneration of the free aCId, anda final estimation of the chlorogenic acid by optical rotation ortitration with alkali. These methods cannot be considered validin view of the presence in coffee of isome~s of chlorogen!c a~idwhich have different rotatory powers and dIfferent neutralIzatIOnequivalents as shown by recent work in this laboratory (3).
Slotta an'd Neisser (15) recognized the unreliability of thl:! results obtained by earlier methods and developed a new techmquefor measuring chlorogenic acid. This method cons~st.s o.f aSoxhlet water extraction of a defatted sample, lead preCIpItatIOn,regeneration with hydrogen sulfide, a~d estin:ation o.f ~heliberated chlorogenic acid by its reaction wIth alkaline hYPOlodlte.
Early experience with the Slotta and N eisser method revealedcertain weaknesses and indicated the need for modifications.Therefore, the initial efforts in the current investigation weredirected toward improvement of the method.
The manipulative difficulties inherent in the Slotta an~ Neissermethod made' it desirable to devise a new analytical procedure forchlorogenic acid. It was found that chlorogenic acid has intenselight absorption at 324 millimicrons. Additional work was undertaken in order to develop an analytical method for chlorogenicacid based upon ultraviolet absorption measurements. This paperreviews briefly t,he recommended modifications of the Slotta andNeisser iodometric method and presents a new ultraviolet absorption method for chlorogenic acid.
Subsequent to the development of this ultraviolet method,Rudkin and Nelson (13) reported a maximum absorption at about
1 Present address. Research Laboratory. Merck and Compariy, Ra.hway,N. J.
620
325 millimicrons of a mixture of phenolic compounds, includingchlorogenic acid, which they found in sweet potatoes.
PURIFICATION ANp PROPERTIES OF CHLOROGENIC ACID
Three samples of chlorogenic acid were isolated from greencoffee by two different methods and purified by repeated crystallization to serve as analytical standards. Sample 1 and a furtherrecrystallized fraction, No.2, were isolated through the potassiumcaffeine complex, while sample 3 Was separated by solvent partition. ' As chlorogenic acid is not available commercially, an extraction and purification procedure is included in this paper.The isolation of chlorogenic acid from coffee through the potassium caffeine complex is a modification, by Kremers (10) of thislaboratory, of previously reported methods (6, 7).
Extract 1 kg. of flaked green coffee by stirring with 6 liters of70% isopropanol for about 3 hours, filter on a Buchner funnel, andextract the residue again for a short time with 6 liters of 70% isopropanol. Concentrate the total extract by vacuum distillationto 2.4 liters and cool to about 50 C. for several hours. Remove theprecipitated fats by filtering with a filter aid. Concentrate thefiltrate under vacuum to about 300 mI. Dissolve in this concentrate, by heating .if necessary, 8, grams of potassium acetate and20 grams of caffeme. Add 300 ml. of 95% ethanol and keep atabout 50 C. for 2 days for crystallization of the crude complex.
Collect the crude co~lexby filtration on a Buchner funnel andwash with a little 50% ethanol. Dissolve the complex in theminimum volume of hot water and add 'sufficient 95% ethanolwith stirring to initiate precipitation. Keep the solution at 50 C.overnight, collect the reprecipitated complex by filtration, anddry at room temperature. About 70 grams of complex are ob-tained from 1 kg. of ooffee. .
Add 100 grams of the complex in small portions to 225 mI. of hotwater containing 24 grams of tartaric acid, cool for severalminutes and remove the potassium bitartrate by filtration.Extract'the filtrate with chloroform in a liquid-liquid extractorfor about 30 hours or until the caffeine is completely removed.Keep the aqueous phase at 50 C. for 1 day for crystallization. ofthe chlorogenic acid. Collect the acid by filtration, wash WIth,cold water and dry at 70 0 C. in a vacuum oven. The chlorogenicacid as obtained melts at 203-206 0 C.
Recrystallization from water two or three times gives a pureproduct, as indicated by Table 1. The samples as used were driedfor 16 hours in a vacuum oven at 70 0 C. and were found to contain 0.5 molecule of water of crystallization, which was measuredby drying to constant weight in vacuum over phosphorus pentoxide at 135 0 to 140 0 C. A weight loss of 2.4 to 2.7% was observed; the theoretical moisture content for the hemihydrate is2.48%. The presence of 0.5 molecule of water of crystallizationin the oven-dried samples is further verified by titration data,which show a neutralization equivalent of 360 to 367; the calculated value for the hemihydrate is 363. A titration Clil've forsample 1 is shown in Figure 1. For uniformity of comparativedata, all the chiorogenic acid values on coffee samples reportedherein are expressed in terms of the anhydrous compound,C,.H,sOg, molecular weight 354.
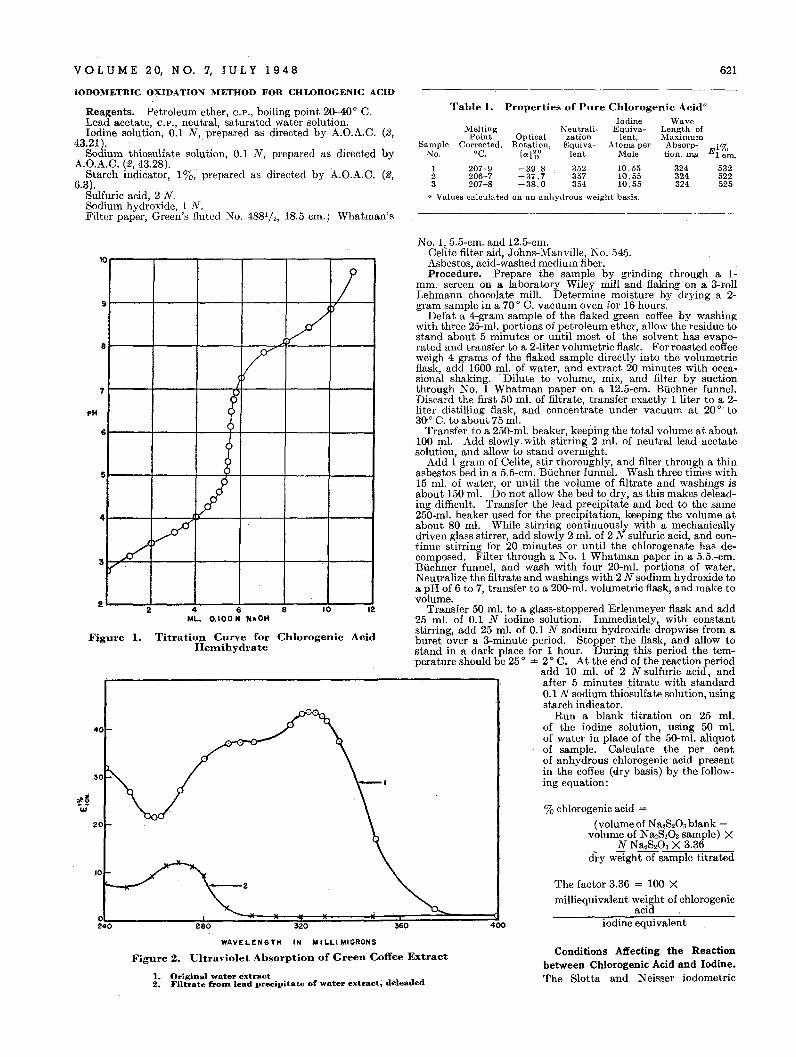
VOL U M E 2 0, N O. 7, J U L Yl 9 4 8 621
IODOMETRIC OXIDATION METHOD FOR CHLOROGENIC ACID
Reagents. Petroleum ether, c.p., boiling point 20-40° C.Lead acetate, c.p., neutral, saturated water solution.Iodine solution, 0.1 N, prepared as directed by A.O.A.C. (2,
43.21).Sodium thiosulfate solution, 0.1 N, prepared as directed by
A.O.A.C. (2,43.28). ,Starch indicator, 1%, prepared as directed by A.O.A.C. (2,
6.3). 'Sulfuric acid, 2 N.Sodium hydroxide, 1 N.Filter paper, Green's fluted No. 4881/z, 18'.5 em.; Whatman's
Table 1. Properties of Pure Chlorogenic Acid"
Iodine WaveIVlelting Neutrali- Equiva- Length ofPoint Optical zation lent, Maximum
Sample Corrected, Rotation, Equiva~ Atoms per Absorp-E 1%No. °e. [albO lent Mole tion, n1JJ. 1 em.
1 207-9 -39.8 352 10,55 324 5322 206-7 -37.7 357 10.55 324 5223 207-8 -38.0 354 10.55 324 525
a Values calculated on an anhydrous weight basis.
~4'~0::-------~2±80::--':::~~===:::;3!20~====~!:::::~'3:li6:;;0===:::===~400
dry weight of sample titrated
iodine equivalent
The factor 3.36 = 100 Xmilliequivalent weight of chlorogenic
acid .
%chlorogenic acid =
(volume of Na2S203 blankvolume of Na2S203 sample) X
N Na"S203 X 3.36
No.1, 5.5-cm. and 12.5-cm.Celite filter aid, Johns-Manville, No. 545.Asbestos, acid-washed medium fiber.Procedure. Prepare the sample by grinding through a 1
mm. screen on a laboratory Wiley mill and flaking on a 3-1'011Lehmann chocolate mill. Determine moisture by drying a 2gram sample in a 70° C. vacuum oven for 16 hours.
Defat a 4-gram sample of the flaked green coffee by washingwith three 25-ml. portions of petroleum ether, allow the residue tostand about 5 minutes or until most of the solvent has evaporated and transfer to a 2-liter volumetric flask. For roasted coffeeweigh 4 grams of the flaked sample directly into the volumetricflask, add 1600 ml. <;>f water, and extract 20 minutes with occasional shaking. 'Dilute to volume, mix, and filter by suctionthrough No. 1 Whatman paper on a 12.5-cm. Buchner funnel.Discard the first 50 ml. of filtrate, transfer exactly 1 liter to a 2liter distilling flask, and concentrate under vacuum at 20°' to3(}0 C. to about 75 ml.
Transfer to a 250-ml. beaker, keeping the total volume at about100 ml. Add slowly with stirring 2 ml. of neutral lead acetatesolution, and allow to stand overnight.
Add 1 gram of Celite, stir thoroughly, and filter throug!t a thinasbestos bed in a 5.5-cm. Buchner funnel. Wash three times with15 ml. of water, or until the volume of filtrate and washings isabout 150 ml. Do not allow the bed to dry, as this makes deleading difficult. Transfer the lead precipitate and bed to the same250-ml. beaker used for the precipitation, keeping the volume atabout 80 ml. While stirring continuously with a mechanicallydriven glass stirrer, add slowly 2 ml. of 2 N sulfuric acid, and continue stirring for 20 minutes or until the chlorogenate has decomposed. Filter through a No.1 Whatman paper in a 5.5.-cm.Buchner funnel, and wash with four 20-ml. portions of water.Neutralize the filtrate and washings with 2 N sodium hydroxide toa pH of 6 to 7, transfer to a 200-ml. volumetric flask, and make tovolume.
Transfer 50 ml. to a glass-stoppered Erlenmeyer flask and add25 ml. of 0.1 N iodine solution. Immediately, with constantstirring, add 25 ml. of 0.1 N sodium hydroxide dropwise from aburet over a 3-minute period. Stopper the flask, and allow tostand in a dark place for 1 hour. During this period the temperature should be 25 0
± 2 ° C. At the end of the reaction periodadd 10 ml. of 2 N sulfuric. acid, andafter 5 minutes titrate with standard0.1 Nsodium thiosulfate solution, usingstarch indicator.
Run a blank titration on 25 ml.of the iodine solution, using 50 ml.of water in place of the 50-ml. aliquotof sample. Calculate the per centof anhydrous chlorogenic acid presentin the coffee (dry basis) by the following equation:
1210
2
4 6 8ML. 0.100 N NoOH
Titratio:n Curve for CWorogenic AcidHeInihydrate
2
0
!9
/V
~
6
2
//
VIf'
3
2
10
40
20
Figure 1.
5
pH
7
8
4
WAVELENG TH IN M I LLI MICRONS
Figure 2. Ultraviolet Absorption of Green Coffee Extract
1. Original water extract2. Filtrate from lead precipitate of water extract; deleaded
Conditions Affecting the Reactionbetween Chlorogenic Acid and Iodine.The Slotta and N eisser iodometric
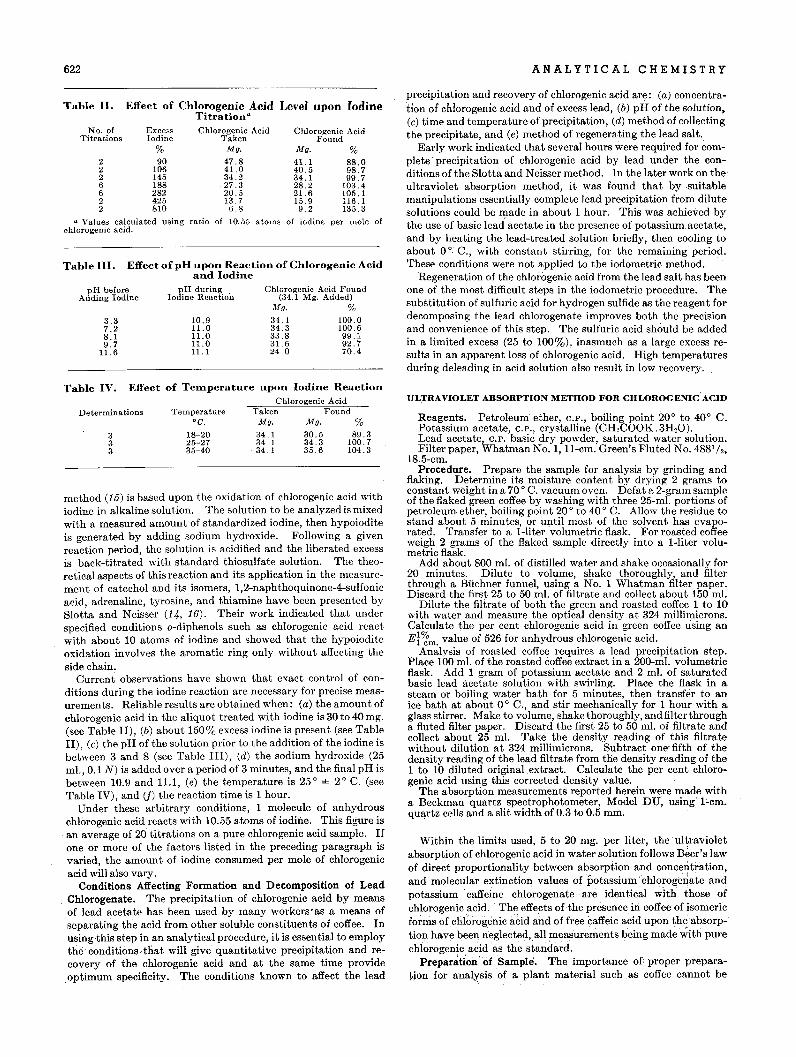
622 ANALYTICAL CHEMISTRY
a Values calculated using ratio of 10.55 atoms of iodine per mole ofchIorogenic acid.
Table III. Effect of pH upon Reaction of Chlorogenic Acidand Iodine
Table II. Effect of Chiorogenic AcidTitration"
No. of Excess Chlorogenic AcidTitrations Iodine Taken
% Mg.
2 90 47.82 106 41.02 145 34.26 188 27.36 282 20.52 425 13,72 810 6.8
method (15) is based upon the oxidation of chlorogenic acid withiodine in alkaline solution. The solution to be analyzed is mixedwith a measured amount of standardized iodine, then hypoioditeis generated by adding sodium hydroxide. Following a givenreaction period, the solution is acidified and the liberated excessis back-titrated with standard thiosulfate solution. The theoretical aspects of this reaction and its application in the measurement of catechol and its isomers, I,2-naphthoquinone-4-sulfonicacid, adrenaline, tyrosine, and thiamine have been presented bySlotta and Neisser (14, 16). Their work indicated that underspecified conditions o-diphenols such as chlorogenic acid reactwith about 10 atoms of iodine and showed that the hypoioditeoxidation involves the aromatic ring only without affecting theside chain.
Current observations have shown that exact control of conditions during the iodine reaction are necessary for precise measurements. Reliable results are obtained when: (a) the amount ofchlorogenic acid in the aliquot treated with iodine is 30 to 40 mg.(see Table II), (b) about 150% excess iodine is present (see TableII), (c) the pH of the solution prior to the addition of the iodine isbetween 3 and 8 (see Table III), (d) the sodium hydroxide (25mI., 0.1 N) is added over a period of 3 minutes, and the final pH isbetween 10.9 and 11.1, (e) the temperature is 25 0
± 2 0 C. (seeTable IV), and (f) the reaction time is 1 hour.
Under these arbitrary conditions, 1 molecule of anhydrouschlorogenic acid reacts with 10.55 atoms of iodine. This figure isan average of 20 titrations on a pure chlorogenic acid sample. Ifone or more of the factors listed in the preceding paragraph isvaried, the amount of iodine consumed per mole of chlorogenicacid will also vary.
Conditions Affecting Formation and Decomposition of LeadChlorogenate. The precipitation of chlorogenic acid by meansof lead acetate has been used by many workers'as a means ofseparating the acid from other soluble constituents of coffee. Inusing-this step in an analytical procedure, it is essential to employthe conditions· that will give quantitative precipitation and recovery' of the chlorogenic acid and at the same time provideoptimum specificity. The conditions known to affect the lead
Effect of Temperature upon Iodine ReactionChlorogenic Acid
pH beforeAdding Iodine
3.37.28.19.7
11.6
Table IV.
Determinations
333
pH duringIodine Reaction
10.911.011.011.011.1
Temperatureae.
18-2025-2735-40
Level upon Iodine
Chlorogenic AcidFound
Mg. %41.1 88.040.5 98.734.1 99.728.2 103.421.6 105.115.9 116.19,2 135.3
Chlorogenic Acid Found(34.1 Mg. Added)
Mg. %34.1 100.034.3 100.633.8 99.131.6 92.724.0 70.4
Taken FoundMg. Mg. %
34 . 1 30.5 89.334.1 34.3 100.734.1 35.6 104.3
precipitation and recovery of chlorogenic acid are:, (a) concentration of chlorogenic acid and of excess lead, (b) pH of the solution,(c) time and temperature of precipitation, (d) method of collectingthe precipitate, and (e) method of regenerating the lead salt.
Early work indicated that several hours were required for complete .precipitation of chiorogenic acid by lead under the conditions of the Slotta and Neisser method. In the later work on theultraviolet absorption method, it was found that by suitablemanipulations essentially complete lead precipitation from dilutesolutions could be made in about 1 hour. This was achieved bythe use of basic lead acetate in the presence of potassium acetate,and by heating the lead-treated solution briefly, then cooling toabout 0 0 C., with constant stirring, for the remaining period.These conditions were not applied to the iodometric method.
Regeneration of the chlorogenic acid from the lead salt has beenone of the most difficult steps in theiodometric procedure. Thesubstitution of sulfuric acid for hydrogen sulfide as the reagent fordecomposing the lead chlorogenate improves both the precisionand convenience of this step. The sulfuric acid should be addedin a limited excess (25 to 100%), inasmuch as a large excess results in an apparent loss of chlorogenic acid. High temperaturesduring deleading in acid solution also result in low recovery.
ULTRAVIOLET ABSORPTION METHOD FOR CHLOROGENIC'ACID
Reagents. Petroleum' ether, c.p., boiling point 20 0 to 40 0 C.Potassium acetate, c.p., crystalline (CR,COOK. 3H20).Lead acetate, C.P. basic dry powder, saturated water solution.Filter paper, Whatman No.1, ll-cm. Green's Fluted No. 4881/ 2,
18.5-cm.Procedure. Prepare the sample for analysis by grinding and
flaking. Determine its moisture content by drying 2 grams toconstant weight in a 70 a C. vacuum oven. Defat a 2-gram sampleof the flaked green coffee by washing with three 25-mL portions ofpetroleum ether, boiling point 20 0 to 40 0 C. Allow the residue tostand about 5 minutes, or until most of the solvent has evaporated. Transfer to a I-liter volumetric flask. For roasted coffeeweigh 2 grams of the flaked sample directly into a I-liter volumetric flask.
Add about 800 mL of distilled water and shake occasionallv for20 minutes. Dilute to volume, shake thoroughly, and filterthrough a Buchner funnel, using a No.1 Whatman filter paper.Discard the first 25 to 50 mL of filtrate and collect about 150 ml.
Dilute the filtrate of both the green and roasted coffee 1 to 10with water and measure the optical density at 324 millimicrons.Calculate the per cent chlorogenic acid in green coffee using anEr~m. value of 526 for anhydrous chlorogenic acid.
Analysis of roasted coffee requires a lead precipitation step.Place 100 ml. of the roasted coffee extract in a 200-ml. volumetricflask. Add 1 gram of potassium acetate and 2 ml. of saturatedbasic lead acetate solution with swirling. Place the flask in asteam or boiling water bath for 5 minutes, then transfer to anice bath at about 0 0 C., and stir mechanically forI hour with aglass stirrer. Make to volume, shake thoroughly, and filter througha fluted filter paper. Discard the first 25 to 50 ml. of filtrate andcollect about 25 ml. Take the density reading of this filtratewithout dilution at 324 millimicrons. Subtract one' fifth of thedensity reading of the lead filtrate from the density reading of the1 to 10 diluted original extract. Calculate the per cent chlorogenic acid using this corrected density value.
The absorption measurements reported herein were made witha Beckman quartz spectrophotometer, Model DU, using' I-em.quartz cells and a slit width of 0.3 to 0.5 mm;
Within the limits used, 5 to 20 mg. per liter, the ultravioletabsorption of chlorogenic acid in water solution follows Beer's lawof direct proportionality between absorption and concentration,and molecular extinction values of'potassium chlorog~nate andpotassium .caffeine chlorogenate,· are identical with those ofchlorogenic acid. The effects of the presence in coffee of isomericforms of chlorogenic acid and of free caffeic acid upon theabsorptionhave beell neglected, all measurements being made with purechlorogenic acid 'as the standa~d.
Prepar~tion'of Sample. The importance of proper preparaHon for anal:j'sis of a plant material such as coffee cannot be
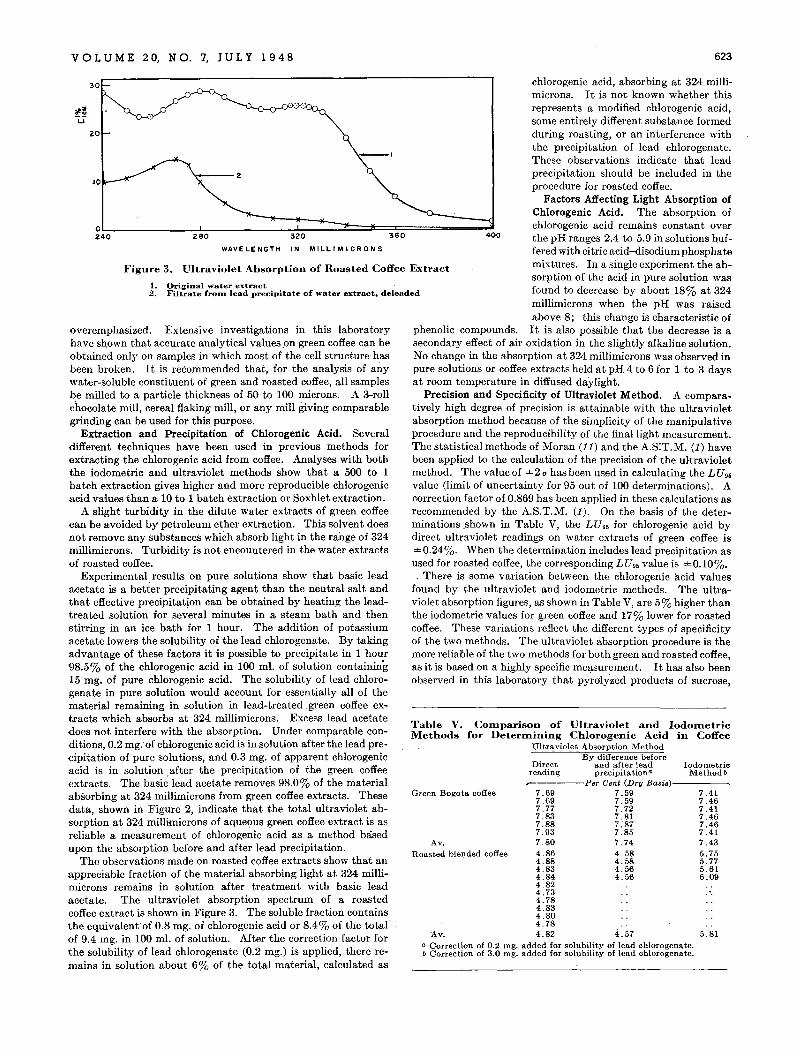
VOL U M E 20, NO.7, J U L Y 1 94 8 623
5.81
7.417.467.417.467.467.417.435.755.775.616.09
IodometricMethodb
Directreading
7.697.697.777.837.887.937.804.864.884.834.844.824.734.784.834.804.78
Av. 4.82 4.57a Correction of 0.2 mg. added for solubility of lead chlorogenate.b Correction of 3.0 mg. added for solubility of lead chlorogenate.
Av.Roasted blel).ded coffee
Green Bogota coffee
chlorogenic acid, absorbing at 324 millimicrons. It is not known whether thisrepresents a .modified chlorogenic acid,some entirely different substance formedduring roasting, or an interference withthe precipitation of lead chlorogenate.These observations indicate that leadprecipitation should be included in theprocedure for roasted coffee.
Factors Affecting Light Absorption ofChiorogenic Acid. The absorption ofchlorogenic acid remains constant overthe pH ranges 2.4 to 5.9 in solutions buf-fered with citric acid-disodium phosphatemixtures. In a single experiment the absorption of the acid in pure solution wasfound to decrease by about 18% at 324millimicrons when the pH was raisedabove 8; this change is characteristic of
phenolic compounds. It is also possible that the decrease is asecondary effect of air oxidation in the slightly alkaline solution.No change in the absorption at 324 millimicrons was observed inpure solutions or coffee extracts held at pH 4 to 6 for 1 to 3 daysat room temperature in diffused daylight.
Precision and Specificity of Ultraviolet Method. A comparatively high degree of precision is attainable with the ultravioletabsorption method because of the simplicity of the manipulativeprocedure and the reproducibility of the final light measurement.The statistical methods of Moran (11) and the A.S:T.M. (1) havebeen applied to the calculation of the precision of the uJ.travioletmethod. The value of ±2 <T has been used in calculating the LU'6value (limit of uncertainty for 95 out of 100 determinations). Acorrection factor of 0.869 has been applied in these calculations asrecommended by the A.S.T.M. (1). On the basis of the determinations .shown in Table V, the LU'6 for chiorogenic acid bydirect ultraviolet readings on water extracts of green coffee is±0.24%. When the determination includes lead precipitation asused for roasted coffee, the corresponding LU'6 value is ±0.1O%.. There is some variation between the chlorogenic acid values
found by the ultraviolet and iodometric methods. The ultraviolet absorption figures, as shown in Table V, are 5% higher thanthe iodometriD values for green coffee and 17% lower for roastedcoffee. These variations reflect the different types of specificityof the two methods. The ultraviolet absorption procedure is themore reliable of the two methods for both green and roasted coffee,as it is based on a highly specific measurement. It has also beenobserved in this laboratory that pYrolyzed products of sucrose,
Table V. Comparison of Ultraviolet and IodometricMethods for Determining Chlorogenic Acid in Coffee
Ultraviolet Absorption MethodBy difference before
and after leadprecipitationa
----Per Cent (Dry Basis)---7.597.597.727.817.877.857.744.584.584.564.56
WAVE LE NGTH
Figure 3. Ultraviolet Absorption of Roasted Coffee Extract
1. Original water extract .2. Filtrate fro.lIl lead precipitate of water extract, deleaded
'O~ ~:-__~==~~~=~:::t:=::l!:=:::==;;==~==::==~240 280 320 360 400
IN MILLIMICRONS
30
20
overemphasized. Extensive investigations in this laboratoryhave sb,own that accurate analytical values.on green coffee can beobtained only on samples in which most of the cell structure hasbeen broken. It is recommended that, for the analysis of anywater-soluble constituent of green and roasted coffee, all samplesbe milled to a particle thickness of 50 to 100 microns. A 3-rollchocolate mill, cereal flaking mill, or any mill giving comparablegriI).ding can be used for this purpose.
Extraction and Precipitation of Chlorogenic Acid. Severaldifferent techniques have been used in previous methods forextracting the chlorogenic acid from coffee. Analyses with boththe iodometric and ultraviolet methods show that a 500 to 1batch extraction gives higher and more reproducible chlorogenicacid values than a 10 to 1 batch extraction or Soxhlet extraction.
A slight turbidity in the dilute water extracts of green coffeecan be avoided by petroleum ether extraction. This solvent doesnot remove any substances which absorb light in the range of 324millimicrons. Turbidity is not encountered in the water extractsof roasted coffee.
Experimental results on pure solutions show that basic leadacetate is a better precipitating agent than the neutral salt andthat effective precipitation can be obtained by heating the leadtreated solution for several minutes in a steam bath and thenstirring in an ice bath for 1 hour. The addition of potassiumacetate lowers the solubility of the lead chlorogenate. By takingadvantage of these factors it is possible to precipitate in 1 hour98.5% of the chlorogenic acid in 100 m!. of solution containing15 mg. of pure chlorogenic acid. The solubility of lead chlorogenate in pure solution would account for essentially all of thematerial remaining in solution in lead-treated green coffee extracts which absorbs at 324 millimicrons. Excess lead acetatedoes not interfere with the absorption. Under comparable conditions, 0.2 mg. of cl;J.lorogenic acid is insoJution after the lead predpitation of pure solutions, and 0.3 mg. of apparent chlorogenicacid is in solution after the precipitation of the green coffeeextracts. The basi~ lead acetate removes 98.0% of the materialabsorbing at 324 millimicrons from green coffee extracts. Thesedata, shown in Figure 2, indicate that the total ultraviolet absorption at 324 millimicrons of aqueous green coffee extract is asreliable a measurement of chlorogenic acid as a method basedupon the absorption before and after lead precipitation.
The observations made on roasted coffee extracts show that anappreciable fraction of the material absorbing light at 324 millimicrons remains in solution after treatment with basic leadacetate. The ultraviolet absorption spectrum of a roastedcoffee extract is shown in Figure 3. The soluble fraction containsthe equivalent· of 0.8 mg. of chlorogenic acid or 8.4% of the totalof 9.4 mg. in 100 m!. of solution. After the correction factor forthe solubility of lead chlorogenate (0.2 mg.) is applied, there remains in solution about 6% of the total material, calculated as
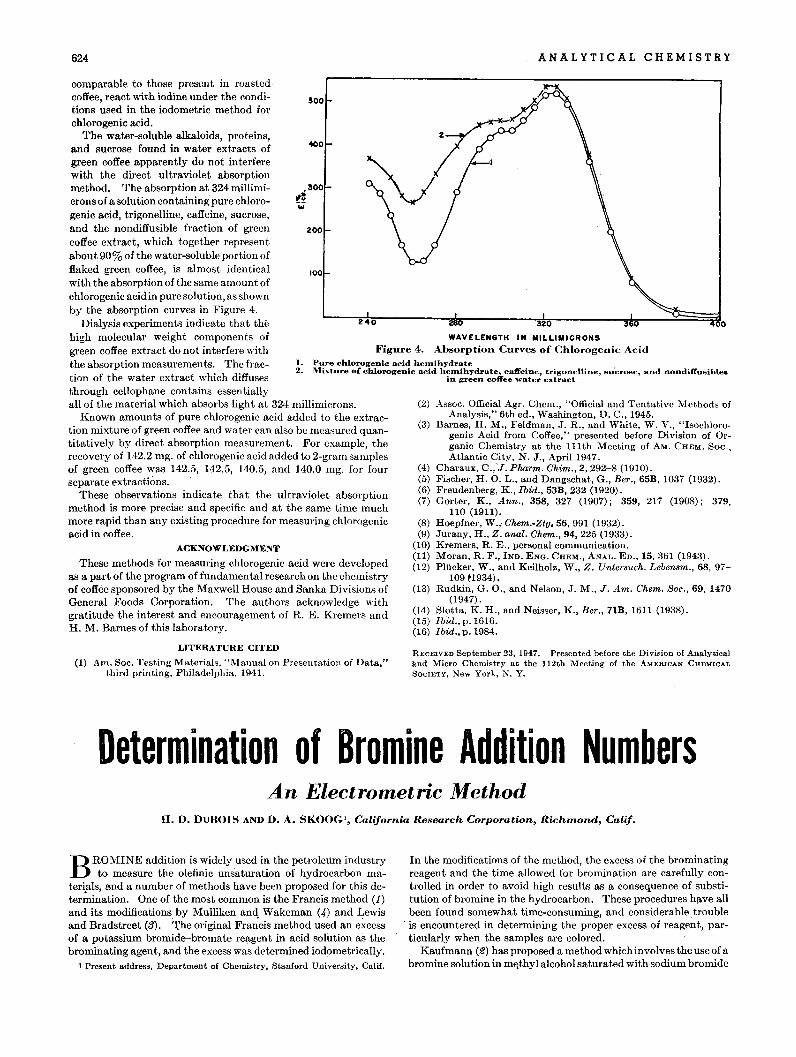
624 ANALYTICAL CHEMISTRY
I. Pure chlorogenic acid hemihydrate2. Mixture of chlorogenic acid helD.ihydrate, caffeine, trigonelline, sucrose, and nondiffusible.
in green coffee water extract
ACKNOWLEDGMENT
These methods for measuring chlorogenic acid were developedas a part of the program of fundamental research on the chemistryof coffee sponsored by the Maxwell House and Sanka Divisions ofGeneral Foods Corporation. The authors acknowledge withgratitude the interest and encouragement of R. E. Kremers andH. M. Barnes of this laboratory.
280 20
WAVELENGTH IN MILLIMICRONS
Absorption Curves of Chlorogenic Acid
(2) Assoc. Official Agr. Chern., "Official and Tentative Methods ofAnalysis," 6th ed., Washington, D. C., 1945.
(3) Barnes, H. M., Feldman, J. R., and White, W. V., "Isochlorogenic Acid from Coffee," presented before Division of Organic Chemistry at the,Ulth Meeting of AM. CHEM. Soc.,Atlantic City, N. J., April 1947.
(4) Charaux, C., 'J. Pharm. Chim., 2, 292-8 (1910).(5) Fischer, H. O. L., and Dangschat, G., Ber., 65B, 1037 (1932).(6) Freudenberg, K., Ibid., 53B, 232 (1920).(7) Gorter, K., Ann., 358, 327 (1907); 359, 217 (1908); 379,
UO (1911).(8) Hoepfner, W., Chem.-Ztg. 56,991 (1932).(9) Jurany, H., Z. anal. Chem., 94, 225 (1933).
(10) Kremers, R. E., personal communication.(11) Moran, R. F., IND. ENG. CHEM., ANAL. ED., 15, 361 (1943).(12) Plucker, W., and Keilholz, W., Z. Untersuch. Lebensm., 68, 97
109 ~1934).
(13) Rudkin, G. 0., and Nelson, J. M., J. Am. Chem. Soc., 69, 1470(1947) .
(14) Slotta, K. H., and Neisser, K., Ber., 7lB, 1611 (1938).(15) Ibid., p. 1616.(16) Ibid., p. 1984.
Figure 4.
240
100
400
200
!l00
.!l00~~...
comparable to those present in roastedcoffee, react with iodine under the conditions used in the iodometric method forchlorogenic acid.
The water-soluble alkaloids, proteins,and sucrose found in water extracts ofgreen coffee apparently do not interferewith the direct ultraviolet absorptionmethod. The absorption at 324 millimicrons of a solution containing pure chlorogenic acid, trigonelline, caffeine, sucrose,and the nondiffusible fraction of greencoffee extract, which together representabout 90% of the water-soluble portion offlaked green coffee, is almost identicalwith the absorption of the same amount ofchlorogenic acid in pure solution, as shownby the absorption curves in Figure 4.
Dialysis experiments indicate that thehigh molecular weight components ofgreen coffee extract do not interfere withthe absorption measurements. The fraction of the water extract which diffusesthrough cellophane contains essentiallyall of the material which absorbs light at 324 millimicrons.
Known amounts of pure chiorogenic acid added to the extraction mixture of green coffee and water can also be measured quantitatively by direct absorption measurement. For example, therecovery of 142.2 mg. of chlorogenic acid added to 2-gram samplesof green coffee was 142.5, 142.5, 140.5, and 140.0 mg. for fourseparate extractions.
These observations indicate that the ultraviolet absorptionmethod is more precise and specific and at the same time muchmore rapid than any existing procedure for measuring chlorogenicacid in coffee.
LITERATURE CITED
(1) Am. Soc. Testing Materials. "Manual on Presentation of Data,"third printing, Philadelphia. 1941.
RECEIVED September 23, 1947. Presented before the Division of Analyticaland Micro Chemistry at the 112th Meeting of the AMERICAN CHEMICALSOCIETY, New York, N. Y.
Determination of Bromine Addition NumbersAn Electrometric Method
H. O. DUBOIS AND D. A. SKOOG', California Research Corporation, Richtnond, Calif.
BROMINE addition is widely used in the petroleum industryto measure the olefinic unsaturation of hydrocarbon ma
terials, and a number of methods have been proposed for this deter~ination. One of the most common is the Francis method (1)and its modifications, by Mulliken and, Wakeman (4) and Lewisand Bradstreet (3). 'l;'he original Francis method used an excessof a potassium bromide-bromate reagent in acid solution as thebrominating agent, and the excess was determined iodometrically.
I Present address, Department of Chemistry, Stanford University, Calif.
In the modifications of the method, the excess of the brominatingreagent and the time allowed for bl'omination are carefully controlled in order to avoid high results as a consequence of substitution of bromine in the hydrocarbon. These procedures h,tve allbeen found somewhat time-consuming, and considerable troubleis encountered in determining the proper excess of reagent, particularly when the samples are colored.
Kaufmann (2) has proposed a method which involves the use of abromine solution in ml'\thyl alcohol saturated with sodium bromide
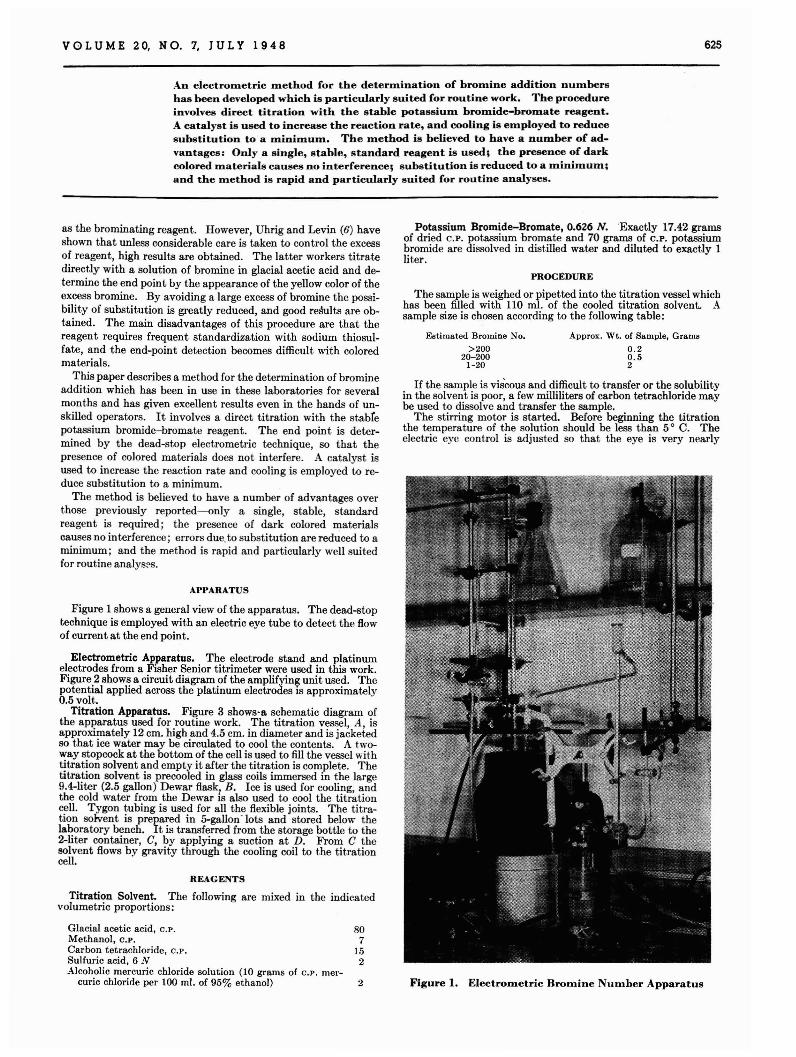
VOL U M E 2 0, N O. 7, J U L Y 1 9 4 8 625
An electrometric method for the determination of bromine addition numbershas been developed which is particularly suited for routine work. The procedureinvolves direct titration with the stable potassium bromide-bromate reagent.A catalyst is used to increase the reaction rate, and cooling is employed to reducesubstitution to'a minimum. The method is believed to have a number of advantages: Only a single, stable, standard reagent is used; the presence of darkcolored materials causes no interference; substitution is reduced to a minimum;and the method is rapid and particularly suited for routine analyses.
Figure 1. Electrometric Bromine Number Apparatus
Potassium Bromide-Bromate, 0.626 N. 'Exactly 17.42 gramsof dried C.P. potassium bromate and 70 grams of C.P. potassiumbromide are dissolved in dist.illed water and diluted to exactly 1liter.
PROCEDURE
The sample is weighed or pipetted into the titration vessel whichhas been filled with 110 m!. of the cooled titration solvent. Asample size is chosen according to the following table:
Appro". Wt. of Sample, Grams
0.20.52
Estimated Bromine No.
>20020-200
1-20
If the sample is viscous and difficult to transfer or the solubilit.yin the solvent is poor, a few milliliters of carbon tetrachloride maybe used to dissolve and transfer the sample.
The stirring motor is started. Before beginning the titrationthe temperature of the solution should be less than 50 C. Theelectric eye control is adjusted so that the eye is very nearly
Glacial acetic acid, C.P. 80Methanol, C.P. 7Carbon tetrachloride. C.P. 15Sulfuric acid, 6 N 2Alcoholic mercuric chloride solution (10 grams of C.P. mer-
curic chloride per 100 ro!. of 95% ethanol) 2
as the brominating reagent. However, Uhrig and Levin (6) haveshown that unless considerable care is taken to control the excessof reagent, high results are obtained. The latter workers titratedirectly with a solution of bromine in glacial acetic acid and determine the end point by the appearance of the yellow color of theexcess bromine. By avoiding a large excess of bromine the possibility of substitution is greatly reduced, and good re~ults are obtained. The main disadvantages of this procedure are that thereagent requires frequent standardization with sodium thiosulfate, and the end-point detection becomes difficult with coloredmaterials.
This paper describes a method for the determination of bromineaddition which has been in use in these laboratories for severalmonths and has given excellent results even in the hands of unskilled operators. It involves a direct titration with the stabfepotassium bromide-bromate reagent. The end point is determined by the dead-stop electrometric technique, so that thepresence of colored materials does not interfere. A catalyst isused to increase the reaction rate and cooling is employed to reduce substitution to a minimum.
The method is believed to have a number of advantages overthose previously reported-only a single, stable, standardreagent is required; the presence of dark colored materialscauses no interference; errors due, to substitution are reduced to aminimum; and the method is rapid and particularly well suit.edfor routine analys~s.
APPARATUS
Figure I shows a general view of the apparatus. The dead-stoptechnique is employed with an electric eye tube to detect the flowof current at the end point.
Electrometric Apparatus. The electrode stand and platinumelectrodes from a Fisher Senior titrimeter were used in this work.Figure 2 shows a circuit diagram of the amplifying unit used. Thepotential applied across the platinum electrodes is approximately0.5 volt..
Titration Apparatus. Figure 3 shows-a schematic diagram ofthe apparatus used for routine work. The titration vessel, A, isapproximately 12 cm. high and 4.5 cm. in diameter and is jacketedso that ice water may be circulated tQ cool the contents. A t.woway stopcock at the bottom of the cell is used to fill the vessel withtitration solvent and empty it after the titration is complete. Thetitration solvent is precooled in glass coils immersed in the large9.4-liter (2.5 gallon) Dewar flask, B. Ice is used for cooling, andthe cold water from the Dewar is also used to cool the titrationcell. Tygon tubing is used for all the flexible joints. The titration solvent is prepared in 5-gallon'lots and stored below thelaboratory bench. It is transferred from the storage bottle to the2-liter container, C, by applying a suction at D. From C thesolvent flows by gravity through the cooling coil to the titrationcell.
REAGENTS
Titration Solvent. The following are mixed in the indicatedvolumetric proportions:
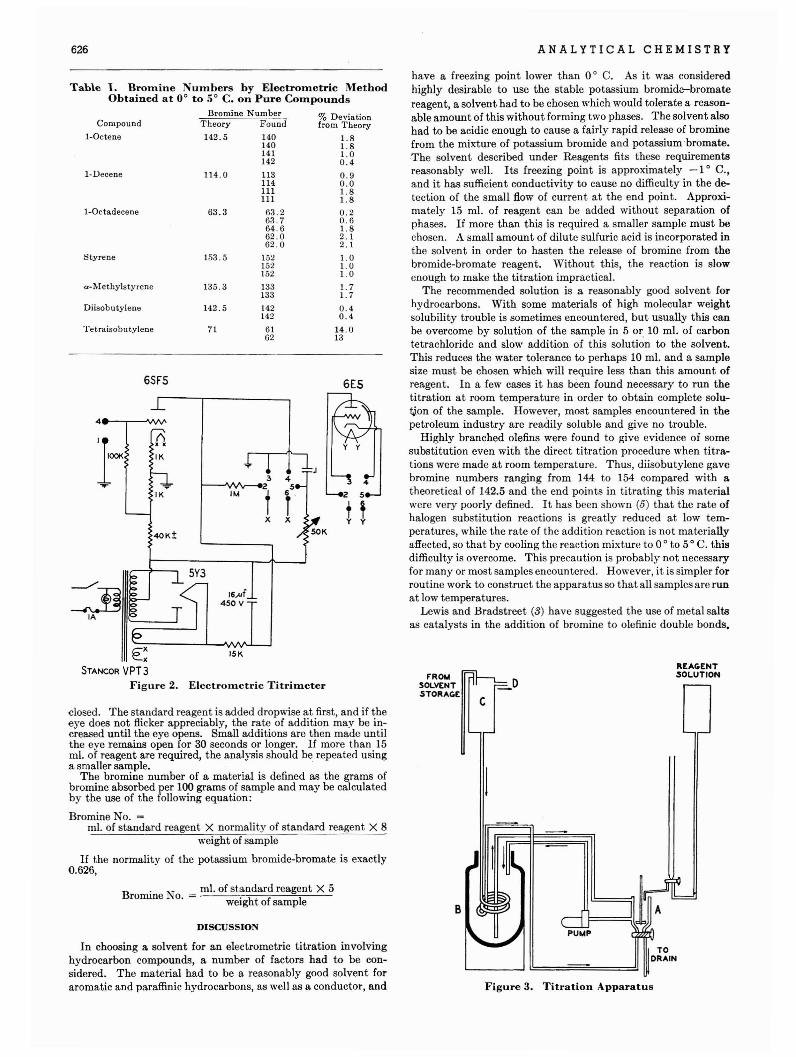
626 ANALYTICAL CHEMISTRY
REAGENT",OLUTION
TODRAIN
Figure 3. Titration Apparatus
c
B
fRO...SOLVENTSTORAGE
have a freezing point lower than 0 0 C. As it was consideredhighly desirable to use the stable potassium bromida--bromatereagent, a solvent had to be chosen which would tolerate a reasonable amount of this without forming two phases. The solvent alsohad to be acidic enough to cause a fairly rapid release of brominefrom the mixture of potassium bromide and potassium .bromate.The solvent described under Reagents fits these requirementsreasonably well. Its freezing point is approximately _1 0 C.,and it has sufficient conductivity to cause no difficulty in the detection of the small flow of current at the end point. Approximately 15 m!. of reagent can be added without separation ofphases. If more than this is required a smaller sample must bechosen. A small amount of dilute sulfuric acid is incorporated inthe solvent in order to hasten the release of bromine from thebromide-bromate reagent. Without this, the reaction is slowenough to make the titration impractical.
The recommended solution is a reasonably good solvent forhydrocarbons. With some materials of high molecular weightsolubility trouble is sometimes encountered, but usually this canbe overcome by solution of the sample in 5 or 10 m!. of carbontetrachloride and slow addition of this solution to the solvent.This reduces the water tolerance to perhaps 10 m!. and a samplesize must be chosen which will require less than this amount ofreagent. In a few cases it has been found necessary to run thetitration at room temperature in order to obtain complete soluijon of the sample. However, most samples encountered in thepetroleum industry are readily soluble and give no trouble.
Highly branched olefins were found to give evidence of somesubstitution even with the direct titration procedure when titrations were made at room temperature. Thus, diisohutylene gavebromine numbers ranging from 144 to 154 compared with atheoretical of 142.5 and the end points in titrating this materialwere very poorly defined. It has been shown (5) that the rate ofhalogen substitution reactions is greatly reduced at low temperatures, while the rate of the addition reaction is not materiallyaffected, so that by cooling the reaction mixture to 0 0 to 50 C. thisdifficulty is overcome. This precaution is probably not necessaryfor many or most samples encountered. However, it is simpler forroutine work to construct the apparatus so that all samples are runat low temperatures.
Lewis and Bradstreet (3) have suggested the use of metal saltsas catalysts in the addition of bromine to olefinic double bonds,
6E5
% Deviationfrom Theory
1.81.81.00.4
0.90.01.81.8
0.20.61.82.12.1
1.01.01.0
1.71.7
0.40.4
14.013
16",f450 V
63.3
114.0
SY3
1. BrOlnine NUJnbers by ElectroDletric MethodObtained at 0 0 to 50 C. on Pure CODlpounds
Bromine NumberTheory Found
142.5 140140141142
113114111111
63.263.764.662.062.0
6SFS
4
1~f't..IK
3 4... ... Z 5IK 1M I
1iX X
40K±
I-Decene
Compound
1-0ctene
Styrene 153.5 152152152
a-Methylstyrene 135.3 133133
Diisobutylene 142.5 142142
Tet.raisobutylene 71 6162
1-0r.tadecene
Tahle
3IA
B '. N _ m!. of standard reagent X 5romme. o. - weight of sample
€~ 15K
STANCOR VPT 3Figure 2. Electrometric Titrimeter
In choosing a solvent for an electrometric titration involvinghydrocarbon compounds, a number of factors had to be considered. The material had to be a reasonably good solvent foraromatic and paraffinic hydrocarbons, as well as a conductor, and
DISCUSSION
closed. The standard reagent is added dropwise at first, and if theeye does not flicker appreciably, the rate of addition may be increased until the eye opens. Small additions are then made untilthe eye remains open for 30 seconds or longer. If more than 15m!. of reagent are required, the analysis should be repeated usinga smaller sample.
The bromine number of a material is defined as the grams ofbromine absorbed per 100 grams of sample and may be calculatedby the use of the following equation:
Bromine No. =m!. of standard reagent X normality of standard reagent X 8
weight of sample
If the normality of the potassium bromide-bromate is exactly0.626,
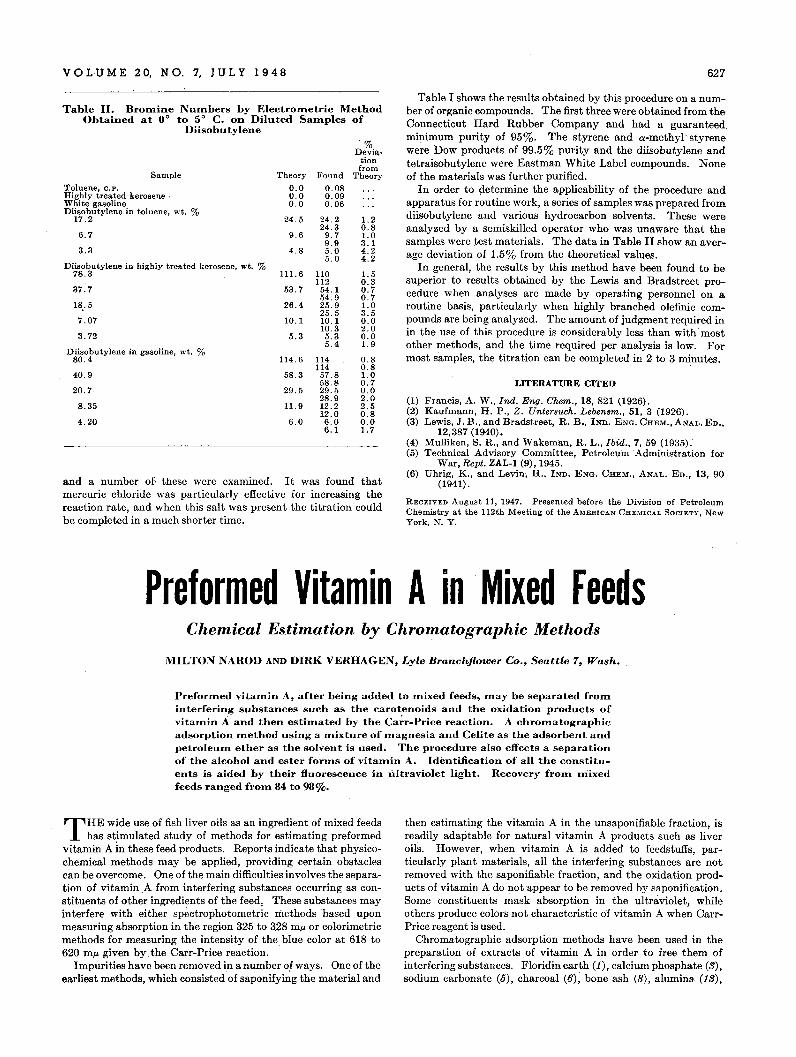
VOL U M E 20, N O. 7, J U L Y 1 94 8
Table II. Brornine Nurnbers by Electrornetric MethodObtained at 0 0 to 50 C. on Diluted Sarnples of
Diisobutylene
%Devia-
tionfrom
Sample Theory Found TheoryToluene, c.p. 0.0 0.08Highly treated kerosene· 0.0 0.09White gasoline 0.0 0.06Diisobutylene in toluene, wt. %
17.2 24.5 24.2 1.224.3 0.8
6.7 9.6 9.7 1.09.9 3.1
3.3 4.8 5.0 4.25.0 4.2
Diisobutylene in highly treated kerosene, wt. %78.3 111. 6 110 1.5
112 0.337.7 53.7 54.1 0.7
54.9 0.718.5 26.4 25.9 1.0
25.5 3.57.07 10.1 10.1 0.0
10.3 2.03.72 5.3 5.3 0.0
5.4 1.9Diisobutylene in gasoline, wt. %
80.4 114.6 114 0.8114 0.8
40.9 58.3 57.8 1.058.8 0.7
20.7 29.5 29.5 0.028.9 2.0
8.35 11. 9 12.2 2.512.0 0.8
4.20 6.0 6.0 0.06.1 1.7
and a number of· these were examined. It was found thatmercuric chloride was particularly effective for increasing thereaction rate, and when this salt was present the titrationcouldbe completed in a much shorter time.
627
Table I shows the results obtained by this procedure on a number of organic compounds. The first three were obtained from theConnecticut Hard Rubber Company and had a guaranteedminimum purity of 95%. The styrene and a-methyl' styrenewere Dow products of 99.5% purity and the diisobutylene andtetraisobutylene were Eastman White Label compounds. Noneof the materials was further purified.
In order to 9-etermine the applicability of the procedure andapparatus for routine work, a series of samples was prepared fromdiisobutylene and various hydrocarbon solvents. These wereanalyzed by a semiskilled operator who was unaware that thesamples were test materials. The data in Table II show an average deviation of 1.5% from the theoretical values.
In general, the results by this method have been found to besuperior to results obtained by the Lewis and Bradstreet procedure when analyses are made by operating personnel on aroutine basis, particularly when highly branched olefinic compounds are being analyzed. The amount of judgment required inin the use of this procedure is considerably less than with' mostother methods, and the time required per analysis is low. Formost samples, the titration can be completed in 2 to 3 minutes.
LITERATURE CITED
(1) Francis, A. W., Ind. Eng. Chem., 18,821 (1926).(2) Kaufmann, H. P., Z. Unter8uch. Lebensm., 51, 3 (1926).(3) Lewis, J. B., and Bradstreet, R. B., IND.. ENG. CHEM., ANAL. ED.,
12,387 (1940).(4) Mulliken, S. R., and Wakeman, R. L., Ibid., 7, 59 (1935).(5) Technical Advisory Committee, Petroleum 'Administration for
War, Rept. ZAL-l (9),1945.(6) Uhrig, K., and Levin; R., IND. ENG. CHEM., ANAL. ED., 13, 90
(1941) .
RECEIVED August 11, 1947. Presented before the Division of PetroleumChemistry at the 112th Meeting of the AMERICAN CHE,nCAL SOCIETY, NewYork, N. Y.
Preformed Vitamin Ain Mixed FeedsChemical Es.timation by Chromatographic Methods
MILTON NAROD AND DIRK VERHAGEN, Lyle Branchjlower Co., Seattle 7, Wash.
Preforrned vitarnin A, after being added to rnixed feeds, rnay be separated frorninterfering substances such as the carotenoids and the oxidation products ofvitamin A and then estirnated by the Ca~r-Price reaction. A chrornatographicadsorption method using a mixture of magnesia and Celite as the adsorbent andpetroleum ether as the solvent is used. The procedure also effects a separationof the alcohol and ester forrns of vitarnin A. Idimtification of all the constituents is aided by their fluorescence in ultraviolet light. Recovery frorn mixedfeeds ranged frorn 84 to 98%.
THE wide use of fish liver oils as an ingredient of mixed feedshas stimulated study of methods for estimating preformed
vitamin A in these feed products. Reports indicate that physicochemical methods may be applied, providing certain obstaclescan be overcome. One of the main difficulties involves the separation of vitamin A from interfering substances occurring as constituents of other ingredients of the feed, These substances mayinterfere with either spectrophotometric IiJ.ethodsbased uponmeasuring absorption in the region 325 to 3.28 mIL or colorimetricmethods for measuring the intensity of the. blue color at 618 to620 mIL given by the Carr-Price reaction.
Impurities have been removed in a number of ways. One of theearliest methods, which consistedof saponifying the material and
then estimating the vitamin A in the unsaponifiable fraction, isreadily adaptable for natural vitamin A products such as liveroils. However, when vitamin A is added to feedstuffs, particularly plant materials, all the interfering substances are notremoved with the saponifiable fraction, and the oxidation products of vitamin A do not appear to be removed by saponification.Some constituents mask absorption in the ultraviolet, whileothers produce colors not characteristic of vitamin A when CarrPrice reagent is used.
Chromatographic adsorption methods have been used in thepreparation of extracts. of vitamin A in order to free them ofinterfering substances. Floridin earth (1), calcium phosphate (3),sodium carbonate (5), charcoal (6); bone ash (8), alumina (13),
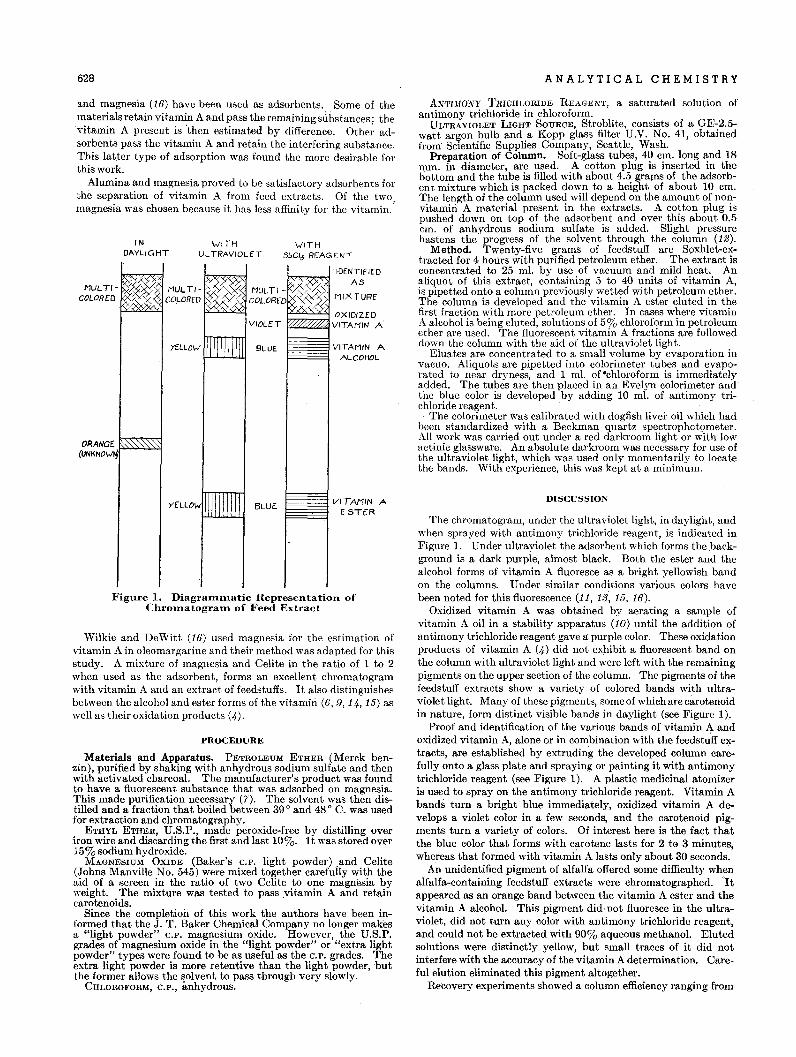
628 A N A L Y T IC A L C HEM I S TRY
and magnesia (16) have been used as adsorbents. Some of thematerials retain vitamin A and pass the remaining sllbstances; thevitamin A present is then estimated by difference. Other adsorbents pass the vitamin A and retain the interfering substance.This latter type of adsorption was found the more desirable forthis work.
Alumina and magnesia proved to be satisfactory adsorbents forthe separation of vitamin A from feed extracts. Of the twomagnesia was chosen because it has less affinity for the vitamin.'
ANTIMONY TRICHLORIDE REAGENT, a saturated solution ofantimony trichloride in chloroform.
ULTRAVIOLET LIGHT SOURCE, Stroblite, consists of a GE-2.5watt argon bulb and a Kopp glass filter U.V. No. 41, obtainedfrom Scientific Supplies Company, Seattle, Wash.
Preparation of Column. Soft-glass tubes, 40 cm. long and 18mrn. in diameter, are used. A cotton plug is inserted in thebottom and the tube is filled with about 4.5 gra)llS of the adsorbent mixture which is packed down to a height of about 10 cm.The length of the column used will depend on the amount of nonvitamiri A material present in the extracts. A cotton plug ispushed down on top of the adsorbent and over this about 0.5cm. of anhydrous sodium sulfate is added. Slight pressurehastens the progress of the solvent through the column (12).
Method. Twenty-five gra)llS of feedstuff are Soxhlet-extracted for 4 hours with purified petroleum ether. The extract isconcentrated to 25 ml. by use of vacuum and mild heat. Analiquot of this extract, containing 5 to 40 units of vitamin A,is pipetted onto a column previously wetted with petroleum ether.The column is developed and the vitamin A ester eluted in thefirst fraction with more petroleum ether. In cases where vitaminA alcohol is being eluted, solutions of 5% chloroform in petroleumether are used. The fluorescent vitamin A fractions are followedclown the column with the aid of the ultraviolet light.
Eluates are concentrated to a small volume by evaporation invacuo. Aliquots are pipetted into colorimeter tubes and evaporated to near dryness, and 1 m!. of·chloroform is immediatelyadded. The tubes are then placed in an Evelyn colorimeter andthe blue color is developed by adding 10 ml. of antimony trichloride reagent., The colorimeter Was calibrated with dogfish liver oil which had
been standardized with a Beckman quartz spectrophot()meter.All work was carried out under a red darkroom light or with lowactinic glassware. An absolute darkroom was necessary for use ofthe ultraviolet light, which was used only momentarily to locatethe bands. With experience, this was kept at a minimum.
IDENTifiEDAS
~~~I VITAMIN A~ ALCOHOL
W'ITHSbC/,j REAGENT
BLUE
>x>': 'MULTI- ~~
COLORED~~ MIX TLJRf
\.2::'::a:;:~2j t~~~ OX/OIUDVIOLET 12 VITAMIN A'
WITHUL TRAVIOLET
INDAYLIGHT
ORANCE~~~(UNKNOW'~
MULT/-COLOR£D
Figure 1. Diagrallllllatic Representation ofChrolllatogralll of Feed Extract
Wilkie and DeWitt (16) used magnesia for the estimation ofvitamin A in oleomargarine and their method was adapted for thisstudy. A mixture of magnesia and Celite in the ratio of 1 to 2when used as the adsorbent, forms an excellent chromatogramwith vitamin A and an extract of feedstuffs. It also distinguishesbetween the alcohol and ester forms of the vitamin (6, 9, 14, 15) aswell as their oxidation products (4).
PROCEDURE
Materials and Apparatus. PETROLEUM ETHER (Merck benzin), purified by shaking with anhydrous sodium sulfate and thenwith activated charcoal. The manufacturer's product was foundto have a fluorescent substance that was adsorbed on magnesia.This made purification necessary (7). The solvent was then distilled and a fraction that boiled between 39 0 and 48 0 C. was usedfor extraction and chromatography.
ETHYL ETHER, U.S.P., made peroxide-free by distilling overiron wire and discarding the first and last 10%., It was stored over15% sodium hydroxide.
MAGNESIUM OXIDE (Baker's C.P. light powder) .and Celite(Johns Manville No. 545) were mixed together carefully with the.aid of a screen in the ratio of two Celite to one magnesia by'weight. The mixture was tested to pass vitamin A and retaincarotenoids.
Since the completion of this work the authors have been informed that the J. T. Baker Chemical Company no longer makesa "light powder" C.P. magnesium oxide. However, the U.S.P.grades of magnesium oxide in the "light powder" or "extra lightpowder" types were found to be as useful as the C.P. grades. Theextra light powder is more retentive than the light powder,butthe former allows the solvent to pass through very slowly.
CHLOROFORM, C.P., anhydrous.
DISCUSSION
The chromatogram, under the ultraviolet light, in daylight, andwhen sprayed with antimony trichloride reagent, is indicated inFigure 1. Under ultraviolet the adsorbent which forms the ,background is a dark purple, almost black. Both the ester and thealcohol forms of vitamin A fluoresce as a bright yellowish bandon the columns. Under similar conditions various colors havebeen noted for this fluorescence (11, 13, 15, 16).
Oxidized vitamin A was obtained by aerating a sample ofvitamin A oil in a stability apparatus (10) until the addition ofantimony trichloride reagent gave a purple color. These oxidationproducts of vitamin A (4) did not exhibit a fluorescent band onthe column with ultraviolet light and were left with the remainingpigments on the upper section of the column. The pigments of thefeedstuff extracts show a variety of colored bands with ultraviolet light. Many of these pigments, some of which are carotenoidin nature, form distinct visible bands in daylight (see Figure 1).
Proof and identification of the various bands of vitamin A andoxidized vitamin A, alone or in combination with the feedstu'ff extracts, are established by extruding the developed column carefully onto a glass plate and spraying or painting it with antimonytrichloride reagent (see Figure 1). A plastic medicinal atomizeris used to spray on the antimony trichloride reagent. Vitamin Abands turn a bright blue immediately, oxidized vitamin A develops a violet color in a few seconds, and the carotenoid pigments turn a variety of colors. Of interest here is the fact thatthe blue color that forms with carotene lasts for 2 tG 3 minutes,whereas that formed with vitamii-I A lasts only about 30 seconds.
An unidentified pigment of alfalfa offered some difficulty whenalfalfa-containing feedstuff extracts were chromatographed. "Itappeared as an orange band between the vitamin A ester and thevitamin A alcohol. This pigment did,not fluoresce in the ultraviolet, did not turn any color with antimony trichloride reagent,and could not be extracted with 90% aqueous methanol. Elutedsolutions were distinctly yellow, but small traces of it did notinterfere with the accuracy of the vitamin A determination. Careful elution eliminated this pigment altogether.
Recovery experiments showed a column efficiency ranging from
1~~~ VITAMIN A~ ESTER
BLUE
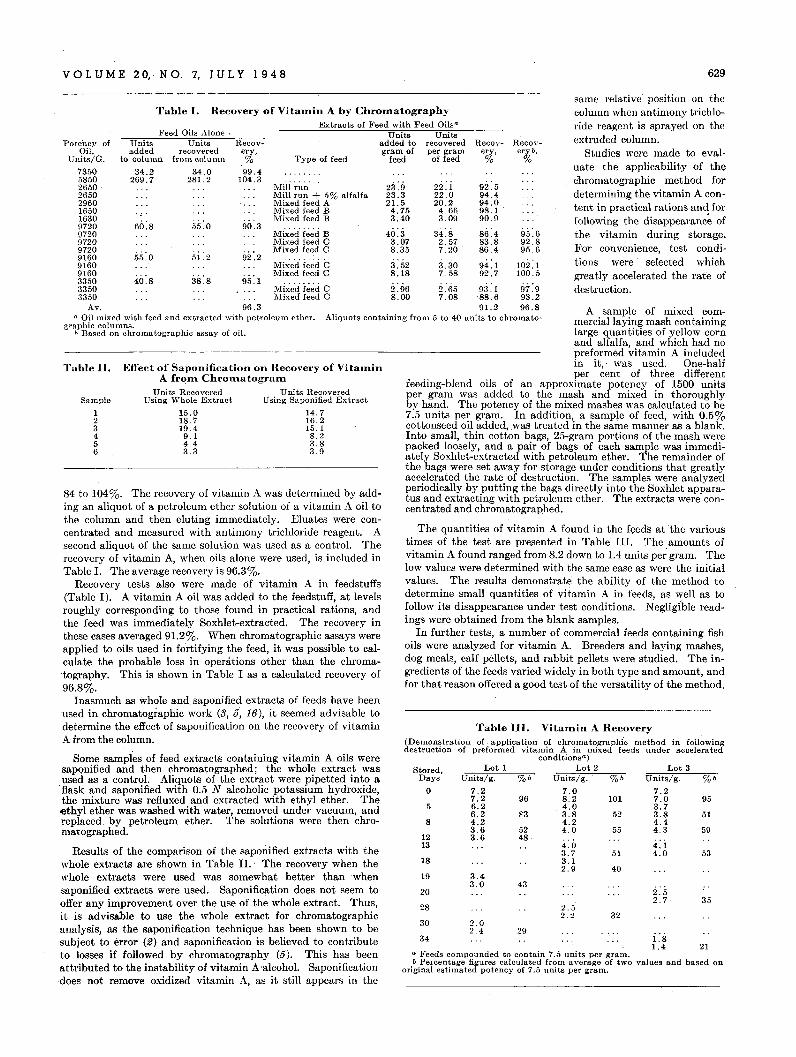
VOL U M E 20, NO.7, J U L Y 1 94 8 629
34 1.8
a Feeds compounded to contain 7.5 \luits per gram. 1.4 21b Percentage figures calculated from average of two values and based on
original estimated potency of 7..; units per gram.
95
51
59
Lot 3Units/g.
7.27.03.73.84.44.355
52
101
same relative' position on thecolumn when antimony trichloride reagent is sprayed on theextruded column.
Studies were made to evaluate the applicability of thechromatographic method fordetermining the vitamin A content in practical rations and forfollowing the disappearanc~ofthe vitamin during .storage.For convenience, test conditions were selected whichgreatly accelcrated the rate ofdestruction.
Units/g.
7.08.24.03.84.24.0
96
83
5248
29
%bLot 1
Reeov- Recov-ery, eryb,% %
92.594.494.098.190.9
86.4 95:683.8 92.886.4 95.6
94.1 102.192.7 100.5
2.02.4
Units/g.7.2 .7.26.26.24.23.63.6
2.657.08
5
8
o
1213
18
19
20
28
30
Stored•Days
A sample of mixed com-merciallaying mash containinglarge quantities of yellow cornand alfalfa, and which had nopreformed vitamin A includedin it,' was used. One-halfpel' cent of three different
feeding-blend oils of an approximate potency of 1500 unitspel' gram was added to the mash and mixed in thoroughlyby hand. The potency of the mixed mashes was calculated to be7.5 units per gram. In addition, a sample of feed with 0.5%cottonseed oil added, was treated in the same manne~ as a blank.Into small, thin cotton bags, 25-gram portions of the mash werepacked loosely, and a pail' of bags of each sample was immediately Soxhlet-extracted with petroleum ether. The remainder ofthe bags were set away for storage under conditions that greatlyacc~le~ated the rate. of destruction. The samples were analyzedpenodlCally by puttmg the bags directly into the Soxhlet apparatus and extracting with petroleum ether. The extracts were concentrated and chromatographed.
Table Ill. Vitalllin A Recovery(Denlonst.ration of application of chromatographfc method in followingdestruction of preformed vitamin A in mixed feeds under accelerated
conditionsa)Lot 2
The quantities of vitamin A found in the feeds at the varioustimes of the test are pre,sented in Table III. The amounts ofvitamin A found ranged from 8.2 down to 1.4 units per gram. Thelow values were determined with the same ease as were the initialvalues. The results demonstrate the ability of the method todetermine small quantities of vitamin A in feeds, as well as tofollow its disappearance under test conditions. Negligible readings were obtained from the blank samples.
In further tests, a number of commercial feeds containing fishoils were analyzed for vitamin A. Breeders and laying mashes,dog meals, calf pellets, and rabbit pellets were studied. The ingredients of the feeds varied widely in both type and amount, andfor that reason offered a good test of the versatility of the method.
23.9 22.123.3 22.021.5 20.24.75 4.603.40 3.09
40.3 34:83.07 2.578.35 7.20
3.52 :i:308.18 7.58
Units Unitsadded to recoveredgram of per gram
feed of feed
93.1 97.9'88.6 93.291.2 96.8
Aliquots containing from 5 to 40 units to chromato-
14.716.215.18.23.83.9
Type of feed
Mix"ed ieeci CiVlixed feed C
Mix"e'd ieeci cMixed feed C
Mili ~;';""Mill run + 5% alfalfaMixed feed AMixed feed BMixed feed B
Mixed feed BMixed feed CMixed feed C
92.2
90.3
95.1
Recovery,%99.4
104.3
Recovery of Vitalllin A by ChrolllatographyExtracts of Feed with Feed Oils"
51.2
34.0281.2
15.018.719.49.14.43.3
Feed Oils Alone .
Table I.
55:0
34.2269.7
Effect of Saponification on Recovery of VitalllinA frOID Chrolllatogralll
Units Recovered Units RecoveredUsing Whole Extract Using Saponified Extract
Units Unitsadded recovered
to column from column
Sample
123456
Table II.
Potency ofOil,
Units/G.
73505850265026502960165016309720972097209720916091609160335033503350
Av. 96.3a Oil mixed with feed and extracted ,dth petroleum ether.
graphic columns.b Based on chromatographic assay of oil.
84 to 104%. The recovery of vitamin A was determined by adding an aliquot of a petroleum ether solution of a vitamin A oil tothe column and then eluting immediately. Eluates were concentrated and measured with antimony trichloride reagent. Asecond aliquot of the same solution was used as a control. Therecovery of vitamin A, when oils alone were used, is included inTable I. The average recovery is 96.3%.
Recovery tests also were made of vitamin A in feedstuffs(Table I). A vitamin A oil was added to the feedstuff, at levelsroughly corresponding to those found in practical rations, andthe feed was immediately Soxhlet-extracted. The recovery inthese cases averaged 91.2%. When chromatographic assays wereapplied to oils used in fortifying the feed, it was possible to calculate the probable loss in operations other than the chromatography. This is shown in Table I as a calculated recovery of96.8%.
Inasmuch as whole and saponified extracts of feeds have beenused in chromatographic work (3, 5, 16), it seemed advisable todetermine the effect of saponification on the recovery of vitaminA from the column.
Some samples of feed extracts containing vitamin A oils weresaponified and then chromatographed; the whole extract was
.used as a control. Aliquots of the extract were pipetted into aflask and saponified with 0.5 N alcoholic potassium hydroxide,the mixture was refluxed and extracted with ethyl ether. Theethyl ether was washed with water. removed under vacuum, andreplaced. by petroleum ether. The solutions were then chromatographed.
Results of the comparison of the saponified extracts with thewhole extracts are shown in Table II.' The recovery when thewhole extracts were used was somewhat better than whensaponified extracts were used. Saponification does not seem tooffer any improvement over the use of the whole extract. Thus,it is advisable to use the whole extract for chromatographicanalysis, as the saponification technique has been shown to besubject to error (2) and saponification is believed to contributeto losses if followed by chromatography (5). This has beenattributed to the instability of vitamin A'alcohol. Saponification·does not remove oxidized vitamin A, as it still appears in the
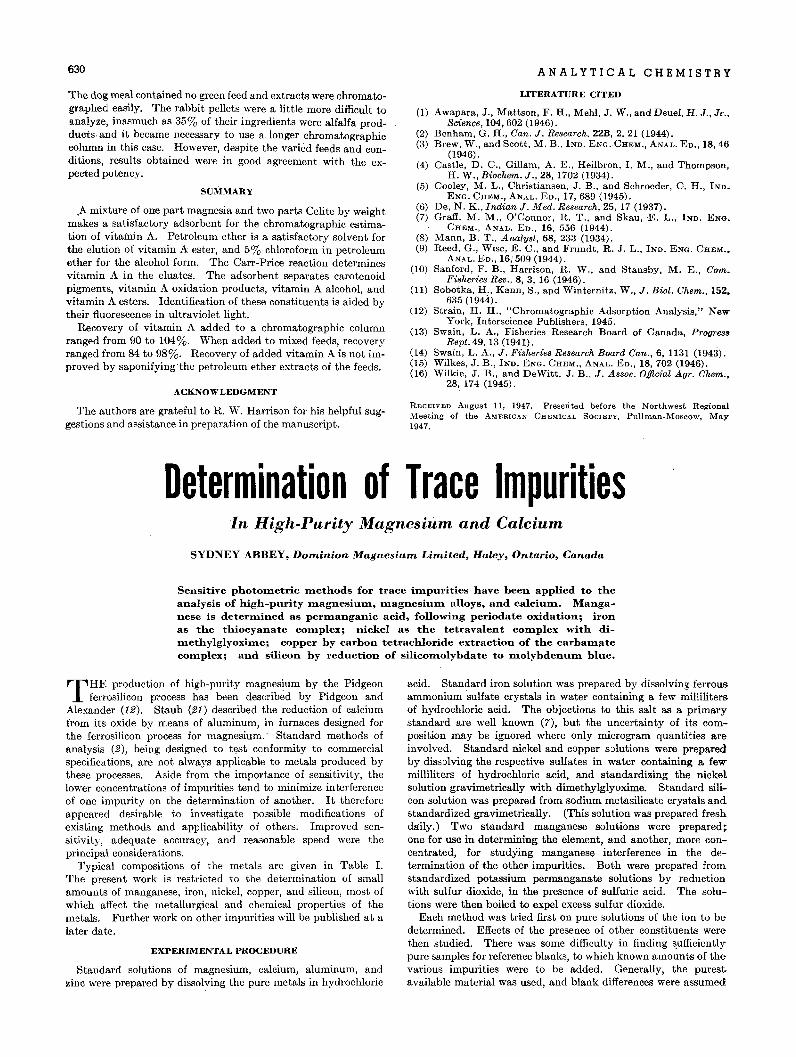
630
The dog meal contained no green feed and extracts were chromatographed easily. The rabbit pellets were a little more difficult toanalyze, inasmuch as 35% of their ingredients were alfalfa prodducts· and it became necessary to use a longer chromatographiccolumn in this case. However, despite the varied feeds and conditions, results obtained were in good agreement with the expected potency.
SUMMARY
.A mixture of one part magnesia and two parts Celite by weightmakes a satisfactory adsorbent for the chromatographic estimation of vita.min A. Petroleum ether is a satisfactory solvent forthe elution of vitamin A ester, and 5% chloroform in petroleumether for the alcohol form. The Carr-Price reaction determinesvitamin A in the eluates. The adsorbent separates carotenoidpigments, vitamin A oxidation products, vitamin A alcohol, andvitamin A esters. Identification of these constituents is aided bytheir fluorescence in ultraviolet light.
Recovery of vitamin A added to a chromatographic columnranged from 90 to 104%. When added to mixed feeds, recoveryranged from 84 to 98%. Recovery of added vitamin A is not improved by saponifying' the petroleum ether extracts of the feeds.
ACKNOWLEDGMENT
The authors are grateful to R. W. Harrison for his helpful suggestions and assistance in preparation of the manuscript.
ANALYTICAL CHEMISTRY
LITERATURE CITED
(1) Awapara, J., Mattson, F. H., Mehl, J. W., and Deuel, H. J., Jr.,·Science, 104, 602 (1946).
(2) Benham, G. H., Can. J. Research. 22B, 2, 21 (1944).(3) Brew, W., and Scott, M. B., IND. ENG.CHEM., ANAL. ED., 18,46
(1946) .(4) Castle, D. C., Gillam, A. E., Heilbron, I. M., and Thompson,
H. W., Biochern.J., 28,1702 (1934).(5) Cooley, M. L., Christiansen, J. B., and Schroeder, C. H., IND.
ENG. CHEM., ANAL. ED., 17,689 (1945).(6) De, N. K., Indian J. M ed. Research, 25, 17 (1937) .(7) Graff, M. M., O'Connor, R. T., and Skau, -E. L., IND. ENG.
CHElL, ANAL. ED., 16, 556 (1944).(8) Mann, B. T., Analyst, 68, 233 (1934).(9) Reed, G., Wise, E. C., and Frundt, R. J. L., IND. ENG. CHEM.,
AN.n. ED., 16,509 (1944).(10) Sanford, F. B., Harrison, R. W.. and Stansby, M. E., Com.
Fisheries Rev., 8, 3, 16 (1946).(11) Sobotka, H., Kann, S., ap.d Winternitz, W., J. Bioi. Chem., 152,
635 (1944).(12) Strain, H. H., "Chromatographic Adsorption Analysis," New
York, Interscience Publishers, 1945.(13) Swain, L. A., Fisheries Research Board of Canada, Progress
Rept. 49, 13 (1941).(14) Swain, L. A., J. Fisheries Research Board Can., 6, 1131 (1943).(15) Wilkes, J. B., IND. ENG. CHEM., ANAL. ED., 18,702 (1946).(16) Wilkie, J. B., and DeWitt, J. B., J. Assoc. Official Agr. Chern.,
28,174 (1945).
RECEIVED August 11, 1947. Presented before the Northwest RegionalMeeting of the AMERICAN CHEMICAL SOCIETY, Pullman-Moscow, May1947.
Determination of Trace ImpuritiesIn High-Purity Magnesium and Calcium
SYDNEY ABBEY, Dom.inion Magnesium. Lim.ited, Haley, Ontario, Canada
Sensitive photoIlletric Illethods for trace iIllpurities have been applied to theanalysis of high-purity IllagnesiuIll, Illagnesiulll alloys, and calciulll. Manganese is deterlllined as perlllanganic acid, following periodate oxidation; ironas the thiocyanate cOlllplex; nickel as the tetravalent cOlllplex with dilllethy1glyoxirne; copper by carbon tetrachloride extraction of the carballlatecOlllplex; and silicon by reduction of silicolllolybdate to lllolybdenulll blue.
THE production of high-purity magnesium by the Pidgeonferrosilicon process has been deseribed by Pidgeon and
Alexander (12). Staub (21) described the reduction of ealciumfrom its oxide by means of aluminum, in furnaces designed forthe ferrosilicon proeess for magnesium.' Standard methods ofanalysis (2), being designed to t!;st eonformity to eommercialspecifications, are not always applicable to metals produced bythese processes. Aside from the impOI·tanee of sensitivity, thelower concentrations of impurities tend to minimize interferenceof one impurity on the determination of another. It thereforeappeared desirable to investigate possible modifications ofexisting methods and applieability of others. Improved sensitivity, adequate aecuracy, and reasonable speed were theprineipal considerations.
Typical compositions of the metals are given in Table I.The present work is restrieted to the determination of smallamounts of manganese, iron, niekel, copper, and silicon, most ofwhich affeet the metallurgieal and ehemieal properties of themetals. Further work on other impurities will be pubiished at alater date.
EXPERIMENTAL PROCEDURE
Standard solutions of magnesium, caleium, aluminum, andzine were prepared by dissolving the pure metals in hydrochloric
acid. Standard iron solution was prepared by dissolving ferrousammonium sulfate crystals in water containing a few millilitersof hydrochloric acid. The objections to this salt as a primarystandard are well known (7), but the uncertainty of its composition may be ignored where only mierogram quantities areinvolved. Standard nickel and copper sJlutions were preparedby dissolving the respective sulfates in water containing a fewmilliliters of hydrochloric acid, and standardizing the nickelsolution gravimetrically with dimethylglyoxime. Standard silicon solution was prepared from sodium metasilicate crystals andstandardized gravimetrically. (This solution was prepared freshdaily.) Two standard manganese solutions were prepared;one for use in determining the element, and another, more concentrated, for. studYing manganese interference in the determination of the other impurities. Both were prepared fromstandardized potassium permanganate solutions by reductionwith sulfur dioxide, in the presence of sulfuric acid. The solutions were then boiled to expel excess sulfur dioxide.
Eaeh method was tried first on pure solutions of the ion to bedetermined. Effects of the presence of other constituents werethen studied. There was some diffieulty in finding suffieientlypure samples for reference blanks, to whieh known amounts of thevarious impurities were to be added. Generally, the purestavailable material was used, and blank differences were assumed
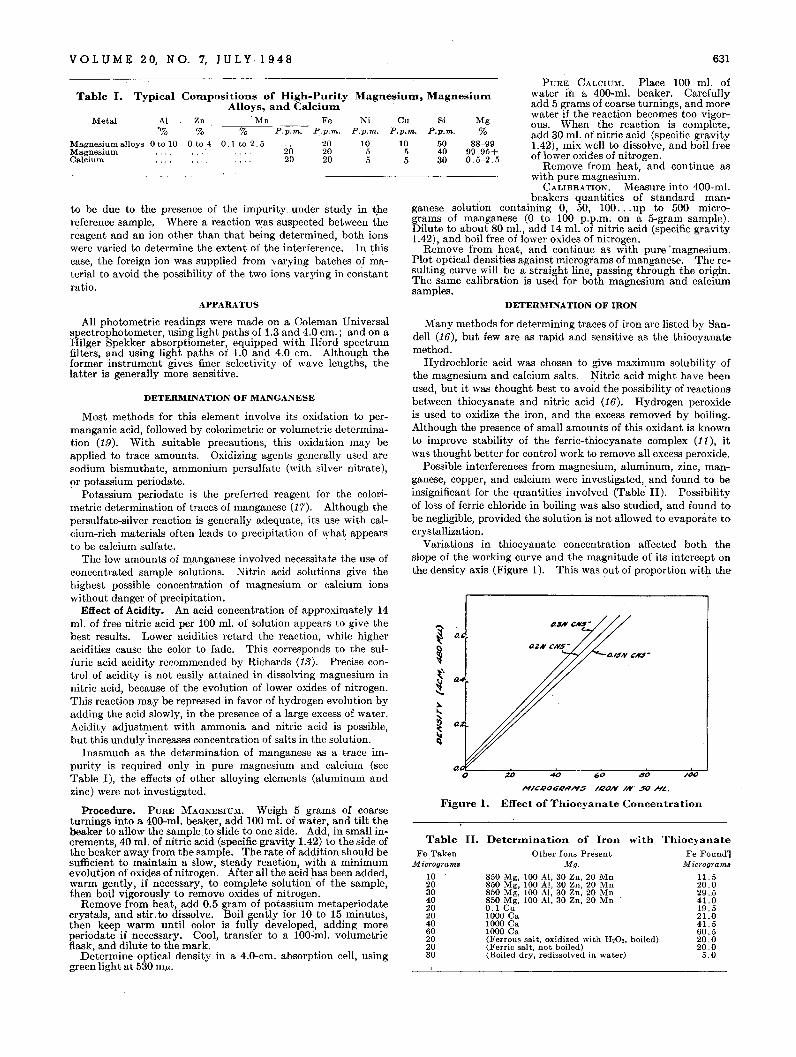
VOL U M E 20, N O. 7, J U L Y . I 948 631
to be due to the presence of the impurity under study in t.hereference sample. Where a reaction was suspected between thereagent and an ion other than that being determined, both ionswere varied to determine the extent of the interference. In thiscase, the foreign ion was supplied from varying batches of material to avoid the possibility of the two ions varying in constantratio.
Mg%
88-9999.95+0.5-2.5
SiP.p.m.
504030
PURE CALCIUM. Place 100 mL ofwater in a 400-mL beaker. Carefullyadd 5 grams of coarse turnings, and morl'water if the reaction becoIP-es too vigorous. When the reaction is complete.add 30 mL of nitric acid (specific gravity1.42), mix well to dissolve, and boil freeof lower oxides of nitrogen.
Remove from heat, and continue aswith pure magnesium.
CALIBRATION. Measure into 400-ml.beakers quantities of standard man
ganese solution containing 0, 50, 100 ... up to 500 micrograms of manganese (0 to 100 p.p.m. on a 5-gram sample).Dilute to about80 mI., add 14 m!. of nitric acid (specific gravity1.42), and boil free of lower oxides of nitrogen.
Remove from heat, and continue as with pure ·magnesium.Plot optical densities against micrograms of manganese. The resulting curve ~ill ~e a: straight line, passing through the origin.The same cahbratlOn IS used for both magnesium and calciumsamples.
CuP.p.m.
1055
MagnesiuIll, MagnesiuIll
NiP.p.m.
1055
2020
%0.lto2.5
Zn%
o to 4
COIllpositions of High-PurityAlloys, and Calcium
°Mn FeP.p.m. P.p.m.
202020
Typical
Metal
Table I.
Al'%
Magnesium alloys 0 to 10MagnesiumCalcium
APPARATUS
All photometric readings were made on a Coleman Universalspectrophotometer, using light paths of 1.3 and 4.0 em.; and on aHilger Spekker absorptiometer, equipped with Ilford spectrumfilters, and using light paths of 1.0 and 4.0 em. Although theformer instrument gives finer selectivity of wave lengths, thelatter is generally more sensitive.
DETERMINATION OF MANGANESE
Most methods for this element involve its oxidation to permanganic acid, followed by colorimetric or volumetric determination (19). With suitable precautions, this oxidation may beapplied to trace amounts. Oxidizing agents generally used aresodium bismuthate, ammonium persulfate (with silver nitrate),or potassium periodate.
Potassium periodate is the preferred reagent for the colorimetric determination of traces of manganese (17). Although thepersulfate-silver reaction is generally adequate, its use with calcium-rich materials often leads to precipitation of what appearsto be calcium sulfate.
The low amounts of manganese involved necessitate the use ofconcentrated sample solutions. Nitric acid solutions give thehighest possible concentration of magnesium or calcium ionswithout danger of precipitation.
Effect of Acidity. An acid concentration of approximately 14ml. of free nitric acid per 100 ml. of solution appears to give thebest results. Lower acidities retard the reaction, while higheracidities cause the color to fade. This corresponds to the sulfuric acid acidity recommended by Richards (13). Precise control of acidity is not easily attained in dissolving magnesium innitric acid, because of the evolution of lower oxides of nitrogen.This reaction may be repressed in favor of hydrogen evolution byadding the acid slowly, in the presence of a large excess of water.Acidity adjustment with ammonia and nitric acid 0 is possible,but this unduly'increases concentration of salts in the solution.
Inasmuch as the determination of manganese as a trace impurity is required only in pure magnesium and calcium (seeTable I), the effects of other alloying elements (aluminum andzinc) were not investigated.
Procedure. PURE MAGNESIUM. Weigh 5 grams of coarseturnings into a 400-mL beaker, add 100 mL of water, and tilt thebeaker to allow the sample to slide to one side. Add, in small increments, 40 mL of nitric acid (specific gravity 1.42) to the side ofthe beaker away from the sample. The rate of addition should besufficient to maintain a slow, steady reaction, with a minimumevolution of oxides of nitrogen. After all the acid has been added,warm gently, if necessary, to complete solution of the sample,then boil vigorously to remove oxides of nitrogen.
Remove from heat, add 0.5 gram of potassium metaperiodatecrystals, and stir. to dissolve. Boil gently for 10 to 15 minutes,then keep warm until color is fully developed, adding moreperiodate if necessary. Cool, transfer to a 100~mL volumetricflask, and dilute to the mark.
Determine optical density in a 4.0-cm. absorption cell, usinggreen light at 530 mI-'.
DETERMINATION OF IRON
Many methods for determining traces of iron are listed by Sandell (16), but few are as rapid and sensitive as the thiocyanatemethod.
Hydrochloric acid was chosen to give maximum solubility ofthe magnesium and calcium salts. Nitric acid might have beenused, but it was thought best to avoid the possibility of reactionsbetween thiocyanate and nitric acid (16). Hydrogen peroxideis used to oxidize the iron, and the excess removed by boiling.Although the presence of small amounts of this oxidant is knownto improve stability of the ferric-thiocyanate complex (11), itwas thought better for control work to remove all excess peroxide.
Possible interferences from magnesium, aluminum, zinc, manganese, copper, and calcium were investigated, and found to beinsignificant for the quantities involved (Table· II). Possibilityof loss of ferric chloride in boiling was also studied, and found tobe negligible, provided the solution is not allowed to evaporate tocrystallization.
Variations in thiocyanate concentration affected both theslope of the working curve and the magnitude of its intercept onthe density axis (Figure 1). This was out of proportion with the
80 /00
I'f/C~O"Rd/'TS //.lON /N $(1 H'£.
Figure 1. Effect of Thiocyanate Concentration
Table II. DeterIllination of Iron with ThiocyanateFe Taken Other Ions Present Fe Found']
Micrograms }r[g. lVlicrogram8
10 850 Mg, 100 AI, 30 Zn, 20 Mn 11 . 520 850 Mg, 100 AI, 30 Zn, 20 Mn 20.030 850 Mg, 100 AI, 30 Zn, 20 Mn 29 '0540 850 Mg, 100 AI, 30 Zn, 20 Mn 41.020 0.1 Cu 19.520 1000 Ca 21.040 1000 Ca 41. 560 1000 Ca 60.520 (Ferrous salt, oxidized with H20" boiled) 20.020 (Ferric salt, not boiled) 20.030 (Boiled dry, redissolved in water) 5.0
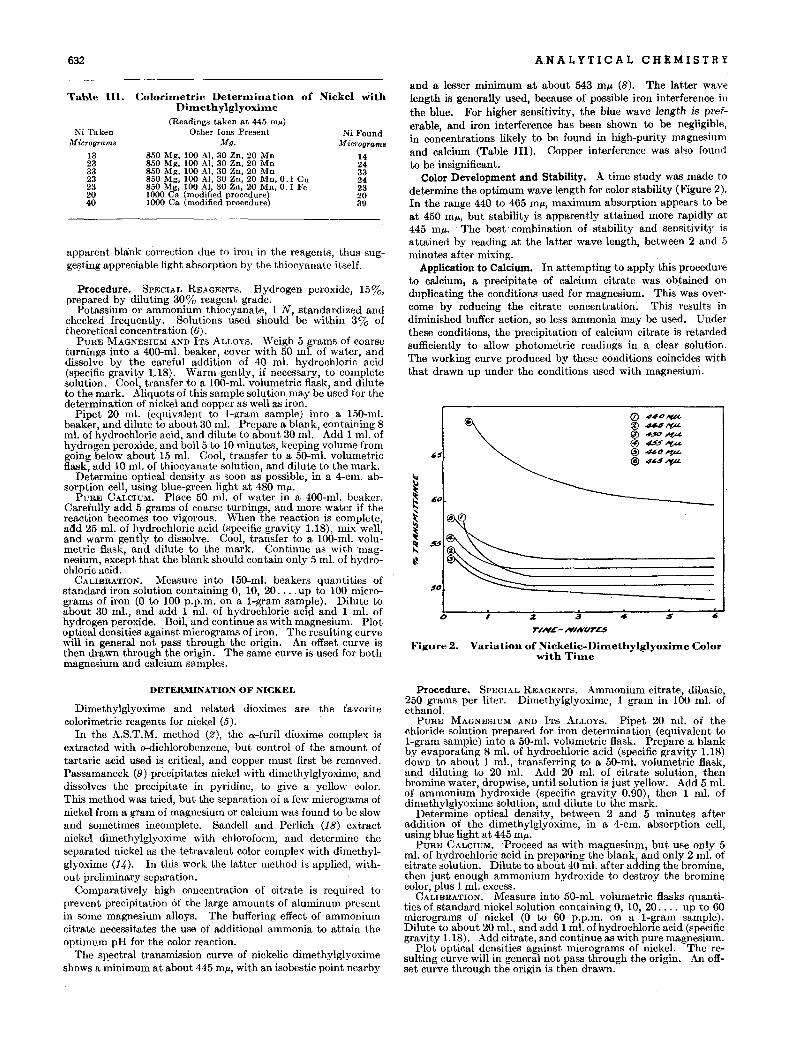
632 A.N A L Y TIC ALe HEM 1ST R Y
apparent blank correction due to iron in the reagents, thus suggel?ting appreciable light absorption by the thiocyanate itself.
Procedure. SPECIAL REAGENTS. Hydrogen peroxide, 15%,prepared by diluting 30% reagent grade.
Potassium .01' ammonium thiocyanate, 1 N, standardized andchecked frequently. Solutions used should be within 3% oftheoretical concentration (6).
PURE MAGNESIUM AND ITS ALLOYS. Weigh 5 grams of coarseturnings into a 40Q-ml. beaker, cover with 50 ml. of water, anddissolve by the careful addition of 40 ml. hydrochloric acid(specific gravity L.18). Warm gently, if necessary, to completesolution. Cool, transfer to a 100-ml. volumetric flask, and diluteto the mark. Aliquots of this sample solution may be used for thedetermination of nickel and copper as well as iron.
Pipet 20 ml. (equivalent to I-gram sample) into a 150-ml.beaker, and dilute to about 30 ml. Prepare a blank, containing 8ml. of hydrochloric acid, and dilute to about 30 ml. Add 1 ml. ofhydrogen peroxide, and boil 5 to 10 minutes, keeping volume fromgoing below about 15 ml. Cool, transfer to a 50-ml. volumetricflask, add 10 ml. of thiocyanate solution, and dilute to the mark.
Determine optical density as soon as possible, in a 4-cm. absorption cell, using blue-green light at 480 mil.
PURE CALCIUM. Place 50 ml. of water in a 400-ml. beaker.Carefully add 5 grams of coarse turnings, and more water if thereaction becomes too vigorous. When the reaction is complete,a<1d 25 ml. of hydrochloric acid (specific gravity 1.18), mix well,and warm gently to dissolve. Cool, transfer to a 100-mi. volumetric flask, and dilute to the mark. Continue as with -magnesium, except that the blank should contain only 5 ml. of hydrochloric acid.
CALIBRATION. Measure into 150-ml. beakers quantities ofstandard iron solution containing 0, 10, 20 .... up to 100 micrograms of iron (0 to 100 p.p.m. on a I-gram sample). Dilute toabout 30 mI., and add 1 ml. of hydrochloric aci(l and 1 ml. ofhydrogen peroxide. Boil, and continue as with magnesium. Plotoptical densities against micrograms of iron. The resulting curvewill in general not pass through the origin. An offset curve isthen drawn through the origin. The same curve is used for bothmagnesium and calcium samples.
14243324232039
Io z ., 4
TIH£- ,."NVTr.s
Figu re 2. Variation of Nickelic-DimethylglyoxiIne Colorwith Time
and a lesser minimum at about 543 mil (8). The latter wavelength is generally used, because of possible iron interference inthe blue. For higher sensitivity, the blue wave length is preferable and iron interference has been shown to be negligible,in co~centrations likely to be found in high-purity magnesiumand calcium (Table III). Copper interference was also foundto be insignificant.
Color Development and Stability. A time study was made todetermine the optin;mm wave length for color stability (Figure 2).In the range 440 to 465 mil, maximum absorption appears to beat 450 mil, but stability is apparently attained more rapidly at445 mil. . The best· combination of stability and sensitivity isattained by reading at the latter wave length, between 2 and 5minutes after mixing.
Application to Calcium. In attempting to apply this procedureto calcium, a precipitate of calcium citrate was obtained onduplicating the conditions used for magnesium. This was overcome by reducing the citrate concentration~ This results indiminished buffer action, so less ammonia may be used. Underthese conditions, the precipitation of calcium citrate is retardedsufficiently to allow photometric readings in a clear solution.The working curve produced by these conditions coincides withthat drawn up under the conditions used with magnesium.
~~------so ~::::=::::===========
o 4 40 !'ILL® 44Sty,ioLlID ..,SOH#@ 4S.S~
@ 400"'#@l 4~S;op.L
Ni Found;.Ificrograms
Colorimetric Determination of Nickel withDhnethylglyoxhne
(Readings taken at 445 m,,)Other Ions Present
Mg.
850 Mg, 100 AI, 30 Zn, 20 Mn850 Mg, 100 AI, 30 Zn, 20 Mn850 Mg, 100 AI, 30 Zn, 20 Mn850 Mg, 100 AI, 30 Zn, 20 Mn, 0.1 Cu850 Mg, 100 AI, 30 Zn, 20 Mn, 0.1 Fe1000 Ca (modified procedure)1000 Ca (modified procedure)
Ni Takenll-ficrograms
13233323232040
Tahle HI.
DETER,MINATION 01" NICKEL
Dimethylglyoxime and related dioximes are the favoritecolorimetric reagents for nickel (5).
In the A.S.T.M. method (2), the a-furil dioxime complex isextracted with o-diehlorobenzene, but control of the amount oftartaric acid used is critical, and copper must first be removed.Passamaneck (9) precipitates nickel with dimethylglyoxime, anddissolves the precipitate in pyridine, to give a yellow color.This method was tried, but the separation of a few micrograms ofnickel from a gram of magnesium or calcium was found to be slowand sometimes incomplete. Sandell and Perlich (18) extractnickel dimethylglyoxime with chloroform, and determine theseparated nickel as the tetravalent color complex with dimethylglyoxime (1.4-). In this work the latter method is applied, without preliminary separation.
Comparatively high eoncentration of citrate is required toprevent precipitation of the large amounts of aluminum presentin some magnesium alloys. The buffering effect of ammoniumcitrate necessitates the use of additional ammonia to attain th"optimum pH for the color reaction.
The spectral transmission curve of nickelic dimethylglyoximeshows a minimum at about 445 mil, with an isobestic point nearby
Procedure. SPECIAL REAGENTS. Ammonium citrate, dibasic,250 grams per liter. Dimethylglyoxime, 1 gram in 100 ml. ofethanol.
PURE MAGNESIUM AND ITS ALLOYS. Pipet 20 ml. of thechloride solution prepared for iron determination (equivalent toI-gram sample) into a 50-ml. volumetric flask. Prepare a blankby evaporating 8 ml. of hydrochloric acid (specific gravity 1.18)down to about 1 mI., transferring to a 50-ml. volumetric flask,and diluting to 20 ml. Add 20 ml. of citrate solution, thenbromine water, dropwise, until solution is just yellow. Add 5 ml.of ammonium hydroxide (specific gravity 0.90), then 1 ml. ofdimethylglyoxime solution, and dilute to the mark.
Determine optical density, between 2 and 5 minutes afteraddition of the dimethylglyoxime, in a 4-cm. absorption cell,using blue light at 445 mil.
PURE CALCIUM. 'Proceed as with magnesium, but use only 5m!. of hydrochloric acid in preparing the blank, and only 2 ml. ofcitrate solution. Dilute to about 40 ml. after adding the bromine,then just enough ammonium hydroxide to destroy the brominecolor, plus 1 ml. excess.
CALIBRATION. Measure into 50-ml. volumetric flasks quanti~ties of standard nickel solution containing 0, 10, 20 .... up to 60micrograms of nickel (0 to 60 p.p.m. on a .I-gram sample).Dilute to about 20 ml., and add 1 ml. of hydrochloric acid (specificgravity 1.18). Add citrate, and continue as with pure magnesium.
Plot optical densities against micrograms of nickel. The resulting curve will in general not pass through the origin. An offset curve through the origin is then drawn.
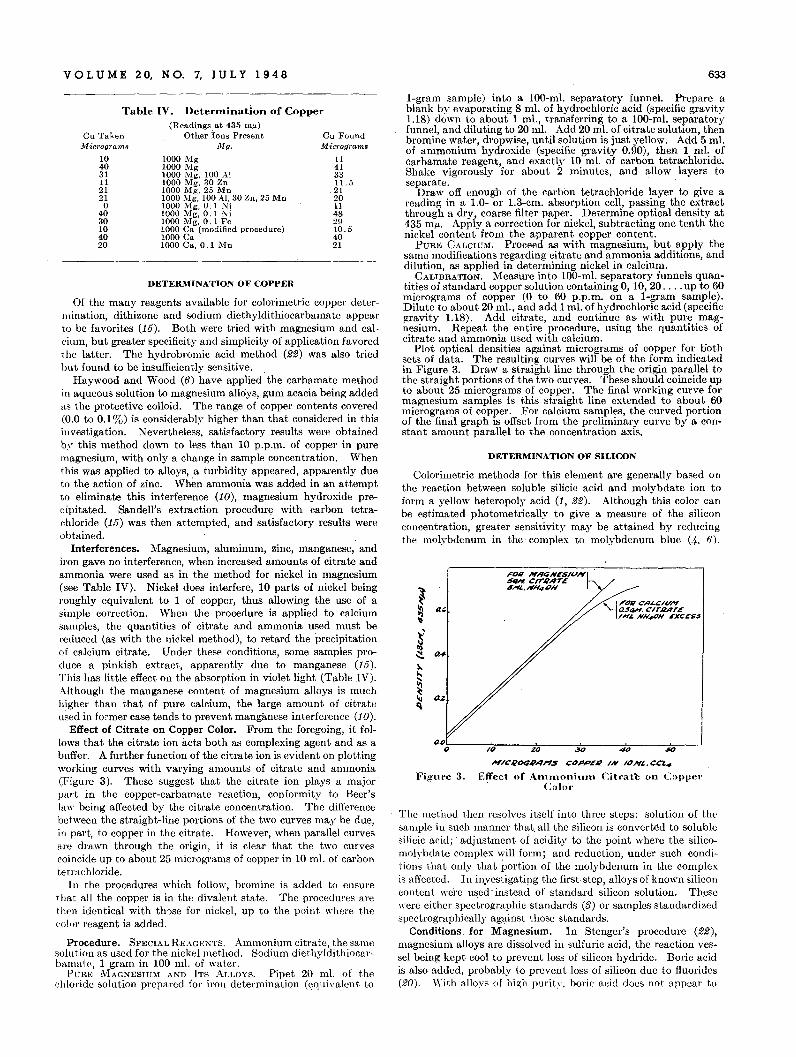
VOL U M E 2 0, N O~ 7, J U L Y 1 9 4 8 633
DETERMINATION OF COPPER
Of the many reagents available for colorimetric copper determination, dithizone and sodium diethyldithiocarbamate appearto be favorites (15). Both were tried with magnesium and calcium, but greater specificity and simplicity of application favoredthe latter. The hydrobromic acid method (22) was also triedbut found to be insufficiently sensitive.
Haywood and Wood (6) have applied the carbamate methodin aqueous solution to magnesium alloys, gum acacia being addedas the protective colloid. The range of copper contents covered(0.0 to 0.1 %) is considerably higher than that considered in thisinvestigation. Nevertheless, satisfactory results were obtainedby this method down to less than 10 p.p.m. of copper in puremagnesium, with only a change in sample concentration. 'Whenthis was applied to alloys, a turbidity appeared, apparently dueto the action of zinc. Wh{)fi ammonia was added in an attemptto eliminate this interference (10), magnesium hydroxide precipitated. Sandell's extraction procedur~ with carbon tetrachloride (15) was then attempted, and satisfactory results wereobtained.
Interferences. 'Magnesium, aluminum, zinc, manganese, andiron gave no interference, whcn increased amounts of citrate andammonia were used as in the method for nickel in magnesium(see Table IV). Nickel does interfere, 10 parts of nickel beingroughly equivalent to 1 of copper, thus allowing the use of asimple correction. When the procedure is applied to calciumsamples, the quantities of citrate and ammonia used must bereduced (as with the nickel method), to retard the precipitationof calcium citrate. Under these conditions, some samples produce a pinkish extract, apparently due to manganese (15).This has little effect on the absorption in violet light (Table IV).Although the manganese content of magnesium alloys is muchhigher than that of pure calcium, the large amount of citrateused in former case tends to prevent manganese interference (10).
Effect of Citrate on Copper Color. From the foregoing, it follows that the citrate ion acts both as complexing agent and as abuffer. A further function of the citrate ion is evident on plottingworking curves with varying amounts of citrate and ammonia(Figure 3). These suggest that the citrate ion plays a majorpart in the copper-carbamate reaction, conformity to Beer'slaw being affected by the citrate concentration. The differencebetween the straight-line portions of the two curves may be due,in part, to copper in the citrate. However, when parallel curvesare drawn through the origin, it is clear that the two curvescoincide up to about 25 micrograms of copper in 10 m!. of carbontetrachloride.
In the procedures which follow, bromine is added to ensurethat all the copper is in the divalent state. The procedures arethen identical with th:>se for nickel, up to the point whet'e theeolor reagent is added.
Procedure. SPECIAL REAGESTS. Ammonium citrate, the samesolution' as used for the nickel method. Sodium diethyldithiocarbamate, 1 gram in 100 m!. of water.
PURE MAGNESIUM AND ITS ALLOYS. Pipet 20 m!. of thechloride solution prepared for it'on determination (equivalent to
'-i FOR c,q~c/u,.,
as..,.,. CITJZAT£/HL NN4 QN £XC£SS
DETERMINATION OF SILICON
Colorimetric methods for this element are generally based ont,he reaction between soluble silicic acid and molybdate ion toform a yellow heteropoly acid (1, 22). Although this color canbe estimated photometrically to give a measure of the siliconconcentration, greater sensitivity may be attained by reducingthe molybdenum in the' complex to molybdenum blue (4. 6).
H/C./loqR"'I"IS COPP£R /N /OHL.CCl..
Figul'e 3. Effect of Annnnniun. C:itt'alc on C"PI,el'Colt,.·
I-gram sample) into a 100-m!. separatory funne!. Prepare ablank by evaporating 8 m!. of hydrochloric acid (specific gravity1.18) down to about 1 m!., transferring to a 100-m!. separatoryfunnel, and diluting to 20m!. Add 20 m!. Of citrate solution, thenbromine water, dropwise, until solution is just yellow. Add 5 m!.of ammonium hydroxide (specific gravity 0.90), then 1 ml. ofcarbamate reagent, and exactly 10 ml. of carbon tetrachloride.Shake vigorously for about 2 minutes, and allow layers toseparate.
Draw off enough of the carbon tetrachloride layer to give areading in a 1.0- or 1.3-cm. absorption cell, passing the extractthrough a dry, coarse filter paper. Determine optical density at435 m,.,. Apply a correction for nickel, subtracting one tenth thenickel content from the apparent copper content.
PURE CALCIUM. Proceed as with magnesium, but apply thesame modifications regarding citrate and ammonia additions, anddilution, as applied in determining nickel in calcium.
CALIBRATION. Measure into 100-m!. separatory funnels quantities of standard copper solution containing 0, 10,20 .... up to 60micrograms of copper (0 to 60 p.p.m. on a I-gram sample).Dilute to about 20 ml., and add 1 m!. of hydrochloric acid (specificgravity 1.18). Add citrate, and continue as with pure magnesium. Repeat the entire procedure, using the quantities ofcitrate and ammonia used with calcium.
Plot optical densities against micrograms of copper for bothsets of data. The resulting curves will be of the form indicatedin Figure 3. Draw a straight line through the origin parallel tothe straight portions of the two curves. These should coincide upto about 25 micrograms of copper. The final working curve formagnesium samples is this straight line extended to about 60micrograms of copper. For calcium samples, the curved portionof the final graph is offset from the preliminary curve by a constant amount parallel to the concentration axis.
The method then resolves itself into three steps: solution of thesample in such manner that. all the silicon is converted to solublesilicic acid; adjustment of acidity to the point where the silicomolybdate complex will form; and reduction, under such conditions that only that portion of the molybdenum in the complexis affected. In inyestigating the first step, alloys of known siliconcontent wei'e used' instead of standard silicon solution. These,,-ere either spectrographic standards (3) or samples standardizedspectrographically against those standards.
Conditions. for Magnesium. In Stenger's procedure (22),magnesium alloys are dissolved in sulfuric acid, the reaction vessel being kept cool to prevent loss of silicon hydride. Boric acidis also added, probably to prevent loss of silicon due to fluorides(20). \Yith alloys of high purit.'" boric fleicl does not appeal' to
11413311. 5
.212011482910.54021
Cn FoundlJiCTograms
1000 Mg1000 Mg1000 Mg, 100 .-\.I1000 Mg, 30 Zn1000 Mg, 25 Mn1000 Mg, 100 AI, 30 Zn, 25 Mn1000 Mg. 0.1 Ni1000 Mg. 0.1 Ni1000 Mg, 0.1 Fe1000 Ca (modified procedure)1000 Ca1000 Ca, 0.1 lVIn
Table IV. Determination of Copper(Readings at 435 m,,)
Other ions PresentMg.
104031112121o
4030104020
Cn Takeni\'1iCTograms
be necessary (Table V). However, poor recoveries of siliconresulted when the solutions were allowed to heat up in the processof dissolving the sample, presumably .due to loss of hydride.High-purity alloys, containing less than 100 p.p.m. of silicon,were found to leave no insoluble residue, thus eliminating thenecessity of fusion with sodium carbonate (22).
J;!:ffect of Acidity. The reaction between silicic acid and molybdate ion appears to work best at an acid concentration of approximat.ely 0.1 N (1). The color failed t.o develop when attemptswere made at much higher acidities, while the use of less acid ledto incomplete solution of the sample.
Reduction Conditions. Sodium sulfite has been used as reducing agent in the production of molybdenum blue from silicamolybdic acid (.4), but its use requires precise pH control. Ifstannous chloride is used, the solution must be made stronglyacid after the silicomolybdate yellow color has fully developed;otherwise, a deep blue solution results, probably due to conversionof some of t.he excess molybdate to molybdenum blue. In thestrongly acid solution, the resulting blue density is proportionalto silicon concentration.
Application to Calcium. Attempts were made to apply thismethod to calcium, but results were widely erratic. (Hydrochloric acid was substituted for sulfuric, to prevent precipitationof calcium sulfate.) The loss of hydrides in the vigorous reactionof dissolving calcium in water was apparently responsible.Attempts to slow down t.he reaction by cooling gave no betterresults. The use of an alkaline solution was found to be necessary to assure quantitative conversion of silicon to soluble silicates. This led to silica contamination from the glassware,both with Pyrex and with Corning alkali-resisting glass, necessitating the use of platinum. Once the sample was dissolved,conditions of the procedure for magnesium were essentially duplicated, except that hydrochloric replaced sulfuric acid.
Procedure. SPECIAL REAGENTS. Sodium hydroxide, 1 N,stored in a hard rubber or wax-lined bottle. Hydrochloric acid,1 N. Sulfuric acid, 1 to 4, freshly prepared. Ammonium molybdate, SO grams per liter, filtered.
Stannous chloride, 1%. Dissolve 1 gram in 2 inl. of hydrochloric acid (specific gravity LIS) and dilute to 100 ml. Prepare freshevery 2 or 3 days.
PURE MAGNEJSIUM AND ALLOYS. Weigh 2 grams of coarseturnings into a 400-ml. beaker, cover with 100 ml. of water, andtilt the beaker to allow the sample to slide to one side. Place in acold water bath, and dissolve by the slow addition of 27.5 ml. ofsulfuric acid (1 to 4) to the side of the beaker away from thesample. The rate of addition should be sufficiently rapid to keep aslow, stead}' reaction going, without overheating. When thereaction subsides after all the acid has been added, warm gentlyto complete solution. Cool, transfer to a 200-ml. volumetricflask, and dilute to the mark. Pipet 50 ml. (equivalent to 0.5gram sample) into a 100-ml. volumetric flask. Prepare a blank,containing 1 ml. of sulfuric acid (1 to 4), dil\lted to 50 mI., inanother 100-ml. flask. Add 5 ml. of molybdate solution, andallow to stand. 10 to 15 minutes. Add 10 ml. of sulfuric acid (1 to4), and allow to stand 2 or 3 minutes. Add 2 ml. of stannouschloride solution, dilute to the mark, and allow to stand 10 to 15 .minutes.
Determine optical density in a 4-cm. absorption cell, using redlight at 650 m).'.
PURE CALCIUM. Using a plastic pipet, place 5 ml. of 1 Nsodium hydroxide in a 75-ml. platinum crucible, and dilute to 25ml. Add 0.5 gram of coarse turnings, and heat to boilin/!. stirring
Table V. DeterITlination of SiliconOther 10l\s Present Conditions
Mg.
634
8i Present.A-licrograms
2030
2030
2626102040
1000 Mg350 Mg, 100 AI, 30 Zn,
20 Mn1000 Mg850 Mg, 100 AI, 30 Zn,
20 Mn1000 Mg1000 Mg1000 Ca1000 Ca1000 Ca
With boric acidWith boric acid
Without boric acidWithout boric acid
Dissolved coolDissolved hotNaOH-HCI procedureNaOH-HCI procedureNaOH-HCl procedure
8i FoundMicrograms
2029
2032
26169
2138
ANALYTICAL CHEMISTRY
with a platinum or hard-rubber rod to assist solution. Whenreaction is complete,. carefully add 5 m!. of hydrochloric acid (1to 1), with continuousstirring. Remove.fromheat, and adjust with1 N hydrochloric acid and 1 N sodium hydroxide, until just acidto litmus, then add 5 ml. of 1 N hydrochloric acid excess. Preparea blank, containing the same quantity of sodium hydroxide inanother platinum crucible. Adjust acidity as with the sample,using only 1 N acid and alkali. Cool and transfer to 100-ml.volumetric flasks. Add 5 m!. of molybdate solution, and allowto stand 10 to 15 minutes. Add 10 ml. of hydrochloric acid(specific gravity. LIS), and allow to stand 2 or 3 minutes. Add Zml. of stannous chloride solution, dilute to the mark, and allow tostand 10 to 15 minutes.
Determine optical density in a 4-cm. absorption cell, using redlight at 650 m).'. .
CALIBRATION. Measure into 100-ml. volumetric flasks quantities of standard silicon solution containing 0, 5, 10 ... up to 50micrograms of silicon (0 to 100 p.p.m. on a 0.5-gram sample).Add 1 ml. of sulfuric acid (1 to 4) and dilute to 50 ml. Continueas with magnesium.
Plot optical densities against micrograms of silicon. The resulting curve will, in general, not pass through the origin. Anoffset curve is then drawn throJIgh the origin. If hydrochloricacid is used instead of sulfuric acid, and the calcium procedure isfollowed, the resulting curve through the origin will coincide.
SUMMARY
Sensitive photometric methods have been applied for thedetermination of microgram quantities of manganese, iron, nickel,copper, and silicon in high-purity magnesium, magnesium alloys,and calcium. Effects of interferences from other elements likelyto be present have been studied. The methods have been usedon a routine basis for the past year, with satisfactory results.
ACKNOW LEDGMENT
The writer is indebted to H. E. Weller for the experimentalwork on the determination of silicon in calcium, and to DominionMagnesium Limited for permission to publish.
LITERATURE CITED
(1) Adams, M. F., IND. ENG. CIJ:EM., ANAL. ED., 17,542 H945).(2) Am. Soc. Testing Materials, Committees E-2 and E-3, "Methods
of Chemical Analysis of Metals," p. 163, Philadelphia, American Society for Testing Materials, 1946.
(3) Am. Soc. Testing Materials, Committee E-2, "Report on Standard Samples for Spectrochemical Analysis," Philadelphia,American Society for Testing Materials, 1947.
(4) Boyle, A. J., and Hughey, V. V., IND. ENG. CHEM., ANAL. ED.,15,618 (1943).
(5) Diehl, H., "Applications of the Dioximes to Analytical Chemistry," Columbus, Ohio, G. Frederick Smith Chemical Co.,1940.
(6) Haywood, F. W., and Wood, A. A. R., "Metallurgical Analysis,"p. 110, London, Adam Hilger, 1944:
(7) Kolthoff, I. M., and Sandell, E. B., "Textbook of QuantitativeInorganic Analysis," rev. ed., p. 595, New York, MacmillanCo., 1945.
(8) Mitchell, A. M., and Mellon, M. G., IND. ENG. CHEM., ANAL.ED., 17, 380 (1945).
(9) Passamaneck, E., Ibid., 17, 257 (1945).(10) Pat.ridge, R. F., Ibid., 17,422 (1945).(11) Peters, C. A., MacMasters, M. M., and French, C. L., Ibid., 11,
502 (1939).(12) Pidgeon, L. M., and Alexander, W. A., Trans. Am. Inst. Mining
Met. Engrs., 159,315 (1944).(13) Richards, M. B., Analyst, 55, 554 (1930).(14) Rollet, A. P., Compt. rend., 183, 212 (1926).(15) Sandell, E. B., "Colorimetric Determination of Traces of
Metals," p. 217, New York, Interscience Publishers, 1944.(16) Ibid., p. 262.(17) Ibid., p. 312.(18) Sandell, E. B., and Perlich, R. W., IND. ENG. CHEM., ANAL. ED.,
11,309 (1939).(19) Scott, .W. W., "Standard Methods of Chemical Analysis," 5th
ed., p. 562, New York, D. Van Nostrand Co., 1939.(20) Ibid., p. 802.(21) Staub, P. H., Chem. Met. Eng., 52.. Nq. 8, 94 (August 1945).(22) Stenger, V. A., Proc. Am. Soc. Testing Materials, 44, 754
(1944).
RECEIvEn November 20, 1947.
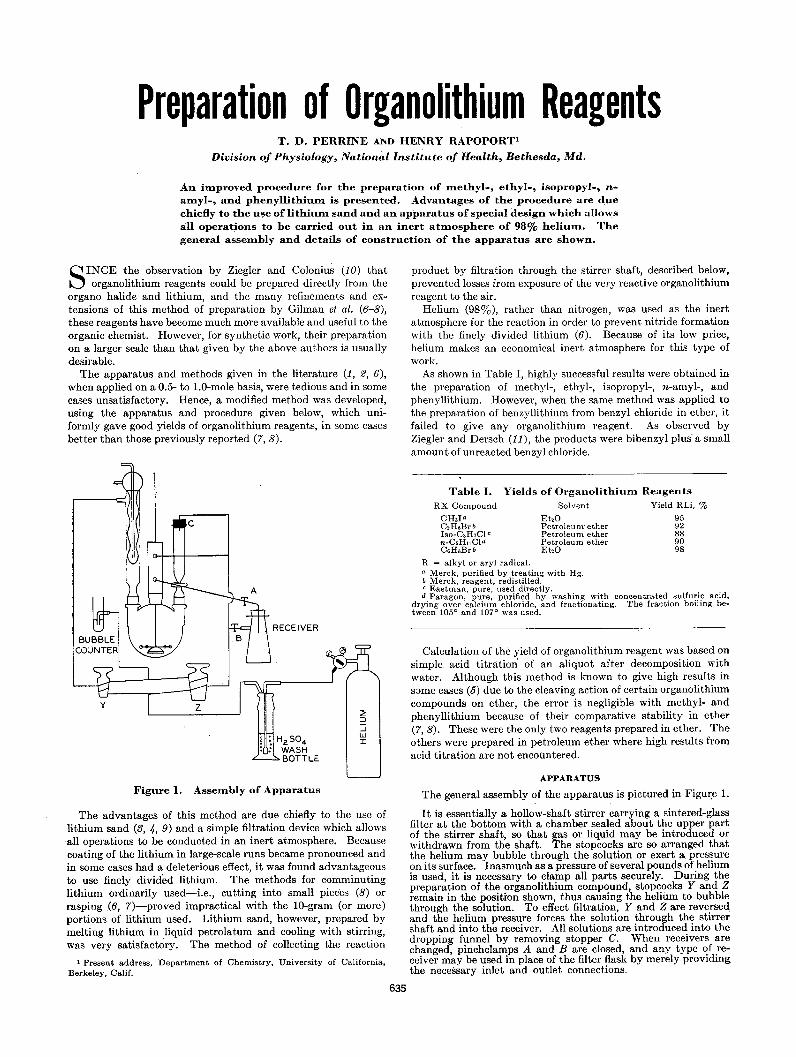
Preparation of Organolithium ReagentsT. D. PERRINE AND HENRY RAPOPORTl
Division of Physiology, National Institute of Health, Bethesda, Md.
An inlproved procedure for the preparation of nlethyl., ethyl-, isopropyl-, nanlyl-, and phenyllithiuIll is presented. Advantages of the procedure are d,uechiefly to the uo;;e of lithiuIll sand and an apparatus of special design which allowsall operations to be carried out in an inert atnlosphere of 98% heliunl. Thegeneral assenlbly and details of construction of the apparatus are shown.
SINCE the observation by Ziegler and Colonius (10) thatorganolithium reagents could be prepared directly from the
organo halide and lithium, and the many refinements and extensions of this method of preparation by Gilman et al. (6-8),these reagents have become much more available and useful to theorganic chemist. However, for synthetic work, their preparationon a larger scale than that given by the above authors is usuallydesirable.
The apparatus and methods given in the literature (1, 2, 6),when applied on a 0.5- to 1.0-mole basis, were tedious and in somecases unsatisfactory. Hence, a modified method was developed,using the apparatus and procedure given below, which uniformly gave good yields of organolithium reagents, in some casesbetter than those previously reported (7, 8).
product by filtration through the stirrer shaft, described below,prevented losses from exposure of the very reactive organolithiumreagent to the air.
Helium (98%), rather than nitrogen, was used as the inertatmosphere for the reaction in order to prevent nitride formationwith the finely divided lithium (6). Because of its low price,helium makes an economical inert atmosphere for this type ofwork.
As shown in Table I, highly successful results were obtained inthe preparation of methyl-, ethyl-, isopropyl-, n-amyl-, andphenyllithium. However, when the same method was applied tothe preparation of benzyllithium from benzyl chloride in ether, itfailed to give any organolithium reagent. As observed byZiegler and Dersch (11), the products were bibenzyl plus' a smallamount of unreacted benzyl chloride.
Yields of Organolithiunl ReagentsSolvent Yield RLi, %
Et,O 95Petroleum ether 92Pet-roleu m ether 88Petroleum ether 90Et,O 98
Table I.RX Compound
CH,IaC2H,BrbIso-C,H,CI cn-C.HllCldC.H.Brb
R ~ alkyl or aryl radical.a Merck, purified by treating with Hg.b Merck, reagent, redistilled.c Eastman, pure, used directly.d Paragon, pure, purified by washing ,\lith concentrated sulfuric acid,
drying over calcium chloride, and fractionating. The fraction boiling between 105 0 and 107 0 was used.
Calculation of the yield of organolithium reagent was based onsimple, acid titration of an aliquot after decomposition withwater. Although this method is known to give high results ins:>me cases (5) due to the cleaving action of certain organolithiumcompounds on ether, the error is negligible with methyl- andphenyllithium because of their comparative stability in ether(7,8). These were the only two reagents prepared in ether. Theothers were prepared in petroleum ether where high results fromacid titration are not encountered.
:::;;:::l...JWI
RECEIVER
~ H2 S04• WASH
BOTTLE
Figure 1. Assenlbly of Apparatus
The advantages of this method are due chiefly to the use oflithium sand (3, 4, 9) and a simple filtration device which allowsall operations to be conducted in an inert atmosphere. Becausecoating of the lithium in large-scale runs became pronounced andin some cases had a deleterious effect, it was found advantageousto use finely divided lithium. The methods for comminutinglithium ordinarily used-i.e., cutting into small pieces (8) orrasping (6, 7)-proved impractical with the lo-gram (or more)portions of lithium used. Lithium sand, however, prepared bymelting lithium in liquid petrolatum and cooling with stirring,was very satisfactory. The method of collecting the reaction
1 Present address, Department of Chemistry, University of California,Berkeley, Calif.
APPARATUS
The general assembly of the apparatus is pictured in Figur:e 1.
It is essentially a hollow-shaft stirrer carrying a sintered-glassfilter at the bottom with a chamber sealed about the upper partof the stirrer shaft, so that gas or liquid may be introduced orwithdrawn from the shaft. The stopcocks are so arranged thatthe helium may bubble through the solution or exert a pressureon its surface. Inasmuch as a pressure of several pounds of heliumis used, it is necessary to clamp all parts securely. During thepreparation of the organolithium compound, stopcocks Y and Zremain in the position shown, thus causing the helium to bubblethrough the solution. To effect filtration, Y and Z are reversedand the helium pressure forces the solution through the stirrershaft and into the receiver. All solutions are introduced into thedropping funnel by removing stopper C. When receivers arechanged, pinchclamps A and B are closed, and any type of receiver may be used in place of the filter flask by merely providingthe necessary inlet and outlet connections.
635
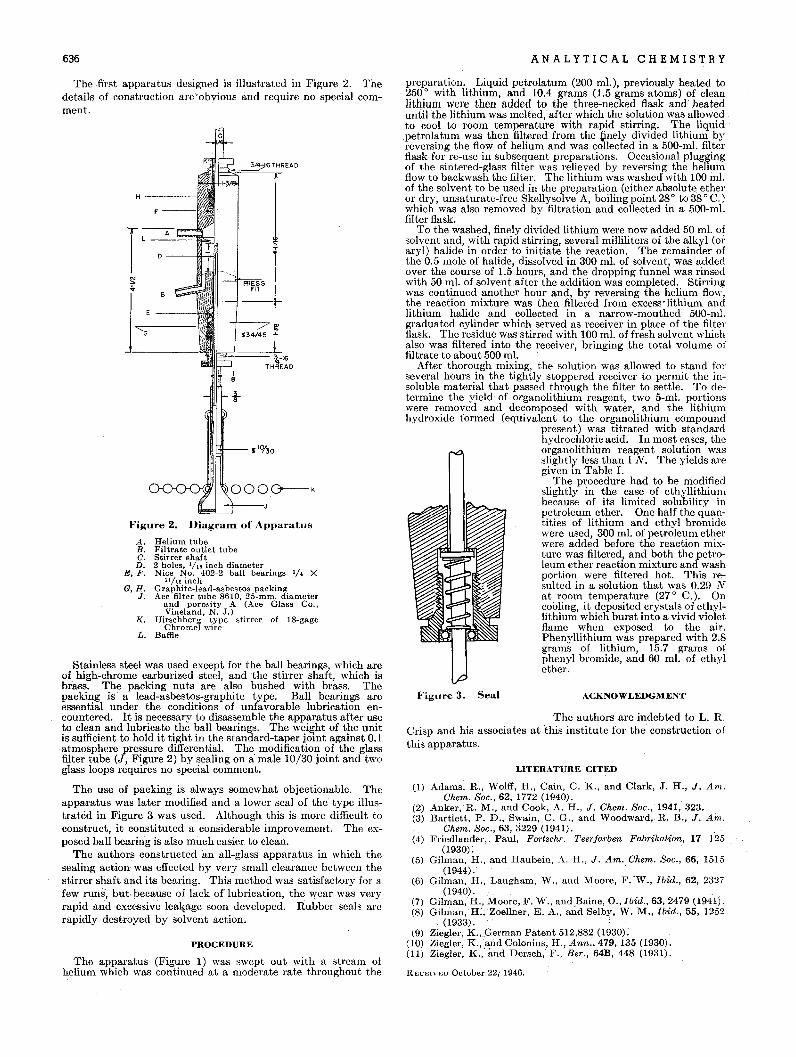
636 ANALYTICAL CHEMISTRY
RECEn'ED October 22; 1946.
The authors are indebted to L. R.Crisp and his associates at 'this institute for the construction ofthis apparatus.
ACKNOWLEDGMENTFigure 3. Seal
LITERATURE ClTED
(1) Adams, R., Wolff, H., Cain, C. K., and Clark, J. H., J. Am.Chem. Soc., 62, 1772 (1940).
(2) Anker, R. M., and Cook, A. H., J. Chem. Soc., 1941,323.(3) Bartlett,P. D., Swain, C. G., and Woodward, R. B., J. Am.
Chem. Soc., 63, 3229 (1941).(4) Friedlander" Paul, Fo-rtschr. Teerf(,-rben Fab-rikation, 17 125
(1930r(5) Gilman, H., and Haubein, A. H., J. Am. Chem. Soc., 66, 1515
(1944) .(6) Gilman, H., Langham. W., and "'foore, F. ·W., Ibid., 62, 2327
(1940). •(7) Gilman, H., Moore, F. W., and Baine, 0., Ibid., 63, 2479 (1941),(8) Gilman, H:, Zoellner, E. A., and Selby, W. M., Ibid., 55, 1252
(1933) .(9) Ziegler,K.,German Patent 512,882 (1930).
(10) Ziegler, K.,and Colonins, H., Ann., 479,135 (1930).(ll) Ziegler, K.; 'md Dersch, F., Be-r., 64B, 448 (1931).
preparation. Liquid petrolatum (200 ml.), previously heated to250 0 with lithium, and 10.4 grams (1.5 grams atoms) of cleanlithium were then added to the three-necked flask and heateduntil the lithium was melted, after which the solution was allowedto cool to room temperature with rapid stirring. The liquid,petrolatum was then filtered from the p.nely divided lithium byreversing the flow of helium and was collected in a 500-ml. filterflask for re-use in subsequent preparations. Occasional pluggingof the sintered-glass filter was relieved by reversing the heliumflow to backwash the filter. The lithium was washed with 100 m!'of the solvent to be used in the preparation (either absolute ethel'or dry, unsaturate-free Skellysolve A, boiling point 28 0 to 38 0 C.)which was also removed by filtration and collected in a 500-m!.filter flask.
To the washed, finely divided lithium were now added 50 m!' ofsolvent and, with rapid stirring, several milliliters of the alkyl (oraryl) halide in order to initiate the reaction. The remainder ofthe 0.5 mole, of halide, dissolved in 300 ml. of solvent, was addedover the course of 1.5 hours, and the dropping funnel was rinsedwith 50 m!' of solvent after the addition was completed. Stirringwas continued another hour and, by reversing the helium flow,the reaction mixture was then filtered from excess'lithium andlithium halide and collected in' a narrow-mouthed 500-m!.graduated cylinder which served as receiver in place of the filterflask. The residue was stirred with 100 ml. of fresh solvent whichalso was filtered into the receiver, bringing the total volume offiltrate to about 500 ml.
After thorough mixing, the solution was allowed to stand forseveral hours in the tightly stoppered receiver to permit the insoluble material that passed through the filter to settle. To determine the yield' of organolithium reagent, two 5-ml. portionswere removed and decomposed with water, and the lithiumhydroxide formed (equivalent to the organolithium compound
present) was titrated with standardhydrochloric acid. In most cases, theorganolithium reagent solution wasslightly less than 1 N. The yields aregiven in Table 1.
The procedure had to be modifiedslightly in the case of ethyllithiumbecause of its limited solubility inpetroleum ether. One half the quantities of lithium and ethyl bromidewere used, 300 ml. of petroleum etherwere added before the reaction mixture was filtered, and both the petroleum ether reaction mixture and washportion were filtered hot. This resulted in a solution that was 0.29 Nat room temperature (27 0 C.). Oncooling, it deposited crystals of ethyllithium which burst into a vivid violetflame when exposed to the air.Phenyllithium was prepared with 2.8grams of lithium, 15.7 grams ofphenyl bromide, and 60 ml. of ethylether.
H-----
Figure 2. DiagraIll of Apparatus
,-t. Helium tubeB. Filtrate outlet tubeC. Stirrer shaftD. 2 holes. lh6 inch diameter
E, /<'. Nice No. 402-2 ball bearings 1/. Xu/H inch
G, H. Graphite-lead-asbestos packingJ. Ace filter tube 8610, 25-mm, diameter
and porosity A (Ace Glass Co.,Vineland, N. J.)
K. Hirschberg type stirrer of 18-gageChromel wire
L. Bailie
The ,first apparatus designed is illustrated in Figure 2. Thedetails of construction are'obvious and require no special comment.
PROCEDURE
The apparatus (Figure 1) was swept out with a stream ofhelium which was continued at a moderate rate throughout the
Stainless steel was used except for the ball bearings, which areof high-chrome carburized steel, and the stirrer shaft, which isbrass. The packing nuts are also bushed with brass. Thepacking is a lead-asbestos-graphite type. Ball bearings areessential under the conditions of unfavorable lubrication encountered. It is necessary to disassemble the apparatus after useto clean and lubricate the ball bearings. The weight of the unitis sufficient to hold it tight in the standard-taper joint against 0.1atmosphere pressure differential. The modification of the glassfilter tube (J, Figure 2) by sealing on a male 10/30 joint and twoglass loops requires no special comment.
The use of packing is always somewhat objectionable. Theapparatus was later modified and a lower seal of the type illustrated in Figure 3 was used. Although this is more difficult toconstruct, it constituted a considerable improvement. The exposed ball bearin'g is also much easier to clean.
The authors constructed an all-glass apparatus in which thesealing action was effected by very small clearance between thestirrer shaft and its bearing. This method was satisfactory for afew runs, but, bec;ause oflack of lubrication, the wear was veryrapid and excessive lea~age soon developed. Rubber seals arerapidly destroyed by solvent action.
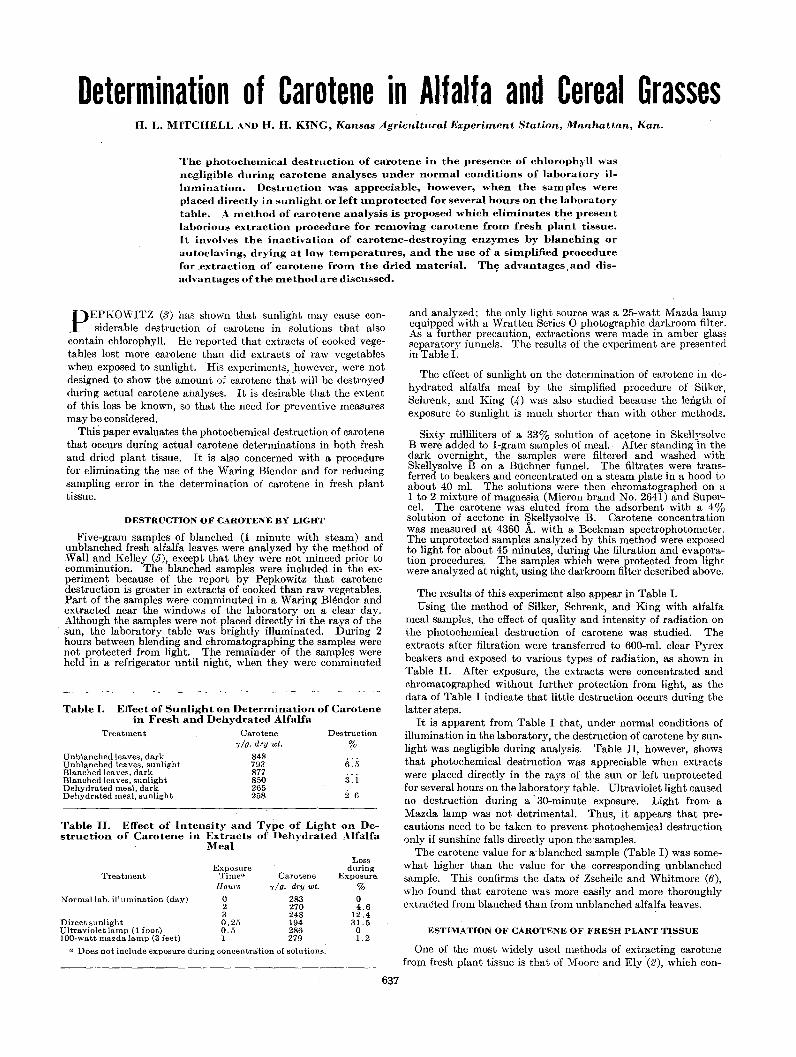
Determination of Carotene in Alfalfa and Cereal GrassesH. L. MITCHELL AND H. H. KING, Kansas. Agricultural Experiment Station, lVlanhattan, Kan.
'The photochelllical destruction of carotene in the presence of chlorophyll wasnegligible during carotene analyses under norlllal conditions of laboratory illUlllination. Destruction was appreciable, however, when the samples wereplaced directly in sunlight or left unprotected for several hours on the laboratorytable. A method of carotene analysis is proposed which eliminates the presentlaborious extraction procedure for removing carotene from fresh plant tissue.It involves the inactivation of carotene-destroying enzyllles by blanching orautoclaving, drying at low temperatures, and the use of a simplified procedurefor ,extraction of carotene froID, the dried material. Th~ advantages.and disadvantages of the method are discussed.
Table I. Effect of Sunlight On Determination of Carotenein Fresh and Dehydrated Alfalfa
Table II. Effect of Intensity and Type of Light on Destruction of Carotene in Extracts of nehydrated Alfalfa
Meal
DESTRUCTION OF CAROTENE BY LIGHT
Five-gram samples of blanched (1 minute with steam) andunblanched fresh alfalfa leaves were analyzed by the method ofWall and Kelley (5), except that they were not minced prior tocomminution. The blanched samples were included in the experiment because of the report by Pepkowitz that carotenedestruction is greater in extracts of cooked than raw vegetables.Part of the samples were comminuted in a ·Waring B16ndor andextracted near the windows of the laboratory on a clear day.Although the samples were not placed directly in the rays of thesun, the laboratory table was brightly illuminated. During 2hours between blending and chromatographing the samples werenot protected from light. The remainder of the samples wereheld in a refrigerator until night, when they were comminuted
PEPKOVVITZ (3) has shown that sunlight may cause considerable destruction of carotene in solutions that also
contain chlorophyll. He reported that extracts of cooked vegetables lost more carotene than did extracts of raw vegetableswhen exposed to sunlight. ·His experiments, however, were notdesigned to show the amount of carotene that will be destroyedduring actual carotene analyses. It is desirable that the extentof this loss be known, so that the need for preventive measuresmay be considered.
This paper evaluates the photochemical destruction of carotenethat occurs during actual carotene determinations in both freshand dried plant tissue. It is also concerned with a procedurefor eliminating the use of the Waring Blendor and for reducingsampling error in the determination of carotene in fresh planttissue.
and analyzed; the only light source was a 25-watt Mazda lampequipped with a Wratten Series 0 photographic darkroom filter.As a further precaution, extractions were made in amber glassseparatory funnels. The results of the experiment are presentedin Table!.
The effect of sunlight on the determination of carotene in dehydrated alfalfa meal by the simplified procedure of Silker,Schrenk, and King (..0 was also studied because the length ofexposure to sunlight is much shorter than with other methods.
Sixty milliliters of a 33% solution of acetone in SkellysolveB were added to I-gram samples of meal. After standing in thedark overnight, the samples were filtered and washed withSkellysolve B on a Buchner funnel. The filtrates were transferred to beakers and concentrated on a steam plate in a hood toabout 40 ml. The solutions were then chromatographed on a1 to 2 mixture of magnesia (Micron brand No. 2641) and Supercel. The carotene was eluted from the adsorbent with a 4%solution of acetone in Skellysolve B.. Carotene concentrationwas measured at 4360 A. with a Beckman spectrophotometer.The unprotected samples analyzed by this method were exposedto light for about 45 minutes, during the filtration and evaporation procedures, The samples which were protected from lightwere analyzed at night, using the darkroom filter described above.
The results of this experiment also appear in Table I.Using the method of Silker, Schrenk, and King with alfalfa
meal samples, the effect of quality and intensity of radiation onthe photochemical destruction of carotene was studied. Theextracts after filtration were transferred to 600-mL clear Pyrexbeakers and exposed to various types of radiation, as shown inTable II. After exposure, the extracts were concentrated andchromatographed without further protection from light, as thedata of Table I indicate that little destruction occurs during thelatter steps.
It is apparent from Table I that, under normal conditions ofillumination in the laboratory, the destruction of carotene by sunlight was negligible during analysis. Table II, however, showsthat photochemical destruction was appreciable when extractswere placed directly in the rays of the sun or .left unprotectedfor several hours on the laboratory table. Ultraviolet light causedno destruction during a' 30-minute exposure. Light from aMazda lamp was not detrimentaL Thus, it appears that precautions need to be taken to prevent photochemical destructiononly if sunshine falls directly upon the· samples.
The carotene value fora' blanched sample (Table I) was somewhat higher than the value for the corresponding unblanchedsample. This confirms the data of Zscheile and Whitmore (6),who found that carotene was more easily and more thoroughlyextracted from blanched than from unblanched alfalfa leaves.
ESTIMATION OF CAROTENE OF FRESH PLANT TISSUE
One of the most Widely used methods of extracting carotenefrom fresh plant tissue is that of :vroore and Ely'(2), which con-
3.1
2.6
6.5
Lossduring
Exposure%o4.6
12.431.5o1.2
Destruction%
Carotene"Y/u. dry wi.
283270248194286279
Carotene"Y/u. dry wi.
848793877850265258
o230.250.51
ExposureTinlcu
Hours
a Does not include exposure during concentration of solutions.
Unblanched leaves, darkUnblanched leaves. sunlightBlanched leaves, darkBlanched leaves, sunlightDehydrated meal, darkDehydrated meal, sunlight
Trcatluent
Treatnlcnt
Normallab. illumination (day)
Direct sunlightUltraviolet lamp (1 foot)100-watt mazda lamp (3 feet)
637
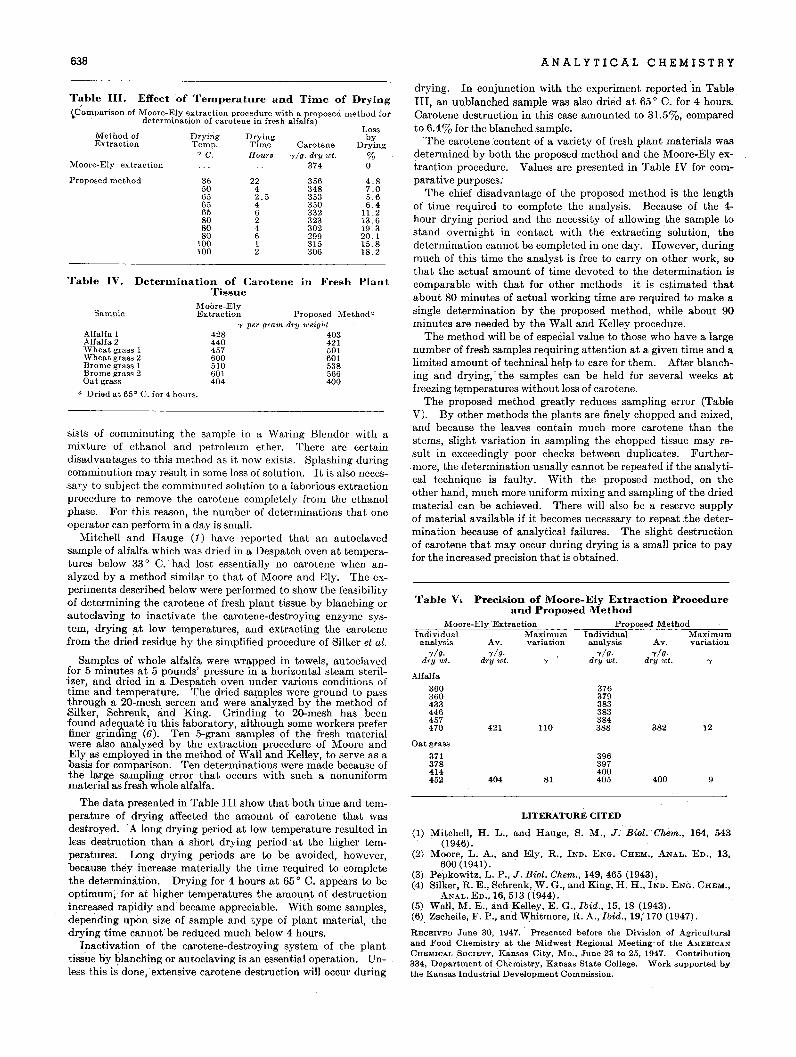
638 ANALYTICAL CHEMISTRY
Table IV. DeterDlination of Carotene in Fresh PlantTissue
9
12
400
382
396397400405
376379383383384388
81
110
404
421
Oat grass
371378414452
Table V. Precision of Moore-Ely Extraction Procedure, and Proposed Method
Moore-Ely 'Extraction Proposed MethodIndividual Maximum Individual Maximum
analysis Avo variation analysis Avo variation'flu. 'flu. 'flu. 'flu.
dry wt. dry wt. 'f dry wI- dry wt. 'f
Alfalfa
360360433446457470
LITERATURE CITED
(1) Mitchell, H. L., and Hauge, S. M., J. 'Bioi. Chem., 164, 543(1946) .
(2) Moore, L. A., and Ely, R., IND. ENG. CHEM., ANAL. ED., 13,600 (1941).
(3) Pepkowitz, L. P., J. Bioi. Chem., 149,465 (1943).(4) Silker, R. E., Schrenk, W. G., and King, H. H., IND. ENG. CHEM.,
ANAL. ED., 16,513 (1944).(5) Wall, M. E., and Kelley, E. G., Ibid., 15, 18 (1943).(6) Zscheile, F. P., and Whitmore, R. A., Ibid., 19; 170 (1947).
RECEIVED June 30, 1947. Presented before the Division of Agriculturaland Food Chemistry .at the Midwest Regional Meeting' of the AMERICANCHEMICAL SOCIETY, K~nsas City, Mo:, June 23 to 25, 1947. Contribution334, Department of Chemistry, Kansas State College. Work supported bythe Kansas Industrial Development Commission.
drying. In conjunction with the experiment reported in Table.III, an unblanched sample was also dried at 65 0 C. for 4 hours.Carotene destruction in this case amounted to 31.5%, comparedto 6.4% for the blanched sample.
'The carotene .content of a variety of fresh plant materials wasdetermined by both the proposed method and' the Moore-Ely extraction procedure. Values are presented in Table IV for comparative purposes:
The chief disadvantage of the proposed method is the lengthof time required to complete the analysis. Because of the 4hour drying period and the necessity of allowing the sample tostand overnight in contact with the extracting solution, thedetermination cannot be completed in one day. However, duringmuch of this time the analyst is free to carryon other work, sothat the actual amount of time devoted to the determination iscomparable with that for other methods-it is estimated thatabout 80 minutes of actual working time are required to make asingle determination by the proposed method, while about 90minutes are needed by the Wall and Kelley procedure.
The method will be of especial value to those who have a largenumber of fresh samples requiring attention at a given time and alimited amount of technical help to care for them. After blanching and drying,' the samples can be held for several weeks atfreezing temperatures without loss of carotene.
The proposed method greatly reduces sampling error (TableV). By other methods the plants are finely chopped and mixed,and because the leaves contain much more carotene than thestems, slight variation in sampling the chopped tissue may result in exceedingly poor checks between duplicates. Further.more, the determination usually cannot be repeated if the analytical technique is faulty. \Vith the proposed method, on theother hand, much more uniform mixing and sampling of the driedmaterial can be achieved. There will also be a reserve supplyof material available if it becomes necessary to repeat .the determination because of analytical failures. The slight destructionof carotene that may occur during drying is a small price to payfor the increased precision that is obtained.
4.87.05.66.4
11.213.619.320.115.818.2
356348353350332323302299315306
Carotene'flu. dry wt.
374
2242.54624612
DryingTimeHours
428440457600510601404
3650656565808080
100100
Moore-ElyExtraction Proposed lVlethoda
'Y per gram dry weight
403421501601538.566400
DryingTemp.
o C.
Method ofExtraction
Sample
Alfalfa 1Alfalfa 2\Vheat grass 1Wheat grass 2Brome grass 1Brome grass 2Oat grass
a Driad at 65° C. for 4 hours.
Table III. Effect of TeDlperature and TiDle of Drying~CompaTi50nof IVloore-Ely extrae-tion procedure with a proposed method for
determination of carotene in fresh alfalfa)Lossby
Drying
%o
Proposed method
!vIoore-Ely extraction
sists of comminuting the sample in a Waring Blendor with amixture of ethanol and petroleum ether. There are certain-disadvantages to this method as it now exists. Splashing duringcomminution may result in some loss of solution. It is also necessary to subject the comminuted solution to a laborious extractionprocedure to remove the carotene completely from the ethanolphase. For this reason, the number of determinations that oneoperator can perform in a day is small.
Mitchell and Hauge (1) have reported that an autoelavedsample of alfalfa which was dried in a Despatch oven at temperatures below 33 0 C. had lost essentially no carotene when analyzed by a method similar to that of Moore and Ely. The experiments described below were performed to show the feasibilityof determining the carotene of fresh plant tissue by blanching orautoelaving to inactivate the carotene-destroying enzyme system, drying at low temperatures, and extracting the carotenefrom the dried residue by the simplified procedure of Silker et al.
Samples of whole alfalfa were wrapped in towels, autoclavedfor 5 minutes at 5 pounds' pressure in a horizontal steam sterilizer, and dried in a Despatch oven under various conditions oftime and temperature. The dried samples were ground to passthrough a 20-mesh screen and were analyzed by the method ofSilker, Schrenk, and King. Grinding to 2Q-mesh has beenfound adequate in this laboratory, although some workers preferfiner grinding (6). Ten 5-gram samples of the fresh materialwere also analyzed by the extraction procedure of Moore andEly as employed in the method of Wall and Kelley, to serve as abasis for comparison. Ten determinations were made because ofthe large sampling error that occurs with such a nonuniformmaterial as fresh whole alfalfa.
The data presented in Table III show that both time and temperature of drying affected the amount of carotene that wasdestroyed. A long drying period at low temperature resulted inless destruction than a short drying period 'at the higher temperatures. Long drying periods are to be avoided, however,because they increase materially the time required to completethe determination. Drying for 4 hours at 65 0 C. appears to be{)ptimum, for at higher temperatures the amount of destructionincreased rapidly and became appreciable. With some samples,depending upon size of sample and type of plant material, thedrying time cannot be reduced much below 4 hours.
Inactivation of the carotene-destroying system of the planttissue by blanching or autoclaving is an essential operation. Unless this is done,' extensive carotene destruction will occur during
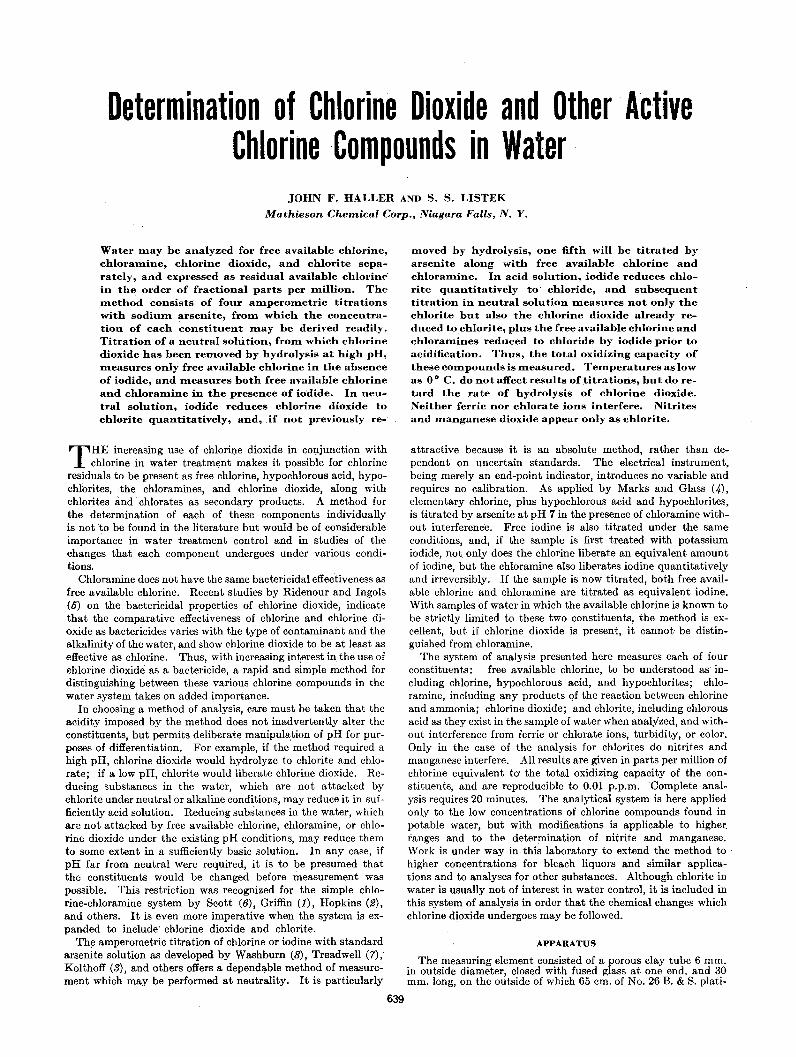
Determination of Chlorine Dioxide and Other ActiveChlorine Compounds in Water
JOHN F. HALLER AND S. S. LISTEK
Mathieson Chemical Corp., Niagara Falls, N. Y.
Water may be analyzed for free available chlorine,chloramine, chlorine dioxide, and chlorite separately, and expressed as residual available chlorin~
in the order of fractional parts per million. The.method consists of four amperometric titrationswith sodium arsenite, from which the concentration of each constituent may be derived readily.Titration of a neutral solution, from which chlorinedioxide has been removed by hydrolysis at high pH,measures only free available chlorine in the absenceof iodide, and measures both free available chlorineand chloramine in the presence of iodide. In neutral solution, iodide reduces chlorine dioxide tochlorite quantitatively, and, jf not previously re-
THE increasing use of chlorine dioxide in conjunction withchlorine in water treatmE)nt makes it possible for chlorine
residuals to be present as free chlorine, hypochlorous acid, hypochlorites,the chloramines, and chlorine dioxide, along withchlorites and' chlorates as secondary products. A method forthe determination of each of these components individuallyis not to be found in the literature but would be of considerableimportance in water treatment control and in studies of thechanges that each component undergoes under various conditions.
Chloramine does not have the same bactericidal effectiveness asfree available chlorine. Recent studies by Ridenour and Ingols(5) on the bactericidal properties of chlorine dioxide, indicatethat the comparative effe~tiveness of chlorine and chlorine dioxide as bactericides varies with the type of contaminant and thealkalinity of the water, and show chlorine dioxide to be at least aseffective as chlorine. Thus, with increasing int.erest in the use ofchlorine dioxide as a bactericide, a rapid and simple method fordistinguishing between these various chlorine compounds in thewater system takes on added importance.
In choosing a method of analysis, care must be taken that theacidity imposed by the method does not inadvertently alter theconstituents, but permits deliberate manipulation of pH for purposes of differentiation. For example, if the method required ahigh pH, chlorine dioxide would hydrolyze to chlorite and chlorate; if a low pH, chlorite would liberate chlorine dioxide. Reducing substances in the water, which are not attacked bychlorite under neutral or alkaline conditions, may reduce it in sufficiently acid solution. Reducing substances in the water, whichare not attacked by free available chlorine, chloramine, or chlorine dioxide under the existing pH conditions, may reduce themto some extent in a sufficiently basic solution. In any case, ifpH far from neutral were required, it is to be presumed thatthe constituents would be changed before measurement waspossible. This restriction was recognized for the simple chlorine-chloramine system by Scott (6), Griffin (1), Hopkins (2),and others. It is even more imperative when the system is expanded to include' chlorine dioxide and chlorite.
Th!J amperometric titration of chlorine or iodine with standardarsenite solution as developed by Washburn (8), Treadwell (7),Kolthoff (,''J); and others offers a dependable method of measurement which may be performed at neutrality. It is particularly
639
moved by hydrolysis, one fifth will be titrated byarsenite along' with free available chlorine andchloramine. In acid solution, iodide reduces chlorite quantitatively to' chloride, and subsequenttitration in neutral solution.measures not only thechlorite but also the chlorine dioxide already reduced tochlorite, plus the free available chlorine andchloramines reduced to chloride by iodide prior toacidification. Thus, the total oxidizing capacity ofthese compounds is measured. Temperatures as lowas 0 0 C. do not affect results of titratioIis, but do retard the rate of hydrolysis of chlorine dioxide.Neither ferric nOr chlorate ions interfere. Nitritesand manganese dioxide appear only as chlorite.
attractive because it is an absolute method, rather than dependent on uncertain standards. The electrical instrument,being merely an end-point indicator, introduces no variable andrequires no calibration. As applied by Marks and Glass (4),elementary chlorine, plus hypochlorous acid and hypochlorites,is titrated by arsenite at pH 7 in the presence of chloramine without interference. Free iodine is also titrated under the sameconditions, and, if the. sample is first treated with potassiumiodide, not only does the chlorine liberate an equivalent amountof iodine, but the chloramine also liberates iodine quantitativelyand irreversibly. If the sample is now titrated, both free available chlorine and chloramine are titrated as equivalent iodine.With samples of water in which the available chlorine is known tobe strictly limited to these two constituents, the method is excellent, but if chlorine dioxide is present, it cannot· be distinguished from chloramine.
The system of analysis presented here measures each of fourconstituents: free available chlorine, to be understood as including chlorine, hypochlorous acid, and hypochlorites; chloramine, including any products of the reaction between chlorineand ammonia; chlorine dioxide; and chlorite, including chlorousacid as they exist in the sample of water when analyzed, and without interference from ferric or chlorate ions, turbidity, or color.Only in the case of the analysis for chlorites do nitrites andmanganese interfere. All results are given in parts per million ofchlorine equivalent to' the total oxidizing capacity of the constituents, and are reproducible to 0.01 p.p.m. 'Complete analysis requires 20 minutes. The analytical system is here appliedonly to the low concentrations of chlorine compounds found inpotable water, but with modifications is applicable to higher.ranges and to the determination of nitrite and manganese.Work is under way in. this laboratory to extend the method tohigher concentrations for bleach liquors and similar applications and to analyses for other substances. Although chlorite inwater is usually not of interest in water control, it is included inthis system of analysis in order that the chemical changes whichchlorine dioxide undergoes may be followed.
APPARATUS
The measuring element consisted of a porous clay tube 6 mm.in outside diameter, closed with fused glass at one end, and 30mm. long, on the outside of which 65 cm. of No. 26 B. & S. plati-
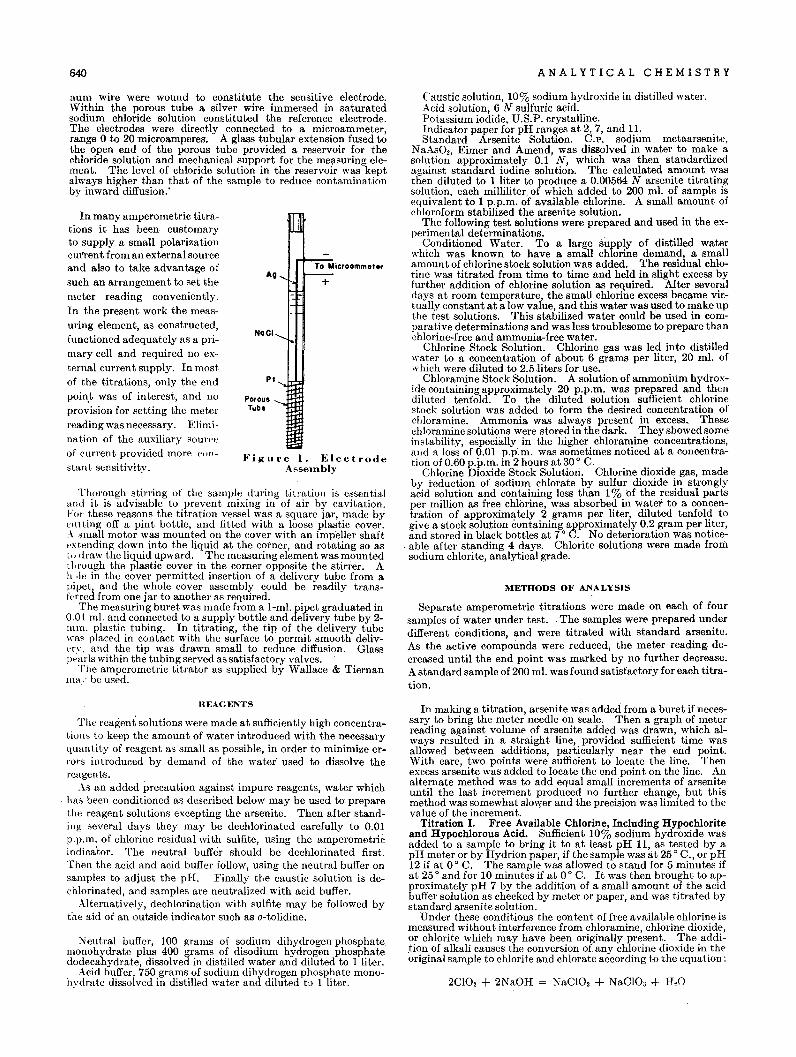
640 ANALYTICAL CHEMISTRY
num wire were wound to constitute the sensitive electrode.Within the porous tube a silver wire immersed in saturatedsodium chloride solution constituted the reference electrode.The electrodes were directly connected to a microammeter,range 0 to 20 microamperes~ A glass tubular extension fused tothe open end of the porous tube provided a reservoir for thechloride solution and mechanical support for the measuring element. The level of chloride solution in the reservoir was keptalways higher than that of the sample to reduce contaminationby inward diffusion."
Thorough stirring of the sample during titration is essentialallli it is advisable to prevent mixing in of air by cavitation.For these reasons the titration vessel was a square jar, made bycutting off a pint bottle, and fitted with a loose plastic cover..\ small motor was mounted on the cover with an impeller shaftl·xt.ending down into the liquid at the cotner, and rotating so asto (Iraw the liquid upward. The measuring element was mountedchrough the plastic cover in the corner opposite the stirrer. Ah ,Ie in the cover permitted insertion of a delivery tube from apipet, and the whole cover assembly could be readily transfNred from one jar to another as required.
The measuring buret was made from a 1-m!. pipet graduated in0.01 m!. and connected to a supply bottle and delivery tube by 2mm. plastic tubing. In titrating, the tip of the delivery tubewas placed in contact with the surface to permit smooth deliv(·r.". and the tip was drawn small to reduce diffusion. Glasspearls within the tubing served as satisfactory valves.
The amperometric titrator as supplied by Wallace & TiernanIll".: be used.
Figure 1. ElectrodeAsseInhly
METHODS OF ANALYSIS
Separate amperometric titrations were made on each of foursamples of water under test. .The samples were prepared underdifferent conditions, and were titrated with standard arsenite.As the active compounds were reduced, the meter reading decreased until the .end point was marked by no further decrease.A standard sample of 200 m!. was found satisfactory for each titration.
Caustic solution, 10% sodium hydroxide in distilled water.Acid solution, 6 N sulfuric acid.Potassium iodide, U.S.P. crystalline.Indicator paper for pH ranges at 2,7, and 11.Standard Arsenite Solution. C.P. sodium metaarsenite,
NaAs02, Eimer and Amend, was dissolved in water to make asolution approximately 0.1 N, which was then standardizedagainst standard iodine solution. The calculated amount wasthen diluted to 1 liter to produce a 0.00564 N arsenite titratingsolution, each milliliter. of which added to 200 m!. of sample isequivalent to 1 p.p.m. of available chlorine. A small amount ofchloroform stabilized the arsenite solution.
The following test solutions were prepared and used in the experimental determinations.
Conditioned Water. To a large supply of distilled waterwhich was known to have a small chlorine demand, a smallamount of chlorine stock solution was added. The residual chlorine was titrated from time to time and held in slight excess byfurther addition of chlorine solution as required. After severaldays at room temperature, the small chlorine excess became virtually constant at a low value, and this water was used to make upthe test solutions. This stabilized water could be used in comparative determinations and was less troublesome to prepare thanchlorine-free and ammonia-free water.
Chlorine Stock Solution. Chlorine gas was led into distilledwater to a concentration of about 6 grams per liter, 20 m!. ofwhich were diluted to 2.5 liters for use.
Chloramine Stock Solution. A solution of ammonium hydroxide containing approximately 20 p.p.m. was prepared and thendiluted tenfold. To the diluted solution sufficient chlorinestock solution was added to form the desired concentration ofchloramine. Ammonia was always present in excess. Thesechloramine solutions were stored in the dark. They showed someinstability, especially in the higher chloramine concentrations,and a loss of 0.01 p.p.m. was sometimes noticed at a concentration of 0.60 p.p.m. in 2 hours at 30 0 C.
Chlorine Dioxide Stock Solution. Chlorine dioxide gas, madeby i'eduction of sodium chlorate by sulfur dioxide in stronglyacid solution and containing less than 1% of the residual partsper million as free chlorine, was absorbed in water to a concentration of approximately 2 grams per liter, diluted tenfold togive a stock solu.tion containing approximately 0.2 gram per liter,and stored in black bottles at 7 0 C. No deterioration was notice-
. able after standing 4 days. Chlorite solutions were made fromsodium chlorite, analytical grade.
+To Microommel..
Ag
PI
NoCI
PorousTube
In many amperometric titrations it has been customaryto supply a small polarizationcurrent from an external sourceand also to take advantage ofsuch an arrangement to set themeter reading conveniently.In the present work the measuring element, as constructed,functioned adequately as a primary cell and required no external current supply. In mostof the titrations, only the endpoin.t was of interest, and noprovision for setting the meterreading was necessary. Elimination of the auxiliary sour,'"of current provided more ('011
stall t sensitivity.
REAGENTS
The reagent solutions were made at sufficiently high concentratiolls to keep the amount of water introduced with the necessaryquantity of reagent as small as possible, in order to minimize errors introduced by demand of the water used to dissolve thereagents.
As an added precaution against impure reagents, water whichhas been conditioned as described below may be used to preparethe reagent solutions excepting the arsenite. Then after standing several days they may be dechlorinated carefully to 0.01p.p.m. of chlorine residual with sulfite, using the amperometricindicator. The neutral buffer should be dechlorinated first.Then the acid and acid buffer follow, using the neutral buffer onsamples to adjust the pH. Finally the caustic solution is dechlorinated, and samples are neutralized with acid buffer.
Alternatively, dechlorination with sulfite may be followed bythe aid of an outside indicator such as o-tolidine.
~eutral buffer, 100 grams of sodium dihydrogen phosphatemonohydrate plus 400 grams of disodium hydrogen phosphatedodecahydrate, dissolved in distilled water and diluted to 1 liter.
Acid buffer, 750 grams of sodium dihydrogen phosphate monohydrate dissolved in distilled water and diluted to 1 liter.
In making a titration, arsenite was added from a buret if necessary to bring the meter needle on scale. Then a graph of meterreading against volume of arsenite added was drawn, which always resulted in a straight line, provided sufficient time wasallowed between additions, particularly near the end point.With care, two points were sufficient to locate the line. Thenexcess arsenite was added to locate the end point on the line. Analternate method was to add equal small increments of arseniteuntil the last increment produced no further change, but thismethod was somewhat slo\\:er and the precision was limited to thevalue of the increment.
Titration I. Free Available Chlorine, Including Hypochloriteand Hypochlorous Acid. Sufficient 10% sodium hydroxide wasadded to a sample to bring it to at least pH 11, as tested by apH meter or by Hydrion paper, if the sample was at 25 0 C., or pH12 if at 0 0 C. The sample was allowed to stand for 5 minutes ifat 25 0 and for 10 minutes if at 0 0 C. It was then brought to approximately pH 7 by the addition of a small amount of the acidbuffer solution as checked by meter or paper, and was titrated bystandard arsenite solution.
Under these conditions the content of free available chlorine ismeasured without interference from chloramine, chlorine dioxide,or chlorite which may have been originally present. The addition of alkali causes the conversion of any chlorine dioxide in theoriginal sample to chlorite and chlorate according to the equation:
2CI02 + 2NaOH = NaCI02 + NaCI03 + H 20
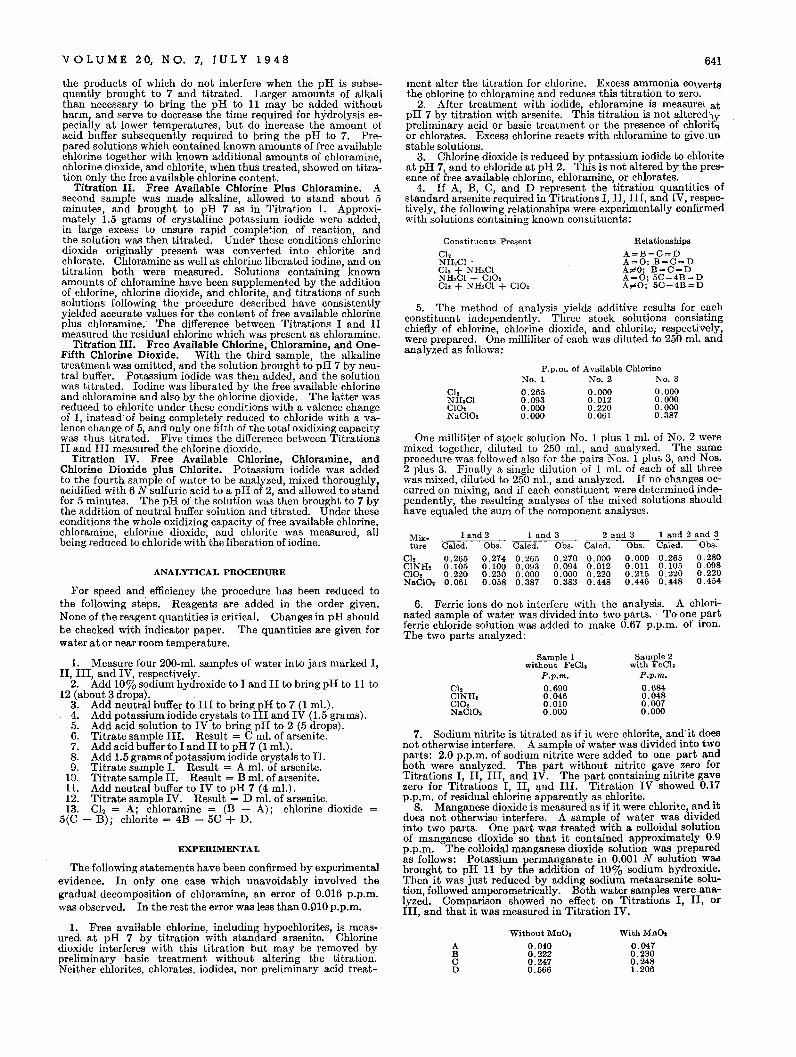
VOL U M E 20, N O. 7, J U L Y 1 9 4 8 641
6. Ferric ions do not interfere with the analysis. A chlorinated sample of water was divided into two parts. To one 'partferric chloride solution was added to make 0.67 p.p.m. of iron.The two parts analyzed:
Mix- 1and2 1 and 3 2 and 3 1 and 2 and 3ture Caled. Obs. Caled. Obs. Caled. Obs. Caled. Obs.
Ch 0.265 0.274 0.265 0.270 0.000 0.000 0.265 0.280CINH, 0.105 0.100 0.093 0.094 0.012 O.Oll 0.105 0.098CIO, 0.220 0.230 0.000 0.000 0.220 0.215 0.220 0.220NaClO, 0.061 0.058 0.387 0.383 0.448 0.446 0.448 0.454
5. The method of analysis yields additive results for eachconstituent independently. Three stock solutions consistingchiefly of chlorine, chlorine dioxide, and chlorite; respectively,were prepared. One milliliter of each was diluted to 250 ml. andanalyzed as follows:
P.p.m. of Available ChlorineNo.1 No.2 No.3
0.265 0.000 0.0000.093 0.012 0.0000.000 0.220 0.0000.000 0.061 0.387
Sample 2with FeCh
P.p.m.
0.6840.0480.0070.000
Relationships
A=B=C=D.'1.=0; B=C=D.'1.,.<0; B=C=D.'1.=0; 5C-4B=D.'1.,.<0; 5C-4B=D
With MnO.
0.0470.2300.2481.206
Sample 1without FeCla
P.p.m.
0.6900.0460.0100.000
Without MnO.
0.0400.2220.2470.566
ABCD
C12CINa.CIO,NaCIO,
Constit,uents Present
C12 .NH,Cl'cr, + NH,ClNH,Cl + CIO,Ch + NH,Cl + CIO,
ment alter the titration for chlorine. Excess ammonia cO\Yertsthe chlorine to chloramine and reduces this titration to zero.
2. After treatment with iodide, chloramine is measuret atpH 7 by titration with arsenite. This titration is not altered'Wpreliminary acid or basic treatment or the presence of chlorit'lor chlorates. Excess chlorine reacts with chloramine to give.unstable solutions.
3. Chlorine dioxide is reduced by potassium iodide to chloriteat pH 7, and to chloride at pH 2. This is not altered by the presence of free available chlorine, chloramine, or chlorates.
4. If A, B,C, and D represent the titration quantities ofstandard arsenite required in Titrations I, II, III, and IV, respectively, the following relationships were experimentally confirmedwith solutions containing known constituents:
One milliliter of stock solution No.1 plus 1 ml. of No.2 weremixed together, diluted to 250 ml., and analyzed. The sameprocedure was followed also for the pairs Nos. 1 plus 3, and Nos.2 plus 3. Finally a single dilution of 1 ml. of each of all threewas mixed, diluted to 250 mI., and analyzed. If no changes occurred on mixing, and if each constituent were determined independently, the resulting analyses of the mixed solutions shouldhave equaled the sum of the component analyses.
7. Sodium nitrite is titrated as if it were chlorite, and'it doesnot otherwise interfere. A sample of water was divided into twoparts: 2.0 p.p.m. of sodium nitrite were added to one part andboth were analyzed. The part without nitrite gave zero forTitrations I, II, III, and IV. The part containing nitrite gavezero for Titrations I, II, ~nd III. Titration IV showed 0.17p.p.m. of residual chlorine apparently as chlorite.
8. Manganese dioxide is measured as if it were chlorite, and itdoes not otherwise interfere. A sample of water was dividedinto two parts. One part was treated with a colloidal solutionof manganese dioxide so that it contained approximately 0.9p.p.m. The colloidal manganese dioxide solution was preparedas follows: Potassium permanganate in 0.001 N solution wa,abrought to pH 11 by the addition of 10% sodium hydroxide.Then it was just reduced by adding sodium metaarsenite solu~tion, followed amperometrically. Both water samples were analyzed. Comparison showed no effect on Titrations I, II, orIII, and that it was measured in Titration IV.
ANALYTICAL PROCEDURE
For speed and efficiency the procedure has been reduced tothe following steps. Reagents are added in the order given.None of the reagent quantities is critical. Changes in pH shouldbe checked with indicator paper. The quantities are given forwater at or near room temperature.
1. Measure four 200-ml. samples of water into jars marked I,II, III, and IV, respectively.
2. Add 10% sodium hydroxide to I and II to bring pH to 11 to12 (about 3 drops).
3. Add neutral buffer to III to bring pH to 7 (1 mI.).4. Add potassium iodide crystals to III and IV (1.5 grams).5. Add acid solution to IV to bring pH to 2 (5 drops).6. Titrate sample III. Result = C ml. of arsenite.7. Add acid buffer to I and II to pH 7 (1 mI.).8. Add 1.5 grams of potassium iodide crystals to II.9. Titrate sample 1. Result = A ml. of arsenite.
10. Titrate sample II. Result = B ml. of arsenite.11. Add neutral buffer to IV to pH 7 (4 mI.).12. Titrate sample IV. Result = D ml. of arsenite.13. Ch = Ai chloramine = (B - A) i chlorine dioxide
5(C - B); chlorite = 4B - 5C + D.
the products of which do not interfere when the pH is subsequently brought to 7 and titrated. Larger amounts of alkalithan necessary to bring the pH to 11 may be added withoutharm, and serve to decrease the time required for hydrolysis especially at lower temperatures, but do increase the amount ofacid buffer subsequently required to bring the pH to 7. Prepared solutions which contained known amounts of free availablechlorine together with known additional amounts of chloramine,chlorine dioxide, and chlorite, when thus treated, showed on titration only the free available chlorine content.
Titration II. Free Available Chlorine Plus Chloramine. Asecond sample was made alkaline, allowed to stand about 5minutes, and brought to pH 7 as in Titration I. Approximately 1.5 grams of crystalline potassium iodide were added,in large excess to ensure rapid completion of reaction, andthe solution was then titrated. Under these conditions chlorinedioxide .originally present was converted into chlorite andchlorate. Chloramine as well as chlorine liberated iodine, and ontitration both were measured. Solutions containing knownamounts of chloramine have been supplemented by the additionof chlorine, chlorine dioxide, and chlorite, and titrations of suchsolutions following the procedure described have consistentlyyielded accurate values for the content of free available chlorineplus chloramine. The difference between Titrations I and IImeasured the residual chlorine which was present as chloramine.
Titration III. Free Available Chlorine, Chloramine, and OneFifth Chlorine Dioxide. With the third sample, the alkalinetreatment was omitted, and the solution brought to pH 7 by neutral buffer. Potassium iodide was then added, and the solutionwas titrated. Iodine was liberated by the free available chlorineand chloramine and also by the chlorine dioxide. The latter was.reduced to chlorite under these conditions with a valence changeof 1, instead'of being completely reduced to chloride with a valence change of 5, and only one fifth of the total oxidizing capacitywas thus titrated. Five times the difference between TitrationsII and III measured the chlorine dioxide.
Titration IV. Free Available Chlorine, Chloramine, andChlorine Dioxide plus Chlorite. Potassium iodide was addedto the fourth sample of water to be analyzed, mixed thoroughly,acidified with 6 N sulfuric acid to a pH of 2, and allowed to standfor 5 minutes. The pH of the solution was then brought to 7 bythe addition of neutral buffer solution and titrated. Under theseconditions the whole oxidizing capacity of free available chlorine,chloramine, chlorine dioxide, and chlorite was measured, allbeing reduced to chloride with the liberation of iodine.
EXPERIMENTAL
The following statements have been confirmed by experimentalevidence. In only one case which unavoidably involved thegradual decomposition of chloramine, an error of 0.016 p.p.m.was observed. In the rest the error was less than 0.010 p.p.m.
1. Free available chlorine, including hypochlorites, is measured at pH 7 by titration with standard arsenite. Chlorinedioxide interferes with this titration but may be removed bypreliminary basic treatment without altering the titration.Neither chlorites, chlorates, iodides, nor preliminary acid treat-
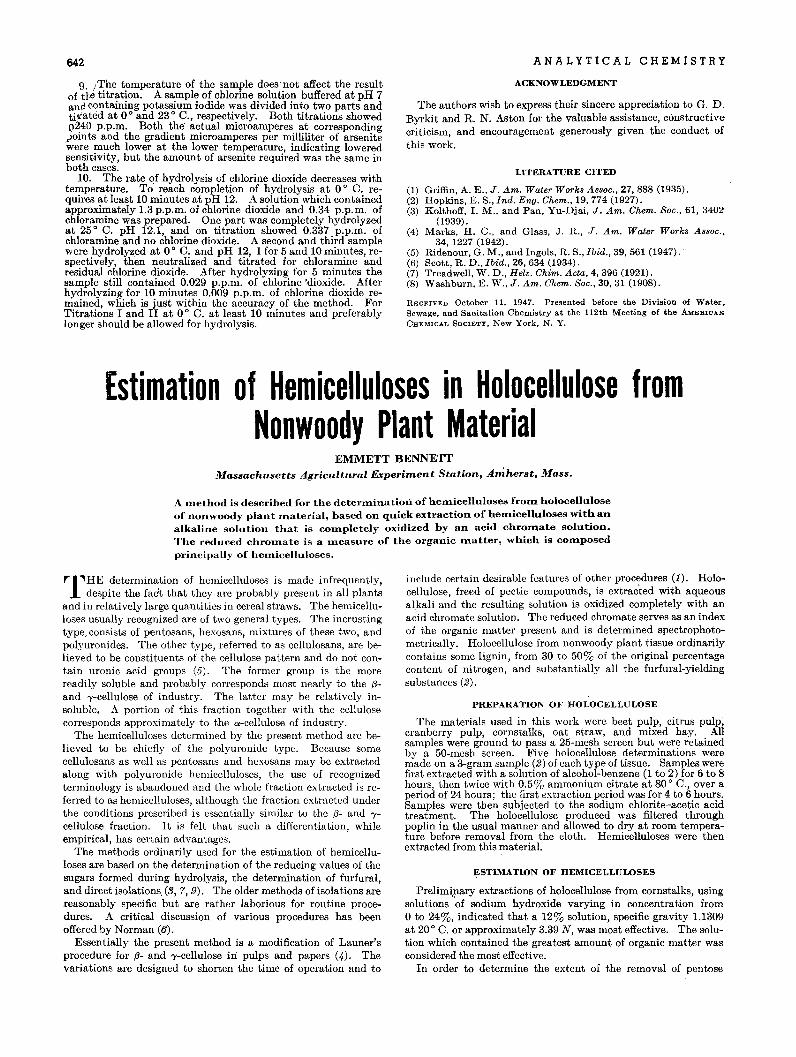
642
9. iThe temperature of the sample does'not affect the resultof tltJ titration. A sample of chlorine solution buffered at pH 7ana containing potassium iodide was divided into two parts andtijfated at 0 0 and 23 0 C., respectively. Both titrations showed0240 p.p.m. Both the actual microamperes at correspondingpoints and the gradient microamperes per milliliter of arsenitewere much lower at the lower temperature, indicating loweredsensitivity, but the amount of arsenite required was the same inboth cases.
10. The rate of hydrolysis of chlorine dioxide decreases withtemperature. To reach completion of hydrolysis at 0 0 C. requires at least 10 minutes at pH 12. A solution which containedapproximately 1.3 p.p.m. of chlorine dioxide and 0.34 p.p.m. ofchloramine was prepared. One part was completely hydrolyzedat 25 0 C. pH 12.1, and on titration showed 0.337 p.p.m. ofchloramine and no chlorine dioxide. A second and third samplewere hydrolyzed at 0 0 C. and pH 12, 1 for 5 and 10 minutes, respectively, then neutralized and titrated for chloramine andresidual chlorine dioxide. After hydrolyzing for 5 minutes thesample still contained 0.029 p.p.m. of chlorine 'dioxide. Afterhydrolyzing for 10 minutes 0.009 p.p.m. of chlorine dioxide remained, which is just within the accuracy of the method. ForTitrations I and II at 0 0 C. at least 10 minutes and preferablylonger should be allowed for hydrolysis.
ANALYTICAL CHEMISTRY
ACKNOWLEDGMENT
The authors wish to express their sincere appreciation to G. D.Byrkit and R. N. Aston for the valuable assistance, constructivecriticism, and encouragement generously given the conduct ofthis work.
LITERATURE CITED
(1) Griffin, A. E., J. Am. Water Works Assoc., 27, 888 (1935).(2) Hopkins, E. S., Ind. Eng. Chem., 19, 774 (1927).(3) Kolthoff, I. M., and Pan, Yu-Djai, J. Am. Chern. Soc., 61, 3402
(1939).(4) Marks, H. C., and Glass, J. R., J. Am. Water Works Assoc.,
34, 1227 (1942).(5) Ridenour, G. M., and Ingols, R. S., Ibid., 39, 561 (1947).(6) Scott, R. D.,Ibid., 26, 634 (1934).(7) Treadwell, W. D., Helv. Chim. Acta, 4, 396 (1921).(8) Washburn, E. W., J. Am. Chem. Soc., 30, 31 (1908).
RECEIVED October 11, 1947. Presented before the Division of Water.Sewage, and Sanitation Chemistry at the 112th Meeting of the AMERICANCHEMICAL SOCIETY, New York. N. Y.
Estimation of Hemicelluloses in Holocellulose fromNonwoody Plant Material
EMME'IT BENNE'IT
Massachusetts Agricultural Experiment Station, Amherst, Mass.
A method is described for the determination of hemicelluloses from holocelluloseof nonwoody plant material, based on quick extraction of hemicelluloses with analkaline solution that is completely oxidized by an acid chromate solution.The reduced chromate is a measure of the organic matter, which is composedprincipally of hemicelluloses.
T HE determination of hemicelluloses is made infrequently,despite the fact that they are probably present in all plants
and in relatively large quantities in cereal straws. The hemicelluloses usually recognized are of two general types. The incrustingtype. consists of pentosans, hexosans, mixtures of these two, andpolyuronides. The other type, referred to as cellulosans, are believed to be constituents of the cellulose pattern and do not contain uronic acid groups (5). The former group is the morereadily soluble and probably corresponds most nearly to the fJand 'Y-cellulose of industry. The latter may be relatively insoluble. A portion of this fraction together with the cellulosecorresponds approximately to the a-cellulose of industry.
The hemicelluloses determined by the present method are believed to be chiefly of the polyuronide type. Because somecellulosans as well as pentosans and hexosans may be extractedalong with polyuronide hemicelluloses, the use of recognizedterminology is abandoned and the whole fraction extracted is referred to as hemicelluloses, although the fraction extracted underthe conditions prescribed is essentially similar to the fJ- and 1'
cellulose fraction. It is felt that such a differentiation, whileempirical, has certain advantages.
The methods ordinarily used for the estimation of hemicelluloses are based on the determination of the reducing values of thesugars formed during hydrolysis, the determination of furfural,and direct isolations, (3,7,9). The older methods of isolations arereasonably specific but are rather laborious for routine procedures. A critical discussion of various procedures has beenoffered by Norman (6).
Essentially the present method is a modification of Launer'sprocedure for fJ- and 'Y-cellulose in pulps and papers (.n. Thevariations are designed to shorten the time of operation and to
include certain desirable features of other procedures (1). Holocellulose, freed of pectic compounds, is extracted with aqueousal,kali and the resulting solution is oxidized completely with anacid chromate solution. The reduced chromate serves as an indexof the organic matter present and is determined spectrophotometrically. Holocellulose from nonwoody plant tissue ordinarilycontains some lignin, from 30 to 50% of the original percentagecontent of nitrogen, and substantially all the furfural-yieldingsubstances (2).
PREPARATION OF HOLOCELLULOSE
The materials used in this work were beet pulp, citrus pulp;cranberry pulp, cornstalks, oat straw, and mixed hay. Allsamples were ground to pass a 25-mesh screen but were retainedby a 50-mesh screen. Five holocellulose determinations weremade on a 3-gram sample (2) of each type of tissue. Samples werefirst extracted with a solution of alcohol-benzene (1 to 2) for 6 to 8hours, then twice with 0.5% ammonium citrate at 80 0 C., over aperiod of 24 hours; the first extraction period was for 4 to 6 hours.Samples were then subjected to the sodium chlorite-acetic acidtreatment. The holocellulose produced was filtered throughpoplin in the usual manner and allowed to dry at room temperature before removal from the cloth. Hemicelluloses were thenextracted from this material.
ESTIMATION OF HEMICELLULOSES
Prclim~p.aryextractions of holocellulose from cornstalks, usingsolutions of sodium hydroxide varying in concentration fromo to 24%, indicated that a 12% solution, specific gravity 1.1309at 20 0 C. or approximately 3.39 N, was most effective. The solution which contained the greatest amount of organic matter wasconsidered the most effective.
In order to determine the extent of the removal of pentose
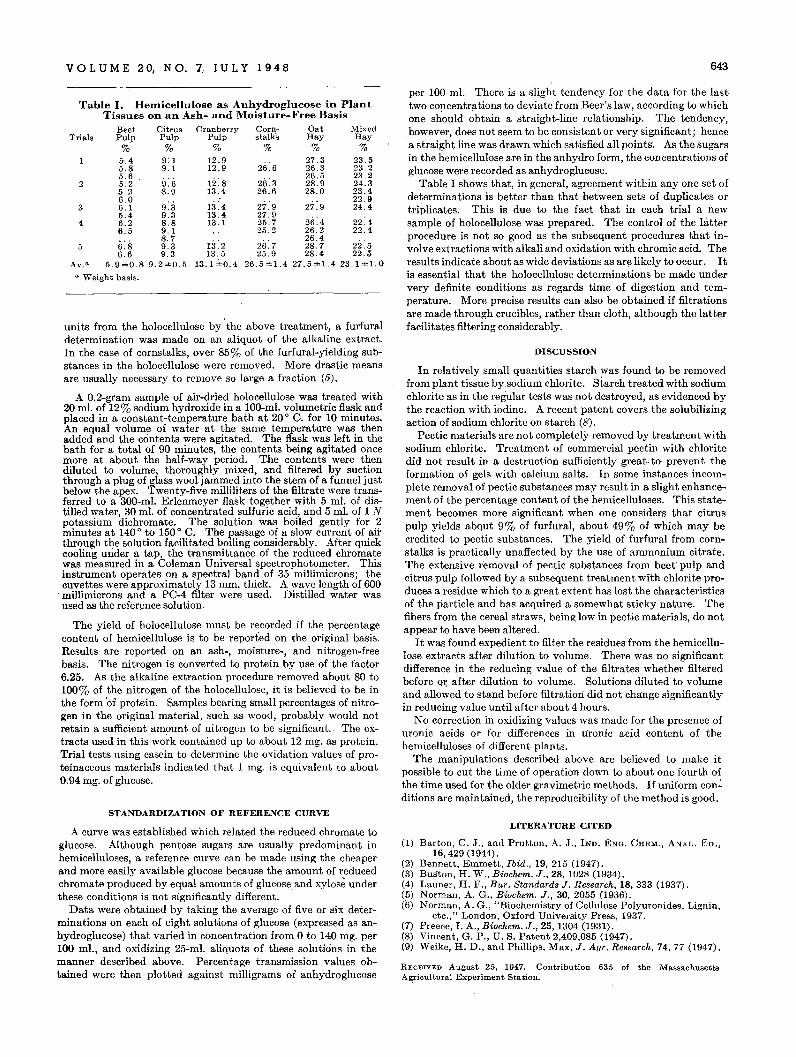
VOL U M E 20, NO.7, JU L Y 1948 643
a Weight basis.
per 100 ml. There is a slight tendency for the data for the lasttwo concentrations to deviate from Beer's law, according to whichotie should obtain a straight-line relationship. The tendency,however, does not seem to be consistent or very significant; hencea straight line was drawn which satisfied all points'. As the sugarsin the hemicellulose are in the anhydro form, the concentrations ofglucose were recorded as anhydroglucose.
Table I shows that, in general, agreement within anyone set ofdeterminations is better than that between sets of duplicates ortriplicates. This is due to the fact that in each trial a newsample of holocellulose was prepared. The control of the latterprocedure is not so good as the subsequent procedures that involve extractions with alkali and oxidation with chromic acid. Theresults indicate about as wide deviations as are likely to occur. Itis essential that the holocellulose determinations be made undervery definite conditions as regards time of digestion and temperature. More precise results can also be obtained if filtrationsare made through crucibles, rather than cloth, although the latterfacilitates filtering considerably.
DISCUSSION
In relatively small quantities starch was found to be removedfrom plant tissue by sodium chlorite. Starch treated with sodiumchlorite as in the regular tests was not destroyed, as evidenced bythe reaction with iodine. A recent patent covers the solubilizingaction of sodium chlorite on starch (8).
Pectic materials are not completely removed by treatment withsodium chlorite. Treatment of commercial pectin with chloritedid not result in a destruction sufficiently great-to prevent theformation of gels with calcium salts. In some instances incomplete removal of pectic substances may result in a slight enhancement ofthe percentage content of the hemicelluloses. This statement becomes more significant when one considers that citruspulp yields abqut 9% of furfural, about 49% of which may becredited to pectic substances. The yield of furfural from cornstalks is practically unaffected by the use of ammonium citrate.The extensive removal of pectic substances from beet pulp andcitrus pulp followed by a subsequent treatment with chlorite produces a residue which to a great extent has lost the characteristicsof the particle and has acquired a somewhat sticky nature. Thefibers from the cereal straws, being low in pectic materials, do notappear to have been altered.
It was found expedient to filter the residues from the hemicellulose extracts after dilution to volume. There was no significantdifference in the reducing value of the filtrates whether filteredbefore OJ; after dilution to volume. Solutions diluted to volumeand allowed to stand before filtration did not change significantlyin reducing value until after about 4 hour·s.
No correction in oxidizing values was made for the presence ofuronic acids or for differences in tironic acid content of thehemicelluloses of different plants.
The manipulations described above are believed to make itpossible to cut the time of operation down to about one fourth ofthe time used for the older gravimetric methods. If uniform con~
ditions are maintained, the reproducibility of the method is good.
26.426.226.428.7 22.528.4 22.5
27.5=1.423.1=1.0
13: 2 26: 713.5 25.9
13.1';'0 4 26.5 =1.4
2
4
3
5
Table I. Hemicellulose as Anhydroglucose in PlantTissues on an Ash- and Moisture-Free Basis
Beet Citrus Cranberry Corn- Oat MixedPulp Pulp Pulp stl'lks Hay Hay
% % % % % %5'.4 9: 1 12.9 27. 3 23. 55.8 9.1 12.9 26.6 26.3 23.25.6 26.5 23.25.2 9.6 12.8 26.3 28.9 24.35.2 8.9 13.4 26.6 28.0 23.4
U 9.3 13:4 27:9 27.9 ~U5.4 9.3 13.4 27.96.2 8.8 13.1 25.76.5 9.1 25.2
8.76.8 9.36.6 9.3
Av.a 5.9=0.89.2=0.5
Trials
units from the holocellulose by 'the above treatment, a furfuraldetermination was made on an aliquot of the alkaline extract.In the case of cornstalks, over 85% of the furfural-yielding substances in the holocellulose were removed. More drastic meansare usually necessary to remove so large a fraction (5).
A 0.2-gram sample of air-dried holocellulose was treated with20 ml. of 12% sodium hydroxide in a 10D-mL volumetric flask andplaced in a constant-temperature bath at 20 0 C. for 10 minutes.An equal volume of water at the same temperature was thenadded and the contents were agitated. The flask was left in thebath for a total of 90 minutes, the contents being agitated oncemore at about the half-way period. T.he contents were thendiluted to volume, thoroughly mixed, .and filtered by suctionthrough a plug of glass wool jammed into the stem of a funnel justbelow the apex. Twenty-five milliliters of the filtrate were transferred to a 300-mL Erlenmeyer flask together with 5 mL of distilled water, 30 ml. of concentrated sulfuric acid, and 5 ml. of 1 Npotassium dichromate. The solution was boiled gently for 2minutes at 140 0 to 150 0 C. The passage of a slow current of airthrough the solution facilitated boiling considerably. After quickcooling under a tap, the transmittance of the reduced chromatewas measured in a Coleman Universal spectrophotometer. Thisinstrument operates on a spectral band of 35 millimicrons; thecuvettes were approximately 13 mm. thick. A wave length of 600millimicrons and a PC-4 filter were used. Distilled water wasused as the reference solution.
The yield of holocellulose must be recorded if the percentagecontent of hemicellulose is to be reported on the original basis.Results are reported on an ash-, moisture-, and nitrogen-freebasis. The nitrogen is converted to protein by use of the factor6.25. As the alkaline extraction procedure removed about 80 to100% of the nitrogen of the holocellulose, it is believed to be inthe form 'of protein. Samples bearing small percentages of nitrogen in the original material, such as wood, probably would notretain a sufficient amount of nitrogen to be significant. The extracts used in this wo~k contained up to about 12 mg. as protein.Trial tests using casein to determine the oxidation values of proteinaceous materials indicated that 1 mg. is equivalent to about0.94 mg. of glucose.
STANDARDIZATION OF REFERENCE CURVE
A curve was established which related the reduced chromate toglucose. Although pentose sugars are usually predominant inhemicelluloses,a reference curve can be made using the cheaperand more easily available glucose because the amount of reducedchromate produced by equal amounts of glucose and xylos~ underthese conditions is not significantly different.
Data were obtained by taking the average of five or six determinations on each of eight solutions of glucose (expressed as anhydroglucose) that varied in concentration from 0 to 140 mg. per100 mI., and oxidizing 25-mL aliquots of these solutions in themanner described above. Percentage transmission. values obtained were then plotted against milligrams of anhydroglucose
LITERATURE CITED
(1) Barton, C. J., and Prutton. A. J'.. IND. ENG. CHEM .• ANAL. ED.,16.429 (1944).
(2) Bennett. Emmett, Ibid .• 19.215 (1947).(3) Buston, H. W .• Biochem. J .• 28.1028 (1934).(4) Launer. H. F., Bur. Standards J. Research, 18.333 (1937).(5) Norman. A. G.• Biochem. J .• 30, 2055 (1936).(6) Norman. A. G., "Biochemistry of Cellulose Polyuronides. Lignin,
etc.... London. Oxford University Press. 1937.(7) Preece. I. A .• Biochem. J., 25.1304 (1931).(8) Vincent, G. P .• U. S. Patent 2,.409.085 (1947).(9) Weike, H. D., and Phillips, Max. J. Agr. Research, 74. 77 (1947).
RECEIVED August 25. 1947. Contribution 635 of the MassachusettsA~iculturalExperiment Station.
Analysis of Liquid PhosgeneCECIL A. RUSH AND CHARLES E. DANNER, Chemical Division, Technical Command, Army Chemical Center, Md.
A satisfactory and precise method is given for the analysis of high-purity liquidphosgene suitahle for munitions and chemical manufacture. The cold liquid istaken up in a thin glass bulb and released by brealung the bulb in a stopperedflask containing specially treated anhydrous sodium iodide and anhydrousacetone. The released iodine is titrated with thiosulfate and the free acid is determined by titration with sodium hydroxide. Separate samples are brokensimilarly in cold water or aqueous potassium iodide for determination of freechlorine. Nonvolatile residue is determined by evaporation, and ferric chloridein the residue is determined iodometrically. Data are presented to show the precision of the determination, the effect of variations of the iodometric method,and the effect of high acidity on side reactions and accuracy.
N o METHOD appears to have been reported in the literature. for the analysis of liquid phosgene. Methods (1, 2, 3)were developed for the determination of relatively low concentrations of gaseous phosgene rather than for the assay of highpurity liquid phosgene.
Current U. S. Army specifications for phosgene (6) cover twogrades: Grade A, phosgene suitable for use in munitions, andGrade B, phosgene suitable for use in chemical manufacture.Theminimum purity is 98%; acidity calculated as hydrochloricacid, 0.50% maximum; residue on evaporation, 0.50% maximum;free chlorine for Grade A, 1.0% maximum; for Grade B, 0.05%maximum.
It was not possible to obtain a correct assay of the liquid bysampling gas from the cylinder, as the vapor pressures of themain impurities, hydrochloric acid and chlorine, are much higherthan.phosgene.
In the first workable method that was used here (5), the coldliquid sample was placed in a bulb, sealed, weighed, and brokenin a stoppered.flask containing a small excess of 0.1 N sodiumhydroxide. Excess barium chloride was added and the precipitawd carbonate was titrated with 0.1 N hydrochloric acid addedin excess and, back-titrated with 0.1 N sodium hydroxide. Chlorine and hydrochloric acid were determined by volatilizing a liquidsample and allowing it to pass through weighed absorption tubescontaining antimony and Michler's ketone, respectively.
Although the method was useful, it was time-consuming andsometimes gave erratic results when used by different analysts.It was evident that a very careful and painstaking technique wasnecessary.
When large-scale manufacture of phosgene was undertakenduring World War II, the available methods for the determinationof phosgene were again studied. The iodometric methodseemed most promising. The excellent article of Matuszak (2)allowed a better understanding of the side reactions occurringand gave ideas on how to proceed. Development of a satisfactory technique for drying and storage overcame objectionsto the use of sodium iodide, whereupon advantage was taken ofthe high solubility of this salt in acetone (molecularly about 15times that of potassium iodide, 4) to minimize the occurrence ofundesired reactions.
In acetone solution sodium iodide reacts with phosgene torelease iodine:
COC12 + 2NaI~ CO + 12 + 2NaCl
The released iodine is titrated with sodium thiosulfate. Whenwater is present, some hydrolysis of phosgene occurs:
COC12 + H 20~ CO2 + 2HCI
Treatment of the sodium iodide to remove alkali and moistureand the use of great excess in anhydrous acetone led to the
procedure given below for high-purity liquid phosgene. Theprocedure was used by many laboratories throughout this countryduring the war, with highly satisfactory results. Directionsshould be followed rather meticulously, because variations intechnique have usually resulted in the presence of moisture withattendant side reactions, low phosgene results, and high acidity.
APPARATUS
Erlenmeyer flasks, 500-ml. heavy-walled, glass-stoppered.Most flasks require regrinding with 300-mesh Carborundumpowder. Test for leaks by placing 25 ml. of acetone in the flasksand heating to boiling, so that the vapors fill the flask. Greasethe warm stopper with petroleum jelly. Stopper the flask and dipinto ice water with the stopper above the water. A leak can beobserved as a striation or bubbling in the grease.
Erlenmeyer flasks, 750-ml. heavy-walled, tested as above.Sampling apparatus as diagramed in Figure 1. Sampling bulbs.about 12 and 15 mm. in diameter.
REAGENTS
Anhydrous Acetone. Place 2 liters of reagent (A.C.S.) acetonein a brown glass-stoppered bottle. Add 200 grams of 20-meshDrierite (anhydrous calcium sulfate), and allow to stand 24 hourswith occasional shaking during the day. Store in a desiccator ofsuitable size. (A desiccator fitted with a low-form bell jar as acover is satisfactory.)
Neutral Anhydrous Sodium Iodide. Place 500 grams of reagentgrade sodium iodide in a porcelain evaporating dish, add about 20m!. of dilute 1 to 2 hydrochloric acid, and stir thoroughly untilthe sodium iodide is uniformly moist. Place on a hot plate andheat slowly with constant stirring until the crystals are white anddry, but avoid decomposing the sodium iodide by too' vigorousheating. Grind to a uniform powder with a mortar and pestlewhile the reag,ent is still hot, place in a Pyrex salt bottle, and storein an oven at 100 0 to 110 0 C. Test for acidity by adding about 5grams of the reagent to 50 m!. of boiled distilled water. Add 2 to 3drops of bromothymol blue-phenol red indicator. The reagentshould be slightly acid, as indicated by a yellow-green color.One drop of 0.1 N sodium hydroxide should make the solutionbasic and violet in color. The sodium iodide is stable at 100 0 to110 0 C. for at least several months.
Bromothymol Blue-Phenol Red Indicator. A 0.1 % aqueoussolution of the sodium salt of bromothymol blue added to anequal quantity of 0.1 % aqueous solution of the sodium salt ofphenol red.
Neutral, standardized 0.1 Nand 0.05 N sodium thiosulfate.Standardized 0.1 N sodium hydroxide. Potassium iodide,reagent grade, iodate-free. Starch indicator. Solid carbondioxide. Chloroform and carbon tetrachloride, equal parts byvolume for the sample bath.
PHOSGENE DETERMINATION
The cylinder containing the phosgene should be previouslycooled for. at least 2 hours in a bath of ice, salt, and water, thenremoved and shaken. Place the cylinder, on a support, in an inclined position, so that the liquid phase occupies the lower end ofthe cylinder. The vapor in the cylinder should not be vented be-
644
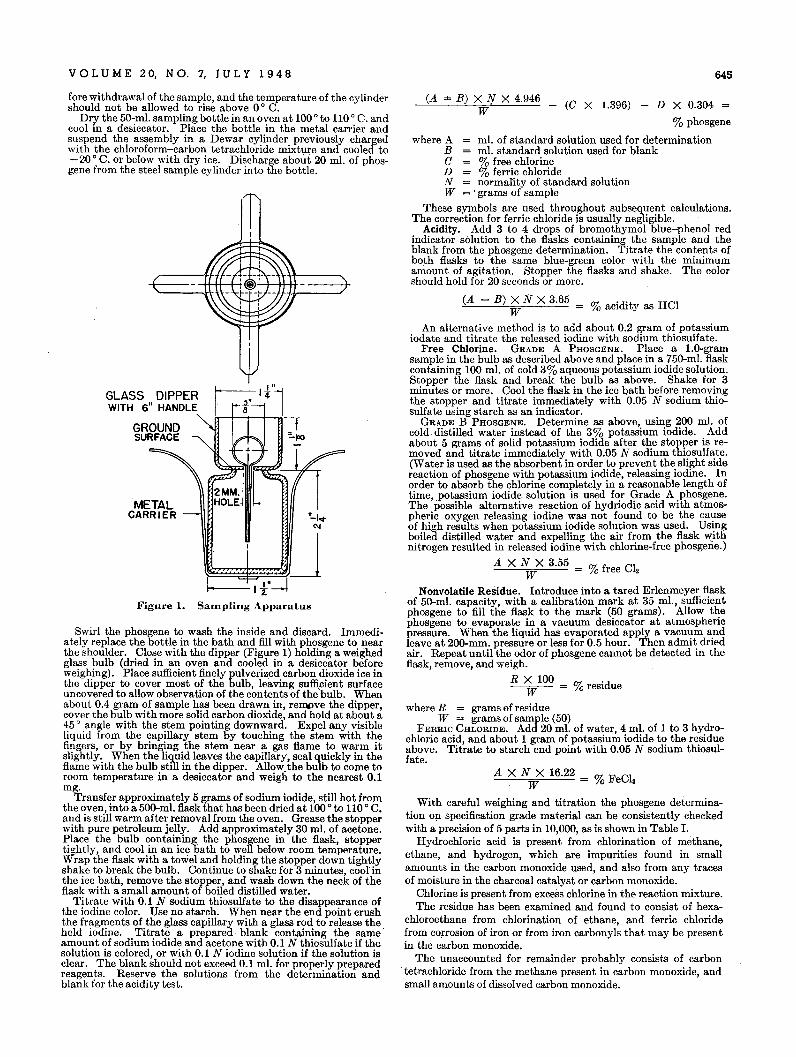
VOL U M E 20, N O. 7, J U L Y 1 948 645
(A ± B) X~Y X 4.946 _ (C X 1.396) _ D X 0.304 =
% phosgene
where A ml. of standard solution used for determinationB ml. standard solution used for blankC % free chlorineD % ferric chlorideN normality of standard solutionW =' grams of sample
These symbols are used throughout subsequent calculations.The correction for ferric chloride is usually negligible.
Acidity. Add 3 to 4 drops of bromothymol blue-phenol redindicator solution to the flasks containing the sample and theblank from the phosgene determination. Titrate the contents ofboth flasks to the same blue-green color with the minimumamount of agitation. Stopper the flasks and shake. The colorshould hold for 20 seconds or more.
A X N X 16.22 _ 01 F ClW - ,0 e 3
With careful weighing and titration the phosgene determination on specification grade material can be consistently checkedwith a precision of 5 parts in 10,000, as is shown in Table I.
Hydrochloric acid is present from chlorination of methane,ethane, and hydrogen, which are impurities found in smallamounts in the carbon monoxide used, and also from any tracesof moisture in the charcoal catalyst or carbon monoxide.
Chlorine is present from excess chlorine in the reaction mixture.The residue has been examined and found to consist of hexa
chloroethane frem chlorination of ethane, and ferric chloridefrom corrosion of iron or from iron carbonyls that may be presentin the carbon monoxide.
The unaccounted for remainder probably consists of carbon.tetrachloride from the methane present in carbon monoxide, andsmall amounts of dissolved carbon monoxide.
% acidity as HCl
% residue
(A - B) X N X 3.65W
An alternative method is to add about 0.2 gram of potassiumiodate and titrate the released iodine with sodium thiosulfate.
Free Chlorine. GRADE A PHOSGENE. Place a l.O-gramsample in the bulb as described above and place in a 750-ml. flaskcontaining 100 ml. of cold 3% aqueous potassium iodide solution.Stopper the flask and break the bulb as above. Shake for 3minutes or more. Cool the flask in the ice bath before removingthe stopper and titrate immediately with 0.05 N sodium thiosulfate using starch as an indicator.
GRADE B PHOSGENE. Determine as above, using 200 ml. ofcold distilled water instead of the 3% potassium iodide. Addabout 5 grams of solid potassium iodide after the stopper is removed and titrate immediately with 0.05 N sodium thiosulfate.(Water is used as the absorbent in order to prevent the slight sidereaction of phosgene with potassium iodide, releasing iodine. Inorder to absorb the chlorine completely in a reasonable length oftime, potassium iodide solution is used for Grade A phosgene.The possible alternative reaction of hydriodic acid with atmospheric oxygen releasing iodine was not found to be the ca1;lseof high results when potassium iodide solution was used. Us~ngboiled distilled water and expelling the air from the flask WIthnitrogen resulted in released iodine with chlorine-free phosgene.)
A X N X 3.55 01 f ClW = ,0 ree 2
Nonvolatile Residue. Introduce into a tared Erlenmeyer flaskof 50-ml. capacity, with a calibration mark at 35 ml., sufficientphosgene to fill the flask to the mark C!iO grams). Allow t~ephosgene to evaporate in a vacuum deSiccator at atmosphencpressure. When the liquid has evaporated apply a vacuum andleave at 200-mm. pressure or less for 0.5 hour. Then admit. driedair. Repeat until the odor of phosgene cannot be detected III theflask, remove, and weigh.
R X 100W
where R = grams ef residueW = grams of sample (50)
FERRIC CHLORIDE. Add 20 ml. of water, 4 ml. of 1 to 3 hydrochloric acid, and about 1 gram of potassium iodide to the residueabove. Titrate to starch end point with 0.05 N sodium thiosulfate.
METALCARRIER
~'Ut----I-r-lFigure 1. Salllpling Apparatus
GLASS DIPPERWITH 6" HANDLE
fore withdrawal of the sample, and the temperatw'e of the cylindershould not be allowed to rise above 0 ° C.
Dry the 50-ml. sampling bottle in an oven at 100° to 110 ° C. andcool in a desiccator. Place the bottle in the metal carrier andsuspend the assembly in a Dewar cylinder previously chargedwith the chloroform-carbon tetrachloride mixture and cooled to-20° C. or below with dry ice. Discharge about 20 ml. of phosgene from the steel sample cylinder into the bottle.
Swirl the phosgene to wash the inside and discard. Immediately replace the bottle in the bath and fill with phosgene to neatthe shoulder. Close with the dipper (Figure 1) holding a weighedglass bulb (dried in an oven and cooled in a desiccator beforeweighing). Place sufficient finely pulverized carbon dioxide ice inthe dipper to cover most of the bulb, leaving suffi,cient surfaceuncovered to allow observation of the contents of the bulb. Whenabout 0.4 gram of sample has been drawn in, remove the dipper,cover the bulb with more solid carbon dioxide, and hold at about a45 ° angle with the stem pointing downward. Expel any visibleliquid from the capillary stem by touching the stem with thefingers, or by bringing the stem near a gas flame to warm itslightly. When the liquid leaves the capillary, seal quickly in theflame with the bulb still in the dipper. Allow, the bulb to come toroom temperature in a desiccator and weigh to the nearest 0.1mg.
Transfer approximately 5 grams of sodium iodide, still hot fromthe oven, into a 500-mI. flask that has been dried at 100 0 to 110° C.and is still warm after removal from the oven. Grease the stopperwith pure petroleum jelly. Add approximately 30 ml. of acetone.Place the bulb containing the phosgene in the flask, stoppertightly, and cool in an ice bath to well below room temperature.Wrap the flask with a towel and holding the stopper down tightlyshake to break the bulb. Continue to shake for 3 minutes, coolinthe ice bath, remove the stopper, and 'wash down the neck of theflask with a small amount of boiled distilled water.
Titrate with 0.1 N sodium thiosulfate to the disappearance ofthe iodine color. Use no starch. When near the end point crushthe fragments of the glass capillary with a glass rod to release the.held iodine. Titrate a prepared· blank containing the sameamount of sodium iodide and acetone with 0.1 N thiosulfate if thesolution is colored, or with 0.1 N iodine solution if the solution isclear. The blank should not exceed 0.1 ml. for properly preparedreagents. Reserve the solutions from the determination andblank for the acidity test.
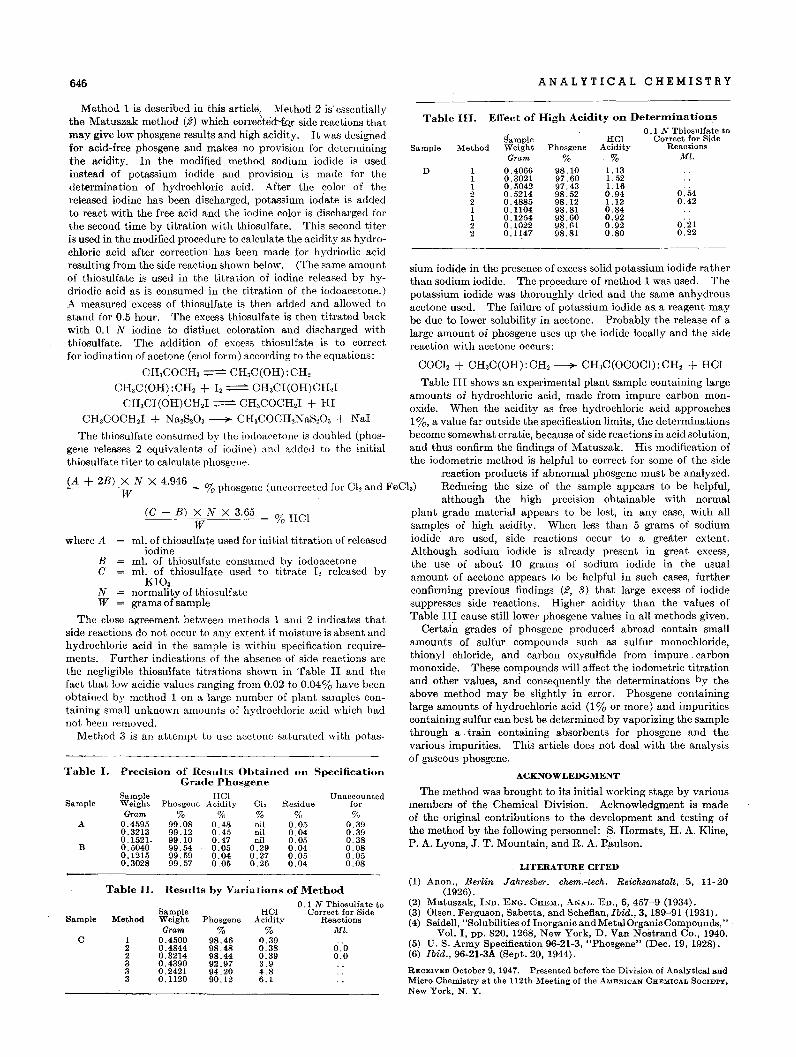
646 ANALYTICAL CHEMISTRY
sium iodide in the presence of excess solid potassium iodide ratherthan sodium iodide. The pr9cedure of method 1 was used. Thepotassium iodide was thoroughly dried and the same anhydrousacetone used. The failure of potassium iodide as a reagent maybe due to lower solubility in acetone. Probably the release of alarge amount of phosgene uses up the iodide locally and the sidereaction with acetone occurs:
0,210,22
0.540.42
HCIAcidity
%1.131.521.160.941.120.840.920.920,80
Phosgene%
98,1097.6097.4398,5298.1298,8198,6098. (\198.81
0.40660.30210.50420,52140.48850.11040.12540.10220.1147
SampleWeightGram
Effect of High Acidity on Detenninations0.1 N Thiosulfate to
Correct for SideReactions
Ml.
111221122
Method
Table III.
D
Sample
Table III shows an experimental plant sample containing largeamounts of hydrochloric acid, made from impure carbon monoxide. When the acidity as free hydrochloric acid approaches1%, a value far outside the specification limits, the determinationsbecome somewhat erratic, because of side reactions in acid solution,and thus confirm the findings of Matuszak. His modification ofthe iodometric method is helpful to correct for some of the side
reaction products if abnormal phosgene must be analyzed.Reducing the size of the sample appears to be helpful,although the high precision obtainable with normal
plant grade material appears to be lost, in any case, with allsamples of high acidity. When less than 5 grams of sodiumiodide are used, side reactions occur to a greater extent.Although sodium iodide is already present in great excess,the use of about 10 grams of sodium iodide in the usualamount of acetone appears to be helpful in such cases, furtherconfirming previous findings (2, 3) that large excess of iodidesuppresses side reactions. Higher acidity than the values ofTable III cause still lower phosgene values in all methods given.
Certai'u grades of phosgene produced abroad contain smallamounts of sulfur compounds such as sulfur monochloride,thionyl chloride, and carbon oxysulfide from impure, carbonmonoxide. These compounds will affect the iodometric titrationand other values, and consequently the determinations by theabove method may be slightly in error. Phosgene containinglarge amounts of hydrochloric acid (1 % or more) and impuritiescontaining sulfur can best be determined by vaporizing the samplethrough a train containing absorbents for phosgene and thevarious impurities. This article does not deal with the analysisof gaseous phosgene.
(C - B) ~TN X 3.65 = % HCI
BC
(A + 2B) X N X 4.946 ,W = % phosgene (uncorrected for Cl, and FeC!,)
Method 1 is described in this article. Method 2 is' essentiallythe Matuszak method (2) which corre6ted-{Q.r side reactions th~tmay give low phosgene results and high acidity. It was designedfor acid-free phosgene and makes no provision for determiningthe acidity. In the modified method sodium iodide is usedinstead of potassium iodide and provision is made for thedetermination of hydrochloric acid. After the color of thereleased iodine has been discharged, potassium iodate is addedto react with the free acid and the iodine color is discharged forthe second time by titration with thiosulfate. This second titeris used in the modified procedure to calculate the acidity as hydrochloric acid after correction has been made for hydriodic acidresulting from the side reaction shown below. (The same amountof thiosulfate is used in the titration of iodine released by hydriodic acid as is consumed in the titration of the iodoacetone.)A measured excess of thiosulfate is then added and allowed tostand for 0.5 hour. The excess thiosulfate is then titrated backwith 0.1 N iodine to distinct coloration and discharged withthiosulfate. The addition of excess thiosulfate is to correctfor iodination of acetone (enol form) according to the equations:
CH.COCH.~ CH.C(OH):CH2
CH.C(OH) :CH2 + Iz~ CH.CI(OH)CHzI
CH.CI(OH)CHzI~ CH.COCH2I + HI
CH.COCH21 + N aZS20. __ CH.COCH2N aSzO. + NaI
The thiosulfate consumed by the iodoaeetone is doubled (phosgene releases 2 equivalents of iodine) ,wei added to the initialthiosulfate titer to calculate phosgene,
where A m\. of thiosulfate used for initial titration of releasediodine
m\. of thiosulfate consumed by iodoacetonem\. of thiosulfate used to titrate I, released by
KIO. -N normality of thiosulfateW grams of sample
The close agreement between methods 1 and 2 indicates thatside reactions do not occur to any extent if moisture is absent andhydrochloric acid in the sample is within specification requirements. Further indications of the absence of side reactions arethe negligible thiosulfate titrations shown in Table II and thefact that low acidic values ranging from 0.02 to 0.04% have beenobtained by method 1 on a large number of plant samples containing small unknown amounts of hydrochloric acid which hadnot been removed.
Method 3 is an attempt to use acetone saturated with potas-
ACKNOWLEDGMENT
The method was brought to its initial working stage by variousmembers of the Chemical Division. Acknowledgment is madeof the original contributions to the development and testing ofthe method by the following personnel: S. Hormats, H. A. Kline,P. A. Lyons, J. T.Mountain, and R. A. Paulson.
LITERATURE CITED
(1) Anon., Berlin Jahresber. chem.-tech. Reichsanstalt, 5, 11- 20(1926) .
(2) Matuszak, IND. ENG. CHEM., ANAL. En., 6, 457-9 (1934).(3) Olsen, Ferguson, Sabetta, and Scheflan, Ibid., 3, 189-91 (1931).(4) Seidell, "Solubilities of Inorganic and Metal Organic Compounds, "
Vol. I, pp. 820, 1268, New York, D. Van Nostrand Co., 1940.(5) U. S. Army Specification 96-21-3, "Phosgene" (Dec. 19, 1928).(6) Ibid., 96-21-3A (Sept. 20, 1944).
RECEIVED October 9, 1947. Presented before the Division of Analytical andMicro Chemistry at the 112th Meeting of the AMERICAN CHEMICAL SOCIETY,New York, N. Y.
Table I. Precision of Results Obtained on Specifica tionGrade Phosgene
Sample HCI UnaccountedSample Weight Phosgene Acidity Ch Residue for
Gram % % % % %A 0.4595 99.08 0,48 nil 0.05 0.39
0.3213 99.12 0.45 nil 0.04 0.390,1521- 99.10 0.47 nil 0.05 0,38
B 0.5040 99.54 0.05 0.29 0.04 0,080.1215 99.59 0.04 0.27 0.05 0,050.3028 99.57 0.05 0,26 0,04 0,08
Table II. Results by Variations of Method
Sample0.1 N Thiosulfate to
HCl Correct for SideSample Method Weight Phosgene Acidity Reactions
Gram % % MI.C 1 0.4500 98.46 0.39
2 0.4844 98.48 0.38 0."02 0,3214 98.44 0.39 0.03 0.4390 92.97 3.93 0.2421 94.20 4,83 0.1120 90.12 6.1
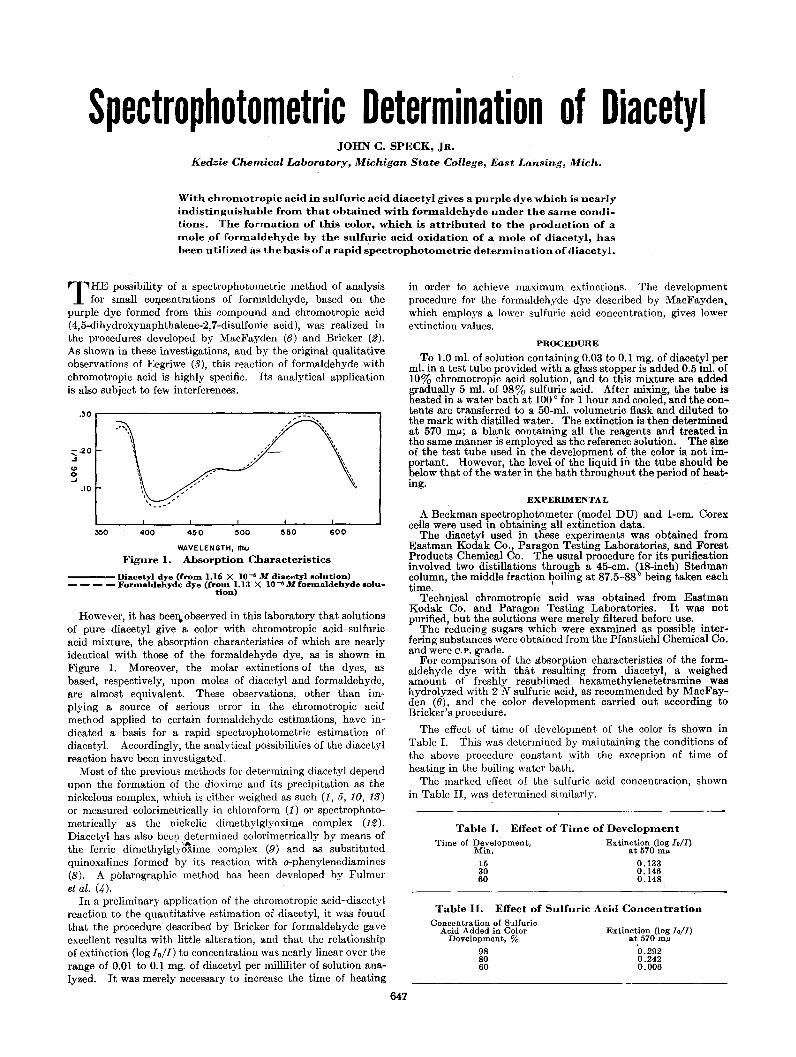
Spectrophotometric Determination of DiacetylJOHN C. SPECK, JR.
Kedzie Chemical Laboratory, Michigan State College, East Lansing, Mich.
~Tith chronwtropic acid in sulfuric acid diacetyl gives a purple dye which is nearlyindistinguishable froIn that obtained with forInaldehyde under the saIne conditions. The formation of this color, which is attributed to the production of amole of formaldehyde by the sulfuric acid oxidation of a mole of diacetyl, hasbeen utilized as the basis of a rapid ~pectrophotometricdetermination ofdiacetyl.
WAVELENGTH, m...Figure 1. Absorption Characteristics
----Diacetyl dye (froll1 1.16 X 10-' M diacetyl solution)- - - - FOrInaldehyde dye (froll1 1.13· X 10-' Mforll1aldehyde solu-
tion)
Extinction (log loll)at 570 m"
'0.2920.2420.006
Concentration of SulfuricAcid Added in Color
Development, %988060
Table II. Effect of Sulfuric Acid Concentration
Table 1. Effect of Time of DevelopInentTime of Development, Extinction (log loll)
Min. at 570 m"
15 0.13330 0.14660 0.148
in order to achieve maximum extinctions. The developmentprocedure for the formaldehyde dye described by MacFayden.which employs a lower sulfuric acid concentration, gives lowerextinction values.
PROCEDURE
To 1.0 ml. of solution containing 0.03 to 0.1 mg. of diacetyl perml. in a test tube provided with a glass stopper is added 0.5 ml. of10% chromotropic acid solution, and to this mixture are addedgradually 5 ml. of 98% sulfuric acid. After mixing, the tube isheated in a water bath at 100 0 for 1 hour and cooled, and the contents are transferred to a 50-ml. volumetric flask and diluted tothe mark with distilled water. The extinction is then determinedat 570 m",; a blank containing all the reagents and treated inthe same manner is employed as the reference solution. The sizeof the test tube used in the development of the color is. not important. However, the level of the liquid in the tube should bebelow that of the water in the bath throughout the period of heating.
EXPERIMENTAL
A Beckman spectrophotometer (model DU) and 1-cm. Corexcells were used in obtaining all extinction data.
The diacetyl used in these experiments was obtained fromEastman Kodak Co., Paragon Testing Laboratories, and ForestProducts Chemical Co. The usual procedure for its purificationinvolved two distillations through a 45-cm. (l8-inch) Stedmancolumn, the middle fraction boiling at 87.5-88 0 being taken eachtime. I
Technical chromotropic acid was obtained from EastmanKodak Co. and Paragon Testing Laboratories. It was notpurified, but the solutions were merely filtered before use.
The reducing sugars which were examined as possible interfering substances were obtained from the Pfanstiehl Chemical Co.and were C.P. grade. .
For comparison of the absorption characteristics of the formaldehyde dye with that resulting from diacetyl, a weighedamount of freshly resublimed hexamethylenetetramine washydrolyzed with 2 N sulfuric acid, as recommended by MacFayden (6), and the color development carried out according toBricker's procedure.
The effect of time of development of the color is shown inTable 1. This was determined by maintaining the conditions ofthe above procedure constant with the exception of time ofheating in the boiling water bath.
The marked effect of the sulfuric acid concentration, shownin Table II, was determined similarly.
600550500450400350
.10
.30 .------------------,-_~_,.,.._,-,----.....," ~,, ,
" "" \, ,,'.- \, ,
-"""--",,-~,, \\
THE possibility of a spectrophotometric method of analysisfor small cOI).centrations of formaldehyde, based on the
purple dye formed from this compound and chromotropic acid(4,5-dihydroxynaphthalene-2,7-disulfonic acid), was realized inthe procedures developed by MacFayden (6) and Bricker (2).As shown in these investigations, and by the original qualitativeobservations of Eegriwe (3), this reaction of formaldehyde withchromotropic acid is highly specific. Its analytical applicationis also subject to few interferences.
However, it has been. observed in this laboratory that solutionsof pure diacetyl give a color with chromotropic acid-sulfuricacid mixture, the absorption characteristics of which are nearlyidentical with those of the formaldehyde dye, as is shown inFigure 1. Moreover, the molar extinctions of the dyes, asbased, respectively, upon moles of diacetyl and formaldehyde,are almost equivalent. These observations, other than implying a source of serious error in the chromotropic acidmethod applied to certain .formaldehyde estimations, have indicated a basis for a rapid spectrophotometric estimation ofdiacetyl. Accordingly, the analytical possibilities of the diacetylreaction have been investigated.
Most of the pre~ious methods for determining diacetyl dependupon the formation of the dioxime and its precipitation as thenickelous complex, which is either weighed as such (1, 5, 10, 13)or measured colorimetrically in chloroform (1) or spectrophotometrically as the nickelic dimethylglyoxime complex (12).Diacetyl has also beelf ,determined colorimetrically by means ofthe ferric dimethylgly6i:ime complex (9) and as substitutedquinoxalines formed by its reaction with o-phenylenediamines(8). A polarographic method has been developed by Fulmeret al. (,4-).
In a preliminary application of the chromotropic acid-diacetylreaction to the quantitative estimation of diacetyl, it was foundthat the procedure described by Bricker for formaldehyde gaveexcellent results with little alteration, and that the relatlonshipof extinctiori (log lolI) to concentration was nearly linear over therange of 0.01 to 0.1 mg. of diacetyl per milliliter of solution analyzed. It was merely necessary to increase the time of heating
647
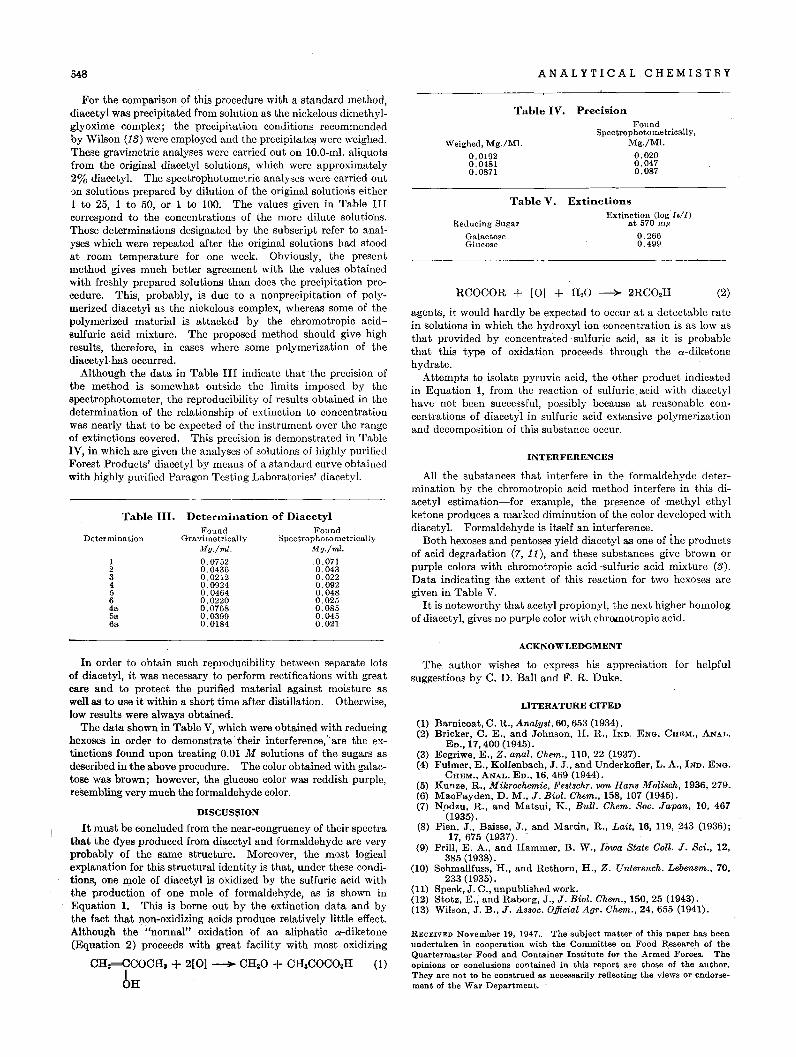
ANALYTICAL CHEMISTRY
agents, it would hardly be expected to occur at a detectable ratein solutions in which the hydroxyl ion concentration is as low asthat provided by concentrated sulfuric acid, as it is probablethat this type of oxidation proceeds through the a-diketonehydrate.
Attempts to isolate pyruvic acid, the other product indicatedin Equation 1, from the reaction of sulfuric acid with diacetylhave not been successful, possibly because at reasonable concentrations of diacetyl in sulfuric acid extensive ·polymerizationand decomposition of this substance occur.
INTERFERENCES
All the substances that interfere in the formaldehyde determination by the chromotropic acid method interfere in this diacetyl estimation-for example, the presence of methyl ethylketone produces a marked diminution of the color developed withdiacety!. Formaldehyde is itself an interference.
Both hexoses and pentoses yield diacetyl as one of the productsof acid degradation (7, 11), and these substances give brown orpurple colors with chromotropic acid-sulfuric acid mixture (3).Data indicating the extent of this reaction for two hexoses aregiven in Table V.
It is noteworthy that acetyl propionyl, the next higher homologof diacetyl, gives no purple color with chromotropic acid.
RCOCOR + [OJ + H20 ~ 2RC02H
For the comparison of this procedure with a standard method,diacetyl was precipitated from solution as the nickelous dimethylglyoxime complex; the precipitation conditions recommendedby Wilson (13) were employed and the precipitates were weighed.These gravimetric analyses were carried out on 1O.0-m!. aliquotsfrom the original diacetyl solutions, which were approximately2% diacetyl. The spectrophotometric analyses were carried outon solutions prepared by dilution of the original solutions either1 to 25, 1 to 50, or 1 to 100. The values given in Table IIIcorrespond to the concentrations of the more dilute solutions.Those determinations designated by the subscript refer to analyses which were repeated after the original solutions had stoodat room temperature for one week. Obviously, the presentmethod gives much better agreement with the values obtainedwith freshly prepared solutions than does the precipitation procedure. This, probably, is due to a nonprecipitation of polymerized diacetyl as the nickelous complex, whereas some of thepolymerized material is attacked by the chromotropic acidsulfuric acid mixture. The proposed method should give highresults, therefore, in cases where some polymerization of thediacetyl·has occurred.
Although the data in Table III indicate that the precision ofthe method is somewhat outside the limits imposed by thespectrophotometer, the reproducibility of results obtained in thedetermination of the relationship of extinction to concentrationwas nearly that to be expected of the instrument over the rangeof extinctions covered. This precision is demonstrated in TableIV, in which are given the analyses of solutions of highly purifiedForest Products' diacetyl by means of a standard curve obtainedwith highly purified Paragon Testing Laboratories' diacetyl.
Table III. Detenuination of DiacetylFound Found
Determination Gravimetrically SpectrophotometricallyMy./ml. My./mJ..
1 0.0752 .0.0712 0.0436 0.0433 0.0212 0.0224 0.0924 0.0925 0.0464 0.0486 0.0220 0.0254a 0.0768 0.0855a 0.0399 0.0456a 0.01S4 0.021
Table IV.
Weighed, Mg./Ml.
0.01920.04810.0871
Table V.
Reducing Sugar
GalactoseGlucose
PreciilionFound
Spectrophotometrically,Mg./Ml.
0.0200.0470.087
ExtinctionsExtinction (log I.II)
at 570 m"0.2660.499
(2)
ACKNOWLEDGMENT
The. author wishes to express his appreciation for helpfulsuggestions by C. D. Ball and F. R. Duke.
RECEIVED November 19, 1947.. The subject matter of this paper has beenundertaken in cooperation with the Committee on Food R:esearch· of theQuartermaster Food and Container Institute for the Armed Forces. Theopinions or conclusions contained in thia report are those of the author.They are not to be construed as necessarily reflecting the views or endorsement of the War Department.
In order to obtain such reproducibility between separate lotsof diacetyl, it was necessary to perform rectifications with greatcare and to protect the purified material against moisture aswell as to use it within a short time after distillation. Otherwise,low results were always obtained.
The data shown in Table V, which were obtained with reducinghexoses in order to demonstrate .their interference,"are the extinctions found upon treating 0.01 M solutions of the sugars asdescribed in the above procedure. The color obtained with galactose was brown; however, the glucose color was reddish purple,resembling very much the formaldehyde color. .
DISCUSSION
It must be concluded from the near-congruency of their spectrathat the dyes produced from diacetyl and formaldehyde are veryprobably of the same structure. Moreover, the most logicalexplanation for this structural identity is that, under these conditions, one mole of diacetyl is oxidized by the sulfuric acid withthe production of one mole of formaldehyde, as is shown inEquation 1. This is borne out by the extinction data and bythe fact that non-oxidizing acids produce relatively little effect.Although the "normal" oxidation of an aliphatic a-diketone(Equation 2) proceeds with great facility with most oxidizing
CH:=CCOCH. + 2[0]~ CHIO + CHI COC02H (1)
6H
(1)(2)
(3)(4)
(5)(6)(7)
(8)
(9)
(10)
(11)(12)(13)
LITERATURE CITED
Barnicoat, C. R., Analyst, 60, 653 (1934).Bricker, C. E., and Johnson, H. R., IND. ENG. CHEM., ANAL.
ED., 17, 400 (1945).Eegriwe, E., Z. anal. Chem., 110, 22 (1937).Fulmer, E., Kolfenbach, J. J., and Underkofler, L. A., IND. ENG.
CHEM., ANAL. ED., 16,469 (1944).Kunze, R., Mikrochemie, Festschr. von Hans Molisch, 1936, 279.MacFayden, n.M., J. BioI. Ch6m., 158, 107 (1945).N.odzu, R., and Matsui, K., Bull. Chem. Soc. Japan, 10, 467
(1935) .Pien, J., Baisse, J., and Martin, R., Lait, 16, 119,243 (1936);
17, 675 (1937) ..Prill, E. A., and Hammer, B. W., Iowa State Coli. J. Sci., 12,
385 (1938).Schmallfuss, H., and Rethorn, H., Z. Untersuch. Lebensm., 70,
233 (1935).Speck, J. C., unpublished work.Stotz, E., and Raborg, J., J. BioI. Chem., 150, 25 (1943).Wilson, J. B., J. Assoc. Official Agr. Chem., 24, 655 (1941).
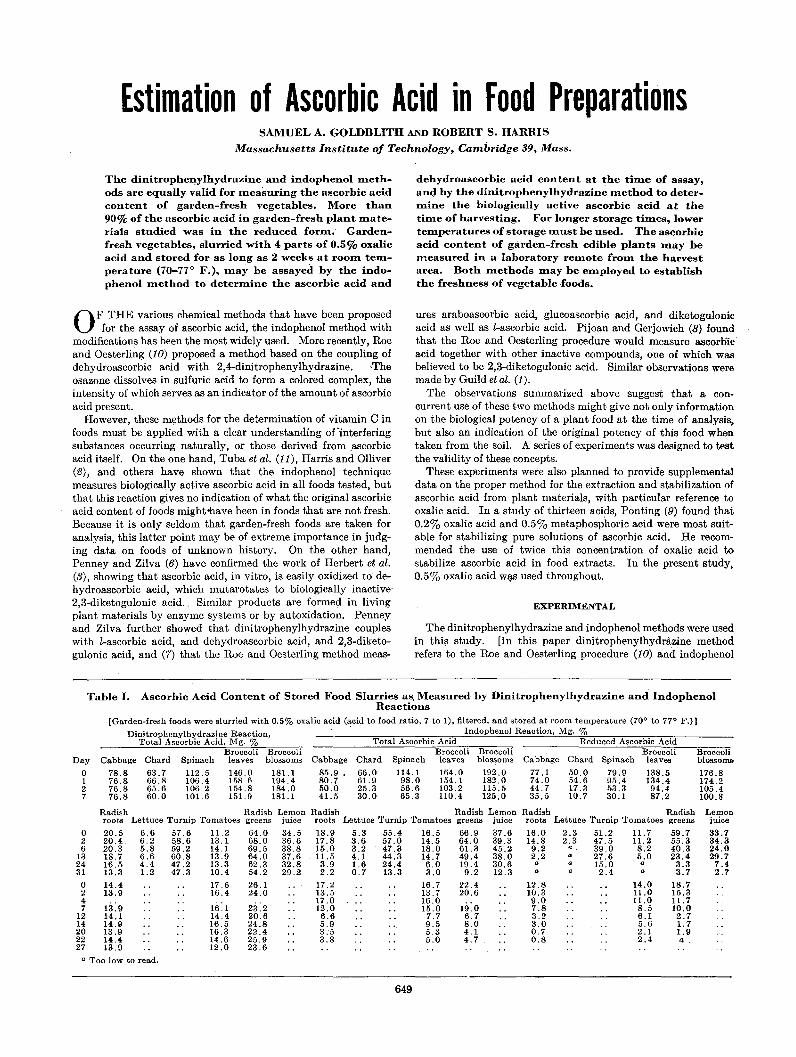
Estimation of Ascorbic Acid in Food PreparationsSAMUEL A. GOLDBLITH AND ROBERT S. HARRIS
Massachusetts Institute of Technology, Cambridge 39, Mass.
The dinitrophe~ylhydrazineand indophenol Illcthods are equally valid for Illeasuring the ascorbic acidcontent of garden-fresh vegetables. More than90% of the ascorbic acid in garden-fresh plant Illateriats studied was in the reduced forIll. Gardenfresh vegetables, slurried with 4 parts of 0.5% oxalicacid and stored for as long as 2 weeks at rOOIll teIllperature (70-77° F.), Illay be assayed by the indophenol Illethod to deterIlline the ascorbic acid and
OF THE various chemical methods that have been proposedfor the assay of ascorbic acid, the indophenol method with
modifications has been the most widely used. More recently, Roeand Oesterling (10) proposed a method based on the coupling ofdehydroascorbic acid with 2,4-dinitrophenylhydrazine. ,Theosazone dissolves in sulfuric acid to form a colored complex, theintensity of which serves as an indicator of the amount of ascorbicacid present.
However, these methods for the determination of vitamin C infoods must be applied with a clear understanding of'interferingsubstances occurring naturally, or those derived from ,ascorbicacid itself. On the one hand, Tuba et al. (11), Harris and Olliver(2), and others have shown that the indophenol techniquemeasures biologically active ascorbic acid in all foods tested, butthat this reaction gives no indication of what the original ascorbicacid content of foods might'have been in foods that are not fresh.Because it is only seldom that garden-fresh foods are taken foranalysis, this latter point may be of extreme importance in judging data on foods of unknown history. On the other hand,Penney and Zilva (6) have confirmed the work of Herbert et al.(S), showing that ascorbic acid, in vitro, is easily oxidized to dehydroascorbic acid, which mutarotates to biologically inactive'2,3-diketogulonic acid., Similar products are formed in livingplant materials by enzyme systems or by autoxidation. Penneyand Zilva further showed that dinitrophenylhydrazine coupleswith !-ascorbic acid, and dehydroascorbic acid, and 2,3-diketogulonic acid, and (7) that the Roe and Oesterling method meas-
dehydroascorbic acid content at the dIlle of assay,and by the dinitrophenylhydrazine method to deterIlline the biologically active ascorbic acid at thetiIlle of harvesting. For longer storage tiIlles, lowerteIllperatures of storage Illust be used. The ascorbicacid content of garden-fresh edible plants Illay bem.easured in a laboratory reIllote froIll the harvestarea. Both Illethods Illay be eIllployed to establishthe freshness of vegetable foods.
ures araboascorbic acid, glucoascorbic acid, and diketogulonicacid as well as l-ascorbic acid. Pijoan and Gerjowich (8) foundthat the Roe and Oesterling procedure would measure ascorokacid together with other inactive compounds, one of which wasbelieved to be 2,3-diketogulonic acid. Similar observations weremade by Guild etal. (1).
The observations summarized above suggest that a concurrent use of these two methods might give not only informationon the biological potency of a plant food at the time of analysis,but also an indication of the original potency of this food whentaken from the soil. A series of experiments was designed to testthe validity of these concepts.
These experiments were also planned to provide supplementaldata on the proper method for the extraction and stabilization ofascorbic acid from plant materials, with particular reference tooxalic acid. In a study of thirteen acids, Ponting (9) found that0.2% oxalic acid and 0.5% metaphosphoric acid were most suitable for stabilizing pure solutions of ascorbic acid. He recommended the use of twice this concentration of oxalic acid tostabilize ascorbic acid in food extracts. In the present study,0.5% oxalic acid wl)-s used throughout.
EXPERIMENTAL
The dinitrophenylhydrazine and indophenol methods were usedin this study. [In this paper dinitrophenylhydrMine methodrefers to the Roe and Oesterling procedure (10) and indophenol
Table I. Ascorbic Acid Content of Stored Food Slurries as, Measured· by Dinitrophenylhydrazine and IndophenolReactions
[Garden-fresh foods were slurried with 0.5% oxalic acid (acid to food ratio. 7 to 1). filtered. and stored at room temperature (70 0 to 77 0 F.) IDinitrophenylhydrazine Reaction, Indophenol Reaction, Mg. %
Total Ascorbic Acid. Mg, % Total Ascorbic Acid Reduced Ascorbic AcidBroccoli Broccoli Broccoli Broccoli
Cabb~geBroccoli Broccoli
Day Cabbage Chard Spinach leaves blossoms Cabbage Chard Spinach leaves blossoms Chard Spinach leaves bloSSOII1B'
0 78.8 63.7 112.5 146.0 181.1 85.9 • 66.0 114.1 164.0 192.0 77.1 50.0 79.9 138.5 176.81 76.8 66.8 106.4 158.6 194.4 80.7 61.9 98.0 154.1 182.0 74.0 54.6 95..4 134.4 174.22 76.8 65.6 106.2 154.8 184.0 50.0 25.3 56.6 103.2 115.5 44.7 17.3 53,3 94.4 105.47 76.8 60,0 101.6 151,9 181.1 41.5 30.0 65.3 110.4 125.0 35.5 10.7 30.1 87.2 100.&
Radish Radish Lemon Radish Radish Lemon Radish Radish Lemonroots Lettuce Turnip _Tomatoes greens juice roots Lettuce Turnip Tomatoes greens juice roots Lettuce Turnip Tomatoes greens juice·
0 20.5 6.6 57.6 112 64.0 34.5 18.9 5.3 55.4 16.5 66.9 37.6 16.0 2.3 51.2 11.7 59.7 33.72 20.4 6.2 58.6 13.1 68.0 36.6 17.8 3.6 57.0 14.5 64.0 39.3 14.8 2.3 47.5 11.2 55.3 34.36 20.3 5.8 59.2 14.1 69.5 38.8 15.0 3.2 47.3 1&.0 61.3 45.2 9.2 a 39.0 8.2 40.3 24.0
13 18.7 6.6 60.8 13.9 64.0 37.6 11.5 4.1 44.3 14.7 49.4 38.0 2.2 a 27.6 5.0 23.4 29.724 16.5 4.4 47.2 13.3 62.3 32.8 3.9 1.6 24.4 6.0 19.4 30.6 a a 15.0 a 3.3 7.431 13.3 1.2 47.3 10.4 54.2 29.2 2.2 0.7 13.3 3.0 9.2 12.3 a 2.4 a 3.7 2.7
0 14.4 17,6 26.1 17.2 16.7 22.4 12.8 14.0 18.72 13.9 16.4 24.0 13.5 13.7 20.6 10.3 11.0 15.34
13:9 16: 117.0 16.0
19:09.0 11.0 11.7
7 23.2 12.0 15.0 7.& 8.5 10.012 14.1 14.4 20.6 6.6 7.7 6,7 3.2 6.1 2.714 14.9 16.5 24.8 5.9 9.5 8.0 3.0 5.6 1.720 13.9 16.3 22.4 3.5 5.3 4.1 0.7 2.1 1.922 14.4 14.6 25.9 3.8 5.0 4.7 0.8 2.4 G.27 13.9 12.0 23.6
a Too low to read.
649
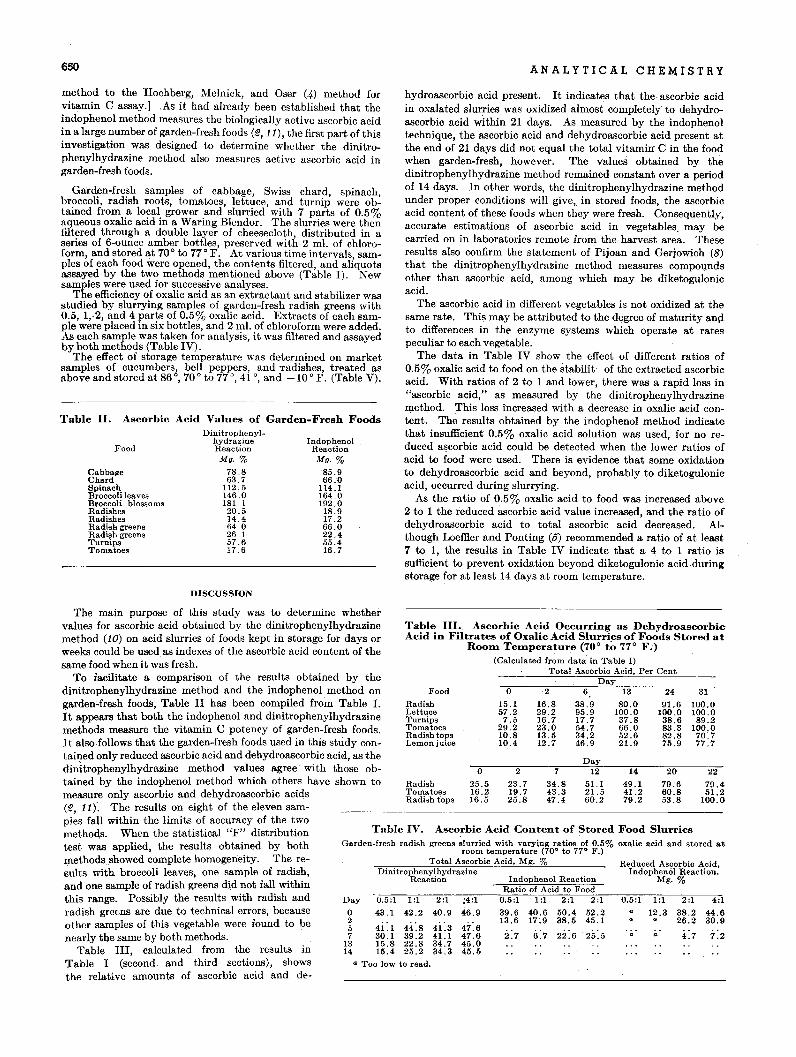
650 A N A L Y TIC ALe HEM; I ST R Y
Table II. Ascorbic Acid Values of Garden-Fresh Foods
method to the Hochberg, YIelnick, and Oser (4) method forvitamin C assay.] As it bad already been established that theindophenol method measures the biologically active ascorbic acidin a large number of garden-fresh foods (2, 11), the first part of thisinvestigation was designed to determine whether the dinitrophenylhydrazine method also measures active ascorbic acid ingarden-fresh foods.
Garden-fresh samples of cabbage, Swiss chard, spinach,broccoli, radish roots, tomatoes, lettuce, and turnip were obtained from a local grower and slurried with 7 parts of 0.5%aqueous oxalic acid in a Waring Blendor. The slurries were thenfiltered through a double layer of cheesecloth, distributed in aseries of 6-ounce amber bottles, preserved with 2 m!. of chloroform, and stored at 70° to 77° F. At various time intervals, samples of each food were opened, the contents filtered, and aliquotsassayed by the two methods mentioned above (Table I). Newsamples were used for successive analyses.
The efficiency of oxalic acid as an extractant and stabilizer wasstudied by slurrying samples of garden-fresh radish greens with0.5, 1,·2, and 4 parts of 0.5% oxalic acid. Extracts of each sampIe were placed in six bottles, and 2 m!. of chloroform were added.As each sample was taken for analysis, it was filtered and assayedby both methods (Table IV).
The effect of storage temperature was determined on marketsamples of cucumbers, bell peppers, and Tadishes, treated asabove and stored at 86°,70 ° to 77 °,41°, and -10 ° F. (Table V).
Food
CabbageChardSpinachBroocoli leavesBroccoli blossomsRadishesRadishesRadieR greensRadish greensTurnipsTomatoes
DinitrophenylhydrazineReaction
Mg. %78.863.7
112.5146.0181,120.514.464.026.157.617.6
IndophenolReaction
Mg. %'85.966.0
114.1164.0192.018.917.266.022.455.416.7
hydroascorbic acid present. It indicates that the· ascorbic acidin oxalated slurries was oxidized almost completely to dehydroascorbic acid within 21 days. As measured by the indophenoltechnique, the ascorbic acid and dehydroascorbic acid present atthe end of 21 days did not equal the total vitamin' C in the foodwhen garden-fresh, however. The values obtained by thedinitrophenylhydrazine method remained constant over a periodof 14 days. In other words, the dinitrophenylhydrazine methodunder proper conditions will give, in stored foods, the ascorbicacid content of these foods when they were fresh. Consequently,accurate estimations of ascorbic acid in vegetables, may becarried on in laboratories remote from the harvest area. Theseresults also confirm the statement of Pijoan and Gerjowich (8)that the dinitrophenylhydrazine method measures compoundsother than ascorbic acid, among which may be diketogulonicacid.
The ascorbic acid in different vegetables is not oxidized at thesame rate. This may be attributed to the degree of maturity an(ito differences in the enzyme systems which operate at ratespeculiar to each vegetable.
The data in Table IV show the effect of different ratios of0.5% oxalic acid to food on the stabilit· of the extracted ascorbicacid. With ratios of 2 to 1 and lower, there was a rapid loss in"ascorbic acid," as measured by the dinitrophenylhydrazinemethod. This loss increased with a decrease in oxalic acid content. The results obtained by the indophenol method indicatethat insufficient 0.5% oxalic acid solution was used, for no reduced a~corbic acid could be detected when the lower ratios ofacid to food were used. There is evidence that some oxidationto dehydroascorbic acid and beyond, probably to diketogulonicacid, occurred during slurrying.
As the ratio of 0.5% oxalic acid to food was increased above2 to 1 the reduced ascorbic acid value increased, and the ratio ofdehydroascorbic acid to total ascorbic acid decreased. Although Loeffler andPonting (5) recommended a ratio of at least7 to 1, the results in Table IV indicate that a 4 to 1 ratio issufficient to prevent oxidation beyond diketogulonic acid.duringstorage for at least 14 days at room temperature.
DISCUSSION
Garden-fresh radi&h greens slurried with varytng ratios of 0.5% oxalic acid and stored atroom temperature (70 0 to 77° F.)
Total Ascorbic Acid. Mg. % Reduced Ascorbic Acid.Dinitrophenylhydrazine Indophenol Reaction.
Reaction Indophenol Reaction Mg. %Ratio of Acid to Food
a Too low to read.
Table III. Ascorbic Acid Occurring as DehydroascorbicAcid in Filtrates of Oxalic Acid Slurries of Foods Stored at
ROOln Telllperature (70° to 77° F.)(Calculated from data in Table I)
Total Ascorbic Acid. Per Cent
Food 0 2 6 13 24 31
Radish 15.1 16.8 38.9 80.0 91.6 100.0Lettuce 57.2 29.2 95.9 100.0 100.0 100.0Turnips 7.5 16.7 17.7 37.8 38.6 89.2Tomatoes 29.2 23.0 54.7 66.0 83.3 100.0Radish tops 10.8 13.5 34.2 52.6 82.8 70.7LemonjulCe 10.4 12.7 46.9 21.9 75.9 77.7
Day0 2 7 12 14 20 22
Radish 25.5 23.7 34.8 51.1 49.1 79:6 79.4Tomatoes 16.2 19.7 43.3 21.5 41.2 60.8 51.2Radish tops 16.5 25.8 47.4 60.2 79.2 53.8 100.0
0.5:1 1 :1 2:1 4:1a 12.3 38.2 44.6a a 26.2 30.9
a a 4.7 7.2
Day
0.5:1 1:1 2:1 2:1
39.6 40.6 50.4 52.213.6 17:9 38.5 45.1
2:7 6.7 22.6 25.5
Ascorbic Acid Content of Stored Food Slurries
1 :1 2:1 :4:1
42.2 40.9 46.9
44.8 41.3 47:639.2 41.1 47.622.8 34.7 45.025.2 34.3 45.5
0.5:1
43.1
41.130.115.815.4
Table IV.
Day
o257
1314
The main purpose of this study was to determine whethervalues for ascorbic acid obtained by the dinitrophenylhydrazinemethod (10) on acid slurries of foods kept in storage for days orweeks could be used as indexes of the ascorbic acid content of thesame food when it was fresh.
To facilitate a comparison of the results obtained by thedinitrophenylhydrazine method and the indophenol method ongarden"fresh foods, Table II has been compiled from Table, I.It appears that both the indophenol and dinitrophenylhydtazinemethods measure the vitamin C potency of garden-fresh foods.It a1so.follows that the garden-fresh foods used in this sttidy contained only reduced ascorbic acid and dehydroascorbic acid, as thedinitrophenylhydrazine method values agree with those obtained by the indophenol method which others have shown tomeasure only ascorbic and dehydroascorbic acids(2, 11Y. The results on eight of the eleven sam-ples fall within the limits of accuracy of the twomethods. When the statistical "F" distributiontest was applied, the results obtained by bothmethodsshowed complete homogeneity. The re~ults with broccoli leaves, one sample of radish,and one sample of radish greens did not fall withinthis range. Possibly the results with radish andradish greens are due to technical errors, becauseother samples of this vegetable were found to benearly the same by both methods.
Table III, calculated from the results inTable I (second and third sections), showsthe relative amounts of ascorbic acid and de-
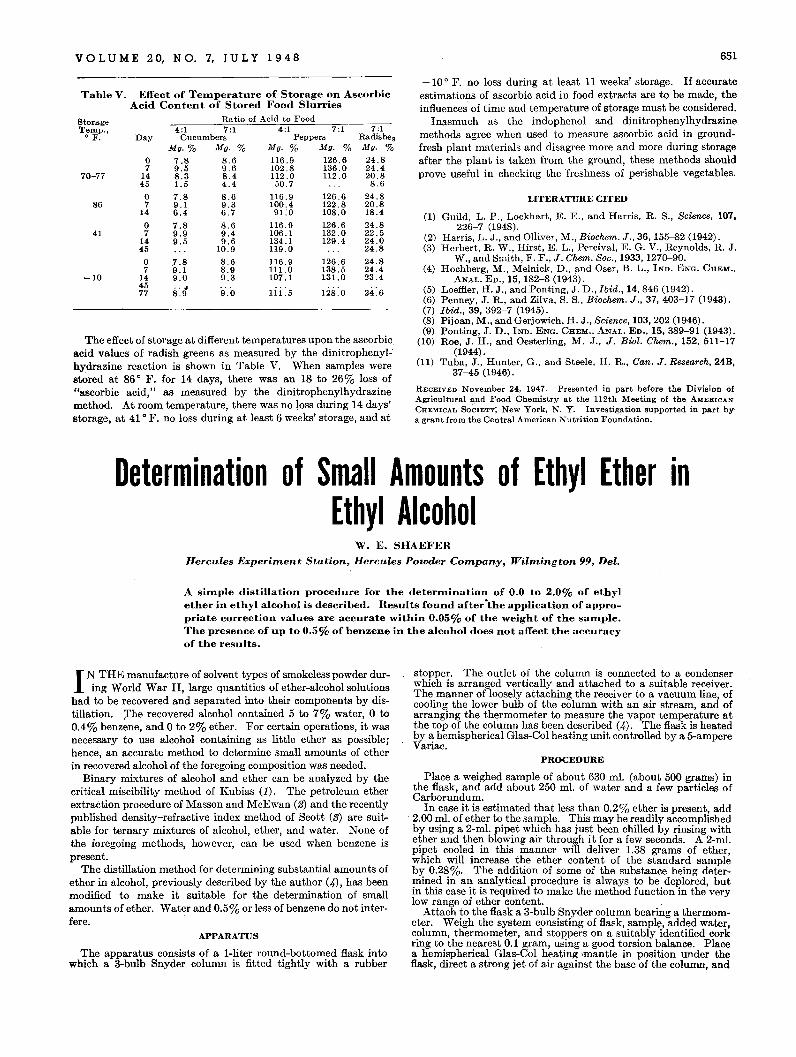
VOLUME 20, NO. 7, JUL Y 1948
TableV. Effect of TeIIlperature of Storage on AscorbicAcid Content of Stored Food Slurries
Btorage Ratio of Acid to FoodTemp., 4:1 7:1 4:1 7 :1 7:1
OF. Day Cucumbers Peppers RadishesMg. % Mg. % Mg. % Mg. % Mg. %
0 7.8 8.6 116.9 126.6 24.87 9.5 9.6 102.8 136.0 24.4
70-77 14 8.3 8.4 112.0 112.0 20.845 1.5 4.4 50.7 8.6
0 7.8 8.6 116.9 126.6 24.886 7 9.1 9.3 100.4 122.8 20.8
14 6.4 6.7 91.0 108.0 18.4
0 7.8 8.6 116.9 126.6 24.841 7 9.9 9.4 106.1 132.0 22.5
14 9.5 9.6 134.1 129.4 24.045 10.9 119.0 24.8
0 7.8 8.6 116.9 126.6 24.87 9.1 8.9 111.0 138.5 24.4
-10 14 9.0 9.3 107.1 131.0 23.445 .. .
24:677 8.9 9.0 111.5 128.0
The effect of storage at different temperatures upon the ascorbicacid values of radish greens as measured by the dinitrophenyl':hydrazine reaction is shown in Table V. When samples werestored at 86 0 F. for 14 days, there was an 18 to 26% loss of"ascorbic acid," as measured by the dinitrophenylhydrazinemethod. At room temperature, there was no loss during 14 days'storage, at 41 0 F. no loss during at least 6 weeks' storage, and at
651
-10 0 F. no loss during at least 11 weeks' storage. If accurateestimations of ascorbic acid in food extracts are to be made, theinfluences of time and temperature of storage must be considered.
Inasmuch as the indophenol and dinitrophenylhydrazinemethods agree when used to measure ascorbic acid in groundfresh plant materials and disagree more and more during storageafter the plant is taken from the ground, these methods shouldprove useful in checking the 'freshness of perishable vegetables.
LITERATURE CITED
(1) Guild, L. P., Lockhart, E. E., and Harris, R. S., Science, 107,226-7 (1948).
(2) Harris, L. J., and Olliver, M., Biochem. J., 36,155-82 (1942).(3) Herbert, R. W., Hirst, E. L., Percival, E. G. V., Reynolds, R. J.
W., and Smith, F. F., J. Chem. Soc., 1933, 1270-90.(4) Hochberg, M., Melnick, D., and Oser, B. L., IND. ENG. CHEM.,
ANAL. ED., IS, 182-8 (1943).(5) Loeffler, H. J., and Ponting, J. D., Ibid., 14,846 (1942) .(6) Penney, J. R., and Zilva, S. S., Biochem. J., 31, 403-17 (1943).(7) Ibid., 39, 392-7 (1945).(8) Pijoan, M., and Gerjowich, H. J., Science, 103, 202 (1946).(9) Ponting, J. D., IND. ENG. CHEM., ANAL. ED., 15,389-91 (1943).
(10) Roe, J. H., and Oesterling, M. J., J. Bioi. Chem., 152, 511-17(1944).
(11) Tuba, J:, Hunter, G., and Steele, H. R., Can. J. Research, 24B,37-45 (1946).
RECEIVED November 24, 1947. Presented in part before the Division ofAgricultural and Food Chemistry at the 112th Meeting of the AMEllICANCHEMICAL SOCIETY, New York, N. Y. Investigation supported in part bya grant from the Central American Nutrition Foundation.
Determination of SIMII Amounts of Ethyl Ether inEthyl Alcohol
W. E. SHAEFER
Hercules Experiment Station, Hercules Powder Company, Wil,nington 99, Del.
A sim.ple distillation procedure for the deterIIlination of 0.0 to 2.0% of ethylether in ethyl alcohol is described. Results found after"the application of appropriate correction values are accurate within 0.05% of the weight of the saIIlple.The presence of up to 0.50/0 of benzene in the alcohol does not affect the accuracyof the results.
I N THE manufacture of solvent types of smokeless powder during World War II, large quantities of ether-alcohol solutions
had to be recovered and separated into their components by distillation. :The recovered alcohol contained 5 to 7% water, 0 to0.4% benzene, and 0 to 2% ether. For certain operations, it wasnecessary to use alcohol containing as little ether as possible;hence, an accurate method to determine small amounts of etherin recovered alcohol of the foregoing composition was needed.
Binary mixtures. of alcohol and ether can be analyzed by thecritical miscibility method of Kubias (1). The petroleum etherextraction procedure of Masson and McEwan (2) and the recentlypublished density-refractive index method of Scott (3) are suitable for ternary mixtures of alcohol, ether, and water. None ofthe foregoing methods, however, can be used when benzene ispresent.
The distillation method for determining substantial amounts ofether in alcohol, previously described by the author (4), has beenmodified to make it suitable for the determination of smallamounts of ether. Water and 0.5% or less of benzene do not interfere.
APPARATUS
The apparatus consists of a I-liter round-bottomed flask intowhich a 3-bulb Snyder column is fitted tightly with a rubber
stopper. The outlet of the column is connected to a condenserwhich is arranged vertically and attached to a suitable receiver.The manner of loosely attaching the receiver to a vacuum line, ofcooling the lower bulb of the column with an air stream, and ofarranging the thermometer to measure the vapor temperature atthe top of the column has been described (4). The flask is heatedby a hemispherical Glas-Col heating unit controlled by a 5-ampereVariac.
PROCEDURE
Place a weighed sample of about 630 ml. (about 500 grams) inthe flask, and add about 250 ml. of water and a few particles ofCarborundum.
In case it is estimated that less than 0.2% ether is present, add2.00 ml. of ether to the sample. This may be readily accomplishedby using a 2-ml. pipet which has just been chilled by rinsing withether and then blowing air through it for a few seconds. A 2-ml.pipet cooled in this manner will deliver 1.38 grams of ether,which will increase the ether content of the standard sampleby 0.28%. The addition of some of the substance being determined in an analytical procedure is always to be deplored, butin this case it is required to make the method function in the verylow range of ether content.
Attach to the flask a 3-bulb Snyder column bearing a thermometer. Weigh the system consisting of flask, sample, added water,column, thermometer, and stoppers on a suitably identified corkring to the nearest 0.1 gram, using a good torsion balance. Placea hemispherical Glas-Col heating 'mantle in position under theflask, direct a strong jet of air against the base ofthe column, and
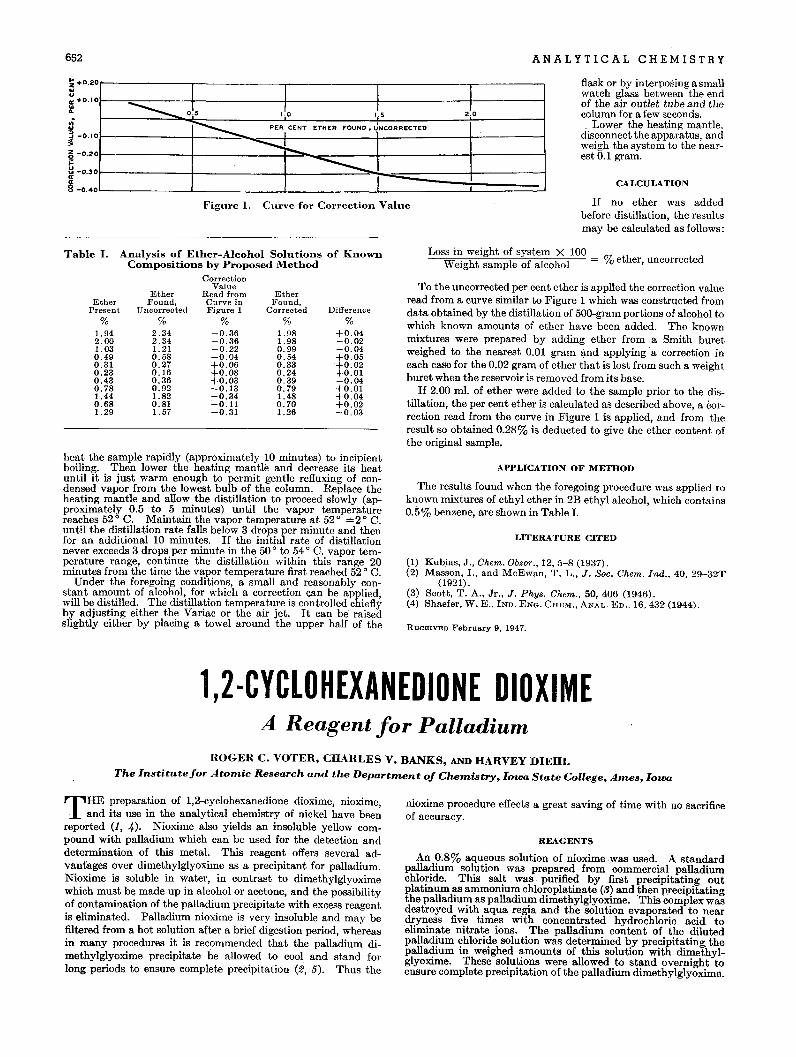
652 ANALYTICAL CHEMISTRY
~ +0.20..ua: +0.10..Cl.
.;..3 -0.10~
~ -0.20;:M-0.30oror8 -0.40
----- 015 1'0
I2'01.5---- PER CENT ETHER
0FOUND. UNCORRECTED--r-..
-----Figure 1. Curve for Correction Value
flask or by int.erposingasmallwatch glass between the endof the air outlet tube and thecolumn for a few seconds.. Lower the heating mantle.
disconnect the apparatus, andweigh the system to the nearest 0.1 gram.
CALCULATION
If no ether was addedbefore distillation, the resultsmay be calculated as follows:
To the uncorrected per cent ether is appl1ed the correction valueread from a curve similar to Figure 1 which was constructed fromdata obtained by the distillation of 500-gram portions of alcohol towhich known amounts of ether have been added. The knownmixtures were prepared by adding ether from a Smith buretweighed to the nearest 0.01 gram and applying'a correction ineach case for the 0.02 gram of ether that is lost from such a weightburet when the reservoir is removed from' its base.
If 2.00 ml. of ether were added to the sample prior to the distillation, the per cent ether is calculated as described above, a correction read from the curve in Figure 1 is applied, and from theresult so obtained 0.28% is deducted to give the ether content, ofthe original sample.
Loss in weight of system X 100 o-t th t dWeight sample of alcohol = /0 e er, uncorrec e
+0.04-0.02-0.04+0.05+0.02+0.01-0.04+0.01+0.04+0.02-0.03
Difference
%
EtherFound,
Corrected%
1.981.980.990.540.330.240.390.791.480.701.26
EtherFound,
Uncorrected%
2.342.341.210.580.270.160.360.921.820.811.57
EtherPresent
%1.942.001.030.490.310.230.430.781.440.681.29
Table I. Analysis of Ether-Alcohol Solutions of KnownCOInpositions by Proposed Method
CorrectionValue
Read fromCurve inFigure 1
%-0.36-0.36-0.22-0.04+0.06+0.08+0.03-0.13-0.34-0.11-0.31
heat the sample rapidly (approximately 10 minutes) to incipientboiling. Then lower the heating mantle and decrease its heatuntil it is just warm enough to permit gentle refluxing of condensed vapor from the lowest bulb of the column. Replace theheating mantle and allow the distillation to proceed slowly (approximately 0.5 to 5 minutes) until the vapor temperaturereaches 52° C. Maintain the vapor temperature at 52° ='=2° C.until the distillation rate falls below 3 drops per minute and thenfor an additional 10 minutes. If the initial rate of distillationnever exceeds 3 drops per minute in the 50 0 to 54 ° C. vapor temperature range, continue the distillation within this range 20minutes from the time the vapor temperature first reached 52 0 C.
Under the foregoing conditions, a small and reasonably constant amount of alcohol, for which a correction can be applied,will be distilled. The distillation temperature is controlled chieflyby adjusting either the Variac or the air jet. It can be raisedslightly either by placing a towel around the upper half of the
APPLICATION OF METHOD
The results found when the foregoing procedure was applied toknown mixtures of ethyl ether in 2B ethyl alcohol, which contains0.5% benzene, are shown in Table I.
LITERATURE CITED
(1) Kubias, J., Chem. Obzor., 12, 5-8 (1937).(2) Masson, I., and McEwan, T. L., J. Soc. Chem. Ind., 40, 29-32T
(1921).(3) Scott, T. A., Jr., J. Phys. Chem., 50,406 (1946).(4) Shaefer, W. K, IND. ENG. CHEM., ANAL. ED.. 16.432 (1944).
RECEIVED February 9, 1947.
1,2·CYCLOHEXANEDIONE DIOXIMEA Reagent for Palladium
ROGER C. VOTER, CHARLES V. BANKS, AND HARVEY DIEHL
The Institute for AtOlnic Research and the Department of Chemistry, Iowa State College, Ames, Iowa
THE preparation of 1,2-cyclohexanedione dioxime, nioxime,. and its use in the analytical chemistry of nickel have been
reported (1, 4). Nioxime also yields an insoluble yellow compound with palladium which can be used for the detection anddetermination of this metal. This reagent offers several advantages over dimethylglyoxime as a precipitant for palladium.Nioxime is soluble in water, in contrast to dimethylglyoximewhich must be made up in alcohol or acetone, and the possibilityof contamination of the palladium precipitate with excess reagentis eliminated. Palladium nioxime is very insoluble and may befiltered from a hot solution after a brief digestion period, whereasin many procedures it is recommended that the palladium dimethylglyoxime precipitate be allowed to cool and stand forlong periods to ensure complete precipitation (2, 5). Thus the
nioxime procedure effects a great saving of time with no sacrificeof accuracy.
REAGENTS
An 0.8% aqueous solution of nioxime was used. A standardpalladium solution was prepared from commercial palladiumchloride. This salt was. purified by first precipitating outplatinum as ammonium chloroplatinate (3) and then precipitatingthe palladium as palladium dimethylglyoxime.This complex wasdestroyed with aqua regia and the solution evaporated to neardryness five times with concentrated hydrochloric acid toeliminate nitrate ions. The palladium content of the dilutedpalladium chloride solution was determined by precipitating thepalladium in weighed amounts of this solution with dimethylglyoxime. These solutions were allowed to stand overnight .toensure complete precipitation of the palladium dimethylglyoxime.
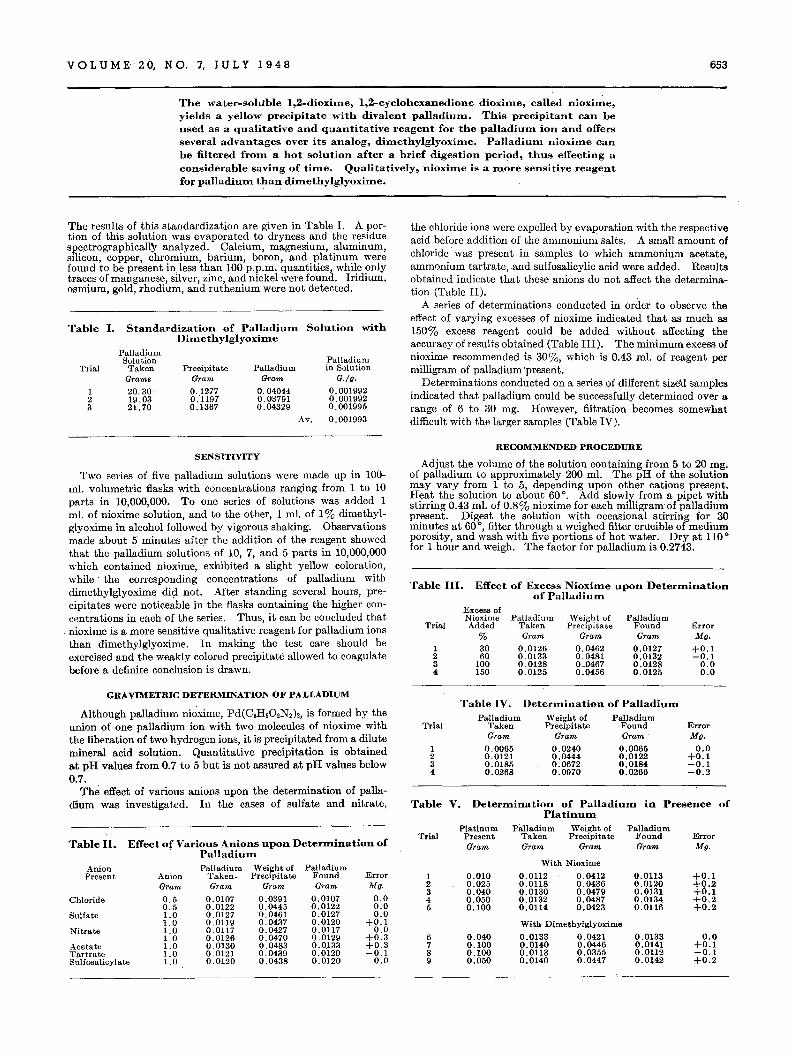
VOL U M E 20, N O. 7, J U L Y I 948
The water-soluble 1,2-dioxhne, 1,2-cyclohexanedione dioxim.e, called nioxim.e,yields a yellow precipitate with divalent palladium.. This precipitant can beused as a qualitative and quantitative reagent for the palladium. ion and offersseveral advantages over its analog, dim.ethylglyoxim.e. Palladium. nioxim.e canbe filtered from. a hot solution after a brief digestion period, thus effecting aconsiderable saving of tim.e. Qualitatively, nioxim.e is a m.ore sensitive reagentfo,.. palladium. than dim.ethylglyoxim.e.
653
The results of this standardization are given in Table 1. A portion of this solution was evaporated to dryness and the residuespe.ctrographicallY analyzed. Calcium, magnesium, aluminum,silicon, copper, chromium, barium, boron, and platinum werefound to be present in less than 100 p.p.m. quantities, while onlytraces of manganese, silver, zinc, and nickel were found. Iridium,osmium, gold, rhodium, and ruthenium were not detected.
Table I. Standardization of Palladium. Solution withDim.ethy1glyoxim.e
PalladiumSolution Palladium
Trial Taken Precipitate Palladium in SolutionGrams Gram Gram G'/g.
1 20.30' 0.1277 0.04044 0.0019922 19.03 0:1197 0.03791 0.0019923 21.70 0.1367 0.04329 0.001995
Av. 0.001993
SENSITIVITY
Two series of five palladiuni solutions were made up in 100mL volumetric flasks with concentrations ranging from 1 to 10parts in 10,000,000. To one series of solutions was added 1mL of nioxime solution, and to the other, 1 m!. of 1% dimethylglyoxime in alcohol followed by vigorous shaking. Observationsmade about 5 minutes after the addition of the reagent showedthat the palladium solutions of 10, 7, and 5 parts in 10,000,000which contained nioxime, exhibited a slight yellow coloration,while' the corresponding concentrations of palladium withdimethylglyoxime did not. After standing several hours, precipitates were noticeable in the flasks containing the higher concentrations in each of the series. Thus, it can be concluded thatnioxime is a more sensitive qualitative reagent for palladium ionsthan dimethylglyoxime. In making the test care should beexercised and the weakly colored precipitate allowed to coagulatebefore a definite conclusion is drawn.
GRAVIMETRIC DETERMINATION OF PALLADIUM
Although palladium nioxime, Pd(C.HsOzNz)z, is formed by theunion of one palladium ion with two molecules of nioxime withthe liberation of two hydrogen ions, it is precipitated from a dilutemineral acid solution. Quantitative precipitation is obtainedat pH values from 0.7 to 5 but is not assured at pH values below0.7.
The effect of various anions upon the determination of palladium was investigated. In the cases of sulfate and nitrate,
Table II. Effect of Various Anions upon Determ.ination of. Palladium.
Anion Palladium Weight of PalladiumPresent Anion Taken. Precipitate Found Error
Gram Gram Gram Gram Mg,
Chloride 0.5 0.0107 0.0391 0.0107 0.00.5 0.0122 0.0445 0.0122 0.0
Sulfate 1.0 0.0127 0.0461 0.0127 0.01.0 0.0119 0.0437 0.0120 +0.1
Nitrate 1.0 0.0117 0.0427 0.0117 0.01.0 0.0126 0.0470 0.0129 +0.3
Acetate 1.0 0.0130 0.0483 0.0.133 +0.3Tartrate 1.0 0.0121 0.0439 0.0120 -0.1Sulfosalicylate 1.0 0.0120 0.0438 0.0120 0.0
the chloride ions were expelled by evaporation with the respectiveacid before addition of the ammonium: salts. A small amount ofchloride was present in samples to which ammonium acetate,ammonium tartrate,and sulfosalicylic acid were added. Resultsobtained indicate that these anions do not affect the determination (Table II).
A series of determinations conducted in order to observe theeffect of varying excesses of nioxime indicated that as much as150% excess reagent could be added without affecting theaccuracy of results obtained (Table III). The minimum excess ofnioxime recommended is 30%, which is 0.43 mL of reagent permilligram of palladium ·present.
Determinations conducted on a series of different size'd samplesindicated that palladium could be successfully determined over arange of 6 to 30 mg. However, filtration becomes somewhatdifficult with the larger samples (Table IV).
RECOMMENDED PROCEDURE
Adjust the volume of the solution containing from 5 to 20 mg.of palladium to approximately 200 mL The pH of the solutionmay vary from 1 to 5, depending upon other cations present.Heat the solution to about 60°. Add slowly from a pipet withstirring 0.43 mL of 0.8% nioxime for each milligram of palladiumpresent. Digest the solution with occasional stirring for 30minutes at 60°, filter through a weighed filter crucible of mediumporosity, and wash with five portions of hot water. Dry at 110°for 1 hour and weigh. The factor for palladium is 0.2743.
Table III. Effect of Excess Nioxim.e upon Determ.inationof Palladium.
Excess ofNioxime Palladium Weight of Palladium
Trial Added Taken Precipitate Found Error% Gram Gram Gram Mg.
1 30 0.0126 0.0462 0.0127 +0.12 60 0.0133 0.0481 0.0132 -0.13 100 0.0128 0.0467 0.0128 0.04; 150 0.0125 0.0456 0.0125 0.0
Table IV. Determ.ination of Palladium.Palladium Weight of Palladium
Trial Taken Precipitate Found ErrorGram Gram Gram' Mg.
1 0.0065 0.0240 0.0065 0.02 0.0121 0.0444 0.0122 +0.13 0.0185 0.0672 0.0184 -0.14 0.0268 0.0970 0.0266 -0.2
Table V. Determ.ination of Palladium. in Presence ofPlatinum.
Platinum Palladium Weight of PalladiumTrial Present Taken Precipitate Found Error
Gram Gram Gram Gram Mg.
With Nioxime
1 0.010 0.0112 0.0412 0.0113 +0.12 0.025 0.0118 0.0436 0.0120 +0.23 0.040 0.0130 0.0479 0.0131 +0.14 0.050 0.0132 0.0487 0.0134 +0.25 0.100 0.0114 0.0423 0.0116 +0.2
With· Dimethylglyoxime
6 0.040 0.0133 0.0421 0.0133 0.07 0.100 0.0140 0.0446 0.0141 +0.18 0.100 0.0113 0.0355 0.0112 -0.19 0.050 0.0140 0.0447 0.0142 +0.2
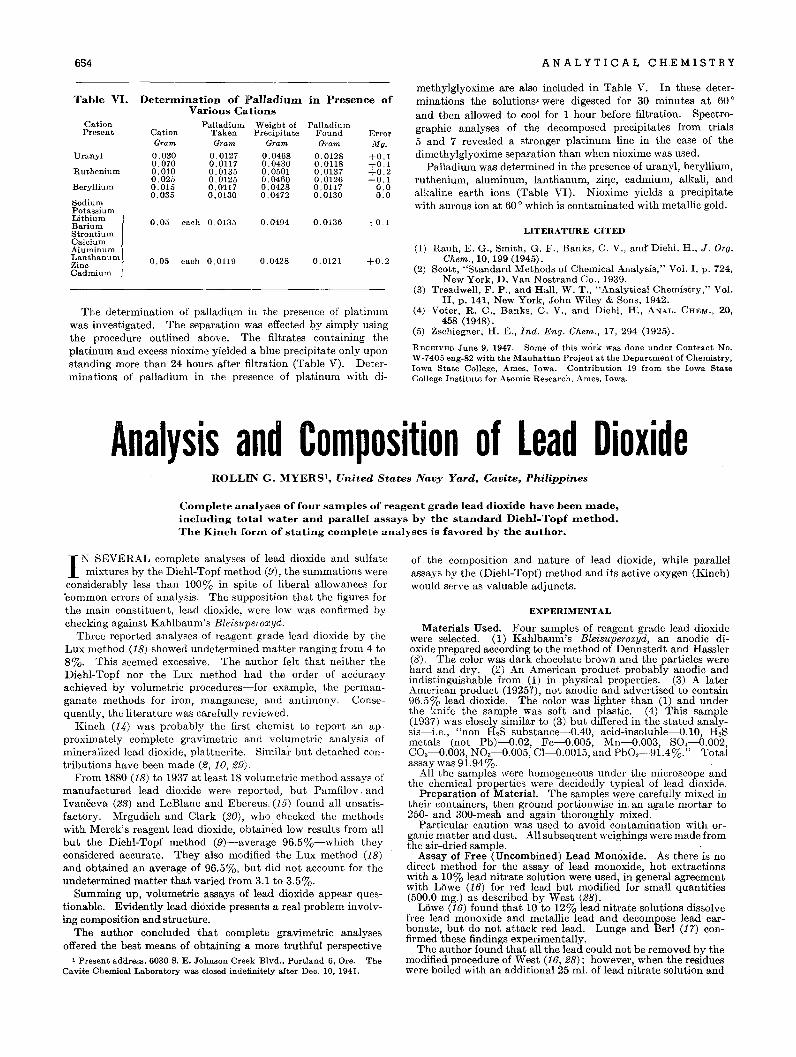
654
Table VI. DeterD:liDlltion of PalladiuID in Presence ofVarious Cations
Cation Palladium Weight of PalladiumPresent Cation Taken Precipitate Found Error
Gram Gram Gram Gram Mg.Ura,nyl 0.030 0.0127 0.0468 0.0128 +0.1
0.070 0.0117 0.0430 0.0118 +0.1Ruthenium 0.010 0.0135 0.0501 0.0137 +0.2
0.025 0.0125 0.0460 0.0126 +0.1Beryllium 0.015 0.0'117 0.0428 0.0117 0.0
0.035 0.0130 0.0472 0.0130 0.0SodiumPotassiumLithium 0.05 each 0.0135 0.0494 0.0136 +0.1BariumStrontiumCalciumAluminumLanthanum 0.05 each 0.0119 0.0428 0.0121 +0.2ZincCadmium
The determination of palladium in the presence of platinumwas investigated. The separation was effected by simply usingthe procedure outlined above. The filtrates containing theplatinum and excess nioxime yielded a blue precipitate only uponstanding more than 24 hours after filtration (Table V). Determinations of palladium in the presence of platinum with di-
A N A L Y TIC ALe HE MIS TRY
methylglyoxime are also included in Table V. In these determinations the solutions' were digested for 30 minutes at 60 0
and then allowed to cool for 1 hour before filtration. Spectrographic analyses of the decomposed precipitates from trials5 and 7 revealed a stronger platinum line in the case of thedimethylglyoxime separation than when nioxime was used.
Palladium was determined in the presence of uranyl, beryllium,ruthenium, aluminum, lanthanum, ziqc, cadmium, alkali, andalkaline earth ions (Table VI). Nioxime yields a precipitatewith aurous ion at 60 0 which is contaminated with metallic gold.
LITERATURE CITED
(1) Rauh, E. G., Smith, G. F., Banks, C. V., and' Diehl, H., J. Org.Chem., 10, 199 (1945).
(2) Scott, "Standard Methods of Chemical Analysis," Vol. I, p. 724,New York, D. Van Nostrand Co .. 1939.
(3) Treadwell, F. P., and Hall, W. T., "Analytical Chemistry," Vol.II, p. 141, New York, John Wiley & Sons, 1942.
(4) Voter, R. C., Banks, C. V., and Diehl, H~, ANAL. CHEM., 20,458 (1948).
(5) Zschiegner, H. E., Ind. Eng. Chem., 17,294 (1925).
RECEIVED June 9, 1947. Some of this work was done under Contract No.W-7405 eng-82 with the Manhattan Project at the Department of Chemistry,Iowa State College, Ames, Iowa. Contribution 19 from the Iowa StateCollege Institute for Atomic Research, Ames. Iowa.
Analysis and Composition of Lead DioxideROLLIN G. MYERS', United States Navy Yard, Cavite, Philippines
COlll.plete analyses of four salll.ples of reagent grade lead dioxide have been lll.ade,including total water and parallel assays by the standard Diehl-Topf lll.ethod.The Kinch form of stating cOlll.plete analyses is favored by the author.
I K SEVERAL complete analyses of lead dioxide and sulfatemixtures by the Diehl-Topf method (9), the summations were
considerably less than 100% in spite of liberal allowances for'common errors of analysis. The supposition that the figures forthe main constituent, lead dioxide, were low was confirmed bychecking against Kahlbaum's Bleisuperoxyd.
Three reported analyses of reagent grade lead dioxide by theLux method (18) showed undetermined matter ranging from 4 to8%. This seemed excessive. The author felt that neither theDiehl-Topf nor the Lux method had the order of accuracyachieved by volumetric procedures-for example, the permanganate methods for iron, manganese, and antimony. Consequently, the literature was carefully reviewed.
Kinch (14) was probably the first chemist to report an approximately complete gravimetric and volumetric analysis ofmineralized lead dioxide, plattnerite. Similar but detached contributions have been made (2, 10,29).
From 1880 (18) to 1937 at least 18 volumetric method assays ofmanufactured lead dioxide were reported, but Pamfilov. andIvanceva (23) and LeBlanc and Ebereus. (15) found all unsatisfactory. Mrgudich and Clark (20), who checked the methodswith Merck's reagent lead dioxide, obtained low results from allbut the Diehl-Topf method (9)-average 96.5%-which theyconsidered accurate. They also modified the Lux method (18)and obtained an average of 96.5%, but did not account for theundetermined matter that varied from 3.1 to 3.5%.
Summing up, volumetric assays of lead dioxide appear questionable. Evidently lead dioxide presents a real problem involving composition and structure.
The author concluded that complete gravimetric analysesoffered the best means of obtaining a more truthful perspective
1 Present address, 6030 S. E. Johnson Creek Blvd., Portland 6, Ore. TheCa"ite Chemical Laboratory was closed indefinitely after Dec. 10, 1941.
of the composition and nature of lead dioxide, while parallelassays by the (Diehl-Topf) method and its active oxygen (Kinch)would serve as valuable adjuncts.
EXPERIMENTAL
Materials Used. Four samples of reagent grade lead dioxidewere selected. (1) Kahlbaum's Bleisuperoxyd, an anodic dioxide prepared according to the method of Dennstedt and Hassler(8). The color was dark chocolate brown and the particles werehard and dry. (Z) An American product probably anodic andindistinguishable from (1) in physical properties. (3) A laterAmerican product (1925?), not anodic and advertised to contain96.5% lead dioxide. The color was lighter than (1) and underthe knife the sample was soft and plastic. (4) This sample(1937) was closely similar to (3) but differed in the stated analysis-i.e., "non H 2S substance--o.40, acid-insoluble--o.10, H,Smetals (not Pb)-0.02, Fe-0.005, Mn--o.003, SO,--o.002,C03-O.003, N03-O.005, CI--o.00l5, and PbO,-91.4%." Totalassay was 91.94%.
All the samples were homogeneous under the microscope andthe chemical properties were decidedly typical of lead dioxide.
Preparation of Material. The samples were carefully mixed intheir containers, then ground portionwise in.an agate mortar to250- and 300-mesh and again thoroughly mixed.
Particular caution was used to avoid contamination with organic matter and dust. All subsequent weighings were made fromthe air-dried sample. . .
Assay of Free (Uncombined) Lead Monoxide. As there is nodirect method for the assay of lead monoxide, hot extractionswith a 10% lead nitrate solution were used, in general agreementwith Lowe (16) for red lead but modified for small quantities(500.0 mg.) as described by West (28).
Lowe (16) found that 10 to 12% lead nitrate solutions dissolvefree lead monoxide and metallic lead and decompose lead carbonate, but do not attack red lead. Lunge and Berl (17) confirmed these findings experimentally.
The author found that all the lead could not be removed by themodified procedure of West (16, 28); however, when the residueswt>re boiled with an adclitional 25 ml. of lead nitrate solution and
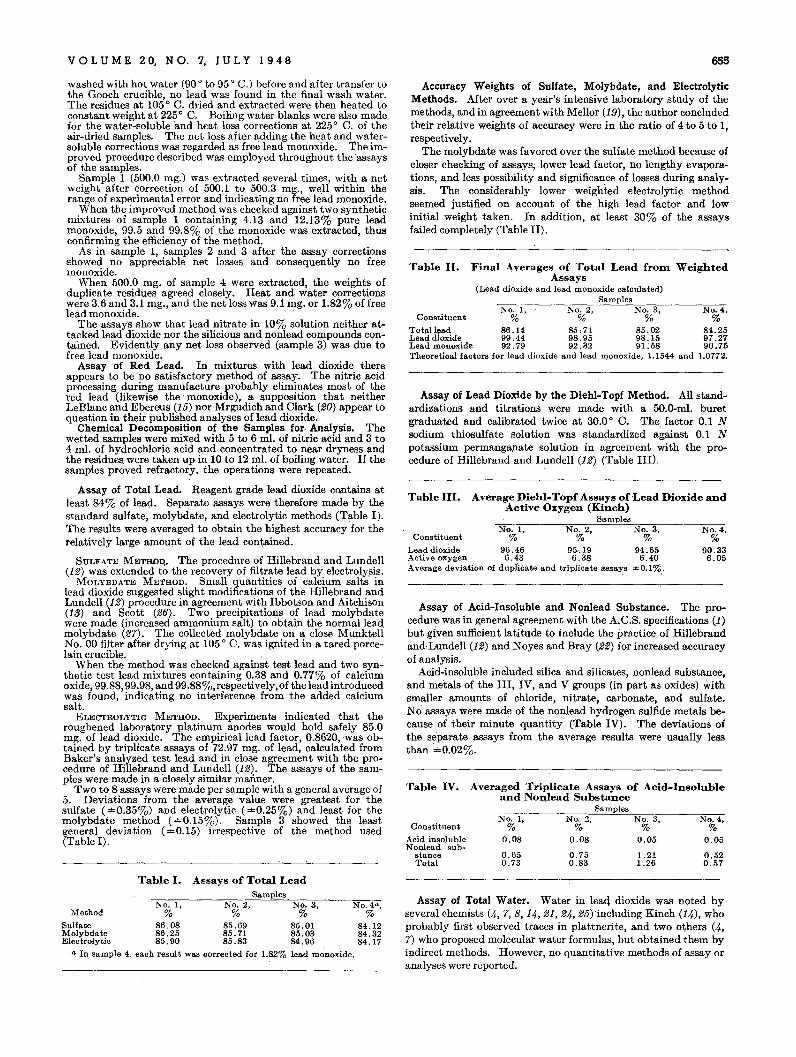
VOL U M E 20, N O. 7, J U L Y 1 948 655
Table III. Average Diehl-Topf Assays of Lead Dioxide andActive Oxygen (Kinch)
Samples
Table II. Final Averages of Total Lead froD1 WeightedAssays
(Lead dioxide and lead monoxide calculated)Samples
No. I, No.2, No.3, No.4,Con.tituent % % % %
Totallead 86.14 85,71 85.02 84.25Lead dioxide 99.44 98.95 98.15 97.27Lead monoxide 92.79 92.32 91:58 90.75Theoretical factors for lead dioxide and lead monoxide, 1.1544 and 1.0772.
Assay of Lead Dioxide by the Diehl-Topf Method. All standardizations and titrations were made with a 50.0-mI. buretgraduated and calibrated twice at 30.0 0 C. The factor 0.1 Nsodium thiosulfate solution was standardized against 0.1 Npotassium permanganate solution in agreement with the procedure of Hillebrand and Lundell (12) (Table III).
0.520.57
No.4,%
90.336.05
No.4,%
0.05
1.211.26
0.750.83
No.2, No.3,% %
0.08 0.05
No. I,%
0.08
0.650.73
Averaged Triplicate Assays of Acid-Insolubleand Nonlead Substance
Samples
No.1, No.2, No.3,Constituent % % %
Lead dioxide 96.46 95-.19 94.65Active oxygen 6.43 6.38 6.40Average deviation of duplicate and triplicate assays =0.1%.
Accuracy Weights of Sulfate, Molybdate, and ElectrolyticMethods. Mter over a year's intensive laboratory study of themethods, and in agreement with Mellor (19), the author concludedtheir relative weights of accuracy were in the ratio of 4 to 5 to I,respectively.
The molybdate was favored over the sulfate method because ofcloser checking of assays, lower lead factor, no lengthy evaporations, and less possibility and significance of losses during analysis. The considerably lower weighted electrolytic methodseemed justified on account of the high lead factor and lowinitial weight taken. In addition, at least 30% of the assaysfailed completely (Table II).
Assay of Acid-Insoluble and Nonlead Substance. The procedure was in general agreement with the A.C.S. specifications (1)but given sufficient latitude to include the practice of Hillebrandand Lundell (12) and Noyes and Bray (22) for increased accuracyof analysis.
Acid-insoluble included silica and silicates, nonlead substance,and metals of the III, IY, and V groups (in part as oxides) withsmaller amounts of chloride, nitrate, carbonate, and sulfate.No assays were made of the nonlead hydrogen sulfide metals because of their minute quantity (Table IV). The deviations ofthe separate assays from the average results were usually lessthan ±O.02%.
Constituent
Acid insolubleN onlead sub
stanceTotal
Table IV.
washed with hot water (90 0 to 95 0 C.) before and after transfer tothe Gooch crucible, no 'lead was found in the final wash water.The residues at 105 0 C. dried and extracted were then heated toconstant weight at 225 0 C. Boiling water blanks were also madefor the water-soluble 'and heat loss corrections at 225 0 C. of theair-dried samples. The net loss after adding the heat and watersoluble corrections was regarded as free lead monoxide. The improved procedure described was employed throughout the assaysof the samples.
Sample 1 (500.0 mg.) was extracted several times, with a netweight after correction of 500.1 to 500.3 mg., we,ll within therange of experimental error and indicating no free lead monoXide.
When the improved method was checked against two syntheticmixtures of sample 1 containing 4.13 and 12.13% pure leadmonoxide, 99.5 and 99.8% of the monoxide was extracted, thusconfirming the efficiency of the method.
As in sample 1, samples 2 and 3 after the assay correctionsEhowed no appreciable net losses and consequently no freemonoxide.
When 500.0 mg. of sample 4 were extracted, the weights ofduplicate residues agreed closely. Heat and water correctionswere 3.6 and 3.1 mg., and the net loss was 9.1 mg. or 1.82% of freelead monoxide.
The assays show that lead nitrate in 10% solution neither attacked lead dioxide nor the silicious and nonlead compounds contained. Evidently any net loss observed (sample 3) was due tofree lead monoxide.
Assay of Red Lead. In mixtures with lead dioXide thereappears to be no satisfactory method of assay. The nitric acidprocessing during manufacture probably eliminates most of thered lead (likewise the' monoXide), a supposition that neitherLeBlanc and Ebereus (15) nor Mrgudich and Clark (20) appear toquestion in their published analyses of lead dioxide.
Chemical Decomposition of the Samples for Analysis. Thewetted samples were mixed with 5 to 6 m!' of nitric acid and 3 to4 mI. of hydrochloric acid and concentrated to near dryness andthe residues were taken up in 10 to 12 mI. of boiling water. If thesamples proved refractory, the operations were repeated.
Assay of Total Lead. Reagent grade lead dioXide contains atleast 84% of lea<;l. Separate assays were therefore made by thestandard sulfate, molybdate, and electrolytic methods (Table I).The results were averaged to obtain the highest accuracy for therelatively large amount of the lead contained.
SULFATE METHDD.. The procedure of Hillebrand and Lundell(12) was extended to the recovery of filtrate lead by electrolY!lis.
MOLYBDATE METHOD. Small quantities of calcium salts inlead dioxide suggested slight modifications of the Hillebrand andLundell (12) procedure in agreement with Ibbotson and Aitchison(13) and Scott (26). Two precipitations of lead molybdatewere made (increased ammonium salt) to obtain the normal leadmolybdate (27). The collected molybdate on a close MunktellNo. 00 filter after drying at 105 0 C. was ignited in a tared porcelain crucible.
When the method was checked against test lead and two synthetic test lead mixtures containing 0.38 and 0.77% of calciumoxide, 99.88,99.98, and 99.88%, respectively, of the lead introducedwas found, indicating no interference from the added calciumsalt.
ELECTROLYTIC METHOD. Experiments indicated that theroughened laboratory platinum anodes would hold safely 85.0mg. of lead dioxide. The empirical lead factor, 0.8620, was obtained by triplicate assays of 72.97 mg. of lead, calculated fromBaker's analyzed test lead and in close agreement with the procedure of Hillebrand and Lundell (12). The assays of the samples were made in a closely similar maimer.
Two to 8 assays were made per sample with a general average of5. Deviations from the average value were greatest for thesulfate ("=0.35%) and electrolytic ("=0.25%) and least for themolybdate method ("=0.15%). Sample 3 showed the leastgeneral deviatioll ("=0.15) irrespective, of the method used(Table I).
Table I. Assays Qf TQtal LeadSamples
No.1. No.2, No.3, 'No.4a,M~hod % % % %
Sulfate 86.08 85.69 85.01 84.12Molybdate 86.25 85.71 85.03 84.32Electrolytic 85.90 85.83 84. 9(l 84. 17
a In sample 4, each result was corrected for 1.82% lead monoxide.
Assay of Total Water. Water in leaq dioXide was noted byseveral chemists (4, 7, 8, 14, 21, 24, 25) including Kinch (14), whoprobably first observed traces in plattnerite, and two others (4,7) who proposed molecular water formulas, but obtained them byindirect methods. However, no quantitative methods of assay oranalyses were reported.
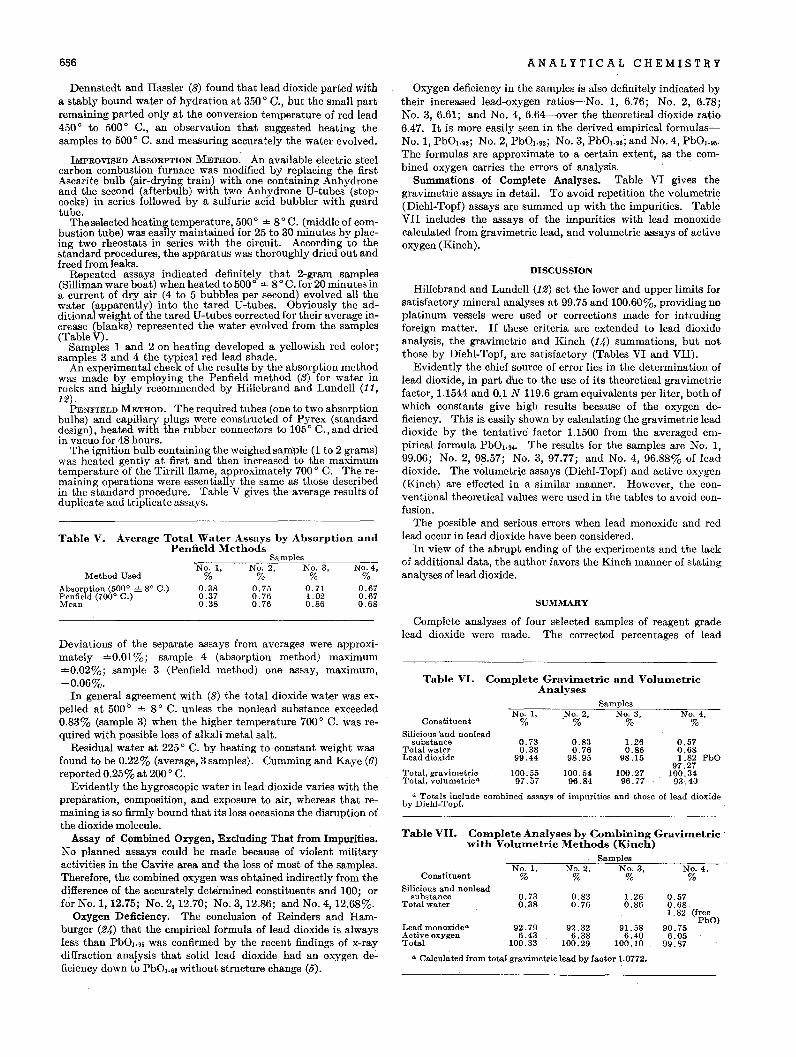
656 ANALYTICAL CHEMISTRY
Deviations of the separate assays from averages were approximately ±0.01 %; sample 4 (absorption method) maximum±0.02%; sample 3 (Penfield method) one assay, maximum,-0.06%.
In general agreement with (8) the total dioxide water was expelled at 500 0
± 8 0 C. unless the nonlead substance exceeded0.83% (sample 3) when the higher temperature 700 0 C. was required with possible loss of alkali metal salt.
Residual water at 225 0 C. by heating to constant weight wasfound to be 0.22% (average, 3 samples). Cumming and Kaye (6)reported 0.25% at 200 0 C.
Evidently the hygroscopic water in lead dioxide varies with thepreparation, composition, and exposure to air, whereas that remaining is so firmly bound that its loss occasions the disruptionofthe dioxide molecule.
Assay of C9mbined Oxygen, Excluding That from Impurities.No planned assays could be made because of violent militaryactivities in the Cavite area and the loss of most of the samples.Therefore, the combined oxygen was obtained indirectly from thedifference of the accurately determined constituents and 100; orfor No.1, 12.75; No.2, 12.70; No.3, 12.86; and No.4, 12.68%.
Oxygen Deficiency. The conclusion of Reinders and Hamburger (24) that the empirical formula of lead dioxide is alwaysless than Pb0J.95 was confirmed by the recent findings of x-raydiffraction analysis that solid lead dioxide had an oxygen de~
ficiency down t~ PbO!.66 without structure change (5).
Dennstedt and Hassler (8) found that lead dioxide parted witha stably bound water of hydration at 350 0 C., but the small partremaining parted only at the conversion temperature of red lead450 0 to 500 0 C., an observation that suggested heating thesamples to 500 0 C. and measuring accurately the water evolved.
IMPROVISED ABSORPTION METHOD. An available electric steelcarbon combustion furnace was modified by replacing the firstAscarite bulb (!tir-drying train) with one containing Anhydroneand the second (afterbulb) with two Anhydrone U-tubes (stopcocks) in series followed by a sulfuric acid bubbler with guardtube.
The selected heating temperature, 500 0 ± 8 0 C. (middle of combustion tube) was easily maintained for 25 to 30 minutes by placing two rheostats in series with the circuit. According to thestandard procedures, the apparatus was thoroughly dried out andfreed from leaks.
Repeated assays indicated definitely that 2-gram samples(Silliman ware boat) when heated to 500 0 ± 8 0 C. for 20 minutes ina current of dry air (4 to 5 bubbles per second) evolved all thewater (apparently) into the tared U-tubes. Obviously the additional weig):J.t of the tared U-tubes corrected for their average increase (blanks) represented the water evolved from the samples(Table V).
Samples 1 and 2 on heating developed a yellowish red color;samples 3 and 4 the typical red lead shade.
An experimental check of the results by the absorption methodwas made by employing the Penfield method (3) for water inrocks and highly recommended by Hillebrand and Lundell (11,12).
PENFIELD METHOD. The required tubes (one to two absorptionbulbs) and capillary plugs were constructed of Pyrex (standarddesign), heated with the rubber connectors to 105 0 C., and driedin vacuo for 48 hours.
The ignition bulb containing the weighed sample (1 to 2 grams)was heated gently at first and then increased to the maximumtemperature of the Tirrill flame, approximately 700 0 C. The remaining operations were essentially the same as those describedin the standard procedure. Table V gives the average results ofduplicate and triplicate assays.
Average Total Water Assays by Absorption andPenfield Methods
Samples
a Totals include combined assays of impurities and those of lead dioxideby Diehl-Topf.
No.4,%
No.3,%
No.2,%
No. 1.%
0.73 0.83 1.26 0.570.38 0.76 0.86 0.68
1.82 (£ree
92.79PbO)
92.32 91.58 90.756.43 6.38 6.40 6.05
100.33 100.29 100.10 99.87
CORlplete Analyses by COlllhining Gravillletricwith Volullletric Methods (Kinch)
Samples
Samples
ConstituentNo. I, .N,%2, No.3, No.4,
% % %Silicious 'and nonlead
substance 0.73 0.83 1.26 0.57Total water 0.38 0.76 0.86 0.68Lead dioxide 99.44 98.95 98.15 1.82 PbO
97.27Total, gravimetric 100.55 100.54 100.27 100.34Total, volumetrica 97.57 96.84 96.77 93.40
Lead monoxideG
Active oxygenTotal
a Calculated from total gravimetric lead by factor 1.0772.
Constituent
Silicious and nonleadsubstance
Total water
Table VII.
DISCUSSION
Hillebrand and Lundell (12) set the lower and upper limits forsatisfactory mineral analyses at 99.75 and 100.60%, providing noplatinum vessels were used or corrections made for intrudingforeign matter. If these criteria are extended to lead dioxideanalysis, the gravimetric and Kinch (14) summations, but notthose by Diehl-Topf, are satisfactory (Tables VI and VII).
Evidently the chief source of error lies in the determination oflead dioxide, in part due to the use of its theoretical gravimetricfactor, 1.1544 and 0.1 N 119.6 gram equivalents per liter, both ofwhich constants give high results because of the oxygen deficiency. This is easily shown by calculating the gravimetric leaddioxide by the tentative factor 1.1500 from the averaged empirical formula PbO!.•4. The results for the samples are No.1,99.06; No.2, 98.57; No.3, 97.77; and No.4, 96.88% of leaddioxide. The volumetr~c assays (Diehl-Topf) and active oxygen(Kinch) are effected in a similar manner. However, the conventional theoretical values were used in the tables to avoid confusion.
The possible and serious errors when lead monoxide and redlead occur in lead dioxide have been considered.
In view of the abrupt ending of the experiments and the lackof additional data, the author favors the Kinch manner of statinganalyses of lead dioxide.
Oxygen deficiency in the samples is also definitely indicated bytheir increased lead-oxygen ratios-No.1, 6.76; No.2, 6.78;No.3, 6.61; and No.4, 6.64-0ver the theoretical dioxide ratio6.47. It is more easily seen in the derived empirical formulasNo.1, PbO!.•2; No.2, PbQ!.•2; No.3, PbO!.•6·; and No.4, PbO!.•5.The formulas are approximate to a certain extent, as the combined oxygen carries the errors of analysis.
Summations of Complete Analyses. Table VI gives thegravimetric assays in detail. To avoid repetition the volumetric(Diehl-Topf) assays ar:e summed up with the impurities. TableVII includes the assays of the impurities with lead monoxidecalculated from gravimetric lead, and volumetric assays of activeoxygen (Kinch).
Table VI. COlllplete Gravillletric and VolullletricAnalyses
SUMMARY
Complete analyses of four selected samples of reagent gradelead dioxide were made. The corrected percentages of lead
No.4,%
0.670.670.68
No; 2, No.3,% %
0.75 0.710.76 1.020.76 0.86
No. I,%
0.380.370.38
Method Used
Absorption (500 0 ± 8 0 C.)Penfield (700° C.)Mean
Table V.
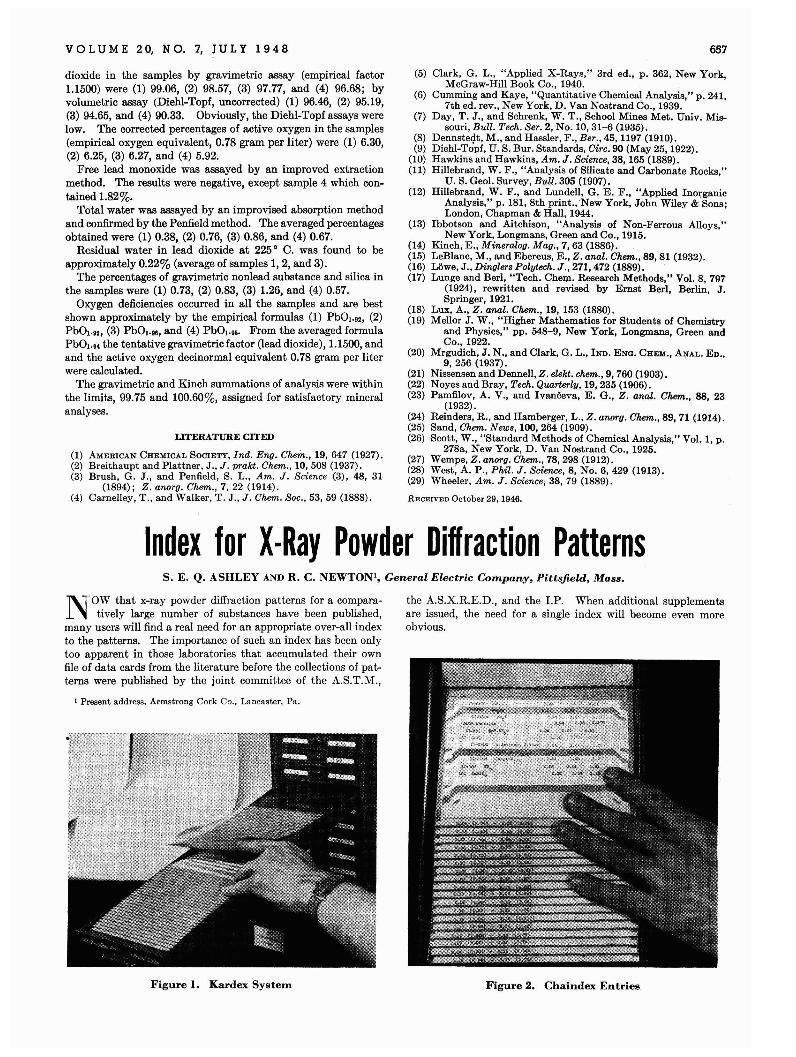
VOL U M E 2 0, N O. 7, JU L Y 1 9 4 8
dioxide in the samples by gravimetric assay (empirical factor1.1500) were (1) 99.06, (2) 98.57, (3) 97.77, and (4) 96.68; byvolumetric assay (Diehl-Topf, uncorrected) (1) 96.46, (2) 95.19,(3) 94.65, and (4) 90.33. Obviously, the Diehl-Topf assays werelow. The corrected percentages of active oxygen in the samples(empirical oxygen equivalent, 0.78 gram per liter) were (1) 6.30,(2) 6.25, (3) 6.27, and (4) 5.92.
Free lead monoxide was assayed by an improved extractionmethod. The results were negative, except sample 4 which contained 1.82%.
Total water was assayed by an improvised absorption methodand confirmed by the Penfield method. The averaged percentagesobtained were (1) 0.38, (2) 0.76, (3) 0.86, and (4) 0.67.
Residual water in lead dioxide at 225 0 C. was found to beapproximately 0.22% (average of samples 1, 2, and 3).
The percentages of gravimetric nonlead substance and silica inthe samples were (1) 0.73, (2) 0.83, (3) 1.26, and (4) 0.57.
Oxygen deficiencies occurred in all the samples and are bestshown approximately by the empirical formulas (1) PbO'.92, (2)PbO'.92, (3) Pb0lo98 , and (4) PbO,.96. From the averaged formulaPbO,.•, the tentative gravimetric factor (lead dioxide), 1.1500, andand the active oxygen decinormal equivalent 0.78 gram per literwere calculated.
The gravimetric and Kinch summations of analysis were withinthe limits, 99.75 and 100.60%, assigned for satisfactory mineralanalyses.
LITERATURE CITED
(1) AMERICAN CHEMICAL SOCIETY, Ind. Eng. Chem., 19, 647 (1927).(2) Breithaupt and Plattner, J., J. prakt. Chem., 10,508 (1937).(3) Brush, G. J., and Penfield, S. L., Am. J. Science (3), 48, 31
(1894); Z. anorg. Chem., 7, 22 (1914).(4) Carnelley, T., and Walker, T. J., J. Chem. Soc., 53, 59 (1888).
657
(5) Clark, G. L., "Applied X-Rays," 3rd ed., p. 362, New York,McGraw-Hill Book Co., 1940.
(6) Cumming and Kaye, "Quantitative Chemical Analysis," p. 241.7th ed. rev., New York, D. Van Nostrand Co., 1939.
(7) Day, T. J., and Schrenk, W. T., School Mines Met. Univ. Missouri, Bull. Tech. Ser. 2, No. 10,31-6 (1935).
(8) Dennstedt, M., and Hassler, F., Ber., 45,1197 (1910).(9) Diehl-Topf, U. S. Bur. Standards, Circ. 90 (May,25, 1922).
(10) Hawkins and Hawkins, Am. J. Science, 38, 165 (1889).(11) Hillebrand, W. F., "Analysis of Silicate and Carbonate Rocks,"
U. S. Geol. Survey, Bull. 305 (1907).(12) Hillebrand, W. F., and Lundell, G. E. F., "Applied Inorganic
Analysis," p. 181, 8th print., 'New York, John Wiley & 'Sons;London, Chapman & Hall, 1944.
(13) Ibbotson and Aitchison, "Analysis of Non-Ferrous Alloys."New York, Longmans, Green and Co., 1915.
(14) Kinch, E., Mineralog. Mag., 7, 63 (1886). ,(15) LeBlanc, M., and Ebereus, E., Z. anal. Chem., 89, 81 (1932).(16) Lowe, J., Ding/ers Polytech. J., 271, 472 (1889).(17) Lunge and Berl, "Tech. Chem. Research Methods," Vol. 8, 797
(1924), rewritten and revised by Ernst Berl, Berlin, J.Springer, 1921.
(18) Lux, A., Z. anal. Chem., 19, 153 (1880).(19) Mellor J. W., "Higher Mathematics for Students of Chemistry
and Physics," pp. 548-9, New York, Longmans, Green andCo., 1922.
(20) Mrgudich, J. N., and Clark, G. L., IND. ENG. CHEM., A~AL. ED.,9, 256 (1937).
(21) Nissensen and Dennell, Z. elekt. chem., 9, 760 (1903).(22) Noyes and Bray, Tech. Quarterly, 19, 235 (1906).(23) Pamfilov, A. V., and Ivanceva, E. G., Z. anal. Chem., 88, 23
(1932).(24) Reinders, R., and Hamberger, L., Z. anorg. Chem., 89, 71 (1914).(25) Sand, Chem. News, 100, 264 (1909).(26) Scott, W., "Standard Methods of Chemical Analysis," Vol. 1, p.
278a, New York, D. Van Nostrand Co., 1925.(27) Wempe, Z.anorg. Chem., 78, 298 (1912).(28) West; A. P., Phil. J. Science, 8, No.6, 429 (1913).(29) Wheeler, Am. J. Science; 38, 79 (1889) ..
RECEIVED October 29, 1946.
Index for X-Ray Powder Diffraction PatternsS. E. Q. ASHLEY AND R. C. NEWTON', General Electric Company, Pittsfield, Mass,
N0~ that x-ray powder diffraction patterns for a co~para
tlvely large number of substances have been published,many users will find a real need for an appropriate over-all indexto the patterns. The importance of such an index has been onlytoo apparent in those laboratories that accumulated their ownfile of data cards from the literature before the collections of patterns were published by the joint committee of the A.S.T.M.,
1 Present address, Armstrong Cork Co., Lancaster, Pa.
Figure 1. .Kardex System
the A.S.X.R.E.D., and the I.P. When additional supplementsare issued, the need for a single index will become even moreobvious.
Figure 2. Chaindex Entries.
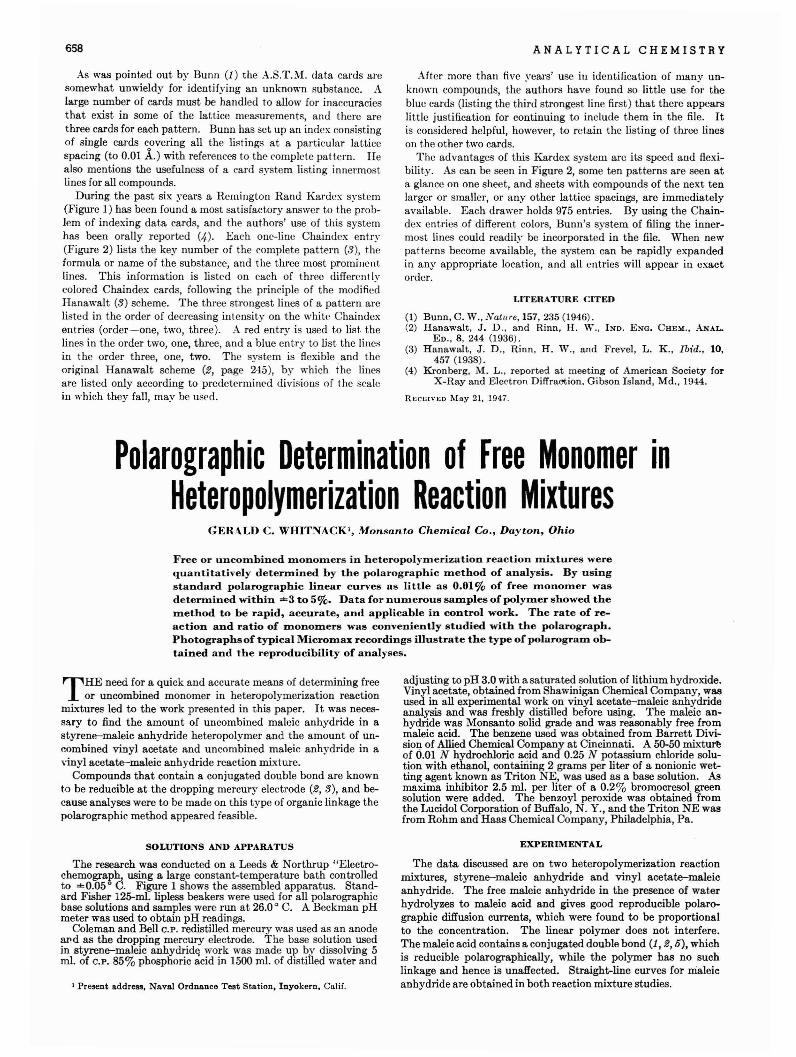
658
As was pointed out by Bunn (1) the A.S.T.;\-!. data cards aresomewhat unwieldy for ident.ifying an unknown substance. Alarge number of cards must be handled to allow for inaccuraciesthat exist in some of the lattice measurements, and there arethree cards for each pattern. Bunn has set up an index consistingof single cards covering all the listings at a particular latticespacing (to 0.01 .A.) with references to the complete pattern. Healso mentions the usefulness of a card system listing innermostlines for all compounds.
During the past six years a Remington Rand Karuex system(Figure 1) has been found a most satisfactory answer to the problem of indexing data cards, and the authors' use of this systemhas been orally reported (.~). Each one-line Chaindex entry(Figure 2) lists the key number of the complete pattern (3), theformula or name of the substance, and the three most prominentlines. This information is listed on each of three differen t Iycolored Chaindex cards, following thc principle of the modifiedHanawalt (3) scheme. The three strongest lines of a pattern arelisted in the order of decreasing intensity on the whitt' Chaindexentries (order-one, two, three). A red entry is used to list thelines in the order two, one, three, and a blue entry to list the line~
in the order three, one, two. The system is flexible and theoriginal Hanawalt scheme (2, page 245), by which the linesare listed only according to predetermined divisions of the scalein which they fall, may be used.
ANALYTICAL CHEMISTRY
After more than five ~'ears' use in identification of many unknown compounds, t,he authors have found so little use for theblue cards (listing the third strongest line first) that there appearslittle justification for continuing to include them in the file. Itis considered helpful, however, to retain the listing of three lineson the other two cards.
The advantages of this Kardex system are its speed and flexibility. As can be seen in Figure 2, some ten patterns are seen ata glance on one sheet, and sheets with compounds of the next tenlarger or smaller, or any other lattice spacings, are immediatelyavailable. Each drawer holds 975 entries. By using the Chaindex entries of different colors, Bunn's system of filing the innermost lines could readily be incorporated in the file. When newpatterns become available, the system can be rapidly expandedin any appropriate location, and all entries will appear in exactorder.
LITERATURE CITED
(1) Bunn, C. W., Natllre, 157, 235 (1946).(2) Hanawalt, J. D., and Rinn, H. W., IND. ENG. CHEM., AN.~L.
ED., 8, 244 (936).(3) Hanawalt, J. D., Rinn, H. W., and Frevel, L. K., Ibid., 10,
457 (1938).(4) Kronberg, M. L., reported at meeting of American Society for
X-Ray and Electron Diffraotion. Gibson Island, Md., 1944.
RECEIVED May 21, 1947.
Polarographic Determination of Free Monomer inHeteropolymerization Reaction Mixtures
GERALD C. WHITNACKI, Monsanto Chemical Co., Dayton, Ohio
Free or uncombined DlonODlers in heteropolymerization reaction Dlixtures werequantitatively determined by the polarographic Dlethod of analysis. By usingstandard polarographic linear curves as little as 0.61% of free monomer wasdetermined within =3 to 5%. Data for nUDlerous samples of polymer showed themethod to be rapid, accurate, and applicable in control work. The rate of reaction and ratio of Dlonomers was conveniently studied with the polarograph.Photographs of typical Micromax recordings illustrate the type of polarogram obtained and the reproducibility of analyses.
T HE need for a quick and accurate means of determining freeor uncombined monomer in heteropolymerization reaction
mixtures led to the work presented in this paper. It was necessary to find the amount of uncombined maleic anhydride in astyrene-maleic anhydride heteropolymer and the amount of uncombined vinyl acetate and uncombined maleic anhydride in avinyl acetate-maleic anhydride reaction mixture.
Compounds that contain a conjugated double bond are knownto be reducible at the dropping mercury electrode (2, 3), and because analyses were to be made on this type of organic linkage thepolarographic method appeared feasible.
SOLUTIONS AND APPARATUS
The research was conducted on a Leeds & Northrup "Electrochemograph, using a large constant-temperature bath controlledto =0.05 0 C. Figure 1 shows the assembled apparatus. Standard Fisher 125-ml. lipless beakers were used for all polarographicbase solutions and samples were run at 26.0 0 C. A Beckman pHmeter was used to obtain pH readings.
Coleman and Bell C.P. redistilled mercury was used as an anodeaJ'ld as the dropping mercury electrode. The base solution usedin styrene-maleic anhydridE; work was made up by dissolving 5m!. of C.P. 85% phosphoric acid in 1500 ml. of distilled water and
1 Present address, Naval Ordnance Test Station, Inyokern, Calif.
adjusting to pH 3.0 with a saturated solution of lithium hydroxide.Vinyl acetate, obtained from Shawinigan Chemical Company, wasused in all experimental work on vinyl acetate-maleic anhydrideanalysis and was freshly distilled before using. The maleic anhydride was Monsanto solid grade and was reasonably free frommaleic acid. The benzene used was obtained from Barrett Division of Allied Chemical Company at Cincinnati. A 50-50 mixtur~
of 0.01 N hydrochloric acid and 0.25 N potassium chloride solution with ethanol, contairiing 2 grams per liter of a nonionic wetting agent known as Triton NE, was used as a base solution. AI!maxima inhibitor 2.5 ml. per liter of a 0.2% bromocresol greensolution were added. The benzoyl peroxide was obtained fromthe Lucidol Corporation of Buffalo, N. Y., and the Triton NE wasfrom Rohm and Haas Chemical Company, Philadelphia, Pa.
EXPERIMENTAL
The data discussed are on two heteropolymerization reactionmixtures, styrene-maleic anhydride and vinyl acetate-maleicanhydride. The free maleic anhydride in the presence of waterhydrolyzes to maleic acid and gives good reproducible polarographic diffusion currents, which were found to be proportionalto the concentration. The linear polymer does not interfere.The maleic acid contains a conjugated double bond (1, 2, 5), whichis reducible polarographically, while the polymer has no suchlinkage and hence is unaffected. Straight-line curves for maleicanhydride are obtained in both reaction mixture studies.
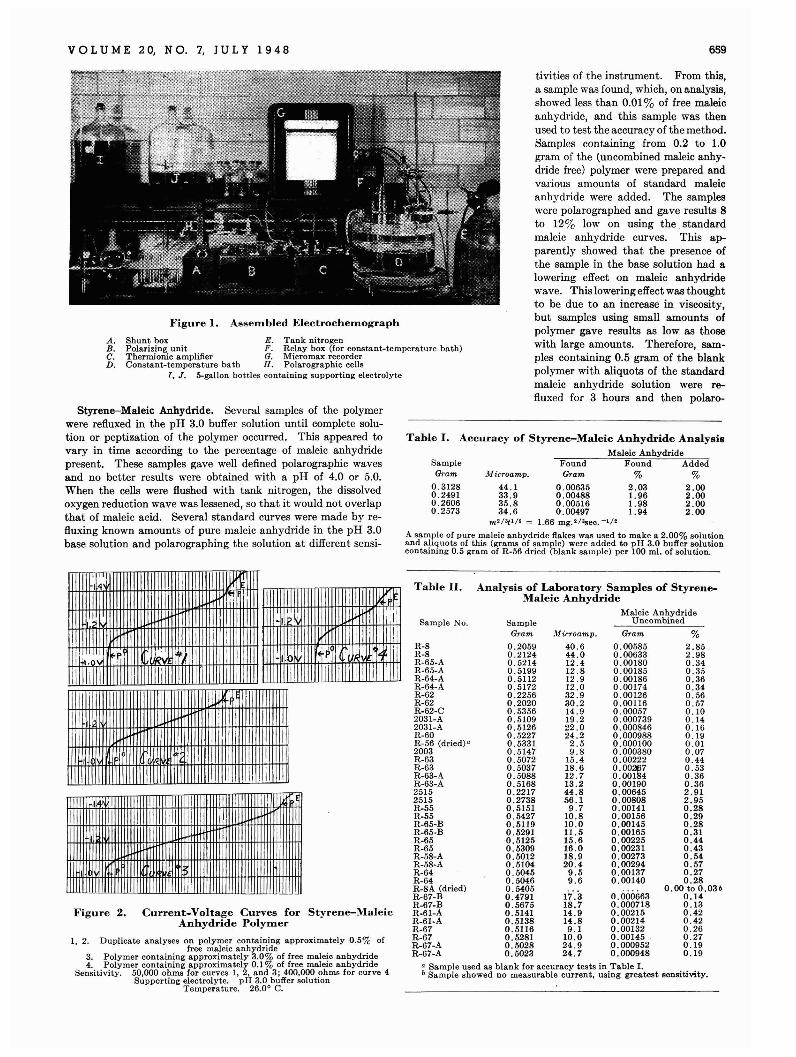
VOL U M E 20, NO.7, J U L Y 1 948 659
Table I. Accurac,· of Styrene-Maleic Anhydride AnalysisMaleic Anhydride
Found Added% %
2.03 2.001.96 2.001.98 2.001.94 2.00
FoundGram
tivities of the instrument. From this,a sample was found, which, on a.nalysis,showed less than 0.01 % of free maleicanhydride, and this sample was thenused to test the accuracy of the method.Samples containing from 0.2 to 1.0gram of the (uncombined maleic anhydride free) polymer were prepared andvarious amounts of standard maleicanhydride were added. The sampleswere polarographed and gave results 8to 12% low on using the. standardmaleic anhydride curves. This apparently showed that the presence ofthe sample in the base solution had alowering effect on maleic anhydridewave. This lowering effect was thoughtto be due to an increase in viscosity,but samples using small amounts ofpolymer gave results as low as thosewith large amounts. Therefore, samples containing 0.5 gram of the blankpolymer with aliquots of the standardmaleic anhydride solution were refluxed for 3 hours and then polaro-
MicToamp.SampleGram
0.31280.24910.26060.2573
44.1 0.0063533.9 0.0048835.8 0.0051634.6 0.00497
m'I'f.'/' = 1.66 mg.'I'sec. -II'
A sample of pure maleic anhydride flakes was used to make a 2.00% solutionand aliquots of this (grams of sample) were added to pH 3.0 buffer solutioncontaining 0.5 gram of R-56 dried (blank sample) per 100 mi. of solution.
Figure 1. Assembled Electrochemograph
A. Shunt box E. Tank nitrogenB. Polarizing unit P. Relay box (for constant-temperature bath)C. Thermionic amplifier G. Micromax recorderD. Constant-temperature bath H. Polarographic cells
T. J. 5-gallon bottles containing supporting electrolyte
Styrene-Maleic Anhydride. Several samples of the polymerwere refluxed in the pH 3.0 buffer solution until complete solution or peptization of the polymer occurred. This appeared tovary in time a.ccording to the percentage of maleic anhydridepresent. These samples gave well defined polarographic wavesand no better results were obtained with a pH of 4.0 or 5.0.When the cells were flushed with tank nitrogen, the dissolvedoxygen reduction wave was lessened, so that it would not overlapthat of maleic acid. Several standard curves were made by refluxing known amounts of pure maleic anhydride in the pH 3.0base solution and polarographing the solution at different sensi-
Figure 2. Current-Voltage Curves for Styrene-MaleicAnhydride Polymer
1, 2. Duplicate analyses on polymer containing approximately 0.5% offree maleic anhydride
3. Polymer containing approximately 3.0% of free maleic anhydride4. Polymer containing approximately 0.1 % of free maleic anhydride
Sensitivity. 50,000 ohms for curves 1,2, and 3; 400,000 ohms for curve 4Supporting electrolyte. pH 3.0 buffer solution
Temperature. 26.0° C.
-- I I
~EI
~ ~
-~',I
I I I I
Iii,· .nv r "" , -1.0 '4p
1IIIIilii II III I III1II
I I 1I
I II ! I
rl'
I·
II III1II
j 1
Table II. Analysis of Laboratory Samples of Styrene-::\Ialeic Anhydride
Maleic AnhydrideSample No. Sample Uncombined
Gram .1l1irroamp. Gram %R-8 0.2059 40.6 0.00585 2.85R-8 0.2124 44.0 0.00633 2.98R-65-A 0.5214 12.4 0.00180 0.34R-65-A 0.5199 12.8 0.00185 0.35R-64-A 0.5112 12.9 0.00186 0.36R-64-A 0.5172 12.0 0.00174 0.34R-62 0.2256 32.9 0.00126 0.56R-62 0.2020 30.2 0.00116 0.57R-62-C 0.5356 14.9 0.00057 0.102031-A 0.5109 19.2 0.000739 0.142031-A 0.5126 22.0 0.000846 0.16R-60 0.5227 24.2 0.000988 0.19R-56 (dried)" 0.5331 2.5 0.000100 0.012003 0.5147 9.8 0.000380 0.07R-63 0.5072 15.4 0.00222 0.44R-63 0.5037 18.6 0.00~7 0.53R-63-A 0.5088 12.7 0.00184 0.36R-63-A 0.5168 13.2 0.00190 0.362515 0.2217 44.8 0.00645 2.912515 0.2738 56.1 0.00808 2.95R-55 0.5151 9.7 0.00141 0.28R-55 0.5427 10.8 0.00156 0.29R-65-B 0.5119 10.0 0.00145 0.28R-65-B 0.5291 11.5 0.00165 0.31R-65 ·0.5125 15.6 0.00225 0.44R-65 0.5309 16.0 0.00231 0.43R-58-A 0.5012 18.9 0.00273 0.54R-58-A 0.5104 20.4 0.00294 0.57R-64 0.5045 9.5 0.00137 0.27R-64 0.5046 9.6 0.00140 0.28R-8A (dried) 0.5405
0.0006630.00 to 0.03b
R-67-B 0.4791 17.3 0.14R-67-B 0.5675 18.7 0.000718 0.13R-61-A 0.5141 14.9 0.00215 0.42R-61-A 0.5138 14.8 0.00214 0.42R-67 0.5116 9.1 0.00132 0.26R-67 0.5281 10.0 0.00145 0.27R-67-A 0.5028 24.9 .0.000952 0.19R-67-A 0.5023 24.7 0.000948 0.19
a Sample used as blank for accuracy tests in Table 1.b Sample showed no measurable current, using greatest sensitivity.
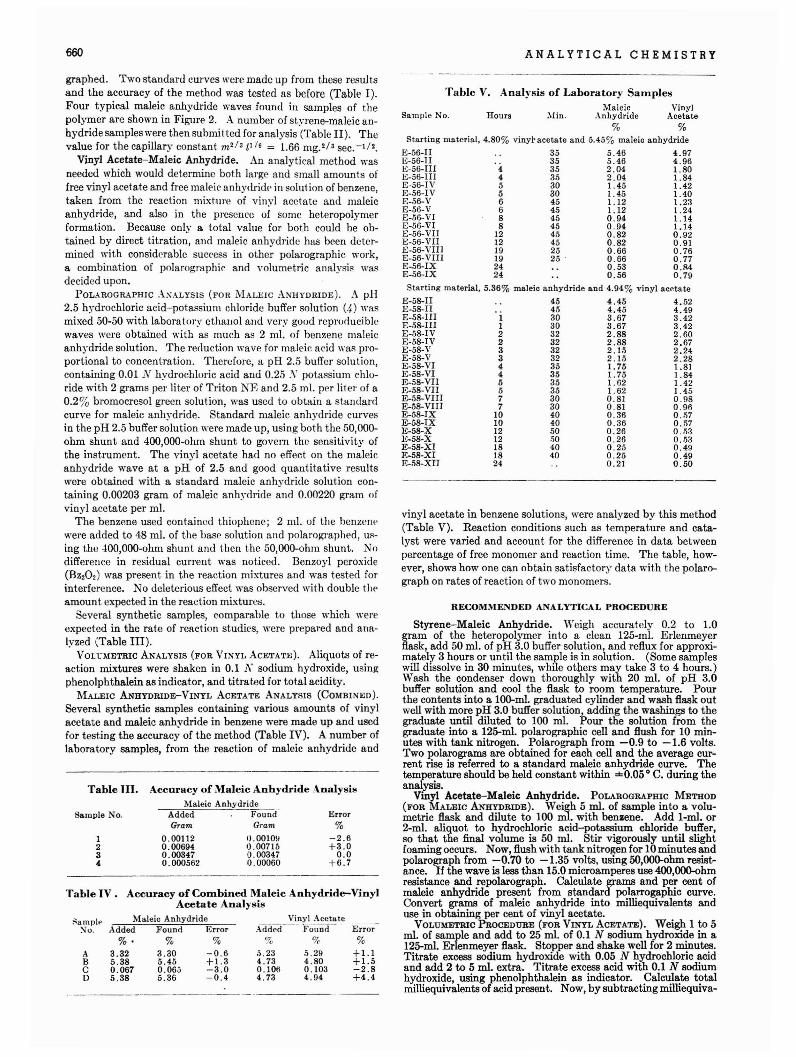
660 ANALYTICAL CHEMISTRY
-----_ .. _--
Table Tn. Accuracy of Maleic Anhydride AnalysisMaleic Anhydride
Sample No. Added Found ErrorGram Gram %
I 0.00112 O.OOIOY -2.62 0.00694 1).007l5 +3.03 0.00347 0.00347 0.04 0.000562 0.00060 +6.7
4.524.493.423.422.602.672.242.281.811.841.421.450.980.960.570.570.530.530.490.490.50
4.454.453.673.672.882.882.152.15I. 751.75I. 62I. 620.810.810.360.360.260.260.250.250.21
4545303032323232353535353030404050.';04040
1I2233445577
10101212181824
------ ._-------------
E-58-IIE-58-IIE-58-IIlE-S8-IIIE-58-IVE-58-IVE-58-VE-58-VE-58-VIE-58-VIE-58-VIIE-58-VIIE-5B-VIIIE-58-VIIlE-58-IXE-58-IXE-58-XE-58-XE-58-XIE-58-XIB-58-XII
RECOMMENDED ANALYTICAL PROCEDURE
Styrene-Maleic Anhydride. Weigh accurately 0.2 to 1.0gram of the heteropolymer into a clean 125-ml. Erlenmeyerflask, add 50 ml. of pH 3.0 buffer solution, and reflux for approximately 3 hours or until the sample is in solution. (Some sampleswill dissolve in 30 minutes, while others may take 3 to 4 hours.)Wash the condenser down thoroughly with 20 ml. of pH 3.0buffer solution and cool the flask to room temperature. Pourthe contents into a 1QO-ml. graduated cylinder and wash flask outwell with more pH 3.0 buffer solution, adding the washings to thegraduate until diluted to 100 ml. Pour the solution from thegraduate into a 125-ml. polarographic cell and flush for 10 minutes with tank nitrogen. Polarograph from -0.9 to -1.6 volts.Two polarograms are obtained for each cell and the average current rise is referred to a standard maleic anhydride curve. Thetemperature should be held constant within ±0.05° C. during theanalysis.
Vinyl Acetate-Maleic Anhydride. POLAROGRAPIDC METHOD(FOR MALEIC ANHYDRIDE). Weigh 5 ml. of sample into a volumetric flask and dilute to 100 ml. with benaene. Add 1-ml. or2-ml. aliquot to hydrochloric acid-potassium chloride buffer,so that the final volume is 50 ml. Stir vigorously until slightfoaming occurs. Now, flush with tank nitrogen for 10 minutes andpolarograph from -0.70 to -1.35 volts, using 5O,()()()..ohm resistance. If the wave is less than 15.0 microamperes use 4OO,QOO-ohmresistance and repolarograph. Calculate ~ams and per cent ofmaleic anhydride present from standard polarrogaphic curve.Convert grams of maleic anhydride into milliequivalents anduse in obtaining per cent of vinyl acetate.
VOLUMETRIC PROCEDURE (FOR VINYL ACETATE). Weigh 1 to 5ml. of sample and add to 25 ml. of 0.1 N sodium hydroxide in a125-ml. Erlenmeyer flask. Stopper and shake well for 2 minutes.Titrate excess sodium hydroxide with 0.05 N hydrochloric acidand add 2 to 5 ml. extra. Titrate excess acid with 0.1 N sodiumhydroxide, using phenolphthalein as indicator. Calculate totalmilliequivalents of acid present. Now, by subtracting milliequiva-
Table V. Analysis of Laboratory SamplesMaleic Vinyl
Sample No. Hours :\-Iin. Anhydride Acetate
% %Starl.ing material, 4.80% viny~acetate and 5.45% maleic anhydride
E-56-II 35 5.46 4.97E-56-II 35 5.46 4.96(':-56-II1 4 35 2.04 I. 80E-56-II1 4 35 2.04 I. 84E-56-IV 5 30 1.45 1.42E-56-IV 5 30 I. 45 1.40E-56-V 6 45 I. 12 1. 23E-56- V 6 45 I. 12 I. 24E-56-VI 8 45 0.94 1.14E-56-VI 8 45 0.94 1.14E-56- VII 12 45 0.82 0.92E-56-VII 12 45 0.82 0.91E-56-VIII 19 25 0.66 0.76E-56-VIIl 19 25' 0.66 0.77E-56-IX 24 0.53 0 .84E-56-IX 24 0.56 0.79
Starting material, 5.36% maleic anhydride and 4.94% vinyl acetate
vinyl acetate in benzene solutions, were analyzed by this method(Table V). Reaction conditions such as temperature and catalyst were varied and account for the difference in data betweenpercentage of free monomer and reaction time. The table, however, shows how one can obta.in satisfactory data with the polarograph on rates of reaction of t.wo monomers.
Error
%+1.1+1.5-2.8+4.4
5.294.800.1034.94
Found
%
Vinyl AcetateAdder!
%5.234.730.1064.73
ABCD
Table IV. Accuracy of Combined Maleic Anhydride-VinylAcetate Analysi!;,
i:ample Maleic Anhydride~o. Added Founr! Error
%. % %
3.32 3.30 -0.65.38 5.45 +1.30.067 0.06.; -3.05.38 5.36 -0.4
graphed. Two standard ern-ves were made up from thcse resultsand the accrn-acy of the method was tested as before (Table I).Four typical maleic anhydride waves found in samples of thepolymer are shown in Figure 2. A number of styrene-maleic anhydride samples were then submitted for analysis '(Table II). Thevalue for the capillary constant m'/' t1 / 6 = 1.66 mg.'l. sec. -II•.
Vinyl Acetate-Maleic Anhydride. An analytical method wasneeded which would determinc both large and small amounts offree vinyl acetate and free maleic anhy(lridr in solution of benzene,taken from the reaction mixt,lII'e of vinyl acetate and maleicanhydride, and also in the prescnce of some heteropolymerformation. Because only a total value for bot.h could be obtained by direct titration, and maleic anhydride has been determined with considerable success in other polarographic work,a combination of polarographic and volumetric analysis wasdecided upon.
POLAROGRAPHIC .\XALYSIS (FOR MALJ;IC ANHYDRIDE). A pH2.5 hydrochloric acid-potassium chloride buffer solution (·0 wasmixed 50-50 with laboratory ethanol and very good reproduciblewaves were obtained with as much as 2 ml. of benzene maleicanhydride solution. The reduction wave for maleic add was proportional to concentration. Therefore, a pH 2.5 buffer solution,containing 0.01 N hydrochloric acid and 0.25 :\' potassium chluride with 2 grams per liter of Triton NE and 2.5 ml. prr lit.rr of a0.2% bromocresol green solution, was used to obtain a standardcurve for maleic anhydride. Standard maleic anhydride curvesin the pH 2.5 buffer solution were made up, using both the 50,000ohm shunt and 400,000-ohm shunt to govern the sensitivity ofthe instrument. The vinyl acetate had no effect on the maleicanhydride wave at a pH of 2.5 and good quantitative resultswere obtained with a standard maleic anhydride solution containing 0.00203 gram of maleic anhyrlride and 0.00220 gram ofvinyl acetate per ml.
The benzene used cont.ained thiophene; 2 1111. of the henzenpwere added to 48 ml. of the base solution and polarographed, using the 400,000-ohll1 shunt and tben the 50,000-ohm shunt. Nodifferencc in residual current was noticed. Benzoyl peroxide(Bz.O.) was present in the reaction mixtures and was tested forinterference. No deleterious effect was observed with double thl'amount expected in the reaction mixtures.
Several synthetic samples, comparable to those which wereexpected in the rate of reactiun st.udies, were prepared and analyzed (Table III).
VOLl:METRIC ANALYSIS (FOR VINYL ACETATE). Aliquots of reaction mixtures were shaken in 0.1 1.; sodium hydroxide, usingphenolphthalein as indicator, and titrated for total acidity.
MALEIC ANHYDRIDE-VINYL ACETATE ANALYSIS (COMBINED).Several synthetic samples containing various amounts of vinylacetate and maleic anhydride in benzene were made up and usedfor testing the accuracy of the method (Table IV). A number oflaboratory samples, from the reaction of maleic anhydride and
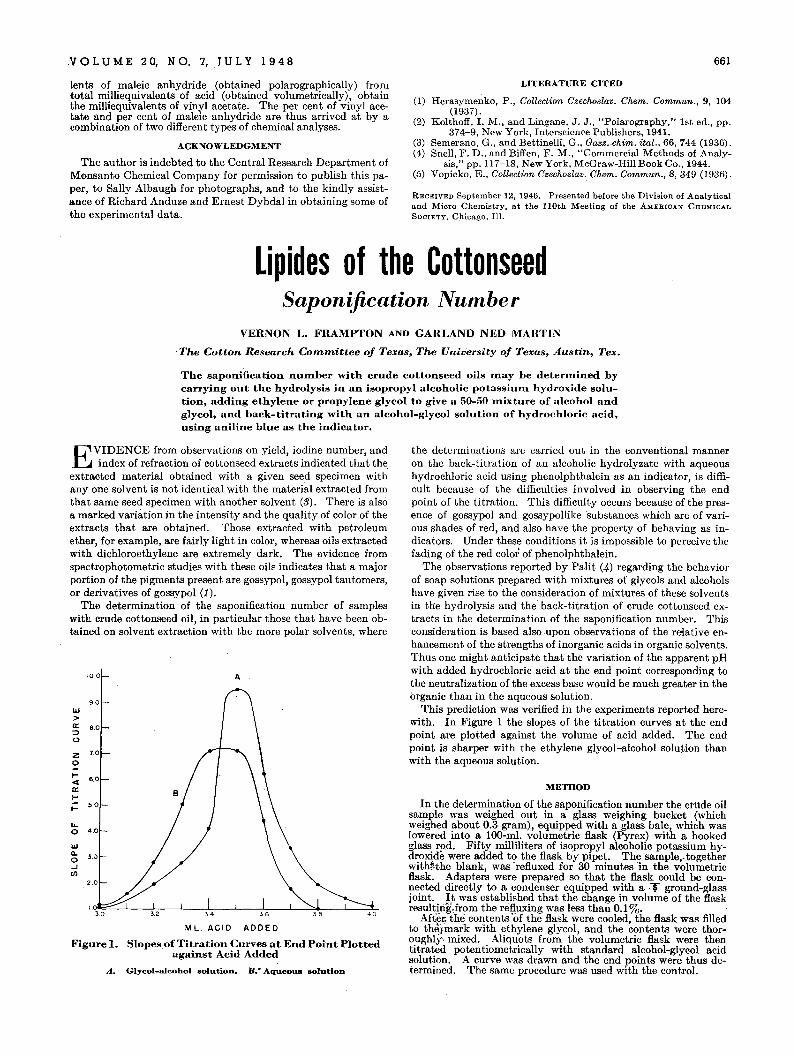
·V 0 L U M E 2 0, N O. 7, J U L Y 1 94 8
Lents of maleic anhydride (obtained polarographically) fromtotal milliequivalents of acid (obtained volumetrically), obtainthe milliequivalents of vinyl acetate. The per cent of vinyl acetate and per cent of maleic anhydride are thus arrived at by acombination of two different types of chemical analyses.
ACKNOWLEDGMENT
The author is indebted to the Central Research Department ofMonsanto Chemical Company for permission to publish this paper, to Sally Albaugh for photographs, and to the kindly assistance of Richard Anduze and Ernest Dybdal in obtaining some ofthe experimental data.
661
LITERATURE CITED
(I) Rerasymenko, P., Collection Czechoslav. Chem. Commun., 9, 104(1937).
(2) Kolthoff, 1. M., and Lingane, J. J., "Polarography," 1st ed., pp.374-9, New York, Interscien~ePublishers, 1941.
(3) Semerano, G., and Bettinelli, G., Gazz..chim. ital., 66, 744 (1936).(4) Snell, F. D., and Biffen, F. M., "Commercial Methods of Analy
sis," pp. 117-18, New York, McGraw-Hill Book Co., 1944.(5) Vopieko, E., Collection Czechoslav. Chem. Commun., 8, 349 (1936).
RECEIVED September 12, 1946. Presented before the Division of Analyticaland Micro Chemistry, at the HOth Meeting of the AMERICAN CHEMICALSOCIETY, Chicago. Ill.
Lipides of the CottonseedSaponification Number
VERNON L. FRAMPTON AND GARLAND NED MARTIN
.The Cotton Research Conunittee of Texas, The University of Texas, Austin, Tex.
The saponification nUInher with crude cottonseed oils Inay he deterInined hycarrying out the hydrolysis in an isopropyl alcoholic potassiuIn hydroxide solution, adding ethylene or propylene glycol to give a 50-50 Inixture of alcohol andglycol, and hack-titrating with an alcohol-glycol solution of hydrochloric acid,using aniline hlue as the indicator.
EVIDENCE from observations OIl yield, iodine number, andindex of refraction of cottonseed extracts indicated that the
extracted material obtained with a given seed specimen withanyone solvent is not identical with the material extracted fromthat same seed specimen with another solvent (3). There is alsoa marked variation in the intensity and the quality of color of theextracts that are obtained. Those extracted with petroleumether, for example, are fairly light in color, whereas oils extractedwith dichloroethylene are extremely dark. The evidence fromspectrophotometric studies with these oils indicates that a majorportion of the pigments present are gossypol, gossypol tautomers,or derivatives of gossypol (1).
The determination of the saponification number of sampleswith crude cottonseed oil, in particular those that have been obtained on solvent extraction with the more polar solvents, where
10.0 A
90W>0: 8.0=>0
Z 7.0
~t- 6.0<0:...i-
5.0
u.0 4.0
W(l.
3.00.J(/)
2.0
ML. ACID ADDED
Figure 1. SlopesofTitration Curves at End Point Plottedagainst Acid Added
A.. Glycol-alcohol 8olution. B .. Jf Aqueous solution
the determinations are carried out.in the conventional manneron the back-titration of an alcoholic hydrolyzate with aqueoushydrochloric acid using phenolphthalein as an indicator, is difficult because of the difficulties involved in observing the endpoint of the titration. This difficulty occurs because of the presence of gossypol and gossypollike 'substances which are of various shades of red, and also have the property of behaving as indicators. Under these conditions it is impossible to perceive thefading of the red color of phenolphthalein.
The observations reported by Palit (4) regarding the behaviorof soap solutions prepared with mixtures of glycols and alcoholshave given rise to the consideration of mixtures of these solventsin the hydrolysis and the back-titration of crude cottonseed extracts in the determination of the saponification number. Thisconsideration is based also.upon observations of the rl~ative enhancement of the strengths of inorganic acids in organic solvents.Thus one might anticipate that the variation of the apparent pHwith added hydrochloric acid at the end point corresponding tothe neutralization of the excess base would be much greater in theorganic than in the aqueous solution.
This prediction was verified in the experiments reported herewith. In Figure 1 the slopes of the titration curves at the endpoint are plotted against the volume of acid added. The endpoint is sharper with the ethylene glycol-alcohol solution thallwith the aqueous solution.
METHOD
In the determination of the saponification number the ctude oilsample was weighed out in a glass weighing bucket (whichweighed about 0.3 gram), equipped with a glass bale, which waslowered into a 100-mI. volumetric flask (Pyrex) with a hookedglass rod. Fifty milliliters of isopropyl alcoholic potassium hydroxide were added to the flask by pipet. The sample,. togetherwitMthe blank, was refluxed for 30 minutes in the volumetricflask. Adapters were prepared so that the flask could be connected directly to a condenser equipped with aT ground-glassjoint. It was established that the change in volume of the flaskresultirig,from the refluxing was less than 0.1 %.Af~r.th~ contEmts'of the flask were cooled, the flask was filled
to thei"mark with ethylene glycol, and the contents were thoroughly. mixed. Aliquots from the volumetric flask were thentitrated potentiometrically with standard alcohol-glycol acidsolution. A curve was drawn and the end points were thus determined. The same procedure was used with the control.
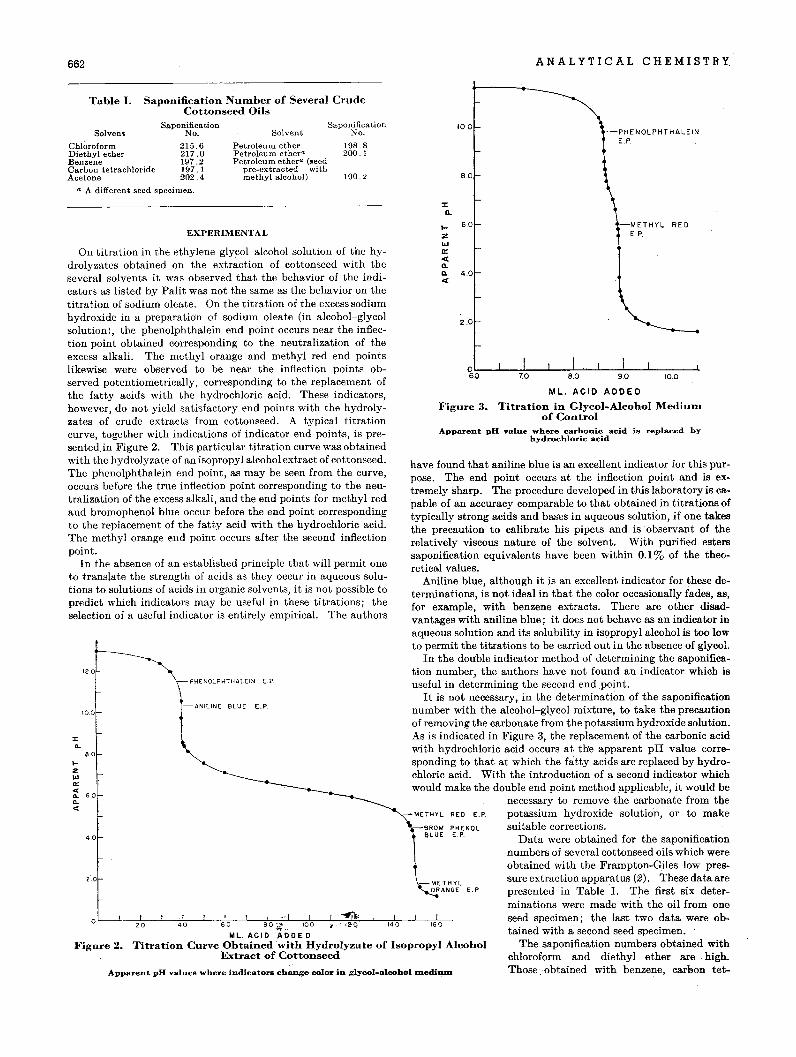
662 A N A L Y TIC ALe HEM 1ST R Y.
Table I. Saponification Number of Several CrudeCottonseed Oils
SaponificationSolvent No.
Chloroform 215.6Diethyl ether 217.0Benzene 197.2Carbon tetrachloride 197. 1Acetone 202.4
a A different seed specimen.
SaponificationSolvent No.
Petroleum ether 198.8Petroleum ethera 200.1Petroleum ethera (seed
pre-extracted withmethyl alcohol) 190.2
:r0.
10.0
S.O
-PHENOLPHTHALEINE.P.
-METHYL REDE.P.
6.0
4.0
2.0
IZUJa::<[0.0.<[
Apparent: pH value where carbonie acid is replaced byhydrochloric acid
ML. ACID ADDED
Figure 3. Titration in Glycol-Alcohol Mediulllof Control
BROM PHENOLSLUE E.P.
-METHYLORANGE E.P
have found that aniline blue is an excellent indicator for this purpose. The end point occurs at the inflection point and is extremely sharp. The procedure developed in this laboratory is capable of an accuracy comparable to that obtained in titrations oftypically strong acids and bases in aqueous solution, if one takesthe precaution to calibrate his pipets and is observant of therelatively viscous nature of the solvent. With purified esterssaponification equivalents have been within 0.1 % of the theoretical values.
Aniline blue, although it is an excellent indicator for these determinations, is not ideal in that the color occasionally fades, as,for example, with benzene extracts. There are other disadvantages with aniline blue; it does not behave as an indicator inaqueous solution and its solubility in isopropyl alcohol is too lowto permit the titrations to be carried out in the absence of glycol.
In the double indicator method of determining the saponification number, the authors have not found an indicator which isuseful in determining the second endpoint.
It is not necessary, in the determination of the saponificationnumber with the alcohol-glycol mixture, to take the precautionof removing the carbonate from the potassium hydroxide solution.As is indicated in Figure 3, the replacement of the carbonic acidwith hydrochloric acid occurs at th"e apparent pH value corresponding to that at which the fatty acids are replaced by hydrochloric acid. With the introduction of a second indicator whichwould make the double end point method applicable, it would be
necessary to remove the carbonate from thepotassium hydroxide solution, or to makesuitable corrections.
Data were obtained for the saponificationnumbers of several cottonseed oils which wereobtained with the Frampton-Giles low pressure extraction apparatus (2). These data arepresented in Table I. The first six determinations were made with the oil from oneseed specimen; the last two data were obtained with a second seed specimen.
The saponification numbers obtained withchloroform and diethyl ether are high.Those obtained with benzene, carl90n tet-
-METHYL RED E.P.
-ANILINE BLUE L?
- PHENOLPHTHALEIN CP.
Apparent; pH values where indica1:ors change color in glycol-alcohol m.edi~
L---.J,_--;:lI,__---L--7�~--.i--!'O·,__-L-~_:7-·.LI____,"'I~--.it-·-~~'s_.:-~...,.,JI::--L_-,f;!c-o 20 40 60 BO.'1:t.. 100 '12:q: 140 160
ML. ACIP APPE 0Titration Curve Obtained with Hydrolyzate of Isopropyl Alcohol
Extract of Cottonseed
4.0
eo
12.0
Figure 2.
....z
'"'"etQ. 6_0G-et
EXPERIMENTAL
On titration in the ethylene glycol-alcohol solution of the hydrolyzates obtained on the extraction of cottonseed with theseveral solvents it was observed that the behavior of the indicators as listed by Palit was not the same as the behavior on thetitration of sodium oleate. On the titration of the excess sodiumhydroxide in a preparation of sodium oleate (in alcohol-glycolsolution), the phenolphthalein end point occurs near the inflection point obtained corresponding to the neutralization of theexcess alkali. The methyl orange and methyl red end pointslikewise were observed to be near the inflection points observed potentiometrically, corresponding to the replacement ofthe fatty acids with the hydrochloric acid. These indicators,however, do not yield satisfactory end points with the hydrolyzates of crude extracts from cottonseed. A typical titrationcurve, together with indications of indicator end points, is presented.in Figure 2. This particular titration curve was obtainedwith the hydrolyzate of an isopropyl alcohol extract of cottonseed.The phenolphthalein end point, as may be seen from the curve,occurs before the true inflection point corresponding to the neutralization of the excess alkali, and the end points for methyl redand bromophenol blue occur before the end point correspondingto the replacement of the fatty acid with the hydrochloric acid.The methyl orange end point occurs after the second inflectionpoint.
In the absence of an established principle that will permit oneto translate the strength of acids as they occur in aqueous solutions to solutions of acids in organic solvents, it is not possible topredict which indicators may be useful in these titrations; theselection of a useful indicator is entirely empirical. The authors
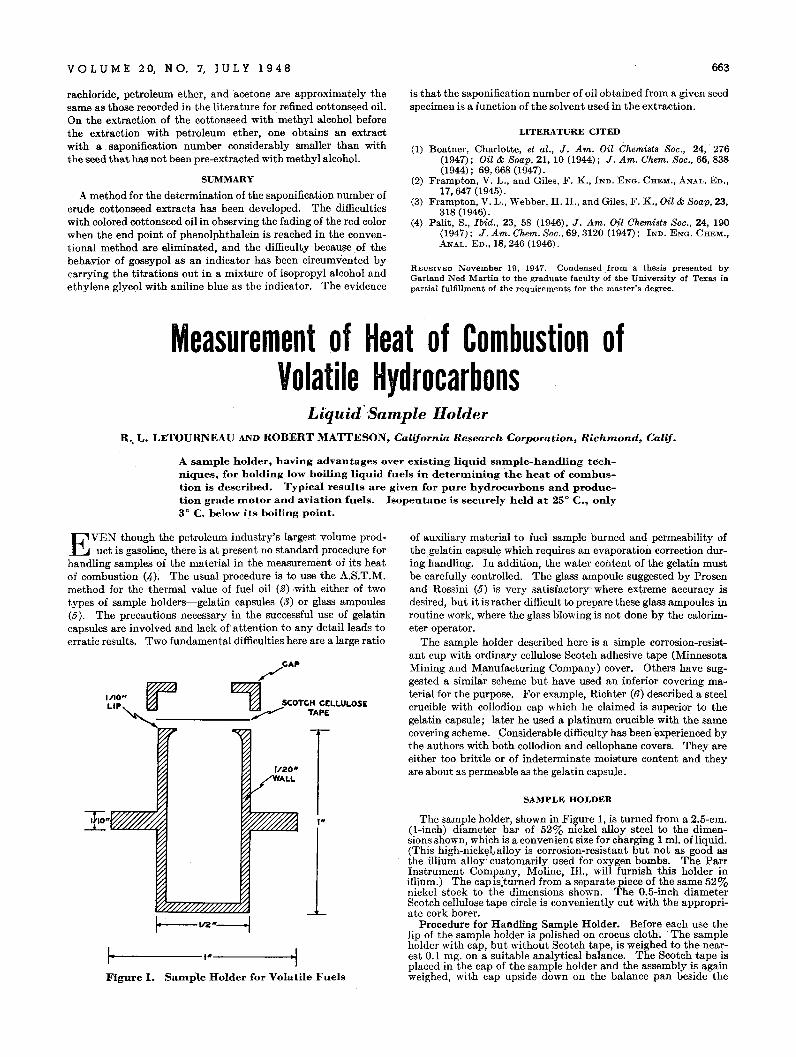
VOL U M E 20, N O. 7, J U L Y I 9 4 8
rachloride, petroleum ether, and acetone are approximately thesame as those reoorded in the literature for refined cottonseed oil.On the extraction of the cottonseed with methyl alcohol beforethe extraction with petroleum ether, one obtains an extractwith a saponification number considerably smaller than withthe seed that has not been pre-extracted with methyl alcohol.
SUMMARY
A method for the determination of the saponification number ofcrude cottonseed extracts has been developed. The difficultieswith colored cottonseed oil in observing the fading of the red colorwhen the end point of phenolphthalein is reached in the conventional method are eliminated, and the difficulty becaw;e of thebehavior of gossypol as an indicator has been circumvented bycarrying the titrations out in a mixture of isopropyl alcoholandethylene glycol with aniline blue as the indicator. The evidence
663
is that the saponification ilUmber of oil obtained from a given seedspecimen is a function of the solvent used in the extraction.
LITERATURE CITED
(1) Boatner, Charlotte, et al., J. Am. Oil Chemists Soc., 24, - 276(1947); Oil & Soap, 21, 10 (1944); J. Am. Chem. Soc., 66, 838(1944); 69,668 (1947).
(2) Frampton, V. L., and Giles, F. K., IND. ENG. CHEM., ANAL. ED.,
17,647 (1945).(3) Frampton, V. L., Webber, H. H., and Giles, F. K., Oil & Soap, 23,
318 (1946).(4) Palit, S., Ibid., 23, 58 (1946), J. Am. Oil Chemists Soc., 24, 190
(1947); J. Am. Chem. Soc., 69, 3120 (1947); IND. ENG. CHEM.,
ANAL. ED., 18, 246 (1946).
RECEIVED November 19, 1947. Condensed from a thesis presented byGarland Ned Martin to the graduate faculty of the University of Texas inpartial fulfillment of the requirements for the master's degree.
Measurement of Heat of Combustion ofVolatile Hydrocarbons
Liquid'Sample HolderR .. L. LETOURNEAU AND ROBERT MATTESON, California Research Corporation, Richmond, Calif.
A sample holder, having advantages over existing liquid sample-handling techniques, for holding low boiling liquid fuels in determining the heat of combustion is described. Typical results are given for pure hydrocarbons and production grade motor and aviation fuels, Isopentane is securely held at 25° C., only3° C. below its boiling point.
EVEN though the petroleum industry's largest volume product is gasoline, there is at present no standard procedure for
handling samples of the material in the measurement of its heatof combustion (4)~ The usual procedure is to use the A.8.T.M.method for the thermal value of fuel oil (2) -with either of twotypes of sample holders-gelatin capsules (3) or glass ampoules(5). The precautions necessary in the successful use of gelatincapsules are involved and lack of' attention to any detail leads toerratic results. Two fundamental difficulties here are a large ratio
/GAP
1t./I10p'~'~ ~~ ~ SCOTCH Gtt.I.Ut.OSE______~ TAPE
'"
110-'-1/2"----11-·----,.----,.,Figure 1. Sample Holder for 'Volatile Fuels
of auxiliary material to fuel sample burned and permeability ofthe gelatin capsule which requires an evaporation correction during handling. In addition, the water content of the gelatin mustbe carefully controlled. The glass ampoule suggested by Prosenand Rossini (5) is very satisfactory"where extreme accuracy isdesired, but it is rather difficult to prepare these glass ampoules \nroutine work, where the glass blowing is not done by the calorimeter operator.
The sample holder described here is a simple corrosion-resistant cup with ordinary cellulose Scotch adhesive tape (MinnesotaMining and Manufacturing Company) cover. Others have suggested a similar scheme but have used an inferior covering material for the purpose. For example, Richter (6) described a steelcrucible with, collodion cap which he claimed is superior to thegelatin capsule; later he used a platinum crucible with the samecovering scheme. Considerable difficulty has been 'experienced bythe authors with both collodion and cellophane covers. They areeither too brittle or of indeterminate moisture content and theyare about as permeable as the gelatin capsule.
SAMPLE HOLDER
The sample holder, shown in Figure I, is turned from a 2.5-cm.(I-inch) diameter bar of 52% nickel alloy steel to the dimensions shown, which is a convenient size forcharging 1 mi. of liquid.(This high-nickE)l,alloy is corrosion-resistant but not as good asthe iIlium alloy customarily used for oxygen bombs. The ParrInstrument Company, Moline, III., will furnish this holder inillium.) The capis;turned from a separate piece of the same 52%nickel stock to the dimensions shown. The O.5-inch diameterScotch cellulose tape circle is conveniently cut with the appropriate cork borer.
Procedure for Handling Sample Holder. Before each use thelip of the sample holder is polished on crocus cloth. 'The sampleholder with cap, but without Scotch tape, is weighed to the nearest 0.1 mg. on a suitable analytical balance. The Scotch tape isplaced in the cap of the sample holder and the assembly is againweighed, with cap upsid!J down on the balance pan beside the
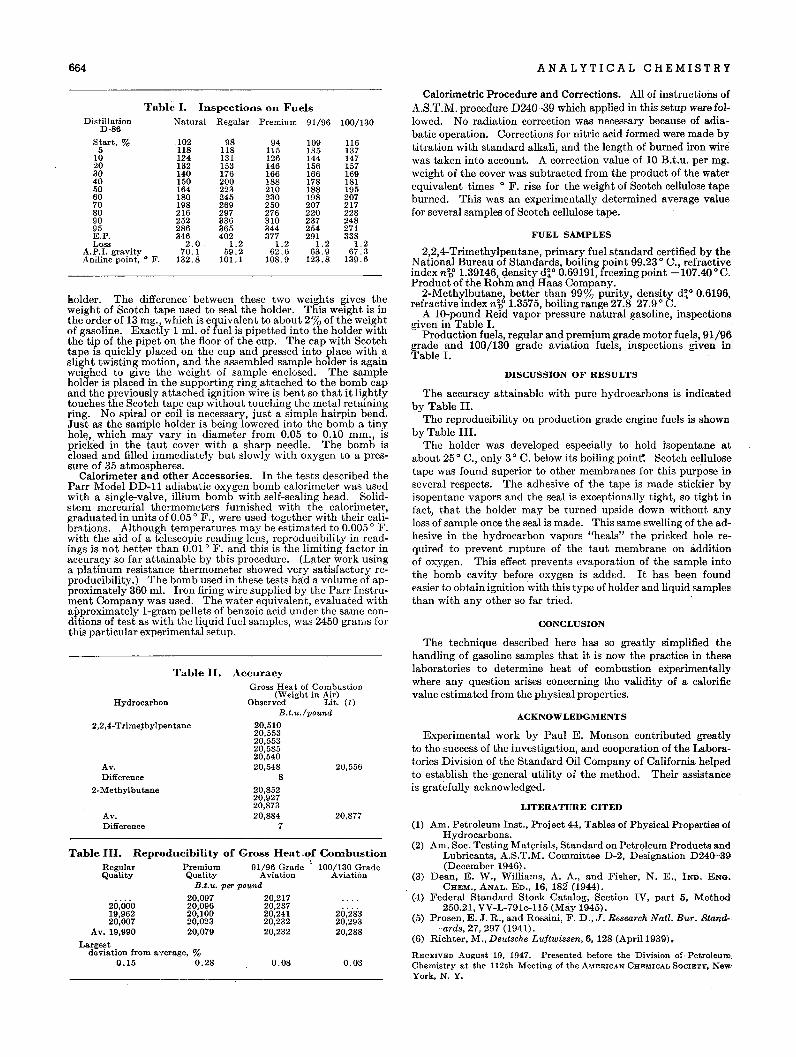
ACKNOWLEDGMENTS
Experimental work by Paul E. Monson contributed greatlyto the success of the investigation, and cooperation of the Laboratories Division of the Standard Oil Company of California helpedto establish the general utility of the method. Their assistanceis gratefully acknowledged.
LITERATURE CITED
AN A L Y TIC ALe HEM I ST R Y
RECEIVED August 19, 1947. Presented before the Division of Petroleum,Chemistry at the 112th Meeting of the AMERICAN CHEMICAL SOCIETY, New'York, N. Y.
(1) Am. Petroleum Inst., Project 44, Tables of Physical Properties 01Hydrocarbons.
(2) Am. Soc. Testing Mat\lrials, Standard on Petroleum Products andLubricants, A.S.T.M. Committee D-2, Designation D24G-39(December 1946).
(3) Dean, E. W., Williams, A. A., and Fisher, N. E., INn. ENG.CHEM., ANAL. En., 16, 182 (1944).
(4) Federal Standard Stock Catalog, Section IV, part 5, Method250.21, VV-L-791c-1l5 (May 1945).
(5) Prosen, E. J. R., and Rossini, F. D., J. Research Natl. Bur. Stand. ards, 27, 297 (1941).
(6) Richter, M., Deutsche Luftwissen, 6, 128 (April 1939) •
CONCLUSION
The technique described here has so greatly simplified thehandling of gasoline samples that it is now the practice in theselaboratories to determine heat of combustion experimentallywhere any question arises concerning the validity of a calorificvalue estimated from the physical properties.
DISCUSSION OF RESULTS
The accuracy attainable with pure hydrocarbons is indicatedby Table II.
The reproducibility on production grade engine fuels is shownby Table III.
The holder was developed especially to hold isopentane atabout 25 0 C., only 3 0 C. below its boiling point': Scotch cellulosetape was found superior to other membranes for this purpose inseveral respects. The adhesive of the tape is made stickier byisopentane vapors and the seal is exceptionally tight, so tight infact, that the holder may be turned upside down without anyloss of sample once the seal is made. This same swelling of the adhesive in the hydrocarbon vapors "heals" the pricked hole required to prevent rupture of the taut membrane on additionof oxygen. This effect prevents evaporation of the sample intothe bomb cavity before oxygen is added. It has been foundeasier to obtain ignition with this type of holder and liquid samplesthan with any other so far tried.
Calorimetric Procedure and Corrections. All of instructions ofA.S.T.M. procedure D24D-39 which applied in this setup werefollowed. No radiation correction was necessary because of adiabatic operation. Corrections for nitric acid formed were made bytitration with standard alkali, and the length of burned iron wirewas taken into account. A correction value of 10 B.t.u. per mg.weight of the cover was subtracted from the product of the waterequivalent times 0 F. rise for the weight of Scotch cellulose tapeburned. This was an experimentally determined average valuefor several samples of Scotch cellulose tape.
FUEL SAMPLES
2,2,4-Trimethylpentane, primary fuel standard certified by theNational Bureau of Standards, boiling point 99.23 0 C., refractiveindex nb" 1.39146, c;l.ensity d~o 0.69191, freezing point -107.40 ° C.Product of the Rohm and Haas Company.
2-Methylbutane, better than 99% purity, density d;o 0.6196,refractive index nbc 1.3575, boiling range 27.8-27.9° C.
A 100pound Reid vapor pressure natural gasoline, inspectionsgiven in Table I.
Production fuels, regular and premium grade motor fuels, 91/96grade and 100/130 grade aviation fuels, inspections given inTable I.
0.03
20,28320,29320,288
0.08
AccuracyGross Heat of CombustioD
(Weight in Air)Observed Lit. (1)
B.t.u';pound
20,51020,55320,55320,58520,54020,548 20,556
8
20,85220,92720,87320,884 20,877
7
Hydrocarbon
Table II.
Av.Difference
2,2,4-Trime~hylpentane
Av.Difference
2-Methylbutane
20:00019,96220,007
Av. 19,990
Largestdeviation from average, %
0.15 0.28
664
Table I. Inspections on FuelsDistillation Natural Regular Premium 91/96 100/130
0-86
Start, % 102 98 94 109 1165 118 118 115 135 137
10 124 131 126 144 14720 132 153 146 156 15730 140 176 166 166 16940 150 200 188 178 18150 164 223 210 188 19560 180 245 230 198 20770 198 269 250 207 21780 216 297 276 220 22890 252 336 310 237 24895 286 365 344 254 271E.P. 346 402 377 291 338Loss 2.0 1.2 1.2 1.2 1.2
A.P.I. gravity 70.1 59.2 62.6 63.9 67.3Aniline point, 0 F. 132.8 101.1 108.9 123.8 139.6
Table III. Reproducibility of Gross Heat,of COIubustionRegular Premium 91/96 Grade ' 100/130 GradeQuality Quality Aviation Aviation
B.t.u. per pound
20,097 20,21720,096 20,23720,100 20,24120,023 20,23220,079 20,232
Rolder. The difference' between these two weights gives theweight of Scotch tape used to seal the holder. This weight is inthe order of 13 mg., which is equivalent to about 2% of the weightof gasoline. Exactly 1 ml. of fuel is pipetted into the holder withthe tip of the pipet on the floor of the cup. The cap with Scotchtape is quickly placed on the cup and pressed into place with aslight twisting motion, and the assembled sample holder is againweighed to give the weight of sample enclosed. The sampleholder is placed in the supporting ring attached to the bomb capand the previously attached ignition wire is bent so that it lightlytouches the Scotch tape cap without touching the metal retainingring. No spiral or coil is necessary, just a simple hairpin bend.Just as the sample holder is being lowered into the bomb a tinyhole, which may vary in diameter from 0.05 to 0.10 mm., ispricked in the taut cover with a sharp needle. The bomb isclosed and filled immediately but slowly with oxygen to a pressure of 35 atmospheres.
Calorimeter and other Accessories. In the tests described theParr Model DD-ll adiabatic oxygen bomb calorimeter was usedwith a single-valve, iIlium bomb with self-sealing head. Solidstem mercurial thermometers furnished with the calorimeter,graduated in units of 0.05 0 F., were used together with their calibrations. Although temperatures may be estimated to 0.005 0 F.with the aid of a telescopic reading lens, reproducibility in readings is not better than 0.01 0 F. and this is the limiting factor inaccuracy so far attainable by this procedure. (Later work usinga platinum resistance thermometer showed very satisfactory reproducibility.) The bomb used in these tests had a volume of approximately 360 ml. Iron firing wire supplied by the Parr Instrument Company was used. The water equivalent, evaluated withapproximately I-gram pellets of benzoic acid under the same conditions of test as with the liquid fuel samples, was 2450 grams forthis particular experimental setup.
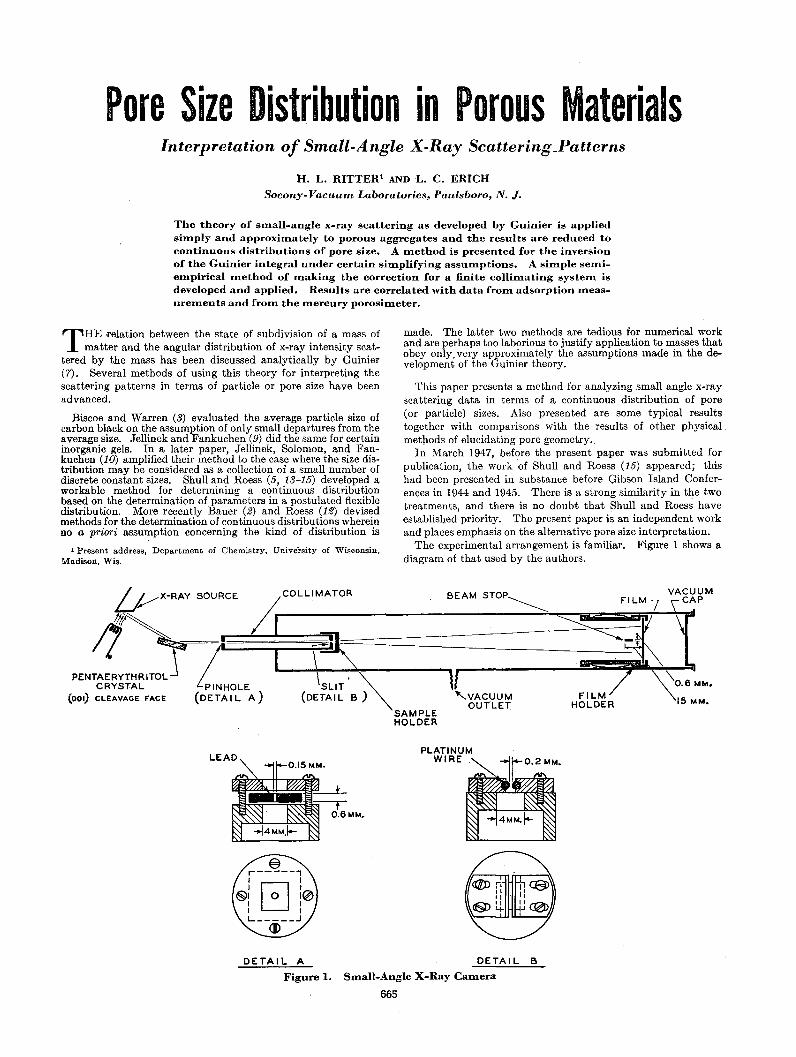
Pore Size Distribution in Porous MaterialsInterpretation of Small-Angle X-Ray Scattering_Patterns
H. L. IUTTERl AND L. C. ERICHSocony-Vacuurn Laboratories, Paulsboro, N. J.
The theory of sIllall-angle x-ray scattering as developed by Guinier is appliedsiIllply and approxiIllately to porous aggregates and the results are reduced tocontinuous distributions of pore size. A Illethod is presented for the inversionof the Guinier integral under certain siIllplifying assuInptions. A siInple seInieInpirical Inethod of Inaking the correction for a finite colliInating systeIn isdeveloped and applied. Results are correlated with data frOIn adsorption IneasureInents and froIn the Inercury porosillleter.
T HE relation between the state of subdivision of a mass ofmatter and the angular distribution of x-ray intensity scat
tered by the mass has been discussed analytically by Guinier(7). Several methods of using this theory for interpreting thescattering patterns in terms of particle or pore size have beenadvanced.
Biscoe and Warren (3) evaluated the average particle size ofcarbon black on the assumption of only small departures from theaverage size. Jellinek and Fankuchen (9) did the same for certaininorganic gels. In a later paper, Jellinek, Solomon, and Fankuchen (10) amplified their method to the case where the size distribution may be considered as a collection of a small number ofdiscrete constant sizes. Shull and Roess (5, 13-15) developed aworkable method for determining a continuous distributionbased on the determination of parameters in a postulated flexibledistribution. More recently Bauer (£?) and Roess (1£?) devisedmethods for the determination of continuous distributions whereinno a priori assumption concerning the kind of distribution is
1 Present address, Department of Chemistry, University of Wisconsin,Madison, Wis.
made. The latter two methods are tedious for numerical workand are perhaps too laborious to justify application to masses thatobey only. very approximately the assumptions made in the development of the Guinier theory.
This paper presents a method for analyzing small angle x-rayscattering data in terms of a continuous distribution of pore(or particle) sizes. Also presented are some typical resultstogether with comparisons with the results of other physicalmetllOds of elucidating pore geometry.
In March 1947, before the present paper was submitted forpublication, the work of Shull and Roess (15) appeared; thishad been presented in substance before Gibson Island Conferences in 1944 and 1945. There is a strong similarity in the twotreatments, and there is no doubt that Shull and Roess haveestablished priority. The present paper is an independent workand places emphasis on the alternative pore size interpretation.
The experimental arrangement is familiar. Figure 1 shows adiagram of that used by the authors.
BEAM STOP~U/X- RAY SOURCE 1.
1
COLLIMATOR
IJ~, ;r==:::./~r. ~ a== ~
PENTAERYTHRITOL j / '---+\--~~------'\ICRYSTAL 41NHOLE SLIT'
(001) CLEAVAGE FACE (DETAIL A) (DETAIL B) 'VACUUMOUTLET
SAMPLEHOLDER
PLATINUMWIRE
VACUUM
~sl\rT\O.6M~'
FILMHOLDER 15 MM.
DETAIL A
Figure 1.
DETAIL B
Slllall-Angle X-Ray Call1era
665
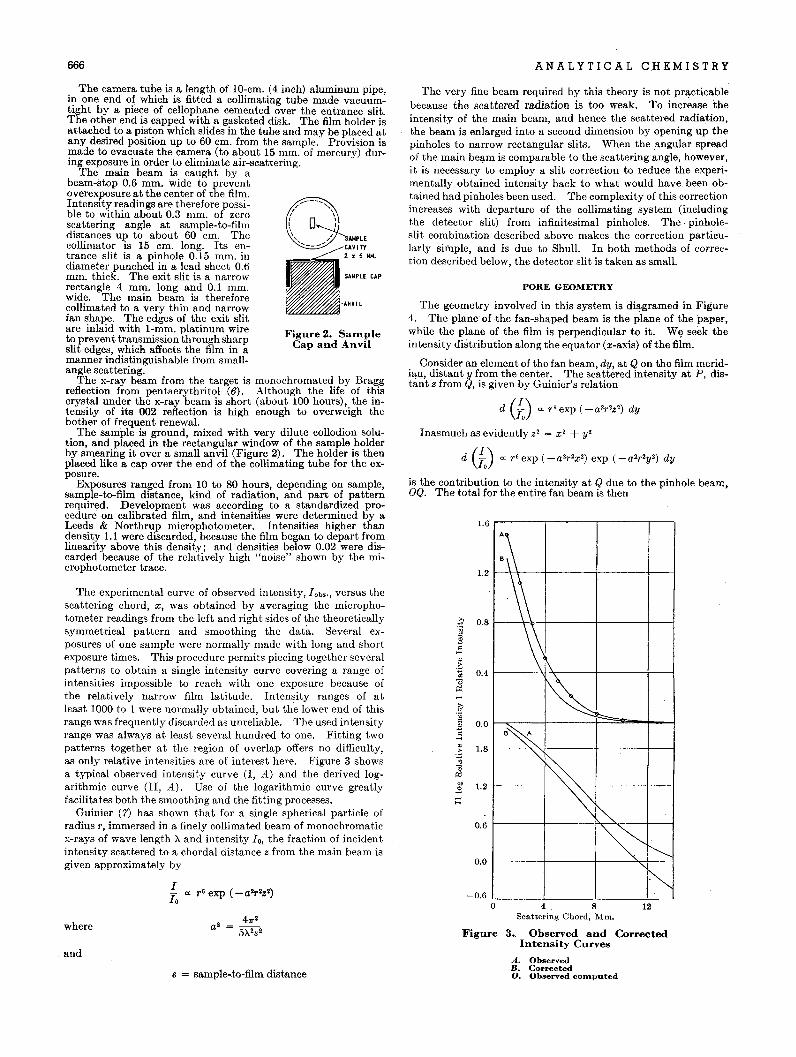
666 A N A L Y TIC A L C.H E MIS TRY
Figure 2. SampleCap and Anvil
Figure 3" Observed and CorrectedIntensity Curves
A. ObservedB. CorrectedO. Observed cOlIlputed
124 8Scattering Chord, Mm.
:\\\~\~~
B~
'"~~~~~
~
0.8
0.4
0.0
1.8
1.2
0.0
-0.6o
0.6
1.2
1.6
PORE GEOMETRY
The geometry involved in this system is diagramed in Figure4. The phi-neof the fan-shaped beam is the plane of the 'paper,while the plane of the film is perpendicular to it. w~ seek theintensity distribution along the equator (x-axis) of the film.
Consider an element of the fan beam, dy, at Q on the film meridian, distant y from the center. The scattered intensity at P, distant z from Q, is given by Guinier's relation
d (f.) 0: 1'" exp ( - a 21'2z2) dy
Inasmuch as evidently z' = x 2 + y2
d (f.) 0: 1'6 exp (-a 21'2x 2) exp (-a 21'2y 2) dy
is the contribution to the intensity at Q due to the pinhole beam,OQ. The total for the entire fan beam is then
The very fine beam required by this theory is not practicablebecause the scattered radiation is too weak. To increase theintensity of the main beam, and hence the scattered radiation,the beam is enlarged into a second dimension by opening up thepinholes to narrow rectangular slits. When tire angular spreadof the main be~m is comparable to the scattering angle, however,it is necessary to employ a slit correction to reduce the experimentally obtained intensity back to what would have been obtained had pinholes been used. The complexity of this correctionincreases with departure of the collimating system (includingthe detector slit) from infinitesimal pinholes. The· pinholeslit combination described above makes the correction particularly simple, and is due to Shull. In both methods of correction described below, the detector slit is taken as small.
The camera tube is a length of 10-cm. (4 inch) aluminum pipe,in one end of which is fitted a collimating tube made vacuumtight by a piece of cellophane cemented over the entrance slit.The other end is capped with a gasketed disk. The film holder isattache~ to a pi~t?n which slides in the tube and may be placed atany desIred posItIOn up to 60 em. from the sample. Provision ismade to evacuate the camera (to about 15 mm. of mercury) dur-ing exposure in order to eliminate air-scattering. .
The main beam is caught by abeam-stop 0.6 mm. wide to preventoverexposure at the center of the film.Intensity readings are therefore possible to within about 0.3 mm. of zeroscattering angle at sample-to-filmdistances up to about 60 em. Thecollimator is 15 em. long. Its entrance slit is a pinhole 0.15 mm. indiameter punched in a lead sheet 0.6mm. thick. The exit slit is a narrowrectangle 4 mm. long and 0.1 mm.wide. The main beam is thereforecollimated to a very thin and narrowfan shape. The edges of the exit slitare inlaid with 1-mm. platinum wireto prevent transmission through sharpslit edges, which affects the film in amanner indistinguishable from small-angle scattering.
The x-ray beam from the target is monochromated by Braggreflection from pentaerythritol (6). Although the life of thiscrystal under the x-ray beam is short (about 100 hours), the intensity of its 002 reflection is high enough to overweigh thebother of frequent renewal.
The sample is ground, mixed with very dilute collodion solution, and placed in the rectangular window of the sample holderby smearing it over a small anvil (Figure 2). The holder is thenplaced like a cap over the end of the collimating tube for the exposure.
Exposures ranged from 10 to 80 hours, depending on sample,sample-to-film distance, kind of radiation, and part of patternrequired. Development was according to a standardized procedure on calibrated film, and intensities were determined by aLeeds & Northrup microphotometer. Intensities higher thandensity 1.1 were discarded, because the film began to depart fromlinearity above this density; and densities below 0.02 were discarded because of the relatively high "noise" shown by the microphotometer trace.
s = sample-to-film distance
where
I- 0: 1'6 exp (-a2r2z2)10
The experimental curve of observed intensity, lObS., versus thescattering chord, x, was obtained by averaging the microphotometer readings from the left and right sides of the theoreticallysymmetrical pattern and smoothing the data. Several exposures of one sample were normally made with long and shortexposure times. This procedure permits piecing together severalpatterns to obtain a single intensity curve covering a range ofintensities impossible to reach with one exposure because ofthe relatively narrow film latitude. Intensity ranges of atleast 1000 to 1 were normally obtained, but the lower end of thisrange was frequently discarded as unreliable. The used intensityrange was always at least several hundred to one. Fitting twopatterns together at the region of overlap offers no difficulty,as only relative intensities are of interest here. Figure 3 showsa typical observed intensity curve (I, A) and the derived logarithmic curve (II, A). Use of the logarithmic curve greatlyfacilitates both the smoothing and the fitting processes.
Guinier (7) has shown that for a single spherical particle ofradius 1', immersed in a finely collimated beam of monochromaticx-rays of wave length t. and intensity 10, the fraction of incidentintensity scattered to a chordal distance z from the main beam isgiven approximately by
and
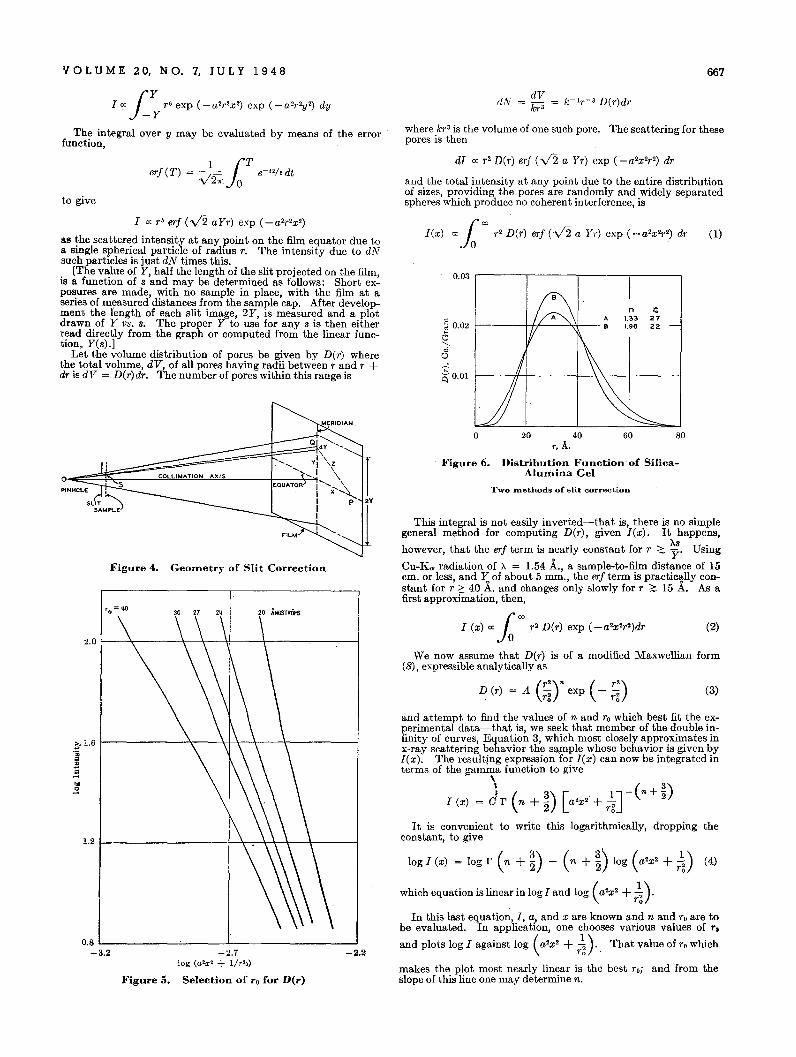
VOL U M E 20, N O. 7, J U L Y 1 948 667
I ex fY r 6 exp ( - a2r 2x 2) exp ( - a 2'r 2y 2) dy-Y
The integral over y may be evaluated by means of the errorfunction,
to give
where kr3 is the volume of one such pore. The scattering for thesepores is then
dI ex r' D(r) erf (viz a Yr) exp (-a2x'r2) dr
and the total intensity at any point due to the entire distributionof sizes, providing the pores are randomly and widely separatedspheres which produce no coherent interference, is
I ex ro erf (V2 aYr) exp (-a2r 2x2)
as the scattered intensity at any point on the film equator due toa single spherical particle of radius r. The intensity due to dNsuch particles is just dN times this.
[The value of Y, half the length of the slit projected on the film,is a function of 8 and may be determined as follows: Short exposures are made, with no sample in place, with the film at aseries of measured distances from the sample cap. Mter developmem the fength of each slit image, 2Y, is measured and a plotdrawn of Y V8. 8. The proper Y to use for any 8 is then eitherread directly from the graph or computed from the linear function" Y(8).J
Let the volume distribution of pores be given by D(r) wherethe total volume, dV, of all pores having radii between rand r +dr is dV = D(r)dr. The number of pores within this range is
M FtIDIAN,
I(x) ex;; 00 r2 D(r) erj (V2 a Yr) exp ( - a2x'r2) dr
0.03 r----,----,----,-----,
~ 0.02 r----+f-f----'''<'i--
o',;o
;g- 0.01 f----H-+-----j--'\-\---f-----j
(1)
806020o 40r, A..
Figure 6. Distribution Function of SilicaAlumina Gel
Two Illethods of slit correction
This integral is not easily inverted-that is, there is no simplegeneral method for computing D(r), given I(x). It happens,
however, that the erf term is nearly constant for r ::::.~. Using
Cu-Ka radiation of A = 1.54 A., a sample-to-film distance of 15em. or less, and Y of about 5 mm., the erf term is practically constant for r ~ 40 A. and changes only slowly for r ::::. 15 A. As afirst approximation, then,
I (x) ex 10 00 T 2 D(r) exp ( - a2x2r2)dr (2)
We now assume that D(r) is of a modified Maxwellian form(8), expressible analytically as
D (r) = A (~)" exp (- ~) (3). To To
and attempt to find the values of nand ro which best fit the experimental data-that is, we seek that member of the double infinity of curves, Equation 3, which most closely approximates inx-ray scattering behavior the sa.mple whose behavior is given byI(x). The resulting expression for I(x) can now be integrated interms of the gamma function to give
- \
1 ( 3) [ IJ-(n+~)I (x) = 0 r n + 2 a 2x 2+ i1 2
It is convenient to write this logarithmically, dropping theconstant, to give
log I (x) = log r (n +D- (n + ~) log (a2x 2 +~) (4)
which equation is linearin log I and log ( a2x 2 +~).
In this last equation, I, a} and x are known and nand ro are tobe evaluated. In applicatlOn, one chooses various values of r.
and plots log I against log (a2x2 + ~). That value of r. which
makes the plot most nearly linear is the best ro; and from theslope of this line one may determine n.
-2.2
Q dY
1\,.................. YI ,\z
..... I \,t.QUATOR I .................. \
I x .....~I pII
30 27 2~
Figure 4. GeOJnetry of Slit Correction
2.0 f--~------\,--+---I+--+---_------l
1.2 f-----------t---\:-;--\-+-+-+----i
0.8 '--- -'- --'- ~
-3.2 -2.7log (a'x' + l/r'o)
Figure 5. Selection of ro for D(r)
~ 1.6 f-------+--\-t--\----\----\-------I
j.9OIl
oS
o
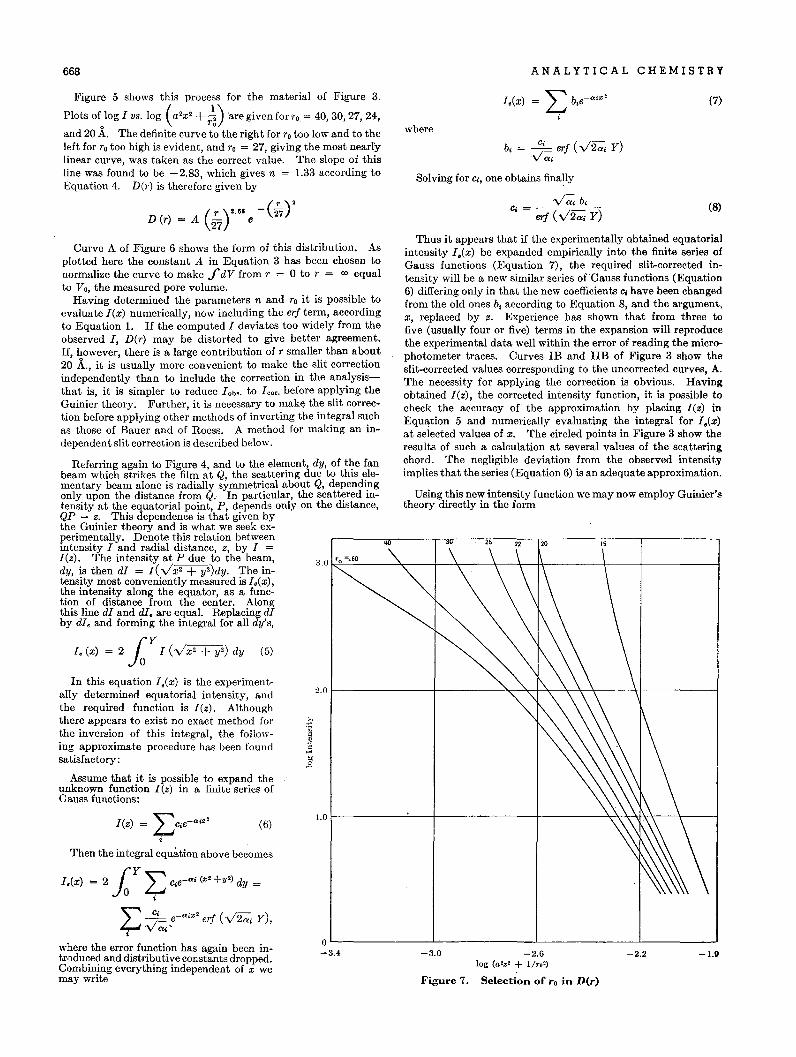
668 ANALYTICAL CHEMISTRY
(7)
(8)
-1.11-2.2
b, = ;-;;. erf (V2a, V)
l.(x)
-3.0 -2.6log (a'.' + l/ro')
Figure 7. Selection: of ro in D(r)
Solving for c;, one obtains finally
V-;;'b,C; - ----,:...--"'-'~--:-
- erf (V2a, V)
where
Thus it appears that if the experimentally obtained equatorialintensity I.(x) be expanded empirically into the finite series ofGauss functions (Equation 7), the required slit-corrected intensity will be a new similar series ofGauss functions (Equation6) differing only in that the new coefficients C; have been changedfrom the old ones b, according to Equation 8, and the argument,x, replaced by z. Experience has shown that from three tofive (usually four or five) terms in the expansion will reproducethe experimental data well within the error of reading the microphotometer traces. Curves IB and IIB of Figure 3 show theslit-corrected values corresponding to the uncorrected curves, A.The necessity for applying the correction is obvious. Havingobtained I(z), the corrected intensity function, it is possible tocheck the accuracy of the approximation by placing I(z) inEquation 5 and numerically evaluating the integral for I.(x)at selected values of x. The circled points in Figure 3 show theresults of such a calculation at several values of the scatteringchord. The negligible deviation from the observed intensityimplies that the series (Equation 6) is an adequate approximation.
Using this new intensity function we may now employ Guinier'stheory directly in the form
OL -.l.~ _.L ..l._ ___'
-3.4
l.0 r------'---t---------I---------.:;tt~il\_\r__\-__j
2.0 r-------1----~~~~~~rl~-_\_t__---__j
(5)
(6)
(V _I,(x) = 2 Jo I (Vx2 + y2) dy
I(z) = L c;e-a'"
i
Then the integral equation above becomes
( r)2.88 -(i7)'D (r) = A 27 e
Curve A of Figure 6 shows the form of this distribution. Asplotted here the constant A in Equation 3 has been chosen tonormalize the curve to make f dV from r = °to r = 00 equalto Vo, the measured pore volume.
Having determined the parameters nand ro it is possible toevaluate I(x) numerically, now including the erf term, accordingto Equation 1. If the computed I deviates too widely from theobserved I, D(r) may be distorted to give better agreement.If however there is a large contribution of r smaller than about20 A., it is 'usually more convenient to make the slit correctionindependently than to include the correction in the analysisthat is, it is simpler to reduce lob,. to I co,. before applying theGuinier theory. Further, it is necessary to make the slit correction before applying other methods of inverting the integral suchas those of Bauer and of Roess. A method for making an independent slit correction is described below.
Referring again to Figure 4, and to the ele~ent, dy, of t~e fanbeam which strikes the film at Q, the scattermg due to thIS ~lementary beam alone is radially symmetrical about Q, dependl.ngonly upon the distance from Q. In particular, the scatt~red mtensity at the equatorial point, P, d~pends only on the dIstance,QP = z. This dependence is that gIven bythe Guinier theory and is what we seek experimentally. Denote this relation betweenintensity I and radial distance, z, by I =I(z). The intensity at P due to the beam,dy is then dI = I(V x 2 + y2)dy. The inte~sity most conveniently measured is I.(x) ,the intensity along the equator, as a function of distance from the center. Alongthis line dI and dIe are equal. Replacing dIby dIe and forming the integral for all dy's,
Figure 5 shows this process for the material of Figure 3.
Plots of log I VB. log (a 2X 2 +~) 'are given forro = 40,30,27,24,
and 20 A. The definite curve to the right for r. too low and to theleft for ro too high is evident, and ro = 27, giving the most nearlylinear curve was taken as the correct value. The slope of thisline was fou~d to be - 2.83, which gives n = 1.33 according toEquation 4. D(r) is therefore given by
I.(x) = 2 (V L c;e-a , (x' +Y') dy =
Jo i
'""'" C; -a'x' f (. 12- V)4-J V~ ...e er v (ti ,
•where the error function has again been introduced and distributive constants dropped.Combining everything independent of x wemay write
In this equation I.(x) is the experimentally determined equatorial intensity, andthe required function is I(z). Althoughthere appears to exist no exact method forthe inversion of this integral, the following approximate procedure has been foundsatisfactory:
Assume that it is possible to expand theunknown function I(z) in a finite series ofGauss functions:
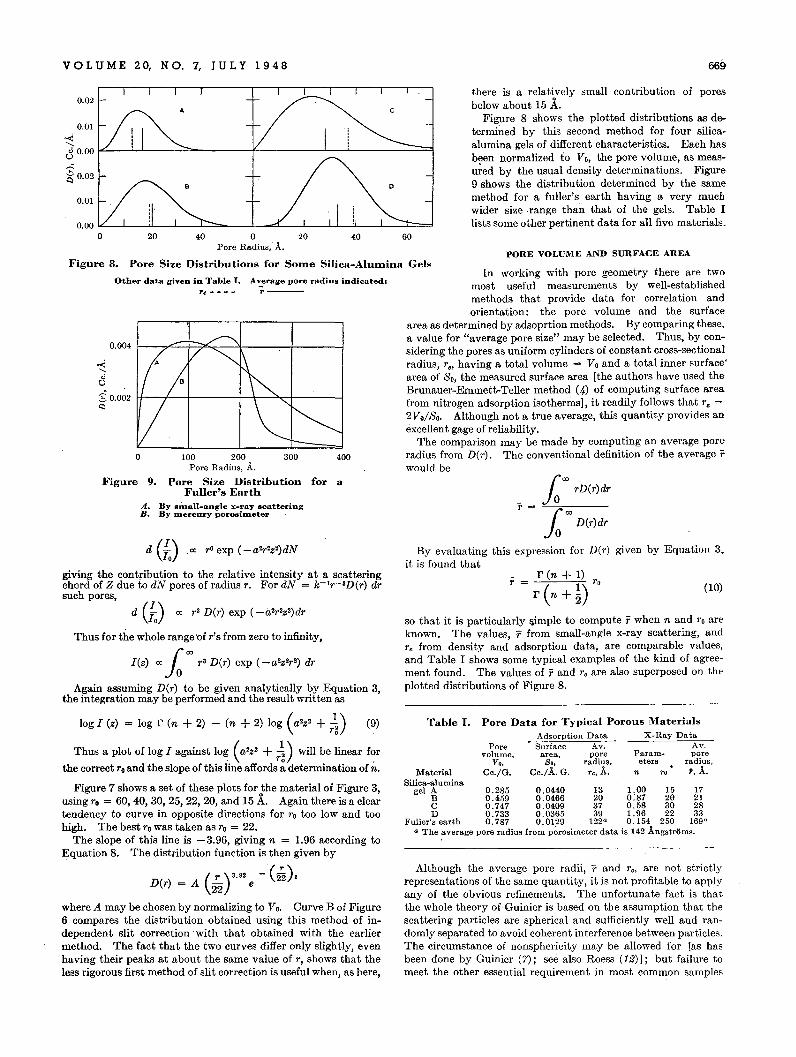
VOL U M E 20, NO.7, J U L Y 1 948 669
(10)
("" rD(r)drJo .
r =
_ r (n + 1)T = ( 1) ro
r n + 2
Pore Data for Typical Porous MaterialsAdsorption Data X-Ray DataSurface Av. Av,
area, pore Param- poreSo, radius, eters radius.
Ce.;A. G. re, 'A. n ro r, 'A.
Porevolume.
V.,Ce./G.
PORE VOLUME AND SURFACE AREA
there is a relatively small contribution of poresbelow about 15 A.
Figure 8 shows the plotted distributions as determined by this second method for four silicaalumina gels of different characteristics. Each hasbeen normalized to Yo, the pore volume, as measu~ed by the usual density determinations. Figure9 shows the distribution determined by the samemethod for a fuller's earth having. a very muchwider size range than that of the gels. Table Ilists some other pertinent data for all five materials.
Table I.
In working with pore geometry there are twomost useful measurements by well-establishedmethods that provide data for correlation andorientation: the pore volume and the surface
area as determined by adsoprtion methods. By comparing these,a value for "average pore size" may be selected. Thus, by considering the pores as uniform cylinders of constant cross-sectionalradius, re , having a total volume = Vo and a total inner surface'area of So, the measured surface area [the authors have used theBrunauer-Emmett-Teller method (4) of computing surface areafrom nitrogen adsorption isotherms], it readily follows that r. =2Vo/So• Although not a true average, this quantity provides anexcellent gage of reliability.
The comparison may be made by computing an average poreradius from D(r). The conventional definition of the average rwould be
fa"" D(r)dr
By evaluating this expression for D('/') given by Equation 3,it is found·that
so that it is particularly ~mple to compute r when nand '/'0 areknown. The values,r from small-angle x-ray scattering, andre from density and adsorption data, are comparable values,and Table I shows some typical examples of the kind of agreement found. The values of rand Te are also superposed on thpplotted distributions of Figure 8.
MaterialSilica-alumina
gel i ngg g:g~tg ~g U~ ~g ~IC 0.747 0.0409 37 0.58 30 28D 0.733 0.0365 39 1.96 22 33
Fuller's earth 0.787 0.0129 122a 0.154 250 169"a The average pore radius from porosimeter data is 142 Angstroms.
60
c
40
400
for a
300
A':,erage pore radius indicated:r---TC - - - -
40 0 20Pore Radius, A.
A
100 200Pore Radius, A.
Pore Size DistributionFuller's Earth
20
A. By small-angle x-ray scatteringB. By Dlercury porosim.eter
o
Pore Size Distributions for Some Silica-Alumina Gels
Other data given in Table I.
0.004 I- ,..",:=+::;;:.~-~--~I----j
Figure 9.
-<'clo~ 0.002 1+--+-+---+-\--...:>..0-+----1"l
0.02
0.00 lL.._L-_"-_L-_.L::::=.~_.l.._-""L...._.l..__.L..l._lL-_.l.__ _===='
o
0.01
Figure 8.
0.01
~c3 0.00 I-"------'-'----=----,'--------'----'--------===;
~0.02
d (fa) .0: rO exp (-a 2r2z2)dN
giving the contribution to the relative intensity at a scatteringchord of Z due to dN pores of radius r. For dN = k- 1r- 3D(r) dTsuch pores,
d (fa) 0: r3 D(r) exp (-ih 2z2)dT
Thus for the whole range 'of r's from zero to infinity,
I(z) 0: fa "" T3 D(r) exp (-a2z2r2) dr
Again assuming D(r) to be given analytically by Equation 3,the integration may be performed and the result written as
log I (z) = log r (n + 2) - (n + 2) log (a2z2 +~) (9)
Thus a plot of log I against log (a2z2 + ~) will be linear f~rthe correct To and the slope of this line affords a determination of n.
Figure 7 shows a set of these plots for the material of Figure 3,using ro = 60, 40, 30, 25, 22, 20, and 15 A. Again there is a cleartendency to curve in opposite directions for ro too low and toohigh. The best TO was taken as ro = 22.
The slope of this line is -3.96, giving n = 1.96 according toEquation 8. The distribution function is then given by
(
T )3.92 -(fz).D(r) = A 22 6
where A may be chosen by normalizing to Yo. Curve B of Figure6 compares the distribution obtained using this method of independent slit correction with that obtained with the earliermethod. The fact that the two curves differ only slightly, evenhaving their peaks at about the same value of T, shows that theless rigorous first method of slit correction is useful when, as here,
Although the average pore radii, rand re , are not strictlyrepresentations of the same quantity, it is not profitable to applyany of the obvious refinements. The unfortunate fact is thatthe whole theory of Guinier is based on the assumption that thescattering particles are spherical and sufficiently well and randomly separated to avoid coherent interference between particles.The circumstance of nonsphericity may be allowed for [as hasbeen done by Guinier (7); see also Roess (12) 1; but failure tomeet the other essential requirement in most common samples
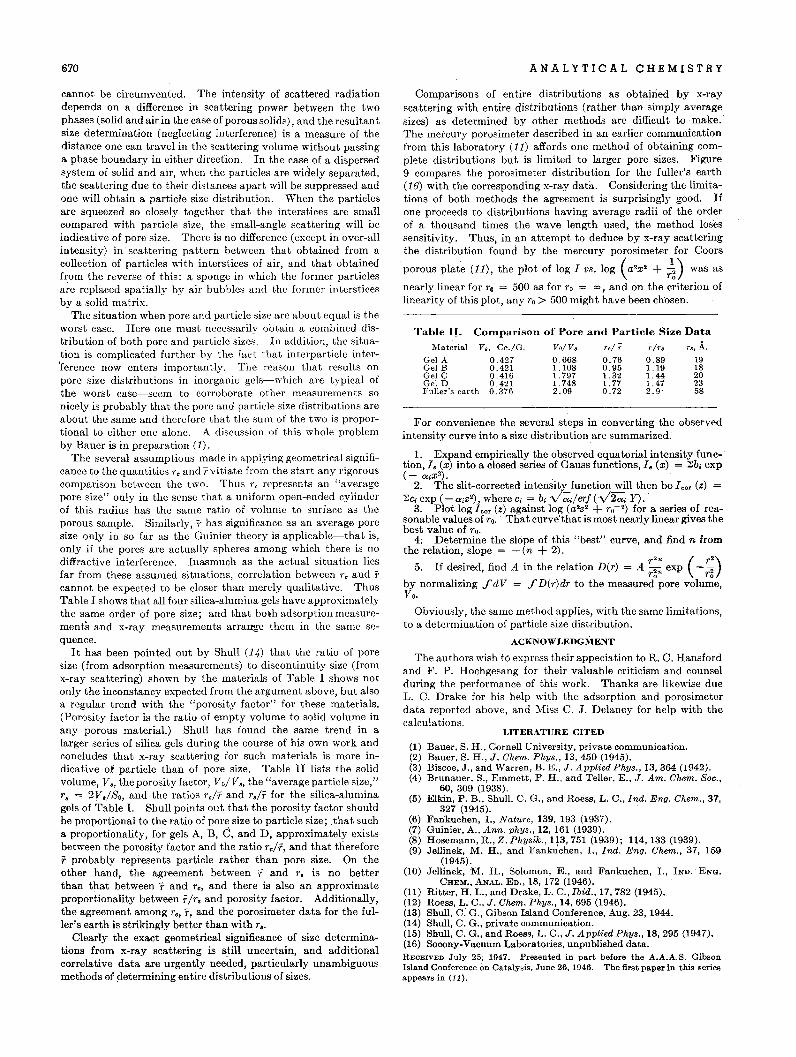
670 ANALYTICAL CHEMISTRY
COll1parison of Pore and Particle Size Data
v., Cc./G. Vol V. rei:;: r Ir. r., A.0.427 0.668 0.76 0.89 190.421 1.108 0.95 1.19 180.416 1.797 1.32 1.44 200.421 1. 748 1. 77 1. 47 230.376 2.09 0.72 2.9' 58
lVlaterial
Gel AGel BGel CGel DFuller's earth
Table n.
For convenience the several steps in converting the observedintensity curve into a size distribution are summarized:
1. Expand empirically the observed equatorial intensity function, I. (x) into a closed series of Gauss functions, I. (x) = ~b; exp(- aix2).
2. The slit-corrected intensity function will then be leo' (z) =
~C; exp (-aiz2), where Ci = bi v-;'/er! (V2ai Y).3. Plot log I em (z) against log (a2z2 +1'0- 2) for a series of rea
sonable values of To.. That curve'that is most nearly linear gives thebest value of 1'0.
4; Determine the slope of this "best" curve, and find n fromthe relation, slope = - (n + 2).
5. If desired, find A in the relation D(r) = A r:: exp (-:;)To To
by normalizing fdV = fD(r)dT to the measured pore volume,Vo•
Obviously, the same method applies, with the same limitations,to a determination of particle size distribution.
ACKNOWLEDGMENT
The authors wish to express their appeciation to R. C. Hansfordand F. P. Hochgesang for their valuable criticism and counselduring the performance of this work. Thanks are likewise dueL. C. Drake for his help with the adsorption and porosimeterdata reported above, and Miss C. J. Delaney for help with thecalculations.
Comparisons of entire distributions as obtained by x-rayscattering with entire distributions (rather than simply averagesizes) as determined by other methods are difficult to make.The mercury porosimeter described in an earlier communicationfrom this laboratory (11) affords one method of obtaining complete distributions but is limited to larger pore sizes. Figure9 compares the porosimeter distribution for the fuller's earth(16) with the corresponding x-ray data. Considering the limitations of both methods the agreement is surprisingly good. Ifone proceeds to distributions having average radii of the orderof a thousand times the wave length used, the method losessensitivity. Thus, in an attempt to deduce by x-ray scatteringthe distribution found by the mercury porosimeter for Coors
porous plate (11), the plot of log I vs. log (a2x2 + ~) was as
nearly linear for To = 500 as for To = co, and on the criterion oflinearity of this plot, any To> 500 might have been chosen.
LITERATURE CITED
(1) Bauer, S. H., Cornell University, private communication.(2) Bauer, S. H., J. Chem. Phys., 13,450 (1945).(3) Biscoe, J., and Warren, B. E., J. Applied Phys., 13,364 (1942).(4) Brunauer, S., Emmett, P. H., and Teller, E., J. Am. Chem. Soc.,
60, 309 (1938).(5) Elkin, P. B., Shull, C. G., and Roess, L. C., Ind. Eng. Chem., 37,
327 (1945).(6) Fankuchen, 1., Nature, 139, 193 (1937).(7) Guinier, A., Ann. phys., 12, 161 (1939).(8) Hosemann, R., Z. Physik., 113, 751 (1939); 114,133 (1939).(9) Jellinek, M. H., and Fankuchen, 1., Ind. Eng. Chem., 37, 159
(1945).(to) Jellinek, M, H., Solomon,. E., and Fankuchen, 1., IND. ENG.
CHEM., ANAL. ED., 18, 172 (1946).(11) Ritter, H. L., and Drake, L. C., Ibid., 17, 782 (1945).(12) Roess, L. C., J. Chem. Phys., 14, 695 (1946).(13) Shull, C: G., Gibson Island Conference, Aug. 23,1944.(14) Shull, C. G., private communication.(15) Shull, C. G., and Roess, L. C., J. Applied Phys., 18, 295 (1947);(16) Socony-Vacuum Laboratories, unpublished data,RECEIVED July 25, 1947. Presented in part before the A.A.A.S. GibsonIsland Conference on Catalysis, June 26, 1946. The first paper in this seriesappears in (11).
cannot be circumvented. The intensity of scattered radiationdepends on a difference in scattering power between the twophases (solid and air in the case of porous solids), and the resultantsize determination (neglecting interference) is a measure of thedistance one can travel in the scattering volume without passinga phase boundary in either direction. In the case of a dispersedsystem of solid and air, when the particles are widely separated,the scattering due to their distances apart will be suppressed andone will obtain a particle size distribution. When the particlesare squeezed so closely together that the interstices are smallcompared with particle size, the small-angle scattering will beindicative of pore size. There is no difference (except in over-allintensity) in scattering pattern between that obtained from acollection of particles with interstices of air, and that obtainedfrom the reverse of this: a sponge in which the former particlesare replaced spatially by air bubbles and the former intersticesby a solid matrix.
The situation when pore and particle size are about equal is theworst case. Here one must necessarily obtain a combined distribution of both pore and particle sizeH. In addition, the situation is complicated further by the fad that interparticle inter'ference now enters importantly. The reason that results onpore size distributions in inorganic gels-which are typical ofthe worst case-seem to corroborate other measurements sonicely is probably that the pore and particle size distributions areabout the same and therefore that the sum of the two is proportional to either one alone. A discussion of this whole problemby Bauer is in preparation (1).
The several assumptions made in applying geometrical significance to the quantities Te and rvitiate from the start any rigorouscomparison between the two. Thus '1", represents an "averagepore size" only in the sense that a uniform open-ended cylinderof this radius has the same ratio of volume to surface as theporous sample. Similarly, r has significance as an average poresize only in so far as the Guinier theory is applicable-that is,only if the pores are actually spheres among which there is nodiffractive interference. Inasmuch as the actual situation liesfar from these assumed situations, correlation between Te and rcannot be expected to be closer than merely qualitative. ThusTable I shows that all four silica-alumina gels have approximatelythe same order of pore size; and that boih adsorption measurements and x-ray measurements arrauge them in the same sequence.
It has been pointed out by Shull (14) that the ratio of poresize (from adsorption measurements) to discontinuity size (fromx-ray scattering) shown by the materials of Table I shows notonly the inconstancy expected from the argument above, but alsoa regular trend with the "porosity factor" for these materials.(Porosity factor is the ratio of empty volume to solid volume inany porous material.) Shull has found the same trend in alarger series of silica gels during the course of his own work andconcludes that x-ray scattering for such materials is more indicative ot particle than of pore size. Table II lists the solidvolume, V., the porosity factor, Vo/V., the "average particle size,"r. = 2V./So, and the ratios 'l"e/1' and r.iT for the silica-aluminagels of Table 1. Shull points out that the porosity factor shouldbe proportional to the ratio of pore size to particle size; .that sucha proportionality, for gels A, B, C, and D, approximately existsbetween the porosity factor and the ratio reN, and that thereforel' probably represents particle rather than pore size. On theother hand, the agreement between rand r. is no betterthan that between rand Te, and there is also an approximateproportionality between 1'/1'. and porosity factor. Additionally,the agreement among Te, T, and the porosimeter data for the fuller's earth is strikingly better than with 1'••
Clearly the exact geometrical significance of size determinations from x-ray scattering is still uncertain, and additionalcorrelative data are urgently needed, particularly unambiguousmethods of determining entire distributions of sizes.
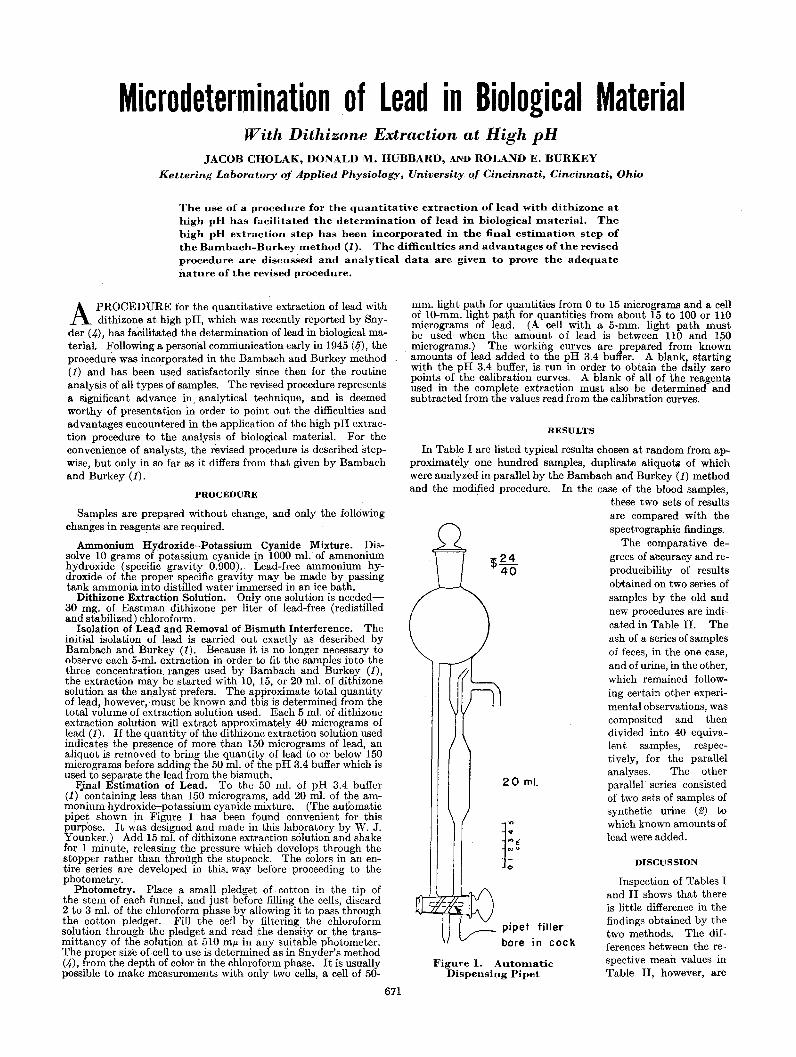
Microdetermination of Lead in Biological MaterialWith Dithizone Extraction at High pH
JACOB CHOLAK, DONALD M. HUBBARD, AND ROLAND E. BURKEY
Kettering Laboratory of Applied Physiology, University of Cincinnati, Cincinnati, Ohio
The use of a procedure for the quantitative extraction of lead with dithizone athigh pH has facilitated the determination of lead in biological material. Thehigh pH extraction step has been incorporated in the final estimation step ofthe Bambach-Burkey method (1). The difficulties and advantages of the revisedprocedure are discussed and analytical data are given to prove the adequatenature of the revised procedure.
A PROCEDURE for the quantitative extraction of lead withdithizone at high pH, which was recently reported by Sny
der (.,n, has fa"cilitated the determination of lead in biological material. Following a personal communication early in 1945 (fj), theprocedure was incorporated in the Bambach and Burkey method(1) and has been used satisfactorily since then for the routineanalysis of all types of samples. The revised procedure representsa significant advance in analytical technique, and is deemedworthy of presentation in order to point out the difficulties andadvantages encountered in the application of the high pH extraction procedure to the analysis of biological material. For theconvenience of analysts, the revised procedure is described stepwise, but only in so far as it differs from that given by Bambachand Burkey (1).
mm. light path for quantities from 0 to 15 micrograms and a cellof lO-mm. light path for quantities from about 15 to 100 or 110micrograms of lead. (A cell with a 5-mm. light path mustbe used when the amount of lead is between 110 and 150micrograms.) The working curves are prepared from knownamounts of lead added to the pH 3.4 buffer. A blank, startingwith the pH 3.4 buffer, is run in order to obtain the daily zeropoints of the calibration curves. A blank of all of the reagentsused in the complete extraction must also be determined andsubtracted from the values read from the calibration curves.
RESULTS
In Table I are listed typical results chosen at random from approximately one hundred samples, duplicate aliquotlD of whichwere analyzed in parallel by the Bambach and Burkey (1) method
pipet filler
bore in cock
20 mi.
PROCEDURE
Samples are prepll-red without change, and only the followingchanges in reagents are required.
Ammonium Hydroxide-Potassium Cyanide Mixture. Dissolve 10 grams of 'potassium cyanide in 1000 ml. of ammoniumhydroxide (specific gravity 0.900).. Lead-free ammonium hydroxide of the proper specific gravity may be made by passingtank ammonia into distilled water immersed in an ice bath.
Dithizone Extraction Solution. Only one solution is needed30 mg. of Eastman dithizone per liter of lead-free (redistilledand stabilized) chloroform.
Isolation of Lead and Removal of Bismuth Interference. Theinitial isolation of lead is carried out exactly as described byBambach and Burkey (1). Because it is no longer necessary toobserve each 5-ml. extraction in. order to fit the samples into thethree concentration. ranges used by Bambach and Burkey (1),the extraction may be started with 10, 15, or 20 ml. of dithizonesolution as the analyst prefers. The approximate total quantityof lead, however,must be known and this is determined from thetotal volume of extraction solution used. Each 5 ml. of dithizoneextraction solution will extract approximately 40 micrograms oflead (1). If the quantity of the dithizone extraction solution usedindicates the presence of more than 150 micrograms of lead, analiquot is removed to bring the quantity of lead to or below 150micrograms before adding the 50 ml. of the pH 3.4 buffer which isused to separate the lead from the bismuth.
Fjnal Estimation of Lead. To the 50 ml. of pH 3.4 buffer(1) containing less than 150 micrograms, add 20 ml. of the ammonium hydroxide-potassium cyanide mixture. (The automaticpipet shown in Figure 1 has been found convenient for thispurpose. It was designed and made in this laboratory by W. J.Younker.) Add 15 ml. of dithizone extraction solution and shakefor 1 minute, releasing the pressure which develops through thestopper rather than through the stopcock. The colors in an entire series are developed in this. way before proceeding to thephotometry.
Photometry. Place a small pledget of .cotton in the tip ofthe stem of each funnel, and just before filling the cells, discard2 to 3 ml. of the chloroform phase by allowing it to pass throughthe cotton pledget. Fill the cell by filtering the chloroformsolution through the pledget and read the density or the transmittancy of the solution at 510 m,u in any suitable photometer.The proper size of-cell to use is determined as in Snyder's method(4), from the depth of color in the chloroform phase. It is usuallypossible to make measurements with only two cells, a cell of 50-
671
and the modified procedure.
Figure 1. AutomaticDispensing Pipet
In the case of the blood samples,these two sets of resultsare compared with thespectrographic findings.
The comparative degrees of accuracy and reproducibility of resultsobtained on two series ofsamples by the old andnew procedures are indicated in Table II. Theash of a series of samplesof feces, in the one case,and of urine, in the other,which remained following certain other experimental observations, wascomposited and thendivided into 40 equivalent samples, respectively, for the parallelanalyses. The otherparallel series consistedof two sets of samples ofsynthetic urine (2) towhich known amounts oflead were added.
DISCUSSION
Inspection of Tables Iand II shows that thereis little difference in thefindings obtained by thetwo methods. The differences between the respective mean values inTable II, however, are
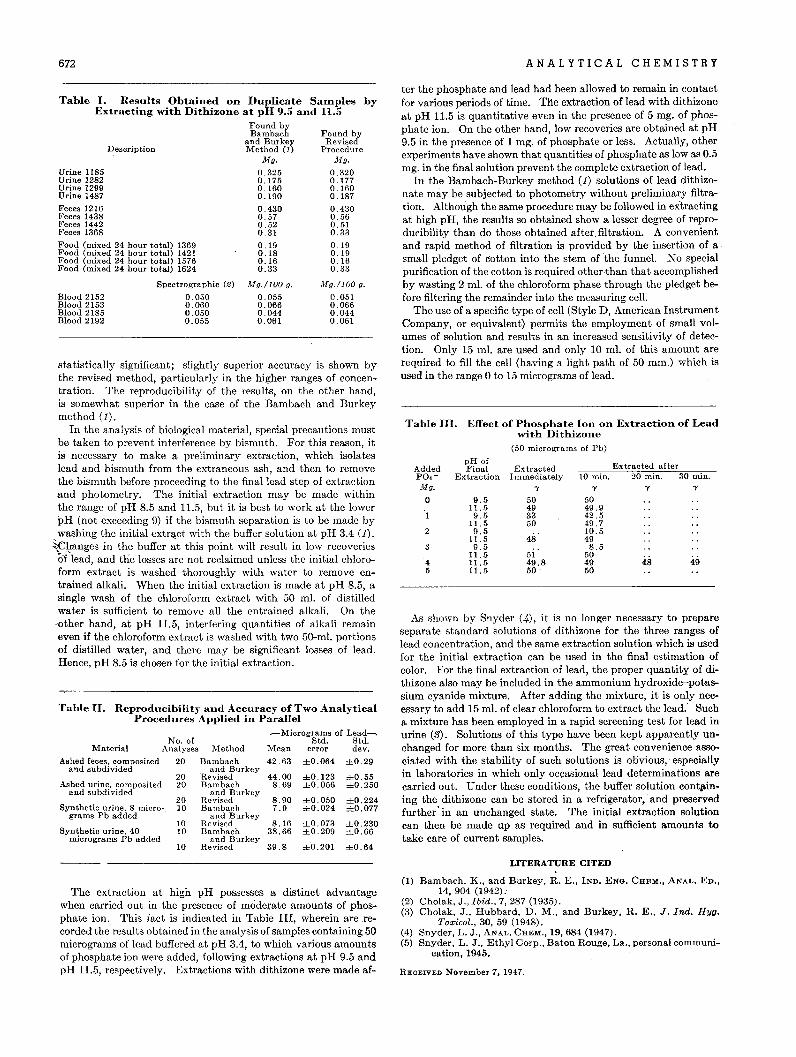
672 ANALYTICAL CHEMISTRY
Table II. Reproducibility and Accuracy of Two AnalyticalProcedures Applied in Parallel
__Micrograms of Lead__No. of Std. Std.
Material Analyses Method Mean error dev.
Ashed feces, composited 20 Bambach 42.63 ±0.064 ±0.29and subdivided and Burkey
20 Revised 44.00 ±0.123 ±0.55A.ahed urine, composited 20 Bambach 8.69 ±0.056 ±0.250
and subdivided and Burkey20 Revised 8.90 ±0.050 ±0.224
Synthetic urine. 8 micro- 10 Bambach 7.9 ±0.024 ±0.077grams Pb added and Burkey
10 Revised 8.16 ±0.073 ±0.230Synthetic urine. 40 10 Bambach 38.66 ±0.209 ±0.66
micrograms Pb added and Burkey10 Revised 39.8 ±0.201 ±0.64
Table Y. Results Obtained on Duplicate Salllpies byExtracting with Dithizone at pH 9.5 and n.5
Found byBambach Found by
and Burkey RevisedDescription Method (1) Procedure
Mg. Mg.
Urine 1185 0.325 0.320Urine 1282 0.175 0.177Urine 1299 0.160 0.160Urine 1487 0.190 0.187
Feces 1216 0.430 0.430Feces 1438 0.57 0.56Feces 1442 0.52 0.51Feces 1368 0.31 0.33
Food (mixed 24 bour total) 1369 0.19 0.19Food (mixed 24 hour total) 1421 0.18 O. 19Food (mixed 24 hour total) 1576 0.16 0.16Food (mixed 24 hour total) 1624 0.33 0.33
statistically significant; slightly superior accuracy is shown bythe revised method, particularly in the higher ranges of concentration. The reproducibility of the results, on the other hand,is somewhat superior in the case of the Bambach and Burkeymethod (1).
In the analysis of biological material, special precautions mustbe taken to prevent interference by bismuth. For this reason, itis necessary to make a preliminary extraction, which isolateslead and bismuth from the extraneous ash, and then to removethe bismuth before proceeding to the final lead step of extractionand photometry. The initial extraction may be made withinthe range of pH 8.5 and 11.5, but it is best to work at the lowerpH (not exceeding 9) if the bismuth separation is to be made bywashing the initial extrl),ct with the buffer solution at pH 3.4 (1).~hanges in the buffer at this point will result in low recoveriesor'lead, and the losses are not reclaimed unless the initial chloroform extract is washed thoroughly with water to remove entrained alkali. When the initial extraction is made at pH 8.5, asingle wash of the chloroform extract with 50 ml. of distilledwater is sufficient to remove all the entrained alkali. On the
"other hand, at pH 11.5, interfering quantities of alkali remaineven if the chloroform extract is washed with two 50-ml. portionsof distilled water, and there may be significant losses of lead.Hence, pH 8.5 is chosen for the initial extraction.
pH ofExtracted afterAdded Final Extracted
PO.- Extraction Immediately 10 min. 20 min. 30 min.M? 'Y 'Y 'Y 'Y
0 9.5 50 5011.5 49 49.9
1 9.5 33 42.511.5 50 49.7
2 9.5 10.511.5 48 49
3 9.5 8.511.5 51 50
4 11.5 49.8 49 48 495 11.5 50 . 50
Table III. Effect of Phosphate Ion on Extraction of Leadwith Dithizone
(50 micrograms of Pb)
tel' the phosphate and lead had been.allowed to remain in contactfor various periods of time. The extraction of lead with dithizoneat pH 11.5 is quantitative even in the presence of 5 mg. of phosphate ion. On the other hand, low recoveries are obtained at pH9.5 in the presence of 1 mg. of phosphate or less. Actually, otherexperiments have shown that quantities of phosphate as low as 0.5mg. in the final solution prevent the complete extraction of lead.
In the Bambach-Burkey method (1) solutions of lead dithizonate may be subjected to photometry without preliminary filtration. Although the same procedure may be followed in extractingat high pH, the results so obtained show a lesser degree of reproducibility than do those obtained after filtration. A convenientand rapid method of filtration is provided by the insertion of asmall pledget of cotton into the stem of'the funnel. No specialpurification of the cotton is required other than that accomplishedby wasting 2 ml. of the chloroform phase through the pledget before filtering the remainder into the measuring cell.
The use of a specific type of cell (Style D, American InstrumentCompany, or equivalent) permits the employment of small volumes of solution and results in an increased sensitivity of detection. Only 15 ml. are used and only 10 ml. of this amount arerequired to fill the cell (having a light path of 50 mm.) which isused in the range 0 to 15 micrograms of lead.
As shown by Snyder (4), it is no longer necessary to prepareseparate standard solutions of dithizone for the three ranges oflead concentration, and the same extraction solution which is usedfor the initial extraction can be used in the final estimation ofcolor. For the final extraction of lead, the proper quantity of dithizone also may be included in the ammonium hydroxide-potassium cyanide mixture. After adding the mixture, it is only necessary to add 15 ml. of clear chloroform to extract the lead.' Sucha mixture has been employed in a rapid screening test for lead inurine (3). Solutions of this type have been kept apparently unchanged for more than six months. The great convenience associated with the stability of such solutions is obvious,' especiallyin laboratories in which only occasional lead determinations arecarried out. Under these conditions, the buffer solution cont~in
ing the dithizone can be stored in a refrigerator,' and preservedfurther' in an unchanged state. The initial extraction solutioncan then be made up as required and in sufficient amounts totake care of current samples.
Mg.IIOO g.
0.0510,0660.0440.061
Mg./100 g.
0.0550.0660.0440.061
Spectrographic (2)
0.0500.0600.0500.055
Blood 2152Blood 2153Blood 2185Blood 2192
LITERATURE CITED
The extraction at hign pH possesses a distinct advantagewhen carried out in the presence of moderate amounts of phosphate ion. This fact is indicated in Table III, wherein are .recorded the results obtained in the analysis of samples containing 50micrograms of lead buffered at pH 3.4, to which various amountsof phosphate ion were added, following extractions at pH 9.5 andpH 11.5, respectively. Extractions with dithizone were made af-
(1) Bambach, K., and Burkey, R. E., IND. ENG. CHEM., ANAL. ED.,14,904 (1942).
(2) Cholak, J.,Ibid., 7, 287 (1935).(3) Cholak, J., Hubbard, D. M., and Burkey, R. E., J. Ind. Hyg.
Toxieol., 3D, 59 (1948).(4) Snyder, L. J., ANAL. CHEM., 19,684 (1947).(5) Snyder, L. J., Ethyl Corp., Baton Rouge, La., personal communi
cation, 1945.
RECEIVED November 7,1947.
Ouantitative Microdetermination of Magnesium inPlant Tissue and, Soil Extracts
A Rapid Colorimetric Method
MATTHEW DROSDOFF AND D. CHARLES NEARPASS
Bureau of Plant Industry, Soils, and Agricultural Engineering, U. S. Department of Agriculture, Gainesville, Fla.
A rapid quantitative colorhnetric lI1ethod is proposed for the deterll1ination oflI1agnesiull1 in plant tissue and soil extracts. It is based on the use of thiazole'yellow and a cOll1pensating starch solution to give a reproducible color that canbe lI1easured in a photoelectric colorill1eter. Ii is not necessary to rell10ve iron,alull1inull1, manganese, phosphorus, or calciull1. Both the precision and accuracy are well within accepted standards for colorill1etric lI1ethods.
AQUANTITATIVE procedure for determining small amountsof magneslum in plant material by using titan yellow· has
been described by Kidson (2). Gillam (1) described a titanyellow method for determining magnesium in fertilizers andsoil extracts. In' both methods iron, aluminum, phosphorus,and calcium have to be removed and ammonium salts destroyedby time-consuming processes. Peech and English (4) examinedthe titan yellow procedure carefully and developed a direct,rapid semiquantitative method for the determination of magnesium in soil extracts in the presence of calcium, iron, aluminum,and manganese. By using their procedure as a basis, and thiazole yellow as recommended by Mikkelsen and Toth (3) insteadof titan yellow, a rapid quantitative colorimetric method hasbeen developed for determining magnesium in tung leaves, andprobably can be Jlsed for other plant tissue.
REAGENTS
Thiazole Yellow, 0.100/". Dissolve 0.10 gram of thiazole yellow(obtained from General Dyestuffs Corporation, New York,N. Y.) in 100 ml. of water and store in a dark bottle. This reagent will keep at least 2 months under ordinary conditions.
Hydroxylamine Hydrochloride, 5%. Dissolve 25 grams ofhydroxylamine hydrochloride in water and dilute to 500 ml.Store in a dark-colored bottle.
Sodium Hydroxide, 2-5 N. Dissolve 100 grams of sodium hydroxide in water and dilute to 1 liter.
Starch Solution, 2%. To 2 grams of C.P. soluble starch addenough water to make a paste and add slowly, while stirring, theremainder of 100 ml. of hot water. Filter if necessary. This reagent should be prepared freshly as needed. Best results wereobtained with Baker and Adamson's reagent grade.
Compensating Solution. Dissolve 3.7 grams of calcium chloride (CaCl,.2H.O), 0.74 gram of aluminum sulfate (Al,(S04)3.18H.0), 0.36 gram of manganous chloride (MnCl,.4H.O), and 0.60gram of sodium phosphate .(Na3P04) in about 500 ml. of watercontaining 10 ml. of concentrated hydrochloric acid. Dilute to 1liter.
Starch Compensating Reagent. Mix equal volumes of the'Starch solution and compensating solution. Prepare daily asneeded.
Standard Magnesium Solution (25 p.p.m. of" magnesium).Dissolve 250 mg. of reagent grade magnesium metal in dilutehydrochloric acid solution (150 ml. of water plus 10 ml. of concentrated hydrochloric acid) and bring to volume in a 250-ml.volumetric flask. Dilute this solution 1 to 40 for the workingstandard of 25 p.p.m. of magnesium.
PROCEDURE
Take an aliquot of the hydrochloric acid solution of plant ashthat should contain 0.025 to 0.15 mg. of magnesium. Withtung leaves a convenient procedure has been to ash 2 grams ofdry ground material, dissolve the ash in dilute hydrochloric acid,and make up the solution to 100 ml. A 1-ml. aliquot of thissolution is satisfactory to cover th~ range 0.10 to 0.70% ofmagnesium in the leaves on a dry basis. For smaller or largerconcentrations than this the aliquots should be adjusted accordingly.
673
Transfer the aliquot to a 50-ml. volumetric flask and addenough water to bring the volume to about 25 ml. Add 1 ml.of the hydroxylamine hydrochloride solution and ,5 ml. of thestarch-compensating solution and mix the solution. ,Add exactly 1 ml. of thiazole yellow solution and mix the solution, andthen ~dd 5 ml. of the sodium hydroxide solution. Bring theflask to volume with water, mix thoroughly the contents, andallow them to stand for 10 minutes before reading on a photoe.lectric colorimeter using a green filter. The color is stable forseveral hours. The concentration of magnesium is obtainedfrom a standard curve as described below. A Cenco photelometerwith the green filter 525 p was used in this work. The colorimeteris set to read 100% transmittance with a blank ::!olution that isrun by the same procedure used with the samples and standards.
STANDARD CURVES
When 0-, 1-, 2-, and 5-ml. aliquots of the standard solution of25 p.p.m. of magnesium were analyzed exactly as describedabove and the readings plotted on semilog paper, a straight-linerelationship was obta,ined. Because of temperature variationsand possibly other fa~tors, good reproducibility' of the standardcurve was not obtained. Therefore for the highest accuracyand precision itis necessary to run a 5-nil. aliquot of the standardsolution in duplicate with each set of determinations. A curvefor the set is then constructed by drawing a straight line from 0concentration and 100% transmittance through the point obtained in the reading of the st,andard. It is convenient to prepare in advance a number of curves, one or two on each sheet ofgraph paper, and to use the appropriate curve for each set ofdeterminations. The colorimeter reading for the 5-ml. aliquotof the standard usually is in the range 75.0 to 79.0 with theCenco photelometer used in this laboratory.
ANALYTICAL RESULTS
The precision of the method was tested by analyzing 13 samplesof tung leaves from widely different localities, ranging in magnesium content from 0.11 to 0.88% on an oven-dry basis. Eachsample was ashed in triplicate, and triplicate determinationswere made on each of the ashings. Thus nine determinationswere made on each sample. A statistical analysis of the dataobtained showed that the standard deviation of a single determination is 0.019%. Hence the standard deviation of thl)difference between two duplicate determinations is 0.027. Thismeans that about two thirds of duplicate determinations shouldagree within 0.027% and 95% of them should agree, within0.054%. The standard error is 4% of the mean of all determinations, which is well within accepted standards for colorimetric methods.
The accuracy of the method was tested by comparison withthe standard volumetric procedure of titrating the magnesiumammqnium phosphate precipitate with standardized 0.1 Nhydrochloric acid. Ten samples of tung leaves from widely
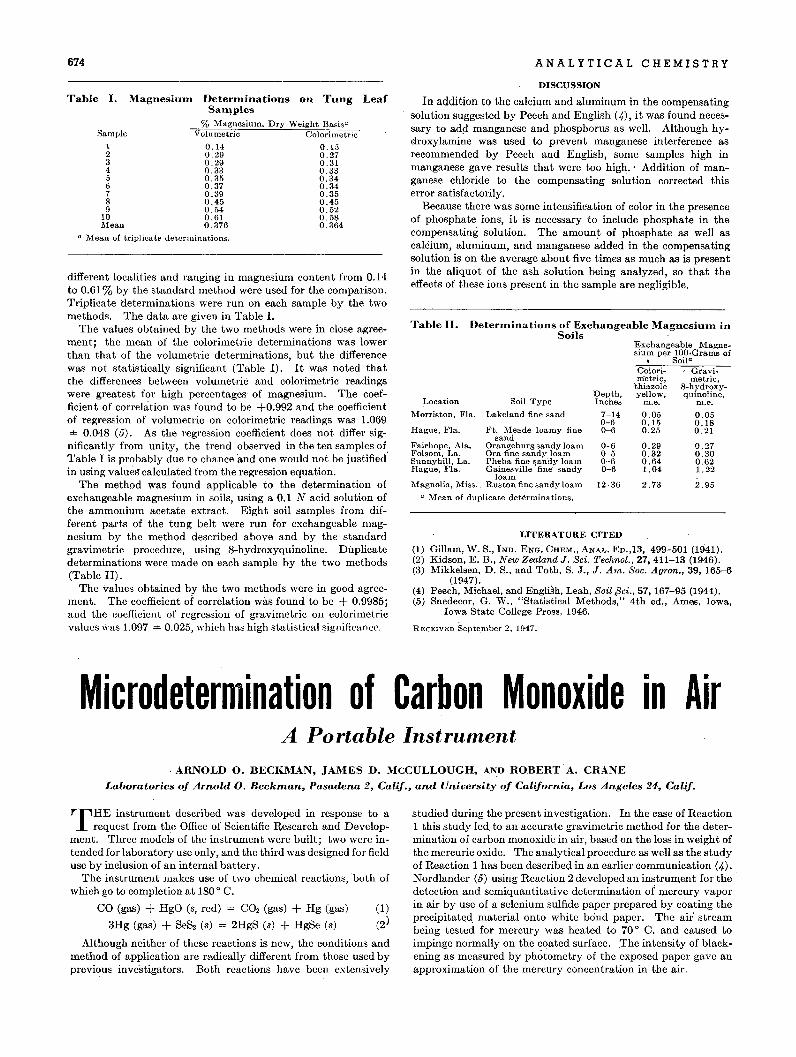
674 ANALYTICAL CHEMISTRY
Sample Volumetric Colorimetric
Table I. Magnesiulll Deterntinations on Tung LeafSan~ples
% n,1agnesium. Dry Weight Basisu
different localities and ranging in magnesium content from 0.14to 0.61 % by the standard method were used for the comparison.Triplicate determinations were run on each sample by the twomethods. The data are given in Table 1.
The values obtained by the two methods were in close agreement; the mean of the colorimetric determinations was lowerthan that of the volumetric determinations, but the differencewas not statistically significant (Table I). It was noted thatthe differences between volumetric and colorimetric readingswere greatest for high percentages of magnesium. The coefficient of correlation was found to be +0.992 and the coefficientof regression of volumetric on colorimetric readings was 1.069± 0.048 (5). As the regression coefficient does not differ significantly from unity, the trend observed in the ten samples ofTable I is probably due to chance and one would not be justified'in using value~calculated from the regression equation.
The method was found applicable to the determination ofexchangeable magnesium in soils, using a 0.1 N acid solution ofthe ammonium acetate extract. Eight soil samples from different parts of the tung belt were run for exchangeable magnesium by the method described above and by the standardgravimetric procedure, using 8-hydroxyquinoline. Duplicatedeterminations were made on each sample by the two methods(Table II).
The values obtained by the two methods were in good agreement. The coefficient of correlation was found to be + 0.9985;and the eoefficient of regression of gravimetrie on colorimetrievalues ,Vas 1.097 ± 0.025, which has high statistical significance.
a l\1ean of triplicate de"terminations.
Exchangeable Magne-sium per lOO·Grams of
. Soila
Colori- Gravi-metric, metric,
'thiazole 8-hydroxy-Depth, yellow, quinoline,Inches m.e. m.e.
7-14 0.05 0.050-6 0.15 0.180-6 0.25 0.21
0-6 0.29 0.270-5 0.32 0.300-6 0.64 0.620-6 1.0'4 1.22
12-36 2.73 2.95
Hague, Fla. Ft. Meade loamy finesand
Orangeburg sandy loamOra fine sandy loamPheba fine ~andy loamGainesville fine' sandy
loaml\1agnolia, Miss. Ruston fine sandy loam
a Mean of duplicate determinations.
LITERATURE CITED
(1) Gillam, W. S., hID. ENG. CHEM., ANAL. ED.,13, 499-501 (1941).(2) Kidson, E. B., New Zealand J. Sci. Technol., 27,411-13 (1946).(3) Mikkelsen, D. S., and Toth, S. J., J. Am. Soc. Agron., 39, 165-6
(1947).(4) Peech, Michael, and Engli~h, Leah, Soil f3ci., 57, 167-95 (1944).(5) Snedecor, G. W., "Statistical Methods," 4th ed., Am&,>, Iowa,
Iowa State College Press, 1946.
R ECEIVlo:O Septe.mber 2, 1947.
Location Soil Type
Morriston, Fla. Lakeland fine sand
Fairhope, Ala.Folsom, La.Sunnyhill, La".Hague,Fla.
DISCUSSION
In addition to the calcium and aluminum in the compensatingsolution suggested by Peech and English (.4-), it was found necessary to ad<:i manganese and phosphorus as well. Although hydroxylamine was used to prevent manganese interference asrecommended by Peech and English, some samples high inmanganese gave results that were too high.' Addition of manganese chloride to the compensating solution corrected thiserror satisfactorily.
Because there was some intensification of color in the presenceof phosphate ions, it is necessary to include phosphate in thecompensating solution. The amount of phosphate as well ascalCium, aluminum, and manganese ~dded in the compensatingsolution is on the average about five times as much as is presentin the aliquot of the ash solution being analyzed, so that theeffects of these ions present in the sample are negligible.
Table II. Deterntinations of Exchangeable Magnesiunt inSoils
0.1,30.270.310.330.340.340.350.450.520.580.364
0.140.290.290.330.350.370.390.450.540.610.376
123456789
10Mean
Microdetermination of Carbon Monoxide in AirA Portable Instrument
. ARNOLD O. BECKMAN, JAMES D. McCULLOUGH, AND ROBERT A. CRANE
Laboratories of Arnold O. Beckman, Pasadena 2, Calif., and University of California, Los Angeles 24, Calif.
THE instrument described was developed in response to arequest from the Office of Scientific Research and Develop
ment. Three models of the instrument were built; two were intended for laboratory use only, and the third was designed for fielduse by inclusion of an internal battery.
The instrument makes use of two ehemical reactions,both ofwhich go to completion at 180 0 C.
CO (gas) + HgO (8, red) = CO2 (gas) + Hg (gas) (1)
3Hg (gas) + Se& (8) = 2HgS (8) + HgSe (8) (2)
Although neither of these reactions is new, the conditions andmethod of application are radically different from those used byprevious investigators. Both reactions have been extensively
studied during the present investigation. In the case of Reaction1 this study led. to an accurate gravimetric method for the determination of carbon monoxide in air, based on the loss in weight ofthe mercuric oxide. The analytical procedure as well as the studyof Reaction 1 has been described in an earlier communication (4).Nordlander (5) using Reaction 2 developed an instrument for thedetection and semiquantitative determination of mercury vaporin air by use of a selenium sulfide paper prepared by coating theprecipitated material onto white bd~d paper. The air' streambeing tested for mercury was heated to 70 0 C. and caused toimpinge normally on the coated surface. The intensity of blackening as measured by photometry of the exposed paper gave anapproximation of the mercury concentration in the air.
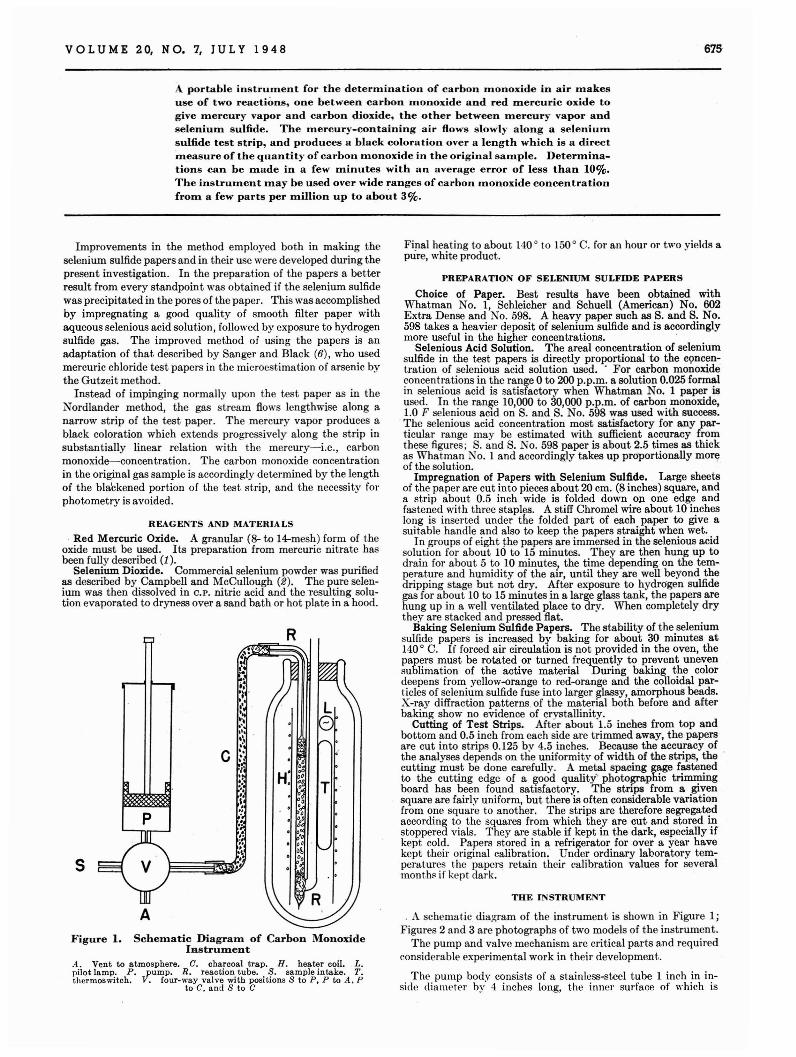
VOL U M E 20, N O. 7, JU L Y 1 9 4 8 675
A portable instrument for the determination of carbon monoxide in air makesuse of two reactions, one between carbon monoxide and red mercuric oxide togive mercury vapor and carbon ~oxide, the other between mercury vapor andselenium sulfide. The mercury-containing air flows slowly along a seleniumsulfide test strip, and produces a black coloration over a length which is a directmeasure of the quantity of carbon monoxide in the original sample. Determinations can be made in a few minutes with an average error of less than 10%.The instrument may be used over wide ranges of carbon 1l1Onoxide concentrationfrom a few parts per million up to abo':'t 3%.
Figure 1. Schematic Diagram of Carbon MonoxideInstrulDent
A.. Vent to atmosphere. C. charcoal trap. H. heater coil. L.pilot lamp. P. _pump. R. reaction tube. S. sample intake. T.thermoswitch. V. four· way valve with positions S to p. P to A. P
to C. and S to C
REAGENTS AND MATERIALS
. Red Mercuric Oxide. A granular (8- to 14-mesh) form of theoxide must be used. Its preparation from mercuric nitrate hasbeen fully described (1).
Selenium Dioxide. Commercial selenium powder was purifiedas described by Campbell and McCullough (2). The pure selenium was then dissolved in C.P. nitric acid and the Tesulting solution evaporated to dryness over a sand bath or hot plate in a hood.
Fip.al heat.ing to about 140 0 to 150 0 C. for an hour or two yields apure, white product.
PREPARATION OF SELENIUM SULFIDE PAPERS
Choice of Paper. Best results have been obtained withWhatman No.1, Schleicher and Schuell (American) No. 602Extra Dense and No. 598. A heavy paper such as S. and S. No.598 takes a heavier deposit of selenium sulfide and is accordinglymore useful in the higher concentrations.
Selenious Acid Solution. The areal concentration of seleniumsulfide in the test papers is directly proportional to the cc;mcentration of selenious acid solution used. . For carbon monoxideconcentrations in the range 0 to 200 p.p.m. a solution 0.025 formalin selenious acid is satisfactory when Whatman No.1 paper isused. In the range 10,000 to 30,000 p.p.m. of carbon monoxide,1.0 F selenious acid on S. and S. No. 598 was used with success.The selenious acid concentration most satisfactory for any particular range may be estimated with sufficient accuracy fromthese figures; S. and S. No. 598 paper is about 2.5 times as thickas Whatman No. I and accordingly takes up proportionally morlfof the solution.
Impregnation of Papers with Selenium Sulfide. Large sheetsof the paper are cut into pieces about 20 cm. (8 inches) square, anda strip about 0.5 inch wide is folded down on one edge andfastened with three staples. A stiff Chromel wire about 10 incheslong is inserted under the folded part of each paper to give asuit.able handle and also to keep the papers straight when wet.
In groups of eight the papers are immersed in the selenious acidsolution for about 10 to 15 minutes. They are then hung up todrain for about 5 to 10 minutes, the time depending on the temperature and humidity of the air, until they are well beyond thedripping stage but not dry. After exposure to hydrogen sulfidegas for about 10 to 15 minutes in a large glass tank, the papers arehung up in a well ventilated place to dry. When completely drythey are stacked and pressed flat.
Baking Selenium Sulfide Papers. The stability of the seleniumsulfide papers is increased by baking for about 30 minutes at140 0 C. If forced air circulation is not provided in the oven, thepapers must be rotated or turned frequently to prevent unevensublimation of the active material During baking the clliordeepens from yellow-orange to red-orange and the colloidal particles of selenium sulfide fuse into larger glassy, atnorphous beads.X-ray diffraction patterns. of the material both before and afterbaking show no evidence of crystallinity.
Cutting of Test Strips. After about 1.5 inches from top andbottom and 0.5 inch from each side are trimmed away, the papersare cut into strips 0.125 by 4.5 inches. BeCll.usc the accuracy ofthe analyses depends on the uniformity of width of the strips, the .cutting must be done carefully. A metal spacing gage fastenedto the cutting edge of a good quality' photographic trimmingboard has been found satisfactory. The strips from a givensquare are fairly uniform, but there is often considerable variationfrom one square to another. The strips are therefore segregatedaccording to the squares from which they are 'cut and stored instoppered vials. They are stable if kept in the dark, especially ifkept cold. Papers stored in a refrigerator for over a year havekept their original calibration. Under ordinary laboratory temperatures t.he papers retain their calibration values for severalmont.h~ if kept dark.
THE INSTRUMENT
. A schemat.ic diagram of the instrument is shown in Figure 1;Figures 2 and 3 are photographs of two models of the instrument.
The pump and valve mechanism are critical parts and requiredconsiderable experimental work in their development.
The pump body consists of a stainless-steel tube 1 inch in inside diameter by 4 inches long, t.he inner sUl'face of which is
,~
;~,\
.'f
c
A
s
Improvements in the method employed both in making .theselenium sulfide papers and in their use were developed during thepresent investigation. In the preparation of the papers a betterresult from every standpoint was obtained if the selenium sulfidewas precipitated in the pores of the paper. This was accomplishedby impregnating a good quality of smooth filter paper withaqueous selenious acid solution, followed by exposure to hydrogensulfide gas. The improved method of using the papers is anadaptation of that described by Sanger and Black (6), who usedmercuric chloride test papers in the microestimation of arsenic bythe Gutzeitmethod.
Instead of impinging normally upon the test paper as in theNordlander method, the gas stream flows lengthwise along anarrow strip of the test paper. The mercury vapor produces ablack coloration which extends progressively along the strip insubstantially linear relation with the mercury-i.e., carbonmonoxide-concentration. The carbon monoxide concentrationin the original gas sample is accordingly determined by the lengthof the blackened portion of the test strip, and the necessity forphotometry is avoided.
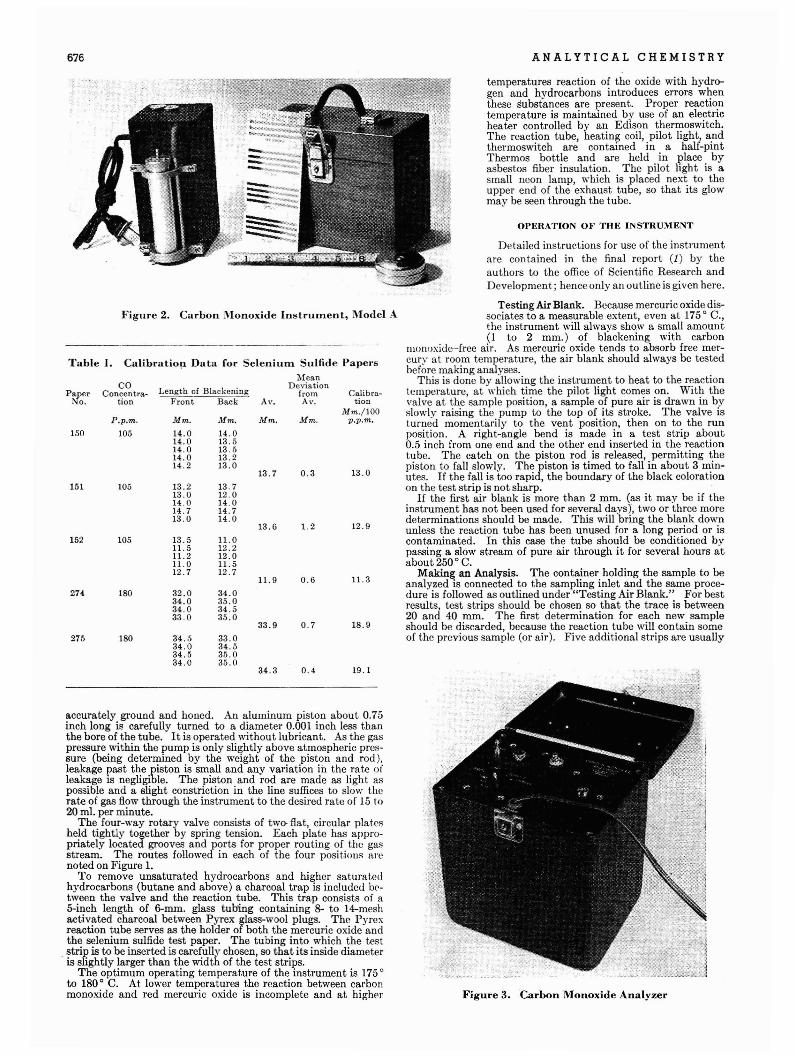
676 ANALYTICAL CHEMISTRY
Table I. Calibratio!J. Data for Selenium Sulfide Papers
Figure 2. Carbon Monoxide Instrument, Model A
temperatures reaction of the oxide with hydrogen and hydrocarbons introduces errors whenthese substances are present. Proper reactiontemperature is maintained by use of an electricheater controlled by an Edison thermoswitch.The reaction tube, heating coil, pilot light, andthermoswitch are contained in a half-pintThermos bottle and are held in place byasbestos fiber insulation. The pilot light is asmall neon lamp, which is placed next to theupper end of the exhaust tube, so that its glowmay be seen through the tube.
Figure 3. Carbon Monoxide Analyzer
OPERATION OF THE INSTRUMENT
Detailed instructions for use of the instrumentare contained in the final report (1) by theauthors to the office of Scientific Research andDevelopment; hence only an outline is given here.
Testing Air Blank. Because mercuric oxide dissociates to a measurable extent, even at 175 0 C.,the instrument will always show a small amount(l to 2 mm.) of blackening with carbon
mOIlDxide-free air. As mercuric oxide tends to absorb free mercur~r at room temperature, the air blank should always be testedbefore making analyses. .
This is done by allowing the instrument to heat to the reactIOntemperature, at which time the pilot light comes on. With thevalve at the sample position, a sample of pure air is drawn in byslowly raising the pump to the top of its stroke. The valve ist.urned momentarily to the vent position, then on to the runposition. A right-angle bend is made in a test strip about0.5 inch from one end and the other end inserted in the reactiontube. The catch on the piston rod is released, permitting thepiston to fall slowly. The piston is timed to fall in about 3 minutes. If the fall is too rapid, the boundary of the black colorationon the test strip is not sharp.
If the first air blank is more than 2 mm. (as it may be if theinstrument has not been used for several days), two or three moredeterminations should be made. This will bring the blank downunless the reaction tube has been unused for a long period or iscontaminated. In this case the tube should be conditioned bypassing a slow stream of pure air through it for several hours atabout250°C.
Making an Analysis. The container holding the sample to beanalyzed is connected to the sampling inlet and the same procedure is followed as outlined under "Testing Air Blank." For bestresults, test strips should be chosen so that the trace is between20 and 40 mm. The first determination for each new sampleshould be discarded, because the reaction tube will contain someof the previous sample (or air). Five additional strips are usually
19.1
18.9
12.9
11.3
13.0
Calibration
Mm./100p.p.m.
0.4
1.2
0.7
0.6
0.3
Mm.
MeanDeviation
fromAv.
33.9
11.9
13.6
13.7
Mm. Mm.
14.0 14.014.0 13.514.0 13.514.0 13.214.2 13.0
13.2 13.713.0 12.014.0 14.014.7 14.713.0 14.0
13.5 11.011. 5 12.211. 2 12.011.0 11.512.7 12.7
32.0 34.034.0 35.034.0 34.533.0 35.0
34.5 33.034.0 34.534.5 35.034.0 35.0
P.p.m. Mm.
105
Con~~tra- Length of Blackeninglion Front Back Av.
275 180
34.3
274 180
151 105
152 105
PaperNo.
150
accurately ground and honed. An aluminum piston about 0.75inch long is carefully turned to a diameter 0.001 inch less thanthe bore of the tube. It is operated without lubricant. As the gaspressure within the pump is only slightly above atmospheric pressure (being determined by the weight of the piston and rod),leakage past the piston is small and any variation ih the rate ofleakage is negligible. The piston and rod are made as light aspossible and a slight constriction in the line suffices to slow therate of gas flow through the instrument to the desired rate of 15 to20 ml. per minute.
The four-way rotary valve consists of two- flat, circular plat.('sheld tightly together by spring tension. Each plate has appropriately located grooves and ports for proper routing of the gasstream. The routes followed in each of the four positions arenoted on Figure 1.
To remove unsaturated hydrocarbons and higher saturatedhydrocarbons (butane and above) a charcoal trap is included brtween the valve and the reaction tube. This trap consists of a5-inch length of 6-mm. glass tubing containing 8- to I4-meshactivated charcoal between Pyrex glass-wool plugs. The Pyrexreaction tube serves as the holder of both the mercuric oxide andthe selenium sulfide test paper. The tubing into which the test
. strip is to be inserted is carefully chosen, so that its inside diameteris slightly larger than the width of the test strips.
The optimum operating temperature of the instrument is 175 °to 180 0 C. At lower temperatures the reaction between carbonmonoxide and red mercuric oxide is incomplete and at higher
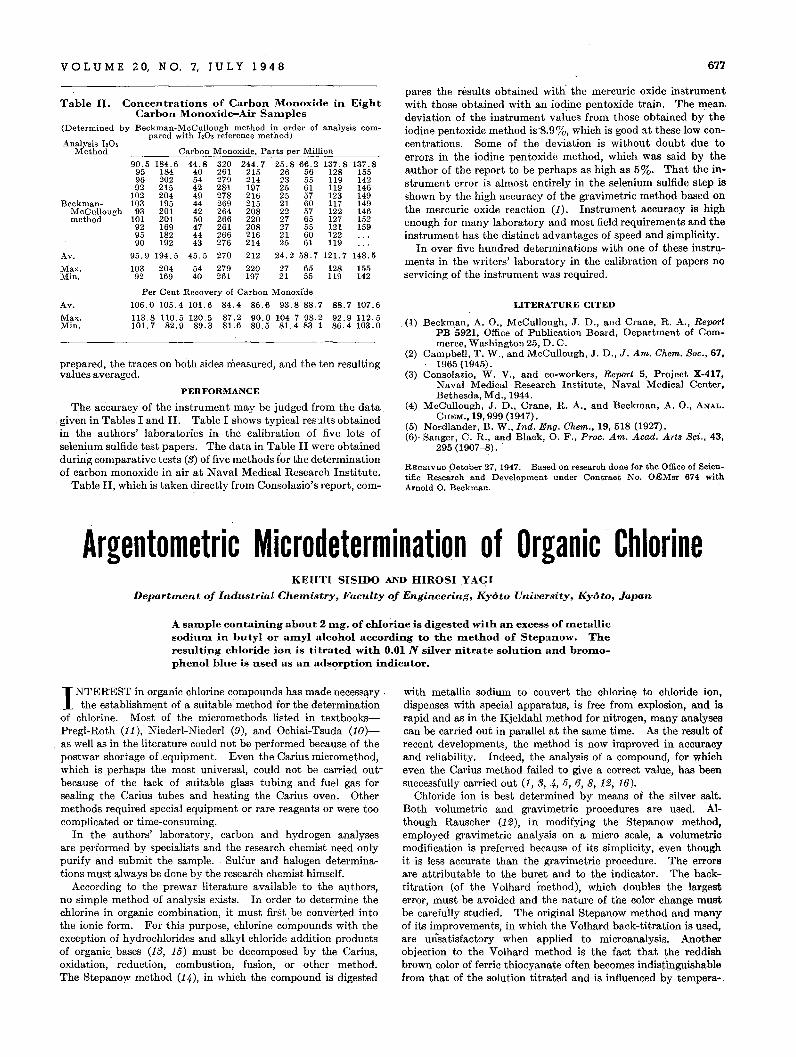
VOLUME 2O, NO. 7, JULY 1948
Table n. Concentrations of Carbon Monoxide in EightCarbon Monoxide-Air Salllpies
(Determined by Beckman-McCullough method in order of analysis com-pared with 1,0. reference method)
Analysis 1,0.Method Carbon Monoxide, Parts per Million
90.5 184.6 44.8 320 244.7 25.866.2 137.8 137.895 184 40 261 215 26 56 128 15596 202 54 279 214 23 55 119 14292 215 42 281 197 25 61 119 146
102 204 49 278 216 25 57 123 149Beckman- 103 195 44 269 215 21 60 117 149
McCullough 93 201 42 264 208 22 57 122 146method 101 201 50 266 220 27 65 127 152
92 169 .47 261 208 27 55 121 15995 182 44 266 216 21 60 12290 192 43 276 214 25 61 119
Av. 95.9 194.5 45.5 270 212 24.2 58.7 121. 7 148.5
:\1ax. 103 204 54 279 220 27 65 128 155Min. 92 169 40 261 197 21 55 119 142
Per Cent Recovery of Carbon Monoxide
Av. 106.0 105.4 101.6 84.4 86.6 93.888.7 88.7 107.6
Max. 113.8 110.5 120.5 87.2 90.0 104.798.2 92.9 112.5Min. 101. 7 82.9 89.3 81.6 80.5 81. 4 83.1 86.4103.0
prepared, the traces on bo'th sides measured, and the ten resultingvalues averaged.
PERFORMANCE
The accuracy of the instrument may be judged from the datagiven in Tables I and II. Table I shows typical res:llts obtainedin the authors' laboratories in the calibration of five lots ofselenium sulfide test papers. The data in Table II were obtaineddurin'g comparative tests (3) of five methods for the determinationof carbon monoxide in air at Naval Medical Research Institute.
Table II, which is taken directly from Consolazio's report, com-
677
pares the results obtained with' the mercuric oxide instrumentwith those obtained with an iodine pentoxide train. The mean.deviation of the instrument values from those obtained by theiodine pentoxide method is·S.9%, which is good at these low concentrations. Some of the deviation is without doubt due toerrors in the iodine pentoxide method, which was said by theauthor of the report to be perhaps as high as 5%. That the instrument error is almost entirely in the selenium sulfide step isshown by the high accuracy of the gravimetric method based onthe mercuric oxide reaction (1). Instrument accuracy is highenough for many laboratory and most field requirements and theinstrument has the distinct advantages of speed and simplicity.
In over five hundred determinations with one of these instruments in the writers' laboratory in the calibration of papers noservicing of the instrument was required.
LITERATURE CITED
(1) Beckman, A. 0., McCullough, J .. D., and Crane, R. A., ReportPB 5921, Office of Publication Board, Department of Commerce, Washington 25, D. C.
(2) Campbell, T. W., and McCullough, J. D., J. Am. Chem. Soc., 67,1965 (1945).
(3) Consolazio, W. V., and co-workers, Report 5, Project X-417,Naval Medical Research Institute, Naval Medical Center,Bethesda, Md., 1944.
(4) McCullough, J. D., Crane, R. A., and Beckman, A. 0., ANAL.CHEM., 19, 999 (1947).
(5) Nordlander, B. W.,lnd. Eng. Chem., 19, 518 (1927).(6)· Sanger, C. R., and Black, O. F., Proc. Am. Acad. Arts Sci., 43,
295 (1907-8) ..
RECEIVED October 27, 1947. Based on research done for the Ollice of Scientific Rese~rch and Development under Contract No. OEMsr 674 withArnold O. Beckman.
Argentometric Microdetermination of Organic ChlorineKEIITI slsmo AND HIROSI YAGI
Department of Industrial Chemistry, Faculty of Engineering, Kyoto University, Kyoto, Japan
A salllple containing about 2 Illg. of cWorine is digested with an excess of metallic
sodium in butyl or amyl alcohol according to the method of Stepanow. The
resuIti;ng chloride ion is titrated with 0.01 N silver nitrate solution and bromo
phenol blue is used as an adsorption indicator.
I NTEREST in organic chlorine compounds has made necessl1-ry .the establishmE)nt of a suitable method for the determination
of chlorine. Most of the micromethods listed in textbooksPregl-Roth (11), Niederl-Niederl (9), and Ochiai_Tsuda (10)as well as in the literature could not be performed because of thepostwar shortage of .equipment. Even the Carius micromethod,which is .perhaps the most universal, could not be carried outbecause of the lack of suitable glass tubing and fuel gas forsealing the Carius tubes and heating the Carius oven. Othermethods required special equipment or rare reagents or were toocomplicated or time-consuming.
In the authors' laboratory, carbon and hydrogen analysesare performed by specialists and the research chemist need onlypurify and submit the sample. Sulfur and halogen determinations must always be done by the research chemist himself.
According to the prewar literature available to the al.!-thors,no simple method of analysis exists. In order to determine thechlorine in organic combination, it must first be converted intothe ionic form. For this purpose, chlorine co~pounds with theexception of hydrochlorides and alkyl chloride addition productsof organic. bases (13, 15) must be decomposed by the Carius,oxidation, reduction, combustion, fusion, or other method.The Stepanow method (14), in which the compound is digested
with metallic sodium to convert the chlorine to chloride ion,dispenses with special apparatus, is free from explosion, and israpid and as in the Kjeldahl method for nitrogen, many analysescan be carried out in parallel at the same time. As the result ofrecent developments, the method is now improved in accuracyand reliability. Indeed, the analysis of a compound, for whicheven the Carius method failed to give a correct value, has beensuccessfully carried out (1, 3, 4, 5, 6, 8, 12, 16).
Chloride ion is best determined by means of the silver salt.Both volumetric and gravimetric procedures are used. Although Rauscher (12), in modifying the Stepanow method,employed gravimetric analysis on a micro scale, a volumetricmodification is preferred because of its simplicity, even thoughit is less accurate than the gravimetric procedure. The errorsare attributable to the buret and to the indicator. The backtitration (of the Volhard method), which doubles the largesterror, must be avoided and the nature of the color change mustbe carefully studied. The original Stepanow method and manyof its improvements, in which the Volhard back-titration is used,are unsatisfactory when applied to microanalysis. Anotherobjection to the Volhard method is the fact that the reddishbrown color of ferric thiocyanate often becomes indist'inguishablefrom that of the solution titrated and is influenced by tempera-.
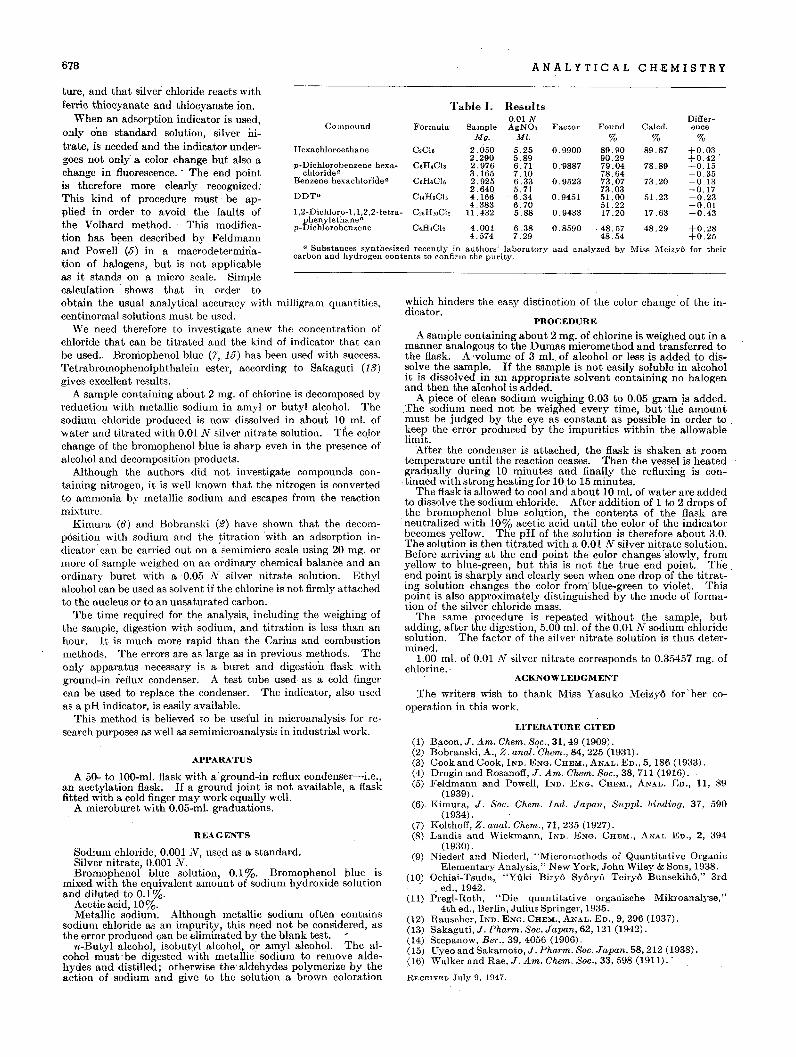
a Substances synthesized recently in authors' laboratory and analyzed by lVIiss Meizy6 for theircarbon and hydrogen contents to confirm the purity.
which hinders the easy distinction of the color change of the in-dicator. .
PROCEDURE
A sample containing about 2 mg. of chlorine is weighed out in amanner analogous to the Dumas micromethod and transferred tothe flask. A 'volume of 3 mI.. of alcohol or less is added to dissolve the sample. If the sample is not easily soluble in alcoholit is dissolved in an appropriate solvent containing no halogenand then the alcohol is added.
A piece of clean sodium weighing 0.03 to 0.05 gram is added..The sodium need not be weighed every time, but the amountmust be judged by the eye as constant as possible in order to .keep the error produced by the impurities within the allowablelimit..
After the condenser is attached, the flask is shaken at roomtemperature until the reaction ceases. Then the vessel is heatedgradually during 10 minutes and finally the refluxing is con.tinued with strong heating for 10 to 15 minutes.
The flask is allowed to cool and about 10 m!' of water are addedto dissolve the sodium chloride. After addition of 1 to 2 drops ofthe bromophenol blue solution, the contents of the flask areneutralized wit.h 10% acetic acid until the color of the indicatorbecomes yellow. The pH of the solution is therefore abolit 3.0.The solution is then titrated with a 0.01 N silver nitrate solution.Before arriving at the end point the color changes'slowly, fromyellow to blue-green, but this is not the true end point. Theend .point is sharply and clearly seen when one drop of the titrating solution changes the color from' blue-green to violet. Thispoint. is also approximately distinguished by the mode of formation of the silver chloride mass.
The same procedure is repeated without the sample, butadding, after the digestion, 5.00 m!' of the 0.01 N sodium chloridesolution. The factor of the silver nitrate solution is thus determined.
1.00 m!' of 0.01 N silver nit.rate corresponds to 0.35457 mg. ofchlorine.'
APPARATUS
A 50- to 100-m!. flask with a'ground-in reflux condenser-i.e.,an acetylation flask. If a ground joint. is not available, a flaskfitted with a cold finger may work equally wei!.
A microburet with 0.05-m!. graduations.
REAGENTS
Sodium chloride, 0.001 N, used as a st.andard.Silver nit.rate, 0.001 N. .Bromophenol blue solution, 0.1 %. Bromophenol blue is
mixed wit.h the equivalent amount of sodium hydroxide solutionand diluted to 0.1 %.
Acetic acid, 10%.Metallic sodium. Although metallic sodium often contains
sodium chloride as an impurity, this need not be considered, asthe error produced can be eliminated by the blank test. -
n-Butyl alcohol, isobutyl alcohol, or amyl alcohol. The alcohol must- be digested with metallic sodium to remove aldehydes and distilled; otherwise the' aldehydes polymerize by theaction of sodium and give to the solution a brown coloration
ANALYTICAL C HEM I S TRY
Table J. Results0.01 N Differ-
Formula Sample AgNO, Factor Found Calcd. Booe
Mu. MI. % % %C,CI, 2.050 5.25 0.9900 89.90 89.87 +0.03
2.290 5.89 90.29 +0.42 .C,H,Clo 2.976 6.71 0:9887 79.04 78.89 +0.15
3.165 7.10 78.64 -0.35C,H,CI, 2.925 6.33 0.9523 73.07 73.20 -0.13
2.640 5.71 73.03 -0.17C14H,CI, 4.166 6.34 0.9451 51.00 51.23 -0.23
4.383 6.70 51.22 -0.01C"H20CI, 11.432 5.88 0.9433 17.20 17.63 -0.43
C,H,CI, 4.001 6.38 0.8590 .48.57 48.29 +0.284.574 7.29 48.54 +0.25
LITERATURE CITED
(1) Bacon, J. Am. Chem. Sqc., 31,49 (1909).(2) Bobranski, A" Z. anal, Chem., 84, 225 (1931).(3) Cook and Cook, IND. ENG. CHEM., ANAL. ED., 5, 186 (1933).(4) Drogin and Rosanoff, J. Am. Chem. Soc., 38, 711 (1916).(5) Feldmann and Powell, IND. ENG. CHEM., ANAL. ED., 11, 89
(1939) .(6) Kimura, J. Soc. Chem. Ind. Japan, Suppl. binding, 37, 590
(1934) .Kolthoff, Z. anal. Chem., 71, 235 (1927).Landis and Wickmann, IND. ENG. CHEM., ANAL ED., 2, 394
(1930) .(9) Nieder! and Niederl, "Micromethods of Quantitative Organic
Elementary Analysis," New York, John Wiley & Sons, 1938.Ochiai-Tsuda, "Yuki Biry6 Sy6ry6 Teiry6 Bunsekih6," 3rd. ed., 1942. '
Pregl-Roth, "Die quantitative organische Mikroanalyse,"4th ed., Berlin, Julius Springer, 1935.
Rauscher, IND. ENG, CHEM., ANAL. ED., 9, 296 (1937).Sakaguti, J. Pharm. Soc. Japan, 62,121 (1942).Stepanow, Ber., 39, 4056 (1906).Dyeo and Sakamoto, J.Pharm. Soc. Japan, 58, 212 (1938).Walker and Rae, J. Am. Chem. Soc., 33, 598 (1911) ..
(7)(8)
RECEIVED July 9, 1947.
(12)(13)(14)(15)(16)
(11)
(1~)
ACKNOWLEDGMENT
The writers wish to thank Miss Yasuko Meizy6 for' her cooperation in this work.
Compound
Hexachloroethane
l,2-Dichloro-1,l.2,Z-tetraphenylethanea
p-Dichlorobenzene
p~Dichlorobenzenehexachloridea
Benzene hexachlor'id.ea
678
ture, and t.hat. silvel: chloride react.s withferric thiocyanate and thiocyanat.e ion.
When an adsorpt.ion indicat.or is used,only one st.andard solut.ion, silvernitrate, is needed and t.he indicator underc
goes not. only" a color change but also achange in fluorescence. - The end pointis therefore more clearly recognized:This kind of procedure must. be applied in order to avoid the fault.s ofthe Volhard method. This modificat.ion has been described by Feldmannand Powell (5) in a macrodetermiriation of halogens, but is not. applicableas it. st.ands on a micro scale. Simplecalculat.ion shows t.hat. in order t.oobt.ain the usual analyt.ical accuracy wit.h milligram quantities,eentinormal solutions must. be used.
We need t.herefore t.o investigat.e anew t.he concent.rat.ion ofehloride that can be t.itrated and t.he kind of indicat.or t.hat canbe used. Bromophenol blue (7,15) has been used wit.h success.Tet.rabromophenolphthalein est.er, according t.o Sakagut.i (13)gives excellent. result.s.
A sample cont.aining about. 2 mg. of ehlorine is decomposed byreduction wit.h met.allic sodium in amyl or but.yl alcoho!' Thesodium chloride produced is now dissolved in about 10 m!' ofwat.er and t.it.rat.ed wit.h 0.01 N silver nit.rat.e solut.ion. Tl'te co.lorchange of t.he bromophenol blue is sharp even in t.he presence ofalcohol and decomposit.ion product.s.
Although the authors did not invest.igate compounds containing nitrogen, it is well known that the nitrogen is convertedto ammonia by metallic sodium and escapes from the reactionmixture.
Kimura (6) and Bobranski (2) have shown that. the decomposition with sodium and the titration 'with an adsorpt.ion indicator' can be carried out on a' semimicro scale using 20 mg. ormore of sample weighed on an ordinary chemical balance and anordinary buret with a' 0.05 N silver nitrate solution. Ethylalcohol can be used as solvent if the chlorine is not firmly att.achedto the nucleus or to an unsaturated carbon.
The time required for the analysis, including the weighing ofthe sample, digestion with sodium, and tit.ration is less t.han anhour. It is much more rapid than the Carius and combustionmethods. The errors are as large as in previous methods. The'only apparatus necessary is a buret. and digestion flask withground-in reflux condenser. A test tube used as a cold fingercan be used to replace the condenser. The indicator, also usedas a pH indicator, is easily available.
This method is believed to be useful in microanalysis· for research purposes as well as semimicroanalysis in industrial work.
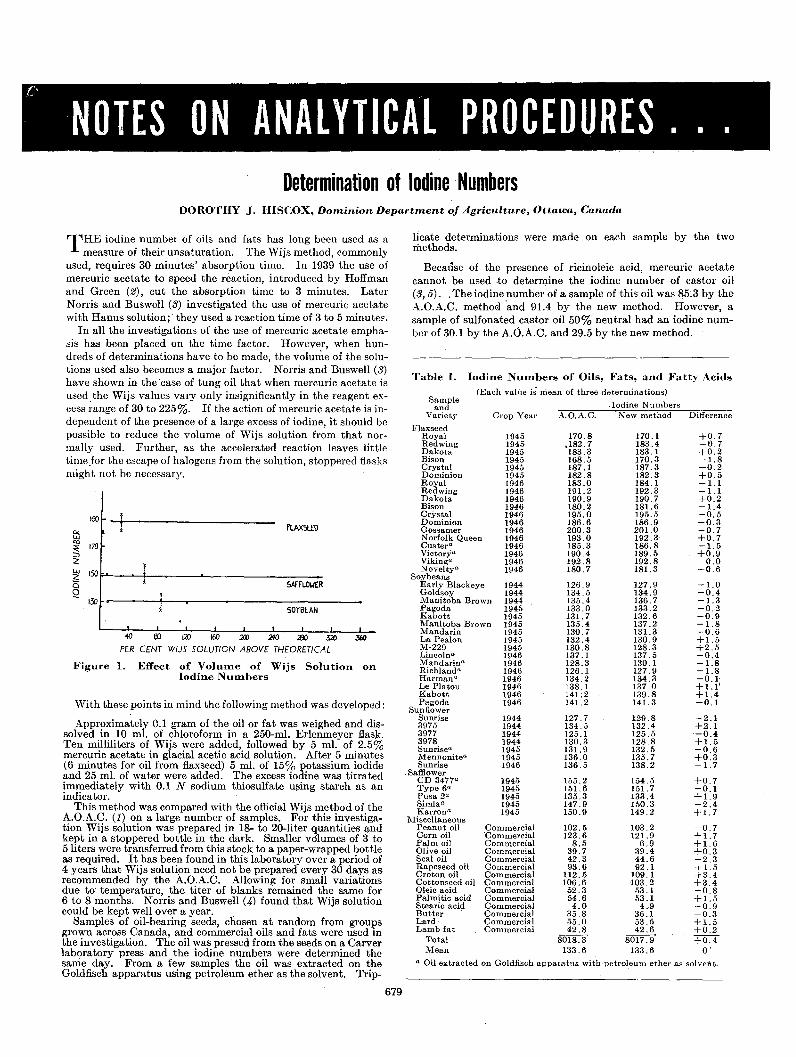
(' NOTES ON ANALYTICAL PROCEDURES ...Determination of Iodine Numbers
DOROTHY J. HISCOX, Dominion Department of Agriculture, Ottawa, Canada
SOYBEAN
~ 00 ~ IW W ~ m ~ ~
PER CENT WUS SOLUTION ABOVE THEORETICAL
Figure 1. Effect of VoluIlle of Wijs Solution onIodine NUIllbers
THE iodine number of oils and fats has long been used as ameasure of their unsaturation. The Wijs method, commonly
used, requires 30 minutes' absorption time. In 1939 the use ofmercuric acetate to speed the reaction, introduced by Hoffmanand Green (2), cut the absorption time to 3 minutes. LaterNorris and Buswell (3) investigated the use of mercuric acetatewith Hanus solution;' they used a reaction time of 3 to 5 minutes.
In all the investigations of the use of mercuric acetate emphasis has been placed on the time factor. However, when hundreds of determinations have to be made, the volume of the solutions used also becomes a major factor. Norris and Buswell (3)have shown in the 'case of tung oil that when mercuric acetate isused the Wijs values vary only insignificantly in the reagent excess ;'ange of 30 to 225 %. If the action of mercuric acetate is independent of the presence of a large excess of iodine, it should bcpossible to reduce the volume of Wijs solution from that normally used. Further, as the accelerated reaction leaves littletime.for the escape of halogens from the solution, stoppered flasksmight not be necessary.
With these points in mind the following method was developed:
Approximately 0.1 gram of the oil or fat was weighed and dissolved in 10 m!. of chloroform in a 250-m!. Erlenmeyer flask.Ten milliliters of Wijs were added, followed by 5 m!. of 2.5%mercuric acetate in glacial acetic acid solution. After 5 minutes(6 minutes for oil from flaxseed) 5 m!. of 15% potassium iodideand 25 m!. of water were added. The excess iodine was titratedimmediately with 0.1 N sodium thiosulfate u~ing starch as anindicator.
This method was compared with the official Wijs method of theA.O.A.C. (1) on a large number of samples. For this investigation Wijs solution was prepared in 18- to 20-liter quantities l),udkept in a stoppered bottle in the dark. Smaller v6lumes of 3 to5 liters were transferred from this stock to a paper-wrapped bottleas required. It has been found in this laboratory over a period of4 years that Wijs solution need not be prepared every 30 days asrecommended by the A.O.A.C. Allowing for small variationsdue to temperature, the titer of blanks remained the same for6 to 8 months. Norris and Buswell (4) found that Wijs solutioncould be kept well over a year. .
Samples of oil-bearing seeds, chosen at random from groupsgrown across Canada, and commercial oils and fats were used inthe investigation. The oil was pressed from the seeds on a Carverlaboratory press and the iodine numbers were determined thesame day. From a few samples' the oil was extracted on theGoldfisch apparatus using petroleum ether as the solvent. Trip-
679
licate determinations were made on each sample by the twomethods.
T.able I. Iodine NUIllbers of Oils, Fats, and Fatty Acids
Because of the presence of ricinoleic acid, mercuric acetatecannot be used .to determine the iodine number of castor oil(3,5). .The iodine number of a sample of this oil was 85~3 by theA.O.A.C. method 'and 91.4 by the new method. However, asample of sulfonated castor oil 50% neutral had an iodine number of 30.1 by the A.O.A.C. and 29.5 by the new method.
(Each vahle is lliean of three determinations)Sample
.Iodine NumbersandVariety Crop Year A.O.A.C. New method Difference
FlaxseedRoyal 1945 170.8 170.1 +0.7Redwing 1945 .182.7 183.4 -0.7Dakota 1945 183.3 183.1 +0.2Bison 1945 168.5 .170.3 -1.8Crystal 1945 187.1 187.3 -0.2Dominion 1945 182.8 182.3 +0.5Royal 1946 183.0 184.1 -1.1Redwing 1946 191.2 192.3 -1.1Dakota 1946 190.9 190.7 +0.2Bison 1946 180.2 181.6 -1.4Crystal 1946 195.0 195.5 -0.5Dominion 1946 186.6 186.9 -0.3Gossamer 1946 200.3 201.0 -0.7Norfolk Queen 1946 193.0 192.3 +0.7Custer a 1946 185.3 186.8 -1.5Victorya 1946 190.4 189.5 +0~9Vikinga 1946 192.8 192.8 0.0Novelty· 1946 180.7 181.3 -0.6
SoybeansEarly Blackeye 1944 126.9 127.9 -1.0Goldsoy 1944 134.5 134.9 -0.4Manitoba Brown 1944 135.4 136.7 -1.3Pagoda 1945 133.0 133.2 -0.2Kabott 1945 131. 7 132.6 -0.9l\tlanitoba Brown 1945 135.4 137.2 -1.8Mandarin 1945 130.7 131.3 -0.6La Pealon 1945 132.4 130.9 +1.5M-229 1945 130.8 128.3 +2.5Lincolna 1946 137.1 137.5 -0.4Mandarina 1946 128.3 130.1 -1.8Richland n 1946 126.1 127.9 -1.8Harmanu 1946 134.2 134.3 -0.1-Le Platou 1946 138.1 137.0 +1.1'Kabott 1946 141 :2 139.8 +1.4Pagoda 1946 141.2 141.3 -0.1
SunflowerSunrise 1944 127.7 129.8 -2.13975 1944 134.5 132.4 +2.13977 1944 125.1 125.5 -0.43978 1944 130.3 128.8 +1.5Sunrisea 1945 131. 9 132.5 -0.6Mennonitea 1945 136.0 135.7 +0.3Sunrise 1946 136.5 138.2 -1. 7
. SafflowerCD 3477" 1945 155.2 154.5 +0.7Type 6" 1945 151.6 151.7 -0.1Pusa 2~ 1945 135.3 133.4 +1.9Simlaa 1945 147.9 150.3 -2.4Karrona 1945 150.9 149.2 +1.7
l\liscellaneousPeanut oil Commercial 102.5 103.2 -0.7Corn oil ·Commercial 123.6 121. 9 +1.7Pa.lm oil Commercial 8.5 6.9 +1.6Olive oil Commercial 39.7 39.4 +0.3Seal oil Commercial 42.3 44.6 -2.3Rapeseed oil Commercial 93.6 92.1 +1.5Croton oil Commercial 112.5 109.1 +3.4Cottonseed oil Commercial 106.6 103.2 +3.4Oleic acid Commercial 52.3 53.1 -0.8Palmitic acid Commercial 54.6 53.1 +1.5Stearic acid Commercial 4.0 4.9 -0.9Butter Commercial 35.8 36.1 -0.3Lard· Commercial 55.0 53.5 +1,5Lamb fat COlllmercial 42.8 42.6 +0.2
Total 8018.3 8017.9 +0.4Mean 133.6 133.6 0'
o a Oil extracted on Goldfisch apparatus with 'petrol,eunt ether as solvept.
fLAXSEEO
SAffLO\.IER
100
'"UJco170§
:z:UJ ISO?;cQ
130
680 ANALYTICAL CHEMISTRY
The results of the iodine number determinations are given inTable I, which lists the means of the triplicate iodine numbersdetermined by the two methods and the differences betweenthem. There is no difference between the means of the methods.In some individual samples the difference.is relatively large buta statistical analysis of all the results showed that these differences are not significant. The reduction in the volume of Wijssolution did not affect the accuracy of the determination to anysignificant extent. The standard error of a ~ingle mean, basedon triplicll,te determinations, was calculated for each type of oi!.It was the same by both methods for soybean (±0.7), safflower( :<,0.7), and thl;), miscellaneous group (±0.5). For flaxseed bythe A.O.A.C. me.thod it was ±0.9 and by the modified mercuricacetate method ±0.8, whereas for sunflower it was ±O.7 and±0.3, respectively.
With the volume of Wijs solution reduced to 10 m!. it seemedadvisable to determine how far this was above the theoretical requirements and how close to the theoretical the volume could bebrought without affecting the iodine number. For this purposecomposite samples of freshly pressed oil from soybeans, safflower,and flaxseed were used. The iodine number was determined intriplicate on 0.10o-gram samples, using varying amounts of Wijssolution. Five-minute absorption periods were used except foroil from flaxseed, where 6 minutes were allowed. From thevalues obtained using 25 m!. of Wijs solution the theoreticalvolume required for 0.100 gram of each oil was calculated.
The results of this experiment are presented graphically inFigure 1. The equations for th~ lines were calculated from thefirst five values for flaxseed, six for soybeans, and all for the safflower. The lines have been extended in the graph. only as far asthese values. The position of 10 m!. of Wijs solution is indicatedon each line by the vertical broken line marked X. The lineextends well beyond this point in each case, so 10 m!. of Wijs aremore than sJIfficient for the satisfactory determination of iodinenumbers. The regression coefficient was calculated in each caseand was insignificant. The lines, for ·all practical purposes, areparallel to the axis. Inspection of Figure 1 shows that for iodine
numbers of 200 no excess of Wijs solution is present. Consequently when only Ip m!. are used, the weight of sample must bereduced if the iodine number is over 200.
In all but the safflower samples the value of the iodine numberdecreases when the· volume of Wijs solution closely approachesthe theoretical volume. This decrease may be partly compensated for by an increased time interval. When the smallestvolume of Wijs solution was uscd in the experiment with flaxseed and the time was increased to 10 minutes, the value of theiodine number was increased from 181.5 to 183.7. With soy-'beans, the increase was from 127.1 to 128.2.
SUMMARY AND CONCLUSIONS
The mercuric acetate method of determining iodine numberswas modified by reducing the volume of Wijs solution and usingunstoppered flasks. Comparison with the offipial Wijs methodof the Association of Official Agricultural Chemists on a largenumber of samples showed no significant difference between theresults obtained.
The effect of decreasing amounts of Wijs solution on the valueof iodine numbers was investigated. With nonconjugated fatsand oils 10 m!. of Wijs solutjon are sufficient for O.l-gram samples,provided the iodine value is not more than 200..
ACKNOWLEDGMENT
Acknowledgment is made to the Adams Chemical Companyfor the supply of sulfonated castor oi!.
LITERATURE CITED
(1) Assoc. Official Agr. Chern., Offic~al and Tentative Methoas ofAnalysis, p. 495 (1945).
(2) Hoffman, H. D., and Green, C. E.,. Oil and Soap, 16, 236 (1939).(3) Norris, F. A., and Buswell, R. J., IND. ENG. CHEM., ANAL. ED.,
15, 258 (1943).(4) Ibid., 16, 417 (1944).(5) .Skell, P. S., and Radlove, S. B., Ibid., 18, 67 (1946).
RECEIVED September 17, 1947. Contribution 139, Division of Chemistry,Science Service, Dominion Department of Agriculture.
New pH Indicator for Titratio.n of Sodium_CarbonateDisodium 4,4'-Bis(2-amino-l.,naphthylazo)-2,2'-stilbenedisulfonate
MICHAEL TARAS, Department of Water Supply, Detroit, Mich.
-INDICATOR PROPERTIES
The dye was prepared by the tetraazotization of 9.5 grams(0.025 M) of 4,4'-diaminostilbene-2,2'-disulfonic acid, Eastman Kodak T4614, and coupling with 8.0"grams (0.06 M) of
l3-naphthylamine, Eastman Kodak 174 (5). The amine was firstdissolved in 50 ml. of glacial acetic acid and distilled water wasadded with stirring to a 100-ml. volume. Coupling was accomplished in this 50% acetic acid solution.
.The disodium salt was formed by grinding a weighed quantityof the dye in' a mortar with the calculated volume of 0.05 N sodium hydroxide and diluting to the proper concentration. Twoconcentrations of the dye were tested for indicator efficiency:0.5 and 0.1 %. Both solutions have a deep red color. Two or 3drops of the 0.5% solution suffice for every 5O-m!. volume titrated.. In the case of the 0.1% solution about 10 drops areneeded for the same volume. .
The 0.5% solution possesses a sirupy consistency, presenting aminor problem of handling. On this account, most of the titrations reported in this paper were performed with the 0.1 % solution.
The color characteristics of the indicator were tested usingsodium dibasic phosphate-citric acid buffers (3). These buffersolutions showed the alkaline color of the indicator to be a delicate.
pH of 3.8, the indicator lends itself advantageously to -the titration of 0.2 Nand 0.5 N sodium carbonate solutions on the onehand, or alternatively, to the direct titration of proportionate
amounts of.the solid salt.SOaH
bSOaHIo CH=CHN N
authority, the dye is known in the color trade as Hessian PurpleN extra and Direct Purple.
A study of the dye's properties discloses that it may functionprofitably as a titrimetric indicator in the pH region near 4.0.
The defects of methyl orange indicator in the acid titration ofcarbonates have long been recognized. Up to the present, theremedy has consisted principally in modifying the indicatorthrough the addition of inert dyes like cyanole xylene FF (2).Occasionally, bromophenol blue has been substituted for methylorange in this' titration (6). More recently, modified methyl.yellow indicator (1) has been proposed for this titration. Eachindicator possesses peculiar merits and, handled discriminatingly,provides advantages over the. older methyl orange dye.
Inasmuch as the sharpest color change of disodium 4,4'-bis(2-amino-1-naphthylazo)-2,2'-stilbenedisulfonate occurs at a
THE dye resulting from the coupling of 1 mole of 4,4'-diaminostilbene-2,2'-disulfonic acid with 2 moles of l3-naphthyl
amine is assigned the formuhi by Schultz (4). According to this
8~~~
N N
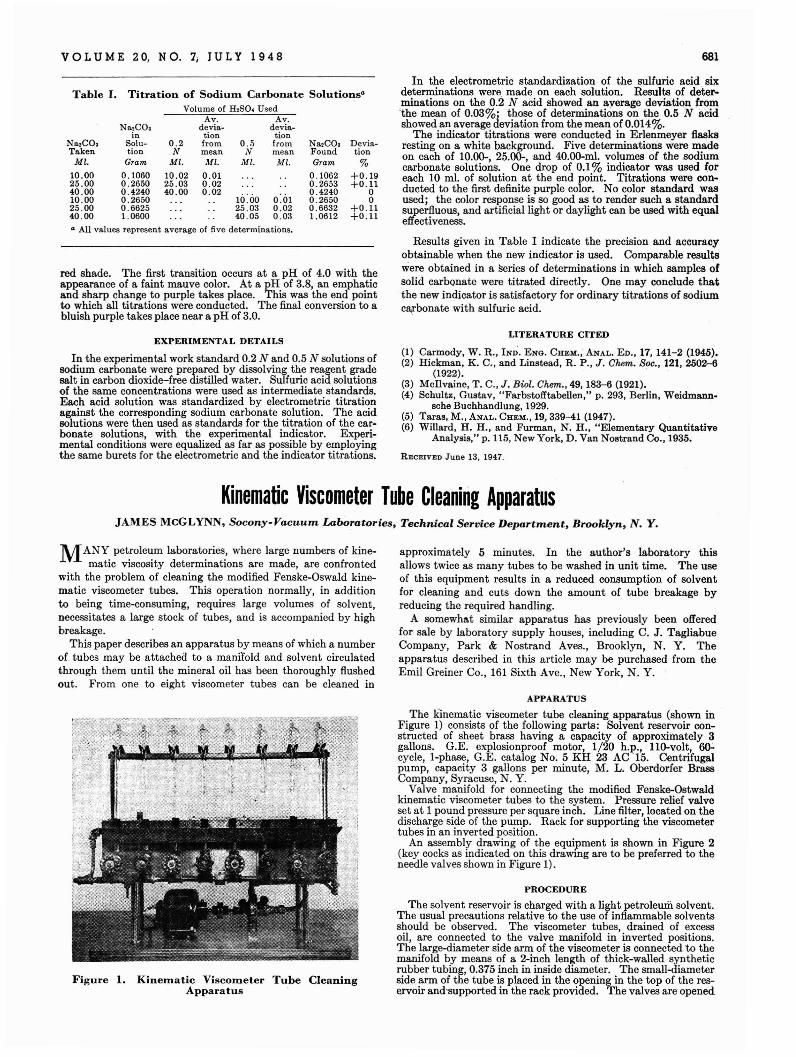
VOL U M E 20, N O. 7; J U L Y 1 948 681
Table I. Titration of Sodium Carbonate SolutionsG
Volume of H,SO. Used
red shade. The first transition occurs at a pH of 4.0 with theappearance of a faint mauve color. At a pH of 3.8, an emphaticand sharp change to purple takes place. This was the end pointto which all titrations were conducted. The final conversion to abluish purple takes place near a pH of 3.0.
G All values represent average of five determinations.
In the electrometric standardization. of the sulfuric acid sixdeterminations were made on each solution. Results of determinations on the 0.2 N acid showed an average deviation from·the mean of 0.03%; those of determinations on the 0.5 N aCidshowed an average deviation from the mean of 0.014%.
The indicator titrations were conducted in Erlenmeyer flasksresting on a white background. Five determinations were madeon each of 10.00-, 25.00-, and 40.00-ml. volumes of the sodiumcarbonate solutions. One drop of 0.1% indicator was used foreach 10 ml. of solution at the end point. Titrations were conducted'to the first definite purple color. No color standard wasused; the color response is so good as to render such a standardsuperfluous, and artificial light or daylight can be used with equaleffectiveness.
Results given in Table I indicate the precision and accuracyobtainable when the new indicator is used. Comparable resultswere obtained in a series of determinations in which samples ofsolid carbonate were titrated directly. One may conclude thatthe new indicator is satisfactory for ordinary titrations of sodiumcli,rbonate with sulfuric acid.
Deviation
%+0.19+0.11
oo
+0.11+0.11
Na,CO.FoundGram
0.10620.26530.42400.26500.66321.0612
0:010.020.03
1<i:oo25.0340.05
Av. Av.devia- devia-
tion tionfrom 0.5 frommean N meanMI. MI. MI.
0.010.020.02
0.2N
MI.
10.0225.0340.00
0.10600.26500.42400.26500.66251.0600
Na,CO.in
Solution
Gram
Na,CO.Taken
Ml.
10.0025.0040.0010.0025.0040.00
EXPERIMENTAL DETAILS
In the experimental work standard 0.2 Nand 0.5 N solutions ofsodium carbonate were prepared by dissolving the reagent gradesalt in carbon dioxide-free distilled water. Sulfuric acid solutionsof the same concentrations were used as intermediate standards.Each acid solution was standardized by electrometric titrationagainst the corresponding sodium carbonate solution. The acidsolutions were then used as standards for the titration of the carbonate solutions, with the experimental indicator. Experimental conditions were equalized as far as possible by employingthe same buret.s for the electrometric and the indicator titrations.
LITERATURE CITED
(1) Carmody, W. R., INI). ENG. CHEM.; ANAL. ED., 17, 141-2 (1945).(2) Hicbnan, K. C., and Linstead, R. P., J. Chem. Soc., 121, 2502-6
(1922). . .(3) McIlvaine, T. C., J. Biol. Chem., 49, 183-6 (1921).(4) Schultz, Gustav, "Farbstofftabellen," p. 293, Berlin, Weidmann
sche Buchhandlung, 1929.(5) Taras, M., ANAL. CHEM., 19.,339-41 (1947).(6) Willard, H. H., and Furman, N. H., "Elementary Quantitative
Analysis," p. 115, New York, D. Van Nostrand Co., 1935.
RECEIVED June 13, 1947.
Kinematic Viscometer Tube Cleaning ApparatusJAMES McGLYNN. Socony-Vacuum Laboratories, Technical Service Department, Brooklyn, N. Y.
M ANY petroleum laboratories, where large numbers of kine-matic viscosity determinations are made, are confronted
with the problem of cleaning the modified Fenske-Oswald kinematic viscometer tubes. This operation normally, in additionto being time-consuming, requires large volumes of solvent,necessitates a large stock of tubes, and is accompanied by highbreakage.
This paper describes an apparatus by means of which a numberof tubes may be attached to a manilold and solvent circulatedthrough them until the mineral oil has been thoroughly flushedout. From one to eight viscometer tubes can be cleaned in
approximately 5 minutes. In the author's laboratory thisallows twice as many tubes to be washed in unit time. The useof this equipment results in a reduced consumption of solventfor cleaning and cuts down the amount of tube breakage byreducing the required handling.
A somewhll.t similar apparatus has previously been offeredfor sale by laboratory supply houses, including C. J. TagliabueCompany, Park & Nostrand Aves., Brooklyn, N. Y. Theapparatus described in this article may be purchased from theEmil Greiner Co., 161 Sixth Ave., New York, N. Y.
Figure 1. Kinem.atic Viscometer Tube CleaningApparatus
APPARATUS
The Kinematic viscometer tube cleaning apparatus (shown inFigure 1) consists of the following parts: Solvent reservoir .constructed of sheet brass having a capacity of approximately 3gallons. G.E. explosionproof motor, 1/20 h.p., nO-volt, 60cycle, I-phase, G.E. catalog No.5 KH 23 AC·15. Centrifugalpump, capacity 3 gallons per minute, M. L. Oberdorfer BrassCompany, Syracuse, N. Y.
Valve manifold for connecting the modified Fenske-Ostwaldkinematic viscometer tubes to the system. Pressure relief valveset at 1 pound pressure per square inch. Line filter, located on thedischarge side of the pump. Rack for supporting the viscometertubes in an inverted position.
An assembly drawing of the equipment is shown in Figure 2(key cocks as indicated on this drawing are to be preferred to theneedle valves shown in Figure 1).
PROCEDURE
The solvent reservoir is charged ~ith a light petroleum solvent.The usual precautions relative to the use of inflammable solventsshould be observed. The viscometer tubes, drained of excessoil, are connected to the valve manifold in inverted positions.The large-diameter side arm of the viscometer is connected to themanifold by means of a 2-inch length of thick-walled syntheticrubber tubing, 0.375 inch in inside diameter. The small-diameterside arm of the tube is placed in the opening in the top of the rese,rvoir and'supported in the rack provided. The valves are opened
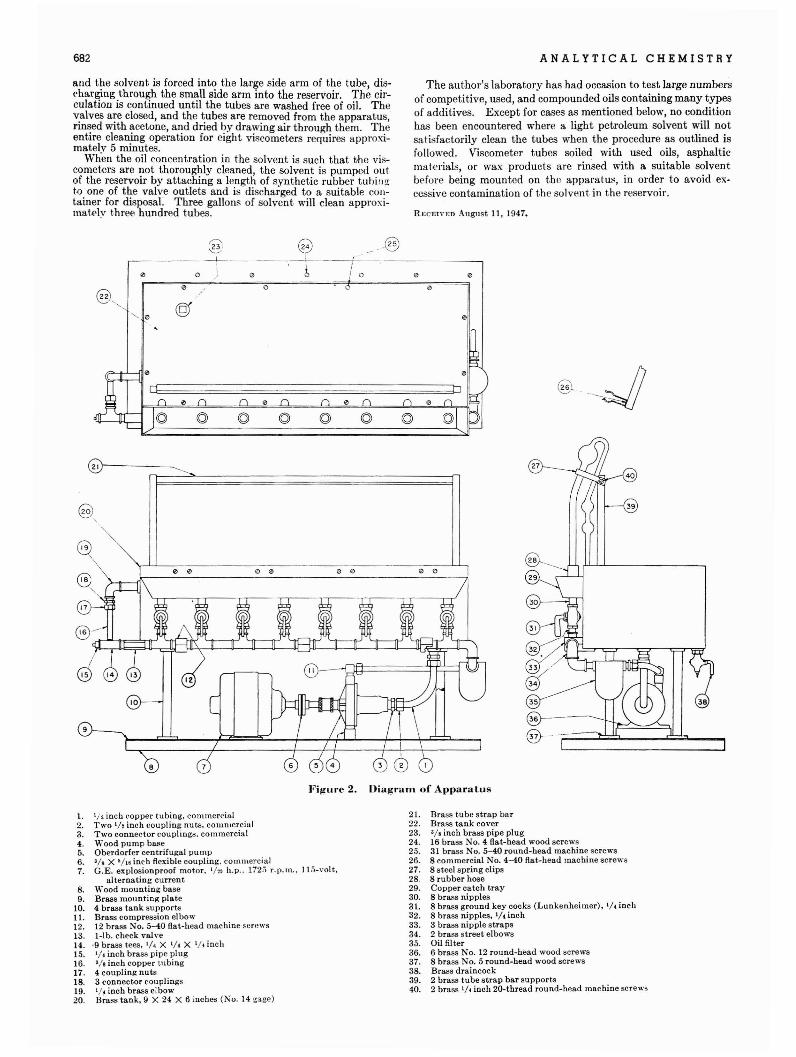
682
and the solvent is forced into the large side arm of the tube, discharging through the small side arm into the reservoir. The circulation is continued until the tubes are washed free of oil. Thev:alves a~e closed, and the ~ubes are removed from the apparatus,rmsed WIth acetone, and dned by drawing air through them. Theentire cleaning operation for eight viscometers requires approximately 5 minutes.
Whim the oil concentration in the solvent is such that I,hc viscometers are not thoroughly cleaned, the solvent is pumped outof the reservoir by attaching a length of synthetic rubber tubi!l;!:t·o one of the valve outlets and is discharged to a suitable COIl
tainer for disposal. Three gallons of solvent will clean approximatRI~' t,hree hundred tubes.
ANALYTICAL CHEMISTRY
The author's laboratory has had occasion to test large numbersof competitive, used, and compounded oils containing many typesof additives. Except for cases as mentioned below, no conditionhas been encountered where a light petroleum solvent will notsatisfactorily clean the tubes when the procedure as outlined isfollo\\·ed. Viscometer tubes soiled with used oils, asphalticmat·erials, or wax products are rinsed with a suitable solventbt'fore being mounted on the apparatus, in order to avoid excessive contamination of the solvent in the reservoir.
RECEl\·F.O August 11, 194i•
@ ~..@
.. 0\
0 b ! 0/ '" '"@ '" 0 0
"- ©'-0 '"
21)------~
@,
@ ...-;Jj
35
@-@ .. -~~~U----,
Fij!ure 2. Diagram of Apparatus
1. liz inch copper tubing, commercial2. Two I/! inch coupling nuts, cOlUmercial3. Two connector couplings. commercial4. Wood pump base5. Oberdorfer centrifugal pump6. 'J/s X ~/16 inch ftexible coupling. commerciali. G.E. explosiollproof motor. I/"!!l h.p.. 172~ r.p.m,. 115-\-0It,
alternat.ing current.8. Wood mounting base9. Brass mounting plate
10. 4 brass tank support«11. Brass compression elbow12. 12 brass No. 5-40 flat-head machine sero,,"S13. I-lb. check Yah-eH. -9 brass tees. ,/. X 1/. X '/< inch15. 1/. inch brass pipe plug16. 3/8 inch copper tubing17. 4 coupling nut.18. 3 connector couplings19. ,/. inch brass elbow20. Bra.. tank. 9 X 24 X 6 inches (No. 14 ~age)
21. Brass tube strap bar22. Brass tank cover23. '/. inch brass pipe plug24. 16 brass No.4 flat-head wood screws25. 31 brass No. 5-40 round-head machine screws26. 8 commercial No. 4-40 flat-head machine screws27. 8 steel spring clips28. 8 rubber hose29. Copper catch tray30. 8 brass nipples31. 8 brass ground key cocks (Lunkenheimerl, ,/. inch32. 8 brass nipples, 1/. inch33. 3 brass nipple straps34. 2 brass street elbows35. Oil filter36. 6 brass No. 12 round-head wood screws37. 8 brass No.5 round-head wood screws38. Brass draincock39. 2 brass tube strap bar supports40. 2 brass '/. inch 20-thread round-head machine screws
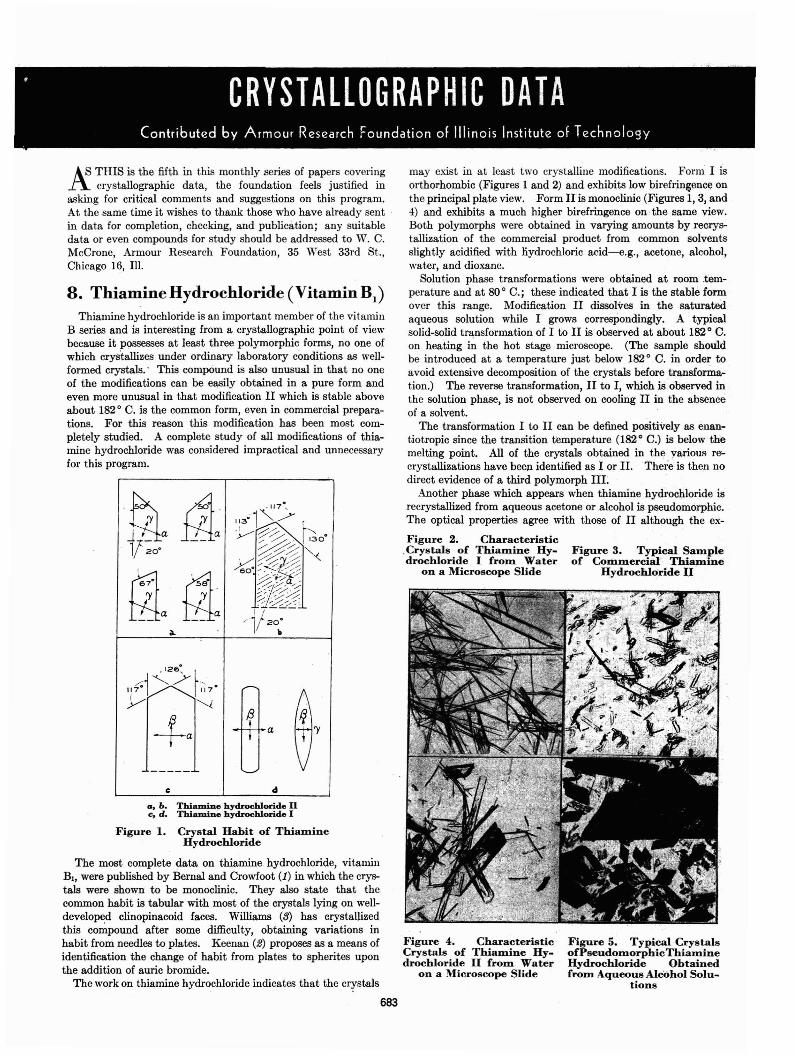
Figure 3. Typical Sampleof Commercial Thiamine
Hydrochloride U
Figure 5. Typical CrystalsofPseudomorphicThiamineHydrochloride Obtainedfrom Aqueous Alcohol Solu-
tions
Figure 4. CharacteristicCrystals of Thiamine Hydrochloride II from Water
on a Microscope Slide
may exist in at least two crystalline modifications. Form I isorthorhombic (Figures 1 and 2) and exhibits low birefrin~ence onthe principal plate view. Form II is monoclinic (Figures 1, 3, and4) and exhibits a much higher birefringence on· the same view.Both polymorphs were obtained in varying amounts by recrystallization of the commercial product from common solventsslightly acidified with liydrochloric acid-e.g., acetone, alcohol,water, and dioxane.
Solution phase transformations were obtained at room .temperature and at SOo C.; these indicated that I is the stable formover this range. Modification II dissolves in the saturatedaqueous solution while I grows correspondingly. A typicalsolid-solid tra,nsformation of I to II is observed at about 182 0 C.on heating in the hot stage microscope. (The sample shouldbe introduced at a temperature just below 182 0 C. in order toavoid extensive decomposition of the crystals before transformation.) The reverse trailsformation, II to I, which is observed inthe solution phase, is not observed on cooling II in the absenceof a solvent. .
The transformation I to II can be defined positively as enantiotropic since the transition temperature (182 0 C.) is below themelting point. All of the crystals obtained in the yarious re'crystallizations have beeJl. identified as I or II. There is then nodirect evidence of a third polymorph IlL
Another phase which appears when thiamine hydrochloride isrecrystallized from aqueous acetone or alcohol is pseudomorphic.The optical properties agree with those of II although the ex-
Figure 2. Characteristic.Crystals of Thiamine Hy-drochloride I from Water
on a Microscope Slide
'Y
dc
A. S THIS is the fifth in this monthly series of papers covering.t\. crystallographic data, the foundation feels justified inasking for critical comments and suggestions on this program.At the same time it wishes to thank those who have already sentin data for completion, checking, and publication; any suitabledata or even compounds for study should be addressed to W. C.McCrone, Armour Research Foundation, 35 West 33rd St.,Chicago 16, Ill.
M!~a 111a1 20·
f~t f£t
Thiamine hydrochloride is an important member of the vitaminB series and is interesting from a crystallographic point of viewbecause it possesses at least three polymorphic forms, no one ofwhich crystallizes under ordinary laboratory conditions as wellformed crystals.' This compOund is also unusual in that no oneof the modifications can be easily obtained in a pure form andeven more unusual in that modification II which is stable aboveabout 182 0 C. is the common form, even in commercial preparations. For this reason this modification has been most completely studied. A complete study of all modifications of thiamine hydrochloride was considered impractical and unnecessaryfor this program.
8. Thiamine Hydrochloride (Vitamin B})
a, b. ThiIUllin" hydrochloride nc, d. ThilUlline hydrochloride I
Figure 1. Crystal Habit of ThiamineHydrochloride
The most complete data on thiamine hydrochloride, vitaminB1, were published by Bernal and Crowfoot (1) in which the crystals were shown to be monoclinic. They also state that thecommon habit is tabular with most of the crystals lying on welldeveloped clinopinacoid faces. Williams (3) has crystallizedthis co~pound after some difficulty, obtaining variations inhabit from needles to plates. Keenan (2) proposes as a means ofidentification the change of habit from plates to spherites uponthe addition of auric bromide.
The work on thiamine hydrochloride' indicates that the crystals
683
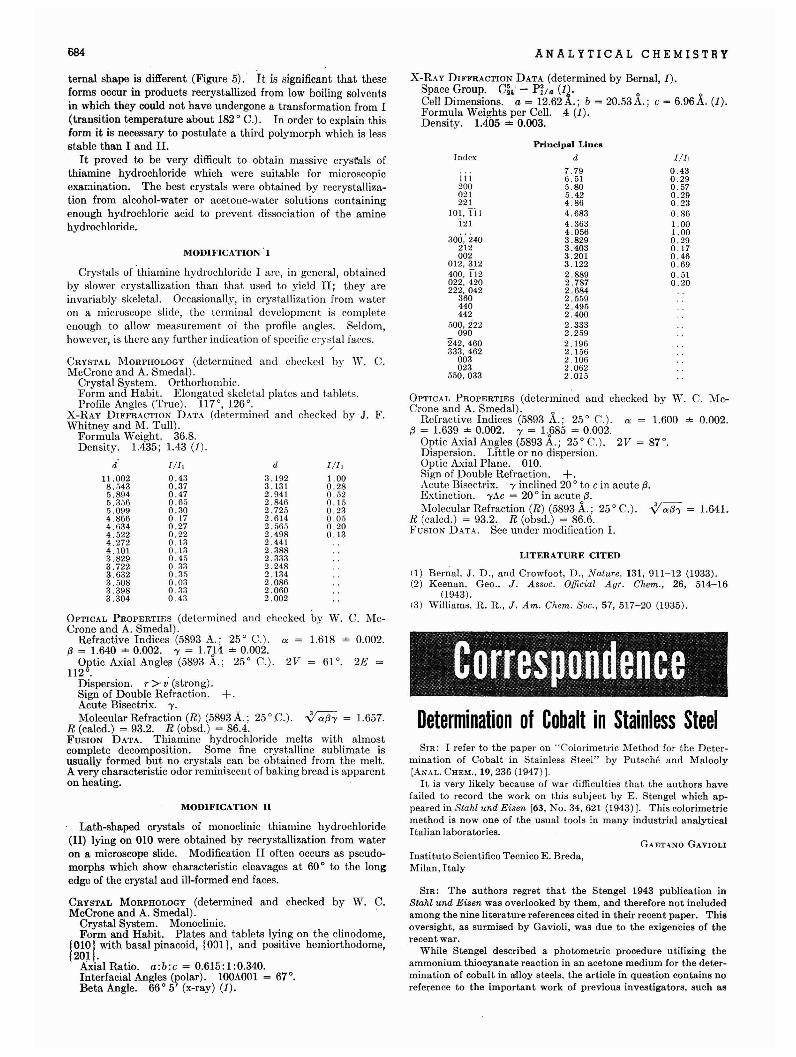
684
ternal shape is different (Figure 5). It is significant that theseforms occur in products recrystallized from low boiling solventsin which they could not have undergone a transformation from I(transition temperature about 182° C.). In order to explain thisform it is necessary to postulate a third polymorph which is lessstable than I and II.
It proved to be very difficult to obtain massive cryst:als ofthiamine hydrochloride which were suitable for microscopicexar.:J.ination. The best crystals were obtained by recrystallization from alcohol-water or acetone-water solutions containingenough hydrochloric acid to prevent dissociation of the aminehydrochloride.
MODlFICAnON' I
Crystals of 'thiamine hydrochloride I arc, in general, obtainedby slower crystallization than that used to yield II; they areinvariably skeletal. Occasionally, in crystallization from wateron a microscope slide, the terminal developmont is completeenough to allow measurement of the profile angles. Seldom,however, is there any further indication of specific crystal faces.
/
CRYSTAL MORPHOLOGY (determined and checked by W. C.McCrone and A. Smedal).
Crystal System. Orthorhombic.Form and Habit. Elongated skeletal plates and tablets.Profile Angles (True). 117°, 126°.
X-RAY DIFFRACTION DATA (determined and checked by J. F.Whitney and M. Tull).
Formula Weight. 36.8.Density. 1.435; 1.43 (1).
d I/I, d I/1,
11.002 0.43 3.192 1.008.543 0.37 3.131 0.285.894 0.47 2.941 0.525.356 0.65 2.846 0.155.099 0.30 2.725 0.234.866 0.17 2.614 0.054.634 0.27 2.565 0.204.522 0.22 2.498 0.134.272 0.13 2.4414.101 0.13 2.3883.829 0.45 2.3333.722 0.33 2.2483.632 0.35 2.1343.508 0.03 2.0863.398 0.33 2.0603.304 0.43 2.002
OPTICAL PROPERTIES (determined ami checked by W. C. McCrone and A. Smedal).
Refractive Indices (5893 A.; 25 ° C.). a = 1.618 ± 0.002.{3 = 1.640 ± 0.002. -y = 1.714 ± 0.002.
Optic Axial AngleB (5893 A.; 25 ° C.). 2V = 61°. 2E =H2°.
Dispersion. r >- v' (strong).Sign of Double Refraction. +.Acute Bisectrix. -y.
Molecular Refraction (R) (5893 A.; 25 ° C.). ~ = 1.657.R (calcd.) = 93.2. R (obsd.) = 86.4.FUSION DATA. Thiamine hydrochloride melts with almostcomplete decomposition. Some fine crystalline sublimate isusually formed but no crystals can be obtained from the melt.A very characteristic odor reminiscent of baking bread is apparenton heating.
MODIFICATION 11
Lath-shaped crystals of monoclinic thiamine hydrochloride(II) lying on 010 were obtained by recrystallization from wateron a microscope slide. Modification II often occurs as pseudomorphs which show characteristic cleavages at 60° to the longedge of the crystal and ill-formed end faces.
CRYSTAL MORPHOLOGY (determined and checked by W. C.McCrone and A. Smedal). .
Crystal System. Monoclinic.Form and Habit. Plates and tablets lying on the clinodome,
10101 with basal pinacoid, {001 I, and positive hemiorthodome,201 .
Axial Ratio. a:b:e = 0.615: 1 :0.340.Interfacial Angles (polar). 100A001 = 67°.Beta Angle. 66° 5' (x-ray) (1).
ANALYTICAL CHEMISTRY
X-RAY DIFFRACTION DATA (determined by Bernal, 1).Space Group. C~~ - P~/a (1). 0
Cell Dimensions. a = 12.62A.; b = 20.53A.; e = 6.961. (1).Formula Weights per Cel\.4 (1).Density. 1.405 ± 0.003.
Principal Line8
Index d I/I,
7.79 0.43III 6.51 0.29200 5.80 0.57021 5.42 0.29221 4:86 o 23
101, Til 4.683 0.86-121 4.363 1.00
300: 2404.056 1.003.829 0.29
212 3.403 0.17002 3.201 0.46
012,312 3.122 0.69400, 112 2.889 0.51022, 420 2.787 0.20222, 042 2.684
360 2.559440 2.495442 2.400
500, 222 2.333090 2.259
242, 460 2.196333, 462 2.156
003 2.106023 2.062
550,033 2.015
OPTICAL PROPERTIES (determined and checked by W. C. Mc-Crone and A. Smedal). 0
Refractive Indices (5893 A.; 25° C.). a = 1.600 ± 0.002.{3 = 1.639 ± 0.002. -y = 1.
0685 ± 0.002.
Optic Axial Angles (5893 A.; 25° C.). 2V = 87°.Dispersion. Little or no dispersion.Optic Axial Plane. 010.Sil!:n of pouble Refraction. +.Acute Bisectrix. l' inclined 20 ° to e in acute {3.Extinction. -yAe = 20° in acute {3.
Molecular Refraction (R) (5893 A.; 25 ° C.). ..ya{3, = 1.641.R (calcd.) = 93.2. R (obsd.) = 86.6.FUSION DATA. See under modification 1.
LiTERATURE CITED
(1) Bernal. J. D., and Crowfoot, D., Nature, 131, 911-12 (1933).(2) Keenan. Geo., J. Assoc. Official Agr. Chem., 26, 514-16
(943).(3) Williams, R. R., J. Am. Chem. Soc., 57, 517-20 (1935).
CorrespondenceDetermination of Cobalt in Stainless SteelSIR: I refer to the paper on "Colorimetric Method for the Deter
mination of Cobalt in Stainless Steel" by PutscM and Malooly[ANAL. CHEM., 19,236 (1947)].
It is very likely because of war difficulties that the authors havefailed to record the work on this subject by E. Stengel which appeared in Stahl und Eisen [63, No. 34, 621 (1943)]. This colorimetricmethod is now one of the usual tools in many industrial analyticalItalian laboratories.
GAETANO GAVIOLI
Instituto Scientifico Tecnico E. Breda,Milan, Italy
SIR: The authors regret that the Stengel 1943 publication inStahl und Eisen was overlooked by them, and therefore not includedamong the nine literature references cited in their recent paper. Thisoversight, as surmised by Gavioli, was due to the exigencies of therecent war.
While Stengel described a photometric procedure utilizing theammonium thiocyanate reaction in an acetone medium for the determination of cobalt in aHoy steels, the article in question contains noreference to the important work of previous investigators, such as
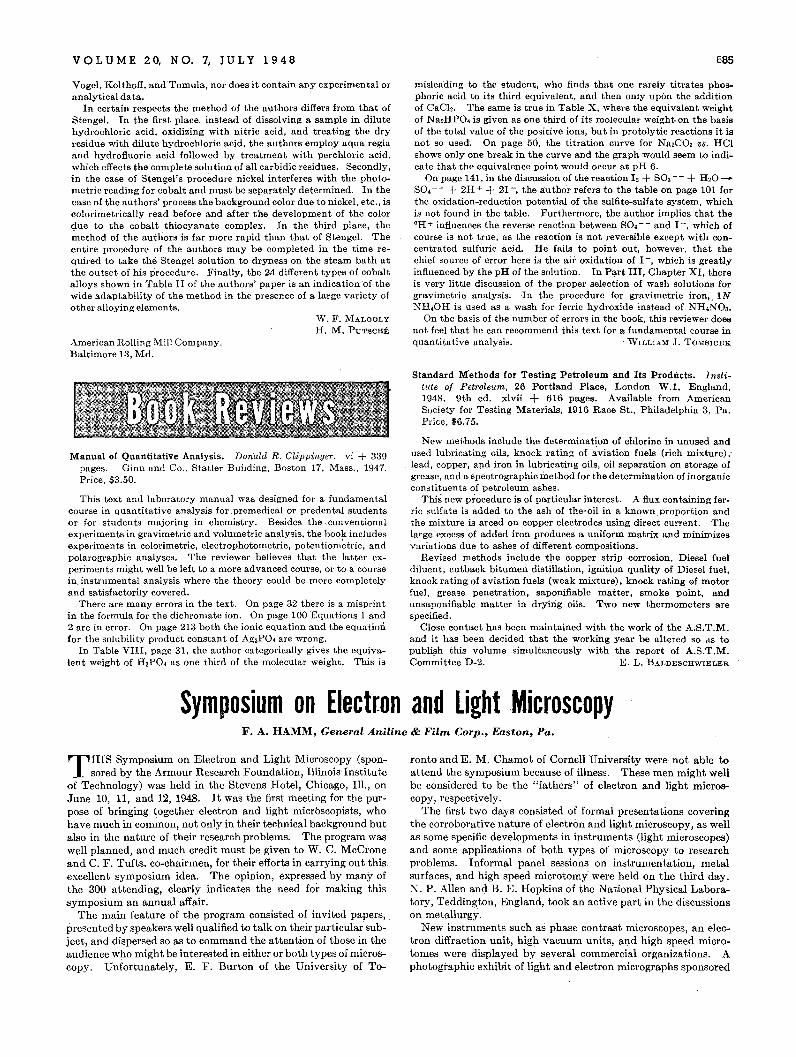
VOL U M E 20, N O. 7, JU L Y 1 948
Vogel, Kolthoff, and Tomula, nor does it contain any experimental oranalytical data.
In certain respects the method of the authors differs from that ofStengel. In the first place, instead of dissolving a sample in dilutehydrochloric acid, oxidizing with nitric acid, and treating the dryresidue with dilute hydrochloric acid, the authors' employ aqua regiaand hydrofluoric acid followed by treatment with pe~chloric acid,which effects the complete solution of all carbidic residues. Secondly,in the case of Stengel's procedure nickel interferes with the photometric reading for cobalt and must be separately determined. In thecase of the authors' process the background color due to nickel, etc., iscolorimetrically read before and after the development of the colordue to the cobalt thiocyanate complex. In the third place, the~ethod of the authors is far more rapid than that of Stengel. Theentire procedure of the authors may be completed in the time required to take the Stengel solution to dryness on the steam bath atthe outset of his procedure. Finally, the 24 different types of cobaltalloys shown in Table II of the authors' paper is an indication 'of thewide adaptability of the method in the presence of a large variety ofother alloying elements.
W. F. MALOOLYH. M. PUTSCHE
American Rolling Mill Company,Baltimore 13, Md.
Manual of Quantitative Analysis. Donald R. Clippinger. vi + 339pages. Ginn and Co.. Statler Building, Boston 17, Mass., 1947.Price. $3.50.
This text and laboratory manual was designed for a fundamentalcourse in quantitative analysis for premedical or predental studentsor for students majoring in chemistry. Besides the ,conventionalexperiments in gravimetric and volumetric analysis, the book includesexperiments in colorimetric, electrophotometric, potentiom~tric, andpolarographic analyses. The reviewer believes that the latter experiments might well be left to a more advanced course, or to a coursein,instrumental analysis where the theory could be mOre completelyand satisfactorily covered.
There are many errors in the text. On page 32 there is a misprintin the formula for the dichromate ion. On page 100 Equations 1 and2 are in error. On page 213 both the ionic equation and the equatiOIifor the solubility product constant of Ag3PO. are wrong.
In Table VIII, page 31, the author categorically gives the equivalent weight of H 3PO. as one third of the molecular weight, This is
685
misleading to. the student, who finds that one rarely titrates phosphoric acid to its third equivalent, and then only upon the additionof CaCho The same is true in Table X, where the equivalent weightof Na,HPO. is given as one third of its molecular weight-on the basisof the total value of the positive ions, but in protolytic reactions it isnot so used. On page 50, the titration curve for Na,C03 VS. HClshows only one break in the curve and the graph would seem to indicate that the equivalence point would occur at pH 6.
On page 141, in the discussion of the reaction 12 + S03 -- + H20-SO. -- + 2H + + 21 -, the author refers to the table on page 101 forthe oxidation-reduction potential of the sulfitecsulfate system, whichis not found in the table. Furthermore, the author implies that the°H + influences the reverse reaction between SO. - - and I -, which ofcourse is not true, as the reaction is not reversible except with concentrated sulfuric acid. He fails to point out, however, that thechief source of error here is the air oxidation of I -, which is greatlyinfluenced by the pH of the solution. In P~rt III, Chapter XI, thereis very little discussion of the proper selection of wash solutions forgravimetric analysis. In the procedure for gravimetric iron, INNH.OH is used as a wash for ferric hydroxide instead of NHiN03.
On the basis of the number of errors in the book, this reviewer doesnot feel that he can recommend this text for a fundamental course inquantitative analysis. 'VILLI AM J. TOMsICEK
Standard Methods for Testing Petroleum and Its Products. Institute of Petroleum, 26 Portland Place, London W.I, England,1948. 9th ed. xlvii + 616 pages. Available from AmericanSociety for Testing Materials, 1916 Race St., Philadelphia 3, Pa.Price, $6.75.
New methods include the determination of chlorine in unused andused lubricating oils, knock rating of ":viation fuels (rich mixture) ..
, lead, copper, a!1d iron in lubricating oils, oil separation on storage ofgrease, and a spectrographic method for the determination of inorganicconstituents of petroleum ashes.
This new procedure is of particular interest. A flux containing ferric sulfate is added to the ash of the·oil in a known ,proportion andthe mixture is arced on copper electrodes using direct current. Thelarge excess of added iron produces a uniform matrix and minimizesvariations due to ashes of different compositions.
Revised methods include the copper strip corrosion, Diesel fueldiluent, cutback bitumen distillation, ignition quality of Diesel fuel,knock rating of aviation fuels (weak mixture), knock rating of motorfuel, grease penetration, saponifiable matter, smoke point, andunsaponifiable matter in drying oils. Two new thermometers arespecified.
Close contact has been maintained with the work of the A.S.T.M.and it has been decided that the working year be altered so dS topublish this volume simultaneously with the report of A.S.T.M.Committee D-2. E. L. BALDESCHWIELER
Symposium on Electron and Light MicroscopyF. A. HAMM, General Aniline & Film Corp., Easton, Pa.
T HIS Symposium on Electron and Light Microscopy (sponsored by the Armour Research Foundation, Illinois' Institute
of Technology) was held in the Stevens Hotel, Chicago, Ill., onJune 10, 11, and 12, 1948. It was the first meeting for the purpose of bringing together electron and light microscopists, whohave much in common, not only in their technical background butalso in the nature of their research problems. The program waswell planned, and much credit must be given to W. C. McCroneand C. F. Tufts, co-chairmen, for their efforts in carrying out thisexcellent symposium idea. The opinion, expressed by many ofthe 300 attending, clearly indicates the need for making thissymposium an annual affair.
The main feature of the program consisted of invited papers, .presented by speakers well qualified to talk on their particular subject, and dispersed so as to command the attention of those in theaudience who might be interested in either or both types of microscopy. Unfortunately, E. F. Burton of the University of To-
ronto and E. M. Chamot of Cornell University were not able toattend the symposium because of illness. These men might wellbe considered to be the "fathers" of electron and light microscopy, respectively.
The first two days consisted of formal presentations coveringthe corroborative nature of electron and light microscopy, as wellas some specific developments In instruments (light microscopes)and some iLPplications of both types of microscopy to researchproblems. Informal panel sessions on instrumentation, metalsurfaces, and high speed microtomy' were held on the third day.N. P. Allen amI B. E. Hopkins of the National Physical Laboratory, Teddington, England, took an active part in the discussionson metallurgy.
New instruments such as phase contrast microscopes, an electron diffraction unit, high vacuum units, and high speed microtomes were displayed by several commercial organizations. Aphotographic exhibit of light and electron micrographs sponsored
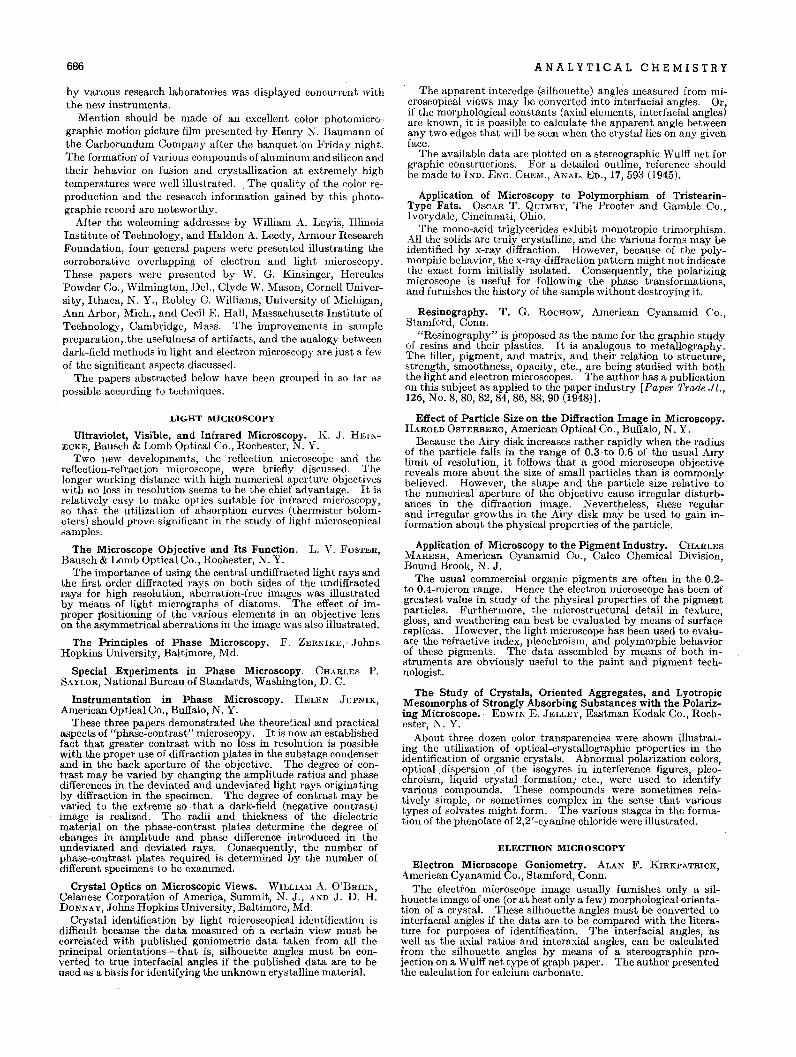
686
by various research laboratories was displayed concurrent withthe new instruments.
Mention should be made of an excellent color photomicrographic motion picture film presented by Henry N. Baumann ofthe Carborundum Company after the banquet 'on Friday night.The formation of various compounds of aluminum and silicon andtheir behavior on fusion and crystallization at extremely hightemperatures were well illustrated. The quality of the color reproduction and the research information gained by this photographic record are noteworthy.
After the welcoming addresses by William A. Lewis, IllinoisInstitute of Technology, and Haldon A. Leedy, Armour ResearchFoundation, four general papers were presented illustrating thecorroborative overlapping of electron and light microscopy.These papers were presented by W. G. Kinsinger, HerculesPowder Co., Wilmington, Del., Clyde W. Mason, Cornell University, Ithaca, N. Y., Robley C. Williams, University of Michigan,Ann Arbor, Mich., and Cecil E. Hall, Massachusetts Institute ofTechnology, Cambridge, Mass. The improvements in samplepreparation, ,the usefulness of artifacts, and the analogy betweendark-field methods in light and electron microscopy are just a fewof the significant aspects discussed.
The papers abstracted below have been grouped in so far aspossible according to techniques.
LIGHT MICROSCOPY
Ultraviolet, Visible, and Infrared Microscopy. K. J. HEINECKE, Bausch & Lomb Optical Co., Rochester, N. Y.
Two new developments, the reflection microscope and thereflection-refraction microscope, wcre briefly discussed. Thelonger working distance with high numerical aperture objectiveswith no loss in resolution seems to be the chief advantage. It isrelatively easy to make optics suitable for infrared miCI'oscopy,so that the lltilization of absorption curves (thermister bolometers) should prove significant in the study of light microscopicalsamples.
The Microscope Objective and Its Function. L. V. FOSTER,Bausch & Lomb Optical Co., Rochester, N. Y.
The importance of using the central undiffracted light rays andthe first order diffracted rays on both sides of the undiffractedrays for high resolution, aberrationcfree images was illustratedby means of light micrographs of diatoms. The effect of improper Ilositioning of the various elements in an object~ve lenson the asymmetrical aberrations in the image was also illustrated.
The Principles of Phase Microscopy. F. ZERNIKE,' JohnsHopkins University, Baltimore, Md.
Special Experiments in Phase Microscopy. CHARLES P.S.-I.YLOR, National Bureau of Standards, Washington, D. C.
Instrumentation in Phase Microscopy. HELEN JUPNIK,American Optical Co., Buffalo, N. Y.
These three papers demonstrated the theoretical and practicalaspects of "phaSe-contrast" microscopy. It is now an establishedfact that greater contrast with no loss in resolution is possiblewith the proper use of diffraction plates in the substage condenserand in the back aperture of the objective. The degree of contrast may be varied by changing the amplitude ratios and phasedifferences in the deviated and undeviated light rays originatingby diffraction in the specimen. The degree of contrast may bevaried to the extreme so that a dark-field (negative contrast)image is realized. The radii and thickness of the dielectricmaterial on the phase-contrast plates determine the degree ofchanges in amplitude and phase difference introduced in theundeviated and deviated rays. Consequently, the number ofphase-contrast plates required is determined by the number ofdifferent specimens to be examined.
Crystal Optics on Microscopic Views. WILLIAM A. O'BRIEN,Celanese Corporation of America, Summit, N. J., AND J. D. H.DONNAY, Johns Hopkins University, Baltimore, Md.
Crystal identification by light microscopical identification isdifficult because the data measured on a certain view must becorrelated with published goniometric data taken from all theprincipal orientations-that is, silhouette angles must be converted to true interfacial aNgles if the published data are to beused as a basis for identifying the unknown crystalline material.
ANALYTICAL CHEMISTRY
The apparent interedge(.silhouette) angles measured from microscopical views may be converted into interfacial angles. Or,if the morphological constants (axial elements, interfacial angles)are known, it is possible to calculate the apparent angle betweenany two edges that will be seen when the crystal lies on any givenface.
The available data are plotted on a stereographic 'Wulff net forgraphic constructions. For a detailed outline, reference shouldbe made to IND. ENG. CHEw!., ANAL-. ED., 17,593 (1945).
Application of Microscopy to Polymorphism of TristearinType Fats. OSCAR T. QunfBY, The Procter and Gamble Co.,I vorydale, Cincinnati, Ohio.
The mono-acid triglycerides exhibit monotropic trimorphism.All the solids are truly crystalline, and the various forms may beidentified by x-ray diffraction. However, because of the polymorphic behavior, the x-ray diffraction pattern might not indicatethe exact form initially isolated. Consequently, the polai-izingmicroscope is useful for following the phase transformations,and furnishes the history of the sample without destroying it.
Resinography. T. G. ROCHOW, American Cyanamid Co.,Stamford, Conn.
"Resinography" is proposed as the name for the graphic studyof resins and their plastics. It is analogous to metallography.The filler, pigment, and matrix, and their relation to structure,strength, smoothness, opacity, etc., are being studied with boththe light and electron microscopes. The author has a publicationon this subject as applied to the paper industry [Paper 'l'rade Jl.,126, No.8, 80, 82, 84, 86, 88; 90 (1948)].
Effect of Particle Size on the Diffraction Image in Microscopy.HAROLD OSTERBERG, American Optical Co., Buffalo, N. Y.
Because the Airy disk increases rather rapidly when the radiusof the particle falls in thfiJ range of 0.3-1.0 0.6 of the usual Airylimit of resolution, it follows that a good microscope objectivereveals more about the size of small particles than is commonlybelieved. However, the shape and the particle size relative tothe numerical' aperture of the objective cause irregular disturbances in the diffraction image. Nevertheless, these regularand irregular growths in the Airy disk may be used to gain information about the physical properties of the particle.
Application of Microscopy to the Pigment Industry. CHARLES:VIARESH, American Cyanamid Co., Calco Chemical Division,Bound Brook, N. J.
The usual commercial organic pigments are often in the 0.2to O.4-micron range. Hence the electron microscope has been ofgreatest value in study of the physical properties of the pigmentparticles. Furthermore, the microstructural detail in texture,gloss, and weathering can best be evaluated by means of surfacereplicas. However, the light microscope has been used to evaluate the refractive index, pleochroism, and polymorphic behaviorof these pigments. The data assembled by means of both instruments are obviously useful to the paint and pigment technologist.
The- Study of Crystals, Oriented Aggregates, and LyotropicMesomorphs of Strongly Absorbing Substances with the Polarizing Microscope. EnwINE. JELLEY, Eastman Kodak Co., Rochester, N. Y.
About three dozen color transparencies were shown illustrating the utilization of optical-crystallographic properties in theidentification of organic crystals. Abnormal polarization colors,optical .dispersion of the isogyres in interference figures, pleochroism, liquid crystal formation; etc., were used to identifyvarious compounds. These compounds were sometimes relatively simple, or sometimes complex in the sense that varioustypes of solvates might form. The various stages in the formation of the phenolate of 2,2'-cyanine chloride were illustrated.
ELECTRON MICROSCOPY
Electron Microscope Goniometry. ALAN F. KIRKPATRICK,American Cyanamid Co., Stamford, Conn.
The electron microscope image usually furnishes only a silhouette image of one (or at best only a few) morphologicalorientation of a crystal. These silhouette angles must be converted tointerfacial angles if the data are to be compared with the literature for purposes of identification. The interfacial angles,aswell as the axial ratios and interaxial angles, can be calculatedfrom the silhouette angles by means of a stereographic projection on a Wulff net type of graph paper. The author presentedthe calculation for calcium carbonate.
VOL U ME 20, N O. 7, J U L Y 1 948
Light and Electron Microscopical Studies of Cellulose Fibers.CHARLES W. HOCK, Hercules Powder Co., Wilmington, Del.
Natural cellulose fibers (cotton) have a laminated fabrillarstructure. The relatively coarse fibrils observed by light microscopy are further subdivided into finer fibrils as seen in the electronmicroscope.. A lengthwise periodicity has al~o been detected.This structure may play a significant role in the chemical reactivity of the fiber. Several of the synthetic cellulose fibers(rayons) have their own characteristic fibrillar pattern. However, this pattern is not so distinct as that in the natural fiber.
Electron Microscopy of Particle Aggregation in Carbon Black.JOHN H. L. WATSON, Medical Research Institute, Henry FordHospital, Detroit, Mich.• The need for evaluating the size and structure of small par
ticle aggregates was demonstrated. Too often too much emphasis is placed on the fundamental particle size, which may notbe so significant as the aggregate data. A critical discussion ofthe interpretation of the electron microscope image in terms ofellipticity and distance. from the supporting membrane waspresented. The accuracy of the technique and its relation torubber compounding were mentioned.
Statistical Analysis of Electron Microscope Particle SizeDeterminations. PAUL L. COPELAND, Illinois Institute ofTechnology, Chicago, Ill.
This l?aper in part fills a strong need for a critical analysis ofthe accuracy of electron microscope particle size determinations.The practical results from a large number of measurements werecompared with a theoretical (statistical) calculation. Themeasurements made on a large number of imaged particles do notagree with the calculated values, probably because of an inadequate representation of the whole sample due to the largenumber of very small particles.
Properties of Evaporated Gold. P. G. WILKINSON AKD L. S.BIRKS, Naval Research Laboratory, Washington, D. C.
Evaporated gold blacks and thin films were examined in theelectron microscope in order to relate continuity with thicknessand electrical resistance. Gold films may be continuous ordiscontinuous, depending upon their thickness, as determined byelectrical measurements. Gold' blacks are discontinuous innature. .
Results of Electron Microscope Studies on BacteriophageAction. THOMAS F. ANDERSON, Johnson Foundation Universityof Pennsylvania, Philadelphia, Pa. ,.
The electron microscope was shown to be a useful tool in examining viruses from the standpoint of their morphological identification, response to sonic vibrations, and the mechanism withwhich they adsorb on the host bacteria cell followed by proliferation within the infected cell. 'The sonic treatment breaks uponly the larger tadpole-shaped viruses; the fragments clmtim.leto survive. Certain phages must be activated with amino a,cidsbefore they will absorb on the host cell. Seven phages on strainB of E. Coli w~re citedas examples.
Electron Microscopy of the Tubercle Bacillus (BCG) by MetalShadow Casting Technique. C. I. REED, S. R: ROSENTHAL,AND B. P. REED, University of Illinois, Urbana, Ill.
The advantages of metal-shadowing (chromium) the surfaceof bacteria were once again demonstrated. Surface (capsule)structure and also some internal details were made more recognizable by the increase in the contrast in the electron microscopeimage. The history (preparation) of the BCG vaccine and itsrelation to the morphology of the bacillus were presented.
Electron Metallography. ROBERT D. HEIDENREICH, BellTelephone Laboratories, Inc., Murray Hill, N. J.
The combination of electron microscopy and electron diffraction in the study of surface metal structure might appropriatelybe called "electron metallography." Electron reflection diffraction, although subject to many qualifications, is useful for identifying the surface films. Slip planes, grain size and structure,height of surface elevations, etc., may be studied by severalreplica. techniques. Three types (plastic, silica, and oxide film)of replicas were described with emphasis on their resolving power.The oxide film type is probably the only one that resolves betterthan 50 A.
Electron Microscopical Study of. Organic Pigments. F. A.HAMM, General Aniline & Film Corp., Easton,· Pa.. A variety of organic pigments (dyes) have been analyzed forthe sake of identification and evaluation of their microphysical
687
propert.ies (shape, size, poi'osity, aggregation, etc.). Three broadaspects of this long range. research program were emphasized:(1) the use of sonic (audio, 9 kc., and ultra, 400 kc.) vibrationsfor dispersing severely aggregated pigments discussed from thestandpoint of the quality of the electron microscope specimcn;(2) the radiation-chemical effect of the electron beam and itsrelation to the polymorphism of several pigments; and (3) theutilization of the RCA Type EMU electron microscope in the"fingerprinting" of pigments by means of their electron diffract.ion patterns.
MlSCELLANEOUS
Electron Diffraction-An Instrument and Some Applications.J. G. HUTTON, General Electric Co., Schenectady, N. Y .
The new G.E. electron diffraction instrument was describedfrom its functional and applicability viewpoin:ts.
High Vacuum Metallizing. GEORGE H ..BANcRof"r, Distillation Products, Inc., Rochester, N. Y.
A new 12-inch vacuum coateI' (D.P.I.) was described. in-cluding its required high vacuum technique: '
Techniques of High Speed Microtomy. ERNEST F. FULLA~I,
General Electric Co., Schenectady, N. Y.The need for a technique in the preparation of sections suf
ficiently thin for examination in the electron microscope has beenpartially filled. Animal tissue, fibers, plastics etc. have beensectioned in thickness of 0.5 micron or less. ' ,
At the panel session on high speed microtomy, R. R. Allen ofCustom Scientific Instruments, Inc., Arlington, N. J.,' andW. F. Fullam of Hemsdale International, Inc., 350 Fifth Ave.,New York, N. Y., described their respective instruments and theirnew improvements. It is now possible to evacuate the chamberin which the sections are cut, cool (freeze) the sample before sectioning, and adapt the disk to serve as an ultracentrifuge.
Second Symposium on Analytical ChemistryArrangements are now being made for holding the Second
Annual Summer Symposium on Analytical Chemistry sponsoreoby the Division of Analytical and Micro Chemistry and ANALYTICAL CHEMISTRY, at vVesleyan University, Middletown, Conn.,in June 1949. The conference will run two full days and will include four technical sessions and a get-together on the eveningof the first day. M. G. Burford, Wesleyan University, will bechairman in charge of arrangements.
Symposium on Nucleonics and Analytical Chemistry. Division of ;t\nalytical and Micro Chemistry, Northwestern Umverslty, Evanston, IlL, Aug. 13 and 14.
. Second Annual Summer Symposium on Analytical Chem. istry. Wesleyan University, Middletown Conn. June
1949. ."
Raman Spectra of Hydrocarbons-CorrectionIn the article 011 "Raman Spectra of Hydrocarbons" [ANAL.
CHEM., 19, 700 (1947) 1, on 'page 710 the second paragraph under"Disubstituted Aromatics" should read: "The 1,4-disubstitutionis characterized by"
Page 711, the dates for reference (7) should be 1939, 1940, and1946.
Page 721, in spectrum table No. 162, the scattering coefficientvalue for the ~v 651 em.-Iline should be 0.560.
lVI. R. FENSKE
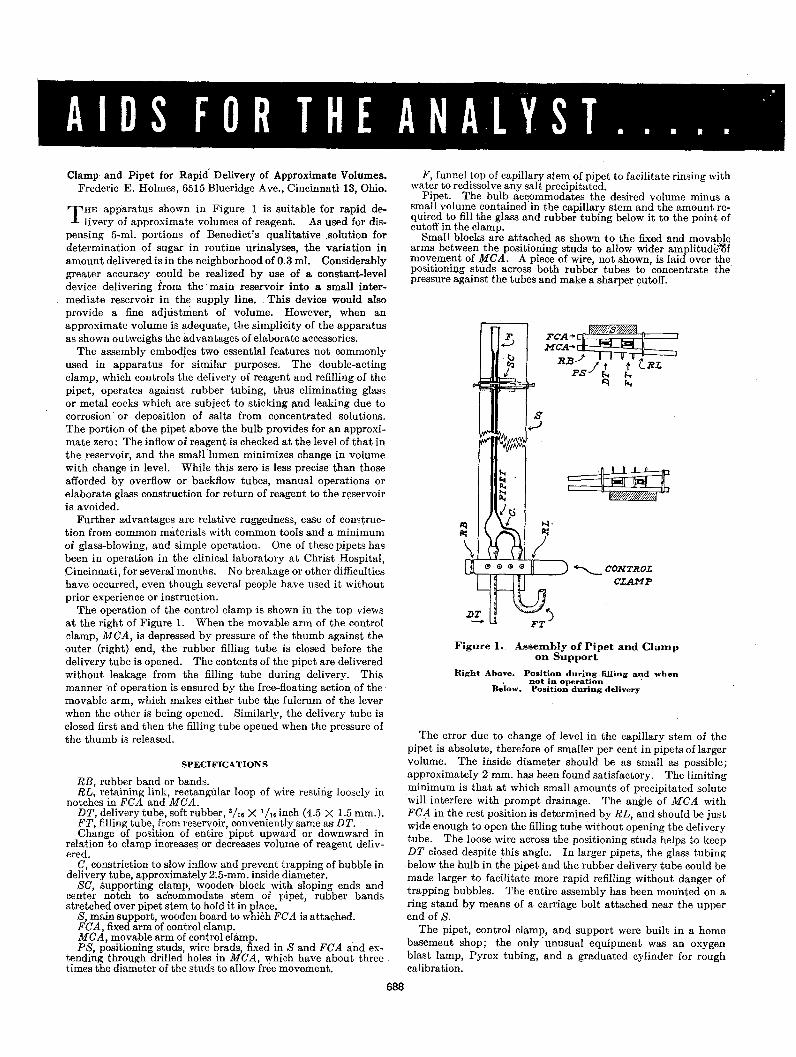
·AIDS FOR THE ANA.L YST I • • •• .'
Clamp and Pipet for Rapid Delivery of Approximate Volumes.Frederic E. Holmes, 6515 Blueridge Ave., Cincinnati 13, Ohio.
T HE apparatus shown in Figure 1 is suitable for rapid delivery of approximate volumes of reagent. As used for dis
pensing 5-ml. portions of Benedict's qualitative .solution fordetermination of sugar in routine urinalyses, the variation inamount delivered IS in the neighborhood of 0.3 m!. Considerablygreater accuracy could be realized by use of a constant-leveldevice delivering from the main reservoir into a small intermediate reservoir in the supply line. This device would alsoprovide a fine adjustment of volume. However, when anapproximate volume is adequate, the simplicity of the apparatusas shown outweighs the advantages of elaborate accessories.
The assembly embodies two essential features not commonlyused in apparatus for similar purposes. The double-actingclamp, which controls the delivery of reagent and refilling of ~he
pipet, operates against rubber tubing, thus eliminating glassor metal cocks which are subject to sticking Itnd leaking due tocorrosion or deposition of salts from concentrated solutions.The portion of the pipet above the bulb provides for an approximate zero: The inflow of reagent is checked at the level of that inthe reservoir, and the small1umen minimizes change in volumewith change in level. While this zero is less precise than thoseafforded by overflow or backflow tubes, manual operations orelaborate glass construction for return of reagent to the reservoiris avoided.
Further advantages are relative ruggedness, ease of construction from common materials with common tools and a minimumof glass-blowing, and simple operation, One of these pipe~s hasbeen in operation in the clinical laboratory at Christ Hospital,Cincinnati, for several months. No breakage or other difficultieshave occurred, even though several people have used it withoutprior experience or instruction.
The operation of the control clamp -is shown in the top viewsat the right of Figure 1. When the movable arm of the controlclamp, MCA, is depressed by pressure of the thumb against theouter (right) end, the rubber filling tube is closed before thedelivery tube is opened. The conten~sof the pipet are deliveredwi~hout leakage from the filling tube during delivery. Thismanner of operation is ensured by the free-floating action of themovable arm, which makes either tube the fulcrum of the leverwhen the other is being opened. Similarly, the delivery tube isclosed first and then the filling tube opened when the pressure ofthe thumb is released.
SPECIFICATIONS
RB, rubber band or bands.RL, retaining link, rectangular loop of wire resting loosely in
notches in FCA and MCA.DT, delivery tube, soft rubber, 3/16 X 1h6 inch (4.5 X 1.5 mm.).FT, filling tube, from reservoir, conveniently same as DT.Change of position of entire pipet upward or downward in
relation to clamp increases or decreases volume of reagent delivered,
C, constriction to slow inflow and prevent trapping of bubble indelivery tube, approximately 2:5-mm. inside diameter.
SC, supporting clamp, wooden- block with sloping ends andcenter notch to ac'commodate stem of pipet, rubber bandsstretched over pipet stem to hold it in place.
S, main support, wooden board to which FCA is attached.FCA, fixed arm of control clamp.MCA, movable arm of control clamp.PS, positioning studs, wire brads, fixed in Sand FCA and ex
tending through drilled holes in MCA, which have about threetimes the diameter of the studs to allow free movement.
688
F, funnel top of capillary stem of pipet to facilitate rinsing withwater to redissolve any salt precipitated.
Pipet. The bulb accommodates the desired volume minus asm.all volume contained'in the capillary stem and the amount reqUIred to fill the glass and rubber tubing below it to the point ofcutoff in the clamp.
Small blocks are attached as shown to the fixed and movablearms between the positioning studs to allow wider amplitudEi"ilfmovement of .MCA. A piece of wire, not shown is laid over thepositioning studs across both rubber tubes to 'concentrate thepressure against the tubes and make a sharper cutoff.
_____ CONTROL
CLAMP
Figure I., Assembly of Pipet and Clampon Support
Right: Above. Position during ,filling and when, not: in operation .
Below. Position during delivery
The error due to change of level in the capillary stem of thepipet is absolute, therefore of smaller per cent in pipets of largervolume, The inside diameter should be as small as possible;approximately 2 mm. has been found satisfactory. The limitingminimum is that at which small amounts of precipitated solutewill interfere with prompt drainage. The angle of MCA withFCA in the rest position is determined by RL, and should be justwide enough to open the filling tube without opening the deliverytube. The loose wire across the positionin'g studs helps to keepDT closed despite this angle. In larger pipets, the glass tubingbelow the hulb in the pipet and the rubber delivery tube could bemade larger to facilitate more rapid refilling without danger oftrapping bubbles. The entire assembly has been mou'nted on aring stand by means of a carriage bolt attached near the upperend of S.
The pipet, control clamp, and support were built in a homebasement shop; the OJily .unusual equipment was an oxygenblast lamp, Pyrex tubing, and a graduated cylinder for roughcalibration.