
Federal Register / Vol. 62, No. 138 / Friday, July 18, 1997 ...
91
38764 Federal Register / Vol. 62, No. 138 / Friday, July 18, 1997 / Rules and Regulations ENVIRONMENTAL PROTECTION AGENCY 40 CFR Parts 53 and 58 [AD–FRL–5725–6] RIN 2060–AE66 Revised Requirements for Designation of Reference and Equivalent Methods for PM2.5 and Ambient Air Quality Surveillance for Particulate Matter AGENCY: Environmental Protection Agency (EPA). ACTION: Final rule. SUMMARY: This final rule revises the 40 CFR part 58 ambient air quality surveillance regulations to include provisions for PM2.5 (particulate matter with an aerodynamic diameter less than or equal to a nominal 2.5 micrometers), as measured by a new reference method being published in 40 CFR part 50, Appendix L, elsewhere in this issue of the Federal Register or by an equivalent method designed in accordance with requirements being promulgated in 40 CFR part 53. In addition, this rule also revises existing ambient air quality monitoring requirements for PM10 (particles with an aerodynamic diameter less than or equal to 10 micrometers). These revisions address network design and siting, quality assurance (QA) and quality control (QC), operating schedule, network completion, system modifications, data reporting, and other monitoring subjects. EFFECTIVE DATE: This regulation is effective September 16, 1997. ADDRESSES: All comments received relative to this rule have been placed in Docket A-96-51, located in the Air Docket (LE-131), Environmental Protection Agency, 401 M St., SW., Washington, DC 20460. The docket may be inspected between 8 a.m. and 5:30 p.m., Monday through Friday, excluding legal holidays. A reasonable fee may be charged for copying. FOR FURTHER INFORMATION CONTACT: For general information, contact Brenda Millar (MD-14), Monitoring and Quality Assurance Group, Emissions Monitoring, and Analysis Division, Environmental Protection Agency, Research Triangle Park, North Carolina 27711, Telephone: (919) 541–5651, e- mail: [email protected]. For technical information, contact Neil Frank (MD-14), Monitoring and Quality Assurance Group, Emissions, Monitoring, and Analysis Division, Environmental Protection Agency, Research Triangle Park, North Carolina 27711, Telephone: (919) 541–5560. SUPPLEMENTARY INFORMATION: Table of Contents I. Authority II. Introduction A. Revision to the Particulate Matter NAAQS B. Air Quality Monitoring Requirements III. Discussion of Regulatory Revisions and Major Comments on 40 CFR Part 53 A. Designation of Reference and Equivalent Methods for PM2.5 B. Reference Method Designation Requirements C. Equivalent Method Designation Requirements D. Proposed Reference and Equivalent Method Requirements E. Changes to the Proposed Method Designation Requirements IV. Discussion of Regulatory Revisions and Major Comments on 40 CFR Part 58 A. Overview of Part 58 Regulatory Requirements B. Section 58.1 - Definitions C. Section 58.13 - Operating schedule D. Section 58.14 - Special purpose monitors E. Section 58.15 - Designation of monitoring sites F. Section 58.20 - Air quality surveillance: plan content G. Section 58.23 - Monitoring network completion H. Section 58.25 - System modification I. Section 58.26 - Annual State monitoring report J. Section 58.30 - NAMS network establishment K. Section 58.31 - NAMS network description L. Section 58.34 - NAMS network completion M. Section 58.35 - NAMS data submittal N. Appendix A - Quality Assurance Requirements for State and Local Air Monitoring Stations (SLAMS) O. Appendix C - Ambient Air Quality Monitoring Methodology P. Appendix D - Network Design for State and Local Air Monitoring Stations (SLAMS), National Air Monitoring Stations (NAMS) and Photochemical Assessment Monitoring Stations (PAMS) Q. Appendix E - Probe and Monitoring Path Siting Criteria for Ambient Air Quality Monitoring R. Appendix F - Annual Summary Statistics S. Review of Network Design and Siting Requirements for PM T. Resources and Cost Estimates for New PM Networks V. Reference VI. Regulatory Assessment Requirements A. Regulatory Impact Analysis B. Paperwork Reduction Act C. Impact on Small Entities D. Unfunded Mandates Reform Act of 1995 I. Authority Section 110, 301(a), 313, and 319 of the Clean Air Act (Act) as amended 42 U.S.C. 7410, 7601(a), 7613, 7619. II. Introduction A. Revision to the Particulate Matter NAAQS Elsewhere in this issue of the Federal Register, EPA announced revisions to the national ambient air quality standards (NAAQS) for particulate matter (PM). In that document EPA amends the current suite of PM standards by adding PM2.5 standards and by revising the form of the current 24–hour PM10 standard. Specifically, EPA is adding two primary PM2.5 standards set at 15 ©g/m 3 , annual mean, and 65 ©g/m 3 , 24–hour average. The annual PM2.5 standard would be met when the 3–year average of the annual arithmetic mean PM2.5 concentrations is less than or equal to 15 ©g/m 3 from single or multiple community-oriented monitors in accordance with 40 CFR part 50, Appendix K and requirements set forth in this final rule. The 24–hour PM2.5 standard would be met when the 3–year average of the 98th percentile of 24–hour PM2.5 concentrations at each population-oriented monitor within an area is less than or equal to 65 ©g/m 3 . EPA also retained the current annual PM10 standard at the level of 50 ©g/m 3 which would be met when the 3–year average of the annual arithmetic PM10 concentrations at each monitor within an area is less than or equal to 50 ©g/ m 3 . Further, EPA retained the current 24–hour PM10 standard at the level of 150 ©g/m 3 , but revised the form such that the standard would be met when the 3–year average of the 99th percentile of the monitored concentrations at the highest monitor in an area is less than or equal to 150 ©g/m 3 . In the part 50 final rule published elsewhere in this issue of the Federal Register, EPA is also revising the current secondary standards for PM by making them identical to the suite of primary standards. The suite of PM2.5 and PM10 standards, in conjunction with the establishment of a regional haze program under section 169A of the Clean Air Act (the Act), are intended to protect against PM-related welfare effects including soiling and materials damage and visibility impairment. As discussed in the part 50 final rule for the PM NAAQS, the PM2.5 standards are intended to protect against exposures to fine particulate pollution, while the PM10 standards are intended to protect against coarse fraction particles as measured by PM10. For PM2.5, the annual standard is intended to protect against both long- and short-term exposures to fine particle pollution. Under this approach, the PM2.5 24–hour standard would serve as a supplement to PM2.5 annual standard
-
Upload
khangminh22 -
Category
Documents
-
view
0 -
download
0
Transcript of Federal Register / Vol. 62, No. 138 / Friday, July 18, 1997 ...

38764 Federal Register / Vol. 62, No. 138 / Friday, July 18, 1997 / Rules and Regulations
ENVIRONMENTAL PROTECTIONAGENCY
40 CFR Parts 53 and 58
[AD–FRL–5725–6]
RIN 2060–AE66
Revised Requirements for Designationof Reference and Equivalent Methodsfor PM2.5 and Ambient Air QualitySurveillance for Particulate Matter
AGENCY: Environmental ProtectionAgency (EPA).ACTION: Final rule.
SUMMARY: This final rule revises the 40CFR part 58 ambient air qualitysurveillance regulations to includeprovisions for PM2.5 (particulate matterwith an aerodynamic diameter less thanor equal to a nominal 2.5 micrometers),as measured by a new reference methodbeing published in 40 CFR part 50,Appendix L, elsewhere in this issue ofthe Federal Register or by an equivalentmethod designed in accordance withrequirements being promulgated in 40CFR part 53. In addition, this rule alsorevises existing ambient air qualitymonitoring requirements for PM10
(particles with an aerodynamic diameterless than or equal to 10 micrometers).These revisions address network designand siting, quality assurance (QA) andquality control (QC), operatingschedule, network completion, systemmodifications, data reporting, and othermonitoring subjects.EFFECTIVE DATE: This regulation iseffective September 16, 1997.ADDRESSES: All comments receivedrelative to this rule have been placed inDocket A-96-51, located in the AirDocket (LE-131), EnvironmentalProtection Agency, 401 M St., SW.,Washington, DC 20460. The docket maybe inspected between 8 a.m. and 5:30p.m., Monday through Friday, excludinglegal holidays. A reasonable fee may becharged for copying.FOR FURTHER INFORMATION CONTACT: Forgeneral information, contact BrendaMillar (MD-14), Monitoring and QualityAssurance Group, EmissionsMonitoring, and Analysis Division,Environmental Protection Agency,Research Triangle Park, North Carolina27711, Telephone: (919) 541–5651, e-mail: [email protected]. Fortechnical information, contact NeilFrank (MD-14), Monitoring and QualityAssurance Group, Emissions,Monitoring, and Analysis Division,Environmental Protection Agency,Research Triangle Park, North Carolina27711, Telephone: (919) 541–5560.SUPPLEMENTARY INFORMATION:
Table of ContentsI. AuthorityII. Introduction
A. Revision to the Particulate MatterNAAQS
B. Air Quality Monitoring RequirementsIII. Discussion of Regulatory Revisions andMajor Comments on 40 CFR Part 53
A. Designation of Reference and EquivalentMethods for PM2.5
B. Reference Method DesignationRequirements
C. Equivalent Method DesignationRequirements
D. Proposed Reference and EquivalentMethod Requirements
E. Changes to the Proposed MethodDesignation RequirementsIV. Discussion of Regulatory Revisions andMajor Comments on 40 CFR Part 58
A. Overview of Part 58 RegulatoryRequirements
B. Section 58.1 - DefinitionsC. Section 58.13 - Operating scheduleD. Section 58.14 - Special purpose
monitorsE. Section 58.15 - Designation of
monitoring sitesF. Section 58.20 - Air quality surveillance:
plan contentG. Section 58.23 - Monitoring network
completionH. Section 58.25 - System modificationI. Section 58.26 - Annual State monitoring
reportJ. Section 58.30 - NAMS network
establishmentK. Section 58.31 - NAMS network
descriptionL. Section 58.34 - NAMS network
completionM. Section 58.35 - NAMS data submittalN. Appendix A - Quality Assurance
Requirements for State and Local AirMonitoring Stations (SLAMS)
O. Appendix C - Ambient Air QualityMonitoring Methodology
P. Appendix D - Network Design for Stateand Local Air Monitoring Stations (SLAMS),National Air Monitoring Stations (NAMS)and Photochemical Assessment MonitoringStations (PAMS)
Q. Appendix E - Probe and MonitoringPath Siting Criteria for Ambient Air QualityMonitoring
R. Appendix F - Annual SummaryStatistics
S. Review of Network Design and SitingRequirements for PM
T. Resources and Cost Estimates for NewPM NetworksV. ReferenceVI. Regulatory Assessment Requirements
A. Regulatory Impact AnalysisB. Paperwork Reduction ActC. Impact on Small EntitiesD. Unfunded Mandates Reform Act of 1995
I. Authority
Section 110, 301(a), 313, and 319 ofthe Clean Air Act (Act) as amended 42U.S.C. 7410, 7601(a), 7613, 7619.
II. Introduction
A. Revision to the Particulate MatterNAAQS
Elsewhere in this issue of the FederalRegister, EPA announced revisions tothe national ambient air qualitystandards (NAAQS) for particulatematter (PM). In that document EPAamends the current suite of PMstandards by adding PM2.5 standardsand by revising the form of the current24–hour PM10 standard. Specifically,EPA is adding two primary PM2.5
standards set at 15 ©g/m3, annual mean,and 65 ©g/m3, 24–hour average. Theannual PM2.5 standard would be metwhen the 3–year average of the annualarithmetic mean PM2.5 concentrations isless than or equal to 15 ©g/m3 fromsingle or multiple community-orientedmonitors in accordance with 40 CFRpart 50, Appendix K and requirementsset forth in this final rule. The 24–hourPM2.5 standard would be met when the3–year average of the 98th percentile of24–hour PM2.5 concentrations at eachpopulation-oriented monitor within anarea is less than or equal to 65 ©g/m3.
EPA also retained the current annualPM10 standard at the level of 50 ©g/m3
which would be met when the 3–yearaverage of the annual arithmetic PM10
concentrations at each monitor withinan area is less than or equal to 50 ©g/m3. Further, EPA retained the current24–hour PM10 standard at the level of150 ©g/m3, but revised the form suchthat the standard would be met whenthe 3–year average of the 99th percentileof the monitored concentrations at thehighest monitor in an area is less thanor equal to 150 ©g/m3.
In the part 50 final rule publishedelsewhere in this issue of the FederalRegister, EPA is also revising thecurrent secondary standards for PM bymaking them identical to the suite ofprimary standards. The suite of PM2.5
and PM10 standards, in conjunctionwith the establishment of a regionalhaze program under section 169A of theClean Air Act (the Act), are intended toprotect against PM-related welfareeffects including soiling and materialsdamage and visibility impairment.
As discussed in the part 50 final rulefor the PM NAAQS, the PM2.5 standardsare intended to protect againstexposures to fine particulate pollution,while the PM10 standards are intendedto protect against coarse fractionparticles as measured by PM10.
For PM2.5, the annual standard isintended to protect against both long-and short-term exposures to fine particlepollution. Under this approach, thePM2.5 24–hour standard would serve asa supplement to PM2.5 annual standard

38765Federal Register / Vol. 62, No. 138 / Friday, July 18, 1997 / Rules and Regulations
1EPA intends to develop and propose for publiccomment a revised Pollutant Standards Index thatwill address PM2.5 as well as PM10, at a later date.
to provide additional protection againstdays with high PM2.5 concentrations,localized ‘‘hot spots,’’ and risks arisingfrom seasonal emissions that would notbe well controlled by a national annualstandard.
In specifying that the calculation ofthe annual arithmetic mean for an area(for purposes of comparison to level ofPM2.5 annual standard) should beaccomplished by comparing the annualmean from a community-orientedmonitor that is representative of averagecommunity-wide exposure, or averagingthe annual arithmetic means derivedfrom multiple, community-orientedmonitoring sites, EPA took into accountseveral factors. As discussed in the part50 final rule, many of the community-oriented epidemiologic studiesexamined in this review used spatialaverages, when multiple monitoringsites were available, to characterizearea-wide PM exposure levels andassociated public health risk. In thosestudies that used only one monitoringlocation, the selected site was chosen torepresent community-wide exposures,not the highest value likely to beexperienced within the community.Because the annual PM2.5 standard isintended to reduce aggregate populationrisk from both long- and short-termexposures by lowering the broaddistribution of PM concentrations acrossthe community, an annual standardbased on monitoring data reflectingaverage community wide exposurewould better reflect area-wide PM2.5
exposure levels and associated healthrisks than would a standard based onconcentrations from a single monitorwith the highest measured values in thearea. The concept of average communityexposures is not appropriate for PM10
because the spatial distribution ofcoarse particles is different and tends tobe more localized in its behavior.
Finally, under the policy approachpresented in the part 50 final rule, the24–hour PM2.5 standard is intended tosupplement an annual PM2.5 standardby providing protection against peak24–hour concentrations arising fromsituations that would not be well-controlled by an annual standard.Accordingly, the 24–hour PM2.5
standard will be based on the singlepopulation-oriented monitoring sitewithin a monitoring planning area withthe highest measured values.
In EPA’s judgment, an annual PM2.5
standard based on monitoring datarepresentative of community average airquality, established in conjunction witha 24–hour standard based on thepopulation-oriented monitoring sitewith the highest measured values, willprovide the most appropriate target for
reducing area-wide population exposureto fine particle pollution and will bemost consistent with the underlyingepidemiological data base.
B. Air Quality Monitoring Requirements
A new Federal Reference Method(FRM) for PM2.5 is promulgated in a newAppendix L to 40 CFR part 50. Section319 of the Act requires that uniformcriteria be followed when measuringambient air quality. To satisfy theserequirements, EPA establishedprocedures on February 10, 1975, in 40CFR part 53 for the determination anddesignation of reference or equivalentmonitoring methods (40 FR 7049).Accordingly, new provisions are addedto 40 CFR part 53 so that each referencemethod for PM2.5, based on a particularsampler, will be formally designed assuch by EPA. Similarly, samplersdemonstrated as equivalent to the FRMcan also be designated. Furthermore,section 110(a)(2)(C) of the Act requiresambient air quality monitoring forpurposes of the State ImplementationPlans (SIPs) and for reporting dataquality to EPA. Uniform criteria to befollowed when measuring air qualityand provisions for daily air pollutionindex reporting are required by section319 of the Act.1 To satisfy theserequirements, on May 10, 1979 (44 FR27558), EPA established 40 CFR part 58which provided detailed requirementsfor air quality monitoring, datareporting, and surveillance for all of thepollutants for which national ambientair quality standards have beenestablished (criteria pollutants).Provisions were promulgatedsubsequently for PM measured as PM10
on July 1, 1987 (52 FR 24740);provisions for PM2.5 are published inthis final rule.
On December 13, 1996, these ruleswere proposed in the Federal Registeras amendments to 40 CFR parts 53 and58. The intent of the monitoring methoddesignations and air quality surveillancerequirements being promulgated todayare to establish a revised particulatematter monitoring network that willproduce air quality data utilizinguniform criteria for the purpose ofcomparison to the revised primary andsecondary PM NAAQS and to facilitateimplementation of a forthcomingregional haze program. The effectivedate of today’s monitoring regulation isSeptember 16, 1997.
III. Discussion of Regulatory Revisionsand Major Comments on 40 CFR Part53
A. Designation of Reference andEquivalent Methods for PM2.5
Provisions for EPA designation ofreference and equivalent methods forPM10 and gaseous criteria pollutantshave been previously established andare set forth in 40 CFR part 53. OnDecember 13, 1996, EPA proposed toamend part 53 to add new provisions togovern designation of reference andequivalent method for PM2.5. TheDecember 13th notice proposed new,detailed sampler testing and otherrequirements that would apply tocandidate reference and equivalentPM2.5 methods and describes how EPAproposed to determine whether acandidate method should be designatedas either a reference or equivalentmethod. The notice further solicitedpublic comments on the proposed newprovisions. Those provisions, modifiedsomewhat based on the publiccomments received, are beingpromulgated today as amended part 53.
As for the other criteria air pollutants,reference methods for PM2.5 areintended to provide for uniform,reproduceable measurements of PM2.5
concentrations in ambient air to serve asa measurement standard for the primarypurpose of making comparisons to theNAAQS. Equivalent methods for PM2.5
allow for the consideration andintroduction of new and innovativePM2.5 measurement technologies for thissame purpose, provided such newtechnologies can be shown to providePM2.5 measurements comparable toreference measurements under a varietyof typical monitoring conditions.
B. Reference Method DesignationRequirements
The new reference method for PM2.5,described in 40 CFR part 50, AppendixL contains a combination of design andperformance specifications to define thereference method PM2.5 sampler. Theperformance-based specifications for thereference method sampler allowmanufacturers to design and fabricatedifferent samplers that would meet allreference method requirements.Accordingly, multiple PM2.5 referencemethods are expected to becomeavailable from several manufacturers, asis the case for reference methods forPM10 and most gaseous criteriapollutants. Each reference method forPM2.5, based on a particular sampler,will be formally designated as such byEPA under the new provisions added to40 CFR part 53.

38766 Federal Register / Vol. 62, No. 138 / Friday, July 18, 1997 / Rules and Regulations
The requirements for designation ofPM2.5 reference methods are set forth insubparts A and E of 40 CFR part 53.These requirements include specifictests to show conformance with alldesign and performance specifications,an operational field precision test, acomprehensive operation/instructionmanual, and documentation of anadequate manufacturing and testingquality system. Subpart A, which hasbeen amended to add provisions forPM2.5 methods, sets forth the generalrequirements for both reference andequivalent methods and for the processunder which applications are submittedand reference and equivalent methodare designated. New subpart E, which isdevoted exclusively to PM2.5 methods,describes the test procedures andrelated requirements for candidatereference methods.
C. Equivalent Method DesignationRequirements
The requirements for designation ofequivalent methods for PM2.5 are alsoset forth in amended part 53. Thegeneral requirements are set forth insubpart A. All candidate equivalentmethods are subject to the field tests foroperational precision and comparabilityto reference method measurements,which are specified in subpart C. Bothsubparts A and C have been amended toinclude the provisions for PM2.5
methods.To minimize the number and extent
of performance tests to which candidateequivalent methods must be subjected,three classes of equivalent methods aredefined.
Class I equivalent methods are basedon samplers that have relatively smalldeviations from the specifications forreference method samplers. Therefore,in addition to the tests and otherrequirements applicable referencemethod samplers, candidate Class Iequivalent samplers must be tested onlyto make sure that the modifications donot significantly compromise samplerperformance. The additional testrequirements for most Class I candidateequivalent methods are a test forpossible loss of PM2.5 in any new ormodified components in the samplerinlet upstream of the sample filter, andthe field testing for comparability toreference method samplers. Theseadditional tests are described insubparts E and C, respectively.
Class II equivalent methods includeall other PM2.5 methods that are basedon a 24–hour integrated filter samplethat is subjected to subsequent moistureequilibration and gravimetric massanalysis. A sampler associated with aClass II equivalent method will
generally have one or more substantialdeviations from the design orperformance specifications of thereference method, such that it cannotqualify as a Class I equivalent method.These samplers may have a differentinlet, a different particle size separator,a different volumetric flow rate, adifferent filter or filter face velocity, orother significant differences. Moreextensive performance testing isrequired for designation of Class IIcandidate equivalent methods, with thespecific tests required depending on thenature and extent of the differencesbetween the candidate sampler and thespecifications for reference methodsamplers. These tests may include a fullwind tunnel evaluation, a wind tunnelinlet aspiration test, a static fractionatortest, a fractionator loading test, avolatility test, and field testing againstreference method samplers. The testsand their specific applicability tovarious types of candidate Class IIequivalent method samplers are setforth in the new subpart F.
Finally, Class III equivalent methodsinclude any candidate PM2.5 methodsthat cannot qualify as either Class I orClass II. This class includes any filter-based integrated sampling methodhaving other than a 24–hour PM2.5
sample collection interval followed bymoisture equilibration and gravimetricmass. More importantly, Class III alsoincludes filter-based continuous orsemi-continuous methods, such as betaattenuation instruments, harmonicoscillating element instruments, andother complete in situ monitor types.Non-filter-based methods such asnephelometry or other opticalinstruments will also fall into the ClassIII category.
The testing requirements fordesignation of Class III candidatemethods are the most stringent, becausequantitative comparability to thereference method will have to be shownunder various potential particle sizedistributions and aerosol composition.However, because of the variety ofmeasurement principles and types ofmethods possible for Class III candidateequivalent methods, the testrequirements must be individuallyselected or specifically designed oradapted for each such type of method.Therefore, EPA has determined that it isnot practical to attempt to develop andexplicitly describe the test proceduresand performance requirements for all ofthese potential Class III methods apriori. Rather, the specific testprocedures and performancerequirements applicable to each Class IIIcandidate method will be determined byEPA on a case-by-case basis upon
request, in connection with eachproposed or anticipated application fora Class III equivalent methoddetermination.
D. Proposed Reference and EquivalentMethod Requirements
The proposed changes to 40 CFR part53 to provide for designation ofreference and equivalent methods forPM2.5 consisted of revisions to subpartsA and C, and new subparts E and F. Theproposed revisions to subpart Aincluded new definitions applicable toPM2.5 methods and clarifications ofexisting definitions, clarifications of thereference and equivalent methoddesignation requirements for allpollutants including the new classes ofequivalent methods for PM2.5, andrequirements for PM2.5 samplers to bemanufactured in an InternationalOrganization for Standardization (ISO)9001-registered facility (or equivalent).Additional proposed changes includedclarifications of the test data and otherinformation required to be submitted inapplications for a reference orequivalent method determination,clarification of requirements for productwarranty and content of operation orinstruction manuals, an increased timelimit for processing applications; andprovisions for providing EPA with acandidate test PM2.5 sampler or analyzerto evaluate in connection with anapplication for reference or equivalentmethod determination.
Revisions to subpart C included newprocedures and specifications forcomparing candidate equivalentmethods for PM2.5 to reference methodsamplers. The entirely new subpart Edescribed the technical procedures fortesting the physical (design) andperformance characteristics of referencemethods and Class I equivalentcandidate methods for PM2.5. The newsubpart F described the procedures fortesting the performance characteristicsof Class II equivalent methods for PM2.5.
E. Changes to the Proposed MethodDesignation Requirements
The tests of the design andperformance characteristics of candidatesamplers for designating referencemethods as well as equivalent methodsare intimately related to thespecifications for reference methods in40 CFR part 50, Appendix L. Many ofthe concerns expressed by commentersregarding the reference method for PM2.5
in 40 CFR part 50, Appendix L alsoapply to some of the provisions of part53. Other comments were more directlyconcerned with the provisions of 40CFR part 53, and these comments aresummarized in this unit.

38767Federal Register / Vol. 62, No. 138 / Friday, July 18, 1997 / Rules and Regulations
Several commenters addressed theresponsibilities of EPA andmanufacturers in the methoddesignation process. Specific commentsincluded the suggestions that: (1) Itwould be more appropriate for EPA toconduct the necessary testing of acandidate method before designating areference method; (2) that EPA shouldclarify how it will respond to possiblepoor sampler performance underextreme environmental conditionsencountered in some areas of the UnitedStates, since the samplers are notrequired to meet such extremeconditions; (3) that EPA should clarifythat specifications for completingsampler modifications or retrofits towork in nonstandard environmentsshould be included as part of a samplerpurchase contract; and (4) that EPAshould clarify that the required methodspecifications must be met throughoutthe warranty period and that theapplicant accepts responsibility andliability for ensuring conformance orresolving nonconformities, including allnecessary components of the system,regardless of the original manufacturer.
The new provisions contained in themodified 40 CFR part 53 require theapplicant to submit information anddocumentation to demonstrate that theapplicant’s candidate reference methodsampler meets all design specificationsset forth in 40 CFR part 50, AppendixL. The provisions also require theapplicant to carry out specific tests todemonstrate that the candidatereference or equivalent method meetsall performance specifications. Thenature of these tests and therequirement that they be carried out bythe applicant rather than by EPA isconsistent with the previouslyestablished requirements in 40 CFR part53 for designating reference orequivalent methods for other criteriapollutants. Section 53.9 clearly statesthat a sampler sold as part of adesignated method must meet theapplicable performance specificationsfor at least 1 year after delivery. Section53.9 further requires that ISO 9001registration of the manufacturing facilitybe maintained and that a ProductManufacturing Checklist signed by acertified ISO auditor be submittedannually to verify manufacturing qualitycontrol.
In response to concerns about theperformance of the sampler underextreme weather conditions, EPA hasestablished sampler specifications thatare intended to cover reasonably normalenvironmental conditions at about 95percent of expected monitoring sites.The performance tests in subpart Eaddress essentially all of these
operational requirements. Specificationof the sampler performance for siteswith extreme environmental conditionswould substantially raise the cost of thesampler for users, most of whom do notrequire the extra capability. EPAstrongly recommends that usersrequiring operation of samplers underextreme environmental conditionsdevelop supplemental specifications formodified samplers to cover thosespecific conditions. Samplermanufacturers have indicated acommitment to respond to such specialoperational needs.
Documentation is required todemonstrate that samplers to be sold asreference or equivalent methods forPM2.5 will be manufactured under aneffective quality control system.Although some commenters supportedthe general quality assurance conceptscontained in the proposed method,several questioned the inclusion of theISO 9001-registration requirement. EPAbelieves that the ISO 9001-registrationrequirement and related provisions arethe most cost-effective way to ensurethat samplers are manufactured in afacility conforming to internationallyrecognized quality system standards.
Several comments questioned theproposed requirement that each PM2.5
sampler model be subjected to a specificannual evaluation of performance andmeet certain operating performancespecifications. In response to thesecomments, this requirement has beendeleted. However, EPA will review theperformance of each PM2.5 samplermodel on an annual basis, and ifcompelling evidence indicates asignificant bias or other operationalproblem, the EPA Administrator maymake a preliminary finding to cancel areference or equivalent methoddesignation in accordance with theprovisions of § 53.11 in subpart A.
Otherwise, the provisions of 40 CFRpart 53 have been retained to conformwith the requirements described in 40CFR part 50, Appendix L. The proposedrevisions to subparts A and C have beenretained with no substantive changes.However, minor technical and editorialchanges have been made to subparts Aand C to clarify or simplify proposedprovisions. Subpart E has undergoneextensive revision and reorganization.Although these changes do not affect theobjectives and nature of the tests, theyare intended to make the testrequirements easier to understand andthe tests easier to perform. The changeswere based on EPA’s own experience inperforming tests of prototype candidatesamplers and on comments fromprospective sampler manufacturers.Subpart F has also been revised to some
extent. The changes to subpart F are notsubstantive in nature, but numeroustechnical and editorial changes weremade to clarify the test requirementsand make the tests, particularly thevolatility test, more straightforward tocarry out.
All testing related to an applicationfor a PM2.5 reference or equivalentmethod determination under 40 CFRpart 53 must be carried out inaccordance with American NationalStandards Institute/American Societyfor Quality Control (ANSI/ASQC) E4standards. These requirements arenecessary to ensure that all samplers oranalyzers sold as reference or equivalentmethods are manufactured and tested tothe high standards required to achievethe needed data quality. Theseprocedures are in keeping with thedeveloping international standards formanufacturing and testing in this andother industries.
IV. Discussion of Regulatory Revisionsand Major Comments on Part 58
The following discussion presents anoverview of the final part 58 monitoringregulation. This is followed by adetailed discussion of the basicconcepts outlined in the December 13,1996 monitoring proposal and addressesthose comments received on theproposed part 58 regulations that EPAconsidered to be most relevant to thechanges and additions adopted in thefinal rule. Comments not addressed inthis preamble are found in a Summaryand Response to Comment documentthat has been placed in Docket A-96-51.Those parts of the proposed regulationswhich were not commented on have notbeen changed. The items are discussedin the order in which they appear in theregulation.
A. Overview of Part 58 RegulatoryRequirements
The requirements set forth in this rulesimultaneously preserve the underlyingintent of the revised NAAQS andrespond positively to the verysubstantial and reasoned commentsreceived on the proposal. Specifically,the major monitoring requirements andprinciples set forth by the revised part58 regulation include:
1. PM2.5 network design. Community-oriented (core) monitors that representcommunity-wide average exposure,form the basis of PM2.5 network design.This approach is consistent with thedata bases used to develop the NAAQS.While all population-orientedmonitoring locations are eligible forcomparison to the 24–hour PM2.5
NAAQS, only locations representativeof neighborhood or larger spatial scales

38768 Federal Register / Vol. 62, No. 138 / Friday, July 18, 1997 / Rules and Regulations
are eligible for comparison to the annualNAAQS. Community monitoring zoneswith constrained criteria may be alsoused to define monitors acceptable forspatial averaging for comparison to theannual NAAQS. Monitoring for regionaltransport and regional background isrequired to assist with implementationof the air quality management program.The combination of emphasis on well-sited community-oriented monitors andthe feasibility by the States to select thepreferred community monitoringapproach reduces complexity associatedwith network design and planning. Thenumber of required core PM2.5 State andLocal Air Monitoring Stations (SLAMS),and other PM2.5 SLAMS results in aminimum national requirement ofapproximately 850 PM2.5 sites(compared to 629 proposed); the totalPM2.5 network is projected to approach1,500 PM2.5 sites. Exceptions to theminimum number of required samplersmay be approved by the EPA RegionalAdministrator. As proposed, the maturenetwork of 1,500 PM2.5 sites would bein place within 3 years. The phase-in ofthe required network has been reducedfrom 3 to 2 years.
2. PM10 monitoring networks.Requirements for PM10 network designand siting are unchanged. Reductions inPM10 networks are encouraged in areasof low concentrations where the PM10
NAAQS are not expected to be violated.3. Sampling frequencies. The
sampling frequencies stipulated in 40CFR 58.13 for both PM2.5 and PM10,have been modified to reflect a one in3–day minimum requirement. Requiredevery day sampling at certain core sitesmay be reduced to one in 3–daysampling after at least 3 complete yearsof data collection with a reference orequivalent method or when collocatedwith a correlated acceptable continuous(CAC) fine particulate monitor;background and regional transport mayalso sample once every third day.Exceptions to the minimum requirementmay be approved by the EPA RegionalAdministrator for seasonal or year-round sampling.
4. Chemical speciation. A modestchemical speciation network of 50 PM2.5
sites that provides a first ordercharacterization of the metals, ions, andcarbon constituents of PM2.5 is arequirement of this rule. These sites willbe part of the National Air MonitoringStations (NAMS) network and willprovide national consistency for trendspurposes and serve as a model for otherchemical speciation efforts. Thisrequired network represents a smallfraction of all the chemical speciationwork that EPA expects to support withFederal funds. Additional efforts may be
used to enhance the required networkand tailor the collection and analysis ofspeciated data to the needs of individualareas.
5. Quality assurance. The QAprogram is collectively based on avariety of QA tools resulting in aprogram which is more efficient, lesscostly, and relaxes the burden on Stateand local agencies. The key programrequirements include:
a. Independent field audits with aPM2.5 FRM are used to evaluate the biasof PM2.5 measurements. The number ofPM2.5 audited sites compared to theproposal are reduced from all non-collocated sites to 25 percent of allSLAMS sites (including NAMS) and theaudit frequency per site is reduced from6 to 4 visits per year.
b. Flow checks will also be used toevaluate bias of PM2.5 and PM10
measurements and are conducted on aquarterly basis as proposed.
c. Collocation with PM2.5 FRM andFederal Equivalent Methods (FEM)samplers at SLAMS sites is used tojudge precision. The number ofcollocated sites per reportingorganization is 25 percent of all PM2.5
SLAMS sites (20 percent wereproposed) and approximately 20 percentof all PM10 SLAMS sites (which iscurrent practice).
d. Systems audits are used to evaluatean agency’s QA system and will beperformed by EPA every 3 years asoriginally proposed.
In an effort to assist the State andlocal agencies in achieving the dataquality objectives of the PM2.5
monitoring program, an incentiveprogram has been established that isbased on network performance andmaturity that can reduce these QArequirements.
6. Moratorium on the use of specialpurpose monitor (SPM) data. Themoratorium on the use of PM2.5 data(§ 58.14) collected by SPMs, has beenchanged from the first 3 calendar yearsfollowing the effective date of this ruleto the first 2 complete calendar years ofoperation of a new SPM. If suchmonitors produce valid data for morethan 2 years, then all historical data forthat site may be used for regulatorypurposes.
7. Monitoring methodology. AppendixC has been revised to allow the use ofInteragency Monitoring of ProtectedVisual Environments (IMPROVE)samplers at regional transport andregional background sites to satisfy theSLAMS requirements.
8. PM monitoring network description.The State shall submit a PM monitoringnetwork description to the EPARegional Administrator by July 1, 1998,
which describes the PM monitoringnetwork, its intended communitymonitoring approach for comparison tothe annual PM2.5 standard, use of non-population-oriented special purposePM2.5 monitors or alternative samplers,and proposed exceptions to EPA’srequirements for minimum number ofmonitors or sampling frequency. Thedescription shall be available for pubicinspection and EPA shall review andapprove/disapprove the documentwithin 60 days. A State air monitoringreport with proposed network revisions,if any, shall be submitted annually.
EPA believes that the aforesaidrevisions to the rule, as proposed,provide a firm basis for the uniformimplementation of a national particulatemonitoring network which is responsiveto a revised NAAQS expressed as PM2.5.The following is a section-by-sectiondiscussion of comments received andany resulting modifications to theproposal.
B. Section 58.1 - DefinitionsEPA proposed to add several
definitions applicable to PMmonitoring. This consisted of revisingthe definition of the term traceable anddefinitions of the terms ConsolidatedMetropolitan Statistical Area (CMSA),core SLAMS, equivalent methods,Metropolitan Statistical Area (MSA),monitoring planning area (MPA),monitoring plan, PM2.5, PrimaryMetropolitan Statistical Area (PMSA),population-oriented, reference method,spatial averaging zone (SAZ), SPM finemonitors, and Annual State MonitoringReport. In response to comments, EPAis modifying the proposed approach andis introducing new terminology anddefinitions. First, EPA is changing thedefinition of core SLAMS monitors todescribe community-oriented monitorsthat are representative of neighborhoodor larger spatial scales and will be keymonitoring entities in the new PM2.5
SLAMS network. As discussed later, asubset of these monitors will berequired to sample everyday in the mostpopulated metropolitan areas with thestated emphasis on community-orientedmonitoring. Although very important,the background and regional transportmonitors in the SLAMS network are nolonger called core sites. Secondly, EPAis replacing the definition of spatialaveraging zone with a definition ofcommunity monitoring zone (CMZ).This is consistent with the intent of theannual PM2.5 standard, that is to bejudged at monitoring stations that arerepresentative of community-wide airquality. EPA is also renaming the PMmonitoring plan as the PM monitoringnetwork description. EPA’s rationale for

38769Federal Register / Vol. 62, No. 138 / Friday, July 18, 1997 / Rules and Regulations
these changes, together with a morecomplete description of communitymonitoring zones, are discussed in 40CFR part 58, Appendix D.
In addition, several commentersaddressed the definition of population-oriented monitoring, objecting to thenarrowness of the definition withrespect to industrial areas, and notingthat if people are present in an area, thesite should be considered population-oriented.
EPA assessed these comments andconcluded that the definition ofpopulation-oriented monitoring or sitesproposed in § 58.1 is essentiallyappropriate and as such will providemonitoring agencies with the flexibilityto design networks that are consistentwith the population-oriented approachdescribed by the PM2.5 standards.Therefore EPA is retaining thisdefinition in the final rule with a minorsimplifying change as follows:population-oriented monitoring (orsites) applies to residential areas,commercial areas, recreational areas,industrial areas and other areas where asubstantial number of people may spenda significant fraction of their day. Thedefinition of population-orientedmonitoring will be further deliniated infuture EPA guidance. As proposed, thefinal rule states that all population-oriented PM2.5 monitoring locationsshall be eligible for comparison to boththe 24–hour PM10 and PM2.5 standards.In order to make these concepts clearerfor the final rule, however, severalchanges to the proposed language weremade in the final rule regardingeligibility of monitoring sites forcomparisons to the PM2.5 NAAQS. First,the new PM2.5 network will placeemphasis on community-orientedmonitoring for making comparisons toboth the annual and 24–hour PM2.5
NAAQS. Secondly, as proposed, uniquepopulation-oriented microscale andmiddle-scale monitoring sites shall onlybe used for comparisons to the 24–hourNAAQS. Furthermore, violationsdetected at rural background andregional transport sites are moreappropriately addressed by theimplementation program which EPA isdeveloping.
C. Section 58.13 - Operating ScheduleEPA proposed that core PM2.5 SLAMS
(including NAMS and core SLAMScollocated at Photochemical AssessmentMonitoring Stations (PAMS) sites)would be required to sample every day,unless an exception is approved by EPAduring established seasons of low PMpollution during which time aminimum of one in 6-day samplingwould be permitted. The proposal stated
that non-core SLAMS sites wouldgenerally be required to sample aminimum of once every sixth day,although episodic or seasonal samplingcould also be possible (e.g., in areaswhere significant violations of the 24–hour NAAQS are expected or at sitesheavily influenced by regional transportor episodic conditions). The proposedand final rule state that special purposemonitors may sample on any samplingschedule. The proposal also recognizedthat although daily sampling withmanual methods is labor intensive dueto site visits and filter equilibration andweighing, semi-automatic sequentialsamplers are anticipated to beapprovable as FRMs or Class Iequivalent samplers (under theprovisions of part 53) that will simplifythe data collection process. Finally, EPAproposed that alternative PM2.5
operating schedules that combineintermittent sampling with the use ofacceptable continuous fine particulatesamplers are approvable at some coresites. This alternative was intended togive the States additional flexibility indesigning their PM2.5 monitoringnetworks and to permit data fromcontinuous instruments to betelemetered. This would facilitatepublic reporting of fine particulateconcentrations, and allow air pollutionalerts to be issued, and allow episodiccontrols to be implemented (as currentlydone in woodburning areas for PM10).Furthermore, this alternative wouldpermit monitoring agencies to takeadvantage of new and improvedmonitoring technologies that shouldbecome available during the first fewyears following the promulgation of thisrule. As proposed, applicability doesnot apply to areas with populationgreater than 1 million during the first 2years of required sampling.
Many commenters supported dailyPM2.5 sampling, citing the need to targetsources, aid enforcement, and provideexposure measurements for futurecommunity health studies.Additionally, commenters supporteddaily PM2.5 sampling to cover the mostpolluted and most populated areas andto capture all violations. Othercommenters supported daily samplingbut suggested limiting it to key locationsor seasons (e.g., only the largestmetropolitan areas or those areas withthe highest PM2.5 concentrations, onlyduring seasons when high values arelikely). Other commenters suggestedallowing a reduction in samplingfrequency to one in 6 days under certainconditions; for example, at sites thathave demonstrated attainment, at siteswith CAC analyzers, following the third
year of data collection, and during theportion of the year with low PM2.5
concentrations at a site with a districtseasonal pattern.
In addition, a number of commenterssuggested a delay of everyday samplinguntil the Class I equivalent samplers areavailable. It was noted that over theshort-term, only designated manualsamplers capable of collecting single24–hour samples, could be available.Consequently, to meet an everydaysampling schedule, several samplerswould need to be installed at eacheveryday sampling site to satisfy thedaily schedule, and cover weekend andholiday sampling periods.
Based on its review of thesecomments, EPA is retaining its everydaysampling schedule for certaincommunity-oriented (core) SLAMS (i.e.,two monitoring sites in each MSAgreater than 500,000 population andSLAMS collocated at PAMS for a totalof 313 nationwide). The remainingSLAMS including NAMS and other coreSLAMS are required to sample everythird day.
Because of concerns over the potentialunavailability of Class I sequentialsamplers, EPA is allowing a waiver ofthe everyday or every third daysampling schedule, when appropriate,in those situations where such samplingis not needed. This waiver would expire1 calendar year from the time asequential sampler has been approvedby EPA. When the waiver is granted forevery day sampling, one in 3-daysampling would be required. Asproposed, EPA encourages the use of asupplemental CAC analyzer as a meansof facilitating a reduction of thereference or equivalent methodeveryday sampling schedule to once in3 days. The CAC monitoring option,however, will not be allowed in areasgreater than 1 million population thathave high PM2.5 concentrations duringthe first 2 years of daily data collection.A minimum frequency of one in 6–daysampling is still required during periodsfor which exemptions to everyday orevery third day sampling are allowed forPM2.5 SLAMS.
For PM10, the EPA Administratorproposed that one in 6-day samplingshould be sufficient to support theproposed PM10 NAAQS and a less densemonitoring network would also beneeded.
A number of commenters supportedthe typical one in 6–day samplingfrequency for PM10. On the other hand,a number of commenters opposed theproposed reduction in PM10 samplingfrequency to one in 6 days, stating thatone in 6–day sampling is inadequate toevaluate impacts on the 24–hour PM10

38770 Federal Register / Vol. 62, No. 138 / Friday, July 18, 1997 / Rules and Regulations
standard, especially in areas withepisodic events or localized hot spots,and that extreme pollutant conditionscould be missed.
In response to the general concernsthat sampling for PM10 is not sufficientand in accordance with the choice of the99th percentile as the form of the 24–hour PM10 standards as discussed in 40CFR part 50, EPA has changed theminimum required sampling frequencyfrom one sample every 6 days to onesample in every 3 days.
The specified minimum samplingfrequency of one in 3 days for PM2.5 andPM10 will provide for a morestatistically stable representation ofactual air quality at each monitor asdiscussed in 40 CFR part 50. Further,increasing the sampling frequency fromone in 6- to one in 3-days will ensurethat the 24–hour NAAQS comparisonsare not based on the highest measuredvalues per year, and thus willsignificantly reduce the chances ofincorrectly classifying a ‘‘clean’’ area asnonattainment, and at the same timeprovide enough information toconfidently classify ‘‘dirty’’ areas asnonattainment without requiring thoseareas to sample every day.
EPA believes that once in 6–daysampling is sufficient to estimate anannual mean concentration for PM2.5 orPM10. Furthermore, every day or everythird day sampling is not generallyneeded during periods of the lowestambient PM concentrations. Therefore,EPA is allowing exemptions to the everyday or the one in 3-day samplingrequirement to individual areas with theapproval of the EPA RegionalAdministrator, in accordance withforthcoming EPA guidance. In general,exemptions to the minimum one in 3-day sampling frequency will beapprovable when existing informationsuggests that maximum 24–hourmeasurements are less than the level ofthe standard. In these cases, a minimumof one in 6-day sampling will berequired to ensure that sufficient dataare available to calculate an annualaverage concentration. Areas adoptingless frequent sampling would beadvised of the risks involved in such achoice; namely, that a single high valuein 1 year could end up causing the areato be declared in violation of the 24–hour NAAQS. The guidance will alsorecommend that more frequentsampling be considered for those areasthat are relatively close to the level ofthe standard. For example, areas whosePM2.5 or PM10 data indicate that theymeet the annual PM NAAQS, but havethe potential to not meet the 24–hourPM NAAQS will be encouraged tosample everyday for PM2.5 or PM10, as
appropriate, during the high PM seasonsin order to better assess their status tothe standards. While such an optionmay be more costly for individual areas,the risk of inaccurately declaring anattainment area to be nonattainmentwould be reduced.
D. Section 58.14 - Special PurposeMonitors
EPA proposed that special purposemonitoring (SPM) is needed in a newPM2.5 monitoring program to helpidentify potential problems, to helpdefine boundaries of problem areas, tobetter define temporal (e.g., diurnal)patterns, to determine the spatial scaleof high concentration areas, and to helpcharacterize the chemical compositionof PM (using alternative samplers andsupplemental analyzers), especially onhigh concentration days or duringspecial studies. It was proposed,however, that data from SPMs wouldnot be used for attainment/nonattainment designations if themonitor is located in an unpopulatedarea, if the monitoring method is not areference or equivalent method or doesnot meet the requirements of section 2.4of 40 CFR part 58, Appendix C.Moreover, in order to encourage thedeployment of SPMs, EPA proposedthat nonattainment designations willnot be based on data produced at anSPM site with any monitoring methodfor a period of 3 years following thepromulgation date of the NAAQS.
Numerous commenters opposed theproposed 3-year exclusion of SPM dataas a basis for NAAQS violations, notingthat all measured violations from allmonitors should be used fornonattainment designations. Othercommenters supported the exclusion,suggesting that SPM data should alwaysbe considered exploratory in nature andshould remain exempt from inclusion inregulatory data bases.
EPA has revisited its position onSPMs in light of these comments. Inorder to encourage the deployment ofSPMs, EPA has decided to continue toprovide States with the flexibility toexempt SPM data from regulatory use,but limit the period of the moratoriumto the first 2 complete calendar years ofoperation of a new SPM. Given thecurrently limited amount of PM2.5 dataand the complexity of the PM2.5 airquality problem, the Agency feels thatthis approach still provides a significantincentive for States to engage inadditional monitoring and therebycollect data that would supplement thedata collected at SLAMS sites. This canbe very helpful for establishing anoptimum network design, for a betterunderstanding of the impacts of specific
emission sources, and for otherplanning purposes. If a monitoring sitesatisfies all applicable part 58requirements including use of referenceor equivalent methods, meeting sitingcriteria, and other requirements asexplained in § 58.14 and it continues tocollect data beyond the first 2 completecalendar years of its operation, the datafrom such SPM sites would then begenerally eligible for comparisons to theNAAQS. One exception is when amonitoring agency intends to evaluate aspecial situation which is notrepresentative of population-orientedmonitoring. In this case, the data fromthe special purpose monitor would notbe used for comparison to the PM2.5
standards. A second exception is whenthe agency intends to evaluate a uniqueimpact area that represents a smallspatial scale (micro or middle). In thiscase, the site would only be eligible forcomparison to the 24–hour NAAQS.Although SPM data will be exempt fromregulatory use during the 2–yearmoratorium, EPA emphasizes that SPMdata should nevertheless be consideredin the State’s PM monitoring networkdescription and in the design of itsoverall SLAMS network. Moreover,SPM sites reporting values greater thanthe level of a NAAQS should beconsidered during the annual networkreview in accordance with § 58.25, andsummary data from SPM sites must beincluded in the annual State AirMonitoring report described in § 58.26.
E. Section 58.15 - Designation ofMonitoring Sites
The proposed monitoring regulationsdefined categories of sites that would beeligible for comparisons to the annual or24–hour NAAQS. This included certainsites that could be used for comparisonto both standards (B sites), to only thedaily standard (D sites) and certainspecial purpose monitors (O sites) thatpotentially would not be used forcomparison to any standard. Due tosignificant concern regarding thecomplexity of implementing thoseconcepts to handle a small number ofunique monitoring situations, the finalrule has eliminated the coding of sitesas type B, D, and O sites. Therefore,§ 58.15 has been deleted in its entirety.The principal reasons also include theemphasis on community-orientedmonitors, the new terminology andmodified approach associated withCMZs, and more precise descriptions ofSLAMS and SPMs. The final ruleprovides a more streamlined andsimplified monitoring approach thatretains the basic community average airquality exposure tenets of the PM2.5
annual NAAQS and, as proposed,

38771Federal Register / Vol. 62, No. 138 / Friday, July 18, 1997 / Rules and Regulations
recognizes that population-oriented hotspot monitoring may be more reflectiveof situations applicable to the purposesof the 24–hour PM2.5 standard.
The changes to communitymonitoring and site categorization arewell integrated. EPA agrees with publiccomment that the proposed spatialaveraging approach may not have beenproperly communicated by suggestingthat it allowed averaging of monitorsacross widely disparate areas notreflective of average community-oriented exposure and a homogeneousemission source mix. EPA believes thatby clarifying the criteria that determinewhich monitors can be averagedtogether (i.e., monitors in areas affectedby similar emission sources), along withemphasizing that well sited community-oriented monitors should be used,environmental equity concerns andrelated issues are effectively addressed.First, a single SLAMS or SPM thatadequately represents a local area canreflect its own community monitoringarea. If its annual averageconcentrations are more than 20 percenthigher than the surrounding averagePM2.5 air quality, it would not beeligible to be averaged in with thesurrounding sites of the largergeographic domain. In addition, uniquepopulation-oriented hot spot impactsites are not eligible for comparison tothe annual PM2.5 NAAQS and are onlyeligible for comparison to the 24–hourNAAQS. Additional details about CMZsare provided later.
F. Section 58.20 - Air QualitySurveillance: Plan Content
Although no comments were receivedon proposed changes to this section, thetitle was inadvertently stated as PlanControl; this title has been changed toPlan Content. In addition, the firstsentence of paragraph (d) has beenchanged by deleting the words ‘‘section2.8 of’’ and the words ‘‘as well as theminimum requirements for networks ofSLAMS stations for PM2.5 described insection 2.8.2 of 40 CFR part 58,Appendix D.’’ Since § 58.20 requires anannual review of the air qualitysurveillance system for all SLAMS,these changes were instituted for clarity.The reference to PM2.5 in the thirdsentence of § 58.20 was retained toensure that the review includes theunique requirements of the PM2.5
monitoring network.The proposal indicated that a detailed
Particulate Matter Monitoring Plan (see§ 58.1, as proposed) must be preparedby the affected air pollution controlagency and submitted to EPA forapproval. This plan was designed tocomprehensively describe the Agency’s
PM2.5 and PM10 air quality surveillancenetworks. Comments received notedthat the term PM monitoring plan couldbe confused with the networkdescription required by § 58.20.Accordingly, EPA has replacedreferences to the ‘‘PM Monitoring Planor monitoring plan’’ in this final rulewith references to the ‘‘particulatematter monitoring network descriptionor PM monitoring network description.’’The Agency notes, however, that therule published today requires a moreexpanded and comprehensive networkdescription for PM than has previouslybeen required for other networks.Therefore, a new paragraph (f) has beenadded to § 58.20 to delineate therequirements for PM monitoringnetwork descriptions. According to§ 58.20(e), as amended, this networkdescription must be submitted to theEPA Regional Administrator forapproval.
To ensure opportunities for publicreview and inspection of the monitoringnetwork, States must maintaininformation and records on such itemsas the station location, monitoringobjectives, spatial scale ofrepresentativeness, optional CMZs, andschedule for completion of the network.Such information and records areincluded in a State’s PM monitoringnetwork description. The PMmonitoring network descriptionprepared by States and submitted toEPA for approval should be viewed asa long-term network of SLAMS andNAMS sites that meet the variety ofmonitoring objectives specified in 40CFR part 58, Appendix D of theseregulations. These objectives includedetermining compliance with air qualitystandards, developing appropriatecontrol strategies as required, andpreparing short- and long-term airquality trends. However, modificationsto the network can be made without aformal SIP revision thus encouragingStates to make any needed yearly (oralternate schedule as determined by theEPA Regional Administrator) changes tothe SLAMS network to make it moreresponsive to data needs and resourceconstraints. In order to avoid makingmajor modifications to the PMmonitoring network description duringthe annual review, the detailed network,including monitoring planning areasand CMZs, should be carefully plannedand designed to provide a stable base ofair quality data. Since no formal SIPrevision (that entails Federal Registerproposal and public comment) isrequired for the PM monitoring networkdescription revisions, EPA encouragespublic involvement in the review of a
State’s PM monitoring networkdescription particularly when thespatial averaging monitoring approachis selected for comparisons to theannual standard.
G. Section 58.23 - Monitoring NetworkCompletion
EPA proposed that the PM networkswould be expected to be completedwithin 3 years of the effective date ofpromulgation. While new PM2.5
networks are developed, reductions inexisting PM10 networks would beconsidered. The proposal stated thatduring the first year, a minimum of onemonitoring planning area per Statewould be required to have core PM2.5
SLAMS. This area would be selected bythe State according to the likelihood ofobserving high PM2.5 concentrations andaccording to the size of the affectedpopulation. In addition, one PM2.5 sitewas proposed to be collocated at onePAMS site in each of the PAMS areas.During the second year, all other corepopulation-oriented PM2.5 SLAMS, andall core background and transport sites,were proposed to be fully operational.During the third year, any additionalrequired PM2.5 (non-core) SLAMS wasproposed to be fully deployed and allNAMS sites would be selected from coreSLAMS and proposed to EPA forapproval.
Several commenters discussed theproposed phase-in schedule. Onecommenter supported an acceleratedphase-in schedule, while othercommenters supported a longer phase-in period. Several State commentersexpressed reservations about theirability to meet the proposed phase-inschedule, due to limited resources andthe unavailability of monitoringequipment. One commenter felt that thephase-in should require one coremonitor in each of a few geographicallydiverse areas per State, as this wouldprovide more valuable information thanonly one per MPA.
As noted in the comments on 40 CFRpart 58, Appendix D, a large number ofcommenters cited the immediate needfor an expansive PM2.5 monitoringnetwork to provide adequate monitoringdata to satisfy the monitoring objectivesof the SLAMS network, in particular, toprovide 3 years of PM2.5 data in orderto make comparisons with the NAAQS.As noted in the discussion below onresources and costs, the Agency’s grantallocations for fiscal years 1997-1998include significant resources toaccelerate the implementation scheduleand increase the number of monitoringsites included in today’s final rule. Inview of these actions, the Agency isaccelerating the SLAMS monitoring

38772 Federal Register / Vol. 62, No. 138 / Friday, July 18, 1997 / Rules and Regulations
network completion schedule to requireat least one core monitor in each MSAgreater than 500,000 population plusone PM2.5 site to be collocated with aPAMS site in each PAMS area and atleast 2 additional SLAMS per State to bein operation by 1998; to require all otherrequired SLAMS including requiredregional transport and regionalbackground sites to be in operation by1999; and to encourage all additionalsites (to complete the network) to be inoperation by 2000. In addition, theStates should have at least one coreSLAMS to be deployed in all areasexpected to have the potential for highPM2.5 concentrations, in accordancewith EPA guidance, to be in operationby 1998 which will be supported withfunding from EPA’s section 105 grantprogram.
H. Section 58.25 - System ModificationThe preamble to the proposal noted
that although no changes to theregulatory language were proposed forthis section, the annual monitoringsystem modifications review mustinclude changes to PM2.5 sitedesignations (e.g., NAAQS comparisonsites), and the number or boundaries ofmonitoring planning areas and/orspatial averaging zones, now referred toas community monitoring zones. Thisinformation is included for explanatorypurposes only and does not necessitatechanges to the regulatory language.
I. Section 58.26 - Annual StateMonitoring Report
Under the current regulations, Statesare required to submit an annualSLAMS data summary report. EPAproposed that this report shall beexpanded to: (1) Describe the proposedchanges to the State’s PM MonitoringNetwork Description, as defined in§ 58.20; (2) include a new brief narrativereport to describe the findings of theannual SLAMS network review,reflecting within the year and proposedchanges to the State air qualitysurveillance system; and (3) provideinformation on PM SPMs and other PMsites noted in the PM monitoringnetwork description regardless ofwhether data from the stations aresubmitted to EPA (including number ofmonitoring stations, general locations,monitoring objective, scale ofmeasurement, and appropriateconcentration statistics to characterizePM air quality such as number ofmeasurements, averaging time, andmaximum, minimum, and averageconcentration). The latter is for EPA toensure that a proper mix of permanentand temporary monitoring locations areused and that populated areas
throughout the Nation are monitored,and to provide needed flexibility in theState monitoring program.
In addition, the proposed changes tothe PM monitoring network descriptionincluded changes to existing PMnetworks. The proposed changes toexisting PM networks includedmodifications to the number, size, orboundaries of MPAs or SAZ’s, numberand location of PM SLAMS; number orlocation of core PM2.5 SLAMS;alternative sampling frequenciesproposed for PM2.5 SLAMS (includingcore PM2.5 SLAMS and PM2.5 NAMS);core PM2.5 SLAMS to be designatedPM2.5 NAMS; and PM SLAMS to bedesignated PM NAMS. SPM’s withmeasured values greater than the levelof the NAAQS would become part of theSLAMS network. The proposed changeswould be developed in closeconsultation with the appropriate EPARegional Office and submitted to theappropriate Regional Office forapproval. The portion of the documentpertaining to NAMS would besubmitted to the EPA Administrator(through the appropriate RegionalOffice).
Finally, as a continuation of currentregulations, the States would berequired to submit the annual SLAMSsummary report and to certify to theEPA Administrator that the SLAMS datasubmitted are accurate and inconformance with applicable part 58requirements. Under the proposedrevisions, States would also be requiredto submit annual summaries of SPMdata to the EPA Regional Administratorfor sites included in their PMmonitoring network description and tocertify that such data are similarlyaccurate and likewise in conformancewith applicable part 58 requirements orother requirements approved by theEPA Regional Administrator, if thesedata are intended to be used for SIPpurposes. All of the proposed changesdescribed above did not receivesubstantive comment and were retainedin the final rule.
During the first 3 years followingpromulgation, the proposal stated thatthe State’s PM monitoring description(changed to PM monitoring networkdescription) and any modifications of itwould be submitted to EPA by July 1(starting on the year followingpromulgation) or by alternate annualdate to be negotiated between the Stateand EPA Regional Administrator, withreview and approval/disapproval by theEPA Regional Administrator wasproposed to occur within 45 days. Afterthe initial 3–year period or once an SAZ(now called CMZ) has been determinedto be violating any PM2.5 NAAQS, then
changes to a MPA would require publicreview and notification to ensure thatthe appropriate monitoring locationsand site types are included.
Several commenters addressed therequirements for the Annual StateMonitoring Report. Some commentersfelt that the 45-day review was toorestrictive and should be extended to 60days. Other commenters felt that theannual review requirement wasreasonable in the short-term, but shouldbe reconsidered after 3 years.
In response to these comments, theAgency is extending the Regionalreview period to 60 days. After the first3 years, the required annual review canbe reconsidered and its schedule revisedas determined by the EPA RegionalAdministrator. As discussed earlier inthis preamble, EPA will entertainsuggestions for modifications to thepublished monitoring networkrequirements. States can requestexemptions from specific requiredelements of the network design (e.g.,required number of core SLAMS sites,other SLAMS sites, sampling frequency,etc.) through the Annual MonitoringReport.
J. Section 58.30 - NAMS NetworkEstablishment
The preamble to the proposal calledfor States to submit a NAMS networkdescription (which is to be derived fromthe core PM2.5 SLAMS) of each State’sSLAMS network to the EPAAdministrator (through the appropriateEPA Regional Office) within 6 monthsof the effective date of the final rule. Atthe same time, a State’s NAMS PM10
network must be reaffirmed if nochanges are made to the existingnetwork and if changed must also befully described and documented in asubmittal to the EPA Administrator(through the appropriate EPA RegionalOffice). The proposed § 58.34 stated thatthe NAMS Network completion shall beby 3 years after the effective date of thefinal rule. This has not been changed inthis final rule. However, the proposedrevisions to this section inadvertentlycalled for the PM2.5 network descriptionto be submitted 3 years after theeffective date of promulgation. The finalrule has been changed to read July 1,1998.
K. Section 58.31 - NAMS NetworkDescription
The term spatial averaging zone wasused in the proposed revisions to thissection. In the final rule, this term hasbeen replaced by the term communitymonitoring zone (CMZ).

38773Federal Register / Vol. 62, No. 138 / Friday, July 18, 1997 / Rules and Regulations
L. Section 58.34 - NAMS NetworkCompletion
The preamble to the proposal calledfor changes to the NAMS PM10 networkto be completed by 1 year after theeffective date of the final rule and to theNAMS PM2.5 network to be completedby 3 years after the effective date of thefinal rule. The proposed rule incorrectlystated 6 months instead of 1 year for thePM10 network to be completed. Thefinal rule has been changed to read 1year after the effective date of theseregulations for PM10 and 3 years afterthe effective date of these regulations forPM2.5.
M. Section 58.35 - NAMS DataSubmittal
The proposed revision to this sectionadded PM2.5 as an additional indicatorof PM to the list of pollutants that mustsubmit air quality data and associatedinformation to the EPA Administrator asspecified in the AIRS Users Guide. Thissection is promulgated as proposed.
N. Appendix A - Quality AssuranceRequirements for SLAMS
1. Summary of proposal. The proposaladdressed the fact that enhanced QAand QC procedures were required in theareas of sampler operation, filterhandling, data quality assessment, andother operator-related aspects of thePM2.5 measurement process. Theseenhanced QA/QC procedures werenecessary for meeting the data qualityobjectives for ambient PM2.5 monitoring.
Most operational QC aspects werespecified in 40 CFR part 58, AppendixA in general terms. However, for PM2.5,explicit, more stringent, requirementswere proposed for sample filtertreatment--including the moistureequilibration protocol, weighingprocedures, temperature limits forcollected samples, and time limits forprompt analysis of samples. Detailsconcerning these operator-relatedprocedures were proposed to bepublished as a new section 2.12 ofEPA’s Quality Assurance Handbook forAir Pollution Measurement Systems,Volume II to assist monitoringpersonnel in maintaining high standardsof data quality.
Procedures were proposed forassessing the resulting quality of themonitoring data in 40 CFR part 58,Appendix A. Perhaps the mostsignificant new data quality assessmentrequirement proposed for PM2.5
monitoring was the requirement thateach PM2.5 SLAMS monitor was to beaudited at least six times per year. Thiswas the first time a requirement hadbeen proposed to assess the relative
accuracy of the mass concentrationmeasured by a PM SLAMS monitor.Each of these six audits would havebeen performed by the monitoringagency and would have consisted ofconcurrent operation of a collocatedreference method audit sampler alongwith the PM2.5 SLAMS monitor. Thedata from these collocated audits wereproposed to have been used by EPA toassess the performance of the PM2.5
SLAMS monitor and to identifyreporting organizations or individualsites that had abnormal bias orinadequate precision for the year.
Other data assessment requirementsproposed for PM2.5 monitoring networkswere patterned after the currentrequirements for PM10 networks andwere intended to supplement the auditprocedure. The proposal required PM2.5
network monitors to be subject toprecision and accuracy assessments forboth manual and automated methods,using procedures similar or identical tothe current procedures required forPM10 monitoring networks. Results ofthe field tests performed by themonitoring agencies (including the fieldtests) would have been sent to EPA. EPAthen would have carried out thespecified calculations which wouldhave become part of the annualassessment of the quality of themonitoring data.
Although the proposed QArequirements for PM2.5 would haveresulted in an increase in qualityassessment requirement for PMmonitoring, the additional QA/QCchecks would have incurred more costto the monitoring agency. Some of theproposed new QA/QC assessmentrequirements would have somewhatoverlapped the information provided byother checks, such as the periodic flowrate checks and the use of collocatedsamplers in monitoring networks.
A revision to 40 CFR part 58,Appendix A, was also proposed toprovide for technical system audits to beperformed by EPA at least every 3 yearsrather than every year. This change to aless frequent system audit schedulerecognized the fact that for many wellestablished agencies, an extensivesystem audit and rigorous inspectionmay not have been necessary every year.The determination of the extent andfrequency of system audits at an evenlower frequency than the proposed 3-year interval was being left up to thediscretion of the appropriate EPARegional Office, based on an evaluationof the Agency’s data quality measures.This change would have afforded bothEPA and the air monitoring agenciesflexibility to manage their air
monitoring resources to better addressthe most critical data quality issues.
2. The PM2.5 QA system. Based uponpublic comments, the Agency hasreviewed 40 CFR part 58, Appendix Aand re-evaluated several aspects of theQA and QC quality control system usedto assess the particulate monitoringdata. The requirements associated withthe PM10 QA system remainedunchanged by these modifications.Specifically for PM2.5, the majormodifications include focusing 80percent of the QA resources to sites withconcentrations of greater than or equalto 90 percent of the annual PM2.5
NAAQS (or 24–hour NAAQS if that isaffecting the area), increasing theamount of collocated monitors to 25percent of the total number of SLAMSmonitors within a reportingorganization, and changing the FRMaudit procedures to an independentassessment of the bias of the PM2.5
monitoring network. The FRM auditswere reduced in number to 25 percentof the SLAMS monitors at a frequencyof 4 times per year. All modificationsare discussed in detail in the followingparagraphs.
In response to comments that theproposed QA requirements wereinadequate, and in order to clarify theintent of the quality system, EPA isincorporating the concept and definitionof a quality system into section 2,Quality System Requirements. EPAdefines QA as an integrated system ofmanagement activities involvingplanning, implementation, assessment,reporting, and quality improvement toensure that a process, item, or service isof the type and quality needed andexpected by the customer. QC is definedas the overall system of technicalactivities that measures the attributesand performance of a process, item, orservice against defined standards toverify that they meet the statedrequirements established by thecustomer. A quality system is defined asa structured and documentedmanagement system describing thepolicies, objectives, principles,organizational authority,responsibilities, accountability, andimplementation plan of an organizationfor ensuring quality in its workprocesses, products (items), andservices. The quality system providesthe framework for planning,implementing, and assessing workperformed by the organization and forcarrying out required QA and QC.
The Agency used the data qualityobjective (DQO) process to specificallydevelop the QA system for the newPM2.5 program. The DQO process is asystematic strategic planning tool based

38774 Federal Register / Vol. 62, No. 138 / Friday, July 18, 1997 / Rules and Regulations
on the scientific method that identifiesand defines the type, quality, andquantity of data needed to satisfy aspecific use. Meeting the new dataquality objectives for ambient PM2.5
monitoring requires a combination ofQA and QC procedures to evaluate andcontrol data measurement uncertainty.For this reason, EPA has developed aquality system specifically for PM2.5
which incorporates procedures toquantify total measurement uncertainty,as it relates to total precision and totalbias, within the PM2.5 monitoringnetwork. In order to clarify the toolsused in the QA system, the Agency hasincluded definitions in 40 CFR part 58,Appendix A. Total bias is defined as thesystematic or persistent distortion of ameasurement process which causeserrors in one direction (i.e., the expectedsample measurement is different fromthe sample’s true value). Total precisionis defined as a measure of mutualagreement among individualmeasurements of the same property,usually under prescribed similarconditions, expressed generally in termsof the standard deviation. Accuracy isdefined as the degree of agreementbetween an observed value and anaccepted reference value, accuracyincludes a combination of random error(precision) and systematic error (bias)components which are due to samplingand analytical operations. The Agencywill use various QA tools to quantifythis measurement uncertainty; thisincludes collocation of monitors atvarious PM2.5 sites, use of operationalflow checks, and implementation of anindependent FRM audit.
The measurement system representsthe entire data collection activity. Thisactivity includes the initialequilibration, weighing, andtransportation of the filters to thesampler; calibration, maintenance, andproper operation of the instrument;handling/placement of the filters;proper operation of the instrument(sample collection); removal/handling/transportation of the filter from thesampler to the laboratory; weighing,storage, and archival of the sampledfilter; and finally, data analysis andreporting. Additional or supplementaldetailed quality assurance proceduresand guidance for all operator-relatedaspects of the PM2.5 monitoring processwill be published as a new section 2.12of EPA’s Quality Assurance Handbookfor Air Pollution Measurement Systems,Volume II, Ambient Air SpecificMethods to assist monitoring personnelin maintaining high standards of dataquality.
To clarify the requirements andguidance concerning the SLAMS
ambient air network, the Agency hasdeveloped Quality Assurance Division(QAD) requirements documents, whichare referenced in section 2.2. Forsimplification, the Agency has removedthe list of pertinent operationalprocedures from this section and hasreplaced the list with the updatedreference. In response to commentsabout potential difficulties in followingthe requirements in ANSI E-4, EPA hasinstead required quality assurance andcontrol programs to follow therequirements for quality assuranceproject plans contained in EPArequirements for quality assuranceproject plans for environmental dataoperations, EPA QA/R-5 an EPA QADdocument.
EPA received many comments on theproposed bimonthly audits for eachPM2.5 site as proposed in section 6.0 ofAppendix A. Commenters expressedconcerns about the excessive burden therequirement would put on State andlocal air pollution control agencies, thelength of time involved with theprocess, and the quality control,reliability, and logistical aspects of aportable audit device.
Based upon these comments, theAgency re-assessed its positionconcerning the number of sites and thefrequency of audits that the State andlocal agencies perform. The Agencyfeels that independent FRM audits areessential to reaching the goal of the dataquality objectives for PM2.5 becausethese audits evaluate the total bias foreach designated PM2.5 Federal Referenceand Equivalent monitoring methodwithin the monitoring network.Therefore, the Agency has modified theproposed audit program to make itindependent and also to reduce theburden on State and local agencies.Section 6.0 as proposed has beendeleted, with remaining data qualityassessment requirements for PM2.5
included in section 3.5 of 40 CFR part58, Appendix A. The resulting data willbe assessed at three distinct levels--single monitor level, reportingorganization level, and at a nationallevel. Details of the assessment processwill be published in EPA’s QualityAssurance Handbook for Air PollutionMeasurement Systems, Volume II,Ambient Air Specific Methods.
Commenters endorsed the reductionin the frequency of systems audits fromevery year to every 3 years as proposedin section 2.5. Therefore, therequirement for a 3–year schedule forsystem audits remains unchanged.
3. Evaluation of measurementuncertainty. EPA received severalcomments on the procedures used toaddress the quality assurance of the data
as proposed in section 3 of theAppendix. Commenters were concernedabout the limited resources available toproperly comply with all aspects of theproposed quality system. In the initialdeployment of the SLAMS PM2.5
network, special QA emphasis shouldbe placed on those sites likely to beinvolved in possible nonattainmentdecisions. Once the initial attainment/nonattainment designations have beenmade, the Agency recommends focusing80 percent of the QA activity (collocatedmonitors and FRM audits) at sites withconcentrations greater than or equal to90 percent of the mean annual PM2.5
NAAQS (or 24–hour NAAQS if that isaffecting the area); this percentage willbe 100 percent if all sites haveconcentrations above either NAAQS.The remaining 20 percent of the QAactivity would be at sites withconcentrations less than 90 percent ofthe PM2.5 NAAQS. If an organization hasno sites at concentration ranges greaterthan or equal to 90 percent of the PM2.5
NAAQS, the Agency recommends 60percent of the QA activity be at sitesamong the highest 25 percent for allPM2.5 sites in the network. The Agencyunderstands the initial selection of siteswill likely be subjective and based uponthe experience of State and localorganizations.
Other data assessment requirementsfor PM2.5 monitoring networks arepatterned after the current requirementsfor PM10 networks and are intended toquantify the monitoring network’s totalprecision and bias. PM2.5 networkmonitors will be subject to performanceassessments for both manual andautomated methods, using proceduressimilar or identical to the currentprocedures required for PM10
monitoring networks. The Agencyreceived several comments describingincentives for acceptable performance inthe QA field. In response to theseconcerns, EPA intends to reduce the QAburden in accordance with networkmonitoring and acceptable performanceof the QA program. Based upon EPA’syearly data quality assessment,acceptable performance could result ina reduction in the frequencies of QA/QCrequirements. Additional details for theincentive program will be provided inthe Quality Assurance Handbook for AirPollution Measurement Systems,Volume II, Ambient Air SpecificMethods.
The Agency believes that to developa national, consistent monitoringnetwork with quantifiable data quality,a quality system must be developed thatpermits maximum flexibility yet ensuresthat the measurement uncertainty isknown and under control. For this

38775Federal Register / Vol. 62, No. 138 / Friday, July 18, 1997 / Rules and Regulations
reason, the Agency has removed therequirement in section 3.3.5 that thepaired monitors have the same FRM orequivalent sampler designation number,but now formalizes the 6-day samplingschedule for collocated monitors intothe regulation; this was previouslydescribed in guidance.
With regard to the requirements forevaluating measurement uncertainty,the estimates of bias within themonitoring network will be evaluatedwith flow audits (section 3.5.1) andindependent FRM audits (see commentsconcerning section 3.5.3). An audit ofthe operational flow rate determinesbias as performed by the local operatorsof manual methods for PM2.5 with eachsampler each calendar quarter. Using aflow rate transfer standard, eachsampler will be audited at its normaloperating flow rate. The percentdifferences between the standard andsampler flow rates will be used toevaluate instrument-specific bias.
Specifically, for Federal Referenceand Equivalent automated methods, anadditional assessment of the precisionwill consist of a one-point precisioncheck performed at least once every 2weeks on each automated analyzer usedto measure PM2.5. This precision checkis performed by checking theoperational flow rate of the analyzer,using a procedure similar to thatcurrently used for PM10 networkassessments. In addition, an alternativeprocedure may be used where, undercertain specific conditions, it ispermissible to obtain the precisioncheck flow rate data from the analyzer’sinternal flow meter without the use ofan external flow rate transfer standard.This alternative procedure is also madeapplicable to PM10 methods.
With regard to the proposedrequirements in section 3.5.2,(Measurement of precision usingcollocated procedures for automatedand manual methods of PM2.5) severalcommenters felt that invalid data or dataof questionable quality should not be apart of the data base, since the generalpublic and many end-users of the datasuch as consultants and modelers do notalways make distinctions about data.Data reporting requirements specify thatall valid monitoring data be reported toAIRS. EPA believes that the requirementcontained in section 4.1 to report allQA/QC measurements including resultsfrom invalid tests is necessary to fullyassess the performance of reportingorganizations and to allow EPA torecommend appropriate correctiveactions. Such data will be flagged sothat it will not be utilized forquantitative assessments of precision,bias, and accuracy. EPA also received
many comments on the use ofcollocated samplers to assess precision.Most of these comments advocated anincrease in the number of collocatedmonitors as an alternative to reduce theburden of the independent audit system.Based upon these comments, EPA hasreassessed its position on the number ofcollocated monitors and now requires25 percent of the total number ofmonitors for each designated FederalRand Equivalent Method within areporting organization to be collocated.To further assess the total precision andbias of the monitoring network, half ofthe collocated monitors for eachdesignated Federal Reference andEquivalent Method must be collocatedwith a Federal Reference Method (FRM)designated monitor and half must becollocated with a monitor of the samedesignated method type as the primarymonitor. An example is shown in TableA-2 in 40 CFR part 58, Appendix A.
The Agency received numerouscomments concerning the burden of theproposed FRM audit procedures forPM2.5 (section 3.5.3), which consisted ofhaving every site audited six times eachyear with a portable FRM audit sampler.In response to these comments, EPA hasreduced the number of audits to 25percent of the total number of SLAMSPM2.5 sites to be audited 4 times eachyear. In addition, EPA has reduced theburden of the State and local agenciesresponsibility for implementing theaudits by providing access to theexisting EPA National PerformanceAudit Program (NPAP) or othercomparable programs. The detailsconcerning the assessment of theresulting data will be published inEPA’s Quality Assurance Handbook forAir Pollution Measurement Systems,Volume II, Ambient Air SpecificMethods.
4. Reporting requirements. EPAreceived several comments concerningthe adequacy of QA reportingrequirements (section 4). The Agencyhas addressed these comments bystrongly encouraging earlier QA datasubmittal in order to assist the State andlocal agencies in controlling andevaluating the quality of the ambient airSLAMS data.
5. Data quality assessment. Inresponse to several commentsconcerning the adequacy of the QA dataassessment procedures for the PM2.5
program, including parts of proposedsection 6.0, EPA developed a newsection 5.5 to consolidate and simplifythe procedures and calculations for theprecision, accuracy, and biasmeasurements used to quantify PM2.5
data quality. The quality assurancesystem has been nested in such a
manner that will allow for theassessment of total measurement biasand precision, as well as portions of themeasurement system (i.e. fieldoperations, laboratory operations, etc.).Four distinct quality control checks andaudits are implemented to evaluate totalmeasurement uncertainty: (1) Determineinstrument accuracy and instrumentbias from flow rate audits, (2) determineprecision from collocated monitorswhere the duplicate monitor has thesame method designation, (3) determinea portion of the measurement bias fromcollocated monitors where the duplicatesampler is an FRM device, and (4)determine total measurement bias fromFRM audits. This design will allow forearly identification of data qualityissues in the measurement phases (field/laboratory operations) where they maybe occurring and therefore, effectiveimplementation of corrective actions.
6. FRM audit requirements. TheAgency received many commentsconcerned with the burden theproposed FRM audit system (the deletedSection 6: Annual OperationalEvaluation of PM2.5 Methods) would putupon the individual State and local airpollution agencies. Based upon thenumerous comments, the Agency has re-assessed its position concerning theaudit system. The Agency reduced thisburden by providing the State and localagencies the flexibility to access theexisting NPAP program or comparableprogram, additionally reducing theburden to 25 percent of the total numberof SLAMS PM2.5 sites each year, andreducing the frequency of the audits to4 per year. EPA has removed section 6.0from the regulations and incorporatedthe appropriate information into othersections within 40 CFR part 58,Appendix A. Additional informationwill be provided in the QualityAssurance Handbook for Air PollutionMeasurement Systems, Volume II,Ambient Air Specific Methods.
O. Appendix C - Ambient Air QualityMonitoring Methodology
EPA proposed that 40 CFR part 53,subpart C, be amended to allow the useof certain PM10 monitors as surrogatesfor PM2.5 monitors for purposes ofdemonstrating compliance with theNAAQS. The proposal further statedhowever, following the measurement ofa PM10 concentration higher than the24–hour PM2.5 standard or an annualaverage concentration higher than theannual average PM2.5 standard, the PM10
monitor would have to be replaced witha PM2.5 monitor. In the proposal ofAppendix C, EPA also discussed the useof several types of PM2.5 samplers at aSLAMS that are not designated as a

38776 Federal Register / Vol. 62, No. 138 / Friday, July 18, 1997 / Rules and Regulations
reference or equivalent method under40 CFR part 53. First, EPA proposed theuse of certain nonreference/nonequivalent PM2.5 methods that couldbe used at a particular SLAMS site tomake comparisons to the NAAQS if itmet the basic requirements of the testfor comparability to a reference methodsampler for PM2.5, as specified of 40CFR part 53, subpart C in each of thefour seasons of the year at the site atwhich it is intended to be used. Amethod that meets this test would thenbe further subjected to the operatingprecision and accuracy requirementsspecified in the proposed Appendix Ato 40 CFR part 53, at twice the normalevaluation interval. A method thatmeets these proposed requirementswould not become an equivalentmethod, but the method could be usedat that particular SLAMS site for anyregulatory purpose. Second, EPAdiscussed the use of CAC methodsdescribed in § 58.13(f) which areintended to supplement a reference orequivalent manual method at certainSLAMS, so that the manual methodcould reduce its sampling frequencyfrom every day to once in 3 days. Inaddition, the proposed Appendix Cclarifies that the monitoring dataobtained with CAC methods would berestricted to use for the purposes of theproposed § 58.13(f) and would not beused for making comparisons to theNAAQS. Finally, the proposal alsodescribed samplers for fine particulatematter used in the IMPROVE network(hereafter termed IMPROVED samplers)and clarified that IMPROVE samplers,although not designated as equivalentmethods, could be used in SLAMS formonitoring regional backgroundconcentrations of fine particulatematter.
Some commenters questioned theproposed use of PM10 samplers assubstitutes for PM2.5 samplers to satisfyrequirements for PM2.5 SLAMSmonitoring. EPA reassessed the logicbehind this proposal and agreed withcommenters that substitute samplersshould not be allowed. In order for aPM10 sampler to be a substitute PM2.5
sampler, the annual average PM10 wouldhave to be less than 15 ©g/m3 and theannual maximum 24–hour PM10 wouldhave to be less than 65 ©g/m3. Thissituation would not be representative ofcommunity-oriented monitoring, wouldonly exist at a few rural locations andwould not even provide usefulinformation about PM2.5 backgroundconcentrations; therefore EPA hasdeleted this provision from Appendix C.
Appendix C is being amended to adda new section 2.4 continuing provisionsthat allow the use of a PM2.5 method
that had not been designated as areference or equivalent method under40 CFR part 53 at a SLAMS underspecial conditions. Such a method willbe allowed to be used at a particularSLAMS site to make comparisons to theNAAQS if it meets the basicrequirements of the test forcomparability to a reference methodsampler for PM2.5, as specified in 40CFR part 53, subpart C, in each of thefour seasons of the year at the site atwhich it is intended to be used. Amethod that meets this test will then befurther subjected to the operatingprecision and accuracy requirementsspecified in 40 CFR part 53, AppendixA, at twice the normal evaluationinterval. A method that meets theserequirements will not become anequivalent method, but can be used atthat particular SLAMS site for anyregulatory purpose. The method will beassigned a special method code, anddata obtained with the method will beaccepted into AIRS as if they had beenobtained with a reference or equivalentmethod. This provision will allow theuse of non-conventional PM2.5 methods,such as optical or open pathmeasurement methods, which would bedifficult to test under the equivalentmethod test procedures proposed for 40CFR part 53.
In addition, Appendix C is beingamended to add a new section 2.5 toclarify that CAC methods for PM2.5
approved for use in a SLAMS undernew provisions in § 58.13(f) will notbecome de facto equivalent methods asproposed. This applies to methods thathave not been designated equivalent ordo not satisfy the requirements ofsection 2.4 previously described. Inresponse to recommendations thatIMPROVE samplers be allowed for useat core background and core transportsites, EPA is revising section 2.9 todefine IMPROVE samplers for fineparticulate matter and clarify thatIMPROVE samplers, although notdesignated as equivalent methods, couldbe used in SLAMS for monitoringregional background and regionaltransport concentrations of fineparticulate matter.
Finally, minor changes are beingmade to section 2.7.1 to update theaddress to which requests for approvalfor the use of methods under the variousprovisions of Appendix C should besent, and section 5 to add additionalreferences.
P. Appendix D - Network Design ForState and Local Air Monitoring Stations(SLAMS), National Air MonitoringStations (NAMS) and PhotochemicalAssessment Monitoring Stations (PAMS)
1. Section 2.8.1 - Specific designcriteria for PM2.5. The proposedregulation contained language regardingthe implementation of spatial averagingthrough the design of PM2.5 monitoringnetworks. MPAs and SAZs wereintroduced to conform to thepopulation-oriented, spatial averagingapproach taken in the proposed PM2.5
NAAQS under 40 CFR part 50. Whilethis proposed approach is more directlyrelated to the epidemiological studiesused as the basis for the proposedrevisions to the particulate matterNAAQS, it recognized that the use ofMPAs and SAZs introduced greatercomplexity into the network designprocess and the comparison of observedvalues to the level of the PM2.5 annualNAAQS.
A great number of comments werereceived concerning the communicationand complexity of spatial averaging, theselection of monitors, and the need forproviding flexibility in specifyingnetwork designs and spatial averaginggiven that the nature and sources of fineparticles vary from one area to another.
In response to concerns about theimplementation and communication ofspatial averaging, EPA is clarifying therequirement for SAZs by changing someterminology. EPA is also making it clearthat the annual mean PM2.5 from asingle properly sited monitor that isrepresentative of community-wideexposures or an average of annual meanPM2.5 concentrations produced by oneor more of such monitors that meetsiting requirements and otherconstraints as set forth in thisrulemaking can be compared to thePM2.5 annual standard. Specifically, thisrule indicates that comparisons to theannual PM2.5 standard can be madethrough the use of individual monitorsor the annual average of monitors inspecific CMZs. Community-orientedmonitors should be used for thesecomparisons. This approach willprovide State and local agencies withadditional flexibility in definingcommunity-wide air quality and indesigning monitoring networks. Theannual average PM2.5 concentrationfrom one or more monitoring siteswithin a CMZ may be averaged toproduce an alternative indicator ofannual average community-wide airquality. However, the criteria forestablishing CMZs have been modified(compared to the previous SAZs) so thatinitial monitors will be located in those

38777Federal Register / Vol. 62, No. 138 / Friday, July 18, 1997 / Rules and Regulations
areas expected to have the highestcommunity-oriented concentrations. Itshould be noted that many of the sitesmeeting the siting, monitoringmethodology, and other monitoringrequirements in 40 CFR part 58 includepopulation-oriented SPMs andindustrial monitors.
The eligible core monitors in a CMZstill must be properly sited and meet theconstraints specified in section 2.8.1.6of 40 CFR part 58, Appendix D. Theterm SAZ has been replaced with CMZand zone throughout Appendix D. If theState chooses to make comparisons tothe annual PM2.5 NAAQS directly withindividual monitors that use the sitingrequirements of section 2.8.1.6.3 of 40CFR part 58, Appendix D then it is notrequired to perform the analyses neededto establish a CMZ. A State still wouldbe expected to justify that the site meetsthe specified siting requirements and isrepresentative of community-wideexposures. Then it would not beexpected, apriori, to define theboundaries of zones within which themonitoring data would be averaged.This section, that was proposed as‘‘Monitoring Planning Areas and SpatialAveraging Zones,’’ has been retitled as‘‘Specific Design Criteria for PM2.5.’’
2. Section 2.8.1.3 - Core monitoringstations for PM2.5. The proposedregulations described requirements forthe numbers of SLAMS sites includingcore SLAMS. To provide a minimalPM2.5 network in all high populationareas for protection of the annual and24–hour PM NAAQS, each requiredMPA was proposed to have at least twocore monitors. The new core monitoringlocations would be an important part ofthe basic PM-fine SLAMS regulatorynetwork. These sites are intended toprimarily reflect community-wide airpollution in residential areas or wherepeople spend a substantial part of theday. In addition to the population-oriented monitoring sites, core monitorswould also be established for regionalbackground and regional transportmonitoring.
To permit interface withmeasurements of ozone precursors andrelated emission sources that maycontribute to PM2.5, an additional coremonitor collocated at a PAMS site wasproposed to be required in those MSAswhere both PAMS and PM2.5 monitoringare required. The core monitor to becollocated at a PAMS site would beconsidered to be part of the MPA PM2.5
SLAMS network and would not beconsidered to be a part of the PAMSnetwork as described in section 4 of 40CFR part 58, Appendix D. Each SAZ ina required MPA was proposed to haveat least one core monitor; SAZs in
optional MPAs were proposed to have atleast one core monitor; and SAZs wereproposed to have at least one core sitefor every four SLAMS.
Several commenters addressed issuesrelated to the number of core SLAMS,population-oriented SLAMS, and otherSLAMS. Numerous commenterssupported increasing the number ofstations while few supported decreasingthe number of stations. In addition,some commenters addressing the issueof spatial averaging also suggested thatmore monitors might be needed toaddress less populated areas and areasnear hot spots. A few commenterssuggested that large States or geographicareas might require several regionalbackground or regional transport sitesand that increased monitoring in ruralor remote areas would be needed toestablish naturally occurringconcentrations produced by biogenicsources.
EPA agrees with commenters thatmore monitors are needed to addresssmaller communities, larger MSAs withseveral source categories of fineparticulate emissions, to addresscoverage for multiple sites in optionalCMZs, regional transport monitoringupwind of the major population centersin the country, and additional sites nearpopulation-oriented pollution hot spots.Accordingly, EPA has revised theregulation to increase the number ofrequired core SLAMS and otherSLAMS. These changes result inapproximately 220 more requiredsampling sites, nationally, as comparedto the number proposed (850 versus629). At least one core SLAMS is nowrequired in any MSA with a populationgreater than 200,000. EPA is requiringadditional sites in all MSAs withpopulation greater than 1 million inaccordance with the following table:
Table 1.—Required Number of CoreSLAMS According to MSA Popu-lation
MSA Population Minimum RequiredNo. of Core Sitesa
>1 M 3
>2 M 4
>4 M 6
>6 M 8
>8 M 10
aCore SLAMS at PAMS are in addition tothese numbers.
This section, which was proposed assection 2.8.2.1, has been renumbered assection 2.8.1.3.
As discussed in § 58.13, OperatingSchedule, all PM2.5 SLAMS are requiredto have a minimum operating scheduleof once every 3 days, except for a subsetof at least two core PM2.5 sites per MSAwith population greater than 500,000and one site in each PAMS area that isrequired to conduct daily sampling asproposed.
3. Section 2.8.1.4 - Other PM2.5
SLAMS locations. EPA is retaining therequirement to have a minimum of oneregional background and one regionaltransport site per State and recognizingthe need for exceptions whenappropriate, particularly in small States;however, these sites are no longerdesignated as core SLAMS. EPA also isrequiring additional SLAMS monitorsbased upon the State population less thepopulation in all required MSAmonitoring areas (i.e., MSAs greaterthan 200,000), to provide populationcoverage throughout the State,particularly in States with fewerurbanized areas. For this remainingpopulation there should be oneadditional SLAMS per 200,000population. These additional sites maybe used to satisfy any SLAMS objectiveanywhere in the State includingpopulation areas (large cities or smalltowns) or regional transport in ruralareas. The requirement for theadditional SLAMS is over and above therequirement for one regionalbackground and regional transport siteper State as mentioned above. Thissection, which was proposed as section2.8.2.2, has been renumbered as section2.8.1.4. For planning purposes, EPAexpects that the total number of sites ina mature, fully-developed PM2.5
network will exceed these requiredminimums. The projected total numberis 1,500 sites, as compared to theproposed 1,200 sites. This is an increaseof 25 percent compared to the numberproposed and is based on the recognizedneed for more monitoring in smallercommunities, more monitors in largerMSAs with several source categories offine particulate emissions, the possibleneed for multiple sites in optionalCMZs, the need to support regionaltransport monitoring upwind of themajor population centers in the country,and the need for additional sites nearpollution hot spots.
4. Section 2.8.1.5 - Additional PM2.5
Analysis Requirements. EPA recognizesthe need for chemical speciation ofparticulate matter. Such data are neededto characterize PM2.5 composition and tobetter understand the sources andprocesses leading to elevated PM2.5
concentrations. Because of the costsassociated with conducting filteranalysis on a routine basis, however the

38778 Federal Register / Vol. 62, No. 138 / Friday, July 18, 1997 / Rules and Regulations
proposal only required filters to bearchived so they would be available forsubsequent chemical analysis on an asneeded basis. EPA recognizes that thereis a need for speciation and otherspecialized monitoring efforts that werenot specifically required by theproposed rule. Accordingly, EPAintended to give these PM monitoringefforts high priority in its section 105grants program.
Many commenters supported theconcept of chemical speciation, notingthat speciation was essential foridentifying all of the components of fineparticles and developing controlstrategies. Some commentersrecommended that the program beconducted under national or regionalsupervision to ensure consistency andreduce costs, and that routine chemicalanalyses are conducted in a centralizedlaboratory. EPA also received severalcomments on the proposed archivalrequirements. Some commenterssuggested that if chemical speciationwas required, the filter archivalrequirement could be eliminated. Othercommenters noted that the long-termarchival requirements placed additionalresource burdens on agencies, and thatpossible filter degradation and/or biascould result from archiving samplesprior to analysis.
Based on these comments, the Agencyreassessed its position concerningchemical speciation as an optional partof the PM2.5 monitoring program.Although speciation is resourceintensive, EPA believes that its overallvalue in satisfying control strategy andother data needs justifies the addedexpense. Chemical speciation iscritically important for theimplementation efforts associated withair quality programs. Specific subjectareas supported by chemical speciationinclude source attribution analysis (i.e.,determining the likely mix of sourcesimpacting a site) and emissioninventory and air quality modelevaluation. Emission inventory andmodeling tools are used to developsound emission reduction strategies.Speciated data are especially critical forair quality model evaluation sinceresolved chemical measurementsprovide greater assurance thatacceptable model behavior results fromappropriate process characterizationrather than through the collective effectof compensating errors. Speciated dataprovide greater ability to identify thecauses of poor model performance andimplement corrective actions. Afterstrategies are developed and controls areimplemented, chemically resolvedPM2.5 data provide a tracking andfeedback mechanism to assess the
effectiveness of controls and, ifnecessary, provide a basis foradjustment. Chemical speciationprovides an additional quality check ondata consistency since a basis forcomparing the sum of individualcomponents (i.e., speciated data) withtotal mass measurement is available.Also, speciated data supports theforthcoming regional haze program byproviding a basis for developing reliableestimates of seasonal and annualaverage visibility conditions.Chemically resolved data shouldprovide more complete data for futurehealth studies. EPA believes thatspeciation should be part of the finalPM2.5 monitoring program due to thecollective value of speciation. However,the Agency also believes that flexibilitymust be provided to the States to tailorefforts to the needs of specific areas.Based on public comments, a minimumchemical speciation trends network willbe required to address the needsdiscussed above.
Based on this requirement to collectspeciated data at NAMS sites, EPA iseliminating the requirement to archivefilters from NAMS. However, all otherSLAMS sites will still be required toarchive filters for a minimum of 1 yearafter collection. Access to thesearchived filters for chemical speciationwould be helpful in cases where: (1)Exceedances or near exceedances of thestandard have occurred and additionalinformation and data are needed todetermine more precisely possiblesources contributing to the exceedancesor high concentrations, and (2) certainsites may have shown markeddifferences in air quality trends at thelocal or national level for no apparentreason and analysis of filters from morethan one site might be required todetermine the reason(s) for thedifferences. EPA intends to assign ahigh priority to this program through itssection 105 grant allocation programand will issue guidance describing themonitoring methods and scenariosunder which speciation should beperformed. The FRM described in 40CFR part 50, Appendix L, is finalized asa single-filter based method. Therefore,supplementary monitoring equipmentthat, for example, permits the use ofadditional filter media will be needed toperform the appropriate speciation.Additional details on the monitoringmethodology for performing speciationand related information on filterhandling and/or storage will beaddressed in forthcoming EPAguidance.
EPA is now instructing the States toinitiate chemical speciation inaccordance with forthcoming EPA
guidance at PM2.5 core sites collocatedat approximately 25 PAMS sites and atapproximately 25 other core sites for atotal of approximately 50 sitesnationwide. These sites would beselected as candidates for future NAMSdesignation. Depending on availableresources, chemical speciation could beexpanded to additional sites in thesecond and third years. The requirementto collect speciated data will bereexamined after 5 years of datacollection. Based on this review, theEPA Administrator may exempt somesites from collecting speciated data. Ata minimum, chemical speciation willinclude analysis for metals and otherelemental constituents, selected anionsand cations, and carbon.
EPA recognizes that advantagesrelated to consistency, quality assuranceand scales of economy would resultfrom using centralized laboratories forconducting chemical analyses.However, EPA is concerned about theavailable laboratory capacity for meetingthe needs of a national PM2.5 speciationnetwork. Several options are underconsideration that include developingnew central and regional laboratoriesand exploring the use of existing federaland State facilities. This section, whichwas proposed as section 2.8.2.4, hasbeen renumbered as section 2.8.1.5.
5. Section 3.7.6 - NAMS speciation.Consistent with the previous discussionon speciation, the requirement toestablish a subset of approximately 50NAMS sites for routine speciation isdescribed in a new section 3.7.6 of 40CFR part 58, Appendix D. Theapproximately 50 sites will include theones collocated at PAMS andapproximately 25 other sites to beselected by the EPA Administrator, inconsultation with the RegionalAdministrators and the States. After 5years of data collection, the EPAAdministrator may exempt some sitesfrom collecting speciated data. Thenumber of NAMS sites at whichspeciation will be performed each yearand the number of samples per year willbe determined in accordance with EPAguidance. The subsequent sections ofsection 3.7 have been renumberedaccordingly.
Q. Appendix E - Probe and MonitoringPath Siting Criteria for Ambient AirQuality Monitoring
The proposed revisions to thisAppendix consisted of relatively minorchanges in the siting criteria to expandthe requirements to include PM2.5.Minor changes were made to theexample monitoring location in section8.1 of the proposed revisions to 40 CFRpart 58, Appendix E, to replace ‘‘mid-

38779Federal Register / Vol. 62, No. 138 / Friday, July 18, 1997 / Rules and Regulations
2Memorandum from William F. Hunt, Jr.,Director, Emissions, Monitoring, and AnalysisDivision dated April 22, 1997, to EPA RegionalDirectors entitled Ambient MonitoringReengineering (found in Docket A-96-51).
town Manhattan in New York City’’with ‘‘central business district of aMetropolitan area.’’
R. Appendix F - Annual SummaryStatistics
A new section was proposed to beadded to 40 CFR part 58, Appendix F,to include annual summary statistics forPM2.5. No changes were made to theproposed revisions.
S. Review of Network Design and SitingRequirements for PM
1. PM10. The network design andsiting requirements for the annual and24–hour PM10 NAAQS will continue toemphasize identification of locations atmaximum concentrations. The PM10
network itself, however, will be revisedbecause the new PM2.5 standards willlikely be the controlling standards inmost situations.
The new network for PM10 will bederived from the existing network ofSLAMS, NAMS, and other monitorsgenerically classified as SPMs whichinclude industrial and special studymonitors. Population-oriented PM10
NAMS will generally be maintained aswill other key sampling locations inexisting nonattainment areas, and inareas whose concentrations are near thelevels of the revised PM10 NAAQS.Currently approved reference orequivalent PM10 samplers can continueto be utilized. The revised network willensure that analysis of national trendsin PM10 can be continued, that airsurveillance in areas with establishedPM emission control programs can bemaintained, and that the PM10 NAAQSwill not be jeopardized by additionalgrowth in PM10 emissions. PM10 sitesshould be collocated with new PM2.5
sites at key community-orientedmonitoring stations so that betterdefinition of fine and coarsecontributions to PM10 can bedetermined to provide a betterunderstanding of exposure, emissioncontrols, and atmospheric processes.PM10 sites not needed for trends or withmaximum concentrations less than 60percent of the NAAQS should bediscontinued in a longer-term PM10
network.2 The sampling frequency at allPM10 sites can be changed to aminimum of once in 3 days, which willbe sufficient to make comparisons withthe new PM10 standards at mostlocations. Locations without high 24–hour concentrations of PM10 (e.g., 140©g/m3) may be exempted from this
provision, and their sampling frequencyreduced to a minimum of once in 6days.
2. PM2.5. Consistency with the newPM2.5 NAAQS demands the adoption ofnew perspectives for identifying andestablishing monitoring stations for thePM2.5 ambient air monitoring network.First, sites which are representative ofcommunity-wide air quality shall be theprincipal focus of the new PM2.5
monitoring program; however, alleligible population-oriented PM2.5 sites(including regional background andregional transport sites) will be used forcomparisons to the new NAAQS.Second, eligible SLAMS and othereligible SPMs may be averaged withinproperly defined CMZs to bettercharacterize exposure and air quality forcomparison to the annual PM2.5
NAAQS. Third, population-orientedPM2.5 SLAMS and SPMs representativeof unique microscale or middle scaleimpact sites would not be eligible forcomparison to the annual PM2.5 NAAQSand would only be compared to the 24–hour PM2.5 NAAQS. The 24–hour PM2.5
NAAQS is intended to supplement theannual PM2.5 standard by providingadditional protection at these smallspatial scales. A violation of the annualPM2.5 NAAQS at localized hot spot andother areas of a small spatial scale (i.e.,less than 0.5km in diameter) are notreflective of the data used to establishthe annual PM2.5 NAAQS. It is also notindicative of a greater area-wideproblem which would initiate the needfor an area-wide implementationstrategy. Clearly, the combination ofcareful network design, i.e., one thatidentifies the differences in monitorlocations, and an implementation policythat strives to develop effectivestrategies optimizing regional and localefforts is required to address the intentof the PM2.5 NAAQS.
The new network for PM2.5 consists ofa core network of community-orientedSLAMS monitors (including certainSLAMS collocated at PAMS), otherSLAMS monitors (including backgroundand regional transport sites), a NAMSnetwork for long-term monitoring fortrends purposes, and a supplementarynetwork of SPMs. Daily sampling isrequired at a subset of core SLAMSlocated in MSAs with populationgreater than 500,000 and at core SLAMScollocated at PAMS sites. This willprovide more accurate and completeinformation on population exposure.One in 3-day sampling is required atNAMS and at all other SLAMS, exceptwhen exempted by the RegionalAdministrator, in which case one in 6-day sampling is required. Frequentmeasurements are important to
characterize the day-to-day variability inPM2.5 concentrations, and to understandepisodic behavior of PM2.5. Routinechemical speciation of PM2.5 will berequired for a small subset of the coreSLAMS. This is necessary to establishand track effective emission controlstrategies to assure protection of theNAAQS. These sites shall be part of thefuture PM2.5 NAMS network. Overall,many of the new PM2.5 sites areexpected to be located at existing PM10
sites, that are representative ofmonitoring oriented exposures andwould be collocated with some PAMSsites.
The concepts that address the intentof PM2.5 network for makingcomparisons to the NAAQS areembodied through: (1) Monitoringplanning areas; (2) specially coded sitesincluding community-oriented (core)SLAMS, regional transport and regionalbackground SLAMS, and other SLAMSor SPMs whose data would be used tocompare to the levels of the annual and24–hour PM2.5 NAAQS; (3) SLAMS orSPMs representative of uniquepopulation-oriented microscale ormiddle scale locations that are onlyeligible for comparison to the 24–hourPM2.5 NAAQS, and (4) individualcommunity-oriented sites or CMZs tocorrespond to the spatial averagingapproach defined by the annual PM2.5
NAAQS.Core sites are community-
representative monitoring sites whichare among the most important SLAMSfor identifying areas that are in violationof the PM2.5 NAAQS and to be used forthe associated SIP planning process.Because of their generally larger spatialscales of representativeness, the coresites are the sites most likely to beeligible for spatial averaging and arealso vital in order to establish theboundaries of potential areas ofviolation of the NAAQS that would bereflective of the areas of highestpopulation exposure to fine particles.Core sites are neighborhood scale intheir spatial dimensions. Core SLAMSand specific SPM monitoring locationswhich are eligible for spatial averagingmust be identified in the PM monitoringnetwork description, satisfy criteriaoutlined in Appendix D, and beapproved by EPA. In accordance withinformation to be specified by the AIRSguidance, the State shall assign theappropriate monitoring site code whenreporting these data to EPA.
Regional transport and regionalbackground sites are located outsidemajor metropolitan areas and wouldgenerally be upwind of one or morehigh concentration PM2.5 impact areas.These sites are expected to be in areas

38780 Federal Register / Vol. 62, No. 138 / Friday, July 18, 1997 / Rules and Regulations
of relatively low population density orin unpopulated regions. The collectionof data at these sites is encouragedbecause they are critical for thecomplete understanding of potentialpollutant transport and for thedevelopment and evaluation of emissioncontrol strategies. Although violationsof the NAAQS may be observed at thesesites, the interpretation and use of suchdata observed at regional transport andregional background locations will beaddressed in the PM implementationprogram.
SLAMS monitoring locationsgenerally should reflect the population-oriented emphasis of the new NAAQS’population risk management approachand its data would be used for NAAQScomparisons. SPMs, on the other hand,could represent a variety of monitoringsituations, some of which are notappropriate for comparison to the PM2.5
standards. This includes monitoring atnon-population-oriented hot spots orspecial emissions characterization sitesthat do not meet EPA siting criteria orrequired SLAMS monitoringmethodology, but provide valuableplanning information to support the SIPprocess. In addition, certain SLAMS andSPMs that represent small spatial scales(i.e., sites that are classified asmicroscale or middle scale, inaccordance with Appendix D) wouldnot represent average, community-oriented air quality. In general, suchlocations would be relatively close to asingle PM emission source or acollection of small local sources. Anexample of such a location is a uniquemicroscale site in a non-residential partof an urban area and which may bezoned industrial. Clearly, such a siteshould not be called a SLAMS. Theremight also be SLAMS sites in residentialdistricts which are representative ofsmall maximum concentration impactareas. Due to the greater spatialhomogeneity of fine particles, theexistence of such small scale impactlocations is expected to be much lessthan that for coarse particles. WhenSLAMS or SPMs do represent small,unique population-oriented impactareas, they should be used forcomparison to the 24–hour PM2.5
standard but not for the annualstandard. This is especially true whenthe site is dominated by a singleemission source. In general, these typesof small impact sites may be surroundedby broader areas of more homogeneousconcentrations which are reflective ofcommunity-wide air quality. However,if the State chooses to monitor at aunique population-oriented microscaleor middle scale location and the
monitoring station meets all applicable40 CFR part 58 requirements (includingmonitoring methodology), then the datashall be used only for comparison to the24–hour PM2.5 standard. This isconsistent with the underlying rationaleof the PM2.5 NAAQS. Such monitorswould require a special AIRS codewhen their data are submitted to EPA,as specified by AIRS guidance.
Exceptions to the use of micro andmiddle scale PM2.5 for comparison onlyto the 24–hour standard may exist whenmicro or middle scale PM2.5 sitesrepresent several small areas in themonitoring domain which collectivelyidentify a larger region of localized highconcentration. For example, there maybe two or more disjoint middle scaleimpact areas in a single residentialdistrict that are not predominantlyinfluenced by a single PM2.5 emissionsource. In this case, these small scalesites should be used for comparison tothe annual NAAQS. This is becausetheir annual average ambient airconcentrations can be interpreted as ifthey collectively represent a larger scale.In a sense, this situation can be viewedas a neighborhood of small scale impactareas. These concepts and associatedrequirements are discussed in section2.8.1 of 40 CFR part 58, Appendix D.
The new network design and sitingrequirements encourage the placementof PM2.5 monitors both within andoutside of population centers in orderto: (1) Provide air quality data necessaryto facilitate implementation of the PM2.5
NAAQS, and (2) augment the existingvisibility fine particle monitoringnetwork. The coordination of these twomonitoring objectives will facilitateimplementation of a regional hazeprogram and lead to an integratedmonitoring program for fine particles.
To achieve the appropriate level of airquality surveillance in such areas, EPAbelieves it is important to coordinateand integrate the regional backgroundand regional transport monitoring sitesspecified in this final rule with theexisting IMPROVE monitors that havebeen in place in a number of locationsaround the country since the late 1980sto characterize fine particulate levelsand visibility in mandatory FederalClass I areas (e.g., certain national parksand wilderness areas). The need forcoordination and integration ofvisibility-oriented monitoring sites willincrease when EPA proposes rulesunder section 169A of the Act tosupplement the secondary NAAQS inaddressing regional haze. More detailedguidance on monitoring and assessmentrequirements will be forthcoming tosupport this program. This will includedetails on topics such as monitor
placement, monitoring methodology,duration of sampling and frequency ofsampling. It is anticipated, however,that the existing IMPROVE network,together with sites established underthis rule, would be an integral part ofthe network for determining reasonableprogress under a regional haze program.
In the meantime, EPA recommendsthat States, in conjunction with EPAand Federal land managers, exploreopportunities for expanding andmanaging PM2.5 and visibilitymonitoring networks in the mostefficient and effective ways to meet thecollective goals of these programs. It isEPA’s intent that monitoring conductedfor purposes of the PM2.5 primary andsecondary NAAQS (including regionalbackground and regional transportsites), and for visibility protection beundertaken as one coordinated nationalPM2.5 monitoring program, rather thanas a number of independent networks.
Although the major emphasis of thenew PM2.5 network is compliancemonitoring in support of the NAAQS,the network is also intended to assist inreporting of data to the general public,especially during air pollution episodesand to assist in the SIP planningprocess. To these ends, additionalmonitoring and analyses are suggestedconcerning the location ofnephelometers (or other continuous PMmeasuring devices) at some coremonitoring sites and the collection ofmeteorological data at core SLAMS sites(including background and regionaltransport sites).
T. Resources and Cost Estimates forNew PM Networks
The proposed rules contained adiscussion of the costs associated withthe start-up and implementation of aPM2.5 network and the phase-down ofthe existing PM10 network.
1. Resources and costs. Severalcommenters expressed concern aboutthe costs of the proposed monitoringand QA/QC requirements. Mostcommenters wanted EPA to provide thefunds to meet the increased effort andcosts with new monies to the agencies,noting that implementing the networkin a timely manner will depend heavilyon timely grant assistance from EPA.
Numerous commenters expressedconcern that either not enoughmonitoring money was projected or thatthe program would be an unfundedmandate. Commenters felt that EPAshould budget the funds necessary todevelop an adequate PM2.5 network thatwill support all SIP obligations,including support for speciation. Fundsto implement a new monitoring networkshould include one-time funding to

38781Federal Register / Vol. 62, No. 138 / Friday, July 18, 1997 / Rules and Regulations
procure sampling, calibration,laboratory, and audit equipment, plusannual funding to support field andlaboratory operations.
Several commenters felt that EPAestimates were too low, citingunderestimates for additionaloperational, analytical, and equipmentcosts including daily sampling;speciation; startup for new monitoringlocations; laboratory modifications;operator training; travel; data collectionand reporting; greater QA equipmentand manpower needs; field testing ofreference and equivalent methods; andcontinuous monitors. No commenter feltthat EPA estimates were too high.
A few commenters addressed thesuggested portions of the totalmonitoring program cost for speciation.Several commenters suggested that thecost of requiring speciation could bereduced by limiting the requirement toa subset of the daily monitoring sites, oroffset by eliminating the requirement fordaily sampling, noting that any costsavings would be overwhelmed by thegreater number of PM2.5 sites and thenumber of sites conducting everydaysampling.
EPA understands the complexitiesand resource demands required by Stateand local agencies in establishing andimplementing the new regulations. In itsreview of the comments on the use ofthe proposed Federal reference samplerand associated quality assurancerequirements, the Agency has publishedmore cost-effective requirements withthis final rule for monitoring network
design, methodology, and qualityassurance. Likewise, EPA recognizes thesubsequent need for it to providetechnical and financial assistance. Inthis regard, some control agencies haveused FY-97 grant allocations to procurePM2.5 prototype instruments or upgradetheir filter weighing facilities.Additionally, the Agency has designatedapproximately $10,935,000 in section105 grant monies for distribution toStates in FY-98. EPA intends to assigna high priority to the PM2.5 monitoringprogram through its section 105 grants,and additional grant dollars have beenearmarked by EPA for subsequent yearswhich should ensure successfulimplementation of the PM2.5 monitoringprogram.
2. Revised cost analysis. In responseto comments on cost estimation andnew requirements described earlier,EPA has revised its estimates for theprojected PM10 and PM2.5 networks.EPA believes that it has both improvedits cost estimates and more adequatelyaddressed the needs for the PMmonitoring program. The net costsassociated with the final PM rulespromulgated today include the start-upand implementation costs associatedwith the new PM2.5 network and thecost savings associated with phase-down of the existing PM10 network. Theestimated costs in the preamble havebeen revised to reflect changes to theregulations based on comments receivedon the proposed changes in 40 CFRparts 50, 53, and 58. In particular, PM2.5
network costs have been revised toreflect an increase in the number of sitesto 1,500, newer cost estimates forprototype samplers, equipping manysites with sequential samplers toprovide for greater operationalflexibility, reducing the number andfrequency of audits with federalreference method samplers, andproviding for additional multi-filtersampling to determine PM2.5 constituentspecies. In addition, PM10 network costshave been revised to reflect an increasein the remaining number of PM10 sitesto 900 and a sampling frequency of onceevery 3 days (instead of once every 6days, as proposed) for those sites thatpreviously had been sampling everyday,every 2 days, or every 6 days.
Table 2 shows the PM2.5 networkphase-in data including number of sitesand samplers, costs for capitalequipment, sampling and qualityassurance, filter analyses, and specialstudies. Table 3 provides a breakdownof the costs associated with the filteranalyses. Table 4 provides a breakdownof the phase-down costs for the PM10
network. The costs are shown for acurrent network of approximately 1,650sites in 1997 and the phase-down to afuture projected network of 900 sites.Table 5 shows the cost of PMmonitoring according to samplingfrequency and the type of PM monitor.Details of this information can be foundin the Information Collection Requestfor these requirements. Tables 2 through5 follow.
TABLE 2.—PM2.5 NETWORK COSTS
[Thousands of Actual Dollars]
Year Numberof Sites
Numberof Sam-plers 1
CapitalCost
Sampling& QA
FilterAnalysis 2
SpecialStudies
TotalCost
1997 ...................................................................................... 0 0 $4,500 ................ ................ ................ $4,5001998 ...................................................................................... 724 861 $8,963 $10,216 $472 $1,426 $18,2251999 ...................................................................................... 1,200 1,512 $14,877 $17,938 $2,325 $3,004 $38,1432000 ...................................................................................... 1,500 1,887 $7,155 $26,697 $3,649 ................ $37,502
1 The PM2.5 network includes a mature network of 332 collocated samplers for QA purposes.2 Three different types of filter analyses are anticipated (exceedance analyses, screening analyses, and detailed analyses).
TABLE 3.—COST FOR PM2.5 FILTER ANALYSES
Type of Filter Analysis Estimated Cost per Sample
Exceedance Analysis $200High PM2.5 concentration events are analyzed for particle size and composition utilizing optical or electron
microscopy ...................................................................................................................................................... ..................................................Screening Analysis $150
Multi-filter analyses including (1) x-ray fluorescence (XRF) for elemental composition (crustal material, sul-fur, and heavy metals); (2) ion chromatography for ions such as sulfate, nitrate, and chloride; (3) thermal-optical analysis for elemental/organic/total carbon ......................................................................................... ..................................................
Detailed Analysis $400Analysis for speciated organic composition ....................................................................................................... ..................................................

38782 Federal Register / Vol. 62, No. 138 / Friday, July 18, 1997 / Rules and Regulations
TABLE 4.—PM10 NETWORK COSTS
[Thousands of Actual Dollars]
Year Number ofSites
Number ofSamplers1
Capital Cost toRemove Sites
Operation &Maintenance
CostTotal Cost
1997 ...................................................................................... 1,650 1,810 ........................ $15,861 $15,8611998 ...................................................................................... 1,450 1,610 $137 $13,358 $13,4951999 ...................................................................................... 1,250 1,410 $89 $11,946 $12,0352000 ...................................................................................... 900 1,060 $159 $9,134 $9,293
1 The PM10 network includes 160 collocated samplers for QA purposes.
TABLE 5.—COSTS FOR PARTICULATE MONITORING
[In 1997 Dollars]
PM Monitor and Sampling Frequency One-Time CapitalCost
Annual Operation& Maintenance
Cost
PM10 1-in-6 day sampling schedule .......................................................................................................... $7,700 to $14,800 $8,000 to $8,900PM10 1-in-3 day sampling schedule .......................................................................................................... $7,700 to $19,400 $12,400PM2.5 1-in-6 day sampling schedule ......................................................................................................... $9,300 to $20,700 $11,300 to $12,500PM2.5 1-in-3 day sampling schedule ......................................................................................................... $12,800 to $20,700 $17,000 to $18,600PM2.5 every day sampling ......................................................................................................................... $12,900 to $20,700 $20,700 to $22,200Nephelometer (continuous) ....................................................................................................................... $21,000 ................. $19,700
V. References
(1) Information Collection Request, 40CFR Part 58, Ambient Air QualitySurveillance, OMB #2060-0084, EPAICR No. 0940.14, U.S. EnvironmentalProtection Agency, Office of Air QualityPlanning and Standards, ResearchTriangle Park, NC 27711.
VI. Regulatory AssessmentRequirements
A. Regulatory Impact Analysis
Under Executive Order 12866 (58 FR51735, October 4, 1993), the Agencymust determine whether the regulatoryaction is ‘‘significant’’ and thereforesubject to Office of Management andBudget (OMB) review and to therequirements of the Executive Order.The Order defines ‘‘significantregulatory action’’ as one that is likelyto result in a rule that may:
(1) Have an annual effect on theeconomy of $100 million or more oradversely affect in a material way theeconomy, a sector of the economy,productivity, competition, jobs, theenvironment, public health or safety, orState, local, or governments orcommunities;
(2) Create a serious inconsistency orotherwise interfere with an action takenor planned by another Agency;
(3) Materially alter the budgetaryimpact of entitlements, grants, user fees,or loan programs or the rights andobligations or recipients thereof; or
(4) Raise novel legal or policy issuesarising out of legal mandates, the
President’s priorities, or the principlesset forth in the Executive Order.
It has been determined that this ruleis not a ‘‘significant regulatory action’’under the terms of the Executive Order12866 and is therefore not subject toformal OMB review. However, this ruleis being reviewed by OMB underReporting and RecordkeepingRequirements.
B. Paperwork Reduction Act
The information collectionrequirements contained in this rule havebeen submitted for approval to OMBunder the Paperwork Reduction Act, 44U.S.C. 3501 et seq. An InformationCollection Request document has beenprepared by EPA (ICR No. 0940.14) anda copy may be obtained from SandyFarmer, Information Policy Branch,EPA, 401 M St., SW., Mail Code 2137,Washington, DC 20460; or by calling(202) 260-2740.
1. Need and use of the collection. Themain use for the collection of the datais to implement the air qualitystandards. The various parametersreported as part of this ICR arenecessary to ensure that the informationand data collected by State and localagencies to assess the nation’s airquality are defensible, of known quality,and meet EPA’s data quality goals ofcompleteness, precision, and accuracy.
The need and authority for thisinformation collection is contained insection 110(a)(2)(C) of the Act, thatrequires ambient air quality monitoringfor purposes of the SIP and reporting ofthe data to EPA, and section 319, that
requires the reporting of a daily airpollution index. The legal authority forthis requirement is the Ambient AirQuality Surveillance Regulations, 40CFR 58.20, 58.21, 58.25, 58.26, 58.28,58.30, 58.31, 58.35, and 58.36.
EPA’s Office of Air Quality Planningand Standards uses ambient airmonitoring data for a wide variety ofpurposes, including making NAAQSattainment/nonattainment decisions;determining the effectiveness of airpollution control programs; evaluatingthe effects of air pollution levels onpublic health; tracking the progress ofSIPs; providing dispersion modelingsupport; developing responsible, cost-effective control strategies; reconcilingemission inventories; and developingair quality trends. The collection ofPM2.5 data is necessary to support thePM2.5 NAAQS, and the informationcollected will have practical utility as adata analysis tool.
The State and local agencies withresponsibility for reporting ambient airquality data and information asrequested by these regulations willsubmit these data electronically to theU.S. EPA’s Aerometric InformationRetrieval System, Air QualitySubsystem (AIRS-AQS). Qualityassurance/quality control records andmonitoring network documentation arealso maintained by each State/localagency, in AIRS-AQS electronic formatwhere possible.
2. Reporting and recordkeepingburden. The total annual collection andreporting burden associated with thisrule is estimated to be 785,430 hours. Of

38783Federal Register / Vol. 62, No. 138 / Friday, July 18, 1997 / Rules and Regulations
this total, 778,826 hours are estimated tobe for data reporting, or an average of5,991 hours for the estimated 130respondents. The remainder of 6,604hours for recordkeeping burdenaverages 51 hours for the estimated 130respondents. The capital operation/maintenance costs associated with thisrule are estimated to be $32,463,626.These estimates include time forreviewing instructions, searchingexisting data sources, gathering andmaintaining the data needed, andcompleting and reviewing the collectionof information.
The frequency of data reporting forthe NAMS and the SLAMS air qualitydata as well as the associated precisionand accuracy data are submitted to EPAaccording to the schedule defined in 40CFR part 58. This regulation currentlyrequires that State and local air qualitymanagement agencies report their datawithin 90 days after the end of thequarter during which the data werecollected. The annual SLAMS report issubmitted by July 1 of each year for datacollected from January 1 throughDecember 31 of the previous year inaccordance with 40 CFR part 58.26. Thiscertification also implies that all SPMdata to be used for regulatory purposesby the affected State or local air qualitymanagement agency have beensubmitted by July 1.
3. Burden. Burden means the totaltime, effort, or financial resourcesexpended by persons to generate,
maintain, retain, or disclose or provideinformation to or for a Federal agency.This includes the time needed to reviewinstructions; develop, acquire, install,and utilize technology and systems forthe purpose of collecting, validating,and verifying information, processingand maintaining information, anddisclosing and providing information;adjust the existing ways to comply withany previously applicable instructionsand requirements; train personnel to beable to respond to a collection ofinformation; search data sources;complete and review the collection ofinformation; and transmit or otherwisedisclose the information.
An Agency may not conduct orsponsor, and a person is not required torespond to a collection of informationunless it displays a currently valid OMBcontrol number. The OMB controlnumbers for EPA’s regulations are listedin 40 CFR part 9 and 48 CFR Chapter15.
C. Impact on Small Entities
Pursuant to section 605(b) of theRegulatory Flexibility Act, 5 U.S.C.605(b), the EPA Administrator certifiesthat this rule will not have a significanteconomic impact on a substantialnumber of small entities. Thisrulemaking package does not imposeany additional requirements on smallentities because it applies togovernments whose jurisdictions covermore than 200,000 population. Underthe Regulatory Flexibility Act,
governments are small entities only ifthey have jurisdictions of less than50,000 people. In addition, this ruleimposes no enforceable duties on smallbusinesses.
D. Unfunded Mandates Reform Act of1995
Under sections 202, 203, and 205 ofthe Unfunded Mandates Reform Act of1995 signed into law on March 22, 1995,EPA must undertake various actions inassociation with proposed or final rulesthat include a Federal mandate that mayresult in estimated costs of $100 millionor more to the private sector, or to Stateor local governments in the aggregate.
EPA has determined that this ruledoes not contain a Federal mandate thatmay result in an administrative burdenof $100 million or more for State andlocal governments, in the aggregate, orthe private sector in any one year. TheAgency’s economic analysis indicatesthat the total incremental administrativecost will be approximately $56,611,000in 1997 dollars for the 3 years to phasein the network, or an average of$18,820,000 per year for the 3-yearimplementation period. Table 6 showshow this 3-year average was derived forthe various cost elements of monitoring.While this table represents the 3-yearperiod 1998-2000, the total cost forPM2.5 monitoring include the initialcapital costs anticipated in 1997. Inaddition, this rule imposes noenforceable duties on small businesses.
Table 6.—Cost Elements for PM Monitoring
Administrative Cost Based on 3-year Average (thousands of constant 1997 dollars)*
Cost/ElementCurrent Revised
Net ChangePM10 PM10 PM2.5 Totals
Network design $0 $1,174 $1,174 $1,174Site installation $0 $1,532 $1,532 $1,532Sampling & analysis $3,518 $2,528 $7,915 $10,443 $6,926Maintenance $1,658 $1,192 $2,285 $3,477 $1,818Data management $2,098 $1,508 $3,370 $4,878 $2,780Quality assurance $2,940 $2,113 $3,342 $5,455 $2,515Supervision $3,350 $2,408 $3,068 $5,476 $2,125Summary $13,564 $9,749 $22,684 $32,433 $18,820*Totals are rounded

38784 Federal Register / Vol. 62, No. 138 / Friday, July 18, 1997 / Rules and Regulations
List of Subjects in 40 CFR Parts 53 and58
Environmental protection,Administrative practice and procedure,Air pollution control, Intergovernmentalrelations, Reporting and recordkeepingrequirements.
Dated: July 16, 1997.
Carol M. Browner,Administrator.
For the reasons set forth in thepreamble, title 40, chapter I, parts 53and 58 of the Code of FederalRegulations are amended as follows:
PART 53—[AMENDED]
1. In part 53:a. The authority citation for part 53
continues to read as follows:Authority: Sec. 301(a) of the Clean Air Act
(42 U.S.C. Sec. 1857g(a)) as amended by sec.15(c)(2) of Pub. L. 91-604, 84 Stat. 1713,unless otherwise noted.
b. Subpart A is revised to read asfollows:
Subpart A—General ProvisionsSec.
53.1 Definitions.53.2 General requirements for a referencemethod determination.53.3 General requirements for an equivalentmethod determination.53.4 Applications for reference orequivalent method determinations.53.5 Processing of applications.53.6 Right to witness conduct of tests.53.7 Testing of methods at the initiative ofthe Administrator.53.8 Designation of reference andequivalent methods.53.9 Conditions of designation.53.10 Appeal from rejection of application.53.11 Cancellation of reference orequivalent method designation.53.12 Request for hearing on cancellation.53.13 Hearings.53.14 Modification of a reference orequivalent method.53.15 Trade secrets and confidential orprivileged information.53.16 Supersession of reference methods.
Tables to Subpart A of Part 53Table A-1.—Summary of ApplicableRequirements for Reference EquivalentMethods for Air Monitoring of CriteriaPollutants
Appendix A to Subpart A of Part 53—References
Subpart A—General Provisions
§ 53.1 Definitions.Terms used but not defined in this
part shall have the meaning given themby the Act.
Act means the Clean Air Act (42U.S.C. 1857-1857l), as amended.
Administrator means theAdministrator of the Environmental
Protection Agency or theAdministrator’s authorizedrepresentative.
Agency means the EnvironmentalProtection Agency.
Applicant means a person or entitywho submits an application for areference or equivalent methoddetermination under § 53.4, or a personor entity who assumes the rights andobligations of an applicant under §53.7. Applicant may include amanufacturer, distributor, supplier, orvendor.
Automated method or analyzer meansa method for measuring concentrationsof an ambient air pollutant in whichsample collection (if necessary),analysis, and measurement areperformed automatically by aninstrument.
Candidate method means a methodfor measuring the concentration of anair pollutant in the ambient air forwhich an application for a referencemethod determination or an equivalentmethod determination is submitted inaccordance with § 53.4, or a methodtested at the initiative of theAdministrator in accordance with§ 53.7.
Class I equivalent method means anequivalent method for PM2.5 which isbased on a sampler that is very similarto the sampler specified for referencemethods in Appendix L of this part,with only minor deviations ormodifications, as determined by EPA.
Class II equivalent method means anequivalent method for PM2.5 that utilizesa PM2.5 sampler in which an integratedPM2.5 sample is obtained from theatmosphere by filtration and issubjected to a subsequent filterconditioning process followed by agravimetric mass determination, butwhich is not a Class I equivalent methodbecause of substantial deviations fromthe design specifications of the samplerspecified for reference methods inAppendix L of part 50 of this chapter,as determined by EPA.
Class III equivalent method means anequivalent method for PM2.5 that hasbeen determined by EPA not to be aClass I or Class II equivalent method.This fourth type of PM2.5 methodincludes alternative equivalent methodsamplers and continuous analyzers,based on designs and measurementprinciples different from those specifiedfor reference methods (e.g., a means forestimating aerosol mass concentrationother than by conventional integratedfiltration followed by equilibration andgravimetric analysis. These samplers (ormonitors) are those deemed to besubstantially different from referencemethod samplers and are likely to use
components and methods other thanthose specified for reference methodsamplers.
Collocated describes two or more airsamplers, analyzers, or otherinstruments which sampler the ambientair that are operated silmultaneouslywhile located side by side, separated bya distance that is large enough topreclude the air sampled by any of thedevices from being affected by any ofthe other devices, but small enough sothat all devices obtain identical oruniform ambient air samples that areequally representative of the generalarea in which the group of devices islocated.
Equivalent method means a methodfor measuring the concentration of anair pollutant in the ambient air that hasbeen designated as an equivalentmethod in accordance with this part; itdoes not include a method for which anequivalent method designation has beencanceled in accordance with § 53.11 or§ 53.16.
ISO 9001-registered facility means amanufacturing facility that is either:
(1) An International Organization forStandardization (ISO) 9001-registeredmanufacturing facility, registered to theISO 9001 standard (by the RegistrarAccreditation Board (RAB) of theAmerican Society for Quality Control(ASQC) in the United States), withregistration maintained continuously.
(2) A facility that can bedemonstrated, on the basis ofinformation submitted to the EPA, to beoperated according to an EPA-approvedand periodically audited quality systemwhich meets, to the extent appropriate,the same general requirements as an ISO9001-registered facility for the designand manufacture of designated referenceand equivalent method samplers andmonitors.
ISO-certified auditor means anauditor who is either certified by theRegistrar Accreditation Board (in theUnited States) as being qualified toaudit quality systems using therequirements of recognized standardssuch as ISO 9001, or who, based oninformation submitted to the EPA,meets the same general requirements asprovided for ISO-certified auditors.
Manual method means a method formeasuring concentrations of an ambientair pollutant in which samplecollection, analysis, or measurement, orsome combination therof, is performedmanually. A method for PM10 or PM2.5
which utilizes a sampler that requiresmanual preparation, loading, andweighing of filter samples is considereda manual method even though thesampler may be capable of

38785Federal Register / Vol. 62, No. 138 / Friday, July 18, 1997 / Rules and Regulations
automatically collecting a series ofsequential samples.
PM2.5 sampler means a device,associated with a manual method formeasuring PM2.5, designed to collectPM2.5 from an ambient air sample, butlacking the ability to automaticallyanalyze or measure the collected sampleto determine the mass concentrations ofPM2.5 in the sampled air.
PM10 sampler means a device,associated with a manual method formeasuring PM10, designed to collectPM10 from an ambient air sample, butlacking the ability to automaticallyanalyze or measure the collected sampleto determine the mass concentrations ofPM10 in the sampled air.
Reference method means a method ofsampling and analyzing the ambient airfor an air pollutant that is specified asa reference method in an appendix topart 50 of this chapter, or a method thathas been designated as a referencemethod in accordance with this part; itdoes not include a method for which areference method designation has beencanceled in accordance with § 53.11 or§ 53.16.
Sequential samples for PM samplersmeans two or more PM samples forsequential (but not necessarilycontiguous) time periods that arecollected automatically by the samesampler without the need forintervening operator service.
Test analyzer means an analyzersubjected to testing as part of acandidate method in accordance withsubparts B, C, D, E, or F of this part, asapplicable. Test sampler means a PM10
sampler or a PM2.5 sampler subjected totesting as part of a candidate method inaccordance with subparts C, D, E, or Fof this part.
Ultimate purchaser means the firstperson or entity who purchases areference method or an equivalentmethod for purposes other than resale.
§ 53.2 General requirements for areference method determination.
The following general requirementsfor a reference method determinationare summarized in Table A-1 of thissubpart.
(a) Manual methods. (1) Formeasuring sulfur dioxide (SO2) andlead, Appendices A and G of part 50 ofthis chapter specify unique manualreference methods for those pollutants.Except as provided in § 53.16, othermanual methods for SO2 and lead willnot be considered for reference methoddeterminations under this part.
(2) A reference method for measuringPM10 must be a manual method thatmeets all requirements specified inAppendix J of part 50 of this chapter
and must include a PM10 sampler thathas been shown in accordance with thispart to meet all requirements specifiedin subparts A and D of this part.
(3) A reference method for measuringPM2.5 must be a manual method thatmeets all requirements specified inAppendix L of part 50 of this chapterand must include a PM2.5 sampler thathas been shown in accordance with thispart to meet the applicable requirementsspecified in subparts A and E of thispart. Further, reference methodsamplers must be manufactured in anISO 9001-registered facility, as definedin § 53.1 and as set forth in § 53.51, andthe Product Manufacturing Checklist setforth in subpart E of this part must becompleted by an ISO-certified auditor,as defined in § 53.1, and submitted toEPA annually to retain a PM2.5 referencemethod designation.
(b) Automated methods. Anautomated reference method formeasuring carbon monoxide (CO),ozone (O3), and nitrogen dioxide (NO2)must utilize the measurement principleand calibration procedure specified inthe appropriate appendix to part 50 ofthis chapter and must have been shownin accordance with this part to meet therequirements specified in subpart B ofthis part.
§ 53.3 General requirements for anequivalent method determination.
(a) Manual methods. A manualequivalent method must have beenshown in accordance with this part tosatisfy the applicable requirementsspecified in subpart C of this part. Inaddition, PM10 or PM2.5 samplersassociated with manual equivalentmethods for PM10 or PM2.5 must havebeen shown in accordance with this partto satisfy the following additionalrequirements:
(1) A PM10 sampler associated with amanual method for PM10 must satisfythe requirements of subpart D of thispart.
(2) A PM2.5 Class I equivalent methodsampler must satisfy all requirements ofsubparts C and E of this part, whichinclude appropriate demonstration thateach and every deviation ormodification from the reference methodsampler specifications does notsignificantly alter the performance ofthe sampler.
(3) A PM2.5 Class II equivalent methodsampler must satisfy the applicablerequirements of subparts C, E, and F ofthis part.
(4) Requirements for PM2.5 Class IIIequivalent method samplers are notprovided in this part because of thewide range of non-filter-basedmeasurement technologies that could be
applied and the likelihood that theserequirements will have to be specificallyadapted for each such type oftechnology. Specific requirements willbe developed as needed and mayinclude selected requirements fromsubparts C, E, or F of this part or otherrequirements not contained in this part.
(5) All designated equivalent methodsfor PM2.5 must be manufactured in anISO 9001-registered facility, as definedin § 53.1 and as set forth in § 53.51, andthe Product Manufacturing Checklist setforth in subpart E of this part must becompleted by an ISO-certified auditor,as defined in § 53.1, and submitted toEPA annually to retain a PM2.5
equivalent method designation.(b) Automated methods. (1)
Automated equivalent methods forpollutants other than PM2.5 or PM10
must have been shown in accordancewith this part to satisfy the requirementsspecified in subparts B and C of thispart.
(2) Automated equivalent methods forPM10 must have been shown inaccordance with this part to satisfy therequirements of subparts C and D of thispart.
(3) Requirements for PM2.5 Class IIIautomated equivalent methods for PM2.5
are not provided in this part because ofthe wide range of non-filter-basedmeasurement technologies that could beapplied and the likelihood that theserequirements will have to be specificallyadapted for each such type oftechnology. Specific requirements willbe developed as needed and mayinclude selected requirements fromsubparts C, E, or F of this part or otherrequirements not contained in this part.
(4) All designated equivalent methodsfor PM2.5 must be manufactured in anISO 9001-registered facility, as set forthin subpart E of this part, and theProduct Manufacturing Checklist setforth in subpart E of this part must becompleted by an ISO-certified auditorand submitted to EPA annually to retaina PM2.5 equivalent method designation.
(5) All designated equivalent methodsfor PM2.5 must also meet annualrequirements for network operatingperformance determined as set forth insection 6 of Appendix A of part 58 ofthis chapter.
§ 53.4 Applications for reference orequivalent method determinations.
(a) Applications for reference orequivalent method determinations shallbe submitted in duplicate to: Director,National Exposure Research Laboratory,Department E (MD-77B), U.S.Environmental Protection Agency,Research Triangle Park, North Carolina27711.

38786 Federal Register / Vol. 62, No. 138 / Friday, July 18, 1997 / Rules and Regulations
(b) Each application shall be signedby an authorized representative of theapplicant, shall be marked inaccordance with § 53.15 (if applicable),and shall contain the following:
(1) A clear identification of thecandidate method, which willdistinguish it from all other methodssuch that the method may be referred tounambiguously. This identificationmust consist of a unique series ofdescriptors such as title, identificationnumber, analyte, measurementprinciple, manufacturer, brand, model,etc., as necessary to distinguish themethod from all other methods ormethod variations, both within andoutside the applicant’s organization.
(2) A detailed description of thecandidate method, including but notlimited to the following: Themeasurement principle, manufacturer,name, model number and other forms ofidentification, a list of the significantcomponents, schematic diagrams,design drawings, and a detaileddescription of the apparatus andmeasurement procedures. Drawings anddescriptions pertaining to candidatemethods or samplers for PM2.5 mustmeet all applicable requirements inReference 1 of Appendix A of thissubpart, using appropriate graphical,nomenclature, and mathematicalconventions such as those specified inReferences 3 and 4 of Appendix A ofthis subpart.
(3) A copy of a comprehensiveoperation or instruction manualproviding a complete and detaileddescription of the operational,maintenance, and calibrationprocedures prescribed for field use ofthe candidate method and allinstruments utilized as part of thatmethod (under § 53.9(a)).
(i) As a minimum this manual shallinclude:
(A) Description of the method andassociated instruments.
(B) Explanation of all indicators,information displays, and controls.
(C) Complete setup and installationinstructions, including any additionalmaterials or supplies required.
(D) Details of all initial or startupchecks or acceptance tests and anyauxiliary equipment required.
(E) Complete operational instructions.(F) Calibration procedures and
required calibration equipment andstandards.
(G) Instructions for verification ofcorrect or proper operation.
(H) Trouble-shooting guidance andsuggested corrective actions forabnormal operation.
(I) Required or recommended routine,periodic, and preventative maintenanceand maintenance schedules.
(J) Any calculations required to derivefinal concentration measurements.
(K) Appropriate references toAppendix L of part 50 of this chapter;Reference 6 of Appendix A of thissubpart; and any other pertinentguidelines.
(ii) The manual shall also includeadequate warning of potential safetyhazards that may result from normal useand/or malfunction of the method anda description of necessary safetyprecautions. (See § 53.9(b).) However,the previous requirement shall not beinterpreted to constitute or imply anywarranty of safety of the method byEPA. For samplers and automatedmethods, the manual shall include aclear description of all procedurespertaining to installation, operation,preventive maintenance, andtroubleshooting and shall also includeparts identification diagrams. Themanual may be used to satisfy therequirements of paragraphs (b)(1) and(b)(2) of this section to the extent thatit includes information necessary tomeet those requirements.
(4) A statement that the candidatemethod has been tested in accordancewith the procedures described insubparts B, C, D, E, and/or F of this part,as applicable.
(5) Descriptions of test facilities andtest configurations, test data, records,calculations, and test results asspecified in subparts B, C, D, E, and/orF of this part, as applicable. Data mustbe sufficiently detailed to meetappropriate principles described inparagraphs 4 through 6 of Reference 2of Appendix A of this subpart, Part b,sections 3.3.1 (paragraph 1) and 3.5.1(paragraphs 2 and 3) and in paragraphs1 through 3 of Reference 5 (section 4.8,Records) of Appendix A of this subpart.Salient requirements from thesereferences include the following:
(i) The applicant shall maintain andinclude records of all relevantmeasuring equipment, including themake, type, and serial number or otheridentification, and most recentcalibration with identification of themeasurement standard or standardsused and their National Institute ofStandards and Technology (NIST)traceability. These records shalldemonstrate the measurement capabilityof each item of measuring equipmentused for the application and include adescription and justification (if needed)of the measurement setup orconfiguration in which it was used forthe tests. The calibration results shall berecorded and identified in sufficient
detail so that the traceability of allmeasurements can be determined andany measurement could be reproducedunder conditions close to the originalconditions, if necessary, to resolve anyanomalies.
(ii) Test data shall be collectedaccording to the standards of goodpractice and by qualified personnel.Test anomalies or irregularities shall bedocumented and explained or justified.The impact and significance of thedeviation on test results andconclusions shall be determined. Datacollected shall correspond directly tothe specified test requirement and belabeled and identified clearly so thatresults can be verified and evaluatedagainst the test requirement.Calculations or data manipulations mustbe explained in detail so that they canbe verified.
(6) A statement that the method,analyzer, or sampler tested inaccordance with this part isrepresentative of the candidate methoddescribed in the application.
(c) For candidate automated methodsand candidate manual methods for PM10
and PM2.5, the application shall alsocontain the following:
(1) A detailed description of thequality system that will be utilized, ifthe candidate method is designated as areference or equivalent method, toensure that all analyzers or samplersoffered for sale under that designationwill have essentially the sameperformance characteristics as theanalyzer(s) or samplers tested inaccordance with this part. In addition,the quality system requirements forcandidate methods for PM2.5 must bedescribed in sufficient detail, based onthe elements described in section 4 ofReference 1 (Quality SystemRequirements) of Appendix A of thissubpart. Further clarification isprovided in the following sections ofReference 2 of Appendix A of thissubpart: Part A (Management Systems),sections 2.2 (Quality System andDescription), 2.3 (PersonnelQualification and Training), 2.4(Procurement of Items and Services), 2.5(Documents and Records), and 2.7(Planning); Part B (Collection andEvaluation of Environmental Data),sections 3.1 (Planning and Scoping), 3.2(Design of Data Collection Operations),and 3.5 (Assessment and Verification ofData Usability); and Part C (Operation ofEnvironmental Technology), sections4.1 (Planning), 4.2 (Design of Systems),and 4.4 (Operation of Systems).
(2) A description of the durabilitycharacteristics of such analyzers orsamplers (see § 53.9(c)). For methods forPM2.5, the warranty program must

38787Federal Register / Vol. 62, No. 138 / Friday, July 18, 1997 / Rules and Regulations
ensure that the required specifications(see Table A-1 of this subpart) will bemet throughout the warranty period andthat the applicant accepts responsibilityand liability for ensuring thisconformance or for resolving anynonconformities, including allnecessary components of the system,regardless of the original manufacturer.The warranty program must bedescribed in sufficient detail to meetappropriate provisions of the ANSI/ASQC and ISO 9001 standards(References 1 and 2 in Appendix A ofthis subpart) for controllingconformance and resolvingnonconformance, particularly sections4.12, 4.13, and 4.14 of Reference 1 inAppendix A of this subpart.
(i) Section 4.12 in Appendix A of thissubpart requires the manufacturer toestablish and maintain a system ofprocedures for identifying andmaintaining the identification ofinspection and test status throughout allphases of manufacturing to ensure thatonly instruments that have passed therequired inspections and tests arereleased for sale.
(ii) Section 4.13 in Appendix A of thissubpart requires documentedprocedures for control ofnonconforming product, includingreview and acceptable alternatives fordisposition; section 4.14 in Appendix Aof this subpart requires documentedprocedures for implementing corrective(4.14.2) and preventive (4.14.3) action toeliminate the causes of actual orpotential nonconformities. In particular,section 4.14.3 requires that potentialcauses of nonconformities be eliminatedby using information such as servicereports and customer complaints toeliminate potential causes ofnonconformities.
(d) For candidate reference orequivalent methods for PM2.5, theapplicant shall provide to EPA for testpurposes one sampler or analyzer that isrepresentative of the sampler oranalyzer associated with the candidatemethod. The sampler or analyzer shallbe shipped FOB destination toDepartment E, (MD-77B), U.S. EPA, 79T.W. Alexander Drive, ResearchTriangle Park, NC 27711, scheduled toarrive concurrent with or within 30 daysof the arrival of the other applicationmaterials. This analyzer or sampler maybe subjected to various tests that EPAdetermines to be necessary orappropriate under § 53.5(f), and suchtests may include special tests notdescribed in this part. If the instrumentsubmitted under this paragraphmalfunctions, becomes inoperative, orfails to perform as represented in theapplication before the necessary EPA
testing is completed, the applicant shallbe afforded an opportunity to repair orreplace the device at no cost to EPA.Upon completion of EPA testing, theanalyzer or sampler submitted underthis paragraph shall be repacked by EPAfor return shipment to the applicant,using the same packing materials usedfor shipping the instrument to EPAunless alternative packing is providedby the applicant. Arrangements for, andthe cost of, return shipment shall be theresponsibility of the applicant. EPAdoes not warrant or assume any liabilityfor the condition of the analyzer orsampler upon return to the applicant.
§ 53.5 Processing of applications.After receiving an application for a
reference or equivalent methoddetermination, the Administrator willpublish notice of the application in theFederal Register and, within 120calendar days after receipt of theapplication, take one or more of thefollowing actions:
(a) Send notice to the applicant, inaccordance with § 53.8, that thecandidate method has been determinedto be a reference or equivalent method.
(b) Send notice to the applicant thatthe application has been rejected,including a statement of reasons forrejection.
(c) Send notice to the applicant thatadditional information must besubmitted before a determination can bemade and specify the additionalinformation that is needed (in suchcases, the 120–day period shallcommence upon receipt of theadditional information).
(d) Send notice to the applicant thatadditional test data must be submittedand specify what tests are necessary andhow the tests shall be interpreted (insuch cases, the 120–day period shallcommence upon receipt of theadditional test data).
(e) Send notice to the applicant thatthe application has been found to besubstantially deficient or incompleteand cannot be processed untiladditional information is submitted tocomplete the application and specifythe general areas of substantialdeficiency.
(f) Send notice to the applicant thatadditional tests will be conducted bythe Administrator, specifying the natureof and reasons for the additional testsand the estimated time required (in suchcases, the 120–day period shallcommence 1 calendar day after theadditional tests have been completed).
§ 53.6 Right to witness conduct of tests.(a) Submission of an application for a
reference or equivalent method
determination shall constitute consentfor the Administrator or theAdministrator’s authorizedrepresentative, upon presentation ofappropriate credentials, to witness orobserve any tests required by this partin connection with the application or inconnection with any modification orintended modification of the method bythe applicant.
(b) The applicant shall have the rightto witness or observe any test conductedby the Administrator in connection withthe application or in connection withany modification or intendedmodification of the method by theapplicant.
(c) Any tests by either party that areto be witnessed or observed by the otherparty shall be conducted at a time andplace mutually agreeable to both parties.
§ 53.7 Testing of methods at the initiativeof the Administrator.
(a) In the absence of an application fora reference or equivalent methoddetermination, the Administrator mayconduct the tests required by this partfor such a determination, may compilesuch other information as may benecessary in the judgment of theAdministrator to make such adetermination, and on the basis of thetests and information may determinethat a method satisfies applicablerequirements of this part.
(b) In the absence of an applicationrequesting the Administrator to considerrevising an appendix to part 50 of thischapter in accordance with § 53.16, theAdministrator may conduct such testsand compile such information as may benecessary in the Administrator’sjudgment to make a determinationunder § 53.16(d) and on the basis of thetests and information make such adetermination.
(c) If a method tested in accordancewith this section is designated as areference or equivalent method inaccordance with § 53.8 or is specified ordesignated as a reference method inaccordance with § 53.16, any person orentity who offers the method for sale asa reference or equivalent methodthereafter shall assume the rights andobligations of an applicant for purposesof this part, with the exception of thosepertaining to submission and processingof applications.
§ 53.8 Designation of reference andequivalent methods.
(a) A candidate method determinedby the Administrator to satisfy theapplicable requirements of this partshall be designated as a referencemethod or equivalent method (asapplicable), and a notice of the

38788 Federal Register / Vol. 62, No. 138 / Friday, July 18, 1997 / Rules and Regulations
designation shall be submitted forpublication in the Federal Register notlater than 15 days after thedetermination is made.
(b) A notice indicating that themethod has been determined to be areference method or an equivalentmethod shall be sent to the applicant.This notice shall constitute proof of thedetermination until a notice ofdesignation is published in accordancewith paragraph (a) of this section.
(c) The Administrator will maintain acurrent list of methods designated asreference or equivalent methods inaccordance with this part and will senda copy of the list to any person or groupupon request. A copy of the list will beavailable for inspection or copying atEPA Regional Offices.
§ 53.9 Conditions of designation.Designation of a candidate method as
a reference method or equivalentmethod shall be conditioned to theapplicant’s compliance with thefollowing requirements. Failure tocomply with any of the requirementsshall constitute a ground forcancellation of the designation inaccordance with § 53.11.
(a) Any method offered for sale as areference or equivalent method shall beaccompanied by a copy of the manualreferred to in § 53.4(b)(3) whendelivered to any ultimate purchaser.
(b) Any method offered for sale as areference or equivalent method shallgenerate no unreasonable hazard tooperators or to the environment duringnormal use or when malfunctioning.
(c) Any analyzer, PM10 sampler, orPM2.5 sampler offered for sale as part ofa reference or equivalent method shallfunction within the limits of theperformance specifications referred to in§ 53.20(a), § 53.30(a), § 53.50, or § 53.60,as applicable, for at least 1 year afterdelivery and acceptance whenmaintained and operated in accordancewith the manual referred to in§ 53.4(b)(3).
(d) Any analyzer, PM10 sampler, orPM2.5 sampler offered for sale as areference or equivalent method shallbear a prominent, permanently affixedlabel or sticker indicating that theanalyzer or sampler has been designatedby EPA as a reference method or as anequivalent method (as applicable) inaccordance with this part anddisplaying any designated methodidentification number that may beassigned by EPA.
(e) If an analyzer is offered for sale asa reference or equivalent method andhas one or more selectable ranges, thelabel or sticker required by paragraph(d) of this section shall be placed in
close proximity to the range selector andshall indicate clearly which range orranges have been designated as parts ofthe reference or equivalent method.
(f) An applicant who offers analyzers,PM10 samplers, or PM2.5 samplers forsale as reference or equivalent methodsshall maintain an accurate and currentlist of the names and mailing addressesof all ultimate purchasers of suchanalyzers or samplers. For a period of 7years after publication of the referenceor equivalent method designationapplicable to such an analyzer orsampler, the applicant shall notify allultimate purchasers of the analyzer orPM2.5 or PM10 sampler within 30 daysif the designation has been canceled inaccordance with § 53.11 or § 53.16 or ifadjustment of the analyzer or sampler isnecessary under § 53.11(b).
(g) If an applicant modifies ananalyzer, PM10 sampler, or PM2.5
sampler that has been designated as areference or equivalent method, theapplicant shall not sell the modifiedanalyzer or sampler as a reference orequivalent method nor attach a label orsticker to the modified analyzer orsampler under paragraph (d) or (e) ofthis section until the applicant hasreceived notice under § 53.14(c) that theexisting designation or a newdesignation will apply to the modifiedanalyzer, PM10 sampler, or PM2.5
sampler or has applied for and receivednotice under § 53.8(b) of a new referenceor equivalent method determination forthe modified analyzer or sampler.
(h) An applicant who has offeredPM2.5 samplers or analyzers for sale aspart of a reference or equivalent methodmay continue to do so only so long asthe facility in which the samplers oranalyzers are manufactured continues tobe an ISO 9001-registered facility, as setforth in subpart E of this part. In theevent that the ISO 9001 registration forthe facility is withdrawn, suspended, orotherwise becomes inapplicable, eitherpermanently or for some specified timeinterval, such that the facility is nolonger an ISO 9001-registered facility,the applicant shall notify EPA within 30days of the date the facility becomesother than an ISO 9001-registeredfacility, and upon such notification,EPA shall issue a preliminary findingand notification of possible cancellationof the reference or equivalent methoddesignation under § 53.11.
(i) An applicant who has offered PM2.5
samplers or analyzers for sale as part ofa reference or equivalent method maycontinue to do so only so long asupdates of the Product ManufacturingChecklist set forth in subpart E of thispart are submitted annually. In theevent that an annual Checklist update is
not received by EPA within 12 monthsof the date of the last such submittedChecklist or Checklist update, EPA shallnotify the applicant within 30 days thatthe Checklist update has not beenreceived and shall, within 30 days fromthe issuance of such notification, issuea preliminary finding and notification ofpossible cancellation of the reference orequivalent method designation under§ 53.11.
§ 53.10 Appeal from rejection ofapplication.
Any applicant whose application fora reference or equivalent methoddetermination has been rejected mayappeal the Administrator’s decision bytaking one or more of the followingactions:
(a) The applicant may submit new oradditional information in support of theapplication.
(b) The applicant may request that theAdministrator reconsider the data andinformation already submitted.
(c) The applicant may request that anytest conducted by the Administrator thatwas a material factor in the decision toreject the application be repeated.
§ 53.11 Cancellation of reference orequivalent method designation.
(a) Preliminary finding. If theAdministrator makes a preliminaryfinding on the basis of any availableinformation that a representative sampleof a method designated as a reference orequivalent method and offered for saleas such does not fully satisfy therequirements of this part or that there isany violation of the requirements setforth in § 53.9, the Administrator mayinitiate proceedings to cancel thedesignation in accordance with thefollowing procedures.
(b) Notification and opportunity todemonstrate or achieve compliance. (1)After making a preliminary finding inaccordance with paragraph (a) of thissection, the Administrator will sendnotice of the preliminary finding to theapplicant, together with a statement ofthe facts and reasons on which thepreliminary finding is based, and willpublish notice of the preliminaryfinding in the Federal Register.
(2) The applicant will be afforded anopportunity to demonstrate or toachieve compliance with therequirements of this part within 60 daysafter publication of notice in accordancewith paragraph (b)(1) of this section orwithin such further period as theAdministrator may allow, bydemonstrating to the satisfaction of theAdministrator that the method inquestion satisfies the requirements ofthis part, by commencing a program to

38789Federal Register / Vol. 62, No. 138 / Friday, July 18, 1997 / Rules and Regulations
make any adjustments that are necessaryto bring the method into compliance, orby taking such action as may benecessary to cure any violation of therequirements of § 53.9. If adjustmentsare necessary to bring the method intocompliance, all such adjustments shallbe made within a reasonable time asdetermined by the Administrator. If theapplicant demonstrates or achievescompliance in accordance with thisparagraph (b)(2), the Administrator willpublish notice of such demonstration orachievement in the Federal Register.
(c) Request for hearing. Within 60days after publication of a notice inaccordance with paragraph (b)(1) of thissection, the applicant or any interestedperson may request a hearing asprovided in § 53.12.
(d) Notice of cancellation. If, at theend of the period referred to inparagraph (b)(2) of this section, theAdministrator determines that thereference or equivalent methoddesignation should be canceled, a noticeof cancellation will be published in theFederal Register and the designationwill be deleted from the list maintainedunder § 53.8(c). If a hearing has beenrequested and granted in accordancewith § 53.12, action under thisparagraph (d) will be taken only aftercompletion of proceedings (includingany administrative review) conducted inaccordance with § 53.13 and only if thedecision of the Administrator reached insuch proceedings is that the designationin question should be canceled.
§ 53.12 Request for hearing oncancellation.
Within 60 days after publication of anotice in accordance with § 53.11(b)(1),the applicant or any interested personmay request a hearing on theAdministrator’s action. If, afterreviewing the request and supportingdata, the Administrator finds that therequest raises a substantial issue of fact,a hearing will be granted in accordancewith § 53.13 with respect to such issue.The request shall be in writing, signedby an authorized representative of theapplicant or interested person, and shallinclude a statement specifying:
(a) Any objections to theAdministrator’s action.
(b) Data or other information insupport of such objections.
§ 53.13 Hearings.(a)(1) After granting a request for a
hearing under § 53.12, theAdministrator will designate a presidingofficer for the hearing.
(2) If a time and place for the hearinghave not been fixed by theAdministrator, the hearing will be held
as soon as practicable at a time andplace fixed by the presiding officer,except that the hearing shall in no casebe held sooner than 30 days afterpublication of a notice of hearing in theFederal Register.
(3) For purposes of the hearing, theparties shall include EPA, the applicantor interested person(s) who requestedthe hearing, and any person permittedto intervene in accordance withparagraph (c) of this section.
(4) The Deputy General Counsel or theDeputy General Counsel’s representativewill represent EPA in any hearing underthis section.
(5) Each party other than EPA may berepresented by counsel or by any otherduly authorized representative.
(b)(1) Upon appointment, thepresiding officer will establish a hearingfile. The file shall contain copies of thenotices issued by the Administratorpursuant to § 53.11(b)(1), together withany accompanying material, the requestfor a hearing and supporting datasubmitted therewith, the notice ofhearing published in accordance withparagraph (a)(2) of this section, andcorrespondence and other material datarelevant to the hearing.
(2) The hearing file shall be availablefor inspection by the parties or theirrepresentatives at the office of thepresiding officer, except to the extentthat it contains information identified inaccordance with § 53.15.
(c) The presiding officer may permitany interested person to intervene in thehearing upon such a showing of interestas the presiding officer may require;provided that permission to intervenemay be denied in the interest ofexpediting the hearing where it appearsthat the interests of the person seekingto intervene will be adequatelyrepresented by another party (or byother parties), including EPA.
(d)(1) The presiding officer, upon therequest of any party or at the officer’sdiscretion, may arrange for a prehearingconference at a time and place specifiedby the officer to consider the following:
(i) Simplification of the issues.(ii) Stipulations, admissions of fact,
and the introduction of documents.(iii) Limitation of the number of
expert witnesses.(iv) Possibility of agreement on
disposing of all or any of the issues indispute.
(v) Such other matters as may aid inthe disposition of the hearing, includingsuch additional tests as may be agreedupon by the parties.
(2) The results of the conference shallbe reduced to writing by the presidingofficer and made part of the record.
(e)(1) Hearings shall be conducted bythe presiding officer in an informal butorderly and expeditious manner. Theparties may offer oral or writtenevidence, subject to exclusion by thepresiding officer of irrelevant,immaterial, or repetitious evidence.
(2) Witnesses shall be placed underoath.
(3) Any witness may be examined orcross-examined by the presiding officer,the parties, or their representatives. Thepresiding officer may, at his/herdiscretion, limit cross-examination torelevant and material issues.
(4) Hearings shall be reportedverbatim. Copies of transcripts ofproceedings may be purchased from thereporter.
(5) All written statements, charts,tabulations, and data offered inevidence at the hearing shall, upon ashowing satisfactory to the presidingofficer of their authenticity, relevancy,and materiality, be received in evidenceand shall constitute part of the record.
(6) Oral argument shall be permitted.The presiding officer may limit oralpresentations to relevant and materialissues and designate the amount of timeallowed for oral argument.
(f)(1) The presiding officer shall makean initial decision which shall includewritten findings and conclusions andthe reasons therefore on all the materialissues of fact, law, or discretionpresented on the record. The findings,conclusions, and written decision shallbe provided to the parties and made partof the record. The initial decision shallbecome the decision of theAdministrator without furtherproceedings unless there is an appeal to,or review on motion of, theAdministrator within 30 calendar daysafter the initial decision is filed.
(2) On appeal from or review of theinitial decision, the Administrator willhave all the powers consistent withmaking the initial decision, includingthe discretion to require or allow briefs,oral argument, the taking of additionalevidence or the remanding to thepresiding officer for additionalproceedings. The decision by theAdministrator will include writtenfindings and conclusions and thereasons or basis therefore on all thematerial issues of fact, law, or discretionpresented on the appeal or consideredin the review.
§ 53.14 Modification of a reference orequivalent method.
(a) An applicant who offers a methodfor sale as a reference or equivalentmethod shall report to the EPAAdministrator prior to implementationany intended modification of the

38790 Federal Register / Vol. 62, No. 138 / Friday, July 18, 1997 / Rules and Regulations
method, including but not limited tomodifications of design or constructionor of operational and maintenanceprocedures specified in the operationmanual (see § 53.9(g)). The report shallbe signed by an authorizedrepresentative of the applicant, markedin accordance with § 53.15 (ifapplicable), and addressed as specifiedin § 53.4(a).
(b) A report submitted underparagraph (a) of this section shallinclude:
(1) A description, in such detail asmay be appropriate, of the intendedmodification.
(2) A brief statement of the applicant’sbelief that the modification will, willnot, or may affect the performancecharacteristics of the method.
(3) A brief statement of the probableeffect if the applicant believes themodification will or may affect theperformance characteristics of themethod.
(4) Such further information,including test data, as may be necessaryto explain and support any statementrequired by paragraphs (b)(2) and (b)(3)of this section.
(c) Within 30 calendar days afterreceiving a report under paragraph (a) ofthis section, the Administrator will takeone or more of the following actions:
(1) Notify the applicant that thedesignation will continue to apply tothe method if the modification isimplemented.
(2) Send notice to the applicant thata new designation will apply to themethod (as modified) if the modificationis implemented, submit notice of thedetermination for publication in theFederal Register, and revise orsupplement the list referred to in§ 53.8(c) to reflect the determination.
(3) Send notice to the applicant thatthe designation will not apply to themethod (as modified) if the modificationis implemented and submit notice of thedetermination for publication in theFederal Register.
(4) Send notice to the applicant thatadditional information must besubmitted before a determination can bemade and specify the additionalinformation that is needed (in suchcases, the 30–day period shallcommence upon receipt of theadditional information).
(5) Send notice to the applicant thatadditional tests are necessary andspecify what tests are necessary andhow they shall be interpreted (in suchcases, the 30–day period shallcommence upon receipt of theadditional test data).
(6) Send notice to the applicant thatadditional tests will be conducted by
the Administrator and specify thereasons for and the nature of theadditional tests (in such cases, the 30–day period shall commence 1 calendarday after the additional tests arecompleted).
(d) An applicant who has received anotice under paragraph (c)(3) of thissection may appeal the Administrator’saction as follows:
(1) The applicant may submit new oradditional information pertinent to theintended modification.
(2) The applicant may request theAdministrator to reconsider data andinformation already submitted.
(3) The applicant may request that theAdministrator repeat any test conductedthat was a material factor in theAdministrator’s determination. Arepresentative of the applicant may bepresent during the performance of anysuch retest.
§ 53.15 Trade secrets and confidential orprivileged information.
Any information submitted under thispart that is claimed to be a trade secretor confidential or privileged informationshall be marked or otherwise clearlyidentified as such in the submittal.Information so identified will be treatedin accordance with part 2 of this chapter(concerning public information).
§ 53.16 Supersession of referencemethods.
(a) This section prescribes proceduresand criteria applicable to requests thatthe Administrator specify a newreference method, or a newmeasurement principle and calibrationprocedure on which reference methodsshall be based, by revision of theappropriate appendix to part 50 of thischapter. Such action will ordinarily betaken only if the Administratordetermines that a candidate method ora variation thereof is substantiallysuperior to the existing referencemethod(s).
(b) In exercising discretion under thissection, the Administrator will consider:
(1) The benefits, in terms of therequirements and purposes of the Act,that would result from specifying a newreference method or a new measurementprinciple and calibration procedure.
(2) The potential economicconsequences of such action for Stateand local control agencies.
(3) Any disruption of State and localair quality monitoring programs thatmight result from such action.
(c) An applicant who wishes theAdministrator to consider revising anappendix to part 50 of this chapter onthe ground that the applicant’scandidate method is substantially
superior to the existing referencemethod(s) shall submit an applicationfor a reference or equivalent methoddetermination in accordance with § 53.4and shall indicate therein that suchconsideration is desired. Theapplication shall include, in addition tothe information required by § 53.4, dataand any other information supportingthe applicant’s claim that the candidatemethod is substantially superior to theexisting reference method(s).
(d) After receiving an applicationunder paragraph (c) of this section, theAdministrator will publish notice of itsreceipt in the Federal Register and,within 120 calendar days after receipt ofthe application, take one of thefollowing actions:
(1) Determine that it is appropriate topropose a revision of the appendix topart 50 of this chapter in question andsend notice of the determination to theapplicant.
(2) Determine that it is inappropriateto propose a revision of the appendix topart 50 of this chapter in question,determine whether the candidatemethod is a reference or equivalentmethod, and send notice of thedeterminations, including a statement ofreasons for the determination not topropose a revision, to the applicant.
(3) Send notice to the applicant thatadditional information must besubmitted before a determination can bemade and specify the additionalinformation that is needed (in suchcases, the 120–day period shallcommence upon receipt of theadditional information).
(4) Send notice to the applicant thatadditional tests are necessary,specifying what tests are necessary andhow the test shall be interpreted (insuch cases, the 120–day period shallcommence upon receipt of theadditional test data).
(5) Send notice to the applicant thatadditional tests will be conducted bythe Administrator, specifying the natureof and reasons for the additional testsand the estimated time required (in suchcases, the 120–day period shallcommence 1 calendar day after theadditional tests have been completed).
(e)(1)(i) After making a determinationunder paragraph (d)(1) of this section,the Administrator will publish a noticeof proposed rulemaking in the FederalRegister. The notice of proposedrulemaking will indicate that theAdministrator proposes:
(A) To revise the appendix to part 50of this chapter in question.
(B) Where the appendix specifies ameasurement principle and calibrationprocedure, to cancel reference methoddesignations based on the appendix.

38791Federal Register / Vol. 62, No. 138 / Friday, July 18, 1997 / Rules and Regulations
(C) To cancel equivalent methoddesignations based on the existingreference method(s).
(ii) The notice of proposedrulemaking will include the terms orsubstance of the proposed revision, willindicate what period(s) of time theAdministrator proposes to allow forreplacement of existing methods undersection 2.3 of Appendix C to part 58 ofthis chapter, and will solicit publiccomments on the proposal withparticular reference to theconsiderations set forth in paragraphs(a) and (b) of this section.
(2)(i) If, after consideration ofcomments received, the Administratordetermines that the appendix to part 50in question should be revised, theAdministrator will, by publication inthe Federal Register:
(A) Promulgate the proposed revision,with such modifications as may beappropriate in view of commentsreceived.
(B) Where the appendix to part 50(prior to revision) specifies a
measurement principle and calibrationprocedure, cancel reference methoddesignations based on the appendix.
(C) Cancel equivalent methoddesignations based on the existingreference method(s).
(D) Specify the period(s) that will beallowed for replacement of existingmethods under section 2.3 of AppendixC to part 58 of this chapter, with suchmodifications from the proposedperiod(s) as may be appropriate in viewof comments received.
(3) Canceled designations will bedeleted from the list maintained under§ 53.8(c). The requirements andprocedures for cancellation set forth in§ 53.11 shall be inapplicable tocancellation of reference or equivalentmethod designations under this section.
(4) If the appendix to part 50 of thischapter in question is revised to specifya new measurement principle andcalibration procedure on which theapplicant’s candidate method is based,the Administrator will take appropriateaction under § 53.5 to determine
whether the candidate method is areference method.
(5) Upon taking action underparagraph (e)(2) of this section, theAdministrator will send notice of theaction to all applicants for whosemethods reference and equivalentmethod designations are canceled bysuch action.
(f) An applicant who has receivednotice of a determination underparagraph (d)(2) of this section mayappeal the determination by taking oneor more of the following actions:
(1) The applicant may submit new oradditional information in support of theapplication.
(2) The applicant may request that theAdministrator reconsider the data andinformation already submitted.
(3) The applicant may request thatany test conducted by the Administratorthat was a material factor in making thedetermination be repeated.
Tables to Subpart A of Part 53
TABLE A–1.—SUMMARY OF APPLICABLE REQUIREMENTS FOR REFERENCE AND EQUIVALENT METHODS FOR AIRMONITORING OF CRITERIA POLLUTANTS
Pollutant Ref. or Equivalent Manual or Automated
Applica-ble part50 Ap-pendix
Applicable Subparts of part 53
A B C D E F
SO2 ....................... Reference .................................. Manual ....................................... A ........ ........ ........ ........ ........ ........Manual ....................................... ✔ ........ ✔ ........ ........ ........
Equivalent .................................. Automated .................................. ✔ ✔ ✔ ........ ........ ........CO ......................... Reference .................................. Automated .................................. C ✔ ✔ ........ ........ ........ ........
Manual ....................................... ✔ ........ ✔ ........ ........ ........Equivalent .................................. Automated .................................. ✔ ✔ ✔ ........ ........ ........
O3 .......................... Reference .................................. Automated .................................. D ✔ ✔ ........ ........ ........ ........Manual ....................................... ✔ ........ ✔ ........ ........ ........
Equivalent .................................. Automated .................................. ✔ ✔ ✔ ........ ........ ........NO2 ....................... Reference .................................. Automated .................................. F ✔ ✔ ........ ........ ........ ........
Manual ....................................... ✔ ........ ✔ ........ ........ ........Equivalent .................................. Automated .................................. ✔ ✔ ✔ ........ ........ ........
Pb .......................... Reference .................................. Manual ....................................... G ........ ........ ........ ........ ........ ........Equivalent .................................. Manual ....................................... ✔ ........ ✔ ........ ........ ........
PM10 ...................... Reference .................................. Manual ....................................... J ✔ ........ ........ ✔ ........ ........Manual ....................................... ✔ ........ ✔ ✔ ........ ........
Equivalent .................................. Automated .................................. ✔ ........ ✔ ✔ ........ ........PM2.5 ..................... Reference .................................. Manual ....................................... L ✔ ........ ........ ........ ✔ ........
Equivalent Class I ...................... Manual ....................................... L ✔ ........ ✔ ........ ✔ ........Equivalent Class II ..................... Manual ....................................... L ✔ ........ ✔ ........ ✔ ✔Equivalent Class III .................... Manual or Automated ................ ✔ ........ ✔ 1 ........ ✔ 1 ✔ 1
1 Note: Because of the wide variety of potential devices possible, the specific requirements applicable to a Class III candidate equivalent meth-od for PM2.5 are not specified explicitly in this part but, instead, shall be determined on a case-by-case basis for each such candidiate method.
Appendix A to Subpart A of Part 53—References
(1) American National Standard QualitySystems-Model for Quality Assurance inDesign, Development, Production,Installation, and Servicing, ANSI/ISO/ASQCQ9001-1994. Available from AmericanSociety for Quality Control, 611 EastWisconsin Avenue, Milwaukee, WI 53202.
(2) American National Standard—Specifications and Guidelines for Quality
Systems for Environmental Data Collectionand Environmental Technology Programs,ANSI/ASQC E41994. Available fromAmerican Society for Quality Control, 611East Wisconsin Avenue, Milwaukee, WI53202.
(3) Dimensioning and Tolerancing, ASMEY14.5M-1994. Available from the AmericanSociety of Mechanical Engineers, 345 East47th Street, New York, NY 10017.
(4) Mathematical Definition ofDimensioning and Tolerancing Principles,
ASME Y14.5.1M-1994. Available from theAmerican Society of Mechanical Engineers,345 East 47th Street, New York, NY 10017.
(5) ISO 10012, Quality AssuranceRequirements for Measuring Equipment-Part1: Meteorological confirmation system formeasuring equipment):1992(E). Availablefrom American Society for Quality Control,611 East Wisconsin Avenue, Milwaukee, WI53202.
(6) Copies of section 2.12 of the QualityAssurance Handbook for Air Pollution

38792 Federal Register / Vol. 62, No. 138 / Friday, July 18, 1997 / Rules and Regulations
Measurement Systems, Volume II, AmbientAir Specific Methods, EPA/600/R-94/038b,are available from Department E (MD-77B),U.S. EPA, Research Triangle Park, NC 27711.
c. Subpart C is revised to read asfollows:
Subpart C—Procedures for DeterminingComparability Between Candidate Methodsand Reference MethodsSec.
53.30 General provisions.53.31 Test conditions.53.32 Test procedures for methods for SO2,CO, O3, and NO2.53.33 Test procedure for methods for lead.53.34 Test procedure for methods for PM10
and PM2.5.
Tables to Subpart C of Part 53Table C-1.—Test Concentration Ranges,Number of Measurements Required, andMaximum Discrepancy SpecificationTable C-2.—Sequence of Test MeasurementsTable C-3.—Test Specifications for LeadMethodsTable C-4.—Test Specifications for PM10 andPM2.5 Methods
Figures to Subpart C of Part 53Figure C-1.—Suggested Format for ReportingTest Results
Appendix A to Subpart C of Part 53—References
Subpart C—Procedures forDetermining Comparability BetweenCandidate Methods and ReferenceMethods
§ 53.30 General provisions.(a) Determination of comparability.
The test procedures prescribed in thissubpart shall be used to determine if acandidate method is comparable to areference method when both methodsmeasure pollutant concentrations inambient air.
(1) Comparability is shown for SO2,CO, O3, and NO2 methods when thedifferences between:
(i) Measurements made by a candidatemanual method or by a test analyzerrepresentative of a candidate automatedmethod.
(ii) Measurements madesimultaneously by a reference method,are less than or equal to the valuesspecified in the last column of Table C-1 of this subpart.
(2) Comparability is shown for leadmethods when the differences between:
(i) Measurements made by a candidatemethod.
(ii) Measurements made by thereference method on simultaneouslycollected lead samples (or the samesample, if applicable), are less than orequal to the value specified in Table C-3 of this subpart.
(3) Comparability is shown for PM10
and PM2.5 methods when therelationship between:
(i) Measurements made by a candidatemethod.
(ii) Measurements made by areference method on simultaneouslycollected samples (or the same sample,if applicable) at each of two test sites,is such that the linear regressionparameters (slope, intercept, andcorrelation coefficient) describing therelationship meet the values specified inTable C-4 of this subpart.
(b) Selection of test sites—(1) Allmethods. Each test site shall be in apredominately urban area which can beshown to have at least moderateconcentrations of various pollutants.The site shall be clearly identified andshall be justified as an appropriate testsite with suitable supporting evidencesuch as maps, population density data,vehicular traffic data, emissioninventories, pollutant measurementsfrom previous years, concurrentpollutant measurements, andmeteorological data. If approval of aproposed test site is desired prior toconducting the tests, a written requestfor approval of the test site or sites mustbe submitted prior to conducting thetests and must include the supportingand justification information required.The Administrator may exercisediscretion in selecting a different site (orsites) for any additional tests theAdministrator decides to conduct.
(2) Methods for SO2, CO, O3, and NO2.All test measurements are to be made atthe same test site. If necessary, theconcentration of pollutant in thesampled ambient air may be augmentedwith artificially generated pollutant tofacilitate measurements in the specifiedranges described under paragraph (d)(2)of this section.
(3) Methods for Pb. Testmeasurements may be made at anynumber of test sites. Augmentation ofpollutant concentrations is notpermitted, hence an appropriate test siteor sites must be selected to provide leadconcentrations in the specified range.
(4) Methods for PM10. Testmeasurements must be made, or derivedfrom particulate samples collected, atnot less than two test sites, each ofwhich must be located in a geographicalarea characterized by ambientparticulate matter that is significantlydifferent in nature and compositionfrom that at the other test site(s).Augmentation of pollutantconcentrations is not permitted, henceappropriate test sites must be selected toprovide PM10 concentrations in thespecified range. The tests at the twosites may be conducted in differentcalendar seasons, if appropriate, toprovide PM10 concentrations in thespecified ranges.
(5) Methods for PM2.5. Augmentationof pollutant concentrations is notpermitted, hence appropriate test sitesmust be selected to provide PM2.5
concentrations and PM2.5/PM10 ratios (ifapplicable) in the specified ranges.
(i) Where only one test site isrequired, as specified in Table C-4 ofthis subpart, the site need only meet thePM2.5 ambient concentration levelsrequired by § 53.34(c)(3).
(ii) Where two sites are required, asspecified in Table C-4 of this subpart,each site must be selected to provide theambient concentration levels requiredby § 53.34(c)(3). In addition, one sitemust be selected such that all acceptabletest sample sets, as defined in§ 53.34(c)(3), have a PM2.5/PM10 ratio ofmore than 0.75; the other site must beselected such that all acceptable testsample sets, as defined in § 53.34(c)(3),have a PM2.5/PM10 ratio of less than0.40. At least two reference methodPM10 samplers shall be collocated withthe candidate and reference methodPM2.5 samplers and operatedsimultaneously with the other samplersat each test site to measure concurrentambient concentrations of PM10 todetermine the PM2.5/PM10 ratio for eachsample set. The PM2.5/PM10 ratio foreach sample set shall be the average ofthe PM2.5 concentration, as determinedin § 53.34(c)(1), divided by the averagePM10 concentration, as measured by thePM10 samplers. The tests at the two sitesmay be conducted in different calendarseasons, if appropriate, to provide PM2.5
concentrations and PM2.5/PM10 ratios inthe specified ranges.
(c) Test atmosphere. Ambient airsampled at an appropriate test site orsites shall be used for these tests.Simultaneous concentrationmeasurements shall be made in each ofthe concentration ranges specified inTables C-1, C-3, or C-4 of this subpart,as appropriate.
(d) Sample collection—(1) Allmethods. All test concentrationmeasurements or samples shall be takenin such a way that both the candidatemethod and the reference methodreceive air samples that are homogenousor as nearly identical as practical.
(2) Methods for SO2, CO, O3, and NO2.Ambient air shall be sampled from acommon intake and distributionmanifold designed to deliverhomogenous air samples to bothmethods. Precautions shall be taken inthe design and construction of thismanifold to minimize the removal ofparticulates and trace gases, and toensure that identical samples reach thetwo methods. If necessary, theconcentration of pollutant in thesampled ambient air may be augmented

38793Federal Register / Vol. 62, No. 138 / Friday, July 18, 1997 / Rules and Regulations
with artificially-generated pollutant.However, at all times the air samplemeasured by the candidate andreference methods under test shallconsist of not less than 80 percentambient air by volume. Schematicdrawings, physical illustrations,descriptions, and complete details of themanifold system and the augmentationsystem (if used) shall be submitted.
(3) Methods for Pb, PM10 and PM2.5.The ambient air intake points of all thecandidate and reference methodcollocated samplers for lead, PM10 orPM2.5 shall be positioned at the sameheight above the ground level, andbetween 2 and 4 meters apart. Thesamplers shall be oriented in a mannerthat will minimize spatial and winddirectional effects on sample collection.
(4) PM10 methods employing the samesampling procedure as the referencemethod but a different analyticalmethod. Candidate methods for PM10
which employ a sampler and samplecollection procedure that are identicalto the sampler and sample collectionprocedure specified in the referencemethod, but use a different analyticalprocedure, may be tested by analyzingcommon samples. The common samplesshall be collected according to thesample collection procedure specifiedby the reference method and shall beanalyzed in accordance with theanalytical procedures of both thecandidate method and the referencemethod.
(e) Submission of test data and otherinformation. All recorder charts,calibration data, records, test results,procedural descriptions and details, andother documentation obtained from (orpertinent to) these tests shall beidentified, dated, signed by the analystperforming the test, and submitted. Forcandidate methods for PM2.5, allsubmitted information must meet therequirements of the ANSI/ASQC E4Standard, sections 3.3.1, paragraphs 1and 2 (Reference 1 of Appendix A ofthis subpart).
§ 53.31 Test conditions.(a) All methods. All test
measurements made or test samplescollected by means of a samplemanifold as specified in § 53.30(d)(2)shall be at a room temperature between20 °C and 30 °C, and at a line voltagebetween 105 and 125 volts. All methodsshall be calibrated as specified inparagraph (c) of this section prior toinitiation of the tests.
(b) Samplers and automated methods.(1) Setup and start-up of the testanalyzer, test sampler(s), and referencemethod (if applicable) shall be in strictaccordance with the applicable
operation manual(s). If the test analyzerdoes not have an integral strip chart ordigital data recorder, connect theanalyzer output to a suitable strip chartor digital data recorder. This recordershall have a chart width of at least 25centimeters, a response time of 1 secondor less, a deadband of not more than0.25 percent of full scale, and capabilityof either reading measurements at least5 percent below zero or offsetting thezero by at least 5 percent. Digital datashall be recorded at appropriate timeintervals such that trend plots similar toa strip chart recording may beconstructed with a similar or suitablelevel of detail.
(2) Other data acquisition componentsmay be used along with the chartrecorder during the conduct of thesetests. Use of the chart recorder isintended only to facilitate visualevaluation of data submitted.
(3) Allow adequate warmup orstabilization time as indicated in theapplicable operation manual(s) beforebeginning the tests.
(c) Calibration. The reference methodshall be calibrated according to theappropriate appendix to part 50 of thischapter (if it is a manual method) oraccording to the applicable operationmanual(s) (if it is an automatedmethod). A candidate manual method(or portion thereof) shall be calibrated,according to the applicable operationmanual(s), if such calibration is a partof the method.
(d) Range. (1) Except as provided inparagraph (d)(2) of this section, eachmethod shall be operated in the rangespecified for the reference method in theappropriate appendix to part 50 of thischapter (for manual reference methods),or specified in Table B-1 of subpart B ofthis part (for automated referencemethods).
(2) For a candidate method havingmore than one selectable range, onerange must be that specified in Table B-1 of subpart B of this part and a testanalyzer representative of the methodmust pass the tests required by thissubpart while operated on that range.The tests may be repeated for a broaderrange (i.e., one extending to higherconcentrations) than the one specifiedin Table B-1 of subpart B of this part,provided that the range does not extendto concentrations more than two timesthe upper range limit specified in TableB-1 of subpart B of this part and that thetest analyzer has passed the testsrequired by subpart B of this part (ifapplicable) for the broader range. If thetests required by this subpart areconducted or passed only for the rangespecified in Table B-1 of subpart B ofthis part, any equivalent method
determination with respect to themethod will be limited to that range. Ifthe tests are passed for both thespecified range and a broader range (orranges), any such determination willinclude the broader range(s) as well asthe specified range. Appropriate testdata shall be submitted for each rangesought to be included in such adetermination.
(e) Operation of automated methods.(1) Once the test analyzer has been setup and calibrated and tests started,manual adjustment or normal periodicmaintenance as specified in the manualreferred to in § 53.4(b)(3) is permittedonly every 3 days. Automaticadjustments which the test analyzerperforms by itself are permitted at anytime. The submitted records shall showclearly when manual adjustments weremade and describe the operationsperformed.
(2) All test measurements shall bemade with the same test analyzer; useof multiple test analyzers is notpermitted. The test analyzer shall beoperated continuously during the entireseries of test measurements.
(3) If a test analyzer shouldmalfunction during any of these tests,the entire set of measurements shall berepeated, and a detailed explanation ofthe malfunction, remedial action taken,and whether recalibration was necessary(along with all pertinent records andcharts) shall be submitted.
§ 53.32 Test procedures for methods forSO2, CO, O3, and NO2.
(a) Conduct the first set ofsimultaneous measurements with thecandidate and reference methods:
(1) Table C-1 of this subpart specifiesthe type (1- or 24–hour) and number ofmeasurements to be made in each of thethree test concentration ranges.
(2) The pollutant concentration mustfall within the specified range asmeasured by the reference method.
(3) The measurements shall be madein the sequence specified in Table C-2of this subpart, except for the 1-hourSO2 measurements, which are all in thehigh range.
(b) For each pair of measurements,determine the difference (discrepancy)between the candidate methodmeasurement and reference methodmeasurement. A discrepancy whichexceeds the discrepancy specified inTable C-1 of this subpart constitutes afailure. Figure C-1 of this subpartcontains a suggested format forreporting the test results.
(c) The results of the first set ofmeasurements shall be interpreted asfollows:

38794 Federal Register / Vol. 62, No. 138 / Friday, July 18, 1997 / Rules and Regulations
(1) Zero failures. The candidatemethod passes the test forcomparability.
(2) Three or more failures. Thecandidate method fails the test forcomparability.
(3) One or two failures. Conduct asecond set of simultaneousmeasurements as specified in Table C-1 of this subpart. The results of thecombined total of first-set and second-set measurements shall be interpreted asfollows:
(i) One or two failures. The candidatemethod passes the test forcomparability.
(ii) Three or more failures. Thecandidate method fails the test forcomparability.
(4) For SO2, the 1-hour and 24–hourmeasurements shall be interpretedseparately, and the candidate methodmust pass the tests for both 1- and 24–hour measurements to pass the test forcomparability.
(d) A 1-hour measurement consists ofthe integral of the instantaneousconcentration over a 60-minutecontinuous period divided by the timeperiod. Integration of the instantaneousconcentration may be performed by anyappropriate means such as chemical,electronic, mechanical, visual judgment,or by calculating the mean of not lessthan 12 equally spaced instantaneousreadings. Appropriate allowances orcorrections shall be made in caseswhere significant errors could occur dueto characteristic lag time or rise/fall timedifferences between the candidate andreference methods. Details of the meansof integration and any corrections shallbe submitted.
(e) A 24–hour measurement consistsof the integral of the instantaneousconcentration over a 24–hourcontinuous period divided by the timeperiod. This integration may beperformed by any appropriate meanssuch as chemical, electronic,mechanical, or by calculating the meanof 24 sequential 1-hour measurements.
(f) For ozone and carbon monoxide,no more than six 1-hour measurementsshall be made per day. For sulfurdioxide, no more than four 1-hourmeasurements or one 24–hourmeasurement shall be made per day.One-hour measurements may be madeconcurrently with 24–hourmeasurements if appropriate.
(g) For applicable methods, control orcalibration checks may be performedonce per day without adjusting the testanalyzer or method. These checks maybe used as a basis for a linearinterpolation-type correction to beapplied to the measurements to correctfor drift. If such a correction is used, it
shall be applied to all measurementsmade with the method, and thecorrection procedure shall become apart of the method.
§ 53.33 Test procedure for methods forlead.
(a) Sample collection. Collectsimultaneous 24–hour samples (filters)of lead at the test site or sites with boththe reference and candidate methodsuntil at least 10 filter pairs have beenobtained. If the conditions of§ 53.30(d)(4) apply, collect at least 10common samples (filters) in accordancewith § 53.30(d)(4) and divide each toform the filter pairs.
(b) Audit samples. Three auditsamples must be obtained from theaddress given in § 53.4(a). The auditsamples are 3/4 x 8-inch glass fiberstrips containing known amounts oflead at the following nominal levels:100 ©g/strip; 300 ©g/strip; 750 ©g/strip.The true amount of lead, in total ©g/strip, will be provided with each auditsample.
(c) Filter analysis. (1) For both thereference method samples and the auditsamples, analyze each filter extract threetimes in accordance with the referencemethod analytical procedure. Theanalysis of replicates should not beperformed sequentially, i.e., a singlesample should not be analyzed threetimes in sequence. Calculate theindicated lead concentrations for thereference method samples in ©g/m3 foreach analysis of each filter. Calculatethe indicated total lead amount for theaudit samples in ©g/strip for eachanalysis of each strip. Label these testresults as R1A, R1B, R1C, R2A, R2B, ..., Q1A,Q1B, Q1C, ..., where R denotes resultsfrom the reference method samples; Qdenotes results from the audit samples;1, 2, 3 indicate the filter number, and A,B, C indicate the first, second, and thirdanalysis of each filter, respectively.
(2) For the candidate method samples,analyze each sample filter or filterextract three times and calculate, inaccordance with the candidate method,the indicated lead concentrates in ©g/m3
for each analysis of each filter. Labelthese test results as C1A, C1B, C2C, ...,where C denotes results from thecandidate method. For candidatemethods which provide a directmeasurement of lead concentrationswithout a separable procedure,C1A=C1B=C1C, C2A=C2B=C2C, etc.
(d) Average lead concentration. Forthe reference method, calculate theaverage lead concentration for eachfilter by averaging the concentrationscalculated from the three analyses:
Equation 1
RR R R
i aveiA iB iC= + +
3where:i is the filter number.
(e) Acceptable filter pairs. Disregardall filter pairs for which the leadconcentration as determined in theprevious paragraph (d) of this section bythe average of the three referencemethod determinations, falls outside therange of 0.5 to 4.0 ©g/m3. All remainingfilter pairs must be subjected to both ofthe following tests for precision andcomparability. At least five filter pairsmust be within the 0.5 to 4.0 ©g/m3
range for the tests to be valid.(f) Test for precision. (1) Calculate the
precision (P) of the analysis (in percent)for each filter and for each method, asthe maximum minus the minimumdivided by the average of the threeconcentration values, as follows:
Equation 2
PR R
Rx Ri
i i
i ave
= −max min 100%
or
Equation 3
PC C
Cx Ci
i i
i ave
= −max min 100%
where:i indicates the filter number.
(2) If any reference method precisionvalue (PRi) exceeds 15 percent, theprecision of the reference methodanalytical procedure is out of control.Corrective action must be taken todetermine the source(s) of imprecisionand the reference methoddeterminations must be repeatedaccording to paragraph (c) of thissection, or the entire test procedure(starting with paragraph (a) of thissection) must be repeated.
(3) If any candidate method precisionvalue (PCi) exceeds 15 percent, thecandidate method fails the precisiontest.
(4) The candidate method passes thistest if all precision values (i.e., all PRi’sand all PCi’s) are less than 15 percent.
(g) Test for accuracy. (1)(i) For theaudit samples calculate the average leadconcentration for each strip byaveraging the concentrations calculatedfrom the three analyses:
Equation 4
QQ Q Q
i aveiA iB iC= + +
3where:i is audit sample number.

38795Federal Register / Vol. 62, No. 138 / Friday, July 18, 1997 / Rules and Regulations
(ii) Calculate the percent difference(Dq) between the indicated leadconcentration for each audit sample andthe true lead concentration (Tq) asfollows:
Equation 5
DQ T
Tx qi
i ave qi
qi
=−
100%
(2) If any difference value (Dqi)exceeds ±5 percent, the accuracy of thereference method analytical procedureis out of control. Corrective action mustbe taken to determine the source of theerror(s) (e.g., calibration standarddiscrepancies, extraction problems, etc.)and the reference method and auditsample determinations must be repeatedaccording to paragraph (c) of thissection, or the entire test procedure(starting with paragraph (a) of thissection) must be repeated.
(h) Test for comparability. (1) Foreach filter pair, calculate all ninepossible percent differences (D) betweenthe reference and candidate methods,using all nine possible combinations ofthe three determinations (A, B, and C)for each method, as:
Equation 6
DC R
Rx 100%in
ij ik
ik
=−
where:i is the filter number, and n numbers from1 to 9 for the nine possible differencecombinations for the three determinations foreach method (j= A, B, C, candidate; k= A, B,C, reference).
(2) If none of the percent differences(D) exceeds ± 20 percent, the candidatemethod passes the test forcomparability.
(3) If one or more of the percentdifferences (D) exceeds ± 20 percent, thecandidate method fails the test forcomparability.
(i) The candidate method must passboth the precision test (paragraph (f) ofthis section) and the comparability test(paragraph (h) of this section) to qualifyfor designation as an equivalent method.
§ 53.34 Test procedure for methods forPM10 and PM2.5.
(a) Collocated measurements. Set upthree reference method samplerscollocated with three candidate methodsamplers or analyzers at each of thenumber of test sites specified in TableC-4 of this subpart. At each site, obtainas many sets of simultaneous PM10 orPM2.5 measurements as necessary (seeparagraph (c)(3) of this section), each setconsisting of three reference methodand three candidate methodmeasurements, all obtained
simultaneously. For PM2.5 candidateClass II equivalent methods, at least twocollocated PM10 reference methodsamplers are also required to obtainPM2.5/PM10 ratios for each sample set.Candidate PM10 method measurementsshall be 24–hour integratedmeasurements; PM2.5 measurementsmay be either 24- or 48–hour integratedmeasurements. All collocatedmeasurements in a sample set mustcover the same 24- or 48–hour timeperiod. For samplers, retrieve thesamples promptly after samplecollection and analyze each sampleaccording to the reference method orcandidate method, as appropriate, anddetermine the PM10 or PM2.5
concentration in ©g/m3. If theconditions of § 53.30(d)(4) apply, collectsample sets only with the threereference method samplers. Guidancefor quality assurance procedures forPM2.5 methods is found in section 2.12of the Quality Assurance Handbook(Reference 6 of Appendix A to subpartA of this part).
(b) Sequential samplers. Forsequential samplers, the sampler shallbe configured for the maximum numberof sequential samples and shall be setfor automatic collection of all samplessequentially such that the test samplesare collected equally, to the extentpossible, among all available sequentialchannels or utilizing the full availablesequential capability.
(c) Test for comparability andprecision. (1) For each of themeasurement sets, calculate the averagePM10 or PM2.5 concentration obtainedwith the reference method samplers:
Equation 7
R
R
j
iji= =∑
1
3
3where:R denotes results from the reference method;i is the sampler number; andj is the set.
(2)(i)(A) For each of the measurementsets, calculate the precision of thereference method PM10 or PM2.5
measurements as:
Equation 8
P
R R
j
ij ijii=
−
==∑∑ 2
1
3 2
1
3 13
2(B) If the corresponding j is below:80 ©g/m3 for PM10 methods.40 ©g/m3 for 24–hour PM2.5 at single test
sites for Class I candidate methods.40 ©g/m3 for 24–hour PM2.5 at sites having
PM2.5/PM10 ratios >0.75.
30 ©g/m3 for 48–hour PM2.5 at single testsites for Class I candidate methods.
30 ©g/m3 for 48–hour PM2.5 at sites havingPM2.5/PM10 ratios >0.75.
30 ©g/m3 for 24–hour PM2.5 at sites havingPM2.5/PM10 ratios <0.40.
20 ©g/m3 for 48–hour PM2.5 at sites havingPM2.5/PM10 ratios >0.75.
(ii) Otherwise, calculate the precisionof the reference method PM10 or PM2.5
measurements as:
Equation 9
RPR
R R
x jj
ij ijii=
−
==∑∑
1
13
2100%
2
1
3 2
1
3
(3) If j falls outside the acceptableconcentration range specified in TableC-4 of this subpart for any set, or if Pjor RPj, as applicable, exceeds the valuespecified in Table C-4 of this subpart forany set, that set of measurements shallbe discarded. For each site, Table C-4 ofthis subpart specifies the minimumnumber of sample sets required forvarious conditions, and § 53.30(b)(5)specifies the PM2.5/PM10 ratiorequirements applicable to Class IIcandidate equivalent methods.Additional measurement sets shall becollected and analyzed, as necessary, toprovide a minimum of 10 acceptablemeasurement sets for each test site. Ifmore than 10 measurement sets arecollected that meet the above criteria, allsuch measurement sets shall be used todemonstrate comparability.
(4) For each of the acceptablemeasurement sets, calculate the averagePM10 or PM2.5 concentration obtainedwith the candidate method samplers:
Equation 10
C
C
j
iji= =∑
1
3
3where:C denotes results from the candidate method;i is the sampler number; andj is the set.
(5) For each site, plot the averagePM10 or PM2.5 measurements obtainedwith the candidate method (Cj) againstthe corresponding average PM10 or PM2.5
measurements obtained with thereference method (Rj). For each site,calculate and record the linearregression slope and intercept, and thecorrelation coefficient.
(6) If the linear regression parameterscalculated under paragraph (c)(5) of thissection meet the values specified inTable C-4 of this subpart for all testsites, the candidate method passes thetest for comparability.
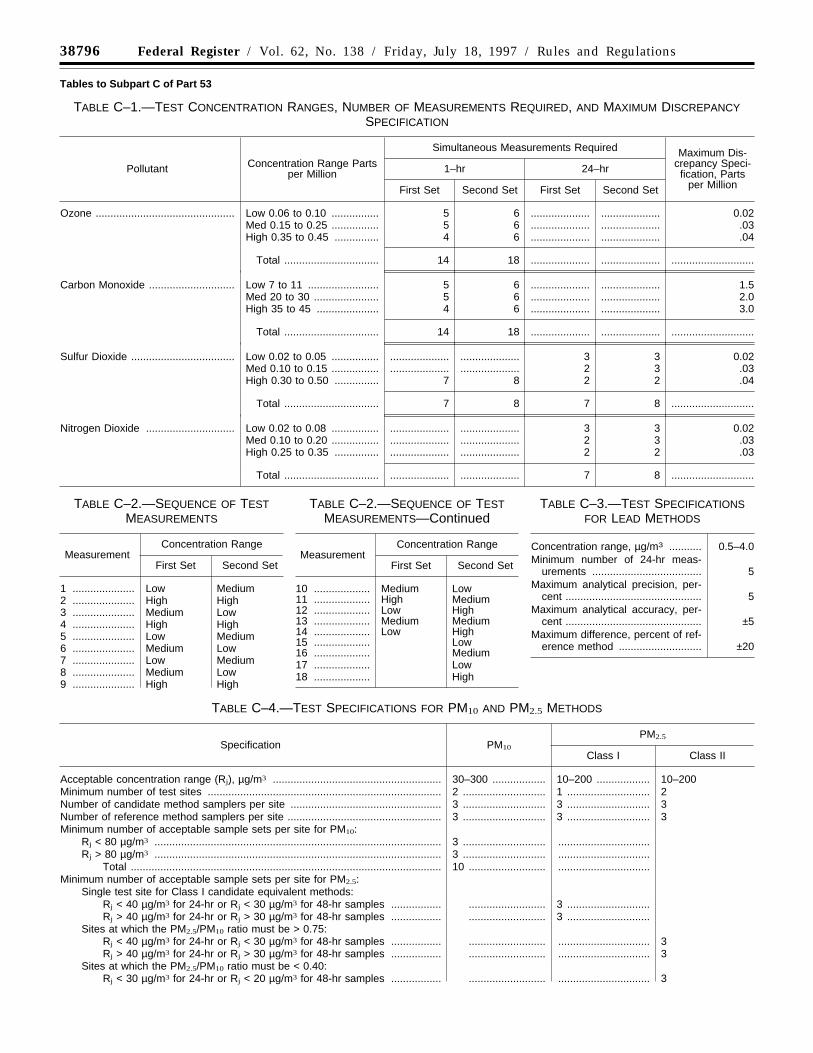
38796 Federal Register / Vol. 62, No. 138 / Friday, July 18, 1997 / Rules and Regulations
Tables to Subpart C of Part 53
TABLE C–1.—TEST CONCENTRATION RANGES, NUMBER OF MEASUREMENTS REQUIRED, AND MAXIMUM DISCREPANCYSPECIFICATION
Pollutant Concentration Range Partsper Million
Simultaneous Measurements Required Maximum Dis-crepancy Speci-fication, Parts
per Million
1–hr 24–hr
First Set Second Set First Set Second Set
Ozone ............................................... Low 0.06 to 0.10 ................ 5 6 .................... .................... 0.02Med 0.15 to 0.25 ................ 5 6 .................... .................... .03High 0.35 to 0.45 ............... 4 6 .................... .................... .04
Total ................................ 14 18 .................... .................... ............................
Carbon Monoxide ............................. Low 7 to 11 ........................ 5 6 .................... .................... 1.5Med 20 to 30 ...................... 5 6 .................... .................... 2.0High 35 to 45 ..................... 4 6 .................... .................... 3.0
Total ................................ 14 18 .................... .................... ............................
Sulfur Dioxide ................................... Low 0.02 to 0.05 ................ .................... .................... 3 3 0.02Med 0.10 to 0.15 ................ .................... .................... 2 3 .03High 0.30 to 0.50 ............... 7 8 2 2 .04
Total ................................ 7 8 7 8 ............................
Nitrogen Dioxide .............................. Low 0.02 to 0.08 ................ .................... .................... 3 3 0.02Med 0.10 to 0.20 ................ .................... .................... 2 3 .03High 0.25 to 0.35 ............... .................... .................... 2 2 .03
Total ................................ .................... .................... 7 8 ............................
TABLE C–2.—SEQUENCE OF TESTMEASUREMENTS
MeasurementConcentration Range
First Set Second Set
1 ..................... Low Medium2 ..................... High High3 ..................... Medium Low4 ..................... High High5 ..................... Low Medium6 ..................... Medium Low7 ..................... Low Medium8 ..................... Medium Low9 ..................... High High
TABLE C–2.—SEQUENCE OF TESTMEASUREMENTS—Continued
MeasurementConcentration Range
First Set Second Set
10 ................... Medium Low11 ................... High Medium12 ................... Low High13 ................... Medium Medium14 ................... Low High15 ................... Low16 ................... Medium17 ................... Low18 ................... High
TABLE C–3.—TEST SPECIFICATIONSFOR LEAD METHODS
Concentration range, µg/m3 ........... 0.5–4.0Minimum number of 24-hr meas-
urements ..................................... 5Maximum analytical precision, per-
cent .............................................. 5Maximum analytical accuracy, per-
cent .............................................. ±5Maximum difference, percent of ref-
erence method ............................ ±20
TABLE C–4.—TEST SPECIFICATIONS FOR PM10 AND PM2.5 METHODS
Specification PM10
PM2.5
Class I Class II
Acceptable concentration range (Rj), µg/m3 ......................................................... 30–300 .................. 10–200 .................. 10–200Minimum number of test sites ............................................................................... 2 ............................ 1 ............................ 2Number of candidate method samplers per site ................................................... 3 ............................ 3 ............................ 3Number of reference method samplers per site .................................................... 3 ............................ 3 ............................ 3Minimum number of acceptable sample sets per site for PM10:
Rj < 80 µg/m3 ................................................................................................. 3 ............................ ...............................Rj > 80 µg/m3 ................................................................................................. 3 ............................ ...............................
Total ......................................................................................................... 10 .......................... ...............................Minimum number of acceptable sample sets per site for PM2.5:
Single test site for Class I candidate equivalent methods:Rj < 40 µg/m3 for 24-hr or Rj < 30 µg/m3 for 48-hr samples ................. .......................... 3 ............................Rj > 40 µg/m3 for 24-hr or Rj > 30 µg/m3 for 48-hr samples ................. .......................... 3 ............................
Sites at which the PM2.5/PM10 ratio must be > 0.75:Rj < 40 µg/m3 for 24-hr or Rj < 30 µg/m3 for 48-hr samples ................. .......................... ............................... 3Rj > 40 µg/m3 for 24-hr or Rj > 30 µg/m3 for 48-hr samples ................. .......................... ............................... 3
Sites at which the PM2.5/PM10 ratio must be < 0.40:Rj < 30 µg/m3 for 24-hr or Rj < 20 µg/m3 for 48-hr samples ................. .......................... ............................... 3

38797Federal Register / Vol. 62, No. 138 / Friday, July 18, 1997 / Rules and Regulations
TABLE C–4.—TEST SPECIFICATIONS FOR PM10 AND PM2.5 METHODS—Continued
Specification PM10
PM2.5
Class I Class II
Rj > 30 µg/m3 for 24-hr or Rj > 20 µg/m3 for 48-hr samples ................. .......................... ............................... 3Total, each site ...................................................................................................... .......................... 10 .......................... 10Precision of replicate reference method measurements, Pj or RPj respectively,
maximum.5 µg/m3 or 7% ...... 2 µg/m3 or 5% ...... 2 µg/m3 or 5%
Slope of regression relationship ............................................................................ 1±0.1 ..................... 1±0.05 ................... 1±0.05Intercept of regression relationship, µg/m3 ............................................................ 0±5 ........................ 0±1 ........................ 0±1Correlation of reference method and candidate method measurements .............. ≥0.97 ..................... ≥0.97 ..................... ≥0.97
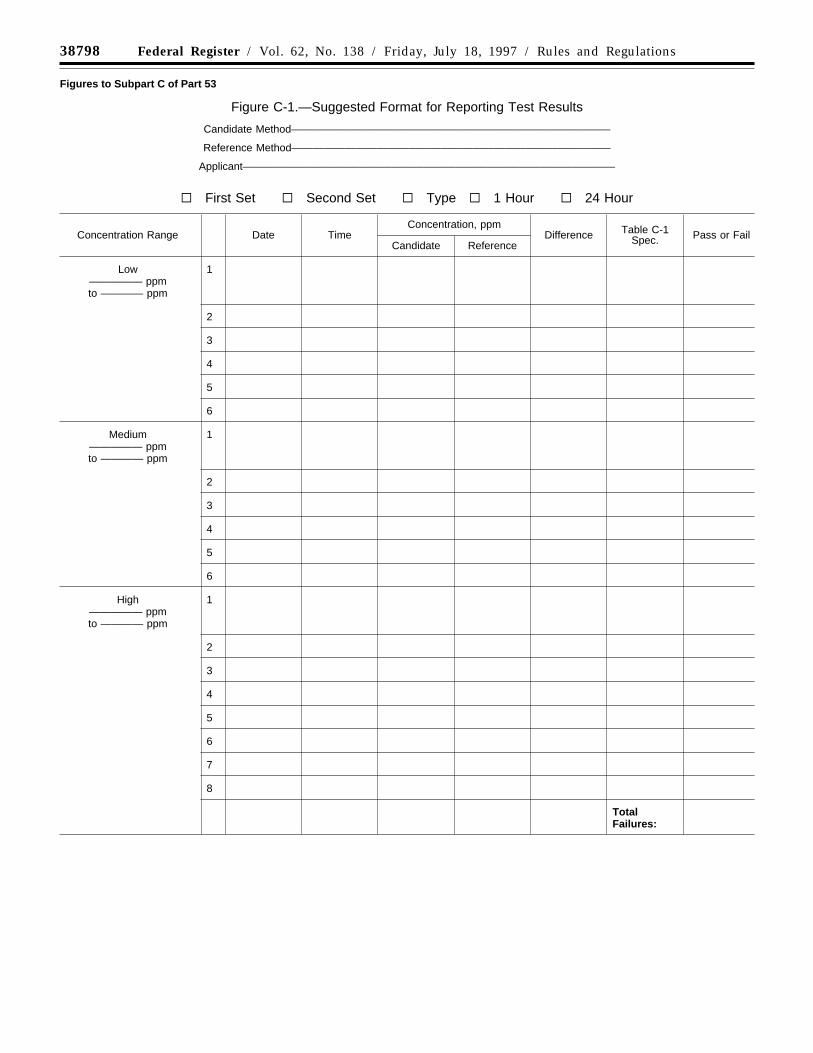
38798 Federal Register / Vol. 62, No. 138 / Friday, July 18, 1997 / Rules and Regulations
Figures to Subpart C of Part 53
Figure C-1.—Suggested Format for Reporting Test Results
Candidate Method——————————————————————————————
Reference Method——————————————————————————————
Applicant———————————————————————————————————
b First Set b Second Set b Type b 1 Hour b 24 Hour
Concentration Range Date TimeConcentration, ppm
Difference Table C-1Spec. Pass or Fail
Candidate Reference
Low————— ppmto ———— ppm
1
2
3
4
5
6
Medium————— ppmto ———— ppm
1
2
3
4
5
6
High————— ppmto ———— ppm
1
2
3
4
5
6
7
8
TotalFailures:

38799Federal Register / Vol. 62, No. 138 / Friday, July 18, 1997 / Rules and Regulations
Appendix A to Subpart C of Part 53--References
(1) American National Standard--Specifications and Guidelines for QualitySystems for Environmental Data Collectionand Environmental Technology Programs,ANSI/ASQC E4-1994. Available fromAmerican Society for Quality Control, 611East Wisconsin Avenue, Milwaukee, WI53202.
d. Subpart E is added to read asfollows:
Subpart E—Procedures for Testing Physical(Design) and Performance Characteristicsof Reference Methods and Class IEquivalent Methods for PM2.5
Sec.
53.50 General provisions.53.51 Demonstration of compliance withdesign specifications and manufacturing andtest requirements.53.52 Leak check test.53.53 Test for flow rate accuracy,regulation, measurement accuracy, and cut-off.53.54 Test for proper sampler operationfollowing power interruptions.53.55 Test for effect of variations in powerline voltage and ambient temperature.53.56 Test for effect of variations in ambientpressure.53.57 Test for filter temperature controlduring sampling and post-sampling periods.53.58 Operational field precision and blanktest.53.59 Aerosol transport test for Class Iequivalent method samplers.
Tables to Subpart E of Part 53
Table E-1.—Summary of Test Requirementsfor Reference and Class I Equivalent Methodsfor PM2.5.Table E-2.—Spectral Energy Distribution andPermitted Tolerance for ConductingRadiative Tests.
Figures to Subpart E of Part 53
Figure E-1—Designation Testing ChecklistFigure E-2—Product Manufacturing Checklist
Appendix A to Subpart E of Part 53—References
Subpart E—Procedures for TestingPhysical (Design) and PerformanceCharacteristics of Reference Methodsand Class I Equivalent Methods forPM2.5
§ 53.50 General provisions.
(a) This subpart sets forth the specifictests that must be carried out and thetest results, evidence, documentation,and other materials that must beprovided to EPA to demonstrate that aPM2.5 sampler associated with acandidate reference method or Class Iequivalent method meets all design andperformance specifications set forth in40 CFR part 50, Appendix L, as well asadditional requirements specified inthis subpart E. Some of these tests mayalso be applicable to portions of a
candidate Class II equivalent methodsampler, as determined under subpart Fof this part. Some or all of these testsmay also be applicable to a candidateClass III equivalent method sampler, asmay be determined under § 53.3(a)(4) or§ 53.3(b)(3).
(b) Samplers associated withcandidate reference methods for PM2.5
shall be subject to the provisions,specifications, and test proceduresprescribed in §§ 53.51 through 53.58.Samplers associated with candidateClass I equivalent methods for PM2.5
shall be subject to the provisions,specifications, and test proceduresprescribed in all sections of this subpart.Samplers associated with candidateClass II equivalent methods for PM2.5
shall be subject to the provisions,specifications, and test proceduresprescribed in all applicable sections ofthis subpart, as specified in subpart F ofthis part.
(c) The provisions of § 53.51 pertainto test results and documentationrequired to demonstrate compliance of acandidate method sampler with thedesign specifications set forth in 40 CFRpart 50, Appendix L. The testprocedures prescribed in §§ 53.52through 53.59 pertain to performancetests required to demonstratecompliance of a candidate methodsampler with the performancespecifications set forth in 40 CFR part50, Appendix L, as well as additionalrequirements specified in this subpart E.These latter test procedures shall beused to test the performance ofcandidate samplers against theperformance specifications andrequirements specified in eachprocedure and summarized in Table E-1 of this subpart.
(d) Test procedures prescribed in§ 53.59 do not apply to candidatereference method samplers. Theseprocedures apply primarily to candidateClass I equivalent method samplers forPM2.5 which have a sample air flow pathconfiguration upstream of the samplefilter that is modified with respect tothat specified for the reference methodsampler, as set forth in 40 CFR part 50,Appendix L, Figures L-1 to L-29, suchas might be necessary to provide forsequential sample capability. Theadditional tests determine the adequacyof aerosol transport through any alteredcomponents or supplemental devicesthat are used in a candidate samplerupstream of the sample filter. Inaddition to the other test procedures inthis subpart, these test procedures shallbe used to further test the performanceof such an equivalent method sampleragainst the performance specifications
given in the procedure and summarizedin Table E-1 of this subpart.
(e) A 10–day operational field test ofmeasurement precision is requiredunder § 53.58 for both candidatereference and equivalent methodsamplers. This test requires collocatedoperation of three candidate methodsamplers at a field test site. Forcandidate equivalent method samplers,this test may be combined and carriedout concurrently with the test forcomparability to the reference methodspecified under § 53.34, which requirescollocated operation of three referencemethod samplers and three candidateequivalent method samplers.
(f) All tests and collection of test datashall be performed in accordance withthe requirements of Reference 1, section4.10.5 (ISO 9001) and Reference 2, PartB, section 3.3.1, paragraphs 1 and 2 andPart C, section 4.6 (ANSI/ASQC E4) inAppendix A of this subpart. All test dataand other documentation obtainedspecifically from or pertinent to thesetests shall be identified, dated, signedby the analyst performing the test, andsubmitted to EPA in accordance withsubpart A of this part.
§ 53.51 Demonstration of compliance withdesign specifications and manufacturingand test requirements.
(a) Overview. (1) The subsequentparagraphs of this section specifycertain documentation that must besubmitted and tests that are required todemonstrate that samplers associatedwith a designated reference orequivalent method for PM2.5 areproperly manufactured to meet allapplicable design and performancespecifications and have been properlytested according to all applicable testrequirements for such designation.Documentation is required to show thatinstruments and components of a PM2.5
sampler are manufactured in an ISO9001-registered facility under a qualitysystem that meets ISO-9001requirements for manufacturing qualitycontrol and testing.
(2) In addition, specific tests arerequired to verify that two criticalfeatures of reference method samplersimpactor jet diameter and the surfacefinish of surfaces specified to beanodized meet the specifications of 40CFR part 50, Appendix L. A checklist isrequired to provide certification by anISO-certified auditor that allperformance and other required testshave been properly and appropriatelyconducted, based on a reasonable andappropriate sample of the actualoperations or their documented records.Following designation of the method,another checklist is required, initially

38800 Federal Register / Vol. 62, No. 138 / Friday, July 18, 1997 / Rules and Regulations
and annually, to provide an ISO-certified auditor’s certification that thesampler manufacturing process is beingimplemented under an adequate andappropriate quality system.
(3) For the purposes of this section,the definitions of ISO 9001-registeredfacility and ISO-certified auditor arefound in § 53.1. An exception to thereliance by EPA on ISO affiliate auditsis the requirement for the submission ofthe operation or instruction manualassociated with the candidate method toEPA as part of the application. Thismanual is required under § 53.4(b)(3).EPA has determined that acceptabletechnical judgment for review of thismanual may not be assured by ISOaffiliates, and approval of this manualwill therefore be performed by EPA.
(b) ISO registration of manufacturingfacility. (1) The applicant must submitdocumentation verifying that thesamplers identified and sold as part ofa designated PM2.5 reference orequivalent method will bemanufactured in an ISO 9001-registeredfacility and that the manufacturingfacility is maintained in compliancewith all applicable ISO 9001requirements (Reference 1 in AppendixA of this subpart). The documentationshall indicate the date of the originalISO 9001 registration for the facility andshall include a copy of the most recentcertification of continued ISO 9001facility registration. If the manufacturerdoes not wish to initiate or completeISO 9001 registration for themanufacturing facility, documentationmust be included in the application toEPA describing an alternative method todemonstrate that the facility meets thesame general requirements as requiredfor registration to ISO-9001. In this case,the applicant must providedocumentation in the application todemonstrate, by required ISO-certifiedauditor’s inspections, that a qualitysystem is in place which is adequate todocument and monitor that the samplersystem components and final assembledsamplers all conform to the design,performance and other requirementsspecified in this part and in 40 CFR part50, Appendix L.
(2) Phase-in period. For a period of 1year following the effective date of thissubpart, a candidate reference orequivalent method for PM2.5 that utilizesa sampler manufactured in a facility thatis not ISO 9001-registered or otherwiseapproved by EPA under paragraph (b)(1)of this section may be conditionallydesignated as a reference or equivalentmethod under this part. Suchconditional designation will beconsidered on the basis of evidencesubmitted in association with the
candidate method application showingthat appropriate efforts are currentlyunderway to seek ISO 9001 registrationor alternative approval of the facility’squality system under paragraph (b)(1) ofthis section within the next 12 months.Such conditional designation shallexpire 1 year after the date of theFederal Register notice of theconditional designation unlessdocumentation verifying successful ISO9001 registration for the facility or otherEPA-acceptable quality system reviewand approval process of the productionfacility that will manufacture thesamplers is submitted at least 30 daysprior to the expiration date.
(c) Sampler manufacturing qualitycontrol. The manufacturer must ensurethat all components used in themanufacture of PM2.5 samplers to besold as part of a reference or equivalentmethod and that are specified by designin 40 CFR part 50, Appendix L, arefabricated or manufactured exactly asspecified. If the manufacturer’s qualityrecords show that its quality control(QC) and quality assurance (QA) systemof standard process control inspections(of a set number and frequency oftesting that is less than 100 percent)complies with the applicable QAprovisions of section 4 of Reference 4 inAppendix A of this subpart andprevents nonconformances, 100 percenttesting shall not be required until thatconclusion is disproved by customerreturn or other independentmanufacturer or customer test records. Ifproblems are uncovered, inspection toverify conformance to the drawings,specifications, and tolerances shall beperformed. Refer also to paragraph (e) ofthis section--final assembly andinspection requirements.
(d) Specific tests and supportingdocumentation required to verifyconformance to critical componentspecifications.—(1) Verification of PM2.5
impactor jet diameter. The diameter ofthe jet of each impactor manufacturedfor a PM2.5 sampler under the impactordesign specifications set forth in 40 CFRpart 50, Appendix L, shall be verifiedagainst the tolerance specified on thedrawing, using standard, NIST-traceableZZ go/no go plug gages. This test shallbe a final check of the jet diameterfollowing all fabrication operations, anda record shall be kept of this final check.The manufacturer shall submit evidencethat this procedure is incorporated intothe manufacturing procedure, that thetest is or will be routinely implemented,and that an appropriate procedure is inplace for the disposition of units thatfail this tolerance test.
(2) Verification of surface finish. Theanodization process used to treat
surfaces specified to be anodized shallbe verified by testing treated specimensurfaces for weight and corrosionresistance to ensure that the coatingobtained conforms to the coatingspecification. The specimen surfacesshall be finished in accordance withmilitary standard specification 8625F,Type II, Class I (Reference 4 inAppendix A of this subpart) in the sameway the sampler surfaces are finished,and tested, prior to sealing, as specifiedin section 4.5.2 of Reference 4 inAppendix A of this subpart.
(e) Final assembly and inspectionrequirements. Each sampler shall betested after manufacture and beforedelivery to the final user. Eachmanufacturer shall document its post-manufacturing test procedures. As aminimum, each test shall consist of thefollowing: Tests of the overall integrityof the sampler, including leak tests;calibration or verification of thecalibration of the flow measurementdevice, barometric pressure sensor, andtemperature sensors; and operation ofthe sampler with a filter in place overa period of at least 48 hours. The resultsof each test shall be suitablydocumented and shall be subject toreview by an ISO-certified auditor.
(f) Manufacturer’s audit checklists.Manufacturers shall require an ISO-certified auditor to sign and date astatement indicating that the auditor isaware of the appropriate manufacturingspecifications contained in 40 CFR part50, Appendix L, and the test orverification requirements in thissubpart. Manufacturers shall alsorequire an ISO-certified auditor tocomplete the checklists, shown inFigures E-1 and E-2 of this subpart,which describe the manufacturer’sability to meet the requirements of thestandard for both designation testingand product manufacture.
(1) Designation testing checklist. Thecompleted statement and checklist asshown in Figure E-1 of this subpart shallbe submitted with the application forreference or equivalent methoddetermination.
(2) Product manufacturing checklist.Manufacturers shall require an ISO-certified auditor to complete a ProductManufacturing Checklist (Figure E-2 ofthis subpart), which evaluates themanufacturer on its ability to meet therequirements of the standard inmaintaining quality control in theproduction of reference or equivalentdevices. The initial completed checklistshall be submitted with the applicationfor reference or equivalent methoddetermination. Also, this checklist(Figure E-2 of this subpart) must becompleted and submitted annually to

38801Federal Register / Vol. 62, No. 138 / Friday, July 18, 1997 / Rules and Regulations
retain a reference or equivalent methoddesignation for a PM2.5 method.
(3) Phase-in period. If the conditionsof paragraph (b)(2) of this section apply,a candidate reference or equivalentmethod for PM2.5 may be conditionallydesignated as a reference or equivalentmethod under this part 53 without thesubmission of the checklists describedin paragraphs (f)(1) and (f)(2) of thissection. Such conditional designationshall expire 1 year after the date of theFederal Register notice of theconditional designation unless thechecklists are submitted at least 30 daysprior to the expiration date.
§ 53.52 Leak check test.
(a) Overview. In section 7.4.6 of 40CFR part 50, Appendix L, the sampleris required to include the facility,including components, instruments,operator controls, a written procedure,and other capabilities as necessary, toallow the operator to carry out a leaktest of the sampler at a field monitoringsite without additional equipment. Thistest procedure is intended to test theadequacy and effectiveness of thesampler’s leak check facility. Because ofthe variety of potential samplerconfigurations and leak checkprocedures possible, some adaptation ofthis procedure may be necessary toaccommodate the specific samplerunder test. The test conditions andperformance specifications associatedwith this test are summarized in TableE-1 of this subpart. The candidate testsampler must meet all test parametersand test specifications to successfullypass this test.
(b) Technical definitions. (1) Externalleakage includes the total flow rate ofexternal ambient air which enters thesampler other than through the samplerinlet and which passes through any oneor more of the impactor, filter, or flowrate measurement components.
(2) Internal leakage is the total sampleair flow rate that passes through thefilter holder assembly without passingthrough the sample filter.
(c) Required test equipment. (1) Flowrate measurement device, range 70 mL/min to 130 mL/min, 2 percent certifiedaccuracy, NIST-traceable.
(2) Flow rate measurement adaptor(40 CFR part 50, Appendix L, Figure L-30) or equivalent adaptor to facilitatemeasurement of sampler flow rate at thetop of the downtube.
(3) Impermeable membrane or disk,47 mm nominal diameter.
(4) Means, such as a micro-valve, ofproviding a simulated leak flow ratethrough the sampler of approximately80 mL/min under the conditions
specified for the leak check in thesampler’s leak check procedure.
(5) Teflon sample filter, as specifiedin section 6 of 40 CFR part 50,Appendix L.
(d) Calibration of test measurementinstruments. Submit documentationshowing evidence of appropriatelyrecent calibration, certification ofcalibration accuracy, and NIST-traceability (if required) of allmeasurement instruments used in thetests. The accuracy of flow rate metersshall be verified at the highest andlowest pressures and temperatures usedin the tests and shall be checked at zeroand one or more non-zero flow rateswithin 7 days of use for this test.
(e) Test setup. (1) The test samplershall be set up for testing as describedin the sampler’s operation or instructionmanual referred to in § 53.4(b)(3). Thesampler shall be installed upright andset up in its normal configuration forcollecting PM2.5 samples, except that thesample air inlet shall be removed andthe flow rate measurement adaptor shallbe installed on the sampler’s downtube.
(2) The flow rate control device shallbe set up to provide a constant,controlled flow rate of 80 mL/min intothe sampler downtube under theconditions specified for the leak checkin the sampler’s leak check procedure.
(3) The flow rate measurement deviceshall be set up to measure the controlledflow rate of 80 mL/min into the samplerdowntube under the conditionsspecified for the leak check in thesampler’s leak check procedure.
(f) Procedure. (1) Install theimpermeable membrane in a filtercassette and install the cassette into thesampler. Carry out the internal leakcheck procedure as described in thesampler’s operation/instruction manualand verify that the leak checkacceptance criterion specified in TableE-1 of this subpart is met.
(2) Replace the impermeablemembrane with a Teflon filter andinstall the cassette in the sampler.Remove the inlet from the sampler andinstall the flow measurement adaptor onthe sampler’s downtube. Close the valveof the adaptor to seal the flow system.Conduct the external leak checkprocedure as described in the sampler’soperation/instruction manual and verifythat the leak check acceptance criteriaspecified in Table E-1 of this subpart aremet.
(3) Arrange the flow control device,flow rate measurement device, andother apparatus as necessary to providea simulated leak flow rate of 80 mL/mininto the test sampler through thedowntube during the specified externalleak check procedure. Carry out the
external leak check procedure asdescribed in the sampler’s operation/instruction manual but with thesimulated leak of 80 mL/min.
(g) Test results. The requirements forsuccessful passage of this test are:
(1) That the leak check procedureindicates no significant external orinternal leaks in the test sampler whenno simulated leaks are introduced.
(2) That the leak check procedureproperly identifies the occurrence of thesimulated external leak of 80 mL/min.
§ 53.53 Test for flow rate accuracy,regulation, measurement accuracy, and cut-off.
(a) Overview. This test procedure isdesigned to evaluate a candidatesampler’s flow rate accuracy withrespect to the design flow rate, flow rateregulation, flow rate measurementaccuracy, coefficient of variabilitymeasurement accuracy, and the flowrate cut-off function. The tests for thefirst four parameters shall be conductedover a 6–hour time period during whichreference flow measurements are madeat intervals not to exceed 5 minutes. Theflow rate cut-off test, conductedseparately, is intended to verify that thesampler carries out the requiredautomatic sample flow rate cut-offfunction properly in the event of a low-flow condition. The test conditions andperformance specifications associatedwith this test are summarized in TableE-1 of this subpart. The candidate testsampler must meet all test parametersand test specifications to successfullypass this test.
(b) Technical definitions. (1) Sampleflow rate means the quantitativevolumetric flow rate of the air streamcaused by the sampler to enter thesampler inlet and pass through thesample filter, measured in actualvolume units at the temperature andpressure of the air as it enters the inlet.
(2) The flow rate cut-off functionrequires the sampler to automaticallystop sample flow and terminate thecurrent sample collection if the sampleflow rate deviates by more than thevariation limits specified in Table E-1 ofthis subpart (±10 percent from thenominal sample flow rate) for more than60 seconds during a sample collectionperiod. The sampler is also required toproperly notify the operator with a flagwarning indication of the out-of-specification flow rate condition and ifthe flow rate cut-off results in anelapsed sample collection time of lessthan 23 hours.
(c) Required test equipment. (1) Flowrate meter, suitable for measuring andrecording the actual volumetric sampleflow rate at the sampler downtube, with

38802 Federal Register / Vol. 62, No. 138 / Friday, July 18, 1997 / Rules and Regulations
a minimum range of 10 to 25 L/min, 2percent certified, NIST-traceableaccuracy. Optional capability forcontinuous (analog) recording capabilityor digital recording at intervals not toexceed 30 seconds is recommended.While a flow meter which provides adirect indication of volumetric flow rateis preferred for this test, an alternativecertified flow measurement device maybe used as long as appropriatevolumetric flow rate corrections aremade based on measurements of actualambient temperature and pressureconditions.
(2) Ambient air temperature sensor,with a resolution of 0.1 °C and certifiedto be accurate to within 0.5 °C (ifneeded). If the certified flow meter doesnot provide direct volumetric flow ratereadings, ambient air temperaturemeasurements must be made usingcontinuous (analog) recording capabilityor digital recording at intervals not toexceed 5 minutes.
(3) Barometer, range 600 mm Hg to800 mm Hg, certified accurate to 2 mmHg (if needed). If the certified flowmeter does not provide directvolumetric flow rate readings, ambientpressure measurements must be madeusing continuous (analog) recordingcapability or digital recording atintervals not to exceed 5 minutes.
(4) Flow measurement adaptor (40CFR part 50, Appendix L, Figure L-30)or equivalent adaptor to facilitatemeasurement of sample flow rate at thesampler downtube.
(5) Valve or other means to restrict orreduce the sample flow rate to a valueat least 10 percent below the designflow rate (16.67 L/min). If appropriate,the valve of the flow measurementadaptor may be used for this purpose.
(6) Means for creating an additionalpressure drop of 55 mm Hg in thesampler to simulate a heavily loadedfilter, such as an orifice or flowrestrictive plate installed in the filterholder or a valve or other flow restrictortemporarily installed in the flow pathnear the filter.
(7) Teflon sample filter, as specifiedin section 6 of 40 CFR part 50,Appendix L (if required).
(d) Calibration of test measurementinstruments. Submit documentationshowing evidence of appropriatelyrecent calibration, certification ofcalibration accuracy, and NIST-traceability (if required) of allmeasurement instruments used in thetests. The accuracy of flow-rate metersshall be verified at the highest andlowest pressures and temperatures usedin the tests and shall be checked at zeroand at least one flow rate within ±3percent of 16.7 L/min within 7 days
prior to use for this test. Where aninstrument’s measurements are to berecorded with an analog recordingdevice, the accuracy of the entireinstrument-recorder system shall becalibrated or verified.
(e) Test setup. (1) Setup of thesampler shall be as required in thisparagraph (e) and otherwise asdescribed in the sampler’s operation orinstruction manual referred to in§ 53.4(b)(3). The sampler shall beinstalled upright and set up in itsnormal configuration for collectingPM2.5 samples. A sample filter and (or)the device for creating an additional 55mm Hg pressure drop shall be installedfor the duration of these tests. Thesampler’s ambient temperature, ambientpressure, and flow rate measurementsystems shall all be calibrated per thesampler’s operation or instructionmanual within 7 days prior to this test.
(2) The inlet of the candidate samplershall be removed and the flowmeasurement adaptor installed on thesampler’s downtube. A leak check asdescribed in the sampler’s operation orinstruction manual shall be conductedand must be properly passed beforeother tests are carried out.
(3) The inlet of the flow measurementadaptor shall be connected to the outletof the flow rate meter.
(4) For the flow rate cut-off test, thevalve or means for reducing samplerflow rate shall be installed between theflow measurement adaptor and thedowntube or in another location withinthe sampler such that the sampler flowrate can be manually restricted duringthe test.
(f) Procedure. (1) Set up the sampleras specified in paragraph (e) of thissection and otherwise prepare thesampler for normal sample collectionoperation as directed in the sampler’soperation or instruction manual. Set thesampler to automatically start a 6–hoursample collection period at a convenienttime.
(2) During the 6–hour operationalflow rate portion of the test, measureand record the sample flow rate with theflow rate meter at intervals not toexceed 5 minutes. If ambienttemperature and pressure correctionsare necessary to calculate volumetricflow rate, ambient temperature andpressure shall be measured at the samefrequency as that of the certified flowrate measurements. Note and record theactual start and stop times for the 6–hour flow rate test period.
(3) Following completion of the 6–hour flow rate test period, install theflow rate reduction device and changethe sampler flow rate recordingfrequency to intervals of not more than
30 seconds. Reset the sampler to start anew sample collection period. Manuallyrestrict the sampler flow rate such thatthe sampler flow rate is decreasedslowly over several minutes to a flowrate slightly less than the flow rate cut-off value (15.0 L/min). Maintain thisflow rate for at least 2.0 minutes or untilthe sampler stops the sample flowautomatically. Manually terminate thesample period, if the sampler has notterminated it automatically.
(g) Test results. At the completion ofthe test, validate the test conditions anddetermine the test results as follows:
(1) Mean sample flow rate. (i) Fromthe certified measurements (Qref) of thetest sampler flow rate obtained by useof the flow rate meter, tabulate eachflow rate measurement in units of L/min. If ambient temperature andpressure corrections are necessary tocalculate volumetric flow rate, eachmeasured flow rate shall be correctedusing its corresponding temperature andpressure measurement values. Calculatethe mean flow rate for the sample period(Qref,ave) as follows:
Equation 1
Q
Q
nref ave
ref ii
n
,
,
= =∑
1
where:n equals the number of discrete certified flowrate measurements over the 6–hour testperiod.
(ii)(A) Calculate the percent differencebetween this mean flow rate value andthe design value of 16.67 L/min, asfollows:
Equation 2
%., Differenc
16.67 e
Qx 100%ref ave =
− 16 67
(B) To successfully pass the meanflow rate test, the percent differencecalculated in Equation 2 of thisparagraph (g)(1)(ii) must be within ±5percent.
(2) Sample flow rate regulation. (i)From the certified measurements of thetest sampler flow rate, calculate thesample coefficient of variation (CV) ofthe discrete measurements as follows:
Equation 3
%,
, ,
CVQ
x
Qn
Q
nx ref
ref ave
ref i ref ii
n
i
n
=−
−−=∑∑
1
1
1100%
2
1
2
1
(ii) To successfully pass the flow rateregulation test, the calculated coefficientof variation for the certified flow ratesmust not exceed 2 percent.

38803Federal Register / Vol. 62, No. 138 / Friday, July 18, 1997 / Rules and Regulations
(3) Flow rate measurement accuracy.(i) Using the mean volumetric flow ratereported by the candidate test samplerat the completion of the 6–hour testperiod (Qind,ave), determine the accuracyof the reported mean flow rate as:
Equation 4
%| |, ,
,
DifferenceQ Q
Qx ind ave ref ave
ref ave
=−
100%
(ii) To successfully pass the flow ratemeasurement accuracy test, the percentdifference calculated in Equation 4 ofthis paragraph (g)(3) shall not exceed 2percent.
(4) Flow rate coefficient of variationmeasurement accuracy. (i) Using theflow rate coefficient of variationindicated by the candidate test samplerat the completion of the 6–hour test(%CVind), determine the accuracy of thisreported coefficient of variation as:
Equation 5
Difference CV CVind ref =|% % % |( ) −(ii) To successfully pass the flow rate
CV measurement accuracy test, theabsolute difference in values calculatedin Equation 5 of this paragraph (g)(4)must not exceed 0.3 (CV%).
(5) Flow rate cut-off. (i) Inspect themeasurements of the sample flow rateduring the flow rate cut-off test anddetermine the time at which the sampleflow rate decreased to a value less thanthe cut-off value specified in Table E-1of this subpart. To pass this test, thesampler must have automaticallystopped the sample flow at least 30seconds but not more than 90 secondsafter the time at which the sampler flowrate was determined to have decreasedto a value less than the cut-off value.
(ii) At the completion of the flow ratecut-off test, download the archived datafrom the test sampler and verify that thesampler’s required Flow-out-of-spec andIncorrect sample period flag indicatorsare properly set.
§ 53.54 Test for proper sampler operationfollowing power interruptions.
(a) Overview. (1) This test procedureis designed to test certain performanceparameters of the candidate samplerduring a test period in which powerinterruptions of various duration occur.The performance parameters tested are:
(i) Proper flow rate performance of thesampler.
(ii) Accuracy of the sampler’s averageflow rate, CV, and sample volumemeasurements.
(iii) Accuracy of the sampler’sreported elapsed sampling time.
(iv) Accuracy of the reported time andduration of power interruptions.
(2) This test shall be conductedduring operation of the test samplerover a continuous 6–hour test periodduring which the sampler’s flow rateshall be measured and recorded atintervals not to exceed 5 minutes. Theperformance parameters tested underthis procedure, the correspondingminimum performance specifications,and the applicable test conditions aresummarized in Table E-1 of this subpart.Each performance parameter tested, asdescribed or determined in the testprocedure, must meet or exceed theassociated performance specification tosuccessfully pass this test.
(b) Required test equipment. (1) Flowrate meter, suitable for measuring andrecording the actual volumetric sampleflow rate at the sampler downtube, witha minimum range of 10 to 25 L/min, 2percent certified, NIST-traceableaccuracy. Optional capability forcontinuous (analog) recording capabilityor digital recording at intervals not toexceed 5 minutes is recommended.While a flow meter which provides adirect indication of volumetric flow rateis preferred for this test, an alternativecertified flow measurement device maybe used as long as appropriatevolumetric flow rate corrections aremade based on measurements of actualambient temperature and pressureconditions.
(2) Ambient air temperature sensor (ifneeded for volumetric corrections toflow rate measurements), with aresolution of 0.1 °C, certified accurate towithin 0.5 °C, and continuous (analog)recording capability or digital recordingat intervals not to exceed 5 minutes.
(3) Barometer (if needed forvolumetric corrections to flow ratemeasurements), range 600 mm Hg to 800mm Hg, certified accurate to 2 mm Hg,with continuous (analog) recordingcapability or digital recording atintervals not to exceed 5 minutes.
(4) Flow measurement adaptor (40CFR part 50, Appendix L, Figure L-30)or equivalent adaptor to facilitatemeasurement of sample flow rate at thesampler downtube.
(5) Means for creating an additionalpressure drop of 55 mm Hg in thesampler to simulate a heavily loadedfilter, such as an orifice or flowrestrictive plate installed in the filterholder or a valve or other flow restrictortemporarily installed in the flow pathnear the filter.
(6) Teflon sample filter, as specifiedin section 6 of 40 CFR part 50,Appendix L (if required).
(7) Time measurement system,accurate to within 10 seconds per day.
(c) Calibration of test measurementinstruments. Submit documentation
showing evidence of appropriatelyrecent calibration, certification ofcalibration accuracy, and NIST-traceability (if required) of allmeasurement instruments used in thetests. The accuracy of flow rate metersshall be verified at the highest andlowest pressures and temperatures usedin the tests and shall be checked at zeroand at least one flow rate within ±3percent of 16.7 L/min within 7 daysprior to use for this test. Where aninstrument’s measurements are to berecorded with an analog recordingdevice, the accuracy of the entireinstrument-recorder system shall becalibrated or verified.
(d) Test setup. (1) Setup of thesampler shall be performed as requiredin this paragraph (d) and otherwise asdescribed in the sampler’s operation orinstruction manual referred to in§ 53.4(b)(3). The sampler shall beinstalled upright and set up in itsnormal configuration for collectingPM2.5 samples. A sample filter and (or)the device for creating an additional 55mm Hg pressure drop shall be installedfor the duration of these tests. Thesampler’s ambient temperature, ambientpressure, and flow measurementsystems shall all be calibrated per thesampler’s operating manual within 7days prior to this test.
(2) The inlet of the candidate samplershall be removed and the flowmeasurement adaptor installed on thesample downtube. A leak check asdescribed in the sampler’s operation orinstruction manual shall be conductedand must be properly passed beforeother tests are carried out.
(3) The inlet of the flow measurementadaptor shall be connected to the outletof the flow rate meter.
(e) Procedure. (1) Set up the sampleras specified in paragraph (d) of thissection and otherwise prepare thesampler for normal sample collectionoperation as directed in the sampler’soperation or instruction manual. Set thesampler to automatically start a 6–hoursample collection period at a convenienttime.
(2) During the entire 6–houroperational flow rate portion of the test,measure and record the sample flow ratewith the flow rate meter at intervals notto exceed 5 minutes. If ambienttemperature and pressure correctionsare necessary to calculate volumetricflow rate, ambient temperature andpressure shall be measured at the samefrequency as that of the certified flowrate measurements. Note and record theactual start and stop times for the 6–hour flow rate test period.
(3) During the 6–hour test period,interrupt the AC line electrical power to

38804 Federal Register / Vol. 62, No. 138 / Friday, July 18, 1997 / Rules and Regulations
the sampler 5 times, with durations of20 seconds, 40 seconds, 2 minutes, 7minutes, and 20 minutes (respectively),with not less than 10 minutes of normalelectrical power supplied between eachpower interruption. Record the hourand minute and duration of each powerinterruption.
(4) At the end of the test, terminatethe sample period (if not automaticallyterminated by the sampler) anddownload all archived instrument datafrom the test sampler.
(f) Test results. At the completion ofthe sampling period, validate the testconditions and determine the testresults as follows:
(1) Mean sample flow rate. (i) Fromthe certified measurements (Qref) of thetest sampler flow rate, tabulate eachflow rate measurement in units of L/min. If ambient temperature andpressure corrections are necessary tocalculate volumetric flow rate, eachmeasured flow rate shall be correctedusing its corresponding temperature andpressure measurement values. Calculatethe mean flow rate for the sample period(Qref,ave) as follows:
Equation 6
Q
Q
nref ave
ref ii
n
,
,
= =∑
1
where:n equals the number of discrete certified flowrate measurements over the 6–hour testperiod, excluding flow rate values obtainedduring periods of power interruption.
(ii)(A) Calculate the percent differencebetween this mean flow rate value andthe design value of 16.67 L/min, asfollows:
Equation 7
%., Differenc
16.67 e
Qx 100%ref ave =
− 16 67
(B) To successfully pass this test, thepercent difference calculated inEquation 7 of this paragraph (f)(1)(ii)must be within ±5 percent.
(2) Sample flow rate regulation. (i)From the certified measurements of thetest sampler flow rate, calculate thesample coefficient of variation of thediscrete measurements as follows:
Equation 8
%,
, ,
CVQ
x
Qn
Q
nx ref
ref ave
ref i ref ii
n
i
n
=−
−−=∑∑
1
1
1100%
2
1
2
1
(ii) To successfully pass this test, thecalculated coefficient of variation for thecertified flow rates must not exceed 2percent.
(3) Flow rate measurement accuracy.(i) Using the mean volumetric flow ratereported by the candidate test samplerat the completion of the 6–hour test(Qind,ave), determine the accuracy of thereported mean flow rate as:
Equation 9
%| |, ,
,
DifferenceQ Q
Qx ind ave ref ave
ref ave
=−
100%
(ii) To successfully pass this test, thepercent difference calculated inEquation 9 of this paragraph (f)(3) shallnot exceed 2 percent.
(4) Flow rate CV measurementaccuracy. (i) Using the flow ratecoefficient of variation indicated by thecandidate test sampler at the completionof the 6–hour test (%CVind), determinethe accuracy of the reported coefficientof variation as:
Equation 10
Difference CV CVind ref =|% % % |( ) −(ii) To successfully pass this test, the
absolute difference in values calculatedin Equation 10 of this paragraph (f)(4)must not exceed 0.3 (CV%).
(5) Verify that the sampler properlyprovided a record and visual display ofthe correct year, month, day-of-month,hour, and minute with an accuracy of ±2 minutes, of the start of each powerinterruption of duration greater than 60seconds.
(6) Calculate the actual elapsedsample time, excluding the periods ofelectrical power interruption. Verifythat the elapsed sample time reportedby the sampler is accurate to within ±20 seconds for the 6–hour test run.
(7) Calculate the sample volume asQref,ave the sample time, excludingperiods of power interruption. Verifythat the sample volume reported by thesampler is within 2 percent of thecalculated sample volume tosuccessfully pass this test.
(8) Inspect the downloadedinstrument data from the test samplerand verify that all data are consistentwith normal operation of the sampler.
§ 53.55 Test for effect of variations inpower line voltage and ambienttemperature.
(a) Overview. (1) This test procedureis a combined procedure to test variousperformance parameters undervariations in power line voltage andambient temperature. Tests shall beconducted in a temperature controlledenvironment over four 6–hour timeperiods during which referencetemperature and flow ratemeasurements shall be made at intervalsnot to exceed 5 minutes. Specific
parameters to be evaluated at linevoltages of 105 and 125 volts andtemperatures of -20 °C and +40 °C areas follows:
(i) Sample flow rate.(ii) Flow rate regulation.(iii) Flow rate measurement accuracy.(iv) Coefficient of variability
measurement accuracy.(v) Ambient air temperature
measurement accuracy.(vi) Proper operation of the sampler
when exposed to power line voltage andambient temperature extremes.
(2) The performance parameters testedunder this procedure, the correspondingminimum performance specifications,and the applicable test conditions aresummarized in Table E-1 of this subpart.Each performance parameter tested, asdescribed or determined in the testprocedure, must meet or exceed theassociated performance specificationgiven. The candidate sampler must meetall specifications for the associatedPM2.5 method to pass this testprocedure.
(b) Technical definition. Sample flowrate means the quantitative volumetricflow rate of the air stream caused by thesampler to enter the sampler inlet andpass through the sample filter, measuredin actual volume units at thetemperature and pressure of the air as itenters the inlet.
(c) Required test equipment. (1)Environmental chamber or othertemperature-controlled environment orenvironments, capable of obtaining andmaintaining temperatures at -20 °C and+40 °C as required for the test with anaccuracy of ±2 °C. The testenvironment(s) must be capable ofmaintaining these temperatures withinthe specified limits continuously withthe additional heat load of the operatingtest sampler in the environment.Henceforth, where the test proceduresspecify a test or environmental‘‘chamber,’’ an alternative temperature-controlled environmental area or areasmay be substituted, provided therequired test temperatures and all othertest requirements are met.
(2) Variable voltage AC powertransformer, range 100 Vac to 130 Vac,with sufficient current capacity tooperate the test sampler continuouslyunder the test conditions.
(3) Flow rate meter, suitable formeasuring and recording the actualvolumetric sample flow rate at thesampler downtube, with a minimumrange of 10 to 25 actual L/min, 2 percentcertified, NIST-traceable accuracy.Optional capability for continuous(analog) recording capability or digitalrecording at intervals not to exceed 5minutes is recommended. While a flow

38805Federal Register / Vol. 62, No. 138 / Friday, July 18, 1997 / Rules and Regulations
meter which provides a directindication of volumetric flow rate ispreferred for this test, an alternativecertified flow measurement device maybe used as long as appropriatevolumetric flow rate corrections aremade based on measurements of actualambient temperature and pressureconditions.
(4) Ambient air temperature recorder,range -30 °C to +50 °C, with a resolutionof 0.1 °C and certified accurate to within0.5 °C. Ambient air temperaturemeasurements must be made usingcontinuous (analog) recording capabilityor digital recording at intervals not toexceed 5 minutes.
(5) Barometer, range 600 mm Hg to800 mm Hg, certified accurate to 2 mmHg. If the certified flow rate meter doesnot provide direct volumetric flow ratereadings, ambient pressuremeasurements must be made usingcontinuous (analog) recording capabilityor digital recording at intervals not toexceed 5 minutes.
(6) Flow measurement adaptor (40CFR part 50, Appendix L, Figure L-30)or equivalent adaptor to facilitatemeasurement of sampler flow rate at thesampler downtube.
(7) Means for creating an additionalpressure drop of 55 mm Hg in thesampler to simulate a heavily loadedfilter, such as an orifice or flowrestrictive plate installed in the filterholder or a valve or other flow restrictortemporarily installed in the flow pathnear the filter.
(8) AC RMS voltmeter, accurate to 1.0volt.
(9) Teflon sample filter, as specifiedin section 6 of 40 CFR part 50,Appendix L (if required).
(d) Calibration of test measurementinstruments. Submit documentationshowing evidence of appropriatelyrecent calibration, certification ofcalibration accuracy, and NIST-traceability (if required) of allmeasurement instruments used in thetests. The accuracy of flow rate metersshall be verified at the highest andlowest pressures and temperatures usedin the tests and shall be checked at zeroand at least one flow rate within ±3percent of 16.7 L/min within 7 daysprior to use for this test. Where aninstrument’s measurements are to berecorded with an analog recordingdevice, the accuracy of the entireinstrument-recorder system shall becalibrated or verified.
(e) Test setup. (1) Setup of thesampler shall be performed as requiredin this paragraph (e) and otherwise asdescribed in the sampler’s operation orinstruction manual referred to in§ 53.4(b)(3). The sampler shall be
installed upright and set up in thetemperature-controlled chamber in itsnormal configuration for collectingPM2.5 samples. A sample filter and (or)the device for creating an additional 55mm Hg pressure drop shall be installedfor the duration of these tests. Thesampler’s ambient temperature, ambientpressure, and flow measurementsystems shall all be calibrated per thesampler’s operating manual within 7days prior to this test.
(2) The inlet of the candidate samplershall be removed and the flowmeasurement adaptor installed on thesampler’s downtube. A leak check asdescribed in the sampler’s operation orinstruction manual shall be conductedand must be properly passed beforeother tests are carried out.
(3) The inlet of the flow measurementadaptor shall be connected to the outletof the flow rate meter.
(4) The ambient air temperaturerecorder shall be installed in the testchamber such that it will accuratelymeasure the temperature of the air inthe vicinity of the candidate samplerwithout being unduly affected by thechamber’s air temperature controlsystem.
(f) Procedure. (1) Set up the sampleras specified in paragraph (e) of thissection and otherwise prepare thesampler for normal sample collectionoperation as directed in the sampler’soperation or instruction manual.
(2) The test shall consist of four testruns, one at each of the followingconditions of chamber temperature andelectrical power line voltage(respectively):
(i) -20 °C ±2 °C and 105 ±1 Vac.(ii) -20 °C ±2 °C and 125 ±1 Vac.(iii) +40 °C ±2 °C and 105 ±1 Vac.(iv) +40 °C ±2 °C and 125 ±1 Vac.(3) For each of the four test runs, set
the selected chamber temperature andpower line voltage for the test run. Uponachieving each temperature setpoint inthe chamber, the candidate sampler andflow meter shall be thermallyequilibrated for a period of at least 2hours prior to the test run. Followingthe thermal conditioning time, set thesampler to automatically start a 6–hoursample collection period at a convenienttime.
(4) During each 6–hour test period:(i) Measure and record the sample
flow rate with the flow rate meter atintervals not to exceed 5 minutes. Ifambient temperature and pressurecorrections are necessary to calculatevolumetric flow rate, ambienttemperature and pressure shall bemeasured at the same frequency as thatof the certified flow rate measurements.Note and record the actual start and stop
times for the 6–hour flow rate testperiod.
(ii) Determine and record the ambient(chamber) temperature indicated by thesampler and the corresponding ambient(chamber) temperature measured by theambient temperature recorder specifiedin paragraph (c)(4) of this section atintervals not to exceed 5 minutes.
(iii) Measure the power line voltage tothe sampler at intervals not greater than1 hour.
(5) At the end of each test run,terminate the sample period (if notautomatically terminated by thesampler) and download all archivedinstrument data from the test sampler.
(g) Test results. For each of the fourtest runs, examine the chambertemperature measurements and thepower line voltage measurements.Verify that the temperature and linevoltage met the requirements specifiedin paragraph (f) of this section at alltimes during the test run. If not, the testrun is not valid and must be repeated.Determine the test results as follows:
(1) Mean sample flow rate. (i) Fromthe certified measurements (Qref) of thetest sampler flow rate, tabulate eachflow rate measurement in units of L/min. If ambient temperature andpressure corrections are necessary tocalculate volumetric flow rate, eachmeasured flow rate shall be correctedusing its corresponding temperature andpressure measurement values. Calculatethe mean flow rate for each sampleperiod (Qref,ave) as follows:
Equation 11
Q
Q
nref ave
ref ii
n
,
,
= =∑
1
where:n equals the number of discrete certified flowrate measurements over each 6–hour testperiod.
(ii)(A) Calculate the percent differencebetween this mean flow rate value andthe design value of 16.67 L/min, asfollows:
Equation 12
%., Differenc
16.67 e
Qx 100%ref ave =
− 16 67
(B) To successfully pass this test, thepercent difference calculated inEquation 12 of this paragraph (g)(1)(ii)must be within ±5 percent for each testrun.
(2) Sample flow rate regulation. (i)From the certified measurements of thetest sampler flow rate, calculate thesample coefficient of variation of thediscrete measurements as follows:
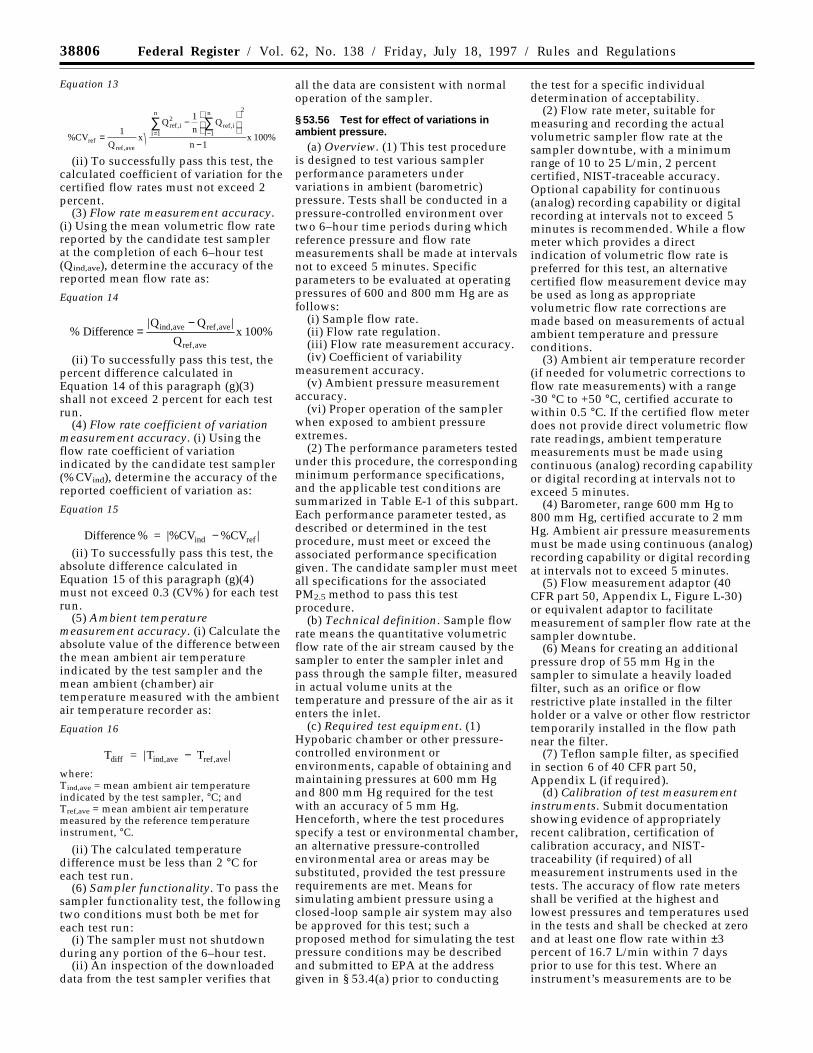
38806 Federal Register / Vol. 62, No. 138 / Friday, July 18, 1997 / Rules and Regulations
Equation 13
%,
, ,
CVQ
x
Qn
Q
nx ref
ref ave
ref i ref ii
n
i
n
=−
−−=∑∑
1
1
1100%
2
1
2
1
(ii) To successfully pass this test, thecalculated coefficient of variation for thecertified flow rates must not exceed 2percent.
(3) Flow rate measurement accuracy.(i) Using the mean volumetric flow ratereported by the candidate test samplerat the completion of each 6–hour test(Qind,ave), determine the accuracy of thereported mean flow rate as:
Equation 14
%| |, ,
,
DifferenceQ Q
Qx ind ave ref ave
ref ave
=−
100%
(ii) To successfully pass this test, thepercent difference calculated inEquation 14 of this paragraph (g)(3)shall not exceed 2 percent for each testrun.
(4) Flow rate coefficient of variationmeasurement accuracy. (i) Using theflow rate coefficient of variationindicated by the candidate test sampler(%CVind), determine the accuracy of thereported coefficient of variation as:
Equation 15
Difference CV CVind ref % = |% − % |
(ii) To successfully pass this test, theabsolute difference calculated inEquation 15 of this paragraph (g)(4)must not exceed 0.3 (CV%) for each testrun.
(5) Ambient temperaturemeasurement accuracy. (i) Calculate theabsolute value of the difference betweenthe mean ambient air temperatureindicated by the test sampler and themean ambient (chamber) airtemperature measured with the ambientair temperature recorder as:
Equation 16
T Tdiff ind ave ref ave = T | |, ,−where:Tind,ave = mean ambient air temperatureindicated by the test sampler, °C; andTref,ave = mean ambient air temperaturemeasured by the reference temperatureinstrument, °C.
(ii) The calculated temperaturedifference must be less than 2 °C foreach test run.
(6) Sampler functionality. To pass thesampler functionality test, the followingtwo conditions must both be met foreach test run:
(i) The sampler must not shutdownduring any portion of the 6–hour test.
(ii) An inspection of the downloadeddata from the test sampler verifies that
all the data are consistent with normaloperation of the sampler.
§ 53.56 Test for effect of variations inambient pressure.
(a) Overview. (1) This test procedureis designed to test various samplerperformance parameters undervariations in ambient (barometric)pressure. Tests shall be conducted in apressure-controlled environment overtwo 6–hour time periods during whichreference pressure and flow ratemeasurements shall be made at intervalsnot to exceed 5 minutes. Specificparameters to be evaluated at operatingpressures of 600 and 800 mm Hg are asfollows:
(i) Sample flow rate.(ii) Flow rate regulation.(iii) Flow rate measurement accuracy.(iv) Coefficient of variability
measurement accuracy.(v) Ambient pressure measurement
accuracy.(vi) Proper operation of the sampler
when exposed to ambient pressureextremes.
(2) The performance parameters testedunder this procedure, the correspondingminimum performance specifications,and the applicable test conditions aresummarized in Table E-1 of this subpart.Each performance parameter tested, asdescribed or determined in the testprocedure, must meet or exceed theassociated performance specificationgiven. The candidate sampler must meetall specifications for the associatedPM2.5 method to pass this testprocedure.
(b) Technical definition. Sample flowrate means the quantitative volumetricflow rate of the air stream caused by thesampler to enter the sampler inlet andpass through the sample filter, measuredin actual volume units at thetemperature and pressure of the air as itenters the inlet.
(c) Required test equipment. (1)Hypobaric chamber or other pressure-controlled environment orenvironments, capable of obtaining andmaintaining pressures at 600 mm Hgand 800 mm Hg required for the testwith an accuracy of 5 mm Hg.Henceforth, where the test proceduresspecify a test or environmental chamber,an alternative pressure-controlledenvironmental area or areas may besubstituted, provided the test pressurerequirements are met. Means forsimulating ambient pressure using aclosed-loop sample air system may alsobe approved for this test; such aproposed method for simulating the testpressure conditions may be describedand submitted to EPA at the addressgiven in § 53.4(a) prior to conducting
the test for a specific individualdetermination of acceptability.
(2) Flow rate meter, suitable formeasuring and recording the actualvolumetric sampler flow rate at thesampler downtube, with a minimumrange of 10 to 25 L/min, 2 percentcertified, NIST-traceable accuracy.Optional capability for continuous(analog) recording capability or digitalrecording at intervals not to exceed 5minutes is recommended. While a flowmeter which provides a directindication of volumetric flow rate ispreferred for this test, an alternativecertified flow measurement device maybe used as long as appropriatevolumetric flow rate corrections aremade based on measurements of actualambient temperature and pressureconditions.
(3) Ambient air temperature recorder(if needed for volumetric corrections toflow rate measurements) with a range-30 °C to +50 °C, certified accurate towithin 0.5 °C. If the certified flow meterdoes not provide direct volumetric flowrate readings, ambient temperaturemeasurements must be made usingcontinuous (analog) recording capabilityor digital recording at intervals not toexceed 5 minutes.
(4) Barometer, range 600 mm Hg to800 mm Hg, certified accurate to 2 mmHg. Ambient air pressure measurementsmust be made using continuous (analog)recording capability or digital recordingat intervals not to exceed 5 minutes.
(5) Flow measurement adaptor (40CFR part 50, Appendix L, Figure L-30)or equivalent adaptor to facilitatemeasurement of sampler flow rate at thesampler downtube.
(6) Means for creating an additionalpressure drop of 55 mm Hg in thesampler to simulate a heavily loadedfilter, such as an orifice or flowrestrictive plate installed in the filterholder or a valve or other flow restrictortemporarily installed in the flow pathnear the filter.
(7) Teflon sample filter, as specifiedin section 6 of 40 CFR part 50,Appendix L (if required).
(d) Calibration of test measurementinstruments. Submit documentationshowing evidence of appropriatelyrecent calibration, certification ofcalibration accuracy, and NIST-traceability (if required) of allmeasurement instruments used in thetests. The accuracy of flow rate metersshall be verified at the highest andlowest pressures and temperatures usedin the tests and shall be checked at zeroand at least one flow rate within ±3percent of 16.7 L/min within 7 daysprior to use for this test. Where aninstrument’s measurements are to be

38807Federal Register / Vol. 62, No. 138 / Friday, July 18, 1997 / Rules and Regulations
recorded with an analog recordingdevice, the accuracy of the entireinstrument-recorder system shall becalibrated or verified.
(e) Test setup. (1) Setup of thesampler shall be performed as requiredin this paragraph (e) and otherwise asdescribed in the sampler’s operation orinstruction manual referred to in§ 53.4(b)(3). The sampler shall beinstalled upright and set up in thepressure-controlled chamber in itsnormal configuration for collectingPM2.5 samples. A sample filter and (or)the device for creating an additional 55mm Hg pressure drop shall be installedfor the duration of these tests. Thesampler’s ambient temperature, ambientpressure, and flow measurementsystems shall all be calibrated per thesampler’s operating manual within 7days prior to this test.
(2) The inlet of the candidate samplershall be removed and the flowmeasurement adaptor installed on thesampler’s downtube. A leak check asdescribed in the sampler’s operation orinstruction manual shall be conductedand must be properly passed beforeother tests are carried out.
(3) The inlet of the flow measurementadaptor shall be connected to the outletof the flow rate meter.
(4) The barometer shall be installed inthe test chamber such that it willaccurately measure the air pressure towhich the candidate sampler issubjected.
(f) Procedure. (1) Set up the sampleras specified in paragraph (e) of thissection and otherwise prepare thesampler for normal sample collectionoperation as directed in the sampler’soperation or instruction manual.
(2) The test shall consist of two testruns, one at each of the followingconditions of chamber pressure:
(i) 600 mm Hg.(ii) 800 mm Hg.(3) For each of the two test runs, set
the selected chamber pressure for thetest run. Upon achieving each pressuresetpoint in the chamber, the candidatesampler shall be pressure-equilibratedfor a period of at least 30 minutes priorto the test run. Following theconditioning time, set the sampler toautomatically start a 6–hour samplecollection period at a convenient time.
(4) During each 6–hour test period:(i) Measure and record the sample
flow rate with the flow rate meter atintervals not to exceed 5 minutes. Ifambient temperature and pressurecorrections are necessary to calculatevolumetric flow rate, ambienttemperature and pressure shall bemeasured at the same frequency as thatof the certified flow rate measurements.Note and record the actual start and stoptimes for the 6–hour flow rate testperiod.
(ii) Determine and record the ambient(chamber) pressure indicated by thesampler and the corresponding ambient(chamber) pressure measured by thebarometer specified in paragraph (c)(4)of this section at intervals not to exceed5 minutes.
(5) At the end of each test period,terminate the sample period (if notautomatically terminated by thesampler) and download all archivedinstrument data from the test sampler.
(g) Test results. For each of the twotest runs, examine the chamber pressuremeasurements. Verify that the pressuremet the requirements specified inparagraph (f) of this section at all times
during the test. If not, the test run is notvalid and must be repeated. Determinethe test results as follows:
(1) Mean sample flow rate. (i) Fromthe certified measurements (Qref) of thetest sampler flow rate, tabulate eachflow rate measurement in units of L/min. If ambient temperature andpressure corrections are necessary tocalculate volumetric flow rate, eachmeasured flow rate shall be correctedusing its corresponding temperature andpressure measurement values. Calculatethe mean flow rate for the sample period(Qref,ave) as follows:
Equation 17
Q
Q
nref ave
ref ii
n
,
,
= =∑
1
where:n equals the number of discrete certified flowmeasurements over the 6–hour test period.
(ii)(A) Calculate the percent differencebetween this mean flow rate value andthe design value of 16.67 L/min, asfollows:
Equation 18
%., Differenc
16.67 e
Qx 100%ref ave = − 16 67
(B) To successfully pass this test, thepercent difference calculated inEquation 18 of this paragraph (g)(1)must be within ±5 percent for each testrun.
(2) Sample flow rate regulation. (i)From the certified measurements of thetest sampler flow rate, calculate thesample coefficient of variation of thediscrete measurements as follows:
Equation 19
%,
, ,
CVQ
x
Qn
Q
nx ref
ref ave
ref i ref ii
n
i
n
=−
−−=∑∑
1
1
1100%
2
1
2
1
(ii) To successfully pass this test, thecalculated coefficient of variation for thecertified flow rates must not exceed 2percent.
(3) Flow rate measurement accuracy.(i) Using the mean volumetric flow ratereported by the candidate test samplerat the completion of each 6–hour test(Qind,ave), determine the accuracy of thereported mean flow rate as:
Equation 20
%| |, ,
,
DifferenceQ Q
Qx ind ave ref ave
ref ave
=−
100%
(ii) To successfully pass this test, thepercent difference calculated inEquation 20 of this paragraph (g)(3)shall not exceed 2 percent for each testrun.
(4) Flow rate CV measurementaccuracy. (i) Using the flow ratecoefficient of variation indicated by thecandidate test sampler at the completionof the 6–hour test (%CVind), determinethe accuracy of the reported coefficientof variation as:
Equation 21
Difference CV CVind ref =|% % % |( ) −
(ii) To successfully pass this test, theabsolute difference in values calculatedin Equation 21 of this paragraph (g)(4)must not exceed 0.3 (CV%) for each testrun.
(5) Ambient pressure measurementaccuracy. (i) Calculate the absolutedifference between the mean ambientair pressure indicated by the testsampler and the ambient (chamber) airpressure measured with the referencebarometer as:
Equation 22
P Pdiff ind ave ref ave = P | |, ,−

38808 Federal Register / Vol. 62, No. 138 / Friday, July 18, 1997 / Rules and Regulations
where:Pind,ave = mean ambient pressure indicated bythe test sampler, mm Hg; andPref,ave = mean barometric pressure measuredby the reference barometer, mm Hg.
(ii) The calculated pressure differencemust be less than 10 mm Hg for eachtest run to pass the test.
(6) Sampler functionality. To pass thesampler functionality test, the followingtwo conditions must both be met foreach test run:
(i) The sampler must not shut downduring any part of the 6–hour tests; and
(ii) An inspection of the downloadeddata from the test sampler verifies thatall the data are consistent with normaloperation of the sampler.
§ 53.57 Test for filter temperature controlduring sampling and post-samplingperiods.
(a) Overview. This test is intended tomeasure the candidate sampler’s abilityto prevent excessive overheating of thePM2.5 sample collection filter (or filters)under conditions of elevated solarinsolation. The test evaluates radiativeeffects on filter temperature during a 4–hour period of active sampling as wellas during a subsequent 4–hour non-sampling time period prior to filterretrieval. Tests shall be conducted in anenvironmental chamber which providesthe proper radiant wavelengths andenergies to adequately simulate thesun’s radiant effects under clearconditions at sea level. For additionalguidance on conducting solar radiativetests under controlled conditions,consult military standard specification810-E (Reference 6 in Appendix A ofthis subpart). The performanceparameters tested under this procedure,the corresponding minimumperformance specifications, and theapplicable test conditions aresummarized in Table E-1 of this subpart.Each performance parameter tested, asdescribed or determined in the testprocedure, must meet or exceed theassociated performance specification tosuccessfully pass this test.
(b) Technical definition. Filtertemperature control during sampling isthe ability of a sampler to maintain thetemperature of the particulate mattersample filter within the specifieddeviation (5 °C) from ambienttemperature during any active samplingperiod. Post-sampling temperaturecontrol is the ability of a sampler tomaintain the temperature of theparticulate matter sample filter withinthe specified deviation from ambienttemperature during the period from theend of active sample collection of thePM2.5 sample by the sampler until the
filter is retrieved from the sampler forlaboratory analysis.
(c) Required test equipment. (1)Environmental chamber providing themeans, such as a bank of solar-spectrumlamps, for generating or simulatingthermal radiation in approximatespectral content and intensityequivalent to solar insolation of 1000 ±50 W/m2 inside the environmentalchamber. To properly simulate the sun’sradiative effects on the sampler, thesolar bank must provide the spectralenergy distribution and permittedtolerances specified in Table E-2 of thissubpart. The solar radiation source areashall be such that the width of thecandidate sampler shall not exceed one-half the dimensions of the solar bank.The solar bank shall be located aminimum of 76 cm (30 inches) from anysurface of the candidate sampler. Tomeet requirements of the solar radiationtests, the chamber’s internal volumeshall be a minimum of 10 times that ofthe volume of the candidate sampler.Air velocity in the region of the samplermust be maintained continuouslyduring the radiative tests at 2.0 ± 0.5 m/sec.
(2) Ambient air temperature recorder,range -30 °C to +50 °C, with a resolutionof 0.1 °C and certified accurate to within0.5 °C. Ambient air temperaturemeasurements must be made usingcontinuous (analog) recording capabilityor digital recording at intervals not toexceed 5 minutes.
(3) Flow measurement adaptor (40CFR part 50, Appendix L, Figure L-30)or equivalent adaptor to facilitatemeasurement of sampler flow rate at thesampler downtube.
(4) Miniature temperature sensor(s),capable of being installed in the samplerwithout introducing air leakage andcapable of measuring the sample airtemperature within 1 cm of the centerof the filter, downstream of the filter;with a resolution of 0.1 °C, certifiedaccurate to within 0.5 °C, NIST-traceable, with continuous (analog)recording capability or digital recordingat intervals of not more than 5 minutes.
(5) Solar radiometer, to measure theintensity of the simulated solarradiation in the test environment, rangeof 0 to approximately 1500 W/m2.Optional capability for continuous(analog) recording or digital recording atintervals not to exceed 5 minutes isrecommended.
(6) Sample filter or filters, as specifiedin section 6 of 40 CFR part 50,Appendix L.
(d) Calibration of test measurementinstruments. Submit documentationshowing evidence of appropriatelyrecent calibration, certification of
calibration accuracy, and NIST-traceability (if required) of allmeasurement instruments used in thetests. The accuracy of flow rate metersshall be verified at the highest andlowest pressures and temperatures usedin the tests and shall be checked at zeroand at least one flow rate within ±3percent of 16.7 L/min within 7 daysprior to use for this test. Where aninstrument’s measurements are to berecorded with an analog recordingdevice, the accuracy of the entireinstrument-recorder system shall becalibrated or verified.
(e) Test setup. (1) Setup of thesampler shall be performed as requiredin this paragraph (e) and otherwise asdescribed in the sampler’s operation orinstruction manual referred to in§ 53.4(b)(3). The sampler shall beinstalled upright and set up in the solarradiation environmental chamber in itsnormal configuration for collectingPM2.5 samples (with the inlet installed).The sampler’s ambient and filtertemperature measurement systems shallbe calibrated per the sampler’s operatingmanual within 7 days prior to this test.A sample filter shall be installed for theduration of this test. For sequentialsamplers, a sample filter shall also beinstalled in each available sequentialchannel or station intended forcollection of a sequential sample (or atleast 5 additional filters for magazine-type sequential samplers) as directed bythe sampler’s operation or instructionmanual.
(2) The miniature temperature sensorshall be temporarily installed in the testsampler such that it accurately measuresthe air temperature 1 cm from the centerof the filter on the downstream side ofthe filter. The sensor shall be installedsuch that no external or internal airleakage is created by the sensorinstallation. The sensor’s dimensionsand installation shall be selected tominimize temperature measurementuncertainties due to thermal conductionalong the sensor mounting structure orsensor conductors. For sequentialsamplers, similar temperature sensorsshall also be temporarily installed in thetest sampler to monitor the temperature1 cm from the center of each filter storedin the sampler for sequential sampleoperation.
(3) The solar radiant energy sourceshall be installed in the test chambersuch that the entire test sampler isirradiated in a manner similar to theway it would be irradiated by solarradiation if it were located outdoors inan open area on a sunny day, with theradiation arriving at an angle of between30° and 45° from vertical. The intensityof the radiation received by all sampler

38809Federal Register / Vol. 62, No. 138 / Friday, July 18, 1997 / Rules and Regulations
surfaces that receive direct radiationshall average 1000 ± 50 W/m2, measuredin a plane perpendicular to the incidentradiation. The incident radiation shallbe oriented with respect to the samplersuch that the area of the sampler’sambient temperature sensor (ortemperature shield) receives full, directradiation as it would or could duringnormal outdoor installation. Also, thetemperature sensor must not be shieldedor shaded from the radiation by asampler part in a way that would notoccur at other normal insolation anglesor directions.
(4) The solar radiometer shall beinstalled in a location where it measuresthermal radiation that is generallyrepresentative of the average thermalradiation intensity that the upperportion of the sampler and sampler inletreceive. The solar radiometer shall beoriented so that it measures theradiation in a plane perpendicular to itsangle of incidence.
(5) The ambient air temperaturerecorder shall be installed in the testchamber such that it will accuratelymeasure the temperature of the air inthe chamber without being undulyaffected by the chamber’s airtemperature control system or by theradiant energy from the solar radiationsource that may be present inside thetest chamber.
(f) Procedure. (1) Set up the sampleras specified in paragraph (e) of thissection and otherwise prepare thesampler for normal sample collectionoperation as directed in the sampler’soperation or instruction manual.
(2) Remove the inlet of the candidatetest sampler and install the flowmeasurement adaptor on the sampler’sdowntube. Conduct a leak check asdescribed in the sampler’s operation orinstruction manual. The leak test mustbe properly passed before other tests arecarried out.
(3) Remove the flow measurementadaptor from the downtube and re-install the sampling inlet.
(4) Activate the solar radiation sourceand verify that the resulting energydistribution prescribed in Table E-2 ofthis subpart is achieved.
(5) Program the test sampler toconduct a single sampling run of 4continuous hours. During the 4-hoursampling run, measure and record theradiant flux, ambient temperature, andfilter temperature (all filter temperaturesfor sequential samplers) at intervals notto exceed 5 minutes.
(6) At the completion of the 4–hoursampling phase, terminate the sampleperiod, if not terminated automaticallyby the sampler. Continue to measureand record the radiant flux, ambient
temperature, and filter temperature ortemperatures for 4 additional hours atintervals not to exceed 5 minutes. At thecompletion of the 4–hour post-samplingperiod, discontinue the measurementsand turn off the solar source.
(7) Download all archived samplerdata from the test run.
(g) Test results. Chamber temperaturecontrol. Examine the continuous recordof the chamber radiant flux and verifythat the flux met the requirementsspecified in Table E-2 of this subpart atall times during the test. If not, theentire test is not valid and must berepeated.
(1) Filter temperature measurementaccuracy. (i) For each 4–hour testperiod, calculate the absolute value ofthe difference between the mean filtertemperature indicated by the sampler(active filter) and the mean filtertemperature measured by the referencetemperature sensor installed within 1cm downstream of the (active) filter as:
Equation 23
T Tdiff filter ind filter ref filter, , ,| | = T −where:Tind,filter = mean filter temperature indicatedby the test sampler, °C; andTref,filter = mean filter temperature measuredby the reference temperature sensor, °C.
(ii) To successfully pass the indicatedfilter temperature accuracy test, thecalculated difference between themeasured means (Tdiff,filter) must notexceed 2 °C for each 4-hour test period.
(2) Ambient temperaturemeasurement accuracy. (i) For each 4-hour test period, calculate the absolutevalue of the difference between themean ambient air temperature indicatedby the test sampler and the meanambient air temperature measured bythe reference ambient air temperaturerecorder as:
Equation 24
T Tdiff ambient ind ambient ref ambient, , ,| |= T −where:Tind,ambient = mean ambient air temperatureindicated by the test sampler, °C; andTref,ambient = mean ambient air temperaturemeasured by the reference ambient airtemperature recorder, °C.
(ii) To successfully pass the indicatedambient temperature accuracy test, thecalculated difference between themeasured means (Tdiff,ambient) must notexceed 2 °C for each 4-hour test period.
(3) Filter temperature controlaccuracy. (i) For each temperaturemeasurement interval over each 4–hourtest period, calculate the differencebetween the filter temperature indicatedby the reference temperature sensor and
the ambient temperature indicated bythe test sampler as:
Equation 25
T Tdiff ref filter ind ambient = - T , ,
(ii) Tabulate and inspect thecalculated differences as a function oftime. To successfully pass the indicatedfilter temperature control test, thecalculated difference between themeasured values must not exceed 5 °Cfor any consecutive intervals coveringmore than a 30–minute time period.
(iii) For sequential samplers, repeatthe test calculations for each of thestored sequential sample filters. Allstored filters must also meet the 5 °Ctemperature control test.
§ 53.58 Operational field precision andblank test.
(a) Overview. This test is intended todetermine the operational precision ofthe candidate sampler during aminimum of 10 days of field operation,using three collocated test samplers.Measurements of PM2.5 are made at atest site with all of the samplers andthen compared to determine replicateprecision. Candidate sequentialsamplers are also subject to a test forpossible deposition of particulate matteron inactive filters during a period ofstorage in the sampler. This procedureis applicable to both reference andequivalent methods. In the case ofequivalent methods, this test may becombined and conducted concurrentlywith the comparability test forequivalent methods (described insubpart C of this part), using threereference method samplers collocatedwith three candidate equivalent methodsamplers and meeting the applicablesite and other requirements of subpart Cof this part.
(b) Technical definition. (1) Fieldprecision is defined as the standarddeviation or relative standard deviationof a set of PM2.5 measurements obtainedconcurrently with three or morecollocated samplers in actual ambientair field operation.
(2) Storage deposition is defined asthe mass of material inadvertentlydeposited on a sample filter that isstored in a sequential sampler eitherprior to or subsequent to the activesample collection period.
(c) Test site. Any outdoor test sitehaving PM2.5 concentrations that arereasonably uniform over the test areaand that meet the minimum levelrequirement of paragraph (g)(2) of thissection is acceptable for this test.
(d) Required facilities and equipment.(1) An appropriate test site and suitable

38810 Federal Register / Vol. 62, No. 138 / Friday, July 18, 1997 / Rules and Regulations
electrical power to accommodate threetest samplers are required.
(2) Teflon sample filters, as specifiedin section 6 of 40 CFR part 50,Appendix L, conditioned andpreweighed as required by section 8 of40 CFR part 50, Appendix L, as neededfor the test samples.
(e) Test setup. (1) Three identical testsamplers shall be installed at the testsite in their normal configuration forcollecting PM2.5 samples in accordancewith the instructions in the associatedmanual referred to in § 53.4(b)(3) andshould be in accordance with applicablesupplemental guidance provided inReference 3 in Appendix A of thissubpart. The test samplers’ inletopenings shall be located at the sameheight above ground and between 2 and4 meters apart horizontally. Thesamplers shall be arranged or orientedin a manner that will minimize thespatial and wind directional effects onsample collection of one sampler on anyother sampler.
(2) Each test sampler shall besuccessfully leak checked, calibrated,and set up for normal operation inaccordance with the instruction manualand with any applicable supplementalguidance provided in Reference 3 inAppendix A of this subpart.
(f) Test procedure. (1) Install aconditioned, preweighed filter in eachtest sampler and otherwise prepare eachsampler for normal sample collection.Set identical sample collection start andstop times for each sampler. Forsequential samplers, install aconditioned, preweighed specified filterin each available channel or stationintended for automatic sequentialsample filter collection (or at least 5additional filters for magazine-typesequential samplers), as directed by thesampler’s operation or instructionmanual. Since the inactive sequentialchannels are used for the storagedeposition part of the test, they may notbe used to collect the active PM2.5 testsamples.
(2) Collect either a 24–hour or a 48–hour atmospheric PM2.5 samplesimultaneously with each of the threetest samplers.
(3) Following sample collection,retrieve the collected sample from eachsampler. For sequential samplers,retrieve the additional stored (blank,unsampled) filters after at least 5 days(120 hours) storage in the sampler if theactive samples are 24–hour samples, orafter at least 10 days (240 hours) if theactive samples are 48–hour samples.
(4) Determine the measured PM2.5
mass concentration for each sample inaccordance with the applicableprocedures prescribed for the candidate
method in Appendix L, 40 CFR part 50of this chapter, in the associated manualreferred to in § 53.4(b)(3) and inaccordance with supplemental guidancein Reference 2 in Appendix A of thissubpart. For sequential samplers, alsosimilarly determine the storagedeposition as the net weight gain ofeach blank, unsampled filter after the 5–day (or 10–day) period of storage in thesampler.
(5) Repeat this procedure to obtain atotal of 10 sets of any combination of24–hour or 48–hour PM2.5
measurements over 10 test periods. Forsequential samplers, repeat the 5–day(or 10–day) storage test of additionalblank filters once for a total of two setsof blank filters.
(g) Calculations. (1) Record the PM2.5
concentration for each test sampler foreach test period as Ci,j, where i is thesampler number (i=1,2,3) and j is thetest period (j=1,2, . . . 10).
(2)(i) For each test period, calculateand record the average of the threemeasured PM2.5 concentrations as Cj
where j is the test period:
Equation 26
C x Cave j i ji
, ,==∑1
3 1
3
(ii) If Cave,j < 10 ©g/m3 for any testperiod, data from that test period areunacceptable, and an additional samplecollection set must be obtained toreplace the unacceptable data.
(3)(i) Calculate and record theprecision for each of the 10 test days as:
Equation 27
P
C C
j
i j i jii=
−
==∑∑ , ,
2
1
3 2
1
3 13
2
(ii) If Cave,j is below 40 ©g/m3 for 24–hour measurements or below 30 ©g/m3
for 48–hour measurements; or
Equation 28
RP
C C
j
i j i jii=
−
==∑∑
100%
13
2
2
1
3 2
1
3
x 1
Cave, j
, ,
(iii) If Cave,j is above 40 ©g/m3 for 24-hour measurements or above 30 ©g/m3
for 48-hour measurements.
(h) Test results. (1) The candidatemethod passes the precision test if all 10Pj or RPj values meet the specificationsin Table E-1 of this subpart.
(2) The candidate sequential samplerpasses the blank filter storage depositiontest if the average net storage deposition
weight gain of each set of blank filters(total of the net weight gain of eachblank filter divided by the number offilters in the set) from each test sampler(six sets in all) is less than 50 ©g.
§ 53.59 Aerosol transport test for Class Iequivalent method samplers.
(a) Overview. This test is intended toverify adequate aerosol transportthrough any modified or air flowsplitting components that may be usedin a Class I candidate equivalent methodsampler such as may be necessary toachieve sequential sampling capability.This test is applicable to all Class Icandidate samplers in which the aerosolflow path (the flow path through whichsample air passes upstream of samplecollection filter) differs from thatspecified for reference method samplersas specified in 40 CFR part 50,Appendix L. The test requirements andperformance specifications for this testare summarized in Table E-1 of thissubpart.
(b) Technical definitions. (1) Aerosoltransport is the percentage of alaboratory challenge aerosol whichpenetrates to the active sample filter ofthe candidate equivalent methodsampler.
(2) The active sample filter is theexclusive filter through which sampleair is flowing during performance of thistest.
(3) A no-flow filter is a sample filterthrough which no sample air isintended to flow during performance ofthis test.
(4) A channel is any of two or moreflow paths that the aerosol may take,only one of which may be active at atime.
(5) An added component is anyphysical part of the sampler which isdifferent in some way from thatspecified for a reference methodsampler in 40 CFR part 50, Appendix L,such as a device or means to allow orcause the aerosol to be routed to one ofseveral channels.
(c) Required facilities and testequipment. (1) Aerosol generationsystem, as specified in § 53.62(c)(2).
(2) Aerosol delivery system, asspecified in § 53.64(c)(2).
(3) Particle size verificationequipment, as specified in § 53.62(c)(3).
(4) Fluorometer, as specified in§ 53.62(c)(7).
(5) Candidate test sampler, with theinlet and impactor or impactorsremoved, and with all internal surfacesof added components electroless nickelcoated as specified in § 53.64(d)(2).
(6) Filters that are appropriate for usewith fluorometric methods (e.g., glassfiber).

38811Federal Register / Vol. 62, No. 138 / Friday, July 18, 1997 / Rules and Regulations
(d) Calibration of test measurementinstruments. Submit documentationshowing evidence of appropriatelyrecent calibration, certification ofcalibration accuracy, and NIST-traceability (if required) of allmeasurement instruments used in thetests. The accuracy of flow rate metersshall be verified at the highest andlowest pressures and temperatures usedin the tests and shall be checked at zeroand at least one flow rate within ±3percent of 16.7 L/min within 7 daysprior to use for this test. Where aninstrument’s measurements are to berecorded with an analog recordingdevice, the accuracy of the entireinstrument-recorder system shall becalibrated or verified.
(e) Test setup. (1) The candidate testsampler shall have its inlet andimpactor or impactors removed. Thelower end of the down tube shall bereconnected to the filter holder, usingan extension of the downtube, ifnecessary. If the candidate sampler hasa separate impactor for each channel,then for this test, the filter holderassemblies must be connected to thephysical location on the sampler wherethe impactors would normally connect.
(2) The test particle delivery systemshall be connected to the sampler
downtube so that the test aerosol isintroduced at the top of the downtube.
(f) Test procedure. (1) All surfaces ofthe added or modified component orcomponents which come in contactwith the aerosol flow shall bethoroughly washed with 0.01 N NaOHand then dried.
(2) Generate aerosol. (i) Generateaerosol composed of oleic acid with auranine fluorometric tag of 3 ± 0.25 ©maerodynamic diameter using a vibratingorifice aerosol generator according toconventions specified in § 53.61(g).
(ii) Check for the presence of satellitesand adjust the generator to minimizetheir production.
(iii) Calculate the aerodynamicparticle size using the operatingparameters of the vibrating orificeaerosol generator. The calculatedaerodynamic diameter must be 3 ± 0.25©m aerodynamic diameter.
(3) Verify the particle size accordingto procedures specified in§ 53.62(d)(4)(i).
(4) Collect particles on filters for atime period such that the relative errorof the resulting measured fluorometricconcentration for the active filter is lessthan 5 percent.
(5) Determine the quantity of materialcollected on the active filter using acalibrated fluorometer. Record the mass
of fluorometric material for the activefilter as Mactive (i) where i = the activechannel number.
(6) Determine the quantity of materialcollected on each no-flow filter using acalibrated fluorometer. Record the massof fluorometric material on each no-flowfilter as Mno-flow.
(7) Using 0.01 N NaOH, wash thesurfaces of the added component orcomponents which contact the aerosolflow. Determine the quantity of materialcollected using a calibrated fluorometer.Record the mass of fluorometricmaterial collected in the wash as Mwash.
(8) Calculate the aerosol transport as:
Equation 29
TM
M Mx i
active
active wash( ) =
+ +∑Mno-flow
100%
where:i = the active channel number.
(9) Repeat paragraphs (f)(1) through(8) of this section for each channel,making each channel in turn theexclusive active channel.
(g) Test results. The candidate Class Isampler passes the aerosol transport testif T(i) is at least 97 percent for eachchannel.
Tables to Subpart E of Part 53
Table E-1.—Summary of Test Requirements for Reference and Class I Equivalent Methods for PM2.5
Subpart E Procedure Performance Test Performance Specification Test ConditionsPart 50, Ap-
pendix L Ref-erence
§ 53.52 Sampler leak checktest
Sampler leak check facility External leakage: 80 mL/min,max
Internal leakage: 80 mL/min,max
Controlled leak flow rate of 80mL/min
Sec. 7.4.6
§ 53.53 Base flow rate test Sample flow rate:1. Mean2. Regulation3. Meas. accuracy4. CV accuracy5. Cut-off
1. 16.67 ± 5%, L/min2. 2%, max3. 2%, max4. 0.3%, max5. Flow rate cut-off if flow rate
deviates more than 10%from design flow rate for>60 ± 30 seconds
(a) 6-hour normal operationaltest plus flow rate cut-offtest
(b) Nominal conditions(c) Additional 55 mm Hg
pressure drop to simulateloaded filter
(d) Variable flow restrictionused for cut-off test
Sec. 7.4.1Sec. 7.4.2Sec. 7.4.3Sec. 7.4.4Sec. 7.4.5
§ 53.54 Power interruption test Sample flow rate:1. Mean2. Regulation3. Meas. accuracy4. CV accuracy5. Occurrence time of power
interruptions6. Elapsed sample time7. Sample volume
1. 16.67 ± 5%, L/min2. 2%, max3. 2%, max4. 0.3%, max5. ±2 min if >60 seconds6. ±20 seconds7. ±2%, max
(a) 6-hour normal operationaltest
(b) Nominal conditions(c) Additional 55 mm Hg
pressure drop to simulateloaded filter
(d) 6 power interruptions ofvarious durations
Sec. 7.4.1Sec. 7.4.2Sec. 7.4.3Sec. 7.4.5Sec. 7.4.12Sec. 7.4.13Sec. 7.4.15.4Sec. 7.4.15.5

38812 Federal Register / Vol. 62, No. 138 / Friday, July 18, 1997 / Rules and Regulations
Table E-1.—Summary of Test Requirements for Reference and Class I Equivalent Methods for PM2.5—Continued
Subpart E Procedure Performance Test Performance Specification Test ConditionsPart 50, Ap-
pendix L Ref-erence
§ 53.55 Temperature and linevoltage effect test
Sample flow rate:1. Mean2. Regulation3. Meas. accuracy4. CV accuracy5. Temperature meas. accu-
racy6. Proper operation
1. 16.67 ± 5%, L/min2. 2 %, max3. 2 %, max4. 0.3 %, max5. 2 °C
(a) 6-hour normal operationaltest
(b) Nominal conditions(c) Additional 55 mm Hg
pressure drop to simulateloaded filter
(d) Ambient temperature at-20 and +40 °C
(e) Line voltage: 105 Vac to125 Vac
Sec. 7.4.1Sec. 7.4.2Sec. 7.4.3Sec. 7.4.5Sec. 7.4.8Sec. 7.4.15.1
§ 53.56 Barometric pressureeffect test
Sample flow rate:1. Mean2. Regulation3. Meas. accuracy4. CV accuracy5. Pressure meas. accuracy6. Proper operation
1. 16.67 ± 5%, L/min2. 2%, max3. 2%, max4. 0.3%, max5. 10 mm Hg
(a) 6-hour normal operationaltest
(b) Nominal conditions(c) Additional 55 mm Hg
pressure drop to simulateloaded filter
(d) Barometric pressure at600 and 800 mm Hg.
Sec. 7.4.1Sec. 7.4.2Sec. 7.4.3Sec. 7.4.5Sec. 7.4.9
§ 53.57 Filter temperaturecontrol test
1. Filter temp meas. accuracy2. Ambient temp. meas. accu-
racy3. Filter temp control accu-
racy, sampling and non-sampling
1. 2 °C2. 2 °C3. Not more than 5 °C above
ambient temp. for morethan 30 min
(a) 4-hour simulated solar ra-diation, sampling
(b) 4-hour simulated solar ra-diation, non-sampling
(c) Solar flux of 1000 W/m2
Sec. 7.4.8Sec. 7.4.10Sec. 7.4.11
§ 53.58 Field precision test 1. Measurement precision2. Storage deposition test for
sequential samplers
1. Pj <2 ©g/m3 for conc. <40©g/m3 (24-hr) or <30 ©g/m3
(48-hr); orRPj < 5% for conc. >40 ©g/
m3 (24-hr) or >30 ©g/m3(48-hr)
2. 50 ©g, max weight gain
(a) 3 collocated samplers at 1site for at least 10 days
(b) PM2.5 conc.≤10 ©g/m3
(c) 24- or 48-hour samples(d) 5- or 10-day storage pe-
riod for inactive stored fil-ters
Sec. 5.1Sec. 7.3.5Sec. 8Sec. 9Sec. 10
The Following Requirement is Applicable to Candidate Equivalent Methods Only
§ 53.59 Aerosol transport test Aerosol transport 97%, min, for all channels Determine aerosol transportthrough any new or modi-fied components with re-spect to the referencemethod sampler before thefilter for each channel.
TABLE E-2.—SPECTRAL ENERGY DISTRIBUTION AND PERMITTED TOLERANCE FOR CONDUCTING RADIATIVE TESTS
ChacteristicSpectral Region
Ultraviolet Visible Infrared
Bandwidth (©m) 0.28 to 0.32 10.32 to 0.40 0.40 to 0.78 0.78 to 3.00Irradiance (W/m2) 5 56 450 to 550 439Allowed Tolerance 2± 35% 2± 25% 2± 10% 2± 10%

38813Federal Register / Vol. 62, No. 138 / Friday, July 18, 1997 / Rules and Regulations
Figures to Subpart E of Part 53
Figure E-1.—Designation Testing Checklist
DESIGNATION TESTING CHECKLIST
llllllllll llllllllll llllllllll
Auditee Auditor signature Date
Compliance Status: Y = Yes N = No NA = Not applicable/Not available
Verification Comments (Includes documentation ofwho, what, where, when, why) (Doc. #, Rev. #,
Rev. Date)Verification Verified by Direct Observation of Process or of
Documented Evidence: Performance, Design orApplication Spec. Corresponding to Sections of 40
CFR Part 53 or 40 CFR Part 50, Appendix LY N NA
Performance Specification TestsSample flow rate coefficient of variation (§ 53.53)
(L 7.4.3)
Filter temperature control (sampling) (§ 53.57) (L7.4.10)
Elapsed sample time accuracy (§ 53.54) (L 7.4.13)
Filter temperature control (post sampling) (§ 53.57)(L 7.4.10)
Application Specification Tests
Field Precision (§ 53.58) (L 5.1)
Meets all Appendix L requirements (part 53, sub-part A, § 53.2(a)(3)) (part 53, subpart E,§ 53.51(a),(d))
Filter Weighing (L-8)
Field Sampling Procedure (§ 53.30, .31, .34)
Design Specification Tests
Filter ( L-6)
Range of Operational Conditions (L-7.4.7)
The Following Requirements Apply Only to Class I Candidate Equivalent Methods
Aerosol Transport (§ 53.59)

38814 Federal Register / Vol. 62, No. 138 / Friday, July 18, 1997 / Rules and Regulations
Figure E-2.—Product Manufacturing Checklist
PRODUCT MANUFACTURING CHECKLIST
llllllllll llllllllll llllllllll
Auditee Auditor signature Date
Compliance Status: Y = Yes N = No NA = Not applicable/Not available
Verification Comments (Includes documentation ofwho, what, where, when, why) (Doc. #, Rev. #,
Rev. Date)Verification Verified by Direct Observation of Process or of
Documented Evidence: Performance, Design orApplication Spec. Corresponding to Sections of 40
CFR Part 53 or 40 CFR Part 50, Appendix LY N NA
Performance Specification Tests
Assembled operational performance (Burn-intest) (§ 53.53)
Sample flow rate (§ 53.53) (L 7.4.1, L 7.4.2)
Sample flow rate regulation (§ 53.53) (L 7.4.3)
Flow rate and average flow rate measurementaccuracy (§ 53.53) (L 7.4.5)
Ambient air temperature measurement accuracy(§ 53.55) (L 7.4.8)
Ambient barometric pressure measurement ac-curacy (§ 53.56) (L 7.4.9)
Sample flow rate cut-off (§ 53.53) (L 7.4.4)
Sampler leak check facility (§ 53.52) (L 7.4.6)
Application Specification Tests
Flow rate calibration transfer standard (L-9.2)
Operational /Instructional manual (L-7.4.18)
Design Specification Tests
Impactor (jet width) (§ 53.51(d)(1)) (L-7.3.4.1)
Surface finish (§ 53.51( d)(2)) (L-7.3.7)
Appendix A to Subpart E of Part 53--References
(1) Quality systems--Model for qualityassurance in design, development,production, installation and servicing, ISO9001. July 1994. Available from AmericanSociety for Quality Control, 611 EastWisconsin Avenue, Milwaukee, WI 53202.
(2) American National Standard--Specifications and Guidelines for QualitySystems for Environmental Data Collectionand Environmental Technology Programs.ANSI/ASQC E4-1994. January 1995.Available from American Society for QualityControl, 611 East Wisconsin Avenue,Milwaukee, WI 53202.
(3) Copies of section 2.12 of the QualityAssurance Handbook for Air PollutionMeasurement Systems, Volume II, AmbientAir Specific Methods, EPA/600/R-94/038b,are available from Department E (MD-77B),U.S. EPA, Research Triangle Park, NC 27711.
(4) Military standard specification (mil.spec.) 8625F, Type II, Class 1 as listed in
Department of Defense Index ofSpecifications and Standards (DODISS),available from DODSSP-Customer Service,Standardization Documents Order Desk, 700Robbins Avenue, Building 4D, Philadelphia,PA 1911-5094.
(5) Quality Assurance Handbook for AirPollution Measurement Systems, Volume IV:Meteorological Measurements. RevisedMarch, 1995. EPA-600/R-94-038d. Availablefrom U.S. EPA, ORD Publications Office,Center for Environmental ResearchInformation (CERI), 26 West Martin LutherKing Drive, Cincinnati, Ohio 45268-1072(513-569-7562).
(6) Military standard specification(mil. spec.) 810-E as listed inDepartment of Defense Index ofSpecifications and Standards (DODISS),available from DODSSP-CustomerService, Standardization DocumentsOrder Desk, 700 Robbins Avenue,Building 4D, Philadelphia, PA 1911-5094.
e. Subpart F is added to read asfollows:
Subpart F—Procedures for TestingPerformance Characteristics of Class IIEquivalent Methods for PM2.5
Sec.
53.60 General provisions.53.61 Test conditions for PM2.5 referencemethod equivalency.53.62 Test procedure: Full wind tunnel test.53.63 Test procedure: Wind tunnel inletaspiration test.53.64 Test procedure: Static fractionatortest.53.65 Test procedure: Loading test.53.66 Test procedure: Volatility test.
Tables to Subpart F of Part 53
Table F-1—Performance Specifications forPM2.5 Class II Equivalent SamplersTable F-2—Particle Sizes and Wind Speedsfor Full Wind Tunnel Test, Wind Tunnel

38815Federal Register / Vol. 62, No. 138 / Friday, July 18, 1997 / Rules and Regulations
Inlet Aspiration Test, and Static ChamberTestTable F-3—Critical Parameters of IdealizedAmbient Particle Size DistributionsTable F-4—Estimated Mass ConcentrationMeasurement of PM2.5 for Idealized CoarseAerosol Size DistributionTable F-5—Estimated Mass ConcentrationMeasurement of PM2.5 for Idealized‘‘Typical’’ Coarse Aerosol Size DistributionTable F-6 Estimated Mass ConcentrationMeasurement of PM2.5 for Idealized FineAerosol Size Distribution
Figures to Subpart F of Part 53
Figure F-1—Designation Testing Checklist
Appendix A to Subpart F of Part 53—References
Subpart F—Procedures for TestingPerformance Characteristics of Class IIEquivalent Methods for PM2.5
§ 53.60 General provisions.
(a) This subpart sets forth the specificrequirements that a PM2.5 samplerassociated with a candidate Class IIequivalent method must meet to bedesignated as an equivalent method forPM2.5. This subpart also sets forth theexplicit test procedures that must becarried out and the test results,evidence, documentation, and othermaterials that must be provided to EPAto demonstrate that a sampler meets allspecified requirements for designationas an equivalent method.
(b) A candidate method described inan application for a reference orequivalent method applicationsubmitted under § 53.4 shall bedetermined by the EPA to be a Class IIcandidate equivalent method on thebasis of the definition of a Class IIequivalent method given in § 53.1.
(c) Any sampler associated with aClass II candidate equivalent method(Class II sampler) must meet allrequirements for reference methodsamplers and Class I equivalent methodsamplers specified in subpart E of thispart, as appropriate. In addition, a ClassII sampler must meet the additionalrequirements as specified in paragraph(d) of this section.
(d) Except as provided in paragraphs(d)(1), (2), and (3) of this section, allClass II samplers are subject to theadditional tests and performancerequirements specified in § 53.62 (fullwind tunnel test), § 53.65 (loading test),and § 53.66 (volatility test). Alternativetests and performance requirements, asdescribed in paragraphs (d)(1), (2), and(3) of this section, are optionallyavailable for certain Class II samplerswhich meet the requirements forreference method or Class I samplersgiven in 40 CFR part 50, Appendix L,and in subpart E of this part, except for
specific deviations of the inlet,fractionator, or filter.
(1) Inlet deviation. A sampler whichhas been determined to be a Class IIsampler solely because the design orconstruction of its inlet deviates fromthe design or construction of the inletspecified in 40 CFR part 50, AppendixL, for reference method samplers shallnot be subject to the requirements of§ 53.62 (full wind tunnel test), providedthat it meets all requirements of § 53.63(wind tunnel inlet aspiration test),§ 53.65 (loading test), and § 53.66(volatility test).
(2) Fractionator deviation. A samplerwhich has been determined to be a ClassII sampler solely because the design orconstruction of its particle sizefractionator deviates from the design orconstruction of the particle sizefractionator specified in 40 CFR part 50,Appendix L for reference methodsamplers shall not be subject to therequirements of § 53.62 (full windtunnel test), provided that it meets allrequirements of § 53.64 (staticfractionator test), § 53.65 (loading test),and § 53.66 (volatility test).
(3) Filter size deviation. A samplerwhich has been determined to be a ClassII sampler solely because its effectivefiltration area deviates from that of thereference method filter specified in 40CFR part 50, Appendix L, for referencemethod samplers shall not be subject tothe requirements of § 53.62 (full windtunnel test) nor § 53.65 (loading test),provided it meets all requirements of§ 53.66 (volatility test).
(e) The test specifications andacceptance criteria for each test aresummarized in Table F-1 of thissubpart. The candidate sampler mustdemonstrate performance that meets theacceptance criteria for each applicabletest to be designated as an equivalentmethod.
(f) Overview of various test proceduresfor Class II samplers—(1) Full windtunnel test. This test procedure isdesigned to ensure that the candidatesampler’s effectiveness (aspiration of anambient aerosol and penetration of thesub 2.5-micron fraction to its samplefilter) will be comparable to that of areference method sampler. Thecandidate sampler is challenged at windspeeds of 2 and 24 km/hr withmonodisperse aerosols of the sizespecified in Table F-2 of this subpart.The experimental test results are thenintegrated with three idealized ambientdistributions (typical, fine, and coarse)to yield the expected massconcentration measurement for each.The acceptance criteria are based on theresults of this numerical analysis and
the particle diameter for which thesampler effectiveness is 50 percent.
(2) Wind tunnel inlet aspiration test.The wind tunnel inlet aspiration testdirectly compares the inlet of thecandidate sampler to the inlet of areference method sampler with thesingle-sized, liquid, monodispersechallenge aerosol specified in Table F-2 of this subpart at wind speeds of 2km/hr and 24 km/hr. The acceptancecriteria, presented in Table F-1 of thissubpart, is based on the relativeaspiration between the candidate inletand the reference method inlet.
(3) Static fractionator test. The staticfractionator test determines theeffectiveness of the candidate sampler’s2.5-micron fractionator under staticconditions for aerosols of the sizespecified in Table F-2 of this subpart.The numerical analysis procedures andacceptance criteria are identical to thosein the full wind tunnel test.
(4) Loading test. The loading test isconducted to ensure that theperformance of a candidate sampler isnot significantly affected by the amountof particulate deposited on its interiorsurfaces between periodic cleanings.The candidate sampler is artificiallyloaded by sampling a test environmentcontaining aerosolized, standard testdust. The duration of the loading phaseis dependent on both the time betweencleaning as specified by the candidatemethod and the aerosol massconcentration in the test environment.After loading, the candidate’sperformance must then be evaluated by§ 53.62 (full wind tunnel evaluation),§ 53.64 (wind tunnel inlet aspirationtest), or § 53.64 (static fractionator test).If the results of the appropriate test meetthe criteria presented in Table F-1 ofthis subpart, then the candidate samplerpasses the loading test under thecondition that it be cleaned at least asoften as the cleaning frequencyproposed by the candidate method andthat has been demonstrated to beacceptable by this test.
(5) Volatility test. The volatility testchallenges the candidate sampler with apolydisperse, semi-volatile liquidaerosol. This aerosol is simultaneouslysampled by the candidate methodsampler and a reference method samplerfor a specified time period. Clean air isthen passed through the samplersduring a blow-off time period. Residualmass is then calculated as the weight ofthe filter after the blow-off phase issubtracted from the initial weight of thefilter. Acceptance criteria are based ona comparison of the residual massmeasured by the candidate sampler(corrected for flow rate variations fromthat of the reference method) to the

38816 Federal Register / Vol. 62, No. 138 / Friday, July 18, 1997 / Rules and Regulations
residual mass measured by the referencemethod sampler for several specifiedclean air sampling time periods.
(g) Test data. All test data and otherdocumentation obtained from orpertinent to these tests shall beidentified, dated, signed by the analystperforming the test, and submitted toEPA as part of the equivalent methodapplication. Schematic drawings of eachparticle delivery system and otherinformation showing completeprocedural details of the testatmosphere generation, verification, anddelivery techniques for each testperformed shall be submitted to EPA.All pertinent calculations shall beclearly presented. In addition,manufacturers are required to submit aspart of the application, a DesignationTesting Checklist (Figure F-1 of thissubpart) which has been completed andsigned by an ISO-certified auditor.
§ 53.61 Test conditions for PM2.5 referencemethod equivalency.
(a) Sampler surface preparation.Internal surfaces of the candidatesampler shall be cleaned and dried priorto performing any Class II sampler testin this subpart. The internal collectionsurfaces of the sampler shall then beprepared in strict accordance with theoperating instructions specified in thesampler’s operating manual referred toin section 7.4.18 of 40 CFR part 50,Appendix L.
(b) Sampler setup. Set up and start upof all test samplers shall be in strictaccordance with the operatinginstructions specified in the manualreferred to in section 7.4.18 of 40 CFRpart 50, Appendix L, unless otherwisespecified within this subpart.
(c) Sampler adjustments. Once thetest sampler or samplers have been setup and the performance tests started,manual adjustment shall be permittedonly between test points for allapplicable tests. Manual adjustmentsand any periodic maintenance shall belimited to only those proceduresprescribed in the manual referred to insection 7.4.18 of 40 CFR part 50,Appendix L. The submitted recordsshall clearly indicate when any manualadjustment or periodic maintenance wasmade and shall describe the operationsperformed.
(d) Sampler malfunctions. If a testsampler malfunctions during any of theapplicable tests, that test run shall berepeated. A detailed explanation of allmalfunctions and the remedial actionstaken shall be submitted as part of theequivalent method application.
(e) Particle concentrationmeasurements. All measurements ofparticle concentration must be made
such that the relative error inmeasurement is less than 5.0 percent.Relative error is defined as (s × 100percent)/(X), where s is the samplestandard deviation of the particleconcentration detector, X is themeasured concentration, and the unitsof s and X are identical.
(f) Operation of test measurementequipment. All test measurementequipment shall be set up, calibrated,and maintained by qualified personnelaccording to the manufacturer’sinstructions. All appropriate calibrationinformation and manuals for thisequipment shall be kept on file.
(g) Vibrating orifice aerosol generatorconventions. This section prescribesconventions regarding the use of thevibrating orifice aerosol generator(VOAG) for the size-selectiveperformance tests outlined in §§ 53.62,53.63, 53.64, and 53.65.
(1) Particle aerodynamic diameter.The VOAG produces near-monodispersedroplets through the controlled breakupof a liquid jet. When the liquid solutionconsists of a non-volatile solutedissolved in a volatile solvent, thedroplets dry to form particles of near-monodisperse size.
(i) The physical diameter of agenerated spherical particle can becalculated from the operatingparameters of the VOAG as:
Equation 1
Dpvol=
61
3 Q C
fπwhere:Dp = particle physical diameter, ©m;Q = liquid volumetric flow rate, ©m3/sec;Cvol = volume concentration (particle volumeproduced per drop volume), dimensionless;andf = frequency of applied vibrational signal, 1/sec.
(ii) A given particle’s aerodynamicbehavior is a function of its physicalparticle size, particle shape, anddensity. Aerodynamic diameter isdefined as the diameter of a unit density(ρo = 1 g/m3) sphere having the samesettling velocity as the particle underconsideration. For converting aspherical particle of known density toaerodynamic diameter, the governingrelationship is:
Equation 2
DC D
Cae
p D p
o Dae
p=ρ
ρwhere:Dae = particle aerodynamic diameter, ©m;ρp = particle density, g/cm3;ρo = aerodynamic particle density = 1 g/m3;
CDp = Cunningham’s slip correction factor forphysical particle diameter, dimensionless;andCDae = Cunningham’s slip correction factorfor aerodynamic particle diameter,dimensionless.
(iii) At room temperature andstandard pressure, the Cunningham’sslip correction factor is solely a functionof particle diameter:
Equation 3
CD DDae
ae aeae= + + ( )1
0 1659 0 053. .exp -8.33 D
or
Equation 4
CD DD
p ppp
= + + −( )10 1659 0 053
8 33. .
. exp D
(iv) Since the slip correction factor isitself a function of particle diameter, theaerodynamic diameter in Equation 2 ofparagraph (g)(1)(ii) of this sectioncannot be solved directly but must bedetermined by iteration.
(2) Solid particle generation. (i) Solidparticle tests performed in this subpartshall be conducted using particlescomposed of ammonium fluorescein.For use in the VOAG, liquid solutionsof known volumetric concentration canbe prepared by diluting fluoresceinpowder (C20H12O5, FW = 332.31, CAS2321-07-5) with aqueous ammonia.Guidelines for preparation offluorescein solutions of the desiredvolume concentration (Cvol) arepresented by Vanderpool and Rubow(1988) (Reference 2 in Appendix A ofthis subpart). For purposes of convertingparticle physical diameter toaerodynamic diameter, an ammoniumfluorescein density of 1.35 g/cm3 shallbe used.
(ii) Mass deposits of ammoniumfluorescein shall be extracted andanalyzed using solutions of 0.01 Nammonium hydroxide.
(3) Liquid particle generation. (i) Testsprescribed in § 53.63 for inlet aspirationrequire the use of liquid particle testscomposed of oleic acid tagged withuranine to enable subsequentfluorometric quantitation of collectedaerosol mass deposits. Oleic acid(C18H34O2, FW = 282.47, CAS 112-80-1)has a density of 0.8935 g/cm3. Becausethe viscosity of oleic acid is relativelyhigh, significant errors can occur whendispensing oleic acid using volumetricpipettes. For this reason, it isrecommended that oleic acid solutionsbe prepared by quantifying dispensedoleic acid gravimetrically. The volumeof oleic acid dispensed can then becalculated simply by dividing the

38817Federal Register / Vol. 62, No. 138 / Friday, July 18, 1997 / Rules and Regulations
dispensed mass by the oleic aciddensity.
(ii) Oleic acid solutions tagged withuranine shall be prepared as follows. Aknown mass of oleic acid shall first bediluted using absolute ethanol. Thedesired mass of the uranine tag shouldthen be diluted in a separate containerusing absolute ethanol. Uranine(C20H10O5Na2, FW = 376.3, CAS 518-47-8) is the disodium salt of fluoresceinand has a density of 1.53 g/cm3. Inpreparing uranine tagged oleic acidparticles, the uranine content shall notexceed 20 percent on a mass basis. Onceboth oleic acid and uranine solutionsare properly prepared, they can then becombined and diluted to final volumeusing absolute ethanol.
(iii) Calculation of the physicaldiameter of the particles produced bythe VOAG requires knowledge of theliquid solution’s volume concentration(Cvol). Because uranine is essentiallyinsoluble in oleic acid, the total particlevolume is the sum of the oleic acidvolume and the uranine volume. Thevolume concentration of the liquidsolution shall be calculated as:
Equation 5
CV V
V
M M
Vvolu oleic
sol
u u oleic oleic
sol
=+
=( ) + ( )ρ ρ
where:Vu = uranine volume, ml;Voleic = oleic acid volume, ml;Vsol = total solution volume, ml;Mu = uranine mass, g;ρu = uranine density, g/cm3;Moleic = oleic acid mass, g; andρoleic = oleic acid density, g/cm3.
(iv) For purposes of converting theparticles’ physical diameter toaerodynamic diameter, the density ofthe generated particles shall becalculated as:
Equation 6
ρρ ρp
u oleic
u u oleic oleic
M M
M M=
+( ) + ( )
(v) Mass deposits of oleic acid shall beextracted and analyzed using solutionsof 0.01 N sodium hydroxide.
§ 53.62 Test procedure: Full wind tunneltest.
(a) Overview. The full wind tunneltest evaluates the effectiveness of thecandidate sampler at 2 km/hr and 24km/hr for aerosols of the size specifiedin Table F-2 of this subpart (under theheading, ‘‘Full Wind Tunnel Test’’). Foreach wind speed, a smooth curve is fitto the effectiveness data and correctedfor the presence of multiplets in thewind tunnel calibration aerosol. The
cutpoint diameter (Dp50) at each windspeed is then determined from thecorrected effectiveness curves. The tworesultant penetration curves are theneach numerically integrated with threeidealized ambient particle sizedistributions to provide six estimates ofmeasured mass concentration. Criticalparameters for these idealizeddistributions are presented in Table F-3 of this subpart.
(b) Technical definitions.Effectiveness is the ratio (expressed as apercentage) of the mass concentration ofparticles of a specific size reaching thesampler filter or filters to the massconcentration of particles of the samesize approaching the sampler.
(c) Facilities and equipmentrequired—(1) Wind tunnel. The particledelivery system shall consist of a blowersystem and a wind tunnel having a testsection of sufficiently large cross-sectional area such that the test sampler,or portion thereof, as installed in thetest section for testing, blocks no morethan 15 percent of the test section area.The wind tunnel blower system must becapable of maintaining uniform windspeeds at the 2 km/hr and 24 km/hr inthe test section.
(2) Aerosol generation system. Avibrating orifice aerosol generator shallbe used to produce monodisperse solidparticles of ammonium fluorescein withequivalent aerodynamic diameters asspecified in Table F-2 of this subpart.The geometric standard deviation foreach particle size generated shall notexceed 1.1 (for primary particles) andthe proportion of multiplets (doubletsand triplets) in all test particleatmosphere shall not exceed 10 percentof the particle population. Theaerodynamic particle diameter, asestablished by the operating parametersof the vibrating orifice aerosol generator,shall be within the tolerance specifiedin Table F-2 of this subpart.
(3) Particle size verificationequipment. The size of the test particlesshall be verified during this test by useof a suitable instrument (e.g., scanningelectron microscope, optical particlesizer, time-of-flight apparatus). Theinstrument must be capable ofmeasuring solid and liquid test particleswith a size resolution of 0.1 ©m or less.The accuracy of the particle sizeverification technique shall be 0.15 ©mor better.
(4) Wind speed measurement. Thewind speed in the wind tunnel shall bedetermined during the tests using anappropriate technique capable of aprecision of 2 percent and an accuracyof 5 percent or better (e.g., hot-wireanemometry). For the wind speedsspecified in Table F-2 of this subpart,
the wind speed shall be measured at aminimum of 12 test points in a cross-sectional area of the test section of thewind tunnel. The mean wind speed inthe test section must be within ± 10percent of the value specified in TableF-2 of this subpart, and the variation atany test point in the test section may notexceed 10 percent of the measuredmean.
(5) Aerosol rake. The cross-sectionaluniformity of the particle concentrationin the sampling zone of the test sectionshall be established during the testsusing an array of isokinetic samplers,referred to as a rake. Not less than fiveevenly spaced isokinetic samplers shallbe used to determine the particleconcentration spatial uniformity in thesampling zone. The sampling zone shallbe a rectangular area having a horizontaldimension not less than 1.2 times thewidth of the test sampler at its inletopening and a vertical dimension notless than 25 centimeters.
(6) Total aerosol isokinetic sampler.After cross-sectional uniformity hasbeen confirmed, a single isokineticsampler may be used in place of thearray of isokinetic samplers for thedetermination of particle massconcentration used in the calculation ofsampling effectiveness of the testsampler in paragraph (d)(5) of thissection. In this case, the array ofisokinetic samplers must be used todemonstrate particle concentrationuniformity prior to the replicatemeasurements of samplingeffectiveness.
(7) Fluorometer. A fluorometer usedfor quantifying extracted aerosol massdeposits shall be set up, maintained,and calibrated according to themanufacturer’s instructions. A series ofcalibration standards shall be preparedto encompass the minimum andmaximum concentrations measuredduring size-selective tests. Prior to eachcalibration and measurement, thefluorometer shall be zeroed using analiquot of the same solvent used forextracting aerosol mass deposits.
(8) Sampler flow rate measurements.All flow rate measurements used tocalculate the test atmosphereconcentrations and the test results mustbe accurate to within ± 2 percent,referenced to a NIST-traceable primarystandard. Any necessary flow ratemeasurement corrections shall beclearly documented. All flow ratemeasurements shall be performed andreported in actual volumetric units.
(d) Test procedures—(1) Establish andverify wind speed. (i) Establish a windspeed specified in Table F-2 of thissubpart.

38818 Federal Register / Vol. 62, No. 138 / Friday, July 18, 1997 / Rules and Regulations
(ii) Measure the wind speed at aminimum of 12 test points in a cross-sectional area of the test section of thewind tunnel using a device as describedin paragraph (c)(4) of this section.
(iii) Verify that the mean wind speedin the test section of the wind tunnelduring the tests is within 10 percent ofthe value specified in Table F-2 of thissubpart. The wind speed measured atany test point in the test section shallnot differ by more than 10 percent fromthe mean wind speed in the test section.
(2) Generate aerosol. (i) Generateparticles of a size specified in Table F-2 of this subpart using a vibrating orificeaerosol generator.
(ii) Check for the presence of satellitesand adjust the generator as necessary.
(iii) Calculate the physical particlesize using the operating parameters ofthe vibrating orifice aerosol generatorand record.
(iv) Determine the particle’saerodynamic diameter from thecalculated physical diameter and theknown density of the generated particle.The calculated aerodynamic diametermust be within the tolerance specifiedin Table F-2 of this subpart.
(3) Introduce particles into the windtunnel. Introduce the generated particlesinto the wind tunnel and allow theparticle concentration to stabilize.
(4) Verify the quality of the testaerosol. (i) Extract a representative
sample of the aerosol from the samplingtest zone and measure the sizedistribution of the collected particlesusing an appropriate sizing technique. Ifthe measurement technique does notprovide a direct measure ofaerodynamic diameter, the geometricmean aerodynamic diameter of thechallenge aerosol must be calculatedusing the known density of the particleand the measured mean physicaldiameter. The determined geometricmean aerodynamic diameter of the testaerosol must be within 0.15 ©m of theaerodynamic diameter calculated fromthe operating parameters of the vibratingorifice aerosol generator. The geometricstandard deviation of the primaryparticles must not exceed 1.1.
(ii) Determine the population ofmultiplets in the collected sample. Themultiplet population of the particle testatmosphere must not exceed 10 percentof the total particle population.
(5) Aerosol uniformity andconcentration measurement. (i) Installan array of five or more evenly spacedisokinetic samplers in the samplingzone (paragraph (c)(5) of this section).Collect particles on appropriate filtersover a time period such that the relativeerror of the measured particleconcentration is less than 5.0 percent.
(ii) Determine the quantity of materialcollected with each isokinetic samplerin the array using a calibrated
fluorometer. Calculate and record themass concentration for each isokineticsampler as:
Equation 7
CM
Q tiso ij
iso ij
ij ij( )
( )
( ) ( )=
×
where:i = replicate number;j = isokinetic sampler number;Miso = mass of material collected with theisokinetic sampler;Q = isokinetic sampler volumetric flow rate;andt = sampling time.
(iii) Calculate and record the meanmass concentration as:
Equation 8
C
C
niso i
iso ijj
n
( )
( )==∑
1
where:i = replicate number;j = isokinetic sampler number; andn = total number of isokinetic samplers.
(iv) Precision calculation. (A)Calculate the coefficient of variation ofthe mass concentration measurementsas:
Equation 9
CV
Cn
C
nCiso i
iso ij iso ijj
n
j
n
iso i( )
( ) ( )==
( )=
−
−×
∑∑ 2
1
2
1
1
1100%/
where:i = replicate number;j = isokinetic sampler number; andn = total number of isokinetic samplers.
(B) If the value of CViso(i) for anyreplicate exceeds 10 percent, theparticle concentration uniformity isunacceptable and step 5 must berepeated. If adjustment of the vibratingorifice aerosol generator or changes inthe particle delivery system arenecessary to achieve uniformity, steps 1through 5 must be repeated. When anacceptable aerosol spatial uniformity isachieved, remove the array of isokineticsamplers from the wind tunnel.
(6) Alternative measure of windtunnel total concentration. If a singleisokinetic sampler is used to determinethe mean aerosol concentration in thewind tunnel, install the sampler in thewind tunnel with the sampler nozzlecentered in the sampling zone(paragraph (c)(6) of this section).
(i) Collect particles on an appropriatefilter over a time period such that therelative error of the measuredconcentration is less than 5.0 percent.
(ii) Determine the quantity of materialcollected with the isokinetic samplerusing a calibrated fluorometer.
(iii) Calculate and record the massconcentration as Ciso(i) as in paragraph(d)(5)(ii) of this section.
(iv) Remove the isokinetic samplerfrom the wind tunnel.
(7) Measure the aerosol with thecandidate sampler. (i) Install the testsampler (or portion thereof) in the windtunnel with the sampler inlet openingcentered in the sampling zone. To meetthe maximum blockage limit ofparagraph (c)(1) of this section or forconvenience, part of the test samplermay be positioned external to the windtunnel provided that neither thegeometry of the sampler nor the lengthof any connecting tube or pipe is
altered. Collect particles for a timeperiod such that the relative error of themeasured concentration is less than 5.0percent.
(ii) Remove the test sampler from thewind tunnel.
(iii) Determine the quantity ofmaterial collected with the test samplerusing a calibrated fluorometer. Calculateand record the mass concentration foreach replicate as:
Equation 10
CM
Q tcand icand i
i i( )
( )
( ) ( )=
×where:i = replicate number;Mcand = mass of material collected with thecandidate sampler;Q = candidate sampler volumetric flow rate;andt = sampling time.

38819Federal Register / Vol. 62, No. 138 / Friday, July 18, 1997 / Rules and Regulations
(iv)(A) Calculate and record thesampling effectiveness of the candidatesampler as:
Equation 11
EC
Cicand i
iso i( )
( )
( )= ×100%
where:i = replicate number.
(B) If a single isokinetic sampler isused for the determination of particlemass concentration, replace Ciso(i) withCiso.
(8) Replicate measurements andcalculation of mean samplingeffectiveness. (i) Repeat steps inparagraphs (d)(5) through (d)(7) of thissection, as appropriate, to obtain aminimum of three valid replicatemeasurements of samplingeffectiveness.
(ii) Calculate and record the averagesampling effectiveness of the testsampler for the particle size as:
Equation 12
E
E
n
ii
n
=( )
=∑
1
where:i = replicate number; andn = number of replicates.
(iii) Sampling effectiveness precision.(A) Calculate and record the coefficientof variation for the replicate samplingeffectiveness measurements of the testsampler as:
Equation 13
CV
En
E
n EE
i ii
n
i
n
=
−
−×
( ) ( )==∑∑ 2
1
2
1
1
1
1100%
where:i = replicate number, andn = number of replicates.
(B) If the value of CVE exceeds 10percent, the test run (steps inparagraphs (d)(2) through (d)(8) of thissection) must be repeated until anacceptable value is obtained.
(9) Repeat steps in paragraphs (d)(2)through (d)(8) of this section until thesampling effectiveness has beenmeasured for all particle sizes specifiedin Table F-2 of this subpart.
(10) Repeat steps in paragraphs (d)(1)through (d)(9) of this section until testshave been successfully conducted forboth wind speeds of 2 km/hr and 24km/hr.
(e) Calculations—(1) Graphicaltreatment of effectiveness data. For eachwind speed given in Table F-2 of this
subpart, plot the particle averagesampling effectiveness of the candidatesampler as a function of aerodynamicparticle diameter (Dae) on semi-logarithmic graph paper where theaerodynamic particle diameter is theparticle size established by theparameters of the VOAG in conjunctionwith the known particle density.Construct a best-fit, smooth curvethrough the data by extrapolating thesampling effectiveness curve through100 percent at an aerodynamic particlesize of 0.5 ©m and 0 percent at anaerodynamic particle size of 10 ©m.Correction for the presence of multipletsshall be performed using the techniquespresented by Marple, et al (1987). Thismultiplet-corrected effectiveness curveshall be used for all remainingcalculations in this paragraph (e).
(2) Cutpoint determination. For eachwind speed determine the sampler Dp50
cutpoint defined as the aerodynamicparticle size corresponding to 50percent effectiveness from the multipletcorrected smooth curve.
(3) Expected mass concentrationcalculation. For each wind speed,calculate the estimated massconcentration measurement for the testsampler under each particle sizedistribution (Tables F-4, F-5, and F-6 ofthis subpart) and compare it to the massconcentration predicted for thereference sampler as follows:
(i) Determine the value of correctedeffectiveness using the best-fit,multiplet-corrected curve at each of theparticle sizes specified in the firstcolumn of Table F-4 of this subpart.Record each corrected effectivenessvalue as a decimal between 0 and 1 incolumn 2 of Table F-4 of this subpart.
(ii) Calculate the interval estimatedmass concentration measurement bymultiplying the values of correctedeffectiveness in column 2 by the intervalmass concentration values in column 3and enter the products in column 4 ofTable F-4 of this subpart.
(iii) Calculate the estimated massconcentration measurement bysumming the values in column 4 andentering the total as the estimated massconcentration measurement for the testsampler at the bottom of column 4 ofTable F-4 of this subpart.
(iv) Calculate the estimated massconcentration ratio between thecandidate method and the referencemethod as:
Equation 14
RC
Cccand est
ref est
= ×( )
( )100%
where:
Ccand(est) = estimated mass concentrationmeasurement for the test sampler, ©g/m3; andCref(est) = estimated mass concentrationmeasurement for the reference sampler, ©g/m3 (calculated for the reference sampler andspecified at the bottom of column 7 of TableF-4 of this subpart).
(v) Repeat steps in paragraphs (e) (1)through (e)(3) of this section for TablesF-5 and F-6 of this subpart.
(f) Evaluation of test results. Thecandidate method passes the windtunnel effectiveness test if the Rc valuefor each wind speed meets thespecification in Table F-1 of this subpartfor each of the three particle sizedistributions.
§ 53.63 Test procedure: Wind tunnel inletaspiration test.
(a) Overview. This test applies to acandidate sampler which differs fromthe reference method sampler only withrespect to the design of the inlet. Thepurpose of this test is to ensure that theaspiration of a Class II candidatesampler is such that it representativelyextracts an ambient aerosol at elevatedwind speeds. This wind tunnel test usesa single-sized, liquid aerosol inconjunction with wind speeds of 2 km/hr and 24 km/hr. The test atmosphereconcentration is alternately measuredwith the candidate sampler and areference method device, both of whichare operated without the 2.5-micronfractionation device installed. The testconditions are summarized in Table F-2 of this subpart (under the heading of‘‘wind tunnel inlet aspiration test’’). Thecandidate sampler must meet or exceedthe acceptance criteria given in Table F-1 of this subpart.
(b) Technical definition. Relativeaspiration is the ratio (expressed as apercentage) of the aerosol massconcentration measured by thecandidate sampler to that measured bya reference method sampler.
(c) Facilities and equipment required.The facilities and equipment areidentical to those required for the fullwind tunnel test (§ 53.62(c)).
(d) Setup. The candidate andreference method samplers shall beoperated with the PM2.5 fractionationdevice removed from the flow paththroughout this entire test procedure.Modifications to accommodate thisrequirement shall be limited to removalof the fractionator and insertion of thefilter holder directly into the downtubeof the inlet.
(e) Test procedure—(1) Establish thewind tunnel test atmosphere. Follow theprocedures in § 53.62(d)(1) through(d)(4) to establish a test atmosphere forone of the two wind speeds specified inTable F-2 of this subpart.

38820 Federal Register / Vol. 62, No. 138 / Friday, July 18, 1997 / Rules and Regulations
(2) Measure the aerosol concentrationwith the reference sampler. (i) Install thereference sampler (or portion thereof) inthe wind tunnel with the sampler inletopening centered in the sampling zone.To meet the maximum blockage limit of§ 53.62(c)(1) or for convenience, part ofthe test sampler may be positionedexternal to the wind tunnel providedthat neither the geometry of the samplernor the length of any connecting tube orpipe is altered. Collect particles for atime period such that the relative errorof the measured concentration is lessthan 5.0 percent.
(ii) Determine the quantity of materialcollected with the reference methodsampler using a calibrated fluorometer.Calculate and record the massconcentration as:
Equation 15
CM
Q tref iref i
i i( )
( )
( ) ( )=
×
where:i = replicate number;Mref = mass of material collected with thereference method sampler;Q = reference method sampler volumetricflow rate; andt = sampling time.
(iii) Remove the reference methodsampler from the tunnel.
(3) Measure the aerosol concentrationwith the candidate sampler. (i) Installthe candidate sampler (or portionthereof) in the wind tunnel with thesampler inlet centered in the samplingzone. To meet the maximum blockagelimit of § 53.62(c)(1) or for convenience,part of the test sampler may bepositioned external to the wind tunnelprovided that neither the geometry ofthe sampler nor the length of anyconnecting tube or pipe is altered.Collect particles for a time period suchthat the relative error of the measuredconcentration is less than 5.0 percent.
(ii) Determine the quantity of materialcollected with the candidate samplerusing a calibrated fluorometer. Calculateand record the mass concentration as:
Equation 16
CM
Q tcand icand i
i i( )
( )
( ) ( )=
×
where:i = replicate number;Mcand = mass of material collected with thecandidate sampler;Q = candidate sampler volumetric flow rate;andt = sampling time.
(iii) Remove the candidate samplerfrom the wind tunnel.
(4) Repeat steps in paragraphs (d) (2)and (d)(3) of this section. Alternatelymeasure the tunnel concentration withthe reference sampler and the candidatesampler until four reference samplerand three candidate samplermeasurements of the wind tunnelconcentration are obtained.
(5) Calculations. (i) Calculate andrecord aspiration ratio for eachcandidate sampler run as:
Equation 17
AC
C Ci
cand i
ref i ref i
( )( )
( ) +( )
=+( ) ×1
12
where:i = replicate number.
(ii) Calculate and record the meanaspiration ratio as:
Equation 18
A
A
n
ii
n
=( )
=∑
1
where:i = replicate number; andn = total number of measurements ofaspiration ratio.
(iii) Precision of the aspiration ratio.(A) Calculate and record the precision ofthe aspiration ratio measurements as thecoefficient of variation as:
Equation 19
CV
An
A
nAA
i ii
n
i
n
i=
−
−×
( ) ( )==
( )
∑∑ 2
1
2
1
1
1100%/
where:i = replicate number; andn = total number of measurements ofaspiration ratio.
(B) If the value of CVA exceeds 10percent, the entire test procedure mustbe repeated.
(f) Evaluation of test results. Thecandidate method passes the inletaspiration test if all values of A meet theacceptance criteria specified in Table F-1 of this subpart.
§ 53.64 Test procedure: Static fractionatortest.
(a) Overview. This test applies only tothose candidate methods in which thesole deviation from the referencemethod is in the design of the 2.5-micron fractionation device. Thepurpose of this test is to ensure that thefractionation characteristics of thecandidate fractionator are acceptablysimilar to that of the reference methodsampler. It is recognized that variousmethodologies exist for quantifying
fractionator effectiveness. The followingcommonly-employed techniques areprovided for purposes of guidance.Other methodologies for determiningsampler effectiveness may be usedcontingent upon prior approval by theAgency.
(1) Wash-off method. Effectiveness isdetermined by measuring the aerosolmass deposited on the candidatesampler’s after filter versus the aerosolmass deposited in the fractionator. Thematerial deposited in the fractionator isrecovered by washing its internalsurfaces. For these wash-off tests, afluorometer must be used to quantitatethe aerosol concentration. Note that ifthis technique is chosen, the candidatemust be reloaded with coarse aerosolprior to each test point whenreevaluating the curve as specified inthe loading test.
(2) Static chamber method.Effectiveness is determined bymeasuring the aerosol massconcentration sampled by the candidatesampler’s after filter versus that whichexists in a static chamber. A calibratedfluorometer shall be used to quantify thecollected aerosol deposits. The aerosolconcentration is calculated as themeasured aerosol mass divided by thesampled air volume.
(3) Divided flow method. Effectivenessis determined by comparing the aerosolconcentration upstream of the candidatesampler’s fractionator versus thatconcentration which exists downstreamof the candidate fractionator. These testsmay utilize either fluorometry or a real-time aerosol measuring device todetermine the aerosol concentration.
(b) Technical definition. Effectivenessunder static conditions is the ratio(expressed as a percentage) of the massconcentration of particles of a given sizereaching the sampler filter to the massconcentration of particles of the samesize existing in the test atmosphere.
(c) Facilities and equipmentrequired—(1) Aerosol generation.Methods for generating aerosols shall beidentical to those prescribed in§ 53.62(c)(2).
(2) Particle delivery system.Acceptable apparatus for delivering thegenerated aerosols to the candidatefractionator is dependent on theeffectiveness measurement methodologyand shall be defined as follows:
(i) Wash-off test apparatus. Theaerosol may be delivered to thecandidate fractionator through directpiping (with or without an in-linemixing chamber). Validation particlesize and quality shall be conducted at apoint directly upstream of thefractionator.

38821Federal Register / Vol. 62, No. 138 / Friday, July 18, 1997 / Rules and Regulations
(ii) Static chamber test apparatus.The aerosol shall be introduced into achamber and sufficiently mixed suchthat the aerosol concentration withinthe chamber is spatially uniform. Thechamber must be of sufficient size tohouse at least four total filter samplersin addition to the inlet of the candidatemethod size fractionator. Validation ofparticle size and quality shall beconducted on representative aerosolsamples extracted from the chamber.
(iii) Divided flow test apparatus. Theapparatus shall allow the aerosolconcentration to be measured upstreamand downstream of the fractionator. Theaerosol shall be delivered to a manifoldwith two symmetrical branching legs.One of the legs, referred to as the bypassleg, shall allow the challenge aerosol topass unfractionated to the detector. Theother leg shall accommodate thefractionation device.
(3) Particle concentrationmeasurement—(i) Fluorometry. Refer to§ 53.62(c)(7).
(ii) Number concentrationmeasurement. A number countingparticle sizer may be used inconjunction with the divided flow testapparatus in lieu of fluorometricmeasurement. This device must have aminimum range of 1 to 10 ©m, aresolution of 0.1 ©m, and an accuracy of0.15 ©m such that primary particles maybe distinguished from multiplets for alltest aerosols. The measurement ofnumber concentration shall beaccomplished by integrating the primaryparticle peak.
(d) Setup—(1) Remove the inlet anddowntube from the candidatefractionator. All tests procedures shallbe conducted with the inlet anddowntube removed from the candidatesampler.
(2) Surface treatment of thefractionator. Rinsing aluminum surfaceswith alkaline solutions has been foundto adversely affect subsequentfluorometric quantitation of aerosolmass deposits. If wash-off tests are to beused for quantifying aerosol penetration,internal surfaces of the fractionator mustfirst be plated with electroless nickel.Specifications for this plating arespecified in Society of AutomotiveEngineers Aerospace MaterialSpecification (SAE AMS) 2404C,Electroless Nickel Plating (Reference 3in Appendix A of Subpart F).
(e) Test procedure: Wash-offmethod—(1) Clean the candidatesampler. Note: The procedures in thisstep may be omitted if this test is beingused to evaluate the fractionator afterbeing loaded as specified in § 53.65.
(i) Clean and dry the internal surfacesof the candidate sampler.
(ii) Prepare the internal fractionatorsurfaces in strict accordance with theoperating instructions specified in thesampler’s operating manual referred toin section 7.4.18 of 40 CFR part 50,Appendix L.
(2) Generate aerosol. Follow theprocedures for aerosol generationprescribed in § 53.62(d)(2).
(3) Verify the quality of the testaerosol. Follow the procedures forverification of test aerosol size andquality prescribed in § 53.62(d)(4).
(4) Determine effectiveness for theparticle size being produced. (i) Collectparticles downstream of the fractionatoron an appropriate filter over a timeperiod such that the relative error of thefluorometric measurement is less than5.0 percent.
(ii) Determine the quantity of materialcollected on the after filter of thecandidate method using a calibratedfluorometer. Calculate and record theaerosol mass concentration for thesampler filter as:
Equation 20
CM
Q tcand icand i
i i( )
( )
( ) ( )=
×where:i = replicate number;Mcand = mass of material collected with thecandidate sampler;Q = candidate sampler volumetric flowrate;andt = sampling time.
(iii) Wash all interior surfacesupstream of the filter and determine thequantity of material collected using acalibrated fluorometer. Calculate andrecord the fluorometric massconcentration of the sampler wash as:
Equation 21
CM
Q twash iwash i
i i( )
( )
( ) ( )=
×where:i = replicate number;Mwash = mass of material washed from theinterior surfaces of the fractionator;Q = candidate sampler volumetric flowrate;andt = sampling time.
(iv) Calculate and record the samplingeffectiveness of the test sampler for thisparticle size as:
Equation 22
EC
C Ciwash i
cand i wash i( )
( )
( ) ( )=
+×100%
where:i = replicate number.
(v) Repeat steps in paragraphs (e)(4) ofthis section, as appropriate, to obtain aminimum of three replicatemeasurements of samplingeffectiveness. Note: The procedures forloading the candidate in § 53.65 must berepeated between repetitions if this testis being used to evaluate the fractionatorafter being loaded as specified in§ 53.65.
(vi) Calculate and record the averagesampling effectiveness of the testsampler as:
Equation 23
E
E
n
ii
n
=( )
=∑
1
where:i = replicate number; andn = number of replicates.
(vii)(A) Calculate and record thecoefficient of variation for the replicatesampling effectiveness measurements ofthe test sampler as:
Equation 24
CV
En
E
n EE
i ii
n
i
n
=
−
−× ×
( ) ( )==∑∑ 2
1
2
1
1
1
1100%
where:i = replicate number; andn = total number of measurements.
(B) If the value of CVE exceeds 10percent, then steps in paragraphs (e) (2)through (e)(4) of this section must berepeated.
(5) Repeat steps in paragraphs (e) (1)through (e)(4) of this section for eachparticle size specified in Table F-2 ofthis subpart.
(f) Test procedure: Static chambermethod—(1) Generate aerosol. Followthe procedures for aerosol generationprescribed in § 53.62(d)(2).
(2) Verify the quality of the testaerosol. Follow the procedures forverification of test aerosol size andquality prescribed in § 53.62(d)(4).
(3) Introduce particles into chamber.Introduce the particles into the staticchamber and allow the particleconcentration to stabilize.
(4) Install and operate the candidatesampler’s fractionator and its after-filterand at least four total filters. (i) Installthe fractionator and an array of four ormore equally spaced total filter samplerssuch that the total filters surround andare in the same plane as the inlet of thefractionator.
(ii) Simultaneously collect particlesonto appropriate filters with the totalfilter samplers and the fractionator for atime period such that the relative error

38822 Federal Register / Vol. 62, No. 138 / Friday, July 18, 1997 / Rules and Regulations
of the measured concentration is lessthan 5.0 percent.
(5) Calculate the aerosol spatialuniformity in the chamber. (i) Determinethe quantity of material collected witheach total filter sampler in the arrayusing a calibrated fluorometer. Calculateand record the mass concentration foreach total filter sampler as:
Equation 25
CM
Q ttotal ij
total ij
ij ij( )
( )
( ) ( )=
×
where:i = replicate number;j = total filter sampler number;Mtotal = mass of material collected with thetotal filter sampler;Q = total filter sampler volumetric flowrate;andt = sample time.
(ii) Calculate and record the meanmass concentration as:
Equation 26
C
C
ntotal i
total ijj
n
( )
( )==∑
1
where:n = total number of samplers;i = replicate number; andj = filter sampler number.
(iii) (A) Calculate and record thecoefficient of variation of the total massconcentration as:
Equation 27
CV
Cn
C
n Ctotal
total ij total ijj
n
j
n
total i
=
−
−× ×
( ) ( )==
( )
∑∑ 2
1
2
1
1
1
1100%
where:i = replicate number;j = total filter sampler number; andn = number of total filter samplers.
(B) If the value of CVtotal exceeds 10percent, then the particle concentrationuniformity is unacceptable, alterationsto the static chamber test apparatusmust be made, and steps in paragraphs(f)(1) through (f)(5) of this section mustbe repeated.
(6) Determine the effectiveness of thecandidate sampler. (i) Determine thequantity of material collected on thecandidate sampler’s after filter using acalibrated fluorometer. Calculate andrecord the mass concentration for thecandidate sampler as:
Equation 28
CM
Q tcand icand i
i i( )
( )
( ) ( )=
×where:i = replicate number;Mcand = mass of material collected with thecandidate sampler;Q = candidate sampler volumetric flowrate;andt = sample time.
(ii) Calculate and record the samplingeffectiveness of the candidate sampleras:
Equation 29
EC
Cicand i
total i( )
( )
( )= ×100%
where:i = replicate number.
(iii) Repeat step in paragraph (f)(4)through (f)(6) of this section, as
appropriate, to obtain a minimum ofthree replicate measurements ofsampling effectiveness.
(iv) Calculate and record the averagesampling effectiveness of the testsampler as:
Equation 30
E
E
n
ii
n
=( )
=∑
1
where:i= replicate number.
(v)(A) Calculate and record thecoefficient of variation for the replicatesampling effectiveness measurements ofthe test sampler as:
Equation 31
CV
En
E
n EE
i ii
n
i
n
=
−
−× ×
( ) ( )==∑∑ 2
1
2
1
1
1
1100%
where:i = replicate number; andn = number of measurements of effectiveness.
(B) If the value of CVE exceeds 10percent, then the test run (steps inparagraphs (f)(2) through (f)(6) of thissection) is unacceptable and must berepeated.
(7) Repeat steps in paragraphs (f)(1)through (f)(6) of this section for eachparticle size specified in Table F-2 ofthis subpart.
(g) Test procedure: Divided flowmethod—(1) Generate calibrationaerosol. Follow the procedures foraerosol generation prescribed in§ 53.62(d)(2).
(2) Verify the quality of the calibrationaerosol. Follow the procedures forverification of calibration aerosol sizeand quality prescribed in § 53.62(d)(4).
(3) Introduce aerosol. Introduce thecalibration aerosol into the staticchamber and allow the particleconcentration to stabilize.
(4) Validate that transport is equal forthe divided flow option. (i) Withfluorometry as a detector:
(A) Install a total filter on each leg ofthe divided flow apparatus.
(B) Collect particles simultaneouslythrough both legs at 16.7 L/min onto anappropriate filter for a time period suchthat the relative error of the measuredconcentration is less than 5.0 percent.
(C) Determine the quantity of materialcollected on each filter using acalibrated fluorometer. Calculate andrecord the mass concentration measuredin each leg as:
Equation 32
CM
Q tii
i i( )
( )
( ) ( )=
×
where:i = replicate number,M = mass of material collected with the totalfilter; andQ = candidate sampler volumetric flowrate.
(D) Repeat steps in paragraphs(g)(4)(i)(A) through (g)(4)(i)(C) of thissection until a minimum of threereplicate measurements are performed.
(ii) With a number counting devicesuch as an aerosol detector:
(A) Remove all flow obstructions fromthe flow paths of the two legs.

38823Federal Register / Vol. 62, No. 138 / Friday, July 18, 1997 / Rules and Regulations
(B) Quantify the aerosol concentrationof the primary particles in each leg ofthe apparatus.
(C) Repeat steps in paragraphs(g)(4)(ii)(A) through (g)(4)(ii)(B) of thissection until a minimum of threereplicate measurements are performed.
(iii) (A) Calculate the meanconcentration and coefficient ofvariation as:
Equation 33
C
C
n
ii
n
=( )
=∑
1
Equation 34
CV
Cn
C
n C
i ii
n
i
n
=
−
−× ×
( ) ( )==∑∑ 2
1
2
1
1
1
1100%
where:i = replicate number; andn = number of replicates.
(B) If the measured meanconcentrations through the two legs donot agree within 5 percent, thenadjustments may be made in the setup,and this step must be repeated.
(5) Determine effectiveness.Determine the sampling effectiveness ofthe test sampler with the inlet removedby one of the following procedures:
(i) With fluorometry as a detector:(A) Prepare the divided flow
apparatus for particle collection. Installa total filter into the bypass leg of thedivided flow apparatus. Install theparticle size fractionator with a totalfilter placed immediately downstreamof it into the other leg.
(B) Collect particles simultaneouslythrough both legs at 16.7 L/min ontoappropriate filters for a time period suchthat the relative error of the measuredconcentration is less than 5.0 percent.
(C) Determine the quantity of materialcollected on each filter using acalibrated fluorometer. Calculate andrecord the mass concentration measuredby the total filter and that measuredafter penetrating through the candidatefractionator as follows:
Equation 35
CM
Q ttotaltotal i
i ii( )
=×
( )
( ) ( )
Equation 36
CM
Q tcandcand i
i ii( )
=×
( )
( ) ( )where:i = replicate number.
(ii) With a number counting device asa detector:
(A) Install the particle sizefractionator into one of the legs of thedivided flow apparatus.
(B) Quantify and record the aerosolnumber concentration of the primaryparticles passing through thefractionator as Ccand(i).
(C) Divert the flow from the legcontaining the candidate fractionator tothe bypass leg. Allow sufficient time forthe aerosol concentration to stabilize.
(D) Quantify and record the aerosolnumber concentration of the primaryparticles passing through the bypass legas Ctotal(i).
(iii) Calculate and record samplingeffectiveness of the candidate sampleras:
Equation 37
EC
Ci
cand i
total i( )
= ×( )
( )100%
where:i = replicate number.
(6) Repeat step in paragraph (g)(5) ofthis section, as appropriate, to obtain aminimum of three replicatemeasurements of samplingeffectiveness.
(7) Calculate the mean and coefficientof variation for replicate measurementsof effectiveness. (i) Calculate and recordthe mean sampling effectiveness of thecandidate sampler as:
Equation 38
E
E
n
ii
n
=( )
=∑
1
where:i = replicate number.
(ii)(A) Calculate and record thecoefficient of variation for the replicatesampling effectiveness measurements ofthe candidate sampler as:
Equation 39
CV
En
E
n EE
i ii
n
i
n
=
−
−× ×
( ) ( )==∑∑ 2
1
2
1
1
1
1100%
where:i = replicate number; andn = number of replicates.
(B) If the coefficient of variation is notless than 10 percent, then the test runmust be repeated (steps in paragraphs(g)(1) through (g)(7) of this section).
(8) Repeat steps in paragraphs (g)(1)through (g)(7) of this section for eachparticle size specified in Table F-2 ofthis subpart.
(h) Calculations—(1) Treatment ofmultiplets. For all measurements madeby fluorometric analysis, data shall becorrected for the presence of multipletsas described in § 53.62(f)(1). Datacollected using a real-time device (asdescribed in paragraph (c)(3)(ii)) of thissection will not require multipletcorrection.
(2) Cutpoint determination. For eachwind speed determine the sampler Dp50
cutpoint defined as the aerodynamicparticle size corresponding to 50percent effectiveness from the multipletcorrected smooth curve.
(3) Graphical analysis and numericalintegration with ambient distributions.Follow the steps outlined in§ 53.62(e)(3) through (e)(4) to calculatethe estimated concentrationmeasurement ratio between thecandidate sampler and a referencemethod sampler.
(i) Test evaluation. The candidatemethod passes the static fractionator testif the values of Rc and Dp50 for eachdistribution meets the specifications inTable F-1 of this subpart.
§ 53.65 Test procedure: Loading test.(a) Overview. (1) The loading tests are
designed to quantify any appreciablechanges in a candidate methodsampler’s performance as a function ofcoarse aerosol collection. The candidatesampler is exposed to a mass of coarseaerosol equivalent to sampling a massconcentration of 150 ©g/m3 over thetime period that the manufacturer hasspecified between periodic cleaning.After loading, the candidate sampler isthen evaluated by performing the test in§ 53.62 (full wind tunnel test), § 53.63(wind tunnel inlet aspiration test), or§ 53.64 (static fractionator test). If theacceptance criteria are met for thisevaluation test, then the candidatesampler is approved for multi-daysampling with the periodic maintenanceschedule as specified by the candidatemethod. For example, if the candidatesampler passes the reevaluation testsfollowing loading with an aerosol massequivalent to sampling a 150 ©g/m3
aerosol continuously for 7 days, thenthe sampler is approved for 7 day fieldoperation before cleaning is required.
(b) Technical definition. Effectivenessafter loading is the ratio (expressed as apercentage) of the mass concentration ofparticles of a given size reaching thesampler filter to the mass concentrationof particles of the same size approachingthe sampler.
(c) Facilities and equipmentrequired—(1) Particle delivery system.The particle delivery system shallconsist of a static chamber or a lowvelocity wind tunnel having a

38824 Federal Register / Vol. 62, No. 138 / Friday, July 18, 1997 / Rules and Regulations
sufficiently large cross-sectional areasuch that the test sampler, or portionthereof, may be installed in the testsection. At a minimum, the system musthave a sufficiently large cross section tohouse the candidate sampler inlet aswell as a collocated isokinetic nozzle formeasuring total aerosol concentration.The mean velocity in the test section ofthe static chamber or wind tunnel shallnot exceed 2 km/hr.
(2) Aerosol generation equipment. Forpurposes of these tests, the test aerosolshall be produced from commerciallyavailable, bulk Arizona road dust. Toprovide direct interlaboratorycomparability of sampler loadingcharacteristics, the bulk dust isspecified as 0-10 ©m ATD availablefrom Powder Technology Incorporated(Burnsville, MN). A fluidized bedaerosol generator, Wright dust feeder, orsonic nozzle shall be used to efficientlydeagglomerate the bulk test dust andtransform it into an aerosol cloud. Otherdust generators may be used contingentupon prior approval by the Agency.
(3) Isokinetic sampler. Mean aerosolconcentration within the static chamberor wind tunnel shall be establishedusing a single isokinetic samplercontaining a preweighed high-efficiencytotal filter.
(4) Analytic balance. An analyticalbalance shall be used to determine theweight of the total filter in the isokineticsampler. The precision and accuracy ofthis device shall be such that therelative measurement error is less than5.0 percent for the difference betweenthe initial and final weight of the totalfilter. The identical analytic balanceshall be used to perform both initial andfinal weighing of the total filter.
(d) Test procedure. (1) Calculate andrecord the target time weightedconcentration of Arizona road dustwhich is equivalent to exposing thesampler to an environment of 150 ©g/m3
over the time between cleaningspecified by the candidate sampler’soperations manual as:
Equation 40
Target TWC = ×150 3µg m twhere:t = the number of hours specified by thecandidate method prior to periodic cleaning.
(2) Clean the candidate sampler. (i)Clean and dry the internal surfaces ofthe candidate sampler.
(ii) Prepare the internal surfaces instrict accordance with the operatingmanual referred to in section 7.4.18 of40 CFR part 50, Appendix L.
(3) Determine the preweight of thefilter that shall be used in the isokineticsampler. Record this value as InitWt.
(4) Install the candidate sampler’sinlet and the isokinetic sampler withinthe test chamber or wind tunnel.
(5) Generate a dust cloud. (i) Generatea dust cloud composed of Arizona testdust.
(ii) Introduce the dust cloud into thechamber.
(iii) Allow sufficient time for theparticle concentration to become steadywithin the chamber.
(6) Sample aerosol with a total filterand the candidate sampler. (i) Samplethe aerosol for a time sufficient toproduce an equivalent TWC equal tothat of the target TWC ± 15 percent.
(ii) Record the sampling time as t.(7) Determine the time weighted
concentration. (i) Determine thepostweight of the isokinetic sampler’stotal filter.
(ii) Record this value as FinalWt.(iii) Calculate and record the TWC as:
Equation 41
TWCFinalWt InitWt t
Q=
−( ) ×
where:Q = the flow rate of the candidate method.
(iv) If the value of TWC deviates fromthe target TWC ± 15 percent, then theloaded mass is unacceptable and theentire test procedure must be repeated.
(8) Determine the candidate sampler’seffectiveness after loading. Thecandidate sampler’s effectiveness as afunction of particle aerodynamicdiameter must then be evaluated byperforming the test in § 53.62 (full windtunnel test). A sampler which fits thecategory of inlet deviation in§ 53.60(e)(1) may opt to perform the testin § 53.63 (inlet aspiration test) in lieuof the full wind tunnel test. A samplerwhich fits the category of fractionatordeviation in § 53.60(e)(2) may opt toperform the test in § 53.64 (staticfractionator test) in lieu of the full windtunnel test.
(e) Test results. If the candidatesampler meets the acceptance criteriafor the evaluation test performed inparagraph (d)(8) of this section, then thecandidate sampler passes this test withthe stipulation that the sampling trainbe cleaned as directed by and asfrequently as that specified by thecandidate sampler’s operations manual.
§ 53.66 Test procedure: Volatility test.
(a) Overview. This test is designed toensure that the candidate method’slosses due to volatility when samplingsemi-volatile ambient aerosol will becomparable to that of a federal referencemethod sampler. This is accomplishedby challenging the candidate samplerwith a polydisperse, semi-volatile liquid
aerosol in three distinct phases. Duringphase A of this test, the aerosol iselevated to a steady-state, test-specifiedmass concentration and the samplefilters are conditioned and preweighed.In phase B, the challenge aerosol issimultaneously sampled by thecandidate method sampler and areference method sampler onto thepreweighed filters for a specified timeperiod. In phase C (the blow-off phase),aerosol and aerosol-vapor free air issampled by the samplers for anadditional time period to partiallyvolatilize the aerosol on the filters. Thecandidate sampler passes the volatilitytest if the acceptance criteria presentedin Table F-1 of this subpart are met orexceeded.
(b) Technical definitions. (1) Residualmass (RM) is defined as the weight ofthe filter after the blow-off phasesubtracted from the initial weight of thefilter.
(2) Corrected residual mass (CRM) isdefined as the residual mass of the filterfrom the candidate sampler multipliedby the ratio of the reference methodflow rate to the candidate method flowrate.
(c) Facilities and equipmentrequired—(1) Environmental chamber.Because the nature of a volatile aerosolis greatly dependent uponenvironmental conditions, all phases ofthis test shall be conducted at atemperature of 22.0 ± 0.5 °C and arelative humidity of 40 ± 3 percent. Forthis reason, it is strongly advised that allweighing and experimental apparatus behoused in an environmental chambercapable of this level of control.
(2) Aerosol generator. The aerosolgenerator shall be a pressure nebulizeroperated at 20 to 30 psig (140 to 207kPa) to produce a polydisperse, semi-voltile aerosol with a mass mediandiameter larger than 1 ©m and smallerthan 2.5 ©m. The nebulized liquid shallbe A.C.S. reagent grade glycerol (C3H8O,FW = 92.09, CAS 56–81–5) of 99.5percent minimum purity. For thepurpose of this test the accepted massmedian diameter is predicated on thestable aerosol inside the internalchamber and not on the aerosolemerging from the nebulizer nozzle.Aerosol monitoring and its stability aredescribed in (c)(3) and (c)(4) of thissection.
(3) Aerosol monitoring equipment.The evaporation and condensationdynamics of a volatile aerosol is greatlydependent upon the vapor pressure ofthe volatile component in the carriergas. The size of an aerosol becomesfixed only when an equilibrium isestablished between the aerosol and thesurrounding vapor; therefore, aerosol

38825Federal Register / Vol. 62, No. 138 / Friday, July 18, 1997 / Rules and Regulations
size measurement shall be used as asurrogate measure of this equilibrium. Asuitable instrument with a range of 0.3to 10 ©m, an accuracy of 0.5 ©m, and aresolution of 0.2 ©m (e.g., an opticalparticle sizer, or a time-of-flightinstrument) shall be used for thispurpose. The parameter monitored forstability shall be the mass medianinstrument measured diameter (i.e.optical diameter if an optical particlecounter is used). A stable aerosol shallbe defined as an aerosol with a massmedian diameter that has changed lessthan 0.25 ©m over a 4 hour time period.
(4) Internal chamber. The timerequired to achieve a stable aerosoldepends upon the time during whichthe aerosol is resident with thesurrounding air. This is a function of theinternal volume of the aerosol transportsystem and may be facilitated byrecirculating the challenge aerosol. Achamber with a volume of 0.5 m3 anda recirculating loop (airflow ofapproximately 500 cfm) isrecommended for this purpose. Inaddition, a baffle is recommended todissipate the jet of air that therecirculating loop can create.Furthermore, a HEPA filtered hole inthe wall of the chamber is suggested toallow makeup air to enter the chamberor excess air to exit the chamber tomaintain a system flow balance. Theconcentration inside the chamber shallbe maintained at 1 mg/m3 ± 20 percentto obtain consistent and significant filterloading.
(5) Aerosol sampling manifold. Amanifold shall be used to extract theaerosol from the area in which it isequilibrated and transport it to thecandidate method sampler, thereference method sampler, and theaerosol monitor. The losses in each legof the manifold shall be equivalent suchthat the three devices will be exposed toan identical aerosol.
(6) Chamber air temperaturerecorders. Minimum range 15-25 °C,certified accuracy to within 0.2 °C,resolution of 0.1 °C. Measurement shallbe made at the intake to the samplingmanifold and adjacent to the weighinglocation.
(7) Chamber air relative humidityrecorders. Minimum range 30 - 50percent, certified accuracy to within 1percent, resolution of 0.5 percent.Measurement shall be made at theintake to the sampling manifold andadjacent to the weighing location.
(8) Clean air generation system. Asource of aerosol and aerosol-vapor freeair is required for phase C of this test.This clean air shall be produced byfiltering air through an absolute (HEPA)filter.
(9) Balance. Minimum range 0 - 200mg, certified accuracy to within 10 ©g,resolution of 1 ©g.
(d) Additional filter handlingconditions. (1) Filter handling. Carefulhandling of the filter during sampling,conditioning, and weighing is necessaryto avoid errors due to damaged filters orloss of collected particles from thefilters. All filters must be weighedimmediately after phase A dynamicconditioning and phase C.
(2) Dynamic conditioning of filters.Total dynamic conditioning is requiredprior to the initial weight determined inphase A. Dynamic conditioning refers topulling clean air from the clean airgeneration system through the filters.Total dynamic conditioning can beestablished by sequential filter weighingevery 30 minutes following repetitivedynamic conditioning. The filters areconsidered sufficiently conditioned ifthe sequential weights are repeatable to± 3 ©g.
(3) Static charge. The followingprocedure is suggested for minimizingcharge effects. Place six or morePolonium static control devices (PSCD)inside the microbalance weighingchamber, (MWC). Two of them must beplaced horizontally on the floor of theMWC and the remainder placedvertically on the back wall of the MWC.Taping two PSCD’s together or usingdouble-sided tape will help to keepthem from falling. Place the filter that isto be weighed on the horizontal PSCDsfacing aerosol coated surface up. Closethe MWC and wait 1 minute. Open theMWC and place the filter on the balancedish. Wait 1 minute. If the charges havebeen neutralized the weight willstabilize within 30-60 seconds. Repeatthe procedure of neutralizing chargesand weighing as prescribed aboveseveral times (typically 2-4 times) untilconsecutive weights will differ by nomore than 3 micrograms. Record the lastmeasured weight and use this value forall subsequent calculations.
(e) Test procedure—(1) Phase A -Preliminary steps. (i) Generate apolydisperse glycerol test aerosol.
(ii) Introduce the aerosol into thetransport system.
(iii) Monitor the aerosol size andconcentration until stability and levelhave been achieved.
(iv) Condition the candidate methodsampler and reference method samplerfilters until total dynamic conditioningis achieved as specified in paragraph(d)(2) of this section.
(v) Record the dynamicallyconditioned weight as InitWtc andInitWtr where c is the candidate methodsampler and r is the reference methodsampler.
(2) Phase B - Aerosol loading. (i)Install the dynamically conditionedfilters into the appropriate samplers.
(ii) Attach the samplers to themanifold.
(iii) Operate the candidate and thereference samplers such that theysimultaneously sample the test aerosolfor 30 minutes.
(3) Phase C - Blow-off. (i) Alter theintake of the samplers to sample airfrom the clean air generation system.
(ii) Sample clean air for one of therequired blow-off time durations (1, 2, 3,and 4 hours).
(iii) Remove the filters from thesamplers.
(iv) Weigh the filters immediately andrecord this weight, FinalWtc andFinalWtr, where c is the candidatemethod sampler and r is the referencemethod sampler.
(v) Calculate the residual mass for thereference method sampler:
Equation 41a
RM FinalWt InitWtij r r( ) = −( )where:i = repetition number; andj = blow-off time period.
(vi) Calculate the corrected residualmass for the candidate method sampleras:
Equation 41b
CRM FinalWt InitWtQ
Qij r rr
c( ) = −( ) ×
where:i = repetition number;j = blow-off time period;Qc = candidate method sampler flow rate,andQr = reference method sampler flow rate.
(4) Repeat steps in paragraph (e)(1)through (e)(3) of this section until threerepetitions have been completed foreach of the required blow-off timedurations (1, 2, 3, and 4 hours).
(f) Calculations and analysis. (1)Perform a linear regression with thecandidate method CRM as thedependent variable and the referencemethod RM as the independent variable.
(2) Determine the following regressionparameters: slope, intercept, andcorrelation coefficient (r).
(g) Test results. The candidate methodpasses the volatility test if the regressionparameters meet the acceptance criteriaspecified in Table F-1 of this subpart.
Tables to Subpart F of Part 53

38826 Federal Register / Vol. 62, No. 138 / Friday, July 18, 1997 / Rules and Regulations
TABLE F–1.—PERFORMANCE SPECIFICATIONS FOR PM2.5 CLASS II EQUIVALENT SAMPLERS
Performance Test Specifications Acceptance Criteria
§ 53.62 Full Wind Tunnel Evaluation ............. Solid VOAG produced aerosol at 2 km/hr and24 km/hr.
Dp50 = 2.5 µm ± 0.2 µm; Numerical AnalysisResults: 95% ≤Rc≤105%
§ 53.63 Wind Tunnel Inlet Aspiration Test ..... Liquid VOAG produced aerosol at 2 km/hr and24 km/hr
Relative Aspiration: 95% ≤A≤105%
§ 53.64 Static Fractionator Test ..................... Evaluation of the fractionator under static con-ditions
Dp50 = 2.5 µm ± 0.2 µm; Numerical AnalysisResults: 95% ≤Rc≤105%
§ 53.65 Loading Test ...................................... Loading of the clean candidate under labora-tory conditions
Acceptance criteria as specified in the post-loading evaluation test (§ 53.62, § 53.63, or§ 53.64)
§ 53.66 Volatility Test ..................................... Polydisperse liquid aerosol produced by airnebulization of A.C.S. reagent grade glycerol,99.5% minimum purity
Regression Parameters Slope = 1 ± 0.1, Inter-cept = 0 ± 0.15 r ≥ 0.97
TABLE F–2.—PARTICLE SIZES AND WIND SPEEDS FOR FULL WIND TUNNEL TEST, WIND TUNNEL INLET ASPIRATION TEST,AND STATIC CHAMBER TEST
Primary Partical Mean Size a (µm)Full Wind Tunnel Test Inlet Aspiration Test Static
FractionatorTest
VolatilityTest2 km/hr 24 km/hr 2 km/hr 24 km/hr
1.5±0.25 ................................................................................................. S S S2.0±0.25 ................................................................................................. S S S2.2±0.25 ................................................................................................. S S S2.5±0.25 ................................................................................................. S S S2.8±0.25 ................................................................................................. S S S3.0±0.25 ................................................................................................. L L3.5±0.25 ................................................................................................. S S S4.0±0.5 ................................................................................................... S S SPolydisperse Glycerol Aerosol ............................................................... L
a Aerodynamic diameter.S=Solid particles.L=Liquid particles.
TABLE F–3.—CRITICAL PARAMETERS OF IDEALIZED AMBIENT PARTICLE SIZE DISTRIBUTIONS
Idealized Distribution
Fine Particle Mode Coarse Particle Mode
PM2.5/PM10Ratio
FRMSamplerExpected
MassConc.
(µg/m3)
MMD(µm)
Geo. Std.Dev.
Conc.(µg/m3)
MMD(µm)
Geo. Std.Dev.
Conc.(µg/m3)
Coarse ............................................................... 0.50 2 12.0 10 2 88.0 0.27 13.814‘‘Typical’’ ............................................................ 0.50 2 33.3 10 2 66.7 0.55 34.284Fine .................................................................... 0.85 2 85.0 15 2 15.0 0.94 78.539
TABLE F-4.—ESTIMATED MASS CONCENTRATION MEASUREMENT OF PM2.5 FOR IDEALIZED COARSE AEROSOL SIZEDISTRIBUTION
Particle AerodynamicDiameter (µm)
Test Sampler Ideal Sampler
Fractional Sam-pling Effective-
ness
Interval MassConcentration
(µg/m3)
Estimated MassConcentrationMeasurement
(µg/m3)
Fractional Sam-pling Effective-
ness
Interval MassConcentration
(µg/m3)
Estimated MassConcentrationMeasurement
(µg/m3)
(1) (2) (3) (4) (5) (6) (7)
<0.500 1.000 6.001 1.000 6.001 6.0010.625 2.129 0.999 2.129 2.1270.750 0.982 0.998 0.982 0.9800.875 0.730 0.997 0.730 0.7281.000 0.551 0.995 0.551 0.5481.125 0.428 0.991 0.428 0.4241.250 0.346 0.987 0.346 0.3421.375 0.294 0.980 0.294 0.2881.500 0.264 0.969 0.264 0.2561.675 0.251 0.954 0.251 0.2391.750 0.250 0.932 0.250 0.2331.875 0.258 0.899 0.258 0.232
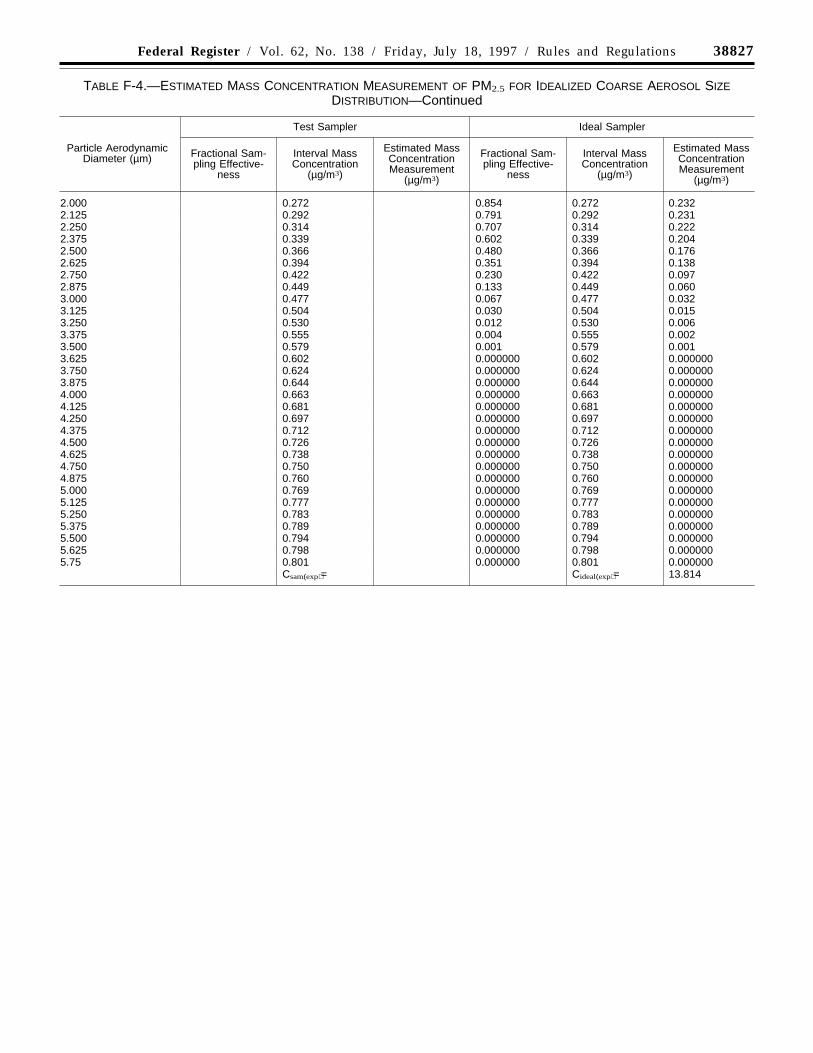
38827Federal Register / Vol. 62, No. 138 / Friday, July 18, 1997 / Rules and Regulations
TABLE F-4.—ESTIMATED MASS CONCENTRATION MEASUREMENT OF PM2.5 FOR IDEALIZED COARSE AEROSOL SIZEDISTRIBUTION—Continued
Particle AerodynamicDiameter (µm)
Test Sampler Ideal Sampler
Fractional Sam-pling Effective-
ness
Interval MassConcentration
(µg/m3)
Estimated MassConcentrationMeasurement
(µg/m3)
Fractional Sam-pling Effective-
ness
Interval MassConcentration
(µg/m3)
Estimated MassConcentrationMeasurement
(µg/m3)
2.000 0.272 0.854 0.272 0.2322.125 0.292 0.791 0.292 0.2312.250 0.314 0.707 0.314 0.2222.375 0.339 0.602 0.339 0.2042.500 0.366 0.480 0.366 0.1762.625 0.394 0.351 0.394 0.1382.750 0.422 0.230 0.422 0.0972.875 0.449 0.133 0.449 0.0603.000 0.477 0.067 0.477 0.0323.125 0.504 0.030 0.504 0.0153.250 0.530 0.012 0.530 0.0063.375 0.555 0.004 0.555 0.0023.500 0.579 0.001 0.579 0.0013.625 0.602 0.000000 0.602 0.0000003.750 0.624 0.000000 0.624 0.0000003.875 0.644 0.000000 0.644 0.0000004.000 0.663 0.000000 0.663 0.0000004.125 0.681 0.000000 0.681 0.0000004.250 0.697 0.000000 0.697 0.0000004.375 0.712 0.000000 0.712 0.0000004.500 0.726 0.000000 0.726 0.0000004.625 0.738 0.000000 0.738 0.0000004.750 0.750 0.000000 0.750 0.0000004.875 0.760 0.000000 0.760 0.0000005.000 0.769 0.000000 0.769 0.0000005.125 0.777 0.000000 0.777 0.0000005.250 0.783 0.000000 0.783 0.0000005.375 0.789 0.000000 0.789 0.0000005.500 0.794 0.000000 0.794 0.0000005.625 0.798 0.000000 0.798 0.0000005.75 0.801 0.000000 0.801 0.000000
Csam(exp)= Cideal(exp)= 13.814

38828 Federal Register / Vol. 62, No. 138 / Friday, July 18, 1997 / Rules and Regulations
TABLE F-5.—ESTIMATED MASS CONCENTRATION MEASUREMENT OF PM2.5 FOR IDEALIZED ‘‘TYPICAL’’ COARSE AEROSOLSIZE DISTRIBUTION
Particle AerodynamicDiameter (µm)
Test Sampler Ideal Sampler
Fractional Sam-pling Effective-
ness
Interval MassConcentration
(µg/m3)
Estimated MassConcentrationMeasurement
(µg/m3)
Fractional Sam-pling Effective-
ness
Interval MassConcentration
(µg/m3)
Estimated MassConcentrationMeasurement
(µg/m3)
(1) (2) (3) (4) (5) (6) (7)
<0.500 1.000 16.651 1.000 16.651 16.6510.625 5.899 0.999 5.899 5.8930.750 2.708 0.998 2.708 2.7030.875 1.996 0.997 1.996 1.9901.000 1.478 0.995 1.478 1.4711.125 1.108 0.991 1.108 1.0981.250 0.846 0.987 0.846 0.8351.375 0.661 0.980 0.661 0.6481.500 0.532 0.969 0.532 0.5161.675 0.444 0.954 0.444 0.4241.750 0.384 0.932 0.384 0.3581.875 0.347 0.899 0.347 0.3122.000 0.325 0.854 0.325 0.2772.125 0.314 0.791 0.314 0.2482.250 0.312 0.707 0.312 0.2212.375 0.316 0.602 0.316 0.1902.500 0.325 0.480 0.325 0.1562.625 0.336 0.351 0.336 0.1182.750 0.350 0.230 0.350 0.0812.875 0.366 0.133 0.366 0.0493.000 0.382 0.067 0.382 0.0263.125 0.399 0.030 0.399 0.0123.250 0.416 0.012 0.416 0.0053.375 0.432 0.004 0.432 0.0023.500 0.449 0.001 0.449 0.0000003.625 0.464 0.000000 0.464 0.0000003.750 0.480 0.000000 0.480 0.0000003.875 0.494 0.000000 0.494 0.0000004.000 0.507 0.000000 0.507 0.0000004.125 0.520 0.000000 0.520 0.0000004.250 0.000000 0.532 0.0000004.375 0.000000 0.543 0.0000004.500 0.000000 0.553 0.0000004.625 0.000000 0.562 0.0000004.750 0.000000 0.570 0.0000004.875 0.000000 0.577 0.0000005.000 0.000000 0.584 0.0000005.125 0.000000 0.590 0.0000005.250 0.000000 0.595 0.0000005.375 0.000000 0.599 0.0000005.500 0.000000 0.603 0.0000005.625 0.000000 0.605 0.0000005.75 0.000000 0.608 0.000000
Csam(exp)= Cideal(exp)= 34.284

38829Federal Register / Vol. 62, No. 138 / Friday, July 18, 1997 / Rules and Regulations
TABLE F-6.—ESTIMATED MASS CONCENTRATION MEASUREMENT OF PM2.5 FOR IDEALIZED FINE AEROSOL SIZEDISTRIBUTION
Particle AerodynamicDiameter (µm)
Test Sampler Ideal Sampler
Fractional Sam-pling Effective-
ness
Interval MassConcentration
(µg/m3)
Estimated MassConcentrationMeasurement
(µg/m3)
Fractional Sam-pling Effective-
ness
Interval MassConcentration
(µg/m3)
Estimated MassConcentrationMeasurement
(µg/m3)
(1) (2) (3) (4) (5) (6) (7)
<0.500 1.000 18.868 1.000 18.868 18.8680.625 13.412 0.999 13.412 13.3990.750 8.014 0.998 8.014 7.9980.875 6.984 0.997 6.984 6.9631.000 5.954 0.995 5.954 5.9241.125 5.015 0.991 5.015 4.9701.250 4.197 0.987 4.197 4.1421.375 3.503 0.980 3.503 3.4331.500 2.921 0.969 2.921 2.8301.675 2.438 0.954 2.438 2.3261.750 2.039 0.932 2.039 1.9001.875 1.709 0.899 1.709 1.5362.000 1.437 0.854 1.437 1.2272.125 1.212 0.791 1.212 0.9592.250 1.026 0.707 1.026 0.7252.375 0.873 0.602 0.873 0.5262.500 0.745 0.480 0.745 0.3582.625 0.638 0.351 0.638 0.2242.750 0.550 0.230 0.550 0.1272.875 0.476 0.133 0.476 0.0633.000 0.414 0.067 0.414 0.0283.125 0.362 0.030 0.362 0.0113.250 0.319 0.012 0.319 0.0043.375 0.282 0.004 0.282 0.0013.500 0.252 0.001 0.252 0.0000003.625 0.226 0.000000 0.226 0.0000003.750 0.204 0.000000 0.204 0.0000003.875 0.185 0.000000 0.185 0.0000004.000 0.170 0.000000 0.170 0.0000004.125 0.157 0.000000 0.157 0.0000004.250 0.146 0.000000 0.146 0.0000004.375 0.136 0.000000 0.136 0.0000004.500 0.129 0.000000 0.129 0.0000004.625 0.122 0.000000 0.122 0.0000004.750 0.117 0.000000 0.117 0.0000004.875 0.112 0.000000 0.112 0.0000005.000 0.108 0.000000 0.108 0.0000005.125 0.105 0.000000 0.105 0.0000005.250 0.102 0.000000 0.102 0.0000005.375 0.100 0.000000 0.100 0.0000005.500 0.098 0.000000 0.098 0.0000005.625 0.097 0.000000 0.097 0.0000005.75 0.096 0.000000 0.096 0.000000
Csam(exp)= Cideal(exp)= 78.539

38830 Federal Register / Vol. 62, No. 138 / Friday, July 18, 1997 / Rules and Regulations
Figures to Subpart F of Part 53
Figure E-1.—Designation Testing Checklist
DESIGNATION TESTING CHECKLIST FOR CLASS II
llllllllll llllllllll llllllllll
Auditee Auditor signature Date
Compliance Status: Y = Yes N = No NA = Not applicable/Not available
Verification Comments (Includes documentation ofwho, what, where, when, why) (Doc. #, Rev. #,
Rev. Date)Verification Verified by Direct Observation of Process or of
Documented Evidence: Performance, Design orApplication Spec. Corresponding to Sections of 40
CFR Part 53, Subparts E and FY N NA
Subpart E: Performance Specification Tests
Evaluation completed according to Subpart E§ 53.50 to § 53.56
Subpart E: Class I Sequential Tests
Class II samplers that are also Class I(sequentialized) have passed the tests in§ 53.57
Subpart F: Performance Spec/Test
Evaluation of Physical Characteristics of CleanSampler - One of these tests must be per-formed:
§ 53.62 - Full Wind Tunnel§ 53.63 - Inlet Aspiration§ 53.64 - Static Fractionator
Evaluation of Physical Characteristics of LoadedSampler
§ 53.65 Loading TestOne of the following tests must be performed for
evaluation after loading: § 53.62, § 53.63,§ 53.64
Evaluation of the Volatile Characteristics of theClass II Sampler § 53.66
Appendix A to Subpart F of Part 53—References
(1) Marple, V.A., K.L. Rubow, W. Turner,and J.D. Spangler, Low Flow Rate Sharp CutImpactors for Indoor Air Sampling: Designand Calibration., JAPCA, 37: 1303-1307(1987).
(2) Vanderpool, R.W. and K.L. Rubow,Generation of Large, Solid CalibrationAerosols, J. of Aer. Sci. and Tech., 9:65-69(1988).
(3) Society of Automotive EngineersAerospace Material Specification (SAE AMS)2404C, Electroless Nickel Planting, SAE, 400Commonwealth Drive, Warrendale PA-15096,Revised 7-1-84, pp. 1-6.
PART 58—[AMENDED]
2. In part 58:a. The authority citation for part 58
continues to read as follows:Authority: 42 U.S.C. 7410, 7601(a), 7613,
7619.
b. Section 58.1 is amended byremoving the existing alphabetic
paragraph designations, byalphabetizing the existing definitions,by revising the definition Traceable andby adding in alphabetical order thefollowing definitions to read as follows:
§ 58.1 Definitions.
* * * * *Annual State air monitoring report is
an annual report, prepared by controlagencies and submitted to EPA forapproval, that consists of an annual datasummary report for all pollutants and adetailed report describing any proposedchanges to their air quality surveillancenetwork.
* * * * *Community Monitoring Zone (CMZ)
means an optional averaging area withestablished, well defined boundaries,such as county or census block, withina MPA that has relatively uniformconcentrations of annual PM2.5 asdefined by Appendix D of this part. Twoor more core SLAMS and other monitors
within a CMZ that meet certainrequirements as set forth in Appendix Dof this part may be averaged for makingcomparisons to the annual PM2.5
NAAQS.Consolidated Metropolitan Statistical
Area (CMSA) means the most recentarea as designated by the U.S. Office ofManagement and Budget andpopulation figures from the Bureau ofthe Census. The Department ofCommerce provides that withinmetropolitan complexes of 1 million ormore population, separate componentareas are defined if specific criteria aremet. Such areas are designated primarymetropolitan statistical areas (PMSAs;and any area containing PMSAs isdesignated CMSA.
Core PM2.5 SLAMS means community-oriented monitoring sites representativeof community-wide exposures that arethe basic component sites of the PM2.5
SLAMS regulatory network. Core PM2.5
SLAMS include community-oriented

38831Federal Register / Vol. 62, No. 138 / Friday, July 18, 1997 / Rules and Regulations
SLAMS monitors, and sites collocated atPAMS.
* * * * *Correlated acceptable continuous
(CAC) PM analyzer means an optionalfine particulate matter analyzer that canbe used to supplement a PM2.5 referenceor equivalent sampler, in accordancewith the provisions of § 58.13(f).
* * * * *Equivalent method means a method of
sampling and analyzing the ambient airfor an air pollutant that has beendesignated as an equivalent method inaccordance with part 53 of this chapter;it does not include a method for whichan equivalent method designation hasbeen canceled in accordance with§ 53.11 or § 53.16 of this chapter.
* * * * *Metropolitan Statistical Area (MSA)
means the most recent area asdesignated by the U.S. Office ofManagement and Budget andpopulation figures from the U.S. Bureauof the Census. The Department ofCommerce defines a metropolitan areaas one of a large population nucleus,together with adjacent communities thathave a high degree of economic andsocial integration with that nucleus.
* * * * *Monitoring Planning Area (MPA)
means a contiguous geographic areawith established, well definedboundaries, such as a metropolitanstatistical area, county or State, havinga common area that is used for planningmonitoring locations for PM2.5. MPAsmay cross State boundaries, such as thePhiladelphia PA-NJ MSA, and be furthersubdivided into community monitoringzones. MPAs are generally orientedtoward areas with populations greaterthan 200,000, but for convenience, thoseportions of a State that are notassociated with MSAs can beconsidered as a single MPA. MPAs mustbe defined, where applicable, in a StatePM monitoring network description.
* * * * *Particulate matter monitoring network
description, required by § 58.20(f),means a detailed plan, prepared bycontrol agencies and submitted to EPAfor approval, that describes their PM2.5
and PM10 air quality surveillancenetwork.
* * * * *PM2.5 means particulate matter with
an aerodynamic diameter less than orequal to a nominal 2.5 micrometers asmeasured by a reference method basedon 40 CFR part 50, Appendix L, anddesignated in accordance with part 53 ofthis chapter or by an equivalent methoddesignated in accordance with part 53 ofthis chapter.
* * * * *
Population-oriented monitoring (orsites) applies to residential areas,commercial areas, recreational areas,industrial areas, and other areas wherea substantial number of people mayspend a significant fraction of their day.
Primary Metropolitan Statistical Area(PMSA) is a separate component of aconsolidated metropolitan statisticalarea. For the purposes of this part,PMSA is used interchangeably withMSA.
* * * * *Reference method means a method of
sampling and analyzing the ambient airfor an air pollutant that will be specifiedas a reference method in an appendix topart 50 of this chapter, or a method thathas been designated as a referencemethod in accordance with this part; itdoes not include a method for which areference method designation has beencanceled in accordance with § 53.11 or§ 53.16 of this chapter.
* * * * *Special Purpose Monitor (SPM) is a
generic term used for all monitors otherthan SLAMS, NAMS, PAMS, and PSDmonitors included in an agency’smonitoring network for monitors usedin a special study whose data areofficially reported to EPA.
* * * * *Traceable means that a local standard
has been compared and certified, eitherdirectly or via not more than oneintermediate standard, to a NationalInstitute of Standards and Technology(NIST)-certified primary standard suchas a NIST-Traceable Reference Material(NTRM) or a NIST-certified GasManufacturer’s Internal Standard(GMIS).
* * * * *c. Section 58.13 is amended by
revising paragraphs (b) and (d) andadding new paragraphs (e) and (f) toread as follows:
§ 58.13 Operating schedule.* * * * *(b) For manual methods (excluding
PM10 samplers, PM2.5 samplers, andPAMS VOC samplers), at least one 24–hour sample must be obtained everysixth day except during periods orseasons exempted by the RegionalAdministrator.
* * * * *(d) For PM10 samplers--a 24–hour
sample must be taken a minimum ofevery third day.
(e) For PM2.5 samplers, a 24–hoursample is required everyday for certaincore SLAMS, including certain PAMS,as described in section 2.8.1.3 ofAppendix D of this part, except duringseasons or periods of low PM2.5 asotherwise exempted by the Regional
Administrator. A waiver of the everydaysampling schedule for SLAMS may begranted by the Regional Administratoror designee, and for NAMS by theAdministrator or designee, for 1calendar year from the time a PM2.5
sequential sampler (FRM or Class Iequivalent) has been approved by EPA.A 24–hour sample must be taken aminimum of every third day for all otherSLAMS, including NAMS, as describedin section 2.8.1.3 of Appendix D of thispart, except when exempted by theRegional Administrator in accordancewith forthcoming EPA guidance. Duringperiods for which exemptions to everythird day or every day sampling areallowed for core PM2.5 SLAMS, aminimum frequency of one in 6-daysampling is still required. However,alternative sampling frequencies areallowed for SLAMS sites that areprincipally intended for comparisons tothe 24–hour NAAQS. Suchmodifications must be approved by theRegional Administrator.
(f) Alternatives to everyday samplingat sites with correlated acceptablecontinuous analyzers. (1) Certain PM2.5
core SLAMS sites located in monitoringplanning areas (as described in section2.8 of Appendix D of this part) arerequired to sample every day with areference or equivalent methodoperating in accordance with part 53 ofthis chapter and section 2 of AppendixC of this part. However, in accordancewith the monitoring priority as definedin paragraph (f)(2) of this section,established by the control agency andapproved by EPA, a core SLAMSmonitor may operate with a reference orequivalent method on a 1 in 3-dayschedule and produce data that may becompared to the NAAQS, provided thatit is collocated with an acceptablecontinuous fine particulate PM analyzerthat is correlated with the reference orequivalent method. If the alternativesampling schedule is selected by thecontrol agency and approved by EPA,the alternative schedule shall beimplemented on January 1 of the year inwhich everyday sampling is required.The selection of correlated acceptablecontinuous PM analyzers andprocedures for correlation with theintermittent reference or equivalentmethod shall be in accordance withprocedures approved by the RegionalAdministrator. Unless the continuousfine particulate analyzer satisfies therequirements of section 2 of AppendixC of this part, however, the data derivedfrom the correlated acceptablecontinuous monitor are not eligible fordirect comparisons to the NAAQS inaccordance with part 50 of this chapter.

38832 Federal Register / Vol. 62, No. 138 / Friday, July 18, 1997 / Rules and Regulations
(2) A Metropolitan Statistical Area(MSA) (or primary metropolitanstatistical area) with greater than 1million population and highconcentrations of PM2.5 (greater than orequal to 80 percent of the NAAQS) shallbe a Priority 1 PM monitoring area.Other monitoring planning areas may bedesignated as Priority 2 PM monitoringareas.
(3) Core SLAMS having a correlatedacceptable continuous analyzercollocated with a reference orequivalent method in a Priority 1 PMmonitoring area may operate on the 1 in3 sampling frequency only afterreference or equivalent data arecollected for at least 2 complete years.
(4) In all monitoring situations, witha correlated acceptable continuousalternative, FRM samplers or filter-based equivalent analyzers shouldpreferably accompany the correlatedacceptable continuous monitor.
d. Section 58.14 is revised to read asfollows:
§ 58.14 Special purpose monitors.(a) Except as specified in paragraph
(b) of this section, any ambient airquality monitoring station other than aSLAMS or PSD station from which theState intends to use the data as part ofa demonstration of attainment ornonattainment or in computing a designvalue for control purposes of theNational Ambient Air Quality Standards(NAAQS) must meet the requirementsfor SLAMS as described in § 58.22 and,after January 1, 1983, must also meet therequirements for SLAMS described in§ 58.13 and Appendices A and E of thispart.
(b) Based on the need, in transitioningto a PM2.5 standard that newly addressesthe ambient impacts of fine particles, toencourage a sufficiently extensivegeographical deployment of PM2.5
monitors and thus hasten thedevelopment of an adequate PM2.5
ambient air quality monitoringinfrastructure, PM2.5 NAAQS violationdeterminations shall not be exclusivelymade based on data produced at apopulation-oriented SPM site during thefirst 2 complete calendar years of itsoperation. However, a notice of NAAQSviolations resulting from population-oriented SPMs shall be reported to EPAin the State’s annual monitoring reportand be considered by the State in thedesign of its overall SLAMS network;these population-oriented SPMs shouldbe considered to become a permanentSLAMS during the annual networkreview in accordance with § 58.25.
(c) Any ambient air qualitymonitoring station other than a SLAMSor PSD station from which the State
intends to use the data for SIP-relatedfunctions other than as described inparagraph (a) of this section is notnecessarily required to comply with therequirements for a SLAMS station underparagraph (a) of this section but must beoperated in accordance with amonitoring schedule, methodology,quality assurance procedures, and probeor instrument-siting specificationsapproved by the RegionalAdministrator.
e. Section 58.20 is amended byrevising the section heading, paragraph(d), and the introductory text ofparagraph (e), by designating the flushtext at the end of the section asparagraph (i) and amending the thirdsentence by removing the words ‘‘(a)through (f)’’ and adding in their place,‘‘(a) through (h)’’, by redesignatingparagraph (f) as paragraph (h), andadding new paragraphs (f) and (g) toread as follows:
§ 58.20 Air quality surveillance: plancontent.
* * * * *(d) Provide for the review of the air
quality surveillance system on anannual basis to determine if the systemmeets the monitoring objectives definedin Appendix D of this part. Such reviewmust identify needed modifications tothe network such as termination orrelocation of unnecessary stations orestablishment of new stations that arenecessary. For PM2.5, the review mustidentify needed changes to core SLAMS,monitoring planning areas, the chosencommunity monitoring approachincluding optional communitymonitoring zones, SLAMS, or SPMs.
(e) Provide for having a SLAMSnetwork description available for publicinspection and submission to theAdministrator upon request. Thenetwork description must be available atthe time of plan revision submittal andmust contain the following informationfor each SLAMS:
* * * * *(f) Provide for having a PM
monitoring network descriptionavailable for public inspection whichmust provide for monitoring planningareas, and the community monitoringapproach involving core monitors andoptional community monitoring zonesfor PM2.5. The PM monitoring networkdescription for PM10 and PM2.5 must besubmitted to the Regional Administratorfor approval by July 1, 1998, and mustcontain the following information foreach PM SLAMS and PM2.5 SPM:
(1) The AIRS site identification formfor existing stations.
(2) The proposed location forscheduled stations.
(3) The sampling and analysismethod.
(4) The operating schedule.(5) The monitoring objective, spatial
scale of representativeness, andadditionally for PM2.5, the monitoringplanning area, optional communitymonitoring zone, and the site codedesignation to identify which site willbe identified as core SLAMS; andSLAMS or population-oriented SPMs, ifany, that are microscale or middle scalein their representativeness as defined inAppendix D of this part.
(6) A schedule for:(i) Locating, placing into operation,
and making available the AIRS siteidentification form for each SLAMSwhich is not located and operating atthe time of plan revision submittal.
(ii) Implementing quality assuranceprocedures of Appendix A of this partfor each SLAMS for which suchprocedures are not implemented at thetime of plan revision submittal.
(iii) Resiting each SLAMS which doesnot meet the requirements of AppendixE of this part at the time of plan revisionsubmittal.
(g) Provide for having a list of allPM2.5 monitoring locations includingSLAMS, NAMS, PAMS and population-oriented SPMs, that are included in theState’s PM monitoring networkdescription and are intended forcomparison to the NAAQS, available forpublic inspection.
* * * * *f. Section 58.23 is amended by
revising the introductory text andadding a new paragraph (c) to read asfollows:
§ 58.23 Monitoring network completion.With the exception of the PM10
monitoring networks that shall be inplace by March 16, 1998 and with theexception of the PM2.5 monitoringnetworks as described in paragraph (c)of this section:
* * * * *(c) Each PM2.5 station in the SLAMS
network must be in operation inaccordance with the minimumrequirements of Appendix D of this part,be sited in accordance with the criteriain Appendix E of this part, and belocated as described on the station’sAIRS site identification form, accordingto the following schedule:
(1) Within 1 year after September 16,1997, at least one required core PM2.5
SLAMS site in each MSA withpopulation greater than 500,000, plusone site in each PAMS area, (plus atleast two additional SLAMS sites perState) must be in operation.
(2) Within 2 years after September 16,1997, all other required SLAMS,

38833Federal Register / Vol. 62, No. 138 / Friday, July 18, 1997 / Rules and Regulations
including all required core SLAMS,required regional background andregional transport SLAMS, continuousPM monitors in areas with greater than1 million population, and all additionalrequired PM2.5 SLAMS must be inoperation.
(3) Within 3 years after September 16,1997, all additional sites (e.g., sitesclassified as SLAMS/SPM to completethe mature network) must be inoperation.
g. Section 58.26 is amended byrevising the section heading and theintroductory text of paragraph (b), andadding paragraphs (d) and (e) to read asfollows:
§ 58.26 Annual state air monitoring report.* * * * *(b) The SLAMS annual data summary
report must contain:* * * * *(d) For PM monitoring and data—(1)
The State shall submit a summary to theappropriate Regional Office (forSLAMS) or Administrator (through theRegional Office) (for NAMS) that detailsproposed changes to the PM MonitoringNetwork Description and to be inaccordance with the annual networkreview requirements in § 58.25. Thisshall discuss the existing PM networks,including modifications to the number,size or boundaries of monitoringplanning areas and optional communitymonitoring zones; number and locationof PM10 and PM2.5 SLAMS; number andlocation of core PM2.5 SLAMS;alternative sampling frequenciesproposed for PM2.5 SLAMS (includingcore PM2.5 SLAMS and PM2.5 NAMS),core PM2.5 SLAMS to be designatedPM2.5 NAMS; and PM10 and PM2.5
SLAMS to be designated PM10 and PM2.5
NAMS respectively.(2) The State shall submit an annual
summary to the appropriate RegionalOffice of all the ambient air qualitymonitoring PM data from all specialpurpose monitors that are described inthe State’s PM monitoring networkdescription and are intended for SIPpurposes. These include thosepopulation-oriented SPMs that areeligible for comparison to the PMNAAQS. The State shall certify the datain accordance with paragraph (c) of thissection.
(e) The Annual State Air MonitoringReport shall be submitted to theRegional Administrator by July 1 or byan alternative annual date to benegotiated between the State andRegional Administrator. The Regionshall provide review and approval/disapproval within 60 days. After 3years following September 16, 1997, theschedule for submitting the required
annual revised PM2.5 monitoringnetwork description may be alteredbased on a new schedule determined bythe Regional Administrator. States maysubmit an alternative PM monitoringnetwork description in which it requestsexemptions from specific requiredelements of the network design (e.g.,required number of core sites, otherSLAMS, sampling frequency, etc.). After3 years following September 16, 1997 oronce a CMZ monitoring area has beendetermined to violate the NAAQS, thenchanges to an MPA monitoring networkaffecting the violating locations shallrequire public review and notification.
h. Section 58.30 is amended byrevising the introductory text ofparagraph (a) to read as follows:
§ 58.30 NAMS network establishment.(a) By January 1, 1980, with the
exception of PM10 and PM2.5 samplers,which shall be by July 1, 1998, the Stateshall:
* * * * *i. In § 58.31, paragraph (f) is revised
to read as follows:
§ 58.31 NAMS network description.* * * * *(f) The monitoring objective, spatial
scale of representativeness, and forPM2.5, the monitoring planning area andcommunity monitoring zone, as definedin Appendix D of this part.
* * * * *j. In § 58.34, the introductory text is
revised to read as follows:
§ 58.34 NAMS network completion.With the exception of PM10 samplers,
which shall be by 1 year after September16, 1997, and PM2.5, which shall be by3 years after September 16, 1997:
* * * * *k. In § 58.35, the first sentence of
paragraph (b) is revised to read asfollows:
§ 58.35 NAMS data submittal.
* * * * *(b) The State shall report to the
Administrator all ambient air qualitydata for SO2, CO, O3, NO2, Pb, PM10, andPM2.5, and information specified by theAIRS Users Guide (Volume II, AirQuality Data Coding, and Volume III,Air Quality Data Storage) to be codedinto the AIRS-AQS format. * * *
* * * * *l. Revise Appendix A of part 58 to
read as follows:
Appendix A—Quality AssuranceRequirements for State and Local AirMonitoring Stations (SLAMS)
1. General Information.1.1 This Appendix specifies the minimum
quality assurance/quality control (QA/QC)
requirements applicable to SLAMS airmonitoring data submitted to EPA. State andlocal agencies are encouraged to develop andmaintain quality assurance programs moreextensive than the required minimum.
1.2 To assure the quality of data from airmonitoring measurements, two distinct andimportant interrelated functions must beperformed. One function is the control of themeasurement process through broad qualityassurance activities, such as establishingpolicies and procedures, developing dataquality objectives, assigning roles andresponsibilities, conducting oversight andreviews, and implementing correctiveactions. The other function is the control ofthe measurement process through theimplementation of specific quality controlprocedures, such as audits, calibrations,checks, replicates, routine self-assessments,etc. In general, the greater the control of agiven monitoring system, the better will bethe resulting quality of the monitoring data.The results of quality assurance reviews andassessments indicate whether the controlefforts are adequate or need to be improved.
1.3 Documentation of all quality assuranceand quality control efforts implementedduring the data collection, analysis, andreporting phases is important to data users,who can then consider the impact of thesecontrol efforts on the data quality (seeReference 1 of this Appendix). Bothqualitative and quantitative assessments ofthe effectiveness of these control effortsshould identify those areas most likely toimpact the data quality and to what extent.
1.4 Periodic assessments of SLAMS dataquality are required to be reported to EPA. Toprovide national uniformity in thisassessment and reporting of data quality forall SLAMS networks, specific assessment andreporting procedures are prescribed in detailin sections 3, 4, and 5 of this Appendix. Onthe other hand, the selection and extent ofthe QA and QC activities used by amonitoring agency depend on a number oflocal factors such as the field and laboratoryconditions, the objectives for monitoring, thelevel of the data quality needed, the expertiseof assigned personnel, the cost of controlprocedures, pollutant concentration levels,etc. Therefore, the quality systemrequirements, in section 2 of this Appendix,are specified in general terms to allow eachState to develop a quality assurance programthat is most efficient and effective for its owncircumstances while achieving the AmbientAir Quality Programs data quality objectives.2. Quality System Requirements.
2.1 Each State and local agency mustdevelop a quality system (Reference 2 of thisAppendix) to ensure that the monitoringresults:
(a) Meet a well-defined need, use, orpurpose.
(b) Satisfy customers’ expectations.(c) Comply with applicable standards
specifications.(d) Comply with statutory (and other)
requirements of society.(e) Reflect consideration of cost and
economics.(f) Implement a quality assurance program
consisting of policies, procedures,specifications, standards, and documentationnecessary to:

38834 Federal Register / Vol. 62, No. 138 / Friday, July 18, 1997 / Rules and Regulations
(1) Provide data of adequate quality to meetmonitoring objectives, and
(2) Minimize loss of air quality data due tomalfunctions or out-of-control conditions.This quality assurance program must bedescribed in detail, suitably documented inaccordance with Agency requirements(Reference 4 of this Appendix), and approvedby the appropriate Regional Administrator, orthe Regional Administrator’s designee. TheQuality Assurance Program will be reviewedduring the systems audits described insection 2.5 of this Appendix.
2.2 Primary requirements and guidancedocuments for developing the qualityassurance program are contained inReferences 2 through 7 of this Appendix,which also contain many suggested andrequired procedures, checks, and controlspecifications. Reference 7 of this Appendixdescribes specific guidance for thedevelopment of a QA Program for SLAMS.Many specific quality control checks andspecifications for methods are included inthe respective reference methods describedin part 50 of this chapter or in the respectiveequivalent method descriptions availablefrom EPA (Reference 8 of this Appendix).Similarly, quality control procedures relatedto specifically designated reference andequivalent method analyzers are contained inthe respective operation or instructionmanuals associated with those analyzers.Quality assurance guidance formeteorological systems at PAMS is containedin Reference 9 of this Appendix. Qualityassurance procedures for VOC, NOx
(including NO and NO2), O3, and carbonylmeasurements at PAMS must be consistentwith Reference 15 of this Appendix.Reference 4 of this Appendix includesrequirements for the development of qualityassurance project plans, and qualityassurance and control programs, and systemsaudits demonstrating attainment of therequirements.
2.3 Pollutant Concentration and Flow RateStandards.
2.3.1 Gaseous pollutant concentrationstandards (permeation devices or cylinders ofcompressed gas) used to obtain testconcentrations for CO, SO2, NO, and NO2
must be traceable to either a NationalInstitute of Standards and Technology (NIST)NIST-Traceable Reference Material (NTRM)or a NIST-certified Gas Manufacturer’sInternal Standard (GMIS), certified inaccordance with one of the procedures givenin Reference 10 of this Appendix.
2.3.2 Test concentrations for O3 must beobtained in accordance with the UVphotometric calibration procedure specifiedin 40 CFR part 50, Appendix D, or by meansof a certified ozone transfer standard. ConsultReferences 11 and 12 of this Appendix forguidance on primary and transfer standardsfor O3.
2.3.3 Flow rate measurements must bemade by a flow measuring instrument that istraceable to an authoritative volume or otherapplicable standard. Guidance for certifyingsome types of flowmeters is provided inReference 7 of this Appendix.
2.4 National Performance Audit Program(NPAP). Agencies operating SLAMS arerequired to participate in EPA’s NPAP. These
audits are described in Reference 7 of thisAppendix. For further instructions, agenciesshould contact either the appropriate EPARegional QA Coordinator at the appropriateEPA Regional Office location, or the NPAPCoordinator, Emissions Monitoring andAnalysis Division (MD–14), U.S.Environmental Protection Agency, ResearchTriangle Park, NC 27711.
2.5 Systems Audit Programs. Systemsaudits of the ambient air monitoringprograms of agencies operating SLAMS shallbe conducted at least every 3 years by theappropriate EPA Regional Office. Systemsaudit programs are described in Reference 7of this Appendix. For further instructions,agencies should contact either theappropriate EPA Regional QA Coordinator orthe Systems Audit QA Coordinator, Office ofAir Quality Planning and Standards,Emissions Monitoring and Analysis Division(MD-14), U.S. Environmental ProtectionAgency, Research Triangle Park, NC 27711.3. Data Quality Assessment Requirements.
3.0.1 All ambient monitoring methods oranalyzers used in SLAMS shall be testedperiodically, as described in this section, toquantitatively assess the quality of theSLAMS data. Measurement uncertainty isestimated for both automated and manualmethods. Terminology associated withmeasurement uncertainty are found withinthis Appendix and includes:
(a) Precision. A measurement of mutualagreement among individual measurementsof the same property usually underprescribed similar conditions, expressedgenerally in terms of the standard deviation;
(b) Accuracy. The degree of agreementbetween an observed value and an acceptedreference value, accuracy includes acombination of random error (precision) andsystematic error (bias) components which aredue to sampling and analytical operations;
(c) Bias. The systematic or persistentdistortion of a measurement process whichcauses errors in one direction. The individualresults of these tests for each method oranalyzer shall be reported to EPA as specifiedin section 4 of this Appendix. EPA will thencalculate quarterly assessments ofmeasurement uncertainty applicable to theSLAMS data as described in section 5 of thisAppendix. Data assessment results should bereported to EPA only for methods andanalyzers approved for use in SLAMSmonitoring under Appendix C of this part.
3.0.2 Estimates of the data quality will becalculated on the basis of single monitors andreporting organizations and may also becalculated for each region and for the entireNation. A reporting organization is defined asa State, subordinate organization within aState, or other organization that isresponsible for a set of stations that monitorsthe same pollutant and for which data qualityassessments can be pooled. States mustdefine one or more reporting organizationsfor each pollutant such that each monitoringstation in the State SLAMS network isincluded in one, and only one, reportingorganization.
3.0.3 Each reporting organization shall bedefined such that measurement uncertaintyamong all stations in the organization can beexpected to be reasonably homogeneous, asa result of common factors.
(a) Common factors that should beconsidered by States in defining reportingorganizations include:
(1) Operation by a common team of fieldoperators.
(2) Common calibration facilities.(3) Oversight by a common quality
assurance organization.(4) Support by a common laboratory or
headquarters.(b) Where there is uncertainty in defining
the reporting organizations or in assigningspecific sites to reporting organizations,States shall consult with the appropriate EPARegional Office. All definitions of reportingorganizations shall be subject to finalapproval by the appropriate EPA RegionalOffice.
3.0.4 Assessment results shall be reportedas specified in section 4 of this Appendix.Table A-1 of this Appendix provides asummary of the minimum data qualityassessment requirements, which aredescribed in more detail in the followingsections.
3.1 Precision of Automated MethodsExcluding PM2.5.
3.1.1 Methods for SO2, NO2, O3 and CO. Aone- point precision check must beperformed at least once every 2 weeks oneach automated analyzer used to measureSO2, NO2, O3 and CO. The precision checkis made by challenging the analyzer with aprecision check gas of known concentration(effective concentration for open pathanalyzers) between 0.08 and 0.10 ppm forSO2, NO2, and O3 analyzers, and between 8and 10 ppm for CO analyzers. To check theprecision of SLAMS analyzers operating onranges higher than 0 to 1.0 ppm SO2, NO2,and O3, or 0 to 100 ppm for CO, use precisioncheck gases of appropriately higherconcentration as approved by the appropriateRegional Administrator or their designee.However, the results of precision checks atconcentration levels other than thosespecified above need not be reported to EPA.The standards from which precision checktest concentrations are obtained must meetthe specifications of section 2.3 of thisAppendix.
3.1.1.1 Except for certain CO analyzersdescribed below, point analyzers mustoperate in their normal sampling modeduring the precision check, and the testatmosphere must pass through all filters,scrubbers, conditioners and othercomponents used during normal ambientsampling and as much of the ambient airinlet system as is practicable. If permitted bythe associated operation or instructionmanual, a CO point analyzer may betemporarily modified during the precisioncheck to reduce vent or purge flows, or thetest atmosphere may enter the analyzer at apoint other than the normal sample inlet,provided that the analyzer’s response is notlikely to be altered by these deviations fromthe normal operational mode. If a precisioncheck is made in conjunction with a zero orspan adjustment, it must be made prior tosuch zero or span adjustments.Randomization of the precision check withrespect to time of day, day of week, androutine service and adjustments isencouraged where possible.

38835Federal Register / Vol. 62, No. 138 / Friday, July 18, 1997 / Rules and Regulations
3.1.1.2 Open path analyzers are tested byinserting a test cell containing a precisioncheck gas concentration into the opticalmeasurement beam of the instrument. Ifpossible, the normally used transmitter,receiver, and as appropriate, reflectingdevices should be used during the test, andthe normal monitoring configuration of theinstrument should be altered as little aspossible to accommodate the test cell for thetest. However, if permitted by the associatedoperation or instruction manual, an alternatelocal light source or an alternate optical paththat does not include the normal atmosphericmonitoring path may be used. The actualconcentration of the precision check gas inthe test cell must be selected to produce aneffective concentration in the range specifiedin section 3.1.1. Generally, the precision testconcentration measurement will be the sumof the atmospheric pollutant concentrationand the precision test concentration. If so, theresult must be corrected to remove theatmospheric concentration contribution. Thecorrected concentration is obtained bysubtracting the average of the atmosphericconcentrations measured by the open pathinstrument under test immediately beforeand immediately after the precision checktest from the precision test concentrationmeasurement. If the difference between thesebefore and after measurements is greater than20 percent of the effective concentration ofthe test gas, discard the test result and repeatthe test. If possible, open path analyzersshould be tested during periods when theatmospheric pollutant concentrations arerelatively low and steady.
3.1.1.3 Report the actual concentration(effective concentration for open pathanalyzers) of the precision check gas and thecorresponding concentration measurement
(corrected concentration, if applicable, foropen path analyzers) indicated by theanalyzer. The percent differences betweenthese concentrations are used to assess theprecision of the monitoring data as describedin section 5.1. of this Appendix.
3.1.2 Methods for Particulate MatterExcluding PM2.5. A one-point precisioncheck must be performed at least once every2 weeks on each automated analyzer used tomeasure PM10. The precision check is madeby checking the operational flow rate of theanalyzer. If a precision flow rate check ismade in conjunction with a flow rateadjustment, it must be made prior to suchflow rate adjustment. Randomization of theprecision check with respect to time of day,day of week, and routine service andadjustments is encouraged where possible.
3.1.2.1 Standard procedure: Use a flow ratetransfer standard certified in accordance withsection 2.3.3 of this Appendix to check theanalyzer’s normal flow rate. Care should beused in selecting and using the flow ratemeasurement device such that it does notalter the normal operating flow rate of theanalyzer. Report the actual analyzer flow ratemeasured by the transfer standard and thecorresponding flow rate measured, indicated,or assumed by the analyzer.
3.1.2.2 Alternative procedure:3.1.2.2.1 It is permissible to obtain the
precision check flow rate data from theanalyzer’s internal flow meter without theuse of an external flow rate transfer standard,provided that:
3.1.2.2.1.1 The flow meter is audited withan external flow rate transfer standard at leastevery 6 months.
3.1.2.2.1.2 Records of at least the threemost recent flow audits of the instrument’sinternal flow meter over at least several
weeks confirm that the flow meter is stable,verifiable and accurate to ±4%.
3.1.2.2.1.3 The instrument and flow metergive no indication of improper operation.
3.1.2.2.2 With suitable communicationcapability, the precision check may thus becarried out remotely. For this procedure,report the set-point flow rate as the actualflow rate along with the flow rate measuredor indicated by the analyzer flow meter.
3.1.2.2.3 For either procedure, the percentdifferences between the actual and indicatedflow rates are used to assess the precision ofthe monitoring data as described in section5.1 of this Appendix (using flow rates in lieuof concentrations). The percent differencesbetween these concentrations are used toassess the precision of the monitoring data asdescribed in section 5.1. of this Appendix.
3.2 Accuracy of Automated MethodsExcluding PM2.5.
3.2.1 Methods for SO2, NO2, O3, or CO.3.2.1.1 Each calendar quarter (during
which analyzers are operated), audit at least25 percent of the SLAMS analyzers thatmonitor for SO2, NO2, O3, or CO such thateach analyzer is audited at least once peryear. If there are fewer than four analyzers fora pollutant within a reporting organization,randomly reaudit one or more analyzers sothat at least one analyzer for that pollutantis audited each calendar quarter. Wherepossible, EPA strongly encourages morefrequent auditing, up to an audit frequencyof once per quarter for each SLAMS analyzer.
3.2.1.2 (a) The audit is made bychallenging the analyzer with at least oneaudit gas of known concentration (effectiveconcentration for open path analyzers) fromeach of the following ranges applicable to theanalyzer being audited:
Audit LevelConcentration Range, PPM
SO2, O3 NO2 CO
1 ................................................................................................................................................................ 0.03–0.08 0.03–0.08 3–82 ................................................................................................................................................................ 0.15–0.20 0.15–0.20 15–203 ................................................................................................................................................................ 0.35–0.45 0.35–0.45 35–454 ................................................................................................................................................................ 0.80–0.90 .................... 80–90
(b) NO2 audit gas for chemiluminescence-type NO2 analyzers must also contain at least0.08 ppm NO.
3.2.1.3 NO concentrations substantiallyhigher than 0.08 ppm, as may occur whenusing some gas phase titration (GPT)techniques, may lead to audit errors inchemiluminescence analyzers due toinevitable minor NO-NOx channel imbalance.Such errors may be atypical of routinemonitoring errors to the extent that such NOconcentrations exceed typical ambient NOconcentrations at the site. These errors maybe minimized by modifying the GPTtechnique to lower the NO concentrationsremaining in the NO2 audit gas to levelscloser to typical ambient NO concentrationsat the site.
3.2.1.4 To audit SLAMS analyzersoperating on ranges higher than 0 to 1.0 ppmfor SO2, NO2, and O3 or 0 to 100 ppm for CO,use audit gases of appropriately higherconcentration as approved by the appropriate
Regional Administrator or theAdministrators’s designee. The results ofaudits at concentration levels other thanthose shown in the above table need not bereported to EPA.
3.2.1.5 The standards from which audit gastest concentrations are obtained must meetthe specifications of section 2.3 of thisAppendix. The gas standards and equipmentused for auditing must not be the same as thestandards and equipment used for calibrationor calibration span adjustments. The auditorshould not be the operator or analyst whoconducts the routine monitoring, calibration,and analysis.
3.2.1.6 For point analyzers, the audit shallbe carried out by allowing the analyzer toanalyze the audit test atmosphere in itsnormal sampling mode such that the testatmosphere passes through all filters,scrubbers, conditioners, and other sampleinlet components used during normalambient sampling and as much of the
ambient air inlet system as is practicable. Theexception provided in section 3.1 of thisAppendix for certain CO analyzers does notapply for audits.
3.2.1.7 Open path analyzers are audited byinserting a test cell containing the variousaudit gas concentrations into the opticalmeasurement beam of the instrument. Ifpossible, the normally used transmitter,receiver, and, as appropriate, reflectingdevices should be used during the audit, andthe normal monitoring configuration of theinstrument should be modified as little aspossible to accommodate the test cell for theaudit. However, if permitted by theassociated operation or instruction manual,an alternate local light source or an alternateoptical path that does not include the normalatmospheric monitoring path may be used.The actual concentrations of the audit gas inthe test cell must be selected to produceeffective concentrations in the rangesspecified in this section 3.2 of this Appendix.

38836 Federal Register / Vol. 62, No. 138 / Friday, July 18, 1997 / Rules and Regulations
Generally, each audit concentrationmeasurement result will be the sum of theatmospheric pollutant concentration and theaudit test concentration. If so, the result mustbe corrected to remove the atmosphericconcentration contribution. The correctedconcentration is obtained by subtracting theaverage of the atmospheric concentrationsmeasured by the open path instrument undertest immediately before and immediatelyafter the audit test (or preferably before andafter each audit concentration level) from theaudit concentration measurement. If thedifference between the before and aftermeasurements is greater than 20 percent ofthe effective concentration of the test gasstandard, discard the test result for thatconcentration level and repeat the test forthat level. If possible, open path analyzersshould be audited during periods when theatmospheric pollutant concentrations arerelatively low and steady. Also, themonitoring path length must be reverified towithin ±3 percent to validate the audit, sincethe monitoring path length is critical to thedetermination of the effective concentration.
3.2.1.8 Report both the actualconcentrations (effective concentrations foropen path analyzers) of the audit gases andthe corresponding concentrationmeasurements (corrected concentrations, ifapplicable, for open path analyzers)indicated or produced by the analyzer beingtested. The percent differences between theseconcentrations are used to assess theaccuracy of the monitoring data as describedin section 5.2 of this Appendix.
3.2.2 Methods for Particulate MatterExcluding PM2.5.
3.2.2.1 Each calendar quarter, audit theflow rate of at least 25 percent of the SLAMSPM10 analyzers such that each PM10 analyzeris audited at least once per year. If there arefewer than four PM10 analyzers within areporting organization, randomly re-auditone or more analyzers so that at least oneanalyzer is audited each calendar quarter.Where possible, EPA strongly encouragesmore frequent auditing, up to an auditfrequency of once per quarter for eachSLAMS analyzer.
3.2.2.2 The audit is made by measuring theanalyzer’s normal operating flow rate, usinga flow rate transfer standard certified inaccordance with section 2.3.3 of thisAppendix. The flow rate standard used forauditing must not be the same flow ratestandard used to calibrate the analyzer.However, both the calibration standard andthe audit standard may be referenced to thesame primary flow rate or volume standard.Great care must be used in auditing the flowrate to be certain that the flow measurementdevice does not alter the normal operatingflow rate of the analyzer. Report the audit(actual) flow rate and the corresponding flowrate indicated or assumed by the sampler.The percent differences between these flowrates are used to calculate accuracy (PM10) asdescribed in section 5.2 of this Appendix.
3.3 Precision of Manual MethodsExcluding PM2.5.
3.3.1 For each network of manual methodsother than for PM2.5, select one or moremonitoring sites within the reportingorganization for duplicate, collocated
sampling as follows: for 1 to 5 sites, select1 site; for 6 to 20 sites, select 2 sites; and forover 20 sites, select 3 sites. Where possible,additional collocated sampling isencouraged. For purposes of precisionassessment, networks for measuring TSP andPM10 shall be considered separately from oneanother. PM10 and TSP sites having annualmean particulate matter concentrationsamong the highest 25 percent of the annualmean concentrations for all the sites in thenetwork must be selected or, if such sites areimpractical, alternative sites approved by theRegional Administrator may be selected.
3.3.2 In determining the number ofcollocated sites required for PM10,monitoring networks for lead should betreated independently from networks forparticulate matter, even though the separatenetworks may share one or more commonsamplers. However, a single pair of samplerscollocated at a common-sampler monitoringsite that meets the requirements for both acollocated lead site and a collocatedparticulate matter site may serve as acollocated site for both networks.
3.3.3 The two collocated samplers must bewithin 4 meters of each other, and particulatematter samplers must be at least 2 metersapart to preclude airflow interference.Calibration, sampling, and analysis must bethe same for both collocated samplers andthe same as for all other samplers in thenetwork.
3.3.4 For each pair of collocated samplers,designate one sampler as the primarysampler whose samples will be used to reportair quality for the site, and designate theother as the duplicate sampler. Eachduplicate sampler must be operatedconcurrently with its associated routinesampler at least once per week. Theoperation schedule should be selected so thatthe sampling days are distributed evenly overthe year and over the seven days of the week.A six-day sampling schedule is required.Report the measurements from both samplersat each collocated sampling site. Thecalculations for evaluating precision betweenthe two collocated samplers are described insection 5.3 of this Appendix.
3.4 Accuracy of Manual MethodsExcluding PM2.5. The accuracy of manualsampling methods is assessed by auditing aportion of the measurement process.
3.4.1 Procedures for PM10 and TSP.3.4.1.1 Procedures for flow rate audits for
PM10. Each calendar quarter, audit the flowrate of at least 25 percent of the PM10
samplers such that each PM10 sampler isaudited at least once per year. If there arefewer than four PM10 samplers within areporting organization, randomly reaudit oneor more samplers so that one sampler isaudited each calendar quarter. Audit eachsampler at its normal operating flow rate,using a flow rate transfer standard certifiedin accordance with section 2.3.3 of thisAppendix. The flow rate standard used forauditing must not be the same flow ratestandard used to calibrate the sampler.However, both the calibration standard andthe audit standard may be referenced to thesame primary flow rate standard. The flowaudit should be scheduled so as to avoidinterference with a scheduled sampling
period. Report the audit (actual) flow rateand the corresponding flow rate indicated bythe sampler’s normally used flow indicator.The percent differences between these flowrates are used to calculate accuracy and biasas described in section 5.4.1 of thisAppendix.
3.4.1.2 Great care must be used in auditinghigh-volume particulate matter samplershaving flow regulators because theintroduction of resistance plates in the auditflow standard device can cause abnormalflow patterns at the point of flow sensing. Forthis reason, the flow audit standard shouldbe used with a normal filter in place andwithout resistance plates in auditing flow-regulated high-volume samplers, or othersteps should be taken to assure that flowpatterns are not perturbed at the point of flowsensing.
3.4.2 SO2 Methods.3.4.2.1 Prepare audit solutions from a
working sulfite-tetrachloromercurate (TCM)solution as described in section 10.2 of theSO2 Reference Method (40 CFR part 50,Appendix A). These audit samples must beprepared independently from thestandardized sulfite solutions used in theroutine calibration procedure. Sulfite-TCMaudit samples must be stored between 0 and5 °C and expire 30 days after preparation.
3.4.2.2 Prepare audit samples in each of theconcentration ranges of 0.2-0.3, 0.5-0.6, and0.8-0.9 ©g SO2/ml. Analyze an audit samplein each of the three ranges at least once eachday that samples are analyzed and at leasttwice per calendar quarter. Report the auditconcentrations (in ©g SO2/ml) and thecorresponding indicated concentrations (in©g SO2/ml). The percent differences betweenthese concentrations are used to calculateaccuracy as described in section 5.4.2 of thisAppendix.
3.4.3 NO2 Methods. Prepare audit solutionsfrom a working sodium nitrite solution asdescribed in the appropriate equivalentmethod (see Reference 8 of this Appendix).These audit samples must be preparedindependently from the standardized nitritesolutions used in the routine calibrationprocedure. Sodium nitrite audit samplesexpire in 3 months after preparation. Prepareaudit samples in each of the concentrationranges of 0.2-0.3, 0.5-0.6, and 0.8-0.9 ©g NO2/ml. Analyze an audit sample in each of thethree ranges at least once each day thatsamples are analyzed and at least twice percalendar quarter. Report the auditconcentrations (in ©g NO2/ml) and thecorresponding indicated concentrations (in©g NO2/ml). The percent differences betweenthese concentrations are used to calculateaccuracy as described in section 5.4.2 of thisAppendix.
3.4.4 Pb Methods.3.4.4.1 For the Pb Reference Method (40
CFR part 50, Appendix G), the flow rates ofthe high-volume Pb samplers shall be auditedas part of the TSP network using the sameprocedures described in section 3.4.1 of thisAppendix. For agencies operating both TSPand Pb networks, 25 percent of the totalnumber of high-volume samplers are to beaudited each quarter.
3.4.4.2 Each calendar quarter, audit the PbReference Method analytical procedure using
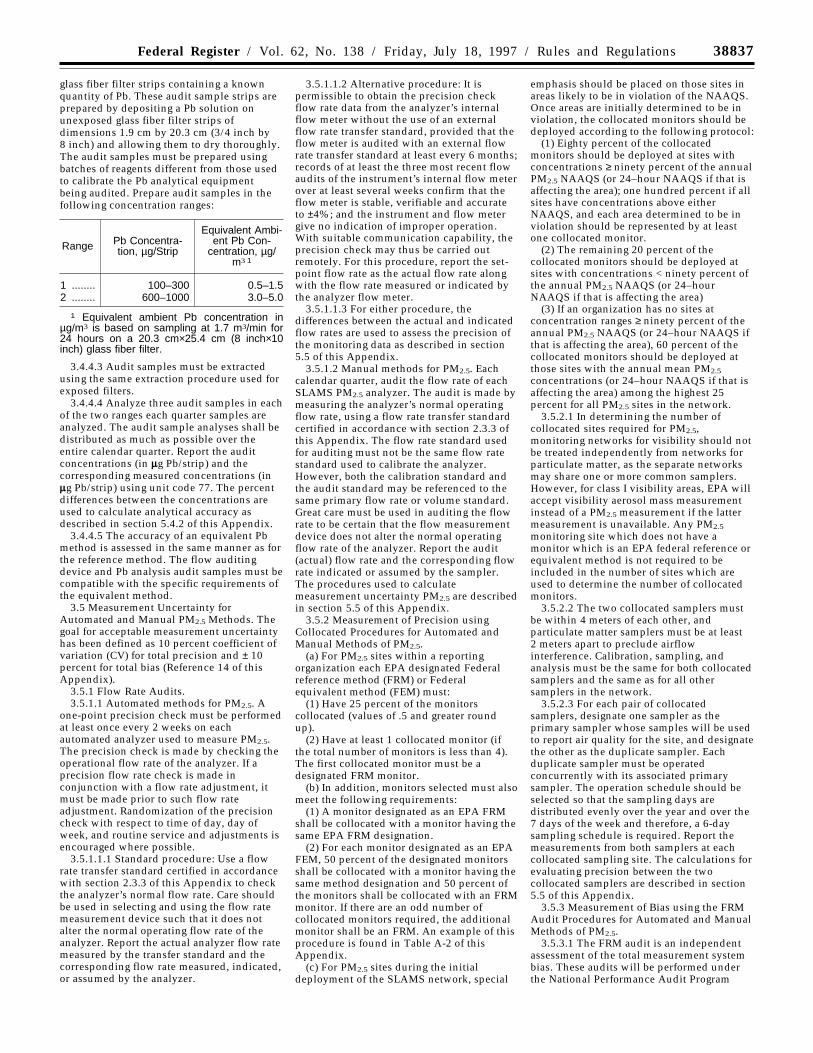
38837Federal Register / Vol. 62, No. 138 / Friday, July 18, 1997 / Rules and Regulations
glass fiber filter strips containing a knownquantity of Pb. These audit sample strips areprepared by depositing a Pb solution onunexposed glass fiber filter strips ofdimensions 1.9 cm by 20.3 cm (3/4 inch by8 inch) and allowing them to dry thoroughly.The audit samples must be prepared usingbatches of reagents different from those usedto calibrate the Pb analytical equipmentbeing audited. Prepare audit samples in thefollowing concentration ranges:
Range Pb Concentra-tion, µg/Strip
Equivalent Ambi-ent Pb Con-
centration, µg/m3 1
1 ........ 100–300 0.5–1.52 ........ 600–1000 3.0–5.0
1 Equivalent ambient Pb concentration inµg/m3 is based on sampling at 1.7 m3/min for24 hours on a 20.3 cm×25.4 cm (8 inch×10inch) glass fiber filter.
3.4.4.3 Audit samples must be extractedusing the same extraction procedure used forexposed filters.
3.4.4.4 Analyze three audit samples in eachof the two ranges each quarter samples areanalyzed. The audit sample analyses shall bedistributed as much as possible over theentire calendar quarter. Report the auditconcentrations (in ©g Pb/strip) and thecorresponding measured concentrations (in©g Pb/strip) using unit code 77. The percentdifferences between the concentrations areused to calculate analytical accuracy asdescribed in section 5.4.2 of this Appendix.
3.4.4.5 The accuracy of an equivalent Pbmethod is assessed in the same manner as forthe reference method. The flow auditingdevice and Pb analysis audit samples must becompatible with the specific requirements ofthe equivalent method.
3.5 Measurement Uncertainty forAutomated and Manual PM2.5 Methods. Thegoal for acceptable measurement uncertaintyhas been defined as 10 percent coefficient ofvariation (CV) for total precision and ± 10percent for total bias (Reference 14 of thisAppendix).
3.5.1 Flow Rate Audits.3.5.1.1 Automated methods for PM2.5. A
one-point precision check must be performedat least once every 2 weeks on eachautomated analyzer used to measure PM2.5.The precision check is made by checking theoperational flow rate of the analyzer. If aprecision flow rate check is made inconjunction with a flow rate adjustment, itmust be made prior to such flow rateadjustment. Randomization of the precisioncheck with respect to time of day, day ofweek, and routine service and adjustments isencouraged where possible.
3.5.1.1.1 Standard procedure: Use a flowrate transfer standard certified in accordancewith section 2.3.3 of this Appendix to checkthe analyzer’s normal flow rate. Care shouldbe used in selecting and using the flow ratemeasurement device such that it does notalter the normal operating flow rate of theanalyzer. Report the actual analyzer flow ratemeasured by the transfer standard and thecorresponding flow rate measured, indicated,or assumed by the analyzer.
3.5.1.1.2 Alternative procedure: It ispermissible to obtain the precision checkflow rate data from the analyzer’s internalflow meter without the use of an externalflow rate transfer standard, provided that theflow meter is audited with an external flowrate transfer standard at least every 6 months;records of at least the three most recent flowaudits of the instrument’s internal flow meterover at least several weeks confirm that theflow meter is stable, verifiable and accurateto ±4%; and the instrument and flow metergive no indication of improper operation.With suitable communication capability, theprecision check may thus be carried outremotely. For this procedure, report the set-point flow rate as the actual flow rate alongwith the flow rate measured or indicated bythe analyzer flow meter.
3.5.1.1.3 For either procedure, thedifferences between the actual and indicatedflow rates are used to assess the precision ofthe monitoring data as described in section5.5 of this Appendix.
3.5.1.2 Manual methods for PM2.5. Eachcalendar quarter, audit the flow rate of eachSLAMS PM2.5 analyzer. The audit is made bymeasuring the analyzer’s normal operatingflow rate, using a flow rate transfer standardcertified in accordance with section 2.3.3 ofthis Appendix. The flow rate standard usedfor auditing must not be the same flow ratestandard used to calibrate the analyzer.However, both the calibration standard andthe audit standard may be referenced to thesame primary flow rate or volume standard.Great care must be used in auditing the flowrate to be certain that the flow measurementdevice does not alter the normal operatingflow rate of the analyzer. Report the audit(actual) flow rate and the corresponding flowrate indicated or assumed by the sampler.The procedures used to calculatemeasurement uncertainty PM2.5 are describedin section 5.5 of this Appendix.
3.5.2 Measurement of Precision usingCollocated Procedures for Automated andManual Methods of PM2.5.
(a) For PM2.5 sites within a reportingorganization each EPA designated Federalreference method (FRM) or Federalequivalent method (FEM) must:
(1) Have 25 percent of the monitorscollocated (values of .5 and greater roundup).
(2) Have at least 1 collocated monitor (ifthe total number of monitors is less than 4).The first collocated monitor must be adesignated FRM monitor.
(b) In addition, monitors selected must alsomeet the following requirements:
(1) A monitor designated as an EPA FRMshall be collocated with a monitor having thesame EPA FRM designation.
(2) For each monitor designated as an EPAFEM, 50 percent of the designated monitorsshall be collocated with a monitor having thesame method designation and 50 percent ofthe monitors shall be collocated with an FRMmonitor. If there are an odd number ofcollocated monitors required, the additionalmonitor shall be an FRM. An example of thisprocedure is found in Table A-2 of thisAppendix.
(c) For PM2.5 sites during the initialdeployment of the SLAMS network, special
emphasis should be placed on those sites inareas likely to be in violation of the NAAQS.Once areas are initially determined to be inviolation, the collocated monitors should bedeployed according to the following protocol:
(1) Eighty percent of the collocatedmonitors should be deployed at sites withconcentrations ≥ ninety percent of the annualPM2.5 NAAQS (or 24–hour NAAQS if that isaffecting the area); one hundred percent if allsites have concentrations above eitherNAAQS, and each area determined to be inviolation should be represented by at leastone collocated monitor.
(2) The remaining 20 percent of thecollocated monitors should be deployed atsites with concentrations < ninety percent ofthe annual PM2.5 NAAQS (or 24–hourNAAQS if that is affecting the area)
(3) If an organization has no sites atconcentration ranges ≥ ninety percent of theannual PM2.5 NAAQS (or 24–hour NAAQS ifthat is affecting the area), 60 percent of thecollocated monitors should be deployed atthose sites with the annual mean PM2.5
concentrations (or 24–hour NAAQS if that isaffecting the area) among the highest 25percent for all PM2.5 sites in the network.
3.5.2.1 In determining the number ofcollocated sites required for PM2.5,monitoring networks for visibility should notbe treated independently from networks forparticulate matter, as the separate networksmay share one or more common samplers.However, for class I visibility areas, EPA willaccept visibility aerosol mass measurementinstead of a PM2.5 measurement if the lattermeasurement is unavailable. Any PM2.5
monitoring site which does not have amonitor which is an EPA federal reference orequivalent method is not required to beincluded in the number of sites which areused to determine the number of collocatedmonitors.
3.5.2.2 The two collocated samplers mustbe within 4 meters of each other, andparticulate matter samplers must be at least2 meters apart to preclude airflowinterference. Calibration, sampling, andanalysis must be the same for both collocatedsamplers and the same as for all othersamplers in the network.
3.5.2.3 For each pair of collocatedsamplers, designate one sampler as theprimary sampler whose samples will be usedto report air quality for the site, and designatethe other as the duplicate sampler. Eachduplicate sampler must be operatedconcurrently with its associated primarysampler. The operation schedule should beselected so that the sampling days aredistributed evenly over the year and over the7 days of the week and therefore, a 6-daysampling schedule is required. Report themeasurements from both samplers at eachcollocated sampling site. The calculations forevaluating precision between the twocollocated samplers are described in section5.5 of this Appendix.
3.5.3 Measurement of Bias using the FRMAudit Procedures for Automated and ManualMethods of PM2.5.
3.5.3.1 The FRM audit is an independentassessment of the total measurement systembias. These audits will be performed underthe National Performance Audit Program

38838 Federal Register / Vol. 62, No. 138 / Friday, July 18, 1997 / Rules and Regulations
(section 2.4 of this Appendix) or acomparable program. Twenty-five percent ofthe SLAMS monitors within each reportingorganization will be assessed with an FRMaudit each year. Additionally, everydesignated FRM or FEM within a reportingorganization must:
(a) Have at least 25 percent of each methoddesignation audited, including collocatedsites (even those collocated with FRMinstruments), (values of .5 and greater roundup).
(b) Have at least one monitor audited.(c) Be audited at a frequency of four audits
per year.(d) Have all FRM or FEM samples subject
to an FRM audit at least once every 4 years.Table A-2 illustrates the procedurementioned above.
3.5.3.2 For PM2.5 sites during the initialdeployment of the SLAMS network, specialemphasis should be placed on those sites inareas likely to be in violation of the NAAQS.Once areas are initially determined to be inviolation, the FRM audit program should beimplemented according to the followingprotocol:
(a) Eighty percent of the FRM auditsshould be deployed at sites withconcentrations ≥ ninety percent of the annualPM2.5 NAAQS (or 24–hour NAAQS if that isaffecting the area); one hundred percent if allsites have concentrations above eitherNAAQS, and each area determined to be inviolation should implement an FRM audit ata minimum of one monitor within that area.
(b) The remaining 20 percent of the FRMaudits should be implemented at sites withconcentrations < ninety percent of the annualPM2.5 NAAQS (or 24–hour NAAQS if that isaffecting the area).
(c) If an organization has no sites atconcentration ranges ≥ ninety percent of theannual PM2.5 NAAQS (or 24–hour NAAQS ifthat is affecting the area), 60 percent of theFRM audits should be implemented at thosesites with the annual mean PM2.5
concentrations (or 24–hour NAAQS if that isaffecting the area) among the highest 25percent for all PM2.5 sites in the network.Additional information concerning the FRMaudit program is contained in Reference 7 ofthis Appendix. The calculations forevaluating bias between the primary monitorand the FRM audit are described in section5.5.4. Reporting Requirements.
(a) For each pollutant, prepare a list of allmonitoring sites and their AIRS siteidentification codes in each reportingorganization and submit the list to theappropriate EPA Regional Office, with a copyto AIRS-AQS. Whenever there is a change inthis list of monitoring sites in a reporting
organization, report this change to theRegional Office and to AIRS-AQS.
4.1 Quarterly Reports. For each quarter,each reporting organization shall report toAIRS-AQS directly (or via the appropriateEPA Regional Office for organizations notdirect users of AIRS) the results of all validprecision, bias and accuracy tests it hascarried out during the quarter. The quarterlyreports of precision, bias and accuracy datamust be submitted consistent with the datareporting requirements specified for airquality data as set forth in § 58.35(c). EPAstrongly encourages early submittal of the QAdata in order to assist the State and Localagencies in controlling and evaluating thequality of the ambient air SLAMS data. Eachorganization shall report all QA/QCmeasurements. Report results from invalidtests, from tests carried out during a timeperiod for which ambient data immediatelyprior or subsequent to the tests wereinvalidated for appropriate reasons, and fromtests of methods or analyzers not approvedfor use in SLAMS monitoring networksunder Appendix C of this part. Such datashould be flagged so that it will not beutilized for quantitative assessment ofprecision, bias and accuracy.
4.2 Annual Reports.4.2.1 When precision, bias and accuracy
estimates for a reporting organization havebeen calculated for all four quarters of thecalendar year, EPA will calculate and reportthe measurement uncertainty for the entirecalendar year. These limits will then beassociated with the data submitted in theannual SLAMS report required by § 58.26.
4.2.2 Each reporting organization shallsubmit, along with its annual SLAMS report,a listing by pollutant of all monitoring sitesin the reporting organization.5. Calculations for Data Quality Assessment.
(a) Calculations of measurementuncertainty are carried out by EPA accordingto the following procedures. Reportingorganizations should report the data forindividual precision, bias and accuracy testsas specified in sections 3 and 4 of thisAppendix even though they may elect toperform some or all of the calculations in thissection on their own.
5.1 Precision of Automated MethodsExcluding PM2.5. Estimates of the precision ofautomated methods are calculated from theresults of biweekly precision checks asspecified in section 3.1 of this Appendix. Atthe end of each calendar quarter, anintegrated precision probability interval forall SLAMS analyzers in the organization iscalculated for each pollutant.
5.1.1 Single Analyzer Precision.5.1.1.1 The percent difference (di) for each
precision check is calculated using equation
1, where Yi is the concentration indicated bythe analyzer for the I-th precision check andXi is the known concentration for the I-thprecision check, as follows:
Equation 1
dY X
Xii i
i
=−
× 100
5.1.1.2 For each analyzer, the quarterlyaverage (dj) is calculated with equation 2,and the standard deviation (Sj) with equation3, where n is the number of precision checkson the instrument made during the calendarquarter. For example, n should be 6 or 7 ifprecision checks are made biweekly during aquarter. Equation 2 and 3 follow:
Equation 2
dn
dj ii
n
==∑1
1
Equation 3
Sn
dn
dj i ii
n
i
n
=−
−
==
∑∑1
1
12
1
2
1
5.1.2 Precision for Reporting Organization.5.1.2.1 For each pollutant, the average of
averages (D) and the pooled standarddeviation (Sa) are calculated for all analyzersaudited for the pollutant during the quarter,using either equations 4 and 5 or 4a and 5a,where k is the number of analyzers auditedwithin the reporting organization for a singlepollutant, as follows:
Equation 4
Dk
d jj
k
==∑1
1
Equation 4a
Dn d n d n d n d
n n n nj j k k
j k
=+ + + + ++ + + + +
1 1 2 2
1 2
...
...
...
...
Equation 5
Sk
Sa jj
k
==∑1 2
1
Equation 5a
Sn S n S n S n S
n n n n kaj j k k
j k
=−( ) + −( ) + + −( ) + + −( )
+ + + + + −1 1
22 2
2 2 2
1 2
1 1 1 1... ...
... ...
5.1.2.2 Equations 4 and 5 are used whenthe same number of precision checks aremade for each analyzer. Equations 4a and 5aare used to obtain a weighted average and a
weighted standard deviation when differentnumbers of precision checks are made for theanalyzers.
5.1.2.3 For each pollutant, the 95 PercentProbability Limits for the precision of areporting organization are calculated usingequations 6 and 7, as follows:

38839Federal Register / Vol. 62, No. 138 / Friday, July 18, 1997 / Rules and Regulations
Equation 6
Upper 95 Percent Probability
Limit = D +1.96 Sa
Equation 7
Lower 95 Percent Probability
Limit = D -1.96 Sa
5.2 Accuracy of Automated MethodsExcluding PM2.5. Estimates of the accuracy ofautomated methods are calculated from theresults of independent audits as described insection 3.2 of this Appendix. At the end ofeach calendar quarter, an integrated accuracyprobability interval for all SLAMS analyzersaudited in the reporting organization iscalculated for each pollutant. Separateprobability limits are calculated for eachaudit concentration level in section 3.2 ofthis Appendix.
5.2.1 Single Analyzer Accuracy. Thepercentage difference (di) for each auditconcentration is calculated using equation 1,where Yi is the analyzer’s indicatedconcentration measurement from the I-thaudit check and Xi is the actual concentrationof the audit gas used for the I-th audit check.
5.2.2 Accuracy for Reporting Organization.5.2.2.1 For each audit concentration level
of a particular pollutant, the average (D) ofthe individual percentage differences (di) forall n analyzers audited during the quarter iscalculated using equation 8, as follows:
Equation 8
Dn
dii
n
==∑1
1
5.2.2.2 For each concentration level of aparticular pollutant, the standard deviation(Sa) of all the individual percentagedifferences for all n analyzers audited duringthe quarter is calculated, using equation 9, asfollows:
Equation 9
Sn
dn
da i ii
n
i
n
=−
−
==
∑∑1
1
12
1
2
1
5.2.2.3 For reporting organizations havingfour or fewer analyzers for a particularpollutant, only one audit is required eachquarter. For such reporting organizations, theaudit results of two consecutive quarters arerequired to calculate an average and astandard deviation, using equations 8 and 9.Therefore, the reporting of probability limitsshall be on a semiannual (instead of aquarterly) basis.
5.2.2.4 For each pollutant, the 95 PercentProbability Limits for the accuracy of areporting organization are calculated at eachaudit concentration level using equations 6and 7.
5.3 Precision of Manual MethodsExcluding PM2.5. Estimates of precision ofmanual methods are calculated from theresults obtained from collocated samplers asdescribed in section 3.3 of this Appendix. Atthe end of each calendar quarter, an
integrated precision probability interval forall collocated samplers operating in thereporting organization is calculated for eachmanual method network.
5.3.1 Single Sampler Precision.5.3.1.1 At low concentrations, agreement
between the measurements of collocatedsamplers, expressed as percent differences,may be relatively poor. For this reason,collocated measurement pairs are selected foruse in the precision calculations only whenboth measurements are above the followinglimits:
(a) TSP: 20 ©g/m3.(b) SO2: 45 ©g/m3.(c) NO2: 30 ©g/m3.(d) Pb: 0.15 ©g/m3.(e) PM10: 20 ©g/m3.5.3.1.2 For each selected measurement
pair, the percent difference (di) is calculated,using equation 10, as follows:
Equation 10
dY X
Y Xii i
i i
=−
+( ) ×/ 2
100
where:Yi is the pollutant concentrationmeasurement obtained from the duplicatesampler; andXi is the concentration measurementobtained from the primary samplerdesignated for reporting air quality for thesite.
(a) For each site, the quarterly averagepercent difference (dj) is calculated fromequation 2 and the standard deviation (Sj) iscalculated from equation 3, where n= thenumber of selected measurement pairs at thesite.
5.3.2 Precision for Reporting Organization.5.3.2.1 For each pollutant, the average
percentage difference (D) and the pooledstandard deviation (Sa) are calculated, usingequations 4 and 5, or using equations 4a and5a if different numbers of pairedmeasurements are obtained at the collocatedsites. For these calculations, the k ofequations 4, 4a, 5 and 5a is the number ofcollocated sites.
5.3.2.2 The 95 Percent Probability Limitsfor the integrated precision for a reportingorganization are calculated using equations11 and 12, as follows:
Equation 11
Upper 95 Percent Probability
Limit = D +1.96 Sa
Equation 12
Lower 95 Percent Probability
Limit = D -1.96 Sa
5.4 Accuracy of Manual MethodsExcluding PM2.5. Estimates of the accuracy ofmanual methods are calculated from theresults of independent audits as described insection 3.4 of this Appendix. At the end ofeach calendar quarter, an integrated accuracyprobability interval is calculated for eachmanual method network operated by thereporting organization.
5.4.1 Particulate Matter Samplers otherthan PM2.5 (including reference method Pbsamplers).
5.4.1.1 Single Sampler Accuracy. For theflow rate audit described in section 3.4.1 ofthis Appendix, the percentage difference (di)for each audit is calculated using equation 1,where Xi represents the known flow rate andYi represents the flow rate indicated by thesampler.
5.4.1.2 Accuracy for ReportingOrganization. For each type of particulatematter measured (e.g., TSP/Pb), the average(D) of the individual percent differences forall similar particulate matter samplersaudited during the calendar quarter iscalculated using equation 8. The standarddeviation (Sa) of the percentage differencesfor all of the similar particulate mattersamplers audited during the calendar quarteris calculated using equation 9. The 95Percent Probability Limits for the integratedaccuracy for the reporting organization arecalculated using equations 6 and 7. Forreporting organizations having four or fewerparticulate matter samplers of one type, onlyone audit is required each quarter, and theaudit results of two consecutive quarters arerequired to calculate an average and astandard deviation. In that case, probabilitylimits shall be reported semi-annually ratherthan quarterly.
5.4.2 Analytical Methods for SO2, NO2, andPb.
5.4.2.1 Single Analysis-Day Accuracy. Foreach of the audits of the analytical methodsfor SO2, NO2, and Pb described in sections3.4.2, 3.4.3, and 3.4.4 of this Appendix, thepercentage difference (dj) at eachconcentration level is calculated usingequation 1, where Xj represents the knownvalue of the audit sample and Yj representsthe value of SO2, NO2, or Pb indicated by theanalytical method.
5.4.2.2 Accuracy for ReportingOrganization. For each analytical method, theaverage (D) of the individual percentdifferences at each concentration level for allaudits during the calendar quarter iscalculated using equation 8. The standarddeviation (Sa) of the percentage differences ateach concentration level for all audits duringthe calendar quarter is calculated usingequation 9. The 95 Percent Probability Limitsfor the accuracy for the reportingorganization are calculated using equations 6and 7.
5.5 Precision, Accuracy and Bias forAutomated and Manual PM2.5 Methods.
(a) Reporting organizations are required toreport the data that will allow assessments ofthe following individual quality controlchecks and audits:
(1) Flow rate audit.(2) Collocated samplers, where the
duplicate sampler is not an FRM device.(3) Collocated samplers, where the
duplicate sampler is an FRM device.(4) FRM audits.(b) EPA uses the reported results to derive
precision, accuracy and bias estimatesaccording to the following procedures.
5.5.1 Flow Rate Audits. The reportingorganization shall report both the auditstandard flow rate and the flow rate indicatedby the sampling instrument. These results are

38840 Federal Register / Vol. 62, No. 138 / Friday, July 18, 1997 / Rules and Regulations
used by EPA to calculate flow rate accuracyand bias estimates.
5.5.1.1 Accuracy of a Single Sampler -Single Check (Quarterly) Basis (di). Thepercentage difference (di) for a single flowrate audit di is calculated using Equation 13,where Xi represents the audit standard flowrate (known) and Yi represents the indicatedflow rate, as follows:
Equation 13
dY X
Xii i
i
=−
× 100
5.5.1.2 Bias of a Single Sampler - AnnualBasis (Dj). For an individual particulatesampler j, the average (Dj) of the individualpercentage differences (di) during thecalendar year is calculated using Equation14, where nj is the number of individualpercentage differences produced for samplerj during the calendar year, as follows:
Equation 14
Dn
djj
ii
n j
= ×=∑1
1
5.5.1.3 Bias for Each EPA FederalReference and Equivalent MethodDesignation Employed by Each ReportingOrganization - Quarterly Basis (Dk,q). Formethod designation k used by the reportingorganization, quarter q’s single samplerpercentage differences (di) are averaged usingEquation 16, where nk,q is the number ofindividual percentage differences producedfor method designation k in quarter q, asfollows:
Equation 15
Dn
dk qk q
ii
nk q
,,
,
= ×=∑1
1
5.5.1.4 Bias for Each ReportingOrganization - Quarterly Basis (Dq). For eachreporting organization, quarter q’s singlesampler percentage differences (di) areaveraged using Equation 16, to produce asingle average for each reportingorganization, where nq is the total number ofsingle sampler percentage differences for allfederal reference or equivalent methods ofsamplers in quarter q, as follows:
Equation 16
Dn
dqq
ii
nq
= ×=∑1
1
5.5.1.5 Bias for Each EPA FederalReference and Equivalent MethodDesignation Employed by Each ReportingOrganization - Annual Basis (Dk). For methoddesignation k used by the reportingorganization, the annual average percentagedifference, Dk, is derived using Equation 17,where Dk,q is the average reported for methoddesignation k during the qth quarter, and nk,q
is the number of the method designation k’s
monitors that were deployed during the qthquarter, as follows:
Equation 17
D
n D
nk
k q k qq
k qq
=( )
=
=
∑
∑
, ,
,
1
4
1
4
5.5.1.6 Bias for Each ReportingOrganization - Annual Basis (D). For eachreporting organization, the annual averagepercentage difference, D, is derived usingEquation 18, where Dq is the average reportedfor the reporting organization during the qthquarter, and nq is the total number monitorsthat were deployed during the qth quarter. Asingle annual average is produced for eachreporting organization. Equation 18 follows:
Equation 18
D
n D
n
q qq
=( )
=
=
∑
∑1
4
1
4
5.5.2 Collocated Samplers, Where theDuplicate Sampler is not an FRM Device. (a)At low concentrations, agreement betweenthe measurements of collocated samplersmay be relatively poor. For this reason,collocated measurement pairs are selected foruse in the precision calculations only whenboth measurements are above the followinglimits:
PM2.5 : 6 ©g/m3
(b) Collocated sampler results are used toassess measurement system precision. Acollocated sampler pair consists of a primarysampler (used for routine monitoring) and aduplicate sampler (used as a quality controlcheck). Quarterly precision estimates arecalculated by EPA for each pair of collocatedsamplers and for each method designationemployed by each reporting organization.Annual precision estimates are calculated byEPA for each primary sampler, for each EPAFederal reference method and equivalentmethod designation employed by eachreporting organization, and nationally foreach EPA Federal reference method andequivalent method designation.
5.5.2.1 Percent Difference for a SingleCheck (di). The percentage difference, di, foreach check is calculated by EPA usingEquation 19, where Xi represents theconcentration produced from the primarysampler and Yi represents concentrationreported for the duplicate sampler, asfollows:
Equation 19
dY X
Y Xii i
i i
=−
+( ) ×/ 2
100
5.5.2.2 Coefficient of Variation (CV) for aSingle Check (CVi). The coefficient ofvariation, CVi, for each check is calculated by
EPA by dividing the absolute value of thepercentage difference, di, by the square rootof two as shown in Equation 20, as follows:
Equation 20
CVd
ii=2
5.5.2.3 Precision of a Single Sampler -Quarterly Basis (CVj,q).
(a) For particulate sampler j, the individualcoefficients of variation (CVj,q) during thequarter are pooled using Equation 21, wherenj,q is the number of pairs of measurementsfrom collocated samplers during the quarter,as follows:
Equation 21
CV
CV
nj q
ii
n
j q
j
,,
= =∑ 2
1
(b) The 90 percent confidence limits for thesingle sampler’s CV are calculated by EPAusing Equations 22 and 23, where X2 0.05,df
and X2 0.95,df are the 0.05 and 0.95 quantilesof the chi-square (X2) distribution with nj,q
degrees of freedom, as follows:
Equation 22
Lower Confidence Limit = CVn
j qj q
n j,q
,,
. ,χ 0 952
Equation 23
Upper Confidence Limit = CVn
j qj q
n j q
,,
. , ,χ 0 05
2
5.5.2.4 Precision of a Single Sampler -Annual Basis. For particulate sampler j, theindividual coefficients of variation, CVi,produced during the calendar year are pooledusing Equation 21, where nj is the number ofchecks made during the calendar year. The90 percent confidence limits for the singlesampler’s CV are calculated by EPA usingEquations 22 and 23, where X2 0.05,df and X2
0.95,df are the 0.05 and 0.95 quantiles of thechi-square (X2) distribution with nj degrees offreedom.
5.5.2.5 Precision for Each EPA FederalReference Method and Equivalent MethodDesignation Employed by Each ReportingOrganization - Quarterly Basis (CVk,q).
(a) For each method designation k used bythe reporting organization, the quarter’ssingle sampler coefficients of variation,CVj,qs, obtained from Equation 21, are pooledusing Equation 24, where nk,q is the numberof collocated primary monitors for thedesignated method (but not collocated withFRM samplers) and nj,q is the number ofdegrees of freedom associated with CVj,q, asfollows:

38841Federal Register / Vol. 62, No. 138 / Friday, July 18, 1997 / Rules and Regulations
Equation 24
CV
CV n
nk q
j q j qj
n
j qj
n
k q
k q,
, ,
,
,
,=
( )=
=
∑
∑
2
1
1
(b) The number of method CVs producedfor a reporting organization will equal thenumber of different method designationshaving more than one primary monitoremployed by the organization during thequarter. (When exactly one monitor of aspecified designation is used by a reportingorganization, it will be collocated with anFRM sampler.)
5.5.2.6 Precision for Each MethodDesignation Employed by Each ReportingOrganization- Annual Basis (CVk). For eachmethod designation k used by the reportingorganization, the quarterly estimatedcoefficients of variation, CVk,q, are pooledusing Equation 25, where nk,q is the numberof collocated primary monitors for thedesignated method during the qth quarterand also the number of degrees of freedomassociated with the quarter’s precisionestimate for the method designation, CVk,q, asfollows:
Equation 25
CV
CV n
nk
k q k qq
k qq
=( )
=
=
∑
∑
, ,
,
2
1
4
1
4
5.5.3 Collocated Samplers, Where theDuplicate Sampler is an FRM Device. At lowconcentrations, agreement between themeasurements of collocated samplers may berelatively poor. For this reason, collocatedmeasurement pairs are selected for use in theprecision calculations only when bothmeasurements are above the following limits:PM2.5: 6 ©g/m3. These duplicate samplerresults are used to assess measurement
system bias. Quarterly bias estimates arecalculated by EPA for each primary samplerand for each method designation employedby each reporting organization. Annualprecision estimates are calculated by EPA foreach primary monitor, for each methoddesignation employed by each reportingorganization, and nationally for each methoddesignation.
5.5.3.1 Accuracy for a Single Check (d’i).The percentage difference, d’i, for each checkis calculated by EPA using Equation 26,where Xi represents the concentrationproduced from the FRM sampler taken as thetrue value and Yi represents concentrationreported for the primary sampler, as follows:
Equation 26
dY X
Xii i
i
' =−
× 100%
5.5.3.2 Bias of a Single Sampler - QuarterlyBasis (D’j,q).
(a) For particulate sampler j, the average ofthe individual percentage differences duringthe quarter q is calculated by EPA usingEquation 27, where nj,q is the number ofchecks made for sampler j during thecalendar quarter, as follows:
Equation 27
Dn
dj qj q
i
i
n j q
,'
,
',
= ×=∑1
1
(b) The standard deviation, s’j,q, of samplerj’s percentage differences for quarter q iscalculated using Equation 28, as follows:
Equation 28
sn
d n Dj qj q
i
n
j q j q
i
j q
,'
,
', ,
',
=−
×
− ( )
=
∑1
12 2
1
(c) The 95 Percent Confidence Limits forthe single sampler’s bias are calculated usingEquations 29 and 30 where t0.975,df is the0.975 quantile of Student’s t distributionwith df = nj,q-1 degrees of freedom, asfollows:
Equation 29
LowerConfidenceLimit = D t sj q df j q,'
. , ,'− ×0 975
Equation 30
Upper ConfidenceLimit = D t sj q df j q,'
. , ,'− ×0 975
5.5.3.3 Bias of a Single Sampler - AnnualBasis (D’j).
(a) For particulate sampler j, the mean biasfor the year is derived from the quarterly biasestimates, D’j,q, using Equation 31, where thevariables are as defined for Equations 27 and28, as follows:
Equation 31
D
n D
nj
j q j qq
j qq
', ,
'
,
=( )
=
=
∑
∑1
4
1
4
(b) The standard error of the aboveestimate, sej’ is calculated using Equation 32,as follows:
Equation 32
se
s n
n nj
j q j qq
j q j qqq
',
',
, ,
=
× −( )[ ]−( ) ( )
=
==
∑
∑∑
2 1
1
1
4
1
4
1
4
(c) The 95 Percent Confidence Limits forthe single sampler’s bias are calculated usingEquations 33 and 34, where t0.975,df is the0.975 quantile of Student’s t distributionwith df=(nj,1+nj,2+nj,3+nj,4-4) degrees offreedom, as follows:
Equation 33
LowerConfidenceLimit = D t sej df j'
. ,'− ×0 975
Equation 34
Upper Confidence Limit = − ×D t sej df j'
. ,'
0 975
5.5.3.4 Bias for a Single ReportingOrganization (D’) - Annual Basis. Thereporting organizations mean bias iscalculated using Equation 35, wherevariables are as defined in Equations 31 and32, as follows:
Equation 35
Dn
Dj
ji
n j' '= ×
=∑1
1
5.5.4 FRM Audits. FRM Audits areperformed once per quarter for selectedsamplers. The reporting organization reportsconcentration data from the primary sampler.Calculations for FRM Audits are similar to
those for collocated samplers having FRMsamplers as duplicates. The calculationsdiffer because only one check is performedper quarter.
5.5.4.1 Accuracy for a Single Sampler,Quarterly Basis (di). The percentagedifference, di, for each check is calculatedusing Equation 26, where Xi represents theconcentration produced from the FRMsampler and Yi represents the concentrationreported for the primary sampler. For quarterq, the bias estimate for sampler j is denotedDj,q.
5.5.4.2 Bias of a Single Sampler - AnnualBasis (D’j). For particulate sampler j, themean bias for the year is derived from thequarterly bias estimates, Dj,q, using Equation
31, where nj,q equals 1 because one FRMaudit is performed per quarter.
5.5.4.3. Bias for a Single ReportingOrganization - Annual Basis (D’). Thereporting organizations mean bias iscalculated using Equation 35, wherevariables are as defined in Equations 31 and32.
References in Appendix A of Part 58
(1) Rhodes, R.C. Guideline on the Meaningand Use of Precision and Accuracy DataRequired by 40 CFR part 58, Appendices Aand B. EPA-600/4-83/023. U.S.Environmental Protection Agency, ResearchTriangle Park, NC 27711, June, 1983.
(2) American National Standard--Specifications and Guidelines for Quality

38842 Federal Register / Vol. 62, No. 138 / Friday, July 18, 1997 / Rules and Regulations
Systems for Environmental Data Collectionand Environmental Technology Programs.ANSI/ASQC E4-1994. January 1995.Available from American Society for QualityControl, 611 East Wisconsin Avenue,Milwaukee, WI 53202.
(3) EPA Requirements for QualityManagement Plans. EPA QA/R-2. August1994. Available from U.S. EnvironmentalProtection Agency, ORD Publications Office,Center for Environmental ResearchInformation (CERI), 26 W. Martin LutherKing Drive, Cincinnati, OH 45268.
(4) EPA Requirements for QualityAssurance Project Plans for EnvironmentalData Operations. EPA QA/R-5. August 1994.Available from U.S. EnvironmentalProtection Agency, ORD Publications Office,Center for Environmental ResearchInformation (CERI), 26 W. Martin LutherKing Drive, Cincinnati, OH 45268.
(5) Guidance for the Data QualityObjectives Process. EPA QA/G-4. September1994. Available from U.S. EnvironmentalProtection Agency, ORD Publications Office,Center for Environmental ResearchInformation (CERI), 26 W. Martin LutherKing Drive, Cincinnati, OH 45268.
(6) Quality Assurance Handbook for AirPollution Measurement Systems, Volume 1--A Field Guide to Environmental QualityAssurance. EPA-600/R-94/038a. April 1994.Available from U.S. Environmental
Protection Agency, ORD Publications Office,Center for Environmental ResearchInformation (CERI), 26 W. Martin LutherKing Drive, Cincinnati, OH 45268.
(7) Quality Assurance Handbook for AirPollution Measurement Systems, Volume II--Ambient Air Specific Methods EPA-600/R-94/038b. Available from U.S. EnvironmentalProtection Agency, ORD Publications Office,Center for Environmental ResearchInformation (CERI), 26 W. Martin LutherKing Drive, Cincinnati, OH 45268.
(7a) Copies of section 2.12 of the QualityAssurance Handbook for Air PollutionMeasurement Systems, are available fromDepartment E (MD-77B), U.S. EPA, ResearchTriangle Park, NC 27711.
(8) List of Designated Reference andEquivalent Methods. Available from U.S.Environmental Protection Agency, NationalExposure Research Laboratory, QualityAssurance Branch, MD-77B, ResearchTriangle Park, NC 27711.
(9) Technical Assistance Document forSampling and Analysis of Ozone Precursors.Atmospheric Research and ExposureAssessment Laboratory, U.S. EnvironmentalProtection Agency, Research Triangle Park,NC 27711. EPA 600/8-91-215. October 1991.
(10) EPA Traceability Protocol for Assayand Certification of Gaseous CalibrationStandards. EPA-600/R-93/224. September1993. Available from U.S. Environmental
Protection Agency, ORD Publications Office,Center for Environmental ResearchInformation (CERI), 26 W. Martin LutherKing Drive, Cincinnati, OH 45268.
(11) Paur, R.J. and F.F. McElroy. TechnicalAssistance Document for the Calibration ofAmbient Ozone Monitors. EPA-600/4-79-057.U.S. Environmental Protection Agency,Research Triangle Park, NC 27711,September, 1979.
(12) McElroy, F.F. Transfer Standards forthe Calibration of Ambient Air MonitoringAnalyzers for Ozone. EPA-600/4-79-056. U.S.Environmental Protection Agency, ResearchTriangle Park, NC 27711, September, 1979.
(13) Musick, D.R. The Ambient AirPrecision and Accuracy Program: 1995Annual Report. EPA-454/R97001. U.S.Environmental Protection Agency, ResearchTriangle Park, NC 27711, February 1997.
(14) Papp, M.L., J,B., Elkins, D.R., Musickand M.J., Messner, Data Quality Objectivesfor the PM2.5. Monitoring Data, U.S.Environmental Protection Agency, ResearchTriangle Park, NC 27711. In preparation.
(15) Photochemical Assessment MonitoringStations Implementation Manual. EPA-454/B-93-051, U.S. Environmental ProtectionAgency, Research Triangle Park, NC 27711,March 1994.
Tables to Appendix A of Part 58
TABLE A–1.—MINIMUM DATA ASSESSMENT REQUIREMENTS
Method Assessment Method Coverage Minimum Frequency Parameters Reported
Precision:Automated Methods for
SO2, NO2, O3, andCO
Response check at con-centration between .08and .10 ppm (8 & 10ppm for CO) 2
Each analyzer Once per 2 weeks Actual concentration 2 andmeasured concentra-tion 3
Manual Methods: Allmethods exceptPM2.5
Collocated samplers 1 site for 1–5 sites2 sites for 6–20 sites3 sites >20 sites (sites
with highest conc.)
Once every six days Particle mass concentra-tion indicated by sam-pler and by collocatedsampler
Accuracy:Automated Methods for
SO2, NO2, O3, andCO
Response check at.03–.08 ppm1,2
.15–.20 ppm1,2
.35–.45 ppm1,2
80–.90 ppm1,2 (if applica-ble)
1. Each analyzer2. 25% of analyzers (at
least 1)
1. Once per year2. Each calendar quarter
Actual concentration 2 andmeasured (indicated)concentration 3 for eachlevel
Manual Methods forSO2, and NO2
Check of analytical proce-dure with audit standardsolutions
Analytical system Each day samples areanalyzed, at least twiceper quarter
Actual concentration andmeasured (indicated)concentration for eachaudit solution
TSP, PM10 Check of sampler flow rate 1. Each sampler2. 25% of samplers (at
least 1)
1. Once per year2. Each calendar quarter
Actual flow rate and flowrate indicated by thesampler
Lead 1. Check of sample flowrate as for TSP
1. Each sampler 1. Include with TSP 1. Same as for TSP
2. Check of analytical sys-tem with Pb audit strips
2. Analytical system 2. Each quarter 2. Actual concentrationand measured (indi-cated) concentration ofaudit samples (µg Pb/strip)
PM2.5

38843Federal Register / Vol. 62, No. 138 / Friday, July 18, 1997 / Rules and Regulations
TABLE A–1.—MINIMUM DATA ASSESSMENT REQUIREMENTS—Continued
Method Assessment Method Coverage Minimum Frequency Parameters Reported
Manual and AutomatedMethods-Precision.
Collocated samplers 25% of SLAMS (monitorswith Conc affectingNAAQS violation status)
Once every six days 1. Particle mass con-centration indicated bysampler and by collo-cated sampler
2. 24-hour value for auto-mated methods
Manual and AutomatedMethods-Accuracyand Bias
1. Check of sampler flowrate
25% of SLAMS (monitorswith Conc affectingNAAQS violation status)
1. Minimum of every cal-endar quarter, 4 checksper year
1. Actual flow rate andflow rate indicated bysampler
2. Audit with referencemethod
2. Minimum 4 measure-ments per year
2. Particle mass con-centration indicated bysampler and by auditreference sampler
1 Concentration times 100 for CO.2 Effective concentration for open path analyzers.3 Corrected concentration, if applicable, for open path analyzers.
TABLE A-2.—SUMMARY OF PM2.5 COLLOCATION AND AUDITS PROCEDURES AS AN EXAMPLE OF A TYPICAL REPORTINGORGANIZATION NEEDING 43 MONITORS, HAVING PROCURED FRMS AND THREE OTHER EQUIVALENT METHOD TYPES
Method Designation Total # of Monitors Total # Collocated # of CollocatedFRMs
# of CollocatedMonitors of Same
Type
# of IndependentFRM Audits
FRM 25 6 6 n/a 6Type A 10 3 2 1 3Type C 2 1 1 0 1Type D 6 2 1 1 2
m. Appendix C is amended byrevising section 2.2 and adding sections2.2.1 and 2.2.2, adding sections 2.4through 2.5, revising section 2.7.1, andadding section 2.9 and references 4through 6 to section 6.0 to read asfollows:
Appendix C—Ambient Air QualityMonitoring Methodology
* * * * *2.2 Substitute PM10 samplers.2.2.1 For purposes of showing compliance
with the NAAQS for particulate matter, ahigh volume TSP sampler described in 40CFR part 50, Appendix B, may be used in aSLAMS in lieu of a PM10 monitor as long asthe ambient concentrations of particlesmeasured by the TSP sampler are below thePM10 NAAQS. If the TSP sampler measuresa single value that is higher than the PM10
24–hour standard, or if the annual average ofits measurements is greater than the PM10
annual standard, the TSP sampler operatingas a substitute PM10 sampler must bereplaced with a PM10 monitor. For a TSPmeasurement above the 24–hour standard,the TSP sampler should be replaced with aPM10 monitor before the end of the calendarquarter following the quarter in which thehigh concentration occurred. For a TSPannual average above the annual standard,the PM10 monitor should be operating byJune 30 of the year following the exceedance.
2.2.2 In order to maintain historicalcontinuity of ambient particulate mattertrends and patterns for PM10 NAMS that werepreviously TSP NAMS, the TSP high volumesampler must be operated concurrently withthe PM10 monitor for a one-year period
beginning with the PM10 NAMS start-up date.The operating schedule for the TSP samplermust be at least once every 6 days regardlessof the PM10 sampling frequency.
* * * * *2.4 Approval of non-designated PM2.5
methods operated at specific individual sites.A method for PM2.5 that has not beendesignated as a reference or equivalentmethod as defined in § 50.1 of this chaptermay be approved for use for purposes ofsection 2.1 of this Appendix at a particularSLAMS under the following stipulations.
2.4.1 The method must be demonstrated tomeet the comparability requirements (exceptas provided in this section 2.4.1) set forth in§ 53.34 of this chapter in each of the fourseasons at the site at which it is intended tobe used. For purposes of this section 2.4.1,the requirements of § 53.34 of this chaptershall apply except as follows:
2.4.1.1 The method shall be tested at thesite at which it is intended to be used, andthere shall be no requirement for tests at anyother test site.
2.4.1.2 For purposes of this section 2.4, theseasons shall be defined as follows: Springshall be the months of March, April, andMay; summer shall be the months of June,July, and August; fall shall be the months ofSeptember, October, and November; andwinter shall be the months of December,January, and February; when alternateseasons are approved by the Administrator.
2.4.1.3 No PM10 samplers shall be requiredfor the test, as determination of the PM2.5/PM10 ratio at the test site shall not berequired.
2.4.1.4 The specifications given in Table C-4 of part 53 of this chapter for Class Imethods shall apply, except that there shall
be no requirement for any minimum numberof sample sets with Rj greater than 40 ©g/m3
for 24–hour samples or greater than 15 ©g/m3 average concentration collected over a 48-hour period.
2.4.2 The monitoring agency wishing touse the method must develop and implementappropriate quality assurance procedures forthe method.
2.4.3 The monitoring agency wishing touse the method must develop and implementappropriate procedures for assessing andreporting the precision and accuracy of themethod comparable to the procedures setforth in Appendix A of this part fordesignated reference and equivalentmethods.
2.4.4 The assessment of network operatingprecision using collocated measurementswith reference method ‘‘audit’’ samplersrequired under section 3 of Appendix A ofthis part shall be carried out semi-annuallyrather than annually (i.e., monthly auditswith assessment determinations each 6months).
2.4.5 Requests for approval under thissection 2.4 must meet the general submittalrequirements of sections 2.7.1 and 2.7.2.1 ofthis Appendix and must include therequirements in sections 2.4.5.1 through2.4.5.7 of this Appendix.
2.4.5.1 A clear and unique description ofthe site at which the method or sampler willbe used and tested, and a description of thenature or character of the site and theparticulate matter that is expected to occurthere.
2.4.5.2 A detailed description of themethod and the nature of the sampler oranalyzer upon which it is based.

38844 Federal Register / Vol. 62, No. 138 / Friday, July 18, 1997 / Rules and Regulations
2.4.5.3 A brief statement of the reason orrationale for requesting the approval.
2.4.5.4 A detailed description of the qualityassurance procedures that have beendeveloped and that will be implemented forthe method.
2.4.5.5 A detailed description of theprocedures for assessing the precision andaccuracy of the method that will beimplemented for reporting to AIRS.
2.4.5.6 Test results from the comparabilitytests as required in section 2.4.1 through2.4.1.4 of this Appendix.
2.4.5.7 Such further supplementalinformation as may be necessary or helpfulto support the required statements and testresults.
2.4.6 Within 120 days after receiving arequest for approval of the use of a methodat a particular site under this section 2.4 andsuch further information as may be requestedfor purposes of the decision, theAdministrator will approve or disapprove themethod by letter to the person or agencyrequesting such approval.
2.5 Approval of non-designated methodsunder § 58.13(f). An automated (continuous)method for PM2.5 that is not designated aseither a reference or equivalent method asdefined in § 50.1 of this chapter may beapproved under § 58.13(f) for use at a SLAMSfor the limited purposes of § 58.13(f). Such ananalyzer that is approved for use at a SLAMSunder § 58.13(f), identified as correlatedacceptable continuous (CAC) monitors, shallnot be considered a reference or equivalentmethod as defined in § 50.1 of this chapterby virtue of its approval for use under§ 58.13(f), and the PM2.5 monitoring dataobtained from such a monitor shall not beotherwise used for purposes of part 50 of thischapter.
* * * * *2.7.1 Requests for approval under sections
2.4, 2.6.2, or 2.8 of this Appendix must besubmitted to: Director, National ExposureAssessment Laboratory, Department E, (MD-77B), U.S. Environmental Protection Agency,Research Triangle Park, North Carolina27711.
* * * * *2.9 Use of IMPROVE Samplers at a
SLAMS. ‘‘IMPROVE’’ samplers may be usedin SLAMS for monitoring of regionalbackground and regional transportconcentrations of fine particulate matter. TheIMPROVE samplers were developed for usein the Interagency Monitoring of ProtectedVisual Environments (IMPROVE) network tocharacterize all of the major components andmany trace constituents of the particulatematter that impair visibility in Federal ClassI Areas. These samplers are routinelyoperated at about 70 locations in the UnitedStates. IMPROVE samplers consist of foursampling modules that are used to collecttwice weekly 24–hour duration simultaneoussamples. Modules A, B, and C collect PM2.5
on three different filter substrates that arecompatible with a variety of analyticaltechniques, and module D collects a PM10
sample. PM2.5 mass and elementalconcentrations are determined by analysis ofthe 25mm diameter stretched Teflon filtersfrom module A. More complete descriptionsof the IMPROVE samplers and the data they
collect are available elsewhere (References 4,5, and 6 of this Appendix).
* * * * *6.0 References.
* * * * *(4) Eldred, R.A., Cahill, T.A., Wilkenson,
L.K., et al., Measurements of fine particlesand their chemical components in theIMPROVE/NPS networks, in Transactions ofthe International Specialty Conference onVisibility and Fine Particles, Air and WasteManagement Association: Pittsburgh, PA,1990; pp 187-196.
(5) Sisler, J.F., Huffman, D., and Latimer,D.A.; Spatial and temporal patterns and thechemical composition of the haze in theUnited States: An analysis of data from theIMPROVE network, 1988-1991, ISSN No.0737-5253-26, National Park Service, Ft.Collins, CO, 1993.
(6) Eldred, R.A., Cahill, T.A., Pitchford, M.,and Malm, W.C.; IMPROVE--a new remotearea particulate monitoring system forvisibility studies, Proceedings of the 81stAnnual Meeting of the Air Pollution ControlAssociation, Dallas, Paper 88-54.3, 1988.
n. Appendix D is amended by revisingin the table of contents the entries for2.8, 3.7, 4., and 5. and adding an entryfor 6., by revising the first threeparagraphs and Table 1 of section 1.,revising the second paragraph in section2. and adding a new paragraph to theend of the section before section 2.1,revising section 2.8 and adding sections2.8.0.1 through 2.8.2.3, revising thethird and fifth paragraphs in section 3.,revising section 3.7 and adding sections3.7.1 through 3.7.7.4, revising the sixthparagraph in section 4.2 andredesignating Figures 1 and 2 as Figures5 and 6 respectively, and revising theredesignated figures, revising footnote 3of Table 2 of section 4.4, revisingsection 5. and reference 18 in section 6.to read as follows:
Appendix D—Network Design for State andLocal Air Monitoring Stations (SLAMS),National Air Monitoring Stations (NAMS),and Photochemical Assessment MonitoringStations (PAMS)
* * * * *2.8 Particulate Matter Design Criteria for
SLAMS* * * * *3.7 Particulate Matter Design Criteria for
NAMS4. Network Design for Photochemical
Assessment Monitoring Stations (PAMS)5. Summary6. References
1. SLAMS Monitoring Objectives and SpatialScales.
The purpose of this Appendix is todescribe monitoring objectives and generalcriteria to be applied in establishing the Stateand Local Air Monitoring Stations (SLAMS)networks and for choosing general locationsfor new monitoring stations. It also describescriteria for determining the number andlocation of National Air Monitoring Stations(NAMS), Photochemical AssessmentMonitoring Stations (PAMS), and core
Stations for PM2.5. These criteria will also beused by EPA in evaluating the adequacy ofthe SLAMS/NAMS/PAMS and core PM2.5
networks.The network of stations that comprise
SLAMS should be designed to meet aminimum of six basic monitoring objectives.These basic monitoring objectives are:
(1) To determine highest concentrationsexpected to occur in the area covered by thenetwork.
(2) To determine representativeconcentrations in areas of high populationdensity.
(3) To determine the impact on ambientpollution levels of significant sources orsource categories.
(4) To determine general backgroundconcentration levels.
(5) To determine the extent of Regionalpollutant transport among populated areas;and in support of secondary standards.
(6) To determine the welfare-relatedimpacts in more rural and remote areas (suchas visibility impairment and effects onvegetation).
It should be noted that this Appendixcontains no criteria for determining the totalnumber of stations in SLAMS networks,except that a minimum number of leadSLAMS and PM2.5 are prescribed and theminimal network introduced in § 58.20 isexplained. The optimum size of a particularSLAMS network involves trade offs amongdata needs and available resources that EPAbelieves can best be resolved during thenetwork design process.
* * * * *
TABLE 1.—RELATIONSHIP AMONGMONITORING OBJECTIVES ANDSCALE OF REPRESENTATIVENESS
Monitoring Objective Appropriate SitingScales
Highest concentration Micro, Middle, neigh-borhood (some-times urban1)
Population ................. Neighborhood, urbanSource impact ........... Micro, middle, neigh-
borhoodGeneral/background .. Neighborhood, urban,
regionalRegional transport ..... Urban/regionalWelfare-related im-
pacts.Urban/regional
1 Urban denotes a geographic scale applica-ble to both cities and rural areas
* * * * *2. SLAMS Network Design Procedures.
* * * * *The discussion of scales in sections 2.3
through 2.8 of this Appendix does notinclude all of the possible scales for eachpollutant. The scales that are discussed arethose that are felt to be most pertinent forSLAMS network design.
* * * * *Information such as emissions density,
housing density, climatological data,geographic information, traffic counts, andthe results of modeling will be useful indesigning regulatory networks. Air pollutioncontrol agencies have shown the value of

38845Federal Register / Vol. 62, No. 138 / Friday, July 18, 1997 / Rules and Regulations
1The boundaries of MPAs do not have tonecessarily correspond to those of MSAs andexisting intra or interstate air pollution planningdistricts may be utilized.
screening studies, such as intensive studiesconducted with portable samplers, indesigning networks. In many cases, inselecting sites for core PM2.5 or carbonmonoxide SLAMS, and for defining theboundaries of PM2.5 optional communitymonitoring zones, air pollution controlagencies will benefit from using such studiesto evaluate the spatial distribution ofpollutants.
* * * * *2.8 Particulate Matter Design Criteria for
SLAMS.As with other pollutants measured in the
SLAMS network, the first step in designingthe particulate matter network is to collectthe necessary background information.Various studies in References 11, 12, 13, 14,15, and 16 of section 6 of this Appendix havedocumented the major source categories ofparticulate matter and their contribution toambient levels in various locationsthroughout the country.
2.8.0.1 Sources of background informationwould be regional and traffic maps, andaerial photographs showing topography,settlements, major industries and highways.These maps and photographs would be usedto identify areas of the type that are ofconcern to the particular monitoringobjective. After potentially suitablemonitoring areas for particulate matter havebeen identified on a map, modeling may beused to provide an estimate of particulatematter concentrations throughout the area ofinterest. After completing the first step,existing particulate matter stations should beevaluated to determine their potential ascandidates for SLAMS designation. Stationsmeeting one or more of the six basicmonitoring objectives described in section 1of this Appendix must be classified into oneof the five scales of representativeness(micro, middle, neighborhood, urban andregional) if the stations are to becomeSLAMS. In siting and classifying particulatematter stations, the procedures in references17 and 18 of section 6 of this Appendixshould be used.
2.8.0.2 The most important spatial scales toeffectively characterize the emissions ofparticulate matter from both mobile andstationary sources are the middle scales forPM10 and neighborhood scales for both PM10
and PM2.5. For purposes of establishingmonitoring stations to represent largehomogenous areas other than the abovescales of representativeness and tocharacterize regional transport, urban orregional scale stations would also be needed.Most PM2.5 monitoring in urban areas shouldbe representative of a neighborhood scale.
2.8.0.3 Microscale—This scale wouldtypify areas such as downtown streetcanyons and traffic corridors where thegeneral public would be exposed tomaximum concentrations from mobilesources. In some circumstances, themicroscale is appropriate for particulatestations; core SLAMS on the microscaleshould, however, be limited to urban sitesthat are representative of long-term humanexposure and of many suchmicroenvironments in the area. In general,microscale particulate matter sites should belocated near inhabited buildings or locations
where the general public can be expected tobe exposed to the concentration measured.Emissions from stationary sources such asprimary and secondary smelters, powerplants, and other large industrial processesmay, under certain plume conditions,likewise result in high ground levelconcentrations at the microscale. In the lattercase, the microscale would represent an areaimpacted by the plume with dimensionsextending up to approximately 100 meters.Data collected at microscale stations provideinformation for evaluating and developinghot spot control measures. Unless these sitesare indicative of population-orientedmonitoring, they may be more appropriatelyclassified as SPMs.
2.8.0.4 Middle Scale—Much of themeasurement of short-term public exposureto coarse fraction particles (PM10) is on thisscale and on the neighborhood scale; for fineparticulate, much of the measurement is onthe neighborhood scale. People movingthrough downtown areas, or living nearmajor roadways, encounter particles thatwould be adequately characterized bymeasurements of this spatial scale. Thus,measurements of this type would beappropriate for the evaluation of possibleshort-term exposure public health effects ofparticulate matter pollution. In manysituations, monitoring sites that arerepresentative of micro-scale or middle-scaleimpacts are not unique and are representativeof many similar situations. This can occuralong traffic corridors or other locations in aresidential district. In this case, one locationis representative of a neighborhood of smallscale sites and is appropriate for evaluationof long-term or chronic effects. This scalealso includes the characteristicconcentrations for other areas withdimensions of a few hundred meters such asthe parking lot and feeder streets associatedwith shopping centers, stadia, and officebuildings. In the case of PM10, unpaved orseldom swept parking lots associated withthese sources could be an important sourcein addition to the vehicular emissionsthemselves.
2.8.0.5 Neighborhood Scale—Measurements in this category wouldrepresent conditions throughout somereasonably homogeneous urban subregionwith dimensions of a few kilometers and ofgenerally more regular shape than the middlescale. Homogeneity refers to the particulatematter concentrations, as well as the land useand land surface characteristics. Much of thePM2.5 exposures are expected to be associatedwith this scale of measurement. In somecases, a location carefully chosen to provideneighborhood scale data would represent notonly the immediate neighborhood but alsoneighborhoods of the same type in otherparts of the city. Stations of this kind providegood information about trends andcompliance with standards because theyoften represent conditions in areas wherepeople commonly live and work for periodscomparable to those specified in the NAAQS.In general, most PM2.5 monitoring in urbanareas should have this scale. A PM2.5
monitoring location is assumed to berepresentative of a neighborhood scale unlessthe monitor is adjacent to a recognized PM2.5
emissions source or is otherwisedemonstrated to be representative of asmaller spatial scale by an intensivemonitoring study. This category also mayinclude industrial and commercialneighborhoods especially in districts ofdiverse land use where residences areinterspersed.
2.8.0.6 Neighborhood scale data couldprovide valuable information for developing,testing, and revising models that describe thelarger-scale concentration patterns, especiallythose models relying on spatially smoothedemission fields for inputs. The neighborhoodscale measurements could also be used forneighborhood comparisons within orbetween cities. This is the most likely scaleof measurements to meet the needs ofplanners.
2.8.0.7 Urban Scale—This class ofmeasurement would be made to characterizethe particulate matter concentration over anentire metropolitan or rural area ranging insize from 4 to 50 km. Such measurementswould be useful for assessing trends in area-wide air quality, and hence, the effectivenessof large scale air pollution control strategies.Core PM2.5 SLAMS may have this scale.
2.8.0.8 Regional Scale—Thesemeasurements would characterize conditionsover areas with dimensions of as much ashundreds of kilometers. As noted earlier,using representative conditions for an areaimplies some degree of homogeneity in thatarea. For this reason, regional scalemeasurements would be most applicable tosparsely populated areas with reasonablyuniform ground cover. Data characteristics ofthis scale would provide information aboutlarger scale processes of particulate matteremissions, losses and transport. Especially inthe case of PM2.5, transport contributes toparticulate concentrations and may affectmultiple urban and State entities with largepopulations such as in the Eastern UnitedStates. Development of effective pollutioncontrol strategies requires an understandingat regional geographical scales of theemission sources and atmospheric processesthat are responsible for elevated PM2.5 levelsand may also be associated with elevatedozone and regional haze.
2.8.1 Specific Design Criteria for PM2.5.2.8.1.1 Monitoring Planning Areas.Monitoring planning areas (MPAs) shall be
used to conform to the community-orientedmonitoring approach used for the PM2.5
NAAQS given in part 50 of this chapter.MPAs are required to correspond to allmetropolitan statistical areas (MSAs) withpopulation greater than 200,000, and allother areas determined to be in violation ofthe PM2.5 NAAQS.1 MPAs for otherdesignated parts of the State are optional. AllMPAs shall be defined on the basis ofexisting, delineated mapping data such asState boundaries, county boundaries, zipcodes, census blocks, or census block groups.
2.8.1.2 PM2.5 Monitoring Sites within theState’s PM Monitoring Network Description.
2.8.1.2.1 The minimum required number,type of monitoring sites, and sampling

38846 Federal Register / Vol. 62, No. 138 / Friday, July 18, 1997 / Rules and Regulations
2The core monitor to be collocated at a PAMS siteshall not be considered a part of the PAMS asdescribed in section 4 of this Appendix, but shallinstead be considered to be a component of theparticular MPA PM2.5 network.
3The measured maximum concentrations at corepopulation-oriented sites should be consistent withthe averaging time of the NAAQS. Therefore, sitesonly with high concentrations for shorter averagingtimes (say 1-hour) should not be category ‘‘a’’ coreSLAMS monitors.
requirements for PM2.5 are based onmonitoring planning areas described in thePM monitoring network description andproposed by the State in accordance with§ 58.20.
2.8.1.2.2 Comparisons to the PM2.5 NAAQSmay be based on data from SPMs in additionto SLAMS (including NAMS, core SLAMSand collocated PM2.5 sites at PAMS), thatmeet the requirements of § 58.13 andAppendices A, C and E of this part, that areincluded in the PM monitoring networkdescription. For comparison to the annualNAAQS, the monitors should beneighborhood scale community-orientedlocations. Special purpose monitors thatmeet part 58 requirements will be exemptfrom NAAQS comparisons with the PM2.5
NAAQS for the first 2 calendar years of theiroperation to encourage PM2.5 monitoringinitially. After this time, however, any SPMthat records a violation of the PM2.5 NAAQSmust be seriously considered as a potentialSLAMS site during the annual SLAMSnetwork review in accordance with § 58.25.If such SPMs are not established as a SLAMS,the agency must document in its annualreport the technical basis for excluding it asa SLAMS.
2.8.1.2.3 The health-effects data base thatserved as the basis for selecting the newPM2.5 standards relied on a spatial averageapproach that reflects average community-oriented area-wide PM exposure levels.Under this approach, the most effective wayto reduce total population risk is by loweringthe annual distributions of ambient 24–hourPM2.5 concentrations, as opposed tocontrolling peak 24–hour concentrations onindividual days. The annual standardselected by EPA will generally be thecontrolling standard for lowering both short-and long-term PM2.5 concentrations on anarea-wide basis and will achieve this result.In order to be consistent with this rationale,therefore, PM2.5 data collected from SLAMSand special purpose monitors that arerepresentative, not of area-wide but rather, ofrelatively unique population-orientedmicroscale, or localized hot spot, or uniquepopulation-oriented middle-scale impactsites are only eligible for comparison only tothe 24–hour PM2.5 NAAQS. However, ininstances where certain population-orientedmicro- or middle-scale PM2.5 monitoring sitesare determined by the EPA RegionalAdministrator to collectively identify a largerregion of localized high ambient PM2.5
concentrations, data from these population-oriented sites would be eligible forcomparison to the annual NAAQS.
2.8.1.2.4 Within each MPA, the responsibleair pollution control agency shall install coreSLAMS, other required SLAMS and as manyPM2.5 stations judged necessary to satisfy theSLAMS requirements and monitoringobjectives of this Appendix.
2.8.1.3 Core Monitoring Stations for PM2.5.Core monitoring stations or sites are a
subset of the SLAMS network for PM2.5 thatare sited to represent community-wide airquality. These core sites include sites to becollocated at PAMS.
2.8.1.3.1 Within each monitoring planningarea, the responsible air pollution controlagency shall install the following core PM2.5
SLAMS:
(a) At least two core PM2.5 SLAMS perMSA with population greater than 500,000sampling everyday, unless exempted by theRegional Administrator, including at leastone station in a population-oriented area ofexpected maximum concentration and atleast one station in an area of poor air qualityand at least one additional core monitorcollocated at a PAMS site if the MPA is alsoa PAMS area2.
(b) At least one core PM2.5 SLAMS perMSA with population greater than 200,000and less than or equal to 500,000 samplingevery third day.
(c) Additional core PM2.5 SLAMS per MSAwith population greater than 1 million,sampling every third day, as specified in thefollowing table:
TABLE 1.—REQUIRED NUMBER OFCORE SLAMS ACCORDING TO MSAPOPULATION
MSA Population Minimum RequiredNo. of Core Sites1
>1 M 3
>2 M 4
>4 M 6
>6 M 8
>8 M 10
1Core SLAMS at PAMS are in addition tothese numbers.
2.8.1.3.2 The site situated in the area ofexpected maximum concentration isanalogous to NAMS ‘‘category a.’’ 3 This willhenceforth be termed a category a coreSLAMS site. The site located in the area ofpoor air quality with high population densityor representative of maximum populationimpact is analogous to NAMS, ‘‘category b.’’This second site will be called a category bcore SLAMS site.
2.8.1.3.3 Those MPAs that are substantiallyimpacted by several different andgeographically disjoint local sources of fineparticulate should have separate core sites tomonitor each influencing source region.
2.8.1.3.4 Within each monitoring planningarea, one or more required core SLAMS maybe exempted by the Regional Administrator.This may be appropriate in areas where thehighest concentration is expected to occur atthe same location as the area of maximum orsensitive population impact, or areas withlow concentrations (e.g., highestconcentrations are less than 80 percent of theNAAQS). When only one core monitor forPM2.5 is included in a MPA or optional CMZ,however, a ‘‘category a’’ core site is strongly
preferred to determine community-orientedPM2.5 concentrations in areas of high averagePM2.5 concentration.
2.8.1.3.5 More than the minimum numberof core SLAMS should be deployed asnecessary in all MPAs. Except for the coreSLAMS described in section 2.8.1.3.1 of thisAppendix, the additional core SLAMS mustonly comply with the minimum samplingfrequency for SLAMS specified in § 58.13(e).
2.8.1.3.6 A subset of the core PM2.5 SLAMSshall be designated NAMS as discussed insection 3.7 of this Appendix. The selectionof core monitoring sites in relation to MPAsand CMZs is discussed further in section2.8.3 of this Appendix.
2.8.1.3.7 Core monitoring sites shallrepresent neighborhood or larger spatialscales. A monitor that is established in theambient air that is in or near a populatedarea, and meets appropriate 40 CFR part 58criteria (i.e., meets the requirements of§ 58.13 and § 58.14, Appendices A, C, and Eof this part) can be presumed to berepresentative of at least a neighborhoodscale, is eligible to be called a core site andshall produce data that are eligible forcomparison to both the 24–hour and annualPM2.5 NAAQS. If the site is adjacent to adominating local source or can be shown tohave average 24–hour concentrationsrepresentative of a smaller spatial scale, thenthe site would only be compared to the 24–hour PM2.5 NAAQS.
2.8.1.3.8 Continuous fine particulatemonitoring at core SLAMS. At least onecontinuous fine particulate analyzer (e.g.,beta attenuation analyzer; tapered-element,oscillating microbalance (TEOM);transmissometer; nephelometer; or otheracceptable continuous fine particulatemonitor) shall be located at a core monitoringPM2.5 site in each metropolitan area with apopulation greater than 1 million. Theseanalyzers shall be used to provide improvedtemporal resolution to better understand theprocesses and causes of elevated PM2.5
concentrations and to facilitate publicreporting of PM2.5 air quality and will be inaccordance with appropriate methodologiesand QA/QC procedures approved by theRegional Administrator.
2.8.1.4 Other PM2.5 SLAMS Locations.In addition to the required core sites
described in section 2.8.1.3 of this Appendix,the State shall also install and operate on anevery third day sampling schedule at leastone SLAMS to monitor for regionalbackground and at least one SLAMS tomonitor regional transport. These monitoringstations may be at a community-oriented siteand their requirement may be satisfied by acorresponding SLAMS monitor in an areahaving similar air quality in another State.The State shall also be required to establishadditional SLAMS sites based on the totalpopulation outside the MSA(s) associatedwith monitoring planning areas that containrequired core SLAMS. There shall be onesuch additional SLAMS for each 200,000people. The minimum number of SLAMSmay be deployed anywhere in the State tosatisfy the SLAMS monitoring objectivesincluding monitoring of small scale impactswhich may not be community-oriented or forregional transport as described in section 1

38847Federal Register / Vol. 62, No. 138 / Friday, July 18, 1997 / Rules and Regulations
of this Appendix. Other SLAMS may also beestablished and are encouraged in a StatePM2.5 network.
2.8.1.5 Additional PM2.5 AnalysisRequirements.
(a) Within 1 year after September 16, 1997,chemical speciation will be required atapproximately 25 PM2.5 core sites collocatedat PAMS sites (1 type 2 site per PAMS area)and at approximately 25 other core sites fora total of approximately 50 sites. Theselection of these sites will be performed bythe Administrator in consultation with theRegional Administrator and the States.Chemical speciation is encouraged atadditional sites. At a minimum, chemicalspeciation to be conducted will includeanalysis for elements, selected anions andcations, and carbon. Samples for requiredspeciation will be collected using appropriatemonitoring methods and sampling schedulein accordance with procedures approved bythe Administrator.
(b) Air pollution control agencies shallarchive PM2.5 filters from all other SLAMSsites for a minimum of one year aftercollection. These filters shall be madeavailable for supplemental analyses at therequest of EPA or to provide information toState and local agencies on the compositionfor PM2.5. The filters shall be archived inaccordance with procedures approved by theAdministrator.
2.8.1.6 Community Monitoring Zones.2.8.1.6.1 The CMZs describe areas within
which two or more core monitors may beaveraged for comparison with the annualPM2.5 NAAQS. This averaging approach asspecified in 40 CFR part 50, Appendix N, isdirectly related to epidemiological studiesused as the basis for the PM2.5 NAAQS. ACMZ should characterize an area of relativelysimilar annual average air quality (i.e., theaverage concentrations at individual sitesshall not exceed the spatial average by morethan 20 percent) and exhibit similar day today variability (e.g., the monitoring sitesshould not have low correlations, say lessthan 0.6). Moreover, the entire CMZ shouldprincipally be affected by the same majoremission sources of PM2.5 .
2.8.1.6.2 Each monitoring planning areamay have at least one CMZ, that may or maynot cover the entire MPA. In metropolitanstatistical areas (MSAs) for which MPAs arerequired, the CMZs may completely cover theentire MSA. When more than one CMZ is
described within an MPA, CMZs shall notoverlap in their geographical coverage. Allareas in the ambient air may become a CMZ.
2.8.1.6.3. As PM2.5 networks are firstestablished, core sites would be usedindividually for making comparisons to theannual PM2.5 NAAQS. As these networksevolve, individual monitors may not beadequate by themselves to characterize theannual average community wide air quality.This is especially true for areas with sharpgradients in annual average air quality.Therefore, CMZs with multiple core SLAMSor other eligible sites as described inaccordance with section 2.8.1.2 to thisAppendix, may be established for thepurposes of providing improved estimates ofcommunity wide air quality and for makingcomparisons to the annual NAAQS. ThisCMZ approach is subject to the constraints ofsection 2.8.1.6.1 to this Appendix.
2.8.1.6.4 The spatial representativeness ofindividual monitoring sites should beconsidered in the design of the network andin establishing the boundaries of CMZs.Communities within the MPA with thehighest PM2.5 concentrations must have ahigh priority for PM2.5 monitoring. Until asufficient number of monitoring stations orCMZs are established, however, themonitored air quality in all parts of the MPAmay not be precisely known. It would bedesirable, however, to design the placementof monitors so that those portions of theMPAs without monitors could becharacterized as having averageconcentrations less than the monitoredportions of the network.
2.8.1.7 Selection of Monitoring LocationsWithin MPAs or CMZs.
2.8.1.7.1 Figure 1 of this Appendixillustrates a hypothetical monitoringplanning area and shows the location ofmonitors in relation to population and areasof poor air quality. Figure 2 of this Appendixshows the same hypothetical MPA as Figure1 of this Appendix and illustrates potentialcommunity monitoring zones and thelocation of core monitoring sites withinthem. Figure 3 of this Appendix illustrateswhich sites within the CMZs of the sameMPA may be used for comparison to thePM2.5 NAAQS.
2.8.1.7.2 In Figure 1 of this Appendix, ahypothetical monitoring planning area isshown representing a typical Eastern USurban areas. The ellipses represent zones
with relatively high population and poor airquality, respectively. Concentration isoplethsare also depicted. The highest populationdensity is indicated by the urban icons, whilethe area of worst air quality is presumed tobe near the industrial symbols. Themonitoring area should have at least one coremonitor to represent community wide airquality in each sub-area affected by differentemission sources. Each monitoring planningarea with population greater than 500,000 isrequired to have at least two core population-oriented monitors that will sample everyday(with PAMS areas requiring three) and mayhave as many other core SLAMS, otherSLAMS, and SPMs as necessary. All SLAMSshould generally be population-oriented,while the SPMs can focus more on othermonitoring objectives, e.g., identifying sourceimpacts and the area boundaries withmaximum concentration. Ca denotes‘‘category a’’ core SLAMS site (community-oriented site in area of expected maximumconcentration); it is shown within thepopulated area and closest to the area withhighest concentration. Cb denotes a ‘‘categoryb’’ core SLAMS site (area of poor air qualitywith high population density orrepresentative of maximum populationimpact); it is shown in the area of poor airquality, closest to highest population density.S denotes other SLAMS sites (monitoring forany objective: Max concentration, populationexposure, source-oriented, background, orregional transport or in support of secondaryNAAQS). P denotes a Special PurposeMonitor (a specialized monitor that, forexample, may use a non-reference sampler).Finally, note that all SPMs would be subjectto the 2-year moratorium against datacomparison to the NAAQS for the first 2complete calendar years of its operation.
2.8.1.7.3 A Monitoring Planning Area mayhave one or more community monitoringzones (CMZ) for aggregation of data fromeligible SLAMS and SPM sites forcomparison to the annual NAAQS. Theplanning area has large gradients of averageair quality and, as shown in Figure 2 may beassigned three CMZs: An industrial zone, adowntown central business district (CBD),and a residential area. (If there is not a largedifference between downtown concentrationsand other residential areas, a separate CBDzone would not be appropriate).

38848 Federal Register / Vol. 62, No. 138 / Friday, July 18, 1997 / Rules and Regulations
2.8.1.7.4 Figure 3 of this Appendixillustrates how CMZs and PM2.5 monitors
might be located in a hypothetical MPAtypical of a Western State. Western States
with more localized sources of PM and largergeographic area could require a different mix

38849Federal Register / Vol. 62, No. 138 / Friday, July 18, 1997 / Rules and Regulations
of SLAMS and SPM monitors and may needmore total monitors. As the networks aredeployed, the available monitors may not besufficient to completely represent all
geographic portions of the MonitoringPlanning Area. Due to the distribution ofpollution and population and because of thenumber and spatial representativeness of
monitors, the MPAs and CMZs may not coverthe entire State.
2.8.1.7.5 Figure 4 of this Appendix showshow the MPAs, CMZs, and PM2.5 monitorsmight be distributed within a hypotheticalState. Areas of the State included withinMPAs are shown within heavy solid lines.Two MPAs are illustrated. Areas in the Stateoutside the MPAs will also include monitors,but this monitoring coverage may be limited.
This portion of the State may also berepresented by CMZs (shown by areasenclosed within dotted lines). The monitorsthat are intended for comparison to theNAAQS are indicated by X. Furthermore,eligible monitors within a CMZ could beaveraged for comparison to the annualNAAQS or examined individually for
comparison to both NAAQS. Both within theMPAs and in the remainder of the State,some special study monitors might notsatisfy applicable 40 CFR part 58requirements and will not be eligible forcomparison to the NAAQS.

38850 Federal Register / Vol. 62, No. 138 / Friday, July 18, 1997 / Rules and Regulations
2.8.2 Substitute PM Monitoring Sites.2.8.2.1 Section 2.2 of Appendix C of this
part describes conditions under which TSPsamplers can be used as substitutes for PM10.This provision is intended to be used whenPM10 concentrations are expected to be verylow and substitute TSP samplers can be usedto satisfy the minimum number of PM10
samplers needed for an adequate PM10
network.2.8.2.2 If data produced by substitute PM
samplers exceed the concentration levelsdescribed in Appendix C of this part, thenthe need for this sampler to be converted toa PM10 or PM2.5 sampler, shall be consideredin the PM monitoring network review. If theState does not believe that a PM10 or PM2.5
sampler should be sited, the State shallsubmit documentation to EPA as part of itsannual PM report to justify this decision. Ifa PM site is not designated as a substitute sitein the PM monitoring network description,then high concentrations at this site wouldnot necessarily cause this site to become aPM2.5 or PM10 site, whichever is indicated.
2.8.2.3 Consistent with § 58.1,combinations of SLAMS PM10 or PM2.5
monitors and other monitors may occupy thesame structure without any mutual effect onthe regulatory definition of the monitors.
3. Network Design for National AirMonitoring Stations (NAMS).
* * * * *Category (a): Stations located in area(s) of
expected maximum concentrations, generallymicroscale for CO, microscale or middlescale for Pb, middle scale or neighborhoodscale for population-oriented particulatematter, urban or regional scale for Regionaltransport PM2.5, neighborhood scale for SO2,and NO2, and urban scale for O3.
* * * * *For each MSA where NAMS are required,
both categories of monitoring stations mustbe established. In the case of SO2 if only oneNAMS is needed, then category (a) must beused. The analysis and interpretation of datafrom NAMS should consider the distinctionbetween these types of stations asappropriate.
* * * * *3.7 Particulate Matter Design Criteria for
NAMS.3.7.1 Table 4 indicates the approximate
number of permanent stations required inMSAs to characterize national and regionalPM10 air quality trends and geographicalpatterns. The number of PM10 stations inareas where MSA populations exceed1,000,000 must be in the range from 2 to 10stations, while in low population urban
areas, no more than two stations are required.A range of monitoring stations is specified inTable 4 because sources of pollutants andlocal control efforts can vary from one partof the country to another and therefore, someflexibility is allowed in selecting the actualnumber of stations in any one locale.
3.7.2 Through promulgation of the NAAQSfor PM2.5, the number of PM10 SLAMS isexpected to decrease, but requirements tomaintain PM10 NAMS remain in effect. ThePM10 NAMS are retained to provide trendsdata, to support national assessments anddecisions, and in some cases to continuedemonstration that a NAAQS for PM10 ismaintained as a requirement under a StateImplementation Plan.
3.7.3 The PM2.5 NAMS shall be a subset ofthe core PM2.5 SLAMS and other SLAMSintended to monitor for regional transport.The PM2.5 NAMS are planned as long-termmonitoring stations concentrated inmetropolitan areas. A target range of 200 to300 stations shall be designated nationwide.The largest metropolitan areas (those with apopulation greater than approximately onemillion) shall have at least one PM2.5 NAMSstations.
3.7.4 The number of total PM2.5 NAMS perRegion will be based on recommendations ofthe EPA Regional Offices, in concert with

38851Federal Register / Vol. 62, No. 138 / Friday, July 18, 1997 / Rules and Regulations
their State and local agencies, in accordancewith the network design goals described insections 3.7.5 through 3.7.7 of this Appendix.The selected stations should represent therange of conditions occurring in the Regionsand will consider factors such as totalnumber or type of sources, ambientconcentrations of particulate matter, andregional transport.
3.7.5 The approach for PM2.5 NAMS isintended to give State and local agenciesmaximum flexibility while apportioning alimited national network. By advancing arange of monitors per Region, EPA intends tobalance the national network with respect togeographic area and population. Table 5presents the target number of PM2.5 NAMSper Region to meet the national goal of 200to 300 stations. These numbers consider a
variety of factors such as Regional differencesin metropolitan population, populationdensity, land area, sources of particulateemissions, and the numbers of PM10 NAMS.
3.7.6 States will be required to establishapproximately 50 NAMS sites for routinechemical speciation of PM2.5. These sites willinclude those collocated at approximately 25PAMS sites and approximately 25 other coreSLAMS sites to be selected by theAdministrator. After 5 years of datacollection, the Administrator may exemptsome sites from collecting speciated data.The number of NAMS sites at whichspeciation will be performed each year andthe number of samples per year will bedetermined by the Administrator.
3.7.7 Since emissions associated with theoperation of motor vehicles contribute to
urban area particulate matter levels,consideration of the impact of these sourcesmust be included in the design of the NAMSnetwork, particularly in MSAs greater than500,000 population. In certain urban areasparticulate emissions from motor vehiclediesel exhaust currently is or is expected tobe a significant source of particulate matterambient levels. The actual number of NAMSand their locations must be determined byEPA Regional Offices and the State agencies,subject to the approval of the Administratoras required by § 58.32. The Administrator’sapproval is necessary to ensure thatindividual stations conform to the NAMSselection criteria and that the network as awhole is sufficient in terms of number andlocation for purposes of national analyses.
TABLE 4.—PM10 NATIONAL AIR MONITORING STATION CRITERIA
[Approximate Number of Stations per MSA]1
Population Category
HighCon-
centra-tion2
MediumCon-
centra-tion3
Low Con-centra-
tion4
>1,000,000 ........................................................................................................................................................... 6–10 4–8 2–4500,000–1,000,000 ............................................................................................................................................... 4–8 2–4 1–2250,000–500,000 .................................................................................................................................................. 3–4 1–2 0–1100,000–250,000 .................................................................................................................................................. 1–2 0–1 0
1 Selection of urban areas and actual number of stations per area will be jointly determined by EPA and the State agency.2 High concentration areas are those for which ambient PM10 data show ambient concentrations exceeding either PM10 NAAQS by 20 percent
or more.3 Medium concentration areas are those for which ambient PM10 data show ambient concentrations exceeding 80 percent of the PM10 NAAQS.4 Low concentration areas are those for which ambient PM10 data show ambient concentrations less than 80 percent of the PM10 NAAQS.
3.7.7.1 Selection of urban areas and actualnumber of stations per area will be jointlydetermined by EPA and the State agency.
3.7.7.2 High concentration areas are thosefor which: Ambient PM10 data show ambientconcentrations exceeding either PM10
NAAQS by 20 percent or more.3.7.7.3 Medium concentration areas are
those for which: Ambient PM10 data showambient concentrations exceeding either 80percent of the PM10 NAAQS.
3.7.7.4 Low concentration areas are thosefor which: Ambient PM10 data show ambientconcentrations less than 80 percent of thePM10 NAAQS.
TABLE 5.—GOALS FOR NUMBER OFPM2.5 NAMS BY REGION
EPA RegionNumber
ofNAMS 1
Percentof Na-tionalTotal
1 ................................ 15 to 20 6 to 82 ................................ 20 to 30 8 to 123 ................................ 20 to 25 8 to 104 ................................ 35 to 50 14 to 205 ................................ 35 to 50 14 to 206 ................................ 25 to 35 10 to 147 ................................ 10 to 15 4 to 68 ................................ 10 to 15 4 to 69 ................................ 25 to 40 10 to 1610 .............................. 10 to 15 4 to 6
Total ................... 205–295 100
1 Each region will have one to three NAMShaving the monitoring of regional transport asa primary objective.
* * * * *4.2 PAMS Monitoring Objectives.* * * * *States choosing to submit an individual
network description for each affectednonattainment area, irrespective of itsproximity to other affected areas, must fulfillthe requirements for isolated areas asdescribed in section 4 of this Appendix, asan example, and illustrated by Figure 5.States containing areas which experiencesignificant impact from long-range transportor are proximate to other nonattainment areas(even in other States) should collectivelysubmit a network description which containsalternative sites to those that would berequired for an isolated area. Such asubmittal should, as a guide, be based on theexample provided in Figure 6, but mustinclude a demonstration that the designsatisfies the monitoring data uses and fulfillsthe PAMS monitoring objectives described insections 4.1 and 4.2 of this Appendix.

38852 Federal Register / Vol. 62, No. 138 / Friday, July 18, 1997 / Rules and Regulations

38853Federal Register / Vol. 62, No. 138 / Friday, July 18, 1997 / Rules and Regulations

38854 Federal Register / Vol. 62, No. 138 / Friday, July 18, 1997 / Rules and Regulations
* * * * *4.4 Minimum Monitoring Network
Requirements.* * * * *Table 2 * * *
3See Figure 5.* * * * *
5. Summary.Table 6 of this Appendix shows by
pollutant, all of the spatial scales that are
applicable for SLAMS and the requiredspatial scales for NAMS. There may also besome situations, as discussed later inAppendix E of this part, where additionalscales may be allowed for NAMS purposes.
TABLE 6.—SUMMARY OF SPATIAL SCALES FOR SLAMS AND REQUIRED SCALES FOR NAMS
Spatial ScaleScales Applicable for SLAMS
SO2 CO O3 NO2 Pb PM10 PM2.5
Micro ...................................................................................... ✔ ✔ ✔ ✔Middle .................................................................................... ✔ ✔ ✔ ✔ ✔ ✔ ✔Neighborhood ........................................................................ ✔ ✔ ✔ ✔ ✔ ✔ ✔Urban ..................................................................................... ✔ ✔ ✔ ✔ ✔ ✔Regional ................................................................................ ✔ ✔ ✔ ✔ ✔
Scales Required for NAMSMicro ...................................................................................... ✔ ✔ ✔ ✔1
Middle .................................................................................... ✔ ✔ ✔1
Neighborhood ........................................................................ ✔ ✔ ✔ ✔ ✔ ✔ ✔Urban ..................................................................................... ✔ ✔ ✔2
Regional ................................................................................ ✔2
1 Only permitted if representative of many such micro-scale environments in a residential district (for middle scale, at least two).2 Either urban or regional scale for regional transport sites.
6. References.* * * * *18. Watson et al. Guidance for Network
Design and Optimum Site Exposure for PM2.5
and PM10. Prepared for U.S. EnvironmentalProtection Agency, Research Triangle Park,NC.
o. Appendix E is amended by revisingthe entry for 8. in the table of contents,by revising the heading to section 8.,adding a sentence at the end of the firstparagraph of section 8.1, and in section8.3 removing the term ‘‘PM10’’ whereverit appears and adding in its place ‘‘PM’’to read as follows:
Appendix E—Probe and Monitoring PathSiting Criteria for Ambient Air QualityMonitoring
* * * * *8. Particulate Matter (PM10 and PM2.5)* * * * *
8. Particulate Matter (PM10 and PM2.5).8.1 Vertical Placement * * * Although
microscale or middle scale stations are not
the preferred spatial scale for PM2.5 sites,there are situations where such sites arerepresentative of several locations within anarea where large segments of the populationmay live or work (e.g., central businessdistrict of Metropolitan area). In these cases,the sampler inlet for such microscale PM2.5
stations must also be 2-7 meters aboveground level.
* * * * *
p. Appendix F is amended by revisingin the table of contents the entry for2.7.3 and adding a new entry for 2.7.4,by redesignating section 2.7.3 as section2.7.4 and adding a new section 2.7.3 toread as follows:
Appendix F—Annual SLAMS Air QualityInformation
* * * * *2.7.3 Annual Summary Statistics
2.7.4 Episode and Other UnscheduledSampling Data
* * * * *
2.7.3 Annual Summary Statistics. Annualarithmetic mean (©g/m3) as specified in 40CFR part 50, Appendix N. All daily PM-finevalues above the level of the 24–hour PM-fine NAAQS and dates of occurrence.Sampling schedule used such as once every6 days, everyday, etc. Number of 24–houraverage concentrations in ranges:
Range Number ofValues
0 to 15 (µg/m3) .........................16 to 30 .....................................31 to 50 .....................................51 to 70 .....................................71 to 90 .....................................91 to 110 ...................................Greater than 110 ......................
[FR Doc. 97–18579 Filed 7–17–97; 8:45 am]
BILLING CODE 6560–50–F