ichitan group pcl. - IR Plus
41
2 nd Analyst Meeting Year 2018 Performance ICHITAN GROUP PCL. May ,2019 15.00 hrs.– 16.00 hrs. Kruithang Room,28 th Floor.
-
Upload
khangminh22 -
Category
Documents
-
view
1 -
download
0
Transcript of ichitan group pcl. - IR Plus

2nd Analyst Meeting Year 2018 Performance
ICHITAN GROUP PCL.
May ,2019 15.00 hrs.– 16.00 hrs. Kruithang Room,28th Floor.

DISCLAIMER
The following presentation may contain forward looking statements by executive of Ichitan Group Public Company Limited (the Company), related to financial or other tendency for future periods, compared with the results for previous periods. Some of the statements contained in this presentation that are not historical facts but these are statements of future estimations with respect to the financial conditions, results of operations and businesses, and related plans and objectives. Disclaimer information is based on management’s current views and assumptions including, but not limited to, prevailing economic and market conditions. These statements involve known and unknown risks and uncertainties that could cause actual results, performance or events to differ materially from those in the statements as originally made. Such statements are not, and should not be constructed as a representation as to future performance of the Company. In addition, such statements should not be regarded as a forecast or projection of future performance of the Company. It should be noted that the actual performance of the Company may vary significantly from such statements in this presentation.
2

Contents
3
Business Information
Product Development
Building Customer Engagement in CLMV
1
2
3
4
Overview & Financial Information

ICHI Overview The Company’s name Ichitan Group Public Company Limited
Stock’s symbol ICHI
Market/Index SET/SET CLMV
Industry/ Sector Agro & Food Industry / Food & Beverage
Type of business
The Company operates beverage business, and manufactures and sells RTD tea beverage under the brands of Ichitan, YenYen by Ichitan, including fruit juice beverage “Bireley’s”.
Registered capital /Fully Paid 1,300 million Baht
Good Corporate Governance
ICHITAN GROUP PCL.
Ichitan Power Co.,Ltd. (The Subsidiary Company)
PT ICHI TAN Indonesia (Joint Venture Company)
99.9% 50%
“Excellent” AGM Checklist: 100% “Excellent” CG Score:2Years

ICHI Financial Performance Revenues from Sale of Goods
Export
1,533
Domestic
4,155
Export
1,693
Domestic
3,511
+10%
-15%
Resulted from: Increased EXPORT sale volume

ICHI Financial Performance EXPENSE

ICHI Financial Performance
Unit : Million /Baht Q4/2017 Q4/2018 Year 2017 Year 2018 Share of loss from JV – Indonesia -42.9 -12.0 -144.3 -110.0

ICHI Profitability ratio
24.7%
13.0%
23.8%
14.8%
7.1%
1.3%
5.5%
0.8% 0.0%
5.0%
10.0%
15.0%
20.0%
25.0%
30.0%
Q4/2017 Q4/2018 Year 2017 Year 2018
Gross Profit Margin (%) Net Profit Margin (%)
Debt to Equity :D/E (times) Year 2017 Year 2018
0.42 0.39

ICHI Financial Performance
(Unit : million Baht)
Year 2018 Year 2017 YoY% Q4/2018 Q4/2017 YoY %
Revenues from sale of Goods 5,204.0 5,687.5 -8.5% 1,312.0 1,304.6 0.6%
Total Revenues 5,216.2 5,719.0 -8.8% 1,314.3 1,311.1 0.2%
Cost of Sell of Goods 4,431.2 4,334.7 2.2% 1,142.0 982.0 16.3%
Distribution Expenses
(incl. Marketing&Promotion cost) 514.6 711.4 -27.7% 101.6 135.9 -25.2%
Administrative Expenses 139.3 174.5 -20.2% 37.0 64.6 -42.7%
Finance Costs 59.4 64.3 -7.5% 13.4 14.5 -7.6%
Total Expenses 5,144.6 5,284.9 -2.7% 1,294.0 1,197.0 8.1%
Share of loss of investment in Joint venture -110.0 (144.3) -23.8% (12.0) (42.9) -72.1%
EBITDA 590.7 877.3 -32.7% 166.0 219.4 -24.3%
Gross Profit 772.7 1,352.8 -42.9% 170.0 322.6 -47.3%
Net Profit (Loss) 43.8 315.1 -86.1% 17.0 93.2 -81.8%
Financial Ratio
Profitability Ratio
Selling (%) 9.9 12.5 -20.9% 7.7 10.4 -25.7%
Admin (%) 2.7 3.1 -12.8% 2.8 5.0 -43.0%
Gross Profit Margin (%) 14.8 23.8 -37.6% 13.0 24.7 -47.6%
Net Profit Margin (%) 0.8 5.5 -84.8% 1.3 7.1 -81.9%
EBITDA (%) 11.4 15.4 -26.4% 12.7 16.8 -24.8%
Consolidated Financial Statements

Overview & Financial Information
Contents
10
Product Development
1
2
3
4
Business Update
Building Customer Engagement in CLMV

Beverage Industry Update Obstacle High competition Taxation
Opportunity New Market New Product Line Premium Product New Product Development Export Market
Trend Premium and Healthy product

15,968 15,574 15,000
13,237 11,892
0
2,000
4,000
6,000
8,000
10,000
12,000
14,000
16,000
18,000
Yr2014 Yr2015 Yr2016 Yr2017 Yr2018
ICHI RTD Tea market update RTD tea Market Share 2018
RTD tea market value 2018 was 11,892 million Baht.
RTD tea market CAGR -7.02 % in between year 2014-2018
13
Market value of RTD tea in Thailand
million Baht
RTD tea Market Share 2017
Others
Jubjai
20.1%
9.7%
39.4%
5.5%
25.3%
YenYen Oishi
JubJai
Others
11,892 Mio. THB
22.4%
10.4%
40.7%
5.5%
21.0%
YenYen Oishi
13,237 Mio. THB
(Value -10.2%)
Source : Nielsen Retail Audit

14
Business Update
7,581 MB (-14.0%)
1,804 MB (-14.8%)
1,141 MB (+30.7%)
1,366 MB (-4.6%)
Main Green Tea
Herbal Tea
Premium Tea
Tea+Nata CoCo
11,892 MB
(-10.2% Value)
Year 2018
Tea Market size & %Growth by Segment
Source : Nielsen Retail Audit

Increasing production capacity to 1,500 Bottles/year PET Production (million Bottles/year) UHT Production(million Bricks/year)
OEM ratio has tendency to decrease continuously in the future after increasing production capacity in phase 2
2 2
Production Line
3 4 2 2 6 2 7
0
400
600
1,000
1,200 1,200 1,200
1,500
200 200 200 200
100%
47%
25%
9%
3% 4%
300 capex
8%
75% 45%
Yr2011 Yr2012 Yr2013 Yr2014 Yr2015 Yr2016 Yr2017 Yr2018 Yr2011 Yr2012 Yr2013 Yr2014 Yr2015
Capacity OEM
8%
16
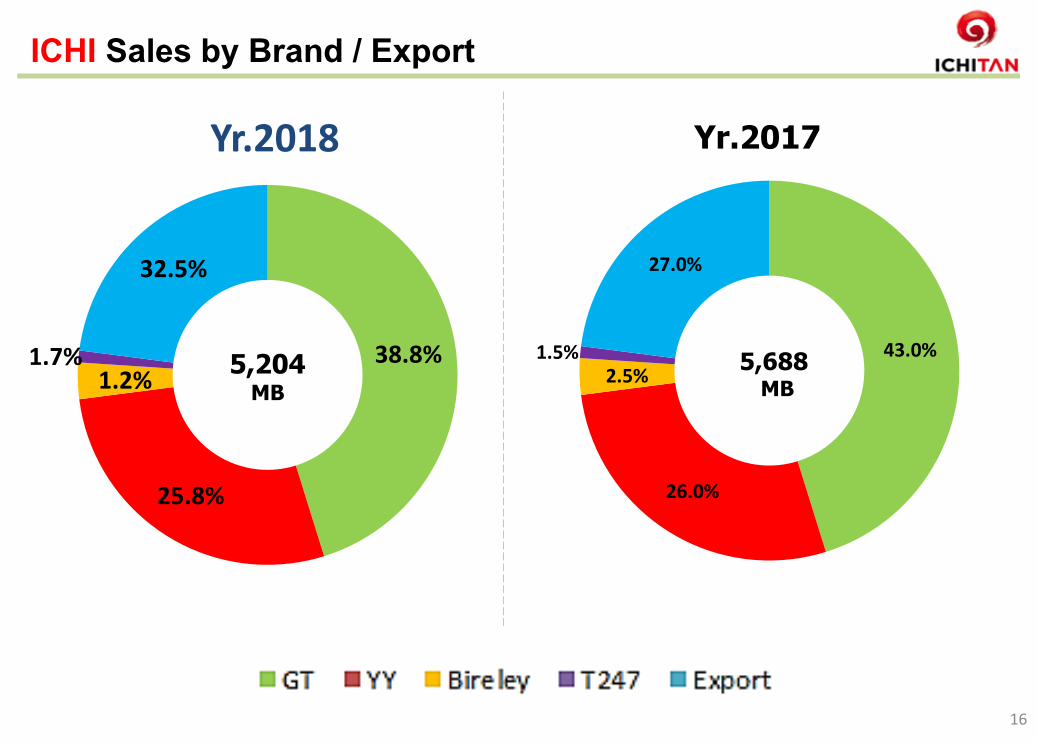
43.0%
26.0%
2.5% 1.5%
27.0%
5,688 MB
ICHI Sales by Brand / Export
38.8%
25.8%
1.2% 1.7%
32.5%
5,204 MB
Yr.2018 Yr.2017

58.2%
41.8 %
ICHI Retail and Distribution Channel
1) Modern Trade
2) Traditional Trade
IGT (TT Retail)
(Wholesaler network and partner of Singha nation wide)
Thailand : 67.5% Export : 32.5%
17
Year 2018
58.2%
7.4%
1.9%

ICHI Proportion of Income by Distribution Channels
18
Yr.2018 Yr.2017
Modern Trade 45.0% Tradition
al Trade 28.0%
Export 27.0%
5,688 MB.
Modern Trade 39.3%
Traditional Trade 28.2%
Export 32.5%
5,204 MB.
Year 2018 : Thailand RTD tea Market Total = 11,892 MB.
Year 2017 : Thailand RTD tea Market Total = 13,237 MB. - 10.2%
- 8.5 %

Overview & Financial Information
Contents
19
1
2
4
Business Update
Product Development
Building Customer Engagement in CLMV

ICHI Product Development
Target Market & Distribution Channel Domestic : Convenience Store and Modern Trade Price: 25 Baht/ Bottle Size: 350 ml. Export: China,USA and etcs. Price: N/A Size: 350 ml.
COCO BURI

ICHI Product Development
Target Market Coconut Milk Drink Export : China and etcs. Price: N/A Size: 350 ml.
ICHITAN WANG
NPD /Seasonal Product
ICHI Product Development

Mar 19 Oct 19 Jan 19
Product : Yen Yen
Size : 350 ml
Price: 20 THB/Bottle
Product : Chew Chew Size : 350 ml Price: 20THB/Bottle
Product : Shizuoka -Hojicha Size : 440 ml Price: 30 THB/Bottle

Co-Create Campaign
ICHI Product Development

เปิดประต ูสูก่า้วใหม ่ของ
อชิตินั กรนีท ี


พรอ้มกนัท ัว่ประเทศ เมษายน 62

Wow!! Exclusive Campaign
ICHI Product Development

Exclusive Campaign
TT & Makro for Summer 2019

POP Example

@ Studio JSL 16 Mar 2019

Exclusive Campaign
Big C for Summer 2019


Exclusive Campaign TESCO for Summer 2019


Overview & Financial Information
Contents
38
1
2
4
Business Update
Product Development
Building Customer Engagement in CLMV
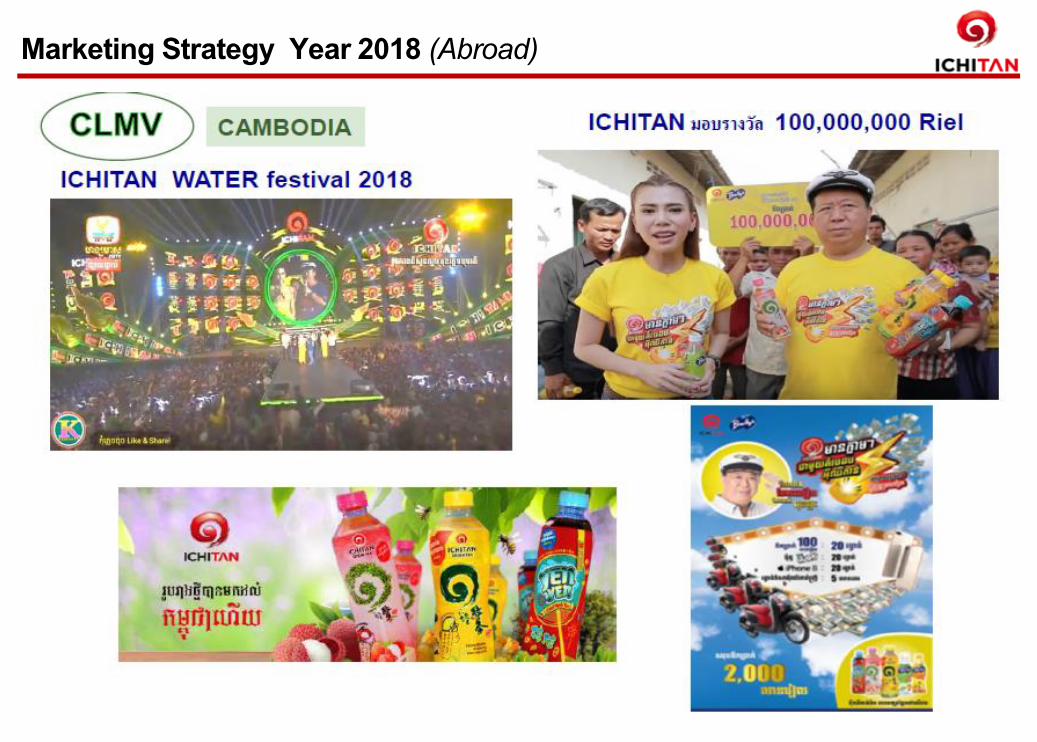
Marketing Strategy Year 2018 (Abroad)

Marketing Strategy Year 2018 (Abroad)
CLMV Lao PDR

Marketing Strategy Year 2018 (Abroad)
Myanmar

Marketing Strategy Year 2018 -2019 (Abroad)