Regional Sector Update - RHB Securities (Thailand) PCL.
28
Regional Sector Update See important disclosures at the end of this report 1 Market Dateline / PP 19489/05/2019 (035080) 15 January 2020 Financial Services | Banks Banks Overcast By Economic Uncertainties Stocks Covered 32 Ratings (Buy/Neutral/Sell): 17 / 11 / 4 Last 12m Earnings Negative 2020 prospects subdued. The signing of a first-stage trade accord between the US and China should bring some relieve to markets. Still, we believe the constant unpredictability of “what happens next” over the past 18 months of bitter battle is unlikely to go away quickly. For now, we continue to expect the moderation in economic growth to weigh on prospects of ASEAN-4 Banks. Indonesia banks is our only OVERWEIGHT – strongest earnings growth within our regional coverage, and reasonable valuations despite its outperformance in 2019. Key trends. ASEAN-4 Banks, consisting of our coverage of banks in Indonesia (IND Banks), Malaysia (MY Banks), Singapore (SG Banks) and Thailand (TH Banks), are heading into 2020 faced with the following key issues: weak loan demand; NIM pressures on possibility of further rate cuts; falling non-II on muted capital markets and digital disruptions; and elevated credit cost on pockets of asset quality stress and adoption of International Financial Reporting Standard 9 (IFRS 9) in Indonesia and Thailand. IND Banks – OVERWEIGHT. IND Banks’ projected net profit growth of 11% in 2020 is the strongest among ASEAN-4 Banks. We prefer the large banks given their strong liquidity and ability to drive loan growth to mitigate margin pressures. Adoption of IFRS 9 would be well absorbed although we may see some volatility in credit costs. Our preferred picks are Bank Central Asia (BBCA IJ, BUY, TP: IDR40,000) and Bank Mandiri (BMRI IJ, BUY, TP: IDR9,300). MY Banks – NEUTRAL. MY Banks are going into 2020 with little to excite investors. Sector ROE should remain on a downward trajectory, albeit mild, given a modest 4% rise in 2020F earnings. Still, with share prices down 10% in 2019, sector risk return appears more favourable at 1.2x 2020F P/BV for 10.2% ROE, while dividend yields of 5-6% would also provide share price support. Our preferred BUYs are CIMB (CIMB MK, BUY, TP: MYR6.10) and Hong Leong Bank (HL Bank) (HLBK MK, BUY, TP: MYR19.20). SG Banks – NEUTRAL. Earnings growth of 1% in 2020 is the weakest vs regional peers. Strength in wealth management business would be negated by the sharp slowdown in loan growth, NIM compression and higher loan provisions for Hong Kong exposures. United Overseas Bank (UOB SP, BUY, TP: SGD29.50) is our only BUY – NII to grow further as loan growth would offset softening SIBOR, and lowest exposure to China vs peers. TH Banks – NEUTRAL. With economic headwinds building up since 2H19, we see downside risk to our projected net profit growth of 7% that is lifted mainly by lower impairment charges. PIOP is expected to dip 2% as the Bank of Thailand (BoT)-led initiatives to lower fees charged for online and mobile transactions should hurt non-II. Investments on digital strategies is also likely to keep CIR elevated. Our picks: Bangkok Bank (BBL) (BBL TB, BUY, TP: THB205.00) and Siam Commercial Bank (SCB) (SCB TB, BUY. TP: THB140.00). Analysts Fiona Leong +603 9280 8886 [email protected] Christopher Andre Benas +6221 5093 9847 [email protected] Liew Wai Hoong +603 9280 8859 [email protected] Leng Seng Choon +65 6232 3890 [email protected] Kasamapon Hamnilrat +66 2088 9739 [email protected] Company Name Rating TP (LCY) % Upside (Downside) P/E (x) Dec-20F P/BV (x) Dec-20F Yield (%) Dec-20F Bank Central Asia BUY 40,000 17.7 25.3 4.2 0.9 Bank Mandiri BUY 9,300 20.4 11.0 1.7 3.5 CIMB BUY 6.10 18.2 9.8 0.9 5.4 Hong Leong Bank BUY 19.20 14.0 12.2 1.2 3.2 UOB BUY 29.50 9.3 10.5 1.2 5.2 Bangkok Bank BUY 205.00 34.4 7.5 0.6 4.8 SCB BUY 140.00 22.3 8.7 0.9 5.4 Source: RHB
-
Upload
khangminh22 -
Category
Documents
-
view
3 -
download
0
Transcript of Regional Sector Update - RHB Securities (Thailand) PCL.

Regional Sector Update
See important disclosures at the end of this report 1
Market Dateline / PP 19489/05/2019 (035080)
15 January 2020 Financial Services | Banks
Banks
Overcast By Economic Uncertainties Stocks Covered 32
Ratings (Buy/Neutral/Sell): 17 / 11 / 4
Last 12m Earnings
Revision Trend:
Negative 2020 prospects subdued. The signing of a first-stage trade accord between
the US and China should bring some relieve to markets. Still, we believe the
constant unpredictability of “what happens next” over the past 18 months of
bitter battle is unlikely to go away quickly. For now, we continue to expect the
moderation in economic growth to weigh on prospects of ASEAN-4 Banks.
Indonesia banks is our only OVERWEIGHT – strongest earnings growth
within our regional coverage, and reasonable valuations despite its
outperformance in 2019.
Key trends. ASEAN-4 Banks, consisting of our coverage of banks in
Indonesia (IND Banks), Malaysia (MY Banks), Singapore (SG Banks) and
Thailand (TH Banks), are heading into 2020 faced with the following key
issues: weak loan demand; NIM pressures on possibility of further rate cuts;
falling non-II on muted capital markets and digital disruptions; and elevated
credit cost on pockets of asset quality stress and adoption of International
Financial Reporting Standard 9 (IFRS 9) in Indonesia and Thailand.
IND Banks – OVERWEIGHT. IND Banks’ projected net profit growth of 11%
in 2020 is the strongest among ASEAN-4 Banks. We prefer the large banks
given their strong liquidity and ability to drive loan growth to mitigate margin
pressures. Adoption of IFRS 9 would be well absorbed although we may see
some volatility in credit costs. Our preferred picks are Bank Central Asia
(BBCA IJ, BUY, TP: IDR40,000) and Bank Mandiri (BMRI IJ, BUY, TP:
IDR9,300).
MY Banks – NEUTRAL. MY Banks are going into 2020 with little to excite
investors. Sector ROE should remain on a downward trajectory, albeit mild,
given a modest 4% rise in 2020F earnings. Still, with share prices down 10%
in 2019, sector risk return appears more favourable at 1.2x 2020F P/BV for
10.2% ROE, while dividend yields of 5-6% would also provide share price
support. Our preferred BUYs are CIMB (CIMB MK, BUY, TP: MYR6.10) and
Hong Leong Bank (HL Bank) (HLBK MK, BUY, TP: MYR19.20).
SG Banks – NEUTRAL. Earnings growth of 1% in 2020 is the weakest vs
regional peers. Strength in wealth management business would be negated
by the sharp slowdown in loan growth, NIM compression and higher loan
provisions for Hong Kong exposures. United Overseas Bank (UOB SP, BUY,
TP: SGD29.50) is our only BUY – NII to grow further as loan growth would
offset softening SIBOR, and lowest exposure to China vs peers.
TH Banks – NEUTRAL. With economic headwinds building up since 2H19,
we see downside risk to our projected net profit growth of 7% that is lifted
mainly by lower impairment charges. PIOP is expected to dip 2% as the Bank
of Thailand (BoT)-led initiatives to lower fees charged for online and mobile
transactions should hurt non-II. Investments on digital strategies is also likely
to keep CIR elevated. Our picks: Bangkok Bank (BBL) (BBL TB, BUY, TP:
THB205.00) and Siam Commercial Bank (SCB) (SCB TB, BUY. TP:
THB140.00).
Analysts
Fiona Leong
+603 9280 8886 [email protected]
Christopher Andre Benas
+6221 5093 9847
Liew Wai Hoong +603 9280 8859 [email protected]
Leng Seng Choon
+65 6232 3890 [email protected]
Kasamapon Hamnilrat +66 2088 9739 [email protected]
Company Name Rating TP
(LCY) % Upside
(Downside) P/E (x)
Dec-20F P/BV (x) Dec-20F
Yield (%) Dec-20F
Bank Central Asia BUY 40,000 17.7 25.3 4.2 0.9 Bank Mandiri BUY 9,300 20.4 11.0 1.7 3.5 CIMB BUY 6.10 18.2 9.8 0.9 5.4 Hong Leong Bank BUY 19.20 14.0 12.2 1.2 3.2 UOB BUY 29.50 9.3 10.5 1.2 5.2 Bangkok Bank BUY 205.00 34.4 7.5 0.6 4.8 SCB BUY 140.00 22.3 8.7 0.9 5.4 Source: RHB

Regional Sector Update
15 January 2020 Financial Services | Banks
See important disclosures at the end of this report 2
Market Dateline / PP 19489/05/2019 (035080)
Investment Summary
Economic backdrop to remain subdued
Across ASEAN-4, real GDP growth for 2020 is not expected to be much different from the past year. RHB economist projected a modest uptick in economic growth for Singapore and Thailand, both of which had experienced a sharp deceleration in 2019 (Figure 1). The Indonesian and Malaysian economies are forecasted to remain in contraction in 2020, with Indonesia likely to be more resilient.
Within the region, Singapore would see the slowest growth at 0.8% in 2020F impacted mainly by external developments and the weak prospects of its trading partners. Indonesia is likely to post the strongest expansion at 4.9%, with higher investments expected to mitigate a softening in household consumption.
RHB economist expects the central banks of Indonesia and Malaysia – Bank Indonesia (BI) and Bank Negara Malaysia (BNM) – to lower policy rates by 50bps and 25bps in 2020. BoT should keep interest rates stable as the 1-day repurchase rate is already at a record low of 1.25%.
Figure 1: ASEAN-4 – real GDP growth, 2017-2020F
Source: Bank Indonesia, BNM, MAS, BoT, RHB
Banks’ 2020 earnings to mirror economic prospects
Reflecting the GDP growth projections, IND Banks are expected to sustained net profit growth at 11% in 2020F while SG Banks’ earnings are forecasted to slump to +1%.
MY Banks’ earnings are projected to recover from -1% in 2019F to +4% in 2020F, helped mainly by a modest rise in operating income and stable impairment charges. TH Banks’ stronger 7% rebound in 2020F earnings would come mainly from lower credit costs following the sharp uplift in loan provision buffers in 2019 ahead of Thai Financial Reporting Standard 9 (TFRS 9) adoption effective Jan 2020. At PIOP level, only TH Banks are expected to report lower profits.
Figure 2: ASEAN-4 Banks – PIOP growth, 2017-2020F Figure 3: ASEAN-4 Banks – net profit growth, 2017-2020F
Source: Banks’ financial statements, RHB Source: Banks’ financial statements, RHB
5.1
5.9
3.6 3.9
5.2
4.7
3.2
4.1
5.0
4.5
0.7
2.7
4.9
4.3
0.8
3.0
-
1.0
2.0
3.0
4.0
5.0
6.0
7.0
Indonesia Malaysia Singapore Thailand
(%) 2017 2018 2019F 2020F
6% 6%
12%
2%
10%
3% 3%
0%
11%
1%
13%
3%
10%
3%
2%
-2%
-4%
-2%
0%
2%
4%
6%
8%
10%
12%
14%
IND Banks MY Banks SG Banks TH Banks
2017 2018 2019F 2020F
30%
11%9%
-8%
14%
11%
19%
9%11%
-4%
9%
0%
11%
4%1%
7%
-15%
-10%
-5%
0%
5%
10%
15%
20%
25%
30%
35%
IND Banks MY Banks SG Banks TH Banks
2017 2018 2019F 2020F

Regional Sector Update
15 January 2020 Financial Services | Banks
See important disclosures at the end of this report 3
Market Dateline / PP 19489/05/2019 (035080)
Share price performances mixed in 2019
IND Banks ended 2019 with a 19% YoY gain that can be attributed to President Joko Widodo’s re-election win in Indonesia’s Presidential Election 2019, the banks’ stronger earnings growth vs regional peers, and the IDR’s 4% YoY rise. This was a sharp recovery from the 4% YoY decline in 2018.
SG Banks’ shares went through periods of volatility in 2019, but ended the year with an 8% YoY gain – a good rebound from -8% YoY in 2018. Share prices were buoyed by the 9% YoY improvement in sector net earnings and decent dividend yields that mitigated concerns over the US-China trade dispute and Hong Kong exposure.
TH Banks started 2019 well and was in positive territory in 1H19. Share prices, however, went on a downtrend since August as macroeconomic challenges led to policy rate cuts. This marked TH Banks’ second consecutive year of decline, a modest -3% YoY in 2019 only because the THB appreciated 12.5% YoY. In local currency terms, TH Banks fell 11% YoY – the sharpest among ASEAN 4-Banks.
MY Banks was the worst performer among ASEAN-4 Banks, down 10% YoY in 2019. The slide in share prices can be attributed to concerns over slowing economic growth, uncertainties in domestic politics, and impact from the Overnight Policy Rate (OPR) cut.
Figure 4: ASEAN 4-Banks – comparative price performance
(USD terms), Jan 2019-2020 YTD
Figure 5: ASEAN 4-Banks – annual price performance (USD
terms), 2017-2019
Source: Bloomberg, RHB Source: Bloomberg, RHB
Regional view: We favour IND Banks
IND Banks is our preferred pick among ASEAN-4 Banks. With the presidential election
done and dusted last year, Indonesia offers investors political stability and a positive structural growth story.
IND Banks continues to stand out against peers for its stronger earnings growth of 11% for 2020. Valuations remain reasonable at 2.8x 2020F P/BV for ROE of 16.9%, just a little higher than historical average of 2.6x, notwithstanding the strong 19% gain in share prices last year. Our preferred stock picks for IND Banks are BBCA and BMRI.
MY Banks over SG Banks. For the remaining three countries, where we have NEUTRAL
ratings, we prefer MY Banks over SG Banks.
MY Banks’ risk return has turned more favourable at 1.2x 2020F P/BV for ROE of 10.2%, following last year’s 10% retreat in share prices. While SG Banks’ valuations (1.2x P/BV; ROE of 11.9%) are slight more attractive, MY Banks pips SG Banks for its higher dividend yields, prospects of relatively stronger currency in 2020F and negligible exposure to Hong Kong’s troubled economy. Our top BUYs for MY Banks are CIMB and HL Bank.
TH Banks rank last. TH Banks have seen a sharp valuation de-rating over the past year.
Current valuations of 0.8x 2020F P/BV for ROE of 9.9% is below -1SD from the historical mean. But with macroeconomic headwinds having gained pace in 2H19, there are rising concerns that risk to 2020 GDP growth is now tilted to the downside. This, coupled with the Government’s desire to rein in the THB to lift growth for the export reliant nation, should keep investors at bay. We believe the adoption of IFRS 9 will be well absorbed, given high levels of provisions buffers (2020F: 153%). Our Top Picks are BBL and SCB.
Longer term, we are concerned that BoT-led initiatives to lower fees charged for online and mobile transactions could result in a structural decline in ROEs.
47%
33%
50%
27%
-4%
3%
-8% -10%
19%
-10%
8%
-3%
-20%
-10%
0%
10%
20%
30%
40%
50%
60%
IND Banks MY Banks SG Banks TH Banks
2017 2018 2019
Regional Sector Update
15 January 2020 Financial Services | Banks
See important disclosures at the end of this report 4
Market Dateline / PP 19489/05/2019 (035080)
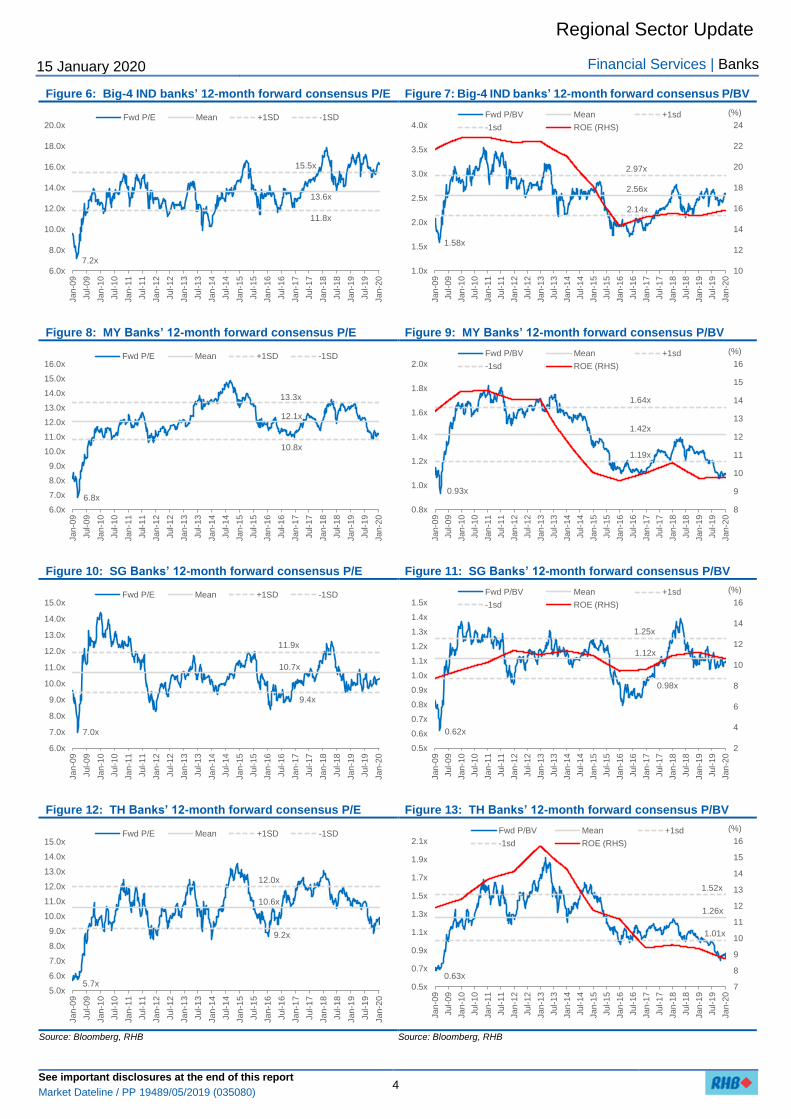
Figure 6: Big-4 IND banks’ 12-month forward consensus P/E Figure 7: Big-4 IND banks’ 12-month forward consensus P/BV
Figure 8: MY Banks’ 12-month forward consensus P/E Figure 9: MY Banks’ 12-month forward consensus P/BV
Figure 10: SG Banks’ 12-month forward consensus P/E Figure 11: SG Banks’ 12-month forward consensus P/BV
Figure 12: TH Banks’ 12-month forward consensus P/E Figure 13: TH Banks’ 12-month forward consensus P/BV
Source: Bloomberg, RHB Source: Bloomberg, RHB
6.0x
8.0x
10.0x
12.0x
14.0x
16.0x
18.0x
20.0x
Jan
-09
Jul-
09
Jan
-10
Jul-
10
Jan
-11
Jul-
11
Jan
-12
Jul-
12
Jan
-13
Jul-
13
Jan
-14
Jul-
14
Jan
-15
Jul-
15
Jan
-16
Jul-
16
Jan
-17
Jul-
17
Jan
-18
Jul-
18
Jan
-19
Jul-
19
Jan
-20
Fwd P/E Mean +1SD -1SD
11.8x
13.6x
15.5x
7.2x
10
12
14
16
18
20
22
24
1.0x
1.5x
2.0x
2.5x
3.0x
3.5x
4.0x
Jan
-09
Jul-
09
Jan
-10
Jul-
10
Jan
-11
Jul-
11
Jan
-12
Jul-
12
Jan
-13
Jul-
13
Jan
-14
Jul-
14
Jan
-15
Jul-
15
Jan
-16
Jul-
16
Jan
-17
Jul-
17
Jan
-18
Jul-
18
Jan
-19
Jul-
19
Jan
-20
(%)Fwd P/BV Mean +1sd
-1sd ROE (RHS)
2.14x
2.56x
2.97x
1.58x
6.0x
7.0x
8.0x
9.0x
10.0x
11.0x
12.0x
13.0x
14.0x
15.0x
16.0x
Jan
-09
Jul-
09
Jan
-10
Jul-
10
Jan-1
1
Jul-
11
Jan
-12
Jul-
12
Jan
-13
Jul-
13
Jan
-14
Jul-
14
Jan
-15
Jul-
15
Jan
-16
Jul-
16
Jan
-17
Jul-
17
Jan
-18
Jul-
18
Jan
-19
Jul-
19
Jan
-20
Fwd P/E Mean +1SD -1SD
10.8x
12.1x
13.3x
6.8x
8
9
10
11
12
13
14
15
16
0.8x
1.0x
1.2x
1.4x
1.6x
1.8x
2.0x
Jan
-09
Jul-
09
Jan
-10
Jul-
10
Jan
-11
Jul-
11
Jan
-12
Jul-
12
Jan
-13
Jul-
13
Jan
-14
Jul-
14
Jan
-15
Jul-
15
Jan
-16
Jul-
16
Jan
-17
Jul-
17
Jan
-18
Jul-
18
Jan
-19
Jul-
19
Jan
-20
(%)Fwd P/BV Mean +1sd
-1sd ROE (RHS)
1.19x
1.42x
1.64x
0.93x
6.0x
7.0x
8.0x
9.0x
10.0x
11.0x
12.0x
13.0x
14.0x
15.0x
Jan
-09
Jul-
09
Jan
-10
Jul-
10
Jan
-11
Jul-
11
Jan
-12
Jul-
12
Jan
-13
Jul-
13
Jan
-14
Jul-
14
Jan
-15
Jul-
15
Jan
-16
Jul-
16
Jan
-17
Jul-
17
Jan
-18
Jul-
18
Jan
-19
Jul-
19
Jan
-20
Fwd P/E Mean +1SD -1SD
9.4x
10.7x
11.9x
7.0x
2
4
6
8
10
12
14
16
0.5x
0.6x
0.7x
0.8x
0.9x
1.0x
1.1x
1.2x
1.3x
1.4x
1.5x
Jan
-09
Jul-
09
Jan
-10
Jul-
10
Jan
-11
Jul-
11
Jan
-12
Jul-
12
Jan
-13
Jul-
13
Jan
-14
Jul-
14
Jan-1
5
Jul-
15
Jan
-16
Jul-
16
Jan
-17
Jul-
17
Jan-1
8
Jul-
18
Jan
-19
Jul-
19
Jan
-20
(%)Fwd P/BV Mean +1sd
-1sd ROE (RHS)
0.98x
1.12x
1.25x
0.62x
5.0x
6.0x
7.0x
8.0x
9.0x
10.0x
11.0x
12.0x
13.0x
14.0x
15.0x
Jan
-09
Jul-
09
Jan
-10
Jul-
10
Jan
-11
Jul-
11
Jan
-12
Jul-
12
Jan
-13
Jul-
13
Jan
-14
Jul-
14
Jan
-15
Jul-
15
Jan
-16
Jul-
16
Jan
-17
Jul-
17
Jan
-18
Jul-
18
Jan
-19
Jul-
19
Jan
-20
Fwd P/E Mean +1SD -1SD
9.2x
10.6x
12.0x
5.7x 7
8
9
10
11
12
13
14
15
16
0.5x
0.7x
0.9x
1.1x
1.3x
1.5x
1.7x
1.9x
2.1x
Jan
-09
Jul-
09
Jan
-10
Jul-
10
Jan
-11
Jul-
11
Jan
-12
Jul-
12
Jan
-13
Jul-
13
Jan
-14
Jul-
14
Jan
-15
Jul-
15
Jan
-16
Jul-
16
Jan
-17
Jul-
17
Jan
-18
Jul-
18
Jan
-19
Jul-
19
Jan
-20
(%)Fwd P/BV Mean +1sd
-1sd ROE (RHS)
1.01x
1.26x
1.52x
0.63x

Regional Sector Update
15 January 2020 Financial Services | Banks
See important disclosures at the end of this report 5
Market Dateline / PP 19489/05/2019 (035080)
COUNTRY VIEWS & STOCK PICKS

Regional Sector Update
15 January 2020 Financial Services | Banks
See important disclosures at the end of this report 6
Market Dateline / PP 19489/05/2019 (035080)
Indonesia – Liquidity Is Key
Decelerating loan growth as GDP and export contracted
We believe the sluggish loan demand seen in 2019 was mainly due to slow global growth as a result of the trade war. Working capital loans, which accounted for 46% of total loans, only grew by 4.1% YoY in Oct 2019, the lowest in three years. This has contributed to slower consumption loan growth of only 6.5% YoY. However, we still see higher growth in investment loans (+11.2% YoY), which brought total loan growth to 6.5% YoY as of Oct 2019. The Financial Services Authority (OJK) forecasted loan growth at only c.8-9% YoY for 2020 (2019: +8-10%), in the absence of significant catalysts. Among the banks under our coverage, we expect Bank Rakyat Indonesia (BBRI IJ, BUY, TP: IDR5,000) to post the strongest loan growth at 12.4% YoY, driven by its focus on the micro and small & medium enterprise (SME) segments.
Liquidity likely improve
As at end Oct 2019, total deposits grew moderately by 5.6% YoY, as liquidity tightened up. However, entering 4Q19, we saw some improvement in liquidity as it recovered from bottoming out in May 2019, with the LDR at above 95%. We expect Hyundai’s commitment to enter Indonesia with foreign direct investments (FDIs) of USD1.55bn until 2030 to help ease liquidity in the system. We think FDI will continue to be a key liquidity factor in the coming years.
Margin compression to persist
BI cut its benchmark rate by 100bps, to 5.0% in 2019. Our economist expects the central bank to lower interest rates by a further 50bps in 2020, as it tries to stimulate growth by easing the monetary policy. This should translate to lower asset yields as customers look for lower borrowing rates, but not all banks will be able to re-price their deposit rates due to still-keen competition for third-party funding.
To offset NIM pressures, banks may have to drive loan volumes. We believe only the Big-4 banks will be able to ramp up loan growth, as their lower funding cost structure enhances the banks’ re-pricing power. Overall, we expect stable NIMs for large banks and some margin slippage for mid- to small-cap banks.
Implementation of IFRS9
Indonesian banks have adopted IFRS 9, which took effect on 1 Jan. Based on what happened in Singapore and Malaysia, the new accounting standard would result in an increase in LLC ratios. Most banks are likely to offset the Day 1 impact for higher provisions via a transfer from retained earnings. While this should mitigate the impact on earnings, it will also reduce capital adequacy ratios (CAR) by an estimated 100-250bps.
Banks with already conservative LLC, namely BBCA (BBCA IJ, BUY, TP: IDR40,000) and BRI with LLC ratios of 164% and 160% respectively, should be less impacted. On the flip side, Bank Tabungan Negara (BBTN) (BBTN IJ, SELL, TP: IDR1,500) may be the most adversely affected, in our view. Management is guiding for LLC ratio to rise to 120%, from only 52.7% currently.
Risks
Downside risks to our call remains slower-than-expected loan growth that may come from a further deceleration in the global economy. Worsening asset quality also poses as a risk to banks, if any surprise downgrades surface.

Regional Sector Update
15 January 2020 Financial Services | Banks
See important disclosures at the end of this report 7
Market Dateline / PP 19489/05/2019 (035080)
Expect a softening, but still profitable
We expect banks to deliver earnings growth of 10.8% YoY in 2020 – a slight moderation from an estimated +11.2% YoY in 2019, but still very decent given the challenging macroeconomic backdrop. Key drivers of 2020F earnings:
i. A 9.4% increase in NII against slower loan growth. We expect NIM to remain stable with impact from expected rate cuts mitigated by rising FDI inflows that will improve system liquidity;
ii. Non-II growth of 9.8% YoY;
iii. A mild 4% YoY rise in total impairment charges with loan credit cost projected at 1.4%. Credit cost is likely to be more volatile this year as banks fine-tune provisioning models in the first year of IFRS9 adoption.
Stay OVERWEIGHT, prefer Big-4 banks
We maintain our OVERWEIGHT rating on the sector, as it remains the backbone of Indonesia’s equity market. While we are not extremely bullish on the sector’s 2020 outlook, due to our expectations of softer GDP growth, the tight liquidity situation should ease as FDIs are already flowing into Indonesia. We believe Hyundai’s commitment to invest USD1.55bn over the next 10 years will help ease liquidity in the system – especially if its supply chain and other companies follow suit. In our view, FDIs will continue to be a key liquidity factor in the coming years.
Another factor to watch is in the adoption of IFRS 9. Banks with high LLC ratios should outperform, as evidenced by what was experienced by Malaysian bank stocks. We maintain our preference on Big-4 banks, over mid- to small-cap banks, given their more liquid balance sheets and higher provision buffers.
Our Top BUYs:
BBCA – Our top Buy is BBCA as we like its defensive qualities. Its solid financial
performance is backed by ample liquidity, with a LDR of 80.6% (the lowest among big banks) and strong CASA franchise (c.75% CASA ratio). Being the main transaction bank for most of its customers helps boost BBCA’s non-II. This should also help in customer retention as most fintech firms partner with BBCA for top-ups of their payment apps. BBCA booked strong PIOP growth of 19% YoY in 9M19, and we believe the stellar performance will continue into 2020.
BMRI – Bank Mandiri (BMRI) (BMRI IJ, BUY, TP: IDR9,300) have shown promising asset
quality improvement over the course of Kartika Wirjoatmodjo’s appointment as CEO. Its credit cost has improved to c.1.5% (from 4% in 2016) and should normalise at this level, as we believe the bank is unlikely to undertake another round of kitchen-sinking under its newly-appointed CEO, Royke Tumilaar (formerly director of its corporate banking unit, the core business of BMRI). We expect the bank’s FY20F earnings to grow by 17% YoY, driven by lower CoF, lower loan-to-fund ratios, as well as continued asset quality improvements contributing to lower credit cost.

Regional Sector Update
15 January 2020 Financial Services | Banks
See important disclosures at the end of this report 8
Market Dateline / PP 19489/05/2019 (035080)
For small/mid-sized banks we like:
Bank Jatim – We like Bank Pembangunan Daerah Jawa Timur (Bank Jatim) (BJTM IJ,
BUY, TP: IDR820) for its robust loan growth coming into 2020F, improved asset quality as well as superior dividend yield of c.7%. For 9M19, its loan growth accelerated to 14% YoY as pension loans are now disbursed solely by Bank Jatim (previously through several banks). In 2020, the bank plans to also disburse micro subsidised loans (KUR), which should further accelerate the expansion of its loan portfolio. Being a key source of revenue for the East Java Province Government, its major shareholder with a 51% stake, Bank Jatim’s dividend payout is consistently above 50% of earnings, translating to an attractive yield of 7-9%.
Bank Tabungan Pensiunan Nasional Syariah (BTPS) (BTPS IJ, BUY, TP: IDR4,150) is a shariah bank with a unique group-based lending business model that has fixed lending rates. The bank enjoys robust financing growth of 27% YoY, while its fixed rate financing translates to an unparalleled net imbalan of 31.2% (shariah’s NIM equivalent). BTPS is also a key beneficiary of the declining interest rate environment. Although valuation is a high 4.9x FY20F P/BV, this is supported by superior ROE of 27%.
Our Top SELL:
BBTN – BBTN’s 9M19 performance was hurt by tightening liquidity (LDR of 111%) and the
deterioration in asset quality (NPL ratio of 3.5%). The bank’s recent appointment of Pahala Mansury as the new CEO would likely see the bank undertake a kitchen-sinking exercise, considering its current asset quality. With liquidity expected to remain a challenge, it is guiding for softer loan growth of 5-7% YoY for 2020 – a significant slowdown from past loan growth of 15-20%. This should also keep CoF high and NIM at a sector-low of 3.4%.

Regional Sector Update
15 January 2020 Financial Services | Banks
See important disclosures at the end of this report 9
Market Dateline / PP 19489/05/2019 (035080)
Figure 8: IND Banks – valuation summary
Note: Prices are as at 14 Jan 2020
Source: Bloomberg, RHB
Figure 9: IND Banks – Key assumptions and forecasts of core earnings
(IDRbn) 2017 2018 2019F 2020F 2021F
Net interest income 270,114 286,113 311,298 340,428 378,476
Net-II growth (%) 5.7% 5.9% 8.8% 9.4% 11.2%
Loan growth (%) 9.7% 12.5% 14.6% 9.4% 10.6%
Net interest margin (%) 6.18% 5.90% 5.81% 5.77% 5.84% Fee income 53,213 62,568 69,576 76,657 83,623
Other income 35,781 40,158 48,180 52,539 57,236
Non-II 88,994 102,726 117,756 129,195 140,858
Non-II growth (%) 6.6% 15.4% 14.6% 9.7% 9.0% Total operating income 359,108 388,838 429,055 469,623 519,335
Op income growth (%) 5.9% 8.3% 10.3% 9.5% 10.6%
Non-II/Total income (%) 24.8% 26.4% 27.4% 27.5% 27.1% Operating costs (166,097) (177,257) (195,243) (211,296) (227,458)
Op cost growth (%) 6.0% 6.7% 10.1% 8.2% 7.6%
CIR (%) 46.3% 45.6% 45.5% 45.0% 43.8% PIOP 193,010 211,581 233,812 258,327 291,877
PIOP growth (%) 5.8% 9.6% 10.5% 10.5% 13.0% Loan impairments (58,480) (55,790) (62,709) (65,043) (70,971)
Other impairments (965) (714) (764) (817) (879)
Total impairment charges (59,445) (56,504) (63,474) (65,860) (71,850)
Credit costs (%) 189 162 161 149 148
NPL ratio (%) 2.40% 2.17% 1.96% 1.78% 1.73%
Loan loss coverage (%) 155% 156% 173% 191% 192% Associates & others 325 755 2,460 855 937
Pre-tax profit 133,890 155,832 172,799 193,323 220,963
Taxation (29,239) (36,242) (39,684) (45,870) (52,195)
Minority interests (961) (1,373) (1,704) (1,866) (2,037)
Net profit 103,691 118,217 131,411 145,587 166,730
Net profit growth (%) 30.2% 14.0% 11.2% 10.8% 14.5%
Source: Banks’ financial statements, RHB
FY19 FY2 0 FY19 FY2 0 FY19 FY2 0 FY19 FY2 0 FY19 FY2 0
Bank Central Asia (BBCA IJ) Buy 33,975 40,000 61,205 13.8 12.4 28.5 25.3 4.8 4.2 18.0 17.6 0.8 0.9
Bank Rakyat Indonesia (BBRI IJ) Buy 4,570 5,000 41,187 14.5 13.2 15.1 13.3 2.6 2.4 18.8 18.8 2.3 2.7
Bank Mandiri (BMRI IJ) Buy 7,725 9,300 26,341 12.2 17.1 12.8 11.0 1.8 1.7 14.8 15.8 3.1 3.5
Bank Negara Indonesia (BBNI IJ) Buy 7,725 9,125 10,526 6.5 21.9 9.0 7.4 1.3 1.1 14.7 16.4 3.6 3.9
Bank Permata (BNLI IJ) Buy 1,275 1,490 2,612 57.0 9.7 25.3 23.0 1.5 1.5 6.1 6.6 0.0 0.0
Bank BTPN (BTPN IJ) Buy 3,180 4,200 1,893 28.7 12.6 7.2 6.4 0.6 0.6 10.5 9.1 3.2 4.2
Bank CIMB Niaga (BNGA IJ) Buy 970 1,380 1,781 1.2 8.6 6.9 6.3 0.6 0.5 8.6 8.7 2.9 2.9
Bank Jawa Timur (BJTM IJ) Buy 670 820 734 9.5 33.0 7.3 5.5 1.1 1.0 15.6 18.9 6.8 7.4
BTPN Syariah Buy 4,360 4,150 2,454 34.9 22.0 25.8 21.2 6.3 5.2 27.9 27.1 0.0 1.6
Bank Danamon (BDMN IJ) Trading Buy 4,070 5,300 2,907 29.3 - 20.4 7.7 9.7 0.8 0.8 11.5 8.3 3.5 4.5
Bank Panin Indonesia (PNBN IJ) Neutral 1,285 1,400 2,262 2.3 7.8 9.7 9.0 0.7 0.7 8.1 8.0 0.0 0.0
Bank Tabungan Negara (BBTN IJ) Sell 2,140 1,500 1,656 - 65.5 97.3 23.4 11.8 1.0 1.1 4.2 8.7 2.5 0.9
Bank Jabar Sell 1,150 1,400 827 - 3.0 6.1 7.4 7.0 0.9 0.9 13.0 13.1 7.9 8.1
We ighte d a ve ra ge 13 .5 14 .4 19 .5 17 .1 3 .2 2 .8 16 .8 16 .9 1.9 2 .2
Big- 4 ba nks 13 .2 14 .2 2 0 .1 17 .7 3 .3 2 .9 17 .4 17 .5 1.9 2 .1
Mid- sma lle r ba nks 16 .2 15 .6 14 .6 12 .5 1.7 1.5 11.7 11.6 2 .2 2 .5
Compa ny Ra ting
Pric e
(IDR)
TP
(IDR)
Mkt Ca p
(USDm)
EPS Chg (%) PER (x) P /BV (x) ROE (%) NDY (%)

Regional Sector Update
15 January 2020 Financial Services | Banks
See important disclosures at the end of this report 10
Market Dateline / PP 19489/05/2019 (035080)
Focus Charts Figure 16: M1 and M2 supply Figure 17: Combined deposit growth YoY (%)
Source: Bank Indonesia, RHB Source: OJK, RHB
Figure 18: Blended NIM and LDR of banks under our coverage
The optimal level for blended LDR for banks should be at 90-92%.
Source: Banks’ financial statements, RHB
Figure 19: Blended NPL Figure 20: Credit cost trend
Source: Banks’ financial statements, RHB Source: Banks’ financial statements, RHB
-5%
0%
5%
10%
15%
20%
25%
30%
35%
Sep
-13
Ma
r-1
4
Sep
-14
Ma
r-1
5
Sep
-15
Ma
r-1
6
Sep
-16
Ma
r-1
7
Sep
-17
Ma
r-1
8
Sep
-18
Ma
r-1
9
Sep
-19
Demand Deposit Savings Deposit Time Deposit Tota l Third Party Fund
(%)
82.0%
84.0%
86.0%
88.0%
90.0%
92.0%
94.0%
96.0%
98.0%
5.0%
5.2%
5.4%
5.6%
5.8%
6.0%
6.2%
6.4%
NIM (LHS) LDR (RHS)
1.0%
1.5%
2.0%
2.5%
3.0%
3.5%
Big 4 Banks NPL% Small-Mid Banks NPL%
0
2
4
6
8
10
12
14
16
18
20
Sep/1
3
Nov/1
3
Jan/1
4
Mar/
14
May/1
4
Jul/14
Sep/1
4
Nov/1
4
Jan/1
5
Mar/
15
May/1
5
Jul/15
Sep/1
5
Nov/1
5
Jan/1
6
Mar/
16
May/1
6
Jul/16
Sep/1
6
Nov/1
6
Jan/1
7
Mar/
17
May/1
7
Jul/17
Sep/1
7
Nov/1
7
Jan/1
8
Mar/
18
May/1
8
Jul/18
Sep/1
8
Nov/1
8
Jan/1
9
Mar/
19
May/1
9
Jul/19
Sep/1
9
Broad Money (M2)
Narrow Money (M1)
% YoY
0
2,000
4,000
6,000
8,000
10,000
12,000
14,000
16,000
0.0%
1.0%
2.0%
3.0%
4.0%
5.0%
Big 4 Banks CoC (LHS) Small Mid Banks CoC (LHS) USDIDR (RHS)

Regional Sector Update
15 January 2020 Financial Services | Banks
See important disclosures at the end of this report 11
Market Dateline / PP 19489/05/2019 (035080)
Malaysia – Dull Outlook Unlikely To Excite
Weak economic outlook
RHB economists expect Malaysia’s real GDP growth to moderate to 4.3% in 2020, from an estimated 4.5% in 2019. This is softer than the Government’s official forecast of 4.8%. We are less sanguine as we expect weaker growth in private consumption and exports.
Geopolitical tensions, policy uncertainty, and unresolved trade disputes remain the major headwinds for global growth outlook. There is also evidence that the weak global trade is beginning to affect domestic demand, particularly investment activity.
BNM cut the OPR by 25bps in May 2019, and subsequently lowered the statutory reserve requirement to 3% from 3.5% in Nov 2019. With the subdued economic outlook expected to extend into 2020, RHB economist expect another rate cut of 25bps early this year.
Modest earnings recovery in 2020
We expect bank earnings to recover 4% YoY in 2020, from a 1.1% YoY dip in 2019. Operating income is projected to grow a modest 2.4%, mainly on higher net fund-based income, while opex growth would be a subdued 1.2% YoY in 2020. Credit cost is expected be stable, allowing for the 3.4% YoY PIOP growth to filter down to net profit.
Within the sector, we expect Alliance Bank Malaysia (ABMB) (ABMB MK, NEUTRAL, TP: MYR2.90) to deliver a healthy 21% rebound in FY21F (Mar) net profit, followed by a 7.7% growth for FY21F (Jun) for HL Bank. Among the large banks, Maybank (MAY MK, NEUTRAL, TP: MYR9.20) is expected to post the strongest growth at 4.1% YoY.
NIM pressure, a downside risk
Malaysia’s interest rate direction will be keenly watched. A reduction in OPR – an attempt to bolster economy – would hurt NIMs. A lower interest rate is unlikely to result in stronger loan growth that would sufficiently offset the compression in loan yields, in our view.
Furthermore, we believe banks have less headroom to reduce funding costs after having released excess liquidity and more expensive deposits post-May 2019 rate cut.
We expect mid-single digit NIMs compression in 2020. ABMB would likely see the sharpest fall in NIM due to higher proportion of variable rate loans (83% of total), and high CASA ratio (37%). Maybank, CIMB, and HL Bank have lower sensitivity to OPR changes.
Moderate loan growth
Headwinds seen in 2019 are likely to persist into 2020. Given this overhang on sentiment, businesses are expected to remain cautious in their investment plans. While BNM has been pro-growth, lower lending rates and easier access to financing alone would unlikely change business sentiment.
We forecast system loan growth to be sustained at 4% YoY in 2020 (Nov 2019: +3.7% YoY). ABMB, BIMB (BIMB MK, BUY, TP: MYR5.10), and HL Bank are expected to chalk up loan growth that is slightly above the industry average.
Sizeable fair value through other comprehensive income (FVOCI) reserves to prop up non-II
Malaysia’s equity market recorded a lacklustre 2019 – total value traded on Bursa Malaysia Securities in Jan-Oct 2019 dropped 15.6% YoY. Banks expect another year of weak core fee income on sluggish capital market-related activities and muted loan-related fees.
That said, we believe banks may be able to sustain non-II at levels seen in 2018. The slide in bond yields since early 2019 has boosted unrealised gains on banks’ bond portfolios, and these can be realised to prop up non-II in 2020.

Regional Sector Update
15 January 2020 Financial Services | Banks
See important disclosures at the end of this report 12
Market Dateline / PP 19489/05/2019 (035080)
Managing asset quality will remain a priority
Banking system impaired loans were up 11% YTD-Nov 2019, with much of the increase coming from the manufacturing (+52% YTD) and agriculture (+585% YTD) sectors. The household sector saw a manageable increase of 10.2% YTD. As a result, system GIL ratio rose to 1.60% (Dec 2018: 1.48%).
Softening domestic economy and slowing trade flows will continue to weigh on asset quality but BNM’s relaxation on rescheduled & restructured (R&R) SME loans should help relieve some strain. Baring mass layouts, we believe the rise in impaired residential mortgages will be moderate, with provisions well-absorbed by banks.
We believe LLC will stay close to the 90% level by end-2019, as the rise in impaired loans moderate. Among the listed banks, sector LLC ratio (including regulatory reserves) was at a comfortable 105.8% in Sep 2019 (Dec 2018: 113.4%). Given the still-challenging operating environment, proactive asset quality management would remain a priority in 2020.
BNM’s relaxation on R&R SME loans and further rate cuts in 2020 should provide some reprieve for borrowers. That said, we expect sector credit cost to stay at 29bps (flat YoY) in 2020, given the anticipated uptick in GILs in the months ahead.
Hopeful of higher dividend payouts
Capital positions of most banks are strong, with CET-1 ratios >12% at end Sep 2019. This, coupled with the slow expansion in asset base, suggest that banks have room for capital management in 2020. Upward adjustment in dividend payouts should help stem the slide in ROEs. Based on our projected sector earnings growth of 4% for 2020, sector ROE would slip to 9.6% from an estimated 10% in 2019 (2018: 10.8%).
NEUTRAL rating on absence of growth catalysts
Based on our assumptions, Malaysian banking sector PATAMI is projected to recover by a modest 4% YoY in 2020, compared to a 1.1% YoY dip in 2019 (2018: +6.2% YoY). Sector valuation multiples have been on a downward slide since early 2019. The sector’s 12-month forward consensus P/BV has de-rated to 1.1x at end-2019 vs. 1.26x in early 2019, while sector consensus P/E is at 11x vs 13.1x. At these levels, sector valuation is close to the low seen during the collapse in oil prices in early 2016.
Sector risk return appears undemanding at 1.2x FY20F P/BV for ROE of 10.2%. We believe the downside risk to share prices has narrowed. That said, we do not see any catalyst for a positive re-rating in the near term, with favourable dividend yields being the main support to share prices. Hence, we accord a NEUTRAL call for the sector.
Sector Picks: CIMB, HL Bank, and BIMB
CIMB (BUY, TP: MYR6.10) – Offers favourable valuation. CIMB’s 9M19 results beat
expectations, on strong non-II, and lower credit costs of 38bps vs guidance of 40-50bps. We expect core PATAMI to be sustained at MYR5,330m (+0.6% YoY) after rising by a robust 13.8% YoY in FY19. At the current price, the stock is trading at an undemanding 0.9x FY20F P/BV for ROE of 9.2%. Our MYR6.10 TP is based on a GGM-derived P/BV of 1.08x, which is at -1SD from its historical mean.
HL Bank (BUY, TP: MYR19.20) – Stands out on defensive qualities. We like HL Bank
for its solid asset quality. GIL ratio is at a low 0.81% in 3Q19, the lowest after Public Bank’s 0.52%, while LLC (including regulatory reserves) ratio was at a high 195.9%. Management guided for ROE of 10.5-11% for FY20, but is hopeful that FY19’s 10.8% can be maintained. We forecast net profit to dip 1.9% in FY20, but it should rebound by 7.7% in FY21. Our MYR19.20 TP is based on a GGM-derived P/BV of 1.45x, which is lower than its historical average of 1.5x.
BIMB (BUY, TP: MYR5.10) – Group restructuring is on its way. The group’s restructuring
plan awards its shareholders one share in the soon-to-be-listed Bank Islam and yet-to-be-determined number of shares in Syarikat Takaful Malaysia Keluarga (STMB MK; BUY; TP: MYR8.00). BIMB looks set to achieve most of FY19’s targets despite credit cost possibly coming in slightly higher than its 20bps guidance. Robust takaful income contribution should
help offset softness in banking operations. We project c.18% and 4% growth in net earnings for FY19F-20F. Our MYR5.10 TP values BIMB at a GGM-derived 1.49x FY20F P/BV.

Regional Sector Update
15 January 2020 Financial Services | Banks
See important disclosures at the end of this report 13
Market Dateline / PP 19489/05/2019 (035080)
Figure 21: MY Banks – valuation summary
Note: Prices are as at 14 Jan 2020
Source: Bloomberg, RHB
Figure 22: MY Banks – sector core earnings forecasts and key assumptions
(MYRm) 2016 2017 2018 2019F 2020F
Net interest income 43,520 47,008 47,787 49,035 50,665
Net-II growth (%) 5.1% 8.0% 1.7% 2.6% 3.3%
Loan growth (%) 6.2% 2.0% 5.6% 3.8% 4.6%
Net interest margin (%) 2.26% 2.35% 2.26% 2.19% 2.17% Fee income 9,740 10,042 9,650 9,290 9,766
Other income 7,647 8,932 8,360 10,683 10,216
Non-II 17,387 18,974 18,010 19,974 19,981
Non-II growth (%) -0.4% 9.1% -5.1% 10.9% 0.0% Total operating income 60,907 65,983 65,797 69,008 70,646
Op income growth (%) 3.5% 8.3% -0.3% 4.9% 2.4%
Non-II/Total income (%) 28.5% 28.8% 27.4% 28.9% 28.3% Operating costs (29,273) (31,491) (31,211) (33,091) (33,502)
Op cost growth (%) 1.2% 7.6% -0.9% 6.0% 1.2%
CIR (%) 48.1% 47.7% 47.4% 48.0% 47.4% PIOP 31,635 34,492 34,586 35,918 37,145
PIOP growth (%) 5.7% 9.0% 0.3% 3.9% 3.4% Loan impairments (5,730) (4,625) (3,153) (4,595) (4,684)
Other impairments (301) (245) (192) (138) (183)
Total impairment charges (6,031) (4,870) (3,346) (4,733) (4,867)
Credit costs (bps) 41 32 21 29 29
NPL ratio (%) 1.91% 1.96% 1.88% 2.03% 2.02%
Loan loss coverage (%) 78.8% 71.1% 88.2% 80.8% 81.5% Associates & others 607 770 769 838 887
Pre-tax profit 26,211 30,392 32,009 32,023 33,164
Taxation (5,961) (6,858) (7,119) (7,477) (7,623)
Minority interests (505) (698) (638) (559) (602)
Net profit 19,744 22,836 24,252 23,987 24,940
Net profit growth (%) 1.2% 15.7% 6.2% -1.1% 4.0%
Source: Banks’ financial statements, RHB
Price TP Mkt Cap
Company Rating (MYR) (MYR) (MYR'm) FY19 FY20 FY19 FY20 FY19 FY20 FY19 FY20 FY19 FY20
CIMB Group (CIMB MK) Buy 5.18 6.10 52,509 10.5 (4.6) 9.4 9.9 0.9 0.9 9.3 9.2 5.2 5.4
HL Bank ̂(HLBK MK) Buy 16.84 19.20 43,408 7.7 9.3 12.2 11.2 1.2 1.1 10.1 10.3 3.2 3.3
BIMB Holdings (BIMB MK) Buy 4.40 5.10 7,516 12.7 3.9 9.7 9.3 1.4 1.3 14.9 14.1 3.6 3.9
Maybank (MAY MK) Neutral 8.65 9.20 105,276 (6.1) 2.0 12.4 12.2 1.2 1.1 9.7 9.2 6.6 6.8
Public Bank (PBK MK) Neutral 19.14 21.10 95,268 (1.4) 0.9 13.5 13.3 1.7 1.6 13.0 12.2 3.7 3.7
AMMB ̂(AMM MK) Neutral 3.85 4.30 13,624 (1.0) 6.5 8.3 7.8 0.6 0.6 7.3 7.5 5.3 5.8
Alliance Bank ̂(ABMB MK) Neutral 2.58 2.90 6,518 21.1 14.4 7.9 6.9 0.6 0.6 8.4 9.1 6.0 7.0
Affin Bank (ABANK MK) Sell 1.90 1.60 4,588 (4.8) (17.5) 7.7 9.3 0.4 0.4 5.4 4.3 2.6 2.6
Weighted average 1.0 2 .2 11.7 11.5 1.2 1.2 10 .5 10 .2 4 .8 5 .0
EPS Chg (%) PER (x) P /BV (x) ROE (%) NDY (%)

Regional Sector Update
15 January 2020 Financial Services | Banks
See important disclosures at the end of this report 14
Market Dateline / PP 19489/05/2019 (035080)
Focus Charts
Figure 23: Loan demand moderated on softening growth Figure 24: Sector loan growth trend, 2014-2020F
Source: BNM, RHB Source: Banks’ financial statements, RHB
Figure 25: Large banks saw good NIM recovery in 3Q19 Figure 26: Smaller banks had mixed NIM trends in 3Q19
Source: Banks’ financial statements, RHB Source: Banks’ financial statements, RHB
Figure 27: FVOCI reserves Figure 28: Public and HL Bank have the best asset quality
(MYRm) 4Q18 3Q19 (%) YTD
Maybank 457.0 3,179.2 596
Public Bank - other reserves 1,431.4 1,797.6 26
RHB 376.1 1,430.8 280
HL Bank - other reserves 711.3 823.0 16
AMMB 406.7 685.5 69
Affin 110.4 291.8 164
CIMB (288.3) 257.4 nm
ABMB 23.9 167.8 603
Source: Banks’ financial statements, RHB Source: Banks’ financial statements, RHB
4.4%
3.8%
-8
-3
2
7
12
17
4Q
05
2Q
06
4Q
06
2Q
07
4Q
07
2Q
08
4Q
08
2Q
09
4Q
09
2Q
10
4Q
10
2Q
11
4Q
11
2Q
12
4Q
12
2Q
13
4Q
13
2Q
14
4Q
14
2Q
15
4Q
15
2Q
16
4Q
16
2Q
17
4Q
17
2Q
18
4Q
18
2Q
19
4Q
19
(%) Real GDP… Loans…
11.2%10.5%
6.2%
2.4%
5.5%
3.7%
4.6%
2014 2015 2016 2017 2018 2019F 2020F
Loan Growth (YoY)
2.50
2.75
3.00
3.25
3.50
3.75
2.0
2.1
2.2
2.3
2.4
2.5
2.6
2.7
2.8
4Q
15
1Q
16
2Q
16
3Q
16
4Q
16
1Q
17
2Q
17
3Q
17
4Q
17
1Q
18
2Q
18
3Q
18
4Q
18
1Q
19
2Q
19
3Q
19
(%)(%) OPR (RHS) CIMB Maybank
Public RHB Cap
2.50
2.75
3.00
3.25
3.50
3.75
1.5
1.7
1.9
2.1
2.3
2.5
2.7
2.94
Q1
5
2Q
16
3Q
16
4Q
16
1Q
17
2Q
17
3Q
17
4Q
17
1Q
18
2Q
18
3Q
18
4Q
18
1Q
19
2Q
19
3Q
19
(%)(%) OPR (RHS) Affin ABMB
AMMB BIMB HL Bank
0.52 0.81
1.11
1.66 1.77
2.16
2.67
3.15 3.42
0.00
0.50
1.00
1.50
2.00
2.50
3.00
3.50
4.00
Pu
blic
HL
Ban
k
BIM
B
AB
MB
AM
MB
RH
B
MA
Y
CIM
B
Aff
in
(%) GIL Ratios 4Q17 4Q18 3Q19
Regional Sector Update
15 January 2020 Financial Services | Banks
See important disclosures at the end of this report 15
Market Dateline / PP 19489/05/2019 (035080)
Singapore – Expect Flat 2020 Earnings
Expect more downside for SIBOR
RHB economists expect the Singapore economy to grow by 0.8% YoY in 2020, slightly higher than the 0.5% estimated for 2019. Expectations are for the 3-month SIBOR to trend down further in 2020, on the back of another cut in the US federal funds rate (FFR).
Mild 2020 loan growth anticipated
We expect moderate loan growth in the mid-single digits in 2020. The three Singapore
banks averaged 3Q19 loan growth of c.5% YoY, with business loans driving the expansion, while home mortgages showed weakness.
In Nov 2019, the management of the three Singapore banks guided for mid-single digit loan expansion in 2020, factoring in global economic uncertainties. We forecast an average of 3.5% loan expansion for the three banks for the year.
2020 NIM squeeze already factored into market forecasts
Given the high correlation between the US FFR and the 3-month SIBOR, FFR cuts in 2019 and further expected cuts in 2020 could lead to more declines in the 3-month SIBOR. From the current 1.77%, RHB economist expects the 3-month SIBOR to fall to 1.6% by end-2020.
We expect 2020 NIM squeeze for the three Singapore banks (vs 2019). The
management of the three banks have guided for 2020 NIM to be narrower than 2019, a consequence of the falling interest rate environment. We forecast 2020 NIM squeeze between 4bps and 7bps for the three banks – this factors in a falling SIBOR as well as recent competitive home mortgage rates that will lower the lending yields for the banks.
Wealth management holds promise
The 3Q19 results of the three banks point to strength in the wealth management business:
i. DBS reported 3Q19 wealth management fees jumping 22% YoY (and accounting for 9% of total income);
ii. OCBC recorded a strong 3Q19 11% YoY increase in wealth management fees (which accounted for 10% share of total income);
iii. UOB’s 3Q19 wealth management fees surged 38% YoY (which accounted for 7% share of total income).
We are optimistic on the wealth management businesses continuing to expand through
2020, on the back of the growing franchises and inflow of foreign funds (including from Greater China).
Asset quality remains high
The three banks recorded sequentially stable NPL ratios in 3Q19. While all three banks have loan exposure to Hong Kong (which is likely to experience GDP contraction), their Hong Kong loan book remained stable. Loan quality for other geographical locations remained high.
We expect some marginal rise in NPLs going forward into 2020. However, this should
not impact banks’ earnings significantly.
Risks
Upside risks. We are NEUTRAL weighted on Singapore banks. If the US-China trade war
resolves smoothly and within a short timeframe, there would be increasing expectations of stronger Singaporean economic growth, and banks’ earnings could rise sharply.
Downside risks. If the US-China trade war worsens, weakening global growth could raise
non-performing assets for Singapore banks.

Regional Sector Update
15 January 2020 Financial Services | Banks
See important disclosures at the end of this report 16
Market Dateline / PP 19489/05/2019 (035080)
Flat 2020 banks’ earnings forecasted
We forecast SG banks to show muted earnings in 2020. Earnings drivers include
stronger fee income, particularly coming from the wealth management space. On the other hand, NII is seen to soften, due to NIM squeeze and unexciting single-digit loan expansion:
i. Given the headwinds from falling interest rates, with partial offsetting effects from mild 2020 loan expansion, we forecast the three banks to record a combined 2020 NII contraction of 0.4%.
ii. Fee and commission income is seen to be the strength in 2020, and we forecast an expansion of 12% YoY.
iii. We forecast 2020 provisions to rise a mild 4% YoY. There is the risk of higher provisions if economic conditions deteriorate.
iv. Total 2020F net profit for the three banks is expected to rise by a modest 0.6% YoY (based on RHB forecasts).
Stay NEUTRAL; UOB is our only BUY
We maintain our NEUTRAL stance on SG banks. Our forecast of flat 2020 combined net
profit of the three banks (vs 2019) points to a NEUTRAL stance.
Our Top BUY is UOB – SGD29.50 TP based on GGM-derived 1.26x 2020F P/BV. 3Q19’s
ROE of 11.8% was higher than 2018's 11.3%. Our valuation for UOB is based on a long-term ROE assumption of 12.7%. This yields a 2020F target P/BV of 1.26x, from which we derive our TP of SGD29.50. UOB is attractive as its current 2020F P/BV of c.1.1x is lower than the 6-year average of 1.22x.
NEUTRAL on Oversea-Chinese Banking Corp (OCBC) (second pick within sector) –
SGD11.50 TP based on GGM-derived 1.08x 2020F P/BV. 9M19’s ROE of 11.6% was lower than 9M18’s 12.3%. Our valuation for OCBC is based on long-term ROE assumption of 11.7% – which yields a 2020F target P/BV of 1.08x, -1SD from its 6-year average of 1.23x. OCBC’s scrip dividend scheme keeps its capital position high but lowers forward ROE.
NEUTRAL on DBS – TP of SGD25.80 based on GGM-derived 1.28x 2020F P/BV. Our
valuation for DBS is based on long-term ROE assumption of 13.3%. This yields a 2020F target P/BV of 1.28x, which is ahead of the 6-year average of 1.21x – we believe the slight P/BV premium is justified on the back of expected strength in fee and commission income. However, concerns on potential increases in loan loss provisioning for DBS’ Greater China operations could dampen interest for DBS shares, and hence we maintain NEUTRAL.

Regional Sector Update
15 January 2020 Financial Services | Banks
See important disclosures at the end of this report 17
Market Dateline / PP 19489/05/2019 (035080)
Figure 29: SG Banks – valuation summary
Note: Prices as at 14 Jan 2020
Source: Bloomberg, RHB
Figure 30: SG Banks – key assumptions and forecasts of core earnings
(SGDm) 2017 2018 2019F 2020F 2021F
Net interest income 18,742 21,065 22,580 22,500 22,833
Net-II growth (%) 8.0% 12.4% 7.2% -0.4% 1.5%
Loan growth (%) 6.6% 8.5% 3.8% 3.6% 4.0%
Net interest margin (%) 1.73% 1.80% 1.83% 1.77% 1.75% Fee income 6,448 6,778 7,300 8,144 8,571
Other income 5,174 4,158 5,733 6,006 6,444
Non-II 11,622 10,936 13,033 14,150 15,015
Non-II growth (%) 8.7% -5.9% 19.2% 8.6% 6.1% Total operating income 30,364 32,001 35,613 36,650 37,848
Op income growth (%) 8.3% 5.4% 11.3% 2.9% 3.3%
Non-II/Total income (%) 38.3% 34.2% 36.6% 38.6% 39.7% Operating costs (12,987) (14,031) (15,371) (16,036) (17,027)
Op cost growth (%) 4.3% 8.0% 9.6% 4.3% 6.2%
CIR (%) 42.8% 43.8% 43.2% 43.8% 45.0% PIOP 17,377 17,970 20,242 20,614 20,821
PIOP growth (%) 11.5% 3.4% 12.6% 1.8% 1.0% Loan impairments (3,292) (1,391) (2,291) (2,385) (2,143)
Other impairments
Total impairment charges (3,292) (1,391) (2,291) (2,385) (2,143)
Credit costs (bps) 42 17 26 26 22
NPL ratio (%) 1.74% 1.59% 1.65% 1.67% 1.67%
Loan loss coverage (%) 85% 84% 84% 87% 89% Associates & others 395 459 568 616 662
Pre-tax profit 14,480 17,038 18,519 18,845 19,340
Taxation (2,274) (2,688) (2,927) (3,103) (3,202)
Minority interests (400) (272) (180) (237) (295)
Net profit 11,806 14,078 15,412 15,505 15,843
Net profit growth (%) 9.2% 19.2% 9.5% 0.6% 2.2%
Source: Banks’ financial statements, RHB
FY19 FY20 FY19 FY20 FY19 FY20 FY19 FY20 FY19 FY20
United Overseas Bank (UOB SP) Buy 26.98 29.50 33,406 10.3 - 0.2 10.5 10.5 1.21 1.15 11.9 11.7 4.8 5.2
DBS Group (DBS SP) Neutral 26.36 25.80 49,986 14.8 - 0.2 10.6 10.6 1.40 1.31 13.1 12.5 4.6 4.9
Overseas Chinese Banking Corp (OCBC SP) Neutral 11.11 11.50 36,296 0.8 - 1.7 10.4 10.5 1.10 1.04 11.7 11.0 4.5 4.6
Weighted average 9 .3 - 0 .6 10 .5 10 .5 1.25 1.19 12 .3 11.9 4 .6 4 .9
EPS Chg (%)
Company Rating
Price
(SGD)
TP
(SGD)
Mkt Cap
(USDbn)
PER (x) P /BV (x) ROE (%) NDY (%)

Regional Sector Update
15 January 2020 Financial Services | Banks
See important disclosures at the end of this report 18
Market Dateline / PP 19489/05/2019 (035080)
Focus Charts
Figure 31: We forecast NIM squeeze ahead Figure 32: Banks guided for mild 2020 loan growth
Source: Banks’ financial statements, RHB Source: Banks’ financial statements, RHB
Figure 33: DBS has the highest percentage Greater China loan exposure
Figure 34: OCBC has the highest CAR
Source: Banks’ financial statements Source: Banks’ financial statements
Figure 35: SIBOR has softened following FFR cuts
There is a historical correlation between the US FFR and 3-month SIBOR. The recent cuts in FFR has led to 3-month SIBOR softening since mid-2019.
Source: Bloomberg
Net Interest Margin DBS OCBC UOB
FY16 1.80% 1.67% 1.71%
FY17 1.75% 1.65% 1.77%
FY18 1.85% 1.70% 1.82%
1Q19 1.88% 1.76% 1.79%
2Q19 1.91% 1.79% 1.81%
3Q19 1.90% 1.77% 1.77%
FY19F 1.88% 1.77% 1.79%
FY20F 1.81% 1.73% 1.73%
FY21F 1.79% 1.72% 1.72%
Loan Growth (YoY%) DBS OCBC UOB
FY16 6.4% 4.1% 8.9%
FY17 7.2% 8.0% 4.7%
FY18 6.8% 9.0% 11.4%
3Q19 3.8% 2.5% 8.0%
FY19F 3.3% 2.2% 5.3%
FY20F 3.5% 2.5% 4.5%
FY21F 3.6% 4.0% 4.5%
3Q19 Loan breakdown by
geography (%)DBS OCBC UOB
Singapore 47.0% 41.6% 51.4%
South & SEA 8.3% NA NA
South-east Asia NA NA NA
- Malaysia NA 11.0% 10.7%
- Thailand NA NA 6.9%
- Indonesia NA 7.7% 4.3%
Greater China 30.4% 24.5% 16.3%
- HK 15.9% 12.9% NA
Others 14.4% 15.1% 10.4%
Total 100.0% 100.0% 100.0%
DBS OCBC UOB
FY17 CET1 CAR 14.3% 13.9% 15.1%
FY17 Tier 1 CAR 15.1% 15.0% 16.2%
FY18 CET1 CAR 13.9% 14.0% 13.9%
FY18 Tier 1 CAR 15.1% 14.8% 14.9%
3Q19 CET1 CAR 13.8% 14.5% 13.7%
3Q19 Tier 1 CAR 14.7% 15.2% 15.0%
0.0
0.4
0.8
1.2
1.6
2.0
2.4(%)
3-mth SIBOR has come off since mid-2019

Regional Sector Update
15 January 2020 Financial Services | Banks
See important disclosures at the end of this report 19
Market Dateline / PP 19489/05/2019 (035080)
Thailand – Clouded By Subpar GDP Growth
Slight strengthening in loan growth prospects
The Thai Government is planning to launch new stimulus measures and speed up public investments to spur domestic consumption and investments to mitigate potential impact from global trade uncertainties. We expect loan growth of 3.5% in 2020, a slight improvement from the 2.8% YoY rise projected for 2019. Lending activity would be driven mainly by the consumer and corporate sectors. Growth in SME loans is likely to be subdued as banks are expected to remain cautious due to asset quality concerns.
Loan demand was lacklustre in 2019, dampened by slowing economic growth and stricter lending criteria. Loans grew a paltry 0.6% YoY as at end Sep 2019 vs a 2.5% rise a year earlier. Although lending activities are likely to increase in 4Q19 due to seasonally higher demand on a pick-up in consumption spending and export activities, full-year 2019 growth would be sharply lower than increases of 4.5-5.1% in 2017-2018.
Asset quality concerns linger
TH Banks are expected to end 2019 with a 7% increase in NPLs, up from the 5% YoY rise in Sep 2019. That said, growth in impaired loans would likely moderate to c.5-6% pa in 2020F-2021F, which compares favourably against the spikes of 10-20% in 2015-2017.
Still, we believe banks would continue to tighten lending criteria to prevent new NPLs given the soft economy and the country’s heavy reliance on international trade. We believe the consumer and SME segments remain vulnerable due to their weaker balance sheets. On the flipside, Thai corporates are weathering the economic uncertainties better, helped by their sound fundamentals.
We expect sector NPL ratio to tick up slightly to 4.0% in 2020F from 3.9% in 2019F. The LLC ratio is projected to be higher at 153.1% in 2020F from 151.4% in 2019F given additional provisions to be set aside.
With the high LLC, banks are well prepared for the adoption of TFRS 9 effective Jan 2020. That said, we do not expect any reversal of impairment allowance that would boost earnings as we believe most banks prefer to maintain the provision buffers, at least in the first year of adoption of the new accounting standard.
Lower interest rates remain a possibility
BoT lowered its policy rate to a record low of 1.25% in 2019 following two cuts of 25bps each in Aug and Nov 2019. RHB economist believes BoT would maintain the 1-day repurchase rate at 1.25% in 2020 as the policy rate is already lower than in the US and other ASEAN countries, which impacts its effectiveness to curb speculative inflows while too-low interest rates could also fuel imbalances in Thailand. We believe the central bank would assess the impact from stimulus packages introduced at end-2019 before deciding if more monetary policy support is necessary.
We expect the interest rate cuts in 2H19 to compress loan yields and erode NIMs in 4Q19F and 2020F. Our estimates suggest that sector NIM would narrow by 6bps to 3.06% in 2019F and another 2bps to 2.98% in 2020F. Large banks are likely to see a sharper fall in NIM as the bulk of their loans are on variable rates, while smaller banks have a larger portion of fixed rate loans. Should there be further rate cuts in 2020, NIM slippage would be wider than the current forecast, particularly if banks are unable to lower deposit rates to mitigate the fall in asset yields.
IT investments to weigh on CIR
To support the digital economy and promote more banking transactions via online banking services, Thai banks implemented the PromptPay scheme in 1Q17. This was followed by the elimination of fees for online transactions in 1Q18. As a result, banks’ net fee income fell 4% YoY in 2018 (2017: +10%) and would likely decline a further 2% YoY in 2019F. While the drag on fee income from technology disruptions would taper in 2020, we believe new digital offerings by banks will not immediately contribute to higher revenues. Instead, it will enhance banks’ ability to analyse consumer data for improved risk management and better customer service.
Regional Sector Update
15 January 2020 Financial Services | Banks
See important disclosures at the end of this report 20
Market Dateline / PP 19489/05/2019 (035080)
Among TH Banks, Kasikornbank (KBANK TB, BUY, TP: THB173.00) and SCB (SCB TB, BUY, TP: THB140.00) are the leaders in digital banking services. Both banks have the largest number of online users and are usually leaders in the introduction of new financial products. Krungthai Bank (KTB TB, NEUTRAL, TP: THB17.50) lags peer banks in digital banking development, and is likely to see higher IT investments hitting its CIR in the next few years. This compares to forecasts of stable CIRs for BBL (BBL TB, BUY, TP: THB205.00), KBANK, and SCB. We believe small and mid-sized banks would have smaller IT budgets given their much smaller consumer base. Overall, we expect sector CIR to increase to 47.3% in 2020F from 45.9% in 2019F (2018: 44.9%).
Moderate rebound in 2020F earnings
Banks are projected to post a 7% YoY growth in 2020F net profit. Earnings uplift would come mainly from:
i. Higher NII on stronger loan growth; and
ii. Lower impairment charges, led mainly by BBL, KBANK, and SCB, which have high levels of excess loan provisions.
Nevertheless, banks’ average ROE is expected to dip further to 9.4% in 2020, from 9.6% in 2019F (2018: 10.4%), as sector leverage continues to trend lower. We believe the banks would prefer to maintain a high level of capitalisation given the ongoing economic uncertainties.
For 2019, sector net profit is forecast to rise a modest 1% YoY despite expectations for a 12% YoY jump in 4Q19F earnings on higher investment gains and net fee income. The sluggish 2019 performance can be attributed to higher overhead expenses and muted fee income.
Thai banks are well capitalised
Thai banks are well capitalised, with capital ratios substantially higher than the Basel III minimum requirements. Total capital ratio (TCR) and Tier-1 capital ratio stood at 18.8% and 15.6% respectively in Sep 2019. We expect the banks’ capital ratios to remain solid at 18.9% for TCR and 16% for Tier-1 in Dec 2020 – well above the Basel III minimum requirement (after conservation and D-SIB buffers) of 12% (TCR) and 9.5% (Tier-1).
Maintain NEUTRAL; BBL and SCB are Top Picks
TH Banks underperformed the broader market with an average decline of 8% in 2019 on concerns over weak growth prospects and NIM pressures. At current levels, the sector is trading at 1.0x 2020F P/BV. Although this is at -1.5SD from the historical mean, we believe the multiple de-ratings reflect the structural downtrend in ROEs. We reiterate our NEUTRAL call for the sector as we see downside risks to earnings given the still-soft economic backdrop, which may result in further rate cuts. In Dec 2019, BoT cut its GDP forecast for 2020 to 2.8% from the +3.3% projected in Sep 2019. We prefer banks with solid balance sheets and attractive dividend yields – BBL and SCB.
BBL – Our THB205.00 TP is based on GGM-derived 0.84x 2020F P/BV. Earnings are
expected to grow a moderate 4-6% in 2019F-2021F on efficient cost management. Fundamentals are solid, while high provision buffers should enable the banks to comfortably absorb impact from TFRS 9. We believe BBL would be a key beneficiary of infrastructure investments, which would result in stronger loan growth in the future.
SCB – Our THB140 TP is based on GGM-derived 1.11x 2020F P/BV. With its business
transformation near completion, growth in operating expenses is expected moderate. The resulting improvement in CIR would help sustain earnings growth in the longer term. With CET-1 at 16.9% post the divestment of SCB Life Insurance, SCB has the capacity to increase dividend payout. This would further boost its already attractive yields of c.5%.

Regional Sector Update
15 January 2020 Financial Services | Banks
See important disclosures at the end of this report 21
Market Dateline / PP 19489/05/2019 (035080)
Figure 36: TH Banks – valuation summary
Note: Prices are as at 14 Jan 2020 Source: Bloomberg, RHB
Figure 37: TH Banks – sector core earnings forecasts and key assumptions
(THBm) 2017 2018 2019F 2020F 2021F
Net interest income 416,058 429,112 447,102 477,328 486,009
Net-II growth (%) 3.1% 3.1% 4.2% 6.8% 1.8%
Loan growth (%) 4.5% 5.1% 10.5% 3.7% 3.7%
Net interest margin (%) 3.10% 3.06% 3.00% 2.98% 2.90% Fee income 187,133 189,501 189,742 205,165 213,684
Other income 40,062 43,832 56,453 17,312 15,862
Non-II 227,195 233,333 246,195 222,477 229,545
Non-II growth (%) 1.7% 2.7% 5.5% -9.6% 3.2% Total operating income 643,253 662,445 693,298 699,805 715,555
Op income growth (%) 2.6% 3.0% 4.7% 0.9% 2.3%
Non-II/Total income (%) 35.3% 35.2% 35.5% 31.8% 32.1% Operating costs (277,121) (297,679) (318,100) (331,235) (337,725)
Op cost growth (%) 3.0% 7.4% 6.9% 4.1% 2.0%
CIR (%) 43.1% 44.9% 45.9% 47.3% 47.2% PIOP 366,132 364,766 375,197 368,570 377,830
PIOP growth (%) 2.3% -0.4% 2.9% -1.8% 2.5% Loan impairments (153,073) (129,546) (130,061) (117,355) (114,260)
Other impairments - - - - -
Total impairment charges (153,073) (129,546) (130,061) (117,355) (114,260)
Credit costs (bps) 163 132 123 104 97
NPL ratio (%) 3.94% 3.86% 3.90% 3.98% 4.00%
Loan loss coverage (%) 140.5% 151.3% 151.4% 153.1% 156.8% Associates & others - - - - -
Pre-tax profit 213,059 235,219 245,136 251,215 263,570
Taxation (37,788) (43,746) (53,691) (47,421) (49,748)
Minority interests (14,818) (16,631) (15,812) (16,130) (16,464)
Net profit 160,453 174,843 175,634 187,664 197,359
Net profit growth (%) -8.5% 9.0% 0.5% 6.8% 5.2%
Source: Banks’ financial statements, RHB
FY19 FY20 FY19 FY20 FY19 FY20 FY19 FY20 FY19 FY20
Siam Commercial Bank (SCB TB) Buy 114.50 140.00 12,852.3 10.5 0.5 8.8 8.7 1.0 0.9 11.3 10.7 5.2 5.4
Kasikornbank (KBANK TB) Buy 133.50 173.00 10,522.1 - 1.2 1.4 8.4 8.3 0.8 0.7 9.7 9.2 3.6 3.6
Bangkok Bank (BBL TB) Buy 152.50 205.00 9,622.8 4.3 5.7 7.9 7.5 0.7 0.6 8.6 8.6 4.5 4.8
Krungthai Bank (KTB TB) NEUTRAL 16.10 17.50 7,438.3 - 1.7 0.8 8.0 8.0 0.7 0.6 8.7 8.1 5.5 5.5
TMB Bank (TMB TB) NEUTRAL 1.58 1.66 5,213.4 - 36.2 0.8 9.4 9.3 0.8 0.7 5.0 8.2 4.8 4.3
Tisco Financial Group (TISCO TB) NEUTRAL 102.00 108.00 2,699.6 5.2 4.2 11.1 10.6 2.1 2.0 19.2 19.2 7.2 7.5
Thanachart Capital (TCAP TB) NEUTRAL 52.00 56.00 1,802.5 2.8 - 2.1 7.5 7.7 0.9 0.8 12.0 11.1 12.6 4.9
Kiatnakin Bank (KKP TB) Sell 68.25 56.00 1,910.4 - 4.5 - 3.4 10.0 10.4 1.3 1.3 13.4 12.4 6.5 6.3
Weighted average - 0 .5 1.7 8 .6 8 .5 0 .9 0 .8 10 .0 9 .9 5 .2 5 .0
Big-4 banks 3 .7 2 .0 8 .3 8 .2 0 .8 0 .7 9 .8 9 .3 4 .7 4 .8
Mid-small - 15 .3 0 .5 9 .6 9 .5 1.2 1.1 10 .8 11.9 6 .9 5 .5
PER (x) P /BV (x) ROE (%) NDY (%)EPS Chg (%)
Company Rating
Price
(THB)
TP
(THB)
Mkt Cap
(USDM)

Regional Sector Update
15 January 2020 Financial Services | Banks
See important disclosures at the end of this report 22
Market Dateline / PP 19489/05/2019 (035080)
Figure 38: All large banks are trading below their average 5-year historical P/BVs
TH Banks’ valuations are undemanding, trading at consensus FY20F P/BV of 0.8x (below -1SD historical mean), compared with their historical mean of 1.26x
Source: Banks’ financial statements, RHB
Figure 39: TH Banks’ NPL ratio and LLC ratio trends
TH Banks’ NPL ratio is likely to trend higher as the slowing economy impacts customers’ ability to repay debts
Banks are well prepared for TFRS 9, with high excess reserves. Average LLC ratio remains high at 153% in 2020
Source: Banks’ financial statements, RHB
Figure 40: TH Banks’ earnings and ROE trends
TH Banks’ earnings are forecast to improve 7% YoY in 2020F (2019F: +1%). But sector ROE is expected to be a lower 9.7% in 2020F vs. 10% in 2019F as banks are likely to maintain high capital ratios to withstand economic uncertainties
Source: Banks’ financial statements, RHB
0.0
0.5
1.0
1.5
2.0
2.5
BBL KBANK KKP KTB SCB TCAP TISCO TMB THBanks
5-yrs mean P/BV 2020F P/BV 2021F P/BV
0.0%
0.5%
1.0%
1.5%
2.0%
2.5%
3.0%
3.5%
4.0%
4.5%
0%
20%
40%
60%
80%
100%
120%
140%
160%
2015 2016 2017 2018 2019F 2020F 2021F
Credit costs (RHS) LLC ratio NPL ratio (RHS)
(15%)
(10%)
(5%)
0%
5%
10%
15%
0
50,000
100,000
150,000
200,000
250,000
2015 2016 2017 2018 2019F 2020F 2021F
TH Bank's earnings (THBm) Earnings growth (RHS) ROAE (RHS)

23
Market Dateline / PP 19489/05/2019 (035080)
RHB Guide to Investment Ratings
Buy: Share price may exceed 10% over the next 12 months Trading Buy: Share price may exceed 15% over the next 3 months, however longer-
term outlook remains uncertain Neutral: Share price may fall within the range of +/- 10% over the next
12 months Take Profit: Target price has been attained. Look to accumulate at lower levels Sell: Share price may fall by more than 10% over the next 12 months Not Rated: Stock is not within regular research coverage Investment Research Disclaimers RHB has issued this report for information purposes only. This report is intended for circulation amongst RHB and its affiliates’ clients generally or such persons as may be deemed eligible by RHB to receive this report and does not have regard to the specific investment objectives, financial situation and the particular needs of any specific person who may receive this report. This report is not intended, and should not under any circumstances be construed as, an offer or a solicitation of an offer to buy or sell the securities referred to herein or any related financial instruments. This report may further consist of, whether in whole or in part, summaries, research, compilations, extracts or analysis that has been prepared by RHB’s strategic, joint venture and/or business partners. No representation or warranty (express or implied) is given as to the accuracy or completeness of such information and accordingly investors should make their own informed decisions before relying on the same. This report is not directed to, or intended for distribution to or use by, any person or entity who is a citizen or resident of or located in any locality, state, country or other jurisdiction where such distribution, publication, availability or use would be contrary to the applicable laws or regulations. By accepting this report, the recipient hereof (i) represents and warrants that it is lawfully able to receive this document under the laws and regulations of the jurisdiction in which it is located or other applicable laws and (ii) acknowledges and agrees to be bound by the limitations contained herein. Any failure to comply with these limitations may constitute a violation of applicable laws. All the information contained herein is based upon publicly available information and has been obtained from sources that RHB believes to be reliable and correct at the time of issue of this report. However, such sources have not been independently verified by RHB and/or its affiliates and this report does not purport to contain all information that a prospective investor may require. The opinions expressed herein are RHB’s present opinions only and are subject to change without prior notice. RHB is not under any obligation to update or keep current the information and opinions expressed herein or to provide the recipient with access to any additional information. Consequently, RHB does not guarantee, represent or warrant, expressly or impliedly, as to the adequacy, accuracy, reliability, fairness or completeness of the information and opinion contained in this report. Neither RHB (including its officers, directors, associates, connected parties, and/or employees) nor does any of its agents accept any liability for any direct, indirect or consequential losses, loss of profits and/or damages that may arise from the use or reliance of this research report and/or further communications given in relation to this report. Any such responsibility or liability is hereby expressly disclaimed. Whilst every effort is made to ensure that statement of facts made in this report are accurate, all estimates, projections, forecasts, expressions of opinion and other subjective judgments contained in this report are based on assumptions considered to be reasonable and must not be construed as a representation that the matters referred to therein will occur. Different assumptions by RHB or any other source may yield substantially different results and recommendations contained on one type of research product may differ from recommendations contained in other types of research. The performance of currencies may affect the value of, or income from, the securities or any other financial instruments referenced in this report. Holders of depositary receipts backed by the securities discussed in this report assume currency risk. Past performance is not a guide to future performance. Income from investments may fluctuate. The price or value of the investments to which this report relates, either directly or indirectly, may fall or rise against the interest of investors. This report does not purport to be comprehensive or to contain all the information that a prospective investor may need in order to make an investment decision. The recipient of this report is making its own independent assessment and decisions regarding any securities or financial instruments referenced herein. Any investment discussed or recommended in this report may be unsuitable for an investor depending on the investor’s specific investment objectives and financial position. The material in this report is general information intended for recipients who understand the risks of investing in financial instruments. This report does not take into account whether an investment or course of action and any associated risks are suitable for the recipient. Any recommendations contained in this report must therefore not be relied upon as investment advice based on the recipient's personal circumstances. Investors should make their own independent evaluation of the information contained herein, consider their own investment objective, financial situation and particular needs and seek their own financial, business, legal, tax and other advice regarding the appropriateness of investing in any securities or the investment strategies discussed or recommended in this report. This report may contain forward-looking statements which are often but not always identified by the use of words such as “believe”, “estimate”, “intend” and “expect” and statements that an event or result “may”, “will” or “might” occur or be achieved and other similar expressions. Such forward-looking statements are based on assumptions made and information currently available to RHB and are subject to known and unknown risks, uncertainties and other factors which may cause the actual results, performance or achievement to be materially different from any future results,
performance or achievement, expressed or implied by such forward-looking statements. Caution should be taken with respect to such statements and recipients of this report should not place undue reliance on any such forward-looking statements. RHB expressly disclaims any obligation to update or revise any forward-looking statements, whether as a result of new information, future events or circumstances after the date of this publication or to reflect the occurrence of unanticipated events. The use of any website to access this report electronically is done at the recipient’s own risk, and it is the recipient’s sole responsibility to take precautions to ensure that it is free from viruses or other items of a destructive nature. This report may also provide the addresses of, or contain hyperlinks to, websites. RHB takes no responsibility for the content contained therein. Such addresses or hyperlinks (including addresses or hyperlinks to RHB own website material) are provided solely for the recipient’s convenience. The information and the content of the linked site do not in any way form part of this report. Accessing such website or following such link through the report or RHB website shall be at the recipient’s own risk. This report may contain information obtained from third parties. Third party content providers do not guarantee the accuracy, completeness, timeliness or availability of any information and are not responsible for any errors or omissions (negligent or otherwise), regardless of the cause, or for the results obtained from the use of such content. Third party content providers give no express or implied warranties, including, but not limited to, any warranties of merchantability or fitness for a particular purpose or use. Third party content providers shall not be liable for any direct, indirect, incidental, exemplary, compensatory, punitive, special or consequential damages, costs, expenses, legal fees, or losses (including lost income or profits and opportunity costs) in connection with any use of their content. The research analysts responsible for the production of this report hereby certifies that the views expressed herein accurately and exclusively reflect his or her personal views and opinions about any and all of the issuers or securities analysed in this report and were prepared independently and autonomously. The research analysts that authored this report are precluded by RHB in all circumstances from trading in the securities or other financial instruments referenced in the report, or from having an interest in the company(ies) that they cover. The contents of this report is strictly confidential and may not be copied, reproduced, published, distributed, transmitted or passed, in whole or in part, to any other person without the prior express written consent of RHB and/or its affiliates. This report has been delivered to RHB and its affiliates’ clients for information purposes only and upon the express understanding that such parties will use it only for the purposes set forth above. By electing to view or accepting a copy of this report, the recipients have agreed that they will not print, copy, videotape, record, hyperlink, download, or otherwise attempt to reproduce or re-transmit (in any form including hard copy or electronic distribution format) the contents of this report. RHB and/or its affiliates accepts no liability whatsoever for the actions of third parties in this respect. The contents of this report are subject to copyright. Please refer to Restrictions on Distribution below for information regarding the distributors of this report. Recipients must not reproduce or disseminate any content or findings of this report without the express permission of RHB and the distributors. The securities mentioned in this publication may not be eligible for sale in some states or countries or certain categories of investors. The recipient of this report should have regard to the laws of the recipient’s place of domicile when contemplating transactions in the securities or other financial instruments referred to herein. The securities discussed in this report may not have been registered in such jurisdiction. Without prejudice to the foregoing, the recipient is to note that additional disclaimers, warnings or qualifications may apply based on geographical location of the person or entity receiving this report. The term “RHB” shall denote, where appropriate, the relevant entity distributing or disseminating the report in the particular jurisdiction referenced below, or, in every other case, RHB Investment Bank Berhad and its affiliates, subsidiaries and related companies. RESTRICTIONS ON DISTRIBUTION Malaysia This report is issued and distributed in Malaysia by RHB Investment Bank Berhad (“RHBIB”). The views and opinions in this report are our own as of the date hereof and is subject to change. If the Financial Services and Markets Act of the United Kingdom
or the rules of the Financial Conduct Authority apply to a recipient, our obligations owed to such recipient therein are unaffected. RHBIB has no obligation to update its opinion or the information in this report. Thailand This report is issued and distributed in the Kingdom of Thailand by RHB Securities (Thailand) PCL, a licensed securities company that is authorised by the Ministry of Finance, regulated by the Securities and Exchange Commission of Thailand and is a member of the Stock Exchange of Thailand. The Thai Institute of Directors Association has disclosed the Corporate Governance Report of Thai Listed Companies made pursuant to the policy of the Securities and Exchange Commission of Thailand. RHB Securities (Thailand) PCL does not endorse, confirm nor certify the result of the Corporate Governance Report of Thai Listed Companies.

24
Market Dateline / PP 19489/05/2019 (035080)
Indonesia This report is issued and distributed in Indonesia by PT RHB Sekuritas Indonesia. This research does not constitute an offering document and it should not be construed as an offer of securities in Indonesia. Any securities offered or sold, directly or indirectly, in Indonesia or to any Indonesian citizen or corporation (wherever located) or to any Indonesian resident in a manner which constitutes a public offering under Indonesian laws and regulations must comply with the prevailing Indonesian laws and regulations. Singapore
This report is issued and distributed in Singapore by RHB Securities Singapore Pte Ltd which is a holder of a capital markets services licence and an exempt financial adviser regulated by the Monetary Authority of Singapore. RHB Securities Singapore Pte Ltd may distribute reports produced by its respective foreign entities, affiliates or other foreign research houses pursuant to an arrangement under Regulation 32C of the Financial Advisers Regulations. Where the report is distributed in Singapore to a person who is not an Accredited Investor, Expert Investor or an Institutional Investor, RHB Securities Singapore Pte Ltd accepts legal responsibility for the contents of the report to such persons only to the extent required by law. Singapore recipients should contact RHB Securities Singapore Pte Ltd in respect of any matter arising from or in connection with the report. Hong Kong
This report is issued and distributed in Hong Kong by RHB Securities Hong Kong
Limited (興業僑豐證券有限公司) (CE No.: ADU220) (“RHBSHK”) which is licensed in
Hong Kong by the Securities and Futures Commission for Type 1 (dealing in securities) and Type 4 (advising on securities) regulated activities. Any investors wishing to purchase or otherwise deal in the securities covered in this report should contact RHBSHK. RHBSHK is a wholly owned subsidiary of RHB Hong Kong Limited; for the purposes of disclosure under the Hong Kong jurisdiction herein, please note that RHB Hong Kong Limited with its affiliates (including but not limited to RHBSHK) will collectively be referred to as “RHBHK.” RHBHK conducts a full-service, integrated investment banking, asset management, and brokerage business. RHBHK does and seeks to do business with companies covered in its research reports. As a result, investors should be aware that the firm may have a conflict of interest that could affect the objectivity of this research report. Investors should consider this report as only a single factor in making their investment decision. Importantly, please see the company-specific regulatory disclosures below for compliance with specific rules and regulations under the Hong Kong jurisdiction. Other than company-specific disclosures relating to RHBHK, this research report is based on current public information that we consider reliable, but we do not represent it is accurate or complete, and it should not be relied on as such. United States This report was prepared by RHB and is being distributed solely and directly to “major” U.S. institutional investors as defined under, and pursuant to, the requirements of Rule 15a-6 under the U.S. Securities and Exchange Act of 1934, as amended (the “Exchange Act”). Accordingly, access to this report via Bursa Marketplace or any other Electronic Services Provider is not intended for any party other than “major” US institutional investors, nor shall be deemed as solicitation by RHB in any manner. RHB is not registered as a broker-dealer in the United States and does not offer brokerage services to U.S. persons. Any order for the purchase or sale of the securities discussed herein that are listed on Bursa Malaysia Securities Berhad must be placed with and through Auerbach Grayson (“AG”). Any order for the purchase or sale of all other securities discussed herein must be placed with and through such other registered U.S. broker-dealer as appointed by RHB from time to time as required by the Exchange Act Rule 15a-6. This report is confidential and not intended for distribution to, or use by, persons other than the recipient and its employees, agents and advisors, as applicable. Additionally, where research is distributed via Electronic Service Provider, the analysts whose names appear in this report are not registered or qualified as research analysts in the United States and are not associated persons of Auerbach Grayson AG or such other registered U.S. broker-dealer as appointed by RHB from time to time and therefore may not be subject to any applicable restrictions under Financial Industry Regulatory Authority (“FINRA”) rules on communications with a subject company, public appearances and personal trading. Investing in any non-U.S. securities or related financial instruments discussed in this research report may present certain risks. The securities of non-U.S. issuers may not be registered with, or be subject to the regulations of, the U.S. Securities and Exchange Commission. Information on non-U.S. securities or related financial instruments may be limited. Foreign companies may not be subject to audit and reporting standards and regulatory requirements comparable to those in the United States. The financial instruments discussed in this report may not be suitable for all investors. Transactions in foreign markets may be subject to regulations that differ from or offer less protection than those in the United States. DISCLOSURE OF CONFLICTS OF INTEREST RHB Investment Bank Berhad, its subsidiaries (including its regional offices) and associated companies, (“RHBIB Group”) form a diversified financial group, undertaking various investment banking activities which include, amongst others, underwriting, securities trading, market making and corporate finance advisory. As a result of the same, in the ordinary course of its business, any member of the RHBIB Group, may, from time to time, have business relationships with or hold positions in the securities (including capital market products) or perform and/or solicit investment, advisory or other services from any of the subject company(ies) covered in this research report.
While the RHBIB Group will ensure that there are sufficient information barriers and internal controls in place where necessary, to prevent/manage any conflicts of interest to ensure the independence of this report, investors should also be aware that such conflict of interest may exist in view of the investment banking activities undertaken by the RHBIB Group as mentioned above and should exercise their own judgement before making any investment decisions.
Malaysia Save as disclosed in the following link (RHB Research conflict disclosures – Jan 2020) and to the best of our knowledge, RHBIB hereby declares that: 1. RHBIB does not have a financial interest in the securities or other capital market
products of the subject company(ies) covered in this report. 2. RHBIB is not a market maker in the securities or capital market products of the
subject company(ies) covered in this report. 3. None of RHBIB’s staff or associated person serve as a director or board
member* of the subject company(ies) covered in this report *For the avoidance of doubt, the confirmation is only limited to the staff of research department
4. Save as disclosed below, RHBIB did not receive compensation for investment banking or corporate finance services from the subject company in the past 12 months.
5. RHBIB did not receive compensation or benefit (including gift and special cost arrangement e.g. company/issuer-sponsored and paid trip) in relation to the production of this report.
Thailand
RHB Securities (Thailand) PCL and/or its directors, officers, associates, connected parties and/or employees, may have, or have had, interests and/or commitments in the securities in subject company(ies) mentioned in this report or any securities related thereto. Further, RHB Securities (Thailand) PCL may have, or have had, business relationships with the subject company(ies) mentioned in this report. As a result, investors should exercise their own judgment carefully before making any investment decisions. Indonesia PT RHB Sekuritas Indonesia is not affiliated with the subject company(ies) covered in this report both directly or indirectly as per the definitions of affiliation above. Pursuant to the Capital Market Law (Law Number 8 Year 1995) and the supporting regulations thereof, what constitutes as affiliated parties are as follows: 1. Familial relationship due to marriage or blood up to the second degree, both
horizontally or vertically; 2. Affiliation between parties to the employees, Directors or Commissioners of the
parties concerned; 3. Affiliation between 2 companies whereby one or more member of the Board of
Directors or the Commissioners are the same; 4. Affiliation between the Company and the parties, both directly or indirectly,
controlling or being controlled by the Company; 5. Affiliation between 2 companies which are controlled, directly or indirectly, by the
same party; or 6. Affiliation between the Company and the main Shareholders. PT RHB Sekuritas Indonesia is not an insider as defined in the Capital Market Law and the information contained in this report is not considered as insider information prohibited by law. Insider means: a. a commissioner, director or employee of an Issuer or Public Company; b. a substantial shareholder of an Issuer or Public Company; c. an individual, who because of his position or profession, or because of a
business relationship with an Issuer or Public Company, has access to inside information; and
d. an individual who within the last six months was a Person defined in letters a, b or c, above.
Singapore Save as disclosed in the following link (RHB Research conflict disclosures – Jan 2020) and to the best of our knowledge, RHB Securities Singapore Pte Ltd hereby declares that: 1. RHB Securities Singapore Pte Ltd, its subsidiaries and/or associated companies
do not make a market in any issuer covered in this report. 2. RHB Securities Singapore Pte Ltd, its subsidiaries and/or its associated
companies and its analysts do not have a financial interest (including a shareholding of 1% or more) in the issuer covered in this report.
3. RHB Securities, its staff or connected persons do not serve on the board or trustee positions of the issuer covered in this report.
4. RHB Securities Singapore Pte Ltd, its subsidiaries and/or its associated companies do not have and have not within the last 12 months had any corporate finance advisory relationship with the issuer covered in this report or any other relationship that may create a potential conflict of interest.
5. RHB Securities Singapore Pte Ltd, or person associated or connected to it do not have any interest in the acquisition or disposal of, the securities, specified securities based derivatives contracts or units in a collective investment scheme covered in this report.
6. RHB Securities Singapore Pte Ltd and its analysts do not receive any compensation or benefit in connection with the production of this research report or recommendation.
25
Market Dateline / PP 19489/05/2019 (035080)
Hong Kong The following disclosures relate to relationships between RHBHK and companies covered by Research Department of RHBSHK and referred to in this research report: RHBSHK hereby certifies that no part of RHBSHK analyst compensation was, is or will be, directly or indirectly, related to the specific recommendations or views expressed in this research report. RHBHK had an investment banking services client relationships during the past 12 months with: -. RHBHK has received compensation for investment banking services, during the past 12 months from: -. RHBHK managed/co-managed public offerings, in the past 12 months for: -. On a principal basis. RHBHK has a position of over 1% market capitalization of: -. Additionally, please note the following: Ownership and material conflicts of interest: RHBSHK policy prohibits its analysts and associates reporting to analysts from owning securities of any company covered by the analyst. Analyst as officer or director: RHBSHK policy prohibits its analysts, and associates reporting to analysts from serving as an officer, director, advisory board member or employee of any company covered by the analyst. RHBHK salespeople, traders, and other non-research professionals may provide oral or written market commentary or trading strategies to RHB clients that reflect opinions that are contrary to the opinions expressed in this research report.
KUALA LUMPUR
RHB Investment Bank Bhd Level 3A, Tower One, RHB Centre Jalan Tun Razak Kuala Lumpur 50400 Malaysia Tel : +603 9280 8888 Fax : +603 9200 2216
JAKARTA
PT RHB Sekuritas Indonesia Revenue Tower, 11th Floor, District 8 - SCBD Jl. Jendral Sudirman Kav 52-53 Jakarta 12190 Indonesia Tel : +6221 509 39 888 Fax : +6221 509 39 777
HONG KONG
RHB Securities Hong Kong Ltd. 12th Floor, World-Wide House 19 Des Voeux Road Central Hong Kong Tel : +852 2525 1118 Fax : +852 2810 0908
BANGKOK
PT RHB Sekuritas Indonesia Revenue Tower, 11th Floor, District 8 - SCBD Jl. Jendral Sudirman Kav 52-53 Jakarta 12190 Indonesia Tel : +6221 509 39 888 Fax : +6221 509 39 777
SINGAPORE
RHB Securities Singapore Pte Ltd. 10 Collyer Quay #09-08 Ocean Financial Centre Singapore 049315 Tel : +65 6533 1818 Fax : +65 6532 6211

Thai Institute of Directors Association (IOD) – Corporate Governance Report Rating 2019
Companies with Excellent CG Scoring by alphabetical order
AAV ADVANC AIRA AKP AKR AMA AMATA AMATAV ANAN AOT AP ARROW BAFS BANPU BAY
BCP BCPG BOL BRR BTS BTW BWG CFRESH CHEWA CHO CK CKP CM CNT COL
COMAN CPALL CPF CPI CPN CSS DELTA DEMCO DRT DTAC DTC EA EASTW ECF EGCO
GBX GC GCAP GEL GFPT GGC GOLD GPSC GRAMMY GUNKUL HANA HARN HMPRO ICC ICHI
III ILINK INTUCH IRPC IVL JKN JSP K KBANK KCE KKP KSL KTB KTC KTIS
LH LHFG LIT LPN MAKRO MALEE MBK MBKET MC MCOT MFEC MINT MONO MTC NCH
NCL NKI NSI NVD NYT OISHI OTO PAP PCSGH PDJ PG PHOL PJW PLANB PLANET
PORT PPS PR9 PREB PRG PRM PSH PSL PTG PTT PTTEP PTTGC PYLON Q-CON QH
QTC RATCH ROBINS RS S S&J SABINA SAMART SAMTEL SAT SC SCB SCC SCCC SCN
SDC SEAFCO SEAOIL SE-ED SELIC SENA SIS SITHAI SNC SORKON SPALI SPI SPRC SSSC STA
STEC SVI SYNTEC TASCO TCAP THAI THANA THANI THCOM THIP THREL TIP TISCO TK TKT
TMB TMILL TNDT TOA TOP TRC TRU TRUE TSC TSR TSTH TTA TTCL TTW TU
TVD TVO U UAC UV VGI VIH WACOAL WAVE WHA WHAUP WICE WINNER
Companies with Very Good CG Scoring by alphabetical order
25 ABM ADB AF AGE AH AHC AIT ALLA ALT AMANAH APCO APCS AQUA ARIP
ASAP ASIAN ASIMAR ASK ASN ASP ATP30 AUCT AYUD B BA BBL BDMS BEC BEM
BFIT BGC BGRIM BIZ BJC BJCHI BLA BPP BROOK CBG CEN CENTEL CGH CHG CHOTI
CHOW CI CIMBT CNS COLOR COM7 COTTO CRD CSC CSP DCC DCON DDD DOD EASON
ECL EE EPG ERW ESTAR ETE FLOYD FN FNS FORTH FPI FPT FSMART FSS FVC
GENCO GJS GL GLOBAL GLOW GULF HPT HTC HYDRO ICN IFS INET INSURE IRC IRPC
IT ITD ITEL J JAS JCK JCKH JMART JMT JWD KBS KCAR KGI KIAT KOOL
KWC KWM L&E LALIN LANNA LDC LHK LOXLEY LRH LST M MACO MAJOR MBAX MEGA
METCO MFC MK MODERN MOONG MPG MSC MTI NEP NETBAY NEX NINE NOBLE NOK NTV
NWR OCC OGC ORI OSP PATO PB PDG PDI PL PLAT PM PPP PRECHA PRIN
PRINC PSTC PT QLT RCL RICHY RML RWI S11 SAAM SALEE SAMCO SANKO SAPPE SAWAD
SCG SCI SCP SE SFP SIAM SINGER SIRI SKE SKR SKY SMIT SMK SMPC SMT
SNP SONIC SPA SPC SPCG SPVI SR SRICHA SSC SSF SST STANLY STPI SUC SUN
SUSCO SUTHA SWC SYMC SYNEX T TACC TAE TAKUNI TBSP TCC TCMC TEAM TEAMG TFG
TFMAMA THG THRE TIPCO TITLE TIW TKN TKS TM TMC TMD TMI TMT TNITY TNL
TNP TNR TOG TPA TPAC TPBI TPCORP TPOLY TRITN TRT TSE TSTE TVI TVT TWP
TWPC UBIS UEC UMI UOBKH UP UPF UPOIC UT UWC VNT WIK XO YUASA ZEN
ZMICO Companies with Good CG Scoring by alphabetical order
A ABICO ACAP AEC AEONTS AJ ALUCON AMC APURE AS ASEFA AU B52 BCH BEAUTY
BGT BH BIG BLAND BM BR BROCK BSBM BSM BTNC CCET CCP CGD CHARAN CHAYO
CITY CMAN CMC CMO CMR CPL CPT CSR CTW CWT D DIMET EKH EMC EPCO
ESSO FE FTE GIFT GLAND GLOCON GPI GREEN GTB GYT HITCH HUMAN IHL INGRS INOX
JTS JUBILE KASET KCM KKC KWG KYE LEE LPH MATCH MATI M-CHAI MCS MDX META
MGT MJD MM MVP NC NDR NEW NNCL NPK NUSA OCEAN PAF PF PICO PIMO
PK PLE PMTA POST PPM PROUD PTL RCL RJH ROJNA RPC RPH SF SGF SGP
SKN SLP SMART SOLAR SPG SQ SSP STI SUPER SVOA TCCC THE THMUI TIC TIGER
TNH TOPP TPCH TPIPP TPLAS TQM TTI TYCN UTP VCOM VIBHA VPO WIN WORK WP
WPH ZIGA

Website: www.thai-iod.com
IOD (IOD Disclaimer)
ผลสาํรวจการกํากบัดแูลกิจการบริษัทจดทะเบียนที่แสดงไว้นี ้ เป็นผลที่ได้จากการสํารวจและประเมินข้อมลูทีบ่ริษัทจดทะเบยีนในตลาดหลกัทรัพย์แหง่ประเทศไทย และ
ตลาดหลกัทรัพย์ เอ็ม เอ ไอ (“บริษัทจดทะเบียน”) เปิดเผยตอ่สาธารณะและเป็นข้อมลูที่ผู้ลงทนุทัว่ไปสามารถเข้าถึงได้ ผลสํารวจดงักลา่วจงึเป็นการนําเสอนข้อมลูในมมุมอง
ของบคุคลภายนอกตอ่มาตรฐานการกํากบัดแูลกิจการของบริษัทจดทะเบยีน โดยไมไ่ด้เป็นการประเมินผลการปฏิบตัิงานหรือการดาํเนินกิจการของบริษัทจดทะเบียนอีกทัง้มิได้
ใช้ข้อมลูภายในของบริษัทจดทะเบยีนในการประเมิน ดงันัน้ผลสํารวจทีแ่สดงนีจ้งึไมไ่ด้เป็นการรับรองถึงผลการปฏิบตัิงานหรือการดาํเนินการของบริษัทจดทะเบียนและไมถื่อ
เป็นการให้คําแนะนําในการลงทนุในหลกัทรัพย์ของบริษัทจดทะเบียนหรือคาํแนะนําใดๆ ผู้ใช้ข้อมลูจงึควรใช้วจิารณญาณของตนเองในการวิเคราะห์และตดัสินใจในการใช้
ข้อมลูใดๆที่เก่ียวกบับริษัทจดทะเบียนที่แสดงในผลสาํรวจนี ้
ทัง้นีบ้ริษัทหลักทรัพย์ อาร์เอชบี (ประเทศไทย) จาํกัด (มหาชน) มิได้ยนืยันหรือรับรองถงึความครบถ้วนและถูกต้องของผลสาํรวจดังกล่าวแต่อย่างใด

ขอ้มลู Anti-Corruption Progress Indicator 2560 ประกาศเจตนารมณ์ CAC
ได้รับการรับรอง CAC
N/A
Source: Thai Institute of Directors
ขอ้มลูบรษิทัทีเ่ขา้ร่วมโครงการแนวร่วมปฏบิตัขิองภาคเอกชนไทยในการต่อตา้นทุจรติ (Thai CAC) ของสมาคมส่งเสรมิสถาบนักรรมการบรษิทัไทย (ขอ้มลู ณ วนัที ่17 ต.ค.)
• ไดป้ระกาศเจตนารมณ์เขา้ร่วม CAC
• ไดร้บัการรบัรอง CAC
การเปิดเผยการประเมนิดชันีชีว้ดัความคบืหน้าการป้องกนัการมสี่วนเกีย่วขอ้งกบัการทุจรติคอรร์ปัชนั (Anti-Corruption Progress Indicators) ของบรษิทัจดทะเบยีนในตลาดหลกัทรพัย์แห่งประเทศไทยที่
จดัทาํโดยสถาบนัทีเ่กีย่วขอ้งซึง่มกีารเปิดเผยโดยสาํนกังานคณะกรรมการกาํกบัหลกัทรพัยแ์ละตลาดหลกัทรพัยน้ี์เป็นการดาํเนินการตามนโยบายและตามแผนพฒันาความยัง่ยนืสําหรบับรษิทัจดทะเบยีนโดย
ผลการประเมนิดงักล่าว สถาบนัทีเ่กีย่วขอ้งอาศยัขอ้มลูทีไ่ดร้บัจากบรษิทัจดทะเบยีนตามทีบ่รษิทัจดทะเบยีนไดร้ะบุในแบบแสดงขอ้มลูเพื่อการประเมนิ Anti-Corruption ซึง่อา้งองิขอ้มลูมาจากแบบแสดง
รายงานขอ้มลูประจาํปี แบบ (56-1) รายงานประจาํปีแบบ (56-2) หรอืในเอกสารหรอืรายงานอื่นทีเ่กีย่วขอ้งซึง่เป็นบุคคลภายนอก โดยมไิดเ้ป็นการประเมนิการปฏบิตัขิองบรษิทัจดทะเบยีนในตลาดหลกัทรพัย์
แห่งประเทศไทยและมไิดใ้ชข้อ้มูลภายในเพื่อการประเมนิ เนื่องจากผลการประเมนิดงักล่าวเป็นเพยีงผลการประเมนิ ณ วนัที่ ปรากฏในผลการประเมนิเท่านัน้ ดงันัน้ผลการประเมนิจงึอาจเปลีย่นแปลงได้
ภายหลงัวนัดงักล่าว หรอืรบัรองความถกูตอ้งครบถว้นของผลประเมนิดงักล่าวแต่อย่างใด