I fJ 7 - International Nuclear Information System (INIS)
203
-
Upload
khangminh22 -
Category
Documents
-
view
1 -
download
0
Transcript of I fJ 7 - International Nuclear Information System (INIS)

I fJ 7 ") ~ -: /;_ ; I (
~r-~~~
/h-1()N1Zl~G RADIATION:
l' Ji~;r~,~~rN D EFFECTS / (,J_,.} / ~ /:·'/'~ ~!' ----===·~ .
A report of the United Nations Scientific Committee
on the Effects of Atomic Radiation
to the Genera/ Assembly,
with annexes
VOLUME I: LEVELS
. ; .. . ,~ ... i1·
,, . ' \
NOTE
The report of the Committee without its appendices and annexes appears as Official Records of the General Assembly, Twenty-seventh Session, Supplement No. 25 (A/8725).
In the text of each annex, Arabic numbers in parenthesis refer to sources listed at the end.
The designations employed and the presentation of the material in this publication do not imply the expression of any opinion whatsoever on the part of the Secretariat of the United Nations concerning the legal status of any country or territory or of its authorities, or concerning the delimitation of its frontiers.
Symbols of United Nations documents are composed of capital letters combined with figures. Mention of such a symbol indicates a reference to a United Nations document.
UNITED NATIONS PUBLICATION
Sales No.: E.72.IX.17
Price: $7.00 (or equivalent in other currencies)
CONTENTS
Page
Abbreviations . . . . . . . . . . . . . . . . . . . . . . . . . . . . . . . . . . . . . . . . . . . . . . . iv
Volume I
Introduction 1
Chapter
I. Sources and doses of radiation . . . . . . . . . . . . . . . . . . . . . . . . . . . . . . 3 II. Genetic effects of radiation . . . . . . . . . . . . . . . . . . . . . . . . . . . . . . . . . 6
III. Effects of radiation on the immune response . . . . . . . . . . . . . . . . . . . 8 IV. Radiation carcinogenesis . . . . . . . . . . . . . . . . . . . . . . . . . . . . . . . . . . . 9
Appendices
I. List of scientific experts, members of national delegations . . . . . . . . . 11 II. List of scientific experts who have co-operated with the Committee
in the preparation of the report . . . . . . . . . . . . . . . . . . . . . . . . . . . . . . 12 III. List of reports received by the Committee . . . . . . . . . . . . . . . . . . . . . 13
ANNEXES
LEVELS
A. Environmental radiation . . . . . . . . . . . . . . . . . . . . . . . . . . . . . . . . . . . 19 B. Doses from medical irradiation . . . . . . . . . . . . . . . . . . . . . . . . . . . . . . 133 C. Doses from occupational exposure . . . . . . . . . . . . . . . . . . . . . . . . . . . . 173 D. Miscellaneous sources of ionizing radiation . . . . . . . . . . . . . . . . . . . . 187
Volume II
ANNEXES (continued)
EFFECTS
E. Genetic effects of ionizing radiation . . . . . . . . . . . . . . . . . . . . . . . . . . 199 F. Effects of radiation on the immune response . . . . . . . . . . . . . . . . . . . . 303 G. Experimental induction of neoplasms by radiation . . . . . . . . . . . . . . . 379 H. Radiation carcinogenesis in man . . . . . . . . . . . . . . . . . . . . . . . . . . . . . 402
iii
ILO FAO WHO WMO IAEA ICRP ICRU
ABCC AEC JNIH
AGR ATB BWR CMD DNA ECBI FBR GCR GSD HVT ICD LET LWR NIC OMR PHWR PWR RBE RNA SST WL WLM
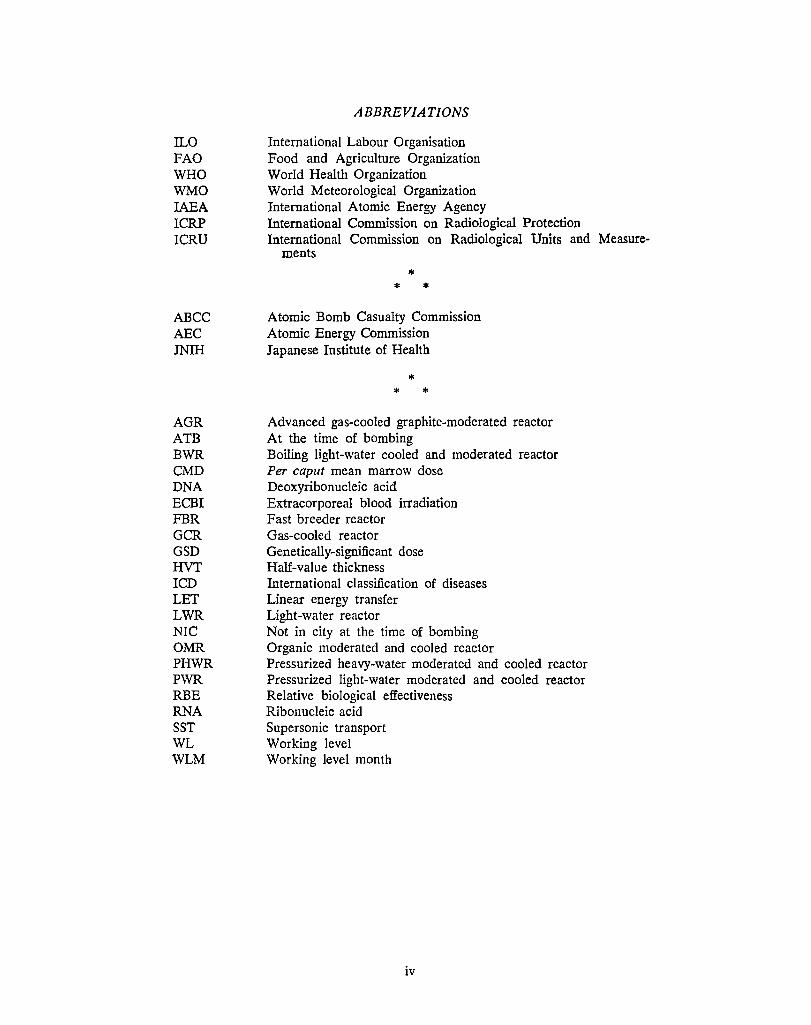
ABBREVIATIONS
International Labour Organisation Food and Agriculture Organization World Health Organization World Meteorological Organization International Atomic Energy Agency International Commission on Radiological Protection International Commission on Radiological Units and Measure-
ments
* * *
Atomic Bomb Casualty Commission Atomic Energy Commission Japanese Institute of Health
* * *
Advanced gas-cooled graphite-moderated reactor At the time of bombing Boiling light-water cooled and moderated reactor Per caput mean marrow dose Deoxyribonucleic acid Extracorporeal blood irradiation Fast breeder reactor Gas-cooled reactor Genetically-significant dose Half-value thickness International classification of diseases Linear energy transfer Light-water reactor Not in city at the time of bombing Organic moderated and cooled reactor Pressurized heavy-water moderated and cooled reactor Pressurized light-water moderated and cooled reactor Relative biological effectiveness Ribonucleic acid Supersonic transport Working level Working level month
iv
INTRODUCTION
1. This is the sixth substantive report of the United Nations Scientific Committee on the Effects of Atomic Radiation1 to the General Assembly. It reviews the levels of radiation received from all sources to which man is exposed and, among the effects of ionizing radiation, it considers the genetic effects, the effects on the immune response and the induction of malignancies in animals and man. These are not the only effects of ionizing radiation. The acute consequences of massive amounts of radiation that may be received accidentally or during nuclear warfare are not reviewed here (the short discussion of this subject in the 1962 report is still largely valid, at least as an introduction), nor are the effects on the nervous system and the induction of chromosome anomalies in somatic cells, which were both considered by the Committee in its 1969 report.
2. Unlike previous reports of the Committee, the present report is submitted to the General Assembly without the technical annexes in which the evidence considered by the Committee is discussed in detail and in which the bases for the Committee's conclusions, which are stated in the report, are fully documented. However, the annexes are being made available at the same time as the report in a separate publication, issued in two volumes2 and the Committee wishes to draw the attention of the General Assembly to the fact that the separation of the report from the annexes is for convenience only and that major importance attaches to the scientific evidence given in the annexes.
3. The preparation of the report took place at the twentieth, twenty-first and twenty-second sessions of the Committee.a Most of the work was done in meetings of groups of specialists which considered working papers prepared by the Secretariat and modified as the drafting proceeded, on the basis of the Committee's requests. The report itself was drafted at the twentysecond session. Professor B. Lindell (Sweden) , Dr. V. Zeleny (Czechoslovakia) and Professor L. R. Caldas (Brazil) served as Chairman, Vice-Chairman
1 The Scientific Committee was established by the General Assembly at its tenth session in 1955. Its terms of reference are set out in resolution 913 (X). It is composed of the following Member States: Argentina, Australia, Belgium, Brazil, Canada, Czechoslovakia, Egypt, France, India, Japan, Mexico, Sweden, Union of Soviet Socialist Republics, United Kingdom of Great Britain and Northern Ireland and United States of America. For the previous substantive reports of the Committee, see Official Records of the General Assembly, Thirteenth Session, Supplement No. 17 (A/3838); ibid., Seventeenth Session, Supplement No. 16 (A/5216); ibid., Nineteenth Session, Supplement No. 14 (A/5814); ibid., Twentyfirst Session, Supplement No. 14 (A/6314); and ibid., Twentyfourth Session, Supplement No. 13 (A/7613). They will be referred to as the 1958, 1962, 1964, 1966 and 1969 reports, respectively.
2 Jonizing Radiation: Levels and Effects (United Nations publications, Sales Nos.: E.72.IX.17 [This is a reference to the present publication] and E.72.IX.18).
3 The twentieth session was held at the United Nations Office at Geneva from 21 to 25 September 1970, the twentyfirst and twenty-second sessions at Headquarters from 14 to 25 June 1971 and 13 to 24 March 1972, respectively.
1
and Rapporteur, respectively, at the twentieth session. Professor B. Lindell (Sweden), Professor F. H. Sobels (Belgium) and Professor L. R: Caldas (Brazil) served as Chairman, Vice-Chairman and Rapporteur, respectively, at the twenty-first session; and Professor L. R. Caldas (Brazil), Professor F. H. Sobels (Belgium) and Dr. A. Nelson (Sweden) served in the same capacity, respectively, at the twenty-second session. The names of those experts who attended the twentieth, twentyfirst or twenty-second sessions of the Committee as members of national delegations are listed in appendix I.
4. The Committee wishes to recall that in 1971 it submitted to the Secretariat of the United Nations Conference on the Human Environment a basic paper on the assessment and control of environmental contamination based on the Committee's experience with artificial radio-activity. The Committee recognizes that, under its present terms of reference as laid down in General Assembly resolution 913 (X), the Committee and its resources can become an element of value in the environmental strategy of the United Nations which may evolve as a result of the Conference on the Human Environment, and it is prepared to play such a role. The Committee further recognizes that. in the present state of affairs, it can continue to discharge its current responsibilities while reporting to the General Assembly less frequently than heretofore. The Committee therefore requests to be relieved from the obligation to report to the General Assembly before the twenty-ninth session and, subject to the acceptance of that request by the Assembly, is not planning to meet before the end of 1973, unless it is asked to undertake new tasks in the context of the environmental strategy of the United Nations or to respond to any other special demand.
5. The Committee was assisted in the preparation of the present report by a small scientific staff and by consultants appointed by the Secretary-General. The scientific staff and consultants were responsible for preliminary review and evaluation of the technical information received by the Committee or published in the scientific literature. Although the Committee itself assumes full responsibility for the report, it wishes to acknowledge the help and advice given by those scientists whose names are listed in appendix II. The Committee owes much to their co-operation and scientific expertise.
6. Representatives of the International Labour Organisation (ILO), the Food and Agriculture Organization of the United Nations (FAO), the World Health Organization (WHO), and of the International Atomic Energy Agency (IAEA), as well as of the International Commission on Radiological Protection (ICRP) and the International Commission on Radiation Units and Measurements (ICRU), attended sessions of the Committee held during the period under review. The Committee wishes to acknowledge with appreciation their contribution to the discussion.
7. The reports received by the Committee from States Members of the United Nations, and members of the specialized agencies and the International Atomic Energy Agency, as well as from these agencies themselves, between 17 May 1969 and 24 March 1972, are listed in appendix ill of this report. Reports re-
2
ceived before 17 May 1969 were listed in earlier reports of the Committee to the General Assembly. The information received officially by the Committee was supplemented by, and interpreted in the light of, information available in the current scientific literature or obtained from unpublished communications of individual scientists.
Chapter I
SOURCES AND DOSES OF RADIATION
A. ENVIRONMENTAL RADIATI0N4
1. Natural radia-tion
~· .Man. has ~een continuously exposed to natural rad1at1on smce his appearance on earth and, until less than a century ago, was exposed to natural radiation only. Even now, despite the widening use· of radiationpro1uci~g devices, the widespread radio-active contammat10n from nuclear weapon tests and the increasing applications of nuclear energy and radio-isotopes, natural sources are the main contributors to the radiation exposure of most of the human population and are likely to remain so in the foreseeable future.
9. Natural radiation is of two origins, extraterrestrial and terrestrial. Extraterrestrial radiation originates in outer space as primary cosmic rays and reaches the atmo~phere, wit.h. whic~ the incoming energy and particles mteract, g1vmg rise to secondary cosmic raysthose to which living beings on the earth's surface are expose~. The. rat: at which doses from cosmic rays are delivered 1s fauly constant at any one point on the earth's surface but varies with latitude and, to a !!Teater extent, with altitude. Typical values at sea 1;'vel in temperate latitudes are of the order of 30 millirads per year. As the altitude increases, dose rates approximately double every 1,500 metres up to a few kilometres above earth.
. 10. ~pecial problems arise with aircraft flying at high altitudes. In that case, not only is the cosmic-ray dose. rate consistently higher than at lower altitudes, but 1t may also, on rare occasions, suddenly rise as a consequence of the emission of high-energy particles from .solar fi~res. The dose rates may, on occasion, be sufficiently high to require the aircraft to descend into the lower protective layers of the atmosphere in order to prevent unacceptable exposures of crew and passengers. The crews of supersonic transports airborne for m~re than .500 hours per year at high altitudes and latitudes will probably receive exposures somewhat hig~er _than those received by the crews of current subs_omc Jets. Passenger doses per kilometre flown are !1kely to b7 about the same in supersonic transport as 1~ convent10nal jet aircraft owing to the shorter flight time of the supersonic transports.
11. Terrestrial radiation is emitted from radio-active nuclides present in varying amounts in all soils and rocks, the atmosphere and the hydrosphere, and from those rad.io-nuclides that, transferred to man through f?od chams or by inhalation, are deposited in his tissues. Terrestrial radio-activity, therefore, leads to both external and internal exposure. External dose rates ya~ depending on the nature of the ground and of bmldmg matenals. whereas internal dose rates are rel~tively c?nstant. The largest part of the world population receives dose rates of the order of 50 and 20
4 For details, see annex A.
3
millirads per year from external and internal terrestrial radiatio~, respectively: Dose rates higher by an order of magnitude are received by populations (a few hundre~ thousand people) living in areas where soils have a high content of uranium and thorium.
2. Man-made environmental radiation
(a) Atmospheric and surface nuclear weapon tests
. 12. Tests of nuclear weapons have been carried out m the last few years at a much lower rate than during earlier periods. Those carried out before 1963 still represent by far the largest series of events leading to global radio-active contamination. However, the debris that these tests had injected into the stratosphere has been almost entirely deposited on the earth's surface so that most of the residual, undecayecl, radio-activity from earlier tests is now present in soil, crops and animal tissues, from which it is steadily removed by ~ number of physical and biological mechanisms. As m the past, the Committee has reviewed the contribution made by the radio-nuclides produced by nuclear tests to the total average doses that will accrue to certain tissues by the year 2000.
13. The intake of strontium-90, a nuclide that is deposited in bone. is now lower than in the past because comparatively small amounts of it are absorbed from the soil by plants used as food-stuffs or animal feed, whereas direct deposition on vegetation, which was the main mechanism of contamination when fallout rates were high, now contributes very little to the intake. As a result, levels of strontium-90 have considerably decreased both in children and in adults. The fact that rates of deposition of strontium-90 are now so much lower than a few years ago has made it possible to evaluate more realistically the rates at which this nuclide is taken up from soils and is eliminated from the human body. These values differ from those that the Committee, in the absence of direct estimates, had so far assumed. and lead to estimates of dose commitments smaller than those accepted by the Committee in its last report. Conversely. the estimates of external doses to all tissues from fall-out deposited on the ground have now been revised upwards. As a result, although the total inventory of long-lived nuclides produced by nuclear tests has changed only slightly. the relative importance of strontium-90 as a contributor to the total dose to be received by the year 2000 is less than in the past. the main contribution being now from those nuclides, in particular caesium-13 7. that give rise to external irradiation. The total per caput dose to be received between 1955 and 2000 by the whole world population from tests carried out between 1955 and the end of 1970 is equivalent to about two years of exposure to natural sources. However. since nuclear weapons tests have not ceased in 1971, it cannot be excluded that a further dose commitment must be added.
14. Iodine-131 is a radio-nuclide that poses special problems because it is concentrated in the thyroid and irradiates that gland more than any other tissue, the doses per unit intake (mostly through milk) being hicrhest in infants. The presence of iodine-131 in milk h:S been reported in a number of countries of the southern hemisphere after each of the 1970 and 1971 series of tests in the southern hemisphere. The annual average doses to the thyroids of infants were of the order of several tens of millirads and the highest annual doses remained markedly lower than those reported in the northern hemisphere before 1963.
(b) Power production from nuclear fission
15. Large-scale production of electric power by nuclear fission presupposes a cycle of complex operations, most of which involve some discharges of radioactive material to the environment and a corresponding radiation exposure of the population at large. The exposures that have resulted so far and may result in the future from operational discharges throughout the world have been considered by the Committee on the basis of published information or of information directly submitted to the Committee. While such information was available from only a . few of the countries in which power reactors are in operation, there is no reason to believe that the population exposure associated with the power-production cycle differs markedly in other countries. The Committee has not reviewed the contamination that may result from future accidental releases of radio-activity.
16. In the full production cycle-from mining and milling of ore to fuel fabrication and enrichment, to power production in reactors and finally to reprocessing of spent fuel-the last two operations are at present the main contributors to the total population dose resulting from nuclear power production, largely because of occupational exposure of workers irI these two parts of the cycle.
17. The exposure of the population is both local, to limited populations living in the proximity of nuclear installations, and global. Most of the population exposure is external, from gaseous discharges through the stacks, whereas a lesser contribution is made by discharges through liquid effluents. Global doses to be received annually by the general public as a result of the continued operation of the energy production cycle at the 1970 production rate are estimated to be one hundred thousandth of the average dose received annually by the world population from natural sources. Local doses can be several times higher than global ones.
18. According to estimates provided by the International Atomic Energy Agency, the world generating capacity will increase more than two hundredfold by the year 2000. With current technology and operational practice. if the nuclear power production were to stabilize at the estimated level reached by the year 2000, annual global radiation doses from the power-production cycle might be as high as two thousandths of those received annually from natural sources. The magnitude of the average increase in the local doses is more difficult to predict for these depend on the population density as well as on the output of the installations. but doses to be received annually as a result of continued power production at the level estirI1ated for the year 2000 are unlikely to exceed greatly the annual global
4
doses received from these sources. Technological advances may make it possible to reduce these expected doses considerably.
( c) Peaceful nuclear explosions
19. Nuclear explosives have a virtually unused potential for peaceful applications. Those that have some prospects of being developed in the near future are the recovery of underground natural resources (particularly natural gas and oil) or the provision of underground storage cavities by contained explosions, and the construction of reservoirs, harbours, canals, etc. by exploiting the earth-moving effect of subsurface cratering explosions. Both types of explosions potentially irivolve population exposure, associated mostly with the radio-activity of the resources recovered in one case, and with the release of radio-active ~aterial to the environment in the other. Their practical applications will probably require international agreements to ensure the protection of the public.
20. A detailed evaluation of artificial radio-activity in the natural gas recovered from the first experimental contained explosion has iridicated that, if the gas had been iritroduced into the distribution network that supplies gas to the 7 million inhabitants of the Los Angeles, California (USA) area, they would have received a dose of the order of a few ten thousandths of that received annually from natural sources. The explosive used irI this experiment had not been designed for gas stimulation. however, and it is to be expected that the new explosives that are now being developed will make it possible to keep gas contamination to such low levels that distribution of gas for industrial and even domestic consumption may become justifiable.
21. Crateririg explosions, by their very nature, always involve at least some ventirig of radio-activity into the atmosphere. Few have been carried out experimentally so far. but one has been used in the Soviet Union for the creation of a water reservoir. Current technology may make it permissible to use crateririg explosions for small projects in isolated areas. For bigger ones, the safety of the populations living near the site of the project, as well as long-range contamination, are powerful limiting factors, and will restrict the use of these projects unless they are overcome by major technological advances.
B. MEDICAL EXP0SURE0
22. Radiation is used in medicine for diagnostic purposes and for the treatment of diseases. particularly cancer. The local doses received by iridividual patients in the course of diagnostic investigations may vary from being about equal to the average doses received annually from natural sources (- 0.1 rad) to 50 times as high. Radiation treatments, on the other hand, may involve individual doses thousands of times higher than those received for diagnostic purposes and are usually delivered over several weeks to part of the body only. Both for diagnosis and for therapy. irradiation is mostly external, but an iricreasing number of radiological procedures now involves the administration of radio-active materials which result in internal irradiation.
23. The mean doses received by the population are detem1ined by a combination of the doses deliv-
5 For details. see annex B.
ered by the individual procedures and the number of cases in which these procedures are applied. In the 10 years since the Committee last reported on this topic the frequency of diagnostic radiological examinations has increased by a few per cent per year in a number of technologically advanced countries, as more facilities for medical care became available and new developments in techniques and instrumentation have been introduced. The aim of medical radiology is to provide maximum benefit to the population served, and therefore an increase in frequency of examinations is likely to be fully justified, particularly in the developing countries. Since it is probable that a large proportion of the world population does not have easy access to modem x-ray facilities, the number of such facilities must increase greatly if local health standards are to improve substantially.
24. Most surveys of medical exposure have been concerned with doses to the reproductive cells. Because such doses, when received after completion of a person's reproductive life, will make no contribution to genetic effects in subsequent generations, individual dose estimates are weighted by the child expectancy of the patient so as to obtain an estimate of the "genetically-significant dose". The estimates so obtained vary for different countries by a factor of almost 10 and range from less than one tenth to more than one half of the annual dose from natural sources. Therapeutic irradiation being most frequently carried out on patients unlikely to have any more children, most of the genetically-significant dose is due to diagnostic irradiation, and different types of examination contribute to different extents to the mean dose. It is very important to note that some of the lowest doses have been reported from countries with the highest health standards, indicating that, with the use of modem radiological techniques and equipment (in particular strict control of field size), the best medical care need not at present involve genetically-significant doses higher than one fifth of the annual dose from natural sources.
25. Only three surveys of doses to blood-forming cells in the bone marrow have been carried out so far. Their results indicate mean annual per caput doses from medical procedures ranging from one third to two times the annual dose from natural sources.
26. There is sufficient agreement between the surveys carried out in the various countries to assess the magnitude of the average doses for particular examinations within an order of magnitude. However, surveys have additional value in indicating where changes in radiological practice or technical advances may achieve significant reductions of the population exposure, and can help in identifying those groups of patients that, having received high doses of radiation, !}lay need continuing surveillance to detect possible mcreases in late radiation effects. But it is questionable whether emphasis should continue to be placed on the conduct of dose surveys alone or whether more attention should not be given to the other means of achieving the minimum practicable dose to the patient commensurate with the needs of diagnostic radiology.
27. Three basic approaches can contribute variously to this improvement, depending, in any particular case, on the availability of funds and trained staffeducational programmes, surveys of the frequency of examination and of the doses received, and administrative control measures. Educational programmes can be aimed at (a) the radiation staff and the conduct
5
of their day-to-day work, ( b) the clinical staff that prescribe investigations involving radiation and (c) the general public and the development of an awareness of the need for radiation protection. The provision of educational training programmes and the establishment of some administrative control may be much more important than dose surveys, particularly where resources are limited.
C. OCCUPATIONAL EXP0SURE6
28. Individuals may be exposed to radiation in the course of their occupation. In industrially developed countries the number of persons liable to receive radiation exposures in the course of their work is reported to be between one and two per thousand of population. Close adherence to the recommendations of such bodies as the International Commission on Radiological Protection, the International Labour Organisation, the World Health Organization and the International Atomic Energy Agency ensures that most workers receive very low exposures, and that very few workers exceed the recommended maximum permissible doses. The maximum permissible annual dose to the whole body is about 50 times that received from natural sources.
29. The mean radiation dose received annually by workers in most types of work involving radiation exposure is reported to be less than six times that received from natural sources, although some types of workers (including industrial radiographers and medical radium workers) tend to receive doses several times higher. The yearly contribution of occupational exposure to the genetically-significant dose of the whole population has been estimated in various countries to be less than one hundredth of the annual dose received from natural sources.
30. Radiation injuries are now very rare and, when they happen, can usually be attributed to carelessness. Most of the reported injuries occur in industrial radiographers, in research workers using x-ray crystallographic machines, and in medical workers using handheld fluoroscopes. Such injuries can be prevented by adherence to recommended practice. Underground miners, not only in uranium mines but in some other types of mines as well, are exposed to radio-active materials in the air they breathe. Considerable efforts are being made to improve conditions in mines so as to reduce this form of radiation exposure, which, at sufficiently high levels, has been shown to be associated with an increased incidence of lung cancer.
D. MISCELLANEOUS SOURCES7
31. The general public may be exposed to ionizing radiation from a wide variety of miscellaneous sources. The most widespread are consumer products containing radio-active materials and electronic tubes emitting x rays but not designed for that purpose. Until a few years ago, appreciable doses could be received from self-luminous wrist watches and from colour television sets. Owing to international recommendations and national regulations, the exposure from these sources has rapidly decreased. Although no recent study of the annual genetically-significant dose has been published, it is estimated to be less than 1 per cent of the annual dose from natural sources.
a For details, see annex C. 7 For details, see annex D.
Chapter II
GENETIC EFFECTS OF RADIATI0N8
32. The genetic material consists of chromosomes -microscopically visible structures within cell nucleiand genes-the functional units of which the chromosomes are composed and which cannot be distinguished microscopically. Although these structures are present in all body cells, only those in the reproductive cells are transmitted to the fertilized ovum ( the zygote) and hence from one generation of individuals into the next. When the reproductive cells are irradiated, changes may be produced in the genes or in the chromosomes of these cells and subsequently transmitted to the descendants of the irradiated individual. These genetic changes are of different kinds: (a) gene mutations i.e., alterations in the function of individual genes; ( b) chromosome aberrations resulting from breakage and reorganization of the chromosomes; and (c) changes in the number of chromosomes. Some of these changes result in offspring suffering abnormalities which may range from mildly detrimental to severely disabling or lethal disorders.
33. Since adequate human data are not available, the estimates of genetic risks ensuing from radiation exposure of the human reproductive cells are based on results obtained with other species, notably mice.
A. GENE MUTATION
34. The two reproductive cell stages most important for the assessment of genetic risks are spermatogonia in the male and oocytes in the female. At high acute doses of radiation the rate of induction in spermatogonial cells is estimated to range between 100-5,000 recessive mutations per rad9 per million. Human populations, however, predominantly receive low doses of radiation under acute (short-term at high dose rate) or chronic (protracted at low dose rate) conditions of exposure. On the basis of experimental studies, it is estimated that under these conditions the rate of mutation induction is about one third of the above figure. Consequently, for males, a rate of induction of 30-1,500 mutations per million per rad seems a more realistic approximation. At high acute doses of radiation the risk of mutation in females conceiving shortly after radiation exposure will be about twice as high as in males, whereas at low doses the risk will be reduced to at least one third and with chronic exposure to about one twentieth of that expected after acute exposure to high doses. If the human ovary responds to irradiation as does that of the mouse, which is by no means certain, it can be expected that, if conception occurs after a sufficient interval following irradiation, the resulting frequency of mutations in the descendants of irradiated females might approach zero.
s For details, see annex E. 9 1 rad,.., 10 times the annual dose received from natural
sources.
6
35. Dominant gene mutations are expressed in the first-generation descendants of an irradiated population. There is evidence suggesting that in man about 1,000 genes may contribute to this category. The estimated rate of induction of dominant visible mutations in the human male exposed to low doses of irradiation is two per rad per million descendants.
B. CHROMOSOME ABERRATIONS
36. Spontaneously occurring chromosome aberrations are a source of considerable human hardship, since they are responsible for a large fraction of all spontaneous miscarriages, congenital malformations and mental and physical defects. For instance, the possession of an additional small chromosome ( number 21 ) leads to Down's syndrome, which is associated with severe mental retardation. Extensive data have been collected recently in the mouse on another type of aberration, known as translocation. This involves the exchange of parts between two different chromosomes. It is known that in man it may lead to malformations similar to those associated with the presence of additional chromosomes, or may lead to early pre-natal death. These effects are associated with the presence of translocations in an unbalanced form, in which there may be loss of one of the exchanged segments and gain of the other. In its balanced form, a translocation usually has no detrimental effect for the person carrying it, but half of his or her offspring are likely to have the translocation in unbalanced form.
37. In male mice, the yield of balanced translocations in the generation after exposure is more or less proportional to dose for acute x-irradiation at moderate to high doses, about 30 being induced per million offspring per rad. It is probably similar in female mice, but information is still meagre. The expected yield of unbalanced translocations (causing early death or detectable abnormality) will be 60 per million zygotes per rad after exposure of males and 180 per million per rad after exposure of females.
38. In attempting to deduce from these figures the probable risk for man under usual exposure conditions, a number of different factors have to be considered. First, there is evidence from work on chromosome aberrations in blood cells that man may be twice as radio-sensitive as the mouse in this respect. Second, chronic gamma-irradiation is only one third as effective as acute x-irradiation in inducing translocations in male mice, while acute x-irradiation at very low doses (as used in medical diagnosis) may be only about one quarter as effective per rad as at higher doses. Therefore the probable yield of balanced translocations in the offspring of exposed males is about 7 per million per rad with chronic gamma-irradiation and about 15 per million per rad with low-dose acute x-irradiation. The expected yields of unbalanced translocation products will be about twice these.
39. Information from both man and the mouse suggests that many of these unbalanced zygotes will die at such an early stage in pregnancy that they will lead, at most. to a missed menstrual period. The proportion surviving to produce abnormal new-born babies is difficult to estimate at present, but is likely to be less than 6 per cent. Therefore one to two additional abnormal babies per million would be expected per rad of paternal exposure at low doses or dose rates. Although a similar estimate cannot yet be made with confidence for maternal exposure, it seems unlikely that risks will be much higher.
40. Translocations are only one category of chromosomal aberration. Those occurring spontaneously (in balanced or unbalanced form) represent about one third of all the chromosome aberrations observed in new-born babies. Information from the mouse suggests that very few of the other aberrations ( e.g. gains or losses of chromosomes) are likely to be transmitted to the next generation after irradiation of the male because the reproductive cells carrying them will be eliminated before they mature. In the female, however, some are transmitted. Thus evidence from the mouse suggests that irradiation of females at low dose rates results in eight additional zygotes with the XO constitution per million (i.e. with a missing sex chromosome).
41. Most of these cases will die before birth; those surviving will be sterile and will have certain other symptoms (Turner's syndrome). No doubt loss of other chromosomes will also occur, but these are likely to be associated with such early embryonic death that they may not constitute a significant risk to liveborn children. Gains of chromosomes form an important component of the human genetic burden. They may be induced by irradiation, especially of females, but positive evidence is lacking so far.
42. Thus in summary, gene mutations are induced at higher frequencies than chromosome aberrations; furthermore chromosome aberrations will be eliminated after a few generations, whereas gene mutations may persist through many more generations thereby affecting a larger number of individuals.
7
C. EsTIMATES OF GENETIC DAMAGE IN RELATION TO THE SPONTANEOUS INCIDENCE OF GENETIC DISEASE
43. While the above estimates provide assessments of the risk of induction of mutations, they do not necessarily provide a useful method of evaluating the harm whic~ is experienced by society. The Committee feels that 1t can also present an estimate of risk of mutation per unit of radiation dose in relation to the natural incidence of genetic disorders observed in man. This was first attempted in the Committee's 1958 report, but confidence in the methodology was not sufficiently great to justify its continued use. Recently, however. experimental work with the mouse has suggested that in males five major indices of mutation are increased, under conditions of acute irradiation. by about 3 per cent per rad. For low-dose or chronic irradiation, the expected increase will be about 1 per cent per rad. Because all these indices of induced mutation have approximately the same rate of increase relative to the spontaneous rate, the Committee feels it may revive this method of assessment with renewed confidence, although it still recognizes that numerous qualifications are necessary.
44. It has been estimated that about 4 per cent of all live-born children suffer from various forms of genetically determined diseases, of which about 2 per cent appear to follow simple rules of inheritance. The other 2 per cent have a more complex mode of transmission. For computational purposes a figure of 3 per cent will be used. Therefore the natural incidence of hereditary diseases maintained by receiving mutation is estimated at 30,000 per million live births.
45. The mutations responsible for that incidence would increase by about 300 per rad under conditions of chronic exposure of males in a parental generation. Up to 20 of these new mutations would contribute to the incidence of hereditary diseases among the immediate descendants of the irradiated males, while the contribution of the remaining new mutations would be distributed over many subsequent generations of descendants.
Chapter III
EFFECTS OF RADIATION ON THE IMMUNE RESPONSE10
46. The immune system provides the main defence mechanisms of the body against infectious agents or their products. The system recognizes what is foreign to the body, and responds by destroying or neutralizing it: it does not distinguish between "foreign-good" and "foreign-bad". Sometimes, therefore, it stands in the way of medically desirable objectives, such as the acceptance of needed tissue or organ transplants. Sometimes, too, the net effects of the immune reaction are themselves undesirable, as in allergies and other immunopathological disorders. Sometimes the system goes awry and reacts to the body's own components, producing auto-immune disease.
47. Because of the many values, "good" and "bad", associated with the immune system, affecting it by irradiation bas great human significance in numerous contexts. For example, depressing immune responsiveness by irradiation reduces the ability to acquire resistance to bacterial, rickettsial and parasitic infections or to neutralize bacterial toxins, and is therefore an undesirable effect of radiation. But depressing immune responsiveness by some means is desirable, even necessary, if organ transplants are to be accomplished. Suppressing or controlling allergy, hypersensitivity, immunopatbological disorder, and auto-immune disease are other important medical objectives.
48. The concept that the immune system evolved only to protect the body against administered foreign agents has been questioned. There is a growing body of data from both experimental animal, and human clinical, studies which indicates that in cancer the malignant cells are recognized as foreign by the individual's own immune system, and that lymphocytes in the host may be directed against tumour cells. The existence of specific serum factors which react with cancer cells has also been recognized, and in some instances these may protect cancer cells from the action of potentially lethal lymphocytes. Most of the recent data in this field have considered the immune response as reacting against an already existing cancer, and in at least some situations it is clear that radiationinduced immune depression permits an increased rate of growth of the cancer. The more critical unanswered
10 For details, see annex F.
8
question is whether immuno-suppression may be an important factor in the radiation-induction of cancer.
49. There have been extensive studies of the effects of radiation on the immune response in experimental animals, but relatively few observations have been made on the radio-sensitivity of the cells involved in the immune response in man. Limited data are available from Hiroshima and Nagasaki and from patients given extensive radio-therapy for malignancy. Comparative studies among many animal species indicate that the radio-sensitivity of a given cell type in the immune system is similar for most species studied. The results of many of these studies can probably be applied directly to man. The relatively recent availability of in vitro techniques for analysing the immune response may now permit direct dose-effect studies to be made with human lymphocytes and other cell types involved in the human response. However, even if it were determined that similar radio-sensitivities of cell types existed for man and animals, it still could not be safely concluded that the immune response will show a similar dose-effect relationship in animals and man, because many factors are involved that cannot be accounted for at the cellular level alone. These include the extent of previous antigenic exposure of the individual ( the secondary response as a whole being relatively more radio-resistant in vivo), the type and dose of antigen, and the interval between antigenic challenge and irradiation.
50. The immune system appears to have large builtin factors of safety, so that it can withstand substantial injury and recover from damage. Although effects on human lymphocytes in culture have been noted even at doses of 1 O rads, 11 the observable damage to the immune system such as changes in antibody formation resulting from whole-body doses of the order of tens of rads is unlikely to be the effect causing the greatest concern. At doses in the range of 100 rads to the whole body, damage to the immune system leads to an increase in susceptibility to infection, and when wholebody doses approach and exceed 200 rads, damage to the immune system is a very important effect of irradiation as expressed, for example, in increased risk of mortality from infection.
11 1 rad ,.., 10 times the annual dose received from natural sources.
Chapter IV
RADIATION CARCINOGENESIS12
51. While experiments with animals suggest that malignant transformations may occur in most mammalian tissues if they are exposed to sufficient radiation doses, the number of people exposed to substantial doses is so small that the relationship between dose and incidence of malignancies in man can only be studied for the most radio-sensitive tissues. By far the largest and most informative groups of irradiated subjects continue to be the survivors of the atomic bombings at Hiroshima and Nagasaki. To these must be added several groups of patients treated by radiotherapy and followed up for several decades, and a few groups of workers exposed to radiation in the course of their occupation--especially underground uranium miners. Children exposed while in utero, in the course of radiological examinations of their pregnant mothers, form a special category.
52. Leukremia is the best known of the radiationinduced malignancies. All evidence indicates that the incidence of certain types of leukremia increases with dose as a result of post-natal irradiation at high dose rate in the 50-500 rad interval.13 At higher doses the rise in frequency decreases, possibly because an increasingly large fraction of cells that would otherwise become leukremic are destroyed by radiation. Radiationinduced leukremias tend to occur most frequently within a few years after exposure and, after 25 years, the frequency tends to return to the levels expected in the absence of irradiation. By that time some 15-40 cases of leukremias per rad1·1 per million exposed have been observed.
53. Lung cancers appear to have been induced at Hiroshima by doses estimated on the basis of crude assumptions to be equivalent to some 30 rads of external gamma radiation delivered at high dose rate, and to have increased with dose up to a dose of about 100 rads. The higher incidence of this type of cancer among irradiated people has been revealed by other surveys also but it is not yet known whether the increase, which starts some 15 years after irradiation, will be sustained for a long time or will eventually subside. Taken at face value, however, the data indicate that from 10 (at 250 rad) to 40 (at 30 rad) cases of cancer per rad per million exposed develop during the first 25 years after exposure to high-dose-rate gamma radiation.
54. Information is available also on the induction of thyroid and breast cancers. Because those affected by these cancers have long survival times, only in the very long run do mortality data reflect the incidence of these tumours. Thus, while breast cancer mortality at Hiroshima suggests a risk of 6-20 cases per million per rad in the first 25 years after irradiation among
12 For details. see annexes G and H. 1a 1 rad - 1 O times the annual dose received from natural
sources. u The estimate applies to doses between 60 and 400 rads of
gamma rays.
9
women exposed to between 60 and 400 rads, this is probably an underestimate of the total yield. For thyroid cancers, an average figure of about 40 cases per million per rad in the same range of doses over the same period of time is obtained from more reliable morbidity data, but the estimate has large uncertainties due to the small number of cases observed. As for lung tumours, there is no information as to whether the increased annual incidence of tumours in the irradiated populations will subside and when.
55. Many surveys of externally irradiated people confirm an increase in other types of cancer taken together, although it is not possible at this stage to identify the specific types whose frequency is enhanced. Among the survivors of the atomic bombing at Hiroshima there is a clear trend for mortality from malignancies other than leukrernia and lung and breast cancers to increase with increasing dose, but quantitative estimates of the rate of increase are hampered by our ignorance of the doses to the tissues concerned. Only a tentative estimate of 40 cases of cancers ( other than leukrernias and breast and lung cancer) per rad per million occurring during the first 25 years after exposure to 250 rads can be advanced on the basis of crude assumptions about tissue doses. Here also it is not known how many additional cases may develop at times later than 25 years.
56. In considering these estimates it must be clearly borne in mind that they are based on observations made after doses of at least tens of rads delivered at high dose rates. These dose rates, and occasionally these doses, are of the order of those that can be received in the course of certain radiological procedures carried out on medical indications, but much higher than those at which we are irradiated by environmental sources, both natural and man-made. It is a matter of speculation whether doses of the order of those received continuously from natural sources may have similar effects. Animal experiments suggest that the yield of tumours per unit dose should be lower at very low doses, except when the target tissue has a susceptibility to radiation induction ?f malignancies much higher than has been observed m man. Animal experiments also indicate that radiation given continuously or in several fractions is usually less carcinogenic than if administered in a single dose within a short period of time. The figures given in the preceding paragraphs are therefore likely to be overestimates of the risk of doses and dose rates such as are received from environmental sources.
57. Studies of people exposed to internal irradiation at substantial doses are few. They concern workers and patients contaminated with radium isotopes and miners exposed to radon gas. Radium-226 is deposited in bones, irradiates bone-forming cells continuously at a decreasing rate for decades after being absorbed into the body and gives rise to bone tumours. Radium-224
causes surnlar efiects after a shorter period of irradiation.
58. Miners exposed to high levels of radon and its radio-active daughters show a very high incidence of lung cancers. The frequency appears to rise in proportion to the level and duration of exposure. The range of exposures within which the increased incidence has been reported corresponds to doses of at least a few hundred rads of alpha radiation. However, dosimetry is difficult and the role of other carcinogenic factors such as smoking habits bas not yet been fully assessed.
10
59. The effects of pre-natal irradiation have been the subject ?f much research. A number of large surveys of children that were exposed to radiation for medical reasons before birth, and that must have received thereby doses of at most a few rads at high dose rate. indicate that pre-natal irradiation is associated with a significant increase of the risk of malignancies in the first 10 years of life. The extent to which the increased risk of malignancies in the medically irradiated is due to radiation rather than to an association with the cause that prompted the irradiation must still be considered as open.
APPENDIX I
LIST OF SCIEl'lTIFIC EXPERTS, MEMBERS OF NATIONAL DELEGATIONS
The scientific experts who took part in the preparation of the present report while attending Committee sessions as members of national delegations are listed below.
ARGENTINA
Dr. D. Beninson (Representative) Dr. D. Cancio Mr. A. J. Gonzalez Mr. G. A. Nowotny Dr. A. E. Placer
AUSTRALIA
Mr. D. J. Stevens (Representative)
BELGIUM
Professor F. H. Sobels (Representative) Dr. 0. B. Zaalberg
BRAZIL
Professor L. R. Carneiro da Silva Caldas (Representative) Dr. E. Pelllla-Franca
CANADA
Dr. G. C. Butler (Representative) Dr. P. J. Barry Dr. J. S. Haskill Dr. A. P. James
CZECHOSLOVAKIA
Dr. M. Klimek (Representative)
EGYPT
Professor M. E. A. El-Kharadly (Representative) Dr. K. E. A. A. Mahmoud (Representative)
FRANCE
Dr. H.P. Jammet (Representative) Professor M. P. Avargues Dr. R. E. Berger Dr. R. B. Coulon Dr. M. H. Dousset Dr. B. H. Dutrillaux Dr. J. C. Lafuma Professor J. Lejeune Professor P. Pellerin
INDIA
Dr. A. R. Gopal-Ayengar (Representative) Dr. K. Sundaram (Representative) Dr. K. B. Mistry
JAPAN
Dr. K. Misono (Representative) Dr. R. Ichikawa Dr. Y. Tazima
11
MEXICO
Dr. M. Martinez-Baez (Representative) Dr. F. Alba-Andrade Dr. R. E. Felix Estrada Dr. R. Gonzalez Dr. A. Leon de Garay Dr. Rebeca Magidin de Nulman
SWEDEN
Professor B. Lindell (Representative) Dr. K. Edvarson Professor K. G. Liining Dr. A. Nelson Mr. J. 0. Snihs
UNION OF SOVIET SOCIALIST REPUBLICS
Professor A. M. Kuzin (Representative) Mr. G. I. Apollonov Mr. Y. G. Balasanov Dr. N. P. Bochkov Dr. I. L. Karol Dr. A. Kulak Dr. A. A. Moiseev Mr. M. Naidenov Dr. R. V. Petrov
UNITED KINGDOM OF GREAT BRITAIN AND NORTHERN IRELAND
Dr. E. E. Pochin (Representative) Professor P. Alexander Dr. W. G. Marley Dr. A. G. Searle
UNITED STATES OF AMERICA
Dr. R.H. Chamberlain (Representative) Dr. S. Abrahamson Dr. B. Bennett Dr. A. M. Brues Dr. H. D. Bruner Dr. J. H. Harley Dr. R. D. Owen Dr. W. L. Russell Mr. G. C. Spiegel Dr. P. C. Tompkins Dr. J. Villforth
APPENDIX II
LIST OF SCIE:NTIFIC EXPERTS WHO HAVE CO-OPERATED WITH THE COMMITTEE IN THE PREPARATION OF THE REPORT
Dr. A. Bouville
Dr. P. M. Bryant
Professor R. E. Ellis
Dr. T. Hirohata
Professor Y. I. Moskalev
Dr. B. J. O'Brien
12
Dr. G. Persson
Dr. K. Sankaranarayanan
Dr. F. Sella
Dr. F. D. Sowby
Dr. H. E. Walburg Jr.
Dr. N. L. Warner
Document No.
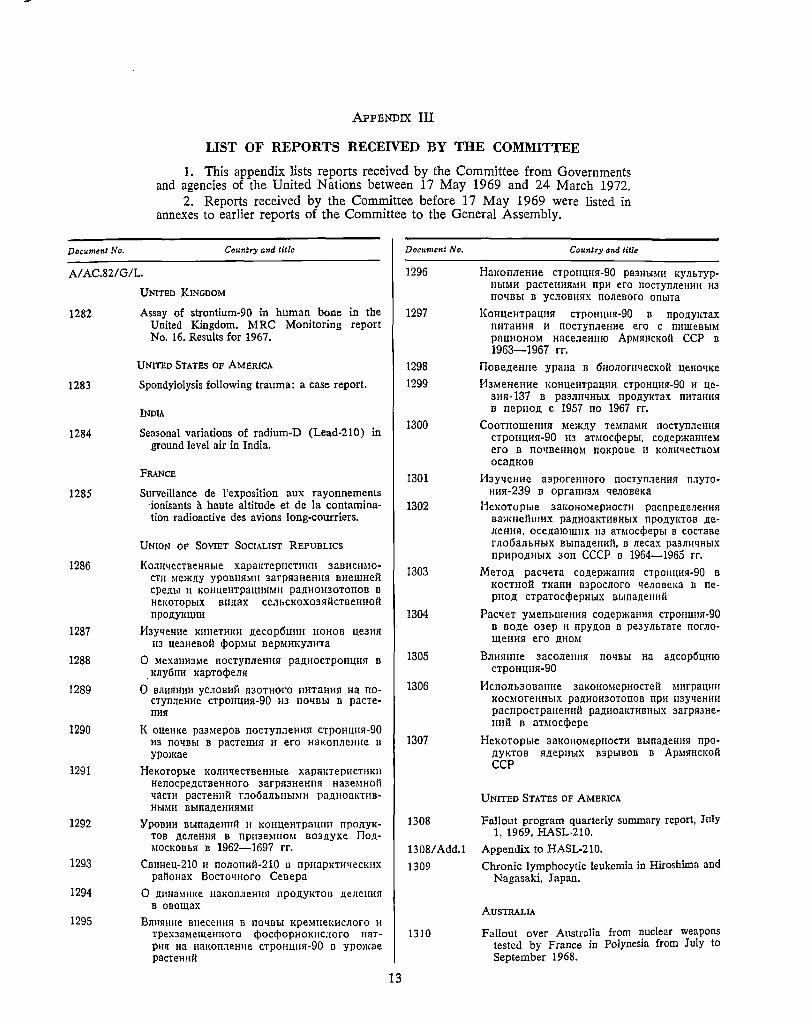
APPENDIX III
LIST OF REPORTS RECEIVED BY THE COMMITTEE
1. This appendix lists reports received by the Committee from Governments and agencies of the United Nations between 17 May 1969 and 24 March 1972.
2. Reports received by the Committee before 17 May 1969 were listed in annexes to earlier reports of the Committee to the General Assembly.
Co,.ntr:,, a"d title Doc,.ment No. Co,.ntry and tille
Al AC.82/G/L. 1296 HaKOilJICHfle CTPOHUll!!-90 pa3HblMH KYJibTYP· Hb!MH pacreHl!llMH npn era IlOCTYilJICl!l!H ll3 Il0'1Bbl B YCJIOBH!IX IlOJICBOro OilbITa UNITED KINGDOM
1282 Assay of strontium-90 in human bone in the
1283
1284
1285
1286
1287
1288
1289
1290
1291
1292
1293
1294
1295
United Kingdom. MRC Monitoring report No. 16. Results for 1967.
UNITED STATES OF AMERICA
Spondylolysis following trauma: a case report.
INDIA
Seasonal variations of radium-D (Lead-210) in ground level air in India.
FRANCE
Surveillance de l'exposition aux rayonnements ionisants a haute altitude et de la contamination radioactive des avions long-courriers.
UNION OF SOVIET SOCIALIST REPU13LICS
KoJJH'ICCTBCHHblC xapaKTepIICTIIKH 3aBHCIIMOCTII MCll<!lY YPOBHSIMII 3arpll3HCHIISI BHewHefi CPCJlbl II KOHUCHTpau11S1Mll paJIHOll30T0Il0B B HCKOTOpb!X Bll.~ax CCJibCKOX03llfiCTBCHHOfi IlPO.llYKUHH
l13y'!eHHe KIIHCTl!l(ll JlCCOpomm HOHOB UC311SI 113 UC3HCB0H clioPMbl BepMHKYJIHTa
0 MCX3HH3MC nocrynJieHHSI pa)ll!OCTPOHU!ISI B 1my61111 Kaproqiem1
0 smrn1111H yc.~oBHH a30THoro nnramrn Ha nocryn.~eHHe CTPOHUHl!-90 H3 IIO'!Bbl B pacreHllll
K oue,me pa3Mepoa nocrynJieHHll crp0Hu1111-90 H3 no'!Bbl B pacremrn H ero HaKonneH!le B ypo)l{ae
HeKOTOpb!e KOJIH'!CCTBCHHbie xapaKTCPHCTHKII HenocpeJICTBCHHoro aarpll3HCHHll Ha3eMHOfi qacrn pacremlil rno6aJibHbUIH pa.n11oaKT1JBHh1MH Bb!IlaJleHHllMII
YpoBHH Bbll18)lCHHfi H KOHUCHTpaUIIJI npO,!lYKTOB JlC.'IeHHll B npH3CMIIOM B03ii,yxe no}lMOCKOBbll a 1962-1697 rr.
Cmrneu-210 H IIOJIOIIHl\-210 B np11apKTI1'1CCKIIX pafionax Bocroirnoro Ceaepa
0 mrnamme HaKOilJ1CHHSI IlPOJlYKTOB .!lC.fleH!rn B oaoruax
Bm1mrne sneceHHll a nO'IBbI 1,pe:,me1mcnoro 11 rpex3aMeIUem1oro clioccliopHOK11c:1oro narpmr Ha HaKOilJICHl!e CTPOHU!ll!-90 B ypoi1rne pacrem1fi
13
1297
1298
1299
1300
1301
1302
1303
1304
1305
1306
1307
1308
1308/Add.1
1309
1310
Ko11ueHTpau1rn CTPOHUll!!-90 B IlPO.!lYKTax Ill!TaHHll H IIOCTYIIJICHHe era C nnrueBblM paunoHoM HaceJieHHIO ApM!!HCKol\ CCP a 1963-1967 rr.
Done.nem,e ypana n 611onorn'leCKofi ueno'!Ke
I13MCHCIIHC KOHUenrpaumr CTPOHU!lll-90 H ue-3HSJ-137 B pa3JIIt'IHblX npo.nyi,rax nnramm n nep110.n c 1957 no 1967 rr.
CooTHOlliCHllll MeiK.!lY TeMnaMH nocryn.~eHHl! CTPOHUI!ll-90 113 an1occliepbl, COJlep)l{aHI!eM ero B IlO'IDCHHOM IlOKPOBe II !WJ1l!'!eCTB0M oca,nKoB
J13yqe1111e a3poren11oro rrocrynJieHHl! nnyroHHsr-239 B opraHH3M 'leJIOBeKa
HeKOTOPbie 3aKoHoMepuocn, pacnpeJie.qemrn Ba)l{HCtllllHX pa,llHOaKTIIBHbIX IlPO.llYlffOB ,lleJICHHll, oce.1Ia10runx 113 anwccliepbl B cocrane rno6a.ribHbIX Bhrna.1IeH11fi, B necax pa3nH'IHbIX npupo,nHblX 30H CCCP n 1964-1965 rr.
Mero.11 pacqera co.1Iepi1rnmrn crpo11uH11-90 a KOCTHOfi TKaHI! B3pOCJIOro 'IC,'JOBeKa B nepno.n cTparocqiepm,1x Bbma.lleH11fi
Pacqer YMCHblllCHHSI COJlep>KaHllll CTPOl!llllll-90 B BO)le 03CP H ITPYJlOB B peayJibTaTe nornoIUCHHll ero JlHOM
Bnnl!Hlle aacoJieH11ll notJBbI Ha aJ1cop6u1110 CTPOIIUHl!-90
I1cnOJib30Il811He aaKOHOMCPHOCTefi Mnrpal(l!I! KOCMOreHHblX paJlll01130TOII0B npn 113Y'ICHIIII pacnpocrpaHeHnl\ pa,11,11oaKT11BllbIX 3arpS13He· HHil B an1ocqiepe
HeKOTOpb!C 38KOHOMCPHOCTH Bb!Ila)leHH!! npo.llYKTOB l!JlCPllblX B3Pb1BOB B ApMllHCKOfi CCP
UNITED STATES OF AMERICA
Fallout program quarterly summary report, July l, 1969, HA.SL-210.
Appendix to HASL-210.
Chronic lymphocytic leukemia in Hiroshima and Nagasaki, Japan.
AUSTRALIA
Fallout over Australia from nuclear weapons tested by France in Polynesia from July to September 1968.
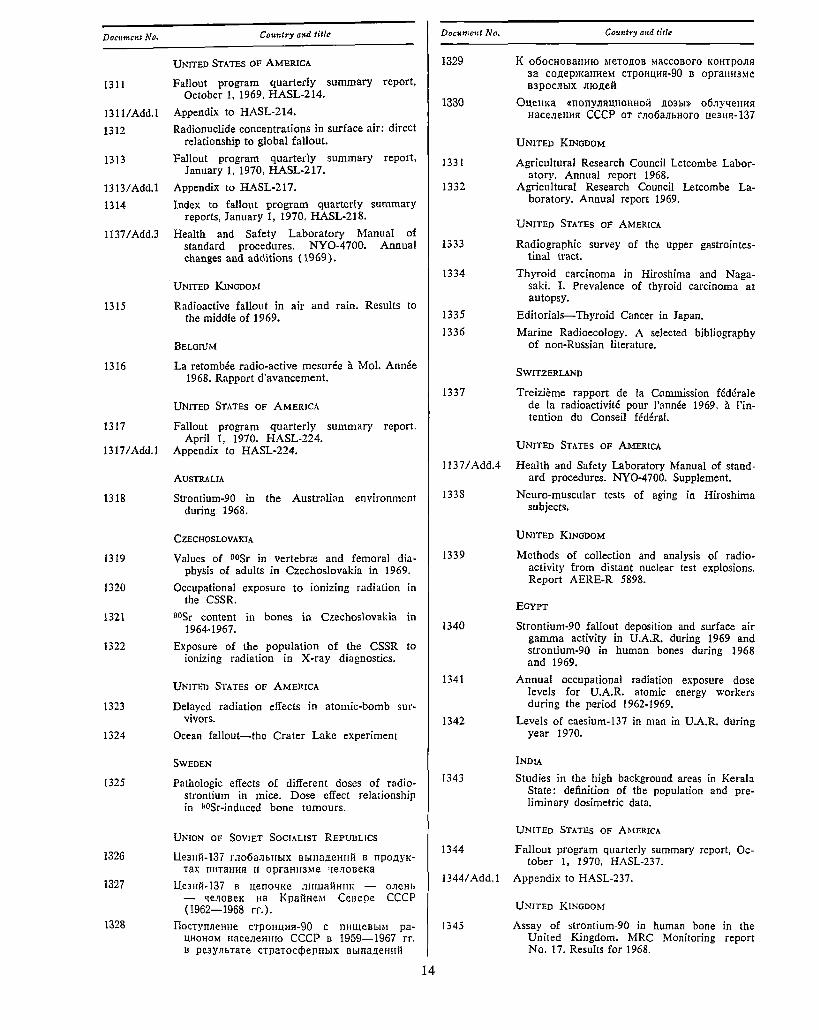
Document No. Country and title
UNITED STATES OF AMERICA
1311 Fallout program quarterly summary report, October 1, 1969, HASL-214.
1311/Add.1 Appendix to HASL-214.
1312
1313
1313/Add.1
1314
1137/Add.3
1315
1316
Radionuclide concentrations in surface air: direct relationship to global fallout.
Fallout program quarterly summary report, January l, 1970, HASL-217.
Appendix to HASL-217.
Index to fallout program quarterly summary reports, January l, 1970, HASL-218.
Health and Safety Laboratory Manual of standard procedures. NY0-4700. Annual changes and additions (1969).
UNITED KINGDOM
Radioactive fallout in air and rain. Results to the middle of 1969.
BELGWM
La retombee radio-active mesuree a Mol. Annee 1968. Rapport d'avancement.
UNITED STATES OF AMERICA
1317 Fallout program quarterly summary report. April 1, 1970. HASL-224.
1317/Add.1 Appendix to HASL-224.
1318
1319
1320
1321
1322
1323
1324
1325
1326
1327
1328
AUSTRALIA
Strontium-90 in the Australian environment during 1968.
CZECHOSLOVAKIA
Values of oosr in vertebrre and femoral diaphysis of adults in Czechoslovakia in 1969.
Occupational exposure to ionizing radiation in the CSSR.
oosr content in bones in Czechoslovakia in 1964-1967.
Exposure of the population of the CSSR to ionizing radiation in X-ray diagnostics.
UNITED STATES OF AMERICA
Delayed radiation effects in atomic-bomb sur-vivors.
Ocean fallout-the Crater Lake experiment
SWEDEN
Pathologic effects of different doses of radiostrontium in mice. Dose effect relationship in oosr-induced bone tumours.
UNION OF SOVIET SOCIALIST REPUBLICS
Ue311tl-137 rno6a.1fbl-lb!X Bbin8ll.CHilil B npo.n:yKTaX nnrnmrn II opraHll3Me ,1e.1J0BeKa
Ue311fl-I37 B rteno'!I<e .1nwai-l1-11m - o,1eHb - qe.1JoBeK na Kpai1He~r Cesepe CCCP (1962-1968 rr.).
DoCTyn11e1me CTPOI-II.UiR-90 C TilllllCBblM paUl{OHOM m1ce,1eH1110 CCCP B 1959-1967 rr. B PC3YilbTaTe CTpatoccpepHblX Bb!TI8.!{e1-1I1!1
14
Document No. Country aud title
1329 K o60CHOBaHHIO MeTO.l(OB Maccoeoro l{OHTPOJIS! 3a co.neplKaHHCM CTPOHI.IIHl-90 B opraHH3MC B3POCJ1b1X JIIO.!I.Cfi
1330 Ou.eHKa «nonym1UHOHHofi .U03hI» 06:ryqeH!lll
1331
1332
1333
1334
1335
1336
1337
11ace.1JeHl!ll CCCP OT r1106aJibHoro ue3HP.· 137
UNITED KINGDOM
Agricultural Research Council Letcombe Laboratory. Annual report 1968.
Agricultural Research Council Letcombe Laboratory. Annual report 1969.
UNITED STATES OF AMERICA
Radiographic survey of the upper gastrointestinal tract.
Thyroid carcinoma in Hiroshima and Nagasaki. I. Prevalence of thyroid carcinoma at autopsy,
Editorials-Thyroid Cancer in Japan.
Marine Radioecology. A selected bibliography of non-Russian literature.
SWITZERLAND
Treizieme rapport de la Commission fedcrale de la radioactivite pour l'annee 1969, a !'intention du Conseil federal.
UNITED STATES OF AMERICA
1137 / Add.4 Health and Safety Laboratory Manual of standard procedures. NY0-4700. Supplement.
1338
1339
1340
1341
1342
1343
Neuro-muscular tests of aging in Hiroshima subjects.
UNITED KINGDOM
Methods of collection and analysis of radioactivity from distant nuclear test explosions. Report AERE-R 5898.
EGYPT
Strontium-90 fallout deposition and surface air gamma activity in U.A.R. during 1969 and strontium-90 in human bones during 1968 and 1969.
Annual occupational radiation exposure dose levels for U.A.R. atomic energy workers during the period 1962-1969.
Levels of caesium-137 in man in U.A.R. during year 1970.
INDIA
Studies in the high background areas in Kerala State: definition of the population and preliminary dosimetric data.
UNITED STATES OF AMERICA
1344 Fallout program quarterly summary report, Oc-tober 1, 1970, HASL-237.
1344/ Add.I Appendix to HASL-237.
UNITED KINGDOM
1345 Assay of strontium-90 in human bone in the United Kingdom. MRC Monitoring report No. 17. Results for 1968.
Docunu,:t l\'o.
1346
1347
1348
1349
Countr3• and title
NEW ZEAL,\::-D
Annual summary 1969. Environmental rndioactivity in New Zealand and Measurements on samples from Fiji and Rarotonga.
Report on radiation control and population dose in New Zealand.
ll\1'IA
Caesium-137 and potassium in Indian whole milk.
NEW ZEALAND
Environmental rndioactivity in New Zealand. Quarterly report April-June 1970 and Pacific Area Monitoring 27 July-9 October.
UNITED STATES OF A.MERICA
1350 Fallout program quarterly summary report. July L 1970. HASL-227.
1350/Add.l Appendix to HASL-227.
1351
1352
1353
AUSTRALIA
Concentrations of caesium-137 in rainwater and milk in Australia during 1968.
Concentrations of caesium-137 in rainwater and milk in Australia during 1969.
The concentrations of radioactive isotopes in Australia surface air during the period May 1965-December 1967.
UNITED STATES OF A.MERICA
1354 Fallout program quarterly summary report, January 1, 1971. HASL-239.
1354/ Add.1 Appendix to HASL-239.
1355
1356
1357
1358
1359
1360
1361
JAPAN
Radioactivity survey data in Japan. No. 26. February 1970.
NEW ZEALAND
Environmental radioactivity in New Zealand and results of extended monitoring of fallout from French nuclear tests in the Pacific for samples processed up to 27 July. Quarterly report January-March J 970.
JAPAN
Radioactivity survey data in Japan. No. 27. May 1970.
UNITED STATES OF AMERICA
Papillary carcinoma of the thyroid gland.
Humboldt Bay - Environmental radiation sur-vey.
JAPAN
Radioac:ivity survey data in Japan. No. 28. August 1970.
UNITED KINGDOM
Radioactive fallout in air and rain. Results to the middle of 1970.
15
Documcat No.
1362
1363
Co1111try aud title
JAPAN
Radioactivity survey data in Jap:m. No. 29. November 1970.
UNITED STATES OF AMERICA
Fallout program quarterly summary report, April 1, 1971. HASL-242.
1363/ Add.l Appendix to HASL-242.
1364
1365
1366
1367
1368
1369
1370
1371
1372
1373
1374
1375
1376
1377
1378
1379
1380
Geographic aspects of malignant lymphoma and multiple myeloma.
NEW ZEALAND
Environmental radioactivity in New Zeal::md. Quarterly report July-September 1970 and Pacific Area Monitoring 9 October-31 October.
CZECHOSLOVAKIA
The values of the ratio 90Sr in vertebrre/OOSr in diaphysis in different age groups (Czechoslovakia 1969).
Values of oosr in vertebrae and femoral diaphysis of adults in Czechoslovakia in 1970.
ITALY
Data on environmental radioactivity collected in Italy (January-June 1967).
Data on environmental radioactivity collected in Italy (January-June 1968).
Data on environmental radioactivity collected in Italy (July-December 1968).
UNITED KINGDOM
Disposal of radioactive wastes ansmg in the United Kingdom from the peaceful uses of atomic energy.
UNITED STATES OF AMERICA
Estimates of potential doses to various organs from X-radiation emissions from color television picture tubes.
A radiation survey of television repair shops in the Baltimore area.
Estimation of gonadal absorbed dose due to environmental gamma radiation.
INDIA
Personnel monitoring using TLD in IRE factory at Manavalakkurichy.
On the biological effects of high background radioactivity: studies on Tradescantia grown in radioactive monazite sand.
Short communication. Comparative uptake of thorium-230, radium-226, Jead-210 and polonium-210 by plants.
Radioactivity in the diet of population of the Kerala coast including rnonazite-bearing high radiation areas.
The effect of chelating agents on the absorption of radium by plants.
I3iological effects of high background radioactivity: studies on plants growing in the monazite-bearing areas of Kerala coast and adjoining regions.
Document No.
1381
1382
1383
1384
1384/Add.1
1385
1386
1387
1388
1389
1389/Corr.1
1390
1391
1137/Add.5
1392
1393
1394
1395
Co,mtr:; and title
FRANCE
Retombees radioactives a la suite des tirs nucleaires en Polynesie. Mai-decea.1bre 1970.
BELOIU:!,1
La retombee radio-active mesuree a Mol. Annee 1969. Rapport d'avancement.
UNITED STATES OF AMERICA
Surveys of radium contamination in aircraft instrument repair facilities 1966-1967.
Fallout program quarterly summary report , July 1, 1971. HASL-243.
Appeadix to HASL-243.
NEW ZEALAND
Environmental radioactivity in New Zealand. Quarterly report October-December 1970.
SWITZERLAND
Quatorzieme rapport de la Commission federale de la radioactivite pour l'annee 1970, a l'intention du Conseil federal.
UNITED KINGDOM
Agricultural Research Council Letcombe Laboratory. Annual report 1970.
JAPAN
Genetically significant dose from diagnostic medical X-ray examinations in Japan, 1969.
Population mean marrow dose and lcukremia significant dose from diagnostic medical Xray examinations in Japan, 1969.
Corrigendum to No. 1389.
Radioactivity survey data in Japan. No. 30. February 1971.
UNITED STATES OF AMERICA
Dietary intake of lead-210.
Health and Safety Laboratory Manual of standard procedures. NY0-4700. Supplement.
ARGENTINA
Fallout radiactivo debido a las explosiones en el Pacifico Sur en el perfodo 1966-1970.
Radioestroncio en el hombre en funci6n de la edad.
AUSTRALIA
Fallout over Australia from nuclear weapons tested by France in Polynesia from May to August 1970.
UNITED STATES OF AMERICA
Fallout program quarterly summary report, October l , 1971. HASL-245.
1395/ Add.I Appendix to HASL-245.
16
Document No.
1396
1397
1398
1399
1400
1401
1402
1403
1404
1405
1406
1407
1408
1409
1410
Co,mtr:; and title
JAPAN
Population doses from tele-radiotherapy in Japan, 1971.
Radioactivity survey data in Japan. No. 31 May 1971.
UNITED KINGDOM .
Assay of strontium-90 in human bone in the United Kingdom. MRC Monitoring report No. 18. Results for 1969.
JAPAN
Radioactivity survey data in Japan. No. 32. August 1971.
NEW ZEALAND
Environmental radioactivity in New Zealand. Quarterly report January-March 1971.
Environmental radioactivity in New Zealand and Pacific area monitoring. Annual summary 1970.
UNITED KINGDOM
Radioactive fallout in air and rain. Results to the middle of 1971.
AUSTRALIA
The concentrations of radioactive isotopes in Australian surface air during the period May 1965-May 1970.
Concentrations of lead-210 in rainwater in Australia during the years 1964-1967.
Concentrations of lead-210 in rainwater in Australia during the years 1964-1970.
JAPAN
Radioactivity survey data in Japan. No. 33. November 1971.
FRANCE
Retombees radioactives a la suite des tirs nucleaires en Polynesie. J uin-octobre 1971.
JAPAN
Estimation of genetically significant dose equivalent from occupational exposure to external sources of radiation in Japan.
AUSTRALL-1.
Strontium-90 and caesium-137 in the Australian environment during 1969 and some results for 1970.
UNITED STATES OF AMERICA
Fallout program quarterly summary report, January l, 1972. HASL-246.
1410/ Add.1 Appendix to HASL-246.
back to
first page
ANNEXES
Levels

Annex A
ENVIRONl\IENTAL RADL-\.TION
CONTENTS
INTRODUCTION ..................•...........
1. The concepts of average dose .......... . 2. Assessment of dose commitments ....... .
PART ONE, NATURAL RADIATION ...•...........
I. COSMIC RAYS ......................... .
A. Primary cosmic rays ............. . 1. Primary galactic cosmic rays ... . 2. Modulation of cosmic rays ..... . 3. Radiation belts ................ .
B. Secondary cosmic rays ............ . 1. Ionization in the atmosphere .... . 2. Cosmic-ray neutrons in the atmos-
phere ....................... .
C. Doses from cosmic rays ........... . 1. Ionizing component ........... . 2. Neutron component ........... . 3. Doses to persons in supersonic
transport aircraft . . . .. . . . . . . . ..
Il. TERRESTRIAL RADIATION ............... .
A. Internal irradiation ............... . 1. Cosmic-ray-produced radio-active
nuclides ...................... . (a) Tritium .................. . (b) Carbon-14 ............... .
2. Primordial radio-active nuclides .. . (a) Potassium-40 ............. . (b) Rubidium-87 ............. . (c) Uranium and thorium series ..
(i) Uranium ............ . a. Concentrations in the
environment ...... . b. Intake, levels and
doses in man ...... . (ii) Thorium-232 ......... . (iii) Radium ............. .
a. Concentrations in the environment ...... .
b. Transfer to man ... . i. Areas of normal
external - radiation background .....
ii. Areas of high external · radiation background .....
c. Dose rates . . . . . _ . (iv) Radon-222, Radon-220,
and their short-lived decay products ............. . a. Concentrations in the
Pal'agraplts
1-4
5-13 14-20
21-146
21-56
22-30 23-24 25-28 29-30
31-39 34-36
37-39
40-56 41
42-46
47-56
57-144
57-131
59-67 60-62 63-67 68-131 69-72
73 74-77 78-80
78-79
80 81-82 83-92
83-86 87-91
87-88
89-91
92
93-120
environment . . . . . . . 93-102 i. Outdoor ground-
level air . . . . . . . . 93-97
19
ii. Indoor levels .. . iii. Water ........ .
b. Transfer to man and doses ............ . i. Inhalation ..... .
(1) Size distribu-tion ...... .
(2) Lung deposition and clear-ance ...... .
( 3) Distance to the biological target
(4) Doses ..... . ii. Ingestion ...... .
(v) Radon-222 long-lived de-cay products ......... . a. 21opb and 210po in the
environment ...... . b. Intake by man .... .
i. Inhalation ..... . ii. Ingestion ...... . iii. Distribution in
man ......... .. iv. Doses ......... .
B. External irradiation ............... .
III. RECAPITULATION OF DOSE RATES ........ .
PART Two. MAN-MADE ENVIRONMENTAL RADIA· TION ................... , , ........ · ·,,. · ·
I. NUCLEAR EXPLOSIONS .•................
A. Atmospheric and surface explosions ..
1. Transport of radio-active debris within the atmosphere ......... . (a) Movement within the strato-
sphere ................... . ( b) Transfer to troposphere .... . (c) Movement within the tropo-
sphere ................... . (d) Deposition ............... .
2. Internal irradiation ............ . (a) Tritium .................. . (b) Carbon-14 ............... . (c) Iron-55 .................. . (d) Krypton-85 .............. . (e) Radio-strontium ........... .
(i) Inventory ........... . ( ii) Levels in food ....... .
(iii) Transfer from deposit to food ................ .
Paragraphs
98-101 102
103-120 103-119
104-107
108-113
114-116 117-119
120
121-131
121-122 123-131
123 124-125
126-130 131
132-144
145-146
147-406
147-311
147-268
150-165
154-155 156-158
159-163 164-165
166-250 166
167-170 171-174 175-177 178-207 178-183 184-185
186-191
(iv) Levels in bone . . . . . . . . 192-194
( v) Transfer from food to bone . . . . . . . . . . . . . . . . . 195-204
Paragraphs
(vi) Dose commitment from oosr ................. 205-207
(f) Iodine-131 ................ 208-221 {i) Transfer to man ....... 210-215
{ii) Doses ............... 216--221 (g) Caesium-137 .............. 222-239
(i) Transfer from deposit to diet .................. 223-230
{ii) Transfer from diet to body ................. 231-235
(iii) Dose commitments ..... 236--239 (h) Plutonium ................ 240-250
(i) Levels in the environ-ment ................ 240-246
(ii) Doses ................ 247-250
3. External irradiation ............. 251-264 {a) Dose commitment from short-
lived fission products ....... 255-260 {b) Dose commitment from 1s1cs 261-264
4. Summary of dose commitments . .. 265-268 B. Underground and cratering explosions 269-311
1. Sources of radio-activity ........ 272-276
2. Contained experiments .......... 277-279 3. Cratering experiments .......... 280-290
(a) Formation of crater ........ 280-284 (b) Release and transport of debris 285-290
(i) Cloud geometry ....... 285-286 (ii) Deposition ............ 287-289
(iii) Ground-water contamina-tion ................. 290
4. Doses ........................ 291-309 (a) Contained explosions ....... 292-299 (b) Cratering explosions ........ 300-301
(i) Dose contribution from short-range fall-out .... 302-304
{ii) Dose contribution from long-range fall-out .... 305-309
5. Conclusion .................... 310-311
II. POWER PRODUCTION BY NUCLEAR FISSION . . 312-404
A. Introduction . . . . . . . . . . . . . . . . . . . . . . 312-316
B. Environmental pathways involving radiation exposure of members of the public . . . . . . . . . . . . . . . . . . . . . . . . . . . 317
I. Atmospheric pathways . . . . . . . . . . 318-321
2. Pathways involving the aquatic environment . . . . . . . . . . . . . . . . . . . 322-324
C. Assessment of radiation doses to mem-bers of the population . . . . . . . . . . . . . 325-326
Introduction
1. Environmental radiation includes cosmic radiation and radiation from nuclides naturally present in the earth's crust, the atmosphere or in waters, as well as radiation from radio-nuclides produced by human activities and introduced into the environment. Individuals are exposed to environmental radiation regardless of health or occupation and the doses received vary widely from place to place and from time to time with respect both to their rate of delivery and to the contribution made by individual sources or type of sources ( e.g .. natural and man-made).
20
ParagraPM
D. Exposures from mining and milling . . 327-332
E. Exposures from fuel fabrication and enrichment . . . . . . . . . . . . . . . . . . . . . . . 333-335
F. Exposures from nuclear power reactors 336--362
1. Origin and amount of radio-nuclides produced . . . . . . . . . . . . . . . . . . . . . 336--341
2. Discharges to the environment . . . 342-351 (a) Liquid discharges . . . . . . . . . . 344-346 (b) Discharges of noble gases . . . 347-350 (c) Other gaseous and particulate
discharges . . . . . . . . . . . . . . . . . 351
3. Doses resulting from environmental contamination . . . . . . . . . . . . . . . . . . 352-362 (a) Doses from radio-nuclides dis-
charged to the aquatic environ-ment . . . . . . . . . . . . . . . . . . . . . 352-358
( b) Doses from noble gases dis-charged to atmosphere ...... 359-360
(c) Doses from radio-nuclides following other pathways . . . 361-362
G. Exposures from fuel reprocessing and waste disposal . . . . . . . . . . . . . . . . . . . . 363-399
1. Fate of the rndio-nuclides in fuel fed to a reprocessing plant . . . . . . 363-372
2. Discharges to the environment . . . 373-383 (a) Liquid discharges . . . . . . . . . . 373-376 (b) Discharges of noble gases . . . 377-378 (c) Other gaseous and particulate
discharges . . . . . . . . . . . . . . . . . 379-383
3. Doses resulting from environmental contamination . . . . . . . . . . . . . . . . . 384 (a) Doses to local populations due
to discharges of radio-nuclides to the aquatic environment . . 385-391
(b) Doses to local populations from discharges of noble gases to atmosphere . . . . . . . . . . . . . 392
(c) Dose to local populations due to other airborne radio-nu-clides . . . . . . . . . . . . . . . . . . . . . 393-395
(d) Doses to the world population resulting from B5Kr and 3H discharged by the nuclear power industry . . . . . . . . . . . . . . . . . . . 396--397
H. Summary of doses from the nuclear power industry . . . . . . . . . . . . . . . . . . . 398-404
ill. RECAPITULATION OF DOSE COMMITMENTS . . 405-406
Page
TABLES . . . . . . . . . . . . . . . . . . . . . . . . . . . . . . 73
REFERENCES . . . . . . . . . . . . . . . . . . . . . . . . . 110
2. The definition of environmental radiation excludes radiation received by selected individuals for medical reasons or in the course of their occupation, as well as irradiation from a number of miscellaneous sources that expose individuals. The present annex will review environmental sources of radiation both natural (Part One) and man-made (Part Two). Annexes B, C and D will review medical and occupational irradiation and exposure to miscellaneous sources, respectively.
3. The Committee reviewed environmental radiation comprehensively in its 1958, 1962 and 1966 reports (612, 613, 615) and in its 1964 and 1969 reports it
reviewed only man-made radio-activity in the environment (614, 616). In reviewing the latter topic, however, the Committee directed its attention almost exclusively to contamination due to nuclear tests in the atmosphere. With the low rates of injection of nuclear debris now experienced, the importance of this source of contamination bas decreased relative to radio-active contamination due to other, rapidly expanding, activities.
4. Hence the Committee has decided to devote considerably greater attention in this report than in previous ones to the contribution that nuclear industry, and the use of nuclear explosions for peaceful purposes. make or may make to radio-active contamination of the environment, and a considerable part of this annex is therefore devoted to reviewing these sources. The reader should be cautioned, however, that the amount of space devoted to discussion of individual sources of environmental radiation does not necessarily reflect their relative importance.
1. The concepts of average dose
5. In addition to the radiation doses to individual members of the population, that are relevant in assessments of radiation risks, average doses are also of interest. Average doses to large populations can be used either to assess the total number of expected injuries in a given population or to compare the risks of two sources of radiation. The latter approach has been used by the Committee in previous reports. Both approaches imply the assumption of a linear, non-threshold relationship between risk and radiation dose.1 The Committee has stressed that this is a cautious assumption which may or may not be valid.
6. In its evaluation of the environmental contamination caused by nuclear test explosions, the Committee made use of the concept of "dose commitment" as defined in the 1969 report, in order to have a measure of the total future radiation dose to a population caused by the given series of explosions. This concept is d.escribed in detail in paragraphs 14-15. Dose commitments may be calculated for different tissues and organs; the Committee has made such calculations for the gonads, the bone marrow and the endosteal cells.
7. The dose commitment is useful in assessing the consequences of any activity per unit practice when significant contributions to the total dose are caused by long-lived nuclides. It is therefore also useful to apply to environmental contamination caused, e.g., by peaceful uses of nuclear explosions and the production of nuclear energy. In these cases the unit practice may be a nominal explosion or one megawatt-year of electrical energy produced, respectively. The concept of dose commitment is particularly useful in the assessment of the trend in a situation before an equilibrium is reached. In such cases the predicted annual dose in a future equilibrium situation is numerically equal to the dose commitment per year of the practice leading to the expected equilibrium.
8. In situations where an equilibrium has already been reached, the actual annual dose (i.e. the dose commitment from each year of practice) is the quantity of immediate interest for assessing the risk to a group
1 This reservation may be unnecessarily stringent in the case of relative risk estimates for dose contributions additional to the natural background radiation, where the differential dose increments would be of interest.
21
of people. This may be taken to be the case with regard to medical and occupational exposures in technologically develo~ed countries. The quantity which is easiest to calc1;1la.te 1s t?en the per caput dose, i.e. the average dose w1thrn a given population.
9. If the dose distribution over the individual members of ~e pop~lation is not uniform, it may be that a substantial fract10n of the per caput dose is contributed by the exposure of individuals which, for biological reasons, are not at risk. This would be the case with regard to genetic effects and carcinogenic effects when doses are received by individuals which, because of their child expectancy or life expectancy, respectively, would not be expected to be able to make the possible biological effect manifest.
10. In such cases weighting procedures are appropriate. Weighting for the individual's child expectancy is part of the calculation of the genetically-significant dose ( GSD) , the procedure being described in paragraphs 7-9 of annex B. A weighting for life expectancy could properly have been an element in the derivation of a leukremia-significant dose although this calculation has not been attempted by the Committee. Instead, the Committee has calculated the population average mean marrow dose without any weighting procedures. this dose therefore being merely a per caput mean marrow dose.
11. Weighting procedures are of particular interest when the average dose in a population is composed of contributions from a number of practices each with different weighting factors. The most striking example is the contribution to the genetically-significant dose from a number of different types of diagnostic x-ray examination. Through the appropriate weighting for child expectancy it is possible to assess the relative importance of the different contributions to the GSD, which is of considerable value in planning protection measures.
12. In the case of occupational exposures, the age distribution makes it less important to derive the properly weighted quantities and it will in most cases suffice to make assessments of the per capc,t doses. In this case it is rarely meaningful to assess anything but the per caput whole-body dose or the per caput gonad dose. In some cases true genetically-significant doses have been reported and seem to be about half the per caput gonad dose. Where such assessments have been made they may be considered to give a more representative presentation of the relevant doses.
13. When a whole population is more or less uniformly exposed to radiation from a particular source, the mean dose received from that source, with any appropriate weighting factors for age and sex of those exposed, gives useful information about the relative importance of the exposure. When, however, only p~ of the population receives exposure from a source. 1t is important to know the number of people exposed and the doses which they receive from the source. In these circumstances, in order to summarize and to compare the population exposures from different sources it is convenient to express the total exposure from each such source as the product of the number exposed and the dose to which each is exposed, in "man-rads". However. when the term "man-rad" is used in the present report it is not intended to imply that it is a measure of the total harm from a source, because of the possible influence of factors such as non-linearity of dose re-
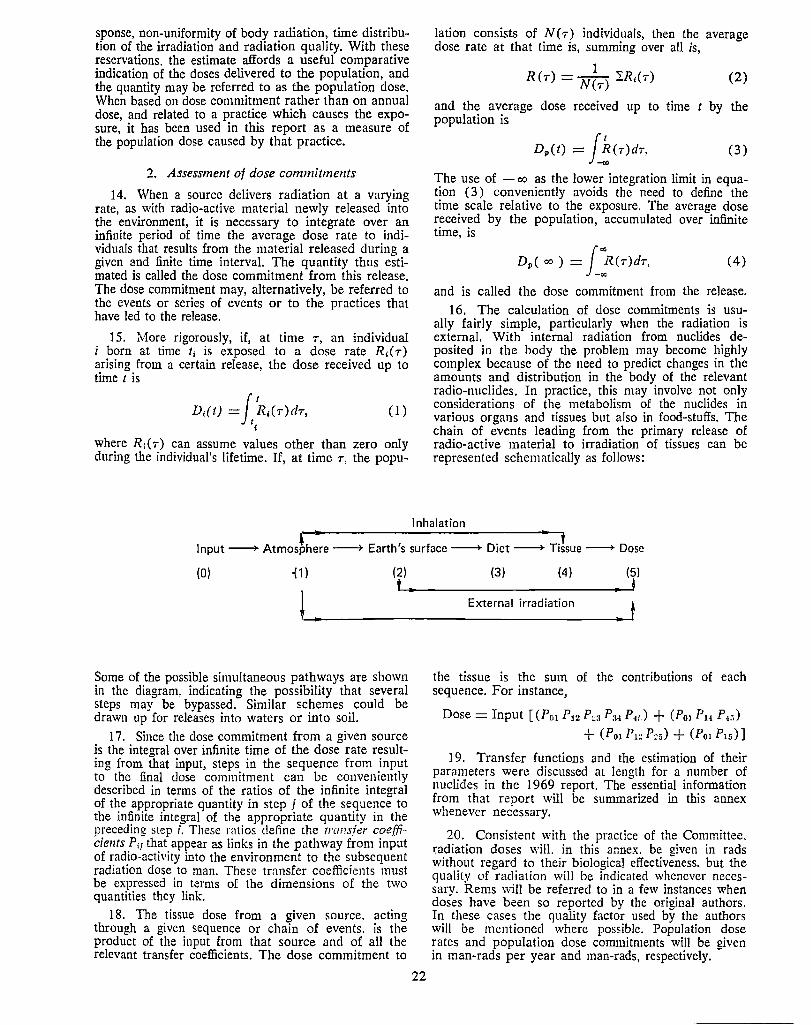
sponse, non-uniformity of body radiation, time distribution of the irradiation and radiation quality. With these reservations. the estimate affords a useful comparative indication of the doses delivered to the population, and the quantity may be referred to as the population dose. When based on dose commitment rather than on annual dose, and related to a practice which causes the exposure, it has been used in this report as a measure of the population dose caused by that practice.
2. Assessment of dose commitments
14. When a source delivers radiation at a varying rate, as with radio-active material newly released into the environment, it is necessary to integrate over an infinite period of time the average dose rate to individuals that results from the material released during a given and finite time interval. The quantity thus estimated is called the dose commitment from this release. The dose commitment may, alternatively, be referred to the events or series of events or to the practices that have led to the release.
15. :More rigorously, if, at time ,, an individual i born at time t1 is exposed to a dose rate R1(T) arising from a certain release, the dose received up to time t is
D;(t) = f R,(T)d,, (l) t, where R;(,) can assume values other than zero only during the individual's lifetime. If, at time T, the popu-
lation consists of N(T) individuals, then the average dose rate at that time is, summing over all is,
(2)
and the average dose received up to time t by the population is
(3)
The use of - co as the lower integration limit in equation ( 3) conveniently avoids the need to define the time scale relative to the exposure. The average dose received by the population, accumulated over infinite time, is
(4)
and is called the dose commitment from the release. 16. The calculation of dose commitments is usu
ally fairly simple, particularly when the radiation is external. With internal radiation from nuclides deposited in the body the problem may become highly complex because of the need to predict changes in the amounts and distribution in the body of the relevant radio-nuclides. In practice, this may involve not only considerations of the metabolism of the nuclides in various organs and tissues but also in food-stuffs. The chain of events leading from the primary release of radio-active material to irradiation of tissues can be represented schematically as follows:
Inhalation ' II< • t
Input - Atmosphere -+- Earth's surface - Diet - Tissue --+ Dose
(0) {1) (2) (3) (4) (5)
I External irradiation t ,. ________ ____,.,
Some of the possible simultaneous pathways are shown in the diagram. indicating the possibility that several steps may be bypassed. Similar schemes could be drawn up for releases into waters or into soil.
17. Since the dose commitment from a given source is the integral over infinite time of the dose rate resulting from that input, steps in the sequence from input to the final dose commitment can be conveniently described in terms of the ratios of the infinite integral of the appropriate quantity in step j of the sequence to the infinite integral of the appropriate quantity in the preceding step i. These ratios define the transfer coe_f{icients Pif that appear as links in the pathway from input of radio-activity into the environment to the subsequent radiation dose to man. These trnnsfer coefficients must be expressed in terms of the dimensions of the two quantities they link.
18. The tissue dose from a given source. acting through a given sequence or chain of events. is the product of the input from that source and of all the relevant transfer coefficients. The dose commitment to
22
the tissue is the sum of the contributions of each sequence. For instance,
Dose= Input [ (Po1 P12 P~3 Pu P4;;) + (P01 P14 P.1r,)
+ (Po1 P1~ P~5) + (Po1 P1s)]
I 9. Transfer functions and the estimation of their parameters were discussed at length for a number of nuclides in the 1969 report. The essential information from that report will be summarized in this annex whenever necessary.
20. Consistent with the practice of the Committee. radiation doses will. in this annex. be given in rads without regard to their biological effectiveness, but the quality of radiation will be indicated whenever necessary. Rems will be referred to in a few instances when doses have been so reported by the original authors. In these cases the quality factor used by the authors will be mentioned where possible. Population dose rates and population dose commitments will be given in man-rads per year and man-rads, respectively.

Part One. Natural radiation
I. Cosmic rays
21. The high-energy radiations which enter the earth ·s atmosphere from outer space are known as primary cosmic rays. 'When they interact with atomic nuclei present in the earth's atmosphere, secondary particles and electromagnetic radiation are produced and these are called secondary cosmic rays.
A. PRIMARY COSMIC RAYS
22. The origin of the primary cosmic rays is still not yet completely determined. However, it is known that most of the observed radiation originates in our galaxy. Moreover, during periods of solar activity the sun produces solar cosmic rays which consist mostly of nonrelativistic protons.
1. Primary galactic cosmic rays
23. Primary galactic cosmic rays largely consist of high-energy protons which enter the solar system from
500
400
.. ... }00 z
" -: <'/
" i 200
100
~terstellar sp~ce. Together with protons are 4He ions m the proport10n of about 10 per cent. Smaller proportions of heavier particles are also present, together with electrons, photons and neutrinos (15, 197, 504, 639 640, 643). The approximate charge composition of primary cosmic rays is shown in table 1. The energy spectrum of the primary-cosmic-ray protons has been measured both in and above the earth's atmosphere by means of instruments carried on balloons and spacecrafts (72, 453, 544). Above about 103 MeV, the proton flux density decreases exponentially with increasing energy. The energy spectrum is peaked around 300 MeV per particle and is very broad, extending from about 1 to lOH MeV.
24. Below 104 MeV, the primary flux density is modified by two processes. In the first place, it is affected by the earth's magnetic field which deflects lower-energy charged particles back into space. This effect is latitude-dependent so that a greater flux of low-energy protons reaches the top of the atmosphere at the poles than in equatorial regions. Thus the ionization produced in the atmosphere is also latitudedependent. This latitude effect increases with altitude and is illustrated in figure I ( 453). In the second place
5gcm·2
20
50
100
140
200
280
60° ao0
GEOMAGNETIC LATITUDE
Figure I. Ionization at different latitudes and atmospheric depths ( 453)
the intensity of the low-energy-proton flux density also varies with the 11-year solar cycle, the density being a minimum during times of maximum solar activity and vice versa; this is known as modulation ( 453, 455, 456).
2. Modulation of cosmic rays
25. The solar-wind theory, originally put forward by Parker (479, 480), adequately accounts for the measured variation of cosmic-ray intensities during the sc,lar cycle. The solar wind consists of an outward flow of plasma, mainly low-energy protons and electrons, travelling out from the sun at several hundred kilo-
23
metres per second. This wind gives rise to an interplanetary magnetic field which extends out to some 5 109 kilometres and this in turn markedly distorts the dipole pattern of the earth's magnetic field (figure II) ( 183, 458, 459). The solar wind protons have insufficient energy to penetrate the earth's magnetic field and so do not give rise to radiation doses in the atmosphere.
26. During the 11-year solar cycle the magnitu~e of the solar wind and of the interplanetary magnetic field and its irregularities undergo a cyclical cha_n¥e, reaching a maximum during increased solar . acuv1ty and a minimum during the period of the qmet sun.
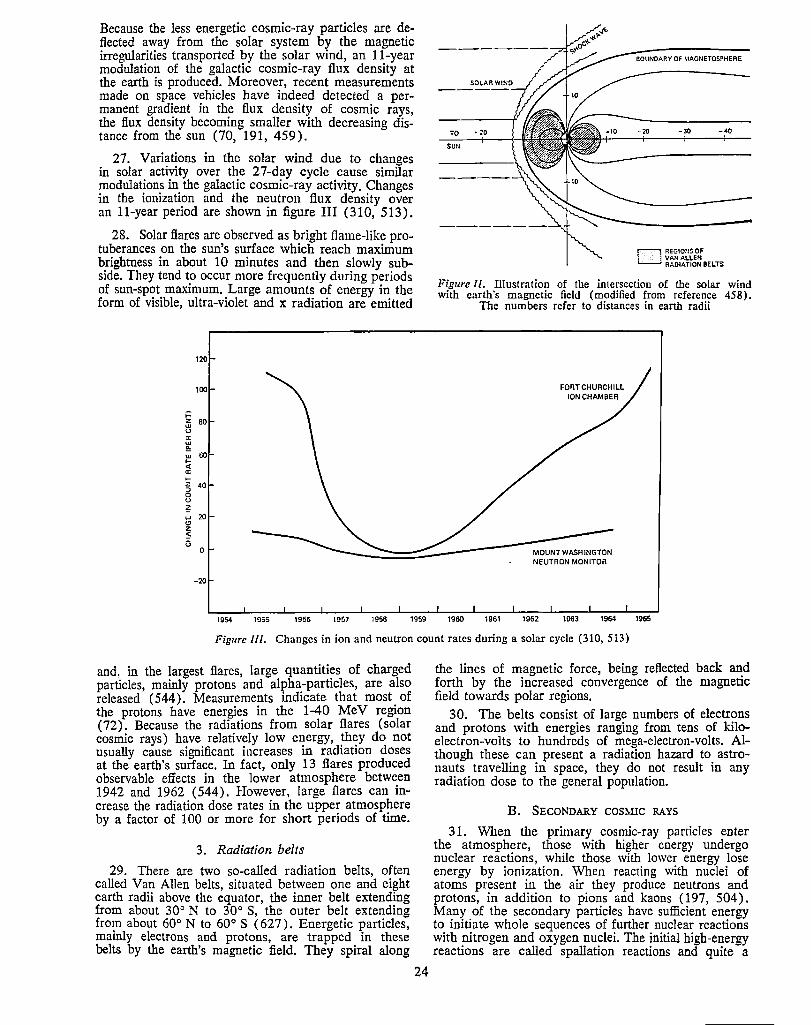
Because the less energetic cosmic-ray particles are deflected away from the solar system by the magnetic irregularities transported by the solar wind, an 11-year modulation of the galactic cosmic-ray flux density at the earth is produced. Moreover, recent measurements made on space vehicles have indeed detected a permanent gradient in the flux density of cosmic rays, the flux density becoming smaller with decreasing distance from the sun (70, 191, 459).
27. Variations in the solar wind due to changes in solar activity over the 27-day cycle cause similar modulations in the galactic cosmic-ray activity. Changes in the ionization and the neutron flux density over an 11-year period are shown in figure III (310, 513).
28. Solar flares are observed as bright flame-like protuberances on the sun's surface which reach maximum brightness in about 10 minutes and then slowly subside. They tend to occur more frequently during periods of sun-spot maximum. Large amounts of energy in the form of visible, ultra-violet and x radiation are emitted
120
100
j:: z 80 w u C: w !,. w 60 ... < a: .... z 40 ::, 0 u ~ w 20
"' z $ u
0
-20
TO •20
SUN
-30
D REGIONS OF VANALLEN RADIATION BELTS
Figure ll. Illustration of the intersection of the solar wind with earth's magnetic field (modified from reference 458).
The numbers refer to distances in earth radii
19S4 1955 1956 1957 1958 1959 1960 1961 1962 1963 1964 1965
Figure Ill. Changes in ion and neutron count rates during a solar cycle (310, 513)
and, in the largest flares, large quantiti~s of charged particles mainly protons and alpha-particles, are also released' ( 544). Measurements indicate that most of the protons have energies in the 1-40 MeV region (72). Because the radiations from solar flares (solar cosmic rays) have relatively low energy, they do not usually cause significant increases in radiation doses at the earth's surface. In fact, only 13 flares produced observable effects in the lower atmosphere between 1942 and 1962 (544). However, large flares can increase the radiation dose rates in the upper atmosphere by a factor of 100 or more for short periods of time.
3. Radiation belts
29. There are two so-called radiation belts, often called Van Allen belts, situated between one and eight earth radii above the equator, the inner belt extending from about 30° N to 30° S, the outer belt extending from about 60° N to 60° S ( 627). Energetic particles, mainly electrons and protons, are trapped in these belts by the earth's magnetic field. They spiral along
24
the lines of magnetic force, being reflected back and forth by the increased convergence of the magnetic field towards polar regions.
30. The belts consist of large numbers of electrons and protons with energies ranging from tens of kiloelectron-volts to hundreds of mega-electron-volts. Although these can present a radiation hazard to astronauts travelling in space, they do not result in any radiation dose to the general population.
B. SECONDARY cos:MIC RAYS
31. When the primary cosmic-ray particles enter the atmosphere, those with higher energy undergo nuclear reactions, while those with lower energy lose energy by ionization. When reacting with nuclei of atoms present in the air they produce neutrons and protons, in addition to pions and kaons (197, 504). Many of the secondary particles have sufficient energy to initiate whole sequences of further nuclear reactions with nitrogen and oxygen nuclei. The initial high-energy reactions are called spallation reactions and quite a
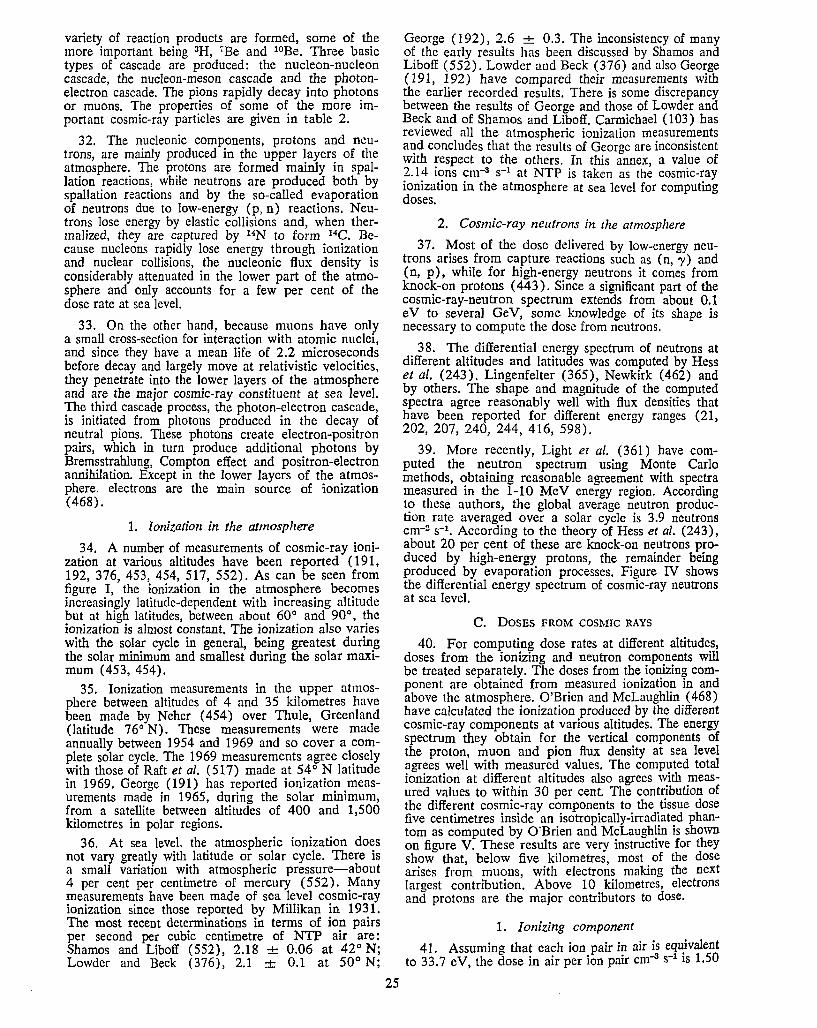
variety of reaction products are formed, some of the more important being 3H, 7Be and 10Be. Three basic types of cascade are produced: the nucleon-nucleon cascade, the nucleon-meson cascade and the photonelectron cascade. The pions rapidly decay into photons or muons. The properties of some of the more important cosmic-ray particles are given in table 2.
32. The nucleonic components, protons and neutrons, are mainly produced in the upper layers of the atmosphere. The protons are formed mainly in spallation reactions, while neutrons are produced both by spallation reactions and by the so-called evaporation of neutrons due to low-energy (p, n) reactions. Neutrons lose energy by elastic collisions and, when thermalized, they are captured by HN to form 14C. Because nucleons rapidly lose energy through ionization and nuclear collisions, the nucleonic flux density is considerably attenuated in the lower part of the atmosphere and only accounts for a few per cent of the dose rate at sea level.
33. On the other hand, because muons have only a small cross-section for interaction with atomic nuclei, and since they have a mean life of 2.2 microseconds before decay and largely move at relativistic velocities, they penetrate into the lower layers of the atmosphere and are the major cosmic-ray constituent at sea level. The third cascade process, the photon-electron cascade, is initiated from photons produced in the decay of neutral pions. These photons create electron-positron pairs, which in turn produce additional photons by Bremsstrahlung, Compton effect and positron-electron annihilation. Except in the lower layers of the atmosphere, electrons are the main source of ionization ( 468).
1. Ionization in the atmosphere
34. A number of measurements of cosmic-ray ionization at various altitudes have been reported ( 191, 192, 376, 453, 454, 517, 552). As can be seen from figure I, the ionization in the atmosphere becomes increasingly latitude-dependent with increasing altitude but at high latitudes, between about 60° and 90°, the ionization is almost constant. The ionization also varies with the solar cycle in general, being greatest during the solar minimum and smallest during the solar maximum (453, 454).
35. Ionization measurements in the upper atmosphere between altitudes of 4 and 35 kilometres have been made by Neher ( 454) over Thule, Greenland (latitude 76° N). These measurements were made annually between 1954 and 1969 and so cover a complete solar cycle. The 1969 measurements agree closely with those of Raft et al. (517) made at 54° N latitude in 1969. George (191) has reported ionization measurements made in 1965, during the solar minimum, from a satellite between altitudes of 400 and 1,500 kilometres in polar regions.
36. At sea level. the atmospheric ionization does not vary greatly with latitude or solar cycle. There is a small variation with atmospheric pressure-about 4 per cent per centimetre of mercury ( 5 52). Many measurements have been made of sea level cosmic-ray ionization since those reported by Millikan in 1931. The most recent determinations in terms of ion pairs per second per cubic centimetre of NTP air are: Shames and Liboff (552), 2.18 + 0.06 at 42° N; Lowder and Beck (376), 2.1 + 0.1 at 50° N;
25
George (192), 2.6 + 0.3. The inconsistency of many of the early results has been discussed by Shamos and Liboff (552). Lowder and Beck (376) and also George ( 191, 192) have compared their measurements with the earlier recorded results. There is some discrepancy between the results of George and those of Lowder and Beck and of Shamos and Lilioff. Carmichael ( 103) has reviewed all the atmospheric ionization measurements ~d concludes that the results of George are inconsistent with respect to the others. In this annex a value of 2.14 ions cm-a s-1 at NTP is taken as th; cosmic-ray ionization in the atmosphere at sea level for computing doses.
2. Cosmic-ray neutrons in the atmosphere
37. Most of the dose delivered by low-energy neutrons arises from capture reactions such as (n, ')I) and (n, p), while for high-energy neutrons it comes from knock-on protons ( 443). Since a significant part of the cosmic-ray-neutron spectrum extends from about 0.1 eV to several GeV, some knowledge of its shape is necessary to compute the dose from neutrons.
38. The differential energy spectrum of neutrons at different altitudes and latitudes was computed by Hess et al. (243). Lingenfelter (365), Newkirk (462) and by others. The shape and magnitude of the computed spectra agree reasonably well with flux densities that have been reported for different energy ranges (21, 202, 207, 240, 244, 416, 598).
39. More recently, Light et al. (361) have computed the neutron spectrum using Monte Carlo methods, obtaining reasonable agreement with spectra measured in the 1-10 Me V energy region. According to these authors, the global average neutron production rate averaged over a solar cycle is 3.9 neutrons cm-2 s-1• According to the theory of Hess et al. (243), about 20 per cent of these are knock-on neutrons produced by high-energy protons, the remainder being produced by evaporation processes. Figure N shows the differential energy spectrum of cosmic-ray neutrons at sea level.
C. DOSES FROM COSMIC RAYS
40. For computing dose rates at different altitudes, doses from the ionizing and neutron components will be treated separately. The doses from the ionizing component are obtained from measured ionization in and above the atmosphere. O'Brien and McLaughlin (468) have calculated the ionization produced by the different cosmic-ray components at various altitudes. The energy spectrum they obtain for the vertical components of the proton, muon and pion flux density at sea level agrees well with measured values. The computed total ionization at different altitudes also agrees with measured values to within 30 per cent. The contribution of the different cosmic-ray components to the tissue dose five centimetres inside an isotropically-irradiated phantom as computed by O'Brien and McLaughlin is shown on figure V. These results are very instructive for they show that, below five kilometres, most of the dose arises from muons, with electrons making the next largest contribution. Above 10 kilometres, electrons and protons are the major contributors to dose.
1. Ionizing component
41. Assuming that each ion pair in air is eq11;ivalent to 33.7 eV, the dose in air per ion pair cm-s s-1 1s 1.50
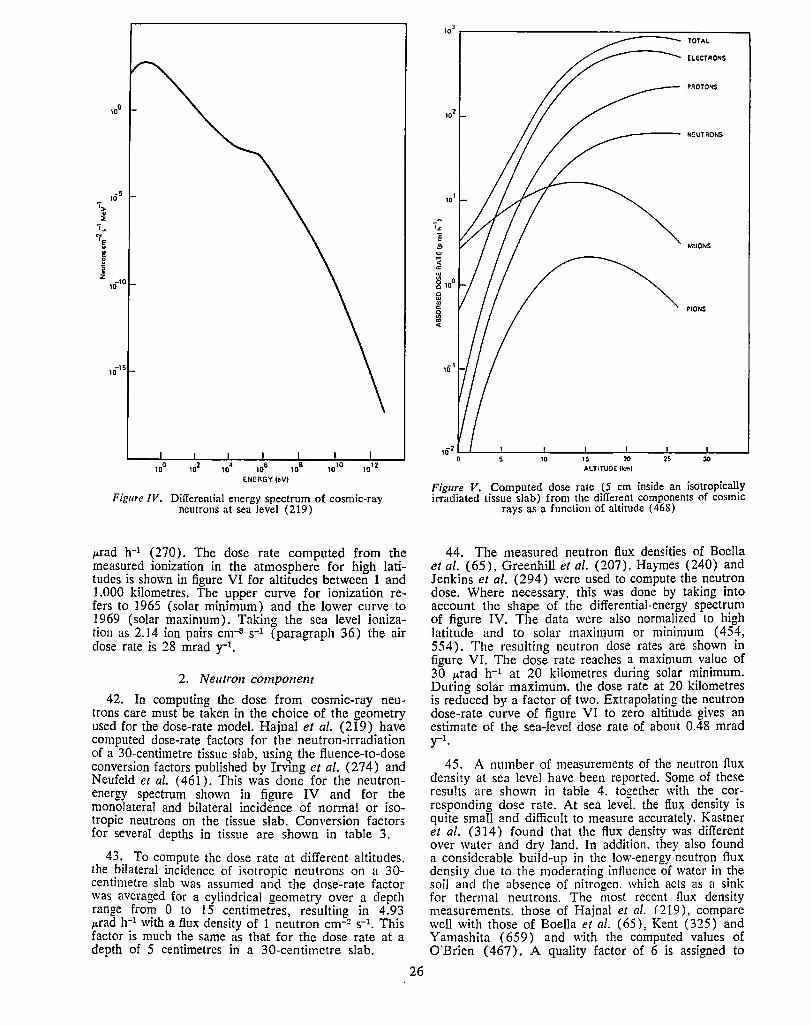
'> ~ ,. 'l'e ~
I! e ii z
100
105
10-10
1015
106
ENERGY loVl
,010 ,012
Figure IV. Differential energy spectrum of cosmic-ray neutrons at sea level (219)
JLrad h-1 (270). The dose rate computed from the measured ionization in the atmosphere for high latitudes is shown in figure VI for altitudes between 1 and 1.000 kilometres. The upper curve for ionization refers to 1965 (solar minimum) and the lower curve to 1969 (solar maximum). Taking the sea level ionization as 2.14 ion pairs cm-a s-1 (paragraph 36) the air dose rate is 28 mrad y-1.
2. Neutron component
42. In computing the dose from cosmic-ray neutrons care must be taken in the choice of the geometry used for the dose-rate model. Hajnal et al. (219) have computed dose-rate factors for the neutron-irradiation of a 30-centimetre tissue slab, using the fluence-to-dose conversion factors published by Irving et al. (274) and Neufeld et al. ( 461). This was done for the neutronenergy spectrum shown in figure IV and for the monolateral and bilateral incidence of normal or isotropic neutrons on the tissue slab. Conversion factors for several depths in tissue are shown in table 3.
43. To compute the dose rate at different altitudes, the bilateral incidence of isotropic neutrons on a 30-centimetre slab was assumed and the dose-rate factor was averaged for a cylindrical geometry over a depth range fro~ 0 to 15 centimetres, resulting in 4.93 /Lrad h-1 with a flux density of 1 neutron cm-2 s-1 . This factor is much the same as that for the dose rate at a depth of 5 centimetres in a 30-centimetre slab.
26
103
TOTAL
ELECTRONS
PROTONS
102
NEUTRONS
101
... ~ ..9, MUONS
~ <( a: u,
g ,oo 0 UJ ., C: PIONS
i <(
,o'
102 .._. __ L..._ _ __J __ __,_ __ -1.. __ J_ __ L..._ _ _J
0 5 10 15 20 ALTITUDE lkml
25 30
Figure V. Computed dose rate (5 cm inside an isotropically irradiated tissue slab) from the difierent components of cosmic
rays as a function of altitude ( 468)
44. The measured neutron flux densities of Boella et al. (65), Greenhill et al. (207), Haymes (240) and Jenkins et al. (294) were used to compute the neutron dose. Where necessary, this was done by taking into account the shape of the differential-energy spectrum of figure IV. The data were also normalized to high latitude and to solar maximum or minimum ( 454, 554). The resulting neutron dose rates are shown in figure VI. The dose rate reaches a maximum value of 30 ,urad lr1 at 20 kilometres during solar minimum. During solar maximum, the dose rate at 20 kilometres is reduced by a factor of two. Extrapolating the neutron dose-rate curve of figure VI to zero altitude gives an estimate of the sea-level dose rate of about 0.48 mrad y-1.
45. A number of measurements of the neutron flux density at sea level have been reported. Some of these results are shown in table 4. to!!ether with the corresponding dose rate. At sea level. the flux density is quite sma!l and difficult to measure accurately. Kastner et al. (314) found that the flux density was different over water and dry land. In addition, they also found a considerable build-up in the low-energy-neutron flux density due to the moderating influence of water in the soil and the absence of nitrogen. which acts as a sink for thermal neutrons. The most recent flux density measurements. those of Hajnal et al. (219), compare well with those of Boella et al. (65), Kent (325) and Yamashita ( 659) and with the computed values of O'Brien ( 467). A quality factor of 6 is assigned to
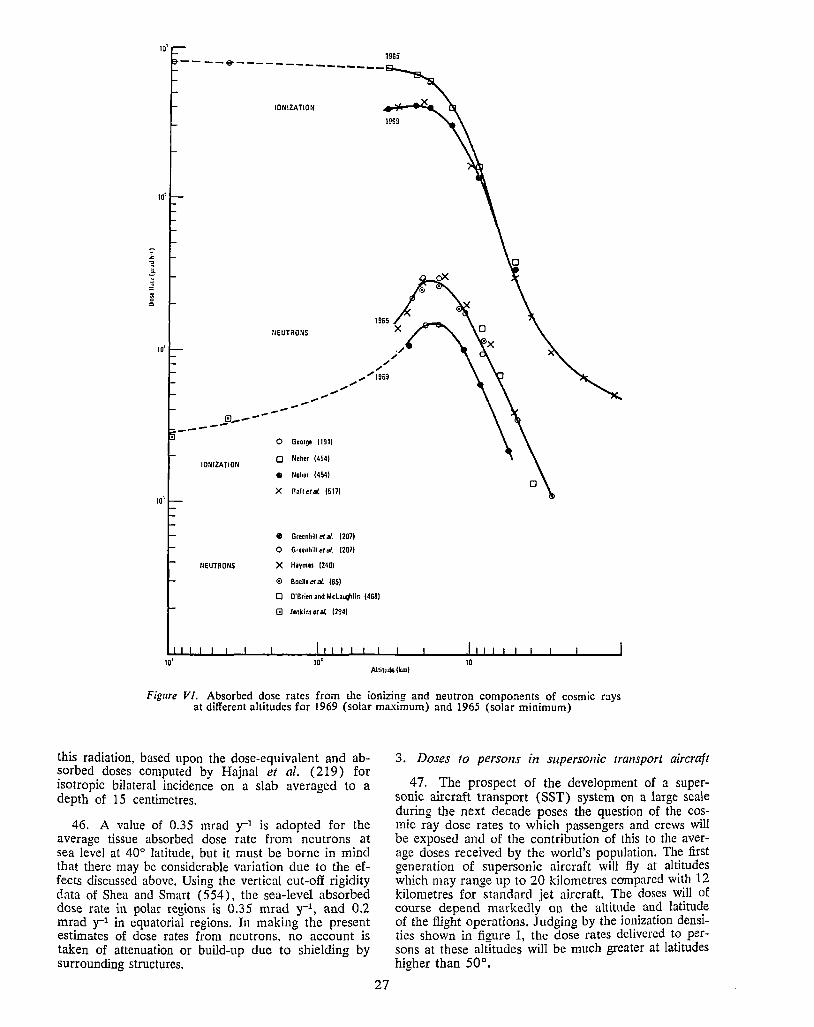
1965 ----~---------------IONIZATION
1969
10'
UEUTRONS
10' ./ ,, ,,
_..--- ..§1...---.,,..
IONIZATION
1/EUTROI/S
10'
,, ,... .... 1969
........
--- ........ ..,.,,, ....
0 George 1191)
O Neher (454)
• Neher (454)
X Rafi eta/, 1517)
e Groenhill et al, 1207)
0 G, eenhill et al. 1207)
X Haymes 1240)
® Boalla et al {65)
0 O'Brien and Mclaughlin {468)
0 Jinkins di al. (294)
10' 10 Altitude (km)
Figure VI. Absorbed dose rates from the ionizing and neutron components of cosmic rays at different altitudes for 1969 (solar maximum) and 1965 (solar minimum)
this radiation. based upon the dose-equivalent and absorbed doses computed by Hajnal et al. (219) for isotropic bilateral incidence on a slab averaged to a depth of 15 centimetres.
46. A value of 0.35 mrad y-1 is adopted for the average tissue absorbed dose rate from neutrons at sea level at 40° latitude, but it must be borne in mind that there may be considerable variation due to the effects discussed above. Using the vertical cut-off rigidity data of Shea and Smart (554), the sea-level absorbed dose rate in polar regions is 0.35 mrad y-1 , and 0.2 mrad y-1 in equatorial regions. In making the present estimates of dose rates from neutrons, no account is taken of attenuation or build-up due to shielding by surrounding structures.
27
3. Doses to persons in supersonic transport aircraft
47. The prospect of the development of a supersonic aircraft transport ( SST) system on a large scale during the next decade poses the question of the cosmic ray dose rates to which passengers and crews will be exposed and of the contribution of this to the average doses received by the world's population. The first generation of supersonic aircraft will fly at altitudes which may range up to 20 kilometres compared with 12 kilometres for standard jet aircraft. The doses will of course depend markedly on the altitude and latitude of the flight operations. Judging by the ionization densities shown in figure I the dose rates delivered to persons at these altitudes' will be much greater at latitudes higher than 50°.
48. When considering dose rates received by persons exposed at such high altitudes, it is necessary to discuss separately two contributions. In the first place are the background galactic cosmic rays, ever present, which vary in intensity by a factor of about two during the sun's 11-year solar cycle. Secondly, there may occasionally be large short-term increases in the radiation as a result of intense fluxes of solar protons originating from solar flares.
. 49. Estimates of the dose rates from both the ionizing and the neutron components of galactic cosmic rays at high latitude and at altitudes of 12 and 20 kilometres can be obtained from figure VI. These results for solar minimum are shown in table 5. It should be noted that neutron dose rates determined from wholebody 24Na burdens, compared with dose rates determined from surface monitors, indicate a considerable build-up in neutron flux density inside the human body (80, 546).
50. In order to determine dose rates at altitudes at which an SST might fly, Fuller and Clarke (185) made· measurements from balloons at 20 kilometres over Fort Churchill, Canada, in July 1964, near solar minimum. Their measurements indicated a dose rate from the ionizing component of 750 11rad lr1 • An average quality factor of 1.5 was established for this ionizing component from a study of tracks recorded in nuclear emulsion plates. The neutron rem counter indicated a doseequivalent rate from neutrons of 500 11rem h-1
• O'Brien and McLaughlin ( 469) concluded that this neutron dose-equivalent measurement corresponded to a surface dose in a phantom irradiated isotropically from above. Since the dose-equivalent rates per neutron cm-2 s-1
for monolateral isotropic incidence on a slab surface and for bilateral isotropic incidence averaged through 15 centimetres are, from table 3, 68 and 29 11rem h-1
,
respectively. the 500 ftfem h-1 of Fuller and Clarke reduces to 210 11rem h-1 for bilateral isotropic incidence averaged through 15 centimetres. With a quality factor of 6, this corresponds to 35 µ.rad 11-1, in reasonable agreement with figure VI.
51. Fuller and Clarke calculated the absorbed dose rate from nuclear stars recorded in the nuclear emulsion plates as 64 ft{ad h-1, with an average quality factor of 8.5. Because of the high quality factor, the dose rate resulting from stars is quite significant and h~s been included in table 5. The authors were not certa10 whether all or part of the dose rate from nuclear stars was recorded in the ionization chamber measurements or not. At the most, failure to subtract the contribution of stars from the ionizing component would overestimate the absorbed dose by 10 per cent. Using the maximum estimates for the absorbed dose rates sho\l.'ll in table 5 and assuming a quality factor of 1.0 for solar radiation, the total dose-equivalent rate at 20 kilometres altitude and at high latitude is 1,700 11rem h-1,
52. The average dose rates from solar particles are listed in the last column of table 5 (267). These estimates were made by the ICRP working group by averaging the effects of solar flares over the period 19 52-1960. It can be seen that at these altitudes the average contribution from this source is small compared with that from galactic cosmic rays. Although radiation of solar origin does not contribute significantly to the average dose rate, during an occasional intense solar flare radiation levels at these altitudes may increase by several orders of magnitude. For example, during the
28
giant solar flare of 23 February 1956, dose rates at 20 kilometres and at high latitude have been estimated to be as high as 0.2-0.6 rad h-1 (267). For this reason SST aircraft will carry radiation warning devices enabling the pilots to take evasive action by bringing the aircraft to lower altitudes when the dose rate reaches a prescribed action level. These giant solar flare events only last for about 10 hours and occur a few times in each solar cycle, and therefore are not likely to add significantly to the total dose burden .
53. The air speed of SST aircraft will be in the range 2,300-2,900 km h-1 compared with 800 km h-1 for conventional jets. A flight from Europe to North America will therefore take some two to three hours instead of the present eight hours. In a conventional jet aircraft cruising at an altitude of 12 kilometres the dose-equivalent rate is 600 µ.rem h-1 or 0.7 11rem km-1 •
In a supersonic aircraft cruising at an altitude of 20 kilometres, the dose-equivalent rate is 1,700 ft{em b-1,
which also corresponds approximately to 0. 7 µ.rem km-1•
54. Using the dose rates of cosmic rays given in table 5, the dose for an Atlantic crossing will be about 2 millirads in an SST compared with about 2.6 millirads for present-day jets. The latter figure does not include the dose contribution from nuclear stars. Thus we see, as was noted by Schaefer ( 546), that the doses per passenger-kilometre will not be very different in SST aircraft than they are at present and may be lower. However, the doses received by the crew of SST aircraft will depend on the number of hours flown and on the flight altitude and latitude, and may range up to a dose equivalent of 1 rem y-1. For the crews of conventional jet aircraft, flying 600 hours per year, the dose-equivalent rate is about 0.5 rem per year.
55. During 1970, some 4.6 1011 passenger-kilometres were flown at an average speed of 580 km 11-1,
throughout the world excluding China (265). An upper limit to the dose received from cosmic galactic radiation is 2.5 105 man-rads which corresponds to an average world population dose rate of about 0.1 millirad per year per person,
56. Schaefer (546) has investigated the contribution to doses at SST altitudes of the heavy-nuclei components of cosmic rays. These particles have a high LET and give rise to a so-called "micro-beam" irradiation. It was concluded that the "micro-beam" part of the heavy flux was virtually extinguished at SST altitudes.
II. Terrestrial radiation
A. INTERNAL IRRADIATION
57. Radio-active nuclides occurring in our natural environment enter the human body mainly through food and water, inhalation being of secondary importance, except for radon daughters. The dose rates to particular body organs are ideally derived from measured tissue concentrations, although an indirect estimation of the dose rates can be made from studies of the distribution of the radio-nuclides in the environment and in diet and from knowledge of their metabolic behaviour. Owing to the varying content of natural radio-active nuclides in the environment and in diet, the levels of radio-active intake, and therefore the corresponding concentrations in the human body, may vary from place to place for elements not subject
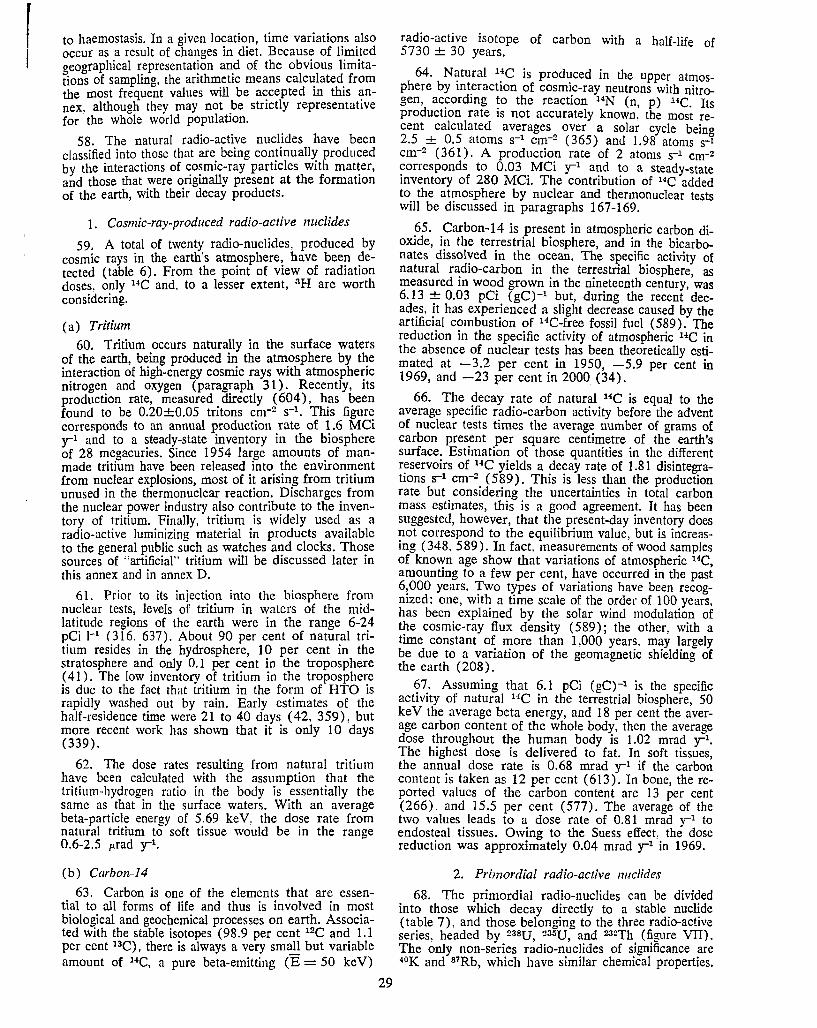
r to haemostasis. In a given location, time variations also occur as a result of changes in diet. Because of limited geographical representation and of the obvious limitations of samplino, the arithmetic means calculated from the most freque~t values will be accepted in this annex, although they may not _be strictly representative for the whole world populabon.
58. The natural radio-active nuclides have been classified into those that arc being continually produced by the interactions of cosmic-ray particles with matter, and those that were originally present at the formation of the earth, with their decay products.
l. Cosmic-ray-produced radio-active nuclides
59, A total of twenty radio-nuclides, produced by cosmic rays in the earth's atmosphere, have been detected (table 6). From the point of view of radiation doses, only 14C and, to a lesser extent, 3H are worth considering.
(a) Tritium 60. Tritium occurs naturally in the surface waters
of the earth, being produced in the atmosphere by the interaction of high-energy cosmic rays with atmospheric nitrogen and oxygen (paragraph 31). Recently, its production rate, measured directly ( 604), has been found to be 0.20±0.05 tritons cm-2 s-1 • This figure corresponds to an annual production rate of 1.6 MCi y-1 and to a steady-state inventory in the biosphere of 28 megacuries. Since 1954 large amounts of manmade tritium have been released into the environment from nuclear explosions, most of it arising from tritium unused in the thermonuclear reaction. Discharges from the nuclear power industry also contribute to the inventory of tritium. Finally, tritium is widely used as a radio-active luminizing material in products available to the general public such as watches and clocks. Tho~e sources of "artificial'' tritium will be discussed later m this annex and in annex D.
61. Prior to its injection into the biosphere from nuclear tests, levels of tritium in waters of the midlatitude regions of the earth were in the range 6-24 pCi 1-1 (316. 637). About 90 per cent of natural tritium resides in the hydrosphere, 10 per cent in the stratosphere and only 0.1 per cent in the troposphere ( 41). The low inventory of tritium in the troposphere is due to the fact that tritium in the form of HTO is rapidly washed out by rain. Early estimates of the half-residence time were 21 to 40 days (42. 359), but more recent work has shown that it is only 10 days (339).
62. The dose rates resulting from natural tritium have been calculated with the assumption that the tritium-hydrogen ratio in the body is essentially the same as that in the surface waters. With an average beta-particle energy of 5.69 keV. the dose rate from natural tritium to soft tissue would be in the range 0.6-2.5 ,,..rad y-1.
(b) Carbon-14
63. Carbon is one of the elements that are essential to all forms of life and thus is involved in most biological and geochemical processes on earth. Associated with the stable isotopes (98.9 per cent 12C and 1.1 per cent 13C), there is always a very small but variable amount of 14C, a pure beta-emitting (E = 50 keV)
29
radio-active isotope of carbon with a half-life of 5730 ± 30 years.
64. N~tural 1:C is prodl!ced in the upper atmosphere by mteract10n of cosmic-ray neutrons with nitrogen, according to the reaction 14N (n, p) HC. Its production rate is not accurately known, the most recent calculated averages over a solar cycle being 2.5 + 0.5 atoms s-1 cm-2 (365) and 1.98 atoms s-1 cm-2
( 361). A production rate of 2 atoms s-1 cm-2 corresponds to 0.03 MCi y-1 and to a steady-state inventory of 280 MCi. The contribution of 14C added to the atmosphere by nuclear and thermonuclear tests will be discussed in paragraphs 167-169.
65. Carbon-14 is present in atmospheric carbon dioxide, in the terrestrial biosphere, and in the bicarbonates dissolved in the ocean. The specific activity of natural radio-carbon in the terrestrial biosphere, as measured in wood grown in the nineteenth century, was 6.13 ± 0.03 pCi (gC)-1 but, during the recent decades, it has experienced a slight decrease caused by the artificial combustion of HC-free fossil fuel (589). The reduction in the specific activity of atmospheric 14C in the absence of nuclear tests has been theoretically estimated at -3.2 per cent in 1950, -5.9 per cent in 1969, and -23 per cent in 2000 (34).
66. The decay rate of natural 14C is equal to the average specific radio-carbon activity before the advent of nuclear tests times the average number of grams of carbon present per square centimetre of the earth's surface. Estimation of those quantities in the different reservoirs of 14C yields a decay rate of 1.81 disintegrations s-1 cnr2 (589). This is less than the production rate but considering the uncertainties in total carbon mass estimates, this is a good agreement. It has been suggested, however, that the present-day inventory does not correspond to the equilibrium value, but is increasing (348. 589). In fact. measurements of wood samples of known age show that variations of atmospheric 14C, amounting to a few per cent, have occurred in the past 6,000 years. Two types of variations have been recognized: one, with a time scale of the order of 100 years, has been explained by the solar wind modulation of the cosmic-ray flux density (589); the other, with a time constant of more than 1.000 years. may largely be due to a variation of the geomagnetic shielding of the earth ( 208).
67. Assuming that 6.1 pCi (gC)-1 is the specific activity of natural uc in the terrestrial biosphere, 50 keV the average beta energy, and 18 per cent the average carbon content of the whole body, then the average dose throughout the human body is 1.02 mrad y-1. The highest dose is delivered to fat. In soft tissues, the annual dose rate is 0.68 mrad y-1 if the carbon content is taken as 12 per cent ( 613). In bone, the reported values of the carbon content are 13 per cent (266). and 15.5 per cent (577). The average of the two values leads to a dose rate of 0.81 mrad y-1 to endosteal tissues. Owing to the Suess effect. the dose reduction was approximately 0.04 mrad y-1 in 1969.
2. Primordial radio-active ,we/ides
68. The primordial radio-nuclides can be divided into those which decay directly to a stable nuclide (table 7). and those belonging to the three radio-active series, headed by 2asu, :ia~u, and 23~Th (figure VII). The only non-series radio-nuclides of significance are 4°K and B7Rb, which have similar chemical properties.
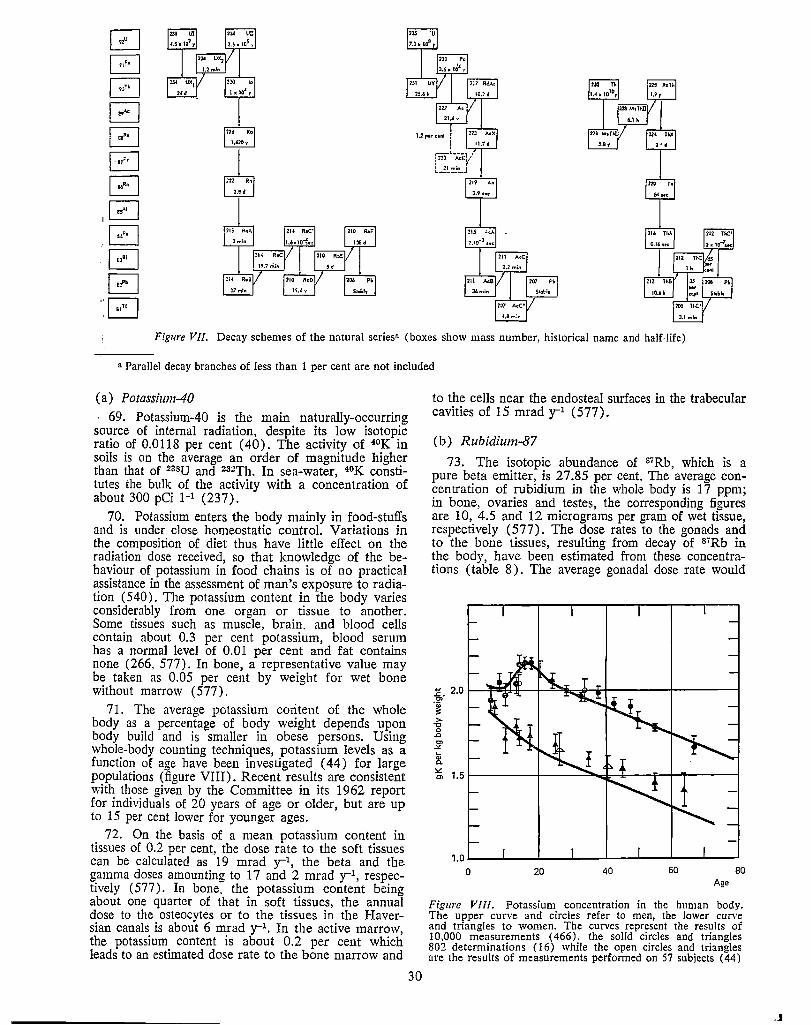
Figure VII. Decay schemes of the natural series• (boxes show mass number, historical name and half-life)
a Parallel decay branches of less than 1 per cent are not included
(a) Potassium-40
69. Potassium-40 is the main naturally-occurring source of internal radiation, despite its low isotopic ratio of 0.0118 per cent ( 40). The activity of 4°K in soils is on the average an order of magnitude higher than that of 2ssu and 232Th. In sea-water, 4°K constitutes the bulk of the activity with a concentration of about 300 pCi 1-1 (237).
70. Potassium enters the body mainly in food-stuffs and is under close homeostatic control. Variations in the composition of diet thus have little effect on the radiation dose received, so that knowledge of the behaviour of potassium in food chains is of no practical assistance in the assessment of man's exposure to radiation ( 540). The potassium content in the body varies considerably from one organ or tissue to another. Some tissues such as muscle, brain. and blood cells contain about 0.3 per cent potassium, blood serum has a normal level of 0.01 per cent and fat contains none (266. 577). In bone, a representative value may be taken as 0.05 per cent by weight for wet bone without marrow (577).
71. The average potassium coritent of the whole body as a percentage of body weight depends upon body build and is smaller in obese persons. Using whole-body counting techniques, potassium levels as a function of age have been investigated ( 44) for large populations (figure VIII). Recent results are consistent with those given by the Committee in its 1962 report for individuals of 20 years of age or older, but are up to 15 per cent lower for younger ages.
72. On the basis of a mean potassium content in tissues of 0.2 per cent, the dose rate to the soft tissues can be calculated as 19 mrad y-1, the beta and the gamma doses amounting to 17 and 2 mrad y-1, respectively (577). In bone. the potassium content being about one quarter of that in soft tissues, the annual dose to the osteocytes or to the tissues in the Haversian canals is about 6 mrad y-1. In the active marrow, the potassium content is about 0.2 per cent which leads to an estimated dose rate to the bone marrow and
30
to the cells near the endosteal surfaces in the trabecular cavities of 15 mrad y-1 (577).
(b) Rubidium-87
73. The isotopic abundance of 87Rb, which is a pure beta emitter, is 27 .85 per cent. The average concentration of rubidium in the whole body is 17 ppm; in bone, ovaries and testes, the corresponding figures are 10, 4.5 and 12 micrograms per gram of wet tissue, respectively (577). The dose rates to the gonads and to the bone tissues, resulting from decay of S7Rb in the body, have been estimated from these concentrations ( table 8). The average gonadal dose rate would
... 2;.
~ 1.5 l-----l----'3o,dl:--,l,----f--t-4'------1
0 20 40 60 80 Age
Figure V /JI. Potassium concentration in the human body. The upper curve and circles refer to men, the lower curve and triangles to women. The curves represent the results of 10,000 measurements ( 466), the solid circles and triangles 802 determinations ( 16) while the open circles and triangles are the results of measurements performed on 57 subjects ( 44)
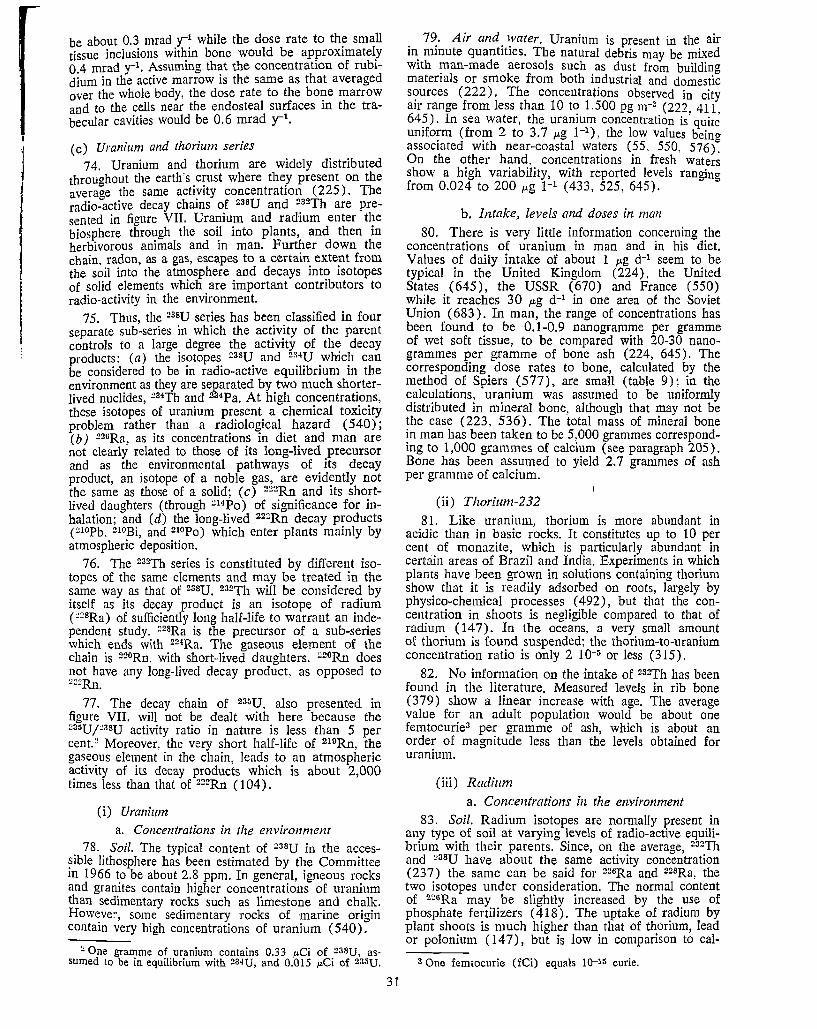
be about 0.3 mrad y-1 while the dose rate to the small tissue inclusions within bone would be approximately 0.4 mrad y-1 • Assuming that the concentration of rubidium in the active marrow is the same as that averaged over the whole body, the dose rate to the bone marrow and to the cells near the endosteal surfaces in the trabecular cavities would be 0.6 mrad y--1 •
(c) Uranium and thorium series 74. Uranium and thorium are widely distributed
throuahout the earth's crust where they present on the avera;e the same activity concentration (225). The radio.'."active decay chains of 238U and 232Tb are presented in figure VII. Uranium and radium enter the biosphere through the soil into plants, and then in herbivorous animals and in man. Further down the chain, radon, as a gas, escapes to a certain extent from the soil into the atmosphere and decays into isotopes of solid elements which are important contributors to radio-activity in the environment.
75. Thus, the 238U series has been classified in four separate sub-series in which the activity of the parent controls to a large degree the activity of the decay products: (a) the isotopes 238U and 2;HU Which Can be considered to be in radio-active equilibrium in the environment as they are separated by two much shorterlived nuclides, ~34Th and 234Pa. At high concentrations, these isotopes of uranium present a chemical toxicity problem rather than a radiological hazard (540); ( b) 226Ra, as its concentrations in diet and man are not clearly related to those of its long-lived precursor and as the environmental pathways of its decay product, an isotope of a noble gas, are evidently not the same as those of a solid; ( c) 2 ~2Rn and its shortlived daughters (through 214Po) of significance for inhalation; and (d) the long-lived 22:Rn decay products (!!10Pb, 210Bi, and 210po) which enter plants mainly by atmospheric deposition.
76. The 232Tb series is constituted by different isotopes of the same elements and may be treated in the same way as that of 238U. 232Th will be considered by itself as its decay product is an isotope of radium e28Ra) of sufficiently long half-life to warrant an independent study. :!28Ra is the precursor of a sub-series which ends with 224Ra. The gaseous element of the chain is 220Rn, with short-lived daughters. !.!20Rn does not have any long-lived decay product, as opposed to ~2"Rn.
77. The decay chain of 235U. also presented in figure VII, will not be dealt with here because the 235UP38U activity ratio in nature is less than 5 per cent.~ Moreover, the very short half-life of 219Rn, the gaseous element in the chain, leads to an atmospheric activity of its decay products which is about 2,000 times less than that of 222Rn (104) .
(i) Uranium a. Concentrations in the environment
78. Soil. The typical content of :::asu in the acces~ible lithosphere has been estimated by the Committee m 1966 to be about 2.8 ppm. In general, igneous rocks and granites contain hi!ilier concentrations of uranium than sedimentary rocks~ such as limestone and chalk. However, some sedimentary rocks of marine ori!!in contain very high concentrations of uranium ( 540) ~
2 One gramme of uranium contains 0.33 /LCi of 2asu, assumed to be in equilibrium with 2,'HU, and 0.015 /LCi of 2aou.
31
. 7~. Air and. ~vater. Uranium is present in the air ~ mmute quant1t1es. The natural debris may be mixed with ?Jan-made aerosols such as dust from building materials or smoke from both industrial and domestic sources ( 222) . The concentrations observed in city air range from less than 10 t~ 1,500 pg nr3 (222, 411, 64?). In sea water, the uramum concentration is quite uniform (from 2 to 3.7 µ.g 1-1), the low values beina associated with near-coastal waters (55, 550, 576t On the other hand, concentrations in fresh waters show a high variability, with reported levels ranging from 0.024 to 200 µ.g 1-1 (433, 525, 645).
b. Intake, levels and doses in man
80. There is very little information concerning the concentrations of uranium in man and in his diet. Values of daily intake of about 1 p.g d-1 seem to be typical in the United Kingdom (224), the United States (645), the USSR (670) and France (550) while it reaches 30 µ.g d-1 in one area of the Soviet Union (683). In man, the range of concentrations has been found to be 0.1-0.9 nanogramme per gramme of wet soft tissue, to be compared with 20-30 nanogrammes per gramme of bone ash (224, 645). The corresponding dose rates to bone, calculated by the method of Spiers (577), are small (table 9); in the calculations, uranium was assumed to be uniformly distributed in mineral bone, although that may not be the case (223, 536). The total mass of mineral bone in man has been taken to be 5,000 grammes corresponding to 1,000 grammes of calcium ( see paragraph 205). Bone has been assumed to yield 2. 7 grammes of ash per gran1me of calcium.
(ii) Thorium-232 81. Like uranium. thorium is more abundant in
acidic than in basic rocks. It constitutes up to 10 per cent of monazite, which is particularly abundant in certain areas of Brazil and India. Experiments in which plants have been grown in solutions containing thorium show that it is readily adsorbed on roots, largely by physico-chemical processes ( 492), but that the concentration in shoots is negligible compared to that of radium ( 14 7). In the oceans, a very small amount of thorium is found suspended; the thorium-to-uranium concentration ratio is only 2 10-a or less (315).
82. No infonnation on the intake of 232Th has been found in the literature. Measured levels in rib bone ( 3 79) show a linear increase with age. The average value for an adult population would be about one femtocurie3 per gramme of ash, which is about an order of magnitude less than the levels obtained for uranium.
(iii) Radium
a. Concentrations in the environment 83. Soil. Radium isotopes are normally present in
any type of soil at varying levels of radio-active equilibrium with their parents. Since, on the average, 232Tb and ~38U have about the same activity concentration (237) the same can be said for 226Ra and 22sRa, the two isotopes under consideration. The normal content of 226Ra may be slightly increased by the use of phosphate fertilizers ( 418). The uptake of radium by plant shoots is much higher than that of thorium, lead or polonium (14 7), but is low in comparison to cal-
3 One femtocurie (fCi) equals 10--15 curie.
cium (328). An exception to that _rule is constitu~ed by the Brazil-nut tree (Ber.tholletz~ excelsa) w~1ch accumulates radium, along with banu~, preferentially to calcium in some tissues of the fruit ( 494, 540), although the soil on which it has been observed to grow does not have an elevated content of radium.
84. Air. The natural background concentration is constituted by the airborne particulate matter picked up from the earth. In city air ( 222), it can be estimated at around seven attocuries4 per cubic metre, if it is assumed that uranium and radium have the same activity in the atmosphere. Fossil-fuelled power plants release very small amounts of radium, which may be detectable in the air around those installations ( 404). The maximum activity of 226Ra dispersed each year by the combustion of coal has been estimated at 150 curies (291).
85. Ocean water. In ocean surface water, the 2 ~0Ra content is low and relatively constant, with a value of about 0.05 pCi 1-1 (83, 597). It is primarily supplied by diffusion from 230Tu-bearing deep-sea sediments ( 83). Similarly, 22BRa diffuses from 232Th sediments and is relatively abundant in waters in contact with terrigenous sediments ( 434) but even there it is in a lower concentration than 226Ra.
86. Fresh water. In fresh waters, the 226Ra content is highly variable, typical figures ranging from 0.01 to 1 pCi 1-1 (26, 139, 433). The highest concentrations, ranging up to 100 pCi 1-1, are found in mineral waters (139, 245, 508). Those drinking-water supplies drawn from surface waters do not in general contain significant amounts of radium. Flocculation and watersoftening processes remove the bulk of the radium activity from water.
b. Transfer to man
i. Areas of normal external-radiation background
87. The average daily intake of 226Ra in areas of normal radiation background has been found to be about 1 pCi (gCa)-1 in the United States, in the United Kingdom, in Argentina, in India, in the USSR, and in France (table 10). In the Soviet Union, a study conducted in one of the cities of Central Asia showed a high 2"6Ra intake of 17 pCi (gCa)-1 explained partly by unusually high levels of 226Ra in water and in bread (676). Individual intakes are increased when food items which have high concentration factors are consumed; levels of 226Ra and 228Ra in Brazil nuts may reach several thousands of picocuries per kilogramme ( 494) while Pacific salmon, which is eaten in large quantities by Eskimos and North American Indians, contain about 20 pCi kg-1 of 2~6Ra (293). The 228Ra daily intake is not well known but the few existing measurements (table 10) seem to indicate that it is more than half of that of ~20Ra.
88. About 80-85 per cent of radium is contained in the skeleton, the remaining fraction being distributed approximately uniformly in soft tissues. World-wide variations in ~~6Ra skeletal burdens in areas of normal rate of intake are not large and show a spread between 4 and 40 fCi (g ash)-1 in different localities (table 11) with an arithmetic average of 14 fCi (g ash)-1 or about 40 picocuries per skeleton. The average ratio between
4 One attocurie (aCi) equals 10-1s curie.
32
activities of 228Tb and 226Ra in bone ash was found to vary between 0.25 and 0.5 (256, 380, 582) which, assuming radio-active equilibrium between 228Ra and 22sTh in bone, leads to an estimated upper lilnit of skeletal burden of 20 picocuries of 22BRa in normal areas.
ii. Areas of high external-radiation background
89. People living on food-stuffs grown in areas of high natural radio-activity have daily intakes well above normal values but indications on their body burdens are very limited. The Indian population along the Kerala coast, including the monazite-bearing high-radiation belt, has an estimated per caput intake of 228Ra of 162 pCi d-1 ( 424); the corresponding figure for 226Ra is only 2.85 pCi d-1 ( 110). The analysis of a femur bone yielded a 226Ra concentration of 143 fCi (g ash)-1•
90. In Brazil, a survey in the Araxa-Tapira region (495) showed that, out of a population of 1,670 people living in or around the radio-active anomalies of Barreiro and Tapira, only 196 individuals are ingesting alpha emitters at a level five times or more than that of a similar group living in Rio de Janeiro. Their intake of radium ranged from 60 to 240 pCi d-1 of 2~8Ra and 10 to 40 pCi d-1 of 226Ra. The mean concentration of 226Ra in ashed teeth of the population living in that area is 85 fCi g-1 ( 496); as the level of 226Ra in teeth is approximately equal to that in bone (375), the result leads to an estimated skeletal burden of 230 picocuries.
91. In Guarapari, body burdens of 208TI, a decay product of 228Ra, are of the order of 10 nanocuries (132). Since the levels in food are normal and the 2 ~0Rn concentrations in breath are elevated, this high burden probably results from inhalation of fine dust particles containing the precursors of 220Rn.
c. Dose rates
92. The fraction of radon retained by the various organs of the body after decay of radium has to be taken into account when computing the doses. The half-life of 220Rn is sufficiently short so that most of it decays where it is produced; however, some is detectable in the breath. In the case of 222Rn, the Committee adopted, in its 1966 report, an average skeleton retention factor of 0.33, but it has been shown that this factor is not constant at all sites (507). In soft tissues, a conservative assumption is that the ~2~Rn retention is the same as in bone (577). The annual alpha doses from 2~6Ra and 22sRa and their daughters, as calculated by the method of Spiers ( 577), are presented in table 9.
(iv) Radon-222, Radon-220, and their shortlived decay products
a. Concentrations in the environment
i. Outdoor ground-level air
93. 22~Rn, 2~0Rn and their short-lived decay products constitute the main part of the radio-activity of ground-level air. The continents are the principal source of 2~2Rn and ::20Rn. as the ratio of the emanation rate from the continents and from the oceans is about 500 for .222Rn ( 82, 485), and probably much higher for 220Rn. The diurnal variation of the atmospheric 222Rn concentration near the ground is inversely related to the coefficient of vertical turbulent mixing (398). Con-
..
sequently, the typical diurnal 222Rn concentration curve bas a maximum in the early morning hours and a minimum in the afternoon (25. 179. 485. 548. 549). The ratio of the maximum to the minimum values is highest in the summer (10 or more) and lowest in the winter (549).
94. The short-lived decay products ( 21BPo, 214Pb, 2HBi 21-1po) are never strictly in equilibrium with 22~R~ in surface air because of losses by deposition on the ground and on other obstacles and/ or because of rapid diffusion of "2~Rn (73, 179). The activity ratio with 222Rn is, in most ca~es, in the range 0.9-1.0 for 21spo and 0.4-1.0 for 214P0 and 214Bi, the lowest ratio occurring in the evenings and during the first half of the night, depending on the local stability conditions in the lower atmosphere. Equilibrium is most closely approached in the morning (179, 3 9 8) .
95. On a seasonal basis, variations of 222Rn in the air above the continents depend not only upon atmospheric thermal stability (362, 397), but also upon the variation of the rate of emanation from soils ( 125, 406) and upon local meteorological conditions and distance from coast ( 442). The average annual values from different parts of the world ( table 12) show the high variability of the 222Rn concentrations.
96. 220Rn (thoron) and its daughters behave in the atmosphere in the same way as 22~Rn and its decay products. However, their radio-active half-lives are very different and the emanation rate of 220Rn from soils is the main factor controlling 220Rn concentrations in ground-level air. In recent years, the 220Rn-emanation rate from soils has been directly measured by several workers (129, 212, 277, 588). Their results are in the range 2.5-14.0 fCi cm-2 s-1, which is consistent with Junge's estimated value of 5.6 fCi cm-2 s-1 based on the world-wide abundance of 232Tb (301). Atmospheric 220Rn comes from the top six-centimetre layer of soil (588), and the exhalation is very sensitive to the soil moisture (212, 277, 588). It is much reduced if the soil is frozen and negligible if the soil is covered with snow. In dry weather the rate of emanation is highest at sunset, when convective streams develop in the soil due to the rapid cooling of its surface, and lowest at sunrise (212, 588).
97. In normal emanation conditions, the 220Rn concentrations one metre above ground level are of the same order as those of 222Rn (0.04-0.4 pCi 1-1) (179, 276). The distance covered by a 220Rn atom between the point where it emanates from the ground and the point where it disintegrates being less than a kilometre ( 212), ~20Rn levels are determined by the local source and by the degree of stability of the lower layers of the atmosphere. The diurnal variation, as measured by Israel (275), exhibits a primary peak in the evening and a secondary one in the early morning. Because of the long half-life of mpb, the daughter products of 220Rn, :mpo excepted. are in much lower concentrations (by a factor of 10 to 100) than 220Rn near ground level (179, 5 64).
ii. Indoor levels
. 98. The air concentration of 222Rn and its daughters mdoors depends upon the concentration in outside air, upon the 222Rn emanation rate from the walls, and upon the ventilation rate in the room. Table 13 shows the results of measurements carried out in various countries.
33
99. ~!2~Rn concentrations are usually higher indoors than outdoors; they are expected to be close to the values found outside if the rooms are efficiently ventilated. as in air-conditioned buildin2.s. or if the emanation rate fro.m the walls and the floor is low, as may be the case m wooden houses. High concentrations are found in rooms with very poor ventilation. for example in some basements, where the ~2~Rn level will be proportional to the emanation rate from the walls, which in turn varies according to such parameters as the origin, nature, and porosity of the building material, and the type of paint or covering layer ( 649, 680). Between those extremes, avernge concentrations several times higher than those recorded outside are observed in naturally-ventilated brick. aggregate. or concrete buildings, the measured levels being sensitive to the actual degree cf ventilation, which is connected to the individual habits of the inhnbilants, and to the emanation rate from the walls (227, 498).
100. ':fhe degr:ee of rguilibrium of the 222Rn decay products mdoors 1s expr::ted to be ruled by the ventilation rate, the equilitrium t~ing nearly reached in rooms with poor ventilatioI', and highly perturbed in efficiently ventilated buildings. In naturally-ventilated rooms the equilibrium conditions rhould be about the sam'e as outside (555).
101. Indoor concentrations of 220Rn and of its decay products are net likely to be higher than outdoors as papering er painting the walls prevents significant releases of 220Rn on account of its short half-life. However, high concentrations have been observed in houses in monazite sand regions of Brazil ( 492).
iii. Water
102. Well away from the air-sea and sediment-sea interfaces, the activity concentration of 222Rn in oceans is equal to that of its parent, 2~6Ra. Even though its emanation rate is small, 222Rn is not in equilibrium with 226Ra near the surface. Its mean concentration at a depth of one metre is around 0.02 pCi 1-1 ( 81, 84). In fresh waters 222Rn levels do not show any relation with the :.!~6Ra levels. Their concentrations range from less than 1 pCi 1-1 in some surface waters to more than 5 105 pCi 1-1 in certain spa waters ( 111). A few nanocuries per litre seems to be a typical activity concentration for ground water (302, 571, 638). Boiling will remove most of the 222Rn from water.
b. Transfer to man and doses
i. Inhalation
103. The radiation dose to the respiratory tract due to inhalation of 220Rn and 22~Rn is negligibly small compared with that due to inhalation of their decay products. which deposit and build up in the respiratory system. The 222Rn daughters are believed to be responsible for the greater rate of lung cancer among the underground uranium miners than among the general population ( 169). Since the observed lung cancers appear to arise primarily in the bronchi near the hilus of the lung, most authors concerned with the dosimetric aspect of the inhalaticn of radon daughters assume the relevant biological target to be the basal-cell layer of the bronchial tree and take into account a detailed structure of the deposition pattern along the respiratory tract. In order to calculate the dose received by the different parts of the respiratory system, the fol-
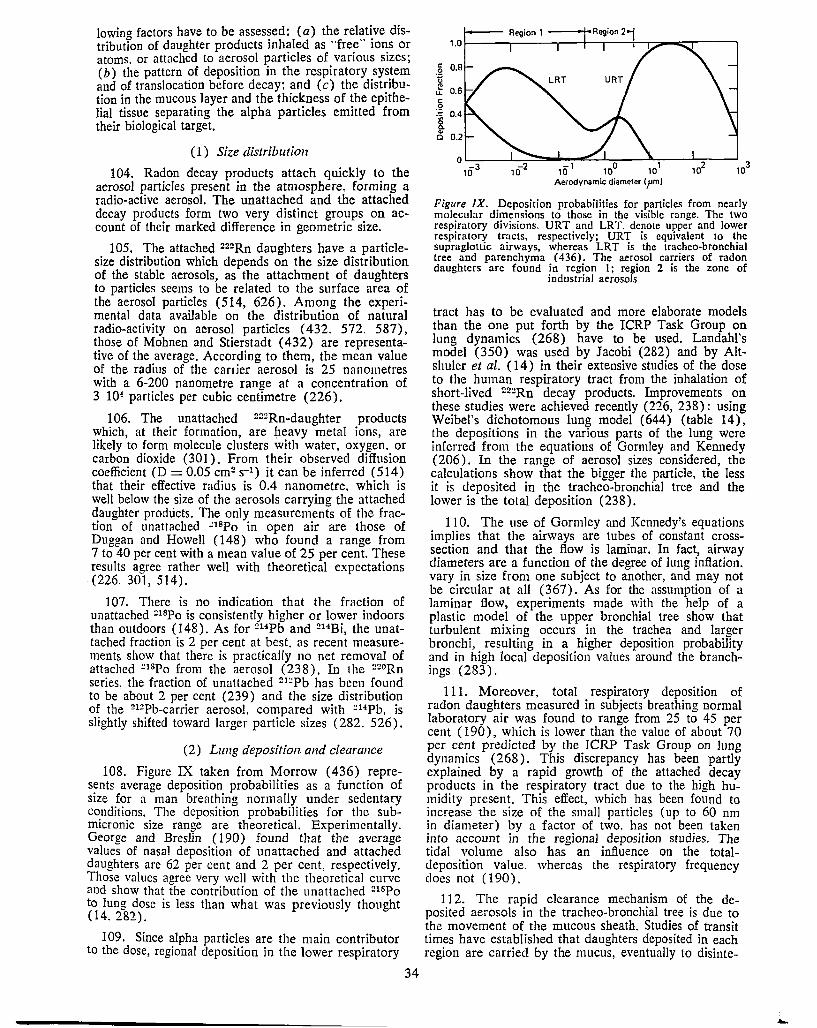
lowine: factors have to be assessed: (a) the relative distribution of daughter products inhaled as '·free" ions or atoms. or attached to aerosol particles of various sizes; ( b) the pattern of deposition in the respiratory system and of translocation before decay; and ( c) the distribution in the mucous layer and the thickness of the epithelial tissue separating the alpha particles emitted from their biological target.
( 1) Size distribution
104. Radon decay products attach quickly to the aerosol particles present in the atmosphere, forming a radio-active aerosol. The unattached and the attached decay products form two very distinct groups on account of their marked difference in geometric size.
105. The attached 222Rn daughters have a particlesize distribution which depends on the size distribution of the stable aerosols, as the attachment of daughters to particles seems to be related to the surface area of the aerosol particles (514, 626). Among the experimental data available on the distribution of natural radio-activity on aerosol particles ( 432. 572. 587), those of Mohnen and Stierstadt (432) are representative of the average. According to them, the mean value of the radius of the carder aerosol is 25 nanometres with a 6-200 nanometre rane:e at a concentration of 3 104 particles per cubic centimetre (226).
106. The unattached 222Rn-daughter .products which, at their formation, are ],wavy metal ,ons, are likely to form molecule clusters with water, oxygen, or carbon dioxide (301 ). From their observed diffusion coefficient (D = 0.05 cm2 s-1 ) it can be inferred (514) that their effective radius is 0.4 nanometre, which is well below the size of the aerosols carrying the attached daughter products. The only measurements of the fraction of unattached ~18Po in open air are those of Duggan and Howell (148) who found a range from 7 to 40 per cent with a mean value of 25 per cent. These results agree rather well with theoretical expectations (226. 301, 514).
107. There is no indication that the fraction of unattached 218Po is consistently higher or lower indoors than outdoors (148). As for 214Pb and 214Bi, the unattached fraction is 2 per cent at best. as recent measurements show that there is practically no net removal of attached !!18Po from the aerosol ( 23 8) . In the 220Rn series. the fraction of unattached 21 :!Pb has been found to be about 2 per cent (239) and the size distribution of the 212Pb-carrier aerosol. compared with 2 HPb, is slightly shifted toward larger particle sizes (282. 526).
(2) Lung deposition and clearance
108. Figure IX taken from Morrow (436) represents average deposition probabilities as a function of size for a man breathing normally under sedentary conditions. The deposition probabilities for the submicronic size range are theoretical. Experimentally. George and Breslin ( 190) found that the average values of nasal deposition of unattached and attached daughters are 62 per cent and 2 per cent, respectively. Those values agree very well with the theoretical curve and show that the contribution of the unattached 218Po to lung dose is less than what was previously thought (14, 282). ~
109. Since alpha particles are the main contributor to the dose, regional deposition in the lower respiratory
34
g 0.8
·~ u. 0.6 C 0 l 0.4
o 0.2
t--- Region 1 ---
Figure IX. Deposition probabilities for particles from nearly molecular dimensions to those in the visible range. The two respiratory divisions, URT and LRT. denote upper and lower respiratory tracts, respectively; URT is equivalent to the supraglottic airways, whereas LRT is the tracheo-bronchial tree and parenchyma ( 436). The aerosol carriers of radon daughters are found in region I; region 2 is the zone of
industrial aerosols
tract has to be evaluated and more elaborate models than the one put forth by the ICRP Task Group on lung dynamics (268) have to be used. Landahl's model (350) was used by Jacobi (282) and by Altshuler et al. (14) in their extensive studies of the dose to the human respiratory tract from the inhalation of short-lived 222Rn decay products. Improvements on these studies were achieved recently (226, 238): using Weibel's dichotomous lung model (644) (table 14), the depositions in the various parts of the lung were inferred from the equations of Gormley and Kennedy ( 206). In the range of aerosol sizes considered, the calculations show that the bigger the particle, the less it is deposited in the tracheo-broncbial tree and the lower is the total deposition (238).
110. The use of Gormley and Kennedy's equations implies that the airways are tubes of constant crosssection and that the flow is laminar. In fact, airway diameters are a function of the degree of lung inflation, vary in size from one subject to another, and may not be circular at all (367). As for the assumption of a laminar flow, experiments made with the help of a plastic model of the upper bronchial tree show that turbulent mixing occurs in the trachea and larger bronchi, resulting in a higher deposition probability and in high local deposition values around the branchings (283).
111. Moreover, total respiratory deposition of radon daughters measured in subjects breathing normal laboratory air was found to range from 25 to 45 per cent ( 190), which is lower than the value of about 70 per cent predicted by the TCRP Task Group on lung dynamics (268). This discrepancy has been partly explained by a rapid growth of the attached decay products in the respiratory tract due to the high humidity present. This effect, which has been found to increase the size of the small particles (up to 60 nm in diameter) by a factor of two. has not been taken into account in the regional deposition studies. The tidal volume also has an influence on the totaldeposition value, whereas the respiratory frequency does not ( 190).
112. The rapid clearance mechanism of the deposited aerosols in tl1e tracheo-bronchial tree is due to the movement of the mucous sheath. Studies of transit times have established that daughters deposited in each region are carried by the mucus, eventually to disinte-
orate at a site nearer to the mouth. However, in termi~al bronchioles. the mucus transit time is so long that the decay products are assumed to disintegrate at the deposition site.
113. Because of the Ion~ half-lives of ~~0Rn daughters lung clearance mechanisms will play an important role'. More than 90 per cent of the ~12Pb atoms deposited in the bronchial tree are eliminated by swalJowinrr before their decay ( 436). Those deposited in the pulmonary region are transferred to the blood with a biological half-life of around I O hours ( 71. 257, 282) which means that about half of the potential decay energy of 112Pb is expended outside the lung, whereas the corresponding figure for 214Pb is only 4 per cent. In the blood, about one half of the 2 12Pb atoms are fixed by the circulating red cells and the other half distributed to other tissues (258).
(3) Distance to the biological target
114. The dose rate to the basal cells of the epithelial tissue depends on the distribution of the daughter products in the mucous layer and on the thickness of the epithelial tissue. The alpha-stopping power in tissue. as inferred from measurements of attenuation in polycarbonate or in gas mixtures, shows a remarkable agreement with the theoretical stopping powers and can be considered to be precisely known (238).
115. The distribution of 2~2Rn daughters within the mucous layer of rabbits and dogs has been recently determined ( 669). For rabbit trachea the mucous thickness was 10 micrometres. In the dog trachea and bronchus, 30 per cent of the total 2HPo activity was found in the first two micrometres of mucus. Activity was estimated to extend throughout the layer with no cut-off point below the surface. Although these data may not strictly apply to the human respiratory tract, they suggest that most of the activity may stay in the top half of the mucous layer. the total thickness of which is about 14 micrometres in man (14).
116. The measured thicknesses of the epithelial bronchial tissues of a single adult man were found to vary considerably in each class of bronchus. In segmental bronchi, an exceptionally low value of thickness was 29 micrometres and the median thickness 56 micrometres. Assuming a distance of 7 micrometres from the basal cell nuclei to the basement membrane, the radon daughter products present in the segmental bronchi are on the average about 60 micrometres away from the basal cell nuclei but may be as close as 22 micrometres if the tissue is exceptionally thin. These dimensions are to be compared with the alpha-particle ranges of :!18Po and ~14Po, which are 47 and 71 micrometres, respectively.
(4) Doses
117. The models predict that the basal-cell nuclei which receive the highest dose in the trachea-bronchial tree are those of the segmental bronchi, which is the region of known cancer incidence among uranium miners. Table 15 presents calculated (226) dose rates to the basal-cell layer of that area for various environments as a function of the distance from the basal cells to the 222Rn daughters present in the mucous layer. The values correspond to mouth breathing with an inhalation rate of 10.4 1 min-1 in the living accom!llodation and 20.8 1 min-1 at the working site. Assummg that the average distance from the basal cells to the
35
~~1 Rn daughters is 60 micrometres, the annual radiation doses. calculated as the sum of the doses received in the living accommodation and at the working site, are in the range 55-195 mrad y-1, but they might be as high as 52~ or as low as 2 mrad y-1 if that distance is 45 or 70 micrometres. Therefore. wide variations will occur locally because of the variability in the thickness of the bronchial epithelium and also because of the nonunif?rm deposition pattern of the radon daughters, but 1t cannot be stated whether those variations affect the over-all hazard to the trachea-bronchial tree as the highest local dose rates are cf the order of 1 rad y-1
only. It should be noted that the annual dose averaoed over the mass of the tracheo-bronchial tree is ab~ut 15 millirads.
118. The dose rate to the alveolar region is of the order of 5 mrad y-1 : it is avera2ed over the mass of the alveolar tissue as the thickness of the walls of the alveoli and the diameter of the blood capillaries are s!Uall compared to the range of the alpha particles cons1de~ed. The doses to organs and tissues outside the respiratory system, presented in table 16. have been measured in guinea-pigs ( 511); as the ventilation volume and the weight of blood are almost the same for 1:1an and for. guinea-pig when divided by their respective body weight ( 510). the results are an estimate of the doses in man. The doses to all organs and tissues are much lower than the dose to the alveoli.
119. The doses received from inhalation of 220Rn
and its decay products are much lower than those due to 222Rn daughters and have been the object of less attention. As in the case of 2~2Rn. the h12hest dose delivered is that to the segmental bronchi. b~t the dose to the . alveoli is less by only a factor of five (282). Assummg that the mean indoors ccncentration of 212Pb and 212Bi is 3 fCi 1-1 , the avera2e dcse rate to the basal-cell nuclei of the segmental bronchi is calculated as 4 mrad y-1 while the dose rate to the alveolar tissue i~ 0.8 mrad y-1 • The doses to tbe other organs and t1ssue.s, as. estimated from experiments on guinea-pigs, are given m table 16 (510).
ii. Ingestion
120. As mentioned by the Committee in its 1966 report. the ingestion of one microcurie of 222Rn dissolved in water leads to a dose to the stomach of about 20 millirads. the doses to the other organs being lower by at least an order of magnitude. Assuming a consumption of 0.3 1 d-1 of fresh water containing 1 nCi 1-1, the annual dose to the stomach is about 2 millirads. Another, but much lower, source of ~2~Rn is milk, which in Sweden was found to contain about 40 times less 221Rn than drinking water (364, 389).
(v) Radon-222 long-lived decay products
a. uopb and 210Po in the environment
121. The main source of 210Pb and its decay product 210Po in the atmosphere is 22~Rn which emanates from the ground. The average concentration of 210Pb in ground-level air at a given locality depends on the 2~2Rn-emanation rate at that point and on the global pattern of air circulation. The observed concentrations are higher above the continents and in the northern middle latitudes, where the proportion of the land surfaces from which 222Rn emanates is 11:reater than in the other latitude bands. For some locations, 210Pb
levels exhibit a seasonal variation with maximum values in winter explained either by the occurrence of long periods of stable air masses (298. 299) or by other climatological factors (557). The 210Pb/"~2Rn activity concentration ratios found at a site in the Soviet Union (25) are fairly constant and lie in the range 0.5 J0-4-1 10-4 • The average values of this ratio for ~other locations vary from 0.2 10-4 to 2.5 104
( 484). The 210Po/210Pb activity concentration ratios in ground-level air usually range from 0.05 to 0.30 but ratios greater than unity are found in industrial regions ( 487), which implies that a significant amount of 210Po is released from coal burning. It is estimated ( 487) that in the latitude zone between 40° N and 60° N, the quantity of "artificial" 210Po is about 10 to 20 per cent of that arising naturally. Karol ( 312) calculated that the total contents of 210Pb and 210Po in the atmosphere are from 20 to 26 and from 2.4 to 5.7 kilocuries, respectively. There is no thorough study of the average size of the aerosols to which 210Pb and 210Po are attached. This size has been reported to be intermediate between that of short-lived :!~2Rn daughters and that of long-lived fission products (371). Skewed distributions have been found with 120 and 160 nanometres as geometric mean diameters (559).
122. The annual rain deposition rate of 210Pb, measured in the United Kingdom ( 4 89), in India (299), and in New Zealand (447), is on the average of 3 mCi Ian-2, which implies an activity of about 80 mCi 1an-2 in the upper layers of the soil under equilibrium conditions. The levels of 210Pb in rainwater are of the order of 1-5 pCi 1-1 (289, 489) while those of 210Po are 5 to 10 times less (96, 399). The mean residence time of 210Pb in the troposphere, calculated from the 210PoP10Pb-activity-concentration ratio under the assumption that there is no shmificant ground-level source of 210Po has been found to be of the order of 10 days (181). In surface waters, the 210Pb concentrations are lower by a factor of 10 to 100 than those usually found in rainwater; however, concentrations in 222Rn-rich waters such as mineral waters or some well waters may reach the levels found in rainwater (288 571 ). '
b. Intake by man i. Inhalation
123. The averaire concentrations of 210Pb and 210po in ground-level air in the northern middle latitudes are around 15 and 1.5 fCi m-3, respectively. Assuming an intake of 20 cubic metres of air in 24 hours, 0.3 picocurie of 210Pb and 0.03 picocurie of nopo are thus inhaled every day. Using a coefficient of transfer to the blood of 0.30 ( 437), the amounts of 21 opb and :.!lDPo reaching the blood are less than 0.1 pCi d-1. An additional intake may result from cigarette smoking: (171, 250). Both 210Pb and :.!iopo are present in cigarette smoke, 210Po beill!! more abundant because of its higher volatility. Smoking 20 cigarettes a day leads to a daily intake of 0.3-0.8 picocurie of ~10Pb and 0.4-1.4 picocuries of 210Po, corresponding to amounts reaching the blood of 0.2 and 0.3 pCi d-1 if the same Hansfer coefficient as above is used. However, it should be remembered that the conditions of inhalation and possibly the particle-size distributions are very different from those in normal respiration.
ii. Ingestion
Table 1 7 shows the values of the daily dietary intake in some countries. In the so-called western-type diet characterized by a high consumption of milk, the 210Pb content is in the range 1-10 pCi d-1, bread, meat, and vegetables contributing about the same amount. In that type of diet, the 210Po/210Pb ratio is about one (200, 24 7). An intake of 5 pCi d-1 leads to 0.4 and 0.3 picocurie of 210Pb and 210Po reaching the blood per day, assuming a gastro-intestinal fractional uptake of 0.08 and 0.06, respectively (266).
125. The 210Po/210Pb ratio may be much greater than one in animal muscle and in sea food (35, 318, 320, 553), and people whose diet consists mainly of meat or fish are expected to ingest relatively large amounts of 210Po. The high 210Po dietary intake of the Lapps is due to the special lichen-reindeer-man food chain, 210Po accumulating in lichens and in reindeer meat. The average intake of 210Po by Lapps is more tha~ an order of magnitude higher than by "nonarctic" populations, while the intake of 21opb is higher by only a factor of about two or three (317). In Japan, the consumption of sea food accounting for 12 pCi d-1 of the 210Pb daily intake it is likely that the mpo dietary intake is also mu;h higher than that of 210pb,
iii. Distribution in man
126. The activity concentration of 2iopb and 21opo in body tissues depends mainly upon the direct intake of those elements. The contribution from other sources such as decay of 226Ra in the skeleton, decay of at~ mo:;;pheric 222Rn dissolved in the body fluids, and decay of inhaled short-lived daucrhters of 222Rn is rela-tively unimportant (249).
0
127. The major fraction of 210Pb in man is found in bone which contains 70 per cent or more of the body burden (289, 326). In the temperate zone of the northern hemi~phere, the 210Pb concentration in wet bone is about 40 pCi kg-1 (289). In soft tissues, the highest average concentrations, typically between 5 and 10 pCi kg-1, are found in liver, bladder and gonads (29, 57). An exception is constituted by hair, which, during its period of growth, concentrates ~1opb in amounts higher than bone. It has been suggested that determination of 210Pb in the hair may be used to assess the integral exposure to this nuclide over the previous month in case of occupational poisoning (288, 290).
128. The 210Po/210Pb activity ratio is close to unity in bone and it is likely that both the amount of 210Po taken up from external sources and that fraction which deca)'.s from 210Pb and 210Bi have a long biological half-Jrfe in bone compared with the physical half-life ( 457). In some soft tissues such as the bladder. the 210Po/210Pb acfrvity ratio is lower than one. whereas it is greater than cne in others, for example the lung, the liver and the kidney (29, 57). The reason for the excess of ::: 10Po in those tissues is not clear; it has been suggested (24 7) that the uptake and the metabolic behaviour cf polonium might be related to the chcmic:--1 form in which the dietary 210Po occurs. Because the concentrations of ::: 10Po in hair. bone tissue and liver of naturally-exposed people show some correlation, hair monitoring has been proposed as a convenient way of assessing the 210Po concentration in bone ( 18).
129. Comparative studies between smokers and ~24. For non-smokers, food usually represents the non-smokers (27. 57, 246) show that the concentra-
mam route of uptake of both :!10Pb and 210Po by man. tions of :::10Pb and :::10Po in the lungs and ribs of ciga-
36
..
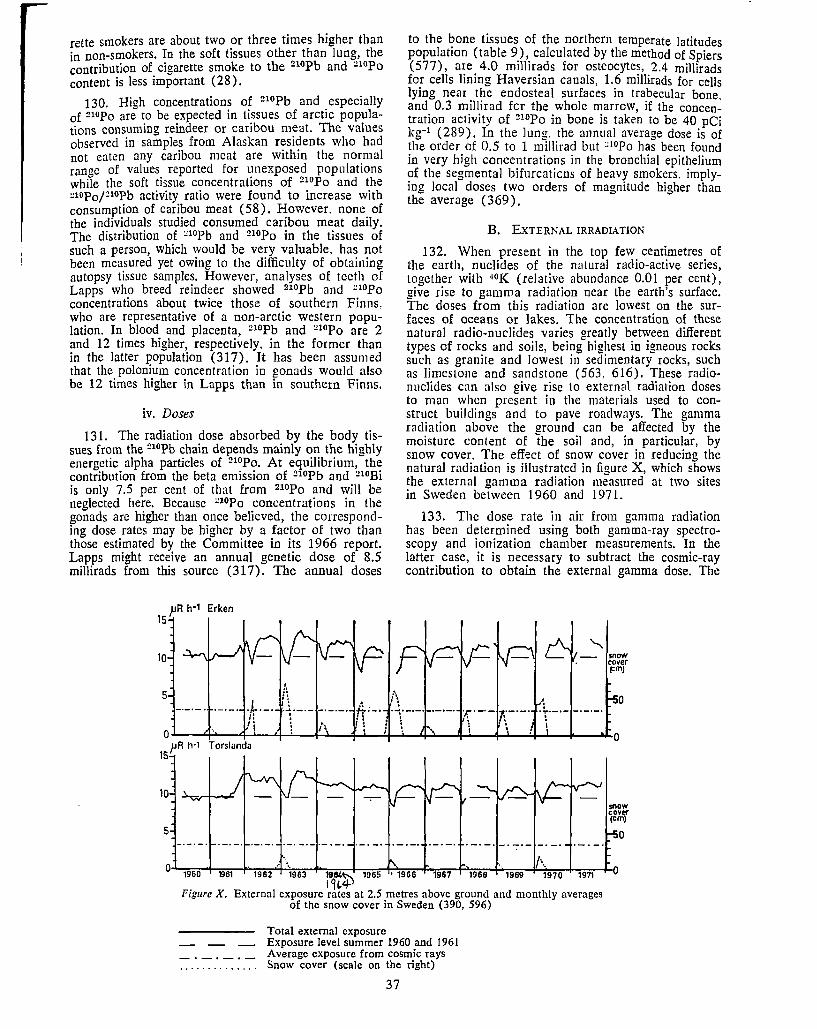
rette smokers are about two or three times higher than in non-smokers. In the soft tissues other than lung, the contribution of cigarette smoke to the 210Pb and 210Po content is less important ( 28).
130. Hi2:h concentrations of 210Pb and especially of !?lOPo are to be expected in tissues of arctic populations consuming reindeer or caribou m~at. The values observed in samples from Alaskan residents who had not eaten any caribou meat are within the normal ranoe of values reported for unexposed populations while the soft tissue concentrations of 210Po and the ~1op0 p1opb activity ratio were found to increase with consumption of caribou meat ( 58). However. none of the individuals studied consumed caribou meat daily. The distribution of 210Pb and 210Po in the tissues of such a person, which would be very valuable, has not been measured yet owing to the difficulty of obtaining autopsy tissue samples. However, analyses of teeth of Lapps who breed reindeer showed 210Pb and ~10Po concentrations about twice those of southern Finns, who are representative of a non-arctic western population. In blood and placenta, 210Pb and :nopo are 2 and 12 times higher, respectively, in the former than in the latter population (317). It has been assumed that the polonium concentration in gonads would also be 12 times higher in Lapps than in southern Finns.
iv. Doses
131. The radiation dose absorbed by the body tissues from the 210Pb chain depends mainly on the highly energetic alpha particles of 210Po. At equilibrium, the contribution from the beta emission of 210Pb and 210Bi is only 7.5 per cent of that from 210Po and will be neglected here. Because 210Po concentrations in the gonads are higher than once believed, the corresponding dose rates may be higher by a factor of two than those estimated by tbe Committee in its 1966 report. Lapps might receive an annual genetic dose of 8.5 millirads from this source (317). The annual doses
pR h·1 Erken 15
10
5
10
5
to the bone tissues of the northern temperate latitudes population (table 9), calculated by the method of Spiers (577), are 4.0 rnillirads for osteocytes, 2.4 rnillirads for cells lining Haversian canals, 1.6 millirads for cells lying near the endosteal surfaces in trabecular bone. and 0.3 millirad fer the whole marrow, if the concentration activity of 210Po in bone is taken to be 40 pCi kg-1 (289), In the Jung. the annual average dose is of the order of 0.5 to 1 millirad but ~10Po has been found in very high concentrations in the bronchial epithelium of the segmental bifurcaticns of heavy smokers, implying local doses two orders of magnitude higher than the average (369).
B. EXTERNAL IRRADL\TION
132. When present in the top few centimetres of the earth, nuclides of the natural radio-active series, together with 1°K (relative abundance 0.01 per cent), give .rise to gamma radiation near the earth's surface. The doses from this radiation are lowest on the surfaces of oceans or Jakes. The concentration of these natural radio-nuclides varies greatly between different types of rocks and soils, being highest in igneous rocks such as granite and lowest in sedimentary rocks, such as limestone and sandstone (563, 616). These radionuclides can also give rise to external radiation doses to man when present in the materials used to construct buildings and to pave roadways. The gamma radiation above the ground can be affected by the moisture content of the soil and, in particular, by snow cover. The effect of snow cover in reducing the natural radiation is illustrated in figure X, which shows the external gamma radiation measured at two sites in Sweden between 1960 and 1971.
133. The dose rate in air from gamma radiation has been determined using both gamma-ray spectroscopy and ionization chamber measurements. In the latter case, it is necessary to subtract the cosmic-ray contribution to obtain the external gamma dose. The
snaw cover ,=mJ
0
, \ f, 0~,~9s~o~~~~~~~,9~s~24~,9~s3~~~~~~~+-~,9~s~s~.~,~9~66~~,~9s~1~~1~9s~s~~,~9~~r.,~9~10~~,~9n~~o
j 'i!..4-> Figure X. External exposure rates at 2.5 metres above ground and monthly averages
of the snow cover in Sweden (390, 596)
Total external exposure Exposure level summer 1960 and 1961 Average exposure from cosmic rays Snow cover (scale on the right)
37
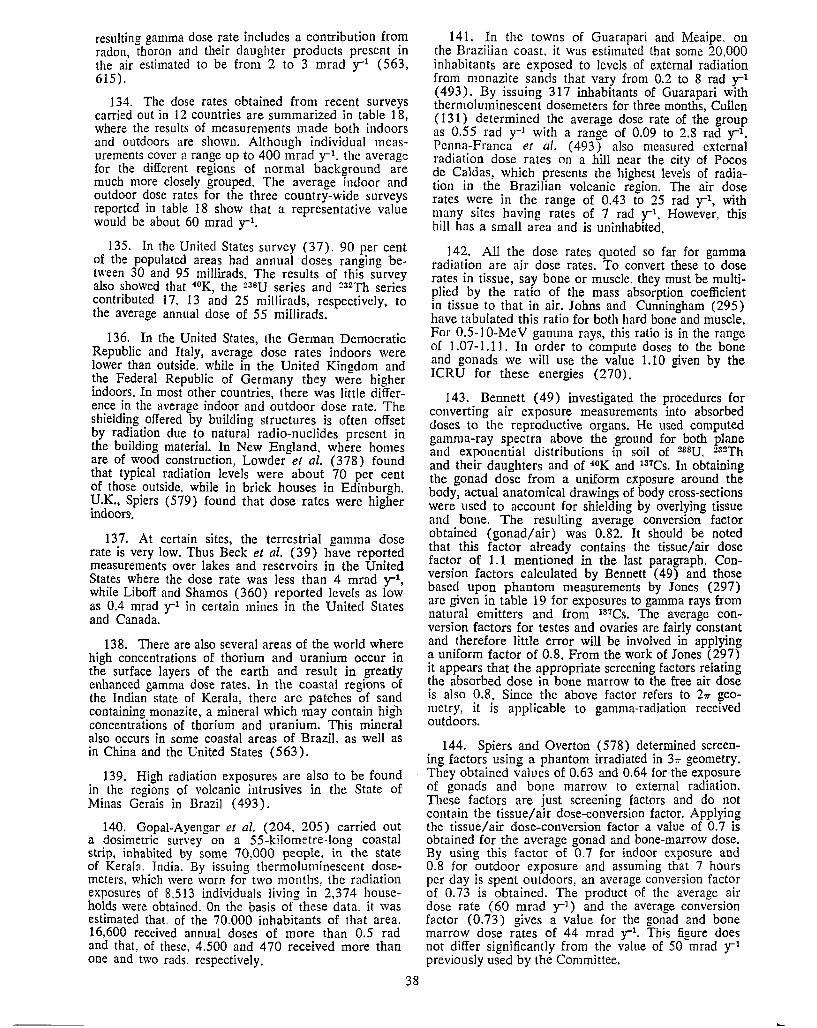
resulting gamma dose rate includes a contribution fro~ radon tboron and their daughter products present m the ai'r estimated to be from 2 to 3 mrad y--1 (563, 615).
134. The dose rates obtained from recent surveys carried out in 12 countries are summarized in table 18, where the results of measurements made both indoors and outdoors are shown. Although individual measurements cover a range up to 400 mrad y-1 , the average for the different regions of normal background are much more closely grouped. The average indoor and outdoor dose rates for the three country-wide surveys reported in table 18 show that a representative value would be about 60 mracl y-1•
135. In the United States survey (37), 90 per cent of the populated areas bad annual doses ranging between 30 and 95 millirads. The results of this survey also showed that 4°K, the ~38U series and ~32Th series contributed 17, 13 and 25 millirads, respectively, to the average annual dose of 55 millirads.
136. In the United States, the German Democratic Republic and Italy, average dose rates indoors were lower than outside. while in the United Kingdom and the Federal Republic of Germany they were higher indoors. In most other countries, there was little difference in the average indoor and outdoor dose rate. The shielding offered by building structures is o[ten offset by radiation due to natural radio-nuclides present in the building material. In New England, where homes are of wood construction. Lowder et al. (3 78) found that typical radiation levels were about 70 per cent of those outside, while in brick houses in Edinburgh, U.K., Spiers (579) found that dose rates were higher indoors.
13 7. At certain sites, the terrestrial gamma dose rate is very low. Thus Beck et al. (39) have reported measurements over lakes and reservoirs in the United States where the dose rate was Jess than 4 mrad y-1, while Liboff and Shamos (360) reported levels as low as 0.4 mrad y-1 in certain mines in the United States and Canada.
138. There are also several areas of the world where high concentrations of thorium and uranium occur in the surface layers of the earth and result in greatly enhanced gamma dose rates. In the coastal regions of the Indian state of Kerala, there are patches of sand containing monazite, a mineral which may contain high concentrations of thorium and uranium. This mineral also occurs in some coastal areas of Brazil, as well as in China and the United States ( 5 63).
139. Hioh radiation exposures are also to be found in the reoi~ns of volcanic intrusives in the State of
0
Minas Gerais in Brazil ( 493).
140. Gopal-Ayengar et al. (2~4. 205) carried out a dosimetric survey on a 55-kilometre-l?ng coastal strip, inhabited by some 70,000 people_, m the state of Kerala. India. By issuing therrnolurnmescent .d~semeters, which were worn for two months, the radiation exposures of 8.513 individuals living in 2,374 households were obtained. On the basis of these data. it was estimated that. of the 70.000 inhabitants of that area. 16,600 received annual doses of more than 0.5 rad and that. of these, 4.500 and 470 received more than one and two rads, respectively.
38
141. In the towns of Guarapari and Meaipe. on the Brazilian coast, it was estimated that some 20,000 inhabitants are exposed to levels of external radiation from monazite sands that vary from 0.2 to 8 rad y-1
( 493). By issuing 317 inhabitants of Guarapari with thermoluminescent dosemeters for three months, Cullen ( 131 ) determined the average dose rate of the group as 0.55 rad y-1 with a range of 0.09 to 2.8 rad y-1 •
Penna-Franca et al. ( 493) also measured external radiation dose rates on a hill near the city of Pocos de Caldas, which presents the highest levels of radiation in the Brazilian volcanic region. The air dose rates were in the range of 0.43 to 25 rad y-1, with many sites having rates of 7 rad y-1. However, this hill has a small area and is uninhabited.
142. All the dose rates quoted so far for gamma radiation are air dose rates. To convert these to dose rates in tissue, say bone or muscle. they must be multiplied by the ratio of the mass absorption coefficient in tissue to that in air. Johns and Cunningham (295) have tabulated this ratio for both hard bone and muscle. For 0.5-10-MeV gamma rays, this ratio is in the range of 1.07-1.11. In order to compute doses to the bone and gonads we will use the value 1.10 given by the ICRU for these energies (270).
143. Bennett ( 49) investigated the procedures for converting air exposure measurements into absorbed doses to the reproductive organs. He used computed gamma-ray spectra above the ground for both plane and exponential distributions in soil of 238U. 232Tb and their daughters and of 4°K and 137Cs. In obtaining the gonad dose from a uniform exposure around the body, actual anatomical drawings of body cross-sections were used to account for shielding by overlying tissue and bone. The resulting average conversion factor obtained (gonad/air) was 0.8_2. It sh~uld b~ noted that this factor already contams the tissue/iur dose factor of 1.1 mentioned in the last paragraph. Conversion factors calculated by Bennett ( 49) and those based upon phantom measurements by Jones (297) are given in table 19 for exposures to gamma rays from natural emitters and from 137Cs. The average conversion factors for testes and ovaries are fairly constant and therefore little error will be involved in applying a uniform factor of 0.8. From the work of Jones (297) it appears that the appropriate screening factors ~elating the absorbed dose in bone marrow to the free alf dose is also 0.8 Since the above factor refers to 21r geometry, it is applicable to gamma-radiation received outdoors.
144. Spiers and Overton (578) determined screening factors using a phantom irradiated in 3rr geometry. They obtained values of 0.63 and 0.64 for the exl?o~ure of gonads and bone marrow to external radrnt10n. These factors are just screening factors and do ?ot contain the tissue/air dose-conversion factor. Applyu~g the tissue/ air dose-conversion factor a value of 0. 7 1s obtained for the average gonad and bone-marrow dose. By using this factor of 0.7 for indoor exposure and 0.8 for outdoor exposure and assuming tha~ 7 hours per day is spent outdoors. an average conversion fact~r of 0. 73 is obtained. The product of the average air dose rate ( 60 mrad y-1 ) and the average conversion factor (0.73) gives a value for the gonad and bone marrow dose rates of 44 mr~.d y-1. This figure does not differ significantly from the value of 50 mrad y-1
previously used by the Committee.
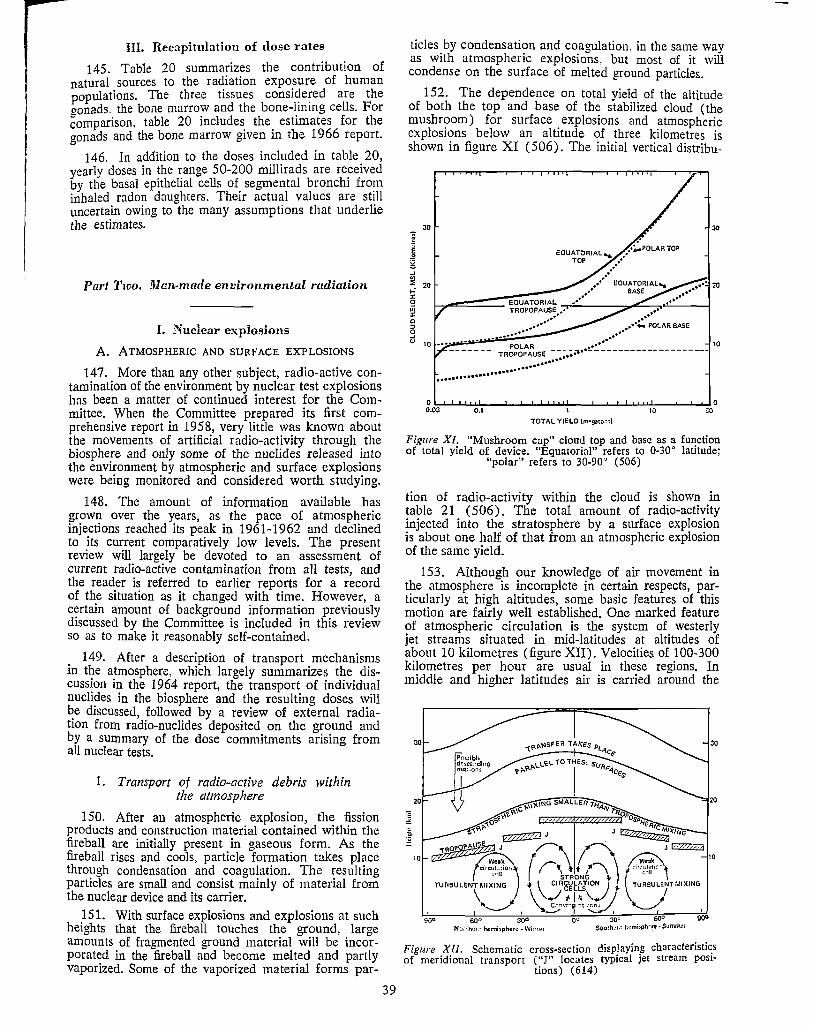
m. Recapitulation of close rates
145. Table 20 summarizes the contribution of natural sources to the radiation exposure of human populations. The three tissues considered are the ~onads. the bone marrow and the bone-lining cells. For comparison, table 20 includes the estimates for the gonads and the bone marrow given in the 1966 report.
146. In addition to the doses included in table 20, yearly doses in the range 50-200 millirads are received by the basal epithelial cells of segmental bronchi from inhaled radon daughters. Their actual values are still uncertain owing to the many assumptions that underlie the estimates.
Part Two. Man-made environmental radiation
I. Nuclear explosions
A. ATMOSPHERIC AND SURFACE EXPLOSIONS
147. More than any other subject, radio-active contamination of the environment by nuclear test explosions has been a matter of continued interest for the Committee. When the Committee prepared its first comprehensive report in 1958, very little was known about the movements of artificial radio-activity through the biosphere and only some of the nuclides released into the environment by atmospheric and surface explosions were being monitored and considered worth studying.
148. The amount of information available bas grown over the years, as the pace of atmospheric injections reached its peak in 1961-1962 and declined to its current comparatively low levels. The present review will largely be devoted to an assessment of current radio-active contamination from all tests, and the reader is referred to earlier reports for a record of the situation as it changed with time. However, a certain amount of background information previously discussed by the Committee is included in this review so as to make it reasonably self-contained.
149. After a description of transport mechanisms in the atmosphere, which largely summarizes the discussion in the 1964 report, the transport of individual nuclides in the biosphere and the resulting doses will be discussed, followed by a review of external radiation from radio-nuclides deposited on the ground and by a summary of the dose commitments arising from all nuclear tests.
1. Transport of radio-active debris within the atmosphere
150. After an atmospheric explosion, the fission products and construction material contained withln the fireball are initially present in gaseous form. As the fireball rises and cools, particle formation takes place through condensation and coagulation. The resulting particles are small and consist mainly of material from the nuclear device and its carrier.
151. With surface explosions and explosions at such heights that the fireball touches the ground, large amounts of fragmented ground material will be incorporated in the fireball and become melted and partly vaporized. Some of the vaporized material forms par-
39
tides by condensation and coagulation, in the same way as with atmospheric explosions. but most of it will condense on the surface of melted ground particles.
152. The dependence on total yield of the altitude of both the top and base of the stabilized cloud (the mushroom) for surface explosions and atmospheric explosions below an altitude of three kilometres is shown in figure XI ( 506). The initial vertical distribu-
o.,,.,. ....... .J..U..._ __ .,_.1.-J....._ ........ ...._ __ .,__.,__1...1...i..u..u....--..1....1-~o 0.03 0.1 10 so
TOTAL YIELD (megaton~}
Figure XI. "Mushroom cap" cloud top and base as a function of total yield of device. "Equatorial" refers to 0-30° latitude;
"polar" refers to 30-90° (506)
tion of radio-activity within the cloud is shown in table 21 ( 5 06). The total amount of radio-activity injected into the stratosphere by a surface explosion is about one half of that from an atmospheric explosion of the same yield.
153. Although our knowledge of air movement in the atmosphere is incomplete in certain respects, particularly at high altitudes, some basic features of this motion are fairly well established. One marked feature of atmospheric circulation is the system of westerly jet streams situated in mid-latitudes at altitudes of about 10 kilometres (figure XII). Velocities of 100-300 kilometres per hour are usual in these regions. In middle and higher latitudes air is carried around the
JO
900 600 3Q0 QC JQC 600 SQG No~th•1rn hcmi~phcrc -Wint"'r Sou~h:rn h.:mi~phr:nr •$,Jmm~r
Figure XII. Schematic cross-section displaying cbaracteristie;s of meridional transport ("J" locates typical jet stream post·
tions) (614)

globe in a week or so .and i~ one to two months in tropical regions ( 66). S111ce, m the stratosphere, these times are short compared to transfer times in the meridional and vertical directions, the debris may be considered to be zonally well mixed so that, several months after a test, they will be uniformly distributed around a circle of latitude ( 66). In the troposphere, vertical motions are rapid but in the lower stratosphere these vertical motions and hence the associated vertical transport are much smaller ( 66, 509).
(a) Movement within the stratosphere
154. Observations of radio-active tracers have contributed greatly to the understanding of air movement within the stratosphere. A schematic representation of the stratospheric circulation features deduced from data on 90Sr. HC. 18"W, 10~Rh. 10°Cd and :::ispu is shown in figure XIII ( 368). Tracer data above about 3 7 kilo-
40,....-.,....---r-.---,---r---.---r-.---r--i~.---.--.----,---.---r--,r--, Km --30
< ... " " ... 0 <( 0
0
0 z
20 z
.............
10 ······+l···
~~o·-'--'--6~0-.-'--'--J~o·-'--'--'-o·--''-.L-~30-·-'--'--G~o7•~~~9o' WINTER SUMMER
Figure XIII. Schematic representation of the stratospheric circulation as deduced from radio-active tracer data (368)
metres between 25° and 70° indicate a flow from the summer hemisphere to the winter hemisphere and a mean descending motion in the winter stratosphere. Ascending motions occur near the equatorial tropopause and poleward motions in the lower winter stratosphere at latitudes higher than 70°. Virtually the entire summer stratosphere and the winter stratosphere below 25° between 18 and 25 kilometres are dominated by mixing processes with no evidence of organized circulations in the meridional phase.
155. The level of maximum concentration of radioactive tracer material injected into the stratosphere slopes from higher altitudes over the equator to lower altitudes and colder potential temperatures near the pole (386). Six to twelve months after the injection into the lower stratosphere in equatorial. temperate and polar latitudes, the configuration of the levels of maximum concentrations was found to be almost identical irrespective of the latitude and altitude of injection and of the vertical distribution of the debris. Tracers originally injected into the upper stratosphere and aerosphere follow a similar pattern. Machta et al. (386) suggest the following genesis of the surface of
40
maximum concentration as deduced from data on radioactive debris from the nuclear explosion at 40° N of 17 June 1967:
(a) a poleward, essentially horizontal, displacement of most of the air containing the debris by mid-autumn, accompanied by a warming of the order of 0.2° C per day;
( b) a net descending motion during late autumn and winter north of about 55° N at a rate of 1-5 kilometres per month with the air cooling by about 1 ° C per day;
(c) isolated patches of debris remaining near the source region;
(d) quasi-horizontal diffusion imposed on the mean circulation, smoothing out the gradients and resulting in a surface of maximum concentration sloping downward from about 20 kilometres at 20° N to 15 kilometres at 60° Nin spring and summer.
(b) Trans/ er to troposphere
156. Many mechanisms may play a role in the transfer of particulate radio-activity from the stratosphere to the troposphere. Thus, heavy particles can settle through the tropopause but the bulk of the radioactivity in the lower stratosphere is associated with particles too small for gravitational settling to contribute significantly to the downward transport through the tropopause ( 614). The horizontal transport through the subtropical tropopause gap makes a considerable ( and often determinant) contribution in the air mass exchange between the stratosphere and the troposphere and the well-known spring maximum concentration of fall-out in surface air is due to a winter maximum exchange between lower stratosphere and troposphere through the tropopause of temperate and high latitudes (313). Finally, stratospheric radio-activity can be incorporated into the troposphere by diffusive mixing through folds of the tropopause (133-135).
157. The concept of stratospheric mean residence time has been thoroughly discussed in the 1964 report of the Committee. It is defined as the average time spent by the radio-active debris in the stratosphere before it is transferred to the troposphere. Such a definition in no way implies that the material is well mixed within the stratosphere or that it is held up during the transfer to the troposphere ( 66).
158. The mean stratospheric residence time of radio-active debris produced by an explosion will depend on the explosion's altitude, latitude. and possibly its time of occurrence. Thus, fission products in lower polar stratosphere may have a mean residence time of six months or less, while debris from mediumaltitude explosions has mean residence times of perhaps two to three years (300). At much higher altitudes ( over 100 km) as illustrated by the 10~Rh experiment, the residence time increases to 5 or 10 years (307, 308. 356, 584). The mean residence time for 90Sr is 1.1-1.2 years (122, 167, 337, 629) and seems to be fairly constant for all northern latitudes (167). For excess 14C in the stratosphere the apparent half residence time is between two and five years ( 605).
(c) Movement within the troposphere
159. Once the radio-active debris enters the troposphere it is mixed fairly rapidly within the hemisphere
' i
' i
of entry since miidng by eddy diffusion and convection is much more rapid in the troposphere than in the stratosphere. In the meridional plane there are two circulation cells within each hemisphere, as shown in fim.1re XII. The tropical cells are well developed, with air rising in equatorial regions and descending into the 20°-30° latitude region. The two cells at higher latitudes are weaker with descending air at latitudes of 40°-50° and rising air at higher latitudes. At middle and higher latitudes large-scale eddies give rise to rapid meridional transport ( 614).
160. In the troposphere, the exchange of particulate radio-activity across the meteorological equator is impeded for two reasons. In the first place the convergence of low-altitude air currents (figure XII) tends to keep air in the same hemisphere and also retards the exchange of gases. The second reason is the scavenging of particulates by showery precipitation in the convergent zone ( 614). However, several investigators have reported interhemispheric transport of tropospheric nuclear debris from southern to northern hemisphere (97, 98, 172, 216, 448, 522, 523, 542, 574) and vice versa (115,349,413,651).
161. Meridional circulation seems to constitute the main mechanism responsible for this transport. The mean exchange time between hemispheres, defined as the mean time spent in the northern hemisphere by a molecule of air before transfer to the southern hemisphere and vice versa, was estimated from various gaseous tracer experiments to be about 1.5 years ( 614).
162. The mean residence time of nuclear debris in the troposphere is estimated to be about 30 days (96, 387, 586). Evidence suggests that particulates reside in the lower, rain-bearing, layers of the atmosphere for a period of the order of five days or less (382, 387, 402).
163. A model for predicting the atmospheric content of radio-active material has been worked out by Krey and Krajewski (337). The atmosphere of each hemisphere is divided into three compartments, i.e. the atmosphere above 21 kilometres, that below 21 kilometres, and the troposphere. Transfer between compartments follows first-order kinetics and the transfer constants used are: from above 21 kilometres to the lower stratosphere 0.116 month-1, from the lower stratosphere to the troposphere 0.0693 month-1 and from the troposphere to ground level 0.693 month-1•
The debris from an injection well above 21 kilometres is equally partitioned between the hemispheres while for debris injected into the lower stratosphere there is a dynamic exchange between the hemispheres with a transfer constant of 0.0116 montb-1• Using this model Krey and Krajewski (337-339) have calcuiated strato~pheric inventory, surface air concentration and deposition and found good agreement with measurements.
( d) Deposition
164. Mechanisms of deposition were discussed in some detail in the Committee's 1964 report. After entering the troposphere from above, fission products are transported down to the level of the rain-bearing clouds mainly by turbulent mixing. This downward movement is enhanced over anti-cyclonic systems and opposed over cyclonic systems ( 134). Below this level, the radio-active particles are rapidly washed out by precipitation and deposited upon the earth (346). In addition, dry removal of fission products talces place
41
through several mechanisms. Dry removal by sedimentation requires particles to be larcrer than about five micrometres and is important only hi. local fall-out. Dry deposition of world-wide fall-out makes an important contribution to the total fall-out only in areas of low rainf aU.
165. Fission products can enter rain-water by processes within the cloud, the so-called rain-out, or can be picked up by raindrops below the cloud, the socalled wash-out. For aerosols of small particle size the wash-out is relatively quite slow so that rain-out is probably the most important wet-deposition process (164, 301). The small contribution of wash-out processes to total deposition probably accounts for the fact that the activity of fission products in ground-level air does not seem to be greatly influenced by precipitation rates (162, 381, 619).
2. Internal irradiation
(a) Tritium
166. Eriksson (165) estimated that l, 900 megacuries of tritium were released into the atmosphere by tests up to 1963, most of them into the northern hemisphere. The dose commitment can be calculated using the relation,
w Di, (co) = Yo -
B
where yo is the dose rate from natural tritium, W is the amount of artificial tritium released into the atmosphere and B is the amount of natural tritium produced annually. The dose rate due to natural tritium of 0.6-2.5 µ.rad y-1 results from an annual production of 1.6 megacuries, that is 0.8 megacurie in each hemisphere ( paragraphs 60 and 62). By assuming that all the bomb-produced tritium remains in the northern hemisphere we obtain an upper limit to the dose commitment. This will be in the range 0.6 10--a (1900/ 0.8) = 1.4 and 2.5 10-a (1900/0.8) = 5.9 millirads. If it is assumed that there is rapid ( compared with the half-life) mixing of tritium between hemispheres, a lower limit to the dose commitment is obtained. This is in the range of 0.6 10-a (1900/1.6) = 0.7 and 2.5 10-3
(1900/1.6) = 3.0 millirads. Since the movement of tritium from one hemisphere to another appears to be fairly slow the true dose commitment should be closer to the upper limit. In this report, the values used as dose commitments to the populations of the northern and of the southern hemisphere are four and one millirads, respectively.
(b) Carbon-14
167. The activity of 14C in the co~ of tropospheric air of the northern and southern hemispheres is shown in figure XIV, where the 14C concentrations of surface ocean waters are also shown (464, 518, 614). During 1968-1969, levels in both hemispheres remained fairly constant at about 60 per cent above normal, the 14C that moved into the oceans having been replenished by the nuclear tests in 1968. The activities in surface ocean waters have risen much less than was expected and now appear to be decreasing.
168. This observation may indicate a much more rapid exchange of 14C between the surface and deep
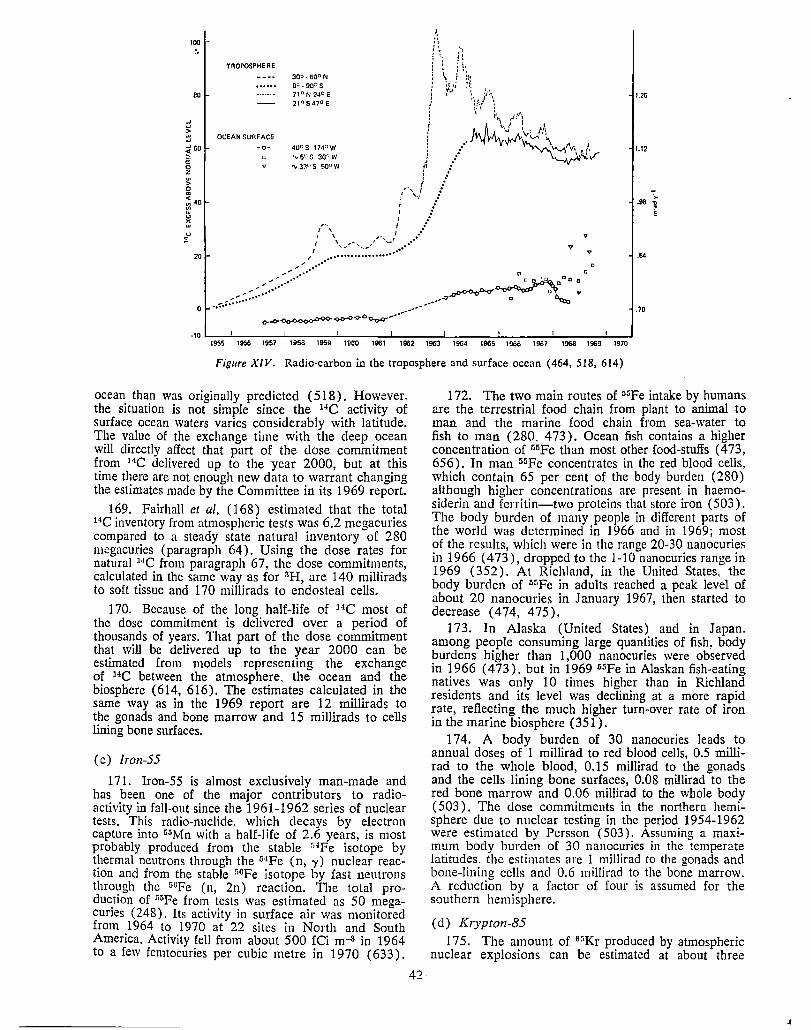
100
;;j ~ ...
80
:;t 60
~ 0 :z w > 0 "' ~ 40
t'.l ~
TROPOSPHERE
OCEAN SURFACE
-o-
3Qo. eooN oc.goos 71°N240E 2105470E
V
1.26
1.12
-:-.. .98 'D
i
.84
.70
·10 I 1955 1956 1957 1958 1959 196-0 1961 1962 1963 1964 1966 1966 1967 1968 1969 1970
Figure XIV. Radio-carbon in the troposphere and surface ocean (464, 518, 614)
ocean than was originally predicted ( 518). However. the situation is not simple since the 14C activity of surface ocean waters varies considerably with latitude. The value of the exchange time with the deep ocean will directly affect that part of the dose commitment from 14C delivered up to the year 2000, but at this time there are not enough new data to warrant changing the estimates made by the Committee in its 1969 report.
169. Fairhall et al. (168) estimated that the total 14C inventory from atmospheric tests was 6.2 megacuries compared to a steady state natural inventory of 280 megacuries (paragraph 64 ). Using the dose rates for natural 14C from paragraph 67, the dose commitments, calculated in the same way as for 3H, are 140 millirads to soft tissue and 170 millirads to endosteal cells.
170. Because of the long half-life of 14C most of the dose commitment is delivered over a period of thousands of years. That part of the dose commitment that will be delivered up to the year 2000 can be estimated from models representing the exchange of 14C between the atmosphere. the ocean and the biosphere (614, 616). The estimates calculated in. the same way as in the 1969 report are 12 millirads to the gonads and bone marrow and 15 millirads to cells lining bone surfaces.
(c) Iron-55
171. Iron-55 is almost exclusively man-made and has been one of the major contributors to radioactivity in fall-out since the 1961-1962 series of nuclear tests. This radio-nuclide, which decays by electron capture into 5"Mn with a half-life of 2.6 years, is most probably produced from the stable "4Fe isotope by thermal neutrons through the lHFe (n, y) nuclear reaction and from the stable 5°Fe isotope by fast neutrons through the 5°Fe (n, 2n) reaction. The total production of 55Fe from tests was estimated as 50 meoacuries (248). Its activity in surface air was monito;ed from 1964 to 1970 at 22 sites in North and South America. Activity fell from about 500 fCi m-a in 1964 to a few femtocuries per cubic metre in 1970 ( 633).
42
172. The two main routes of 55Fe intake by humans are the terrestrial food chain from plant to animal to man and the marine food chain from sea-water to fish to man (280, 473). Ocean fish contains a higher concentration of 55Fe than most other food-stuffs ( 4 73, 656). In man 1i5Fe concentrates in the red blood cells, which contain 65 per cent of the body burden (280) although higher concentrations are present in haemosiderin and ferritin-two proteins that store iron (503). The body burden of many people in different parts of the world was determined in 1966 and in 1969; most of the results, which were in the range 20-30 nanocuries in 1966 (473), dropped to the 1-10 nanocuries range in 1969 (352). At Richland, in the United States, the body burden of 5r.pe in adults reached a peak level of about 20 nanocuries in January 1967, then started to decrease (474, 475).
173. In Alaska (United States) and in Japan. among people consuming large quantities of fish, body burdens higher than 1,000 nanocuries were observed in 1966 ( 473), but in 1969 55Fe in Alaskan fish-eating natives was only 10 times higher than in Richland residents and its level was declining at a more rapid rate, reflecting the much higher tum-over rate of iron in the marine biosphere ( 351).
174. A body burden of 30 nanocuries leads to annual doses of 1 millirad to red blood cells, 0.5 millirad to the whole blood, 0.15 millirad to the gonads and the cells lining bone surfaces, 0.08 millirad to the red bone marrow and 0.06 millirad to the whole body ( 503). The dose commitments in the northern hemisphere due to nuclear testing in the period 1954-1962 were estimated by Persson ( 503). Assuming a maximum body burden of 30 nanocuries in the temperate latitudes, the estimates are 1 millirad to the gonads and bone-lining cells and 0.6 millirad to the bone marrow. A reduction by a factor of four is assumed for the southern hemisphere.
( d) Krypton-85
175. The amount of 8~Kr produced by atmospheric nuclear explosions can be estimated at about three
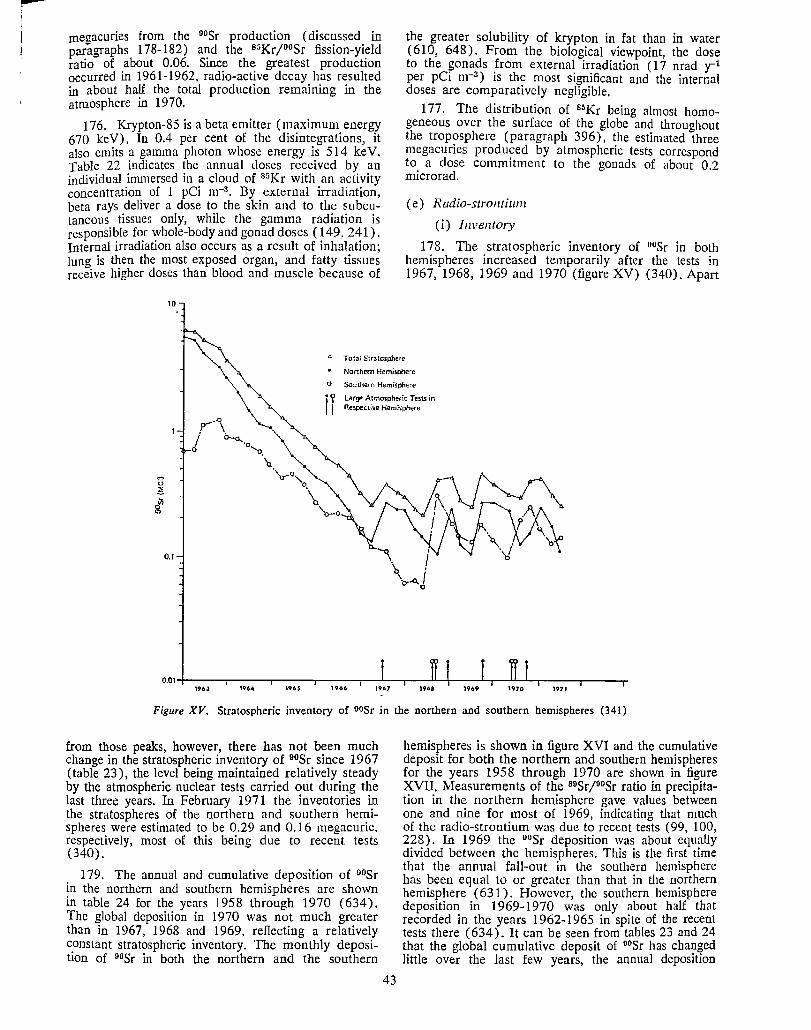
r---i I
megacuries from the 00Sr production ( discussed in paragraphs 178-182) and the s;;Kr/00Sr fission-yield ratio of about 0.06. Since the greatest production occurred in 1961-1962, radio-active decay has resulted in about half the total production remaining in the atmosphere in 1970.
176. Krypton-85 is a beta emitter ( maximum energy 670 ke V). In 0.4 per cent of the disintegrations, it also emits a gamma photon whose energy is 514 ke V. Table 22 indicates the annual closes received by an incliviclual inunersed in a cloud of 85Kr with an activity concentration of I pCi ni-3. By external irradiation, beta rays deliver a dose to the skin and to the subcutaneous tissues only, while the gamma radiation is responsible for whole-body and gonad doses (149. 241). Internal irradiation also occurs as a result of inhalation; lung is then the most exposed organ, and fatty tissues receive higher doses than blood and muscle because of
10
the greater solubility of krypton in fat than in water (610, 648). From the biological viewpoint, the dose to the ~on~f s _from externa~ ir:adiation ( 17 nrad y-1 per pC1 nr ) 1s the most s1gmficant and the internal doses are comparatively negligible.
177. The distribution of 85Kr bein" almost homogeneous over the surface of the globe "'and throughout the troposphere ( paragraph 396), the estimated three megacuries produced by atmospheric tests correspond to a close commitment to the gonads of about 0.2 microrad.
( e) Radio-stro11ti11m
(i) Inventory
178. The stratospheric inventory of 00Sr in both hemispheres increased temporarily after the test~ in 1967, 1968, 1969 and 1970 (figure XV) (340). Apart
~ Totill S!rato,sphere
• Northern Hemisphe'e
O Southern Hemisphere
f Y Large Atmospheric Te:Hs in I j Respective Hemisphere
0.1
0.01--t---""T""----r----r---~-'--~----'-'--+-----'--r----'-L......i~--~--~ 1963 1904 196~ 1966 1907 1961 1969 1971
Figure XV. Stratospheric inventory of oosr in the northern and southern hemispheres (341)
from those peaks, however, there has not been much change in the stratospheric inventory of 00Sr since 1967 ( table 23), the level being maintained relatively steady by the atmospheric nuclear tests carried out during the last three years. In February 1971 the inventories in the stratospheres of the northern and southern hemispheres were estimated to be 0.29 and 0.16 megacurie, respectively, most of this being due to recent tests (340).
179. The annual and cumulative deposition of 00Sr in the northern and southern hemispheres are shown in table 24 for the years 1958 through 1970 (634). The global deposition in 1970 was not much greater than in 1967, 1968 and 1969, reflecting a relatively constant stratospheric inventory. The monthly deposition of 90Sr in both the northern and the southern
43
hemispheres is shown in figure XVI and the cumulative deposit for both the northern and southern hemispheres for the years 1958 through 1970 are shown in figure XVII . .Measurements of the 89Sr/00Sr ratio in precipitation in the northern hemisphere gave values between one and nine for most of 1969, indicating that much of the radio-strontium was due to recent tests (99, 100, 228). In 1969 the 00Sr deposition was about equally divided between the hemispheres. This is the first time that the annual fall-out in the southern hemisphere has been equal to or greater than that in the northern hemisphere ( 631). However, the southern hemisphere deposition in 1969-1970 was only about half that recorded in the years 1962-1965 in spite of the recent tests there ( 634). It can be seen from tables 23 and 24 that the global cumulative deposit of 00Sr has changed little over the last few years, the annual deposition
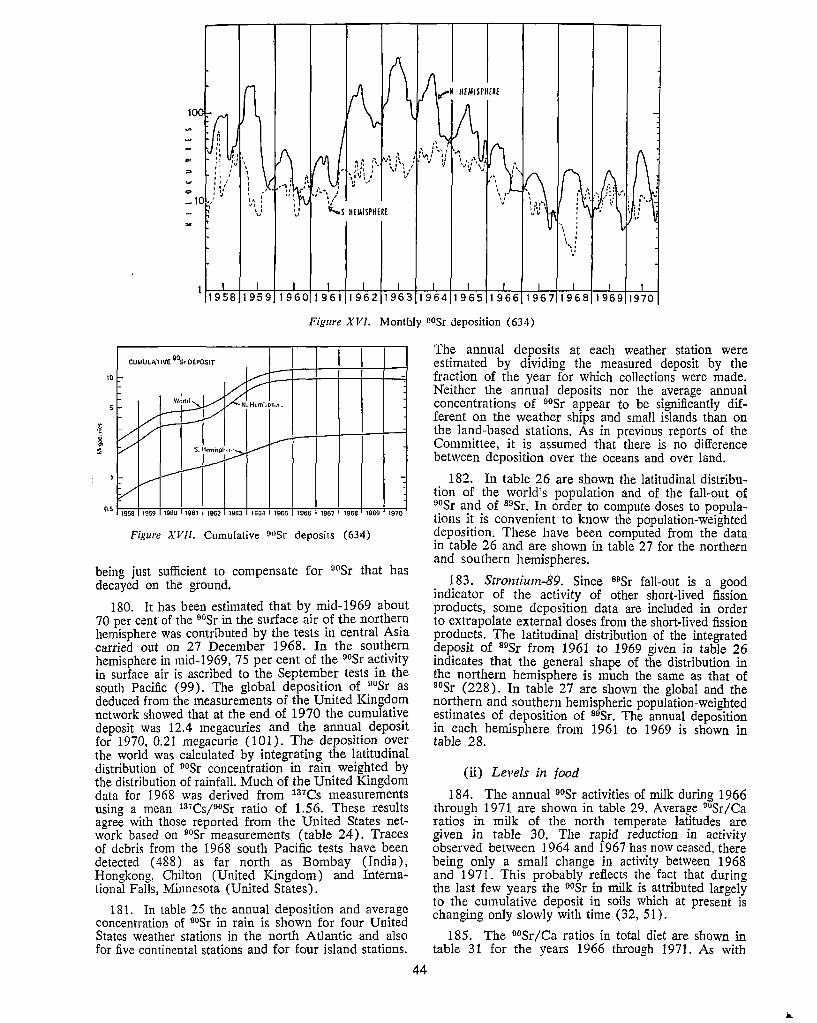
1195819591960196119621963 1964 1965 1966 19671968 19691970
Figure XVI. Monthly 90Sr deposition ( 634)
CUMULATIVE 90s, DEPOSIT
10
o.s 1958 1959 1960 1961 I 1962 1963 196,1 I 196S 1966 1967 1968 1969 1970
Figure XVII. Cumulative oosr deposits (634)
being just sufficient to compensate for 90Sr that has decayed on the ground.
180. It has been estimated that by mid-1969 about 70 per cent of the 00sr in the surface air of the northern hemisphere was contributed by the tests in central Asia carried out on 27 December 1968. In the southern hemisphere in mid-1969, 75 per cent of the 00Sr activity in surface air is ascribed to the September tests in the south Pacific (99). The global deposition of 90Sr as deduced from the measurements of the United Kingdom network showed that at the end of 1970 the cumulative deposit was 12.4 megacuries and the annual deposit for 1970, 0.21 megacurie (101). The deposition over the world was calculated by integrating the latitudinal distribution of 9osr concentration in rain weighted by the distribution of rainfall. Much of the United Kingdom data for 1968 was derived from 137Cs measurements using a mean mcs/90Sr ratio of 1.56. These results agree with those reported from the United States network based on 90Sr measurements ( table 24). Traces of debris from the 1968 south Pacific tests have been detected ( 488) as far north as Bombay (India), Hongkong. Chilton (United Kingdom) and International Falls, Minnesota (United States).
181. In table 25 the annual deposition and average concentration of 90Sr in rain is shown for four United States weather stations in the north Atlantic and also for five continental stations and for four island stations.
44
The annual deposits at each weather station were estimated by dividing the measured deposit by the fraction of the year for which collections were made. Neither the annual deposits nor the average annual concentrations of 90Sr appear to be significantly different on the weather ships and small islands than on the land-based stations. As in previous reports of the Committee, it is assumed that there is no difference between deposition over the oceans and over land.
182. In table 26 are shown the latitudinal distribution of the world's population and of the fall-out of 90Sr and of 89Sr. In order to compute doses to populations it is convenient to know the population-weighted deposition. These have been computed from the data in table 26 and are shown in table 27 for the northern and southern hemispheres.
183. Strontium-89. Since 89Sr fall-out is a good indicator of the activity of other short-lived fission products, some deposition data are included in order to extrapolate external doses from the short-lived fission products. The latitudinal distribution of the integrated deposit of 89Sr from 1961 to 1969 given in table 26 indicates that the general shape of the distribution in the northern hemisphere is much the same as that of 90Sr (228). In table 27 are shown the global and the no';ihern and southern hemispheric population-weighted esttmates of deposition of 89Sr. The annual deposition in each hemisphere from 1961 to 1969 is shown in table 28.
(ii) Levels in food
184. The annual 90Sr activities of milk during 1966 through 1971 are shown in table 29. Average 90Sr /Ca ratios in milk of the north temperate latitudes are given in table 30, The rapid reduction in activity observed between 1964 and 1967 has now ceased. there being only a small change in activity between 1968 and 1971. This probably reflects the fact that during the last few years the 90Sr in milk is attributed largely to the cumulative deposit in soils which at present is changing only slowly with time (32, 51).
185. The 00Sr/Ca ratios in total diet are shown in table 31 for the years 1966 through 1971. As with
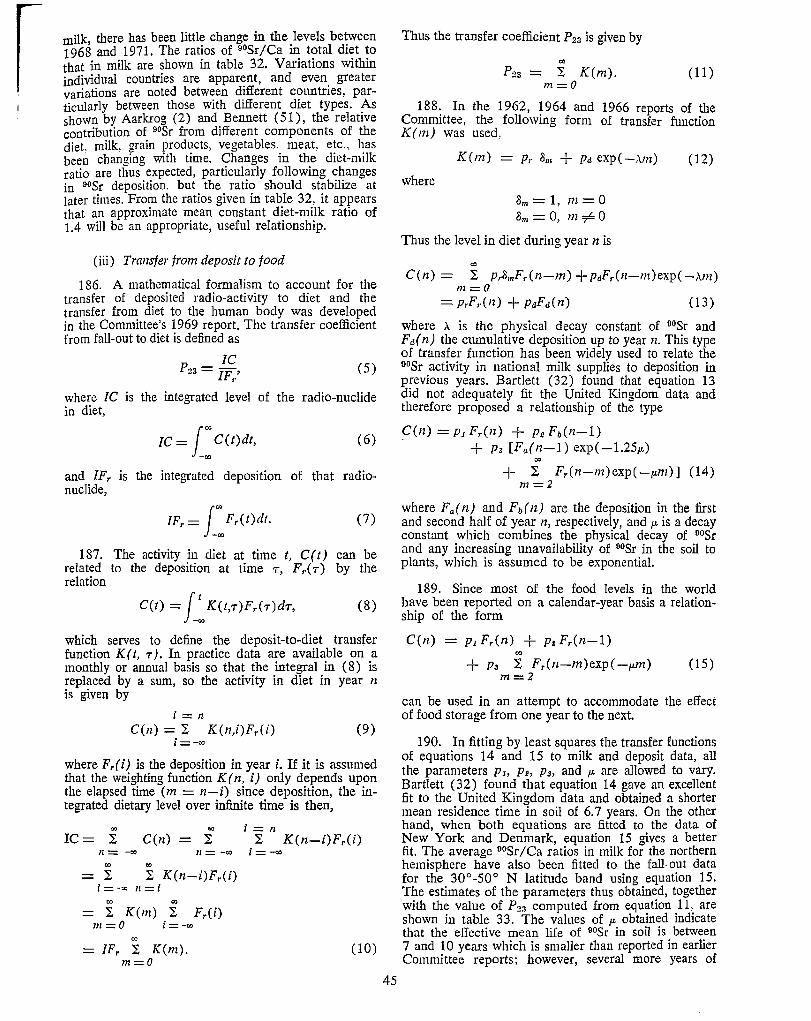
milk there has been little change in the levels between 1968 and 1971. The ratios of 90Sr/Ca in total diet to that in milk are shown in table 32. Variations within individual countries are appar~nt, and even. greater variations are noted between different countries, particularly between those with different diet types. As shown by Aarkrog (2) and Bennett ( 51), the relative contribution of 90Sr from different components of the diet milk. grain products, vegetables. meat, etc., has bee~ changing with time. Changes in the diet-milk ratio are thus expected, particularly following changes in 90Sr deposition, but the ratio should stabilize at later times. From the ratios given in table 32, it appears that an approximate mean constant diet-milk ratio of 1.4 will be an appropriate, useful relationship.
(iii) Transfer from deposit to food
186. A mathematical formalism to account for the transfer of deposited radio-activity to diet and the transfer from diet to the human body was developed in the Committee's 1969 report. The transfer coefficient from fall-out to diet is defined as
IC P23 = IF,! (5)
where JC is the integrated level of the radio-nuclide in diet,
JC= 1_: C(t)dt, (6)
and IFr is the integrated deposition of that radionuclide,
IF,= J_: F,(t)dt. (7)
187. The activity in diet at time t, C(t) can be related to the deposition at time r, F ,( r) by the relation
C(t) = f ~ K(t,r)F,(r)dr, (8)
which serves to define the deposit-to-diet transfer function K ( t, r). In practice data are available on a monthly or annual basis so that the integral in ( 8) is replaced by a sum, so the activity in diet in year n is given by
i = n C(n) = I K(n,i)FrU) (9)
i=-eo
where Fr(i) is the deposition in year i. If it is assumed that the weighting function K(n, i) only depends upon the elapsed time (m = n-i) since deposition, the integrated dietary level over infinite time is then,
"' "' i=n IC= I C(n) = I k K(n-i)Fr(i)
n= -o, 11=-«> i=-eo "' 00 = I I K(n-i)F,(i)
j =-:.:, 11 = i "' "' = I K(m) I Fr(i)
m=O i=-"' co
IFr I K(m). (10) m=O
45
Thus the transfer coefficient P2a is given by
co
P2a = I K(m). m=O
(11)
188. In the 1962, 1964 and 1966 reports of the Committee, the following form of transfer function K(m) was used,
where
K(m) = p,. Sm + Pd exp(-,\m) (12)
Sm= 1, m=O 8m = 0, m'FO
Thus the level in diet during year n is
CX)
C(n) = I p,.8mFr(n-m) + PaFr(n-m)exp(-,\m) m=O
= p,.Fr(n) + PdFd(n) (13)
where ,\ is the physical decay constant of 00Sr and F,dn) the cumulative deposition up to yearn. This type of transfer function has been widely used to relate the 00Sr activity in national milk supplies to deposition in previous years. Bartlett (32) found that equation 13 did not adequately fit the United Kingdom data and therefore proposed a relationship of the type
C(n) = P1 Fr(n) + Pe Fo(n-1) + Ps [Fa(n-]) exp(-l.25p.)
00
+ I Fr(n-m)exp(-p.m)] (14) m=2
where Fa(n) and Fb(n) are the deposition in the first and second half of year n, respectively, and p. is a decay constant which combines the physical decay of 90Sr and any increasing unavailability of 00Sr in the soil to plants, which is assumed to be exponential.
189. Since most of the food levels in the world have been reported on a calendar-year basis a relationship of the form
C(n) = P1 Fr(n) + Ps F,(n-1) co + p3 I Fr(n-m)exp(-p.m) (15)
m=2
can be used in an attempt to accommodate the effect of food storage from one year to the next.
190. In fitting by least squares the transfer functions of equations 14 and 15 to milk and deposit data, all the parameters P1, Ps, p3, and ,_,. are allowed to vary. Bartlett (32) found that equation 14 gave an excellent fit to the United Kingdom data and obtained a shorter mean residence time in soil of 6. 7 years. On the other hand, when both equations are fitted to the data of New York and Denmark, equation 15 gives a better fit. The average 90Sr/Ca ratios in milk for the northern hemisphere have also been fitted to the fall-out data for the 30°-50° N latitude band using equation 15. The estimates of the parameters thus obtained, together with the value of P2 :i computed from equation 11. are shown in table 33. The values of ,_,. obtained indicate that the effective mean life of 90Sr in soil is between 7 and 10 years which is smaller than reported in earlier Committee reports; however, several more years of

data will be required to determine p. with greater confidence. The fits obtained with data from a number of
50
40
,.... I ro (.)
...9 .... Cl)
g 30
~
20
10
1954
• The dot~ are mus.urtd annual a·,·i:ragc ~·11lues
_ Tht! 1ine1 con.nect poiriu ,~prtu!'lting the c..lcuL,rtd ,,aJu:s for ttth year
~
UNITED KINGDOM
1956 1958 1960 1962
areas and with the pooled data from the northern hemisphere are shown in figure XVIII.
1964 1966 1968 1970
Year
Figure XVIJI. Measured and calculated annual average oosr/Ca ratios in milk. The calculated results are based upon deposition data. Equation 15 was used for all results except for those of the United Kingdom for which equation 14 was applied. The curves for New York (USA), Denmark and the northern hemisphere are displaced upwards by 10, 20 and 30
divisions, respectively, for clarity
191. In 1970 the 00Sr/Ca level in milk in the northern hemisphere was 7.4 pCi (gCa)-1 and the corresponding integrated level 161 pCi y (gCa)-1
( table 30). Assuming an effective mean life in the soil of 10 years (table 33, northern hemisphere) the estimated future integrated level in milk is 74 pCi y (g<;a)-1 giving a total integrated level in milk of 235 pC1 y (gCa)-1. With an integrated deposition (40-600 N) up to 1970 inclusive of 80 mCi km-2 (table 26) a value of 2.9 is obtained for the deposit-to-milk transfer coefficient P~a (milk). From table 33 we can assign a lower limit to the mean life in the soil of 5.5 years, while the upper limit is 40 years. Using these values one obtains lower and upper limits to P23 of 2.5 and 5.7. A value of 5 was used in the 1969 report of the Committee. In this report a value of 3.2 is taken (table 33)
46
for the purposes of computing dose commitments. The deposit-to-diet transfer coefficient is obtained from the corresponding value for milk by multiplying by 1.4, resulting in P23 (diet) = 4.5 pCi y (gCa)-1 per mCi km-2• The value of this factor is based upon data from countries in northern temperate latitudes which have a western type diet. It may be different for other types of diet or in other geographical regions. However, since there are few data from other regions. the value of 4.5 will be assumed to apply globally, for the purposes of computing doses.
(iv) Levels in bone
192. New data on 90Sr in bone are shown in table 34, including results from the limited bone-sampling programme undertaken by the World Health Organiza-
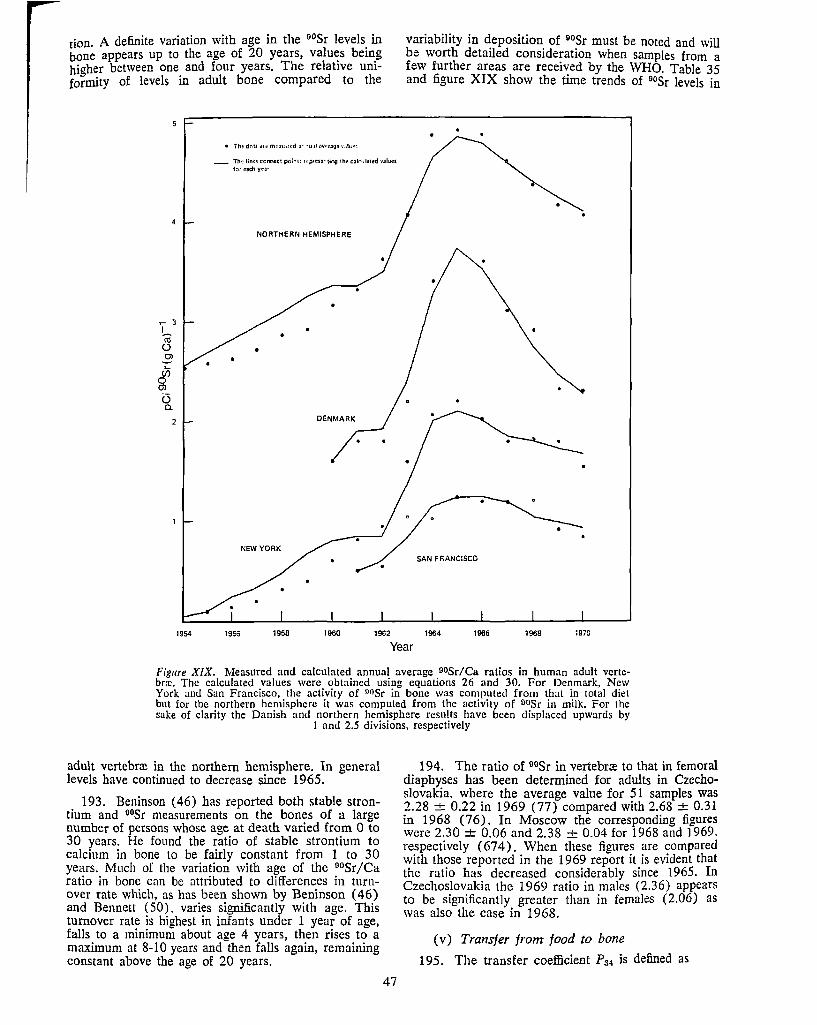
tion. A definite variation with age in the 00Sr levels. in bone appears up to the age of 20 years, valu~s bem_g higher between one and four years. The relative uruformity of levels in adult bone compared to the
variability in deposition of 90Sr must be noted and will be worth detailed consideration when samples from a few further areas are received by the WHO. Table 35 and figure XIX show the time trends of 00Sr levels in
_ Th'-' lint.-1 connect point~ ,~prcs~nti~ tht calculated~·alues
,.... 3 I ro (.) Ol
t 0 a.
2
fer each y,:-~r
NORTHERN HEMISPHERE
1954 1956 1958 1960 1962 1964 1966 1968 1970
Year
Figure XIX. Measured and calculated. annua~ average .oosr/Ca ratios in human adult vertebr.c. The calculated values were obtained usmg equations 26 and 30. For Denmark, New York and San Francisco, the activity of oosr in bone was computed from that in total diet but for the northern hemisphere it was computed from the activity of oosr in milk. For the sake of clarity the Danish and northern hemisphere results have been displaced upwards by
1 and 2.5 divisions, respectively
adult vertebrre in the northern hemisphere. In general levels have continued to decrease since 1965.
193. Beninson ( 46) has reported both stable strontium and o0sr measurements on the bones of a large number of persons whose age at death varied from O to 30 years. He found the ratio of stable strontium to calcium in bone to be fairly constant from 1 to 30 years. Much of the variation with age of the 00Sr/Ca ratio in bone can be attributed to differences in turnover rate which, as has been shown by Beninson ( 46) and Bennett ( 50), varies significantly with age. This turnover rate is highest in infants under 1 year of age, falls to a minimum about age 4 years, then rises to a maximum at 8-10 years and then falls again, remaining constant above the age of 20 years.
47
194. The ratio of 00Sr in vertebrre to that in femoral diaphyses has been determined for adults in Czechoslovalda, where the average value for 51 samples was 2.28 -+- 0.22 in 1969 (77) compared with 2.68 ± 0.31 in 1968 (76). In Moscow the corresponding figures were 2.30 ± 0.06 and 2.38 + 0.04 for 1968 and 1969. respectively ( 67 4) . When these figures are compared with those reported in the 1969 report it is evident that the ratio has decreased considerably since 1965. In Czechoslovakia the 1969 ratio in males (2.36) appears to be significantly greater than in females (2.06) as was also the case in 1968.
(v) Transfer from food to bone
195. The transfer coefficient Pa-1 is defined as
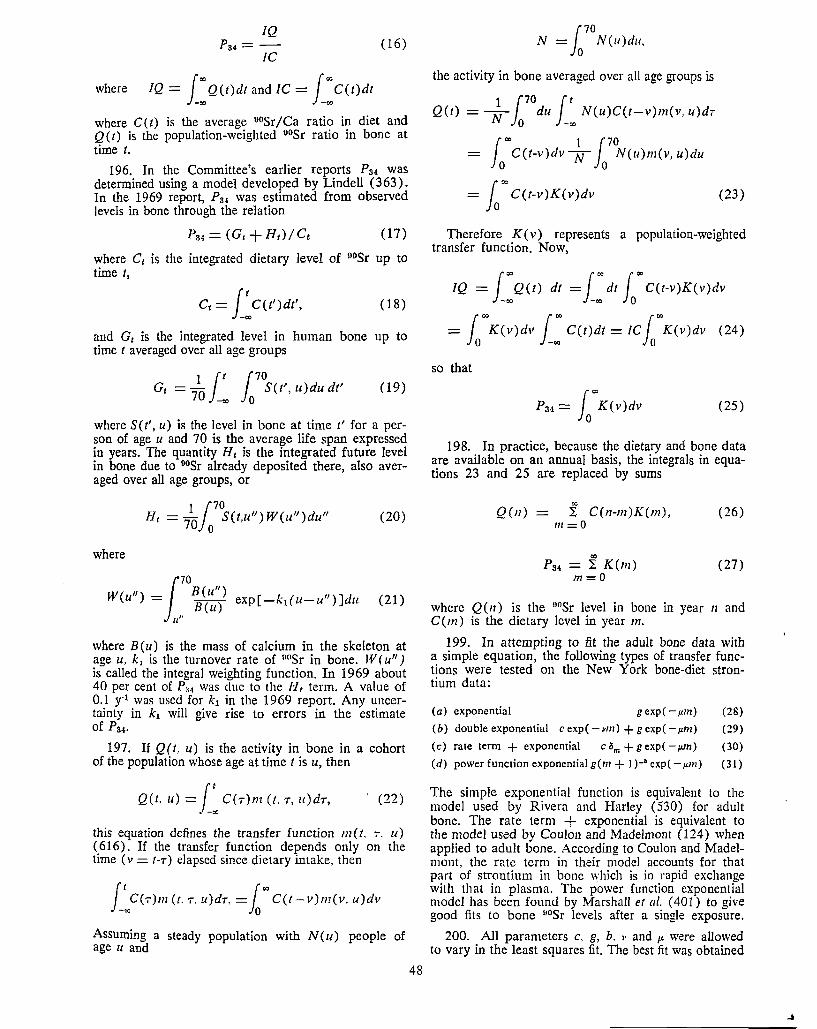
IQ Ps4=- (16)
IC
where IQ= J~ Q(t)dt and IC= i: C(t)dt
where C(t) is the average 00Sr/Ca ratio in diet and Q(t) is the population-weighted 00Sr ratio in bone at time t.
196. In the Committee's earlier reports Ps,t was determined using a model developed by Lindell ( 3 63). In the 1969 report, P 34 was estimated from observed levels in bone through the relation
(17)
where C1 is the integrated dietary level of 00Sr up to time t,
Ct = i: C(t')dt', (18)
and G1 is the integrated level in human bone up to time t averaged over all age groups
l ft f10 G1 = 70 -«> Jo S(t', u)du dt' (19)
where S ( t', u) is the level in bone at time t' for a person of age u and 70 is the average life span expressed in years. The quantity H, is the integrated future level in bone due to 00Sr already deposited there, also averaged over all age groups, or
1 [10 H, =
70)
0 S(t,u") W(u")du"
where
170
W(u") = B(u") B(u)
u''
exp[-ki(u-u")]du
(20)
(21)
where B(u) is the mass of calcium in the skeleton at age u, k1 is the turnover rate of 00Sr in bone. W ( u") is called the integral weighting function. In 1969 about 40 per cent of Pa.1 was due to the H, term. A value of 0.1 y·1 was used for k1 in the 1969 report. Any uncertainty in k1 will give rise to errors in the estimate of Ps4,
197. If Q(t, u) is the activity in bone in a cohort of the population whose age at time t is u, then
Q(t, u) = i: C(T)m (t, T, u)dT, . (22)
this equation defines the transfer function m(t. -;-, u) ( 616). If the transfer function depends only on the time (v = t-,) elapsed since dietary intake, then
f I C(,)m (t. ;, u)d,. = {"' C(t-v)m(v, u)dv -,,, lo Assuming a steady population with N(u) people of age u and
48
[70 N = Jo N(u)du,
the activity in bone averaged over all age groups is
1 170 Jt Q(t) = N du N(u)C(t-v)m(v, u)d, 0 -co
{"' 1 170 = JO
C(t-v)dv N O
N(u)m(v, u)du
= lace C(t-v)K(v)dv (23)
Therefore K ( v) represents a population-weighted transfer function. Now,
IQ = J"' Q(t) dt =1"' dt {"' C(t-v)K(v)dv --eo _,, lo
= {"' K(v)dv f 00 C(t)dt = IC f00
K(v)dv (24) lo _.,, lo so that
(25)
198. In practice, because the dietary and bone data are available on an annual basis, the integrals in equations 23 and 25 are replaced by sums
Q(n) f C(n-m)K(m), (26) 111 = 0
"' Ps4 = ~ K(m) (27) m=O
where Q ( n) is the 00Sr level in bone in year n and C(m) is the dietary level in year m.
199. In attempting to fit the adult bone data with a simple equation, the following types of transfer functions were tested on the New York bone-diet strontium data:
(a) exponential g exp(-µm) (28)
(b) double exponential cexp(-vm) +cexp(-µm) (29)
(c) rate term+ exponential cam +cexp(-µm) (30)
(d) powerfunctionexponentialg(m+J)-&exp(-µm) (31)
The simple exponential function is equivalent to the model used by Rivera and Harley (530) for adult bone. The rate term + exponential is equivalent to the model used by Coulon and Madelmont (124) when applied to adult bone. According to Coulon and Madelmont, the rate term in their model accounts for that part of strontium in bone which is in rapid exchange with that in plasma. The power function exponential model has been found by Marshall et al. ( 401) to give good fits to bone 00Sr levels after a single exposure.
200. All parameters c. g, b. i, and µ. were allowed to vary in the least squares fit. The best fit was obtained
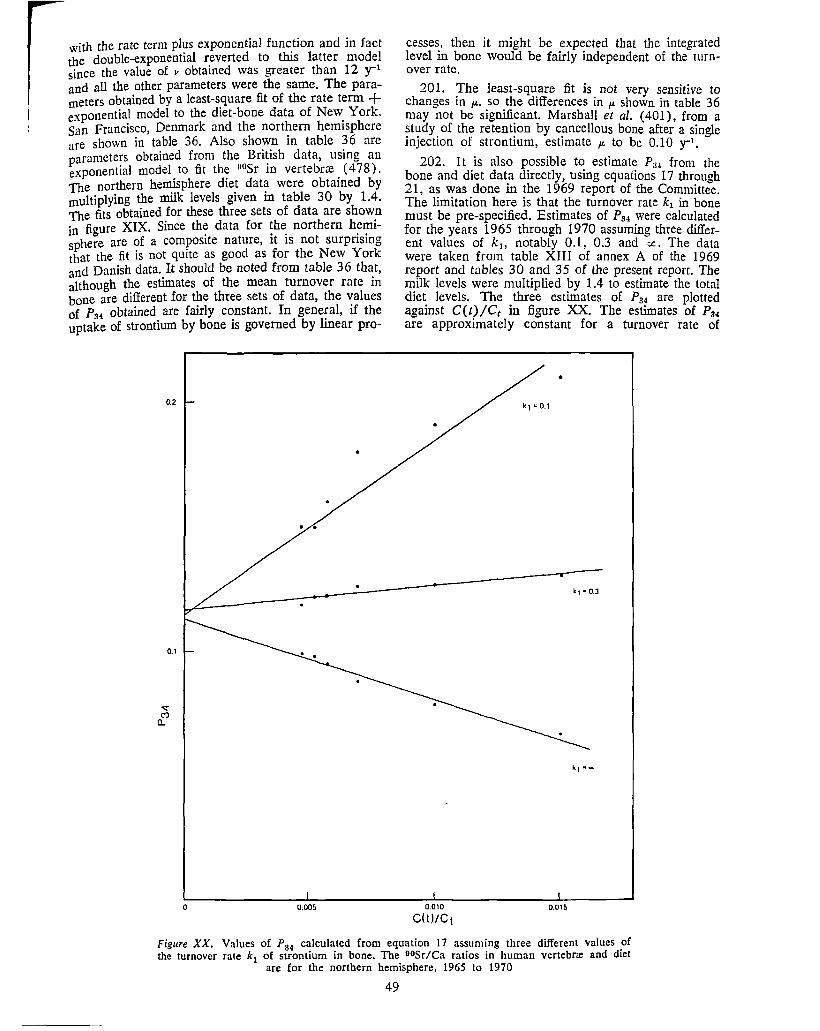
with the rate term plus exponential function and in fact the double-exponential reverted to this latter model since the value of v obtained was greater than 12 y-1
and all the other parameters were the same. The parameters obtained by a Jeast-s_quare fit of the rate term + exponential model to the diet-bone data of New. York, San Francisco, Denmark and the nort~ern hemisphere are shown in table 36. Also shoyt.n m table ~6 are parameters obtained from the Bn~1sh data, usmg an exponential model. to fit th~ 00Sr m vertebra!. ( 4 78). The northern hen:1sphere die~ dat~ were obtamed by multiplying the milk levels given m table 30 by 1.4. The fits obtained for these three sets of data are shown in figure XIX. Since th~ data for ~e. northern h~1;1i-phere are of a composite nature, 1t 1s not surpnsmg
~hat the fit is not quite as good as for the New York and Danish data. It should be noted from table 36 that, although the estimates of the mean turnover rate in bone are different for the three sets of data, the values of P34 obtained are fairly c~nstant. In gene:al, if the uptake of strontium by bone 1s governed by linear pro-
0.2
0.1
0 0.005
cesses, then it might be expected that the integrated level in bone would be fairly independent of the turnover rate.
201. The least-square fit is not verv sensitive to changes in µ., so the differences in µ. sho\vn in table 36 may not be significant. Marshall et al. ( 401), from a study of the retention by cancellous bone after a single injection of strontium, estimate µ. to be 0.10 y-1.
202. It is also possible to estimate P34 from the bone and diet data directly, using equations 17 through 21, as was done in the 1969 report of the Committee. The limitation here is that the turnover rate k1 in bone must be pre-specified. Estimates of Pai were calculated for the years 1965 through 1970 assuming three different values of k1, notably 0.1, 0.3 and 'l.l. The data were taken from table XIII of annex A of the 1969 report and tables 30 and 35 of the present report. The milk levels were multiplied by 1.4 to estimate the total diet levels. The three estimates of P34 are plotted against C(t)/Ct in figure XX. The estimates of P84 are approximately constant for a turnover rate of
•
0.010 0.015
C(t)/Ct
Figure XX. Values of P 34 calculated from equation 17 assuming three different values _of the turnover rate k1 of strontium in bone. The OOSr/Ca ratios in human vertebra: and diet
are for the northern hemisphere, 1965 to 1970
49
k 1 = 0.3 y-1, indicating that this turnover rate is about correct for the data. If straight lines are drawn through the three sets of points, they intersect the C ( t) IC, = 0 axis at about P34 = 0.12.
203. Thus these estimates of both the turnover rate and P3.1 are in agreement with those in table 36 for the northern hemisphere data. A value of 0.12 will be taken for P34 to compute the dose commitment from gosr.
204. A transfer function P:;4 for stable strontium can also be determined by the same rate term + exponential model (equation 30) as used for 90Sr. Since there is no radio-active decay, µ. must be reduced by 0.025. If this is done for the parameters of the New York and San Francisco data shown in table 36, stable strontium values of P34 for New York and San Francisco of 0.14 and 0.18, respectively, are obtained. Rivera (529) reported values of 0.16 and 0.16, respectively, based upon stable strontium measurements in bone and diet.
(vi) Dose commitment from 90Sr
205. For the purpose of dose estimation, it was previously assumed by the Committee that 90Sr is uniformly distributed in the seven kilogrammes skeleton of standard man (616). Committee II of the ICRP has recently qualified the skeletal mass to include five kilogrammes of bone mineral in addition to cartilage and peri-articular tissue ( 401). Assuming the 90Sr to be uniformly distributed only in bone mineral has the effect of increasing D0 , the dose rate per unit activity to a small tissue-filled cavity in bone. D 0 is given by Spiers (577)
D0 = Nm E (ST/SB)m (KB/KT) '·.
where Nm= 1.17 10° M-1 y-1 per pCi (gCa)-1 = number of beta particles emitted per picocurie of 90Sr per gramme of calcium; M = 5, being the mass, in grammes. of mineral bone per gramme of calcium ( 401, 650); E = the effective energy of beta-rays emitted (1.13 MeV for 90Sr + 90Y); (S.T/Sn)m = the ratio of the mass stopping powers in tissue and bone = 1.07 (52); Kn and KT = factors allowing for the effect of scattering on the effective particle range, assumed to be unity here (163). So that D 0 = (1.17 106 1.13 1.6 10-5 1.07)/5 = 4.5 mrad y-1 per pCi (gCa)-1.
206. Spiers ( 5 80) has re-estimated the values of D,,JDa and D,/D0 where D111 and D8 are the dose rates in bone marrow and endosteal cells, respectively, per unit activity in bone. The new values are:
Cortical contribution ............. . Trabecular contribution
TOTAL
Using these values we obtain:
D ID DID m ,
0.055 0.260
0.315
0.082 0.352
0.434
?45 (marrow) = 4.5 0.315 = 1.42 mrad per pCi y (gCa)-1
?45 (endosteal cells) = 4.5 0.434 = 1.95 mrad per pCi y (gCa)-1
The values used in the Committee's 1969 report were 0.55 for doses to marrow and 1.1 for doses to endosteal cells.
50
207. The following values of the transfer coefficients are used:
P23 (fall-out/diet) = 4.5 pCi y (gCa)-1 per mCi km·2 (paragraph 191),
P:H (diet/vertebrre) = 0.12 pCi y (gCa)·1 per pCi y (gCa)·l (paragraph 203),
P4a (bone marrow) = 1.42 mrad per pCi y (gCa)·1
(paragraph 206), P~:-, (endosteal cells) = 1.95 mrad per pCi v (gCa)·1
(paragraph 206). ·· · ' -~
The deposition from 00sr from all tests to 1970 in the temperate zones is taken to be (tables 26 and 27)
Northern hemisphere . . . . . . . . 80.3 (58.4)5 mCi km-2 Southern hemisphere . . . . . . . . . 22.1 (13.9) rnCi km-2
The resulting estimates of dose commitment are shown in table 37.
(f) Jodine-131
208. Eleven radio-active isotopes of iodine, most of them short-lived, originate in nuclear fission. Only 1311, because of its half-life of eight days, is present in significant amount in the long-range tropospheric fall-out shortly after atmospheric nuclear detonations. Iodine-129 (half-life 1.6 107 years) is a negligible radiation hazard in fall-out as its activity is very low.
209. Iodine present in diet in soluble form is probably completely absorbed from the gastro-intestinal tract into the blood and is selectively concentrated in the thyroid gland. The stable iodine concentration in the thyroid tissue is of the order of 400 to 500 microgrammes per gramme of tissue while in the rest of the body it is much less than one microgramme per gramme ( 5 77). The mass of the thyroid is of the order of 20 grammes in the adults and about 10 times less in 0-1-year-old babies (144, 430). Consequently, young children receive a higher dose than adults from a given intake of radio-iodine. The dose to the whole body is of the order of a thousandth of that to the thyroid (36).
(i) Transfer to man
210. Ingestion and inhalation are the two principal modes of entry of 131! into the body. The transfer to man by ingestion is complex as it depends on a variety of factors including meteorological conditions, agricultural practices and biological variability.
211. Radio-active fall-out is observed to circle the earth in 20-30 days on average (527) which is approximately the mean residence time of an aerosol in the troposphere. It is unlikely that during such a short period the clouds of debris become well mixed. The surface-air concentration of 1311 at a particular station will fluctuate according to meteorological conditions and will not necessarily be representative of a larger region nor of a latitude band ( 48 6).
212. Information on the physical and chemical nature of fall-out 1311 is very limited. In the United Kingdom, late 1961, an average 75 per cent of the activity was in particulate form. the rest being in the gaseous state (152), but in the United States in 1962 the particulate fraction \Vas found to vary from 10 to 90 per cent ( 500). These large variations are thought to be
5 Figures in brackets refer to the whole hemispheres. the others to the northern and southern temperate zones (40'-60').
due both to the origin of the fall-out and to the history of the air masses undergoing physical and chemical transformations during the travel.
213. Radio-iodine is deposited on the ground and on vegetation by dry and wet processes. The rate of dry deposition is characterized by the deposition velocity which, for rn1 fall-out. is of the order of 5 10--~m s-1
( 107). When precipitation occurs, 131 I is deposited at a much faster rate than in dry weather, essentially by rain-out. or in-cloud, mechanisms rather than by wash-out, or below-the-cloud, processes ( 614). For instance, during the period June-September 1970, owing to the frequent occurrence of rain in Cape Town, South Africa. the deposition-to-surface-air concentration ratio was an order of magnitude higher in that city than in Pretoria, where it rained only four days ( 624). On the other hand, rain will wash the surfaces of the leaves and thus remove some of the radio-iodine ( 156). Chamberlain and Chadwick (107) calculated that, from September to December 1961, only about half of the 131I falling out in rain was retained on herbage. Other processes, such as mechanical disturbance and re-volatilization, enhance the decrease of grass contamination. Evidence from laboratory experiments and nuclear industry releases shows that the effective half-time of 131I on herbage is 3-6 days, most estimates lying around 5 days ( 53). Unfortunately, the results of measurements of 131 I in world-wide fall-out cannot be used to test the foregoing estimates as quantitative observations are usually obscured by the rapidly changing pattern of fall-out ( 189).
214. Fresh milk is usually the main source of 131I in food because of the concentration achieved by the grazing animal and the short storage period of milk. The extent to which 131 I is transferred from vegetation to milk varies widely depending mainly upon density of the herbage and on feeding · practices. The animal may feed partly only, or not at all, on contaminated grass and the milk produced may be diluted with uncontaminated milk at a dairy. Garner and Russell ( 189) suggested that from laboratory experiments the maximum level in cow's milk from continuous grazing after a single deposition of 1 pCi m-2 might be 0.15 pCi I-1, corresponding to an integrated level of 1.5 pCi d 1-1 and mentioned that 1311 in tropospheric fallout might be reduced in availability because of its physical form. This hypothesis seems to be confirmed by fall-out results from Argentina, where the relationship between integrated milk level and deposition is 0.23 pCi d 1-1 per pCi m-2 and shows little variation from year to year (47). On the other hand, the transfer coefficient from deposition to diet for ewes and goats is probably much higher as a considerable fraction of their 1311 intake is secreted in milk (189).
215. Milk dominates as a source of 1311 ingestion in areas where it is a major dietary component, but vegetables are probably the main source of intake where little milk is consumed (657). However. only milk will be considered here because of its important world-wide contribution in the diet of infants. It should be noted that there are three sources of milk in infants' diet: human milk. fresh milk from animals such as goats and cows, and dried or evaporated milk. Only fresh milk of animal origin contributes 131 I to their diet to a significant extent. In the United States. infants of more than six months of age consume mainly this kind of milk and their daily milk intake from six months to two years is about 0. 7 litre ( 150). This figure has
51
been assumed to be representative of many areas of the world.
(ii) Doses
216. The Committee, in its 1964 report, estimated i:t 16.5 rads the dose to the thyroid of a baby of less than two years of age resulting from the inoestion of one microcurie of 131I. Similar results can ''be found in recent publications. Morley and Bryant ( 435), using values of parameters revised by the United Kin2dom Medical Research Council in 1968. obtained a value of 15.5 rads per microcurie for a six-month-old baby while, according to Neil and Robinson·s data ( 457) the corresponding figure for a 6-11-month-old baby is 18.5 rads.
217. Adopting average values for the parameters discussed above (table 38), the dose from 131I fall-out to the thyroid of infants can be estimated at 4.0 mrad per pCi d m-a. The corresponding dose to adults should be at least an order of magnitude lower because their average milk consumption is much less ( 620) and the mass of their thyroid is approximately 10 times larger.
218. Inhalation is another possible mode of exposure which can only be predominant when deposition of 1311 does not result in the contamination of the diet. Assuming that the blood uptake after inhalation is 0.75 of the uptake from ingestion and that six cubic metres of air are inspired daily by an infant ( 86), an integrated air concentration of 1 pCi d m-3 would lead to a thyroid dose of about 0.07 millirad.
219. Because 1311 deposition patterns are unpredictable, doses can only be calculated if the local deposit and transfer coefficients are known or if milk levels are measured. Since these are often not available from large areas of the world, it is not possible to estimate dose commitments on the global scale but only those to local groups whose milk supply has been adequately monitored.
220. During the period from 1951-1958, the pattern of weapons testing was such that copious tropospheric fall-out was produced, but neither interest in 131 I nor the proper tools for measuring it existed at that time (156). Integrated milk levels, crudely derived from beta air concentrations, were estimated to be of the order of one microcurie day per litre in certain areas of Utah, United States in 1952, 1953 and 1957 (491). Milk contamination from atmospheric tests during the period 1961-1968 was examined by the Committee in its 1964, 1966 and 1969 reports. In the northern hemisphere, the highest levels in milk were observed in Alaska in 1962 (37.800 pCi d 1-1 ). while in the southern hemisphere, the highest values were reported in Argentina in 1966 (27,000 pCi d 1-1 ).
221. Integrated milk levels resulting from the atmospheric tests conducted in 1970 and 1971 in the southern hemisphere are presented in table 39. The milk contamination pattern was clearly different in ~e two years but the values obtained in the same location are in general smaller than in 1966. There has been no report of significant milk contamination arising froi:n the atmospheric tests performed in the northern hemisphere from 1969 to 1971.
(g) Caesium-137
222. Caesium-137 produced by nuclear ~xplosions in the atmosphere is transported to the earth s surface
without fractionation with respect to 90Sr, as shown by the relative uniformity of the observed 137Cs/90Sr ratios in air and deposit, which lie around 1.6. Caesium-137 enters plants mainly through surface contamination and is absorbed readily in the human body where its biological half-life is about 100 days.
(i) Transfer from deposit to diet
223. The transfer from deposit to diet is normally characterized by high uptake during the first years after deposition and by a relatively small uptake subsequently. The main dietary sources of 137Cs are milk, meat, vegetables and cereals. A large number of milk analyses from different countries have been reported (table 29). Milk levels show a pronounced yearly cycle depending on deposition rates and agricultural practice, but the yearly mean level is representative of the dietary intake in that year. Milk being locally produced in most areas of the world, its levels are representative of the contamination of the regional agricultural production.
224. In a given country, variations of an order of magnitude from one region to another are common. Low concentrations predominate in the temperate regions where caesium is :fixed in the solid phases of the soil and milk levels are strongly dependent on the deposition rate of the same year and of the preceding year. In those regions, the annual 137Cs concentrations were fairly stable from 1968 to 1971. On the other hand, high concentrations, explained by a significant uptake from soils low in potassium and high in organic content, are mainly dependent on the 137Cs cumulative deposit (2. 655, 673). From 1968 to 1970. the milk levels in those regions decreased with a half-time of about five years. The highest reported levels in 1970 ( 620 pCi 1-1 with a range 70-1,600 pCi 1-1 ) were found in some forest areas of the Byelorussian SSR, where an increased uptake of 137Cs from the soil into plants was most common in areas of peaty bog and clayed podzolic sandy soils with a high water-table, high moisture content and low pH ( 673).
225. On a world-wide scale, high milk levels are predominantly found in the high latitudes of the northern hemisphere but tracer experiments indicate that uptake of 137Cs from red, lateritic and alluvial soils common in the tropics and subtropics might also be considerably higher than uptake from the clay soils of temperate regions ( 182). Unfortunately, measurements in local food products or people in the tropics are scarce.
226. Yearly averages of 137Cs dietary intakes in various countries, summarized in table 31, are not closely related to milk levels for various reasons. Widespread distribution of grain products and meat, which provide about half of the 137Cs intake, tend to smooth out the local variations observed in milk contamination. Furthermore, the grain products are often stored and may thus be representative of an earlier fall-out situation. This also applies to meat when livestock is fed with grain products prior to marketing.
227. Levels in such dietary items as fish or mushrooms depend strongly upon cumulative deposition. In the :ase of fresh-water fish, the activity concentrations are mversely related to the potassium content of the water (334). so that the activity of fresh-water fish can be one hundred times that of ocean fish. with a maximum value of a few nanocuries per kilogramme in
52
fresh-water fish (166, 213). In 1968, fish accounted for 7 per cent of the 137es dietary intake in Denmark. Mushrooms were shown to concentrate very effectively 137Cs from soils with a high organic content (211, 296). Typical levels are several tens of nanocuries per kilogramme so that a single meal of mushrooms may increase the normally incorporated 137Cs content to a considerable degree. As a result of these factors, the relative contribution of the individual food-stuffs varies from year to year and levels in diet have decreased between 1968 and 1970.
228. In its 1969 report, the Committee estimated at 4.1 pCi y (gK)-1 per mCi km-? the transfer coefficient P2a from deposition to diet This value has been confirmed by studies conducted in Denmark and in the Soviet Union. In Denmark (2), the influence of the soil uptake on the levels in diet was so small that reliable determinations of the soil factor have been impossible and the dietary intake was related to the annual deposition in the same year and in the two preceding years, yielding 4.1 pCi y (gK)-1 per mCi km-2 as P 23•
229. In the Soviet Union, the territory has been divided in two zones according to the importance of the soil factor which, although much greater than in Denmark, has not been calculated precisely ( 684). Assuming that the daily intake of potassium is 3.8 grammes and that the half-residence time of 137Cs in the soil is equal to its physical half-life, the coefficient P~11 lies in the range 3.8-7.3 and the contribution of the soil uptake is from 40 to 180 per cent of that of the surface uptake. If no major series of atmospheric tests takes place in the next few years. the contribution of the soil uptake will probably be more precisely determined.
230. Exceptionally high values have been observed in caribou and reindeer meat which is the staple food of the populations living in arctic regions. Levels of _137Cs in caribou and reindeer are high because the lichens, which are an important food for these animals during winter, effectively entrap a substantial proportion of the deposit falling on to them, and retain it with an apparent half-life of a few years due to grazing and leaching. Two other food chains participate in the accumulation of 137Cs in man more effectively in those regions than in the middle latitudes: fresh water-fishman and fresh water-plants-milk-man (519).
(ii) Transfer from diet to body
231. Caesium-13 7 ingested by man is rapidly distributed in the body, about 80 per cent being deposited in muscle and 8 per cent in bone. About 10 per cent is eliminated with a biological half-time of about one day, and the remainder is excreted at a slower constant rate (577). The observed half-life in adults varies between less than 50 and more than 200 days. Even within a relatively homogeneous group, the variability in half-life is considerable. The half-life in children is shorter than in adults and is of the order of ten days for new-born infants. Based on published data. McCraw ( 410) gave the empirical equation T 1/.2 (days) = 12.8 (11¥.. + exp (-u)) where u is age in years.
232. Table 40 and figure XXI present 187es levels in man in several countries. The average body content of 13;Cs in a population at a given time varies with individual values of the biological half-life and with
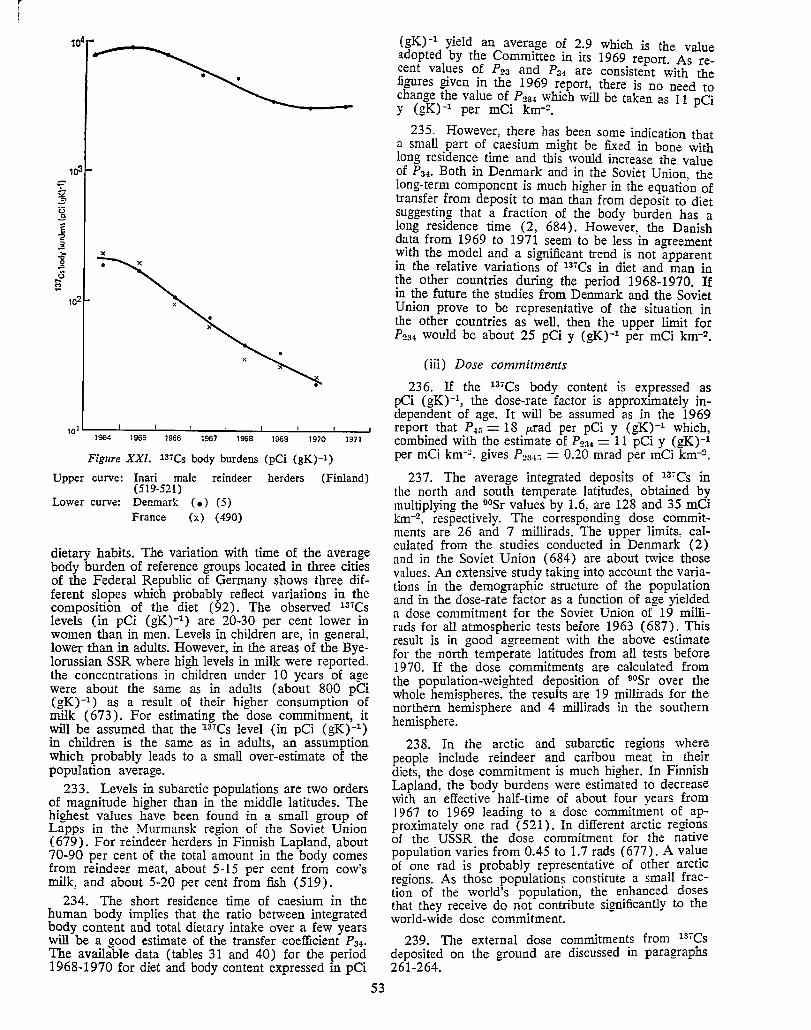
r I
r I
1a3 -g .; u ~
-8 5 .:, > X
"" 0 ..c u ...
!:? 102
101 '--,-96-4--'--,96-5-'--,-96-6-----1-96_7....:...._196-8-.1..-,-96-9--'--,-97-0--'--,g-7__.1
Figure XXI. 137Cs body burdens (pCi (gK)-1)
Upper curve: lnari male reindeer herders (Finland) (519-521)
Lower curve: Denmark ( •) (5) France (x) (490)
dietary habits. The variation with time of the average body burden of reference groups located in three cities of the Federal Republic of Germany shows three different slopes which probably reflect variations in ~e composition of the diet (92). The observed 13 '<;::s levels (in pCi (gK)-1 ) are 20-30 per cent lower rn women than in men. Levels in children are, in general, lower than in adults. However, in the areas of the Byelorussian SSR where hi!!h levels in milk were reported. the concentrations in children under 10 years of age were about the same as in adults (about 800 pCi (gK)-1) as a result of their higher consumption of milk ( 673). For estimating the dose commitment, it will be assumed that the 137Cs level (in pCi (gK)-1 )
(gK)-1 yield an average of 2.9 which is the value adopted by the Committee in its 1969 report. As recent values of P23 and P34 are consistent with the figures given in the 1969 report, there is no need to change the value of P2a4 which will be taken as 11 pCi y (gK)-1 per mCi km-2•
235. However, there has been some indication that a small part of caesium might be fixed in bone with long residence time and this would increase the value of P34. Both in Denmark and in the Soviet Union, the long-term component is much higher in the equation of transfer from deposit to man than from deposit to diet suggesting that a fraction of the body burden has a long residence time (2, 684). However, the Danish data from 1969 to 1971 seem to be less in agreement with the model and a significant trend is not apparent in the relative variations of 137Cs in diet and man in the other countries during the period 1968-1970. If in the future the studies from Denmark and the Soviet Union prove to be representative of the situation in the other countries as well, then the upper limit for P234 would be about 25 pCi y (gK)-1 per mCi km-2 •
(iii) Dose commitments
236. If the 137es body content is expressed as pCi (gK)-1, the dose-rate factor is approximately independent of age. It will be assu~ed as in the 1~69 report that P45 = 18 p.rad per pC1 y (gK)-1 which, combined with the estimate of P234 = 11 pCi y (gK)-1
per mCi km-~, gives P2:w-. = 0.20 mrad per mCi km-2•
237. The average integrated deposits of 137es in the north and south temperate latitudes, obtained b~ multiplying the 9°Sr values by 1.6, ar.e 128 and 35 m~1 km-2 , respectively. The correspondrng dose commitments are 26 and 7 millirads. The upper limits, calculated from the studies conducted in Denmark (2) and in the Soviet Union ( 684) are about twice those values. An extensive study taking into account the vaij.ations in the demographic structure of the population and in the dose-rate factor as a function of age yielded a dose commitment for the Soviet Union of 19 millirads for all atmospheric tests before 1963 ( 687). This result is in good agreement with the above estimate for the north temperate latitudes from all tests before 1970. If the dose commitments are calculated from the population-weighted deposition of _90_Sr over the whole helnispheres, the results are 19 millrrads for the northern helnisphere and 4 millirads in the southern hemisphere.
in children is the same as in adults, an assumption 238. In the arctic and subarctic regions where which probably leads to a small over-estimate of the people include reindeer a~d cariboi: meat in. th_eir population average. diets the dose commitment 1s much higher. In Fmmsh
Lapl~nd, the body burdens were estimated to decrease 233. Levels in subarctic populations are two orders with an effective half-time of about four years from
of magnitude higher than in the Iniddle latitudes. The 1967 to 1969 leading to a dose. commitme.nt of. ap-hi!!hest values have been found in a small group of Lapps in the Murmansk recrion of the Soviet Union proximately one rad (521). In different arctic regi~ns
::;,· of the USSR the dose commitment for the native (679). For reindeer herders in Finnish Lapland, about population varies from 0.45 to 1.7 rads (677). A val~e 70-90 per cent of the total amount in the body comes of one rad is probably representative of other arctic from reindeer meat, about 5-15 per cent from cow's re2:ions. As those populations constitute a small frac-milk, and about 5-20 per cent from fish (519). tion of the world's population, the enhanced doses
234. The short residence time of caesium in the that they receive do not contribute significantly to the human body implies that the ratio between integrated world-wide dose commitment. body content and total dietary intake over a few years . f 1a-es will be a oood estimate of the transfer coefficient P34• 239. The external dose comillltment_s rom ' The availtble data ( tables 31 and 40) for the period deposited on the ground are discussed m paragraphs 1968-1970 for diet and body content expressed in pCi 261-264.
53
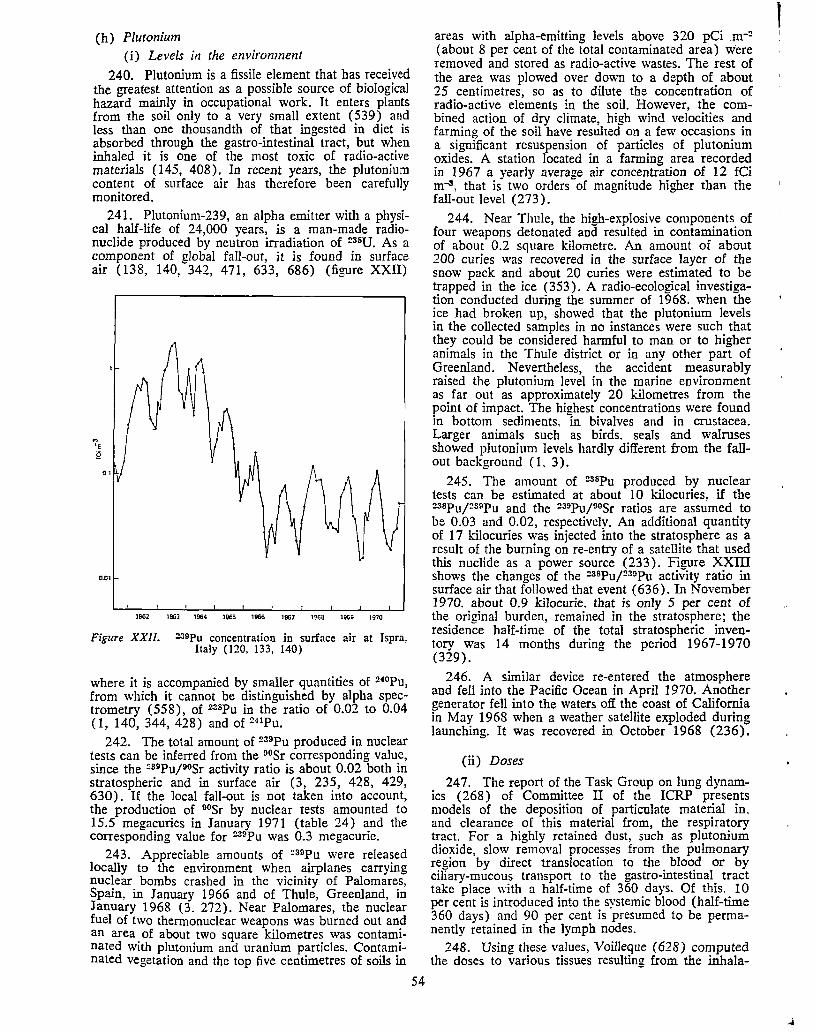
(h) Plutonium (i) Levels in the environment
240. Plutonium is a fissile element that has received the greatest attention as a possible source of biological hazard mainly in occupational work. It enters plants from the soil only to a very small extent ( 539) and less than one thousandth of that ingested in diet is absorbed through the gastro-intestinal tract, but when inhaled it is one of the most toxic of radio-active materials (145, 408). In recent years, the plutonium content of surface air has therefore been carefully monitored.
241. Plutonium-239, an alpha emitter with a physical half-life of 24,000 years, is a man-made radionuclide produced by neutron irradiation of 236U. As a component of global fall-out, it is found in surface air ( 138, 140, 342, 471, 633, 686) (figure XXII)
1962 l96J 1964 1965 1966 1967 1960 1969 1970
Figure XXII. ~opu concentration in surface air at lspra, Italy (120, 133, 140)
where it is accompanied by smaller quantities of 240Pu, from which it cannot be distinguished by alpha spectrometry (558), of 238Pu in the ratio of 0.02 to 0.04 (1, 140, 344, 428) and of 241Pu.
242. The total amount of 239Pu produced in nuclear tests can be inferred from the 00Sr corresponding value, since the 2a9pu;oosr activity ratio is about 0.02 both in stratospheric and in surface air (3, 235, 428, 429, 630). If the local fall-out is not taken into account, the production of 90Sr by nuclear tests amounted to 15.5 megacuries in January 1971 (table 24) and the corresponding value for 239Pu was 0.3 megacurie.
243. Appreciable amounts of ~39Pu were released locally to the environment when airplanes carrying nuclear bombs crashed in the vicinity of Palomares, Spain, in January 1966 and of Thule, Greenland, in January 1968 (3. 272). Near Palomares, the nuclear fuel of two thermonuclear weapons was burned out and an area of about two square kilometres was contaminated with plutonium and uranium particles. Contaminated vegetation and the top five centimetres of soils in
54
areas with alpha-emitting levels above 320 pCi m-2
(about 8 per cent of the total contaminated area) were removed and stored as radio-active wastes. The rest of the area was plowed over down to a depth of about 25 centimetres, so as to dilute the concentration of radio-active elements in the soil. However, the combined action of dry climate, high wind velocities and farming of the soil have resulted on a few occasions in a significant resuspension of particles of plutonium oxides. A station located in a farming area recorded in 1967 a yearly average air concentration of 12 fCi m-3, that is two orders of magnitude higher than the fall-out level (273).
244. Near Thule, the high-explosive components of four weapons detonated and resulted in contamination of about 0.2 square kilometre. An amount of about 200 curies was recovered in the surface layer of the snow pack and about 20 curies were estimated to be trapped in the ice ( 353). A radio-ecological investigation conducted during the summer of 1968. when the ice had broken up, showed that the plutonium levels in the collected samples in no instances were such that they could be considered harmful to man or to higher animals in the Thule district or in any other part of Greenland. Nevertheless, the accident measurably raised the plutonium level in the marine environment as far out as approximately 20 kilometres from the point of impact. The highest concentrations were found in bottom sediments. in bivalves and in crustacea. Larger animals such as birds. seals and walruses showed plutonium levels hardly different from the fallout background (1. 3).
245. The amount of 238Pu produced by nuclear tests can be estimated at about 10 kilocuries, if the 23BPuf239Pu and the 239Pu/90Sr ratios are assumed to be 0.03 and 0.02, respectively. An additional quantity of 17 kilocuries was injected into the stratosphere as a result of the burning on re-entry of a satellite that used this nuclide as a power source (233). Figure XXIII shows the changes of the 236Pu/239Pu activity ratio in surface air that followed that event (636). In November 1970. about 0.9 kilocurie. that is only 5 per cent of the original burden, remained in the stratosphere; the residence half-time of the total stratospheric inventory was 14 months during the period 1967-1970 (329).
246. A similar device re-entered the atmosphere and fell into the Pacific Ocean in April 1970. Another generator fell into the waters off the coast of California in May 1968 when a weather satellite exploded during launching. It was recovered in October 1968 (236).
(ii) Doses
247. The report of the Task Group on lung dynamics (268) of Committee II of the ICRP presents models of the deposition of particulate material in. and clearance of this material from, the respiratory tract. For a highly retained dust, such as plutonium dioxide, slow removal processes from the pulmonary region by direct translocation to the blood or by ciliary-mucous transport to the gastro-intestinal tract take place with a half-time of 360 days. Of this. 10 per cent is introduced into the systemic blood (half-time 360 days) and 90 per cent is presumed to be permanently retained in the lymph nodes.
248. Using these values, Voilleque (628) computed the doses to various tissues resulting from the inhala-
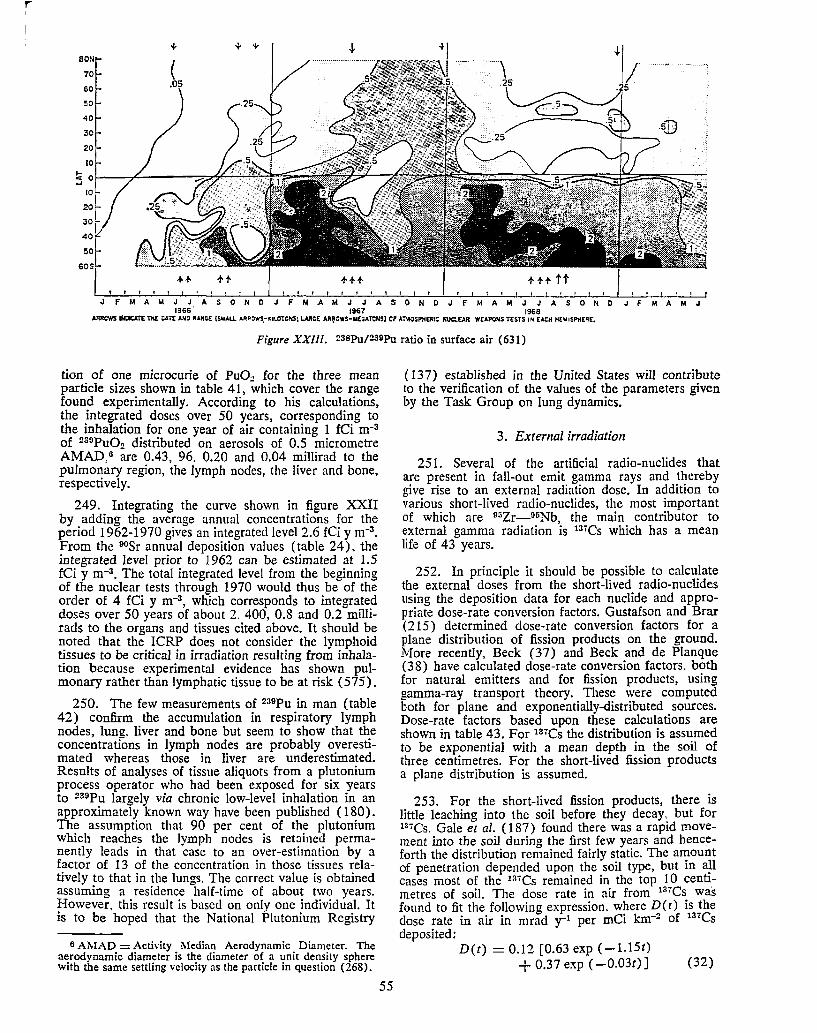
r-I
'r + 'I- + BON
70
60
so 40
30
\ +11 ,~
.25 "I---20,-
10 I-
:5 OL IOI 20-
30L
401.t
sol eosl
.f..f-
l f t I t I ' I I f I I ! I
JFMAMJJASONDJFMAMJJASONOJFMAMJJASONDJFMAMJ 1966 1967 1968
Allffl:WS IHCICATE Tlll: CATt ..,., RANQE ($11.&U. •••ows.-KILOTONS: UIIGE AR~OWS-111:.Al'tlNSI OF ATIIOSl'!IE!lt: NllC.£AR WEAPONS TESTS'" EAO! H[l<JSP>!£RE.
Figure XXIII. !!38Pu/!!39Pu ratio in surface air (631)
tion of one microcurie of PuO., for the three mean particle sizes shown in table 41, which cover the range found experimentally. According to his calculations, the integrated doses over 50 years, corresponding to the inhalation for one year of air containing 1 fCi m·3
of 230Pu02 distributed on aerosols of 0.5 micrometre AMAD,6 are 0.43, 96, 0.20 and 0.04 millirad to the pulmonary region, the lymph nodes, the liver and bone, respectively.
249. Integrating the curve shown in figure XXII by adding the average annual concentrations for the period 1962-1970 gives an integrated level 2.6 rei y m-3. From the 90Sr annual deposition values ( table 24), the integrated level prior to 1962 can be estimated at 1.5 fCi y m-a. The total integrated level from the beginning of the nuclear tests through 1970 would thus be of the order of 4 fei y m-s, which corresponds to integrated doses over 50 years of about 2. 400, 0.8 and 0.2 millirads to the organs and tissues cited above. It should be noted that the ICRP does not consider the lymphoid tissues to be critical in irradiation resulting from inhalation because experimental evidence has shown pulmonary rather than lymphatic tissue to be at risk (575).
250. The few measurements of 239Pu in man (table 42) confirm the accumulation in respiratory lymph nodes, lung. liver and bone but seem to show that the concentrations in lymph nodes are probably overestimated whereas those in liver are underestimated. Results of analyses of tissue aliquots from a plutonium process operator who had been exposed for six years to 239Pu largely via chronic low-level inhalation in an approximately known way have been published (180). The assumption that 90 per cent of the plutonium which reaches the lymph nodes is retained permanently leads in that case to an over-estimation by a factor of 13 of the concentration in those tissues relatively to that in the lungs. The correct value is obtained assuming a residence half-time of about two years. However, this result is based on only one individual. It is to be hoped that the National Plutonium Registry
6 Al\lAD = Activity Median Aerodynamic Diameter. The aerodynamic diameter is the diameter of a unit density sphere with the same settling velocity as the particle in question (268).
55
(137) established in the United States will contribute to the verification of the values of the parameters given by the Task Group on lung dynamics.
3. External irradiation
251. Several of the artificial radio-nuclides that are present in fall-out emit gamma rays and thereby give rise to an external radiation dose. In addition to various short-lived radio-nuclides, the most important of which are 95Zr-0GNb, the main contributor to external gamma radiation is 137Cs which has a mean life of 43 years.
252. In principle it should be possible to calculate the external doses from the short-lived radio-nuclides using the deposition data for each nuclide and appropriate dose-rate conversion factors. Gustafson and Brar (215) determined dose-rate conversion factors for a plane distribution of fission products on the ground. More recently, Beck (37) and Beck and de Planque (38) have calculated dose-rate conversion factors. both for natural emitters and for fission products, using gamma-ray transport theory. These were computed both for plane and exponentially-distributed sources. Dose-rate factors based upon these calculations are shown in table 43. For 137es the distribution is assumed to be exponential with a mean depth in the soil of faree centimetres. For the short-lived fission products a plane distribution is assumed.
253. For the short-lived fission products, there is little leaching into the soil before they decay, but for m·cs. Gale et al. (187) found there was a rapid movement into the soil during the first few years and henceforth the distribution remained fairly static. The amount of penetration depended upon the soil type, but in ajl cases most of the 137Cs remained in the top 10 centlmetres of soil. The dose rate in air from 137es wa·s found to fit the following expression. where D(t) is the dose rate in air in mrad y-1 per mCi km-:i of 137es deposited:
D(t) = 0.12 [0.63 exp (-1.15t) + 0.37 exp (-0.03t) J (32)

254. It is debatable whether, to allow for weathering, it is preferable to use a fixed exponential distribution in the soil or a dose rate that changes exponentially with time. There may also be some reduction in the gamma dose rate due to roughness of the terrain. In any case. large sections of the population live within paved cities, where a large fraction of the fission products would run off into the drainage system. Therefore, dose commitments calculated using the above models would probably give an upper limit.
(a) Dose commitment from short-lived fission products
255. In order to compute the dose commitment from the short-lived fission products it would be necessary to know the integrated deposition of each from 1950 until 1970. Although some data are available on the deposition of these fission products, they do not cover a long enough period to make an accurate estimate of the dose commitment possible. As in the previous Committee reports, we will rely on direct measurements.
256. The external dose in air from fission products in Tol-yo, measured at one metre above a paved surface between 1958 and 1967 was 121 millirads (445, 446, 658). Between 1962 and 1967, the dose one metre above a grassed plot in Chiba City, Japan, was 122 millirads (445, 446).
257. Gibson et al. (195) have reported results on the gamma radiation from deposited fall-out at Grove, United Kingdom, for the period 1951-1967. These results, which are shown in figure XXIV, are based
Figure XXIV. Gamma-radiation from deposited fall-out at Grove, UK, from 1951 to 1968 (195)
upon direct measurement and on calculation from deposition data. There was excellent agreement between the computed and measured dose rate. In 1967, the dose rate had fallen to about 15 per cent of that prevailing in 1962-1964. The annual dose from fissionproduct gamma rays reached a peak of 22. 7 millirads in 1963, and for the period 1951-1967 the integrated dose was 131 millirads. of which 16 millirads were estimated to be from 137Cs. Of the 1967 annual dose of 3.5 millirads, about 2.5 millirads were from 13•Cs.
56
258. At Grove, United Kingdom, the dose delivered between 1951 and 1967 from short-lived fission products deposited in the same period was 131 - 16 = 115 millirads, and if the small contribution to be delivered after this time is neglected, we can consider 115 millirads as the dose commitment.
259. In order to compute the population-weighted dose commitment for the northern hemisphere, we use the 90Sr deposition up to 1967 at Abingdon (near Grove) of 43.2 mei km-:: compared with the population-weighted mean for the northern hemisphere for the same period, 54.2 mCi km-::. The dose commitment for deposition up to the end of 1967 is 115 (54.2/43.2) = 144 millirads. From table 28, it can be seen that in the northern hemisphere 1.3 megacuries of 89Sr deposited in 1968-1969 compared with 51.7 megacuries in the period 1961-1967. Using this as a guide, the contribution to the dose commitment from deposition in 1968-1969 is at most 2.5 per cent. Adding this to 144 millirads, we obtain 148 millirads for the population-weighted dose commitment in the northern hemisphere for all deposition up to 1969. In the same manner, the dose commitment in the northern temperate latitudes ( 40°-60°) is estimated to be 203 millirads.
260. To estimate the dose commitment for the southern hemisphere, we use the deposition of 89Sr in the northern and southern hemispheres for the period 1961-1969 (table 27), 260 and 71 mCi km-2, respectively, as a guide, and assume the dose commitment to be proportional to these. The dose commitment in the southern hemisphere from short-lived fission products is thus 148 (71/260) = 40 millirads. In the temperate regions it is 60 millirads.
(b) Dose commitment from 131Cs
261. Using 93.4 and 22.2 mCi km-2 as the total population-weighted deposition of 137es in the northern and southern hemispheres. respectively. together with the dose-commitment conversion factor of 1.44 mrad per mCi km-2 from table 43, the dose commitments in the northern and southern hemispheres are 134 and 32 millirads, respectively.
262. It is possible to estimate the dose commitment from 137es by another method. At Grove, United Kingdom, the dose from 137Cs up to 1967 was 16 millirads and in 1967 the annual dose was 2.5 millirads (see paragraph 257). Assuming that the 137es was already permanently distributed in depth within the soil, only the second term of equation 32, which has an effective mean life of 33 years, applies. Thus, the dose commitment at Grove for 137Cs deposited up to 1967 is 16 + (2.5 X 33) = 99 millirads. Using the oosr deposition at Abingdon up to 1967 of 43.2 mei Jan-2 and the population-weighted deposition in the northern hemisphere of 58.4 mCi 1cm-2 from all tests to 1970, the dose commitment for the northern hemisphere is 134 millirads. in agreement with the estimate made in the last paragraph.
263. To estimate average doses to the population it is necessary to consider the shielding afforded by buildings. A reduction factor of 0.2 will be taken as a world average for shielding by buildings ( 613). Also assuming an average time of 1 7 hours is spent indoors, the over-all reduction of dose due to shielding is 0.4.
-264. In addition, in order to obtain the gonad and
bone-marrow tissue doses, we must multiply by the (tissue/air) conversion factor of 0.8 discussed in paragraph 143. This factor allows for conversion from air dose to tissue dose in addition to screening by intervening body tissues. The combined factor to convert air doses to gonad and bone doses is thus 0.32. The dose commitments resulting from short-lived radionuclides and from 137Cs for all tests up to the end of 1970 are shown in table 44.
4. Summary of dose commitments
265. Estimates of dose commitments from nuclear tests carried out before 1971 are summarized in table 45. For comparison, the estimates given in the 1969 report for tests conducted before 1968 are also included. Although no major series of tests occurred during the period 1968-1970, there are significant differences between the two sets of estimates for the internal dose commitments from 90Sr to the bone-lining cells and for the external dose commitments to all tissues. As a result, the ratios of the external to the internal dose commitments for all tissues are found to be markedly higher in this report than in the 1969 report. Most of the changes are a consequence of improved information becoming available.
266. In the case of 90Sr, the transfer coefficient from deposit to diet has been estimated as 4.5 pCi y (gCa)-1
per mCi km-2 instead of 9 pCi y (gCa)-1 per mCi km-2 ,
and the transfer coefficient from diet to vertebrre has been taken as 0.12 instead of 0.2. A reassessment of the dose-rate factors (P45 ) resulted in changes from 1.1 to 1.95 mrad per pCi y (gCa)-1 for bone-lining cells and from 0.55 to 1.42 mrad per pCi y (gCa)-1
for bone marrow.
267. Estimates of doses from external radiation are higher, mainly because the ratio of the tissue dose to outdoor air dose is now taken as 0.32 instead of 0.2. However, the 187Cs dose-rate factor used in this report is 0.033 mrad y-1 per mCi km-2 compared with 0.04 mrad y-1 per mCi knr2 used in the 1969 report. In addition, a small difference results from an incorrect use in the 1969 report of the cumulative rather than the integrated 90Sr deposit to estimate the 187Cs deposit. Doses from short-lived radio-nuclides have been estimated from actual measurements and the new tissue/air dose conversion factor was applied.
268. As a result of the combination of higher dose commitments from external radiation and lower dose commitments from 90Sr. the relative importance of 00Sr has decreased and is,cs appears to be the main contributor to the total dose commitment.
B. UNDERGROUND AND CRATERING EXPLOSIONS
r-;-i 269. During the last decades. in addition to the I · . : development of nuclear devices for military purposes, : . i there has been an increasing interest in the peaceful ! • applications of nuclear explosions. The inherent ad-! - vantage of using nuclear explosives for peaceful appli-
cations lies in the huge energy source available in a • small package at a relatively low cost per unit of
! '..'~I energy released.
l('._l 27~. There are two basic types of explosions: cratering explosions in which nuclear explosives are
57
potentially useful ~s an ear~-breaking and moving tool for, ~-g .. uncovenn~ of mmeral deposits, canal construct10_n. construc_uon of ~arth and rock-fill dams. reserv01r construction, creation of cuts and embank.:. ments for railways and roads. harbour construction creatio~ of craters for the disposal of minino and pro~essmg wastes;. contained explosions in whi;h the devices are potentially useful to break up or increase the permeability of the underground resource strata so that the resource can be recovered and used by man or to provide storage cavities. Examples are intensified exploitation of oil and natural gas deposits, stimulation of geothermal heat, creation of underground caviti~s for the storage of natural gas, gas condensates and oil products, creation of underground cavities for the burial of biologically dangerous industrial wastes. underground working of ore deposits, and stopping oil and gas blow-outs.
271. Both types of explosions present certain hazards. This report is only concerned with those arisincr from radiation exposure which may occur throucrh (a) release of radio-activity to the environment. This is a primary concern with cratering exposions where some radio-activity is unavoidably released but it is a~s? relevant. to containe_d expl_osions where the probabili~ of accidental venting exists and where contamination of ground-water may occur. Of special concern are such nuclides as 3H, 14C, and 85Kr because of their long half-life and high mobility in the environment; and (b) the use of products recovered from "contained ~ype" of explosions. When nuclear energy is used to mcrease the availability of oil, natural gas, etc., the resulting products will be contaminated to some extent with .radio-nuclides. These products could be used at locations far removed from the explosion.
1. Sources of radio-activity
2 72. There are two sources of radio-activity from a nuclear explosion, the direct products of the nuclear reactions ( the :fission fragments and tritium) and the radio-active products which result from activation of the surrounding medium (both inside and outside the explosive device).
273. The two design extremes are the pure fission device producing about 2.9 1023 fission fragments per kiloton and the pure fusion device which would produce no :fission products but approximately from 1023 to 1024 atoms of 8H per kiloton ( depending on the efficiency and kind of thermonuclear fuel) ( 606). The excess neutrons produced (about 2 1023 neutrons per kiloton escape both from an unshielded fission explosive and from a fusion explosive) are captured either in the device or in its immediate environment (358). In this way, a variety of induced radio-active products are formed.
274. A fully contained one-megaton explosion (10 kt fission) surrounded by borated material would, if exploded in a medium with the average chemical composition of the earth's crust, produce radio-nuclides in the amounts shown in table 46 (583). The relative activities of the total fission products and the induced activities at various times after the explosion are shown in figure XXV. After one year the activity is entirely dominated by aH, ooco, 90Sr and 13,cs, tritium being the most abundant nuclide. After 10 years, tritium is still the most abundant nuclide and its activity is three orders of magnitude greater than that of 6°Co or 90Sr.

"' w a: ::, l)
1010
1a9
108
,o7
1o6
105
1a4
'v FISSION PRODUCTS
' ' ' ' ' ' TRITIUM
1<>2 L...-~...J.._~-1--~-L,---"-~---'-~--"'----' ,o2 1a3 104 - HOURS Time after explosion 10
YEARS - t 10 102 ta3
Figure XXV. Activities of radio-nuc!ides at various times after a nominal one-megaton explosion (10 kton fission) in
average crustal material (583)
For peaceful applications, the explosive can be selected so as to minimize the potential hazard of the associated radio-activity.
275. For cratering explosions, Kelly (322), based on past experience, assumes that largely because of (a) the amount of scavenging during the venting process: (b) the effect of special emplacement techniques: and ( c) the use of low fission explosives, the sum of fission products airborne in the radio-active cloud and in the fall-out for each nuclear explosive detonated may be expected to be as low as the equivalent of 20 tons. Further, the tritium release may be less than 20 kilocuries per kiloton of total yield. The inventory of selected products expected in the radio-active cloud and in the fall-out are shown in table 47.
276. For underground engineering. fission products (except S5Kr) do not generally appear to be troublesome, but tritium, either from the explosive or from neutron reactions with trace lithium in the soil, gives rise to potential difficulties. Where hydrocarbons are involved, approximately 3 per cent of all neutrons that escape into the soil will produce tritium in typical shales ( 209). In addition, tritium might be produced in second-order reactions if boron is used as shielding material. Thus, a fission explosive with no neutrons allowed to leak to the soil should be used for hydrocarbon applications (209).
2. Contained experiments
277. The initial result of an underground nuclear explosion is the release of all its energy and of a large number of neutrons within less than a microsecond ( 463). The neutrons are thermalized and captured in the surrounding material, producing a variety of induced nuclides. The extreme pressures and temperatures ( > 106 atmospheres and > 107 degrees) that are generated vaporize some of the surrounding material and give rise to a strong shock wave that propagates outwards. Initially this shock wave is sufficiently intense to vaporize additional rock and add its mass and
58
volume to the cavity formed. In contained explosions the cavity reaches its peak size in a few hundredths (or tenths) of a second (667). At this time the pressure is approximately balanced by the lithostatic pressure and the shock wave breaks away from the cavity. While still in the neighborhood of the cavity the shock wave crushes the rock. Further out, fractures are produced whereas, at greater distances, the medium behaves elastically in response to the pressure wave. The resulting cavity stands for a period of time which depends upon the type of rock, the depth of burial and the explosion yield. When and if collapse occurs, it generally progresses upward at about the same diameter as the cavity until the limit of the fracture zone is reached. The resulting roughly cylindrical volume of broken rock and rubble is called the chimney. The time history of an underground explosion is shown in figure XXVI.
3 MICROSECONDS
A FEW SECONDS TO A FEW HOURS
FINAL CONFIGURATION
Figure XXVI. A typical sequence of events after a nuclear explosion is detonated underground (538)
278. If the explosion occurs at great depths,• all the radio-active products will remain underground. However, the crushing of rock and the formation of fissure systems may create channels from the cavity through the overlying layers to the surface and radioactivity may be released into the atmosphere. This process would usually require considerable time ( of the order of an hour or more). This means that only the isotopes of inert gases or volatile elements ( e.g., halogens) could escape into the atmosphere. The isotopes ssmKr, 87Kr, 88Kr, 133Xe, 135Xe. and 138Xe would be the ones most efficiently released (278). If, however, the release were to begin a few minutes after
• The minimum depth for total containment depends on explosion yield and is approximately 140 m kt-1/3.
...
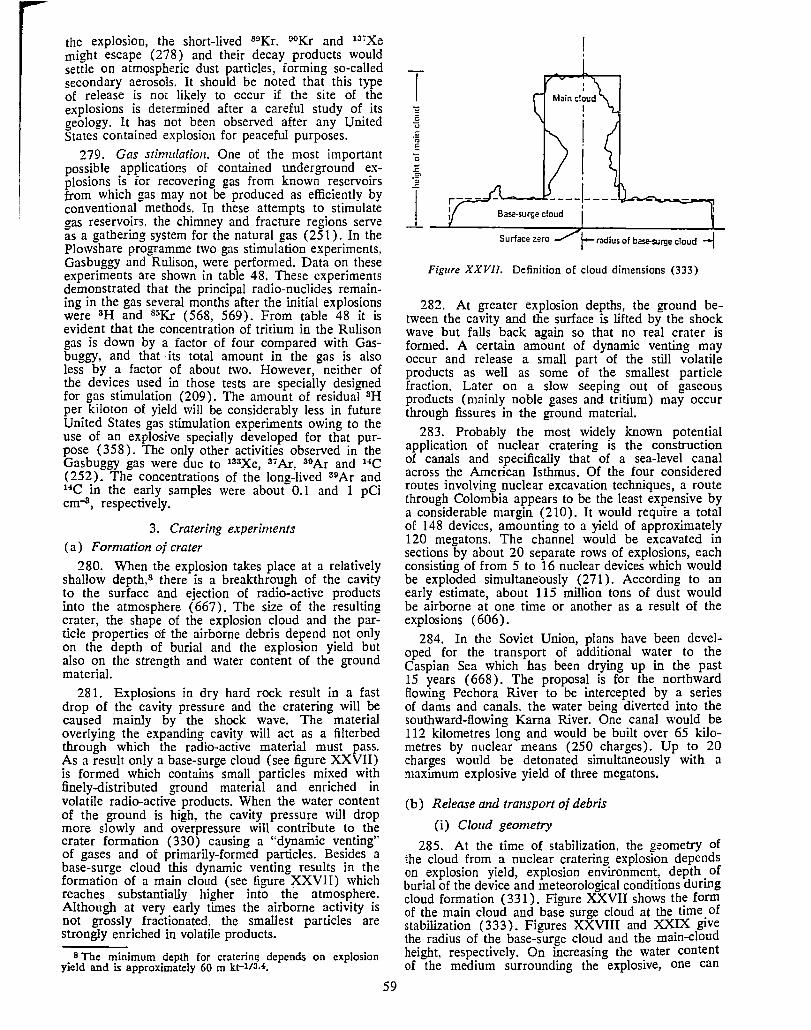
the explosion, the short-lived 89Kr, 90Kr and 137Xe miaht escape (278) and their decay products would settle on atmospheric dust particles, forming so-called secondary aerosols. It should be noted that this type of release is nm likely to occur if LlJe site of the explosions is determined after a careful study of its aeology. It has not been observed after any United States contained explosion for peaceful purposes.
279. Gas stimulation. One of the most important possible applications of contained underground explosions is for recovering gas from known reservoirs from which gas may not be produced as efficiently by conventional methods. In these attempts to stimulate gas reservoirs. the chimney and fracture regions serve as a gathering system for the natural gas (251). In the Plowshare programme two gas stimulation experiments. Gasbuggy and Rulison, were performed. Data on these experiments are shown in table 48. These experiments demonstrated that the principal radio-nuclides remaining in the gas several months after the initial explosions were 3H and 8"Kr (568, 569). From table 48 it is evident that the concentration of tritium in the Rulison gas is down by a factor of four compared with Gasbuggy, and that its total amount in the gas is also less by a factor of about two. However, neither of the devices used in those tests are specially designed for gas stimulation (209). The amount of residual 3H per kiloton of yield will be considerably less in future United States gas stimulation experiments owing to the use of an explosive specially developed for that purpose (358). The only other activities observed in the Gasbuggy gas were due to 133Xe, 37 Ar, 39 Ar and HC (252). The concentrations of the long-lived 39Ar and 14C in the early samples were about 0.1 and 1 pCi cm-s, respectively.
3. Cratering experiments
(a) Formation of crater
280. When the explosion takes place at a relatively shallow depth, s there is a breakthrough of the cavity to the surface and ejection of radio-active products into the atmosphere (667). The size of the resulting crater, the shape of the explosion cloud and the particle properties of the airborne debris depend not only on the depth of burial and the explosion yield but also on the strength and water content of the ground material.
281. Explosions in dry hard rock result in a fast drop of the cavity pressure and the cratering will be caused mainly by the shock wave. The material overlying the expanding cavity will act as a filterbed through which the radio-active material must pass. As a result only a base-surge cloud (see figure XXVII) is formed which contains small particles mixed with finely-distributed ground material and enriched in volatile radio-active products. When the water content of the ground is high, the cavity pressure will drop more slowly and overpressure will contribute to the crater formation (330) causing a ';dynamic venting" of gases and of primarily-formed particles. Besides a base-surge cloud this dynamic venting results in the formation of a main cloud ( see figure ~VII) which reaches substantially higher into the atmosphere. Although at very early times the airborne activity is not grossly fractionated. the smallest particles are strongly enriched in volatile products.
s The minimum depth for cratering depends on explosion yield and is approximately 60 m kt-1/3.4.
59
T
I Base-surge cloud _,_ ---'--------......---------&....
Surface zero r radius of base-surge cloud -I Figure XXVII. Definition of cloud dimensions (333)
282. At greater explosion depths, the ground between the cavity and the surface is lifted by the shock wave but falls back again so that no real crater is formed. A certain amount of dynamic venting may occur and release a small part of the still volatile products as well as some of the smallest particle fraction. Later on a slow seeping out of gaseous products (mainly noble gases and tritium) may occur through fissures in the ground material.
283. Probably the most widely known potential application of nuclear cratering is the construction of canals and specifically that of a sea-level canal across the American Isthmus. Of the four considered routes involving nuclear excavation techniques, a route through Colombia appears to be the least expensive by a considerable margin (210). It would require a total of 148 devices, amounting to a yield of approximately 120 megatons. The channel would be excavated in sections by about 20 separate rows of explosions, each consisting of from 5 to 16 nuclear devices which would be exploded simultaneously (271). According to an early estimate, about 115 million tons of dust would be airborne at one time or another as a result of the explosions ( 606).
284. In the Soviet Union, plans have been developed for the transport of additional water to the Caspian Sea which has been drying up in the past 15 years (668). The proposal is for the northward flowing Pechora River to be intercepted by a series of dams and canals. the water being diverted into the southward-flowing Karna River. One canal would be 112 kilometres long and would be built over 65 kilometres by nuclear means (250 charges). Up to 20 charges would be detonated simultaneously with a maximum explosive yield of three megatons.
(b) Release and transport of debris
(i) Cloud geometry
285. At the time of stabilization, the geometry of the cloud from a nuclear cratering explosion depends on explosion yield, explosion environment, depth . of burial of the device and meteorological conditions during cloud formation (331). Figure XXVII shows the form of the main cloud and base surge cloud at the time. of stabilization (333). Figures XXVIII and 'XXp{ give the radius of the base-surge cloud and the main-cloud height, respectively. On increasing the water content of the medium surrounding the explosive, one can

104
1ol
,o2
-:.: 10 !:S
" I! . 10-3 10°
a 8. " Yield (kllorom) ...
Figure XXV/II. Radius of base-surge cloud versus yield at scaled depth of burial of 3 to I 5 m kt-1/3 in alluvium (333) 1o-l
Yield lkilotonl)
Figure XXIX. Height of main cloud versus yield at scaled depths of burial of O to 85 m kt-1/3 in alluvium (333)
expect that the stabilized base-surge cloud would be larger ( 661 ) and that the main cloud and the vented fraction of refractory radio-nuclides would increase (333 ).
286. Lack of experimental data makes it difficult to predict the sizes of the resulting clouds from the explosions of nuclear row charges. However, the individual main clouds may be treated separately and their heights may be obtained from figure XXIX (333). At any rate, it is essential to follow up the evolution of the cloud. The radius of the resulting base-surge cloud would be about the same as that of a base-surge cloud formed in a single explosion with the same total yield and the same scaled depth.
(ii) Deposition
287. Crater and lip. A large part of the radioactivity produced in a nuclear cratering explosion is carried down by the fall-back which descends into the initial crater and its immediate vicinity. Figure XXX shows the exposure rate as a function of time for five different explosion yields ( 600). The exposure rate in the crater and lip area decreases as the explosion yield increases. This decrease is due to lower concentrations of radio-nuclides in the fall-back and ejecta. This in turn results from (a) a decrease with increasing yield ( constant fission trigger) in the amount of radioactivity produced per unit yield: and ( b) the increase in direct proportion to yield of the amount of material
60
Time{hounl
Figure XXX. Time variation of the exposure rate in the crater and lip area from 3 kt-fission explosions of different total yields detonated at a scaled depth of burst of
44 m kt-1/3.4 (600)
which contains the radio-activity. The shapes of the curves change with yield because, as the yield increases, so does the relative contribution from the induced radio-nuclides ( 600).
288. Local fall-out. The large particles in the base surge and the main cloud descend within the first day and form the local or close-in fall-out. Ffo:ure XXXI shows, for explosions at different scaled depths, the percentage of the radio-active products deposited as
SCALED DEPTH OF BURIAL (m)
Figure XXXI. Percentage of radio-activity deposited as local fall-out in cratering tests (198)
local fall-out ( 198). The medium surrounding the explosive, and especially its water content, plays an important role which is reflected in the breadth of the band that describes the relationship in figure XXXI. Once the fraction of radio-active products present in the local fall-out is predicted, it is possible to calculate a fall-out pattern which can be used in planning safety measures. This is accomplished by using appropriate meteorological data ( turbulence and wind speed as a function of altitude), distribution of debris of different particle sizes and initial cloud configuration (333).
289. Long-range fall-out. The very small particles may remain suspended in the air for considerable times before they reach the ground as long-range fall-out. The cloud dimensions continually increase as a result of turbulent diffusion. The cloud can thus be very large and the particles be brought to great distances by the wind before they descend to earth either by impact or by precipitation. With regard to the radio-activity present in the long range cloud, Crawford ( 3 3 3) has developed a diffusion model which enables the cloud concentrations to be estimated as a function of time and which also provides a means for determining the deposition of material from the cloud over considerable distances from the epicentre. Experimental findings indicate that the basic constituents of the long-range fall-out from cratering explosions are 89Sr, 140Ba and 01y which after about 10 days account for more than 80 per cent of the total activity (279). This distribution of fission products is due to the fact that among the precursors of these products in the mass chains are isotopes of krypton and xenon with half-lives ranging from 10 seconds to several minutes. Similar isotopic composition of long-range fall-out has been reported elsewhere (319, 336, 501). Devices of different designs may result in different distributions of radio-nuclides in long-range fall-out. Thus, 181W and 185W were reported to predominate in the long-range fall-out from the Schooner cratering explosion (table 49) (62, 99, 126,141,502).
(iii) Ground-water contamination 290. For contained underground explosions, the
concentrations of radio-active products in ground water are dependent on several factors such as radio-nuclide production and initial distribution, radio-active decay. sorption on geologic material, and dispersion during hydrologic transport. For cratering explosions other aspects of the hydrologic cycle, particularly rainfall and the characteristics of the water table. must be considered ( 646). For contained explosions, where the cavity may collapse either completely to form a subsidence crater or partially to form a chimney, there are indications that the ground water close to the explosion point will flow inward toward the cavity for a considerable time, possibly years (583). After the restoration of the pre-explosion ground-water flow, the radionuclides will be transported away from their initial deposition by ground water along the regional hydraulic gradient. Tritium, which is readily available for transport and whose exchange with the rock matri't ~ negligible, is the only radio'..nuclide in ground water ~ely to appear in significant concentrations at some dIStance from the explosion point. 90Sr will be significantly retarded in its ground-water transport in practically all geologic environments; the rate of movement of 90Sr will rarely be more than a few per cent of the average rate of ground-water flow (583). The small amount of 14C produced may be considered
61
insignµicant when distributed in the large volume of matenal around an underground explosion. mes tends to be even more firmly held by sorption than is 90Sr (583), while 6°Co is insignificant in comparison with the longer-lived 9osr.
4. Doses
291. Nuclear explosives for peaceful applications are still in the experimental stage. Cratering events have been conducted in isolated areas on a scale small by comparison to that of the projects to which they might be applied. A few practical applications of contained explosions have so far been made, all of th.em in the Soviet Union (table 49). Up till now, the doses received by the public have been extremely small. This section will review the doses received so far. and also indicate those that might be expected if some krge-scale applications were carried out with the help of nuclear devices of current design.
(a) Contained explosions
292. An underground explosion successfully contained does not lead to any release to the environment, but if its purpose is to enhance the availability of oil or natural gas, the resulting products are likely to be contaminated to some extent. Four such experiments have been reported so far, two in the Soviet Union (321) and two in the United States (table 48).
293. In the Soviet Union, three charges were detonated several years ago in an oil deposit to increase the extraction of petroleum. The explosions produced no general radio-active contamination of the atmosphere or ground site. and the outputs of the wells which were increased over the entire field by 27-60 per cent over its normally-expected yield, showed no traces of non-gaseous radio-active contamination. The data regarding the second explosion, which was set off in a gas field, have not yet been reported (321).
294. The two United States experiments (Gasbuggy and Rulison) were conducted in natural gas formations. The only significant long-lived radio-nuclides found in the dry gas product were 3H. BC and 85Kr (568, 569). The contaminated gas was burned at the surface, instead of being marketed. The results of the off-site radiological surveillance for project Gasbuggy indicated that the project did not result in the introduction of any device-related radio-activity into the existing natural-gas distribution system ( 409). Future contamination of water supplies following hydrological transport of radionuclides is also very unlikely (573).
295. Although none of the gas from the Gasbuggy well had been introduced into the distribution system, theoretical evaluation of the potential radiation exposure from hypothetical domestic and commercial utilization of the contaminated gas have been reported (33. 285). The most important radiation exposures from 3H and 14C are likely to occur after combustion transforms CH3 T and 14CH4 into HTO and HCO~. whereas 85Kr is merely carried along with the natural gas. Table 50 presents the whole-body doses resulting from hypothetical distribution of all the Gasbuggy gas in the Los Angeles basin, where natural gas is used for fueling steam plants to generate electricity and for a wide variety of industrial and commercial applications, as well as for domestic consumption (33). Tritium would practically be the only contributor to the dose despite the fact that most of the amount produced
by the explosion was bound with water in the cavity where it did not seem to exchange appreciably to methane (252). The most critical pathway would be domestic consumption for space heating and cooking. For a given consumption rate of contaminated gas in a conventional dwelling. the dose from domestic use depends upon the fraction of combustion products vented inside the home. i.e. upon the relative amounts of gas used in nonvented and vented appliances and upon the efficiency of the venting system. The weighted average dose assumes that. in 10 per cent of the houses, the heating and other appliances making use of gas are unvented and that, in the other 90 per cent, only the kitchen range is unvented (33, 647). The dose resulting from ingestion of food and water that have been exposed to the combustion products has not been included, but experimental results indicate that it would only amount to 2 to 7 per cent of the total (285).
296. As the consumption of gas in the Los Angeles basin is much larger than the production of the Gasbuggy well. the contaminated gas was assumed to be diluted before distribution in that region. The hypothetical dose commitment resulting from the exclusive domestic use of undiluted Gasbuggy gas. in an area where the annual heating requirement is 2,800-degree Celsius-days (average value for the United States) (286) is 40 millirads. Assuming a production rate of 28 103 m3 d-1 (285). more than 99 per cent of the dose would be received in the first year.
297. The population dose commitment would be about 200 man-rads if the contaminated gas were distributed in the Los Angeles basin and thus. to a certain extent. used for industrial purposes. The maximum population dose commitment would occur if all the gas were used for domestic consumption; in that case, it would be 700 man-rads if the gas were distributed in the Los Angeles basin (population 7 million) and 550 man-rads if the gas were distributed in an area where the annual heating requirement is 2.800-degree Celsius-days. After use, the tritium would be released to the atmosphere and would give rise to an additional dose commitment to the world population. This, however, would be quite small. as it corresponds to a population dose of the order of 10 man-rads.
298. From the radiation protection point of view, the analysis of the Gasbuggy experiment led to the conclusion that efforts should be directed to the reduction of production of 3H by the explosion. From 1,400 Ci kr-1 in the Gasbuggy event, the 3H production decreased to 250 Ci kr-1 in the Rulison event and is expected to be less than 20 Ci kt-1 in future gasstimulation applications which would use a new explosive design (358). For the purpose of comparison, table 50 presents the whole-body doses which would be expected if the Gasbuggy experiment had been shot with the specially developed explosive and if the contaminated gas had been marketed in the Los Angeles basin. Those explosives have been envisioned to develop a field of 28 wells in Wyoming in the United States (647). Four 100-kiloton explosions would be used per well and the 28 wells would be drilled over a six-year period. The gas from this field would supply about I O per cent of the demand in the Los Angeles basin, where the average whole-body dose commitments to the population of users would be 0.6 millirad from 3H + 65Kr, the dose from a:;Kr being about 10 times less than that from sH.
62
299. The lower limit of tritium production in a gas-stimulation explosion is estimated at 2 Ci kr-1
(209). If that limit were reached. the radiation exposures from 3H and s;;Kr would be about equal.
(b) Cratering explosions
300. The nuclear clouds formed by the few cratering explosions which have been detonated did not reach the stratosphere (figure XXIX) and, as a consequence, the radio-activity produced. with the exception of longlived gases. was deposited in a matter of weeks in inhomogeneous patterns particularly sensitive to scavenging by precipitation.
30 I. The doses to the public could best be derived from the knowledge of the deposition pattern of the radio-active debris following each cratering experiment. The United States and the Soviet Union have independently developed prediction methods to that purpose (332). Unfortunately, the published data on actual explosions do not indicate if the nuclear clouds crossed densely populated areas a few days after the explosion and are not sufficient to calculate the population doses.
(i) Dose contribution from short-range fall-out
302. In certain circumstances. milk contaminated with 131I appears to be at least a rough indicator of the whole-body doses which might have resulted from cratering experiments. Table 51 presents levels observed around the Nevada test site where the sL~ United States cratering events took place. Five tests gave rise to detectable levels in the local milk network surrounding the test site. This network samples mostly farms or dairies located in eleven western states of the United States. Only Sedan and Palanquin gave rise to detectable levels in the national network which analyses weekly composite samples pooled from farms dispersed over hundreds to thousands of square kilometres.
303. Study of milk contamination around the detonation site provides some information on the population doses resulting from the intermediate fall-out. Analysis of the potential radiation exposures to a child from nuclear excavation projects shows that, for deposition at one day after detonation, the thyroid dose from 13ll ingested via the forage-cow-milk pathway would be the most important (127, 175). However. since 1963. the cratering experiments were intentionally conducted during the colder half of the year with wind blowing towards the north to take advantage of the fact that dairy cattle were on dry food (384). As a crude approximation. the total external whole-body dose to man can be expected to be equal to the 131 I thyroid dose to infants.
304. Using the pessimistic assumptions that the milk contaminated at the maximum concentration level observed in the local network would be distributed to 5.000 people and that the concentrations reported by the national network would be representative of the milk levels in the whole state. the population dose to the thyroids of infants six months to two years old were roughly estimated from population and birth-rate data (541, 617). The population whole-body dose commitment. then calculated as the product of the total population thyroid dose to infants ( 1.200 man-rads) by the ratio of the total population to the infant population ( about 40 in the United States) is estimated at 4.6 1()4 man-rads. Dividing by the world population (3.5 109 ) yields an average whole-body dose of 14
rnicrorads. Owing to lack of data. the dose arising from the intermediate fall-out of the Soviet Union cratering tests has not been taken into account.
(ii) Dose contribution from long-range fall-out
305. In order to estimate the doses from long-range fall-out, the inventories of selected isotopes present in the main cloud and the base surge in the Schooner experiment (332) were assumed to be homogeneously diluted in the 40-50° N latitude band. The dose commitments were then estimated from the transfer coefficients and other data given in the section on atmospheric and surface explosions. Results are summarized in table 52. Besides 3H, only 00Sr and 13·Cs have been considered for internal irradiation because the transfer coefficients from deposit to diet are not sufficiently known for the other radio-nuclides listed in table 52.
306. Although it is realized that, as a result of continuous improvement in explosive design and differences in fission yield and conditions of explosion, the activities released by the tests varied widely, if it is tentatively assumed that the Schooner event is representative of the nine nuclear cratering experiments conducted so far, then the total dose commitments from long-range fall-out may be estimated by multiplying the results of table 52 by nine. The total population integrated external dose commitment is thus found to be of the order of 104 man-rads. Dividing by the world population yields a world average dose of three microrads.
307. Regarding the internal doses, the major contribution is furnished by 3H. For a 170-kiloton explosion, the amount of 3H expected to be released to the environment is estimated at two megacuries (table 47). Assuming that the amount of 3H released is proportional to the total yield, the cratering experiments gave rise to a world-wide distribution of about three megacuries, which corresponds to an average dose commitment of six microrads, much greater than the contribution of oosr and 137Cs.
308. There is a significant potential for using nuclear explosives to accomplish large-scale construction projects at considerable savings in cost and time as compared to use of conventional construction techniques. The most documented project is the construction of a new Atlantic-Pacific interoceanic canal (paragraph 283). If the route through Colombia w~re to be adopted. an area of about 8,000 square kilometres would have to be evacuated mainly to guard against short- and intermediate-range fall-out. Recent estimates show that approximately 10.000 persons live within this area (271). If those people were not evacuated. they would receive estimated lifetime doses ranging up to 300 rads from external radiation alone.
309. Concerning the long-range fall-out, the trajectories of the clouds are expected to be such that most of the radio-activity would be deposited over the Pacific Ocean and that only a small fraction of the base surge would branch towards the Colombian mainland (127). However. 3H and s:;Kr would eventually be distributed world-wide. The amount of 3H released would be 1,400 megacuries-slightly less than the quantity produced by atmospheric testing (paragraph 166). The dose commitment to the world's population would be of the order of three millirads. The production of 85Kr has been assumed from table 48 to be in the range 12-23 curies per kiloton of fission. If the
63
fission yield of the explosive device, assumed constant regardless of the total yield. is taken as 90 tons (smallest fission yield rep?rted. in t~e nuclear experiments), then the total fission yield 1s 13 kilotons: the production of 85Kr would then be in the range 150-300 curies and the corresponding whole-body -dose commitment would be of the order of 10 picorads.
5. Conclusion
310. There is a wide spectrum of potential peaceful applications for nuclear explosives. In any nuclear cratering explosion, some radio-activity is inevitably released into the environment. Nuclear cratering techniques have been developed to the point where they can be used for relatively small projects, such as formation of water reservoirs, as demonstrated in the Soviet Union. Dose commitments from past events have been tentatively estimated and should be considered as merely indicative. They would probably have been lower if current explosive designs had been employed. For large scale projects, problems involving safety of the population living in the proximity of the explosion site seem to be strong limiting factors.
311. The future of contained explosions looks more promising as some applications would not result in a release of radio-activity to the biosphere. For example, elimination of a runaway gas well was safely conducted in the Soviet Union and the prospect of storing industrial radio-active wastes in cavities formed by contained explosives has attracted interest. In other applications, the release of radio-activity would be small and could be controlled to a large extent. The only significant contamination of the natural gas recovered after the gas stimulation experiments carried out in the United States was that due to 3H and 85Kr.
II. Power production by nuclear fission
A. INTRODUCTION
312. The increasing use of nuclear fission in power production calls for assessment of potential environmental contamination at present and in the future. Estimates of the growth of nuclear power vary but the highest given in table 53 indicate that the world generating capacity. which was about 20 GW(e) in 1970 (264), may increase to about 1,600 GW ( e) by 1990 and to about 4,300 GW(e) by the year 2000 ( 5 81). This increase is partly due to the predicted rise in power demand and partly to the higher percentage (just over 60 per cent in 2000) of electrical power expected to be produced by nuclear fission.
313. An IAEA survey (264) lists 361 research reactors and 127 power reactors as being in operation in 1971. About half of the power reactors are either experimental with output below 20 MW ( e) or have relatively low outputs of 20-100 MW(e). The remainder of the power reactors. which account<:d f';'r more than 90 per cent of the installed capacity m 1970, have outputs in the range 100-800 MW(e) and are in operation in a total of 12 countries.9 There are many power reactors under construction with outpu.ts up to 1.200 MW(e) and 319 are expected to be m operation by 1977.
9 These are Canada, France, ~he Federal Rep!Jblic of Germany, India, Italy, Japan, Spam, Sweden, _Switzerland, the Soviet Union, the United Kingdom and the United States.
314. The nuclear power generated in 1970, calculated from the figures published by the IAEA (263), was 8.6 GW ( e) y to which must be added the contribution (1.1 G\V(e) y) from power stations for which the installed capacity is known and the load factor assumed to be 0.65. This load factor is an average value for power stations fully operational before 1970 (263). Other reactors which were not fully operational contributed 5 GW ( e) to the total installed capacity of 20 GW ( e). The total nuclear power generated during 1970 was thus estimated to be 9.7 GW(e) y corresponding to an over-all load factor of 0.5. This is assumed to apply also in the year 2000, although a substantial number of nuclear power reactors may then be operated only during periods of high energy demand.
315. The Committee noted that the largest part of the information on which it bases its conclusions comes from a very small number of countries among those in which nuclear power plants are used to generate electricity. The Committee does not discuss. in this annex, reactors used in other applications of nuclear power, for example, district heating, ship propulsion or experimental projects.
316. In common with other industries. the nuclear power industry gives rise to wastes which may occur in airborne, liquid and solid fonns. Environmental contamination resulting from leakage or discharge of radio-nuclides in wastes will be discussed here step by step. from the mining of ore to the reprocessing of spent fuel. Dose commitments from current practice, and those expected to be incurred in the future as a result of the industry's expansion, will be estimated. The dose commitments considered here will be those which are related to normal conditions of operational variability and not to accidents leading to uncontrolled discharges to the environment.
B. ENVIRO~MENTAL PATHWAYS INVOLVING RADIATION EXPOSURE OF ME!\IBERS OF THE PUBLIC
317. Radio-nuclides discharged in airborne, liquid and solid wastes may be transferred along environmental pathways which depend upon the physical and chemical nature of the nuclides. These radio-nuclides may then give rise to radiation doses which are either external, e.g. from radio-nuclides in air, on the ground or in sediments, or internal, e.g. from radio-nuclides deposited in tissues following intake into the body. Estimations of doses from discharges by the nuclear power industry are more likely to require consideration of local situations than those from weapons tests fallout because members of the public are likely to be relatively near such installations. As a result of this, short-lived nuclides, e.g. certain isotopes of krypton and xenon, and radio-nuclides whose properties may make them of significance to man in a particular environment, e.g. water-borne 106Ru. give radiation exposures to defined population groups following pathways that are not relevant to fall-out from weapons tests.
I. Atmospheric pathways
318. Radio-nuclides in airborne wastes may be discharged by the nuclear power industry in gaseous, vapour or particulate form. Dispersion of a plume of airborne materials in the atmosphere has been described by a gaussian distribution (593). and working methods for quantitatively predicting dispersion have been
64
evolved (e.g. 85, 481, 482, 565). The basic methods apply to level ground in open country during meteorological conditions ranging from substantial solar heating of the ground, resulting in considerable turbulence, to inversion conditions when temperature rises with height above ground and turbulence is suppressed. Modifications of the basic methods may be necessary to take account of the presence of obstacles, e.g. buildings or trees. or of discharge from a stack.
319. Airborne radio-nuclides may be deposited by dry deposition resulting from very small-scale turbulent diffusion processes which lead to impaction and/ or adsorption of radio-nuclides on surfaces (106). The dry-deposition velocity varies with the physical and chemical form of the radio-nuclide; an outstanding example of this variation occurs with iodine which may be discharged from the nuclear power industry in several different forms (22, 30, 107, 196). Radionuclides may also be deposited by means of wash-out by rain falling through contaminated air at a rate which depends on the rainfall rate and on the form of the airborne material (160, 161).
320. If iodine is deposited on pasture grazed by dairy cows. a proportion is transmitted to milk (paragraphs 214-215) which mav subsequently be consumed by infants. This pathway is not important, however, for heavy elements such as uranium and plutonium, which are not absorbed significantly from the gut into the cow's bloodstream (116) and, hence. are not transmitted to milk. Nor is the pathway important in the many countries where milk is either not produced near nuclear power sites or does not contribute significantly to diet. Other pathways which may lead to internal radiation exposure of man involve deposition on growing crops and soil, and on pastures used for animals providing meat for human consumption. An additional pathway leading to internal irradiation is inhalation of radio-nuclides in the plume of airborne wastes from the stack; in the special case of tritiated water. intake also occurs by absorption through skin (472) (paragraphs 362 and 395).
321. Beta and/or gamma emitting radio-nuclides in the plume or deposited on the ground may give rise to external radiation exposure of man. Many of the fission-product noble gases emit both types of radiation. the beta component usually irradiating only the skin. The shorter-lived kryptons and xenons mainly irradiate populations which may be described as local (paragraph 359) in contrast to the longer-lived 85Kr which irradiates local populations as the plume is dispersed downwind. and subsequently irradiates the world population when the 85Kr is dispersed in the global atmosphere (652) (paragraphs 392 and 396).
2. Pathways involving the aquatic environment
322. Radio-nuclides may also be discharged by the nuclear power industry in liquid and solid wastes and enter the aquatic environment by mixing and leaching processes. Water-borne radio-nuclides may be further dispersed, or be re-concentrated on sediments or in biota ( paragraph 323). as local and general movement of surface and ground water proceeds. This pathway leading to radiation exposure of man is more important for the nuclear power industry than for weapons tests. which have taken place mainly in the atmosphere. Mixing and exchange processes in the sea with special reference to radio-active waste disposal ·were reviewed in 1961 (261).
r I 323. Re-concentration of radio-nuclides on inani
mate matter or in biota depends critically on the specific nuclide involved, its chemical fom1, which may change with time due to reaction with other constituents of the water, and the presence or absence of a stable homologue acting as a carrier. It also depends on metabolic and/ or physical characteristics of the biota and sediments. Whilst concentration factors ran!!ing from just under one to about 105 have been observed in particular circumstances, these should not be applied in the course of dose estimations to situations where the conditions are unknown or different from those in which the factors were measured ( 109, 184). Measurements of 134Cs and 137Cs in environmental materials provide evidence of the complex situation involving the interdependence of contamination of biota and inanimate matter as a result of fall-out from weapons tests and discharges of these nuclides by the nuclear power industry (paragraphs 355-357).
324. Utilization of fresh and sea water provides many environmental pathways for internal radiation exposure of man. Exposure of local (i.e. not global) populations may result from consumption of contaminated fish caught recreationally (paragraphs 356, 357, 386, 390) or commercially (paragraphs 356 and 390), or of an edible seaweed marketed commercially (paragraphs 387-389). Tritiated water discharged in liquid wastes may result in radiation exposure to local populations who ingest contaminated water or locallyproduced food-stuffs ( paragraph 391), or to the world population when 3H is dispersed in the water of the globe ( paragraph 397). Radio-nuclides re-concentrated on estuarine silt may result in external radiation exposure of a few persons using the area for fishing (paragraph 390).
C. ASSESSMENT OF RADIATION DOSES TO MEMBERS OF THE POPULATION
325. Doses incurred by the population can be assessed either by an adequate knowledge of the quantity discharged and of the transfer parameters involved ( dispersion, re-concentration factors. etc.), or by means of a programme of environmental monitoring which is usually related specifically to pathways selected as being of greatest importance.
326. It should be recognized that both approaches have serious shortcomings for the dose assessments required in this report. Calculations based on transfer models are subject to considerable uncertainty due to the complexities involved in field conditions. In many cases, the simplified models available are unrealistic. Monitoring routines, on the other hand, are frequently geared to ensure compliance with accepted limits and therefore provide insufficient information on the very low doses which may be incurred by members of the public. An additional difficulty in the interpretation of monitoring results may be due to the presence of fall-out nuclides in considerably larger amount than that of the same nuclides discharged from the nuclear industry. Furthermore, in many instances the discharges are so small that the resulting environmental levels are too low to measure by usual techniques. In view of the small contribution by the nuclear power industry to total dose commitments to members of the public, there has been no requirement to date for more sensitive methods of analysis and dose estimation.
65
D. EXPOSURES FROM l\IINL'<G A~'D MILLD<G
327. The first stage in the nuclear power industry is mining of uranium-bearing ores. As explained in Part One of this annex. the isoto::>e :?::su. which constitutes about 99.3 per cent of natural uranium, is the radio-active parent of a long chain of daughter products. of which 2~0Ra. 222Rn and :?
10Po are the most important from the radiation protection point of view ( paragraphs 74-75). The mining processes give rise to liquid wastes which may be of local interest.
328. Most of the uranium is leached from the ore during milling and recovered in the subsequent chemical treatment, but the majority of radio-active daughter products in raw ore remain in the mill waste ( 609). A study of ~20Ra balances at mills employing different processes showed that most of the :?:?0Ra is present as suspended solids in mill tailings, which consist of about 99 per cent of the ore fed to the mill and are discharged on to tailings piles ( 609).
329. Liquids from these piles drain into tailings ponds which allow deposition and retention of ore solids and associated radio-activity. This represents a basic minimum form of treatment. Evaporation from tailings ponds in dry climates or re-use of water may reduce substantially the quantity of radio-active daughter products which reach surface or ground waters ( 421). Chemical treatment of process streams may also reduce significantly the concentration of dissolved pollutants. including :?26Ra, 210Pb and various chemical components ( 609).
330. Solids in tailings piles are estimated to have totalled about 83 million tonnes by 1969 in the United States alone ( 562). This accumulation is the result of the sudden demand for uranium during the increase in the nuclear weapons production experienced in the United States after World War II. At that time. technological efforts were concentrated on the development of ore-re.fining facilities and on economical re.fining processes, and little attention was paid to waste materials. As a consequence, effective waste treatment or containment was lacking for several years (562).
331. A comprehensive survey of about 30 uranium mills in the United States was undertaken by Merritt ( 421) in 1967; of these half were disused. The survey showed that operators of mills still in use were planning and conducting current operations with the objective of total containment of solids and of controlling the discharge of water-borne radio-active daughter products. A proportion of the uranium output of these mills is used by the nuclear power industry.
332. Information on environmental contamination by radio-active daughter products discharged from uranium mills relates only to the legacy of past practices for disposal of ore solids and contaminated liquids and is not relevant to future production of uranium for use by the nuclear power industry. The use of tailings as fill material in habitable structures in Grand Junction, United States, is discussed in annex D.
E. ExPOSURES FROM FUEL FABRICATION AND ENRICHMENT
333. The process of fuel fabrication usually starts with the uranium-ore concentrates produced at the mills. These concentrates are further purified by chemical processing involving the use of nitric acid and
fluorine and, if fuel enriched with the 235U isotope is required. the volatile uranium hexafluoride is produced. Subsequent to enrichment,. usually in a multi-~tage diffusion plant this product 1s converted by various processes (involving ammonia as a gas or a dilute solution, steam and hydrogen) to uranium as dioxide or metal, as required (199, 534). The final stage in fuel fabrication involves the addition of cladding material.
334. Fuel fabrication and enrichment give rise to various types of wastes. Most uranium compounds are solid and conventional air-cleaning equipment is used to remove particulates from airborne wastes. The quantity of uranium and other chemicals in liquid wastes is reduced by suitable treatment before discharge to the environment; uranium wastes and contaminated plant and other equipment are buried under controlled conditions. No data on wastes discharged from fuel fabrication plants are available to the Committee: however, these wastes are of little si!IDificance from the radiation protection point of view ~ as they consist at present largely of uranium.
335. Thermal reactors currently employed in power production use uranium fuel, but some advanced reactor types now under development are based on fuel consisting of mixed uranium and plutonium oxides or carbides. The addition of plutonium to the fuel does not radically alter the processes required in its fabrication, but it does have an influence upon the potential environmental effects of material discharged because of the high radio-toxicity of plutonium. particularly when inhaled. The plants required for producing plutonium fuel are designed to provide more thorough containment at all stages including storage of wastes.
F. EXPOSURES FROM NUCLEAR POWER REACTORS
1. Origin and amount of radio-nuclides produced
336. The production of power in nuclear reactors is accompanied by the formation of fission products and activation products. Studies of slow-neutron fission of 2s~u and 23epu show that the masses of over 80 fission products generated during fission fall largely into two groups. a '"light"' group with mass numbers 80 to 110 and a "heavy" group with mass numbers from 125 to 155. Fission yields for the various mass numbers range up to over 6 per cent and vary with the fissile nuclide (199). Total ~35U and 239Pu fission yields for nuclides of particular interest for this section are given in table 54, together with their radio-active half-lives.
337. Production rates of fission 3H and 85Kr are of interest because virtuallv all the activity produced is at present discharged to the environment during reprocessing. Data on production rates of !!?OJ are included with those for 3H and s;;Kr in table 55 because some of the 129I produced may be discharged to the environment and its radio-active half-life is very long (1.7 107 y). Production rates per MW(e) y are given for thermal and fast fission: in practice there will be a gradual transition from ~35U to ~39Pu, because many thermal reactors will burn a significant amount of 239Pu produced from z:isu in fuel.
338. Annual production rates (table 55) of 3H. ssKr and 1~9I are calculated on the basis of (a) the power produced in 1970 (9.7 GW(e)) and (b) the estimated world capacity of 4,300 GW(e) in the year 2000 ( table 53) consisting of 70 per cent fast-breeder reactors, as projected for the United States ( 465).
66
Values are also given in table 55 for the integrated amounts produced and the cumulative amounts of these nuclides remaining when decay is taken into account. In all cases a load factor of 0.5 and a thermal efficiency of 0.3 are assumed. The values given for the year 2000 are very approximate as estimates of world nuclear generating capacity vary by a factor of about four (table 53) and the production rate of each of 3H. 65Kr and 1291 differs by a factor of about two according to the fissile material ( table 55). The values for 3H include only that produced by ternary fission in fuel.
339. Tritium is also produced by neutron activation of 2H. In light-water reactors the rate is estimated to be about 0.004 Ci {MW(e) y)-1• but in heavy-water reactors it could be as high as 30 Ci (MW(e) y)-1
(505). Tritium in quantities intermediate between these values is also produced by activation of other reactor components such as boron and lithium used for neutrondensity control (505) (table 56). These sources could add appreciable amounts to the 2 H produced by ternary fission, but the amounts vary too much depending on reactor design to be included in the estimates in table 55.
340. Besides 3H, a large variety of activation products is formed in a nuclear reactor (table 56). Some of them, such as 134Cs and some actinide radio-nuclides, are formed in the fuel and their activities can be calculated from data on burn-up and the neutron energy spectrum. The most important actinide radio-nuclide is 239Pu which, being a fissile element, is also burnt up as fuel. Reported activities of 239Pu in spent fuel are 160 Ci r-1 for fuel in advanced gas-cooled reactors (AGRs) ( 54) and 330 Ci t-1 for fuel in light-water reactors (LWRs) ( 465). 134Cs is produced by neutron activation of 1s.1cs, which is one of the most abundant stable nuclides formed by fission. 184Cs activity in AGR fuel, after a bum-up of 18.000 MW(th) d r 1 at a specific power of 10 MW (th) t-1, has been calculated to be about 20 per cent of that of 137Cs (112).
341. The other radio-nuclides listed in table 56 are produced by activation of reactor components other than fuel. The cross-sections for production of those nuclides are given in table 56 but their activities cannot be calculated without a knowledge of the isotopic composition of the materials used in the reactor components and of the spatial distribution of the neutron flux and energy spectrum. Neutron irradiation of graphite or of carbon dioxide leads to the production of 14C and irradiation of 160 contained in air or water results in the formation of 12N and 16N. 41Ar is produced by activation of air which contains 40 Ar in the proportion of about 1 per cent. The presence of chromium. cobalt, or zinc in metals gives rise to the formation of 58Co, 60Co, 51Cr and 65Zn.
2. Discharges to the environment
342. The emphasis in this report is on data which specify individual radio-nuclides discharged and which are, therefore, relevant to the estimation of radiation doses to man. Data on discharges are not available for some of the operating reactors and are limited in scope for others, being mainly in the form of gross activity measurements. Comprehensive studies giving information on individual nuclides discharged have been carried out in the United States on a boiling-water reactor (BWR) (304) and a pressurized-water reactor (P\VR) (303). These are both light-water reactors
J
(LWRs). In addition, a detailed study has been made of the Hudson River (USA) to which radio-nuclides from a P\VR are discharged (357). There is a small amount of information for similar reactors in other countries.
343. Limited information on individual nuclides discharged is available for gas-cooled reactors ( GCRs) (88. 146, 499) and pressurized heavy-water reactors (PHWRs) (400). Discharges of noble gases from all of the above types of reactors are relatively well documented. Other reactor types, such as fast breeder reactors (FBRs) and oreanic moderated and cooled reactors ( OMRs). are still at the development or design stage. and no information on discharges is available.
(a) Liquid discharges
344. Tritium is present in the coolant of watercooled reactors (paragraph 339) and some of this is discharged with miscellaneous liquid wastes arising in connexion with reactor operation. Quantities discharged in each of the years 1968-1970 are given in table 57. which also shows the quantities of 3H discharged per unit of power generated. It is clear that PWRs and the PHWR have discharged much more 3H than BWRs. Various causes contribute to the difference. The use of dissolved boron in PWRs and of heavy water in the PHWR gives rise to considerable quantities of activation product 3H in the coolant. Stainless-steel cladding used on fuel elements in the first four PWRs listed in table 57 allows greater diffusion of fission product 3H into the coolant than the zircaloy cladding on fuel elements used in Dresden-I (BWR) and Ginna (PWR) in the United States.
345. Discharges of 3H in liquid wastes from gascooled reactors in 1969 and 1970 are given in table 58. These vary considerably from station to station. but are on averaee somewhat more than those from BWRs and less than~ from PWRs in total quantities discharged and quantities per MW ( e) y of power generated. The aH is partly fission-product 3H from cooling ponds and the gas-coolant drying plant, and partly activationproduct 3H (146).
346. Individually-measured radio-nuclides discharged in liquid wastes are listed in tables 59 and 60 for water- and gas-cooled reactors, respectively. They are discharged as mixtures of fission and activ<ttion products. The nuclides are often very difficult or costly to measure individually. and the usual practice is to estimate gross beta and gamma activity only, unless this is abnormally high.
(b) Discharges of noble gases
34 7. Discharges of noble gases constitute the main source of external radiation around reactors. A very small proportion of the 85Kr in fuel is discharged at reactor sites and all the remainder is released from fuel during reprocessing. Discharges of 85Kr to the environment are discussed in paragraphs 377-378. In general, the total noble-gas activity discharged. which consists mainly of kryptons and xenons. is highest in BWRs and lowest in PWRs (table 61).
348. Activation gases are discharged from some reactors, particularly some GCRs and PHWRs ( table 61). Activation of subsidiary-cooling air leads to discharge of nAr at a rate which depends on the char-
67
actcristics of the reactor; discharge of gases activated in the primary coolant occurs as a result of leakage and of operational need (262).
349. In LWRs, discharges consist mainly of fission gases which enter the coolant from fuel. The composition of noble fission gases is presented in table 62 for various decay times. In BWRs, eases are discharged after a 20-30 minute hold-up of the off-gas stream to achieve removal by decay of most of the original activity (324). Table 63 shows that the measured composition of gases discharged from the Dresden-I BWR agrees reasonably well with results computed for a 21 minute decay.
350. In PWRs, gases are discharged when the coolant is depressurized after a hold-up time of up to 120 days. Values for the discharge of radio-active gases from PWRs, which consist mainly of 133Xc, are shown in table 61.
( c) Other gaseous and particulate discharges
351. Discharges of other gaseous and particulate radio-nuclides to atmosphere are usually reported in general terms, such as halogens and particulates. Information available for 3H and gaseous 131 I is summarized in table 64. The tritiated water discharges from the PHWR at Douglas Point in Canada resulted largely from the high production rate of 3H in the heavy-water coolant and moderator (400). The discharges of 131! from Dresden-I, Yankee Rowe and Douglas Point reactors were less than one curie per year, although the total 1311 content of these reactors when at their full power of about 200 MW ( e) is of the order of 1 O• curies. Discharges of particulates from Dresden-I and Yankee Rowe were also well under one curie per year (303. 304), while airborne particulates from the PHWR are removed by filtration and are not normally present in detectable quantities (400). As well as 41Ar, 14C and the short-lived 16N, the radio-nuclide 35S has been reported as a constituent of GCR stack gases in the United Kingdom ( 499).
3. Doses resulting from environmental contamination
(a) Doses from radio-nuclides discharged to the aquatic environment
352. Radio-nuclides are discharged to rivers, sometimes in tidal reaches, or to large lakes from all the water-cooled reactors listed in table 57 except Oyster Creek and San Onofre, from which they are discharged directly to the Atlantic and Pacific Oceans, respectively. Radio-nuclides are discharged to the coastal waters of the British Isles from all the United Kingdom gascooled reactors listed in table 58, except those at Trawsfynydd from which they are discharged to. a fresh-water lake. In the case of the reactor at Latina in Italy, they are discharged to the Mediterranean.
353. The highest measured values of tritium concentrations in environmental samples near three P~R sites quoted by Krieger et al. ( 345) relate to discharges and not to water available for intake by members of the public. The only published estimates ~f. the very low doses to local populations due to . tntmm discharged are based on conservative assumptions of dilution and intake (59, 345, 400).
354. Detailed environmental studies have been conducted near two of the water-cooled reactors in the
United States for which data on specific radio-nuclides in liquid discharges are given in table 59. The study in the Illinois River near the Dresden-I reactor took place during a nine-month period in 1968 (304) and a comprehensive research programme on the Hudson River estuary. into which radio-nuclides from the Indian Point-I reactor are discharged. was carried out from 1964 to 1970 (357). A comprehensive monitoring programme is also in operation on the coastal waters of the British Isles into which four of the reactor sites listed in table 60 discharge their wastes, and on Lake T rawsfynydd to which the fifth site discharges (426, 427).
355. Monitoring results require considerable interpretation before an estimate of doses to members of the public can be made. For example, as mes is often the nuclide which contributes most of the dose when contaminated fish or other aquatic food-stuffs are eaten by humans. it is desirable to distinguish 13•Cs from reactor operations from that in fall-out. The presence of the shorter-lived isotope 134Cs in the former is of assistance here and its use is suggested in the studies of the 134Cs/137Cs ratio in biota in the brackish water of the Hudson River. These studies indicated that intake of caesium by the biota was mainly from freshly introduced caesium isotopes from the reactor rather than 137Cs from fall-out retained on bottom sediments (357).
356. Mean caesium concentrations measured in fish at Dresden-I. Indian Point-I and Trawsfynydd are shown in table 65. The mean 13•Cs concentration of 0.015 pCi g-1 wet in various species in the Illinois River near Dresden-I is the average of upstream and downstream values because there was no significant difference between them. The discharges of radiocaesium into the Hudson River from Indian Point-I produced a measurable difference between upstream and downstream samples for both 134Cs and 137Cs and. in this case. it is possible to calculate doses resulting from material discharged. The dose from both isotopes was estimated to be 10--0 rad y-1 per g d-1 of fish consumed ( table 65). Commercial and recreational fishing take place in the affected reaches of the Hudson but neither the fish consumption rates nor the size of the population involved are known. Other nuclides ( 68Co. 6°Co and 54Mn) were also measured in fish. but they did not add appreciably to the dose due to the radiocaesium discharged.
357. Mean caesium concentrations measured in trout and perch from the lake at Trawsfynydd ( 426), where about 100 persons consume fish caught recreationally (323), are shown in table 65. Although some of the 137Cs in fish from Lake Trawsfynydd may be from fall-out. the ratio of 137Cs/134Cs in the fish in 1969 was similar to that in the discharge in that year. The total annual whole-bodv dose due to radio-caesium is estimated to be 2 10--4 • rad y-1 per g d-1 of fish consumed ( table 65). Values for 1970 were somewhat lower than those for 1969 (427).
358. Population dose commitments from discharges from three United Kine:dom reactor sites are shown in table 66 (323). The~ dose commitments have been taken to be equal to the annual doses (thus implying that the various components of the food chain are in equilibrium). In the table. individual and population dose commitments are based on the consumption and
68
exposure rates quoted for the exposed population groups.
(b) Doses from noble gases discharged to atmosphere
359. Noble gases in airborne wastes cause external radiation exposure which decreases rapidly wiLl-i distance from the reactor as a result of the short half-life of most of the gases discharged and of dispersion of the plume in the atmosphere. Annual doses to populations living in the vicinity of nuclear power plants are a function of the population distribution, meteorological characteristics and distance from the site boundary. Average annual doses in 1969 (table 67), both at the site boundary and for the population included within 6.4 and 80 kilometres of these plants, have been calculated (188) using realistic population distributions and wind frequencies for 11 power reactor sites in the United States and average meteorological conditions. Because no allowance has been made for the time spent in buildings and the shielding afforded by them, these doses are overestimated. As expected, the doses vary widely from one power plant to another and in the case of BWRs are much less for new reactors than for old ones because of technical improvements. The population dose beyond 80 kilometres will depend upon the amount of comparatively long-lived nuclides, particularly 133Xe, present in the discharge. The ratio between the long-distance and the short-distance contributions to the population dose will increase if the radio-active gases are stored for a period sufficient to allow the short-lived components to decay, thus increasing the proportion of longer-lived components in the mixture. The contribution from 85Kr is insignificant because most of the 65Kr is released from the reprocessing plants (paragraph 369).
360. Estimates of doses at the site boundary of some of the reactors listed in table 61 are shown in table 68. Where annual doses at or near the boundary have not been reported, they have been estimated using the assumptions indicated in the table.
(c) Doses from radio-nuclides following other pathways
361. A survey in the vicinity of the Dresden-I reactor, where discharges in 1968 of a number of radionuclides to atmosphere and the aquatic environment were up to one curie ( tables 59 and 64). showed that few of the environmental samples contained any activity attributable to the discharges ( 304). 131I was measured in thyroids of heifers allowed to graze on pasture for several weeks before slaughter, specifically as indicators of contamination. but was not detected in milk from a herd at the nearest dairy. This and other negative results in a range of other environmental materials, including cabbage. deer and rabbit. led to the conclusion that exposure to the surrounding population through consumption of food and water from radionuclides discharged from Dresden-I was not measurable.
362. Doses may be incurred by the population at large living near reactors from which tritiated water is discharged to atmosphere. If 3H intake is limited to inhalation and passage through the skin. drinking water and food being uncontaminated. the dose at the boundary fence is calculated to be 7 10-1 rad (MW(e) y)-1
for the Douglas Point PH\VR (400). Considerably smaller amounts of 3H are discharged from reactors of other types ( table 64) and the doses are correspondingly lower. The contribution of 3H discharges to global doses is discussed in paragraph 397.
I G. EXPOSURES FRO:\! FUEL REPROCESSING AND WASTE DISPOSAL
l. Fate of the radio-nuclides in fuel fed to a reprocessing plant
363. At the end of its useful life in the reactor. fuel is removed and immersed in a cooling pond at the reactor site to allow substantial decay of many shortJived nuclides. This decreases potential radiation and other hazards during subsequent handling, transport and reprocessing of fuel, and simplifies the recovery of valuable fissile materials. e.g. 2]~Pu ar.d uranium.
364. The principle widely employed in reprocessing plants is to separate plutonium and uranium from fission products by a multiple-stage extraction process that leaves the fission and corrosion products in aqueous solution. The aqueous solution from the first extraction usually contains more than 99.9 per cent of the fission products from the dissolved fuel ( 611 ) ; this highly radio-active solution is often concentrated by evaporation before storage in specially constructed and protected steel tanks, sometimes located underground. In some cases the solution is allowed to boil, in others it is cooled, but there is always a gaseous stream which may carry entrained fission products from the solution. This process stream is filtered before being discharged to the environment.
365. Although the storage of highly radio-active solutions has been satisfactory hitherto, potential problems associated with long-term maintenance and supervision of containment have led to investigation of methods of permanent disposal ( 54 7). The principle common to most of the methods is to convert the solution to suitable solid material that will withstand effects of high radiation levels, and to store or bury it in selected man-made or natural locations. There would be little airborne or water-borne radio-activity released from stored solidified wastes. but clean-up problems of gaseous process .streams might be severe during solidification processes. The decision to apply the principle of solidification has already been made in the United States, where liquid storage is to be permitted only during the first five years after reprocessing ( 43).
366. Various aqueous solutions of fission products of relatively low activity concentration are produced as a result of the washing of organic solutions of plutonium and uranium separated from the bulk of the fission products during the multiple stage process. In some cases, chemical or other treatment may be employed to reduce the quantity of many of the radionuclides in these solutions, before they are mixed with other lower-activity solutions. The latter may arise from the decontamination of process equipment, pro-
. tective clothing and personnel, as well as from scrubbers or similar devices used to remove radio-activity from gaseous streams. At present these waste solutions. which may be of very large volume, are discharged to the environment by way of dry wells or open pits in the ground (618) or directly into the sea (253).
637. The aqueous waste currently discharged to the environment contains, as tritiated water, virtually all of the fission-product 3H present in fuel at dissolution ( table 5 5). although advanced technology may reduce the rate of discharge from future reprocessing plants by factors of l O to 100 ( 465). For the same reason that 3H is practically unrecoverable-after tritiated water
69
has been diluted with ordinary water. 3H will not be expected to concentrate in biological material.
368. ~t~er radio-nuclidcs present in fuel ,vhose charactenstlcs make them of interest in the present ~ontext are the noble gases 85Kr and 13axe. and two isotopes of iodine. 1201 and 1a11.
369. Almost all of the 85Kr produced in thermal reactors (table 55) remains in the fuel until dissolution, unless the cladding becomes defective in the reactor. The normal cooling time of about six months does not materially affect the amount of 85Kr available for discharge because its half-life is relativelv long (10.7 y) but methods have been developed to ·absorb and store the gas for a period of several half-lives (149 420. 566). '
370. The fission product 133Xe has a short half-life (5.3 d) and its equilibrium level is about I MCi r-1 at a power level of 20 MW(th) t-1 (table 54). The activity decays to 10-1 Ci t-1 when fuel is cooled for about six months. If fast-reactor fuel is cooled for only 30 days before reprocessing. the corresponding content would be about 2 10~ Ci r-1• The 131mxe content of fuel is two orders of magnitude less than 133Xe ( table 54) but its longer half-life (12 d) results in a slower rate of decay than with mxe. Several processes involving hold-up on a charcoal bed may be employed to produce an order of magnitude reduction in the radio-xenon activity discharged ( 465).
3 71. Because of its very long half-life ( 1. 7 1 Qi y), virtually all of the 129I produced in small amounts in nuclear fuel ( about 0.02 Ci r-1 ) is present at the time of dissolution (87, 537). 131! bas a half-life of only eight days and after the usual cooling period for thermal-reactor fuel of about six months. the 131I content of fuel is about 0.1 Ci r 1• It is normal practice to employ general-purpose scrupbers with a decontamination factor of up to 1.000 to reduce the amounts of airborne radio-iodine discharged from the plant (90, 465). ~
372. The reprocessing of short-q:,oled fast-reactor fuels is likely to be part of a combined fast- and thermal-reactor programme because there will be a strong economic incentive to reduce to a minimum the quantity of plutonium required for the whole power programme. Investigations into control of a.irborne 131 I discharges during reprocessing of such fuel have shown that process streams will require decontamination factors well beyond those currently in use ( 90, 465). Because of this, discharges of 129I will also be much less than the quantities in the fuel reprocessed. -
2. Discharges to the environment
(a) Liquid discharges
373. The quantity of radio-nuclides discharged to the environment from reprocessing plants depends largely upon waste-management practices. These. in turn. depend upon the characteristics of the local environment and population and on the requirement of ensuring compliance with accepted radiation protection criteria. At the first commercial reprocessing plant (Nuclear Fuel Services. NFS) in the United States (393) low-activity solutions are discharged to lagoons which provide additional decontamination through settling during storage. Liquids from the lagoons are then discharged to creeks and rivers in the environment.
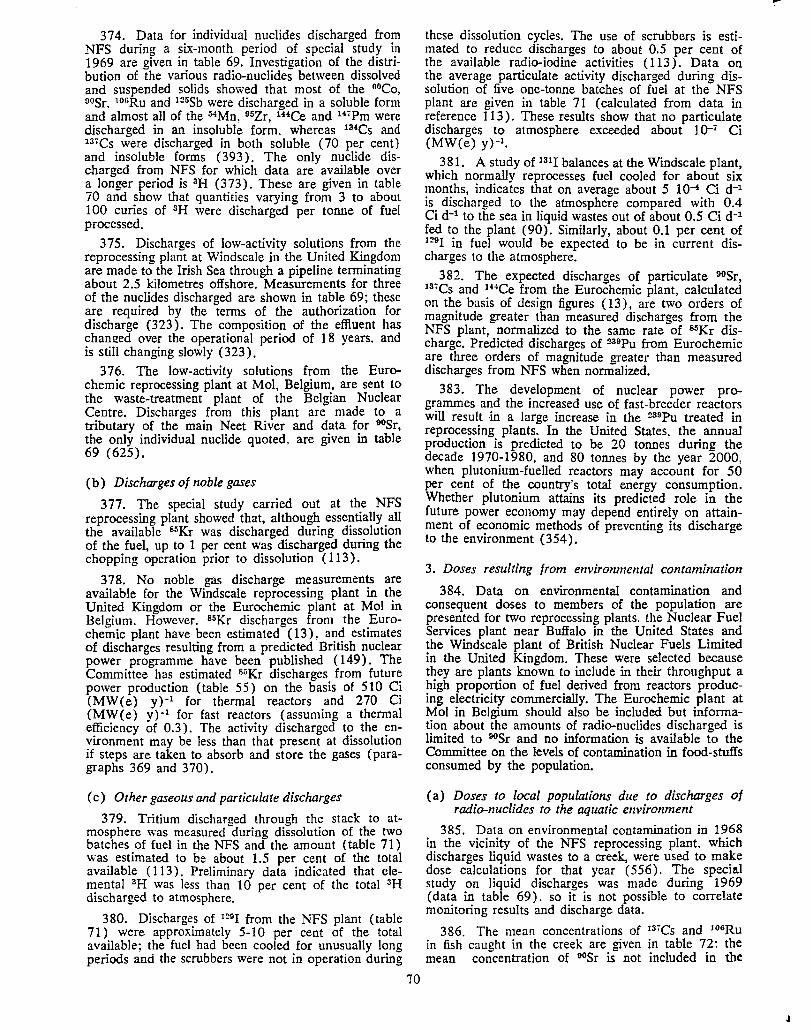
374. Data for individual nuclides discharged from NFS during a six-month period of special study in 1969 are given in table 69. Investigation of the distribution of the various radio-nuclides between dissolved and suspended solids showed that most of the 0°Co, eosr. 106Ru and 125Sb were discharged in a soluble form and almost all of the 54Mn. 95Zr, 144Ce and 14.Pm were discharged in an insoluble form. whereas 134Cs and 13•Cs were discharged in both soluble (70 per cent) and insoluble forms ( 393). The only nuclide discharged from NFS for which data are available over a longer period is 3H (373). These are given in table 70 and show that quantities varying from 3 to about 100 curies of 3H were discharged per tonne of fuel processed.
375. Discharges of low-activity solutions from the reprocessing plant at Windscale in the United Kingdom are made to the Irish Sea through a pipeline terminating about 2.5 kilometres offshore. Measurements for three of the nuclides discharged are shown in table 69; these are required by the terms of the authorization for discharge (323). The composition of the effluent has changed over the operational period of 18 years. and is still changing slowly ( 323).
376. The low-activity solutions from the Eurochemic reprocessing plant at Mol, Belgium, are sent to the waste-treatment plant of the Belgian Nuclear Centre. Discharges from this plant are made to a tributary of the main Neet River and data for 90Sr, the only individual nuclide quoted, are given in table 69 (625).
(b) Discharges of noble gases
3 77. The special study carried out at the NFS reprocessing plant showed that, although essentially all the available 85Kr was discharged during dissolution of the fuel, up to 1 per cent was discharged during the chopping operation prior to dissolution ( 113).
378. No noble gas discharge measurements are available for the Windscale reprocessing plant in the United Kingdom or the Eurochemic plant at Mol in Belgium. However. S5Kr discharges from the Eurochemic plant have been estimated (13), and estimates of discharges resulting from a predicted British nuclear power programme have been published (149). The Committee has estimated 85Kr discharges from future power production ( table 55) on the basis of 510 Ci (MW(e) y)-1 for thermal reactors and 270 Ci (MW(e) y)-1 for fast reactors (assuming a thermal efficiency of 0.3). The activity discharged to the environment may be less than that present at dissolution if steps are taken to absorb and store the gases ( paragraphs 369 and 370).
(c) Other gaseous and particulate discharges
379. Tritium discharged through the stack to atmosphere was measured during dissolution of the two batches of fuel in the NFS and the amount (table 71) was estimated to be about 1.5 per cent of the total available ( 113). Preliminary data indicated that elemental 3H was less than 10 per cent of the total 3H discharged to atmosphere.
380. Discharges of 129I from the NFS plant (table 71) were approximately 5-10 per cent of the total available; the fuel had been cooled for unusually long periods and the scrubbers were not in operation during
70
these dissolution cycles. The use of scrubbers is estimated to reduce discharges to about 0.5 per cent of the available radio-iodine activities ( 113). Data on the average particulate activity discharged during dissolution of five one-tonne batches of fuel at the- NFS plant are given in table 71 (calculated from data in reference 113). These results show that no particulate discharges to atmosphere exceeded about 10-7 Ci (MW(e) y)-1•
381. A study of 1311 balances at the Windscale plant, which normally reprocesses fuel cooled for about six months, indicates that on average about 5 10-4 Ci d-1
is discharged to the atmosphere compared with 0.4 Ci d-1 to the sea in liquid wastes out of about 0.5 Ci d-1
fed to the plant (90). Similarly, about 0.1 per cent of 1291 in fuel would be expected to be in current discharges to the atmosphere.
382. The expected discharges of particulate 90Sr, 137Cs and wee from the Eurochemic plant, calculated on the basis of design figures (13), are two orders of magnitude greater than measured discharges from the NFS plant, normalized to the same rate of llllKr discharge. Predicted discharges of 239Pu from Eurochemic are three orders of magnitude greater than measured discharges from NFS when normalized.
383. The development of nuclear power programmes and the increased use of fast-breeder reactors will result ,in a large increase in the 239Pu treated in reprocessing plants. In the United States. the annual production is predicted to be 20 tonnes during the decade 1970-1980, and 80 tonnes by the year 2000, when plutonium-fuelled reactors may account for 50 per cent of the country's total energy consumption. Whether plutonium attains its predicted role in the future power economy may depend entirely on attainment of economic methods of preventing its discharge to the environment ( 3 54).
3. Doses resulting from enviroronental contamination
384. Data on environmental contamination and consequent doses to members of the population are presented for two reprocessing plants. the Nuclear Fuel Services plant near Buffalo in the United States and the Windscale plant of British Nuclear Fuels Limited in the United Kingdom. These were selected because they are plants known to include in their throughput a high proportion of fuel derived from reactors producing electricity commercially. The Eurochemic plant at Mol in Belgium should also be included but information about the amounts of radio-nuclides discharged is limited to 90Sr and no information is available to the Committee on the levels of contamination in food-stuffs consumed by the population.
(a) Doses to local populations due to discharges of radio-nuclides to the aquatic environment
385. Data on environmental contamination in 1968 in the vicinity of the NFS reprocessing plant, which discharges liquid wastes to a creek, were used to make dose calculations for that year (556). The special study on liquid discharges was made during 1969 ( data in table 69), so it is not possible to correlate monitoring results and discharge data.
386. The mean concentrations of 137Cs and 106Ru in fish caught in the creek are given in table 72: the mean concentration of 90Sr is not included in the
.J

table because the values were measured for whole fish and most of the 1JOSr will be in inedible bone (556). The mean 137Cs concentration of 0.63 pCi g-1 in fish corresponds to an annual dose of 2 104 rad for a typical fish consumption rate of 15 g d-1
by members of the population. Similarly the mean concentration of 106Ru of 0.85 pCi g-1 corresponds to an annual dose to the gastro-intestinal tract equal to 9 1()-4 rad. Assuming that the 1968 operations are typical. the annual throughput of fuel irradiated to about 20 MW ( e) y r-1 is 140 t y-1 ( table 70) and these annual doses therefore correspond to about 1 o-, and 3 10-7 rad (MW(e) y)-1 for 137Cs and 106Ru, respectively (table 72). However, the numbers of people to which these doses are applicable is not stated but the numbers are probably small since the consumption of fish in the sampling area is the result of recreational fishing only.
387. A comprehensive marine monitoring programme is employed in connexion with the liquid discharges from Windscale ( 426. 427, 654). The critical pathway involves a type of edible sea-weed which is used in making laverbread in South Wales, 500 kilometres away. The sea-weed is monitored inter alia for 05Zr/05Nb, 106Ru and 1-1-1ce. and a study in 1967-1968 showed that 106Ru contributed 82 per cent of the dose to the gastro-intestinal tract ( 425).
388. The 106Ru concentrations in laverbread of 15 and 7 pCi g-1 wet in 1969 and 1970. respectively (table 72). are average values for the products of three manufacturers (426, 427). Intensive market surveys in South Wales have shown that the median rate of consumption of laverbread by a small critical group (about 100 persons) is 160 g d-1. and that consumption by the whole group of 26,000 laverbread eaters is about 10 per cent of this ( 512). Average annual doses to the gastro-intestinal tract of the whole group of laverbread eaters, as result from 106Ru contamination, were 1.7 10-2 and 8.0 lQ--3 rad per 16 g d-1 consumed in 1969 and 1970, respectively (table 72).
389. If the average annual throughput of the Windscale plant is taken to be about 1.800 tonnes of fuel irradiated to a level of 3 MW ( e) y r 1 • the annual plant throughput corresponds to the generation of about 5,000 MW(e) y. Thus the above annual doses are equivalent to 3.4 10-0 and 1.6 lQ-6 rad (MW(e) y)-1 to members of the whole P<:Pulation of Iav~rbr~ad eaters in 1969 and 1970. respectively. The contnbution from this pathway to the population dose commitment to the gastro-intestinal tract is therefore about 0.09 and 0.04 man-rad (MW(e) y)-1 in these years. The contribution to the population gonad dose is lower by a factor about 1,000 (88).
390. Dose commitments to small groups exposed through other pathways are given in table 73. The contribution to the population dose is, however, very small because of the small numbers of individuals exposed as well as the generally smaller individual dose commitments. On the other hand, plaice is fished commercially over a wide area of the Irish Sea and radio-caesium contamination of the fish is estimated to give rise to a population whole-body dose commitment of 3 10-2 man-rad (MW(e) y)-1 (427). This is over three orders of magnitude greater than the population whole-body dose commitment resulting from consumption of fish by the much smaller group of 100 persons (table 73).
71
391. Concentrations of 3H have been measured in various local food-stuffs around the NFS plant (556). Although 3H discharged to the atmosphere may have contributed to amounts of this nuclide in such food-stuffs as deer meat and milk. the fraction c?ming froll: this source ( 1.5 per cent of the total d1scha~ge~) is.probably small compared to that coming from hqu1d discharges. Observed levels in milk were similar to those to be expected from 3H released by the testing of nuclear weapons in the atmosphere. Levels in fish were about 10 times greater than those expected from fall-out alone while levels in deer were about 30 times greater. The latter results sugoest that the deer were obtaining drinking water ftom the creek at points closer to the plant than the points where the fish were sampled. Members of the public eat deer meat and fish caught in the area. but Shleien (556) concluded that doses from 3H to individuals eating typical amounts of these local food-stuffs were negligible.
(b) Doses to local populations from discharges of noble gases to atmosphere
392. Assuming a 85Kr discharge of 510 Ci (MW (e) y)-1 (table 55), the average rate of discharge of this nuclide from a plant processing fuel from a thermal reactor at the rate of I MW(e) y annually is about 1.6 lQ--5 Ci s-1• At a distance of a few kilometres the long-term mean concentration in groundlevel air is about 10-1 Ci m--a per Ci s-1 discharged (85) so that the concentration near the plant would be about 1.6 pCi m--a and the gonad dose commitment 2.7 10-a rad (MW(e) y)-1. The actual dose received by members of a population near a reprocessing plant would, of course, depend on the quantity and irradiation of fuel processed. Similarly. the dose to the population would depend on the population distribution around a specific plant. Taking the estimates of average concentrations per unit rate of discharge as a function of distance given by Bryant ( 85), and a uniform density of 100 persons per square kilometre, the population gonad dose commitment is 5.4 1 o--a man-rad (MW(e) y)-1 to the population (about 20 million) living within 250 kilometres of the site (table 74 ).
(c) Dose to local populations due to other airborne radio-nuclides
393. The concentrations of 90Sr in milk from farms about five kilometres from the Windscale plant are not significantly different from those expected ( typically 15 pCi ( gCa )-1 ) from the fall-out from weapons tests ( 654). Somewhat hi!!her levels ( about 40 pCi ( gCa )-1 ) have been found at farms nearer the site but these are believed to be due to the 90Sr deposited as a result of discharges from the experimental reactors aL Windscale during their early years of operation (414).
394. Levels of 90Sr and 137Cs in the diet, excluding fish and deer caught locally, of persons living ne_ar the NFS plant in New York State can~ot be distinguished from those observed elsewhere m the state which arise from the fall-out from nuclear weapons tests.
395. Doses to individuals living near the reprocessing plants resultino from discharges of 3H to the atmosphe;e, can be calculated using . methods similar to those used to estimate correspondmg doses
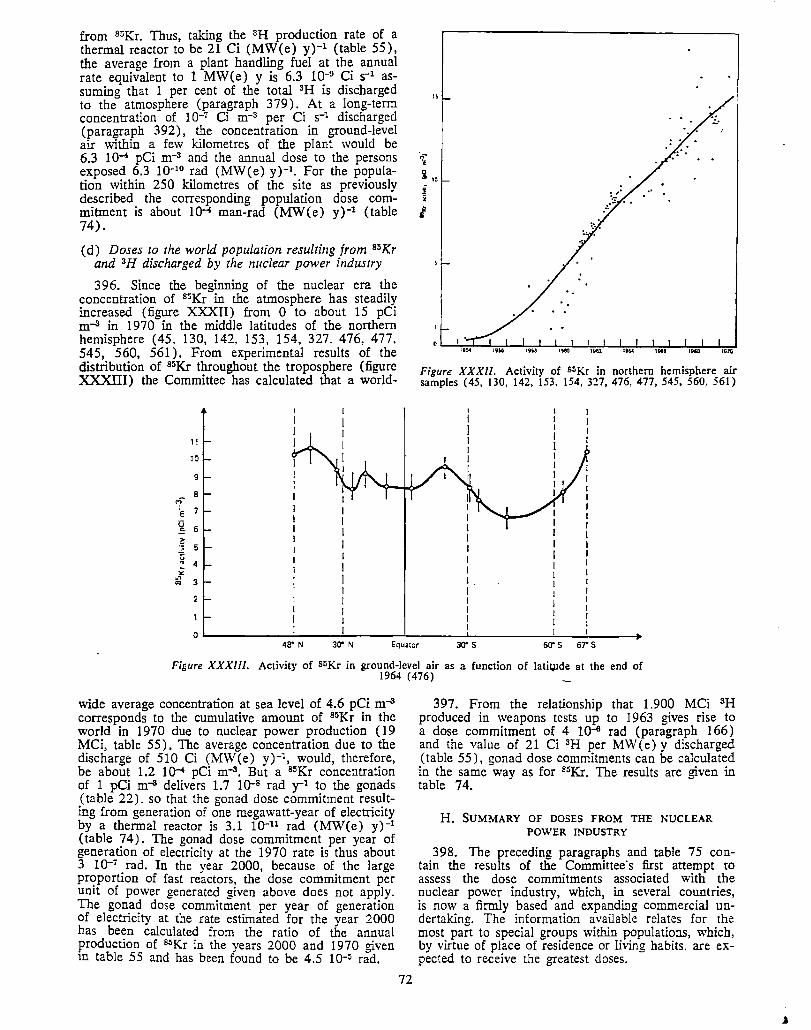
from ssKr. Thus, taking the 3H production rate of a thermal reactor to be 21 Ci (MW(e) y)-1 (table 55), the average from a plant handling fuel at the annual rate equivalent to 1 MW(e) y is 6.3 10-9 Ci s-1 assuming that 1 per cent of the total 3H is discharged to the atmosphere (paragraph 3 79). At a long-term concentration of 10--7 Ci m-s per Ci s-1 discharged (paragraph 392), the concentration in ground-level air within a few kilometres of the plant would be 6.3 1<>-' pCi m-s and the annual dose to the persons exposed 6.3 10--10 rad (MW(e) y)-1• For the population within 250 kilometres of the site as previously described the corresponding population dose commitment is about 1()-4 man-rad (MW(e) y)-1 (table 74).
(d) Doses to the world population resulting from 85Kr and 3H discharged by the nuclear power industry
396. Since the beginning of the nuclear era the concentration of 85Kr in the atmosphere has steadily increased (figure XXXII) from O to about 15 pCi m-s in 1970 in the middle latitudes of the northern hemisphere (45, 130, 142, 153, 154, 327. 476, 477, 545, 560, 561). From experimental results of the distribution of 85Kr throughout the troposphere (figure XXXIII) the Committee has calculated that a world-
'7-
11
10
9
8
'E 7
i 6
::-:~ 5
~ 4 >£
:I:: 3
2
15
~ i ,. :i i
I
19~ 1960 1952 1966 19'8 1&10
Figure XXXll. Activity of S5Kr in northern hemisphere air samples (45, 130, 142, 153, 154,327,476,477,545, 560, 561)
48" N 30" N Equator 30' s 60" S 67"S
Figure XXXl/1, Activity of S5Kr in ground-level air as a function of latit,µde at the end of 1964 (476) _
wide average concentration at sea level of 4.6 pCi m-3 corresponds to the cumulative amount of 85Kr in the world in 1970 due to nuclear power production (19 MCi, table 55). The average concentration due to the discharge of 510 Ci (MW(e) y)-1 , would, therefore, be about 1.2 104 pCi m-s. But a 85Kr concentration of 1 pCi m~ delivers 1. 7 1 ()-8 rad y-1 to the gonads ( table 22). so that the gonad dose commitment resulting from generation of one megawatt-year of electricity by a thermal reactor is 3.1 10-11 rad (MW(e) y)-1
(table 74). The gonad dose commitment per year of generation of electricity at the 1970 rate is thus about 3 10--7 rad. In the year 2000, because of the large proportion of fast reactors, the dose commitment per unit of power generated given above does not apply. The gonad dose commitment per year of generation of electricity at the rate estimated for the year 2000 has been calculated from the ratio of the annual production of 65Kr in the years 2000 and 1970 given in table 55 and has been found to be 4.5 10-S rad.
72
397. From the relationship that 1,900 MCi 3H produced in weapons tests up to 1963 gives rise to a dose commitment of 4 10-e rad (paragraph 166) and the value of 21 Ci 3H per MW(e) y discharged (table 55), gonad dose commitments can be calculated in the same way as for 85Kr. The results are given in table 74.
H. SUMMARY OF DOSES FROM THE NUCLEAR POWER INDUSTRY
398. The preceding paragraphs and table 75 contain the results of the Committee·s first attempt to assess the dose commitments associated with the nuclear power industry, which, in several countries, is now a firmly based and expanding commercial undertaking. The information available relates for the most part to special groups within populations, which, by virtue of place of residence or living habits, are expected to receive the greatest doses.
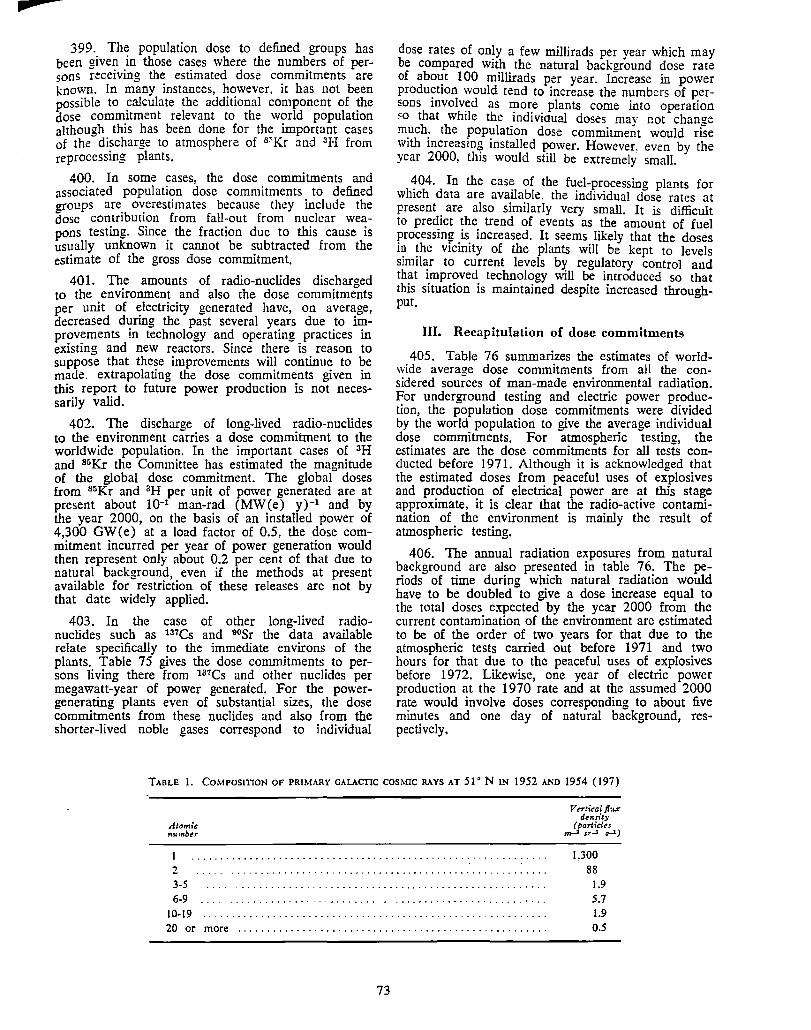
jiiiP
399. The population dose to defined groups has been given in those cases where the numbers of persons receiving the estimated dose commitments are known. In many instances, however, it has not been passible to calculate the additional component of the dose commitment relevant to the world population although this has been done for the important cases of the discharge to atmosphere of 8~Kr and 3H from reprocessing plants.
400. In some cases, the dose commitments and associated population dose commitments to defined groups are overestimates because they include the dose contribution from fall-out from nuclear weapans testing. Since the fraction due to this cause is usually unknown it cannot be subtracted from the estimate of the gross dose commitment.
401. The amounts of radio-nuclides discharged to the environment and also the dose commitments per unit of electricity generated have, on average, decreased during the past several years due to improvements in technology and operating practices in existing and new reactors. Since there is reason to suppose that these improvements will continue to be made. extrapolating the dose commitments given in this report to future power production is not necessarily valid.
402. The discharge of long-lived radio-nuclides to the environment carries a dose commitment to the worldwide population. In the important cases of 3H and 8GKr the Committee has estimated the magnitude of the global dose commitment. The global doses from 85Kr and 3H per unit of power generated are at present about 10-1 man-rad (MW(e) y)-1 and by the year 2000, on the basis of an installed power of 4,300 GW(e) at a load factor of 0.5, the dose commitment incurred per year of power generation would then represent only about 0.2 per cent of that due to natural background, even if the methods at present available for restriction of these releases are not by that date widely applied.
403. In the case of other long-lived radionuclides such as 137Cs and 90Sr the data available relate specifically to the immediate environs of the plants. Table 75 gives the dose commitments to persons living there from 137Cs an~ other nuclides per megawatt-year of power generated. For the powergenerating plants even of substantial sizes, the dose commitments from these nuclides and also from the shorter-lived noble gases correspond · to individual
dose rates of only a few millirads per year which may be compared with the natural background dose rate of abo1:t 100 millirads per year. Increase in power produ~tion would tend to increase the numbers of persons mvolv~d as more plants come into operation so that while the indivictual doses mav not change much. the population dose commitment would rise with increasin9 installed power. However, even by the year 2000, this would still be extremely small.
404. In the case of the fuel-processino plants for which data are available. the individual d~se rates at present are also similarly very small. It is difficult to predict the trend of events as the amount of fuel processing is increased. It seems likely that the doses in the vicinity of the plants will be kept to levels similar to current levels by regulatory control and that improved technology will be introduced so that this situation is maintained despite increased throughput.
Ill. Recapitulation of dose commitments
405. Table 76 summarizes the estimates of worldwide average dose commitments from all the considered sources of man-made environmental radiation. For underground testing and electric power production, the population dose commitments were divided by the world population to give the average individual dose commitments. For atmospheric testing, the estimates are the dose commitments for all tests conducted before 1971. Although it is acknowledged that the estimated doses from peaceful uses of explosives and production of electrical power are at this stage approximate, it is clear that the radio-active contamination of the environment is mainly the result of atmospheric testing.
406. The annual radiation exposures from natural background are also presented in table 76. The periods of time during which natural radiation would have to be doubled to give a dose increase equal to the total doses expected by the year 2000 from the current contamination of the environment are estimated to be of the order of two years for that due to the atmospheric tests carried out before 1971 and two hours for that due to the peaceful uses of explosives before 1972. Likewise, one year of electric power production at the 1970 rate and at the assumed 2000 rate would involve doses corresponding to about five minutes and one day of natural background, respectively.
TABLE 1. COMPOSITION OF PRIMARY GALACTIC COSMIC RAYS AT 51 °NIN 1952 AND 1954 (197)
Atomic numbtr
2 3-5 6-9 .......................................................... .
10-19 20 or more .................................................... .
73
V n-tica/ f/:ud,n.rit:;
(particles n,-2 sr-1 ~)
1,300 88
1.9 5.7 1.9
0.5
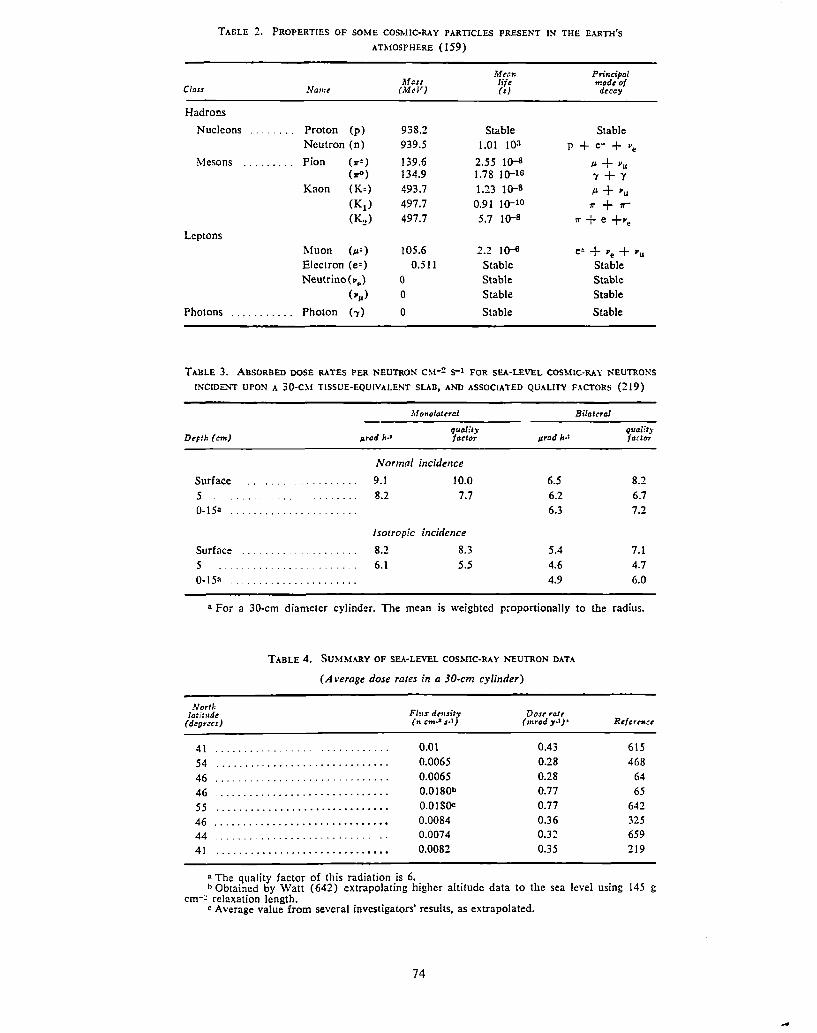
TABLE 2. PROPERTIES OF SOME COSMIC-RAY PARTICLES PRESENT IN THE EARTH'S
ATMOSPHERE (159)
Mean Principal 1,fa$S lift modt of
Class Namt (McV) (s) decay
Hadrons
Nucleons ........ Proton (p) 938.2 Stable Stable Neutron (n) 939.5 1.01 103 p + e- + ve
Mesons ......... Pion ( ir•) 139.6 2.55 10-S µ+Vil (,:<>) 134.9 1.78 10-10 "'f + y
Kaon (K•) 493.7 1.23 10-s µ + "11
(K1) 497.7 0.91 10-10 lT + ,r-
(K2) 497.7 5.7 10-s ir + e +v. Leptons
Muon (µ•) 105.6 2.2 !o-6 e= + "• + "11
Electron (e•) 0.511 Stable Stable Neutrino( ... ) 0 Stable Stable
(,.,,) 0 Stable Stable
Photons ........... Photon ("'() 0 Stable Stable
TABLE 3. ABSORBED DOSE RATES PER NEUTRON CM-2 s-1 FOR SEA-LEVEL COSMIC·R.·W NEUTRONS
!NCIDE.'<T UPON A 30-CM TISSUE-EQUIVALENT SLAB, AND ASSOCIATED QUALITY FACTORS (219)
llfonou,teral Bilateral
Depth (cm) JlTad 1,.1 quality factt>r µrad 1,.1
quality factor
Normal incidence
Surface ....... - 9.1 10.0 6.5 8.2
5 8.2 7.7 6.2 6.7 0-15a ......... 6.3 7.2
Isotropic incidence
Surface . . . . . . . . 8.2 8.3 5.4 7.1
5 6.1 5.5 4.6 4.7
0-15" ................... 4.9 6.0
11 For a 30-cm diameter cylinder. The mean is weighted proportionally to the radius.
TABLE 4. SUMM.-.RY OF SEA-LEVEL COSMIC-RAY NEUTRON DATA
(Average dose rates in a JO-cm cylinder)
Nort/, F/u.r dmsitf Dost rc:lt latitude
(dtgr~u) (n cn1..2 s·l (mrad 1·')'
41 ...... 0.01 0.43
54 . . . . . . . .. . ..................... 0.0065 0.28
46 . . . . . . . . . . . . . . .............. 0.0065 0.28
46 . .. . . . . . ..................... 0.0180b 0.77
55 .............................. 0.01 soe 0.77
46 . . . . . . . ........................ 0.0084 0.36
44 . . . . . . . . . . . . . . . . . ......... . . 0.0074 0.32
41 . . .. . . ........................ 0.0082 0.35
Rt/C.tNU
615 468
64 65
642 325 659 219
• The quality factor of this radiation is 6. b Obtained by Watt (642) extrapolating higher altitude data to the sea level using 145 g
cm-~ relaxation length. c Average value from several investigators' results, as extrapolated.
74
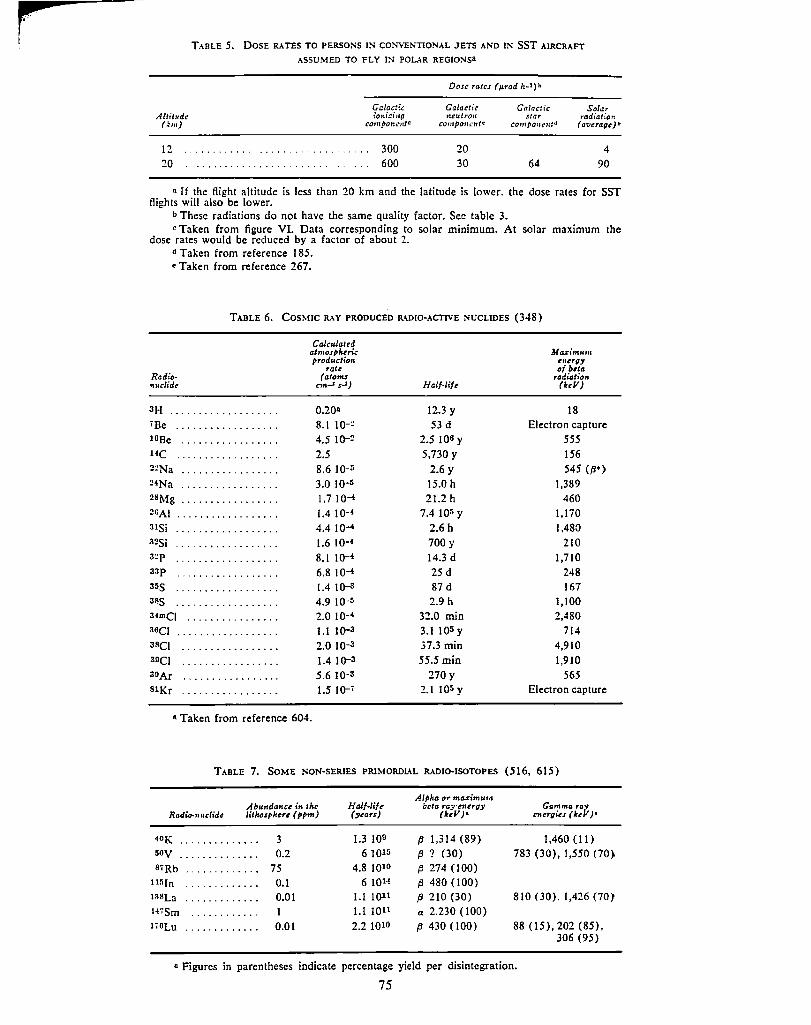
f I TABLE 5. DOSE RATES TO PERSONS IN CONVENTIONAL JETS AND IN SST AIRCRAFT
ASSUMED TO FLY IN POLAR REGIONS&
Altit11dc (km)
12 20
Galactic ioni~i,,g
componente
300 600
Dosc rates ( µrad J:..1) b
Galactic Galactic Solar n.eutrou star radiatiot1.
compo-uL~ntr: eompo11c11td (average)•
20 4 30 64 90
0 If the flight altitude is less than 20 km and the latitude is lower, the dose rates for SST flights will also be lower.
b These radiations do not have the same quality factor. See table 3. c Taken from figure VI. Data corresponding to solar minimum. At solar maximum the
dose rates would be reduced by a factor of about 2. d Taken from reference 185. e Taken from reference 267.
TABLE 6. COS!\HC RAY PRODUCED R.\DIO-.... CTIVE NUCLIDES (348)
Calculated atmosplurk Ma.rimttnt productwn energy
rat~ of blla Radio- (atoms rodialion nuclide c,n-' sJ) Half-life (kcV)
3H ................... 0.20a 12.3 y 18 7Be .................. 8.1 10-~ 53 d Electron capture lOBe ................. 4.5 10-2 2.5 ]06 y 555 HC .................. 2.5 5,730 y 156 22Na ................. 8.6 ]0-5 2.6 y 545 (p+)
24Na ................. 3.0 10-s 15.0 h 1,389 2SMg ................. 1.7 ]0-4 21.2 h 460 :?GAi .................. 1.4 10-• 7.4 105 y 1,170 31Si .................. 4.4 ]0-4 2.6 h 1,480 32Si ' .. ' .............. 1.6 10-• 700 y 210 3~p .................. 8.1 ID-* 14.3 d 1,710 33p .................. 6.8 10-* 25 d 248 ass .................. 1.4 JQ-3 87 d 167 aas .................. 4.9 J0-5 2.9 h 1,100 34mC( ................ 2.0 10-• 32.0 min 2,480 36Cl .................. 1.1 IQ-3 3.l I05y 714 asc1 ................. 2.0 I0-3 37.3 min 4,910 aoc1 ................. 1.4 10-3 55.5 min 1,910 30Ar ................. 5.6 lQ-3 270 y 565 81Kr ................. 1.5 10-• 2.1 105 y Electron capture
• Taken from reference 604.
TABLE 7. SOME NON-SERIES PRIMORDIAL RADIO-ISOTOPES (516, 615)
Half-lift Alpha or ma.nmu,11
Gamma ra? Abundance in Ilse beta ra::rffltrgy Radio-nuclide /ithosphert ( ppm) (ytarS) (keV)• 1/flergics{kt )•
40K .............. 3 1.3 109 p 1,314 (89) 1,460 (II) soy .............. 0.2 61015 p ? (30) 783 (30), 1,550 (70) 87Rb ............. 75 4.8 1010 p 274 (100)
ur.rn ............. 0.1 6 1014 p 480 (100) l!IBLa ............. 0.01 1.1 lQll fJ 210 (30) 810 (30), 1,426 (70} 14,Sm ............ I 1.1 1011 a 2,230 ( 100) 1,6Lu ............. 0.01 2.2 1010 p 430 (100) 88 (15), 202 (85),
306 (95)
a Figures in parentheses indicate percentage yield per disintegration.
75
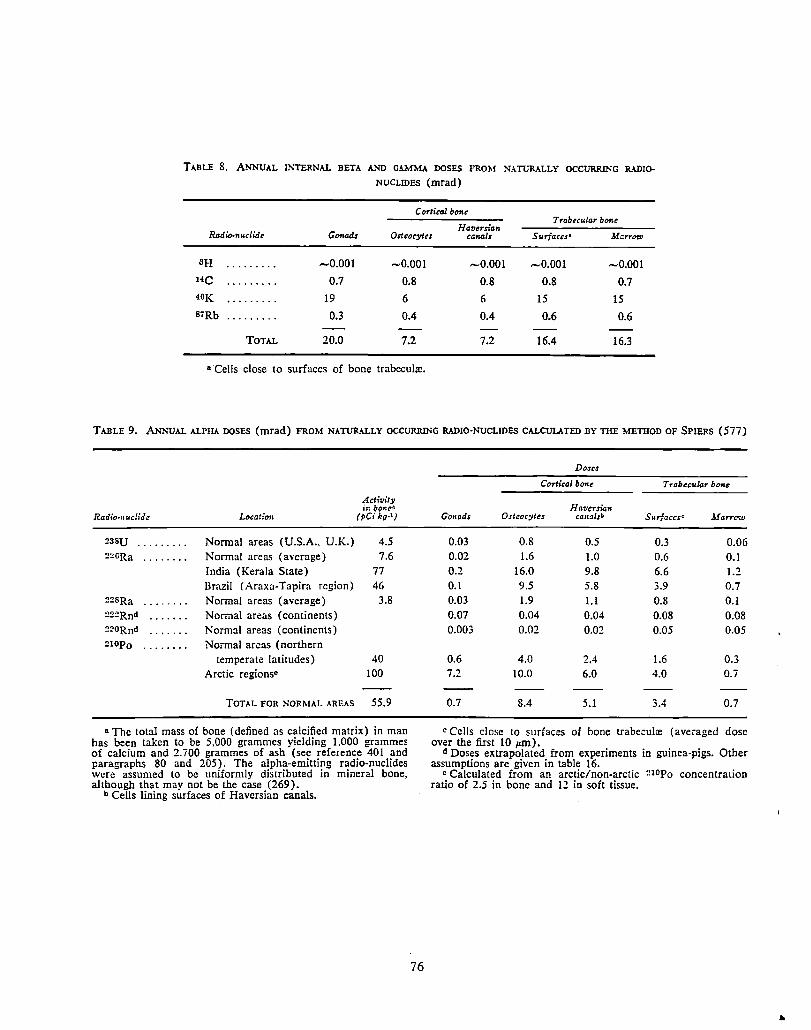
TABLE 8. ANNUAL I?'1"ERNAL BETA AND GAMMA DOSES FROM NATURALLY OCClJRRING RADIO
NUCLIDES (mrad)
C orlical bone Trabecular bone
Haversian Radio-nuclide Gonads Orteocytu canals Surfaces• MarrOTJ1
llH ......... ..... 0.001 -0.001 -0.001 -0.001 -0.001 HC ......... 0.7 0.8 0.8 0.8 0.7 40K ......... 19 6 6 15 15 87Rb ......... 0.3 0.4 0.4 0.6 0.6
TOTAL 20.0 7.2 7.2 16.4 16.3
a Cells close to surfaces of bone trabcculre.
TABLE 9. ANNUAL ALPIL', DOSES (mrad) FROM NATURALLY OCCURRING RADIO·NUCLIDES CALCULATED BY lliE METHOD OF SPIERS (577)
Radio,nuclidc
23SU ........ .
220Ra ......••
22SRa ..•.....
22:?Rnd
220Rnd ..•..••
21op0 ..•.•.••
Activity in bcmra
Location (pCi ko·1 )
Normal areas (U.S.A., U.K.) 4.5 Normal areas (average) 7.6 India (Kerala State) 77 Brazil (Araxa-Tapira region) 46 Normal areas (average) 3.8 Normal areas (continents) Normal areas (continents) Normal areas (northern
temperate latitudes) 40 Arctic regionse 100
TOTAL FOR NORMAL AREAS 55.9
11 The total mass of bone (defined as calcified matrix) in man has been taken to be 5,000 grammes yielding 1,000 grammes of calcium and 2.700 grammes of ash (see reference 401 and paragraphs 80 and 205). The alpha-emitting radio-nuclides were assumed to be uniformly distributed in mineral bone, although that may not be the case (269).
b Cells lining surfaces of Haversian canals.
76
Doses
Cortical bone T rabecular bone
Haversi4n Gonads Os:eocytcs cana/sb Surfaces< },!arrow
0.03 0.8 0.5 0.3 0.06 0.02 1.6 1.0 0.6 0.1 0.2 16.0 9.8 6.6 1.2 0.1 9.5 5.8 3.9 0.7 0.03 1.9 1.1 0.8 0.1 0.07 0.04 0.04 0.08 0.08 0.003 0.02 O.Q2 0.05 0.05
0.6 4.0 2.4 1.6 0.3 7.2 10.0 6.0 4.0 0.7
0.7 8.4 5.1 3.4 0.7
c Cells close to surfaces of bone trabecul:e (averaged dose over the first 10 µm).
d Doses extrapolated from experiments in guinea-pigs. Other assumptions are given in table 16.
e Calculated from an arctic/non-arctic nopo concentration ratio of 2.5 in bone and 12 in soft tissue.
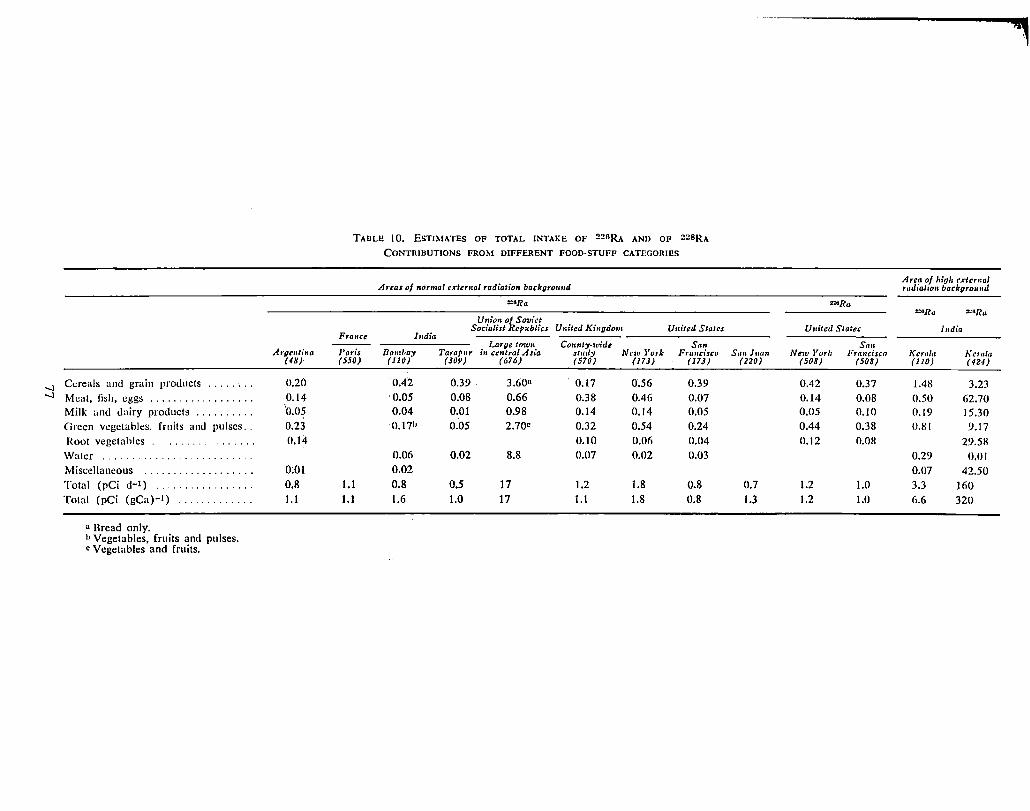
Argenti•a (48)-
-.J Cereals and grain products ........ 0.20 -.J Meat, fish, eggs 0.14 ..................
Milk and dairy products ... ' ...... 0.05 Green vegetables, fruits and pulses .. 0.23 Root vegetables . . ................ 0.14 Water . . . . . . .............. ' . Miscellaneous .............. 0:01 Total (pCi d-1) . . . ' ............. 0.8 Total (pCi (gCa)-1) ... ' ......... I.I
n Bread only. "Vegetables, fruits and pulses. • Vegetables and fruits.
TAUL!! JO. ESTIMATES OF TOTAL INTAKE OF :?:?ORA AND OF 228RA
CONTRIBUTIONS FROM DIFFERENT. FOOD-STUFF CATEGORll!S
A,·,as of 11or111al external radiation backoround
"''"Ra
U11ion of Soviet Socialist Rcfm/Jlics United Kingdom U11ited States
France I11dia Large town Co,mty,u-ide Sa11
Paris Bombay Tarapur in central Asia study New l'ork Fnu,et'sco (550) ( 110) (JO'i) (676) (570) (17J) (17J)
0.42 0.39 3.6011 0.17 0.56 0.39 ·0.05 0.08 0.66 0.38 0.46 0.07 0.04 0.01 0.98 0.14 0.14 0.05 0.17h 0.05 2.70C 0.32 0.54 0.24
0.10 0.06 0.04 0.06 0.02 8.8 0.07 0.02 0.03 0.02
1.1 0.8 0.5 17 1.2 1.8 0.8 1.1 1.6 1.0 17 I.I 1.8 0.8
,
Arca of hioll •~·tern al radia/1011 backoro1111d
"'"Ra raRa :=!11Ra
U11ited Statc.r India
Son San}umi New York Francisco Kern/a /,~trn/cJ
(220) (508) (508) (110) (42-1)
0.42 0.37 1.48 3.23 0.14 0.08 0.50 62.70 0,05 0.10 0.19 15.30 0.44 0.38 0.81 9.17 0.12 0.08 29.58
0.29 0.01 0.07 42.50
0.7 1.2 1.0 3.3 160 1.3 1.2 1.0 6.6 320
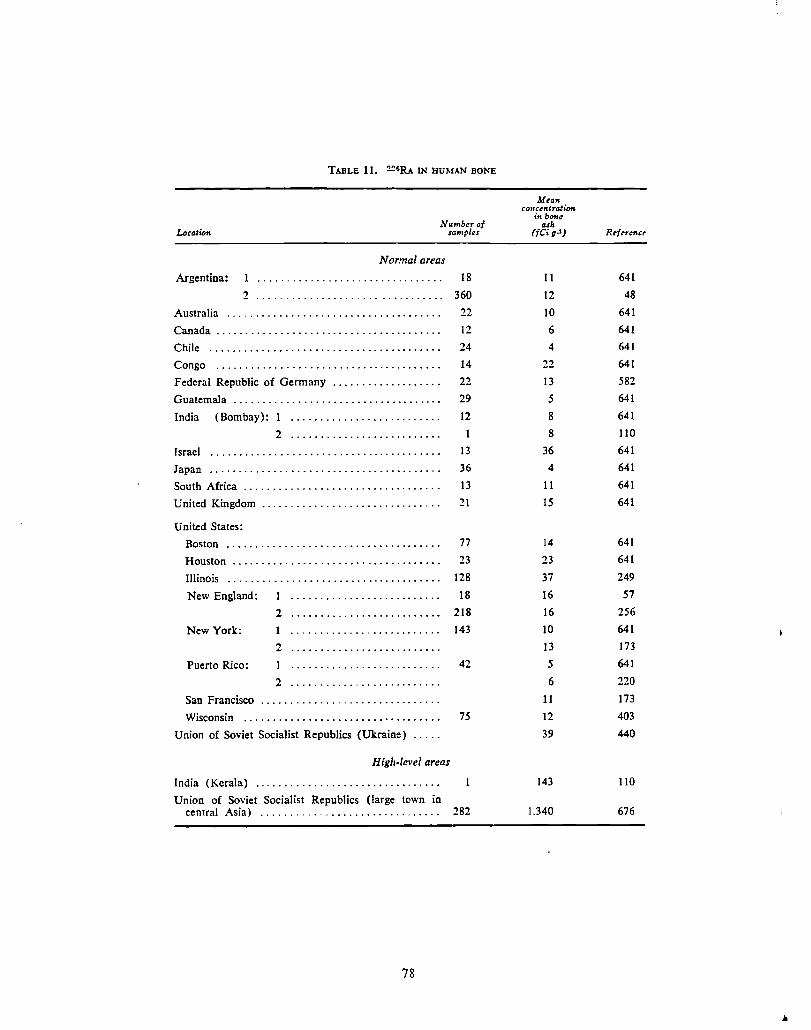
TABLE 11. 226R.A IN HUMAN BONE
Number of samples
Normal areas
Argentina:
2 ................ .
Australia .................................... .
Canada ...................................... .
Chile ....................................... .
Congo ...................................... .
Federal Republic of Germany .................. .
Guatemala ................................... .
India (Bombay): ......................... .
2 ......................... .
Israel
Japan ....................................... .
South Africa ................................. .
United Kingdom
United States:
18
360
22
12
24
14
22 29
12
1
13
36
13
21
Boston . . . . . . . . . . . . . . . . . . . . . . . . . . . . . . . . . . . . . 77
Houston . . . . . . . . . . . . . . . . . . . . . . . . . . . . . . . . . . . . 23
Illinois . . . . . . . . . . . . . . . . . . . . . . . . . . . . . . . . . . . . . 128
New England: l . . . . . . . . . . . . . . . . . . . . . . . . . . 18
2 . . . . . . . . . . . . . . . . . . . . . . . . . . 218
New York: 1 . . . . . . . . . . . . . . . . . . . . . . . . . . 143
2 ......................... .
Puerto Rico: l ......................... . 42
2
San Francisco
Wisconsin . . . . . . . . . . . . . . . . . • • . . • • . . . . . . . . . . . 75
Union of Soviet Socialist Republics (Ukraine) .....
Higli-level areas
India (Kerala)
Union of Soviet Socialist Republics (large town in central Asia) . . . . . . . . . . . . . . . . . . . . . . . . . . . . . . . 282
78
Mtan concentration
in ba,u, cuh
(!Ci g-')
11
12
10
6
4
22
13
5
8
8
36
4
11
15
14
23
37
16
16
10
13
5
6
11
12
39
143
1,340
Rtfrrer<cr
641
48
641
641
641
641
582
641
641
110
641
641
641
641
641
641
249
57
256
641
173
641
220
173
403
440
110
676
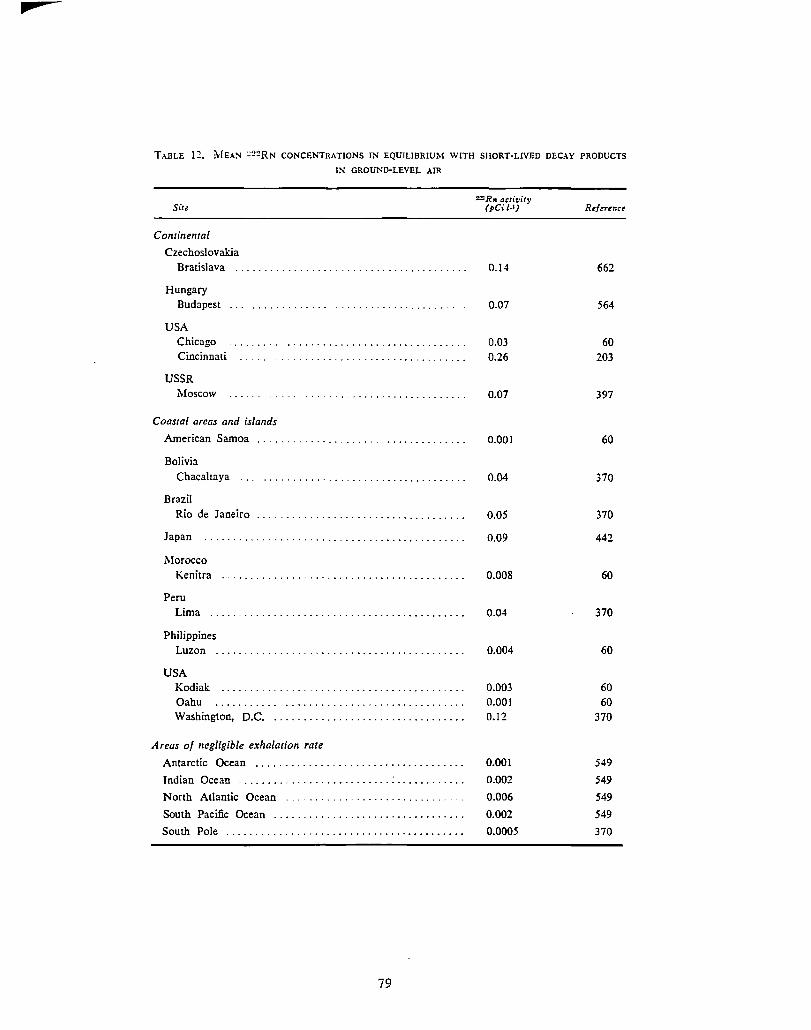
TABLE 12. MEAN ~'.!'.!RN CONCENTRATIONS IN EQUILIBRIUM WITH SHORT-LIVED DECAY PRODUCTS
JN GROUND-LEVEL AIR
Si:e
Continental
Czechoslovakia Bratislava
Hungary Budapest
USA Chicago Cincinnati
USSR Moscow
Coastal areas and islands
American Samoa
Boli\,ia Chacaltaya
Brazil Rio de Janeiro
Japan ............................................ .
Morocco Kenitra
Peru Lima
Philippines Luzon
USA Kodiak Oahu Washington, D.C. . ............................... .
Areas of negligible e:i:halarion rate
Antarctic Ocean ................................... .
Indian Ocean .......................... : ........... .
North Atlantic Ocean ............................. .
South Pacific Ocean ................................ .
South Pole ........................................ .
79
2:::Rn activity (pCi /.1)
0.14
0.07
0.03 0.26
0.07
0.001
0.04
0.05
0.09
0.008
0.04
0.004
0.003 0.001 0.12
0.001
0.002
0.006
0.002
0.0005
Reference
662
564
60 203
397
60
370
370
442
60
370
60
60 60
370
549
549
549
549
370
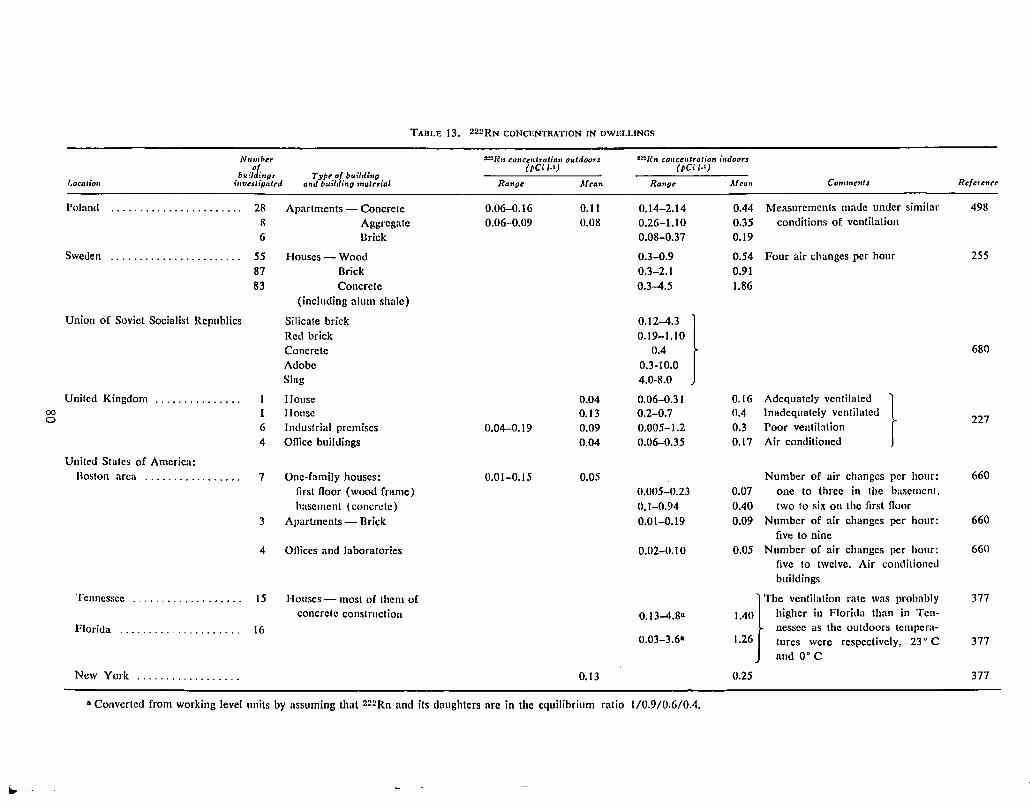
00 0
TABLE 13. 222RN CONCENTRATION IN DWELLINGS
Number ~Rn conccutratiou outdoors •nR11 conceutration iudoors
1-ocat{on buil°Ji·ugs
invtstigaled
Poland ....................... 28 8
6
Sweden ....................... 55 87 83
Union of Soviet Socialist Republics
United Kingdom ............... 1 1 6 4
United States of America: Boston area ................. 7
3
4
Tennessee 15
Florida 16
New York ................. .
Type of l111ildi1111 and buildi1111 matrrial
Apartments - Concrete Aggregate Brick
Houses - Wood Brick Concrete
(including alum shale)
Silicate brick Red brick Concrete Adobe Slag
House House Industrial premises Office buildings
One-family houses: first floor (wood frame) basement ( concn.:te)
Apartments - Brick
Offices and laboratories
Houses - most of them of concrete construction
(PCil-1)
Range l\f can
0.06-0.16 0.11 0.06-0.09 0.08
0.04 0.13
0.04-0.19 0.09 0.04
0.01-0.15 0.05
0.13
(pCi 1-1)
Rangt'
0.14-2.14 0.26-1.10 0.08-0.37
0.3-0.9 0.3-2.1 0.3-4.5
0.12-4.3 0.19-1.10
0.4 0.3-10.0 4.0-8.0
0.06-0.31 0.2-0.7 0.005-1.2 0.06-0.35
0.005-0.23 0.1-0.94 0.01-0.19
0.02-0.10
0.13-4.8•
0.03-3.6•
}
11 Converted from working level units by assuming that 222Rn and its daughters arc in the equilibrium ratio 1/0.9/0.6/0.4.
Mran Commtuts
0.44 Measurements made under similar 0.35 conditions of ventilation 0.19
0.54 Four air changes per hour 0.91 1.86
0.16 Adequately ventilated
} 0.4 Inadequately ventilated Poor ventilation 0.3
0.17 Air conditioned
Number of air changes per hour: O.o7 one to three in the basement. 0.40 two to six on the first floor 0.09 Number of air changes per hour:
five to nine 0.05 Number of air changes per hour:
five to twelve. Air conditioned buildings
}
The ventilation rate was probably 1.40 higher in Florida than in Ten-
nessee as the outdoors tempera-1.26 lures were respectively, 23 ° C
and o• C
0.25
Rcfercnu
498
255
680
227
660
660
660
377
377
377
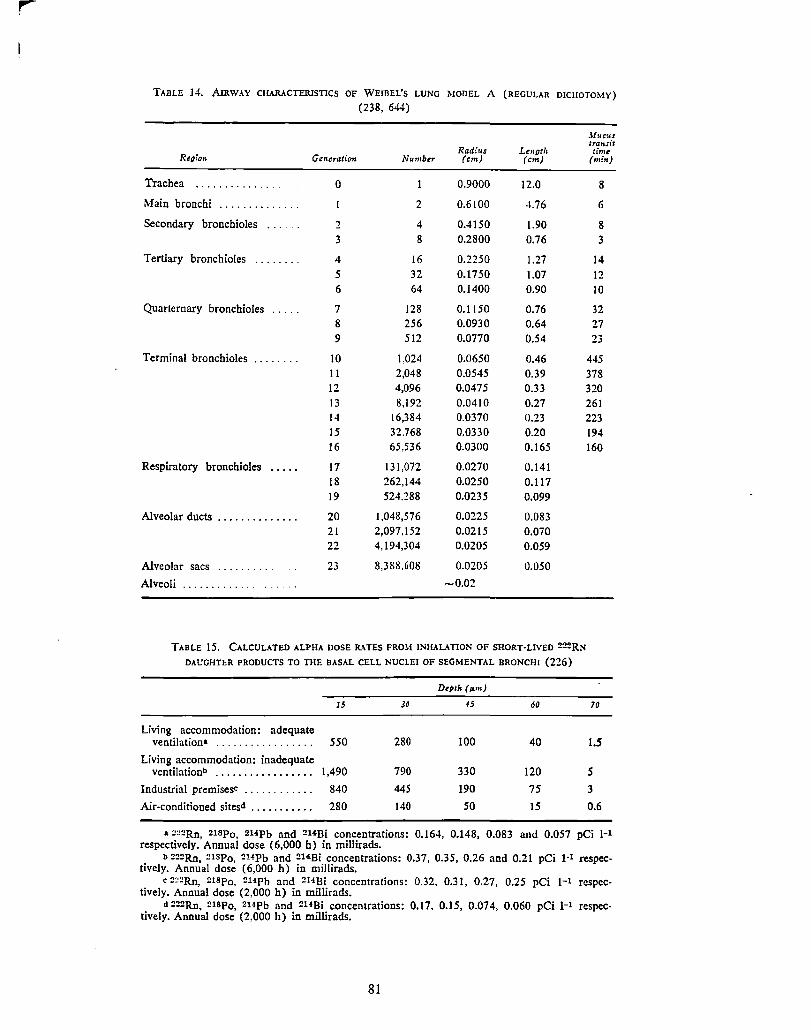
TABLE 14. A.nlWAY CHARACTERISTICS OF WE!BEL'S LUNG MODEL A (REGULAR DICHOTOMY) (238, 644)
Jl:,~.u Iran.tit
Radius Lc11oth time Region Generation Number (cm) (cm) (min)
Trachea .............. 0 0.9000 12.0 8
Main bronchi .......... 2 0.6100 4.76 6
Secondary bronchioles 2 4 0.4150 1.90 8 3 8 0.2800 0.76 3
Tertiary bronchioles ........ 4 16 0.2250 1.27 14 5 32 0.1750 1.07 12 6 64 0.1400 0.90 10
Quarternary bronchioles ..... 7 128 0.1150 0.76 32 8 256 0.0930 0.64 27 9 512 0.0770 0.54 23
Terminal bronchioles ........ 10 1.024 0.0650 0.46 445 11 2,048 0.0545 0.39 378 12 4,096 0.0475 0.33 320 13 8,192 0.0410 0.27 261 14 16,384 0.0370 0.23 223 15 32.768 0.0330 0.20 194 16 65,536 0.0300 0.165 160
Respiratory bronchioles ..... 17 131,072 0.0270 0.141 18 262,144 0.0250 0.117 19 524.288 0.0235 0.099
Alveolar ducts .............. 20 1,048,576 0.0225 0.083 21 2,097.152 0.0215 0.070 22 4,194,304 0.0205 0.059
Alveolar sacs ....... 23 8,388.608 0.0205 0.050
Alveoli ............. -0.02
TABLE 15. CALCULATED ALPHA DOSE RATES FROM INHALATION OF SHORT-LIVED 222RN DAUGHTER PRODUCTS TO THE BASAL CELL NUCLEI OF SEGMENTAL BRONCHI (226)
Depth (Jt.m)
15 JO 45 60 70
Living accommodation: adequate ventilation" ................. 550 280 100 40 1.5
Living accommodation: inadequate ventilationb ................. 1,490 790 330 120 5
Industrial premises<' ............ 840 445 190 75 3
Air-conditioned sitesd ......••••. 280 140 50 15 0.6
a ~~2Rn, 21spo, 214Pb and 2HBi concentrations: 0.164, 0.148, 0.083 and 0.057 pCi 1-1 respectively. Annual dose (6,000 h) in millirads.
b z:?2Rn, 21spo, 2HPb and 2HBi concentrations: 0.37, 0.35, 0.26 and 0.21 pCi I·l respectively. Annual dose (6,000 h) in millirads.
c 2~2Rn, 21spo, 214Pb and 2HBi concentrations: 0.32, 0.31, 0.27, 0.25 pCi 1-1 respectively. Annual dose (2,000 h) in millirads.
d:?z:?Rn, 21spo, 2HPb and 2HBi concentrations: 0.17, 0.15, 0.074, 0.060 pCi 1-1 respectively. Annual dose (2,000 h) in millirads.
81
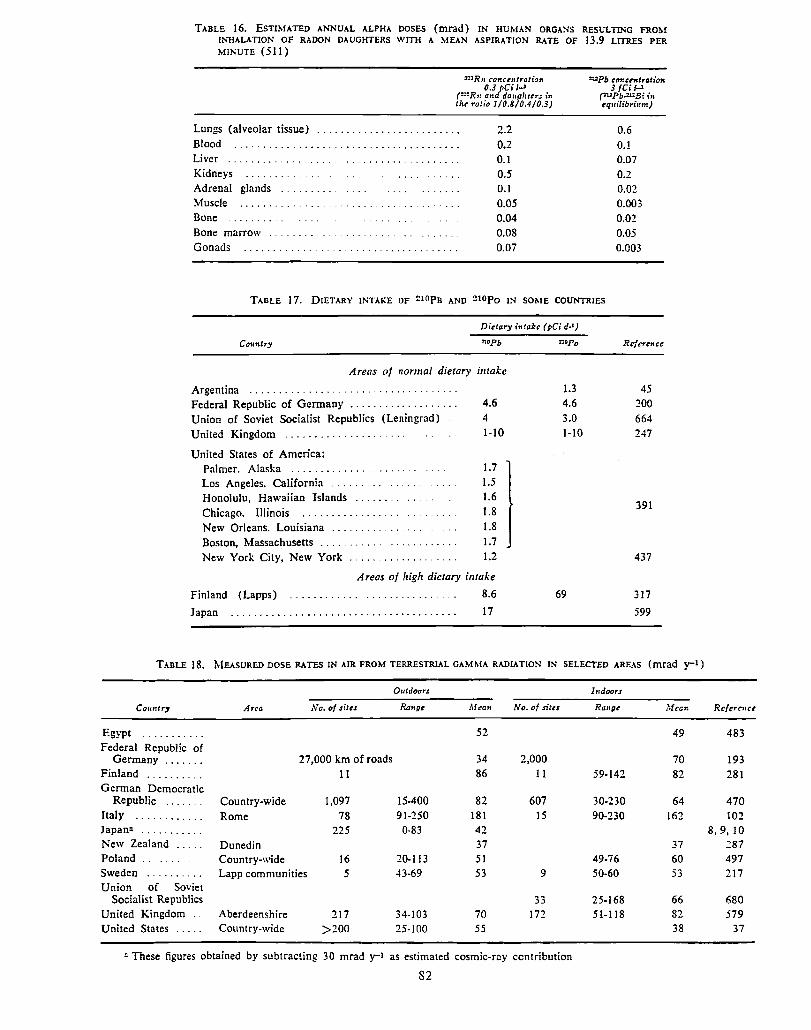
TABLE 16. ESTIMATED ANNUAL ALPHA DOSES (mrad) IN HUMAN ORGANS RESULTING FROM INHAL.\TION OF RADON DAUGHTERS WITH A MEAN ASPIRATION RATE OF 13.9 LITRES PER MINUTE (511)
2:!Rr. conc~nlratio-r. 0.3 pCi/.J
rr.•Rn and da11plttcr, in the ratio 1/0.8/0.4/0.3)
Lungs (alveolar tissue) ........................ . 2.2 0.2 0.1 0.5 0.1 0.05 0.04 0.08 0.07
Blood ...................................... . Liver ............ . Kidneys ........ . Adrenal glands ... . Muscle Bone Bone marrow .. Gonads ......... .
=Pb conct'711rali0fl 3 fCi /.J
("'Pb=Bi in cq11ilibri1un)
0.6 0.1 0.07 0.2 0.02 0.003 0.02 0.05 0.003
TABLE 17. DIETARY 11''TAKE OF ::10pB AND :llOpo IN SOME COUNTRIES
Dietary inlake (pCi d.1)
Country "'•Pb
Areas of normal dietary intake
Argentina ............................ . Federal Republic of Germany . . . . . . . . . . . . . . . . . . . 4.6 Union of Soviet Socialist Republics (Leningrad) 4 United Kingdom . . . . . . . . . . . . . . . . . 1-10
United States of America: Palmer, Alaska ....................... . Los Angeles, California ...... . Honolulu, Hawaiian Islands ....... . Chicago. Illinois .............. . New Orleans, Louisiana ......... . Boston, Massachusetts ... . New York City, New York .................. .
1.7 1.5 1.6 1.8 1.8 1.7 1.2
Finland (Lapps)
Japan
Areas of high dietary intake
8.6
17
nop0
1.3 4.6 3.0 1-10
69
Reference
45 200 664 247
391
437
317
599
TABLE 18. MEASURED DOSE RATES IN AIR FROM TERRESTRIAL GAMMA RADIATION IN SELECTED AREAS (mrad y-1)
Outdoor, Indoors
Co1mlry Area No. of silts Range Mean No. of sitts Rangt Mcar.
Egypt ........ 52 49 Federal Republic of
Germany ....... 27,000 km of roads 34 2,000 70 Finland ........... 11 86 11 59-142 82 German Democratic
Republic ....... Country-wide 1,097 15-400 82 607 30-230 64 Italy ............ Rome 78 91-250 181 15 90-230 162 Japana ........... 225 0-83 42 New Zealand Dunedin 37 37 Poland .. Country-wide 16 2()..113 51 49-76 60 Sweden .......... Lapp communities 5 43-69 53 9 50-60 53 Union of Soviet
Socialist Republics 33 25-168 66 United Kingdom Aberdeenshire 217 34-103 70 172 51-118 82 United States ..... Country-wide >200 25-100 55 38
n These figures obtained by subtracting 30 mrad y-1 as estimated cosmic-my contribution
82
Rt!/crtnu
483
193 281
470 102
8, 9, 10 287 497 217
680 579
37
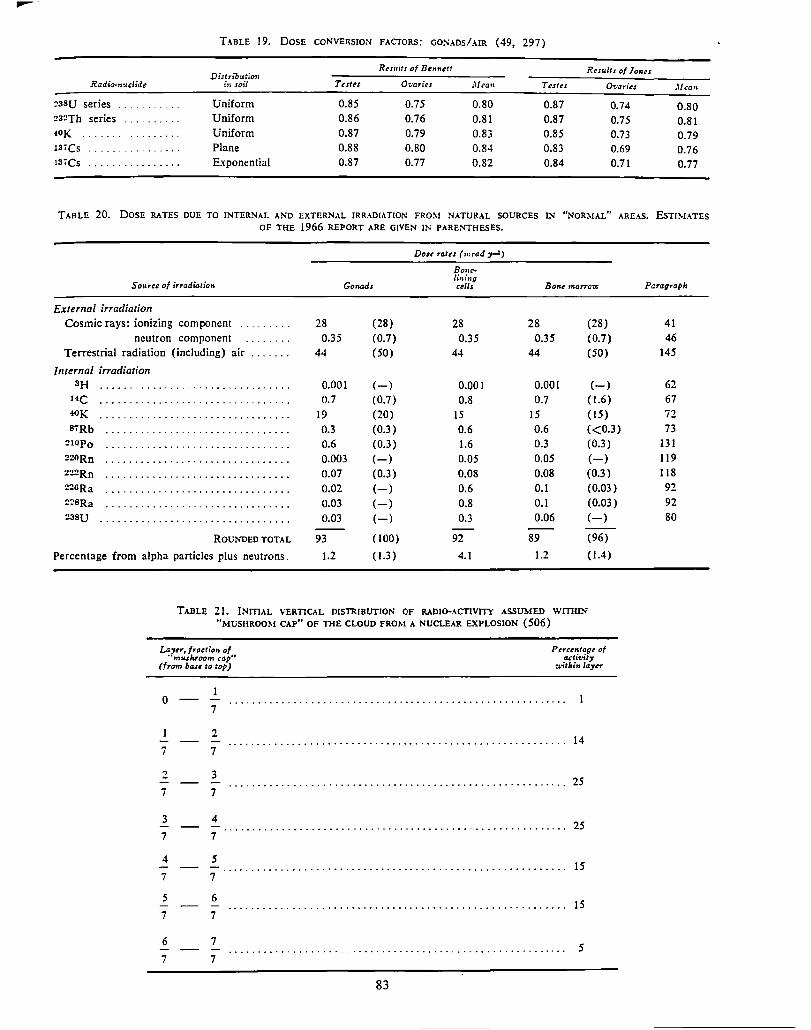
TABLE 19. DOSE CONVERSION FACTORS; GONADS/AIR (49, 297)
Distribution Residts of Btnn~t: Re~ul:~ of Jones
Radio-,rnclide in sail Testes Or1a,its M,a,. Tutu Ovari~, .,.,1 can
!?3SU series Uniform 0.85 0.75 0.80 0.87 0.74 0.80 :?3:?Th series Uniform 0.86 0.76 0.81 0.87 0.75 0.81 ~OK ......... Uniform 0.87 0.79 0.83 0.85 0.73 0.79 1s,cs ' .... - .. Plane 0.88 0.80 0.84 0.83 0.69 0.76 13,Cs ................ Exponential 0.87 0.77 0.82 0.84 0.71 0.77
TABLE 20. DOSE RATES DUE TO INTERNAL AND EXTERNAL IRRADIATION FROM NATURAL SOURCES IN "NORMAL" AREAS. ESTIMATES OF THE 1966 REPORT ARE GIVEN IN PARENTHESES.
Dou rates (mrad ~)
Bone•
Source of irradiatio,s Gonads li"ing cells Bone marrO"'..v
External irradiation Cosmic rays: ionizing component ... 28 (28) 28 28 (28)
neutron component .. ' ..... 0.35 (0.7) 0.35 0.35 (0.7) Terrestrial radiation (including) air ...... - 44 (50) 44 44 (50)
Internal irradiation 3H ................................. 0.001 (-) 0.001 0.001 (-)
HC ..................... - ........... 0.7 (0.7) 0.8 0.7 ( 1.6) 40K ............ - ........ -......... -- 19 (20) 15 15 (15) 8iRb ................................ 0.3 (0.3) 0.6 0.6 (<0.3)
!?tOPo ............................... - 0.6 (0.3) 1.6 0.3 (0.3) 220Rn ................................ 0.003 (-) 0.05 0.05 (-)
222Rn ................................ 0.07 (0.3) 0.08 0.08 (0.3) ZZ6Ra ................................ 0.02 (-) 0.6 0.1 (0.03) 2~8Ra ................................ 0.03 (-) 0.8 0.1 (0.03) 2:1su ................................. 0.03 (-) 0.3 0.06 (-)
RotJNDED TOT.U. 93 (100) 92 89 (96)
Percentage from alpha particles plus neutrons. 1.2 ( 1.3) 4.1 1.2 (1.4)
TABLE 21. INmAL VERTICAL DISTRIBUTION OF RADIO-A~ ASSUMED WITlllN "MUSHROOM CAP" OF THE CLOUD FROM A NUCLEJJt EXPLOSION (506)
La:,er, fractiott of · mushroom cap''
(from base to top)
Percentage of a.tivity
u-it/ti,s lay«
0
1
7
2
1
7
2
7
3
7 7
3
7
4
7
5
7
6
4
7
5
7
6
7
7
7 7
.......................................................... 14
.......................................................... 25
........................................................... 25
........................................................... 15
.......................................................... 15
5
83
Paragraph
41 46
145
62 67 72 73
131 119 118 92 92 80
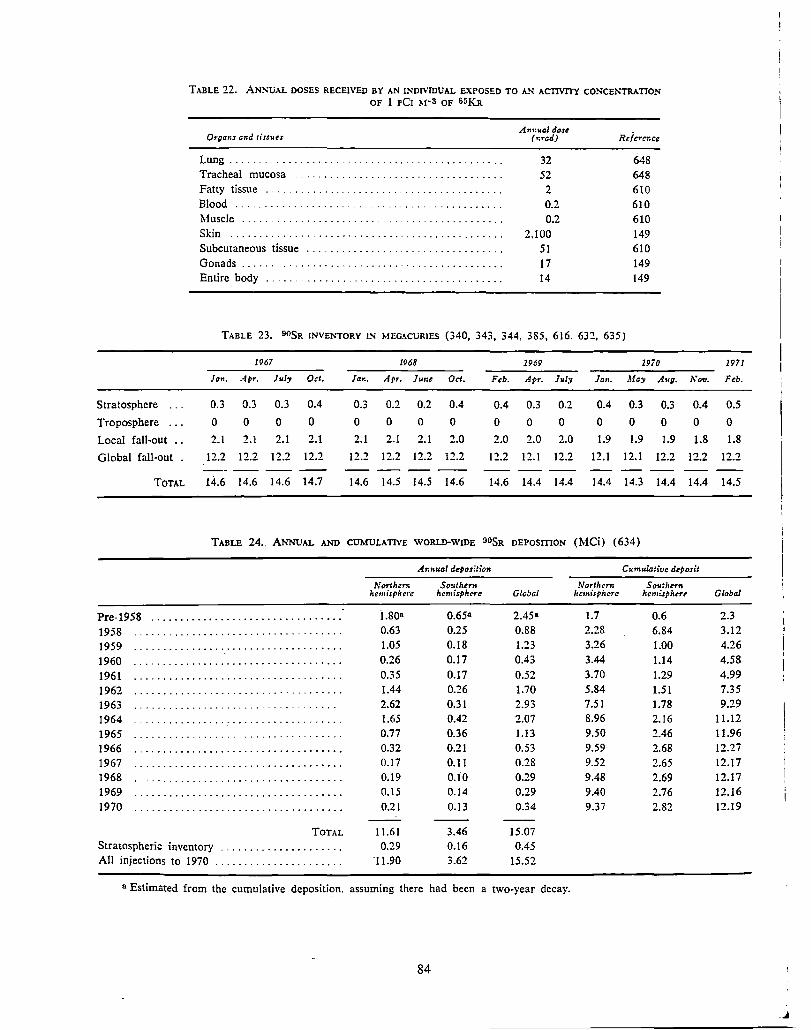
Stratosphere ... Troposphere ... Local fall-out .. Global fall-out
TOTAL
TABLE 22. ANNUAL DOSES RECEIVED BY AN U,.'UIVIDUAL EXPOSED TO "'" ACTIVITY CONCENTRATION OF 1 pCJ 1,1-3 OF S5.KR
Organs end tissues
Lung ...... . Tracheal mucosa Fatty tissue .... Blood ... 11uscle . . . . . . . . . . . . . . . . . . . ............. . Skin .............................................. . Subcutaneous tissue Gonads . . . . . . . .................................. . Entire body . . . . . . . . . . . . . . ........................ .
An,:waJ dose (r.rod)
32 52
2 0.2 0.2
2,100 51 17 14
Rciercr.ce
648 648 610 610 610 149 610 149 149
TABLE 23. 90SR INVEJ\'TORY IN MEGKURIES (340, 343, 344. 385, 616. 632, 635)
1967 1968 1969 1970
Jon. Apr. July Oct. Jar.. Apr. June Orl. Feb. Apr. July Jan. May A1tg.
0.3 0.3 0.3 0.4 0.3 0.2 0.2 0.4 0.4 0.3 0.2 0.4 0.3 0.3
0 0 0 0 0 0 0 0 0 0 0 0 0 0
2.1 2.1 2.1 2.1 2.1 2.1 2.1 2.0 2.0 2.0 2.0 1.9 1.9 1.9
12.2 12.2 12.2 12.2 12.2 12.2 12.2 12.2 12.2 12.1 12.2 12.1 12.1 12.2 ---- -- --14.6 14.6 14.6 14.7 14.6 14.5 14.$ 14.6 14.6 14.4 14.4 14.4 14.3 14.4
TABLE 24 .. .ANNuAL AND CUMULATIVE WORLD-WIDE OOSR DEPOSIDON (MCi) (634)
NM!.
0.4
0
1.8
12.2
14.4
Annual deposition Cumulative deposit
Northern Southern Northern Sowtl:rrn hemisphere /1cmisphere Global latmi.rphcrc hemisphere
Pre-1958 ................................. 1.808 0.6511 2.45• 1.7 0.6
1958 ...... - ............................. 0.63 0.25 0.88 2.28 6.84
1959 ..... --- ............................ 1.05 0.18 1.23 3.26 1.00
1960 ....... - ............................ 0.26 0.17 0.43 3.44 1.14
1961 .................................... 0.35 0.17 0.52 3.70 1.29
1962 .................................... 1.44 0.26 1.70 5.84 1.51 1963 ....................... 2.62 0.31 2.93 7.51 1.78 1964 ................................ 1.65 0.42 2.07 8.96 2.16 1965 .................................... 0.77 0.36 1.13 9.50 2.46 1966 .................................... 0.32 0.21 0.53 9.59 2.68 1967 .................................... 0.17 0.11 0.28 9.52 2.65 1968 ... - . - . - -· ........................ 0.19 0.10 0.29 9.48 2.69 1969 .................................... 0.15 0.14 0.29 9.40 2.76 1970 .................... - ............... 0.21 0.13 0.34 9.37 2.82
TOTAL 11.61 3.46 15.07 Stratospheric inventory ..................... 0.29 0.16 0.45 All injections to 1970 ...................... 11.90 3.62 15.52
a Estimated from the cumulative deposition, assuming there had been a two-year decay.
84
1971
Feb.
0.5
0
1.8
12.2
14.5
Global
2.3 3.12 4.26 4.58 4.99 7.35 9.29
11.12 11.96 12.27 12.17 12.17 12.16 12.19

TAIILB 25. ACTIVITY OF OOSR IN RAIN (pCi 1-1) AND WBT DEPOSITION (mCi km-2) (101, 230, 231)
1965 1966 1967 1968 1969 1970
pCil-1 mCikm-1 pCi I-' mCi km·' pCil·' mCikm-' pCil-• mCi km-i pCil·' mCi km•2 pCil·' mCi l:m-l
I. Co11ti11e11ts 51 ° N Milford Haven .......... 5.06 4.82 2.63 3.08 1.17 1.22 1.25 1.24 0.82 0.85 1.18 1.19 51° N Abingdon '' ............ 5.49 3.09 2.40 1.78 1.30 0.78 1.20 0.91 1.34 0.81 0.96 0.57 40° N New York ............. 8.35 5.53 2.40 2.43 1.31 1.64 1.14 1.32 1.16 1.43 l.65 1.48 25° N Miami ................ 2.41 3.58 1.07 2.25 0.37 0.62 0.42 0.88 0.50 0.91 0.77 0.88 40° N Misawa ................ 2.91 3.17 1.05 1.41 0.67 0.77 0.65 0.99 0.71 0.99 1.07 0.73
Mean 4.84 4.04 1.91 2.19 0.96 l.01 0.93 1.07 0.90 1.00 1.13 0.97
00 2. Islands VI
21 ° N Honolulu .............. 1.84 2.77 1.75 1.68 1.22 1.91 2.51 3.42 1.06 1.15 1.14 1.13 38°N Azores ................ 2.08 2.84 1.35 2.14 0.43 0.54 0.27 0.33 0.50 0.53 0.96 1.30 32° N Bermuda .............. 2.59 3.02 1.23 1.84 0.62 0.83 0.99 1.04 0.60 0.73 0.76 1.04 22° N Taiwan ................ 0.99 1.18 1.68 0.29 0.10 0.17 0.07 0.20 0.08 0.15 0.09 0.18
Mean 1.87 2.45 1.50 1.49 0.59 0.86 0.96 1.25 0.56 0.64 0.74 1.22
3. Ships 56° N Bravo ................. 2.58 1.33 2.00 0.74 0.89 0.34 1.19 0.53 1.19 0.48 1.46 0.51 52° N Charlie ..... . . . . . . . . . . 5.44 3.18 3.08 1.42 0.91 0.49 1.09 0.60 1.16 0.55 1.73 0.69 44° N Delta ............ 2.80 2.25 2.42 1.59 0.80 0.66 1.01 0.81 0.83 0.63 0.87 0.71 35" N Echo .................. 3.24 2.45 3.59 1.50 0.61 0.57 1.14 0.62 0.88 0.56 0.74 0.43
Mean 3.51 2.30 2.77 1.31 0.80 0.52 1.11 0.64 1.01 0.55 1.20 0.58
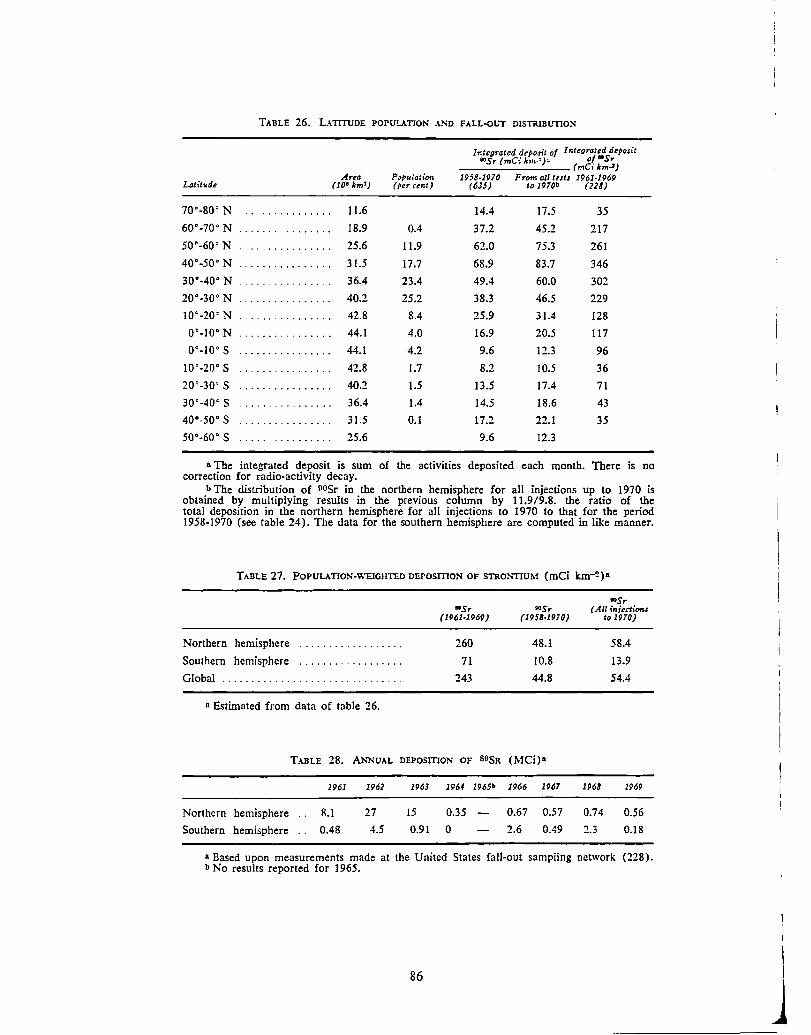
TABLE 26. L.\TITUDE POPULATION ANO FALL-OUT DISTRIBUTION
It,tegrated deposit of lntegroJed deposit "'Sr (mCi km-:)" o( .. S~
(mC: km-) Area Population 1958-1970 From all te.rts 1961·1969
LoJit1<de (10• km') (per cent) (635) to 1970b (228)
10•.30' N .......... 11.6 14.4 17.5 35
60°-70° N . . . . . . . . . . . . . . . 18.9 0.4 37.2 45.2 217
50°-60° N .............. 25.6 11.9 62.0 75.3 261
40°-50° N ................ 31.5 17.7 68.9 83.7 346
30°-40° N ............... 36.4 23.4 49.4 60.0 302
20°-30° N .............. 40.2 25.2 38.3 46.5 229
10°-20' N .......... 42.8 8.4 25.9 31.4 128
o•.10• N ................ 44.1 4.0 16.9 20.5 117
o·-10· s ................ 44.1 4.2 9.6 12.3 96
10·.20· S ................ 42.8 1.7 8.2 10.5 36
20°-30' S ................ 40.2 1.5 13.5 17.4 71
30°--40° S ................ 36.4 1.4 14.5 18.6 43
40"-50" S ................ 31.5 0.1 17.2 22.1 35
50°-60° S ..... ' .......... 25.6 9.6 12.3
a The integrated deposit is sum of the activities deposited each month. There is no correction for radio-activity decay.
b The distribution of oosr in the northern hemisphere for all injections up to 1970 is obtained by multiplying results in the previous column by 11.9/9.8, the ratio of the total deposition in the northern hemisphere for all injections to 1970 to that for the period 1958-1970 (see table 24). The data for the southern hemisphere are computed in like manner.
TABLE 27. PoPULATION•\VEIGHTED DEPosmoN OF STRONTIUM (mCi kIJl-!!)a
Northern hemisphere
Southern hemisphere
Global
n Estimated from data of table 26.
TABLE 28. ANNUAL
1961 1962
Northern hemisphere 8.1 27
Southern hemisphere 0.48 4.5
•Sr (1961-1969)
260
71
243
DEPosmoi- OF S9SR
196] 1964 1965b
15 0.35
0.91 0
""Sr ""Sr ( All injeetion.s
(1958-1970) to 1970)
48.1 58.4
10.8 13.9
44.8 54.4
(MCi)a
1966 1967 1968 1969
0.67 0.57 0.74 0.56
2.6 0.49 ., , -·-' 0.18
• Based upon measurements made at the United States fall-out sampling network (228). b No results reported for 1965.
86
I
I I
j

TABLE 29. 90SR AND 13,Cs IS :O.ULK
"°Sr to caldu m ratio u~cs conctntra::"on (pCig.1) (pCi /-1)
Region or country 1966 1967 1968 1969 1970 19il 1966 1967 19118 1969 19.'0 1971 Rt/~rcncr
Northern hemisphere
Austria .,, _., 14 13 12 70 33 28 27 93,94,95,653
Belgium 13 9 8 9 6 36 17 20 15 10 120,551
Canada 13 10 8 9 9 51 33 25 20 21 136,412,515
Colombia ... 2 528 Czechoslovakia 12 441
Denmark .............. 12 9 9 7 8 7 22 14 14 14 10 14 4,5
Egypt • + ••••••••••••••• 13 6 394,395
Faroe Islands ....... . . 73 51 45 35 37 34 800 586 507 463 357 352 4,6
Federal Republic of Ger-many ............... 16 11 9 9 7 61 35 27 25 31 91, 92
Finland ............... 13 10 9 8 134 92 70 54 49 105
France: I ............. 19 14 12 9 !! 9 21 20 19 21 22 186.490,550
2 ............. 18 15 12 12 12 11 62 34 24 24 26 28 123
Guiana ................ 11 14 7 528
India (Bombay) ........ 11 6 5 422,423
Israel ................. 2 2 14 11 170
Italy .................. 13 10 8 119
Jamaica ............... 9 7 4 4 200 184 109 95 81 621
Japan ................. 11 8 7 5 5 52 30 28 18 16 19
Korea ................ 22 11 15 335
Netherlands ........... 15 9 8 7 43 37 28 23 120,405,460
Norway ............ ·-. 28 16 11 10 244 181 146 128 260
Panama ... 4 21 22 II II 621
Puerto Rico ........... 6 4 4 4 21 14 621
Senegal ............... 10 8 5 2 528
Sweden 15 10 8 7 7 63 38 30 20 .,, 218,591 ............... ~.)
Switzerland ............ 18 13 11 10 10 26 17 7 13 12 254
Union of Soviet Socialist 671,672. Republics ............ 12 8 8 7 7 56 38 30 20 20 681,682
United Kingdom .. 12 9 8 7 6 6 46 20 16 14 17 18 II, 12
United States .......... 12 9 29 16 621
Alaska .............. 12 6 6 5 34 20 13 621
Chicago ............. 9 8 8 6 14 16 14 14 74,621
Hawaii ' ............. 4 3 4 2 25 9 621
New York City ... 12 10 9 9 8 8 232
Tampa .............. 11 JI 7 5 139 102 66 55 51 521,632
Venezuela 4 14 9 621
Southern hemisphere
Argentina ..... ' 5 5 4 4 3 24 21 19 20 20 118
Australia .............. 7 5 4 5 6 28 20 15 18 19 23. 69, 177, 178, 194, 585
Chile .................. 2 1 1 528
Ecuador ............... 4 1 528
Malagasy Republic ..... 2 2 2 528
New Caledonia ........ 3 2 2 2 528
New Zealand ........... 8 6 5 7 7 55 43 32 40 35 450
Peru ............... 2 1 528
Reunion (La) .... 4 3 3 5 17 15 18 16 550
Society Islands .. 5 3 3 528
87
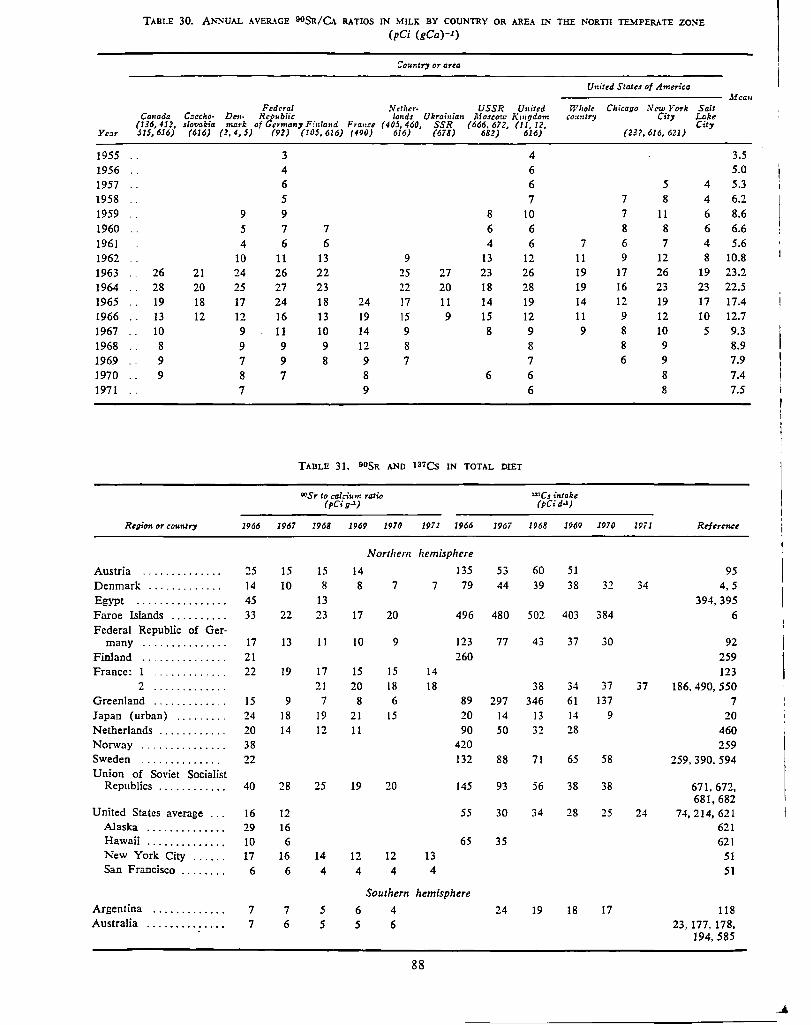
TABLE 30. ANNUAL AVERAGE 90SR/CA RATIOS IN MILK BY COUNTRY OR AREA IN THE NORIB TEMPERATE ZONE (pCi (gCa)-I)
Cour.tr, or arta
United States of America J!ea11
Fedrral N,tlzcr- USSR United Wliolt Chicago N cw Yark Salt Ca11ada C::echo· De,,. R1J'."blic lands Ukrainfon Mosco-..u Krngdom co1,utry City Lake
(136,412, s/ovakia ,nark of ermariy F:"nland France (40!J, 460, SSR (666. 672, (11, 12, City Year SIS, 616) (616) (2, 4, 5) (92) (105,616) (49,J) 616) (678) 682) 616) (232,616, 621)
1955 3 4 3.5 1956 4 6 5.0 1957 6 6 5 4 5.3 1958 5 7 7 8 4 6.2 1959 9 9 8 10 7 11 6 8.6 1960 5 7 7 6 6 8 8 6 6.6 1961 4 6 6 4 6 7 6 7 4 5.6 1962 10 11 13 9 13 12 11 9 12 8 10.8 1963 26 21 24 26 22 25 27 23 26 19 17 26 19 23.2 1964 28 20 25 27 23 22 20 18 28 19 16 23 23 22.5 1965 19 18 17 24 18 24 !7 11 14 19 14 12 19 17 17.4 1966 13 12 12 16 13 19 15 9 15 12 11 9 12 10 12.7 1967 10 9 11 10 14 9 8 9 9 8 10 5 9.3 1968 8 9 9 9 12 8 8 8 9 8.9 1969 9 7 9 8 9 7 7 6 9 7.9 1970 9 8 7 8 6 6 8 7.4 1971 7 9 6 8 1.5
TADLE 31. OOSR AND 137C5 IN TOTAL DIET
"°Sr to calcium ratio ""Cs intake (pCi g-') (pCi d-')
Region or cou..try 1966 1967 1968 1969 1970 19il 1966 1967 1968 1969 1970 1971 Refer~e
Northern hemisphere
Austria .............. 25 15 15 14 135 53 60 51 95 Denmark ............. 14 10 8 8 7 7 79 44 39 38 32 34 4,5 Egypt ................. 45 13 394,395 Faroe Islands .......... 33 22 23 17 20 496 480 502 403 384 6 Federal Republic of Ger-
many ............... 17 13 11 10 9 123 77 43 37 30 92 Finland .. ' ............ 21 260 259 France: 1 .......... 22 19 17 15 15 14 123
2 ............. 21 20 18 18 38 34 37 37 186, 490, 550 Greenland ....... ·-· ... 15 9 7 8 6 89 297 346 61 137 7 Japan (urban) ......... 24 18 19 21 15 20 14 13 14 9 20 Netherlands ............ 20 14 12 11 90 50 32 28 460 Norway ............... 38 420 259 Sweden .............. 22 132 88 71 65 58 259,390.594 Union of Soviet Socialist
Republics ............ 40 28 25 19 20 145 93 56 38 38 671,672, 681,682
United States average ... 16 12 55 30 34 28 25 24 74,214,621 Alaska .............. 29 16 621 Hawaii .............. 10 6 65 35 621 New York City ...... 17 16 14 12 12 13 51 San Francisco ........ 6 6 4 4 4 4 51
Southern hemisphere Argentina ............. 7 7 s 6 4 24 19 18 17 118 Australia ·············· 7 6 s 5 6 23, 177, 178,
194,585
88
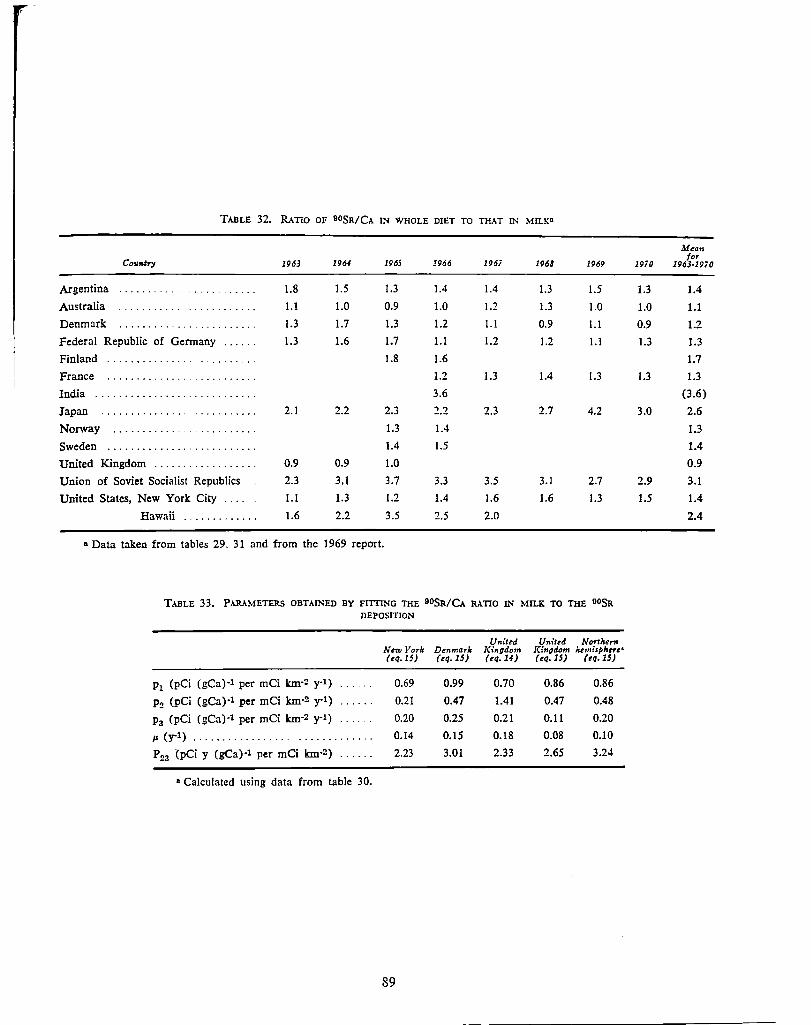
TABLE 32. RATIO OF 90SR/CA IN WHOLE DIET TO THAT IN MILK•
Co,,rlfry 1963 1964 1965 1966 196i 1968 1969
Argentina . . . . . . . . . . ~ ............ 1.8 1.5 1.3 1.4 1.4 1.3 1.5
Australia ........... . . . . . . . . . . . . 1.1 1.0 0.9 1.0 ).2 1.3 1.0
Denmark ........................ 1.3 1.7 1.3 1.2 1.1 0.9 1.1
Federal Republic of Germany ...... 1.3 1.6 1.7 1.1 1.2 1.2 1.1
Finland . . . . . . . . . . . . . . ............ 1.8 1.6
France .............. . . . . . . . . . . . 1.2 1.3 1.4 1.3
India ................. . . . . . . .. . . . 3.6
Japan ............... ' .......... 2.1 2.2 2.3 2.2 2.3 2.7 4.2
Norway ........ ·- .. . ...... - ... 1.3 1.4
Sweden ............... . . . . . . . . . . . 1.4 1.5
United Kingdom .................. 0.9 0.9 1.0
Union of Soviet Socialist Republics 2.3 3.1 3.7 3.3 3.5 3.1 2.7
United States, New York City .... 1.1 1.3 1.2 1.4 1.6 1.6 1.3
Hawaii ............. 1.6 2.2 3.5 2.5 2.0
a Data taken from tables 29, 31 and from the 1969 report.
TABLE 33. PARAMETERS OBTAINED BY FITTING THE 90SR/CA RATIO IN MILK TO THE OOSR DEPOSITION
p1 (pCi (gCa)·l per mCi km·2 y·l)
p2 (pCi (gCa)·l per mCi knr2 y-1)
p3 (pCi (gCa)·l per mCi k.m·2 y-1)
µ (y-1) ...............................
Pza (pCi y (gCa)·l per mCi k.m·2) ......
a Calculated using data from table 30.
United New York Denmark Kingdom (eq.15) (eq.15) (eq.14)
0.69 0.99 0.70
0.21 0.47 1.41
0.20 0.25 0.21
0.14 0.15 0.18
2.23 3.01 2.33
89
Unittd Northern Kingdom hemisphn'e• (eq.1S) (eq.1S)
0.86 0.86
0.47 0.48
0.11 0.20
0.08 0.10
2.65 3.24
Mi!an
19i0 for
1963-1970
1.3 1.4
1.0 1.1
0.9 1.2
1.3 1.3
1.7
1.3 1.3
(3.6)
3.0 2.6
1.3
1.4
0.9
2.9 3.1
1.5 1.4
2.4
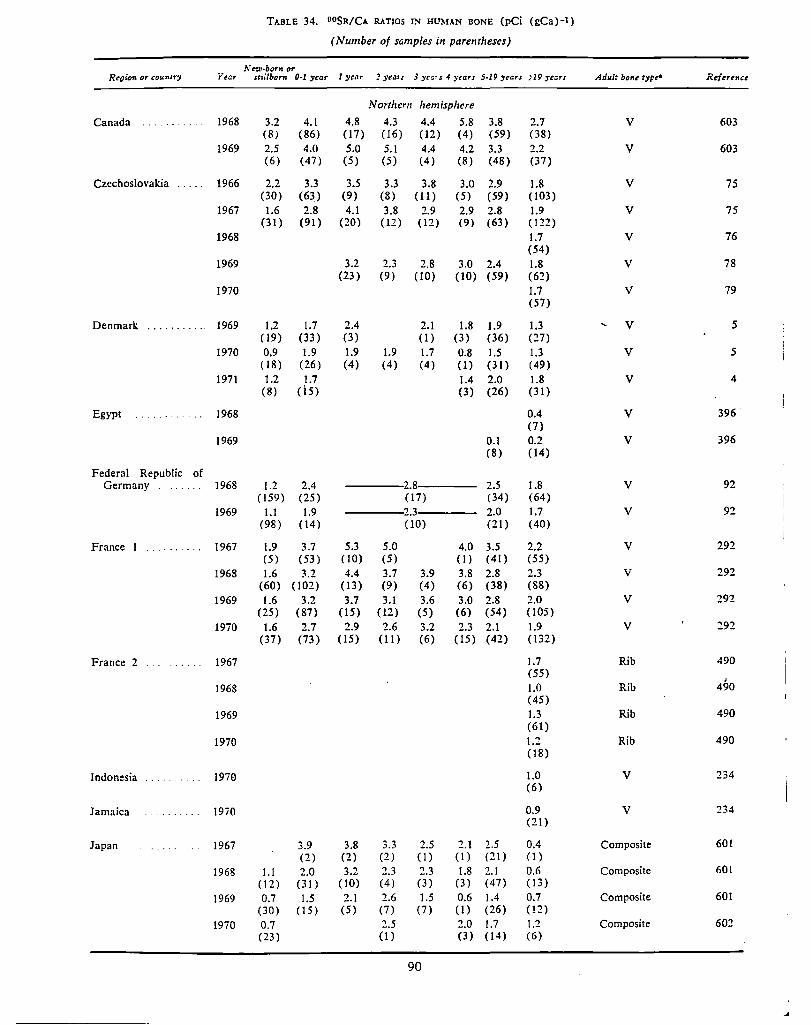
TABLE 34. DDSR/CA RATIOS IN HUMAN BONE (pCi (gCa)-1)
( Number of samples in parentheses)
N=·bqrn,,,. Regicn or tountry Ytar stillborn 0-1 :,,ear 1 ye,1r J yei11s 3 years 4 ytars 5-19 year, >19 years Adult bo1<t typt• Rrltunce
Northern hemisphere
Canada . . ......... 1968 3.2 4.1 4.8 4.3 4.4 5.8 3.8 2.7 V 603 (8) (86) (17) (16) (12) (4) (59) (38)
1969 2.5 4.0 5.0 5.1 4.4 4.2 3.3 2.2 V 603 (6) (47) (5) (5) (4) (8) (48) (37)
Czechoslovakia ..... 1966 2.2 3.3 3.5 3.3 3.8 3.0 2.9 1.8 V 75 (30) (63) (9) (8) (11) (5) (59) (103)
1967 1.6 2.8 4.1 3.8 2.9 2.9 2.8 1.9 V 75 (31) (91) (20) (12) (12) (9) (63) ( 122)
1968 1.7 V 76 (54)
1969 3.2 2.3 2.8 3.0 2.4 1.8 V 78 (23) (9) (10) (10) (59) (62)
1970 1.7 V 79 (57)
Denmark . ' ........ 1969 1.2 1.7 2.4 2.1 1.8 1.9 1.3 V 5 (19) (33) (3) (1) (3) (36) (27)
1970 0.9 1.9 1.9 1.9 1.7 0.8 1.5 1.3 V 5 (18) (26) (4) (4) (4) (1) (31) (49)
1971 1.2 1.7 1.4 2.0 1.8 V 4 (8) (i5) (3) (26) (31)
Egypt ....... 1968 0.4 V 396 (7)
1969 0.1 0.2 V 396 (8) (14)
Federal Republic of Germany ...... 1968 1.2 2.4 2.8 2.5 1.8 V 92
( 159) (25) (17) (34) (64) 1969 1.1 1.9 2.3 2.0 1.7 V 92
(98) ( 14) (10) (21) (40)
France I ' ......... 1967 1.9 3.7 5.3 5.0 4.0 3.5 2.2 V 292 (5) (53) ( 10) (5) (I) (41) (55)
1968 1.6 3.2 4.4 3.7 3.9 3.8 2.8 2.3 V 292 (60) ( 102) (13) (9) (4) (6) (38) (88)
1969 1.6 3.2 3.7 3.1 3.6 3.0 2.8 2.0 V 292 (25) (87) (15) (12) (5) (6) (54) (105)
1970 1.6 2.7 2.9 2.6 3.2 2.3 2.1 1.9 V 292 (37) (73) (15) (11) (6) (15) (42) (132)
France 2 1967 1.7 Rib 490 (55)
J
1968 1.0 Rib 490 (45)
1969 1.3 Rib 490 (61)
1970 1.2 Rib 490 (18)
Indonesia . . . . . .... 1970 1.0 V 234 (6)
Jamaica 19i0 0.9 V 234 (21)
Japan 1967 3.9 3.8 3.3 2.5 2.1 !.5 0.4 Composite 601 (2) (2) (2) (1) (1) (21) (1)
1968 1.1 2.0 3.2 2.3 2.3 1.8 2.1 0.6 Composite 601 ( 12) (31) ( 10) (4) (3) (3) (47) (13)
1969 0.7 1.5 2.1 2.6 1.5 0.6 1.4 0.7 Composite 601 (30) (15) (5) (7) (7) (1) (26) (12)
1970 0.7 2.5 2.0 1.7 1.2 Composite 602 (23) (1) (3) (14) (6)
90
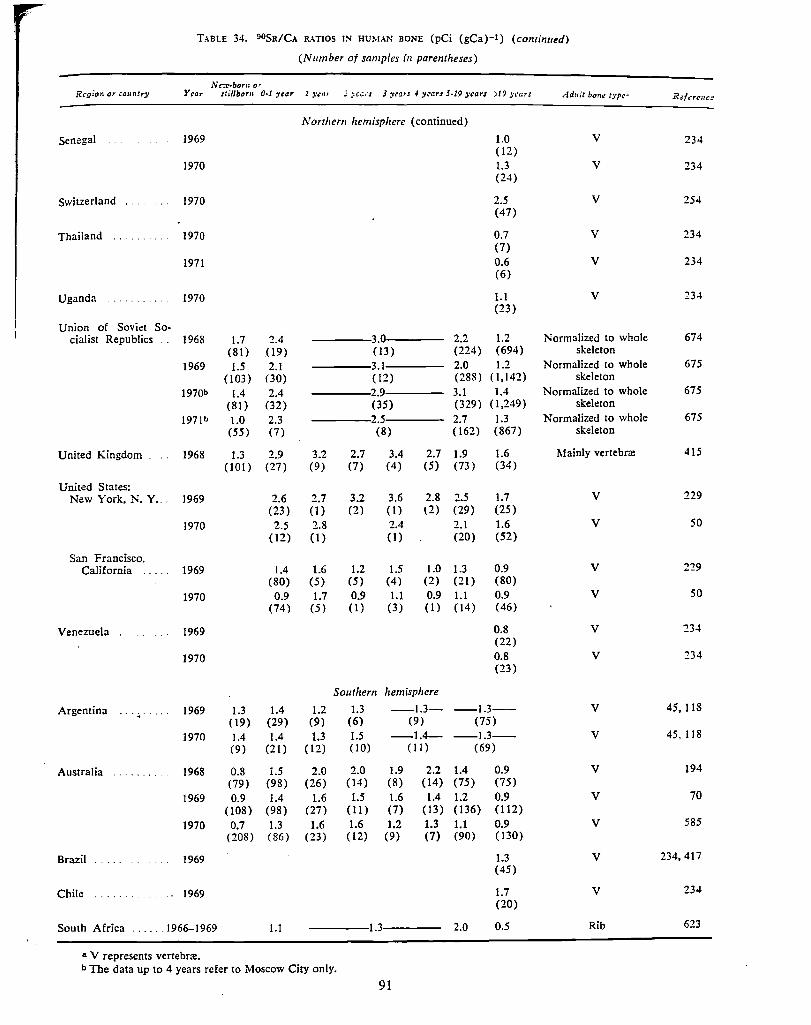
TABLE 34. 90SR/CA RATIOS IN HUMAN BONE (pCi (gCa)-1) ( continued)
(Number of samples in parenrheses)
."'w.e-::t--boru or Region or coirn~rJ' Year .rtillborn 0·1 ytar 1 )'t:f1T 2 ;:ca,·s J yr!lrs 4 yrars 5-19 years )19 years Ad:tit bon~ typ1;: Ref"~rence
N orthem hemisphere (continued)
Senegal 1969 1.0 V 234 (12)
1970 1.3 V 234 (24)
Switzerland 1970 2.5 V 254 (47)
Thaiiand ...... 1970 0.7 V 234 (7)
1971 0.6 V 234 (6)
Uganda 1970 I. I (23)
V 234
Union of Soviet So-cialist Republics .. 1968 1.7 2.4 3. 2.2 1.2 Normalized to whole 674
(81) (19} (13) (224) (694) skeleton
1969 1.5 2.1 3.1 2.0 1.2 Normalized to whole 675 (103) (30) (12) (288) (1,142) skeleton
1970b 1.4 2.4 2.9 3.1 1.4 Normalized to whole 675 (81) (32) (35) (329) (1,249) skeleton
197Jb 1.0 2.3 2.5 2.7 1.3 Normalized to whole 675 (55) (7) (8) . (162) (867) skeleton
United Kingdom 1968 1.3 2.9 3.2 2.7 3.4 2.7 1.9 1.6 Mainly vertebrre 415 (101) (27) (9) (7) (4) (5) (73) (34)
United States: New York, N. Y ... 1969 2.6 2.7 3.2 3.6 2.8 2.5 1.7 V 229
(23) (1) (2) (I) l2) (29) (25) 1970 2.5 2.8 2.4 2.1 1.6 V 50
(12) (1) (I) (20) (52)
San Francisco, California ..... 1969 1.4 1.6 1.2 1.5 1.0 1.3 0.9 V 229
(80) (5) (5) (4) (2) (21) (80} 1970 0.9 1.7 0.9 1.1 0.9 1.1 0.9 V 50
(74) (5) (I) (3) (1) (14) (46)
Venezuela 1969 0.8 V 234 (22)
1970 0.8 V 234 (23)
Southern hemisphere
Argentina 1969 1.3 1.4 1.2 1.3 -1.3- --1.3-- V 45,118 - (19) (29) (9) (6) (9) (75) 1970 1.4 1.4 1.3 1.5 -1.4- --1.3-- V 45, 118
(9) (21) (12) (10) (11) (69)
Australia . . . . . . . . 1968 0.8 1.5 2.0 2.0 1.9 2.2 1.4 0.9 V 194 (79) (98) (26) (14) (8) (14) (75) (75)
1969 0.9 1.4 1.6 1.5 1.6 1.4 1.2 0.9 V 70 (108) (98) (27) (11) (7) (13) (136) (112)
1970 0.7 1.3 1.6 1.6 1.2 1.3 1.1 0.9 V 585 (208) (86) (23) (12) (9) (7) (90) (130)
Brazil 1969 1.3 V 234,417 (45)
Chile 1969 1.7 V 234 (20)
South Africa 1966-1969 1.1 1.3 2.0 0.5 Rib 623
a V represents vertebra:. b The data up to 4 years refer to Moscow City only.
91
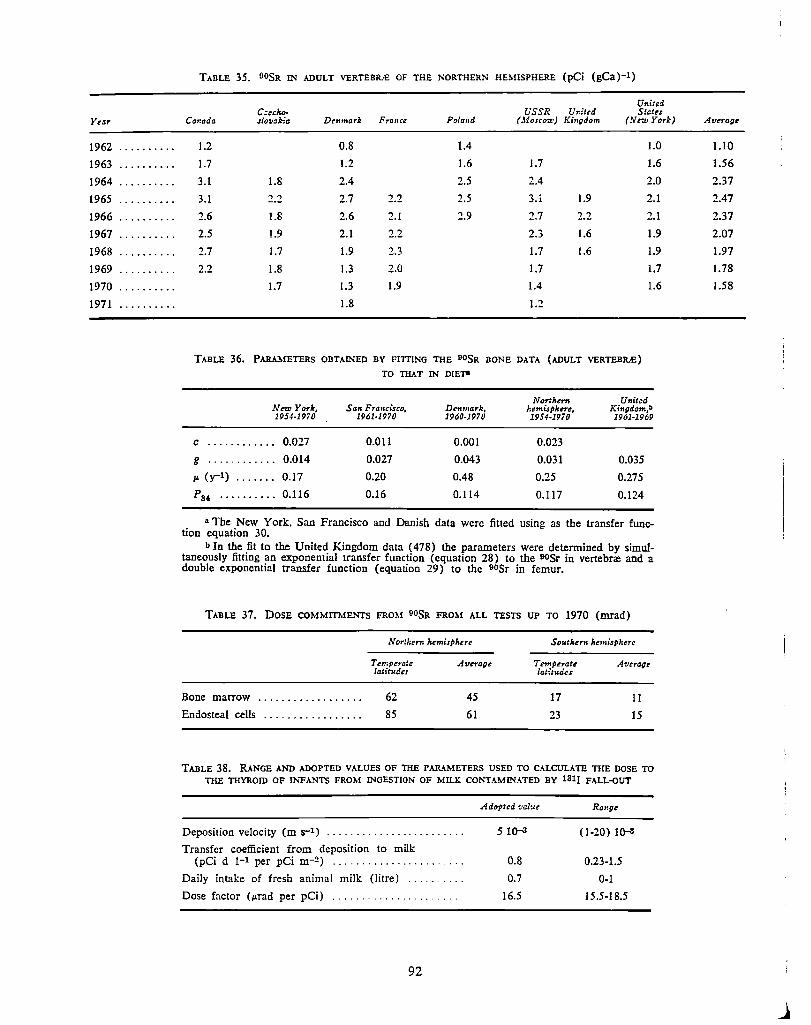
Year
1962 .......... 1963 .......... 1964 .......... 1965 ........... 1966 .......... 1967 .......... 1968 .......... 1969 .......... 1970 .......... 1971 ..........
TABLE 35. 90SR IN ADULT VERTEBR..E OF THE NORTHERN HE.',USPHERE (pCi (gCa)-1)
United C:ecJw. USSR United States
Canada slovckia Drnmark France Poland (Moscow) Kingdom (New York)
1.2 0.8 1.4 1.0
1.7 1.2 1.6 J.7 1.6
3.1 1.8 2.4 2.5 2.4 2.0
3.1 2.2 2.7 2.2 2.5 3.1 1.9 2.1
2.6 1.8 2.6 2.1 2.9 2.7 2.2 2.1
2.5 1.9 2.1 2.2 2.3 1.6 1.9
2.7 1.7 1.9 2.3 1.7 1.6 1.9
2.2 1.8 1.3 2.0 1.7 1.7
1.7 1.3 1.9 1.4 1.6
1.8 1.2
TABLE 36. PARAMETERS OBTAINED BY Fl1TING THE 90SR BONE DATA (ADULT VERTEBRA!) TO THAT IN DIET"
Northern United New York, San Francisco, DNimark, hemispherl!, Kingdom,b 1954-1970 1961-1970 1960-1970 1954-1970 1961-1969
C ............ 0.027 0.011 0.001 0.023
g ............ 0.014 0.027 0.043 0.031 0.035
µ. (y-1) ....... 0.17 0.20 0.48 0.25 0.275
Ps, .......... 0.116 0.16 0.114 0.117 0.124
n The New York, San Francisco and Danish data were fitted using as the transfer func-tion equation 30. -
b In the .fit to the United Kingdom data ( 478) the parameters were determined by simultaneously fitung an exponential transfer function (equation 28) to the 90Sr in vertebr~ and a double exponential transfer function (equation 29) to the 90Sr in femur.
TABLE 37. DOSE COMMITMENTS FROM 90SR FROM ALL TESTS UP TO 1970 (mrad)
N orll:ern /u,misphere Soul/urn hemisphere
Tm,perate latitude,
Average Tempera/I! latitudes
Average
Bone marrow ................. .
Endosteal cells ................ .
62
85
45
61
17
23
11
15
TABLE 38. RANGE AND ADOPTED VALUES OF THE PARAMETERS USED TO CALCULATE THE DOSE TO nm THYROID OF ll'<"FANTS FROM INGESTION OF MILK CONTAMINATED BY 131{ FALL-OUT
Deposition velocity (m s-1) ....................... .
Transfer coefficient from deposition to milk (pCi d 1-1 per pCi m-!?) .................. .
Daily intake of fresh animal milk (litre) ..... .
Dose factor (µrad per pCi) ................. .
92
Adopted ,al,u
5 lQ--8
0.8
0.7
16.5
Range
(1-20) lQ--8
0.23-1.5
0-1
15.5-18.5
Avrragl!
1.10
1.56
2.37
2.47
2.37
2.07
1.97
1.78
1.58
j
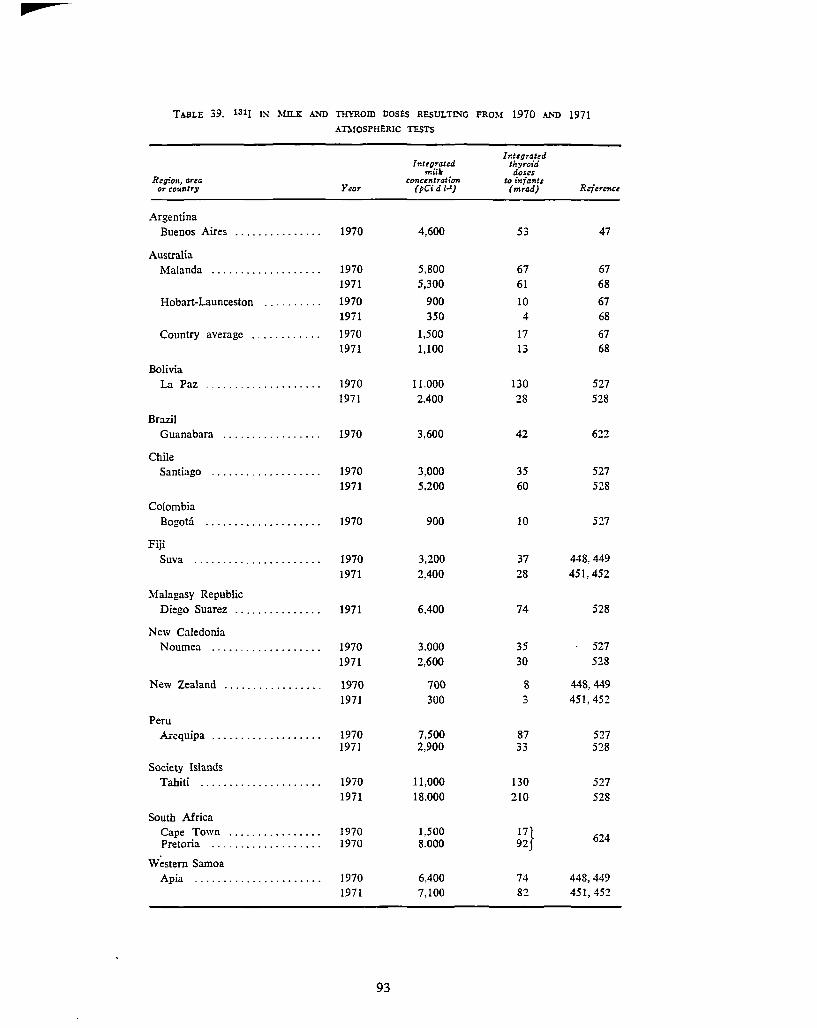
jiP
TABLE 39. 131! IN 1\fil.K AND THYROID DOSES RESULTING FRO!',f 1970 AND 1971 AThfOSPHERIC TESTS
Region, arta or country
Argentina Buenos Aires
Australia Malanda
Hobart-Launceston
Year
1970
1970 1971
1970 1971
Country average . . . . . . . . . . . . 1970
Bolivia La Paz
Brazil Guanabara
Chile Santiago
Colombia Bogota
Fiji Suva
Malagasy Republic Diego Suarez
New Caledonia
1971
1970 1971
1970
1970 1971
1970
1970 1971
1971
Noumea . . . . . . . . . . . . . . . . . . . 1970
New Zealand
Peru Arequipa
Society Islands
1971
1970 1971
1970 1971
Tahiti . . . . . . . . . . . . . . . . . . . . . 1970 1971
South Africa Cape Town . . . . . . . . . . . . . . . . 1970 Pretoria . . . . . . . . . . . . . . . . . . . 1970
Western Samoa Apia . . . . . . . . . . . . . . . . . . . . . . 1970
1971
93
Integrated millr
conc1ntralion (pCi d /·')
4,600
5,800 5,300
900 350
1,500 1,100
11.000 2.400
3,600
3,000 5,200
900
3,200 2,400
6,400
3.000 2,600
700 300
7,500 2,900
11,000 18.000
1.500 8.000
6,400 7,100
Integrated thyraici doses
to 1·n.fan!s (mrad)
53
67 61
10 4
17 13
130 28
42
35 60
10
37 28
74
35 30
8 3
87 33
130 210
17} 92
74 82
Reference
47
67 68
67 68
67 68
527 528
622
527 528
527
448,449 451,452
528
527 528
448,449 451, 452
527 528
527 528
624
448,449 451,452
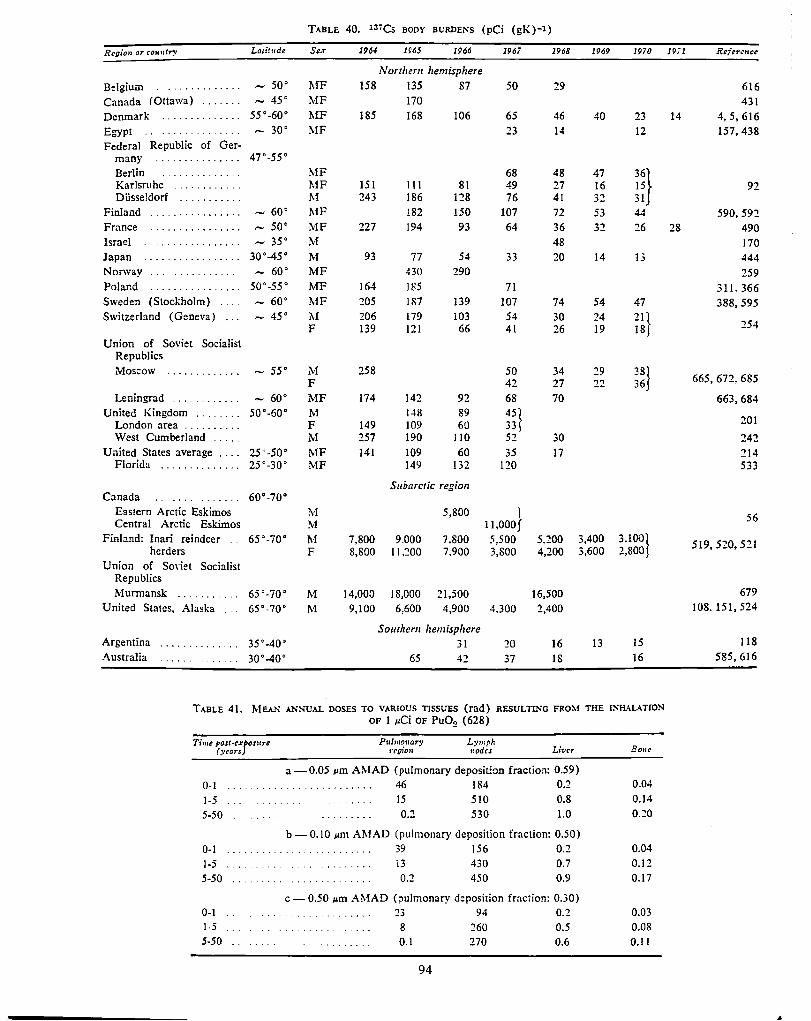
TABLE 40. 137Cs BODY BURDENS (pCi (gK)-1)
Region or country• La1it11de Sex 1964 1965 1966 1967 1968 1969 1970 l9il Referr:nc~
Nort/iern hemisphere
Belgium ............. - 50° ?,.1F 158 135 87 50 29 616 Canada (Ottawa) ....... - 45• MF 170 431 Denmark 55°-60° :MF 185 168 106 65 46 40 .,~ 14 4, 5,616 .......... ... ., Egypt . . ......... -- .. - 30° MF 23 14 12 157,438 Federal Republic of Ger-
many ............... 47•.55•
Berlin .............. MF 68 48 47 36} Karlsruhe ....... -. - .. },IF 151 111 81 49 27 16 15 92
Dilsseldorf M 243 186 128 76 41 ~., 31 ........... ., __
Finland ................ - 60° MF 182 150 107 72 53 44 590,592 France ................. - so· MF 227 194 93 64 36 32 26 28 490 Israel . . . ' ............. ,.., 35• M 48 170 Japan 30°-45° M 93 77 54 33 20 i4 13 444 Norway . . . ........... - 60° MF 430 290 259 Poland ...... , .. so·-ss· l\1F 164 185 71 311. 366 Sweden (Stockholm) .. - 60° MF 205 187 139 107 74 54 47 388,595 Switzerland (Geneva) ... - 45° M 206 179 103 54 30 24 21}
F 139 121 66 41 26 19 18 254
Union of Soviet Socialist Republics Mos;:ow ............. 55• M 258 50 34 29 38} 665, 672. 685 F 42 27 .,., 36 Leningrad .... . . . . . . . . 60° :MF 174 142 92 68 70 663,684
United Kingdom ........ 50 ° -60° J'vl 148 89 45} 201 London area .......... F 149 109 60 33 West Cumberland ..... M 257 190 J 10 52 30 242
Uaited States average .... 25'-50° MF 141 109 60 35 17 214 Florida .............. 25 ° -30 ° MF 149 132 120 533
Subarctic region Canada ... .. . . 60°-70°
Eastern Arctic Eskimos M 5,800 l 56 Central Arctic Eskimos M 11,000 f Finland: Inari reindeer 65°-70° J\·f 7,800 9.000 7.800 5,500 5,200 3,400 3,100( 519,520,521
herders F 8,800 11,200 7.900 3,800 4,200 3,600 2,800} Union of SoYiet Socialist
Republics Murmansk ....... 65°-10· M 14,000 18,000 21,500 16,500 679
United States, Alaska 65"-70° M 9,100 6,600 4,900 4,300 2,400 108. 151,524
S0111hem hemisphere Argentina .............. 35°-40° 31 20 16 13 15 118 Australia 30°-40° 65 42 37 18 16 585,616
TABLE 41. MEAN ANNUAL DOSES TO VARIOUS TISSUES (rad) RESULTING FROM THE r.lHAL-\TION OF 1 µCi OF Pu02 (628)
Time post·txfosure Pulm~nar,-1 L,•mplt Liver Bone (year, rro:on nodes
a -0.05 µm AMAD (pulmonary deposition fraction: 0.59)
0-1 .. . '. ........... 46 184 0.2 0.04
1-5 15 510 0.8 0.14
5-50 . . . ..... 0.2 530 1.0 0.20
b-0.10 µm AMAD (pulmonary deposition fraction: 0.50)
0-1 . . . .......... 39 156 0.2 0.04
1-5 . . . . ........ 13 430 0.7 0.12 5-50 .......... 0.2 450 0.9 0.17
c - 0.50 µm AMAD (;,ulmonary deposition frac:ion: 0.30) 0-1 .. . ......... 23 94 0.2 0.03 1-5 8 260 0.5 0.08 5-50 ...... ·- .. 0.1 270 0.6 0.11
94
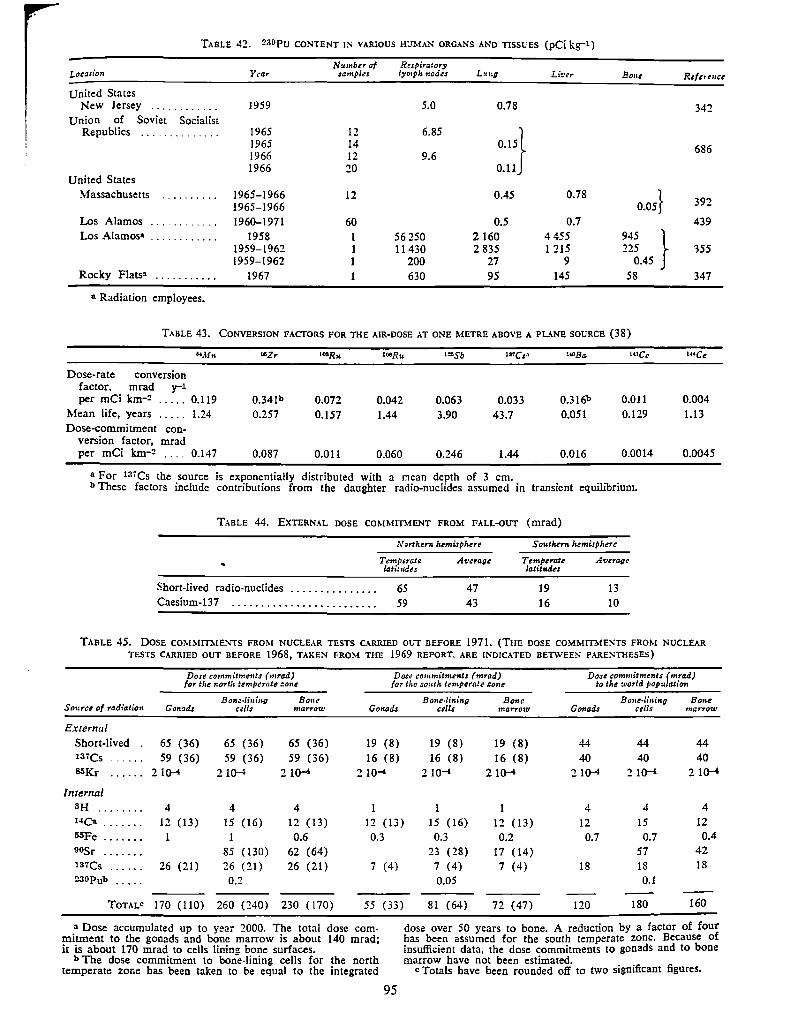
TABLE 42. '.?30pu CONTENT I~ VARIOUS HcJMAN ORGANS AND TISSL'ES (pCi kg-1)
Location
United States New Jersey ....... .
Union of Soviet Socialist Republics ............ .
Y,ar
1959
1965 1965 1966 1966
N«mbcrof samples
12 14 12 20
Rupirau,ry lymph nodes
5.0
6.85
9.6
Lr,na
0.78
··"} 0.11
Bo,u
United States Massachusetts 1965-1966
1965-1966 12 0.45 0.78
o.o5} Los Alamos Los Alamos•
Rocky Flatsn .......... .
a Radiation employees.
1960-1971 1958
1959-1962 1959-1962
1967
60 1 1 1
56250 11430
200 630
0.5 2 160 2 835
27 95
0.7 4 455 945 1 215 225
9 0.45 145 58
TABLE 43. CONVERSION FACTORS FOR THE AIR-DOSE AT ONE METRE ABOVE A PLANE SOURCE (38)
Dose-rate conversion factor, mrad y-1 per mCi km-2 ..... 0.119
Mean life, years . . . . . 1.24 Dose-commitment con
version factor, mrad per mCi km-:? . . . . 0.147
""Zr
0.341b 0.257
0.087
0.072 0.157
0.011
0.042 1.44
0.060
0.063 3.90
0.246
incs•
0.033 43.7
1.44
0.316b 0.051
0.016
0.011 0.129
0.0014
4 For 137Cs the source is exponentially distributed with a .r.iean depth of 3 cm. b These factors include contributions from the daughter radio-nuclides assumed in transient equilibrium.
TABLE 44. ExTERNAL DOSE COMMITMENT FROM FALL-OUT (mrad)
Short-lived radio-nuclides .............. . Caesium-137 .....................••..
Northern hemisphere
Temperate 14ti111des
65 59
47 43
Soulheni hemisphere
Temperate latitudes
19 16
Average
13
10
}
342
686
392
439
'355
347
0.004 1.13
0.0045
TABLE 45. DOSE COM:!-lITh!E.'sTS FROM NUCLEAR TESTS CARRIED oi:rr BEFORE 1971. (THE DOSE COMMITMENTS FROM NUCLEAR TESTS CARRIED OUT BEFORE 1968, TAKEN FRO'.\-! THE 1969 REPORT. ARE INDICATED BETWEEN PARL'-'THESES)
Dose commitments (mrad) for the nortl& temperate zone
Dose commitments (mrad) for the south temperate :one
Dose commitments (mra.d) to the world populatfrm
Source of radiation
External Short-lived 137Cs
s:1Kr
Internal 3H ....... .
Gonads
65 (36) 59 (36)
21()-l
4
Bon.: 0 /ining cells
65 (36) 59 (36)
2 lQ-4
4
Bone marrow
65 (36) 59 (36)
2 1()-l
4
Gonads
19 (8)
16 (8)
2 lQ-4
1
Bone-litiing cells
19 (8)
16 (8)
2 lQ-4
1
Bone marrotu
19 (8)
16 (8) 2 1()-l
Gonads
44 40
21Q-4
Bone-lining cells
44 40
2 lQ-4
Bone marrotU
44 40
2 1()-l
HCa
55Fe ......• 12 (13)
1 15 (16)
1 12 (13)
0.6 12 (13) 0.3
15 (16) 0.3
12 (13)
0.2
4
12 0.7
4 15
0.7 57 18 0.1
4 12
0.4 42 18
oosr ...... . 1s1cs ..... . 26 (21) 230Pub .... .
85 (130) 26 (21)
0.2
62 (64) 26 (21) 7 (4)
TOTALC 170 ( 110) 260 (240) 230 ( 170) 55 (33)
a Dose accumulated up to year 2000. The total dose commitment to the gonads and bone marrow is about 140 mrad; it is about 170 mrad to cells linin!! bone surfaces.
b The dose commitment to bone-lining cells for the north temperate zone has been taken to be equal to the integrated
95
23 (28)
7 (4) 0.05
81 (64)
17 (14)
7 (4)
72 (47)
18
120 180 160
dose over 50 years to bone. A reduction by a factor of four has been assumed for the south temperate zone. Because of insufficient data, the dose commitments to gonads and to bone marrow have not been estimated.
c Totals have been rounded off to two significanc figures.
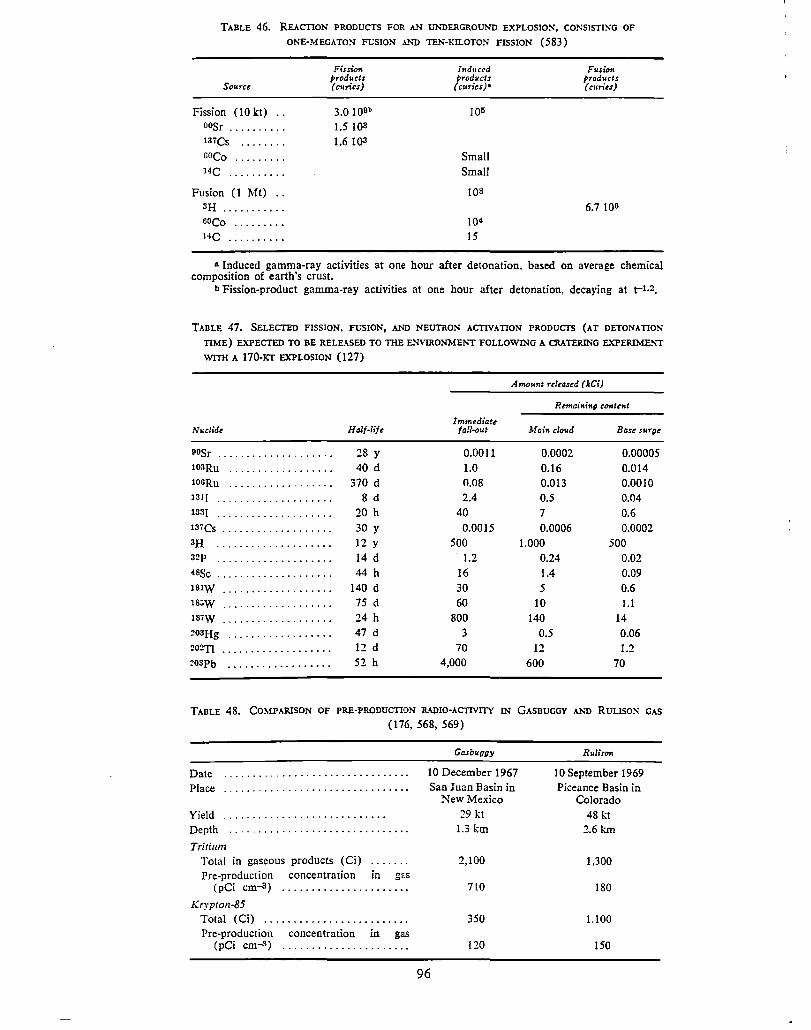
TABLE 46. REACTION PRODUCTS FOR AN U1s'DERGROUND EXPLOSION, CONSISTING OF
ONE-MEGATON Ft:SION !ND TEN-KILOTON FISSION (583)
Source
Fission (10 l;:t) oosr .......... 1s1cs ........ ooco ......... HC ..........
Fusion (1 Mt) .. 3H ........... ooco ......... HC ..........
FissiOfl products (curies)
3.0 100•
1.5 103
1.6 lOS
Induced products
(curies)•
1Q5
Small Small
IQS
104
15
Fusion products (curiu)
6.7 106
a Induced gamma-ray activities at one hour after detonation, based on average chemical composition of earth's crust.
b Fission-product gamma-ray activities at one hour after detonation. decaying at i-1.2.
TABLE 47. SELECTED FISSION, FUSION, AND NEUTRON ACTIVATION PRODUCTS (AT DETONATION
TIME) EXPECTED TO BE RELE....SED TO THE ENVIRONMENT FOLLOWING A CRATERING EXPERIME1''T
\VITI! A 170-JIT EXPLOSION (127)
Nuclide
oosr ................... . 10:iRu
100Ru .......•.........•
1s1r ........•..•..•....•
1331 ...........•.....•..
1s1cs .................. . 3H ................... . 3:?p ........•........•••
•ssc ................... . 1a1w
1a:.w ..... , , , . , . , . , , ... . 1a1w .................. . 203Hg ................. .
!?O!?Tl ................. •.
2ospb ................. .
HaJf.Jife
28 y 40 d
370 d
8 d 20 h 30 y 12 y
14 d
44 h 140 d
75 d
24 h
47 d
12 d 52 h
Immediate fall•out
0.0011
1.0 0.08
2.4 40
0.0015
500
1.2
16
30
60
800
3 70
4,000
Amount rt/eased (kCi)
Remaining COfltent
Main cloud Base surge
0.0002 0.00005
0.16 0.014
0.013 0.0010
0.5 0.04
7 0.6
0.0006 0.0002
1,000 500
0.24 0.02
1.4 0.09
5 0.6
10 I.I 140 14
0.5 0.06
12 1.2
600 70
TABLE 48. COMPARISON OF PRE-PRODUCTION RADIO-!,CTIVllY IN GASBUGGY Arm RULISON GAS
(176, 568, 569)
Date Place
Yield Depth .............................. .
Tritium Total in gaseous products (Ci) ...... . Pre-production
(pCi cm-S)
Krypton-85
concentration in g2.s
Total (Ci) ........................ . Pre-production concentration in gas
(pCi cm-S) ..................... .
Gasbuggy
10 December 1967
San Juan Basin in New Mexico
96
29 kt
1.3 km
2,100
710
350
120
Ru/is""
10 September 1969
Piceance Basin in Colorado
48 kt 2.6km
1,300
180
1.100
150
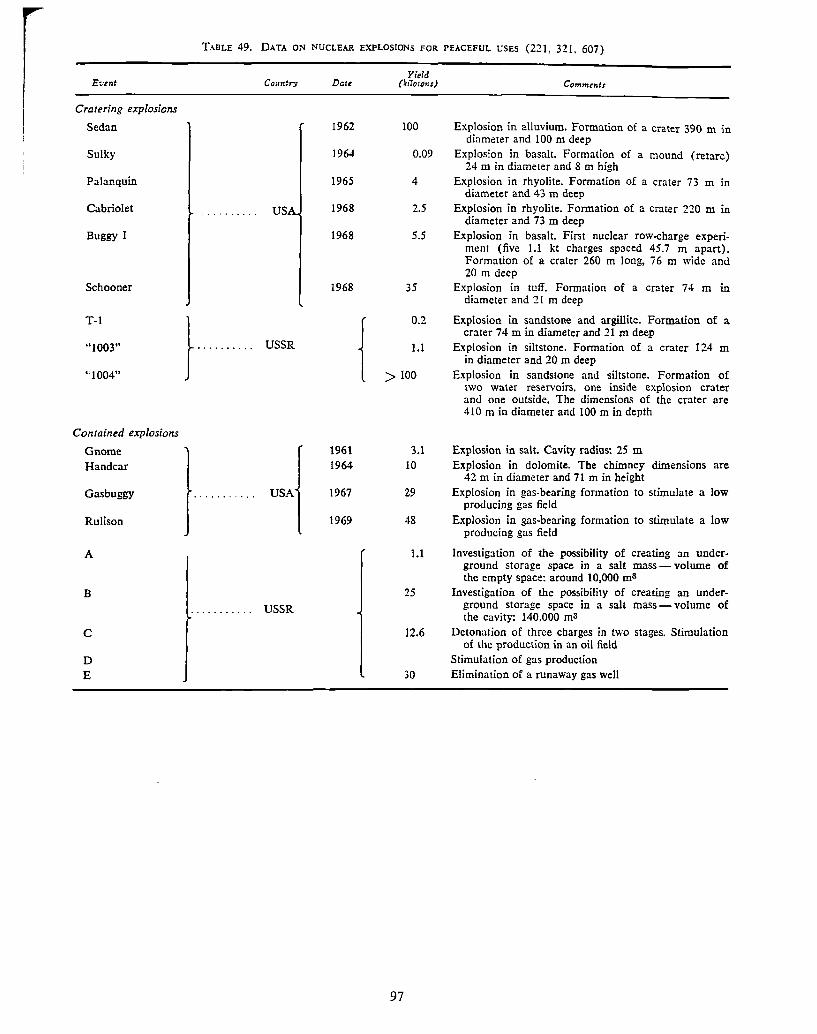
E::ent
Cratering explosions
Sedan
Sulky
Palanquin
Cabriolet
Buggy I
Schooner
T-1
"1003"
"1004"
Contained explosions
Gnome Handcar
Gasbuggy
Rulison
A
B
C
D E
TABLE 49. DAT • .\ ON NUCLEAR EXPLOSIONS FOR PEACEFUL USES (221, 321. 607)
Co:u::ry
us
USSR
USA
USSR
Dau
1962
1964
1965
1968
1968
1968
1961 1964
1967
1969
{
Yield (•ilotor.s)
100
0.09
4
2.5
5.5
35
0.2
1.1
>100
97
3.1 10
29
48
1.1
25
12.6
30
Commtnt.1
Explosion in alluvium. Formation of a crater 390 m in diameter and 100 m deep
Explosion in basalt. Formation of a mound (retarc) 24 m in diameter and 8 m high
Explosion in rhyolite. Formation of a crater 73 m in diameter and 43 m deep
Explosion in rhyolite. Formation of a crater 220 m in diameter and 73 m deep
Explosion in basalt. First nuclear row-charge experiment (five 1.1 kt charges spaced 45.7 m apart). Formation of a crater 260 m long, 76 m wide and 20 m deep
Explosion in tuff. Formation of a crater 74 m in diameter and 21 m deep
Explosion in sandstone and argillite. Formation of a crater 74 m in diameter and 21 m deep
Explosion in siltstone. Formation of a crater 124 m in diameter and 20 m deep
Explosion in sandstone and siltstone. Formation of two water reservoirs, one inside explosion crater and one outside, The dimensions of the crater are 410 m in diameter and 100 m in depth
Explosion in salt. Cavity radius: 25 m Explosion in dolomite. The chimney dimensions are
42 m in diameter and 71 m in height Explosion in gas-bearing formation to stimulate a low
producing gas field Explosion in gas-bearing formation to stimulate a low
producing gas field
Investigation of the possibility of creating an underground storage space in a salt mass - volume of the empty space: around 10,000 ma
Investigation of the possibility of creating an underground storage space in a salt mass - volume of the cavity: 140,000 m3
Detonation of three charges in two stages. Stimulation of the production in an oil field
Stimulation of gas production Elimination of a runaway gas well
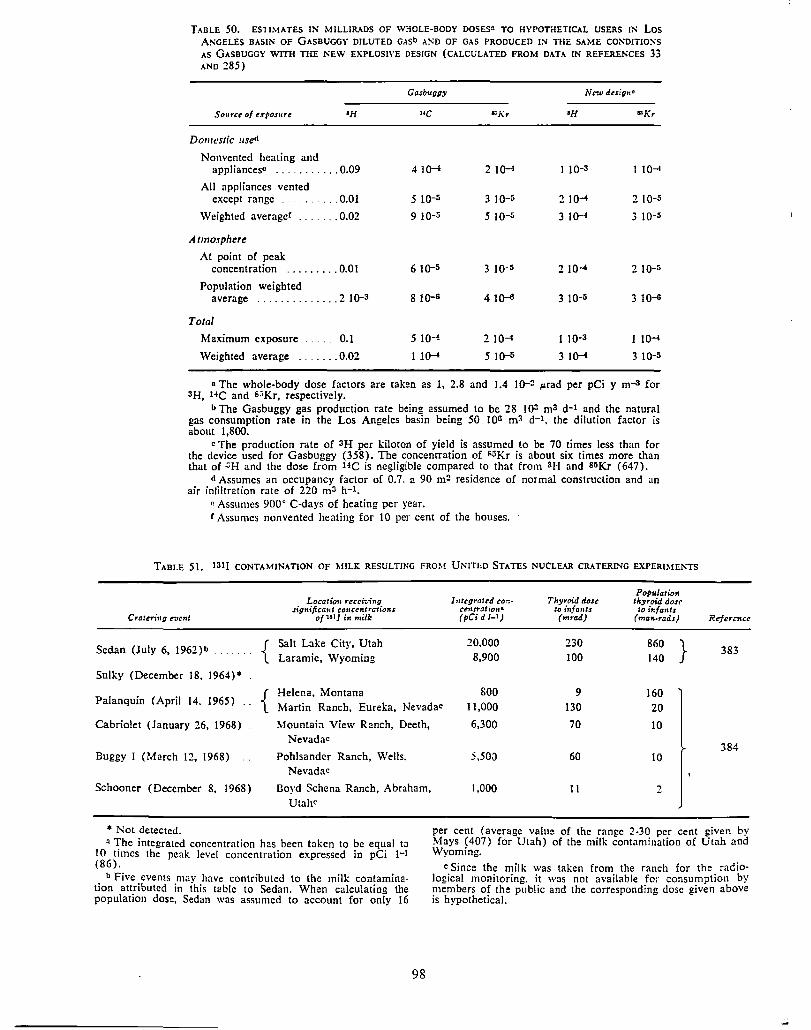
TABLE 50. ESTIMATES IN MILLIR. ... DS OF WHOLE-BODY DOSEsn TO HYPOTHETICAL USERS IN Los ANGELES BASIN OF GASBUGGY DILUTED GASb AND OF GAS PRODUCED !:>I TIIE SAME CONDITIO!'IS
AS GASBUGGY WITH THE NEW EXPLOSIVE DESIGN (CALCULATED FROM DATA IN REFERENCES 33 AND 285)
Gas&un:; Nt"W dcsiguc
S011rce of cxt,os"rt •H ac ""Kr •H ""Kr
Domestic used
Nonvented heating and appliances• ........... 0.09 4 1 Q-1 2 IQ-I I 10-3 I 10-1
All appliances vented except range ........ 0.01 51Q-5 3 ]Q-5 2 IQ-I 2 I0-5
Weighted averager ....... 0.02 9 10-s 5 JQ-5 3 ]0-4 3 JQ-5
Atmosphere
At point of peak concentration ......... 0.01 610-5 3 lQ-5 2 IQ-I 2 10-5
Population weighted average .............. 2 ]0-3 8 ]Q-6 4 lQ-6 3 10-s 3 lQ-6
Total
Maximum exposure 0.1 5 10-* 2 IQ-I 1 10-3 I IQ-I
Weighted average ....... 0.02 I 104 5 10-S 3 104 3 10-5
n The whole-body dose factors are taken as 1, 2.8 and 1.4 ]0-!? µrad per pCi y m-3 for 3H, HC and B"Kr, respectively.
b The Gasbuggy gas production rate being assumed lo be 28 103 m3 d-1 and the natural gas consumption rate in the Los Angeles basin being 50 106 m3 d-1, the dilution factor is about 1,800.
c The production rate of 3H per kiloton of yield is assumed to be 70 times less than for the device used for Gasbuggy (358). The concentration of S5Kr is about six times more than that of ;;H and the dose from HC is negligible compared to that from 3H and BliKr (647).
d Assumes an occupancy factor of 0.7. a 90 m!? residence of normal construction and an air infiltration rate of 220 ma h-1.
"Assumes 900° C-days of heating per year. t Assumes nonvenled heating for 10 per cent of the houses.
TABLE 51. 1311 CONTAMINATION OF MILK RESULTING FROM UNITED STATES NUCLEAR CRATERING EXPERIMENTS
Thyroid dose Population
Location recri-:..'1ng lntrgratrd ror:- thyruid dose significant concentn;1io-n.r ce1s.traliona to infants ta infa,its
C rat ,ri,, g r.Jcnt of uJ J ill niill: (pCi d l-1) (mrad) (man,rads)
Sedan (July 6, 1962)b { Salt Lake City, Utah 20,000 230 860 } Laramie, Wyoming 8,900 100 140
Sulky (December 18, 1964)*
{ Helena, Montana 800 9 160 Palanquin (April 14. 1965)
Martin Ranch, Eureka, Nevadac 11,000 130 20
Cabriolet {January 26, 1968) Mountab View Ranch, Deeth, 6,300 70 10 Nevadac
Buggy I (March 12, 1968) Poh!sander Ranch, Wells, 5,50J 60 10 Nevadac
Schooner {December 8, 1968) Boyd Schena Ranch, Abraham, 1,000 11 2 Ulahc
Reference
383
384
• Not detected. 0 The integrated concentration has been taken to be equal to
10 times the peak level concentration expressed in pCi 1-1 (86).
per cent (average value of the range 2-30 per cent given by Mays (407) for Utah) of the milk contamination of Utah and Wyoming.
b Five events may have contributed to the milk contamination attributed in this table to Sedan. When calculating the population dose, Sedan was assumed to account for only 16
98
c Since the milk was taken from the ranch for the radiological monitoring. it was not available for consumption by members of the public and the corresponding dose given above is hypothetical.
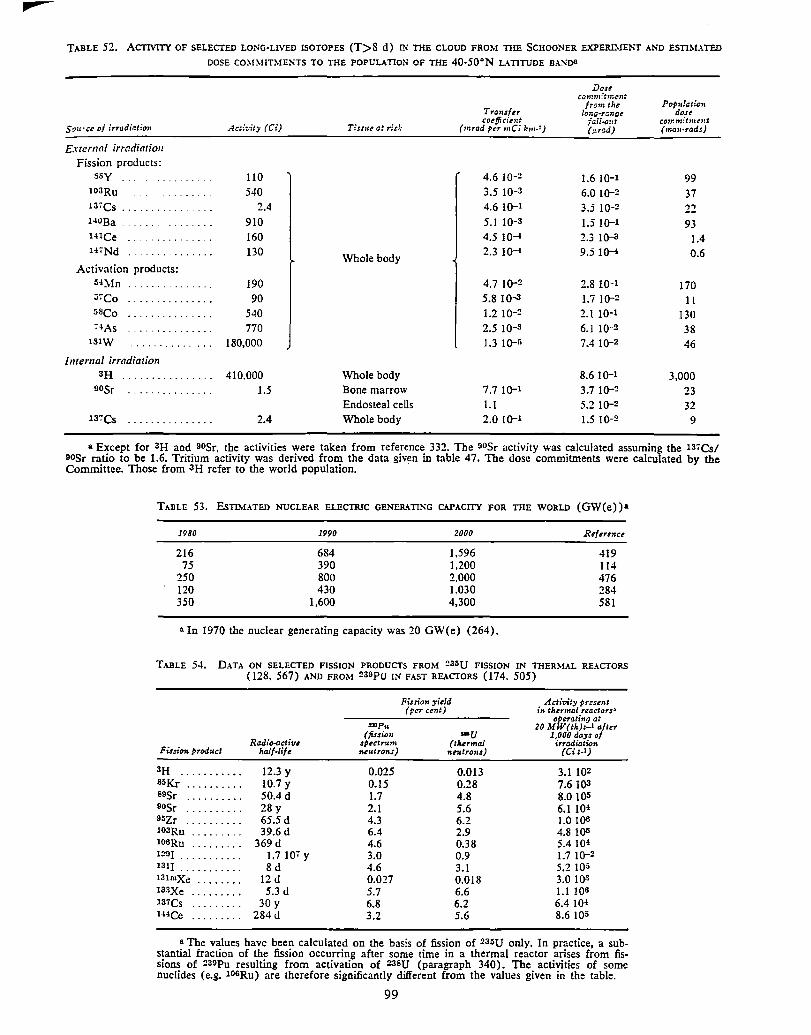
TABLE 52. ACTMTY OF SELECTED LONG-LIVED ISOTOPES (T>8 d) IN THE CLOUD FROM THE SCHOONER E.XPERD!ENT AND ESTIMATED DOSE COll!MITMENTS TO THE POPULATION OF THE 40-50°N LATITUDE BA:Sl>"
Source oj irradiation
External irradiation Fission products:
ssy . _ lOJRu
13•Cs . HOBa HlCe ... H7Nd ..
Activation products: 54~fn 57Co
58Co ,4As
1s1w
Internal irradiation
Activity {Ci)
110 540
2.4
910 160 130
190 90
540 770
180,000
3H . . . . . . . . . . . . . . . . 410.000 90Sr 1.5
137Cs 2.4
Tissue a: risJ:
Whole body
Whole body Bone marrow Endosteal cells Whole body
Transfer coeffici,,:t
(mrad per mCi km·')
4.6 10-2 3.5 10-3
4.6 10-1 5.1 lQ-3
4.5 10-1 2.3 10-4
4.7 10-2 5.8 lQ-3
1.2 10-2
2.5 10-3
1.3 10-5
7.7 10-1
1.1 2.0 )Q-1
Dost commitment
from the long-rcnge
fall-out (µrad)
1.6 10-1 6.0 10-2 3.5 10-2
1.5 10-1 2.3 lQ-3
9.5 IQ-4
2.8 10-1 1.7 10-2
2.1 10-1 6.J 10-2
7.4 10-2
8.6 10-1 3.7 10-2
5.2 10-~ 1.5 10-2
Pop11/aticn dose
co,r.mitmcnt {,na11•rads)
99
37
22 93
1.4 0.6
170 11
130
38 46
3,000 23 32
9
a Except for 3H and 90Sr, the activities were taken from reference 332. The oosr activity was calculated assuming the 13,Cs/ 90Sr ratio to be 1.6. Tritium activity was derived from the data given in table 47. The dose commitments were calculated by the Committee. Those from 3H refer to the world population.
TABLE 53. EsTIM.-\TED NUCLEAR ELECTRIC GENERATING CAPACITY FOR THE WORLD (GW(e))a
1980
216 75
250 120 350
1990
684 390 800 430
1,600
2000
1,596 1,200 2,000 1.030 4,300
a In 1970 the nuclear generating capacity was 20 GW(e) (264).
Reference
419 114 476 284 581
TABLE 54. DATA ON SELECTED FISSION PRODUCTS FROM ~35U FISSION IN THERMAL REACTORS (128, 567) AND FROM 239pu IN FAST REACTORS (174, 505)
Fission yield Activity present (per cent) in th.ennal reactors 3
operating at :mp,. 20 MW(th)t-1 after
(fission -u 1,000 days of Radio-activ, spectrum (thermal im:diatian
Fission produd half-life neutrons) ne,,trons) (Ci t-l J
3H ........... 12.3 y 0.025 0.013 3.1 102 85Kr .......... 10.7 y 0.15 0.28 7.6 103 89Sr .......... 50.4 d 1.7 4.8 8.0 105 9DSr .......... 28 y 2.1 5.6 6.1 104 95Zr .......... 65.5 d 4.3 6.2 1.0 106 103Ru ......... 39.6 d 6.4 2.9 4.8 105 106Ru .. -· ..... 369 d 4.6 0.38 5.4 104 1!!91 ........... 1.7 107 y 3.0 0.9 1.7 10-2 1311 ........... 8d 4.6 3.1 5.2 105 13lmXe ........ 12 d 0.027 0.018 3.0 103 133Xe ......... 5.3 d 5.7 6.6 1.1 106 1a1cs ......... 30 y 6.8 6.2 6.4 10-1 lHCe ......... 284 d 3.2 5.6 8.6 105
a The values have been calculated on the basis of fission of 235U only. In practice, a substantial fraction of the fission occurring after some time in a thermal reactor arises from fissions of 239Pu resulting from activation of 23SU (paragraph 340). The activities of some nuclides (e.g. 106Ru) are therefore significantly different from the values given in the table.
99
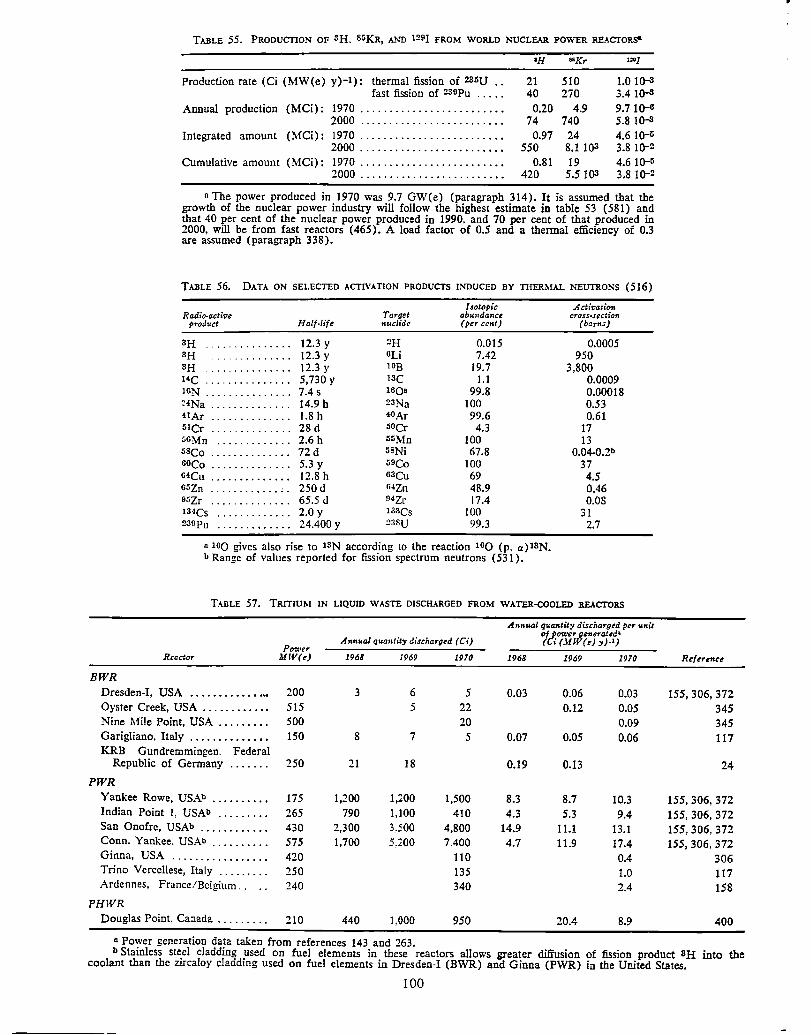
TABLE 55. PRODUCTION OF 3H. S5KR, AND 1291 FROM WORLD NUCLEAR POVVER REACTORS-
•H ""Kr =1
Production rate (Ci (MW(e) y)-1): thermal fission of 2s:.u .. 21 510 1.0 10-S fast fission of 239Pu ..... 40 270 3.4 10-S
Annual production (MCi): 1970 ......................... 0.20 4.9 9.7 10-6 2000 ......................... 74 740 5.8 10-S
Integrated amount (MCi): 1970 ......................•.. 0.97 24 4.6 lQ-G
2000 ......................•.. 550 8.1103 3.8 10-2 Cumulative amount (MCi): 1970 ........................• 0.81 19 4.6 10-5
2000 ........................• 420 5.5 103 3.8 10-2
0 The power produced in 1970 was 9.7 GW(e) (paragraph 314). It is assumed that the growth of the nuclear power industry will follow the highest estimate in table 53 (581) and that 40 per cent of the nuclear power produced in 1990, and 70 per cent of that produced in 2000, will be from fast reactors (465). A load factor of 0.5 and a thermal efficiency of 0.3 are assumed (paragraph 338).
TABLE 56. DATA ON SELECTED ACTIVATION PRODUCTS INDUCED BY THERMAL NEUTRO~S (516)
Raafo-active product
3H .............. . 3H ............. . 3H .............. .
HC ··············· IGN ........•......
~-!Na ............. . 41Ar .....•........ 51Cr ............. .
ss~fn ............ . ssco ............. . ooco ............ .. 6-!Cu ............. . oszn ............ '. eszr ............. . 13-ICs ............ . 239Pu ............ .
Ha/f./ifc
12.3 y 12.3 y 12.3 y 5,730 y 7.4 s 14.9h 1.8 h 28 d 2.6 h 72d 5.3 y 12.8 h 250d 65.5 d 2.0 y 24.400 y
Target nuclide
2H ou lOB 13c 16()n
23Na 40Ar
50Cr
55Mn 58Ni 59Co 63Cu 04Zn 9·1Zr iascs :nsu
Isotopic Activation abu11dance cross•secticn (per cent) (barns)
0.015 0.0005 7.42 950
19.7 3,800 1.1 0.0009
99.8 0.00018 100 0.53 99.6 0.61
4.3 17 100 13 67.8 0.04-0.'.!b
100 37 69 4.5 48.9 0.46 17.4 0.08
100 31 99.3 2.7
n 100 gives also rise to 13N according to the reaction 100 (p, a)l3N. b Range of values reported for fission spectrum neutrons (531).
TABLE 57. TRITIUM IN LlQUID WASTE DISCH..\RGED FROM WATER-COOLED REACTORS
Reactor
BWR
Dresden-I, USA . . . . . . . . . . • • ... 200 Oyster Creek, USA . . . . . . . . • . • • 515 Nine Mile Point, USA . . . . . . • . . 500 Garigliano, Italy . . . . . . . . . . . • . . 150 KRB Gundremmingen. Federal
Republic of Germany 250
PWR
Yankee Rowe, USAb . . . . . . . . . . 175 Indian Point I, USAb . . . . . . . . . 265 San Onofre, USAb . . . . . . . . • • . • 430 Conn. Yankee, USAb . . . . . . . . . . 575 Ginna, USA . . . . . . . . . . . . . . . . . 420 Trino Vercellese, Italy . . . . . . . . . 250 Ardennes, France/Belgium. . 240
PHWR Douglas Point, Catlada . . . . . . . . . 210
A"""al quantity discharged (Ci)
1968
3
8
21
1,200 790
2,300 1,700
440
j969
6
5
7
18
1,200 1,100 3.500 5.200
I.OOO
1970
5 22 20
5
1,500 410
4,800 7.400
110 135 340
950
A Power generation data taken from references 143 and 263.
Annual qum,lity discharged per 1mit of power generated•
1968
0.03
O.Q7
0.19
8.3 4.3
14.9 4.7
(Ci (MW(e) :,)-1)
1969
0.06 0.12
0.05
0.13
8.7 5.3
11.1 11.9
20.4
1970
0.03 0.05 0.09 0.06
10.3 9.4
13.1 17.4 0.4 1.0 2.4
8.9
Reference
155,306,372 345 345 117
24
155,306,372 155,306,372 155,306,372 155, 306, 372
306 117 158
400
b Stainless ste_el cladding }JSed on fuel elements in. these reactors allows grea~er diffusion of fission product SH into the coolant than the zrrcaloy claddmg used on fuel elements m Dresden-I (BWR) and Gmna (PWR) in the United States.
100
'
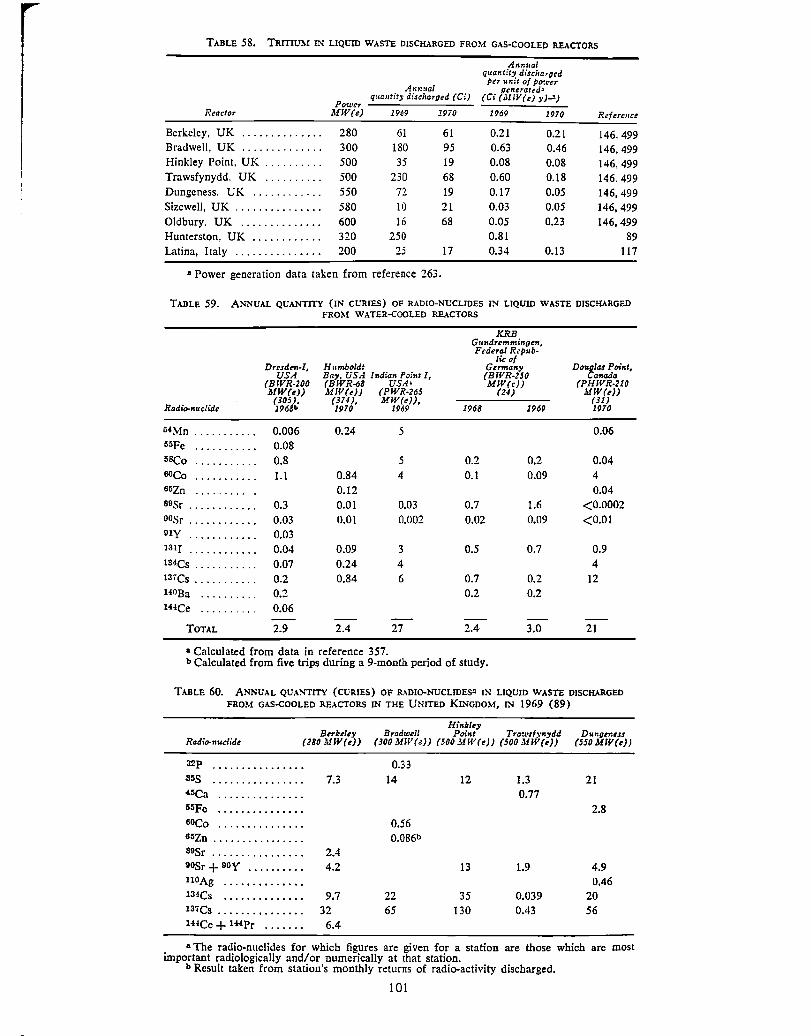
TABLE 58. TRITIUM IN LIQUID WASTE DISCHARGED FROM GAS•COOLED REACTORS
An1121al quantity discl,argcd
Annual per unil of po-.i:er
gc11erattd:i
Power q:<a11tity discharged (Ci) (Ci (MIV(e) y)..1J
Reactor MW(e) 1969 1970 1969 1970 Refcrmct
Berkeley, UK .............. 280 61 61 0.21 0.21 146.499 Bradwell, UK .............. 300 180 95 0.63 0.46 146,499 Hinkley Point, UK .......... 500 35 19 0.08 0.08 146,499 Trawsfynydd. UK .......... 500 230 68 0.60 0.18 146.499 Dungeness, UK ............ 550 72 19 0.17 0.05 146,499 Sizewell, UK ............... 580 10 21 0.03 0.05 146,499 Oldbury. UK .............. 600 16 68 0.05 0.23 146,499
Hunterston, UK ............ 320 250 0.81 89
Latina, Italy ............... 200 25 17 0.34 0.13 117
a Power generation data taken from reference 263.
TABLE 59. AJl<"NUAL QU.~"ITITY (IN CURIES) OF RADIO-NUCLIDES IN LIQUID WASTE DISCHARGED FROM WATER-COOLED REACTORS
KRB G11ndremmfogen, Federal Repul,-
Dresdns-I, lkof
Humboldt Germany USA Ba:,, USA Indian Point I, (BWR.z5o
(BWR-200 (BWR-d8 US.4• MW(e)) MW(e)) MW(e)) (PWR-265 (24)
Radio-nuclide (305), (374 ), MW(e)), 1968b 1970 1969 1968 1969
5•Mn ........... 0.006 0.24 5 55Fe ........... 0.08 5BCo ........... 0.8 5 0.2 0.2 60Co ........... 1.1 0.84 4 0.1 0.09 65Zn ........... 0.12
sosr ............ 0.3 0.01 0.03 0.7 1.6 oosr ............ 0.03 0.01 0.002 0.02 0.09 Illy ............ 0.03 13lf ............ 0.04 0.09 3 0.5 0.7
134Cs ........... 0.07 0.24 4
t37Cs ........... 0.2 0.84 6 0.7 0.2 140Ba .......... 0.2 0.2 0.2 144Ce .......... 0.06
TOTAL 2.9 2.4 27 2.4 3.0
• Calculated from data in reference 357. b Calculated from five trips during a 9-month period of study.
Do"'(llas Point, Canada
(PHWR-210 .\!W(e))
(JI) 1970
0.06
0.04
4
0.04
<0.0002
<0.01
0.9
4 12
21
T.ulLE 60. ANNUAL QUA."ITITY (CURIES) OF RADI0-NUCLIDES'1 IN LIQUID WASTE DISCHARGED FROM GAS-COOLED REACTORS IN THE UNITED KINGDOM, IN 1969 (89)
Radio-nuclide Berkeley
(2BO MW(e))
32p ...............• ass ............... . •sca 55Fe
GDCo
sszn ............... . 89Sr ............... . 11osr + ooy .......••. llOAg ....•••.•••••• 134Cs ..•••••••.••••
137Cs ••••••• , •••••••
H4Ce + 1+1Pr ....••.
7.3
2.4
4.2
9.7
32 6.4
Hinkley Bradwell Point Trawsfyn:,dd Dungen,ss
(300 MW(e)) (500 !,!W(e)) (500 ll1W(1)) (550 MW(e))
0.33
14 12
0.56 0.0861>
13
22 35
65 130
1.3
0.77
1.9
0.039
0.43
21
2.8
4.9 0.46
20
56
a The radio-nuclides for which figures are given for a station are those which are most important radiologically and/or numerically at that station.
b Result taken from station's monthly returns of radio-activity discharged.
101
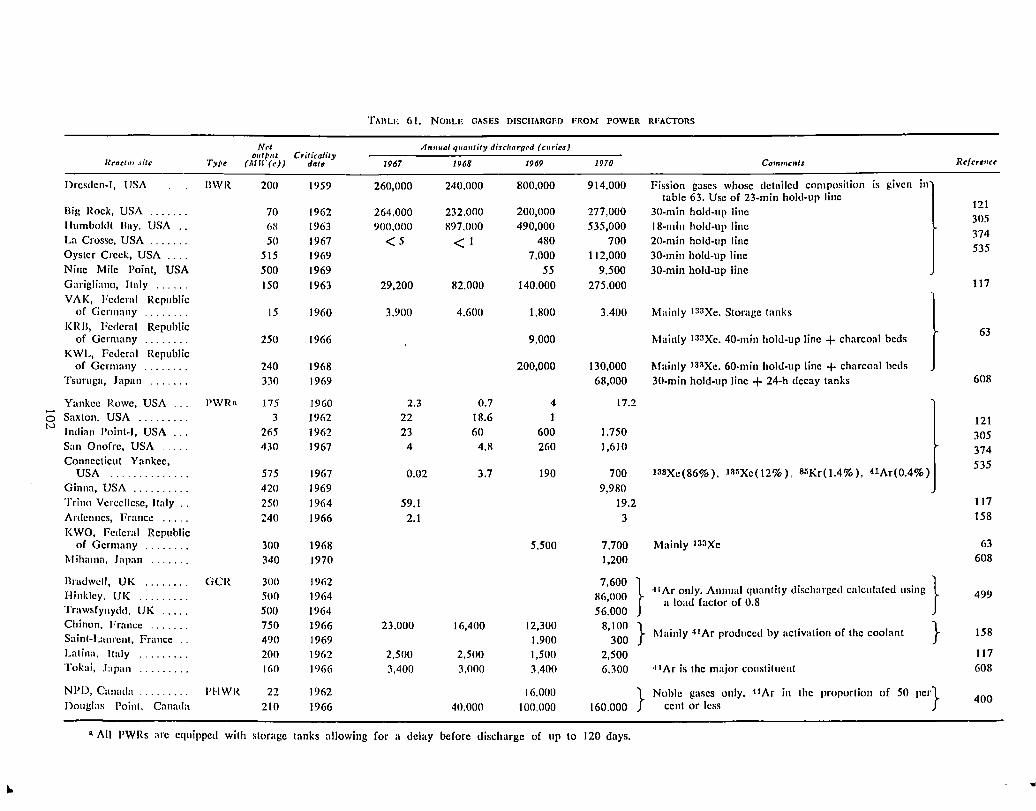
Rrnctor xitc
Dresden-I, USA BWR
Big Rock, USA ...... . Humboldl. Bay, USA .. La Crossc, USA ...... . Oyster Creek, USA ... . Nine Mile Point, USA Garigliano, Italy ..... . VAK, l•ederal Republic
of Germany ....... . KRil, Federal Republic
of Germany ....... . KWL, Federal Republic
of Germany ....... . Tsurnga, Japan ...... .
Yankee Rowe, USA PWRn
o Saxton, USA ........ . t-.> Indian Point-I, USA .. .
San Onofre, USA Connecticut Yankee,
USA ............. . Ginna, USA ......... . Trino Vcrccllcsc, Italy .. Anlenncs, France ..... KWO, Federal Republic
of Germany ....... . l\lihama, Japan ...... .
Bradwell, UK ....... . Ilinklcy. UK ........ . Trawsfynydd. UK .... . Chinon, France ...... . Saint-L:nirent, France .. Latina, Italy ........ . Tokai, .Japan ........ .
NPO, Canada Douglas l'oinl. Canada
GCR
PHWR
N,t 011t/n1t Criticality
(MH'(e)) date
200
70
50 515 500 150
15
250
240 330
175 3
265 430
575 420 250 240
300 340
300 500 500 750 490 200 160
22 210
1959
1962 1963 1967 1969 1969 1963
1960
1966
1968 1969
1960
1962 1962 1967
1967 1969 1964 1966
1968 1970
1962 1964 1964 1966 1969 1962 1966
1962 1966
TAIILE 61. Nonu, GASES DISCHARGED FROM POWER REACTORS
Anw,a/ quautity di.rcl1argcd (cu,·ics}
1967
260,000
264,000 900.000
<5
29,200
3,900
2.3 22 23 4
0.02
59.1 2.1
23,000
2,500 3,400
1961/
240,000
232.000 897,000
<I
82,000
4,600
0.7 18.6 60
4.8
3.7
16,400
2,500 3,000
40.000
1969
800,000
200,000 490,000
480 7,000
55 140.000
1,800
9,000
200,000
4 1
600 260
190
5,500
12,300 1.900 1,500 3.400
16,000 100,000
1970
914,000
277,000 535,000
700 112,000
9,500 275.000
3,400
130,000 68,000
Comments
Fission gases whose detailed composition is given in table 63. Use of 23-min hold-up line
30-min hold-up line 18-min hold-up line 20-min hold-up line 30-min hold-up line 30-min hold-up line
Mainly 1:l3Xe. Storage tanks
Mainly J33Xe. 40-min hold-up line + charcoal beds
Mainly J33Xe. 60-min hold-up line + charcoal beds 30-min hold-up line + 24-h decay tanks
l 17.2
1.750 1,610
700 138Xe(86%). l8~Xe(12%), 85Kr(l.4%), 41Ar(0.4%)
9,980 19.2 3
7,700 Mainly 133Xe 1,200
7,600 86,000 56,000
8,100 300
2,500 6,300
}
·t I Ar only. Annual quantity discharged calculated using } a load factor of 0.8
} l\lainly 41Ar produced by activation of the coolant }
1 IAr is the major constiluent
} Noble gases only. ·11Ar in the proportion of 50 per}
160.000 cent or less
n All l'WRs arc equipped wilh storage tanks allowing for a delay before discharge of up to 120 days.
Refer111u
121 305 374 535
117
63
608
121 305 374 535
117 158
63 608
499
158
117 608
400
•
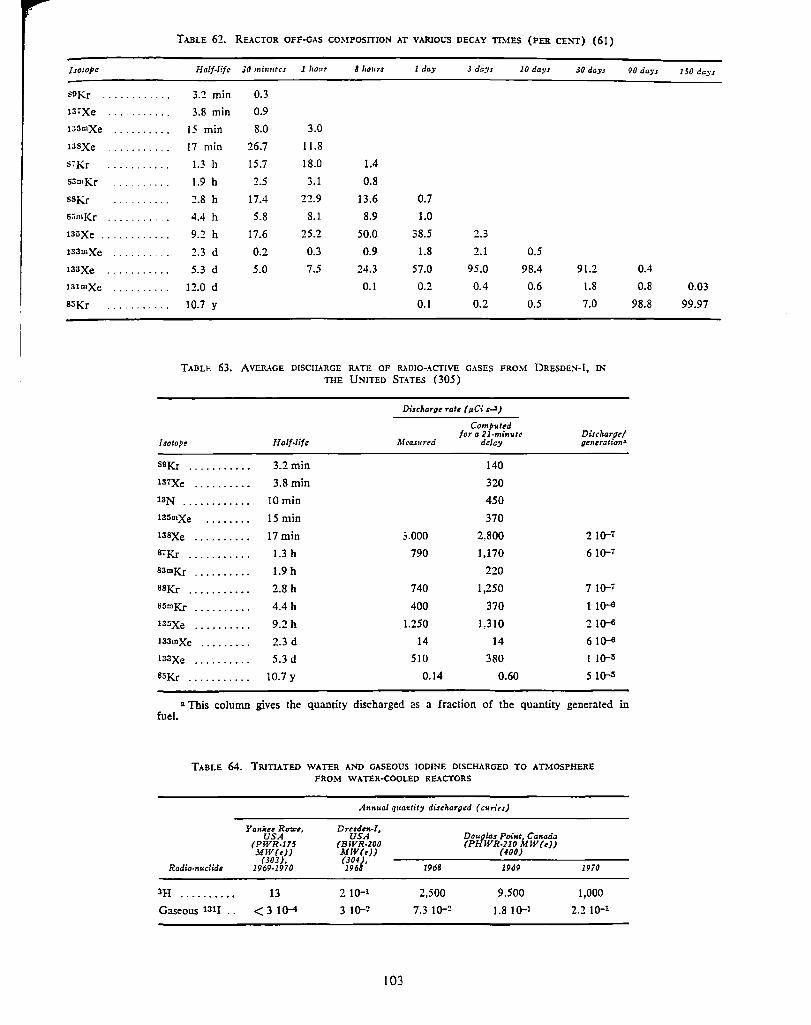
TABLE 62. REACTOR OFF-OAS CO!'>IPOSITION AT VARIOUS DECAY TDIES (PER CE1'<7) (61)
Isotope Half-Ii/< JO minutes l /lour 8 liours 1 day 3 days 10 days 30 days 90 days
SOKr ' ') min 0.3 ....... . . . -'·-13,Xe . - ......... 3.8 min 0.9
1~n11,xe .......... 15 min 8.0 3.0
13SXe ........... 17 min 26.7 11.8
s,Kr .. -· ....... 1.3 h 15.7 18.0 1.4
S3mKr 1.9 h 2.5 3.1 0.8
S8Kr . - ......... 2.8 h 17.4 22.9 13.6 0.7
sr.ml(r - .......... 4.4 h 5.8 8.1 8.9 1.0
1a:1xe ............ 9.2 h 17.6 25.2 50.0 38.5 2.3
133mXe
1aaxe
13lmXe
S5Kr
.......... 2.3 d 0.2 0.3 0.9 1.8 2.1 0.5
- - ... -..... 5.3 d 5.0 7.5 24.3 57.0 95.0 98.4 91.2
.......... 12.0 d 0.1 0.2 0.4 0.6 1.8
........... 10.7 y 0.1 0.2 0.5 7.0
TABLE 63. AVERAGE DISCHARGE RATE OF RADIO-ACTIVE GASES FROM DRESDE~·l, IN 1HE UNITED STATES (305)
Isotope
S9Kr ..........•
137Jee ......... .
13N .....•....••
135mXe
13SXe ......... .
8.Kr .........••
S3mKr .....•••••
8SKr ....•.•••••
S5mKr
ia~xe
133mXe ........ .
t33Xe ......... .
S5Kr .......... .
Haff.fife
3.2min
3.8 min
lOmin
15min
17min
1.3 h
1.9 h
2.8 h
4.4 h
9.2h
2.3 d
5.3 d
10.7 y
Discharge raU (µCi s~)
Meas11red
3.000
790
740
400
1.250
14
510
0.14
Compvted for a 21-min .. te
delay
140
320
450
370
2.800
1,170
220
1,250
370
1,310
14
380
0.60
Discharge/ gcnerationo
2 10-•
6 10-7
7 1()-7
1 JQ-6
2 lQ-6
610-6
1 J()-5
5 1()--5
a This column gives the quantity discharged as a fraction of the quantity generated in fuel.
TABLE 64. TRITIATED WATER AND GASEOUS IODINE DISCHARGED TO ATMOSPHERE FROM WATER-COOLED REACTORS
An,u,al q11a11tity discl1arged ( c"ries)
Yanku Rou:e. Drudm-1, Dougla.r Poi..t Canada USA USA
(PWR•l75 (BWR·ZOO (PHWR-210 MW(e)) MW(e)) MW(e)) (400)
(303), (304" Radio-n11clids 1969-1970 196 1968 1969 1970
3H .. -······· 13 2 10--1 2,500 9.500 1,000
Gaseous 131I .. < 3 1()-f 3 )()-2 7.3 10-2 1.8 10-1 2.2 10-1
103
0.4
0.8
98.8
150 days
0.03
99.97

TABLE 65. ES'nMATES OF DOSE DUE TO 1!EASURED CAESIUM CONCENTRATIONS IN FISH
Reactor
Dresden-I. USA (1968) ..
Indian Point I, USA (1969)
Trawsfynydd, UK (1969)c .
Mean caesium concenlralun<
in fish (pCi gJ. u:d)
0.015
0.056
0.022
0.026
( calc.) 0.034
11 1.0
25 2.4
SD14rce of a::ivily
Fall-out I37Csb
Total I37Cs
Fall-out 1sres
Discharged I84Cs } Discharged 137Cs
Total I37Cs in trout Discharged IS4Cs in trout Total I37Cs in perch Discharged I34Cs in perch
"The rate of power generation in 1969 was taken from reference 263. b Paragraph 356. cvaiues for 1970 were somewhat lower than those for 1969 (427).
Annual Individual dase whole-bod:, commitment,
dose to per unit of fish illdividuals co11su1nptiou concerned and unit rate per unit of power
rate of fish gtnerati(m1. consu,npticn (rad kg-•
(rad (g d-l)J.) (MW(eJP)
3 10-7
10--il 1.3 10-s
} 2 104 1.4 10--il
Reference
304
357
323, 426
TABLE 66. POPULATION DOSE COJ\,U,IITMu"ITS DUE TO DISCHARGES FROM SELECTED NUCLEAR POWER STATIO:SS IN THE UNITED KINGDOM CALCULATED FRO:.! DATA IN REFERENCES 263 AND 323
Whole body dose- Population dose commitment to commitment t,er
Daily co,.sumption individuals unit of pou1er Station uposed rate or annual concern,d p,r ,mit generated
and Critical pop1<lation ho11rsof Importont of pou:er generated (man-rad pathu-,,y material group e~posure radio-n,ulides (rnd(MW(e) :,JJ) (MW(e) y)J)
Bradwell
Internal Oyster Oyster fishermen 75 g d-1 oszn 1.1 I 0--il 5.5 10-5 (50 persons) (critical)
137Cs llOmAg 3:?p
Trawsfynydd
Internal ..... Trout and perch Lake anglers ( 100 100 g d-1 1s;cs 5.2 IQ-5 5.2 10-3 flesh persons) 134Cs
Hinkley Point
Internal ..... Fish and shrimp Local fishermen 90 g d-1 137Cs 9.1 10-7 9.110-S flesh and families 134Cs
(100 persons)
External ..... Mud/silt Local fishermen 880 h y-1 1arcs 2.3 10--il 2.3 10-5 (10 persons) l34Cs
104
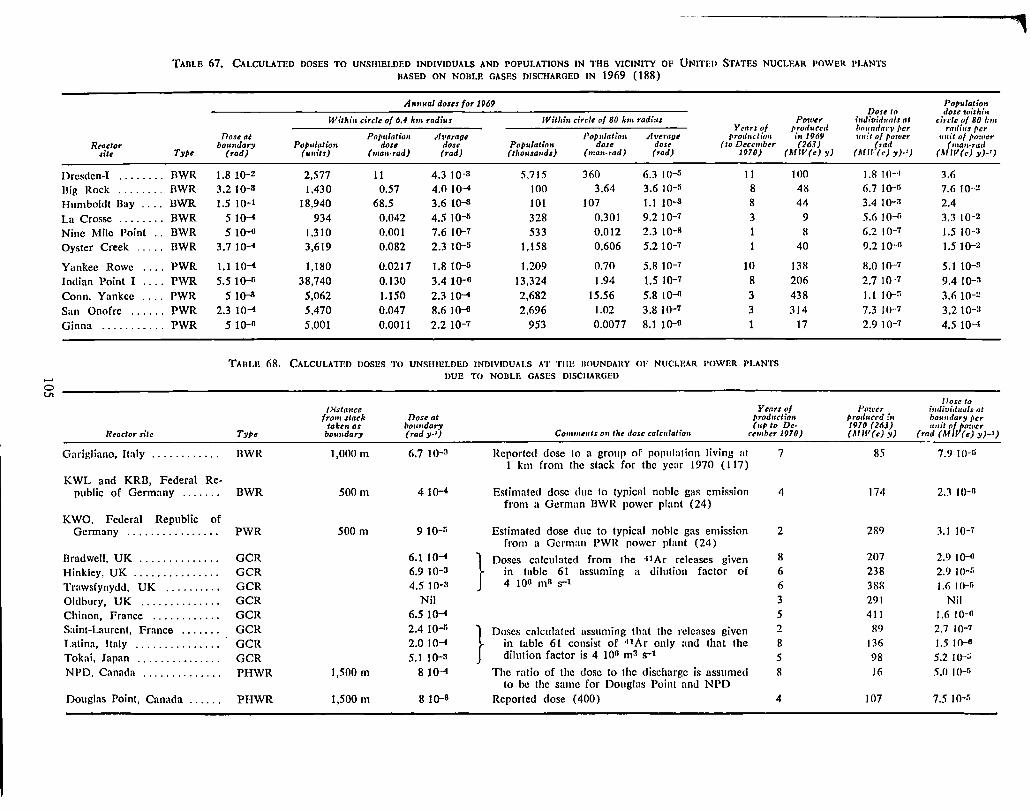
...... 0 VI
TABLE 67, CALCULATED l>OSES TO UNSIIIELDED INDIVIDUALS AND POPULATIONS IN '1118 VICINITY OF UNITED STATES NUCLEAR POWER PLANTS BASED ON NOBLE GASES DISCHARGED IN 1969 (188)
Dose at Reactor boundary
site Type (rad)
Dresden-I ........ BWR 1.8 10-2 Big Rock ........ BWR 3.2 10-3 Humboldt Bay . . . . BWR 1.5 10-1
La Crosse . . . . . . . . BWR 5 10-4
Nine Mile Point . . BWR 5 J0-0
Oyster Creek . . . . . BWR 3.7 10-1
Yankee Rowe .... PWR 1.110-1
Indian Point I .... PWR 5.5 10-11
Conn. Yankee .... PWR 5 JO-ll
San Onofre ...... PWR 2.3 )0-4
Ginna ........... PWR
Rtador silt
Gurigliano, Italy ........... .
KWL and KRB, Federal Re-public of Germany ...... .
KWO, Federal Republic of Germany ............... .
Bradwell, UK ............. . Hinkley, UK .............. . Trnwsfynydd, UK ......... . Oldbury, UK ............. . Chinon, France ........... . Saint-Laurent, France ...... . Latina, Ttnly .............. . Tokni, Japan .............. . NPD, Canada ............. .
Douglas Point, Canada ..... .
5 10-6
TAHU! 68,
T:,I'•
BWR
BWR
PWR
GCR GCR GCR GCR GCR GCR GCR GCR PHWR
PHWR
Am1ual dos,s for 1969
Witliin circle of 6.4 k,n radi11S Witl,in circle of 80 l1tn radius Po·w,r
Pop11/atio11 Year., of prmfoce<l
At•craue l'ot,11/ation Average prod11etion in 1969 P(,.11/alio11 dose dose Pot,11/atinn dose dos~ (lo Drcc111btr f263)
11t1itsJ (,nan,rad) (rad) (tl1011sauds) (man-rad) (rad) 1970) (M Y(e) y)
2,577 11 4.3 lQ--8 5,715 360 6.3 J0-5 11 100 1,430 0.57 4.0 10-1 100 3.64 3.6 10-n 8 48
18,940 68.5 3.6 lQ-3 101 107 I.I lQ-8 8 44
934 0.042 4.5 10-5 328 0.301 9.2 J0-7 3 9
1,310 0.001 7.6 10-7 533 0.012 2.3 J0-8 1 8
3,619 0.082 2.3 10-5 1,158 0.606 5.2 10-7 1 40
1,180 0.0217 1.8 J0-5 1,209 0.70 5.8 10-7 10 138
38,740 0.130 3.4 10-6 13,324 1.94 1.5 10-7 8 206
5,062 1.150 2.3 10-4 2,682 15.56 5.8 10-0 3 438 5,470 0.047 8.6 J0-6 2,696 1.02 3.8 I0-7 3 314 5,001 0.0011 2.2 10-7 953 0.0077 8.1 10-0 1 17
CALCULATED DOSI!S TO UNSIIII!LDI!D INDIVIDUALS A'I' 'fllll IIOUNDARY OP NUCI.I!AR POWER PLANTS
Distance from stack
taken as boundary
1,000m
500m
500 m
1,500 m
1,500 m
DUE TO NOBLE GASES DISCHARGED
Dose at boiitidary (rad y-1)
6.7 10-11
410-4
910-5
6.110-1 6.9 J0-3 4.5 10-11
Nil 6.5 J0-4 2.4 10-5
2.0 J0-·1 5.1 J0-3
8 ]0--4
8 J0-8
Cottrn16nts ou IJ1e ,lose calculaJion-
Years of production (up to De
amber 1970)
Reported dose lo a group of population living at 1 km from the stack for the yenr 1970 (117)
Estimated dose due lo typical noble gas emission from a German BWR power plant (24)
Estimated dose due to typical noble gas emission from a German PWR power plant (24)
}
Doses cnlculated from the 41Ar releases given in table 61 assuming a dilution factor of 4 100 ms 8-1
}
Doses calculated assuming that the releases given in table 61 consist of •llAr only and that the dilution factor is 4 100 m3 s-1
The ratio of the dose to the discharge is assumed to be the same for Douglas Point and NPD
Reported dose (400)
7
4
2
8 6 6
3 5 2
8
5 8
4
Dose to ,·,ulivi,lrra/.r nl lmundcrry per uu!t of Pmucr
{rat/ (MW(c) y)·')
1,8 10-·1 6.7 10-n 3.4 10-3 5.6 ](l-li
6.2 J0-7 9.2 10-n
8.0 10-7 2.7 10-7 1.1 10-r.
7.3 10"7 2.9 I 0-1
Po·wcr J,roduerd t·,. 1970 (263) (MW(c) y)
85
174
289
207 238 388 291 411
89 136 98 16
107
Pot,ulation dose wjt/tin
circle of 80 Im, ,-mlius ficr
writ of power (mau•racl
(/IIW(c) y)·')
3.6 7.6 10-2 2.4 3.3 10-2 1.5 10-:i 1.5 10-2
5.1 J0-3 9.4 10-3 3.6 J0-2 3.2 10-·:J
4.5 10-I
I.Jn.re to imlivirluals at borrn,la,-y Ptr :rnit of f,trwcr
(rad (MIY(c) y)-1)
7.9 10-6
2.3 10-0
3.1 10-7
2.9 10-0 2.9 10-r.
1.6 10-r.
Nil 1.6 10-0 2.7 J0-7 1.5 I o-o 5.2 1()-5
5,0 1()-5
7.5 J0-5
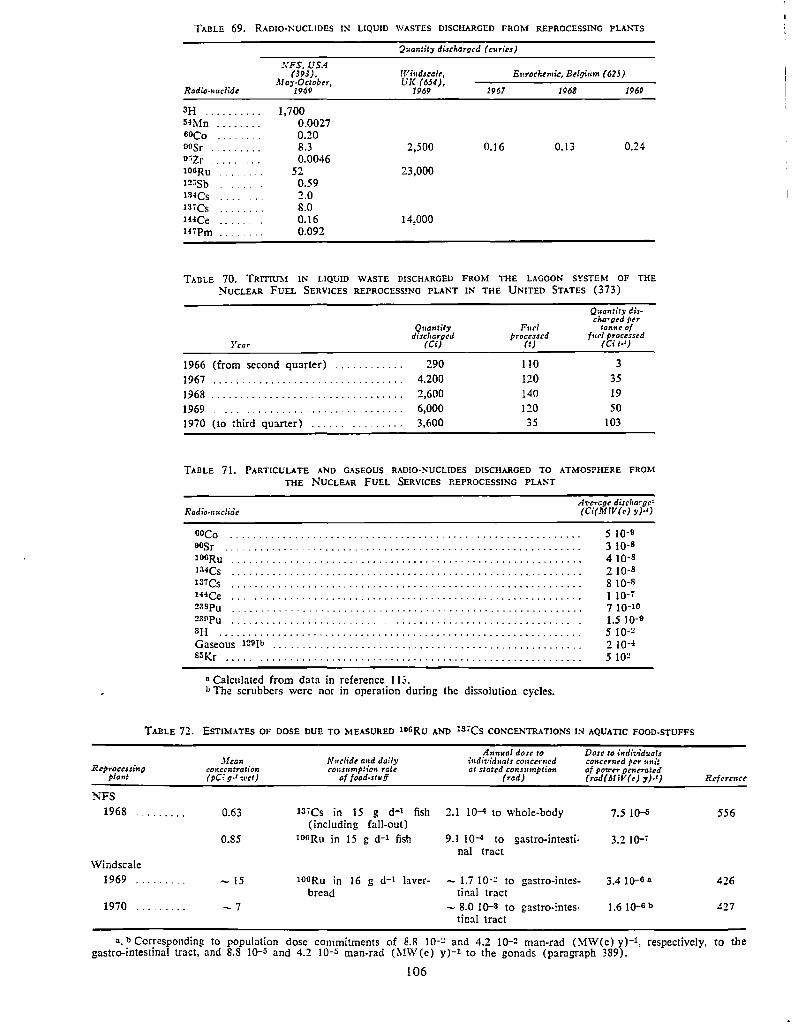
TABLE 69. RADIO-NUCLIDES IN LIQUID WASTES DISCHARGED FROM REPROCESSING PLA!s'TS
Quantity discharged { curies)
SFS, USA (393),
May-October, 1969
Windscalc, UK (654),
1969
Et<rocl,enik, Be/giu,n (625)
Radio-m,clidt 1967 196S 1969
3H ......... . 5-IMn ....... . eoco .. . oosr ........ .
1,700 0.0027 0.20 8.3 0.0046
2,500
23,000
0.16 0. 13 0.24 o~zr 100Ru
i2~sb 1a-1cs 1a1cs lHCe 14.Pm
52 0.59 2.0 8.0 0.16 0.092
14,000
TADLE 70. TRITIUM IN LIQUID WASTE DISCHARGED FROM TIIE LAGOON SYSTEM OF THE NUCLEAR FUEL SERVICES REPROCESSING PLANT IN THE UNITED STATES (373)
Year
1966 (from second quarter) 1967 1968 1969 1970 (to third qu:mer) ......... .
Quantity discharged
{Ci)
290 4,200 2,600 6,000 3,600
Fuel processed
{t)
110 120 140 120 35
Quantity cis-charged per
tonne of fuel processed
(Cit-1)
3 35 19 50
103
TABLE 71. PARTIClJLATE AND GASEOUS RAD!O-NUCLIDES DISCHARGED TO ATMOSPHERE FROM THE NUCLEAR FUEL SERVICES REPROCESSING PLANT
Ai1cragr discl1ar-gc-:. Radio-nuclide
ooco sosr 100Ru
lMCs 1z1cs lHCe 2:ispu 2:iopu ........................................................... . 3H ............................................................. . Gaseous 12011> .........•••••.••.•.•.•..••••.••.•.•..•.••..•••...•.•
S5Kr ...................................................... .
a Calculated from data in reference 113. b The scrubbers were not in operation during the dissolution cycles.
(Ci(MW(e) y)-1)
5 10-9 3 10-s 4 10-s 2 10-s 8 10-s 1 10-7 7 10-10 1.5 10-9 5 10-2 2 lQ-4
5102
TABLE 72. ESTIMATES OF DOSE DUE TO MEASURED lOGRu AND 137Cs CONCE."-TRATIONS DJ AQUATIC FOOD-STUFFS
Reprocessing plant
NFS
1968
Windscale 1969
1970
.Hean eonccntration (pCigJwet)
0.63
0.85
-15
-7
Nuclide and daily cous:,mption rate
of food-st11ff
1a,cs in 15 g d-1 fish ( including fall-out)
1or.Ru in 15 g d-1 fish
lOORu in 16 g d-1 bverbread
Aun,,a/ dose to individuals concenztd at stated consumption
(rad)
2.1 10-1 to whole-body
9.1 10-4 to gastro-intestinal tract
- 1.7 10-~ to gastro-intestinal tract
- 8.0 10-S to gastro-intestinal tract
Dose to i11dividua/s conctr11td per Hnit of pou,~r gentrated {rad{MW(e) y)J)
7.5 10-S
3.2 10-•
3.4 IQ-6 a
1.6 1()-6 b
556
426
427
a. b Corresponding to population dose commitments of 8.8 I o-~ and 4.2 1 Q-2 man-rad (IvfW( e) y)-l, respectively, to the gastro-intestinal tract, and 8.8 I0-5 and 4.2 10-5 man-rad (MW(e) y)-1 to the gonads (paragraph 389).
106
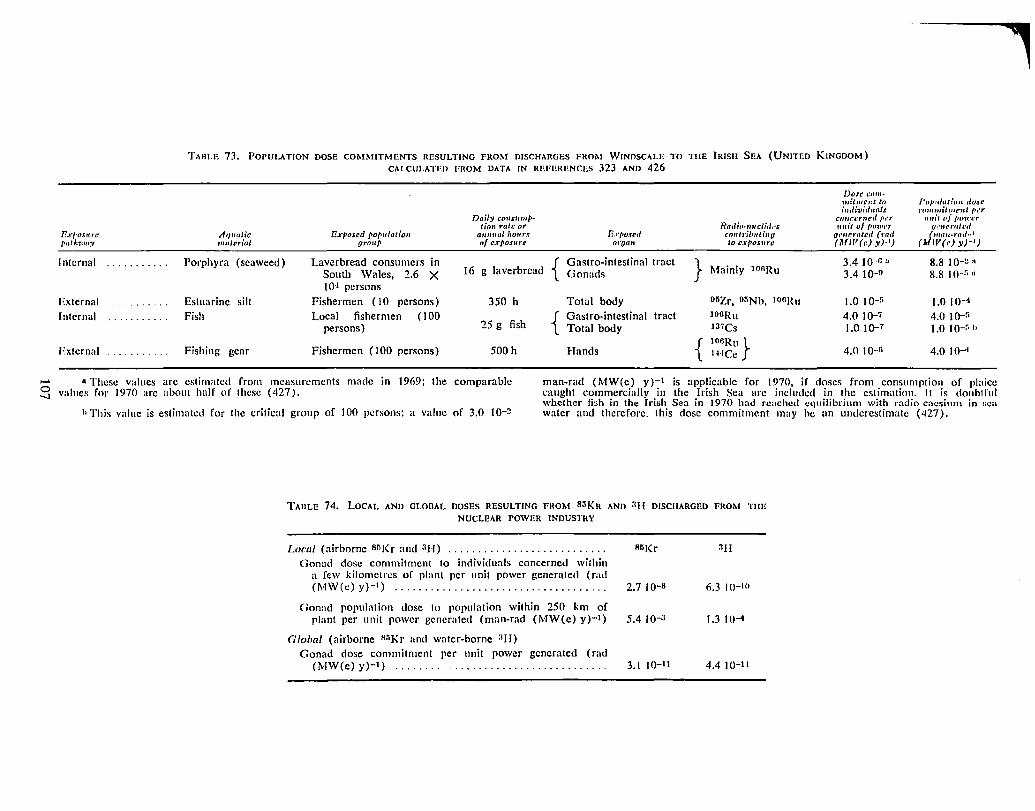
J?.t•(iaJUt'l' f'i1tlm111y
Internal ...........
External
Internal
lixtcrnal . . . .......
TABLE 73. POPULATION DOSE COM!'-IITMENTS RESULTING FROM DISCHARGES FROM WINDSCALE TO THE IRISH SEA (UNITED KINGDOM) CALCULATED FROM DATA IN REPERENCLS 323 AND 426
Do.,c emu-mitmcnt to individuals
Daily c011.r11mp-tion r<,Jt: or
Aq1rnllc Exposccl Pof>11/at/011 aumial l,our.1 T!.1·/•t1s8d motirial group of e.~pos11re Ol"Ql111
cm1c1.•rned /•er H.a,lio-tJft clttl i •s ruait of Potth'r
co11tril,uti'nu gc,wr,,/ccl (rml to e.1·J,os1t,.c (JIIIV(c) ;v)-1)
Porphyra (seaweed) Laverbread consumers in { Gastro-intestinal tract South Wales, 2.6 X 16 g laverbrcad Gonads I O·l persons
} Mainly lOURu 3.410-011
3.4 J0-9
Estuarine silt Fishermen ( 10 persons) 350 h Total body o5zr, 05Nb, IOOJlu 1.0 I o-r.
Fish Local fishermen (100 { Gastro-intestinal tract persons) 25 g fish Total body
lOGRu 4.0 )0-7 I37Cs 1.0 )0-7
Fishing gear Fishermen ( I 00 persons) 500 h Hands { 1oaRu} tHCc 4.0 10-n
Pop11Ittlr"o11 ,lose co111mitm1.•ut p,·r
llllit 1•/ /10'l(',.'r IJ1'HCrtJlt~,/
/""'""'""'/-1 (A IV(,·) y)·')
8.8 1 o-~ 11
8.8 1()--r, II
1.0 I 0-4 4.0 10-r. 1.0 10-r. h
4.0 10-1
- u These values are estimated from measurements made in 1969; the comparable S values for 1970 arc about half of these (427).
man-rad (MW(c) y)-t is applicable for 1970, if doses from consumption of pl;iicc caught commercially in the Irish Sea arc included in the estimation. It is doubtful whether fish in the Irish Sea in 1970 had reached equilibrium with radio-caesium in i;ca water and therefore. this dose commitment may he im underestimate (427). h This value is estimated for the critical group of 100 pcTsons; a value of 3.0 10-~
TAllLE 74. LOCAL AND GtODAL DOSP.S RESULTING PROM B~KR AND :IH DISCHARGED FROM TIIE
NUCLEAR POWER INDUSTRY
torn/ (airborne B»Kr and :IJ-1) ....................... , ..•
Gonad dose commitment to individuals concerned within a few kilometres of plan! per unit power generated ( rad (J\1W(e) y)-1 ) ••••••.•••••••••••••••••••••••••••••
Gonad population dose to population within 250 km of plant per unit power generated (man-rad (MW(e) y)-t)
Global (airborne BliKr and water-borne :1(1)
Gonad dose commitment per unit power generated (rad (MW(e) y)-1) .................................. .
Rlll(r
2.7 10-s 6.3 I 0-10
5.4 10-a 1.3 J0-4
3.1 10-11 4.4 10-11
,
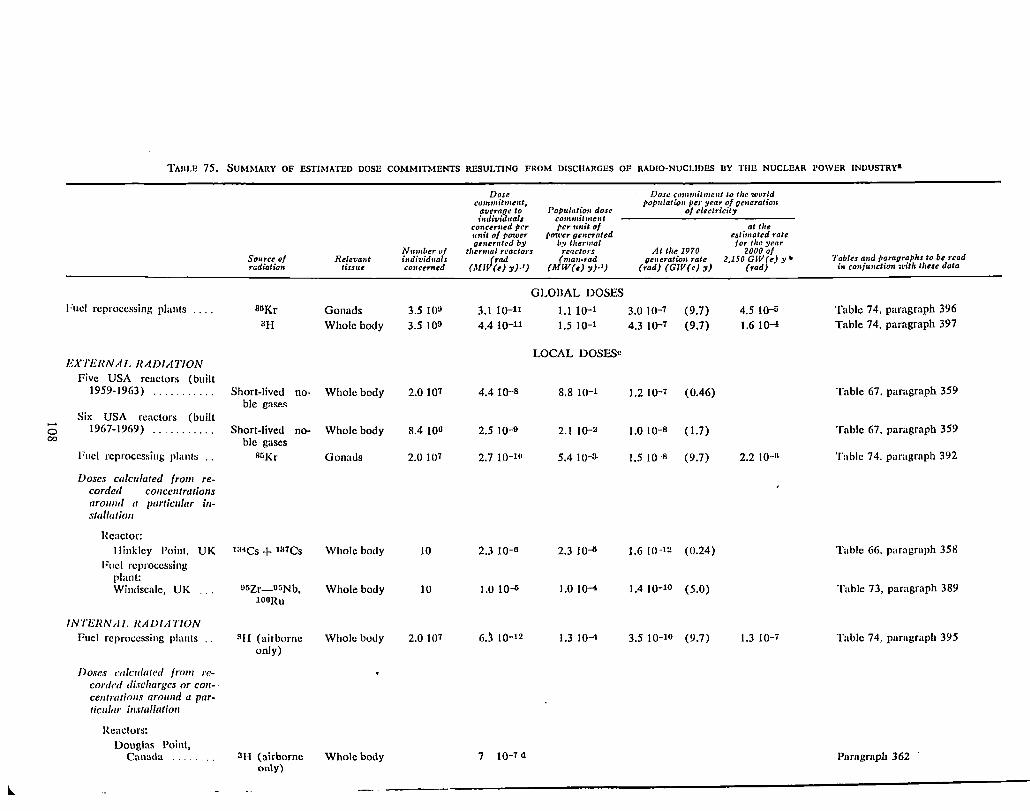
TAIILE 75. SUMMARY OF ESTIMATED DOSll COMMITMENTS RESULTING FROM DISCIIARGl!S OF RADIO-NUCLIDE.5 BY Till! NUCLEAR l'OWER INDUSTRY•
/Jo.re Dose commltmeut to tlao •world commitment,,
average to individuals
populatio,i /•er :yea,· of ucncration Population dose of elutricit:y
commitment concerned per per rrnil of at tl,e unit of pou,er power generated estimated rate uenc.-alcd b:y b:y tlieruwl /or tlic )'Car
Nt1111ber of thermal readors reacto,·s At the 1970 2000 of Tables and parauraplis to be read Source of Relevant it1dit1iduals ;.rml (man-rad generation rate 2,150 GW) e) :y b
radiation tissue conctrned (Ml (e) y)J) (MW(e) y)·') (rad) (GW(c) y) (rad in conjsincfion mitl, tlaese data
GLOBAL DOSES I ;uel reprocessing plants .... 85Kr Gonads 3.5 !Oil 3.1 10-11 1.1 10-1 3.0 10-7 (9.7) 4.5 10-5 Table 74, paragraph 396
3H Whole body 3.5 J09 4.4 10-11 1.5 10-1 4.3 10-7 (9.7) 1.6 1()-l Table 74. paragraph 397
LOCAL DOSESc EX'J'ERN A/, RAJ)fA TION
Five USA reactors (built 1959-1963) ........ ~ .. Short-lived no- Whole body 2.0 107 4.4 10-s 8.8 10-1 1.2 10-7 (0.46) Table 67, paragraph 359
ble gases Six USA reactors (built ......
1967-1969) Short-lived Whole body 8.4 100 2.5 J0-9 2.1 10-2 1.0 10-s ( 1.7) Table 67, paragraph 359 0 .. . . . . . . . . . no-00 ble gases
Fuel reprocessing planls .. Bul(r Gonads 2.0 1()1 2.7 10-10 5.4 10-3 1.5 JO-B (9.7) 2.2 10-0 Table 74. paragraph 392
Doses calculated from re-corded co11ce11trations aro1111d (I particular ill-stallatio11
Reactor: J linkley Point, UK 134Cs + rn1cs Whole body 10 2.3 10-0 2.3 JO~ 1.6 1()-12 (0.24) Table 66, paragraph 358
Fuel reprocessing plant: Wimlscale, UK o5zr_05Nb, Whole body JO 1.0 10-tl 1.0 10-4 1.4 10-10 (5.0) Table 73, paragraph 389
lOORu
IN'f'ERNAT. UAIJIA'J'/ON Fuel reprocessing plants Sf{ (airborne Whole body 2.0 107 6.3 10-12 1.3 I 0-4 3.5 10-10 (9.7) 1.3 J0-7 Table 74. paragraph 395
only)
Doses calc11fated /mm re-cordl'd discharges or con-ce11trntio11s aro1111<J 11 par-tic11/ar i11stallatio11
Reactors: Douglas Point,
Canada .... aa (airborne Whole body 7 10-7 d Paragraph 362 only)
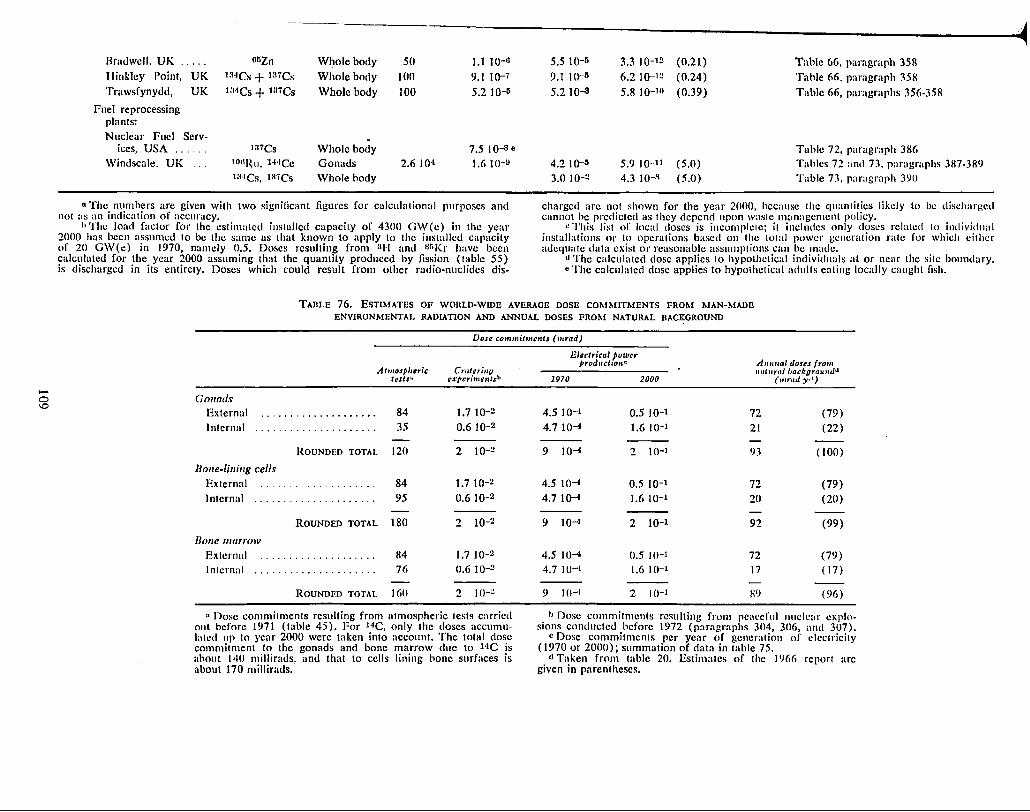
..... 0 \0
Brndwcll, UK ..... onzn Whole body 50 1.1 10-0
Hinkley Point, UK 13·lCs + 1:11cs Whole body 100 9.1 10-7 Trawsfynydd, UK 1:MCs + rn1cs Whole body 100 5.2 I Q-li
Fuel reprocessing plants: Nuclear Fuel Serv- .
ices, USA .... 1a1cs Whole body 7.5 I O-B e
Windscale. UK lOlll{u. H·ICe Gonads 2.6 10·1 1.6 10-0 J3·1Cs, 137Cs Whole body
"The numbers are given with two significant figures for calculational purposes and not :is an indication of accuracy.
"The load factor for the estimated installed capacity of 4300 GW(e) in the year 2000 has been assumed to be the same as that known to apply to the installed capacity of 20 GW(e) in 1970, namely 0.5. Doses resulting from au and Hf>Kr have been calculated for the year 2000 assuming that the quantity produced by fission ( table 55) is discharged in its entirety. Doses which could result from other radio-nuclidcs dis-
5.5 10-li 3.3 10-12
9.1 10-11 6.2 ]Q-12
5.2 10-3 5.8 10-10
4.2 JO-II 5.9 J0-11 3.0 JO-!l 4.3 10-8
(0.21)
(0.24)
(0.39)
(5.0) (5.0)
Table 66, paragraph 358 Table 66, paragraph 358
Table 66, paragraphs 356-358
Table 72, paragraph 386 Tables 72 and 73, paragraphs 387-389 Tuble 73, paragraph 390
charged arc not shown for the year 2000, because the quantities likely to be discharged cannot be predicted as they depend upon waste nmnagcment policy.
c This list of local doses is incomplc1c; it includes only doses related to individual installations or to operations based on the total power generation rate for which cilhcr adequate data exist or reasonable assumptions can be made.
t1 The calculated dose applies lo hypothetical individuals al or near the site boundary. • The calculated dose applies to hypothetical adults eating locally caught fish.
TABLE 76. EsTIMATES OF WORLD-WIDE. AVERAGE DOSE COMMITMENTS FROM MAN-MADE ENVIRONMENTAL RADIATION AND ANNUAL DOSES FROM NATURAL BACKGROUND
Dose commitments (11,rad)
Gonads External Internal
At111osp/1,ric tests 14
84 35
ROUNDED TOTAL 120
Bone-li11i11g cells External Internal .................... .
84 95
ROUNDED TOTAL 180
Bone marrow External ................... . Internal .................... .
84 76
ROUNDED TOTAi. 160
Craterfuu cxperime11tsh
1.7 lQ-!l
0.6 J0-2
2 10-2
1.7 ]0-2
0.6 JO-!l
2 10-2
1.7 J0-2 0.6 I0-2
2 JO-:!
11 Dose commitments resulting from atmospheric tests carried out before 1971 (table 45). For 14C, only the doses accumulated up to year 2000 were taken into account. The total dose commitment to the gonads and bone marrow due to HC is about 140 millirads, and that to cells lining bone surfaces is about 170 millirads.
lilcctrical power J,rodHct10,itl
1970 2000
4.5 10-·1
4.7 10-4
9 10-4
4.5 JQ-4
4.7 I (}--1
9 I (}--1
4.5 J0-4 4.7 10-1
9 10-1
0.5 J0-1 1.6 10-1
2 10-1
0.5 10-1 1.6 I 0-1
2 10-1
0.5 10-1 1.6 JO-l
2 J(l-1
Auuual Josts from ,wturr1J bacllgroirndd
(111rml y- 1)
72 (79) 21 (22) - --93 (100)
72 (79) 20 (20) - --92 (99)
72 (79)
17 ( 17) - -
89 (96)
b Oose commitments resulting from peaceful nuclear explosions conducted before 1972 (paragraphs 304, 306, and 307).
c Dose commitments per year of generation of electricity ( 1970 or 2000); summation of data in table 75.
d Taken from table 20. Estimates of the J 966 report arc given in parentheses.
REFERENCES
1. Aarkrocr A. Radio-ecological investigations, p. 74-79 in Project Crested Ice. A joint Danis~American report on the crash near Thule air base on 21 January 1968 of a B-52 bomber carrying nuclear weapons. Riso report 213 (1970).
2. Aarkrog, A. Prediction moqels for strontium-90 and caesium-137 levels in the human food chain. Health Phys. 20: 297-311 (1971).
3. Aarkrog. A. Radioecological investigations of plutonium in an arctic marine environment. Health Phys. 20: 31-47 (1971).
4. Aarkrog, A. Unpublished. 5. Aarkrog, A., and J. Lippert. Environmental
radioactivity in Denmark. Danish Atomic Energy Commission. Riso reports 154 (1967), 180 (1968), 202 (1969), 221 (1970), 245 (1971).
6. Aarkrog, A.. and J. Lippert. Environmental radio-activity in the Farces. Danish Atomic Energy Commission. Riso reports 131 (1967), 155 (1968), 181 (1969), 221 (1970), 246 (1971).
7. Aarkrog, A. and J. Lippert. Environmental radio-activity in Greenland. Danish Atomic Energy Commission. Riso reports 156 (1967), 182 (1968), 203 (1969), 222 (1970), 247 (1971).
8. Abe, S., N. Sekiguchi. K. Shimizu et al. External exposure due to natural radiation. Radioactivity Survey Data in Ja pan. National Institute of Radiological Sciences report NIRS-RSD-19, Chiba. 1968.
9. Abe, S., N. Sekiguchi, K. Shimizu et al. External exposure due to natural radiation. Radioactivity Survey Data in Japan. National Institute of Radiological Sciences report NIRS-RSD-25, Chiba. 1969.
10. Abe, S .. K. Arai. T. Jwal.'llra et al. External exposure due to natural radiation. Radioactivity Survey Data in Japan. National Institute of Radiological Sciences report NIRS-RSD-28, Chiba. 1970.
11. Agricultural Research Council. Letcombe Laboratory. Annual report, 1970. Wantage, Berkshire, 1971.
12. Agricultural Research Council. Letcombe Laboratory. Annual report, 1971. Wantage. Berkshire, 1972 (in press).
13. Aldcrhout, J. J., T. Franke and W. Hunzinger. The population dose as criterion for an environmental monitoring program, p. 373-379 in Environmental Contamination by Radioactive Materials. IAEA publication STI/PlJB/226. Vienna, 1969.
14. Altshuler, B .. N. Nelson and M. Kuschner. Estimation o( lung tissue dose from the inhalation of radon and daughters. Health Phys. 10: 1137-1161 (1964).
110
15. Anand, K. C., S. Diswas. P. J. Lavakare et al. Heavy nuclei in the primary cosmic-rays in . June 1963 at Fort Churchill. in Proceedings of the Ninth International Conference on Cosmic Rays. p. 396-402. Vol. 1. The Institute of Physics and the Physical Society. London, 1966.
16. Anderson, E. C. Determination of body potassium by 4 rr gamma counting. Chanter 17 in Radioactivity in Man. Second Symposium. (Meneely, G. R. and S. M. Linde, eds.). Charles C. Thomas, Springfield, Ill., 1965.
17. Anderson, H. R. The radial gradient of cosmic radiation measured by Mariners 2 and 4. J. Geophys. Res. 73: 2897-2909 (1968).
18. Antonova, V. A., N. S. Shwidko and P. V. Ramzaev. The possibility of 210Po monitoring in bone and liver by analysis of hair. Presented at a meeting on The Biology and Ecology of Polonium and Radiolead. Sutton. 1970.
19. Asari, T., M. Chiba and M. Kuroda. Strontium-90 and Cesium-137 in milk. in Radioactivity Survey Data in Japan, National Institute of Radiological Sciences ( Chiba. Japan). reports NIRS-RSD-9 and 10 (1965-1966): NIRS-RSD-15 (1967). 17 (1967), 20 (1968), 24 (1969), 26 (1970), 30 (1971).
20. Asari. T., M. Chiba and M. Kuroda. Strontium-90 and Cesium-137 in total diet in Radioactivity Survey Data in Japan. National Institute of Radiological Sciences (Chiba, Japan), reports NJRS-RSD-13 (1966), 15 (1967). 17 (1967).
21.
22.
23.
24.
20 (1968), 24 (1969), 26 (1970). 30 (1971). Ashton, F. and R. B. Coats. The energy spectrum of cosmic-ray neutrons at sea level in the range 20-4000 GeV. J. Phys. A 1: 169-171 (1968). Atkins, D. H., R. C. Chadwick and A. C. Chamberlain. Deposition of radioactive methyl iodide to vegetation. Health Phys. 13: 91-92 (1967). Atomic Weapons Tests Safety Committee Report No. 2 (Commonwealth of Australia): strontium-90 and caesium-137 in the Australian environment during 1969 and some results for 1970. Ascot Vale, Victoria, 1971. Aurand, K., M. Ruf, W. Schikarski et al. Environmental exposure by radionuclides in gaseous and liquid effluents from nuclear pO\ver plants in the Federal Republic of Germany. Vol. 11. p. 591-607 in Peaceful Uses of Awmic Energy. Proceedings of the Fourth International Conference. Geneva. 6-16 September 1971. Published by the United Nations and the International Atomic Energy Agency, 1972. Bakulin. V. N .. E. E. Senko, B. G. Starikov et al. Investigation of turbulent exchange and wash-out by measurement of natural radioactivity in surface air. J. Geopbys. Res. 75: 3669-3674 (1970).
26. Banerjee, P. and S. D. Chatterjee. Radium contents of the Ganges water. Science and Culture 32: 178-180 (1966\
27. Baratta. E. J. and E. S. Ferri. Radionuclides in selected human tissues. Amer. Ind. Hyg. Assoc. J. 27: 438-443 (1966).
28. Baratta, E. J. and E. S. Ferri. Polonium-210 and lead-210 concentrations in human tissues. Presented at a meeting on The Biology and Ecolo!!V of Polonium and Radiolead. Sutton. 1970.~-
29. Baratta. E. L J. C. Apidianakis and E. S. Ferri. Caesium-137. lead-210 and polonium-210 concentrations in selected human tissues in the United States. Amer. Ind. Hyg. Assoc. J. 30: 443-448 (1969).
30. Barry, P. J. and A. C. Chamberlain. Deposition of iodine onto plant leaves from air. Health Phys. 9: 1149-1157 (1963).
31. Barry, P. J. and A. M. Marko. Atomic Energy of Canada Ltd. Report No. AECL 4156 (1972).
32. Bartlett, B. 0. An improved relationship between the deposition of strontium-90 and the contamination of milk in the United Kingdom, p. 26-31 in Agricultural Research Council. Letcombe Laboratory, Annual report 1970. Wantage, Berkshire, 1971.
33. Barton, C. J., D. J. Jacobs and M. J. Kelly. Quarterly progress report on radiological safety of peaceful uses of nuclear explosives: hypothetical population exposures in metropolitan areas. Oak Ridge National Laboratory report ORNL-TM-3338 (1971).
34. Baxter, M. S. and A. Walton. A theoretical approach to the Suess effect. Proc. Roy. Soc., Ser. A. 318: 213-230 (1970).
35. Beasley, T. M., T. A. Jokela and R. J. Eagle. Radionuclides and selected trace elements in marine protein concentrates. Health Phys. 21: 815-820 (1971).
36. Beattie. J. R. and P. M. Bryant. Assessment of environmental hazards from reactor fission product releases. United Kingdom Atomic Energy Authority report AHSB(S) R 135. Risley, Warrington. Lancashire, 1970.
37. Beck, H. L. Environmental gamma radiation from deposited fission products. 1960-1964. Health Phys. 12: 313-322 (1966).
38. Beck. H. L.. and G. de Planque. The radiation field in air due to distributed gamma-ray sources in the ground. United States Atomic Energy Commission report HASL-195. New York, 1968.
39. Beck. H. L., W. M. Lowder, B. G. Bennett et al. Further studies of external environmental radiation. United States Atomic Energy Commission report HASL-170. New York, 1966.
40. Beckinsale, R. D. and M. H. Gale. A reappraisal of the decay constants and branching ratio of 40K. Earth and Planetary Science Letters 6: 289-294 (1969).
41. Begemann. F. Earth Science and Meteorites, p. 169-187. North Holland Publishing Co. Amsterdam. 1963.
111
42. Begemann. F. and W. F. Libby. Continental water balance. ground water inventory and storage times. surface ocean mixing rates and world wide water circulation patterns from cosmic-ray and bomb tritium. Geochim. Cosmochin1. Acta 12: 277-296 (1957).
43. Belter, W. G., W. McVey, C. B. Bartlett et al. The AECs position on radioactive waste management. Nuclear News. November 1969.
44. Bengtsson, L. G. Time varia!ior;s of caesium-137 and potassium in humans from Southern Sweden. Acta Radiologica: Therapy Physics Biology 6: 259-282 (1967).
45. Beninson, D. Unpublished. 46. Beninson. D .. A. M. de Beninson. C. Menossi
et al., Radicestroncio en el hombie en funci6n de la edad. Trabajo presentado en el Quinto Congreso Internacional de la "Societe fram;aise de Radioprotection'", Grenoble-Febrero 1-5 1971: v. United Nations document A/ AC.82/ G/L.1393.
47. Beninson. D .. A. M. de Beninson, y C. Menossi. Fallout radioactive debido a las expiosiones en el Padfico sur en el perfodo 1966-1970. Comisi6n N acional de Energfa At6mica. Informe RS 28/49 (1971) ~ v. United Nations document Al AC.82/G/L.1392.
48. Beninson, D., A. M. de Beninson y C. Menossi. Radio-226 en el hombre. Comisi6n Nacional de Energia At6mica. Informe RS 35/67. Buenos Aires, 1972.
49. Bennett, B. G. Estimation of gonadal absorbed dose due to environmental gamma radiation. Health Phys. 19: 757-767 (1970).
50. Bennett, B. G. Strontium-90 in human bone. p. I-99-1-115 in Health and Safety Laboratory fallout program quarterly summary report HASL-243. New York, 1971.
51. Bennett, B. G. Strontium-90 in the diet. Results through 1971, p. I-95-I-105 in Health and Safety Laboratory fallout program quarterly summary report HASL-249. New York. 1972.
52. Berger, M. J. and S. M. Seiter. Additional stopping power and range tables for protons, mesons, and electrons. National Aeronautics and Space Administration report NASA-SP-3036. Washington, D. C. 1966.
53. Bergstrom, S. 0. W. Transport of fallout 131I into milk. p. 159-174 in Radiological Concentration Processes (Aberg, B. and F. P. Hungate. eds.), Pergamon Press, 1967.
54. Beynon, S. M. and R. H. Clarke. Radiations from CAGR fuel: a-activity. 8-heating, y-spectra and neutron emission. Central Electricity Generating Board report RD/B/N1887. Berkeley, 1971.
55. Bhat, S. G., S. Krishnaswamy, D. Lal et al. :!3-1Th/238U ratios in the ocean. Earth and Planetary Science Letters 5: 483-491 (1969).
56. Bird. P. M. Studies of fallout 137Cs in the Canadian North. Arch. Environ. Health 17: 631-638 (1968).
57. Blanchard, R. L. Relationship between 210Pa and :i10pb in man and his environment. p. 281-?96 in Radioecolocical Concentration Processes (A.berg. B. and F. P. Hungate. eds.). Pergamon Press, 1967.
58.
59.
60.
61.
62.
63.
64.
65.
66.
67.
68.
69.
70.
Blanchard. R. L. and J. B. Moore. 210Pb and 21opo in tissues of some Alaskan residents as related to consumption of caribou or reindeer meat. Health Phys. 18: 127-134 (1970). Blanchard, R. L., H. L. Krieger, H. E. Kolde et al. Radiological surveillance studies at a BWR nuclear power station. Estimated dose rates, p. 372-384 in Proceedings of the Health Physics Society Fifth Annual Midyear Topical Symposium. Idaho Falls, 1971. Blifford, I. H., Jr., H. Friedman, L. B. Lockhart, Jr. et al. Geographical and time distribution of radioactivity in the air. J. Atm. Terr. Phys. 9: 1-17 (1956). Blomeke, J. 0. and F. E. Harrington. Management of radio-active wastes at nuclear power stations. United States Atomic Energy Commission report ORNL-4070. Oak Ridge, 1969. Biomqvist. L. and M. Asikainen. Tungsten-181 in fallout in Finland. Nature 225: 58 only (1970). Bodege. R .. N. Eickelpasch. A. Grau et al. Activity release and control at the nuclear power stations KWL Lingen. KRB Gundremmingen. VAK Kahl and KWO Obrigheim. Vol. 11. p. 355-367 in Peaceful Uses of Atomic Energy. Proceedings of the Fourth International Conference, Geneva, 6-16 September 1971. Published by the United Nations and the International Atomic Energy Agency, 1972. Boella, G., G. Degli Antoni, C. Dilworth et al. Measurement of the cosmic-ray neutron flux in the atmosphere. Il Nuovo Cimento 29: 103-117 (1963). Boella, G., G. Degli Antoni, C. Dilworth et al. Measurement of the cosmic-ray neutron flux at 4.6 billion volts geomagnetic cutoff rigidity. J. Geophys. Res. 70: 1019-1030 (1965).
Bolin. B. The general circulation of the atmosphere as deduced with the aid of tracers, p. 27-56 in Technical note No. 68. Meteorological Aspects of Atmospheric Radioactivity (Bleeker, W .. ed.). WMO publication No. 169, TP. 83. Geneva. 1965.
Bonnyman. J. and J. C. Duggleby. Measurements on iodine-131 in milk supplies, Chapter 3 in Fallout over Australia from nuclear weapons tested by France in Polynesia from May to August 1970. Commonwealth of Australia report AWTSC No. 1. Ascot Vale. Victoria. 1971.
Bonnyman, J. and J. C. Duggleby. Measurements of iodine-131 in milk supplies, Chapter 3 in Fallout over Australia from nuclear weapons tested by France in Polynesia from June to August 1971. Commonwealth of Australia report AWTSC No. 3. Ascot Vale, Victoria, 1971.
Bonnyman, J .. J. C. Duggleby, J. Molina-Ramos et al. Concentrations of caesium-13 7 in rainwater and milk in Australia during 1969. Search 1: 160-163 (1970).
Bonnyman, J., J. H. Harley. W. K. Matthews et al. Measurements of strontium 90, chapter 2 in Strontium-90 and caesium-137 in the Australian environment during 1969 and some results for 1970. Commonwealth of Australia report AWTSC No. 2. Ascot Vale, Victoria, 1971.
71.
72.
73.
74.
75.
76.
77.
78.
79.
80.
81.
82.
83.
84.
85.
112
Booker. D. V., A. C. Chamberlain, D. Newton et al. Uptake of radioactive lead following inhalation and injection. Brit. J. Radial. 42: 457-466 (1969). Bostrom, C. 0. and J. W. Kohl. The February 5. 1965 solar proton event. 1. Tin1e history and spectrums observed at 1,100 kilometres. J. Gee>phys. Res. 72: 4487-4495 (1967). Bouville, A., B. Leroy, D. Guedalia et al. Une methode de mesure du desequi!ibre radioactif dans !'atmosphere entre le radon et ses descendants a vie courte. Aerosol Science 2: 381-387 (1971). Brar, S. S. and D. M. Nelson. Caesium-137 in various Chicago foods in Health and Safety Laboratory fallout program quarterly summary reports for the years 1968 to 1972, passim. Brezik:, Z. 90Sr content in bones in Czechoslovakia in 1964-1967, p. I-3-I-10 in Health and Safety Laboratory fallout program quarterly summary report HASL-237. New York, 1970. Btezik. Z. Values of 90Sr in vertebrre and in femoral diaphysis of adults in Czechoslovakia in 1968. p. I-2-I-8 in Health and Safety Laboratory fallout program quarterly summary report HASL-217. New York, 1970. Btezik. Z. and D. Bfezikova. Values of 90Sr in vertebrre and in femoral diaphysis of adults in Czechoslovakia in 1969. Institute of Radiation Hygiene. Praha (1970); v. United Nations document A/ AC.82/G/L.1319. Btezik, Z. and D. Bfezfkova. The values of the ratio 90Sr in vertebrre/,0Sr in diaphysis in different age groups ( Czechoslovakia, 1969). Institute of Radiation Hygiene. Praha, 1971: v. United Nations document A/ AC.82/G/L.1366. Btezik, Z. and D. Bfezikova. Values of 90Sr in vertebrre and femoral diaphysis of adults in Cze-choslovakia in 1970. Institute of Radiation Hygiene, Praha, 1971; v. United Nations document A/ AC.82/G/L.1367. Brodzinski. R. L., N. A. Wagman and R. W. Perkins. Final activity report to the NASA Ames Research Center, June 15, 1967, through September 1, 1968. Induced Radionuclides in astronauts. United States Atomic Energy Commission report BNWL-5314 (1968). Broecker, W. S. and A. Kaufman. Near-surface and near-bottom radon results for the 1969 North Pacific Geosec station. J. Geophys. Res. 75: 7679-7681 (1970). Broecker. W. S. and T. H. Peng. The vertical distribution of radon in the Bomex area. To be published. Broecker. W., A. Kaufman, T. L. Ku et al. Radium-226 measurements from the 1969 North Pacific Geosec station. J. Geophys. Res. 75: 7682-7685 (1970). Broecker. W. S.. Y. H. Li and J. Cromwell. Radium-226 and radon-222: Concentration in Atlantic and Pacific Oceans. Science 158: 1307-1310 (1967). Bryant. P. M. Methods of estimation of the dispersion of windbome material and data to assist in their application. United Kingdom Atomic Energy Authority report AHSB (RP) R 42. Harwell, Berkshire, 1964.
86.
87.
88.
89.
90.
91.
92.
93.
94.
95.
96.
97.
98.
99.
100.
101.
Bryant. P. M. Data for assessments concerning controlled and accidental releases of 131 I and 137Cs to atmosphere. Health Phys. 17: 51-57 (1969). Bryant, P. M. Derivation of working limits for continuous release rates of 1201 to atmosphere. Health Phys. 19: 611-616 (1970). Bryant. P. M. and F. Morley. Control of nuclear pollution. Presented at the Symposium on Environmental Pollution at the University of Lancaster, July 1971. Published in the proceedings. Bryant, P. M. and F. Morley. Disposal of radioactive waste arising in the United Kingdom from the peaceful uset of atomic energy~ National Radiolocical Protection Board. UK (1971): v. United Nations document A/ AC.82/G/L.1371. Bryant. P. M. and B. F. Warner. The control of radio-iodine release from reprocessing plants. IAEA panel on the control of iodine and other constituents of airborne radioactive wastes. Vienna. 19-23 October 1970. Bundesminister fiir wissenschaftliche Forschung. Umweltradioalctivitat und Strahlenbelastung. Berichte III und N, 1966, Mlinchen. 1966-1967 Berichte L II. III and N, 1967. Mlinchen 1967-1968. Jabresbericht 1968. Mlinchen, 1969. Bundesminister fiir Bildung und Wissenschaft. Umweltradioaktivitat und StrahlenbelastungJahresbericbt 1970-Schriftenreihe Kernsforschung 4. Mlinchen, 1971. Bundesministerium fiir soziale Verwaltung. Radioaktivitatsmessungen in Osterreich 8-Jahresbericht 1967. Wien.~ 1968. Bundesministerium fiir soziale Verwaltung. Radioaktivitatsmessungen in Osterreich 9-J ahresbericht 1968. Wien: 1969. Bundesministerium flir soziale Verwaltung. Radioaktivittitsmessungen in Osterreich-10 J ahresbericht 1969, Wien, 1970. Burton. W. M .. N. G. Stewart. Use of long-lived natural radio-activity as an atmospheric tracer. Nature 186: 584-589 (1960). Cambray, R. S., E. M. Fisher, W. L. Brooks et al. Radio-active fallout in air and rain. Results to the middle of 1966. Atomic Energy Research Establishment report AERE-R-5260. Harwell, Berkshire. 1966. Cambray, R. S., E. M. Fisher, W. L. Brooks et al. Radio-active fallout in air and rain. Results to the middle of 1968. Atomic Energy Research Establishment report AERE-R-5899. Harwell, Berkshire, 1968. Cambray. R. S., E. M. Fisher, W. L. Brooks et al. Radio-active fallout in air and rain. Results to the middle of 1969. Atomic Energy Research Establishment report AERE-R-6212. Harwell, Berkshire, 1969. Cambray. R. S., E. M. Fisher. W. L. Brooks et al. Radio-active fallout in air and rain. Results to the middle of 1970. Atomic Energy Research Establishment report AERE-R-6556. Harwell, Berkshire. 1970. Cambray, R. S., E. M. Fisher, W. L. Brooks et al. Radio-active fallout in air and rain. Results to the middle of 1971. Atomic Energy Research Establishment report AERE-R-6923. Harwell, Berkshire, 1971.
113
102. Cardinale, A., L. Frittelli and G. Lembo. Studies on the natural background radiation in Italy. Health Phys. 20: 285-296 (1971).
103. Carmichael. H. Comments on the absolute ionization of cosmic radiation at balloon altitudes covering four solar maxima. Twelfth Internatiom~l Conference on Cosmic Rays. Paper Mod-67, Hobart, Tasmania, 1971.
104. Caruso. E. Identification of Ac C in the alpha radioactivity in the air. Energia Nucleare 13: 491-492 (1966).
105. Castren, 0. and 0. Paakkola. Radioactivity of Finnish milk in Studies on Environmental Radioactivity in Finland. Sateilyfysiikan laitos, Helsinki, reports SFL-A8 (1967), SFL-A12 (1968) and SFL-A17 (1971).
106. Chamberlain. A. C. Transport of particles across boundary layers. United Kingdom Atomic Energy Authority report AERE-M-1122 (1962). _
107. Chamberlain. A. C. and R. C. Chadwick. Transport of iodine from atmosphere to ground. United Kingdom Atomic Energy Authority Research Group report AERE-R-4870. Harwell, Berkshire, 1965.
108. Chandler, R. P. and D. R. Snavely. Summary of caesium-137 and strontium-90 concentrations reported in certain Alaskan populations and food-stuffs 1961-1966. Radial. Health Data and Reports 7: 675-690 (1966).
109. Chapman. W. H., H. L. Fisher and M. W. Pratt. Concentration factors of chemical elements in edible aquatic organisms. University of California report UCRL-50564 (1968).
110. Chhabra, A. S. Radium-226 in food and man in Bombay and Kerala State (India). Brit. J. Radial. 39: 141-146 (1966).
111. Cigna, A. A. e M. Talenti. La radioattivita naturale di alcune acque minerali italiane. Minerva Nucleare 9: 248-250 (1965).
112. Clarke, R. H. and R. E. Utting. FISP2: The current version of the FISP program for fission product inventories. Central Electricity Generating Board report RD/BIN 1737. Berkeley, 1970.
113. Cochran, J. A.. D. G. Smith, P. J. Magno et al. An investigation of airborne radio-active effluent from an operating nuclear fuel reprocessing plant. United States Department of Health, Education, and Welfare report BRH/NERHL 70-3. Rockville, Maryland, 1970.
114. Coleman, J. R. and R. Liberace. Nuclear power production and estimated Krypton-85 levels. Radial. Health Data and Reports 7: 615-621 (1966).
115. Collins. W. R. · Evidence for penetration of tropospheric debris from tests into the southern hemisphere, p. 200-203 in Health and Safety Laboratory fallout program quarterly summary report HASL-117. New York, 1961.
116. Comar, C. L. Radio-active materials in animals -entry and metabolism, p. 129-157 in Radioactivity and Human Diet (R. S. Russell, ed.). Pergamon Press (1966).
117.
118.
Cornetta. M., G. Toccafondi, 0. Dari et al. Radiation protection experience in Italian nuclear power plants. Vol. 11, p. 91-111 in Peaceful Uses of Atomic Energy. Proceedings of the Fourth International Conference, Geneva, 6-16 September 1971. Published by the United Nations and the International Atomic Energy Agency, 1972.
Comisi6n Nacional de Energfa At6mica. Compilaci6n de los resultados -del monitoraje de Sr-90 y Cs-13 7 debidos al fallout en Ja Republica Argentina. Informe No. RS 34/66. Buenos Aires, 1972.
119. Comitato Nazionale Energia Nucleare. Data on environmental radioactivity collected in Italy. Reports for the years 1966 to 1968.
120. Commission des Communautes Europeennes. Radioactivite ambiante dans les pays de la Communaute. Reports for the years 1967 to 1970.
121. Congress of the United States. Hearings before the Joint Committee on Atomic Energy, First session on environmental effects of producing electric power, October 28. 29, 30, 31; November 4, 5, 6 and 7, 1969. Washington, D.C., 1969.
122. Cooper, W. W., J. N. Beck, T. S. Chen et al. Radio-active strontium and barium fallout. Health Phys. 19: 625-632 (1970).
123. Coulon, R. Unpublished.
124. Coulon, R. et C. Madelmont. Etude comparee chez l'homme du rapport 90Sr/Ca dans l'alimentation et le tissu osseux. Rapport CEA-R-3848. Fontenay-aux-Roses, 1969.
125. Cox, W. M., R. L. Blanchard and B. Kahn. Relation of radon concentration in the atmosphere to total moisture detention in soil and atmospheric thermal stability. chapter 25. p. 436-446 in Radionuclides in the environment. Advances in Chemistry Series 93. American Chemical Society. Washington, D.C., 1970.
126. Crawford, T. V. Diffusion and deposition of the Schooner clouds, p. 381-399 in Proceedings for the Symposium on Engineering with Nuclear Explosives, Las Vegas, Nevada, January 14-16, 1970.
127. Crawford, T. V., K. R. Peterson and J. B. Knox. Prediction of long distance radio-activity and radiation doses to man in 13 hypothetical excavation applications. University of California report UCRL-50936 Rev. 2 (1971).
128. Croall, I. F. Yields from neutron-induced fission. United Kingdom Atomic Energy Authority report AERE-R-5086. ·Harwell, Berkshire, 1967.
129. Crozier, W. D. Direct measurement of radon-220 (thoron) exhalation from the ground. J. Geophys. Res. 74: 4199-4205 (1969).
130. Csongor, E. Investigation of the krypton-85 activity of the atmosphere, Kozlem. 10: 1-7 (1968).
131. Cullen. T. L. Dosimetric measurements in Brazilian regions of high natural radio-activity, in Radiation Protection (Snyder, W. W .. H. H. Abee, L. K. Burton et al., eds.). Pergamon Press. New York, 1968.
114
132. Cullen, T. L. A study of natural radioactivity in Brazil. Nota Cientffica 10-70. Pontificia Universidade Cat6lica do Rio de Janeiro (1970).
133. Danielsen, E. F. Radioactivity transport from stratosphere to troposphere. Mineral industries 33 ( 6) : 1-7 (1964). A publication of the Pennsylvania State University, Pennsylvania.
134. Danielsen, E. F., K. H. Bergman, C. A. Paulson. Radioisotopes, potential temperature and potentia1 vorticity. A study of stratospheric-tropospheric exchange processes. University of Washington, Seattle. 1962.
135. Danielsen, E.. R. Bleck J. Shedlovsky et al. Observed distribution of radioactivity, ozone and potential vorticity associated with tropopause folding. J. Geophys. Res. 75: 2353-2361 (1970).
136. Das Gupta, A. K. Radiation Surveillance in Canada. Department of National Health and Welfare, Canada, quarterly reports RPD 80, 83, 85 (1970): RPD 96 (1971).
137. Deal, L. J.. K. E. Cowser. and A. L. Baietti. News from the United States. Health Phys. 16: 101-104 (1969).
138. De Bortoli, M. and P. Gaglione. SNAP plutonium-238 fallout at Ispra, Italy. Health Phys. 16: 197-204 (1969).
139. De Bartoli, M. and P. Gaglione. Radium-226 in environmental materials and foods, Health Phys. 22: 43-48 (1972).
140. De Bartoli. M., P. Gaglione. A. Malvicini. Plutonium-239 and 238. Strontium-90 and Caesium-137 in surface air from mid-1961 through 1965, p. 361-367 in Radiation Protection (Snyder, W. S.. H. H. Abee. L. K. Burton et al., eds.). Pergamon Press. New York, 1968.
141. De Franceschi, L., A. Gentili. G. Gremigni et al. Tungsten radioisotopes in the atmosphere near Pisa. Italy. Nature 225: 571-573 (1969).
142. Delibrias, G., M-T. Perquis et J. Labeyrie. Mesure de l'activite de l'air due au Krypton-85. Bulletin d'informations scientifiques et techniques du Commissariat a l'energie atomique, No 54. Saclay, 1961.
143. Direktion Energie des Statistischer Arnt der Europaischen Gemeinschakteng. Betriebsergebnisse der Kernkraftwerke in der Europaischen Gemeinschaft 1970. 11it zustazlichen Angaben filr 1963 bis 1970. Atomwirtschaft 7: 377-380 (1971).
144. Dolphin, G. W. Dietary intakes of iodine and thyroid dosimetry. Health Phys. 21: 711-712 (1971 ).
145. Dolphin. G. W., K. P. Duncan. H. J. Dunster et al. Maximum permissible concentrations in air for compounds of Pu-239. United Kingdom Energy Authority report AHSB (RP) R69. Harwell, Berkshire, 1966.
146. Dougall, I. and J. E. Newell. Management of low- and intermediate-level radioactive wastes at the nuclear power stations of the Central Electricity Generating Board. p. 275-295 in Management of Low and Intermediate Level Radioactive Wastes. IAEA publication STI/ PUB/264. Vienna. 1970.
.....
147.
148.
149.
D"Souza, T. J. and K. B. Mistry. Comparative uptake of Thorium-230, Radium-226, Lead-210 and Polonium-210 by plants. Radiation Botany, 10: 293-295 (1970). Duggan. M. J. and D. M. Howell. The measurement of the unattached fraction of airborne RaA. Health Phys. 17: 423-427 (1969).
Dunster, H. J. and B. F. Warner. The disposal of noble gas fission products from the reprocessing of the nuclear fuel. United Kingdom Atomic Energy Authority report AHSB (RP) R I O 1. Harwell. Berkshire, 1970.
150. Durbin. P. W., J. Lynch and S. Murray. Average milk and mineral intakes ( calcium. phosphorus, radium and potassium) of infants in the United States. from 1954 to 1968; implications for estimating annual intakes of radionuclides. Health Phys. 19: 187-222 (1970).
151. Eckert, J. A.,- J. S. Coogan, R. L. Mikkelsen et al. Caesium-137 concentrations in Eskimos, Spring 1968. Radio!. Health Data and Reports 11: 219-225 (1970).
152. Eggleton, A. E. J., D. H. Atkins and L. B. Cousins. Chemical and physical nature of fallout 131 I and carrier-free 131 I released in air. An abstract. Health Phys. 9: 1111 only ( 1963).
153. Ehhalt. D .. K. 0. Miinnich, W. Raether et al. Artificially produced radioactive noble gases in the atmosphere. J. Geophys. Res. 68: 3817-3821 (1963 ).
154. Ehhalt, D .. K. 0. Miinnich. W. Raether et al. Krypton-85 in the atmosphere. Paper No. 541 presented at the Third United Nations International Conference on the Peaceful Uses of Atomic Energy. Geneva, 1965.
155. Eisenbud. M. Review of USA power reactor operating experience, p. 861-876 in Environmental Aspects of Nuclear Power Stations. IAEA publication STI/PUB/261. Vienna, 1971.
156. Eisenbud, M. and M. E. Wrenn. Biological disposition of radioiodine. A review. Health Phys. 9: 1133-1139 (1963).
157. El-Assaly. F. M. and A. A. Alloush. Levels of Caesium-137 in man in U.A.R. during year 1970. U.A.R. Atomic Energy Establishment, Radiation Protection Department report U.A.R.S.C.E.A.R., vol. 12-3 (July 1970).
158. Electricite de France. Compte rendu annuel des controles effectues dans les centrales nucleaires et alentour. Saint-Denis, 1970.
159. Enge, H. A. Introduction to Nuclear Physics. Addison-Wesley. Reading, Mass., 1966.
160. Engelmann, R. J. Calculation of precipitation scavenging of particulates and gases from the atmosphere. Nuclear Safety 7: 354-364 (1966).
161. Engelmann, R. J. et al. Wash-out coefficients for selected gases and particulates. Battelle Memorial Institute report BNWL-SA-657. Richland. Washington, 1966.
162. Engelmann. R. J. and W. G. N. Slinn (eds.). Precipitation scavenging ( 1970), Proceedings of a symposium held at Richland, Washington. June 2-4, 1970. Atomic Energy Commission Symposium Series 22. Oak Ridge. 1970.
115
163. Engstrom, A., R. Bjornerstedt, C. J. Clemendson et al. Bone and radiostrontium. Almquist and Wiksell. Stockholm, 1957.
164. Eriksson, E. Vertical transport and depositions of atmospheric constituents, p. 117-122 in Technical note No. 68, MeteoroloO'ical Aspects of Atmospheric Radioactivity (Bl~eker, W .. ed.). WMO publication No. 619. TP.83. Geneva, 1965.
165. Eriksson. E. An account of the major pulses of tritium and their effects in the atmosphere. Tellus 17: 118-130 (1965).
166.
167.
168.
169.
170.
171.
172.
173.
174.
175.
176.
177.
178.
Ervet, P., M. L. Remy, M. E. Gahinet et al. Recherches comparatives sur la contamination radioactive du milieu marin et des eaux deuces, p. 37-45, Colloque sur la radioecologie marine. Cherbourg, 3-6 decembre 1968.
Fabian, P .. W. F. Libby and C. E. Palmer. Stratospheric residence time and interhemispheric mixing of strontium 90 from fallout in rain. J. Geophys. Res. 73: 3611-3616 (1968).
Fairhall. A. W .. R. W. Buddemeier, I. C. Yang, et al. Radiocarbon in the sea. p. I-35-1-78 in Health and Safety Laboratory fallout program quarterly summary report HASL-242. New York. 1971.
Federal Radiation Council staff report. Guidance for the control of radiation hazards in uranium mining. Report No. 8, revised. Washington, D.C., 1967.
Feicre, Y. Israel Atomic Energy Commission, Sor~q Nuclear Research Centre. Communication.
Ferri, E. S. and H. Christiansen. Lead-210 in tobacco and cigarette smoke. Public Health Reports 82: 828-832 (1967).
Findlayer. J. Interhemispheric transport of air in the lower troposphere over the western Indian Ocean. Quart. J. R. Met. Soc. 95: 400-403 (1969).
Fisenne. I. M. and H. W. Keller. Radium-226 in the diet of two U.S. cities, p. I-2-I-8 in Health and Safety Laboratory fallout program quarterly summary report HASL-224. New York, ·(1970).
Fleming. E. H., Jr. The fission product decay chains (239Pu with fission spectrum neutrons). University of California report UCRL-50243 (1967).
Fleming, E. H. Methodology for computing potential -radiation dose to man from nuclear excavation projects. University of California report UCRL-50990 (1971).
Fleming. E. H. Lawrence Livermore Laboratory. Communication.
Fletcher, W., W. J. Gibbs, J. R. Moroney et al. Strontium-90 in the Australian environment during 1966. Aust. Journal of Science 30: 307-313 (1968).
Fletcher, W .. W. J. Gibbs, J. R. Moroney et al. Strontium-90 in the Australian environment during 1967. Aust. Journal of Science 31: 174-179 (1968).
179.
180.
181.
182.
183.
184.
185.
186.
187.
188.
189.
190.
191.
192.
193.
194.
Fontan, J., A. Birot, D. Blanc et al. Measurement of the diffusion of radon, thoron and their radioactive daughter products in the lower layers of the earth's atmosphere. Tellus 18: 623-632 (1966). Foreman, H., W. Moss, and W. Langham. Plutonium from long-term occupational exposure. Health Phys. 2: 326-333 (1960). Francis, C. W. and G. Chesters. Determination of 210Pb mean residence time in the atmosphere. Environ. Sci. and Technol. 4: 586-589 (1970). Fredriksson, L., R. J. Garner and R. S. Russell. Caesium-13 7, chapter 15 in Radioactivity and Human Diet, (R. S. Russell, ed.). Pergamon Press. 1966. Freeman. J. W., J. A. Van Allen and L. J. Cahill. Explorer 12 observations of the magnetospheric boundary and the associated solar plasoa on September 13, 1961. J. Geophys. Res. 68: 2121-2130 (1963). Freke. A. M. A model for the approximate calculation of safe rates of discharge of radioactive wastes into marine environments. Health Phvs. 13: 743-758 (1967). . Fuller. E. W. and N. T. Clarke. The radiological dose to the SST Concorde from galactic cosmic rays. United Kingdom Atomic Energy Authority, A WRE report No. 064/68. Aldermaston. Berkshire, 1968. Gahinet, M. E., M. L. Remy, J. P. Moroni, et al. Etude de la radioactivite du regime alimentaire total au niveau des etablissements scolaires, p. 357-372 in Environmental Contamination by Radioactive Materials. IAEA publication STJ/PUB/226. Vienna, 1969. Gale. H. J., D. L. 0. Humphreys and E. M. R. Fisher. Weathering of caesium-137 in soil. Nature 201: 257-261 (1964). Gamertsfelder, C. C. Regulatory experience and projections for future design criteria. Paper presented at the Southern Conference on Environmental Radiation Protection at Nuclear Power Plants. St. Petersburg Beach, Florida. 1971. Garner. R. J. and R. S. Russell. Isotopes of iodine. p. 297-315 in Radioactivity and Human Diet, (R. S. Russell, ed.). Pergamon Press. 1966. George. A. and A. J. Breslin. Deposition of radon daughters in human exposed to uranium mine atmospheres. Health Phys. 17: 115-124 (1969). George. M. J. The altitude dependence of the quiet time cosmic-ray ionization over the polar regions at solar minimum. J. Geophys. Res. 75: 3154-3158 (1970). Georee. M. J. New data on the absolute cosm:cray ionization in the lower atmosphere. J. Geophys. Res. 75: 3693-3705 (1970). Geyh. M. und S. Lorch. Messung der terrestrischen Komponente der natlirlichen y-Umgebungsstrahlung in der Bundesrepublik Deutschland. Niedersachsischcs Landesamt ftir Bodenforschung Hannover, Forschungsbericht K 66-42 (1966). Gibbs, W. J., W. K. Matthews. J. R. Moroney, et al. Strontium-90 in the Australian environment during 1968. Aust. Journal of Science 32: 238-244 (1969).
116
195. Gibson, J. A. B., J.E. Richards and J. Docherty. Nuclear radiation in the environment-beta and gamma-ray dose rates and air ionizations from 1951-1968. J. Atmospheric Terrest. Phys. 31: 1183-1196 (1969).
196. Gifford. F. A., Jr. and D. H. Pack. Surface deposition of airborne material. Nuclear Safety 3: 76-80 (1962).
197. Ginzburg, V. L. and S. I. Syrovatskii. The origin of cosmic rays. Pergamon Press ( 1964).
198. Glasstone, S. Public Safety and Underground Nuclear Detonations. United States Atomic Energy Commission publication TID-25708. Oak Ridge. 1971. ~ .
199. Glasstone. S. and A. Seasonske. Nuclear reactor engineering. D. Van Nostrand Company, Inc., 1963.
200. Globel, B .. H. Muth und E. Oberhausen. Aufnahme und Ausscheidung der natlirlichen Radionuklide 210Pb und 210Po durch den Menschen. Strahlentherapie 133: 218-226 (1966).
201. Godfrey. B. E. and J. Vennart. Measurements of caesium-137 in human beings in 1958-1967. Nature 218: 741-746 (1968).
202. Gold. R. Energy spectrum of fast cosmic-ray neutrons near sea level. Physical Review 165: 1406-1411 (1968).
203. Gold. S .. H. W. Barkhau. B. Schleien et al. Measurement of naturally occurring radionuclides in air. chapter 22. p. 369-382 in The Natural Radiation Environment ( Adams. J. A. S.. W. M. Lo:vder, eds.). The University of Chicago Press, Clucago; Ill.. 1964.
204. Gopal-Ayengar, A. R.. K. Sundaram, K. B. Mistry, et al. Studies in the high background ureas in Kerala State: definition of the population and preliminary dosimetric data. Health Physics Division report, Bhabha Atomic Research Centre (1970); v. United Nations document A/ AC.82/G/L.1343.
205. Gopal-Ayengar, A. R., K. Sundaram, K. B. Mistry et al. Evaluation of the long-term effects of high background radiation on selected population groups of the Kerala Coast. Vol. 11, p. 31-51 in Peaceful Uses of Atomic Energv. Proceedings of the Fourth International Coi'iference, Geneva, 6-16 September 1971. Published by the United Nations and the International Atomic Energy Agency. 1972.
206. Gormley. P. G. and M. Kennedy. Diffusion from a stream flowing through a cylindrical tube. Proc. Royal Irish Acad. 52: 163-169 (1948).
207. Greenhill. J. G, A. G. Fenton and K. B. Fenton. Solar cycle variations in the polar atmospheric neutron flux at balloon altitudes. Paper MOD-62, p. 758-763 in vol. 2 of the conference papers of the Twelfth International Conference on Cosmic Rays. Hobart, Australia, 1971.
208. Grey, D. C. Geophysical mechanisms for 14C variations. J. Geophys. Res. 74: 6333-6340 (1969).
209. Groseclose, B. C. Nuclear explosive development, p. 24-28 in Proceedings for the Symposium on Engineering with Nuclear Explosives, Las Vegas. Nevada, January 14-16. 1970.

210.
211.
212.
213.
214.
215.
216.
217.
218.
219.
220.
221.
222.
223.
Groves, R. H. Status of the interoceanic canal study, p. 280-293 in Proceedings for the Sym-posium on Engineering with Nuclear Explosives, Las Vegas, Nevada, January 14-16, 1970. Grueter. H. Radioactive fission product 137Cs in mushrooms in W. Germany during 1963-1970. Health Phys. 20: 655-656 (1971). Guedalia. D., J. L. Laurent. J. Fontan et al. A study of radon-220 emanation from soils. J. Geophys. Res. 7 5: 3 57-3 69 ( 1970). Gustafson. P F.. Comments on radionuclides in aquatic e~osystems, p. 853-858 in Radio-ecological Concentration Processes (Aben!. B. and F. P. Hungate. eds.). Pergamon Press. 1967. Gustafson. P. F .. 137Cs in the U.S. diet 1961-1968 and the influence of climatic and aErricultural factors. p. 135-143 in Environmental-Contamination by Radioactive Materials. IAEA publication STI/PUB/226. Vienna. 1969. Gustafson. P. F. and S. S. Brar. Gamma-ray doses from short-lived fission products from nuclear weapon tests. Health Phys. 9: 629-634 (1963). Gustafson. P. F .. D. M. Nelson and S. S. Brar. Possible evidence of radio-activity from southern hemisphere nuclear tests in surface air over the Central United States, p. I-75-I-77 in Health and Safety Laboratory fallout program quarterly summary report HASL-204. New York, 1969. Gustafsson, M. External and internal irradiation of Swedish reindeer breeders 1950-1970. Health Phys. 17: 19-34 (1969). Hagberg, N .. Halten av cesium-137 i mejerimjolk 1970. Intern basrapport, SSI: 1971-005 in Arsrapport 1970. speciallaboratorierna. Statens stralskyddsinstitut, rapport SST: 1971-013 (maj 1971). Hajnal, F .. J. E. McLaughlin, M. S. Weinstein et al. 1970 sea-level cosmic-ray neutron measure-ments. United States Atomic Energy Commission report HASL-241. New York. 1971. Hallden, N. A. and J. H. Harley. Radium-226 in diet and human bone from San Juan, Puerto Rico. Nature. 204: 240-241 (1964). Hamburger. R. Statements on national programs: United States of America, p. 27-45 in Peaceful Nuclear Explosions-Proceedings of a panel, Vienna. 2-6 March 1970. IAEA publication STI/PUB/273. Vienna, 1970. Hamilton. E. I. The concentration of uranium in air from contrasted natural environments. Health Phys. 19: 511-520 (1970). Hamilton, E. I. The concentration and distribution of uranium in human skeletal tissues. Cale. Tiss. Res. 7: 150-162 (1971).
224. Hamilton. E. I. The concentration of uranium in man and his diet. Health Phys. 22: 149-153 (1972).
225. Hansen, R. 0. and P. R. Stout. Isotropic distribution of uranium and thorium in soils. Soil Science 105: 44-50 (1968).
226. Haque. A. K. M. M. and A. J. L. Collinson. Radiation dose to the respiratory system due to radon and its daughter products. Health Phys. 13: 431-443 (1967).
227. Haque. A. K. M. M .. A. J. L. Collinson and C. 0. S. Blyth Brooke. Radon concentration in different environments and the factors influencing it. Phys. Med. Biol. 10: 505-514 (1965).
117
228. Hardy, E. 80Sr fallout from atmospheric nuclear testing. p. I-81-I-93 in Health and Safety Laboratory fallout program quarterly summary report HASL-227. New York (1970).
229. Hardy, E. Strontium 90 in human bone-1969 results-p. II-10-II-15 in Health and Safety Laboratory fallout program quarterly summary report HASL-227. New York. 1970.
230. Hardy, E. 00sr and 89Sr in monthly deposition at world land sites, appendix A in Health and Safety Laboratory fallout program quarterly summary report HASL-249. New York. 1972.
231. Hardy. E. Radiostrontium deposition at Atlantic Ocean weather stations. Appendix B in Health and Safety Laboratory fallout program quarterly summary report HASL-249. New York, 1972.
232. Hardy. E. Radiostrontium in milk and tap water. Appendix D in Health and Safety Laboratory fallout program quarterly summary report HASL-249. New York, 1972.
233. Harley, J. H. Possible plutonium-238 distribution from a satellite failure, p. I-38-I-42 in Health and Safety Laboratory fallout program quarterly summary report HASL-149. New York. 1964.
234. Harley, J. H. UNSCEAR-WHO bone program, p. II-4-II-7 in Health and Safety Laboratory fallout program quarterly summary report HASL-245. New York, 1971.
235. Harley. J. H. Worldwide plutonium fallout from weapons tests, p. 13-19 in Proceedings of Environmental Plutonium Symposium. Held at LASL. August 4 and 5. 1971. Los Alamos Scientific Laboratory publication LA-4756 (1971).
236. Harley, J. H. United States Atomic Energy Commission. Communication.
237. Harley, J. H. and W. M. Lowder. Natural radioacfaity and radiation, p. I-3-I-23 in Health and Safety Laboratory fallout program quarterly summary report HASL-242. New York, 1971.
238. Harley. N. H. Spatial distribution of alpha dose based on experimental energy absorption measurements. Ph.D. Thesis, New York University, 1971.
239. Harley. N. H. and B. S. Pasternack. Experimental absorption applied to lung dose from thoron daughters. Health Physics (in press).
240. Haymes, C. Fast neutrons in the earth's atmosphere. J. Geophys. Res. 69: 841-852 (1964).
241. Hendrickson. M. M. The dose from 85Kr released to the earth's atmosphere. p. 237-246 in Environmental Aspects of Nuclear Power Stations. IAEA publication STI/PUB/261. Vienna, 1971.
242. Hesp, R. and R. M. Ledgerwood. Uptake of 1s,cs. due to nuclear weapon fallout, in subjec!-5 from West Cumberland. United Kingdom Atomic Energy Authority report 984 (W). Windscale, 1970.
243.
244.
245.
Hess. W. N., E. H. Canfield and R. E. Lingenfelter. Cosmic-ray neutron demography, J. Geophys. Res. 66: 665-677 (1961).
Hess. W. N .. H. W. Patterson. R. Wallace et al. Cosmic-ray neutron energy spectrum. Phys. Rev. 116: 445-457 (1959).
Hickey, J. L. S. and S. D. Campbell. High radium-226 concentrations in public water supplies. Public Health Reports 83: 5 51-557 (1968).
246. Hill, C. R. Polonium-210 in man. Nature 208: 423-428 (1965).
247. Hill. C.R. Routes of uptake of 210Po into human tissues. p. 297-302 in Radioecological Concentration Processes (Abcrg, B. and F. P. Hungate, eds.). Pergamon Press, 1967.
248. Hoang Chi Trach. Study of the fall-out of artificial 55Fe. Application to the evaluation of the fall-out of natural iron of stratospheric origin. Rapport CEA-R-3918. Saclay, 1970.
249. Holtzman, R. B. Measurement of the natural contents of Ra D (210Pb) and Ra F (21DPo) in human bone-estimates of whole-body burdens. Health Phys. 9: 3 85-400 (1963).
250. Holtzman. R. B. and F. H. Ilcewicz. Lead-210 and polonium-210 in tissues of cigarette smokers. Science 153: 1259-1260 (1966).
251. Holzer, F. Summary of results of underground engineering experience, p. 133-159 in Proceedings for the Symposium on Public Health Aspects of Peaceful Uses of Nuclear Explosives. Las Vegas, Nevada, April 7-11, 1969.
252. Holzer, F. Gasbuggy in perspective, p. 662-697 in Proceedings for the Symposium on Engineering with Nuclear Explosives. Las Vegas, Nevada, January 14-16, 1970.
253. Howells, H. Discharges of low-activity radioactive effluent from the Windscale Works into the Irish Sea, p. 7 69-785 in Disposal of Radioactive Wastes into Seas, Oceans and Surface Waters. IAEA publication STI/PUB/126. Vienna, 1966.
254. Huber, 0., J. Halter et P. Winiger. Quatorzieme rapport de la Commission federale de la radioactivite pour I'annee 1970, a }'intention du Conseil federal. Bulletin du Service federal de !'hygiene publique, supplement B. No. 5/1971. Fribourg, 1971.
255. Hultqvist. B. Studies on naturally occurring ionizing radiations. Kgl. Svenska Vetenskaps. Hand]. Vol. 6, Ser. 4, No. 3 (1956).
256. Hunt. V. R., E. P. Radford, Jr., and A. Segall. Naturally occurring concentrations of alphaemitting isotopes in a New England population. Health Phys. 19: 235-243 (1970).
257. Hursh, J. B. and Mercer, T. T. Measurement of :)12Pb loss rate from human lungs. Journal of Applied Physiology 28: 268-274- (1970).
258. Hursh. J. B., A. Schraub, E. L. Sattler et al. Fate of ~12Pb inhaled by human subjects. Health Phys. 16: 257-267 (1969).
118
259.
260.
Hvinden, T .. A. Aarkrog, 0. Castren et al. The fall-out situation in Denmark, Finland, Norway and Sweden in 1965-1966. Report from a meeting of Scandinavian experts on radiation protection. Helsinki (May 11-12, 1967). National Institute of Radiation Protection, Stock-holm. report SSI: 1967-035 (Aug. 1967).
Hvinden, T. and A. Lillegraven. Cesium-137 and strontium-90 in Norwegian milk 1960-1969. Norwegian Defense Research Establishment report F-539 (1970).
261. International Atomic Energy Agency. Safety Series No. 5. Radioactive waste disposal into the sea. IAEA publication STI/PUB/14. Vienna, 1961.
262. International Atomic Energy Agency. Safety Series No. 28. Management of radioactive wastes at nuc1ear power ~plants. IAEA publication STI/PUB/208, Vienna, 1968.
263. International Atomic Energy Agency. Power and research reactors in Member States, May 1969, May 1970 and 1971 editions. IAEA publications STI/PUB/194/1, 3 and 4. Vienna 1969, 1970 and 1971.
264. International Atomic Energy Agency. Power and research reactors in Member States. 1971 edition. IAEA publication STI/PUB/194/4. Vienna, 1971.
265. International Civil Aviation Organization. Traffic 1960-1970, Digest of statistics No. 159 (1971).
266.
267.
268.
269.
270.
271.
272.
International Commission on Radiological Protection. Report of ICRP Committee II on permissible dose for internal radiation (1959), with bibliography for biological, mathematical and physical data. Health Phys. 3: 1-380 (1960).
International Commission on Radiological Protection. Task Group on the Biological Effects of High-Energy Radiations, Radiobiological aspects of the supersonic transport. Health Phys. 12: 209-226 (1966).
International Commission on Radiological Protection. Task Group on Lung Dynamics, Deposition and retention models for internal dosimetry of the human respiratory tract. Health Phys. 12: 173-207 (1966).
International Commission on Radiological Protection. A review of the radio-sensitivity of the tissues in bone. ICRP Publication 11. Pergamon Press. 1968. International Commission on Radiological Units. Physical aspects of irradiation. Recommendation of the International Commission on Radiological Units and Measurements. United States Department of Commerce. National Bureau of Standards, Handbook 85 ( 1964) .
Interoceanic canal studies-1970, volume IV of annex V-Study of engineering feasibility. Prepared by U.S. Army Engineer Nuclear Cratering Group. Livermore, California, 1970.
Iranzo, E. First results from the programme of action following the Palomares accident. p. 446-455 in Radiological protection of the public in a nuclear mass disaster. Interlaken, Switzerland. 26 May-I June 1968.
273. Iranzo, E. and S. Salvador. Inhalation risks to people living near a contaminated area. Paper presented at the Second International Congress of the International Radiation Protection Association, Brighton, England, 3-8 May 1970.
274. Irving, D. C .. R. G. Alsmiller and H. S. Moran. Tissue current-to-dose conversion factors for neutrons with energies from 0.5 to 60 MeV. United States Atomic Energy Commission report ORl\TL-4032. Oak Ridge, 1967.
275. Israel, G. W. Meteorological influence on the thoron (Rn2~0) content of the atmosphere. Tellus 18: 633-637 (1966).
276. Israel, H. and G. W. Israel. A new method of continuous measurements of radon (Rn~2~) and thoron (Rn2::0 ) in the atmosphere. Tellus, 18: 557-561 (1966).
277. Israel, H., M. Herbert and C. de la Riva. Measurements of the thoron concentration of the lower atmosphere in relation to the exchange ("austausch'') in this region. Final tech. report. U.S. Army Contract DAJA 37-67-C-0593 (1968).
278. Izrael. Yu. A. Radioactivity in contained underground nuclear explosions. p. 231-240 in Peaceful Nuclear Explosions. Proceedings of a Panel. Vienna. 2-6 March 1970. IAEA publication STI/PUB/273. Vienna, 1970.
279. Izrael. Yu. A. and V. N. Petrov. Spread of underground-nuclear-explosion radioactive products over long distances. p. 130-141 in Nuclear explosions for peaceful purposes. A collection of articles edited by I. D. Morokhov. Atomizdat. Moscow 1970. United States Atomic Energy Commission translation report No. UCRLTRAJ.~S-10517 (1971).
280. J aakkola, T. Analysis of 55Fe produced by nuclear tests and its enrichment in Finnish Lapps. Paper No. 20 in Radioactive Foodchains in the Subarctic Environment. Annual Report for the period Aug. 15, 1968-Aug. 14. 1969. Department of Radio-chemistry, University of Helsinki, Finland.
281. Jaakkola. T. and P. Kauranen. Environmental -y-radiation dose rate in Finnish Lappland and southern Finland. Presented at the Second International Congress of the International Radiation Protection Association. Brighton, England. May 3-8, 1970.
282. Jacobi, W. The dose to the human respiratory tract by inhalation of short 1ived 22~Rn and 220Rn decay products. Health Phys. 10: 1163-1174 (1964).
283. Jacobi, W. and D. Martin. Diffusion deposition of inhaled particles in the upper bronchial tree. Presented at the Second International Congress of the International Radiation Protection Association. Brighton, England. May 3-8, 1970.
284. Jacobs, D. G. Sources of tritium and its behavior upon release to the environment. United States Atomic Energy Commission publication TID-24635. Oak Ridge, 1968.
119
285. Jacobs. D. G., C. J. Barton, C.R. Bowman et al. Theoretical evaluation of consumer products from project Gasbuggy. Final report, phase I: Impact of hypothetical releases of contaminated gas in the San Juan basin. Oak Ridge National Laboratory report ORNL-4646 (1971).
286. Jacobs, D. G., E. G. Struxness and C. R. Bowman. A preliminary assessment of the radiological implications of commercial utilization of natural gas from a nuclearly stimulated well, p. 8 31-849 in Proceedings of the Symposium on Engineering with Nuclear Explosives, Las Vegas, Nevada, January 14-16, 1970.
287. Jamieson, H. D., C. G. H. Tripp and F. L. Sanderson. Environmental ionizing radiation in Dunedin, New Zealand. N.Z.J. Sci. 9: 674-683 (1966).
288. Jaworowski, Z. Stable and radioactive lead in environment and human body. Nuclear Energy Center Review report No. 29, Warsaw, 1967.
289. Jaworowski, Z. Radioactive lead in the environment and in the human body. Atomic Energy Review, 7: 3-45 (1969).
290. Jaworowski, Z .. J. Bilkiewica and W. Kostanecki. Hair as a medium for detection of radiopoisoning, p. 637-645 in Actes du Congres international sur la radioprotection du milieu devant le developpement des utilisations pacifiques de l'energie nucleaire. Societe Fran9aise de Radioprotection. Paris, 1968.
291. Jaworowski. Z., J. Bilkiewica and E. Zylicz. Radium-226 in contemporary and fossil snow. Health Phys. 20: 449-450 (1971).
292. Jeanmaire. L. et F. Patti. Teneur en strontium-90 d'os humains preleves en 1967, 1968, 1969 et 1970. Centre d'etudes nucleaires de Fontenay-aux-Roses. Rapports CEA-R-3681 (1969), CEA-N-1299 (1970), CEA-N-1428 1971), sous presse (1972}.
293. Jenkins, C. E. Radionuclide distribution in Pacific salmon. Health Phys. 17: 507-512 (1969).
294. Jenkins, R. W., J. A. Lockwood, S. 0. Ifedili et al. Latitude and altitude dependence of the cosmic ray albedo neutron flux. J. Geophys. Res. 75: 4197-4204 (1970).
295. Johns, H. E. and J. R. Cunningham. The physics of radiology. Charles C. Thomas, Springfield, Illinois, 1969.
296. Johnson, W. and C. L. Nayfield. Elevated levels of Caesium-137 in common mushrooms (Agaricaceae) with possible relationship to high levels of Caesium-137 in whitetail deer, 1968-1969. Radial. Health Data and Reports 11: 527-531 (1970).
297. Jones. A. R., Proposed calibration factors for various, dosimeters at different energies. Health Phys. 12: 663-671 (1966).
298. Joshi, L. U. and T. N. Mahadevan. Seasonal variations of radium-D in ground level in India. Health Phys. 15: 67-71 (1968).
299. Joshi. L. U., C. Rangarajan and Smt. Sarada Gopalskrishnan. Measurement of lead-210 in surface air and precipitation. Tellus, 21: 107-112 (1969).
300.
301.
302.
303.
304.
305.
306.
307.
308.
309.
310.
311.
312.
313.
Junge, C. E. Studies of global exchange. pr_ocesses in the atmosphere by natural and arttfictal tracers. J. Geophys. Res. 68: 3849-3856 (1963).
Junge, C. E. Air chemistry and radioactivity. Academic Press, New York. 1963.
Kahlos, H., Radon-222 concentration of some water samples determined ~ith gammasp~ctFo-metric measurements. Institute of Rad1atton Physics report SFL-A14. Helsinki, 1969.
Kahn. B .. R. L. Blanchard, H. E. Kolde et al. Radiolocical surveillance studies at a pressurized water nuclear power reactor. U.S. Envir?~ent~l Protection Agency report RD 71-1. Cmcmnati, Ohio, 1971. Kahn, B., R. L. Blanchard, H. L. ~i~ger et al. Radiological surveillance at a boilmg water nuclear power reactor. U.S. Department of Health. Education. and Welfare report BRH/ DER 70-1. Rock-ville, Maryland, 1970.
Kahn. B., R. L. Blanchard, H. L. Krieger et al. Radiological surveillance studies at a boiling water nuclear power station, p. 535-548 in Environmental Aspects of Nuclear Po'Yer Stations, IAEA publication STI/PUB/261. Vtenna, 1971.
Kahn, B., B. Sbleien and C. Weaver. Environmental experience with radioactive effluents f:9m operating nuclear power plants. yoI. 11. p. :>)9-573 in Peaceful Uses of Atomic Energy. Proceedings of the Fourth International Conference, Geneva, 6-16 September 1971. Pu~lished by tl~e United Nations and the International Atomic Energy Agency, 1972. Kalkstein, M. I. Rhodium-102 high altitude tracer experiment. Science 13 7: 645-652 (1962). Kalkstein, M. I. Movement of material fr?m high altitude deduced from tracer observations. J. Geophys. Res. 68: 3835-3839 (1963).
Karnath. P. R., I. S. Bhat. A. A. Khan et al. Pre-operational search for baseline radioactivity, critical food and population group at the Tarap~r Atomic Power Station site, p. 1111-1125 m Radiation Protection (Snyder, W. S., H. H. Abee. L. K. Burton et al., eds.). Pergamon Press, New York. 1968. Kane, S. R., J. R. Winkler and R. L. Arnoldy. Studies of primary cosmic rays with ionization chambers. in Proceedings of the Ninth International Conference on Cosmic Rays. p. 157-164, vol. 1, The Institute of Physics and the Physical Society. London, 1966.
Karniewicz. W. Caesium-137 in population of Lodz (Poland) in 1963 and 1964. Nukleonika 10: 35-49 (1965). Karol, I. L. Calculation of planetary distributions of radon and its long-lived daughter concentra-tions in the troposphere and lower stratosphere. Tellus 22: 219-227 (1970). Karol. I. L. Numerical model of the global transport of radioactive tracers from the instantaneous sources in the lower stratosphere. J. Geophys. Res. 75: 3589-3608 (1970).
314. Kastner. J.. B. G. Oltman. Y. Feige, et al. Nuclear radiation detection for the natural environment, p. 144-150 of IEEE Transactions Nuc. Science, NS-17 (l 970).
120
315. Kaufman. A. The 23~Th concentration of surface ocean water. Geochimica et Cosmochimica Acta 33: 717-724 (1969).
316. Kaufman, S. and W. F. Libby. The natural distribution of tritium. Phys. Rev. 93: 1337-1344 (1954).
317. Kauranen, P. and J. K. Miettinen. 210Po and 21°pb in the Arctic food chain and the natural radiation exposure of Lapps. Health Phys. 16: 287-295 (1969).
318. Kauranen, P. and J. K. Miettinen. 210Pb and 210Po in some aqueous ecosystems and food chains. Paper No. 39 in Radioactive Foodchains in the Subarctic Environment. Technical progress report NY0-3446-15 for the period Aug. 15, 1970-Aug. 14. 1971. Helsinki. 1971.
319. Kauranen. P., A. Kulmala and R. Mattsson. Fission products of unusual composition in Finland. Nature 216: 238-241 (1967).
320. Kauranen. P .. J. K. Miettinen and E. Pulliainen. Polonium-210 and lead-210 in some terrestrial animals in Finland. Ann. Zool. Fennici, 8: 318-323 (1971).
321. Kedrovskii, 0. L., I. Ya. Ivanov, K. V. Myasnikov et al. Industrial uses of underground nuclear explosions, p. 3-69 in Nuclear explosions for peaceful purposes. A collection of articles edited by I. D. Morokhov. Atomizdat. Moscow. 1970. United States Atomic Energy Commission translation report UCRL-Trans-10517 ( 1971).
322. Kelly. J. S. The future of Plowshare. p. 5-12 in Proceedings for the Symposium on Engineering with Nuclear Explosives, Las Vegas, Nevada, January 14-16, 1970.
323. Kenny, A. W. and M. T. Mitchell. United Kingdom waste-management policy, p. 69-90 in Management of Low- and Intermediate-Level Radioactive Wastes. IAEA publication STI/ PUB/264. Vienna, 1970.
324. Kent. C. E., S. Levy and J. M. Smith. Effluent control for boiling water reactors, p. 339-357 in Environmental Aspects of Nuclear Power Stations. IAEA publication STI/PUB/261. Vienna, 1971.
325. Kent, R. A. R. Cosmic-ray neutron measurement. United States Atomic Energy Commission report HW-SA-2870 (1963).
326. Khandekar, R. N. and S. J. S. Anand. Measurement of lead-210 (RaD) in the human bone at Bombay, India. Health Phys. 20: 83-85 (1971).
327. Kigoshi, K. Natural concentration of krypton-85, carbon-14 and tritium in recent years, 1961; v. United Nations document A/ AC.82/G/L.693.
328. Kirchmann. R.. R. Boulenger et A. La Fontaine. Absorption du 226Ra par Jes plantes cultivees, p. 1045-1051 in Radiation Protection (Snyder. W. S .. H. H. Abee. L. K. Burton et al., eds.). Pergamon Press. New York. 1968.
329. Kleinman, M. T. The stratospheric inventory of Pu-238, p. I-84-1-102 in Health and Safety Laboratory fallout program quarterly summary report HASL-245. New York. 1971.
330. Knox. J. B. Water quality in flooded craters produced by nuclear excavation. Lawrence Radiation Laboratory, Livermore report UCID 4741 (1964).

331.
332.
333.
334.
335.
336.
337.
338.
339.
340.
341.
342.
343.
344.
345.
Knox, J. B. and R. Rohrer. Project Pre-Buggy: base surge analysis. Lawrence Radiation Laboratory. Livermore report PNE-304 ( 1963). Knox. J. B., T. V. Crawford, K. R. Peterson et al. Comparison of U.S. and U.S.S.R. methods of calculating the transport. diffusion. and deposition of radioactivity. University of California report UCRL-51054 (1971). Knox, J.B .. H. A. Tewes. T. V. Crawford et al. Radioactivity released from underground nuclear detonations: source transport. diffusion and deposition. University of California report UCRL-50230, Rev. 1 (1970). Kolehmainen. S .• E. Hasanen and J. K. Miettinen. 137Cs in fish, plankton and plants in Finnish lakes during 1964-65. p. 913-919 in Radioecological Concentration Processes (Abeni. B. and F. P. Hungate, eds.). Pergamon Press,~1967. Korea. Republic of. Data for the effects of atomic radiation. Office of Atomic Energy. Communication. Koyama. S .. T. Sotobayashi and T. Suzuki. Highly fractionated nuclear debris resulting from the venting of a Soviet underground nuclear test. Nature 209: 239-240 (1966). Krey. P. W. and B. Krajewski. HASL model of atmospheric transport. United States Atomic Energy Commission report HASL-215. New York, 1969. Krey, P. W. and B. Krajewski. Comparison of atmospheric transport model calculations with observations of radioactive debris. J. Geophys. Res. 75: 2901-2908 (1970). Krey, P. W. and B. Krajewski. Tropospheric scavenging of 90Sr and 3H. p. 447-46~ in Precipitation Scavenging (1970). Procecdillgs of a Symposium held at Richland. Washington, June 2-4, 1970. Atomic Energy Commission Symposium Series 22. Oak Ridge, 1970. Krey. P. W. and B. T. Krajewski. Updating stratospheric inventories to February 1971, p. I-103-I-124 in Health and Safety Laboratory fallout program quarterly summary report HASL-245. New York, 1971. Krey. P. W. and B. T. Krajewski. Sr-90, Zr-95 and Pu-238 stratospheric inventories 1969-1971. To be published in Health and Safety Laboratory fallout program quarterly summary report HASL-257. New York, 1972 (in press). Krey, P. W .. D. Bogen and E. French. Plutonium in man and his environment. Nature 195: 263-267 (1962). Krey, P. W., M. Kleinman and B. Krajewski. 90Sr stratospheric inventories 1967-1968, p. I-45-I-75 in Health and Safety Laboratory fallout program quarterly summary report HASL-210. New York. 1969. Krey P. W., M. T. Kleinman and B. T. Kr~jewski. Sr-90, Zr-95 and Pu-238 str~tosphenc inventories 1967-1969. p. I-39-I-69, m Health and Safety Laboratory fallout program quarterly summary report HASL-227. New York. 1970. Krieger, H. L.. S. Gold and B. Kahn. Tritium releases from nuclear power stations. Presented at the Tritium Symposium, Las Vegas, Nevada. August 30-September 2, 1971.
121
346.
347.
348.
349.
350.
351.
352.
353.
354.
355.
356.
357.
358.
359.
360.
Kruger, P .. A. ?vliller and C. L. Hosler. Meteorological evaluation of radio-active fall-out. Semiannual report-United States Atomic Energy Commission report TID-17 518 (1962). -Lagerquist. C. R.. D. L. Bakowski, S. E. Hammond et al. Plutonium content of several internal organs following occupational exposure. .A..mer. Ind. Hyg. Assoc. J. 30: 417-421 (1969). Lal. D. and H. E. Suess. The radioactivitv of the atmosphere and hydrosphere. p. 407-434 in Annual Review of Nuclear Science-Vo!. 18 (Segre. E., ed.), Annual Reviews. Inc., 1968. Lambert. G. Etude du comportement des aerosols radioactifs artificiels. Application a quelques problemes de circulation atmospherique. Rapport du Commissariat a renergie atomique, CEA-R-2347. Saclay, 1963. Landahl. H. D. Particle removal by the respiratory system. Note on the removal of airborne particulates by the human respiratory tract with particular reference to the role of diffusion. Bull. Math. Biophys. 25: 29-39 (1963). Langford. J. C. and C. E. Jenkins. Iron-55 in the human population of the world, p. 28-30 in Pacific Northwest Laboratory Annual report for 1969 to the USAEC Division of Biology and Medicine. Report BNWL-1307, Part 2 (1970) . Langford, J.C. and C. E. Jenkins. The latitudinal variations of 55Fe in man and cattle. Health Phys. 21: 71-77 (1971). Langham. W. H. Technical and laboratory support. p. 36-41, in Project Crested Ice. A joint Danish-American report on the crash near Thule air base on 21 January 1968 of a B-52 bomber carrying nuclear weapons. Riso report 213 (1970). Langham. W. H. Plutonium distribution as a problem in environmental science, p. 3-11, in Proceedin!!s of Environmental Plutonium Symposium. held at Los Alamos Scientific Laboratory, August 4 and 5, 1971. LASL report LA-4756 (1971). Langham, W. H., J. N. P. Lawrence, J. McCielland et al. The Los Alamos Scientific Laboratory's experience with plutonium in man. Health Phys. 8: 753-760 (1962). Leipunskii. 0. I., J. E. Kon~tantinov .. G .. A Fedorov et al. Mean residence time of radioactive aerosols in the upper layers of the atmosphere based on fallout of high-altitude tracers. J. Geophys. Res. 75: 3569-3574 (1970). Lentsch. J. W., M. E. Wrenn, T. J. Kneip et al. Man-made radionuclides in the Hudson River estuary, p. 499-528 in Proceeding~ of the He~th Physics Society Fifth Annual Midyear Topical Symposium. Idaho Falls, 1971. Lessler, R. M., J. B. Green, Jr., and F .. H~lzer. Tritium production in Plowshare. applications. University of California report UCRL 73170 Rev. 1 (1971 ). Libby. W. F. Radioactive fall-out. Proc. Nat. Acad. Sci., U.S. 44: 800-820 (1958). Liboff. A. R. and M. H. Shames. Uitra-Jow levels of terrestrial ionization. Nature 217: 629-631 (1968).
361.
362.
363.
364.
365.
366.
367.
368.
369.
370.
371.
372.
373.
374.
375.
376.
Light, E. S., M. Merker, S. A. Korff et al. Sol~ modulation of atmospheric neutron flux. expenment and calculation. Paper MOD-107, p. 903-908 in vol. 3 of the conference papers of the 12th International Conference on Cosmic Rays. Hobart, Australia, 1971. Lindeken. C. L. Seasonal variations in the concentration of airborne radon and thoron daughters, p. 41-43 in Hazards Control progress report No. 25 (April-August 1966). University of California report UCRL-50007-66-1 (1966). Lindell, B. An approach to the question of computing doses and effects from fall-out. Health Phys. 2: 341-365 (1960). Lindell, B. Ingested radon as a source of human radiation exposure, p. 719-725 in Radiatio;1 Protection (Snyder, W. S., H. H. Abee, L. K. Burton et al., eds.). Pergamon Press, New York, 1968. Lingenfelter, R. E. The cosmic-ray neutron leakage flux. J. Geophys. Res. 68: 5633-5639 (1963). Liniecki, J. Instytut Medycyny Pracy, Poland. Communication. Lippmann, M. and R. E. Albert. The effect of particle size on the regional deposition of inhaled aerosols in the human respiratory tract. Amer. Ind. Hyg. Assoc. J. 30: 257-275 (1969).
List, R. J. and K. Telegadas. Using radioactive tracers to develop a model of the circulation of the stratosphere. J. Atmosph. Sci. 26: 1128-1136 (1969). Little. J. B. and E. P. Radford. Jr. Polonium-210 in bronchial epithelium of heavy smokers. Science 155: 606-607 (1967). Lockhart, L. B .. Jr. Radioactivity of the radon-222 and radon-220 series in the air at ground level. Chapter 18. p. 331-344 in The Natural Radiation Environment (Adams, J. A. S .. W. M. Lowder. eds.), The University of Chicago Press, Chicago, ill., 1964. Lockhart, L. B., Jr.. R. L. Patterson, Jr. and A. W. Saunders. Jr. The size distribution of radioactive atmospheric aerosols. J. Geophys. Res. 70: 6033-6041 (1965). Logsdon, J. E. and R. I. Chissler. Radioactive waste discharges to the environment from nuclear power facilities. U.S. Department of Health, Education and Welfare report BRH-DER-70-2. Rockville, Maryland, 1970. Logsdon, J.E. and J. W. N. Hickey. Radioactive waste discharges to the environment from a nuclear fuel reprocessing plant. Radial. Health Data and Reports 12: 305-312 (1971). Logsdon, J. E. and T. L. Robinson. Radioactive waste discharges to the environment from nuclear power facilities-addendum- I to BRH/DER 70-2 U.S. Environmental Protection Agency report ORP/SID 71-1. \Vashington, D.C., 1971. Lovaas, A. I. and J. B. Hursh. Radium-226 and lead-210 in human teeth and bones. Health Phys. 14: 549-555 (1968). Lowder, W. M. and H. L. Beck. Cosmic ray ionization in the lower atmosphere. J. Geophys. Res. 71: 4661-4668 (1966).
122
377. Lowder, W. M., A. C. George, C. V. Gogolak et al. Indoor radon daughter and radiation measurements in East Tennessee and Central Florida. Unpublished.
378. Lowder, W. M., A. Segall and W. J. Condon. Environmental radiation survey in northern New England, p. 907-917 in The Natural Radiation Environment ( Adams. J. A. S., W . .\1. Lowder, eds.), The University of Chicago Press, Chicago, ill., 1964.
379. Lucas, H. F., Jr., D. N. Edgington and F. Markun. Natural thorium in human bone. Health Phys. 19: 739-742 (1970).
380. Lucas, H. F., Jr., R. B. Holtz..man and D. C. Dahlin. Radium-226, radium-228, lead-210 and fluorine m persons with osteogenic sarcoma. Science 144: 1573-1575 (1964).
381. Lund, L., 0. B. Michelsen. B. Ottar et al. A study of 90Sr and 137Cs in Norway 1957-1959. Norwegian Defence Research Establishment intern rapport K-253 (1962).
382. Machta, L. A preliminary model of tropospheric aer?sol removal. Paper presented at the Symposmm on Air Chemistry and Radioactivity. Helsinki, August 1960.
383. Machta, L. Meteorological processes in the transport of weapon radioiodine. Health Phys. 9: 1123-1132 (1963).
384. Machta, L. and K. Telegadas. Radioiodine levels in the U.S. Public Health Service pasteurized milk network from 1963 to 1968 and their relationship to possible sources. Health Phys. 19: 469-485 (1970).
385. Machta, L., R. J. List and K. Telegadas. Inventories of selected long-lived radioisotopes produced during nuclear testing, p. 243-271 in Health and Safety Laboratory fall-out program quarterly summary report HASL-142. New York, 1964.
386. Machta, L., K. Telegadas and R J. List. The slope of surfaces of maximum tracer concentration in the lower stratosphere. J. Geophys. Res. 75: 2279-2289 (1970).
387. Machta, L., R. J. List, M. E. Smith, Jr. et al. Use of natural radioactivity to estimate largescale precipitation scavenging, p. 465-4 74 in Precipitation Scavenging (1970). Proceedings of a symposium held at Richland, Washington. June 2-4, 1970. Atomic Energy Commission Symposium Series 22. Oak Ridge, 1970.
388. Magi, A. Observations on the Cs13 7 body burden of a control group in Stockholm. National Institute of Radiation Protection, Stockholm, report SSI: 1968-022 (1968).
389. Magi, A. and B. Lindell. 222Rn in milk. p. 337-340 in Radioecolosncal Concentration Processes (Aberg. B. and F. -P. Hungate, eds.), Pergamon Press, 1967.
390. Magi, A., J. 0. Snihs and G. A. Swedjemark. Some measurements on radioactivity in S\veden caused by nuclear test explosions. Radial. Health Data and Reports 11: 487-510 (1970).
391. Magno, P. J., P. R. Groulx and J. C. Apidianakis. Lead-210 in air and total diets in the United States during 1966. Health Phys. 18: 383-388 (1970).
392. Magno, P. J., P. E. Kauffman and B. Shleien. Plutonium in environmental and biological media. Health Phys. 13: 1325-1330 (1967).
393. Magno. P .. T. Reavey and J. Apidianakis. Liquid waste effluents from a nuclear fuel reprocessing plant. U.S. Department of Health. Education and Welfare report BRH-NERHL 70-2. Rockville. Maryland, 1970.
394. Mahmoud. K. A., M. K. Moloukhia. S. A. AbdelLatif et al. Fall-out and radioactive content of food chain in U.A.R. during the year 1966. Environment Laboratories. Radiation Protection and Civil Defence Dept., U.A.R. Atomic Energy Establishment report U.A.R.S.C.E.A.R.. Vol. 9-1 (June 1967).
395. Mahmoud. K. A.. M. K. Moloukhia. S. A. AbdelLatif et al. Strontium-90 levels of fall-out and of food diet in U.A.R. during the year 1968. Radiation Protection and Civil Defence Department, U.A.R. Atomic Energy Establishment report U.A.R.S.C.E.A.R., Vol. 10-1 (March 1969).
396. Mahmoud, K. A., M. K. Moloukhia. S. A. AbdelLatif et al. Strontium-90 fall-out deposition and surface air gamma activity in U.A.R. during 1969 and strontium-90 in human bones during 1968 and 1969. Environmental Laboratories, Radiation Protection and Civil Defence Department, U.A.R. Atomic Energy Establishment report U .A.R.S.C.E.A.R.. Vol. 12-1 (1970).
397. Malakhov, S. G. and P. G. Chemysheva. On the seasonal variations in the concentration of radon and thoron in the surface layer of the atmosphere, p. 60-68 in Radioactive isotopes in the atmosphere and their use in meteorology. Conference at Obninsk. February 1964 (Karol. I. L. and others, eds.). Published for the U.S. Atomic Energy Commission and the National Science Foundation, Washington, D.C. by the Israel Program for Scientific Translations. Jerusalem. 1967.
398. Malakhov, S. G .. V. N. Bakulin, G. V. Dmtrieva et al. Diurnal variations of radon and thoron decay product concentrations in the surface layer of the atmosphere and their washout by precipitations. Tell us 18: 643-654 (1966).
399. Marenco, A .. J. Fontan. D. Blanc et al. Variations a Toulouse des concentrations de 210Pb, 210Po et 7Be dans l'air et les precipitations. Geofisica e Meteorologia 16: 31-35 (1967).
400. Marko, A. M., P. J. Barry, R. Wilson et al. Nuclear power and the environment. Vol. 11. p. 475-485 in Peaceful Uses of Atomic Energy. Proceedings of the Fourth International Conference, Geneva. 6-16 September 1971. Published by the United Nations and the International Atomic Energy Agency, 1972.
401. Marshall, J. H., E. L. Lloyd. J. Rundo et al. ICRP Task Group on the local retention of bone seekers. A model of normal adult human bone which provides macroscopic and microscopic retention functions for alkaline earth radioisotopes. Health Physics (in press).
402.
403.
Martell, E. A. Transport patterns and residence times for atmospheric trace constituents vs. altitude. Proc. Symposium on Radionuclides in the Environment, San Francisco, California, April 1-3, 1968. l\fartin. A. Content and distribution of stable strontium and 226Ra in human skeletons from Wisconsin decedents, 1957-1961. Brit. J. Radial. 42: 295-298 ( 1969).
404. Martin, J. E., E. D. Harward and D. T. Oakley. AppendL""t 14, p. 773-809 in Hearings before the Joint Committee on Atomic Energy. Congress of the United States. First session on environmental effects of producing electric power. October 28, 29, 30, 31; November 4, 5, 6 and 7, 1969. Washington. D.C., 1969.
405. Mattern. F. C. M., R. Drost and L. Strackee. 90Sr and 137Cs in the human diet in the Netherlands during 1967. Report RA-34. Rijks Instituut voor de Volksgezondheid, Utrecht (1968).
406. Mattsson, R. Seasonal variation of short-lived Rn progeny, 210 Pb and 210 Po in ground level air in Finland. J. Geophys. Res. 7 5: 1741-17 44 (1970).
407. Mays, C. W. Statement before the Joint Committee on Atomic Energy, Congress of the United States, August 20, 21, 22 and 27, 1963 in Fallout, Radiation Standards, and CountermeasureSPart 2. Washington, D.C .. 1963.
408. Mays. C. W., G. N. Taylor, W. S. S. Jee et al. Speculated risk to bone and liver from 239Pu. Health Phys. 19: 601-610 (1970).
409. McBride, J. R. and D. Hill. Ofisite radiological surveillance for project Gasbuggy-June 1967-July 1968. Rad. Health Data and Reports 10: 535-546 (1969).
410. McCraw, T. F. The half-time of caesium-137 in man. Radio]. Health Data and Reports 6: 711-718 (1965).
411. McEachem, P., W. G. Myers and F. A. White.
123
Uranium concentrations in surface air at rural and urban localities within New York State. Env. Sc. and Tech. 5: 700-703 (1971).
412. McGregor, R. G., E. R. Samuels and H. Taniguchi. Environmental radioactivity surveillance in Canada. 1969. Radiation Protection Division report RPD-78, Department of National Health and Welfare, Canada, March 1970.
413. McNaughton, G. S. and R. N. Woodward. Barium-140 in New Zealand rainwater. Nature 191: 1344-1345 (1961).
414. Medical Research Council. The hazards to man of nuclear and allied radiations. A second report to the Medical Research Council. London. 1960.
415. Medical Research Council. Assay of strontium-90 in human bone in the United Kingdom. Results for 1968, Monitoring report no. 17. London, 1970.
416. Mendell, R. B. and S. A. Korff. Fast neutron flux in the atmosphere. J. Geophys. Res. 68: 5487-5495 (1963).
417. Mendon\;a. A. H. Determina~ao da atividade de uosr em ossos humanos. Tese submetida a Universidade Federal do Rio De Janeiro. 1970.
418.
419.
420.
421.
422.
423.
424.
425.
426.
427.
Menzel, R. G. Uranium, radium an.d tho~um content in phosphate rocks and their possible radiation hazard. J. Agr. Food Chem. 16: 231-234 (1968). Merlin. H. B. Energy consumption: its growth and pattern. Atomic Energy of Canada Limited report AECL-3293 (March 1969). Merriman, J. R., J, H. Pashley, K. E. Habiger et al. Concentration and collection of krypton and xenon by selective absorption in fluorocarbon solvents, p. 303-313 in Treatment of _.AJrborne Radioactive Wastes. IAEA publication STI/ PUB/195. Vienna, 1968. Merritt, R. C. The extraction metallurgy of uranium. Colorado School of Mines Research Institute, 1971. Mishra, U. C., A. S. Deshpande, R. Kerale Varma et al. Caesium-137 and potassium in milk. Bhabha Atomic Research Centre report B.A.R.C.-278 (1967).
Mishra, U. C., R. Kerale Varma, and P. G. Karnath. Caesium-13 7 and potassium in Indian whole milk. Journal of Scientific and Industrial Research 28: 354-358 (1969).
Mistry, K. B., K. G. Bharathan and A. R. Gopal-Ayengar. Radioactivity in the diet of population of the Kerala coast including monazite bearing high radiation areas. Health Phys. 19: 535-542 (1970). Mitchell, N. T. Monitoring of the aquatic environment of the United Kingdom and its application to hazard assessment, p. 449-462 in Environmental Contamination by Radioactive Materials, IAEA publication STI/PUB/226. Vienna, 1969. Mitchell, N. T. Radioactivity m surface and coastal waters of the British Isles. 1969. Ministry of Agriculture. Fisheries and Food, Fisheries Radiological Laboratory, technical report FRL 7. Lowestoft, Suffolk, 1971. Mitchell, N. T. Radioactivity in surface and coastal waters of the British Isles, 1970. Ministry of Agriculture, Fisheries and Food. Fisheries Radiological Laboratory, technical report FRL 8. Lowestoft. Suffolk. 1971.
428. Miyake. Y.. Y. Katsuragi and Y. Sugimura. Deposition of plutonium in Tokyo through the end of 1966. Papers in Meteorology and Geophysics XIX: 267-276 (1968).
429. Miyake, Y., Y. Katsuragi, Y. Sugimura. A study on plutonium fall-out. J. Geophys. Res. 75: 2329-2330 (1970).
430. Mochizuki. Y., R. Mowafy and B. Pasternack. Weights of human thyroids in New York City. Health Phys. 9: 1299-1301 (1963).
431. Mahindra. V. K. and J. H. Gordon. Caesium-137 levels in the Canadian North, January to June 1965. p. 3-12 in Data from Radiation Protection Programs, 3, (10), (October 1965).
432. Mohnen, V. and K. Stierstadt. Die Verteilung der Natiirlichen Radioaktivitat auf das Groszenspectrum des Natiirlichen Aerosols. Z. Phys. 173: 276-293 (1963).
124
433. Moore, W. S. Amazon and Mississipi River concentrations of uranium, thorium and radium isotopes. Earth and Planetary Science Letters 2: 231-234 (1967).
434. Moore. W. S. Oceanic concentrations of radium-228. Earth and Planetary Science Letters 6: 437-446 (1969).
435. Morley, F. and P. M. Bryant. Basic and derived radiological protection standards for the evaluation of environmental contamination, p. 255-272 in Environmental contamination by radioactive materials. LA.EA publication STI/PUB/ 226. Vienna, 1969.
436. Morrow, P. E. Models for the study of particle retention and elimination in the lung, p. 103-119 in Inhalation Carcinogenesis. Atomic Energy Commission Symposium Series 18 ( 1970).
437. Morse, R. S. and G. A. Welford. Dietary intake of lead-210. Health Phys. 21: 53-55 (1971).
438. Morsy, S. M. and M. Y. Abu-Bakr. Levels of potassium and caesium-13 7 in man in U.A.R. during year 1968. U.A.R. Atomic Energy Establishment, Radiation Protection Department, report U.A.R.S.C.E.A.R., Vol. 10-2 (April 1969).
439. Moss, W. D. and E. E. Campbell. Plutonium concentration in tissues of a general population. Paper No. 63 presented at the 11th Hanford Biology Symposium. Richland, Wash., Sept. 26-29, 1971.
440. Muchin, I. E. Content of radium-226 in the environment. food-stuffs and bone of Ukrainians. p. 308 in USSR Reports on radio-activity in man and the environment, Health and Safety Laboratory translation report. New York, 1968.
441. Millier, J .. Institute of Radiation Hygiene, Prague. Communication.
442. Murayama N., Mean level of natural radioactivity in the surface air in Japan. J. Radiat. Res. 7: 1-7 (1966).
443. National Bureau of Standards. Protection against neutron radiation up to 30 million electron volts. United States Department of Commerce, l\1BS Handbook 63 (1957).
444. National Institute of Radiological Sciences, Chiba. Japan. Caesium-137 body burden in Japanese male adults in Radioactivity Survey Data in Japan. reports l\1IRS-RSD-7 (19 65) , NIRS-RSD-14 (1967), NIRSD-RSD-26 (1970), NIRS-RSD-30 (1971 ).
445. National Institute of Radiological Sciences, Chiba. Japan. External doses of radiation from fallout. p. 8-9 in Radioactivity Survey Data in Japan No. 15 (1967).
446. National Institute of Radiological Sciences. Chiba, Japan. External doses of radiation from fallout, p. 10-11 in Radioactivity Survey Data in Japan No. 19 (1968).
447. National Radiation Laboratory. Environmental radioactivity in New Zealand, Annual Summary 1969. Report No. NRL-F38. Christchurch, New Zealand.
r 448. National Radiation Laboratory quarterly report
No. F 39. January-March 1970. Environmental radioactivity in New Zealand and results of extended monitoring of fall-out from French nuclear tescs in the Pacific for sa_mples processed up to 27 July (1970). Christchurch, New Zealand.
449. National Radiation Laboratory quarterly report No. F 40. Environmental radioactivity in New Zealand quar~erly report April-June 1970 and Pacific area monitoring 27 July-9 October (1970). Christchurch, New Zealand.
450. National Radiation Laboratory, New Zealand. Environmental radioactivity in New Zealand. reports Nos. NRL---F 33 (1969), NRL-F 34 (1969), N""R.L-F 35 (1970), NRL-F 36 (1970), NRL-F 37 (1970), NRL-F 43 (1971). Christchurch, New Zealand.
451. National Radiation Laboratory report No. NRL -F 45. Environmental radioactivity in New Zealand quarterly report April-June 1971 and Pacific area monitoring 4 June-31 August (1971). Christchurch, New Zealand.
452. National Radiation Laboratory report No. NRL -F 46. Environmental radioactivity in New Zealand quarterly report July-September ( 1971) and Pacific area monitoring 31 August-31 October (1971). Christchurch, New Zealand.
453. Neher, H. V. Cosmic-ray particles that changed from 1954 to 1958 to 1965. J. Geophys. Res. 72: 1527-1539 (1967).
454. Neher, H. V. Cosmic rays at high latitudes and altitudes covering four solar maxima. J. Geophys. Res. 76: 1637-1651 (1971).
455. Neher, H. V. and H. R. Anderson. Cosmic-ray intensity at Thule, Greenland, during 1962 and 1963 and a comparison with data from Mariner 2. J. Geophys. Res. 69: 807-814 (1964).
456. Neher, H. V. and H. R. Anderson. Cosmic ray changes during a solar cycle, p. 153-156, vol. 1, in Proceedings of the 9th International Conference on Cosmic Rays. The Institute of Physics and the Physical Society, London, 1966.
457. Neill, R.H. and P. B. Robinson. Radiation doses to children's thyroids from iodine-131 in milk. Radiol. Health Data and Reports 10: 1-9 (1969).
458. Ness, N. F. The earth's magnetic tail. J. Geophys. Res. 70: 2989-3005 (1965).
459. Ness, N. F. Measurements of the magnetic fields in interplanetary space and the magnetosphere, p. 14-25, vol. 1, in Proceedings of the 9th International Conference on Cosmic Rays. The Institute of Physics and the Physical Society, London, 1966.
460. Netherlands. General radioactive contamination of the biosphere. Measurements in the Netherlands for 1968 and 1969. Ministerie van Sociale Zaken en Volksgezondheid.
461. Neufeld, J., W. S. Snyder, J. E. Turner et al. Calculation of radiation dose from protons and neutrons to 400 MeV. Health Phys. 12: 227-237 (1966).
462. Newkirk, L. L. Calculation of low-energy neutron flux in the atmosphere by the Sn method. J. Geophys. Res. 68: 1825-1833 (1963).
125
463. Nordyke, M. D. Underground encineering applications, p. 111-13 2 in Proceedings for the Symposium on Public Health Aspects of Peaceful Uses of Nuclear Explosives, Las Vegas, Nevada. April 7-11, 1969.
464. Nydal, R. and K. Lovsetb. Prospective decrease in atmospheric radiocarbon. J. Geophys. Res. 75: 2271-2278 (1970).
465. Oak Ridge National Laboratorv. Siting of fuel reprocessing plants and waste nianagem~ent facilities. Report ORNL-4451 (1970).
466. Oberhausen, E. and C. 0. Onstead. Relationship of potassium content of man with age and sex. Results of 10,000 measurements of normal persons; factors influencing potassium content. Chapter 14 in Radioactivity in Man, Second Symposium (Meneely, G. R. and S. M. Linde, eds.). Charles C. Thomas, Springfield, Ill.. 1965.
467. O'Brien, K. Cosmic-ray propagation in the atmosphere. II Nuovo Cimento, Series 11, Vol. 3A, p. 521-547 (June 1971).
468. O'Brien, K. and J. E. McLaughlin. Calculation of dose and dose-equivalent rates to man in the atmosphere from galactic cosmic-rays. United States Atomic Energy Commission report HASL-228. New York, 1970.
469. O'Brien, K. and J.E. McLaughlin. The radiation dose to man from galactic cosmic-rays. Health Phys. 22: 225-232 (1972).
4 70. Ohlsen, H. Determination of the mean population burden from natural external radiation in the Soviet zone of Germany. Staatliche Zentrale fiir Strahlenschutz, report No. SZS-14/69 also United States Atomic Energy Commission translation report AEC-tr-7216 (1971).
471. Osborne, R. V. Plutonium-239 and other nuclides in ground-level air and human lungs during spring 1962. Nature 199: 143-146 (1963).
4 72. Osborne, R. V. Absorption of tritiated water vapour by people. Health Phys. 12: 1527-1537 (1966).
473. Palmer, H. E. and T. M. Beasley. Iron-55 in man and the biosphere. Health Phys. 13: 889-895 (1967).
474. Palmer, H. E. and J. C. Langford. Iron-55 levels in humans living in Richland, Washington (1964-1967), p. 148-149 in Pacific Northwest Laboratory annual report for 1967 to the USAEC Division of Biology and Medicine. Report BNWL-715, Part 2 (1968).
475. Palmer, H. E., J. C. Langford, T. M. Beasley et al. Levels of iron-55 in humans. animals and food, 1964-1967. Radial. Health Data and Reports 9: 387-390 (1968).
4 7 6. Pannetier, R. Distribution, transfert atmospherique et bilan du krypton-85. Rapport CEA-R-3591. Saclay, 1968.
477. Pannetier, R. and R. Gros. Unpublished. 478. Papworth, D. and J. Vennart. Unpublished. 479. Parker, E. N. A brief outline of the development
of cosmic-ray modulation theory, p. 26-34, vol. 1 in Proceedings of the 9th International Conference on Cosmic Rays. The Institute of Physics and the Physical Society, London, 1966.

480. Parker, E. N. The dynamical origin of the solar wind and cosmic-ray variations. Progr. Elem. Particle Cosmic Ray Phys. 9: 3-38 (1967).
481. Pasquill, F. The estimation of the dispersion of windborne material. Met. Mag. 90: 33-49 (1961).
482. Pasquill. F. Meteorological aspects of the spread of windbome contaminants, p. 43-53 in Protection of the public in the event of radiation accidents, WHO, Geneva. 1965.
483. Patterson, H. W. and R. Wallace. Report on a radi~tion survey made in Egypt, India and Ceylon lil January 1963. Health Phys. 12: 935-941 (1966).
484. Patterson. R. L., Jr. and L. B. Lockhart, Jr. Geographical distribution of lead-210 (Ra D) in the ground-level air, chap. 23, p. 383-392 in The Natural Radiation Environment (Adams. J. A. S. and W. M. Lowder, eds.). The University of Chicago Press. 1964.
485. Pearson, J. E. and G. E. Jones. Soil concentrations of "emanating radium-226" and emanation of radon-222 from soils and plants. Tellus 18: 655-662 (1966).
486. Peirson, D. H. and J. R. Keane. The characteristics of early fall-out from the Russian nuclenr explosions of 1961. Nature 196: 801-807 (1962).
487. Peirson, D. H., R. S. Cambray and W. L. Brooks. Natural and anomalous concentrations of lead-210 and polonium-210 in the atmosphere. Paper presented at a meeting on the biology and ecology of polonium and radiolead. Sutton, 1970.
488. Peirson. D. H., R. S. Cambray and C. L. Rawson. Transfer of nuclear debris from southern to northern troposphere during 1968. J. Geophys. Res. 75: 1760-1765 (1970).
489. Peirson, D. H., R. S. Cambray and G. S. Spicer. Lead-210 and Polonium-210 in the atmosphere. Tellus 18: 427-433 (1966).
490. Pellerin, P. Ministere de la sante publique et de la securite sociale, Service central de protection contre Jes rayonnements ionisants. Communication.
491. Pendleton. R. C., C. W. Mays, R. D. Lloyd et al. Differential accumulation of 1311 from local fallout in people and milk. Health Phys. 9: 1253-1262 (1963).
492. Penna-Franca, E. Unpublished.
493. Penna-Franca. E., J. C. Almeida, J. Becker et al. Status of investigations in the Brazilian areas of high natural radioactivity. Health Phys. 11: 699-712 (1965).
494. Penna-Franca. E .. M. Fiszman, N. Lobao et al. Radioactivity of Brazil nuts. Health Phys. 14: 95-99 (1968).
495. Penna-Franca, E., M. Fiszman, N. Lobao et al. Radioactivity in the diet in hioh backoround areas of Brazil. Health Phys.
0
19: 657-662 (1970).
496. Penna-Franca, E.. N, Lobao. M. Teitakowski et al. Radiochemical determination of !!~6Ra in human tooth and urine. Anais da Academia Brasileira de Ciencias 3 8: 121-13 6 (1966).
126
497. Pensko, J. Environmental radiation measurements in Poland by means of scintillation methods, p. 499-516 in Actes du congres international tenu a Toulouse les 14, 15, 16 roars 1967 sur la radioorotection du milieu devant le developpement des utilisations paci.fiques de I'energie nucleaire. Societe Fran~aise de Radioprotection, Paris, 1968.
498. Pensko, J., K. Mamont and T. Wardaszko. Measurements of ionizing radiation inside blocks of flats in Poland, 1969.
499. Pepper, R. B. and P. A. Carter. Radiological conditions and effluent releases at Central Electricity Generating Board nuclear stations: a c.omparison between design forecasts and operational experience. Vol. 11, p. 67-77 in Peaceful Uses of Atomic Energy. Proceedings of the Fourth International Conference. Geneva. 6-16 ~eptember 1971. Published by the United Nat10ns and the International Atomic Energy Agency, 1972.
500. Perkins, R. W. Physical and chemical form of 1311 in fall-out. Health Phys. 9: 1113-1122 (1963).
501. Persson, G. Fractionation phenomena in activity from an underground nuclear explosion. Health Phys. 16: 515-523 (1969).
502. Persson, G. Radioactive tun!!sten in the atmosphere following project Schooner. Research Institute of National Defence. Stockholm, report C 4460-28 (1971).
503. Persson, R. B. R. lron-55 in northern Sweden; relationships and annual variation from 1956 until 1967 in lichen and reindeer as well as uptake and metabolism in man. Health Phys. 16: 69-78 (1969).
504. Peters, B. Cosmic rays. Chapter 12. part 9, p. 9-201 to 9-244 in Handbook of Physics (Condon. E. U. and H. Odishaw, eds.), McGraw-Hill. New York, 1958.
505. Peterson, H. T., J. E. Martin, C. L. Weaver et al. Environmental tritium contamination from increasing utilization of nuclear energy sources. p. 35-60 in Environmental Contamination by Radioactive Materials. LA.EA publication STJ/PUB/226. Vienna, 1969.
506. Peterson, K. R. An empirical model for estimating worldwide deposition from atmospheric nuclear detonations. Health Phys. 18: 357-378 (1970).
507. Petrow, H. G. The metabolic and dosimetric significance of nopb to 2!!6Ra ratios in the bones of radium dial painters. p. 727-741 in Radiation Protection, part 2 (Snyder. W. S .. H. H. Abee, L. K. Burton et al., eds.). Pergamon Press, 1968.
508. Petrow, H. G., W. J. Schiessle. A. Cover et al. Radiochemical analysis of Brazilian samples from regions of high natural radioactivity, part VI in Radioactivity Studies. New York University Medical Center report No. N-Y0-3086-1 (1965).
509. Petterssen, S. Introduction to meteorology. McGraw-Hill Book Co., Inc., 2nd edition, New York, 1958.

510.
511.
512.
513.
514.
515.
516.
517.
518.
519.
520.
521.
522.
523.
Pohl. E. and J. Pohl-Rilling. The radiation dose received by inhalation of air containing z:?:?Rn, ~"''Rn, ;;1"!Pb (Th B) and their decay products. Anais da Academia Brasileira de Ciencias 39: 393-404 (1967). Pohl, E. and J. Pohl-Rilling. Die Strahlenbelastung der Bevolkerung Badgastein, Osterreich. Ber. Nat. -med. Ver. Innsbruck 57: 95-110 (1969). Preston, A. and D. F. Jefferies. Aquatic aspects in chronic and acute contamination situations, p. 183-211 in Environmental Contamination by Radioactive Materials. IAEA publication STI/ PUB/226. Vienna, 1969. Quenby. J. J. Cosmic rays and the interplanetary field, p. 3-13, vol. 1 in Proceedings of the 9th International Conference on Cosmic Rays. The Institute of Physics and the Physical Society, London, 1966. Raabe, 0. G. Concerning the interactions that occur between radon decay products and aerosols. Health Phys. 17: 177-185 (1969).
Radiation Protection Division, Department of National Health and Welfare, Ottawa, Canada. Data from Radiation Protection Programs, vols. 4-6 (1966-1968). Radiological Health Handbook. Revised edition. U.S. Department of Health, Education, and Welfare. Rockville, Maryland, 1970.
Raft. P. D .. W. M. Lowder and H. L. Beck. Measurements of cosmic-ray ionization in the atmosphere, 1968-1970. United States Atomic Energy Commission report HASL-234. New York, 1970. Rafter, J. A. and B. J. O'Brien. Exchange rates between the atmosphere and the ocean as shown from recent 14C measurements in the South Pacific. Paper presented at the 12th Nobel Symposium on Radio-carbon Variations and Absolute Chronology. Uppsala, August 1969.
Rahola, T. and J. K. Miettinen. Body burden of 137Cs and the radiation dose of a population group in Finnish Lapland. Presented at the Second International Congress of Radiation Protection Association, Brighton. May 3-8, 1970.
Rahola, T. and J. K. Miettinen. Body burden of 137Cs in Finnish Lapps in March 1971 (Preliminary results). Paper No. 33 in Radioactive foodchains in the subarctic environment. Technical Progress Report for the period August 15. 1970-August 15, 1971. Helsinki, May 1971.
Rahola. T., T. Hattula and J. K. Miettinen. Present situation regarding accumulation of 13•Cs and radiation burden in Finnish Lapps. p. I 039-1056 in Actes du Symposium International de Radioecologie. C.E.N. de Cadarache, 8-12 septembre 1969.
Rangarajan. C. and S. Gopalakrishnan. Transport and interhemispheric mixing of radioactive debris from recent nuclear tests. Bhabha Atomic Research Center report BARC-393 (1969).
Rangarajan, C., S. Gopalakrishnan and K. G. Vohra. Interhemispheric mixing of fallout debris in monsoon regions. J. Geophys. Res. 75: 1753-1759 (1970).
127
524.
525.
526.
527.
528.
529.
530.
531.
532.
533.
534.
535.
536.
537.
538.
539.
Rechen, H. J. L., R. L. Mikkelsen, 0. C. Birscoe et al. Caesium-137 concentrations in Alaskans during the spring of 1967. Radial. Health Data and Reports 9: 705-717 (1968). Remy, M. L. et P. Pellerin. Radioactivite naturelle de 250 sources hydrominerales franc_;aises. Rapport SCPRI No. 117 ou Bulletin de l'INSERMT 23: 23-62 (1968). Renoux, A. Etude des noyaux de condensation rad io~ctifs de !'atmosphere. Tell us 18: 59 8-609 (1966). Republique franc_;ruse. Retombees radioactives a la suite des tirs nucleaires en Polynesie. Maidecembre 1970; v. United Nations document A/ AC.82/G/L.1381. Republique franc_;aise. Retombees radioactives a la suite des tirs nucleaires en Polynesie. Juinoctobre 1971; v. United Nations document A/ AC.82/G/L.1407. Rivera, J. Strontium-calcium discrimination by adults and infants, p. 235-238 in Health and Safety Laboratory fallout program quarterly summary report HASL-138. New York, 1963. Rivera, J. and J. H. Harley. The HASL bone program 1961-1964. United States Atomic Energy Commission report HASL-163. New York. 1965. Rochlin, R. S. Fission-neutron cross sections for threshold reactions. p. 48-49 in Nucleonics Data Sheets Nos. 1-45. McGraw-Hill, New York, 1962. Roessler, C. E., E. G. Williams and E. D. Nettles. Caesium-137 and strontium-90 in Florida milkA five-year study of distribution and levels. Health Phys. 16: 681-689 (1969). Roessler, G. C., B. G. Dunavant and C. E. Roessler. Caesium-137 body burdens in Florida residents. Health Phys. 16: 673-679 (1969). Rogan, H., C. Buck, P. E. Carter et al. Fuel fabrication processes at Springfields Works of the British Nuclear Fuels Limited. Paper No. 490 presented at the Fourth United Nations International Conference on the Peaceful Uses of Atomic Energy, Geneva, 1971. Rogers, L. and C. C. Gamertsfelder, U.S. regulations for the control of releases of radioactivity to the environment in effluents from nuclear facilities. p. 127-145 in Environmental Aspects of Nuclear Power Stations. IAEA publicationSTI/PUB/261. Vienna, 1971. Rowland, R. E. and J. E. Farnham. The deposition of uranium in bone. Health Phys. 17: 139-144 (1969). Russell, J. L. and P. B. Hahn. Public health aspects of iodine-129 from the nuclear power industry. Radial. Health Data and Reports 12: 189-194 (1971). Russell, P. L. Industry potential of large scale uses for peaceful nuclear explosives. p. 671-68_3 in Proceedings for the Svmposium on Public Health Aspects of Peacefui Uses of Nuclear Explosives, Las Vegas. Nevada, April 7-11, 1969. Russell, R. S. Other fission products, induced activities and fissile materials. Chapter 16 in Radioactivity and Human Diet (Russell, R. S., ed.), Pergamon Press. 1966.

540. Russell, R. S. and K. A. Smith. Naturally occurring radioactive substances. The uranium and thorium series. chapter 17, p. 367-379 in Radioactivity and Human Diet (Russell, R. S., ed.), Pergamon... Press, 1966.
541. Sachs, M. Y. Worldmark Encyclopedia of the Nations, Worldmark Press, Harper and Row, New York, 1971.
542. Saba. K. Air and water vapour transport across the equator in western Indian Ocean during northern summer. Tcllus 22: 681-687 (1970).
543. Saba, K. Interhemispheric drift of radioactive debris and tropical circulation. Tellus 22: 688-698 (1970).
544. Sandstrom, A. E. Cosmic ray physics. North Holland Publ. Co., Amsterdam, 1965.
545. Sax, N. J., R. R. Reeves and J. D. Denny. Surveillance for krypton-85 in the atmosphere. Radio!. Health Data and Reports 10: 99-101 (1969).
546. Schaefer, H. J. Public health aspects of galactic radiation exposure at supersonic transport altitudes. Aerospace Medicine 39: 1298-1303 (1968).
547. Schneider. K. J., A. G. Blasewitz, R. L. Bradshaw et al. Status of solidification of disposal of highly radioactive liquid wastes from nuclear power plants in the U.S.A., p. 369-386 in Environmental Aspects of Nuclear Power Stations. IAEA publication STI/PUB/261. Vienna, 1971.
548. Senko, E. E. Diurnal variations in Rn exhalation and atmospheric concentration. Izv. Atmos. and Ocean Phys. 4: 533-539 (1968).
549. Servant, J. Temporal and spatial variations of the concentration of the short-lived decay products of radon in the lower atmosphere. Tellus 18: 663-671 (1966).
550. Service central de protection contre les rayonnements ionisants. Ministere de la sante publique et de la securite sociale. Rapports mensuels d'activite couvrant les annees 1967 a 1971, passim. 78-Le Vesinet, France.
551. Service de chimie de l'Institut d'hygiene et d'epidemiologie, Departement des mesures du C.E.N., Radiocontamination de la chaine alimentaire en Belgique, annees 1965-1966.
552. Shamas, M. H. and A. R. Liboff. A new measurement of the intensity of cosmic-ray ionization at sea level. J. Geophys. Res. 71: 4651-4659 (1966).
553. Shannon. L. V. and R. D. Cherry. Polonium-210 and lead-210 in the hydrosphere. Paper presented at the 1970 International Symposium on Hydrogeochemistry and Biogeochemistry, Tok-yo, Japan.
554. Shea. M. A. and F. D. Smart. Worldwide trajectory-derived vertical cutoff rigidities and their application to experimental measurements. J. Geophys. Res. 72: 2021-2027 (1967).
555. Shleien. B. The simultaneous determination of atmosp~eric radon by filter paper and charcoal absorptive techniques. Amer. Ind. Hyg. Assoc. J. 24: 180-187 (1963).
128
556. Shleien, B. An estimate of radiation doses received by individuals living in the vicinity of a nuclear fuel reprocessing plant in 1968. U.S. Department of Health, Education and Welfare report BRH-NcRHL-70-1. Rockville, Maryland, 1970.
557. Sbleien, B. and A. G. Friend. Local ground-level air concentrations of lead-210 at Winchester Massachusetts. Nature 210: 579-580 (1966). '
558. Sbleien, B., J. A. Cochran and P. J. Magno. Strontium and plutonium isotopes in ground level air, October 1963-March 1969. Radial. Health Data and Reports 11: 129-134 (1970).
559. Shleien, B., A. G. Friend and H. A. Thomas, Jr. A method for the estimation of the respiratory deposition of airborne materials. Health Phys. 13: 513-517 (1967).
560. Shuping, R E., C. R. Phillips and A. A. Moghissi. Low-level counting of environmental krypton-85 by liquid scintillation. Analytical Chemistry 41: 2082-2083 (1969).
561. Shuping, R. E., C.R. Phillips and A. A. Moghissi. Krypton-85 levels in the environment determined from Krypton gas samples. Radial. Health Data and Reports 11: 671-672 (1970).
562. Siek, R. D. Statement before the Joint Committee on Atomic Energy, United States Congress, 28 October 1971, in Use of Uranium Mill Tailings for Construction Purposes. Washington 1971. '
563. Sievert, R. M., G. A. Swedjemark and J. C. Wilson. Exposure of man to ionizing radiation from natural and artificial sources, p. 335-371 in Handbuch der Medinzinischen Radiologie, Encyclopedia of Medical Radiology, Sprinoer-Verlag, Berlin, 1966. ~ "'
564. Simon, A. Measurement of natural radioactivity of atmosphere in Budapest, p. 36-46 in Radioactivity of the Atmosphere. Moskovskoe Otdelenie Gidrometeoizdata. Moscow. 1970. U.S. Atomic Energy Commission translation report AEC-tr-7268.
565. Slade, D. H. Meteorology and Atomic Energy, 1968. United States Atomic Energy Commission report TID-24190. Oak Ridge, 1968.
566. Slansky, C. M., H.K. Peterson and V. G. Johnson. Nuclear power growth spurs interest in fuel plant wastes. Environ. Sci. Technol. 3: 446-451 (1969).
567. Sloth, E. N., D. L. Horrocks, E. J. Boyce et al. Tritium in the thermal neutron fission of uranium-235. J. Inorg. Nucl. Chem. 24: 337 (1962).
568. Smith, C. F. Gas analysis results for project Rulison calibration flaring samples. University of California report UCRL 50986 (1971).
569. Smith. C. F., Jr. Project Gasbuggy gas quality analysis and evaluation program tabulation of radiochemical and chemical analytical results. University of California report UCRL 50635 Rev.2 (1971).
570. Smith, K. A. and P. G. Watson. Radium-226 in diet in the United Kingdom in 1963, p. 79-80 in Agricultural Research Council Radiobiological Laboratory annual report 1963-1964, ARCRL-12. Wantage, Berkshire, 1964.
571. Snilis, J. 0. Occurrence of 210Pb and ~10Po in drinking water with high radon contents. National Institute of Radiation Protection report SSI: 1970-029. Stockholm, 1970.
572. Soillem, P. J. The measurement of the size spectrum and charne to total ratio of condensation nuclei having naturally occurring radon daughter products attached to them. Health Phys. 18: 245-254 (1970).
573. Sokol. D. Ground water safety evaluation. Project Gasbuggy. Teledyne Isotopes report PNE-1009 (1970).
574. Sotobayasbi. T.. T. Suzuki and A. Furusawa. Interhemispheric transfer of fresh debris from French nuclear tests in 1968. Nature 224: 1096-1097 (1969).
575. Sowby, D. International Commission on Radiological Protection. Communication.
576. Spence, R. The uranium content of sea-water. Talanta 15: 1307-1309 (1968).
577. Spiers, F. W. Radioisotopes in the Human Body: Physical and Biological Aspects. Academic Press, New York and London, 1968.
578. Spiers, F. W. and T. R. Overton. Attenuation factors for certain tissues when the body is exposed to nearly omni-directional gamma radiation. Phys. in Med. and Biol. 7: 35-67 (1962).
579. Spiers, F. W., M. J. McHugh and D. B. Appleby. Environmental y-ray dose to populations: Surveys made with a portable meter, p. 885-906 in The Natural Radiation Environment (Adams, J. A. S., W. M. Lowder, eds.). The University of Chicago Press, Chicago, Ill., 1964.
580. Spiers, F. W., G. D. Zanelli, P. J. Darley et al. Beta-particle dose rates in human and animal bone, p. 130-148 in Biomedical Implications of Radiostrontium Exposure. Proceedings of a symposium held at Davis, California, February 22-24, 1971. Atomic Energy Symposium Series 25. Oak Ridge, 1972.
581. Spinrad, B. I. The role of nuclear power in meeting world energy needs, p. 57-82 in Environmental Aspects of Nuclear Power Stations. IAEA publication STI/PUB/261. Vienna, 1971.
582. Stablhofen, W. Measurement of the natural content of 228Tb, 226Ra and their daughters in the human body. p. 505-519 in Assessment of Radioactivity in Man, vol. II. IAEA publication STI/ PUB/84. Vienna, 1964.
583. Stead. F. W. Groundwater contamination, p. 205-220 in Education for Peaceful Uses of Nuclear Explosives (Weaver, L. E., ed.). The University of Arizona press, Tucson, Arizona, 1970.
584. Stebbins, A. K. Second special report on the high altitude sampling programme. Technical analysis report DASA-539 B (1961).
585. Stevens. D. J. Commonwealth X-ray and Radium Laboratory, Melbourne. Communication.
586. Stewart, N. G .. R. N. Crooks and E. M. R. Fisher. The radiological dose to persons in the U.K. due to debris from nuclear test explosions prior to January 1956. United Kingdom Atomic Energy Authority report HP /R.201 7 (19 5 6).
129
587. Styr~,. B. I. and V. I. Matulyavichene. Size and ~ability spectra of natural radioactive aerosols m the atmosphere, p. 20-28 in Radioactive isotopes in the atmosphere and their use in meteorology. Conference at Obninsk, February 1964 (KaroL I. L. and others, eds.). Published for the U.S. Atomic Energy Commission and the National Science Foundation, Washin!?ton. D.C. by the Israel ProQJ"am for Scientific Translation, Jerusalem, 1967.
588. Styra. B. L T. N. Nedveckaite and E. E. Senko. New methods of measuring Thoran (Radon-220) exhalation. J. Geophys. Res. 75: 3635-3638 (1970).
589. Suess, H. E. Secular variations of the cosmic-ray produced carbon-14 in the atmosphere and their interpretations. J. Geophvs. Res. 70: 5937-5952 (1965). .
590. Suomela, M. Caesium-137 and potassium body burden in some Helsinki inhabitants 1965-66, p. 45-48 in Studies on environmental radioactivity in Finland 1966. Report SFL-A8 (Oct. 1967). Institute of Radiation Physics. Helsinki.
591. Suomela, J. Halten av strontium-90 i mejerimjolk 1970. Intern basrapport, SSI: 1971-006 in Arsrapport 1970, speciallaboratorierna. Statens stralskyddsinstitut, rapport SSI: 1971-013 (Maj 1971). '
592. Suomela. M., 137Cs-level in the control group of the Institute of Radiation Physics in 1968-70, p. 57-63 in Studies of Environmental Radioactivity in Finland 1968-1970. Report SFL-Al 7 ( June 1971). Institute of Radiation Physics, Helsinki.
593. Sutton, 0. G. l'v1icrometeorology. McGraw-Hill Book Co., New York-London, 1953.
594. Swedjemark, G. A. Unpublished. 595. Swedjemark, G. A. and G. Eklund. Cesium137 i
stralskyddsinstitutets kontrollgrupp, 1970. Intern basrapport, SSI: 1971-010 in Arsrapport 1970, speciallaboratorierna, Statens strfilskyddsinstitut, rapport SSI: 1971-013 (Maj, 1971).
596. Swedjemark, G. A. and B. Hakansson. Gamma radiation at ground level in Sweden in 1970-1971. Primary data report, SSI: 1972-003. National Institute of Radiation Protection, Stockholm, 1972.
597. Szabo, B. J. Radium content in plankton and sea water in the Bahamas. Geochimica et Cosmochimica Acta 31: 1321-1331 (1967).
598. Tajima, E., M. Adachi, T. Doke et al. Soectrum of cosmic-ray produced neutrons. J. of the Physical Society of Japan, vol. 22, No. 2, February 1967.
599. Takata, N., H. Watanabe and R. Ichikawa. Lead-210 content in food-stuffs and its dietary intake in Japan. J. Rad. Res. 9: 29-34 (1968).
600. Tami. T. M. and W. C. Day. Prediction of gamma exposure rates in large nuclear craters, p. 1544-1562 in Proceedings for the Symposium on engineering ,vith nuclear explosives, Las Vegas, Nevada, January 14-16, 1970.
601. Tanaka, G., H. Kawamura and M. Izyuin. 90Sr in human bone in Radioactivity Survey data in Japan reports NIRS-RSD-21 (1968) and NIRSRSD-26 (1970). National Institute of Radiological Sciences, Chiba, Japan.
602. Tanaka. G. and H. Kawamura. Strontium-90 in human bone, p. 20-22 in Radioactivity Survey Data in Japan report NIRS-RSD-30. National Institute of Radiological Sciences, Chiba, Ja pan, 1971.
603. Taniguchi, H. Environmental surveillance-fallout. Department of National Health and Welfare, Canada, report RPD-80 (1970).
604. Teegarden, B. J. Cosmic-ray production of deuterium and tritium in the earth's atmosphere. J. Geophys. Res. 72: 4863-4868 (1967).
605. Telegadas, K. The seasonal atmospheric distribution and inventories of excess carbon-14 from March 1955 to July 1969, p. 1-2-1-87 in Health and Safety Laboratory fallout program quarterly summary report HASL-243. New York, 1971.
606. Teller, E.. W. K. Talley, G. H. Higgins et al. The constructive uses of nuclear explosives. McGraw-Hill, Inc., 1968.
607. Toman, J. Summary of results of cratering experiments, p. 48-82 in Proceedings for the Symposium on Public Health Aspects of Peaceful Uses of Nuclear Explosives, Las Vegas, Nevada, April 7-11 1969.
608. Toyota, M., S. Hamaguchi and C. Asada. Management of radioactive effluents from nuclear power stations currently under operation in Japan and environmental monitoring. Vol. 11. p. 547-558 in Peaceful Uses of Atomic Energy. Proceedings of the Fourth International Conference. Geneva. 6-16 September 1971. Published by the United Nations and the International Atomic Energy Agency, 1972.
609. Tsivoglou, E. C. and R. L. O'Connell. Nature, volume and activity of uranium mill wastes, p. 101-122 in vol. II of Radiological Health and Safety in Mining and Milling of Nuclear Materials. IAEA publication STI/PUB/78, Vienna, 1964.
610. Turkin, A. D., E. S. Trukhmanova. L. M. Mikbailov et al. Radiation hazards from radioactive inert gases. Paper presented to the IAEA Consultants' Meeting on Noble Gas Fission Products in the Nuclear Industry. Paris, 1969.
611. Unger. W. E.. F. N. Browder and S. Mann. Nuclear safety in American radiochemical processing plants. Nuclear Safety 12: 234-246 (1971).
612. United Nations. Report of the United Nations Scientific Committee on the Effects of Atomic Radiation. New York, 1958. Official Records of the General Assembly, Thirteenth Session, Supplement No. 17 (A/3838).
613. United Nations. Report of the United Nations Scientific Committee on the Effects of Atomic Radiation. New York. 1962. Official records of the General Assembly, Seventeenth Session, Supplement No. 16 (A/5216).
614. United Nations. Report of the United Nations Scientific Committee on the Effects of Atomic Radiation. New York. 1964. Official records of the General Assembly, Nineteenth Session, Supplement No. 14 (A/5814).
130
615. United Nations. Report of the United Nations Scientific Committee on the Effects of Atomic Radiation. New York. 1966. Official records of the Gene:al Assembly, Twenty-first Session, Supplement No. 14 (A/6314).
616. United Nations. Report of the United Nations Scientific Committee on the Effects of Atomic Radiation. New York, 1969. Official records of the General Assembly. Twenty-fourth Session, Supplement No. 13 (A/7 613).
617. United Nations. Statistical Yearbook 1969. United Nations. New York, 1970.
618. United States Atomic Energy Commission. Proceedings of Conference on Ground Disposal of Radioactive Wastes. USAEC report TID-7621 (1961).
619. United States Department of Health, Education and Welfare. National Air Sampling Network. Fourth quarter and annual summary 1962. Radio!. Health Data 4: 167-170 (1963).
620. United States Department of Health, Education and Welfare. National Food Consumption Survey: Fresh whole milk consumption in the U.S .. July 1962. Radio!. Health Data 4: 15-17 (1963).
621. United States Department of Health, Education and Welfare, Public Health Service, Radio!. Health Data and Reports from 1966 to 1971, passim.
622. Universidade Federal do Rio de Janeiro. Instituto de Biofisica. Annual report to the Brazilian Atomic Energy Commission (1970).
623. Van As, D. and H. 0. Fourie. A comparison of the 00Sr content in bone of population groups with high and low calcium diets, p. 1-24-1-34 in Health and Safety Laboratory fallout program quarterly summary report HASL-242. New York. 1971.
624. Van As, D. and C. M. Vleggaar. Determination of an acceptable 1311 concentration in air when the critical intake is through milk. Health Phys. 21: 114-116 (1971).
625. Van de Voorde, N., G. E. Cantillon, C. de Raikem et al. Low- and intermediate-level radioactive waste management in Belgium, in particular at MoL p. 433-459 in Management of Low and Intermediate Level Radioactive Wastes. IAEA publication STI/PUB/264, Vienna, 1970.
626. Van Pelt, W. R. and M. E. Wrenn. Attachment of radon-222 decay products to a natural aerosol as a function of aerosol particle size, section VI in volume II of Progress Report No. NY0-3086-11. New York University Medical Center, New York. 1971.
627. Vernov, S. N., E. V. Gortchakov. S. N. Kuznetsov et al. Earth's radiation belt. p. 40-49. vol. 1 in Proceedings of the 9th International Conference on Cosmic Rays. The Institute of Physics and the Physical Society, London. 1966.
628. Voilleque, P. G. Calculation of organ and tissue burdens and doses resulting from an acute exposure to a radioactive aerosol using the ICRP Task Group report on the human respiratory tract. Idaho Operations Office repon ID0-1206 7 (1968).
629. Volchok, H. L. Strontium-90 in New York City. Science 156: 1487-1489 (1967).
630. Volchok. H. L. Fall-out of Pu-238 from the SN,\P-9A Burnup-IV. p. 1-5-I-13 in Health and Safety Laboratory fall-out program quarterly summary repon HASL-207. New York. 1969.
63 l. Volchok, H. L. Worldwide deposition of 00Sr through 1969, p. I-70-I-80 in Health and Safety Laboratory fall-out program quarterly summary report HASL-227. New York. 1970.
632. Volchok, H. L. Worldwide deposition of ~0sr through 1971. To be published in Health and Safety Laboratory fall-out program quarterly summary report HASL-259. New York, 1972 (in press).
633. Volchok, H. L. and M. T. Kleinman. Radionuclides and lead in surface air. Appendix C in Health and Safety Laboratory fall-out program quarterly summary report HASL-245. New York, 1971.
634. Volchok. H. L. and lVL T. Kleinman. Worldwide deposition of 90Sr through 1970, p. 1-88-I-98 in Health and Safety Laboratory fall-out program quarterly summary report HASL-243. New York. 1971.
635. Volchok, H. L. and M. T. Kleinman. Global 00Sr fallout and precipitation: Summary of the data by 10 degree bands of latitude. p. I-2-1-83 in Health and Safety Laboratory fall-out program quarterly summary report HASL-245. New York. 1971.
636. Volchok, H. L. and P. W. Krey. Plutonium-239 anomaly in the troposphere, p. I-14-I-27 in Health and Safety Laboratory fall-out program quarterly summary report HASL-224. New York, 1970.
637. Von Butler, H. and W. F. Libby. National distribution of cosmic-ray produced tritium. Part II. J. Inorg. Nucl. Chem. 1: 75-91 (1955).
638. Von Dobeln, W. and B. Lindell. Some aspects of radon contamination following ingestion. Arkiv for Fysik 27: 531-572 (1964).
639. Waddington, C. J. The composition of the primary cosmic radiation. Progr. Nucl. Phys. 8: 3-45 (1960).
640. Waddington, C. J. Spectral composition-rapporteur paper, p. 462-468 in Proceedings of the 9th International Conference on Cosmic Rays. The Institute of Physics and the Physical Society, London, 1966.
641. Walton, A., R. Kologrivov and J. L. Kula. The concentration and distribution of radium in normal human skeleton. Health Phys. 1: 409-416 (1959).
642. Watt. D. E. Dose-equivalent rate from cosmicray neutrons. Health Phys. 13: 501-507 (1967).
643. Webber, W.R., J. F. Ormes and T. von Rosenvinge. Measurements of the energy spectrum of nuclei with Z ~ 3 in the primary radiation using a balloon borne Cerenkov-scintillation counter. p. 407-411. vol. I in Proceedings of the 9th International Conference on Cosmic Rays. The Institute of Physics and the Physical Society. London, 1966.
131
644.
645.
646.
647.
648.
649.
650.
651.
652.
653.
654.
655.
656.
657.
658.
659.
Weibel. E. R. Morphometry of the human Jung. Academic Press, Inc., New York. 1963. Welford. G. A. and A. Baird. Uranium levels in human diet and biological materials. Health Phys. 13: 1321-1324 (1967). Werner, L. B. Radioactivity in the hydrologic environment. p. 280-308 in Proceedinas for the Symposium on Public Health Aspects "of Peaceful Uses of Nuclear Explosives. Las Vegas. Nevada, April 7-11.1969. -\Verth. G. C.. M. D. Nordyke. L. B. Ballou et al. An analysis of nuclear explosive gas stimulation and the program required for its development. University of California report UCRL-50966 ( 1971). ' Whitton, J. T. Dose arising from inhalation of noble gases. Berkeley Nuclear Laboratories report RD/B/Nl274 (1968). Wollenberg, H. A. and A. R. Smith. A concrete low-background counting enclosure. Health Phys. 12: 53-60 (1966). Woodard. H. W. The elementary composition of human cortical bone. Health Phys. 8: 513-517 ( 1962). Woodward. R. N. Transfer of northern hemisphere fall-out to the southern hemisphere. Nature 210: 1244-1245 (1966). World Health Organization. International Atomic Energy Agency.~ Public health implications of radioactive waste releases. Vol. 11. p. 725-739 in Peaceful Uses of Atomic Energy, Proceedings of the Fourth International Conference. Geneva. 6-16 September I 971. Published by the United Nations and the International Atomic Energy Agency, 1972. Wortley. G. Dietary levels of strontium-90, caesium-137 and iodine-131 for the years 1965-68. Final report covering period 1.1.65-28.2.69. Joint FAO/IAEA Division of Atomic Energy in Food and Agriculture, 6.3.69: v. United Nations document A/ AC.82/G/L. l 27 4. Wray. E. T. Environmental monitoring associated with discharges of radioactive waste during 1969 from UKAEA establishments. United Kingdom Atomic Energy Authority report (RP) R- 105 Harwell, Berkshire, 1970. Wrenn, M. E., R. Broseur, M. Eisenbud et al. Caesium-13 7 and strontium-90 in milk, grass and soil from Jamaica. section VII in volume III of Progress Report No. NY0-3086-11, New York University Medical Center. New York. 1971. Wrenn, M. E. and N. Cohen. Jron-55 from nuclear fall-out in the blood of adults: dosimetric implications and development of a model to predict levels in blood. Health Phys. 13: 1075-1082 (1967). Yamagata, N. and K. Iwashima. Environmental contamination with short-lived radionuclides in Japan in 1961. J. Rad. Res. 3: 1-15 ( 1963). Yamasaki, F., M. Okano. T. Nagahara et al. External radiation doses from fallout in Tokyo and its vicinity. J. Rad. Res. 5: 113-115 (1964). Yamashita, M., L. D. Stephens and H. W. Patterson. Cosmic-ray produced neutrons at ground level: neutron production rate and flux distribution. J. Geophys. Res. 71: 3817-3834 (1966).
660. Yeates, D. B., A. S. Goldin and D. W. Moeller. Radiation from natural sources in the urban environment. Harvard School of Public Health Report HSPH/EHS 70-2. Boston, 1970.
661. Young, G. A. Base surge analysis-HE analysis, operation Jangle. U.S. Naval Ordnance Laboratory, White Oak, Maryland report NOLR-1169 (1952).
662. Zavodski, D. Radon concentration in the surface layer of the atmosphere in Bratislava, p. 47-53 in Radioactivity of the Atmosphere. Moskovskoe Ordelenie Gidrometeoizdata. Moscow. 1970. U.S. Atomic Energy Commission translation report AEC-tr-7268.
663. Eem1e, IO. C., 3. i\>1. Kp11c10K, 0. B. Jle6e.nen H
.up. Co.!1.epiKam1e Ue3H51-l 37 H KamHJ y HaCeJieHHSI CCCP B 1962-1966 rr., ATOMH3.ll.aT, MocKBa, 1967; .110KyMeHT OOH A/AC.82/G/L.1193.
664. Ep~10.'1aeBa-Ma1<0BCl<a51, A. n., JI. A. nepuon ll
.[l. l<. DonOB, DoJIOHllfi-210 B opraHH3~1e H 0Kpy)l(3I0IUeH cpe.!le, ATOMli3.!laT, MoCKaa, 1968; .u.oKyMeHT OOH A/AC.82/G/L.1260.
665. 3ai!ueBa, A. <!>., M. n. fepacm,,ona, P. M. Eapxy.napoB H .11.p. Co.!lepiKaHHe ue3HH-l 37 r.106anbHOro nponcXOiK.!leHIHI B opraHH3Me y B3p0CJIOro Hace.'IeHliH r. M.ocKBbl B 1968-1969 rr., ATOM· 113.llaT, 1970.
666. 3b1K0Ba, A. C., E. JI. TenywKirna, B. n. Py6neacKm1, r. n. Ecpper.toBa, r. A. Ky3HeuoBa. Co.nep}KaHHe CTpOHL.t:HH-90 11 ue3H51- l 3 7 B HeKOTOpb!X 061,eKTax BHell!He11 cpe.nbI u B opram13~1e mo.neil B 1958-1967 rr. MocKna, 1968; .noKyMeHT OOH A/ AC.82/G/L.1248.
667. l1fapae,1, IO. A., B. H. neTpOB, A. 5L flpeotaH II
.up. Pa.!JJIOaKTHBHOe 3arp.H3HeH!le np11pO.UHblX cpe.n npH no.u3eMl!blX 51,!1.epHbIX B3pb1Bax H MeTO· JI.bi ero rrporno311ponamrn. MocKBa, 1969.
668. Ke.upoacKm1, 0. n., B KHttre Peaceful Nuclear Explosions, cTp. 17-21. Proceedings of a Panel, Vienna, 2-6 March 1970. L..\EA Publication STI/PUB/273, Vienna, 1970.
669. I<11pnL1eHK0, B. H., .[l;K, r. XaL111pon, C. A. ,Uy6· pOBHH Ii .up. 3KcnepHMeHT8,1bHOe H3ytieHHe pacnpe.neJieHH51 KOpOTKO)KHBYIUHX .!l01!epH1lX npoJJ.yt<TOB pa.noHa B .!lbIXaTeJibHblX nyn1x, rurneHa u caHJnap1rn: 2: 52-56 ( 1970).
670. l<HH11<H11K0B, B. A. H A. A. Mo.HceeB. Heony6n11-K0BaH0.
671. l<HM)l{HHKOB, B. A., 3. B. DeTyxosa, IO. C. CTenaHoB u ,up. nocTynJieHHll CTpOHUHH-90 c nHmeBblM paun0Hm1 HaceJJeHHIO CCCP B 1959-1967 rr. B pe3y.lbTaTe CTpaToccpepHbIX Bbtna.!{eHHM, ATOMH3.UaT, .MocKBa, 1969; .ll.OKyMeHT OOH A/AC.82/G/L.1328.
672. Mapel1, A. H. Heony6m11<0BaH0. 673. Mapeti , A. H., P. M. Eapxy.a.apon, H. ~- Hoatt
Kosa. Ue3m1-13 7 rno6aJJbHblX Bbma.ueHHH Kale HCT01!HllK o6.'ly4eHH51 Hace.neHH51 no.7JeCb51, B ne'!8TH.
132
674. Mapei!, A. H., E. K. EopHcoB. 0 co,uep:arnmrn CTpOHUM.H-90 B KOCTHOH TKaHH H8CeJieHH51 ConeTCKOro Co103a B 1969 rony. Heony6;111K0BaH0.
675. Mape11. A. H., EopHcOB, E. K. ll11HaMHKa CTpOHUHH-90 B l<OCTHOH TKaHH Hace.'leHH51 CoBeTCKOro Co103a 3a 1969-1971 rr. Heony6:1HKOB8HO.
676. MapeH, A. H., A. H. KapMaena. Het<OTOpbte rurneH1111ecKHe acneKTbl npo6neMbl pa.!urn-226, .MocKBa, 1965; ,u.oKyMeHT OOH A/AC.82/G/L.1088.
677. MottceeB, A. A. 11 .11.p. Heorryom-nrnBaHo.
678. MyxHH, H. E., JJ. H. HaroBHUHHa. Co.n.ep:>1rnH.He CTpOHUJrn-90 B rnooaJibHblX BbIII8.!leHHllX Ha TeppHTOplU! YKpauHcK011 CCP B 1963-1966 rr., ATOM113.UaT, Moct<Ba, 1967; .ll.OKp1eHT OOH A/AC.82/G/L.1199 .
679. HMmHHKoB, A. H., M. A. HencrpyeBa, n. B. PaM-3aen u .np. Ue3m1-137 B uerro11Ke .1Juwai1HHKOJ1eHb-'!eJ10BeK Ha KpatiHeM ceBepe CCCP ( 1962-1968 rr.), AToMH3.U.aT, MocKBa, 1969; .!lOKyMeHT OOH A/AC.82/G/L.1327.
680. T1epu.oB, JI. A. HeKOTOpbie pa,n:HaUHOHHO-rnrne HH1!eCKHe acrreKTbl l',ll{l{p0K'1HMaTa CTpOeHHH, ArnMH3.!laT, MocKBa, 1967; .!lOK)~leHT OOH A/AC.82/G /L.1181.
681. IleTyxoBa, 3. B., B. A. l<HHiKHHKOB. nocTym1e~rne CTpOHmrn-90 H ue3HH-137 c mnueBbIM paUHOHOM ttace.11eHHIO CoaercKoro Co103a B 1966-1967 rr. B pe3yJlbTaTe CTpaTOCq>epHblX Bbin8,ll,eH!fli, ATOMH3.!l8T, MoCKaa, 1968; .!lOKyMeHT OOH A/ AC.82/G/L.1245.
682. IleTyxoBa, 3. B., B. A. l<H11iKHHKOB. Co..'lep,1-aHne CTpOHUH51-90 H ue3H51-l37 B llHIUeBOM paUHOHe Hace.11emrn CoaeTcKoro Co103a B 1967-1969 rr . Heony6JIHI<OBaHo.
683. DpHcTep, 6. C. CTOBe.ueH11e ypaHa B 61-10.r1orn11ecKOH ueno11Ke, ATOMH3.!laT, MocKBa, 1969; ~oKyMeHT OOH A/ AC.82/G/L.1298.
684. DpoKOq>ben, 0. H., M. A. HencTpyeBa, A. A. nepoaa 11 .a.p. Ue3Hi1-l 37 r:106aiibHblX BbmaAemn1 B npo.nyKTaX nHTaHH5I B opraHH3Me '-!eJIOBeKa, ATOMH3.llaT, MocKBa, 1969; .ll.OKyMeHT OOH A/AC.82/G/L.1326.
685. C11B11HUeB, IO. B., B. A. KaHapei'.iKHH, 0. M. ApyTHHOB. H3MeHeHHe KOHUeHTpamm Cs-137 B opraHH3Me '!eJIOBeKa. Pa.u.1106110.'IOrnH 6: 822-825 (1966).
686. c~mpO.!lHHUeBa, r. H., C. H. TapacoB, A. <P. OpeWHHa H .ll.p, J;I3y11eHHe a3poreHHOro IlOCTynJieHHll m1yTOHH51-239 B opraHl-13~! 1!eJIOBeKa, ATOMH3,!l.aT, Moc1rna, 1968; .!lOKyMeHT OOH A/AC.82/G/L.-1301.
687. Yllla1rnBa, A. n., YI. A. J111xTapeB, A. A. MoHce· ea. OueHKa <i:CTonymruHOHHOH .ZI03hI» o6JiytJeHH51 nace,1eHHH CCCP or rno6am,Horo ue3HH-137, AToMH3.llaT, MocKBa, 1969; ,noKyl\teHT OOH A/AC.82/G/L.1330.
Annex B
DOSES FROM i\IEDICAL IRRADLt\.TION
CONTENTS
INTRODUCTION .••....................••....
I. DIAGNOSTIC X-RAY EXAMINATIONS ••.......
A. Growth of diagnostic radiology ..... . B. Limitatiom of radiological surveys ... .
1. Frequency of examinations ........ . 2. Selection of patients or centres ... . 3. Gonad-dose measurements ........ . 4. Child expectancy ................ .
C. Genetically-significant dose .......... . 1. Description of surveys ........... . 2. Gonad dose .................... . 3. Genetically-significant dose by exam-
ination type .................... . 4. Genetically-significant dose by sex
and by age at examination ....... . 5. Other investigations ............. .
D. Bone-marrow dose ................. . 1. Variation with type of examination 2. Determination of mean bone-marrow
dose ......................... · · 3. fer .capllt mean marrow dose by exam-
mation type .................... . 4. Dental radiography .............. .
Introduction
Paragraphs
1-16 17-89 17-19 20-38 22-25
26 27-31 32-38
39-72 39-59 60-63
64-65
61Hi8 69-72 73-83 77-78
79-80
81-82 83
1. The population exposure due to the medical uses of ionizing radiation and of radio-isotopes was last reviewed by the Committee in its 1962 report (148). The present annex summarizes the information published therein and reviews the data that have since become available on radiation exposure from diagnostic x-ray examinations, from x- and gamma-ray therapy and from the diagnostic and therapeutic use of radio-active materials prepared for administration as radio-pharmaceuticals or used as sealed sources.
2. For each of these types of exposure, the following aspects have been considered:
(a) The number of examinations carried out in various centres and the gonad and genetically-significant doses arising from them;
( b) The mean bone-marrow dose ( see however paragraphs 11 and 73) ;
(c) The skin dose from the various x-ray examinations or the dose to the organ of reference in the case of radio-pharmaceuticals.
3. The data are presented and analysed so as to identify and assess the trends currently developing in medical radiology and to suggest the epidemiological studies to which particular groups of patients may lend themselves. This requires determining the pro-
133
E. Dose to the skin and other organs ... .
F. Trends with extensive examinations ... .
G. Recommendations for the protection of the patient in diagnostic radiology ....
II. DIAGNOSTIC USE OF RADIO-PHARt.L-\CEUTICALS
1. Organ dose from radio-pharmaceuti-cals ............................ .
2. Genetically-significant dose ....... .
Ill. X- AND GAMMA-RAY TREATMENTS
t. Genetically-significant dose 2. Bone-marrow dose ............... . 3. Doses to other organs ........... .
IV. THERAPEUTIC USE OF RADIO-PHAR!.L-\CEUTI-CALS ....•.••.....••.•.••.....•.•....•.
V. CONCLUSIONS .•....••••.•..•••.•••.....
APPfu",DIX •••••••••••••••••••••••••••••
TABLES
REFERENCES ...•••..•.•.........•••....
Parcgraph.r
84-86
87-88
89
90-97
94 95-97
98-109
100-102 103-108
109
110-113
114-116
Page
150
152
168
cedures that contribute significantly to population doses and the effects that changes in radiological practice or technical advances will have on the magnitude of the radiation doses.
4. A number of groups of patients have already been identified as receiving high doses, and some of them have been shown to have an incidence of certain diseases higher than in comparable but nonirradiated groups. Similar groups of patients may be identified as a result of particular radiation dose surveys. For example, guided by the findings of the British survey of medical irradiation (25), Doll and Smith (33) studied women in whom artificial menopause had been induced for the treatment of metropathia and showed an incidence of leukremia about four times as high as that in the control group.
5. The annexes of previous Committee reports (147-149) and annex H of this report contain the results of studies on other groups of patients exposed for medical reasons to x-rays and radio-active materials who were studied to determine the incidence of longterm effects of radiation. These include studies of patients undergoing diagnostic examinations:
(a) Children irradiated in wero (139-141);
( b) Patients investigated using thorium products as a contrast medium ( 46, 88); and
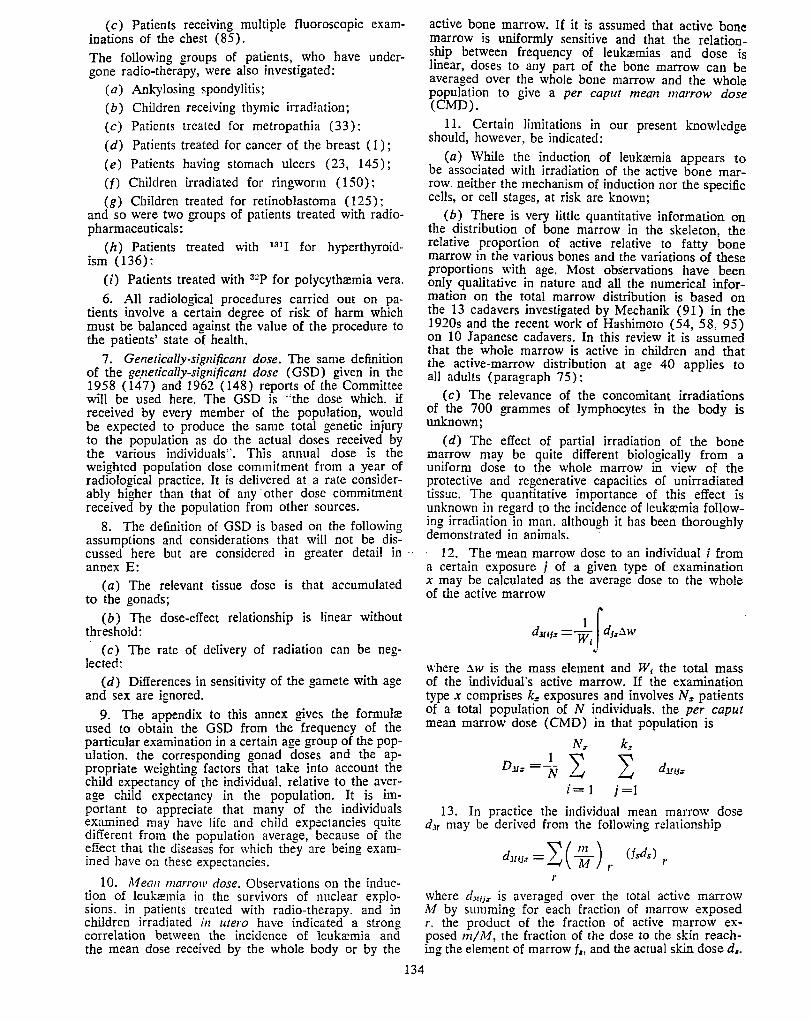
( c) Patients rece1v10g multiple fluoroscopic examinations of the chest ( 8 5) .
The following groups of patients, who have undergone radio-therapy, were also investigated:
(a) Ankylosing spondylitis;
( b) Children receiving thymic irradiation;
( c) Patients treated for metropathia ( 33);
( d) Patients treated for cancer of the breast ( 1); (e) Patients having stomach ulcers (23, 145);
(f) Children irradiated for ringworm (150) ;
(g) Children treated for retinoblastoma (125); and so were two groups of patients treated with radiopharmaceuticals:
(h) Patients treated with 131! for hyperthyroidism (136):
(i) Patients treated with 3~P for polycythremia vera.
6. All radiological procedures carried out on patients involve a certain degree of risk of harm which must be balanced against the value of the procedure to the patients' state of health.
1. Genetically-significant dose. The same definition of the ge.netically-significant dose ( GSD) given in the 1958 (147) and 1962 ( 148) reports of the Committee will be used here. The GSD is ··the dose which. if received by every member of the population, would be expected to produce the same total genetic injury to the population as do the actual doses received by the various individuals". This annual dose is the weighted population dose commitment from a year of radiological practice. It is delivered at a rate considerably higher than that of any other dose commitment received by the population from other sources.
8. The definition of GSD is based on the following assumptions and considerations that will not be discussed here but are considered in greater detail in annex E:
(a) The relevant tissue dose is that accumulated to the gonads;
( b) The dose-effect relationship is linear without threshold:
( c) The rate of delivery of radiation can be neglected:
(d) Differences in sensitivity of the gamete with age and sex are ignored.
9. The appendix to this annex gives the formulre used to obtain the GSD from the frequency of the particular examination in a certain age group of the population. the corresponding gonad doses and the appropriate weighting factors that take into account the child expectancy of the individual. relative to the average child expectancy in the population. It is important to appreciate that many of the individuals examined may have life and child expectancies quite different from the population average, because of the effect that the diseases for which they are being examined have on these expectancies.
10. Mean marrow dose. Observations on the induction of leukremia in the survivors of nuclear explosions. in patients treated with radio-therapy. and in children irradiated in utero have indicated a strong correlation between the incidence of leukremia and the mean dose received by the whole body or by the
134
active bone marrow. If it is assumed that active bone marrow is uniformly sensitive and that the relationship between frequency of leukremias and dose is linear, doses to any part of the bone marrow can be averaged over the whole bone marrow and the whole population to give a per caput mean marrow dose (CMD).
11. Certain limitations in our present knowledge should, however, be indicated:
(a) While the induction of leukremia appears to be associated with irradiation of the active bone marrow, neither the mechanism of induction nor the specific cells, or cell stages, at risk are known;
( b) There is very little quantitative information on the distribution of bone marrow in the skeleton. the relative proportion of active relative to fatty bone marrow in the various bones and the variations of these proportions with age. Most obs·ervations have been only qualitative in nature and all the numerical irtformation on the total marrow distribution is based on the 13 cadavers investigated by Mechanik (91) in the 1920s and the recent work of Hashimoto (54, 58, 95) on 10 Japanese cadavers. In this review it is assumed that the whole marrow is active in children and that the active-marrow distribution at age 40 applies to all adults (paragraph 75):
(c) The relevance of the concomitant irradiations of the 700 grammes of lymphocytes in the body is unknown;
( d) The effect of partial irradiation of the bone marrow may be quite different biologically from a uniform dose to the whole marrow in view of the protective and regenerative capacities of unirradiated tissue. The quantitative importance of this effect is unknown in regard to the incidence of leukremia following irradiation in man. although it has been thoroughly demonstrated in animals. - 12. The mean marrow dose to an individual i from a certain exposure j of a given type of examination x may be calculated as the average dose to the whole of the active marrow
du.,,= :.f d,,ow
where ;lw is the mass element and W 1 the total mass of the individual's active marrow. If the examination type x comprises k:r exposures and involves N :r patients of a total population of N individuals, the per caput mean marrow dose ( CMD) in that population is
N:r k.T 1 I I Du::: =N duiJ=
i= I j=l
13. In practice the individual mean marrow dose d.u may be derived from the following relationship
dmJ.r = I( ;~) r Usds) r ,.
where dM1ir is averaged over the total active marrow M by summing for each fraction of marrow exposed r. the product of the fraction of active marrow exposed m/M, the fraction of the dose to the skin reaching the element of marrow f ,, and the actual skin dose d •.
14. In a survey conducted in Japan (58) a weighting factor was applied to the calculation of the bonemarrow dose to cive a "leukremia-significant" dose. The weighting factors were based on the fact that the incidence of leukremia in the population exposed to the nuclear explosions at Hiroshima was a function of time after exposure (paragraph 7 6).
15. Radiation quantities. In the original papers referred to in this review. various radiation quantities have been used. namely, exposure, absorbed dose, and dose equivalent. For the sake of consistency these will be converted throughout to absorbed dose on the basis of an absorbed dose of one rad corresponding to an exposure of one roentgen and to a dose equivalent of one rem. For gonad-dose measurements in the !ange. of quali~es used in diagnostic radiology, some mvesugators ('::i7, 118, 119) have used a conversion of about 0.94 rad per roentgen.
16. The dosimetry of the radiation absorbed in the bone marrow is made complex by the need to take into account the fact that the marrow is enclosed in the spaces between bone trabeculre. Both the distribution of the sizes of these spaces and the thickness of the trabeculre vary in the various parts of the s~eleto.n. The average dose to the marrow at any given site will depend on the number and energy of the photo-electrons emitted from the bone trabeculre and, therefore. on the quality of the radiation. used. A conversion. factor from roentgen to rad units must be based on a particular model of marrow distribution and will be a function of radiation quality. Such factors have been used in some of the bone-marrow dose surveys (25, 58).
I. Diagnostic x-ray examinations
A. GROWTH OF DL.\GNOSTIC RADIOLOGY
17. The growth of diagnostic radiology must be considered in relation to the chanoes in its contribution to population exposure. The £actors affecting the total growth are:
(q) The number of examinations of each type being earned out;
(b) The types of procedure being carried out;
(c) Changes in the complexity of the procedures; and
( d) Changes in the technical facilities available, viz. the use of irnae:e intensification, cine procedures and biplane apparatuses.
However, the changes in the GSD and the CivID will also depend on whether the doses received by the patient during the particular procedures increase or decrease. The awareness of the radiological staff of the importance of the protection of the patient is probably the greatest factor in the control of population exposure.
18. The over-all increase in the number of radiological examinations has been assessed as 4 per cent per year in New Zealand (1959-1963) (156), 6 per cent per year in Sweden (1965-1969) (152), 2 per cent per year in the United Kingdom (1958-1961) (99), whereas (21, 106) the increase was a little over 3 per cent per year in the Un~ted States during the 1960s. These figures, however, mclude the effect of increasing population. When this is excluded, the rate of examination appears to have increased about
135
~ per cent. per year during t?e 1960s. A useful study m the Umted States ( 60) illustrates the chang:es in f~equency ~d age distribution of 10 diagnostic -radiat101;1 categones over the years 1963, 1966 and 1968. Thi~ survey was c~ried out in 228 general hospitals havmg patlents staymg for short periods. The averaoe annual observed increment for each of the 10 cateoori~s was I. 7 per cent and the total annual increment was approximately twice this value. This study emphasizes the need to study over a period of years the variation in the age-specific frequency of a particular examination ~nd t~e ~hanges in the over-all pattern of diagnostic mvest1gat1ons, such as may be due to the increasing popularity of a particular examination. Such studies have been recommended by the World Health Assembly ( 122) to Member States and relevant data are included in the report of an expert committee on the medical uses of radiation ( 157).
19. Services in developing countries. Valid statistics from developing countries are not currently available but every indication shows that there is a great difference between the facilities provided in such countries and those available in the more technically advanced countries. Therefore such services need to be expanded with appropriate emphasis given to modern techniques and good patient protection (77). In developing countries, x-ray facilities are often only available in the main cities and even in industrialized countries there are often large but sparsely populated areas where such services are very limited. It is likely that a large proportion of the world population does not have easy access to modern x-ray facilities. It is obvious. therefore. that the rates of increase quoted in paragraph 18 are relevant only to countries in which a highly sophisticated medical care system is already in existence. In countries in which medical care and preventive medicine are not as developed. the rate of increase is expected to be many times higher during the next decade. -
B. LIMITATIONS OF RADIOLOGICAL SURVEYS
20. The design of surveys for the estimation of the GSD or of the CMD received by a particular population was considered by the International Commission on Radiological Protection (ICRP) and the International Commission on Radiation Units and Measurements (ICRU) in 1955 (42) and 1959 (43) and involves the consideration of the following factors:
(a) The method of obtaining- the data on the frequency of exa:minations and the size of the sample required for that purpose;
( b) The selection of the number of patients for whom doses are to be measured or estimated and the choice of centres at which this is to be done;
( c) The actual method of measuring or estimating the dose for each type of examination. Since examinations may involve a number of irradiated fields of differing area, focal skin distance and radiation quality. sufficient numbers must be studied to constitute a reliable average of each type of examination, particularly for those that make the !!featest contribution to the GSD or the CIYID; ~
(d) For the estimation of the GSD. the expectation of subsequent parenthood according to age within each group of patients undergoing a particular type of examination; and
( e) For the estimation of bone-marrow doses, the distribution of the active bone marrow.
21. Each of the above parameters introduces into the final result some sampling error the magnitude of which will decrease as the size of the sample increases. On the other hand, a systematic bias towards lower doses may result from the presence of an observer or from the foreknowledge of the subsequent dose estimation. An analysis of these factors is given in the following paragraphs.
1. Frequency of examinations
22. It is important to determine with the greatest accuracy the frequency of those examinations which can be judged to make the greatest contribution to the population dose. The frequency of such examinations may be low. For example. in the 1957-1958 British survey (26). obstetrical abdomen examinations contributed 24 per cent of the GSD though their frequency was only 0.6 per cent of the total yearly examinations. The main problem in comparing frequencies from one country with those from another is that the actual procedures may be considerably different for examinations similarly defined.
23. Two basic approaches have been used. The vast majority of the surveys have entailed the collection of the over-all numbers of examinations in age classes from all, or a known fraction of. hospitals, clinics and private practices over a given period of time. This period has varied from a few days to 18 months. Typical values of the percentage of the total year"s work in these samples are 40 per cent in the Netherlands (14), 8 per cent in Finland ( 67), 6.4 per cent in Czechoslovakia (80). 3.5 per cent in New Zealand (156), 2.5 per cent in the United Kingdom (26) 1957-1958. and 2 per cent in Sweden (82). The numbers of persons undergoing examination in the radiolocical departments included in these surveys have been very large and typical values are 254.000 in Czechoslovakia ( 80), 143.000 in Finland (67) and 40,000 in New Zealand (156).
24. The second method whlch was utilized in the United States 1964 survey ( 106), depends on the selection of householders by a multistage design that permits a continuous sampling of the civiliarr population. After house-to-house interviews of some 31,000 people, about 3.600 of the 4,500 people who had been radiographed in the ·past three months were traced. Forty per cent of these. however. had been radiographed for dental examinations. About 2,200 people. therefore, provided the data on the frequency of examinations in radiological department. represent!llg some .0.002 per cent of the radiology carried out m the Umted States in one year. In 1970, the United States repeated the national survey using the same methodology that was employed in the 1964 survey except that they doubled the sample size so that over 67 ,OOO persons were interviewed in the household interview survey ( 21 ) .
25. The consumption of x-ray film per year is not in itself a reliable method for estimatin!! GSDs. because for a given film size used at a particular site, the g:onad dose will depend on whether good or bad practice is followed. However. within any one institution. film consumption will follow seasonal variations in the frequency of examination as long as changes in techniques. such as the replacement of conventional radi-
136
ograpby by photofluorographic methods, do not take place. The consumption of film by month or quarter bas been used in a number of surveys ( 26, 80), in relation to the number of examinations carried out during a sample period of the year. to obtain the yearly number of examinations.
2. Selection of patients or centres
26. The hospitals and clinics at which the measurements of gonad doses or the collection of exposure data are to be carried out are usually selected on the basis of their size and geographical location. In some surveys, however, only one or a few centres were utilized and this obviously is likely to have biased the results since the particular hospitals selected were usually the largest or leading ones in the area surveyed and hence can be expected to have a higher standard of radiological practice and of patient's protection than is common in the area. In a number of surveys no measurements were carried out and values of gonad doses published in the literature were utilized. In the United States in both the 1964 and 1970 surveys (21, 106), the centres themselves supplied exposure data on the patients selected in the frequency survey.
3. Gonad-dose measurements
27. The need to establish reliably the mean gonad dose per examination is obvious. However, for any one type of examination, the effort should be proportional to the contribution of the examination to the total dose. The difficulty, as far as sample surveys are concerned, is that, by altering the position of the edge of the beam by a few centimetres, the gonads of the patient may be just in or just out of the beam. This can change the gonad dose by a factor of ten or a hundred (100). Similarly, the use of gonad shields greatly reduces the gonad dose when the gonads are in the direct beam.
28. The determination of gonad doses may be direct or indirect. Direct measurements of male gonad doses with the dosemeter in contact with the scrotum have been made in a large number of surveys. A few surveys (119, 132) have made measurements of female gonad doses by placing dosemeters in the vagina or rectum but most surveys have relied on an abdominal skin measurement during an examination of female patients and converted it by phantom measurements to an ovary dose. In one survey (69) a multiple regression method was utilized for the conversion. In the indirect method of g:onad-dose determination used in the United States for both the 1964 and the 1970 surveys ( 21, 106), the radiological centre returned the exposure factors together with an exposed film providing the appropriate field size and radiation quality. The data were then used in phantom experiments to derive the gonad dose.
29. The objection to the direct method is that the presence of the observer may tend to make staff use optimal operational discipline and be more aware of whether the gonads are in the beam or not. The indirect method. -on the other hand. is retrospective by at least three months. and staff cannot state accurately the exact field size or precisely where the film was applied.
30. Typical numbers of actual gonad dose measurements made in the large surveys are 10,000 in Czechoslovakia (80). 3.800 in New Zealand (156),
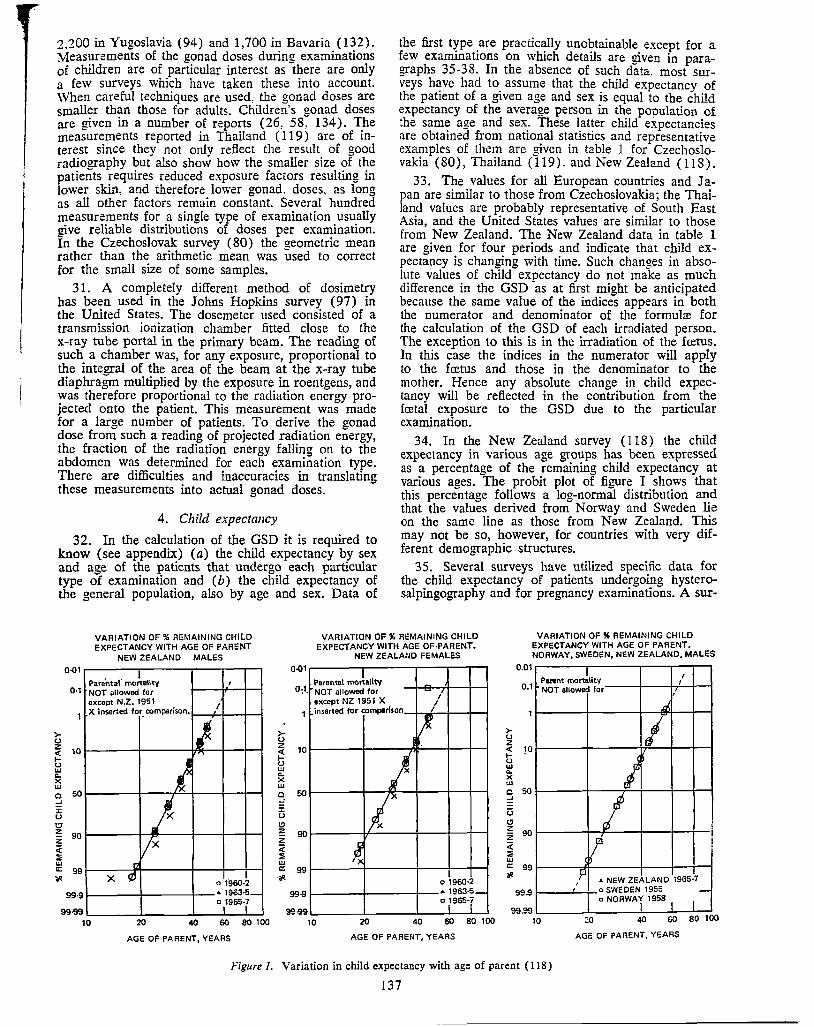
2.200 in Yugoslavia (94) and 1,700 in Bavaria (132). Measurements of the gonad doses during examinations of children are of particular interest as there are only a few surveys which have taken these into account. When careful techniques are used, the gonad doses are smaller than those for adults. Children·s gonad doses are given in a number of reports (26, 58, 134). The measurements reported in Thailand (119) are of interest since they not only reflect the result of good radiography but also show how the smaller size of the patients requires reduced exposure factors resulting in lower skin, and therefore lower gonad. doses. as long as all other factors remain constant. Several hundred measurements for a single type of examination usually give reliable distributions of doses per examination. In the Czechoslovak survey ( 80) the geometric mean rather than the arithmetic mean was used to correct for the small size of some samples.
31. A completely different method of dosimetry bas been used in the Johns Hopkins survey (97) in the United States. The dosemeter used consisted of a transmission ionization chamber fitted close to the x-ray tube portal in the primary beam. The reading of such a chamber was, for any exposure, proportional to the integral of the area of the beam at the x-ray tube diaphragm multiplied by the exposure in roentgens, and was therefore proportional to the radiation energy projected onto the patient. This measurement was made for a large number of patients. To derive the gonad dose from such a reading of projected radiation energy, the fraction of the radiation energy falling on to the abdomen was determined for each examination type. There are difficulties and inaccuracies in translating these measurements into actual gonad doses.
4. Child expectancy
32. In the calculation of the GSD it is required to know (see appendix) (a) the child expectancy by sex and age of the patients that undergo each particular type of examination and ( b) the child expectancy of the general population, also by age and sex. Data of
the first t¥pe .are practic~y uno~tainable except for a few exammat1ons on which details are !riven in paragraphs 35-38. In the absence of such data. most surveys have had to assume that the child expectancy of the patient of a given age and sex is equal to the child expectancy of the average person in the population of the same age and sex. These latter child expectancies are obtained from national statistics and representative examples of them are given in table 1 for Czechoslovakia ( 80), Thailand ( 119). and New Zealand ( 118) .
33. The values for all European countries and Japan are similar to those from Czechoslovakia; the Thailand values are probably representative of South East Asia, and the United States values are similar to those from New Zealand. The New Zealand data in table 1 are given for four periods and indicate that child expectancy is changing with time. Such changes in absolute values of child expectancy do not make as much difference in the GSD as at first might be anticipated because the same value of the indices appears in both the numerator and denominator of the formul~ for the calculation of the GSD of each irradiated person. The exception to this is in the irradiation of the fcetus. In this case the indices in the numerator will apply to the fcetus and those in the denominator to the mother. Hence any absolute change in child expectancy will be reflected in the contribution from the fretal exposure to the GSD due to the particular examination.
34. In the New Zealand survey (118) the child expectancy in various age groups has been expressed as a percentage of the remaining child expectancy at various ages. The probit plot of figure I shows that this percentage follows a log-normal distribution and that the values derived from Norway and Sweden lie on the same line as those from New Zealand. This may not be so, however, for countries with very different demographic structures.
35. Several surveys have utilized specific data for the child expectancy of patients undergoing hysterosalpingography and for pregnancy examinations. A sur-
VARIATION OF% REMAINING CHILD EXPECTANCY WITH AGE OF PARENT
NEW ZEALAND MALES
VARIATION OF% REMAINING CHILD EXPECTANCY WITH AGE OF,PARENT.
VARIATION OF% REMAINING CHILD EXPECTANCY WITH AGE OF PARENT. NORWAY, SWEDEN, NEW ZEALAND. MALES
0-01 .------.---~--,--...-,
Parental' mortality 0•1 NOT allowed for
except N.Z. 1951 / X inserted for. comparison.1---1-1---+---1
>-0 z ~ 10 u w a. X w a ro1-----t---f-'-'--+---1----,,--i ..J
J: 0 't!T ~ 901-----t---1'.1>----+---1----,r--1
< ::. w ~ 99 1-----Pt-----+---1----,r--1
>-0
NEW ZEALAIJD FEMALES
0-01 .-------.----~--,--i--, Parental mortality
0:1. NOT allowed for except NZ 1951 X I
I
1 inserted for comparison-1-...,...-1--t--i
z 10 1-----1-----.---1----,r--1
~ w a. X w a rol----+---re-+---+--,r-i ..J
J: u (,!J
~ 001----+,'----t---+--r--t
< ::;; w ~ 991----+---+---+--r-i
~ X o 1960-2 ~ o 1960-2 99.9 1----+-----"t---" 1963·5 99·9 1--------i---• 1963·5
a 1965-7 o 1965-7
0.01
0.1 '· I Pantnt mortality I NOT allowed for '
n
>-0 z <( JO I-
,-t1
u w a. X w C 50 ..J
u (,!J z
90 z < ::. w
I /
! j !
~ 99 ~
99.9
99.99
,ll • NEW ZEALAND 1965-7 o SWEDEN 1955 -o NORWAj 1958 (
I ~~._ __ _. ___ ..._ _ _.___._. ~~'----'-----'---'---'-' 10 20 40 60 80 100 10 20 40 60 80 100 10· 40 60 80 100
AGE OF PARENT, YEARS AGE OF PARElff, YEARS
Figure I. Variation in child expectancy with age of parent ( 118)
137
AGE OF PARENT, YEARS
vey in Brno. Czechoslovakia ( 80), followed up 700 women who had had hysterosalpingography examinations and showed that 25 per cent of them gave birth to live children after the examinations. This factor of 0.25 was applied to the average population statistics for the particular age class. Other surveys used different factors-0.5 in the Netherlands (14), Sweden (82), and Texas (27), and 0.1 in the United Kingdom (26).
36. For examinations connected with pregnancy, several surveys have utilized as the expected number of offspring the average population statistics for the particular age class concerned less 1 ( or less 0.99) in recognition of the fact that the fretus must be considclass was derived which also resulted in a considerable ered separately with its own child expectancy. In the Dutch survey (14) a more detailed relationship by age reduction in child expectancy. It is doubtful whether this type of correction is appropriate, for it may be argued that a woman in a particular age class who is currently pregnant is more likely, rather than less likely, to have more children than the average woman in the population of that age class. This was confirmed in a survey based on the 1951 British census (98) which showed the following expectations in the different age classes:
Child exputaney
Age dass Now Average (years) pregnant in population
15-19 .. - ·- ............... 2.78 2.207 20-24 .... -............... 2.23 1.733 25-29 .................... 1.84 1.017 30-34 .................... 1.60 0.462 35-39 .................... 1.47 0.157 40-44 .................... 1.38 0.030
37. A correction (9 per cent) for multiple pregnancies, twins, etc. was included in the British survey (26), as multiple pregnancy is one of the clinical indications for x-ray examination. The correction increased the number of offspring per pregnancy x-ray examination by 9 per cent.
38. The contribution from fretal irradiation during examinations not apparently connected with pregnancy, or before the pregnancy was determined, was assessed in some survevs on the basis of the number of women in the population that are pregnant at any given time. This was estimated to be 6 per cent in Finland (67) and 9 and 3 per cent in the 15-29 and 30-49 age groups. respectively. in the United Kingdom (26). In New Zealand (156) the same contribution varied with age as follows:
A11e groJCp (years)
15-19 20-24 :!.5-29 30-34 35-37 40-44 45-49
Percrnta.fle pregnant
at a,iy onL" time
3.59 19.70 20.22 11.95 5.84 1.72 0.12
In the f,;etherlands (14). however. a further correction facror of 2h was appiied to take into account the reluctance of clinicians to request x-ray examinations of pregnant women.
138
C. GENETICALLY-SIGNIFICANT DOSE
l. Description of surveys
39. The 1962 report gave detailed information on surveys carried out in 12 countries or dist..--icts. The resulting GSD due to diagnostic radiology ranged from 7 to 56 millirads. These surveys were carried out during the period 1950-1961 but most of them during the last five years of that period. A summary of the results is given in table 2 which is abstracted from the 1962 report of the Committee (annex G, tables I, XVII, XXI).
40. Since 1962. a considerable number of investigations in other countries and large districts have been reported. The results of these surveys are given in table 3 and the details of each study in paragraphs 47 to 59. The GSDs range from 5 to 75 millirads and are therefore similar in magnitude to those reported in the previous decade.
41. The frequencies of radiographic examinations per year excluding mass surveys of the chest, given in tables 2 and 3 are plotted in figure II against the year of survey. This figure gives an over-all impression of the variation in the numbers of radiographs carried out in different areas of the world but attention must be drawn to the fact that different diseases and radiological techniques will alter the relative contribution of any one procedure to the over-all frequency of examinations. However, comparisons within any one country or region will be a reasonably valid indication of the growth of radiological services. Examples of this are given by the curves for New Zealand (156) and the United Kingdom (99) in figure II.
42. The frequency of radiological examinations in some industrialized countries is about one examination per person per year. From the GSDs reported in tables 2 and 3 and the annual frequency of radiolrntical examinations in figure II a projection of the GSD has been made for each country or region assuming that the practice has increased to a frequency of one examination per person per year. These projections are shown in figure III against the year in which the original survey was conducted. This shows the variation in the GSDs arising from differences in the prevalent types of examinations in different countries. in radiological procedures and in the standards of patient protection. The main uncertainty in the value of the normalized GSDs lies in the total number of examinations reported.
43. The increase in the number of examinations need not necessarily lead to higher GSDs if the increase is accompanied by procedural improvements. Of the surveys reported in table 3. the regional survey (89) that was carried out in the United Kingdom seven years after the national survey showed a drop in the GSD from 14.1 to 8.6 mi!lirads. The 1969 New Zealand survey ( 118) yielded a value not significamly higher ( 5 per cent) than that obtained by the 1963 survey despite an 11 per cent increase in the frequency of examinations.
44. The Dutch survey of 1967 (14) included a use~:il study of the dependence of the GSD on the particular values of the parameters used in the calculation. The parameters studied were the gonad dose and the frequency of the examinations. The values of gonad doses per examination used in this study were those determined in four surveys carried out in Leiden ( 13),
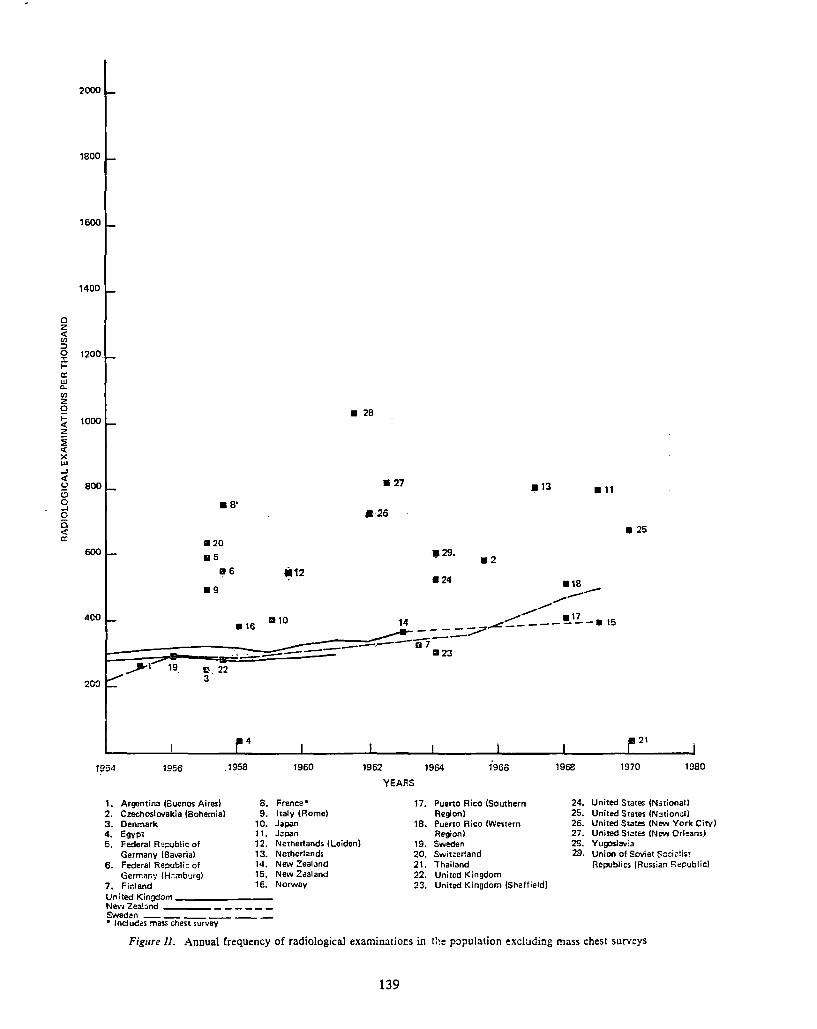
0 z <( tll :>
2000
1800
1600
1400
0 1200 ::.:: l-a: w c.. tll z 0
~ 1000 z :E <( X w ..J <( u 800 5 0 ..J 0 0 <( a:
600
400
•S'
a20
.s II 6
•9
• 28
a 27
•·26
•12
1!129, •2
a24
a13
.,s -_,.,.,,., _,,.,..,..,,., • 17
14 ...:--------a 15 ----? • ,s ---~ L-----"".:"--------~-- _..--.:---- D 7 i==--"'."""-::::""'4~----==· !.:"-=·=:.:-====-==------- 1123 _,...,
19_ El. 22 3
4
• 25
21
1954 1956 .1958 1960 1962 1964 1968 1970 1980
1. Argentina (Buenos Aires) 2. Czechoslovakia (Bohemia) 3. Denmark 4. Egypt 5. Federal Re;,-.;blic of
Germany (Bavaria I 6. Federal Republk of
Germany (H cmburg) 7. Finland
8. France• 9. Italy (Rome)
10. Japan 11. Japan 12. Netherlands (Leiden) 13. Netherlands 14. New Zealand 15. New Zealand 16, Norway
United Kin(}<:lom ---------New Zealand _____ _ Sweden __________ _
• lncludi:s mass chest survey
YEARS
17. Puerto Rico (Southern Region)
18. Puerto Rico (Western Region)
19. Sweden 20. Switzerland 21. Thailand 22. United Kingdom 23. United Kingdom (Sheffield)
24. United States (National) 25. United States (Nation~!) 26. United States (New York City) 27. United Stata (Ne-.N Orl,eans) 28. Yugoslavia 29. Union of Sa,liet Soci~list
Republics (Russian Republic)
Figure 11. Annual frequency of radiological examinatiors in t]1e population excluding mass chest surveys
139
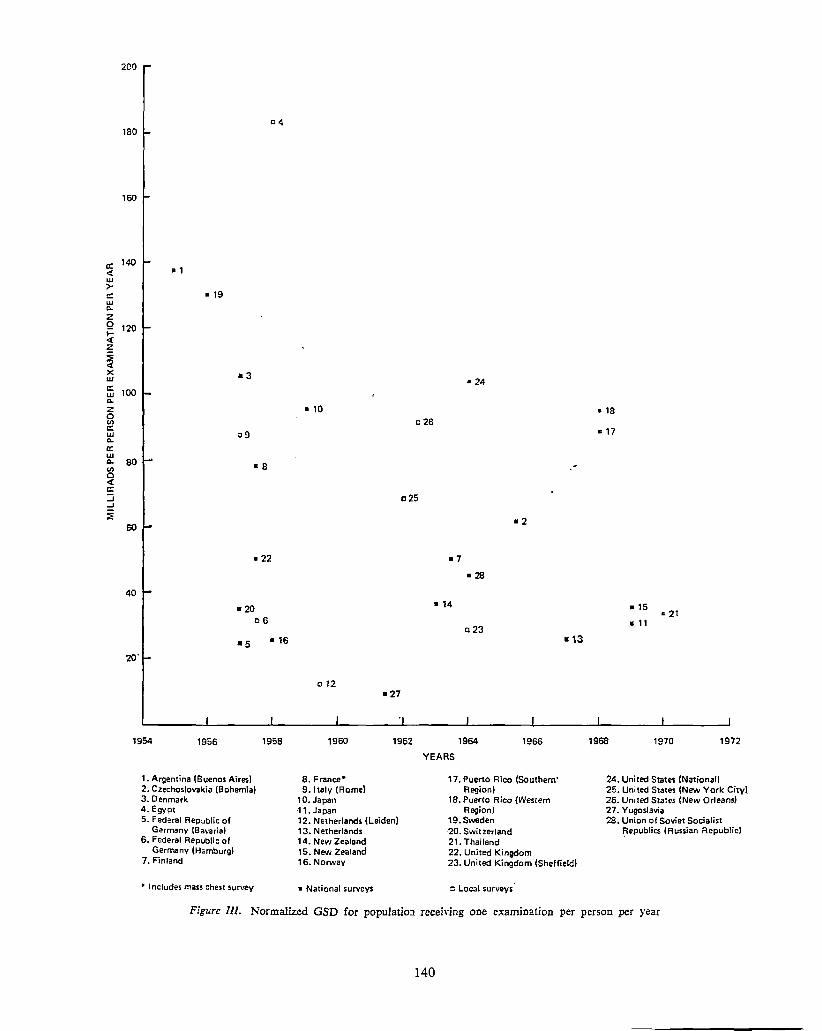
a: <( UJ > a: UJ ... z Q I-<( z :E < X UJ
a: UJ ... z 0 <I) a: UJ ... a: UJ ... <I)
0 <( a: :i ..J
~
2CO
180
160
140 R 1
• 19
120
•3
100
o9
80 • 8
60
• 22
40
•20 06
•5 • 16
20·
1954 1956 1958
1. Argentina (Buenos Aires) 2. Czechoslovakia (Bohemia) 3. Denmark 4. Egypt 5. Federal Republic of
Germany (Bavaria) 6. Federal Republic of
Germany (Hamburg) 7. Finland
• Includes mass chest survey
• 24
• 10 026
c25
•7 • 28
• 14
c23 • 13
0 12 • 27
1960 1962 1964 1966
8. France• 9. Italy (Rome)
10. Japan ·11. Japan 12. Netherlands (Leiden) 13. Netherlands 14. New Zealand 15. New Zealand 16. Norway
• National surveys
YEARS
17. Puerto Rico (Southern· Region)
18. Puerto Rico (Western Region)
19. Sweden 20. Switzerland 21. Thai land 22. United Kingdom 23. United Kingdom (Sheffield)
c: Local surveys
• 18
• 17
• 15
• 11
1968 1970 1972
24. United States (National) 25. United States (New York City). 26. United States (New Orleans) 27. Yugoslavia 28. Union of Soviet Socialist
Republics (Russian Republic)
Figure lll. Normalized GSD for populatio:i receiving one examination per person per year
140
in Denmark (53) and in Texas (27) by the same physicist ( 14) and in the United States national survey of 1964 (15). These were combined with one of two sets of examination frequencies obtained in the Netherlands on 1 million people (survey A) and on 5 million people (survey B), respectively (see paragraph 50). Six values of the GSD were determined using the following selections from the above data:
Selection I using Leiden gonad dose data and survey A Selection 2 using Texas gonad dose data and survey A Selection 3 using Leiden gonad dose data and survey B Selection 4 using Texas gonad dose data and survey B Selection 5 using Denmark gonad dose data and survey B Selection 6 using U.S.A. gonad dose data and survey B
45. The six estimates of the GSD together with their male and female components were as follows:
Stlution Male Female GSD
1 ............. 7.8 10 17.8 2 ............. 5.6 7.8 13.4 3 ............. 7.6 9.1 16.7 4 ............. 5.4 7.4 12.8 5 ............. 9.4 7.6 17.0 6 ............. 30.6 8.9 39.5
Mean 19.5
Comparison of 1 with 3 and 2 with 4 shows that there was little difference between the two sample populations. Comparison of 3, 4, 5 and 6 shows the difference produced by using different sets of gonad doses per examination. The four female contnbutions to the total were similar. but one of the male contributions was far higher than the others as a result of examinations, included in the United States national survey ( 106), in which the testes were exposed in the direct beam.
46. The main details of the actual surveys referred to in table 3 are presented in the following paragraphs. The results of most of the surveys are given in tables 4-17. In each of these tables the 10 examinations making the greatest contribution to the GSD are presented, with the exception that pelvimetry and obstetrical abdomen are included even though they might not rank among the top ten. In these cases they replace the ninth and tenth types of examination. The frequency of these examinations and the gonad doses are also given for each examination.
47. Czechoslovakia, Bohemia, 1965-1966 (table 4) ( 80). The survey covered three (population 4.341,000 or 30.5 per cent of the country total) out of the 11 regions of the Czechoslovak Socialist Republic. The number of examinations carried out in all radiological and fluoroscopic units over a one-year period were collected, together with those carried out during a three-month period in all mass chest survey units and during two one-week periods in 219 out of 570 dental x-ray departments. A breakdown of the examinations by age was obtained for 253.853 examinations. i.e. for 6.4 per cent of the annual number of examinations (2.2 million radiographic and fluoroscopic; 1.4 million mass chest; 0.4 million dental). Central-axis skindose and gonad-dose measurements were carried out on 5,602 patients in 70 departments at 28 industrial and agricultural localities. To obtain the ovary dose, phantom measurements were carried out on each machine immediately following each exposure. The national average child expectancy in the population was used in the calculation of the GSD ( table 1 )
141
except for hysterosalpingography (paragraph 35). It sJiould be noted t?at pelv!metry examinations are practically never earned out m Czechoslovakia.
48. Finland, 1963-1964 (table 5) (67). All medical institutions. hospitals and private physicians in Finla~d '_Vere aske~ to supply. details of all radiological exammauons earned out dunng four weeks in 1963. together with the total number, or estimated total number, of x-ray examinations during 1963. A second survey was instituted to complete the required information. The frequency of dental examinations was estimated from film consumption. Total examinations for 1963 were 2.7 million plus 80,000 dental examinations. 143,000 examinations were recorded in the study period. Gonad dose measurements were obtained by using 1960 fluoroglass dosemeters sent to 124 hospitals. In the case of males, fluoroglass rods were in contact with the testes; in females the dosemeter was placed on the back, near the ovaries. The ovary dose was obtained by phantom measurements using a calibration factor dependent on the type of x-ray unit used. National child-expectancy figures were used in the calculation of the GSD. Six per cent of the women examined were assumed to be pregnant and a fcetal dose equal to the female gonad dose was assumed.
49. Federal Republic of Germany, Bavaria, 1956-1958 (table 6) (130-132, 134). Statistical data regarding the admission of patients to hospitals in Bavaria were obtained in 1956. The classification by type of examination, age and sex was obtained for a population of 0.75 million. Gonad-dose measurements were made on 1,759 patients in 10 different types of hospitals and private practices. Some 705 measurements on children and 700 on adults were also carried out at the University of Munich. The gonad doses of adult females were measured in the vagina and for female children in the rectum. The comparison of gonad doses in various clinics and hospitals and for various ages showed a wide variation depending on the procedures observed. The national child-expectancy figures were used in the calculation of the GSD.
50. Netherlands, 1967 (table 7) (14. 107). The radiological examinations carried out in one year on 4.9 million people covered by 53 insurance companies were used to derive the annual total number of examinations. A subsample of nine companies which covered 1 million people was used to obtain the breakdown by age and sex. Both samples were geographically scattered. The two samples were cross-checked and found to be in reasonable agreement. The gonad-dose measurements were those obtained in a previous survey in Leiden ( 13) on patients and on a phantom, but other gonad-dose measurements (some by the same authors working in Texas) were used to compute various estimates of the GSD ( see paragraph 44). National child-expectancy figures were used. except for the examinations of pregnant women (paragraph 35). An increase in the GSD has been reported (154) on the basis of further gonad-dose measurements at two hospitals in 1971 and on the 7 per cent per annum increase in the frequency of examination.
51. Japan, 1969 (table 8) (57). The frequencies of examinations were obtained during 30 consecutive days from a number of hospitals of various sizes (number of beds) and from I.OOO physicians. Answers giving the numbers of examinations and the physical conditions used were received from 60 per cent of the hospitals approached. Gonad doses were measured
on four phantoms using x-ray units from different manufacturers operating at the particular conditiocs used for each examination type in the various hospitals included in the survey. The phantoms represented 8-month, 5-year and 10-year-old children and the adult. The output of some 54 x-ray generators was surveyed to obtain a mean output per unit. The child expectancies were derived from national statistics.
52. New Zealand, 1963 and 1969 (table 9) (118, 156). Annual figures from the Department of Health showed an increase of over-all frequencies of 21.6 per cent during the years 1963-1970. During the same time the population of New Zealand increased from 2.5 to 2.8 million. A survey in which details of 40,000 examinations were collected and analysed, sampled 3.5 per cent of the annual number of examinations. A field survey was conducted in which the gonad or skin doses were measured in 1,400 examinations and 2,460 technique forms were used to derive the gonad dose. The male measurements were carried out directly and the ovary dose was calculated from the data used in the British national survey of 19 57. Child expectancies were derived from national statistics ( table 1 and figure I). The 1970 survey utilized the same gonaddose measurements and the distribution of examinations by age and sex as in the earlier survey but current data on the total frequency of examinations and child expectancy were used. The most notable changes in the frequency of examinations that took place during the 1957-1963 period regarded pelvimetry examinations, which dropped to 40 per cent of the 1957 frequency, and obstetrical abdomen examinations, which dropped to 60 per cent of that frequency.
53. Thailand, 1970 (table 10) (4, 119). The total number of patients radiographed in all centres was requested for the month of January 1970 and the 56 per cent return obtained represented some 45 per cent of the estimated number of examinations carried out. A very low total frequency of 30 examinations per year per 1,000 persons was reported. Gonad-dose measurements were made in one hospital during fluoroscopic procedures using thermoluminescent dosemeters placed on the scrotum of male patients and in the vagina of female patients. Phantom measurements were undertaken in five hospitals utilizing the exposure data of patients. The lower gonad dose due to the smaller size of the patients is to be noted ( paragraph 30). As data were insufficient to make possible an accurate estimate of the GSD. a "most probable·' value was derived. As this value seems exceptionally low. an upper limit bas been estimated, referred to as "the maximum" GSD based on the "maximum'· average gonad dose. The female child-expectancy data derived in 1966 by the Ministry of Public Health was used and the male fertility was deduced from it, using as a basis the relationships observed in New Zealand <figure I). It was considered that the pattern for females might be changing since the median age of the mother at childbirth had dropped from 27 years in 1966 to 25 years in 1970.
54. United Kingdom. Sheffield.. 1964 (table 11) ( 89). The frequencies of the examinations in the Sheffield area (population 4.5 million) were collected in all the x-ray departments during a one-week period. This showed an increase in the frequency of radiography of 33 per cent compared to that reported in the 1957 sun,ey. The population increase was 6.2 per cent. showing a 26 per cent increase in the frequency of
142
radiography per caput. Fluoroscopic examinations had decreased by 36 per cent per caput and mass chest surveys increased by 42 per cent. Gonad doses were measured using ionization chambers placed at the scrotum in males and at the level of the iliac crest in females. Over 2,000 measurements on 800 patients in 30 hospitals were made. The ovary dose was calculated using the conversion data measured on a phantom in the 1957 British survey (26, 38, 39). For changes indicated by analyses of the two surveys. see paragraph 61. The same child expectancies, based on national statistics, that were used in the earlier survey ( 26) were utilized in the later one.
55. United States, 1964 national survey (table 12) (21, 51,104.106, 108). The national survey was conducted on the basis of interviews of 9,653 complete households in 1964 and 21,667 in 1970. selected by a multistage sampling programme used for sampling the civilian population of the United States. The first division consisted of 357 geographically-defined primary sampling units. Within each, the ultimate subdivisions, called segments, consisted of a cluster of nine neighbouring households. Each week a random sample of approximately 90 segments ( 800 households) was drawn from the whole country. Interviews of these selected households over a three-month period covered just over 31.000 people of whom 4.525 bad had an x-ray examination during the previous three months. (For details see paragraph 24.) The follow-up consisted of an approach to each clinic or hospital at which a selected person had had an. x-ray examination, with requests for details on the examination together ·with a film from which the x-ray quality and the field size could be determined. The gonad doses were determined on the basis of these exposure factors by processing the results of comprehensive scatter measurements made on a phantom. These were checked by in viva thermoluminescent dosemeters applied to 360 patients undergoing a variety of examinations. The mean "system-calculated'' male-gonad doses ranged for particular examinations from + 170 to - 71 per cent of the mean dosimetric measurements. For examinations with the ovary expected to be in the direct field, the "system-calculated'' values ranged from +57 to -30 per cent of the dosimetric measurements. For data regarding field size variation. see paragraph 61. Child expectancy figures were derived from national statistics.
56. United States, Puerto Rico, southern and western regions, 1968 ( table 13) ( 44, 45). The average number of patients radiographed per week over the year 1968 was presented from all hospitals in the two regions of Puerto Rico. These statistics were broken down into types of examinations. An earlier investigation had been carried out in the western region in 1967 ( 44). The majority of the dosimetric work was carried out on one unit. Thermoluminescent dosemeters and ionization chambers were used for a limited number of in virn dose measurements at one centre and agreed reasonably with phantom measurements. The average gonad doses were derived from the returns from the 47 facilities with one or more x-ray units in the southern region and from 65 facilities in rhe w~stern recion. The-recions had a total of 83 and 75 x-ray units, respectively.~In the southern region the number of x-ray units excluding dental units ,vas 13 in 1940, 28 in 1950. 57 in 1960 and 83 in 1968. indicating a doubling period of about 10 years. The difference in the GSD estimates in the two regions may be accounted for by technically sounder practices in the southern
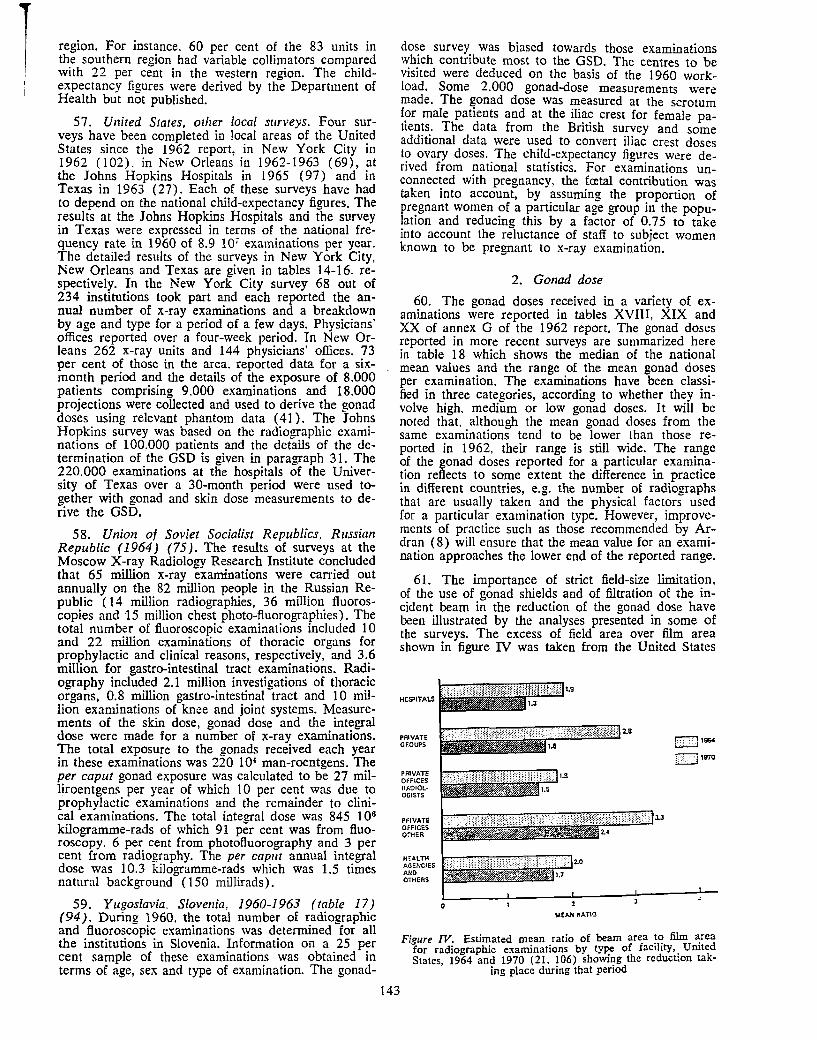
I region. For instance, 60 per cent of the 83 units in the southern region had variable collimators compared with 22 per cent in the western region. The childexpectancy figures were derived by the Department of Health but not published.
57. United States, other local surveys. Four surveys have been completed in lo~al areas of the {!nit~d States since the 1962 report, m New York City m 1962 (102). in New Orleans in 1962-1963 (69), at the Johns Hopkins Hospitals in 1965 (97) and in Texas in 1963 (27). Each of these surveys have had to depend on the national child-expectancy figures. The results at the Johns Hopkins Hospitals and the survey in Texas were expressed in terms of the national frequency rate in 1960 of 8.9 107 exa!ninations per y~ar. The detailed results of the surveys m New York City, New Orleans and Texas are given in tables 14-16, respectively. In the New York City survey 68 out of 234 institutions took part and each reported the annual number of x-ray examinations and a breakdown by age and type for a period of a few days. Physicians' offices reported over a four-week period. In New Orleans 262 x-ray units and 144 physicians' offices, 73 per cent of those in the area. reported data for a sixmonth period and the details of the exposure of 8.000 patients comprising 9.000 examinations and 18.000 projections were collected and used to derive the gonad doses using relevant phantom data ( 41). The Johns Hopkins survey was based on the radiographic examinations of 100.000 patients and the details of the determination of the GSD is given in paragraph 31. The 220.000 examinations at the hospitals of the Univer-sity of Texas over a 30-month period were used together with gonad and skin dose measurements to derive the GSD.
58. Union of Soviet Socialist Republics, Russian Republic (1964) (75). The results of surveys at the Moscow X-ray Radiology Research Institute concluded that 65 million x-ray examinations were carried out annually on the 82 million people in the Russian Republic (14 million radiographies, 36 million. fluoroscopies and 15 million chest photo-fluorograph1es). The total number of fluoroscopic examinations included 10 and 22 million examinations of thoracic organs for prophylactic and clinical reasons, respectively, and 3.~ million for gastro-intestinal tract examinations. Rad~ography included 2.1 million investigations of thorac.1c organs, 0.8 million gastro-intestinal tract and 10 million examinations of knee and joint systems. Measurements of the skin dose, gonad dose and the integral dose were made for a number of x-ray examinations. The total exposure to the gonads received each year in these examinations was 220 104 man-roentgens. The per caput gonad exposure was calculated to be 27 milliroentoens per year of which 10 per cent was due to prophylactic examinations and the remainder to clinical examinations. The total integral dose was 845 106
kilogramme-rads of which 91 per cent was from fluoroscopy. 6 per cent from photofluorography and 3 per cent from radiography. The per caput annual i.,tegral dose was 10.3 kilogramme-rads which was 1.5 times natural background ( 150 millirads).
59. Yugoslavia, Slovenia, 1960-1963 (table 17) (94). During 1960, the total number of radiographic and fluoroscopic examinations was determined for all the institutions in Slovenia. Information on a 25 per cent sample of these examinations was obtained in terms of age, sex and type of examination. The gonad-
dose survey was biased towards those examinations which contribute most to the GSD. The centres to be visited were deduced on the basis of the 1960 workload. Some 2.000 gonad-dose measurements were made. The gonad dose was measured at the scrotum for male patients and at the iliac crest for female patients. The data from the British survey and some additional data were used to convert iliac crest doses to ovary doses. The child-expectancy figures were derived from national statistics. For examinations unconnected with pregnancy, the fcetal contribution was taken into account, by assuming the proportion of pregnant women of a particular age group in the population and reducing this by a factor of 0.75 to take into account the reluctance of staff to subject women known to be pregnant to x-ray examination.
2. Gonad dose
60. The gonad doses received in a variety of examinations were reported in tables XVIII, XIX and XX of annex G of the 1962 report. The gonad doses reported in more recent surveys are summarized here in table 18 which shows the median of the national mean values and the range of the mean gonad doses per examination. The examinations have been clas.sified in three categories, according to whether they involve high. medium or low gonad doses. It will be noted that, although the mean gonad doses from the same examinations tend to be lower than those reported in 1962, their range is still wide. The range of the gonad doses reported for a. particula: cxami1!-ation reflects to some extent the difference m pracuce in different countries, e.g. the number of radiographs that are usually taken and the physical factors used for a particular examination type. However, improvements of practice such as those recommended by Ardran ( 8) will ensure that the mean value for an examination approaches the lower end of the reported range.
143
61. The importance of strict field-size limitation, of the use of gonad shields and of filtration of the incident beam in the reduction of the gonad dose have been illustrated by the analyses presented in some of the surveys. The excess of field area over film area shown in figure IV was taken from the United States
HCSPITALS
PAIVAT£ GFOUPS
PRIVATE OFFICES RADIOL• OGlSTS
PFIVATE OFFICES 0".HER
H:"ALTH AGENCIES AND OTHERS
3.3
ME.o.H RATIO
o,! ,: __ '31970
Figure IV. Estimated mean ratio of beam area ~~ film_ ~rea for radiographic examinations by t~ of fac1hty,_ Umte~ States, 1964 and 1970 (21, 106) show~g the reducuon tak
ing place during that penod
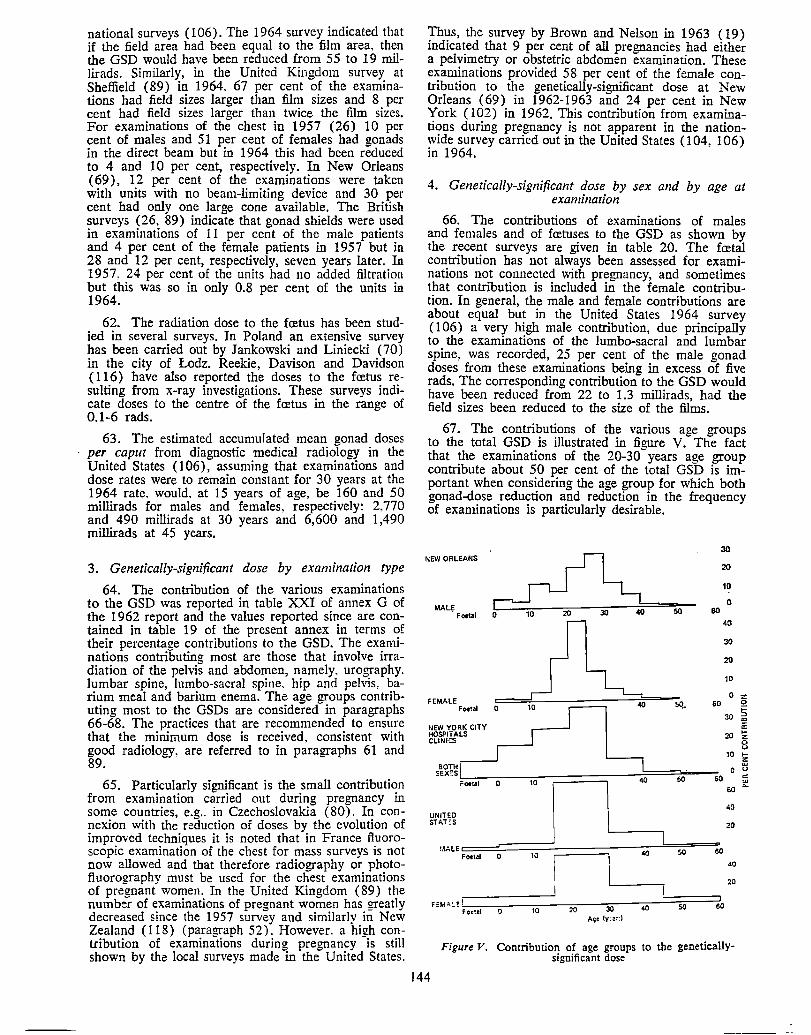
national surveys (106). The 1964 survey indicated that if the :field area had been equal to the film area. then the GSD would have been reduced from 55 to 19 millirads. Similarly, in the United Kingdom survey at Sheffield (89) in 1964, 67 per cent of the examinations had :field sizes larger than film sizes and 8 per cent had field sizes larger than twice the film sizes. For examinations of the chest in 1957 (26) 10 per cent of males and 51 per cent of females had gonads in the direct beam but in 1964 this had been reduced to 4 and 10 per cent, respectively. In New Orleans (69), 12 per cent of the examinations were taken with units with no beam-limiting device and 30 per cent had only one large cone available. The British surveys (26, 89) indicate that gonad shields were used in examinations of 11 per cent of the male patients and 4 per cent of the female patients in 1957 but in 28 and 12 per cent, respectively, seven years later. In 19 57, 24 per cent of the units had no added filtration but this was so in only 0.8 per cent of the units in 1964.
62. The radiation dose to the fcetus bas been studied in several surveys. In Poland an extensive survey has been carried out by Jankowski and Liniecki (70) in the city of Lodz. Reekie, Davison and Davidson (116) have also reported the doses to the fcetus resulting from x-ray investigations. These surveys indicate doses to the centre of the fcetus in the range of 0.1-6 rads.
63. The estimated accumulated mean gonad doses per caput from diagnostic medical radiology in the United States ( 106), assuming that examinations and dose rates were to remain constant for 30 years at the 1964 rate, would. at 15 years of age, be 160 and 50 millirads for males and females. respectively: 2,770 and 490 millirads at 30 years and 6,600 and 1,490 millirads at 45 years.
3. Genetically-significant dose by examination type
64. The contribution of the various examinations to the GSD was reported in table XXI of annex G of the 1962 report and the values reported since are contained in table 19 of the present annex in terms of their percentage contributions to the GSD. The examinations contributing most are those that involve irradiation of the pelvis and abdomen, namely. urography, lumbar spine, lumbo-sacral spine. hip and pelvis, barium meal and barium enema. The age groups contributing most to the GSDs are considered in paragraphs 66-68. The practices that are recommended to ensure that the minimum dose is received. consistent with good radiology, are referred to in paragraphs 61 and 89.
65. Particularly significant is the small contribution from examination carried out during pregnancy in some countries, e.g .. in Czechoslovakia (80). In connexion with the reduction of doses by the evolution of improved techniques it is noted that in France fluoroscopic examination of the chest for mass surveys is not now allowed and that therefore radiography or photofluorography must be used for the chest examinations of pregnant women. In the United Kingdom (89) the number of examinations of pregnant women has greatly decreased since the 1957 survey and similarly in New Zealand (118) (paragraph 52). However, a high contribution of examinations during pregnancy is still shown by the local surveys made in the United States.
Thus, the survey by Brown and Nelson in 1963 (19) indicated that 9 per cent of all pregnancies had either a pelvimetry or obstetric abdomen examination. These examinations provided 58 per cent of the female contribution to the genetically-significant dose at New Orleans (69) in 1962-1963 and 24 per cent in New York ( 102) in 1962. This contribution from examinations during pregnancy is not apparent in the nationwide survey carried out in the United States (104, 106) in 1964.
4. Genetically-significant dose by sex and by age at examination
66. The contributions of examinations of males and females and of fcetuses to the GSD as shown by the recent surveys are given in table 20. The foetal contribution has not always been assessed for examinations not connected with pregnancy, and sometimes that contribution is included in the female contribution. In general, the male and female contributions are about equal but in the United States 1964 survey (106) a very high male contribution, due principally to the examinations of the lumbo-sacral and lumbar spine, was recorded, 25 per cent of the male gonad doses from these examinations being in excess of five rads. The corresponding contribution to the GSD would have been reduced from 22 to 1.3 millirads, had the field sizes been reduced to the size of the films.
67. The contributions of the various age groups to the total GSD is illustrated in figure V. The fact that the examinations of the 20-30 years age group contribute about 50 per cent of the total GSD is important when considering the age group for which both gonad-dose reduction and reduction in the frequency of examinations is particularly desirable.
NEW ORLEANS
·~===--0 10 20 30 40 SO
30
20
10
0 80 MALE
Fo«UI 40
30
20
10
0 5(!. 60
30
CLINICS 20
10
60
FEMALE~Ftal O 10 40
~~h°if/.sK CITY
BOTH
SEXcS~Foe:al o ~10 ! ~1
40 ~so
UNITED STAT;cs
0
60
40
20
144
!.\ALE====' Fottat 0 10
f;CM,',l! I 20 Foetal 0 10
40
30 40 Age !ycar,J
so
so
60
60
40
20
Figure V. Contribution of age groups to the geneticallysignificant dose
z 0
§ "' ii: ... z 8 ... z ... (.J
a: ... ...
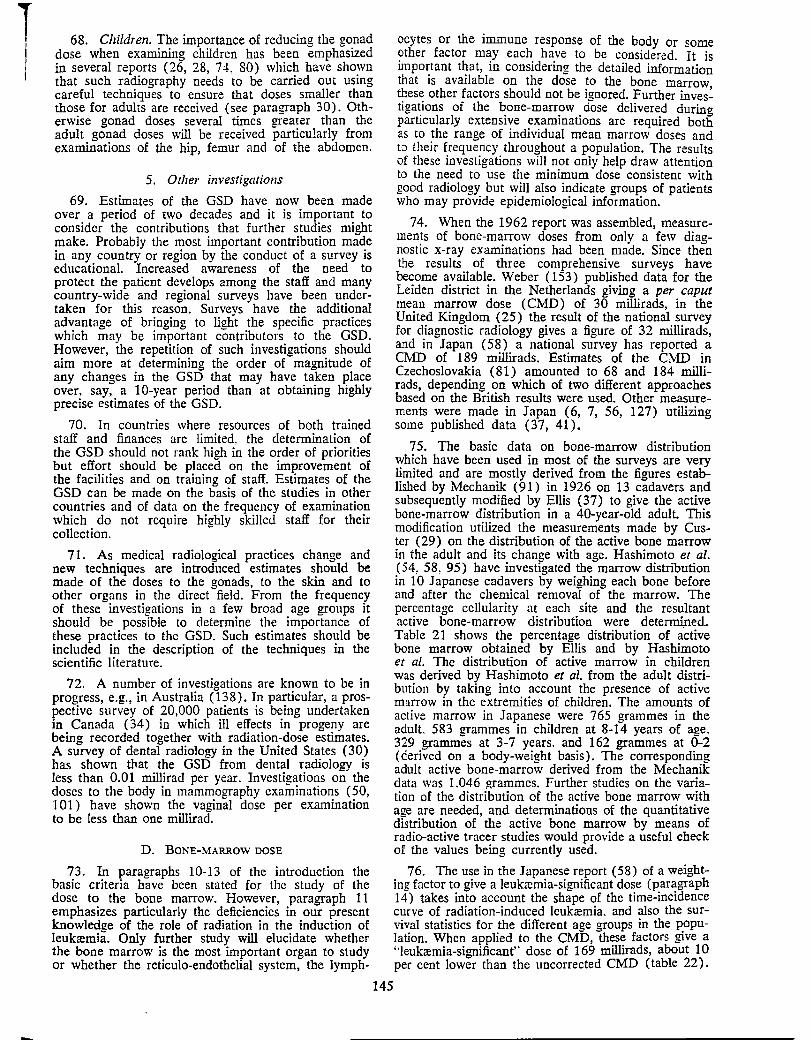
T I I
68. Children. The importance of reducing the gonad dose when examining children has been emphasized in several reports (26, 28, 74, 80) which have shown that such radiography needs to be carried out using careful techniques to ensure that doses smaller than those for adults are received (see paragraph 30). Otherwise gonad doses several times greater than the adult gonad doses will be received particularly from examinations of the hip, femur and of the abdomen.
5. Other investigations
69. Estimates of the GSD have now been made over a period of two decades and it is important to consider the contributions that further studies might make. Probably the most important contribution made in any country or region by the conduct of a survey is educational. Increased awareness of the need to protect the patient develops among the staff and many country-wide and regional surveys have been undertaken for this reason. Surveys have the additional advantage of bringing to light the specific practices which may be important contributors to the GSD. However, the repetition of such investigations should aim more at determining the order of magnitude of any changes in the GSD that may have taken place over. say, a 10-year period than at obtaining highly precise estimates of the GSD.
70. In countries where resources of both trained staff and finances are limited. the determination of the GSD should not rank high in the order of priorities but effort should be placed on the improvement of the facilities and on training of staff. Estimates of the GSD can be made on the basis of the studies in other countries and of data on the frequency of examination which . do not require highly skilled staff for their collect1on.
71. As medical radiological practices change and new techniques are introduced estimates should be made of the doses to the gonads, to the skin and to other organs in the direct field. From the frequency of these investigations in a few broad age groups it should be possible to determine the importance of these practices to the GSD. Such estimates should be included in the description of the techniques in the scientific literature.
72. A number of investigations are known to be in progress, e.g., in Australia (138). In particular, a prospective survey of 20,000 patients is being undertaken in Canada ( 34) in which ill effects in progeny are being recorded together with radiation-dose estimates. A survey of dental radiology in the United States (30) has shown that the GSD from dental radiology is less than 0.01 millirad per year. Investigations on the doses to the body in mammography examinations (50, 101) have shown the vaginal dose per examination to be Jess than one millirad.
D. BONE-MARROW DOSE
73. In paragraphs 10-13 of the introduction the basic criteria have been stated for the study of the dose to the bone marrow. However, paragraph 11 emphasizes particularly the deficiencies in our present knowledge of the role of radiation in the induction of leukremia. Only further study will elucidate whether the bone marrow is the most important organ to study or whether the reticulo-endothelial system, the lymph-
145
ocytes or the immune response of the bodv or some other factor may each have to be considered. It is impo1:tant t~at, in considering the detailed information that 1s available on the dose to the bone marrow these other factors should not be imored. Further inves~ tigations of the bone-marrow dose delivered durino particularly extensive examinations are required both as to the range of individual mean marrow doses and tD their frequency throughout a population. The results of these investigations will not only help draw attention to the need to use the minimum dose consistent with good radiology but will also indicate groups of patients who may provide epidemiological information.
74. When the 1962 report was assembled, measurements of bone-marrow doses from only a few diagnostic x-ray examinations had been made. Since then the results of three comprehensive surveys have become available. Weber (153) published data for the Leiden district in the Netherlands giving a per caput mean marrow dose (CMD) of 30 millirads, in the United Kingdom (25) the result of the national survey for diagnostic radiology gives a figure of 32 millirads, and in Japan (58) a national survey has reported a CMD of 189 millirads. Estimates of the CMD in Czechoslovakia ( 81) amounted to 68 and 184 millirads, depending on which of two different approaches based on the British results were used. Other measurements were made in Japan (6, 7, 56, 127) utilizing some published data (37, 41).
75. The basic data on bone-marrow distribution which have been used in most of the surveys are very limited and are mostly derived from the figures established by Mechanik (91) in 1926 on 13 cadavers and subsequently modified by Ellis (37) to give the active bone-marrow distribution in a 40-year-old adult. This modification utilized the measurements made by Custer (29) on the distribution of the active bone marrow in the adult and its change with age. Hashimoto et al. (54. 58, 95) have investigated the marrow distribution in 10 Japanese cadavers by weighing each bone before and after the chemical removal of the marrow. The percentage cellularity at each site and the resultant active bone-marrow distribution were determinedTable 21 shows the percentage distribution of active bone marrow obtained by Ellis and by Hashimoto et al. The distribution of active marrow in children was derived by Hashimoto et al. from the adult distribution by taking into account the presence of active marrow in the extremities of children. The amounts of active marrow in Japanese were 765 grammes in the adult. 583 grammes in children at 8-14 years of age. 329 grammes at 3-7 years. and 162 grammes at 0-2 (derived on a body-weight basis). The corresponding adult active bone-marrow derived from the Mechanik data was 1.046 grammes. Further studies on the variation of the distribution of the active bone marrow with age are needed, and determinations of the quantitative distribution of the active bone marrow by means of radio-active tracer studies would provide a useful check of the values being currently used.
76. The use in the Japanese report (58) of a weighting factor to give a leukremia-significant dose (paragraph 14) takes into account the shape of the time-incidence curve of radiation-induced leukremia. and also the survival statistics for the different age groups in the population. When applied to the CMD, these factors give a "leukremia-significant" dose of 169 millirads, about 10 per cent lower than the uncorrected CMD ( table 22).
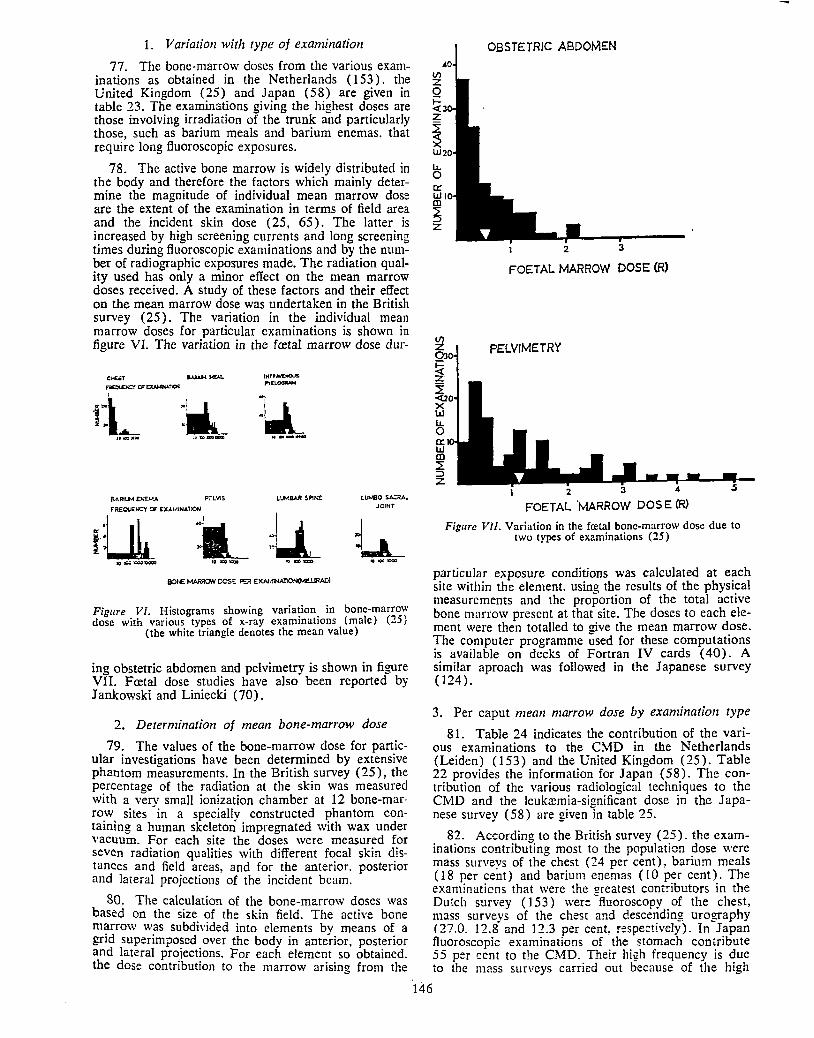
1. Variation with type of examination
77. The bone-marrow doses from the various examinations as obtained in the Netherlands (153). the United Kingdom (25) and Japan (58) are given in table 23. The examinations giving the highest doses are those involving irradiation of the trunk and particularly those, such as barium meals and barium enemas. that require long fluoroscopic exposures.
78. The active bone marrow is widely distributed in the body and therefore the factors which mainly determine the magnitude of individual mean marrow dose are the extent of the examination in terms of field area and the incident skin dose (25, 65). The latter is increased by high screening currents and long screening times during fluoroscopic examinations and by the number of radiographic exposures made. The radiation quality used has only a minor effect on the mean marrow doses received. A study of these factors and their effect on the mean marrow dose was undertaken in the British survey (25). The variation in the individual mean marrow doses for particular examinations is shown in figure VI. The variation in the fretal marrow dose dur-
CHt.J ............... IWJt.WC:NOI.S
~CF~..::»I '"'"·--I
J.l_ 1L ,~.__ uicc»oo l~SI>-- ........
LUJ.90 SA.:RA. JOINT
• -.........
Figure VI. Histograms showing variation in bone-marrow dose with various types of x-ray examinations (male) (25)
(the white triangle denotes the mean value)
ing obstetric abdomen and pelvimetry is shown in figure VII. Fc:etal dose studies have also been reported by Jankowski and Liniecki ( 70).
2. Determination of mean bone-marrow dose
79. The values of the bone-marrow dose for particular investigations have been determined by extensive phantom measurements. In the British survey (25), the percentage of the radiation at the skin was measured with a very small ionization chamber at 12 bone-marrow sites in a speciallv constructed phantom containing a human skeleton impregnated with wax under vacuum. For each site the doses were measured for seven radiation qualities with different focal skin distances and field areas, and for the anterior. posterior and lateral projections of the incident beam.
80. The calculation of the bone-marrow doses was based on the size of the skin field. The active bone marrow was subdivided into elements by means of a grid superirnpo~ed _over the body in anterior, posterior and lateral pro1ect1ons. For each element so obtained. the dose contribution to the marrow arising from the
AO V)
z 0 j:: ~3 z ; W20
lJ.. 0 er Wl en ; z
~ 030 ~ z
to X w
~ er w en ~ :::::, z
OBSTETRIC ABDOMEN
2 3
FOETAL MARROW DOSE (R)
PELVIMETRY
2 3
FOETAL 'MARROW DOSE (R)
Figure Vil. Variation in the fretal bone-marrow dose due to two types of examinations (25)
146
particular exposure conditions was calculated at each site within the element, using the results of the physical measurements and the proportion of the total active bone marrow present at that site. The doses to each element were then totalled to give the mean marrow dose. The computer programme ~sed for these computations is available on decks of Fortran IV cards ( 40). A similar aproach was followed in the Japanese survey (124).
3. Per caput mean marrow dose by examination type
81. Table 24 indicates the contribution of the various examinations to the CMD in the Netherlands (Leiden) (153) and the United Kingdom (25). Table 22 provides the information for Japan (58). The contribution of the various radiological techniques to the C:MD and the Jeuk:Emia-significant dose in the Japanese survey (58) are given in table 25.
82. According to the British survey (25). the examinations contributing most to the population dose were mass surveys of the chest (24 per cent), barium meals ( 18 per cent) and barium enemas ( I O per cent). The examinaticns that were the 2:reatest contributors in the Dutch survey (] 53) were -fluoroscopy of the chest, mass surveys of the chest and descending urography (27.0. 12.8 and 12.3 per cent, respectively). In Japan fluoroscopic examinations of the stomach contribute 55 per cent to the CMD. Their high frequency is due to the mass surveys carried out because of the high
r incidence of stomach cancer in that country (58). These results are good examples of the contribution that bone-marrow dose surveys can make in identifying those groups of patients of importance for the epidemiological studies recommended by the ICRP /ICRU reports (42, 43) and by the ·uN/WHO seminar (144).
4. Dental radiography
83. Few data are available on the individual mean marrow dose from dental radiography. This dose was estimated in 1959 to be 1.8 millirads in the United Kingdom which, with an annual examination rate of 2 million dental examinations in a population of 50 million, corresponds to a CMD from dental radiography of 0.1 millirad (25. 26). However the practice in some countries is tending towards the use of wider fields and more frequent dental x-ray examinations so that the CMD from dental radiography is likely to increase. When radiographs of the whole mouth are required the use of intra-oral x-ray tubes may reduce the doses received.
E. DOSE TO THE SKIN Ai'ID OTHER ORGANS
84. The dose to the skin in the primary beam and the area of the beam are two important parameters that determine the total dose to important organs such as the bone marrow. Significant radiation may also be received by other organs and tissues of particular groups of patients. For example, young children with orthopredic conditions may receive many radiographs of particular bones over a number of years. Such groups of people may lend themselves to epidemiological studies and the ICRP /ICRU reports ( 42, 43) have drawn attention to the necessity to ensure accurate dose estimates for these groups of patients.
85. Variations in the skin dose from radiographic examinations reflect the type of film and screen used and the amount of initial filtration inserted in the primary beam. For most examinations the fastest filmscreen combination may be used. but where fine detail is required, as in bone radiography, fine-grain screens or no screens are often used. Table 26 gives for a number of examination types the median and the range of the average skin doses in the primary beam reported in seven surveys (8, 25, 63, 80, 123, 126. 156). Ardran ( 8) has drawn attention to the need to reduce the off-focus radiation and thus reduce the incident skin and gonad doses. The skin dose due to any particular examination may be much less or much more than the average values reported in table 26, depending on the number of exposures and on the exposure factors used. For example, in the British survey (25) the mean value of skin dose was 2.1 rads for pelvic examinations. but values up to 33.4 rads were recorded. In the investigations on the skin doses received during mammography examinations, local doses up to 35 rads were measured (50).
86. The doses to the skin. thyroid, hypothalamus and the lens of the eye from dental radiography are not negligible. The doses delivered to the lens will be considerably reduced by the use of protective diaphragms and centring techniques. When radiographs of the whole mouth are required the use of intra-oral x-ray tubes. if correctly applied, will reduce the irradiation of the patient.
147
F. TRENDS WITH EXTENSIVE EXA::,.,IINATIONS
87 .. Th~~ ma~ trends in diagnostic radiology have been 1dentmed m paragraph 17. The doses received during the use o~ image in~ensificati?n . and cine procedures have received attention. The mc1dent skin-dose rate during non-intensified fluoroscopic examinations may be about 4-10 rad min-1 . The ICRP (114) recommends that it should not exceed 5 rad min-1. When the conditions under which imaQe intensification is carried out are optimised. for example by dark adaptation of the operators, and technical problems are overcome. the dose rate may be reduced to about 0.5-1 rad min-1 . However, reports indicate that when the imageintensifier tube deteriorates. the higher screenine: current necessary to obtain a good image may increase the skin-dose rate above that for non-intensified fluoroscopy. With cine-fluorography. very much higher skin-dose rates are used, rates of 50-100 rad min-1 being delivered on thick patients. Gough. Davis and Stacey (52) report the following doses delivered during cardiac catheterization of 85 patients in the United Kingdom:
.Mean dose 1-f a.rinrn m dose
rad mrad rad mrad
Skin 47 140 Marrow ............... . 1.4 3.9 Male gonads ........... . 25 80 Female gonads .......... . 39 100
Ardran (9) reported similar doses in another series of patients in the United Kingdom. Even higher radiation doses were reported by Gough. Davis and Stacey (52) as being delivered during pacemaker insertion-an emergency procedure. An average skin dose of 132 rads per patient was received in a group of six patients. Other surveys of the doses received during fluoroscopy have been published by Seyss (135) on 5,000 cases, and by Schoen (128).
88. The irradiation of children both for cardiac catheterization and for such examinations as voiding urethrocystography may lead to high gonad doses. Typical measurements by Kaude. Lorenz and Reed (74) give average male gonad doses of 105 millirads and ovary doses of 270 millirads. with maximum values of 570 and 690 millirads, respectively.
G. RECOMMENDATIONS FOR THE PROTECTION OF THE PATIENT IN Dl.\GNOSTIC RADIOLOGY
89. Because of the increasing use of diagnostic radiology (for example. an estimate in the United States (24) indicates that 50 per cent of all diagnoses are made or confirmed by diagnostic radiology), the ICRP ( 65. 114) and other international and national bodies have made recommendations for achieving the minimum patient dose consistent with good radiology. Similar recommendations regarding special aspects of radiology have also been published (93, 155). for example, for the examination of children ( 4 7) and for dental examinations (35).
II. Diagnostic use of radio-pharmaceuticals
90. In many countries the increase in the diagnostic use of radio-pharmaceuticals has been extremely rapid during the 1960s. The procurement of radio-pharmaceuticals has been relatively easy and their dispat~h by air freight has enabled many clinics and laboratones to use radio-pharmaceuticals manufactured in a few centres. Both the number of patients investigated by
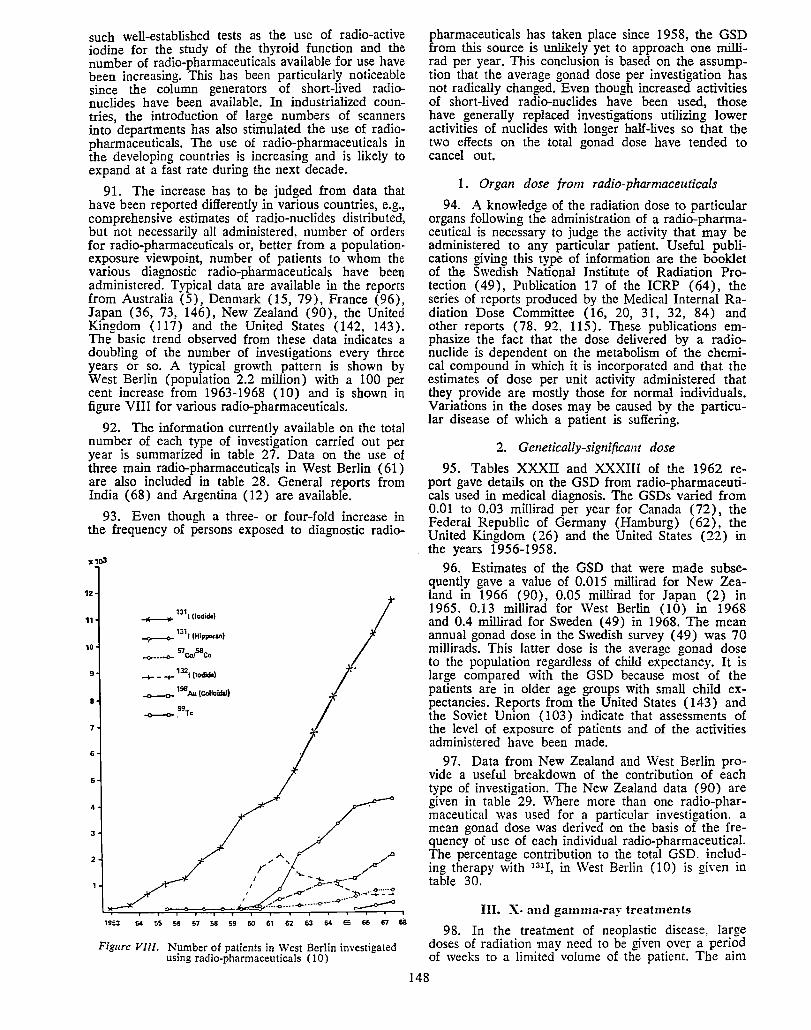
such well-established tests as the use of radio-active iodine for the study of the thyroid function and the number of radio-pharmaceuticals available for use have been increasing. This has been particularly noticeable since the column generators of short-lived radionuclides have been available. In industrialized countries, the introduction of large numbers of scanners into departments has also stimulated the use of radiopharmaceuticals. The use of radio-pharmaceuticals in the developing countries is increasing and is likely to expand at a fast rate during the next decade.
91. The increase has to be judged from data that have been reported differently in various countries, e.g., comprehensive estimates of radio-nuclides distributed, but not necessarily all administered, number of orders for radio-pharmaceuticals or, better from a populationexposure viewpoint, number of patients to whom the various diagnostic radio-pharmaceuticals have been administered. Typical data are available in the reports from Australia (5), Denmark (15, 79), France (96), Japan (36, 73, 146), New Zealand (90), the United Kingdom (I 17) and the United States (142, 143). The basic trend observed from these data indicates a doubling of the number of investigations every three years or so. A typical growth pattern is shown by West Berlin (population 2.2 million) with a 100 per cent increase from 1963-1968 (10) and is shown in figure Vlll for various radio-pharmaceuticals.
92. The information currently available on the total number of each type of investigation carried out per year is summarized in table 27. Data on the use of three main radio-pharmaceuticals in West Berlin ( 61) are also included in table 28. General reports from India ( 68) and Argentina ( 12) are available.
93. Even though a three- or four-fold increase in the frequency of persons exposed to diagnostic radio-
x1o3
12
11
10
9
8
7
6
5
4
3
___,.. 13\ (lod;dt)
~ 131i (H1ppuranl
-o,. •••• ,o... 57co?'co
-+ _ ..,_ 1321 (Iodide)
-o---o- 198 Au (C<Jlloidol)
-<>--<>- .99
Tc
1953 54 SS 55 57 58 59 60 61 62 63 64 65 66 67 68
Figure VIII. Number of patients in West Berlin investigated using radio-pharmaceuticals ( 10)
pharmaceuticals has taken place since 1958, the GSD from this source is unlikely yet to approach one rnillirad per year. This conclusion is based on the assumption that the average gonad dose per investigation has not radically changed. Even though increased activities of short-lived radio-nuclides have been used, those have generally replaced investigations utilizing lower activities of nuclides with longer half-lives so that the two effects on the total gonad dose have tended to cancel out.
1. Organ dose from radio-pharmaceuticals
94. A knowledge of the radiation dose to particular organs following the administration of a radio-pharmaceutical is necessary to judge the activity that may be administered to any particular patient. Useful publications giving this type of information are the booklet of the Swedish National Institute of Radiation Protection ( 49), Publication 17 of the ICRP ( 64), the series of reports produced by the Medical Internal Radiation Dose Committee ( 16, 20, 31, 32, 84) and other reports (78. 92, 115). These publications emphasize the fact that the dose delivered by a radionuclide is dependent on the metabolism of the chemical compound in which it is incorporated and that the estimates of dose per unit activity administered that they provide are mostly those for normal individuals. Variations in the doses may be caused by the particular disease of which a patient is suffering.
2. Genetically-significant dose
95. Tables XXXII and XXXIII of the 1962 report gave details on the GSD from radio-pharmaceuticals used in medical diagnosis. The GSDs varied from 0.01 to 0.03 millirad per year for Canada (72), the Federal Republic of Germany (Hamburg) (62), the United Kingdom (26) and the United States (22) in the years 1956-1958.
96. Estimates of the GSD that were made subsequently gave a value of 0.015 millirad for New Zealand in 1966 (90), 0.05 millirad for Japan (2) in 1965. 0.13 millirad for West Berlin (10) in 1968 and 0.4 millirad for Sweden ( 49) in 1968. The mean annual gonad dose in the Swedish survey (49) was 70 millirads. This latter dose is the average gonad dose to the population regardless of child expectancy. It is large compared with the GSD because most of the patients are in older age groups with small child expectancies. Reports from the United States ( 143) and the Soviet Union (103) indicate that assessments of the level of exposure of patients and of the activities administered have been made.
97. Data from New Zealand and \Vest Berlin provide a useful breakdown of the contribution of each type of investigation. The New Zealand data (90) are given in table 29. Where more than one radio-pharmaceutical was used for a particular investigation. a mean gonad dose was derived on the basis of the frequency of use of each individual radio-pharmaceutical. The percentage contribution to the total GSD. including therapy with 131I, in West Berlin (10) is giYen in table 30.
148
ID. X- and gamma-ray treatments
98. In the treatment of neoplastic disease, large doses of radiation may need to be given over a period of weeks to a limited volume of the patient. The aim
of the treatment is. of course, to restore the health of the patient yet it , is also necessary to consider the small probability of causing, during the lifetime of the patient, some deleterious effect due to the radiation, either to the individual or to any subsequent offspring. For the treatment of non-neoplastic disease alternative forms of therapy not involvfng radiation have been recommended for some disorders (26) so as to reduce the incidence of somatic effects over the long subsequent life expectancy of these patients.
99. In many industrialized countries about one-half of the new cancer cases arising each year are treated with radio-therapy. This proportion has not changed appreciably even though the use of chemotherapy has been increasing. Technological developments in the form of linear accelerators, betatrons and telecurie units and 14-MeV neutron therapy units are likely to maintain the current regimes of radio-therapy in the industrialized countries. Elsewhere, the treatment of cancer will rise in importance as other causes of death such as malnutrition. malaria and tuberculosis are gradually eliminated by the improvement in living conditions and the availability of medical care.
1. Genetically-significant dose
100. Tables XXV to XXVIII of annex G of the 1962 report showed the average gonad doses received by patients during treatment for non-neoplastic diseases, together with the GSDs arising from these treatments.
101. These were 2.2 millirads in the Federal Republic of Germany (62), 3.1 millirads in France (110), 3.1-12.1 millirads in the Netherlands (129) and 4.47 millirads in the United Kingdom (26) with additional contributions from the treatment of neoplastic disease of 0, 2.5, 1.0 and 0.52 millirads, respectively.
102. In Japan (95) in 1962 the GSD from therapeutic irradiation was estimated to be 0.9 millirad. A further survey in 1971 (59) has been carried out and utilizes a range of child-expectancy factors for p~ti~nts by age and disease. A value of GSD of 0.97 millirad was obtained. From unpublished reports in the United Kingdom it appears that the frequency of treatments of non-neoplastic diseases has tended to decrease and that the use of x-rays of lower kilovoltage for the treatment of many skin diseases has tended to reduce the GSD.
2. Bone-marrow dose 103. The results of the British survey (25) on
bone-marrow doses from the treatment of non-neoplastic diseases and on the subsequent contribution to the population dose in terms of man-rads were issued in 1966. The method of calculation of the bone-marrow dose was based on that described in paragraphs 79 and 80.
104. Table 31 gives the mean marrow dose per treatment course in those patients who were treated on the head and trunk only, and also the average for all patients treated for a particular condition, including those that were treated on the limbs and whose bone marrow was therefore: not exposed since no active marrow is present in the adult limbs. The first set of data can then be used for calculating marrow doses to individuals or populations known to have been treated on the head and trunk, the second set to obtain population doses in groups of patients treated for a
149
particular condition, assuming that the distribution of treatment sites is the same in the study population as in the British survey ( 25) .
105. Table 32 gives the total annual radiation load in man-rads from radio-therapy of non-neoplastic disease. This is 617,000 man-rads per year in the United Kingdom ( 25). The authors of the original report considered that this radiation load to the population could not justifiably be expressed as a per caput mean marrow dose ( C!vID) since only 1.2 persons per thousand in the population receive such treatment in any one year. However, expressed as CMD, it would amount to 11 millirads.
106. The three procedures making the greatest contributions to the total radiation load are the treatment of skin conditions (41 per cent), that of ankylosing spondylitis (25 per cent) and the induction of artificial menopause (20 per cent). The contribution from the treatment of skin conditions arises from a large number of irradiated patients receiving each year mean marrow doses of about 3.3 rads. On the other hand, the treatment of anlq1losing spondylitis and the induction of artificial menopause are carried out on relatively small populations, each receiving mean marrow doses of 50-100 rads.
107. The marrow doses resulting from the treatment of neoplastic disease were also considered in the British survey (25). Estimates per treatment course for the main conditions are given in table 33. The estimates were made for treatments carried out at 250 kVp (2mm Cu HVT). No estimates seem to have been made of the bone-marrow dose received from treatments by supervoltage equipment. It is estimated, however, that such treatments will not appreciably increase the bone-marrow doses since similar integral doses are received from 250 kVp therapy and supervoltage therapy for the 100-400 cm2 fields that are used in the treatment of neoplasms 6 to 9 centimetres deep.
108. An extensive survey of the bone-marrow dose from the radio-therapy of neoplastic disease has been carried out in Japan in 1971 (59). The CMD for the population amounted to 206 millirads. Utilizing a weighting factor to give a "leukremia-significant" dose (paragraphs 14 and 76) a value of 37 millirads was obtained.
3. Doses to other organs
109. The radiation: dose received by the skin, or, in the case of supervoltage radiation, by the tissues lying just beneath the skin surface, will be of the same order as the doses to the main treatment volume. By increasing the number of fields the superficial doses can be reduced. Nevertheless, significant radiation may be received by organs such as the lung, the kidney and the tissues of the nervous system and the gastro-intestinal tract which are in a direct beam. The radiation doses received by stomach, pancreas and cesophagus during the treatment of ankylosing spondylitis are currently being estimated in the United Kingdom as part of a study of the cancers occurring in these organs, which are heavily irradiated during the treatment of the spine.
IV. Therapeutic use of radio-pharmaceuticals
110. The two most important radio-nuclides administered to patients for therapy are 131I for thyroid
treatment and 32P for polycythremia vera. 198Au and DOY are used in the local treatment of effusions and 131I-lipidiol for endolymphatic therapy.
111. GSDs due to the therapeutic use of radiopharmaceuticals were presented in table XXXII of annex G of the 1962 report. The annual doses were 0.40 millirad in Canada ( 72). 0. 18 millirad in the Federal Republic of Germany (Hamburg) (62), 0.15 millirad in the United Kingdom (26) and 0.24 millirad in the United States (22). The only further information available is from New Zealand (90) where the dose in 1966 was estimated to be 0.047 millirad, from West Berlin (10) where the use of 131I for therapy contributed 0.014 millirad in 1968, and from Japan (2) where 131I was estimated to contribute 0.047 millirad in 1965.
112. Typical values of the gonad doses per millicurie administered for therapy are 0.45-0.6 rad for 131I (17) and 2.6-7.0 rads for 32P (90). The bonemarrow doses per millicurie in the treatment of thyroid cancer has been estimated as 1. 7 rads ( 83) and for intravenously administered 32P the bone-marrow dose is 30 rads per millicurie ( 64). The use of colloidal gold in malignant diseases and rheumatoid arthritis leads to local doses at the site of injection but to insignificant gonad and bone-marrow doses as long as there is no transport away from the injection site. Endolymphatic therapy is a relatively infrequent form of treatment and the dose to the lung per millicurie administered is about 10 rads (64).
113. Sealed sources of radio-nuclides are also used in the treatment of patients. These sources emit either beta rays. as with 00Sr surface applicators, or gamma rays as with 1a1cs tubes and needles inserted into the patient. The gonad and bone-marrow doses received will depend on the distance of the gonads or the bone marrow from the area under treatment, the radionuclide used and the total dose delivered. For a typical treatment of cancer of the cervix using sealed gammaray emitters the gonad dose will be 1.800 rads and the individual mean marrow dose about 260 rads (25).
V. Conclusions
114. The aim of medical radiology being to provide maximum benefit to the population served. any increase in frequency of radiological examinations must be justified. particularly in the developing countries. The Committee has examined data on the frequency of diagnostic radiological examinations and noted that in the 10 years since its last review of the subject (148) there has been an increase by a few per cent per year in this frequency in a number of technically advanced countries and that considerably larger increases may have occurred in developing countries. The Committee has also reviewed information on the attendant doses and concluded that an increase in the frequency of x-ray examinations need not be accompanied by a proportionate rise of the population dose.
115. The results of surveys carried out in the various countries are sufficiently in agreement to make it possible to assess within an order of magnitude the average doses resulting from particular examinations. It therefore appears to be questionable whether emphasis should continue to be placed on the need to carry out dose surveys alone or whether more attention should not be given to other means of achieving the minimum practicable dose to the patient commensurate with the needs of diagnostic radiology.
116. Three basic approaches can contribute variously to this improvement depending. in any particular case, on the availability of funds and trained staff --educational programmes, surveys of the frequency of examination and of the doses received, and administrative control measures. Educational programmes can be aimed at (a) the radiation staff in the conduct of their day-to-day work; (b) the clinical staff that prescribe investigations involving radiation; ( c) the development in the general public of an awareness of the need for radiation protection. The provision of educational training programmes and the establishment of some administrative control may be much more important than dose surveys, particularly where resources are limited.
APPENDIXn
1. A general definition of genetically significant dose has been given in paragraph 9 above.b Approximations must be made to calculate this dose, the most obvious being consideration of groups rather than individuals. It is convenient to start with the approximate definition*
:::; :::; (N(F) w<') d<') + N<"') w<") dC•1> ) ; k ;k Jk Jk jk ;k JI,
D- (1) :::; (N(F) w(F) + N<"> w(")) k k k k k
where
D = (annual) geneticalJy significant dose,
N 11: = (annual) number of individuals of age-class k, sub· jected to class ; exposure,
Nk = total number of individuals of age-class k,
a Reprinted from annex G of the 1962 report of the Committee (148).
b This definition is reproduced in paragraph 7 of the present annex B.
• The degree of approximation involved in the use of formula I depends on the definition of classes ;. In theory, there need be no approximation since the classes may be made so restrictive as to include only one individual per class.
150
w fk = future number of children expected by an exposed individual of age-class k subsequent to a class i exposure.
future number of children expected by an average individual of age-class k,
dfk - gonad dose per class j exposure of an individual of age-class k.
(F) and (M) denote "female" and "male" respectively.
2. For the practical work, formula 1 can be simplified considerably, the first step being to replace the denominator by w·N, where
N(F} \\'(F}
N,w, 111 1,11 (2) \I' - N + -,:r-
and
I (3) w• = N• t w• N* k k
In the last expression, * denotes the sex. N is the total number of individuals of the population. It should be noticed that w·N is about twice the future number of children expected by the present population even though the value of w may be as low as 0.8.
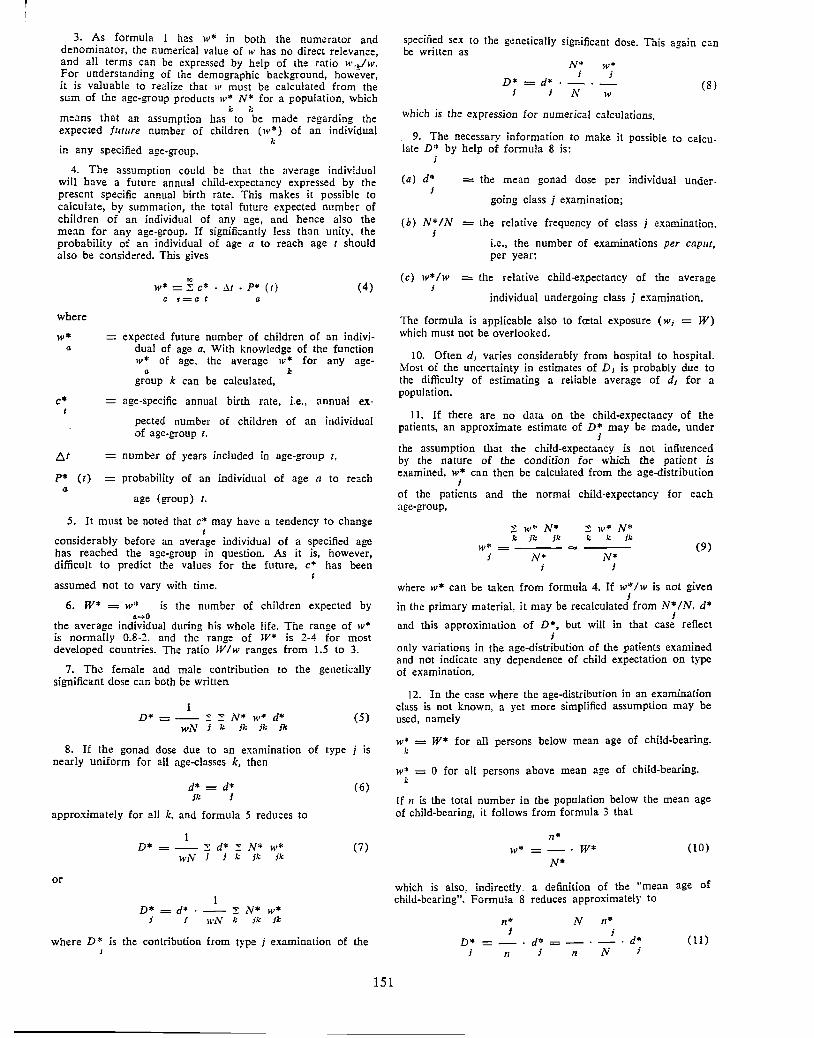
r
3. As formula 1 has w" in both the numerator and denominator, the numerical value of w has no direct relevance, and all terms 7an be expressed by help of the ratio w;,,.lw. For understanding of the demographic background, however, it is valuable to re:ilize that w must be calculated from the sum of the age-group products w* N* for a population, which
k k me::ins that an assumption has to be made regarding the expected fwure number of children (w*) of an individual
k in any specified age-group.
4. The assumption could be that the average individual will have a future annual child-expectancy expressed by the present specific annual birth rate. This makes it possible to calculate, by summation, the total future expected number of children of an individual of any age, and hence also the mean for any age-group. If significantly less than unity, the probability of an individual of age a to reach age t should also be considered. This gives
., w* =:::: c* M • P* (1) (4)
Cl 'l=Cl t Cl
where
w* expected future number of children of an indivi-a dual of age a. With knowledge of the function
w* of age, the average w* for any age-a k
group k can be calculated,
c* age-specific annual birth rate, i.e., annual ex-
pected number of children of an individual of age-group t,
b,.t number of years included in age-group t.
P* (t) - probability of an individual of age a to reach a
age (group) t.
5. It must be noted that c* may have a tendency to change t
considerably before an average individual of a specified age has reached the age-group in question. As it is, however, difficult to predict the values for the future, c* has been
t assumed not to vary with time.
6. W* = w* is the number of children expected by a->O
the average individual during his whole life. The range of w* is normally 0.8-2, and the range of W* is 2-4 for most developed countries. The ratio W /w ranges from 1.5 to 3.
7. The female and male contribution to the genetically significant dose can both be written
1 D* = -- :::: "' N* w* d* (5)
wN i k Jk Jk Jk
8. If the gonad dose due to an examination of type is nearly uniform for all age-classes k, then
d* = d* (6) f/; ;
approximately for all k, and formula 5 reduces to
1 D* = -- :::: d* :::: N* w* (7)
wN i k ;1, 11.
or
1 D* = d* · -- :!: N* w*
i i wN k Jk Jk
where D" is the contribution from type j examination of the J
151
specified sex to the genetically significant dose. This again can be written as
N*
D* = d* · ; J N
w* J
w (8)
wbicb is the expression for numerical calculations.
9. The necessarv information to make ii possible to calculate D" by help of formula 8 is:
;
(a) d* J
- the mean gonad dose per individual under
going class j examination;
( b) N* IN = the relative frequency of class j examination, J
i.e., the number of examinations per caput, per year;
( c) w* lw - the relative child-expectancy of the average J
individual undergoing class j examination.
The formula is applicable also to fretal exposure (w; = W) which must not be overlooked.
10. Often d, varies considerably from hospital to hospital. Most of the uncertainty in estimates of D 1 is probably due to the difficulty of estimating a reliable average of d1 for a population.
11. If there are no data on the child-expectancy of the patients, an approximate estimate of D* may be made, under
; the assumption that the child-expectancy is not influenced b~· the nature of the condition for which the patient is examined. w* can then be calculated from the age-distribution
j
of the patients and the normal child-expectancy for each age-group,
w* J
~ w* N* k }7; jk
N* j
:::: w* N* k k ;,,
N* j
(9)
where w* can be taken from formula 4. If w* lw is not given i
in the primary material, it may be recalculated from N*/N. d* J
and this approximation of D*, but will in that case reflect J
only variations in the age-distribution of the patients examined and not indicate any dependence of child expectation on type of examination.
12. In the case where the age-distribution in an examination class is not known, a yet more simplified assumption may be used, namely
w* = W* for all persons below mean age of child-bearing, i:
w* = 0 for all persons above mean age of child-bearing. i:
If II is the total number in the population below the mean age of child-bearing, it follows from formula 3 that
11*
w* = - · W* N*
(10)
which is also, indirectly, a definition of the "mean age of child-bearing". Formula 8 reduces approximately to
11* N 11*
J j
D* - d* =-· d* (11) j 11 j n N i
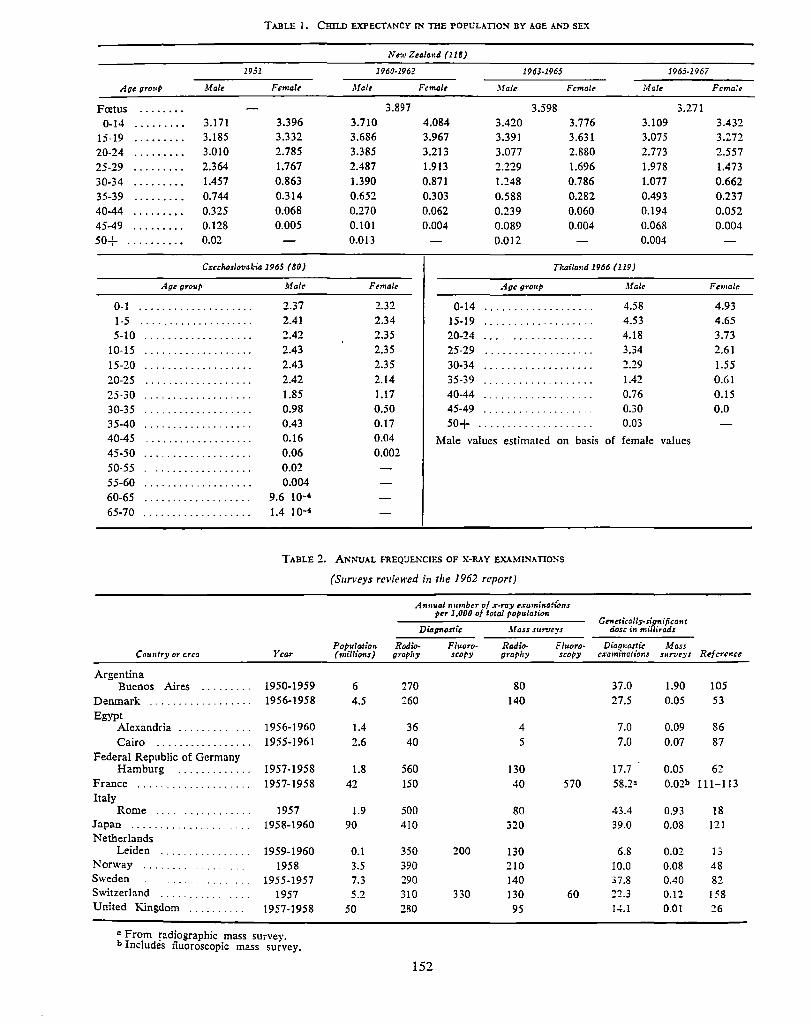
TABLE 1. CHn.o EXPECT ..... "s'CY IN THE POPUL>.TION BY AGE A.1'1> SEX
1951
Age group Male Female
Fcetus -- ...... 0-14 ......... 3.171 3.396
15-19 ......... 3.185 3.332 20-24 .. -...... 3.010 2.785 25-29 ......... 2.364 1.767 30-34 .. -...... 1.457 0.863 35-39 ......... 0.744 0.314 40-44 ......... 0.325 0.068 45-49 ......... 0.128 0.005
so+ .......... 0.02
C,:cc/u,slovakia 1965 (80)
0-1 1-5 5-10
10-15 15-20 20-25 25-30 30-35 35-40 40-45 45-50 50-55 55-60 60-65 65-70
Age grm,p
Cou11tr)1 or crea
Argentina Buenos Aires .........
Denmark .................. Egypt
Alexandria ............. Cairo .... -···· ........
Federal Republic of Germany Hamburg .............
France ... . . . . . . . . . . . . . . . . . Italy
Rome ................. Japan ............... Netherlands
Leiden .............. Norway . . . . . . . .
Sweden Switzerland ....... United Kingdom .......
Male
2.37 2.41 2.42 2.43 2.43 2.42 1.85 0.98 0.43 0.16 0.06 0.02 0.004
9.6 104
1.4 1 Q-4
TABLE 2.
Year
1950-1959 1956-1958
1956-1960 1955-1961
1957-1958 1957-1958
1957 1958-1960
1959-1960 1958
1955-1957 1957
1957-1958
"From radiographic mass survey. b Includes iluoroseopic mass survey.
Ne-,., Zealand (118)
1960-1962 1963-1965 1965-196i
Malt Femalt ,\falc Female Male Female
3.897 3.598 3.271 3.710 4.084 3.420 3.776 3.109 3.432 3.686 3.967 3.39) 3.631 3.075 3.272 3.385 3.213 3.077 2.880 2.773 2.557 2.487 1.913 2.229 1.696 1.978 1.473 1.390 0.871 1.248 0.786 1.077 0.662 0.652 0.303 0.588 0.282 0.493 0.237 0.270 0.062 0.239 0.060 0.194 0.052 0.101 0.004 0.089 0.004 0.068 0.004 0.013 0.012 0.004
Tluzilar.d 1966 (119)
Female Age group Male Female
2.32 0-14 ................... 4.58 4.93 2.34 15-19 ·- ........ - ........ 4.53 4.65 2.35 20-24 ................... 4.18 3.73 2.35 25-29 ........... -· ...... 3.34 2.61 2.35 30-34 ................... 2.29 1.55 2.14 35-39 ................... 1.42 0.61 1.17 40-44 - ....... ' .......... 0.76 0.15 0.50 45-49 .................. 0.30 0.0 0.17 so+ ............. -- ..... 0.03 0.04 Male values estimated on basis of female values 0.002
ANNUAL FREQcJENCIES OF X-RAY EXAMINATIONS
(Sun•eys reviewed in the 1962 report)
Annual n,unber of :r-ray e:ramina.tions per 1,000 of total population
Genetico/ly-si3!'.ificant Di,Jg,w.rtic Mass sur::cys dose 1·n mi lirod.1
Population Radio- Fluoro- Radio· Fluoro· Diagnostic Mass (millions) grap/iy ,copy grapl,y scopy examinations SUMJCj'S Reference
6 270 80 37.0 1.90 105 4.5 '.:60 140 27.5 0.05 53
1.4 36 4 7.0 0.09 86 2.6 40 5 7.0 0.07 87
1.8 560 130 17.7 0.05 62 42 150 40 570 58.24 O.Q2b 111-113
1.9 500 80 43.4 0.93 18 90 410 320 39.0 0.08 121
0.1 350 200 130 6.8 0.02 13 3.5 390 210 10.0 0.08 48 7.3 290 140 37.8 0.40 82 5.2 310 330 130 60 22.3 0.12 158
50 280 95 14.1 0.01 26
152
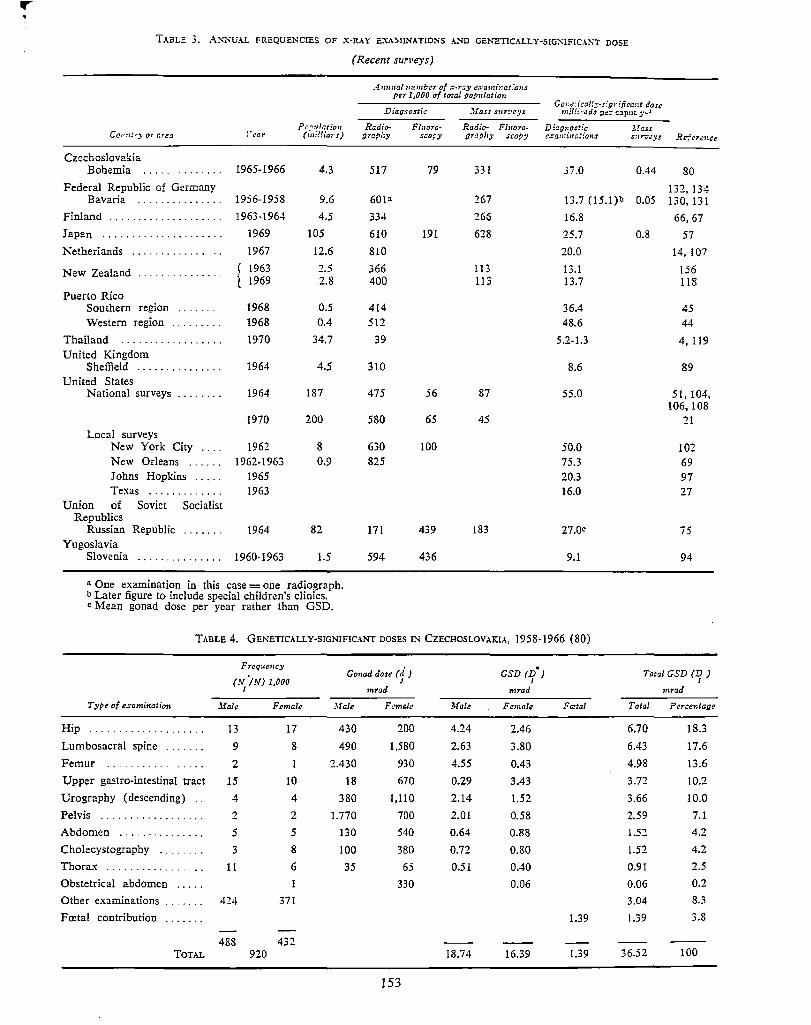
If"" 1
T.\BLE 3. AN!-.'lH.L FREQUENCIES OF X-RAY EXA:'.;!JNATIONS .U,'1) GENETICALLY-SIG:--IFICANT DOSE
Co11r:!•·)• or areu Fear Po:iulation
(111i!/i,,i:s)
Czechoslovakia Bohemia .............. 1965-1966 4.3
Federal Republic of Germany Bavaria ............... 1956-1958 9.6
Finland .................... 1963-1964 4.5
Japan ..................... 1969 105
Netherlands . . . . -· ....... .. 1967 12.6
New Zealand f 1963 2.5 l 1969 2.8
Puerto Rico Southern region 1968 0.5 Western region ......... 1968 0.4
Thailand .................. 1970 34.7 United Kingdom
Sheffield ............... 1964 4.5 United States
National surveys ........ 1964 187
1970 200 Local surveys
New York City ... ' 1962 8 New Orleans .. - ... 1962-1963 0.9 Johns Hopkins ..... 1965 Texas ............. 1963
Union of Soviet Socialist Republics
Russian Republic 1964 82 Yugoslavia
Slovenia ............... 1960-1963 1.5
" One examination in this case= one radiograph. b Later figure to include special children's clinics. "Mean gonad dose per year rather than GSD.
(Recent surveys)
A m::ta/ ,rn mber of .:-•r=y 1.~.1.·an:i,:at:·011s per 1,000 of total population
D£ag~1osti,: J.fass s:,r:•ey.s Ge1:e:ica!!::•s:·gnificant dose
mil!frads per c:J.put :,.•J
Radio- Filloro- Radio- Fl11oro• Diagnos:ic Jfou grap/iy scopy graph:; scop:; c.raminations s:,r;.:cys
517 79 331 37.0 0.44
601" 267 13.7 (15.l)b 0.05
334 266 16.8
610 191 628 25.7 0.8
810 20.0
366 113 13.1 400 113 13.7
414 36.4 512 48.6
39 5.2-1.3
310 8.6
475 56 87 55.0
580 65 45
630 100 50.0 825 75.3
20.3 16.0
171 439 183 27.0"
594 436 9.1
TABLE 4. GENETICALLY-SIGNIFICANT DOSES IN CZECHOSLOVAKIA, 1958-1966 (80)
Rr,crmce
80
132, 134 130, 131
66, 67
57 14, 107
156 118
45 44
4,119
89
51, 104, 106, 108
21
102 69 97 27
75
94
Frequc11cy Gonad dose ( J') GSD (D•) Total GSD (Ij )
(N •IN) 1,000 J J J mrad mrad mrad
Type of exami11<1tio,1 Male Female :Male Feme/e Male Female Fa,tal Total Percc,:tagc
Hip .................... 13 17 430 200 4.24 2.46 6.70 18.3
Lumbosacral spine ....... 9 8 490 1,580 2.63 3.80 6.43 17.6
Femur ... 2 1 2.430 930 4.55 0.43 4.98 13.6
Upper gastro-intestinal tract 15 10 18 670 0.29 3.43 3.72 10.2
Urograpby ( descending) 4 4 380 1,110 2.14 1.52 3.66 10.0
Pelvis ...... -· .......... 2 2 1.770 700 2.01 0.58 2.59 7.1
Abdomen ............... 5 5 130 540 0.64 0.88 1.52 4.2
Cholecystography .... 3 8 100 380 0.72 0.80 1.52 4.2
Thorax ....... - - ..... 11 6 35 65 0.51 0.40 0.91 2.5
Obstetrical abdomen 1 330 0.06 0.06 0.2
Other examinations 424 371 3.04 8.3
Fretal contribution ....... 1.39 l.39 3.8
488 4~,, :J-
TOTAL 920 18.74 16.39 1.39 36.52 100
153
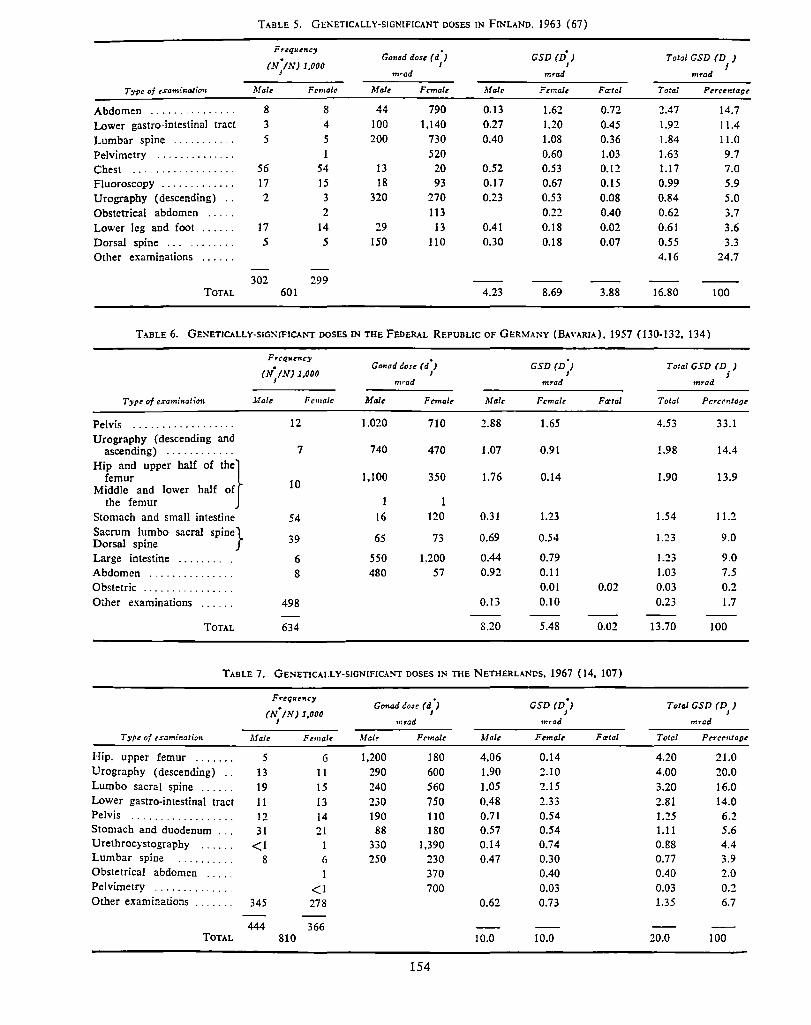
TABLE 5. GENETICALLY·SIGNrFICANT DOSES IN FINLAND, 1963 (67)
Frtqsuncy Gonad dose ( d ·) GSD (D.)
(N./N) 1,000 Total GSD (D J
J J i J m.-ad mrad mrad
Type of ,.rcminalion Male F~n:alr Male Female Male Feriale Ftrtol Total P~rcc-ntage
Abdomen ............. 8 8 44 790 0.13 1.62 0.72 2.47 14.7 Lower gastro-intestinal tract 3 4 100 1,140 0.27 1.20 0.45 1.92 11.4 Lumbar spine ........... 5 5 200 730 0.40 1.08 0.36 l.84 11.0 Pelvimetry .............. 520 0.60 1.03 1.63 9.7 Chest . . - ..... ......... 56 54 13 20 0.52 0.53 0.12 1.17 7.0 Fluoroscopy ............. 17 15 18 93 0.17 0.67 0.15 0.99 5.9 Urography (descending) .. 2 3 320 270 0.23 0.53 0.08 0.84 5.0 Obstetrical abdomen ... 2 113 0.22 0.40 0.62 3.7 Lower leg and foot ...... 17 14 29 13 0.41 0.18 0.02 0.61 3.6 Dorsal spine ... ' .. ' .... 5 5 150 110 0.30 0.18 O.Q7 0.55 3.3 Other examinations .. -... 4.16 24.7
302 299 TOTAL 601 4.23 8.69 3.88 16.80 100
T . .\BLE 6. GENETICALLY·SIGKIFJCANT DOSES IN THE FEDERAL REPUBLIC OF GERMANY (BA\'ARU.), 1957 {130-132, 134)
Frcq,.ency Gonad t!ose ( d •) GSD (D'J
(N. /N) 1,000 Total GSD (D )
J J J J mrad mrad mrad
T:.1pe of examination ,lfale Female Male Female Male Femal~ Ftrtal Total Pcrcrntooe
Pelvis .................. 12 1.020 710 2.88 1.65 4.53 33.1 Orography ( descending and
ascending) -·· ......... 7 740 470 1.07 0.91 1.98 14.4
Hip ,nd """" hall of th,} femur
10 1,100 350 1.76 0.14 1.90 13.9
Middle and lower half of the femur
Stomach and small intestine 54 16 120 0.31 1.23 1.54 11.2
Sacrum lumbo sacral spine} Dorsal spine 39 65 73 0.69 0.54 1.23 9.0
Large intestine .......... 6 550 1.200 0.44 0.79 1.23 9.0 Abdomen ............... 8 480 57 0.92 0.11 1.03 7.5 Obstetric ................ 0.01 0.02 0.03 0.2 Other examinations 498 0.13 0.10 0.23 1.7
TOTAL 634 8.20 5.48 0.02 13.70 100
TABLE 7. GESETICALLY·SIGN!FJCANT DOSES IN IBE NETHERLANDS, 1967 ( 14, 107)
Freq"'"•:! Gonad t!ose ( d ·) GSD (D•J Total GSD (D )
(N. /NJ 1,000 J J J J "11'CJd mr-ad mrad
Tyre of f'raminatio,i Male Fenialt M al, Femalt Male Femalt Faetal Tote/ Percentaoe
Hip, upper femur ....... 5 6 1,200 180 4.06 0.14 4.20 21.0 Urography (descending) .. 13 11 290 600 1.90 2.10 4.00 20.0 Lumba sacral spine ...... 19 15 240 560 1.05 2.15 3.20 16.0 Lower gastro-intestinal tract 11 13 230 750 0.48 2.33 2.81 14.0 Pelvis
+ •••••••••••••••• 12 14 190 110 0.71 0.54 1.25 6.2 Stomach and duodenum ... 31 21 88 180 0.57 0.54 1.11 5.6 Urethrocystography ...... <1 I 330 1,390 0.14 0.74 0.88 4.4 Lumbar spine .......... 8 6 250 230 0.47 0.30 0.77 3.9 Obstetrical abdomen .... ' I 370 0.40 0.40 2.0 Pelvimetry .............. <1 700 0.03 0.03 0.2 Other examinations 345 278 0.62 0.73 1.35 6.7
444 366 TOTAL 810 10.0 10.0 20.0 100
154
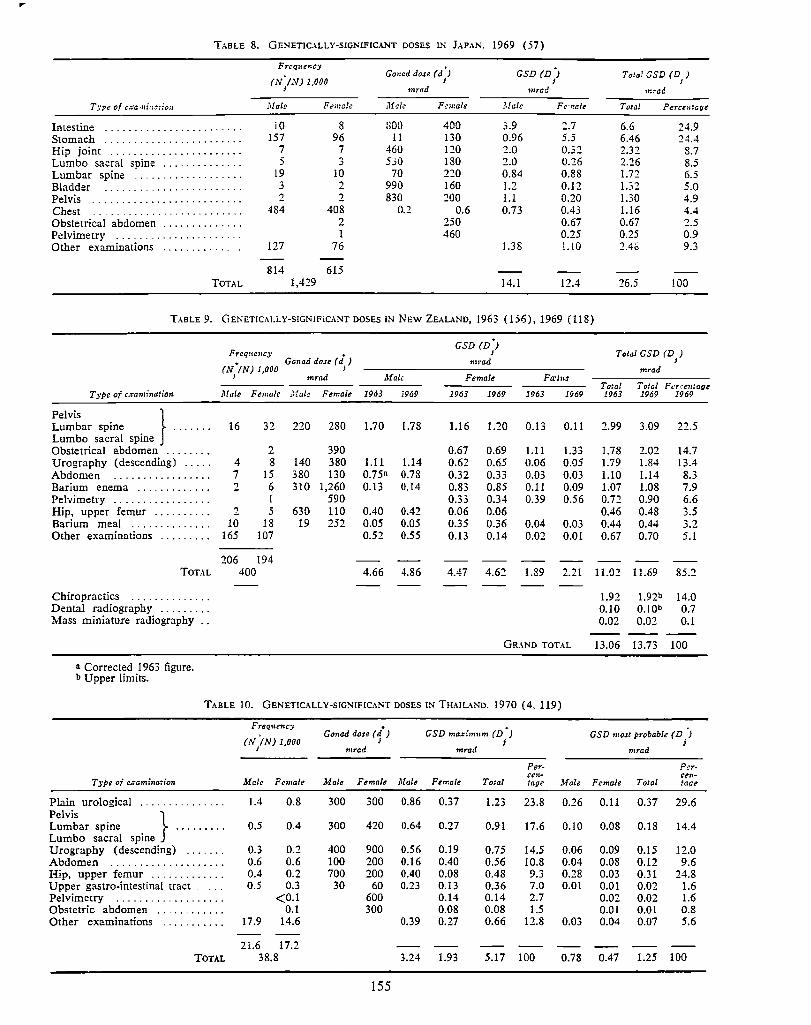
,..
TABLE 8. GENETICALLY-SIGNIFICANT DOSES IN JAPAN. 1969 (57)
Frcq:,ency Gonad dose (d•) GSD (D)
(N-/N) 1,000 Total GSD (D. )
I J ; I mrad mrad 11:rad
Type of c.i-a,,,footio;z Male Female ,11 al, Fen:ale Jlale Fe,,:ale Total Pcrccn:aae
Intestine ........... - ............ 10 8 SOO 400 3.9 2.7 6.6 24.9 Stomach ........................ 157 96 11 130 0.96 5.5 6.46 24.4 Hip joim ....................... 7 7 460 120 2.0 0.32 2.32 8.7 Lumba sacral spine .............. 5 3 530 180 2.0 0.26 2.26 8.5 Lumbar spine ................... 19 10 70 220 0.84 0.88 1.72 6.5 Bladder ' ................... 3 2 990 160 1.2 0.12 1.32 5.0 Pelvis .......................... 2 2 830 200 I.I 0.20 1.30 4.9 Chest ................... - ...... 484 408 0.2 0.6 0.73 0.43 1.16 4.4 Obsteu·ical abdomen .............. 2 250 0.67 0.67 2.5 Pelvimerry . . . .............. - .... I 460 0.25 0.25 0.9 Other examinations .............. 127 76 1.38 1.10 2.43 9.3
814 615 TOTAL 1,429 14.l 12.4 26.5 100
TABLE 9. GEKETICAJ.LY-SIGNIFICANT DOSES IN NEW ZEALAND, 1963 (156), 1969 (118)
Frcquc11c:y/ GSD (D•)
Gonad dose ( d° ) J Total GSD (D )
(N •IN) 1,000 mrad J
J mrad I mmd Male Female Fa:tus
Total Total Pcr~entage Type of c.ramination Male Female J!afo Female 1963 1969 1963 1969 1963 1969 i963 1969 1969
Pelvis } Lumbar spine ....... 16 32 220 280 1.70 1.78 1.16 1.20 0.13 0.11 2.99 3.09 22.5 Lumba sacral spine Obstetrical abdomen ........ 2 390 0.67 0.69 1.11 1.33 1.78 2.02 14.7 Urography (descending) ..... 4 8 140 380 1.11 1.14 0.62 0.65 0.06 0.05 1.79 1.84 13.4 Abdomen ................. 7 15 380 130 0.75n 0.78 0.32 0.33 0.03 0.03 1.10 1.14 8.3 Barium enema ............. 2 6 310 1,260 0.13 0.14 0.83 0.85 0.11 0.09 1.07 1.08 7.9 Pelvimetry ................. I 590 0.33 0.34 0.39 0.56 0.72 0.90 6.6 Hip, upper femur .......... 2 5 630 110 0.40 0.42 0.06 0.06 0.46 0.48 3.5 Barium meal .............. 10 18 19 252 0.05 0.05 0.35 0.36 0.04 0.03 0.44 0.44 3.2 Other examinations ......... 165 107 0.52 0.55 0.13 0.14 0.02 0.01 0.67 0.70 5.1
206 194 TOTAL 400 4.66 4.86 4.47 4.62 1.89 2.21 11.02 11.69 85.2
Chiropractics .............. 1.92 J.92b 14.0 Dental radiography ......... 0.10 O.!Ob 0.7 Mass miniature radiography .. 0.02 0.02 0.1
GRAND TOTAL 13.06 13.73 100
n Corrected 1963 figure. b Upper limits.
TABLE 10. GENETICALLY-SIGNIFICANT DOSES IN THAILAND, 1970 (4. 119)
Frequency Gonad dose (l) GSD ma.i-imum (D ·) GSD most probable ( D )
(N ·1 N) 1,000 J J , J mrad mrad mra.d
Per- Per-ccn- ,:en-
TsPe of cscmination Male Female Male Female Male Female Total tage },[ale Female Total taae
Plain urological ............... 1.4 0.8 300 300 0.86 0.37 1.23 23.8 0.26 0.11 0.37 29.6 Pelvis
spine} Lumbar spine ......... 0.5 0.4 300 420 0.64 0.27 0.91 17.6 0.10 0.08 0.18 14.4 Lumbo sacral Urography (descending) ....... 0.3 0.2 400 900 0.56 0.19 0.75 14.5 0.06 0.09 0.15 12.0 Abdomen .................... 0.6 0.6 100 200 0.16 0.40 0.56 10.8 0.04 0.08 0.12 9.6 Hip, upper femur ............. 0.4 0.2 700 200 0.40 0.08 0.48 9.3 0.28 0.03 0.31 24.8 Upper gastro-intestinal tract 0.5 0.3 30 60 0.23 0.13 0.36 7.0 0.01 0.01 0.02 1.6 Pelvimetry ................... <0.1 600 0.14 0.14 2.7 0.02 0.02 1.6 Obstetric abdomen ............ 0.1 300 0.08 0.08 1.5 0.01 0.01 0.8 Other examinations ........... 17.9 14.6 0.39 0.27 0.66 12.8 0.03 0.04 0.07 5.6
21.6 17.2 TOTAL 38.8 3.24 1.93 5.17 100 0.78 0.47 1.25 100
155
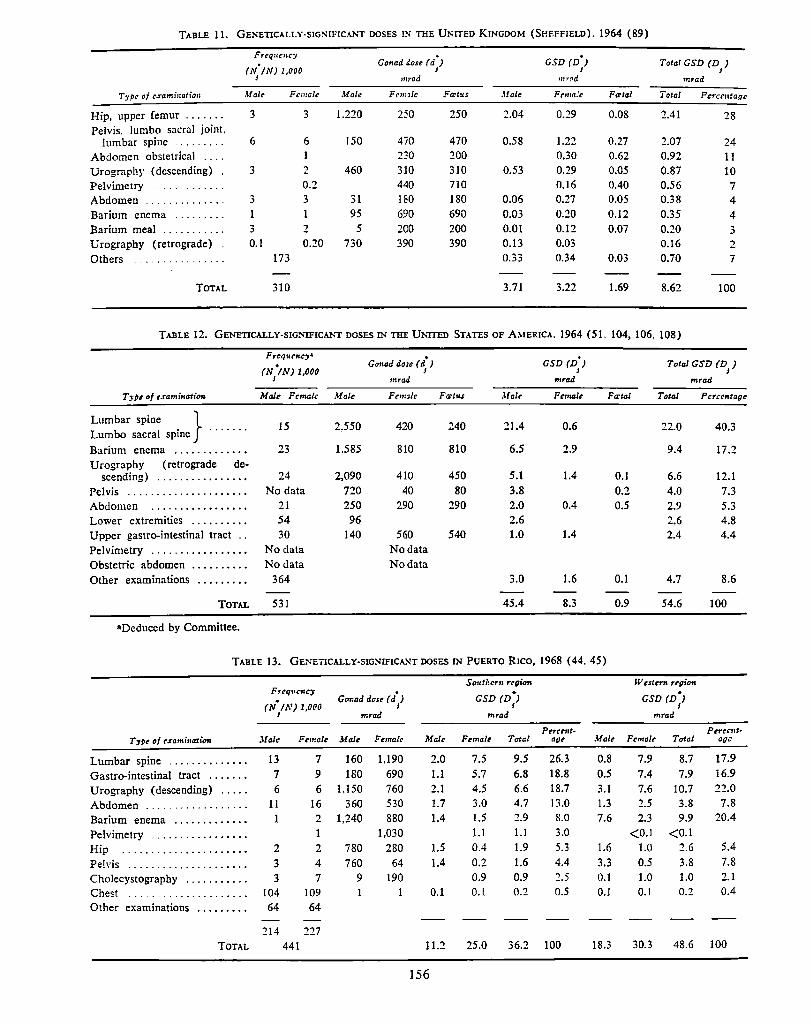
TABLE 11. GENETICALLY-SIGNIFICANT DOSES IN THE U1'TIED KINGDOM (SHEFFIELD). 1964 (89)
FrtqtttHC}' Gonad dose ( d ·) GSD (D•)
( N• IN J 1,000 J J Total GSD (DJ)
J mrad mn,d mrad
Type of cxami11atio11 Male Fcmalt Male Fcm1/c Fa!IUS ltf ale Fcma.'c Fa:tal Total Percentage
Hip, upper femur ....... 3 3 1.220 250 250 2.04 0.29 0.08 2.41 28 Pelvis. Jumbo sacral joint,
lumbar spine ......... 6 6 150 470 470 0.58 1.22 0.27 2.07 24 Abdomen obstetrical .... 230 200 0.30 0.62 0.92 11 Urography ( descending) 3 1 460 310 310 0.53 0.29 0.05 0.87 10 Pelvime1ry ............. 0.2 440 710 0.16 0.40 0.56 7 Abdomen .............. 3 3 31 180 180 0.06 0.27 0.05 0.38 4 Barium enema ......... 95 690 690 0.03 0.20 0.12 0.35 4 Barium meal ........... 3 2 5 200 200 0.01 0.12 0.07 0.20 3 Urography (retrograde) 0.1 0.20 730 390 390 0.13 0.03 0.16 2 Others . . . . ............ 173 0.33 0.34 0.03 0.70 7
TOTAL 310 3.71 3.22 1.69 8.62 100
TABLE 12. GENETICALLY·S1Gl'<"1FICANT DOSES IN THE UNITED STATES OF AMERICA, 1964 (51, 104, 106. 108)
Frcqucu::,• Gonad do;c ( l) GSD (D•)
(N./N) 1,000 J J Total GSD (DJ)
J mrad mrad mrad
Typt of e.rami11ation Mali, Ftmalc Mali, Fem,Ie Fa!ttU Jfalt Female Fa:tal Total Percentage
Lumbar spine } Lumbo sacral spine
....... 15 2.550 420 240 11.4 0.6 22.0 40.3
Barium enema ....... ·····. 23 1,585 810 810 6.5 2.9 9.4 17.2 Urograpby ( retrograde de-
scending) ................ 24 2,090 410 450 5.1 1.4 0.1 6.6 12.1
Pelvis ..................... No data 720 40 80 3.8 0.2 4.0 7.3 Abdomen ................. 21 250 290 290 2.0 0.4 0.5 2.9 5.3 Lower extremities .......... 54 96 2.6 2.6 4.8 Upper gastro-intestinal tract .. 30 140 560 540 1.0 1.4 2.4 4.4
Pelvimetry ................. No data No data Obstetric abdomen .......... No data No data
Other examinations ......... 364 3.0 1.6 0.1 4.7 8.6
TOTAL 531 45.4 8.3 0.9 54.6 100
aDcduced by Committee.
TABLE 13. GENETICALLY-SIGNIFICANT DOSES JN PUERTO RICO, 1968 (44, 45)
Southern region West"" ugi(m Frcq11c,1cy
Gonad dose ( l) GSD (D•) GSD (D•) (N. IN) 1,000 J J J
J mrad mrad mrad
Perunt· Pcrccnt-T::,pe of c.rami111nion .Ualir Female Male Female Male Fema/i, Total age Male Female Talal age
Lumbar spine .............. 13 7 160 1,190 2.0 7.5 9.5 26.3 0.8 7.9 8.7 17.9
Gastro-intestinal tract ....... 7 9 180 690 1.1 5.7 6.8 18.8 0.5 7.4 7.9 16.9
Urography ( descending) ..... 6 6 1.150 760 2.1 4.5 6.6 18.7 3.1 7.6 10.7 22.0
Abdomen . . . . .............. 11 16 360 530 1.7 3.0 4.7 13.0 1.3 2.5 3.8 7.8
Barium enema ............. 1 2 1,240 880 1.4 1.5 2.9 8.0 7.6 2.3 9.9 20.4
Pelvimetry ................. 1 1,030 1.1 1.1 3.0 <0.1 <O.l
Hip ...................... 2 2 780 280 1.5 0.4 1.9 5.3 1.6 1.0 2.6 5.4
Pelvis ..................... 3 4 760 64 1.4 0.2 1.6 4.4 3.3 0.5 3.8 7.8
Cholecystography ........... 3 7 9 190 0.9 0.9 2.5 0.1 1.0 1.0 2.1
Chest ..................... 104 109 1 1 0.1 0.1 0.2 0.5 0.1 0.1 0.2 0.4
Other examinations ......... 64 64
214 227 TOTAL 441 11.2 25.0 36.2 100 18.3 30.3 48.6 100
156
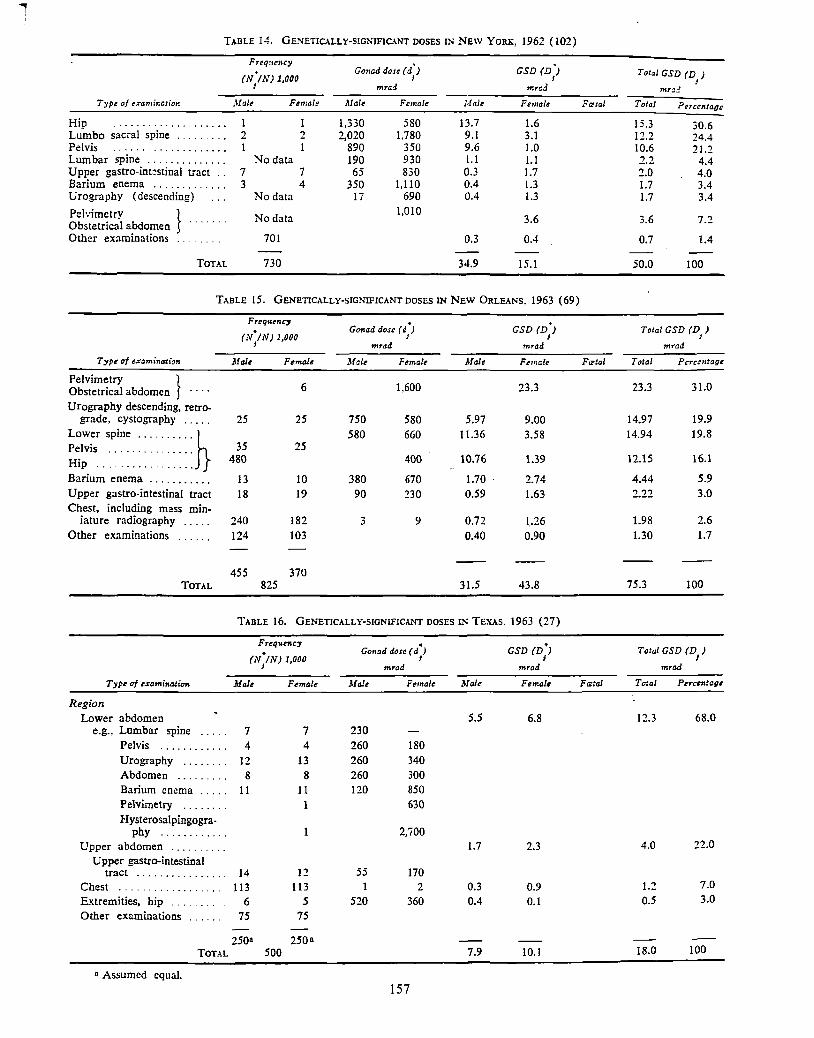
TABLE 14. GE.'iETIC\LLY·SIGNlFICANT DOSES IN NEW YORK, 1962 (102)
Type of e.ramillation
Hip ............ . Lumbo sacral spine ........ . Pelvis ................... . Lumbar spine ............. . Upper gastro-int~stinal tract .. Barium enema ............ . Urography ( descending)
Pelvimetry } Obstetrical abdomen · · · · · · · Other examinations . . . . ...
TOTAL
Freq11e11cy
(N,IN) 1,000 I
Male
1 1 2 2 1
No data 7 7 3 4
No data
No data
701
730
Go11ad dose ( i) I
mrad
Male
1,330 2,020
890 190 65
350 17
Female
580 1,780
350 930 830
1,110 690
1,010
Male
13.7 9.1 9.6 1.1 0.3 0.4 0.4
0.3
34.9
GSD (D) I
mrcd
Female
1.6 3.1 1.0 1.1 1.7 1.3 1.3
3.6
0.4
15.1
TABLE 15. GENETICALLY-SIGNIFICANT DOSES IN NEW ORLEANS. 1963 (69)
Frequency
(N./N) 1,000 J
T :,pt of e.ramination Malt
Pelvimetry } Obstetrical abdomen Urography descending, retro.
grade, cystography . . . . . 25
Lower spine .......... } Pelvis . . . . . . . . . . . . . . . } 35 Hip . . . . . . . . . . . . . . . . . 480
Barium enema . . . . . . . . . . . 13 Upper gastro-intestinaJ tract 18 Chest, including mass min-
iature radiography . . . . . 240 Other examinations . . . . . . 124
Ftmali!
6
25
25
10
19
182 103
455 370 TOTAL 825
Gonad dose r/J J
mrad
Male
750 580
380 90
3
Female
1,600
580
660
400
670 230
9
Male
5.97 11.36
10.76
1.70 0.59
0.72
0.40
31.5
GSD (D•J I
mrad
Female
23.3
9.00 3.58
1.39
2.74 1.63
L26 0.90
43.8
TABLE 16. GENETICALLY-SIGNIFICANT DOSES IN TEXAS. 1963 (27)
Freq1<ency
(N.JNJ 1,000 I
Male
Region Lower abdomen
e.g., Lumbar spine 7
Pelvis . . . . . . . . . . . . 4 Urography . . . . . . . . 12 Abdomen . . . . . . . . . 8 Barium enema . . . . . 11 Pelvimetry ....... . Hysterosalpingogra-
phy ........... . Upper abdomen ......... .
Upper gastro-intestinal tract . . . . . . . . . . . . . . . . 14
Chest . . . . . . . . . . . . . . . . . . 113 E""Ctremities, hip . . . . 6 Other examinations . . . . . . 75
Female
7 4
13
8 11 1
1
12 113
5 75
2504 2504 TOTAL 500
a Assumed equal.
Gonad dose (a") I
mrad
Male
230 260 260 260 120
55 1
520
Female
180 340 300 850 630
2,700
170 2
360
157
Maltt
5.5
1.7
0.3 0.4
7.9
mrad
Femaltt
6.8
2.3
0.9 0.1
10.1
F(J!ta/
F<Etal
Total GSD (D ) I
Total
15.3 12.2 10.6 2.2 2.0 1.7 1.7
3.6
0.7
50.0
Percentage
30.6 24.4 21.2 4.4 4.0 3.4 3.4
7.2
1.4
100
Total GSD (DJ)
mrad
Total
23.3
14.97 14.94
12.15
4.44 2.22
1.98
1.30
75.3
Pcrc:ntage
31.0
19.9 19.8
16.1
5.9
3.0
2.6 1.7
100
Total GSD (D1
)
mrad
Total
12.3
4.0
1.2 0.5
18.0
Percentage
68.0
22.0
7.0 3.0
100
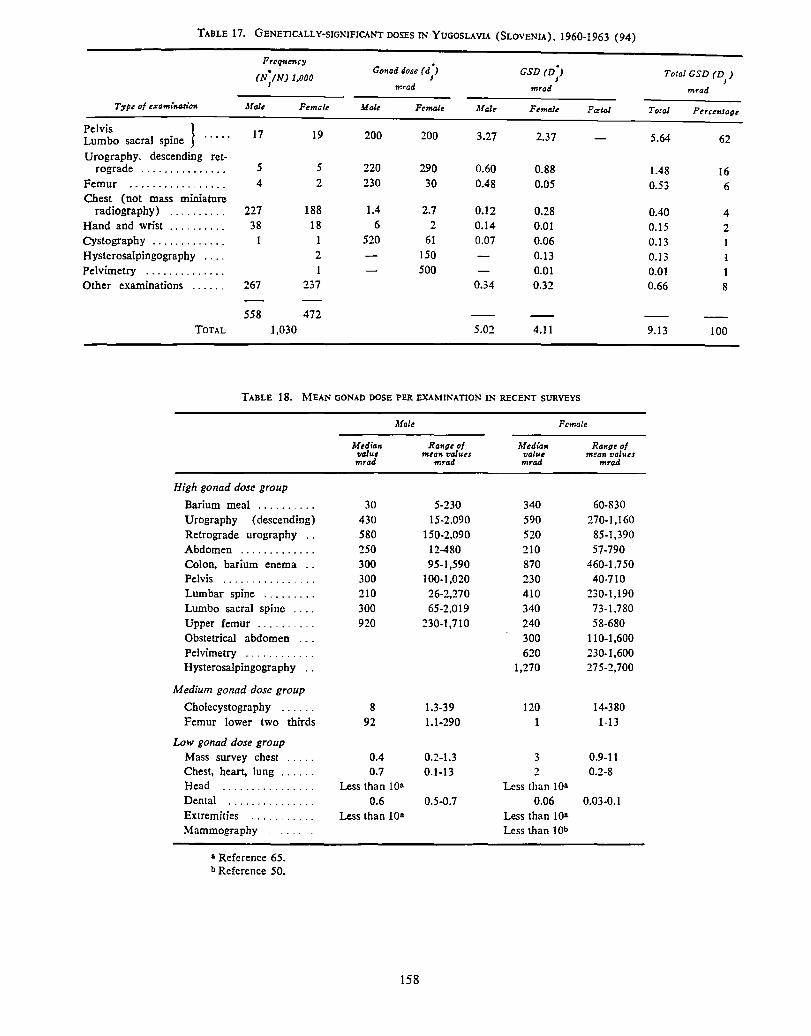
TABLE 17. GENETICALLY•SJGNJFICANT DOSES IN YUGOSLAVIA (SLOVENIA), 1960-1963 (94)
Frcq,uncy
(N./NJ 1,000 J
Type of esa,,u"niuum Male
Pelvis } 17 Lumbo sacral spine Urography, descending ret-
rograde . . . . . . . . . . . . . . . 5 Femur . . . . . . . . . . . . . . . . . 4 Chest (not mass miniature
radiography) . . . . . . . . . . 227 Hand and wrist . . . . . . . . . . 38 Cystography ............ . Hysterosalpingography ... . Pelvimetry ............. . Other examinations ..... . 267
Female
19
5 2
188 18
1 2
237
558 472 TOTAL 1,030
Gonad aose ( d ') J
Male
200
220 230
1.4 6
520
200
290 30
2.7 2
61 150 500
llf ale
3.27
0.60 0.48
0.12 0.14 0.07
0.34
5.02
GSD (D') J
,nrad
Female
2.37
0.88 0.05
0.28 0.01 0.06 0.13 0.01 0.32
4.11
Fatal
TABLE 18. MEAN GONAD DOSE PER EXAMINATION IN RECENT SURVEYS
High gonad dose group
Barium meal ......... . Urography (descending) Retrograde urography .. Abdomen ............ . Colon, barium enema .. Pelvis ............ . Lumbar spine ........ . Lumbo sacral spine ... . Upper femur ...... . Obstetrical abdomen .. . Pelvimetry ........... . Hysterosalpingography ..
Medium gonad dose group
Cholecystography ..... . Femur lower two thirds
Low gonad dose group Mass survey chest .... . Chest, heart, Jung ..... . Head ............... . Dental Extremities Mammography
a Reference 65. b Reference 50.
Male
Median value mrad
30 430 580 250 300 300 210 300 920
8 92
0.4 0.7
Less than lQn
0.6 Less than 10a
158
Range of mean values
mrad
5-230 15-2.090
150-2,090 12-480 95-1,590
100-1,020 26-2,270 65-2,019
230-1,710
1.3-39 1.1-290
0.2-1.3 0.1-13
0.5-0.7
Female
Media" Rangt of value mean values mrad mrad
340 60-830 590 270-1,160 520 85-1,390 210 57-790 870 460-1,750 230 40-710 410 230-1.190 340 73-1.780 240 58-680 300 110-1,600 620 230-1,600
1,270 275-2,700
120 14-380 1 1-13
3 0.9-11 2 0.2-8
Less than 10a 0.06 0.03-0.1
Less than 1 oa Less than 10b
Total GSD (D1
)
tnrad
Total
5.64
1.48 0.53
0.40 0.15 0.13 0.13 0.01 0.66
9.13
Percentage
62
16 6
4 2
1
1 8
100
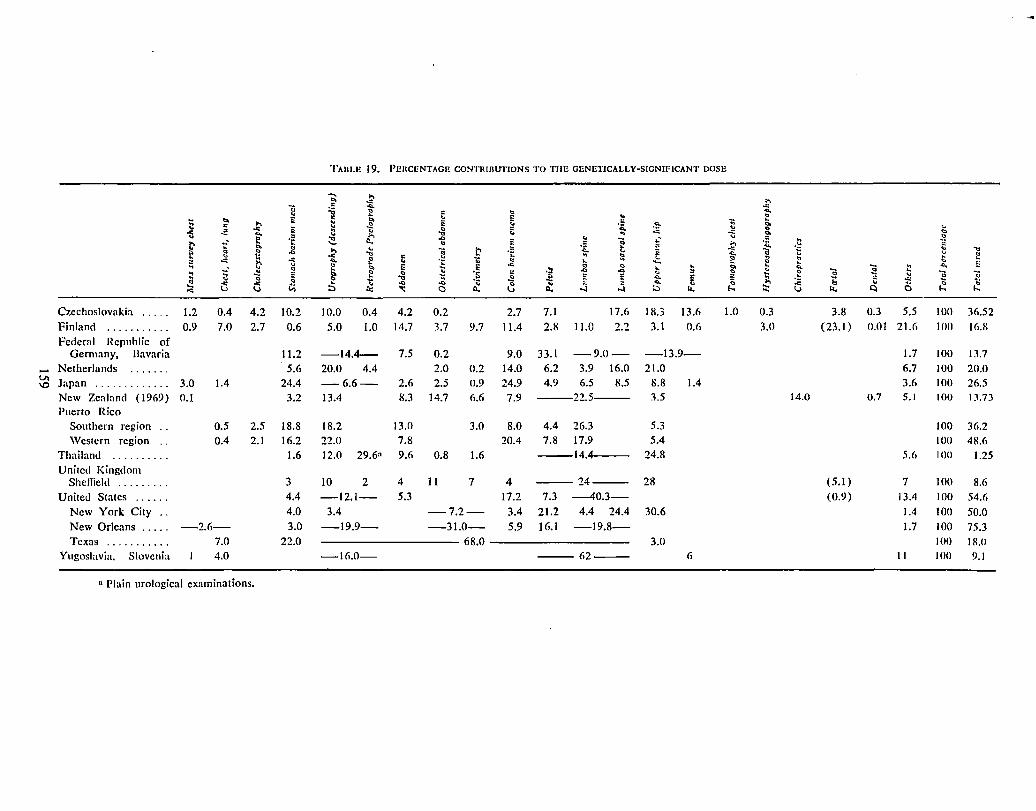
TABLE 19 . PERCENTAGE CONTRIIJUTIONS TO THE GENETICALLY-SIGNIFICANT DOSE
..., ... "' ... ...
;; ~ .... ... ~ ~ " ....
" " " .. E f "' " .. -:; :: ~ ... " ii ;;; ·= -~ .., .. " i .~
.; c ~ " " .:: .... ;:: .., .., .., .. "" I! .., t: ..,
" ] .:- ... t ·~ " ~ t:' '- " i: .:: ,., ;:; "' " .. i'.' ·t " .., .., r "
., ... ~ .., ;; ~ " :: .... t! '-' ~ ll -;; t; 1 ;:; .., .. ... i' " ~ " ... ... " ~ ... = ... .... ... ~ = ... t:' ...
~ E •g ... " " ... ... "' .... - ::! .... i ~ " " . :, .., .., :, "
... " " 5 "' {l .§ ...
I " .. ] ;; -:; E E .... ~ " ... l Ii ~ ~ ·;:: ~
~ :.; t; ;;; "" ~ t:i .., ..,
" ... j .... c " :.i \.) V) :::, Cl:: ~ 0 ~ \.) ~ .:i :.:, "- \.) "- Cl h
Czechoslovakia ..... 1.2 0.4 4.2 10.2 10.0 0.4 4.2 0.2 2.7 7.1 17.6 18.3 13.6 1.0 0.3 3.8 0.3 5.5 100 36.52 Finland ........... 0.9 7.0 2.7 0.6 5.0 1.0 14.7 3.7 9.7 11.4 2.8 I 1.0 2.2 3.1 0.6 3.0 (23.1) 0.01 21.6 100 16.8 Federal Republic of
Germany, llavaria 11.2 -14.4- 7.5 0.2 9.0 33.1 -9.0- -13.9- J.7 100 IU
Netherlands 5.6 20.0 4.4 2.0 0.2 14.0 6.2 3.9 16.0 21.0 6.7 100 20.0 ~ Japan ............. 3.0 1.4 24.4 -6.6- 2.6 2.5 0.9 24.9 4.9 6.5 8.5 8.8 J.4 3.6 100 26.5
New Zealand (1969) 0.1 3.2 13.4 8.3 14.7 6.6 7.9 ---22.5--- 3.5 14.0 0.7 5.1 JOO JJ.73 Puerto Rico
Southern region 0.5 2.5 18.8 18.2 13.0 3.0 8.0 4.4 26.3 5.3 100 36.2 Western region 0.4 2.1 16.2 22.0 7.8 20.4 7.8 17.9 5.4 100 48.6
Thailand .......... 1.6 12.0 29.6n 9.6 0.8 1.6 --14. 24.8 5.6 100 1.25 United Kingdom
Sheffield ......... 3 JO 2 4 11 7 4 --- 24--- 28 (5.1) 7 JOO 8.6 United Slates ...... 4.4 -12.1- 5.3 17.2 7.3 --40.3- (0.9) 13.4 100 54.6
New York City .. 4.0 3.4 -7.2- 3.4 21.2 4.4 24.4 30.6 1.4 100 50.0 New Orleans ..... -2.6- 3.0 -19.9- -31.0- 5.9 ] 6.1 -19.8- 1.7 100 75.3 Texas ........... 7.0 22.0 68.0 3.0 J.00 18.0
Yugoslavia, Slovenia I 4.0 -16.0- --62-- 6 II 100 9.1
n Plain urological examinations.
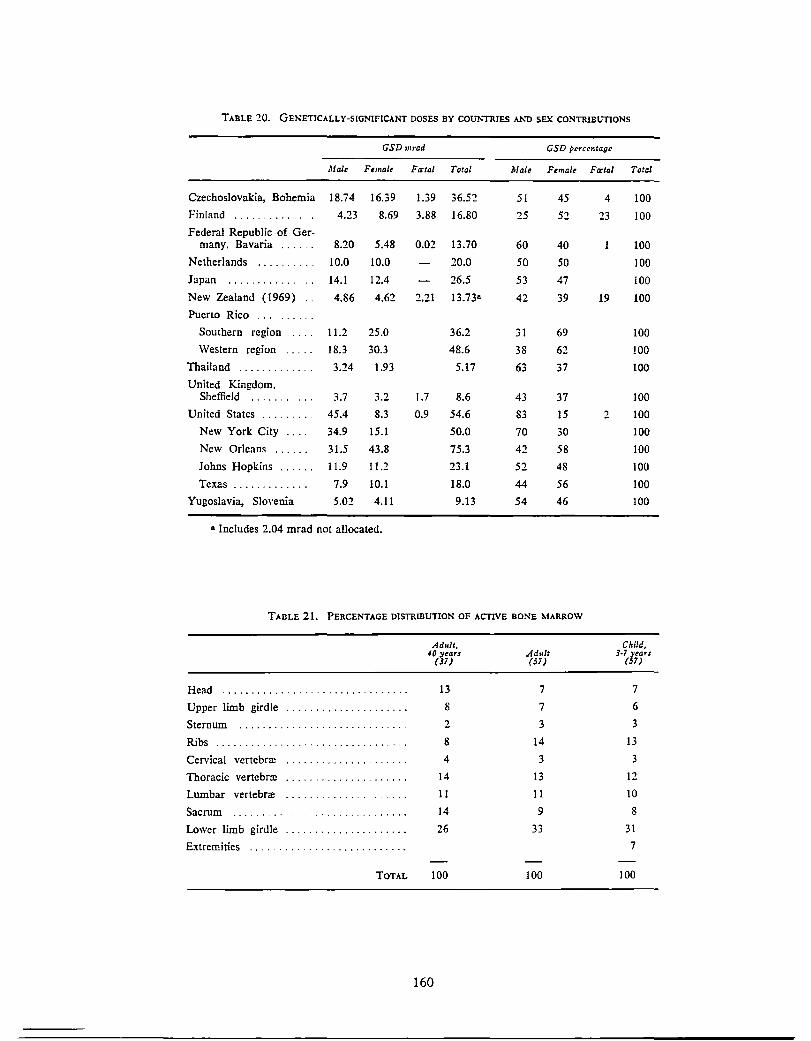
TABLE 20. GENETICALLY-SIGNIFICANT DOSES BY CO'CJN!RIES AND SEX CONTIUBUTIONS
GSDmrad GSD Percentage
Male F1111a/e Ftrtal Total .Male Ftmale Fa:tal
Czechoslovakia, Bohemia 18.74 16.39 1.39 36.52 51 45 4
Finland .............. 4.23 8.69 3.88 16.80 25 52 23
Federal Republic of Ger-many. Bavaria ... 8.20 5.48 0.02 13.70 60 40
Netherlands ...... ' ... 10.0 10.0 20.0 50 50
Japan ............ 14.1 12.4 26.5 53 47
New Zealand (1969) 4.86 4.62 2.21 13.73 .. 42 39 19
Puerto Rico ... Southern region .... 11.2 25.0 36.2 31 69
Western region 18.3 30.3 48.6 38 62
Thailand ......... 3.24 1.93 5.17 63 37
United Kingdom, Sheffield ........ 3.7 3.2 1.7 8.6 43 37
United States ........ 45.4 8.3 0.9 54.6 83 15 2
New York City .... 34.9 15.1 50.0 70 30
New Orleans .. - - .. 31.5 43.8 75.3 42 58
Johns Hopkins ...... 11.9 11.2 23.1 52 48
Texas -- ........... 7.9 10.1 18.0 44 56
Yugoslavia, Slovenia 5.02 4.11 9.13 54 46
n Includes 2.04 mrad not allocated.
TABLE 21. PERCENTAGE DISTRIBllTION OF ACTIVE BONE MARROW
Head ............................... .
Upper limb girdle .................... .
Sternum ..................... .
Ribs ................................ .
Cervical vertebrre
Thoracic vertcbrre
Lumbar vertebra:
Sacrum . . . . . . . . . . . . ....... .
Lower limb girdle .................... .
Extremities . . . . . .. .
TOTAL
Adult, 40 :!}tOFS
(Ji)
13
8
2
8
4
14
11
14
26
100
160
Adult (5i)
7
7
3
14
3
13
11
9
33
100
Total
100
100
100
100
100
100
100
100
100
100
100
100
100
100
100
100
Child, J.7 years
(57)
7
6
3
13
3
12
10
8
31
7
100

TABLE 22. Per caput MEAN BONE-MARROW DOSE (JAPAN) (58)
(mrad per person per year)
J.fi:an boue•marrow dJse !Juk~mia-sig,,ificant dou
Male Fcmalt Total Perce11taqe Male Female Total Ptr~entagt
Skull ........ . . . . .. . . . . . . 0.49 0.25 0.74 0.4 0.42 0.14 0.64 0.4
Cervical spine ..... - ........ 0.55 0.28 0.83 0.4 0.50 0.26 0.76 0.5
Shoulder R 0.38 0.17 0.55 0.3 0.35 0.16 0.51 0.3
F 0.30 0.19 0.48 0.2 0.39 0.18 0.57 0.3
Thorax . . . . . . ...... R 0.22 0.16 0.38 0.2 0.20 0.15 0.35 0.1 F 0.44 0.24 0.68 0.4 0.43 0.24 0.67 0.4
Chest .... R 1.6 0.90 2.5 1.3 1.4 0.82 2.22 1.3
F 5.4 2.2 7.6 4.0 4.4 2.0 6.4 3.8
PF 10.2 10.0 20.2 10.7 9.4 9.5 18.9 11.2
CEsophagus ... . . . . . . . . . . . . 0.68 0.49 1.7 0.9 0.57 0.4 1.0 0.6
Stomach .. . . . . . . . . . . . . . . . . R 11.4 6.1 17.5 0.3 10.2 5.5 15.7 9.3
F 60.0 40.6 100.6 53.2 53.2 36.5 89.7 53.0
3.6 3.0 6.6 3.5 3.0 2.7 5.7 3.4
Cholecystography .......... R 0.59 0.5 1.1 0.6 0.52 0.42 0.9 0.5
F 3.8 2.2 6.0 3.1 3.5 2.1 5.6 3.3
Abdomen ............. 0.41 0.34 0.75 0.4 0.35 0.30 0.65 0.3
Barium enema R 0.66 0.58 1.24 0.7 0.59 0.53 1.1 0.7
F 4.7 4.4 9.1 4.8 4.05 4.00 8.05 4.7
Dorsal spine . . . . . . . . . 0.50 0.46 0.96 0.5 0.45 0.41 0.86 0.5
Lumbar spine 2.9 1.5 4.4 2.3 2.5 1.4 3.9 ') ~ ......... ~·-'
Lumbo-sacral spine - ........ 0.49 0.32 0.81 0.4 0.43 0.28 0.71 0.4
Pelvis .................... 0.16 0.15 0.31 0.2 0.14 0.13 0.27 0.1
Urography . -- ....... R 0.44 0.33 0.77 0.4 0.39 0.31 0.70 0.4
F 0.34 0.12 0.46 0.2 0.30 0.10 0.40 0.2
Bladder ......... . . . . . . . . . . 0.12 0.057 0.13 0.1 0.10 0.05 0.15 0.1
Pelvimetry ... ' ............ 0.13 0.13 0.1 0.10 0.10 0.1
Hysterosalpingography R 0.042 0.042
F 0.37 0.37 0.1 0.36 0.36 0.2
Obstetrical abdomen . . . .... 0.17 0.17 0.1 0.16 0.16 0.1
Hip ...................... 0.22 0.21 0.43 0.2 0.20 0.19 0.39 0.1
Femur ........ . .. . . . . . . . . 0.013 0.007 0.02 0.01 0.01
Lower leg ................. 0.008 0.005 0.013 0.01 0.01
Other examinations . ' .. 1.40 0.73 2.13 1.1 1.0 0.76 1.7 1.2
TOTAL 112 77 189 100 99 70 169 100
R = radiography. F = fluoroscopy. PF = pbotofluorography.
161
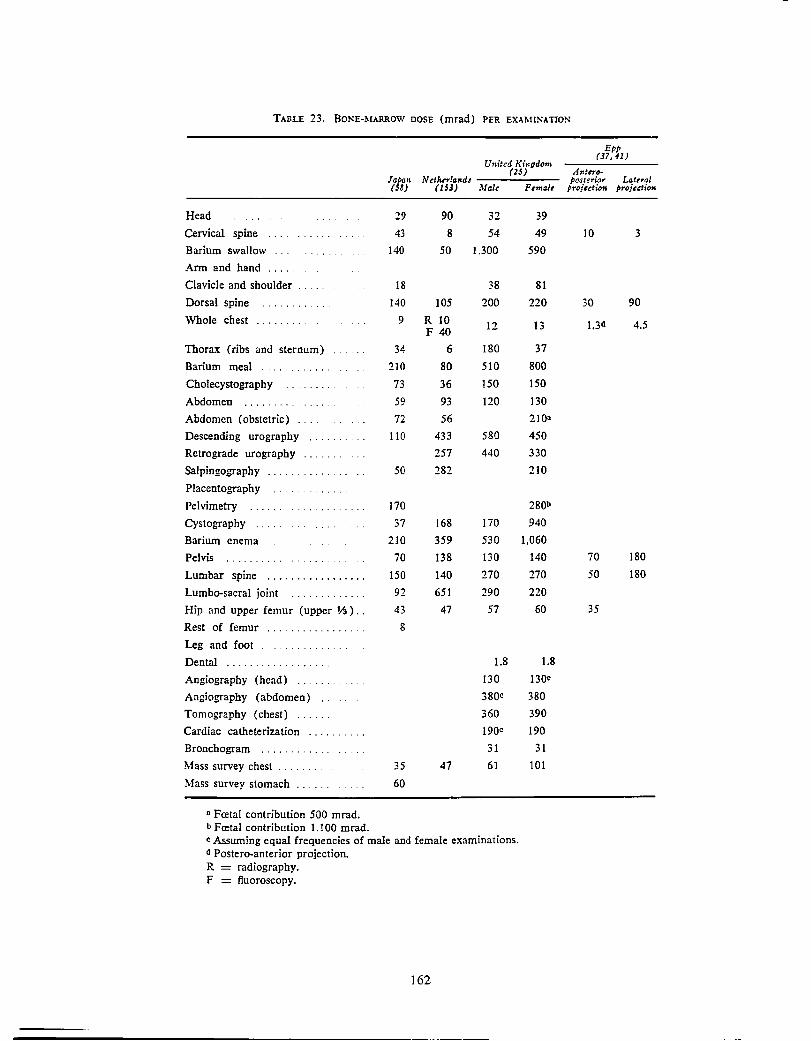
TABLE 23. BONE-MARROW DOSE (mrad) PER EXAMINATION
Head
Cervical spine
Barium swallow
Arm and hand .....
Clavicle and shoulder
Dorsal spine
Whole chest
Thorax (ribs and sternum)
Barium meal ............ .
Cholecystography
Abdomen .............. .
Abdomen (obstetric) ... .
Descending urography ... .
Retrograde urography
Salpingography
Placentography
Pelvimetry
Cystography .....
Barium enema
Pelvis
Lumbar spine
Lumba-sacral joint ......... .
Hip and upper femur {upper ¥.i) ..
Rest of femur ............... .
Leg and foot . . . ....... .
Dental ..... .
Angiography (head) ..
Angiography (abdomen)
Tomography (chest) .. .
Cardiac catheterization ......... .
Bronchogram .......... .
Mass survey chest ..
:Mass survey stomach ..... .
n Fcetal contribution 500 mrad. b Fcetal contribution 1.100 mrad.
Japan (St)
Uuited Kingdom (25)
Nctwlands ------(153) Male Female
29
43 140
18
90
8
50
140 105 9 R 10
F 40
34 6
210 80
73 36 59
72
110
50
170
37 210
70
150 92
43
8
35
60
93
56 433 257 282
168 359
138 140
651 47
47
32
54
1.300
38
200
12
180
510 150
120
580
440
170
530 130
270
290 57
1.8
130
38Qe
360 190C
31 61
39
49
590
81
220
13
37
800
150
130 210•
450 330
210
280b
940 1,060
140
270
220
60
1.8
I3QC
380
390
190
31
101
c Assuming equal frequencies of male and female examinations. d Postero-anterior projection. R = radiography. F = fluoroscopy.
162
Epp (37, 41)
Anll!f'o-posterior Lateral
projection p,ojectio"
10
30
1.3d
70
50
35
3
90
4.5
180
180
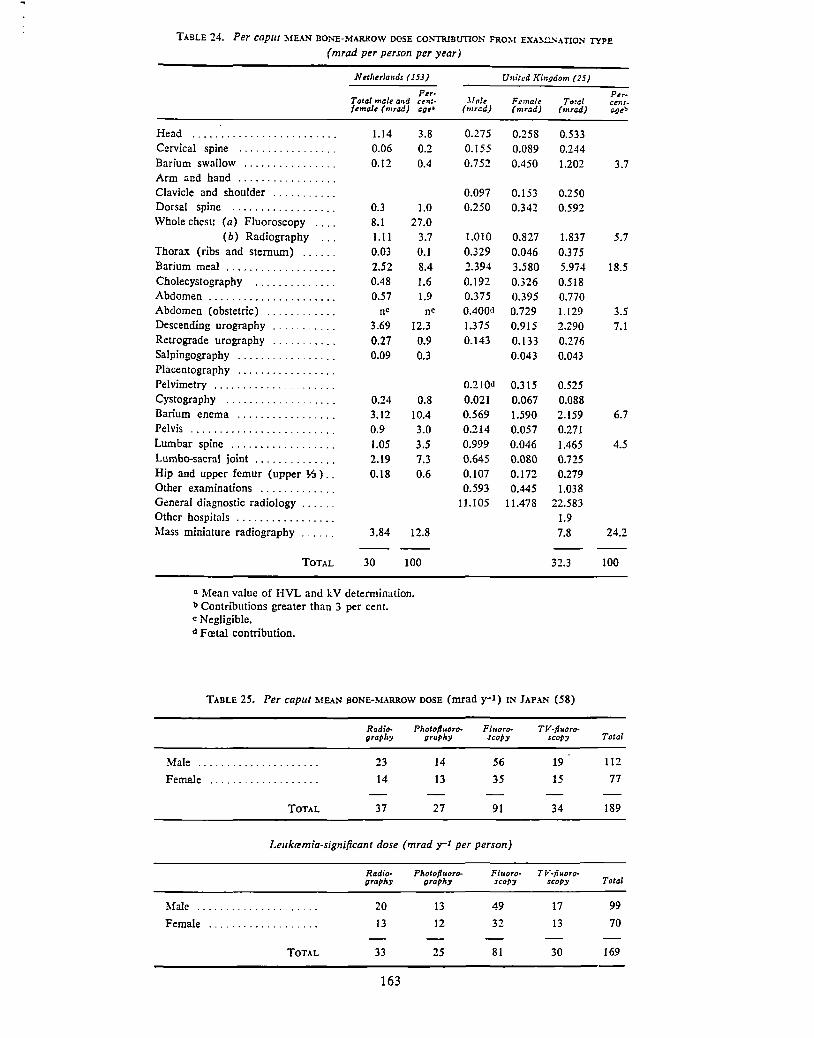
TABLE 24. Per caput MEAN BONE-MARROW DOSE CONTRIBUTION FRO:>,! EXA:l-1L's.\T!O!i TYPE
(mrad per person per year)
Head Cervical spine ................ . Barium swallow ............... . Arm and hand ................ . Clavicle and shoulder .......... . Dorsal spine ................. . Whole chest: (a) Fluoroscopy ... .
( b) Radiography Thora..ic (ribs and sternum) ..... .
Barium meal .................. . Cholecystography ............. . Abdomen ..................... . Abdomen (obstetric) ........... . Descending urography .......... . Retrograde urography .......... . Salpingography ................ . Placentography ................ . Pelvimetry ............. . Cystography ............. . Barium enema ................ . Pelvis ........................ . Lumbar spine ................. . Lumba-sacral joint ............. . Hip and upper femur (upper Y.i) ..
Other examinations ............ . General diagnostic radiology ..... . Other hospitals ................ . Mass miniature radiography
TOTAL
Netl,er/a,ids (153)
Total male and cen:female (mrad) age•
1.14 0.06 0.12
0.3 8.1 1.11 0.03 2.52 0.48 0.57
3.69
0.27 0.09
0.24 3.12 0.9 1.05 2.19 0.18
3.84
30
3.8 0.2 0.4
1.0 27.0
3.7 0.1 8.4 1.6 1.9
12.3 0.9 0.3
0.8 10.4 3.0
3.5 7.3 0.6
12.8
100
a Mean value of HVL and kV determination. b Contributions greater than 3 per cent. c Negligible. d Fretal contribution.
Male {mrad)
0.275 0.155 0.752
0.097 0.250
1.010 0.329 2.394 0.192 0.375 0.400d
1.375 0.143
0.210d
0.021 0.569 0.214 0.999 0.645 0.107 0.593
11.105
U11itcd Kingdom (25)
Female Total (mrad) (mrad)
0.258 0.089 0.450
0.153 0.342
0.827 0.046 3.580 0.326 0.395 0.729 0.915 0.133 0.043
0.315 0.067 1.590 0.057 0.046 0.080 0.172 0.445
11.478
0.533 0.244 1.202
0.250 0.592
1.837 0.375 5.974 0.518 0.770 1.129 2.290 0.276 0.043
0.525 0.088 2.159 0.271
1.465 0.725 0.279 1.038
22.583 1.9 7.8
32.3
TABLE 25. Per caput MEAN BONE-MARROW DOSE (mrad y-1) IN JAPAN (58)
Radio- Photofluoro- Fl11oro• TV·/luoro-grap/1::,, graph::,, scopy scop::,,
Male .... . ............ 23 14 56 19
Female . . . . . . ............. 14 13 35 15
TOTAL 37 27 91 34
Leuk~mia-significant dose (mrad y-1 per person)
Radio- Photofluoro- Fluoro- TV·fluoro• graph::,, graph::,, scopy scopy
Male ..... ' ....... 20 13 49 17
Female .... ' ...... . . . . . . . . 13 12 32 13
TOTAL 33 25 81 30
163
Ptr• centageb
3.7
5.7
18.5
3.5 7.1
6.7
4.5
24.2
100
Total
112
77
189
Total
99
70
169
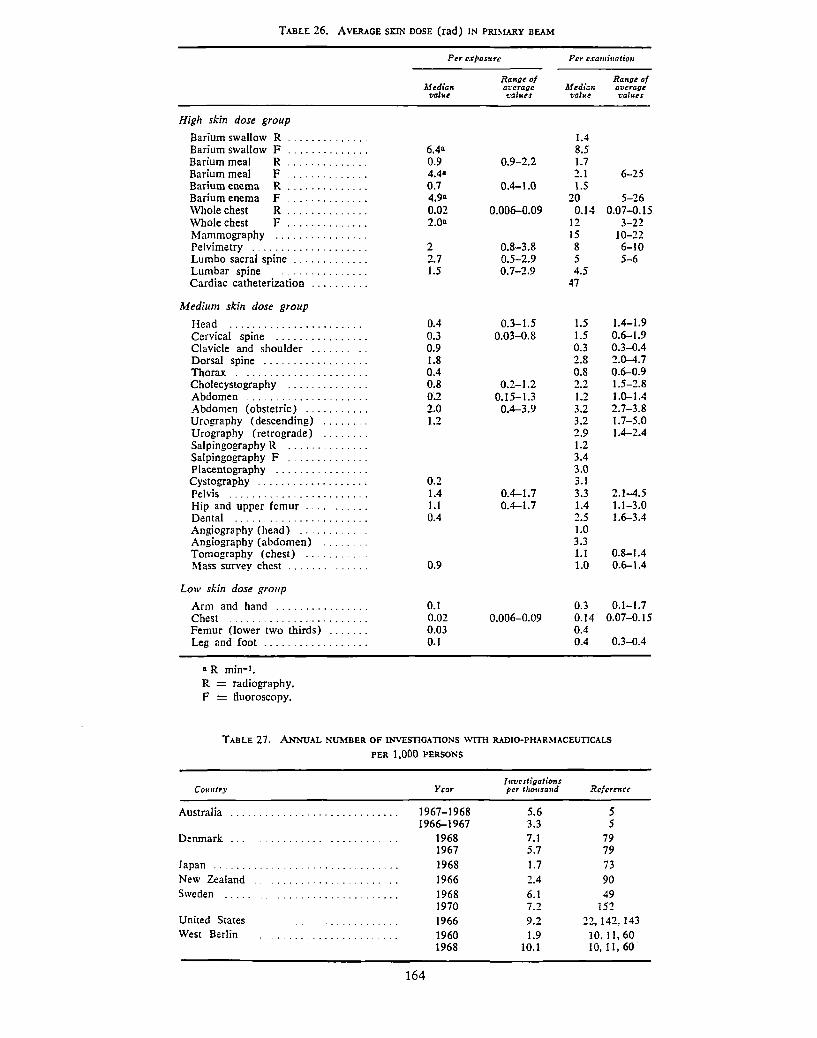
TABL£ 26. AVERAGE SKIN DOSE (rad) IN PRIMARY BEAM
High skin dose group
Barium swallow R .............. Barium swallow F .............. Barium meal R ... - .......... Barium meal F . ' ............ Barium enema R .............. Barium enema F .............. Whole chest R .............. Whole chest F .............. Mammography ................ Pelvimetry . ' .................. Lumbo sacral spine ............. Lumbar spine ..... . . . . Cardiac catheterization ..........
Medium skin dose group
Head ...................... . Cervical spine ............... . Clavicle and shoulder ......... . Dorsal spine ................. . Thorax .................... . Cholecystography ............. . Abdomen ............ . Abdomen (obstetric) .......... . Urography ( descending) ....... . Urography (retrograde) ....... . Salpingography R ............. . Salpingography F ............. . Placentography ............... . Cystography .................. . Pelvis ....................... . Hip and upper femur . . ... . Dental .... , ... , ............. . Angiography (head) ...... . Angiography (abdomen) ..... . Tomography (chest) ...... . Mass survey chest ........... .
Low skin dose group
Arm and hand ............... . Chest ............ , ..... . Femur (lower two thirds) ...... . Leg and foot ................. .
a R min-1. R = radiography. F = fluoroscopy.
Per exposure
Median value
6.4a 0.9 4.4a 0.7 4.9• 0.02 2.0•
2 2.7 1.5
0.4 0.3 0.9 1.8 0.4 0.8 0.2 2.0 1.2
0.2 1.4 I.I 0.4
0.9
0.1 0.02 0.03 0.1
Ra11ge of a:veragc ttalues
0.9-2.2
0.4-1.0
0.006-0.09
0.8-3.8 0.5-2.9 0.7-2.9
0.3-1.5 0.03-0.8
0.2-1.2 0.15-1.3
0.4-3.9
0.4-1.7 0.4-1.7
0.006-0.09
Per examinati'on
Median Range of avcragt
value values
1.4 8.5 1.7 2.1 6-25 1.5
20 5-26 0.14 0.07-0.15
12 3-22 15 10-22 8 6-10 5 5-6 4.5
47
1.5 1.4-1.9 1.5 0.6-1.9 0.3 0.3-0.4 2.8 2.0-4.7 0.8 0.6-0.9 2.2 1.5-2.8 1.2 1.0-1.4 3.2 2.7-3.8 3.2 1.7-5.0 2.9 1.4-2.4 1.2 3.4 3.0 3.1 3.3 2.1-4.5 1.4 1.1-3.0 2.5 1.6-3.4 1.0 3.3 1.1 0.8-1.4 1.0 0.6-1.4
0.3 0.1-1.7 0.14 0.07-0.15 0.4 0.4 0.3-0.4
TABLE 27. ANNV,\l, NUMBER OF 11'.'VESTIGATIOSS WITH RADIO-PHARMACEUTICALS
PER 1,000 PERSONS
Cortirlry
Australia
D:nmark
Japan New Zealand . Sweden .....
United States West Berlin
Year
1967-1968 1966-1967
1968 1967 1968 1966 1968 1970 1966 1960 1968
164
I1111cst,'gations ptr thousand Rcfere11u
5.6 5 3.3 5 7.1 79 5.7 79 1.7 73 2.4 90 6.1 49 7.2 152 9.2 22, 142, 143 1.9 10, 11, 60
10.1 10,11,60
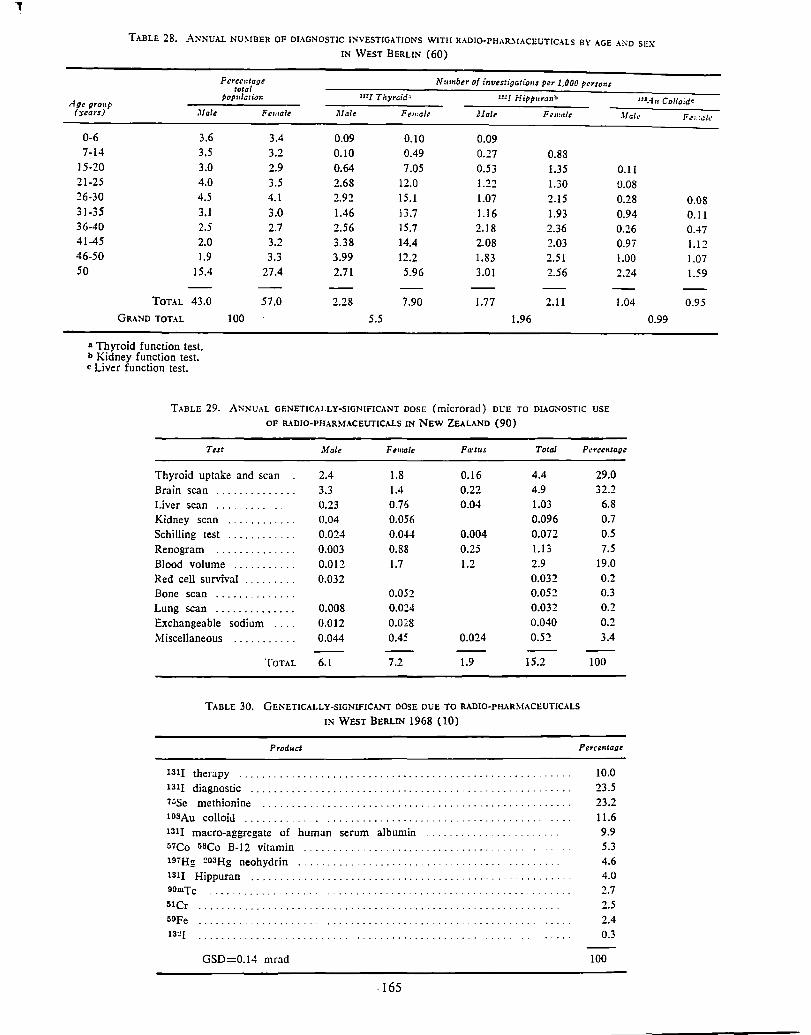
TABLE 28. ANNUAL NU).!BER OF DL\GNOSTIC INVESTIGATIONS WITH RADIO·PIIAR).IACEUTICALS BY AGE A~D SEX L"I WEST BERLIN (60)
Percc11lage Nmnber of fovutigotfo11s per 1,000 persons total
Age group pop11/atfon mJ Thyroid> UJ/ Hippuran• "'.fo Colloid<
(years) Male Female Male Female Male Female
0-6 3.6 3.4 0.09 0.10 0.09 7-14 3.5 3.2 0.10 0.49 0.27 0.88
15-20 3.0 2.9 0.64 7.05 0.53 l.35 21-25 4.0 3.5 2.68 12.0 1.22 l.30 26-30 4.5 4.1 2.92 15.1 1.07 2.15 31-35 3.1 3.0 1.46 13.7 1.16 1.93 36-40 2.5 2.7 2.56 15.7 2.18 2.36 41-45 2.0 3.2 3.38 14.4 2.08 2.03 46-50 1.9 3.3 3.99 12.2 1.83 2.51 50 15.4 27.4 2.71 5.96 3.01 2.56
TOTAL 43.0 57.0 2.28 7.90 1.77 2.11
GRAND TOTAL 100 5.5 1.96
" Thyroid function test. b Kidney function test. c Liver function test.
TABLE 29. ANNUAL GENETICALLY-SIGNIFICANT DOSE (microrad) DUE TO DIAGNOSTIC USE
OF R..\DIO·Pf!ARMACEUTICALS IN NEW ZEAL\ND (90)
Jlal,•
0.11
0.08
0.28
0.94
0.26
0.97
1.00 2.24
1.04
Test Male Female Fll'tus Total Percentaoe
Thyroid uptake and scan
Brain scan ............. .
Liver scan . . . . . ..... .
Kidney scan ........... .
Schilling test ........... . Renogram ............. .
Blood volume ........ .
Red cell survival ........ .
Bone scan ............. .
Lung scan ............. .
Exchangeable sodium .. .
Miscellaneous ....
TOTAL
2.4
3.3
0.23
0.04
0.024
0.003
0.012
0.032
0.008
0.012
0.044
6.1
1.8
1.4
0.76
0.056
0.044
0.88
1.7
0.052 0.024
0.028
0.45
7.2
0.16
0.22
0.04
0.004
0.25
1.2
0.024
1.9
4.4
4.9
1.03
0.096
0.072
1.13
2.9
0.032 0.052
0.032
0.040
0.52
15.2
TABLE 30. GEKETICALLY·SIGNIF!CANT DOSE DUE TO RADIO-PHARMACEUTICALS
IN WEST BERLIN 1968 (10)
29.0 32.2
6.8
0.7
0.5
7.5
19.0
0.2
0.3 0.2
0.2
3.4
100
Product Percentage
131 I therapy .................................................. .
131J diagnostic ................................................. .
7~Se methionine ........................................... · · .. · · - · · ·
lOSAu colloid ................................................. . 131! macro-aggregate of human serum albumin
57Co 5SCo B-12 vitamin ............................... . 197Hg 20:iHg neohydrin ..................... .
131! Hippuran ...................................................... . 90mTc
51Cr
59Fe 1321
GSD=0.14 mrad
-165
10.0
23.5
23.2
11.6 9.9
5.3
4.6 4.0
2.7 2.5
2.4
0.3
100
F,•r;afr
0.08
0.11 0.47
1.12 1.07
1.59
0.95
0.99
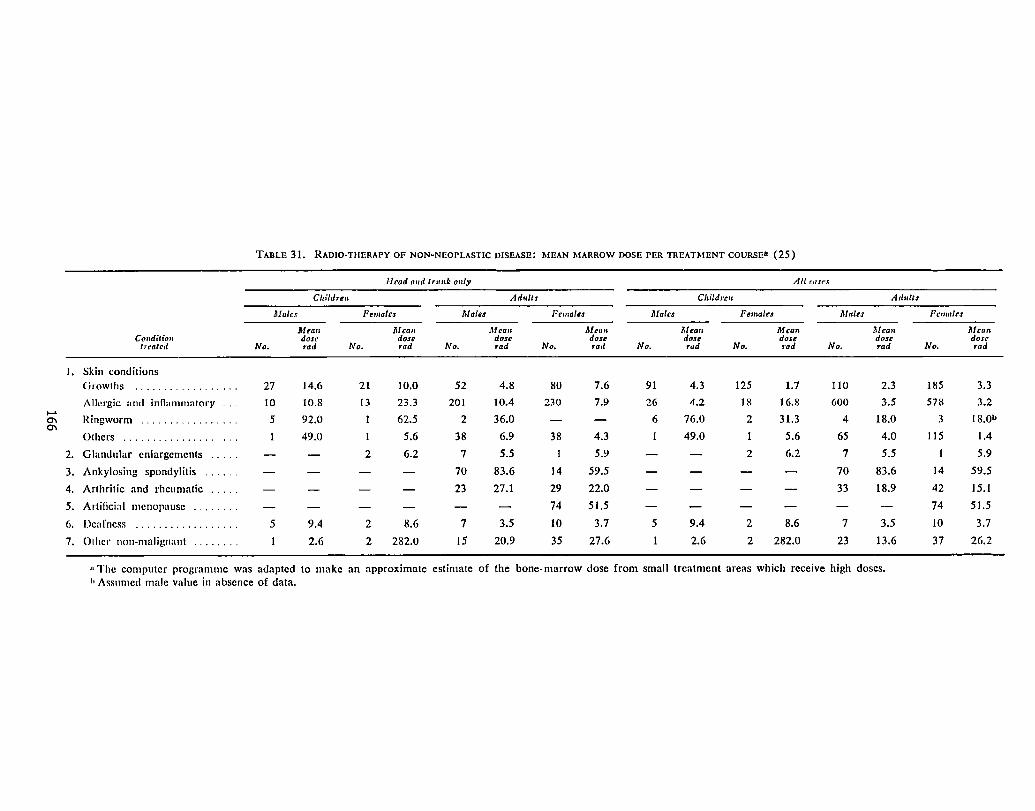
TABLE 31. RADIO·TIIERAPY OF NON•NEOPLASTIC DISEASE: MEAN MARROW DOSE PER TREATMENT COURSED (25)
Head ,111d lr1111/1 only All,·11.,a
Ch,'/J,·eu Atfolts Cl1ildl'e11 Arfolts
Males Females Males Femal,s Mairs Females Males Females
Mrau Mean Mean Mean lllea11 Mean .. ,rcan Mean Condition dose dose dose Jose dos, dose dose dose
frcatcd No. rad No. rad No. rad No. ra<I No. rrJd No. rad No. rad No. rad
I. Skin conditions Growths .................. 27 14.6 21 10.0 52 4.8 80 7.6 91 4.3 125 1.7 110 2.3 185 3.3
Allergic and inflammatory 10 10.8 13 23.3 201 10.4 230 7.9 26 4.2 18 16.8 600 3.5 578 J.2 ......
Ringworm 5 0\ ................. 92.0 I 62.5 2 36.0 6 76.0 2 31.3 4 18.0 3 18.0b 0\
Others ................... 49.0 I 5.6 38 6.9 38 4.3 49.0 5.6 65 4.0 115 1.4
2. Glandular enlargements 2 6.2 7 5.5 I 5.9 2 6.2 7 5.5 5.9
3. Ankylosing spondylitis 70 83.6 14 59.5 70 83.6 14 59.5
4. Arthritic and rheumatic 23 27.1 29 22.0 33 18.9 42 15.1
5. Artificial menopause .... 74 51.5 74 51.5
6. Deafness ......... ' ........ 5 9.4 2 8.6 7 3.5 10 3.7 5 9.4 2 8.6 7 3.5 10 3.7
7. Other non-malignant ' ....... 1 2.6 2 282.0 15 20.9 35 27.6 2.6 2 282.0 23 13.6 37 26.2
11 The computer programme was adapted to make an approximate estimate of the bone-marrow dose from small treatment areas which receive high doses. 11 Assumed male value in absence of data.
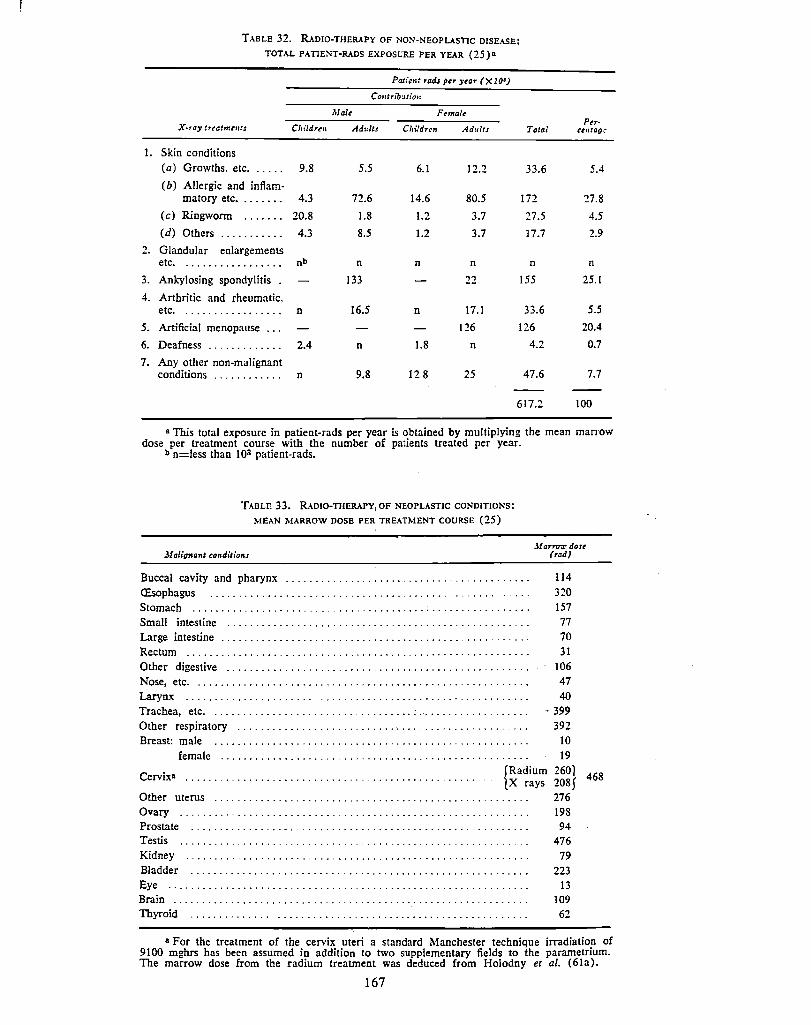
TABLE 32. RADIO-THERAPY OF NON-NEOPLASTIC DISEASE: TOTAL PATIENT·RADS EXPOSt:RE PER YEAR (25)a
Patient rads per year (XlO')
C ,mtrib,tio,:
Malt Ft malt
X•ray Jrtatmrnt1 Cliildre11 Ad1</ts Children Ptr·
Ad11/t, Total ctutag;:
1. Skin conditions
(a) Growths. etc. 9.8 5.5 6.1 12.2 33.6 5.4
(b) Allergic and inflam-matory etc. 4.3 72.6 14.6 80.5 172 27.8
(c) Ringworm 20.8 1.8 1.2 3.7 27.5 4.5
(d) Others ........... 4.3 8.5 1.2 3.7 17.7 2.9
2. Glandular enlargements etc. ................. nb n n n n n
3. Ankylosing spondylitis 133 22 155 25.1
4. Arthritic and rheumatic. etc. ................. n 16.5 n 17.1 33.6 5.5
5. Artificial menopause ... 126 126 20.4
6. Deafness ............. 2.4 D 1.8 n 4.2 0.7
7. Any other non-malignant conditions ............ n 9.8 12 8 25 47.6 7.7
617.2 100
a This total exrosure in patient-rads per year is obtained by multiplying the mean marrow dose per treatment course with the number of patients treated per year.
b n=less than 103 patient-rads.
TABLE 33. RADI0•TIIERAPY 1 OF NEOPLASTIC CONDITIONS:
MEAN MARROW DOSE PER TREATMENT COURSE (25)
3falig11anl conditions
Buccal cavity and pharynx ......................................... .
CEsophagus ...................................................... .
Stomach ......................................................... .
Small intestine ............................. , ..................... .
Large intestine .................................................... .
Rectum ........................................................... .
Other digestive ................................................... .
},[ arrow dost (rad)
114
320 157
77
70
31
106
Nose, etc. . . . . . . . . . . . . . . . . . . . . . . . . . . . . . . . . . . . . . . . . . . . . . . . . . . . . . . . . . 47
Larynx . . . . . . . . . . . . . . . . . . . . . . . . . . . . . . . . . . . . . . . . . . . . . . . . . . . . . . . . . . . 40
Trachea, etc. . ................................. : . . . . . . . . . . . . . . . . . . . - 399
Other respiratory . . . . . . . . . . . . . . . . . . . . . . . . . . . . . . . . . . . . . . . . . . . . . . . . . . 392
Breast: male ............................... , . . . . . . . . . . . . . . . . . . . . . . 10
female . . . . . . . . . . . . . . . . . . . . . . . . . . . . . • . . . . . . . . . . . . . . . . . . . . . . . 19
Cervixa ................................................. . fRadium 260l lX rays 208f
Other uterus . . . . . . . . . . . . . . . . . . . . . . . . . . . . . . . . . . . . . . . . . . . . . . . . . . . . . . 276
Ovary . . . . . . . . . . . . . . . . . . . . . . . . . . . . . . . . . . . . . . . . . . . . . . . . . . . . . . . . . . . . 198 Prostate Testis
Kidney
Bladder
Eye ............................................................. . Brain ...................................... · · · · · · · · · · · · · · · · · · · · · · · Thyroid ........................................................ .
94
476
79
223 13
109
62
468
a For the treatment of the cervix uteri a standard Manchester technique irradiation of 9100 mghrs has been assumed in addition to two supplementary fields to the parametrium. The marrow dose from the radium treatment was deduced from Holodny et al. (61a).
167
REFERENCES
1. Andrews, P. S. Radiation induced basal cell squamous carcinoma. M.D. thesis, London University, 1958.
2. Anno, Y., A. Takeshita and M. Iwamoto. Medical use of radio-isotopes in Ja pan, especially for treating hyperthyroidism and evaluation of the consequent radiation risk. Gann Monograph 9: 241-253 (1970).
3. Annual Report for the year 1968. R.P.S. AR.2. Ministry of Public Health, Bangkok, Thailand, 1968.
4. Annual Report for the year 1969. RP.S. AR.3. Ministry of Public Health, Bangkok, Thailand, 1969.
5. Annual Report of the National X-ray and Radium Laboratory, Melbourne, 1968.
6. Antoku, S. and R. C. Milton. Dose to bone marrow and gonads from chest examinations. Atomic Bomb~ Casualty Commission. Technical Report 4/67 (1967).
7. Antol.'11, S., H. Yoshinaga and W. J. Russell. Bone marrow and gonadal dose in roentgenography excluding posteroanterior chest examinations. Atomic Bomb Casualty Commission, Technical Report 5/68 (1968).
8. Ardran, G. M. and H. E. Crooks. A comparison of radiographic techniques with special reference to dosage. Brit. J. Radial. 26: 352 (1953).
9. Ardran, G. M., J. Hamill, E. Emrys-Roberts et al. Radiation dose to the patient in cardiac radiology. Brit J. Radial. 43: 391-94 (1970).
10. Aurand, K. and G. Hinz. Erhebungen liber die Entwicklung der Anwendung offener Radionuklide in Diagnostik und Therapie. Bundesgesundheitsblatt 13: 30-33 (1970).
11. Aurand, K. and G. Hinz. Paper presented at the 7th Congress of the Intern. Society for Nuclear Medicine, Zurich, 25-27 Sept. 1969.
12. Baro. G. B., J. G. Flegenheimer. Survey of Radioisotope applications in Latin America. Isotop. Radiat. Technol. 7: 465-468 (1970).
13. Beekman, Z. M. Genetically significant dose from diagnostic roentgenology (A study concerning a defined population in the Netherlands). Leiden, Neder. Inst. v. Praevent. Geneesk. 53 (1962).
14. Beentjes, L. B. An estimate of G.S.D. in the Netherlands (1967). Thesis. Utrecllt. 1969.
15. Beretning om Laboratoriets Virksomhed for tiden 1 April 1966-31 Marts 1970. Radiation Hygiene Laboratory, Copenhagen (1970).
16. Berger, M. J. Energy deposition in water by photons from point isotropic sources. Medical Internal Radiation Dose (MIRD) Committee. Pamphlet No. 2. Journal of Nuclear Medicine (1968).
168
17. Berman, M., D. V. Becker and R. S. Benna. The use qf !133 in the treatment of Graves' disease. J. Clin. Endoc. 17: 1222-1228 (1957).
18. Biagini, C., M. Barilla, A. Montanara. Zur genetischen Strahlenbelastung der Bevolkerung Roms durch die R6ntgendiagnostik. Strahlentherapie 113: 100-109 (1960).
19. Brown, M. L. and A. B. Nelson. Medical x-ray visits and examinations during pregnancy, U.S. Department of Health. Education and Welfare. National Center for Health Statistics Series 22 Number 5.
20. Brownell, G. L., W. H. Ellett and A. R. Reddy. Abs.orbed fractions for photon dosimetry. Medical Internal Radiation Dose (MIRD) Committee. Pamphlet No. 3. Journal of Nuclear Medicine ( 1968).
21. Bureau of Radiological Health, Department of Health, Education and Welfare. Information provided by J.·c. Villforth.
22. Chamberlain. R. H. Gonadal radiation in the genetically significant portion of the population derived from radioactive isotope procedures in medicine, p. 885-888 in The nature of radioactive fallout and its effects on man. Hearings. 85th Session, U.S. Congr. Jt Cttee. Atomic -Energy. Spee. Subcttee Rad. (May 1957). vol. 1.
23. Cocco, A. E. and A. I. Mendeloff. Effects of gastric irradiation in duodenal ulcer patients: gastric secretary response to maximal histamine stimulation during a three-year period. Johns Hopkins Med. J. 126. 2, p. 61-68 (1970).
24. Coll, W. S. The judicious use of diagnostic radiation in the healing arts. Amer. J. Public Health 59: 1199-1203 (1969).
25. Committee on Radiological Hazards to Patients. Final report of the Committee. London. H.M. s.o. (1966).
26. Committee on the Radiological Hazards to Patients. Second report of the Committee. London, H.M.S.O. (1960).
27. Cooley. R. N. and L. B. Beentjes. Weighted gonadal diagnostic roentgen ray doses in a teaching hospital with comments on x-ray dosages to the general population of the United States. Am. J. Roentgenol. 92: 404-417 (1964).
28. Cox. D. W. An investigation of possible genetic damage in the offspring of women receiving multiple diagnostic pelvic x rays. Am. J. Human Genet. 16: 214-230 (1964 ).
29. Custer. R. P. Atlas of Blood and Bone Marrow. p. 29. W. B. Saunders Co., New York (1949).
30. Diagnostic dental x-rays and the patient-an overview. Bureau of Radiological Health. Rad. Health Data. Jan. 1970.
31. Dillman. L. T. Radionuclide decay schemes and nuclear parameters for use in radiation-dose estimation. Medical Internal Radiation Dose (MIRD) Committee. Pamphlet No. 4 (1969).
32. Dillman, L. T. Radionuclide decay schemes and nuclear parameters for use in radiation-dose estimation. Part 2. Medical Internal Radiation Dose (MIRD) Committee. Pamphlet No. 6. (1970).
33. Doll, R. and P. G. Smith. The long-term effects of x·irradiation in patients treated for metropathia haemorrhacica. Brit. J. Radial. 41: 362-368 (1968). -
34. Duggan, H. E. and G. L. Olde. Radiation dose to the skin and to the gonads from diagnostic x-ray procedures. Canad. Med. Assoc. J. 89: 1144-7 (1963).
35. Eleven recommendations of radiographic examination in oral diagnosis. N. Y. J. Dent. 38: 101 (1968).
36. Eleventh annual report 1966-1967, p. 59-60. Atomic Energy Commission, Japan.
37. Ellis, R. E. The distribution of active bone marrow in the adult. Phys. Med. Biol. 5: 255-258 (1961).
38. Ellis. R. E. The estimation of ovary dose received during diagnostic x-ray examinations from measurements of the iliac crest dose and skin dose. Adrian Committee Internal Report, 9/5/60/S (1960).
39. Ellis. R. E. The use of a computer to carry out the computation of ovary dose in the Adrian Committee Survey. Adrian Committee Internal Report, 10/5/60/S (1960).
40. Ellis, R. E. and M. Healey. Unpublished. 41. Epp, E. R.. J. M. Heslin. J. S. Laughlin et al.
Measurement of bone marrow and gonadal dose from x-ray examinations of the pelvis, hip and spine as a function of field size. tube kilovoltage and added filtration. Brit. J. Radial. 36: 247-265 (1963).
42. Exposure of man to ionizing radiation arising from medical procedures. Report of the ICRP and ICRU. Phys. Med. Biol. 2: 107-151 (1957).
43. Exposure of man to ionizing radiation arising from medical procedures with special reference to radiation induced diseases. Report of the ICRP and ICRU Phys. Med. Biol. 6: 199-258 (1961).
44. Evaluation of health hazards due to unintentional irradiation of the gonads during routine abdominal x-ray examinations of male and female patients in Puerto Rico. Report No. l. Western Region. Nuclear Center Department of Health, Commonwealth of Puerto Rico (1969).
45. Evaluation of health hazards due to unintentional irradiation of the gonads during routine abdominal x-ray examinations of male and female patients in Puerto Rico. Report No. 2. Southern Region. Nuclear Center Department of Heal~, Puerto Rico (1970).
46. Faber, M. A follow-up of 1,000 thorotrast cases in Denmark, Proc. 1st Intern. Congress of Radiation Protection, 1966, p. 1521-1524, Pergamon Press, 1968.
169
47. FendeL H. Radiation problems in roentgen examinations of the chest. Prag. Pediat. Radial. 1: 18-32 (1967).
48. Flatby. J. Genetically significant dose in x-ray diagnosis in Norway. In press.
49. Garby. L.. B. Nosslin and S. Lofveberg. Data on dose to organs/ JLCi administered and statistical data. Swedish Institute of Radiation Protection. 1969. .
50. Gilbertson, J. D., M. G. Randall and A. G. Fmgerhut. Evaluation of roentgen exposure in mammography. Radiology 95: 383-394 (1970).
51. Gitlin, J. N. and P. S. Lawrence. Population exposure to x-rays, U.S. 1964. A report of the Public Health Service X-ray Exposure Study. United States Department of Health, Education and Welfare. PHS Publication No. 1519 (1966).
52. Gough, J. H., R. Davis and A. J. Stacey. Radiation doses delivered to the skin, bone marrow and gonads of patients during cardiac catheterisation and angiocardiography. Brit. J. Radio!. 41: 508-518 (1968).
53. Hammer Jacobsen, E. Genetically significant radiation doses in diagnostic radiology. Acta Radiologica, Suppl. 222 ( 1963).
54. Hashimoto, M., K. Yamada et al. Distribution of red marrow and its weight. (Estimation of population dose due to diagnostic x rays in Japan.) Annual Reports of Scientific Research Grants 1963 ( 1964).
55. Hashizume, M. Reduction of patient dose. Proc. 17th Japanese Med. Congress V: 801-839 (1967).
56. Hashizume, T. and Y. Kato. Bone marrow dose in photofluorography in Ja pan. Nippon Acta Radiolog. 25: 991-7 (1965).
57. Hashizume, T., Y. Kato, T. Maruyama et al. Genetically significant dose for diagnostic medical x-ray examinations in Japan, 1969: United Nations document A/ AC.82/G/L.1388.
58. Hashizume, T., Y. Kato, T. Maruyama et al. Population mean marrow dose and leukremia significant dose from diagnostic medical x-ray examinations in Japan 1969; United Nations documents A/ AC.82/G/L.1389 and A/ AC.82/G/ L.1389/Corr.1.
59. Hashizume, T., Y. Kato, H. Yamaguchi et al. Population doses from teleradiotherapy in Ja pan 1971: United Nations document A/AC.82/G/ L.1396.
60. Hemphill, F. M., F. B. Locke and R. D. Hesselgren. Diagnostic radiation utilization in selected short-term general hospitals. U.S. Department of Health, Education and Welfare, BRH/DBE 70-8 (1970).
61. Hinz, G. Unpublished. 61a. Holodny, E., H. Lechtman and J. S. Laughlin.
Bone-marrow dose produced by radioactive isotopes. Radio!. 77: 1-11 (1961).
62. Holthusen, H., H. H.-K. Leetz, W. Leppin. Die genetische Belastung der Bevolkerung einer Grosstadt (Hamburg) durch medizinische Strahlenanwendung, Schrifteoreihe des Bundesministers fiir Atomkemenergie und Wasserwirtschaft. Strahlenschutz, Heft 21 (1961).
63.
64.
65.
66.
67.
68.
69.
70.
71. 72.
73.
74.
75.
76.
77.
78.
79.
80.
81.
Hunt, A. B. et al. Cancer cervix in 3rd trimester of pregnancy. Clin. Obstet. Gyn. 6: 964-974 (1963) International Commission on Radiological Protection. Protection of patient in radio-nuclide investigations. ICRP Publication 17. Pergamon Press (1971). International Commission on Radiological Protection. Protection of the patient in x-ray diagnosis. ICRP Publication 16. Pergamon Press (1970). Isola, A. On the extent of X-ray examinations in Finland. Proc. 1 st Intern. Cong. of Radiation Protection. 1966, p. 1321-1324, Pergamon Press. 1968. Isola. A and 0. Ojala. The genetically significant dose from roentgen examination in Finland in 1963. Acta Radiologica, 254: 120-130. Iya. V. K.. R. G. Deshpande. Radioisotope program in India. Isotop. Radiat. Technol. 7: 452-457 (1970). Izenstark. J. L. and W. Lafferty. Medical radiological practice in New Orleans: estimates and characteristics of visits, examinations and genetically significant dose. Radio 1. 90: 229-242 (1968). Jankowski, J. and J. Liniecki. The frequency of radiography of the pelvic region in pregnant women in the city of Lodz and the province of Lodz and the exposure of the fretus to x rays connected with it. Zdrowie Pub. 8: 707-716 (1970). J ayerwardene, R. P. Unpublished. Johns. H. E., R. M. Taylor. Gonadal dose in Canada arising from the clinical use of unsealed radioactive isotopes. J. Can. Assn. Radiologists 9: 55-58 (1958). Kakehi, H. Nuclear medicine in Japan, past, present and future. XII Intern. Cong. Radial., Tokyo, 1969. Kaude. J. V., E. Lorenz and J.M. Reed. Gonad dose to children in voiding urethrocystography performed with 70-mm image-intensifier fluorography. Radio!. 92: 771-774 (1969). Konganz, A. N., L. N. Gorelova and V. Ya. Gotlib. Radiation doses to patients and criterion for maximum permissible dose. Med. Radial. 11.8: 77-84 (1966). Koren, C. and S. Mandal. Genetically significant dose following radio-therapy. Abstract 305. 11th Intern. Cong. Radiology. Excerpta Medica International Congress Series No. 89, p. 166 (1965). Krishnamoorthy, P. N. Radiological protection problems in the developing countries, Health Phys. 21: 163-171 (1971). Kriss, J.P., R. Barran, R. Greenberg et al. Guidelines and criteria for a Committee authorizing the use of radioactive isotopes in humans. J. Nucl. Med. 8: 70-73 (1967). Kristensen. K. Nuclear medicine in Danish hospitals, 1969. Kunz. E. and V. Michal. Exposure of the population of the CSSR to ionizing radiation in x-ray diagnostics; United Nations document A/ AC.82/ G/L.1322. Kunz, E. Unpublished.
170
82.
83.
84.
85.
86.
87.
88.
89.
90.
91.
92.
93.
94.
95.
96.
Larsson, L.-E. Radiation doses to the gonads of patients in Swedish roentgen diagnostics: studies on magnitude and variation of the gonad doses together with dose reducing measures. Acta Radiol.. Suppl. 157: 7-127 (1958). Lewallen, C. G. Some observations on radiation dose to bone marrow during l131 therapy of thyroid cancer. Am. J. Roentgen. 89: 618-623 (1963). Loevinger. R.. M. Berman. Schema for absorbeddose calculations for biologically-distributed radionuclides. Medical Internal Radiation Dose (MIRD) Committee. Pamphlet No. 1. Journal of Nuclear Medicine (1968). Mackenzie, I. Breast cancer fo1lowing multiple fluoroscopies. Brit. J. Cancer 19: 1-8 (1965). Mahmoud, K. A., M. M. Mahfouz. I. R. Atiyah et al. Report on genetically significant dose from diagnostic radiology in Cairo and Alexandria. U.A.R. Scientific Committee on the Effects of Atomic Radiation on Man, Vol. 4-2 (1962). Mahmoud K. A .. M. M. Mahfouz, M. E. Mahmoud et ~I. Gonadal and bone marrow dose in medical diagnostic radiology. U.A.R. Scientific Committee on the Effects of Atomic Radiation on Man. Vol. 3-1 (1961). Marinelli. L. D. Dosimetry in relation to epidemiology: its implications in radiogenic leukemias and bronchial carcinoma ( thorotrast). Annual report July 1966-June 1967. Radiological Physics Div., Argonne Nat. Laboratory, ANL-7360, 37-44 (1967). Matthews, J. C. and H. Miller. Radiation hazards from diagnostic radiology. A repeat survey over a small area. Brit. J. Radial. 42: 814-817 (1969). McEwan. A. C. Unsealed radioisotopes in medical practice in New Zealand. Publication NRL/ PDS/1967. Mechanik N. Untersucbungen Uber das Gewicht des Knochenmarkes des Menschen. Zeitschrift filr die Gesamte Anatomie 79 (Abt.I): 58-90 (1926). Medical radionuclides: radiation dose and effects. ( Cloutier, R. J.. C. L. Edwards a;1d W. S. Snyder, eds.). United States AtoDll~ Energy Commission. Div. Technical Information. AEC Symposium Series 20 (1970). Memorandum on implementation of the second report of the Adrian Committee on radiological hazards to patients. Brit. J. Radial. 37: 559-561 (1964). Milhailovic, M., M. Pavlic, M. V. Milha~ovic et al. Radiation doses to the gonads of patients from diagnostic radiology in Yugoslavia. Proc. XL International Cong. Radiol. Excerpta Med. ICS No. 105: 1547-1561 (1967). Miyakawa, T. Population dose from medical exposures in Ja pan (bone marrow dose and genetically significant dose). Proc. XI Intern. Cong. Radio!. Excerpta Med. ICS No. 105: 1574-1579 (1967). Moroni, J. P. and M. L. Remy. Doses delivrees lors des examens medicaux mettant en cause des radioelements osteotropes. Rapport SCPRI No. 131 (1971).
97. Morgan, R. H. and J. C. Gehret. The radiant energy received by patients in diagnostic x-ray practice. Am. J. Roentgenol. 97: 793-810 (1966).
98. Osborn, S. B. A study of radiation hazards to large populations with special reference to diagnostic radiology. Ph. D. Thesis. University of London. 1960.
99. Osborn, S. B. The implication of the reports of the Committee on radiological hazards to patients ( Adrian Committee). I. Variations in the radiation dose received by the patient in diagnostic radiology. Brit. J. Radiol. 36: 230-234 (1963).
100. Osborn, S. B. and R. E. Ellis. Protection from ionizing radiation. Chapter 29. The science of ionizing radiation (Etter. L. E., C. Thomas, eds.), Illinois, USA, 1965.
101. Palmer. R. C., R. L. Egan and B. J. Barrett. Preliminary evaluation of absorbed dose in mammography. Radiology 95: 395-397 (1970).
102. Pasternack. B. S. and M. B. Heller. Genetically significant dose to the population of New York City from diagnostic medical radiology. Radiology 90: 217-228 (1968).
103. Pavlov, A. S. The principles of regulation and of reducing the levels of irradiation of patients examined with the use of radioactive preparations with diagnostic aims. Paper to WHO group, 1969.
104. Penfil, R. L. and M. L. Brown. Genetically significant dose to the United States population from diagnostic medical roentgenology, 1964. Radiology 90: 209-216 (1968).
105. Placer, A. E. Dosis geneticamente significativa debida al radio-diagn6stico medico. Republica Argentina, Comisi6n Nacional de Energfa At6-mica, Informe No. 49, Buenos Aires, 1961.
106. Population dose from x rays, U.S. 1964. Estimates of gonad dose and genetically significant dose from the Public Health Service X-ray Exposure Study. United States Department of Health. Education and Welfare. PHS Publication No. 2001 (1969).
107. Puylaert, C. B. A. J. De Expansie van de Rontgendiagnostick. Medisch Contract, 1969/24/685. Medicamundi 14, 3, 137-149 (1969).
108. Radiation bio-effects. Summary report Jan-Dec. 1969. United States Department of Health, Education and Welfare. PHS Publication No. BRR/ DBE 70-1 (1970).
109. Radiological hazards to patients. Lancet 2: 1325-1326 (1964).
110. Reboul, J .. G. Delorme, Y. Meilhan et al. Doses gonades resultant de l'utilisation des radiations ionisantes en France. 3. Radiotherapie. Ann. Radial. 3: 293-304 (1960).
111. Reboul, J., G. Delorme, J. Tavernier et al. Doses gonades resultant de l'utilisation des radiations ionisantes en France. II. Radioscopie. Ann. Radio!. 3: 89-99 (1960).
112. Reboul. J.. J. Tavernier. G. Delorme et al. Doses gonades resultant de !'utilisation des radiations ionisantes en France. I. Radiodiagnostic (suite et fin). Ann. Radial. 2: 571-584 (1959).
171
113. Reboul, J., J. Tavernier, Y. Istin et al. Doses gonadcs resultant de !'utilisation des radiations ionisantes en France. I. Radiodiagnostic Ann. Radio!. 2: 179-196 (1959).
114. Recommendations of the International Commission on Radiological Protection. Protection against ionizing radiations from external sources. ICRP. Publication 15, Pergamon Press (1970).
115. Reduction of radiation exposure in nuclear medicine. United States Department of Health. Education and Welfare. PHS Environmental Health Series. Radiological Health. Publication No. 99-RH-30, 1967.
116. Reekie, D., M. Davison and J. K. Davidson. The radiation hazard in radiography of the female abdomen. Brit. J. Radio!. 40: 849-854 (1967).
117. Report of the Working Party on the Organization of Radioactive Isotope Services, London, H.M.S.O., 1970.
118. Report on radiation control and population dose in New Zealand. National Radiation Laboratory, Christchurch, NRL UN/2 (1970).
119. Report on some aspects of radiation protection and population exposure in Thailand. Ministry of Public Health, Thailand, Radiation Protection Service, Department of Medical Sciences, 1970.
120. Report to the Surgeon General. U.S. PHS. Protecting and improving health through the radiological sciences. National Advisory Committee on Radiation. United States Department of Health, Education and Welfare. Public Health Service. Washington D.C., 1966.
121. Research Group on the Genetically Significant Dose by the Medical Use of X-ray in Japan. The genetically significant dose by the x-ray diagnostic examination in Japan (March 1961).
122. Resolution of the 24th World Health Assembly WHA 24.31 sixteenth plenary meeting A24/ VR/16, 18 May 1971.
123. Rogers, R. T. Radiation dose to the skin in diagnostic radiography. Brit J. Radio!. 42: 511-518 (1969).
124. Russell, W. J.. H. Yoshinaga et al. Active bone marrow distribution in the adult. Brit. J. Radio!. 39: 735-739 (1966).
125. Sagerman, R.H., J. R. Cassady, P. Tretter et al. Radiation induced neoplasia following external beam therapy for children with retinoblastoma. Am. J. Roentgenol. 105: 529-535 (1969).
126. Sanders, A. P., K. Sharpe, K. Cahoon et al. Radiation dose to the skin in diagnostic procedures. Arn. J. Roentgenol. 84: 359-368 (1960).
127. Sawada, S., T. Wakabayashi and W. J. Russell, Photofluorography techniques in hospitals and clinics. Atomic Bomb Casualty Commission, Technical Report 3/68 (1968).
128. Schoen, D. On the dependence of radiation exposure on the experience of the examiner and on the characteristics of the patient. Strahlenschutz Forsch. und Prax., 7: 31-48 ( 1967).
129. Scholte. P. J. L., A. van Vianen, J. W. E. Vos et al. Genetically significant dose from radiotherapy in the Netherlands, 1942-1951. Brit. J. Radio!. 36: 622-623 (1963).
130. Seelentag, W. Die gegenwartige Exposition der Bevolkerung <lurch die medizinische Strahlenanwendung und ihre Bedeutung. Strahlentherapie 52: 326-333 (1963).
131. Seelentag, W., D. V. Arnim, E. Klotz et al. Zur Frage der genetischen Belastung der Bevolkerung <lurch die .-<\nwendung ionisierender Strahlen in der Medizin, II. Teil: Messungen Uber die bei rontgendiagnostischen Untersuchungen an die Gonaden gelangenden Dasen. Strahlentherapie 105: 169-195 (1958).
132. Seelentag, W., E. Seelentag-Lupp and E . Klotz. Zur Frage der genetiscben Belastung der Bevolkerung durch die Anwendung ionisierender Strahlen in der Medizin, V. Tell: Werte und Schwan-1...-ungsbreiten von Untersuchungsfrequenzen und gemessenen Dasen in 10 grossen und kleinen Krankenhausern und in der freien rontgenologiscben Praxis. Strahlentherapie 111: 435-467 (1960).
133. Seelentag, W. On the importance of the radiation burden of a population with special reference to the genetically significant dose from application of radiation in medicine. Progress in Nucl. Energy. Series XII; Health Physics, Vol. 2, Part I : 125-155 (1969).
134. Seelentag, W., T. Nurnberger, D. Knorr et al. Zur Frage der genetischen Belastung der Bevolkerung <lurch die Anwendung ionisierender Strahlen in der Medizin, IV. Tei!: Die Strahlenbelastung durch die Rontgendiagnostik in Kinderkliniken. Strahlentherapie 107: 537-555 (1958).
135. Seyss, R. Radiation exposure in radiography of the gastrointestinal tract. Radial. Aust. 17: 135-142 (1967).
136. Sobels, F. H. Estimation of the genetic risk resulting from the treatment of women with 131Iodine. ~Strahlentherapie 138: 172-177 (1969) .
137. Stanford, R. W., K. Twinn and C. B. Allsopp. Some problems encountered in the investigation of gonad doses received by patients undergoing dental x-ray examinations. Brit. J. Radial. 35: 366-371 (1962).
138. Stevens, D. J. and D. W. Kearn. Unpublished. 139. Stewart, A., G. W. Kneale. Radiation dose effects
in relation to obstetric x-rays and childhood cancers. Lancet 1: 1185-1188 (1970).
140. Stewart, A. M., G. W. Kneale. Age distribution of cancers caused by obstetric x-rays and their relevance to cancer latent periods. Lancet 2: 4-8 (1970).
141. Stewart, A. , R. Barber. Epidemiological importance of childhood cancers. British Medical Bulletin 27, 1: 64-70 (1971 ).
142. Survey of the uses of radio-nuclides in medicine. Preliminary report. United States Department of Health, Education and Welfare. PHS publication MORP 68-10, 1968.
172
143. Survey of the uses of radio-nuclides in medicine. United States Department of Health. Education and Welfare. PHS publication BRH/DMRE, 70-1, 1970.
144. The use of vital and health statistics for genetic and radiation studies. Seminar UN and WHO, Geneva 1960. UN publication A/ AC.82/Seminar (1962).
145. Thompson, P. L. and I. R. Mackay. Radiation nephritis after gastric irradiation for peptic ulcer. In press (1969).
146. Twelfth annual report 1967-1968, p. 83-85. Atomic Energy Commission, Ja pan.
147. United Nations. General Assembly. Report of the United Nations Scientific Committee on the Effects of Atomic Radiation. 1958. (A/3838: G.A. Official records, 13th sess. Suppl. No. 17.)
148. United Nations. General Assembly. Report of the United Nations Scientific Committee on the Effects of Atomic Radiation. 1962. (A/5216: G.A. Official records, 17th sess. Suppl. No. 16.)
149. United Nations. General Assembly. Report of the United Nations Scientific Committee on the Effects of Atomic Radiation. 1964. (A/5814: G.A. Official records, 19th sess. Suppl. No. 14.)
150. United Nations. General Assembly. Report of the United Nations Scientific Committee on the Effects of Atomic Radiation. 1966. (A/6314: G.A. Official records, 21st session. Suppl. No. 14.)
151. United Nations. General Assembly. Report of the United Nations Scientific Committee on the Effects of Atomic Radiation. 1969. (A/7613: G.A. Official records, 24th sess. Suppl. No. 13.)
152. Verksamheten 1970. Statens Stralskyddsinstitut Stockholm (1971).
153. Weber, J. Beenmergdosis tengevolge van de rontgendiagnostiek. Thesis. Leiden ( 1964).
154. Weber, J. Unpublished.
155. Williamson, B. D. P. A simple patient dose calculator for radiographic exposures. National Radiation Laboratory, Christchurch, New Zealand, Publication T /26-undated.
156. Williamson, B. D. P. and A. C. McEwan. The genetically significant radiation dose to the population of New Zealand from diagnostic radiology. NRL/PDS/1965.
157. World Health Organization. The medical uses of ionizing radiation and radio-isotopes. Report of a joint IAEA/WHO Expert Committee ( Geneva, 26 October-1 November 1971). Technical Report Series No. 492 (1972).
158. Zuppinger, A., W. Minder, R. Sarasin et al. Die Strahlenbelastung der schweizerischen Bevolkerung durch rontgendiagnostische Massnahmen. Radial. Clinica 30: 1-27 (1961).
back to
first page
Annex C
DOSES FROM OCCUPATIONAL EXPOSURE
CONTENTS
INTRODUCTION
l. SoURCES OF P.<FORMATION ............... .
II. LIMITATIOl'.S OF THE DATA ................ .
III. RESULTS ............................... .
Poragraplis
1-2
3
4-12
13-63
A. The numbers of radiation workers . . . . . . . 14-19 B. The distribution of recorded doses in cer-
tain dose ranges ...................... . C. The mean annual dose by type of work ..
Introduction
20-32 33-59
1. In its 1962 report (72) the Committee discussed the contribution made by occupational exposure to the population dose. At that time it was concluded that the genetically-significant dose (GSD) from this source was unlikely to exceed a value of 0.5 millirem per year. The 1962 report also presented information on the numbers of workers in various countries, and on the doses being received by workers in various categories of work involving exposure to radiation.
2. The purpose of the present annex is to present new information with which the 1962 report can be updated.
I. Sources of information
3. Surprisingly little information on occupational exposure has been published in the scientific literature, although a considerable body of data is reported in sources of limited availability, such as annual reports of various organizations. Some of the information in this report has been submitted to the Committee as unpublished data. Much of the submitted data has needed to be reprocessed by the Committee in order for it to be put into the form required for the report. It is to be hoped that the presentation of such a considerable amount of unpublished data will encourage the publication of similar information through the~ normal scien-tific channels. ~
II. Limitations of the data
4. Most of the data that the Committee has used in this report were originally obtained for other purposes. and, in particular, in personnel monitoring programmes tha! e!ther were designed to check that the exposures of radiation wo~kers do not exceed some specified level, or were reqmred by law. For reasons described below, the data were not always suitable for deriving estimates of dose in the form required by the Committee.
5. Accurate assessment of dose at the lower exposure levels is severely limited by the fact that in personnel monitoring it is usual to ignore doses below either a
173
D. The population dose resultin2 from occu-pational exposure .......... ~
IV. SO!>lE SPECIAL PRODLE:l.iS ....... .
V. ACCIDENTS .......................... .
VI. SUMMARY ........................... .
T.-ulLES .................................•
REFERENCES
Parograp/,s
60-63
64-67 68-70 71-77
Page
180
185
minimum detectable level, or below an "investigation level"1 selected for monitoring purposes. Because the exposures of most radiation workers are in this low rang_e, there are few precise data on the actual doses rece1v~d by them. The difficulties of selecting a repre~entatrve dose value for this lower range are described m paragraph 34.
6. Another factor tending to limit the use of monitoring data for the Committee's assessment of dose is th_at the proportion of workers who have been supplied wrth personal monitoring devices varies considerably from place to place. In some establishments the staff includin~ those. not likely to ~e exposed to radiatioO: are provided with such a device, while in others only those workers whose exposures might exceed three tenths of the annual dose limit are so monitored (see also paragraphs 16 and 17).
7. A m~jo~ problem in using the results of personnel momtormg programmes to make dose estimates ~s concerned with the meaning of the term "dose" 1tsel~. ~ith e~temal radiation, irradiated personal momtonng devices undergo some change which is ~su~~ comp~red with the amount of change occurring m similar devices exposed under calibration conditions. In most instances the calibration devices indicate the ~xposure (in its strict physical sense) in the device itself, and seldom can it be said that the so-called "dose" in the test device is a true absorbed dose Similarly. with the monitoring device worn by ~ worker, the ~hange produced by irradiation, after being ~ompared with a standard, is usually reported as a "dose", although it is not strictly an "absorbed dose".
8. Of more .significance, however, is the fact that the "dose" est1D1ated for the monitoring device is usually assumed to represent the "dose" in tissue in the person wearing the device. At the low dose levels encountered by most radiation workers it is not usual to assess the actual absorbed dose in tissue by taking account of factors such as depth, direction, and energy of the radiation; instead, for radiation protection pur-
1 For a description of this concept see reference 24.
poses, the rough assumption is made that the "dose" in the monitoring: device is the same as the dose in the underlying tissues. While this is a satisfactory procedure for radiation protection, difficulties arise when the reported results are used to estimate the actual dose in tissue, and particularly the whole-body dose.
9. It is therefore not surprising that practice varies as to whether the results of personnel monitoring programmes are reported as exposures (R), absorbed doses (rad) or dose equivalents (rem). The dose equivalent is frequently used since it is in terms of this quantity that the International Commission on Radiological Protection (ICRP) expresses the maximum permissible doses for occupational exposure. thus taking account of differences in the biological effectiveness of different radiations. The dose equivalent (H) is the absorbed dose (D) expressed in rads multiplied by a quality factor ( Q) determined from the linear energy transfer (LET i:o) of the radiation (22), However. in many instances it is not possible to know which quantity was originally determined, and the Committee has therefore decided, for the purposes of this report. to use the term "recorded dose", for want of a better term. In keeping with its previous practice, the Committee has adopted the procedure of using the rad as the unit for this quantity. However, in instances where the recorded dose may contain a significant component of high-LET radiation (such as neutron exposures), it becomes necessary to draw special attention to this fact.
10. With external monitoring there is seldom much information available about the actual doses received by the various tissues. Individual workers rarely wear more than one dosemeter, the exposure of which may or may not give a true indication of the doses received by the various parts of the body ( 1). However, when only a single doserneter is used, it is frequently worn at the position of highest exposure, in which case the dose in more distant parts of the body will generally be lower than in the dosemeter. Exceptions to this may occur with localized high exposures of parts of the body, an extreme example of this being with narrow beams from x-ray crystallographic machines.
11. For various reasons, therefore, it is probable that the direct use of data about individual doses from personnel monitoring programmes will tend to overestimate population doses for the various tissues of interest, but, at the low levels currently involved, this is not considered to be a serious problem.
12. .~ith .personal monitoring for internal exposure the :positron 1s even more complex. In work places the ambient levels of radio-activity are usually maintained at low values, and therefore significant internal exposures of radiation workers seldom occur. Intakes of radio-activity occur, however. on occasion from minor mishaps or incidents, and monitoring procedures may thus often be discontinuous. Whilst they are entirely c:de.quate to ensure compliance with prescribed intake hm1ts, t!iey may involve considerable uncertainty for dose ~st1mates. at the very low levels occurring. Available mformat10n suggests that when hiQ:her levels occu~ _they _are limited to very few workers": Exposure to tntmm 1s, however, an exception. and appreciable w~ole-bo~y d.oses frequently occur in workplaces where thrs nuclide 1s used. Another exception is the exposure . of the. 1.ungs of workers engaged in underground uraruum m1Illl1g.
174
III. Results
~3. The main function of this annex is to present est1?1ates of the population dose resulting from occupauonal exposure to radiation. With a few exceptions information about population doses was not submitted to the Committee, so that estimates of the population dose had to be made from other available data. In addition, it was felt that it would be useful to present data on the numbers of radiation workers per thousand population for comparison with the 1962 report, on the distribution of dose in certain ranges and on the annual mean dose for various occupational categories.
A. THE NUMBERS OF RADIATION WORKERS
14. With the increasing use of radiation sources and radio-active substances it becomes increasingly difficult to define what is meant by ''radiation workers". There is no clear border-line between the group of workers who are directly engaged in manipulatina radiation sources and those workers who are les~ actively engaged in such work but who are nevertheless exposed to ionizing radiation in the course of their work. Often a ·•radiation worker" is merely a worker who might receive radiation doses of such magnitude that dose monitoring is justified (see paragraphs 15-17). Hence, the actual number of radiation workers in different countries may sometimes differ merely as the result of different administrative practices.
15. In the 1962 report the term "occupational exposure" was considered to apply to all activities involving exposure of individuals in the course of their work, regardless of whether or not they were directly engaged in radiation work. At that time it was customary, for radiation protection purposes, to make a distinction between individuals who were regularly, and those who were occasionally, exposed in the course of their work. In addition there was a large group of individuals, such as typists, cleaners, etc., who worked in radiation establishments, but who were not considered to be occupationally exposed to radiation. However. in 1966 the ICRP introduced (23) the concept of a single category of occupational exposure, namely, the radiation exposure received by any worker in the course of his work.
16. In its 1966 recommendations the ICRP also noted that for administrative purposes it was convenient to consider two conditions under which workers are exposed, namely, conditions such that the resulting doses might exceed three tenths of the annual dose limit, and conditions in which they are most unlikely to exceed this value. The ICRP recommended that personal monitoring and health supervision should be applied in the former case, but indicated that they were not generally required in the latter.
17. The anticipated result of this recommendation was that a considerable number of workers. employed under conditions such that their exposures were most unlikely to exceed three tenths of the dose limits, would no longer be subject to personal monitoring, and consequently would not be included in the records of monitoring programmes. In this case, unless steps had been taken to include information on this latter category. any use of data derived from personal monitoring programmes would underestimate the actual number of radiation workers. However, the impact
of the 1966 recommendation of ICRP has not been fully realized in practice and. in the words of one report (15), ·'it is difficult to advocate any radical pruning of the numbers of workers subjected to film or other forms of monitoring". Thus. it is not possible to say to what extent the reported numbers of monitored persons may underestimate the actual number of radiation workers.
18. Table l presents data on the numbers of radiation workers per thousand population in various countries. It will be seen that the total is approximately the san1e in most countries, a representative figure being between 1 and 2 per thousand. with a somewhat higher figure for the United States. The high value for Norway (2.7 per thousand) may be accounted for by the particularly large number of dentists and dental assistants in that country. It is not clear whether the figures for other countries include dental assistants or not. In general. the number of workers in the medical field has not changed since the time of the 1962 report, being still about 0.3-0.5 per thousand.
19. However. in industry there are indications (Australia, the German Democratic Republic, Sweden) that there has been a considerable increase over the previously reported value of about 0.06 per thousand. There has also been an increase in the reported number of workers in education and research.
B. THE DISTRIBUTION OF RECORDED DOSES IN CERTAIN DOSE RANGES
20. A number of countries supplied data on the distribution of recorded individual doses in certain dose ranges for various types of work. With the exception of exposures resulting from irradiation by tritium. 131I and some bone-seeking nuclides, which will be dealt with later, all information about the doses relates to external exposures. It needs to be emphasized that the numbers of persons in the lowest dose ranges will depend on the numbers of workers supplied with personal dosemeters.
21. The recorded dose ranges varied somewhat. and for the purposes of this report the following ranges, in rads per year, have been selected: 0-0.5; 0.5-1.5; 1.5-5; >5.
22. Tables 2-10. showing the percentages of monitored workers in different dose ranges must be read with some caution since the numbers are dependent on the somewhat arbitrary selection of the group of "radiation workers" being monitored. For example, an increase in the monitoring programme would be expected to raise the percentage number in the lowest dose range and decrease the percentage number in the highest dose range.
23. Table 2 shows the percentages of monitored workers in the various ranges in five countries. It will be seen that most workers are reported as receiving less than 0.5 rad per year. and that very few receive recorded doses of more than five rads per year. 2 Data from Sweden ( 64) show that a large proportion of workers receive no detectable exposure in a year.
2 It should be pointed out that under the ICRP recommendations, a worker may exceptionally receive a whole-body dose up to 12 rems in a single year provided that his average exposure does not exceed 5 rems per year (23).
175
24. Tables 3 and 4 show the trend of exposure with time in Poland and New Zealand. In both countries it is seen that a considerable decrease in recorded dose has occurred. This is particularly evident in New Zealand? for which da~a covering a period of 16 years are avadable on morutoring films exposed to gamma rays and x rays above 150 kV. Table 4 shows the percentage of monitoring films exposed in selected ranges, and demonstrates the marked change that occurred between 1954 and 1958, which has been maintained since then.
25. A similar trend is shown in table 5, which illustrates the experience in the gyn:ecological department of a large Swedish medical centre in which radium is used extensively. Over the period 1961-1968 there was a marked shift of exposures towards the lower dose ranges, as a result of intensive efforts to reduce the irradiation of the staff.
26. Exposures of medical workers using radium tend to be higher than for those exposed to other radio-nuclides and x rays. as exemplified by data from the German Democratic Republic for 1966 ( table 6).
27. Information was received from the United States about the results of film-badge monitoring of a sample of workers using radio-active materials ( table 7). The recorded dose ranges differ slightly from those used previously but they confirm that, in general, the great majority of exposures lies in the lower dose ranges. Two significant exceptions may be noted: the first concerns the large percentages of waste-disposal workers with exposures in the high dose ranges, and the second shows the same trend, although to a much lesser extent, among industrial radiographers.
28. Information from India (table 8) also shows that most exposures are in the lowest range. However, in contrast with the data for the United States (table 7) workers in industry, and especially in reactor work, show a higher proportion of exposures in the range 0.5-5 rads.
29. Data about the exposure of atomic energy workers are shown in table 9. Most of the data refer to atomic energy research establishments, but the data from Canada's NPD reactor and from the United Kingdom are for workers in nuclear power stations. The figures from the United Kingdom are for seven nuclear power stations of the Central Electricity Generating Board.
30. An extensive review ( 14) of occupational exposure in the United Kingdom during the three-year period 1963-1965 confirms the observations made in other countries about the smallness of the doses received by most workers. 91-100 per cent of workers being reported as receiving less than 1.5 rads per year. Workers in medical radio-therapy. luminizing and industrial radiography received the highest doses, although less than I per cent of these received more than an average of five rads per year. However, a more recent analysis (2) has been made in the United Kingdom of the exposures of industrial radiographers working in factory conditions. and in the field ( e.g.. construction sites. gas pipelines). This showed that 5 per cent of factory radiographers and 11.5 per cent of site radiographers received doses greater than an average of five rads per year. For the period 1965-1970 the average annual recorded dose for factory radiographers was 0.9 rad. whereas for site radiography it was 2. 7 rads.
The analysis concludes that the st.and~d of ~adiologi~l protection for workers engaged m site radiography 1s significantly lower than for workers employed in. factory conditions. Nevertheless, the good results obtamed by some firms in both groups suggest that, if the necessary precautions are taken, the process of industrial radiography can be carried on without workers receiying doses greater than those permitted by the national regulations.
31. Observations over a period of six years (1962-1967) made in the Federal Republic of Germany (8) showed that the percentage of workers with exposures over five rads was nearly constant from year to year, and mostly below 1 per cent, although the total number of workers doubled in the same period of time.
32. In Japan, in contrast with other countries, exposures of medical workers in 1968 were rather greater in the higher dose ranges, but very few recorded doses exceeded five rads (table 10).
C. THE MEAN ANNUAL DOSE BY TYPE OF WORK
33. Table 11 shows the mean annual recorded dose in rads for monitored workers in various types of work involving external exposure. In some cases the values shown are those reported by the country in question. In the remaining cases no value was given and it had to be estimated. For this purpose it was necessary to select a representative dose from the information supplied about the numbers of workers in various dose ranges.
34. The selection of an appropriate value for the mean annual dose for the range 0-0.5 rad has to take account of the well-known skewed distribution within this range. The value of the mean dose will depend critically on how many more-or-less unexposed workers were actually monitored. A Swedish analysis ( 64) shows that, for persons wearing monitoring films that were all reported as being exposed below the practical threshold value, the mean annual recorded dose was about 20 millirads. The mean annual recorded dose when films were reported as falling in the range 0.05-0.5 rad was about 150 millirads. For the purposes of this report, therefore, the value of 0.1 rad was selected as the mean dose for the reported range 0-0.5 rad. The use of this value probably results in an over-estimate of the dose contribution from this range; for example, the use of this value, if applied to the data in table 2, results in contributions from the recorded dose range 0-0.5 rad of about 50 per cent to the total calculated man-rads in each category of work, the actual proportion varying from 12 to 83 per cent. Because the calculated mean doses are generally low in relation to the dose limits, this is not considered to be a serious drawback.
35. For the ranges 0.5-1.5 and 1.5-5 rads, representative values were selected at one rad and three rads. respectively. The Swedish data referred to in the previous paragraph gave values for these ranges of 0.8 rad and 2.5 rads. respectively. For recorded doses greater than five rads. representative values were chosen at the arithmetic mean when ranges were given. or were arbitrarily allotted the value of seven rads when the only information was that there were exposures greater than five rads.
36. A fairly consistent pattern emerges from table 11. indicating that the mean recorded dose in medical work and in industry usually lies between about 0.2
176
and 0.6 rad per year, and that in other work the dose is lower. Data from Australia, New Zealand and the United Kingdom show higher mean doses in medical radio-therapy than in medical radio-diagnosis, this apparently being mainly caused by exposure to sealed radio-active sources. This is confirmed by data from the German Democratic Republic (7) from which it can be calculated that medical workers exposed to radium and radio-active cobalt sources received an annual mean dose of 0.79 rad, while those working with x ray machines ( diagnostic and therapy) received 0.13 rad.
37. Data concerning certain hospitals in Paris for the year 1971 (51) show that in spite of the introduction of up-to-date equipment, exposures in radiological departments were still far from negligible, over 1 per cent of workers receiving more than 2 rads per year. In certain specialized radiological work up to 10 per cent of the workers received more than 2 rads per year; this particularly applied to angiography and to radiological procedures conducted during surgery and brachytherapy. The increasing use of medical radiology, and in particular, its use during surgery and in specialized procedures such as angiography, emphasizes the importance of adequate protection for all those involved in this work.
38. Swedish data (65) show that medical workers exposed to x rays ( unspecified as to whether diagnostic or therapeutic) received a mean recorded dose of 0.11 rad per year and that those using radio-nuclides received 0.34 rad. A point of interest is the relative contribution to the doses received by radio-isotope workers from sealed and unsealed sources. More than 90 per cent of the mean recorded doses received by this group was from exposure to brachytherapy sources ( 64). Reference has already been made (paragraph 25) to the exposures in a large Swedish medical centre using radium ( 3 8). From data summarized in table 5 it was calculated that the annual mean recorded dose to workers in this centre was steadily reduced from a value of about two rads in 1961 to less than one rad in 1968.
39. The mean annual dose to the trunks of veterinary workers, as reported in the United Kingdom for 1964 (14) was 0.24 rad. This can be compared with an assessment of the dose in 1969 (50): in this study a special evaluation of low doses was made. and the mean annual doses were estimated to be 0.04 rad in women and 0.07 rad in men.
40. The data from New Zealand, which are presented in table 4, have been used to estimate the mean exposure from gamma rays and x rays above 150 kV. In 1954 the mean exposure of monitoring films was 2.4 roentgens, and by 1958 it had been reduced to 0.4 roentgen. Since 1958 the mean exposure has remained steady, at just below 0.4 roentgen.
41. The information presented in table 7, showing the distribution of recorded dose in the United States, can be used to calculate mean recorded doses in the various types of work. These show general agreement with the results shown in table 11, but in the case of waste-disposal workers the annual mean recorded dose was 1.84 rads. Industrial radiographers bad a mean recorded dose of 0.50 rad (54).
42. Amongst other industrial workers, luminizers in the United Kingdom were reported to have received an average recorded dose of 0.59 rad in 1964; these luminizers worked at that time mainly with radium-
activated luminous compound "in rather primitive working conditions'' ( 14). Luminizing is now tending to be done with tritium- rather than radium-activated compounds. with a consequent reduction in external exposure. The occupational exposures from tritium luminizing are from internal radiation and are discussed in paragraphs 51 and 52.
43. Information about the doses received by atomic energy workers, whether in research establishments or in nuclear power stations, are not generally available in the scientific literature. The data included in this report were made specially available to the Committee, and in some cases the original data had to be changed into a form suitable for the Committee's purposes. The annual mean recorded doses of workers in research atomic energy establishments varied considerably, ranging from 0.06 rad in Israel to 0.69 rad in the United Kingdom. The latter figure is for workers employed by the United Kingdom Atomic Energy Authority. Among this group, those working on nuclear-fuel reprocessing were reported as receiving a mean annual dose of 1.5 rads ( 41). A value of 0.11 rad per year in 1968 was reported from the Oak Ridge National Laboratory in the United States (47).
44. Data were provided on doses received by workers in seven nuclear power stations operated by the Central Electricity Generating Board in the United Kingdom (49). In 1969 these ranged from mean recorded doses of 0.84 rad in the oldest station to 0.17 rad in the newest. In the same year, the mean recorded dose in three nuclear power stations in the United States ranged from 0.6 to 1.3 rads (54).
45. Information about a number of nuclear power stations makes it possible to calculate the ratio of total staff dose to output of electricity, expressed as manrads per megawatt-year of electricity. This quantity, whilst not of importance for the individual workers, is of relevance to the total dose incurred by the population. The results are shown in table 12. These results only apply to the doses received by workers within nuclear power stations; however, in the case of the British nuclear power programme an estimate can also be made of the total occupational dose contributed at present by the reprocessing of the nuclear fuel (including waste management) used in the power reactors. The available data indicate that, for the two years 1968-1969, the occupational exposure~ contributed by fuel reprocessing ( 41) and by work in the nuclear power stations ( 49) were:
Fuel reprocessing ... . Power stations ...... . Total ............. .
1.6 man-rads per megawatt-year 0.7 man-rad per megawatt-year 2.3 man-rads per megawatt-year
46. Only limited information is so far available on the dose related to electrical output, but the data indicate that, at the present time, for a fairly-wellestablished nuclear power programme, electricity can be produced at a rate of two or three man-rads per megawatt-year, of which the dose contributed by fuel reprocessing appears to form the major part. Improved technology. and the trend towards the construction of power reactors with greater electrical output, in which the staff exposures are not likely to raise proportionately, are expected to result in lower values of manrads per megawatt-year. as indicated in table 12. Technical developments in reprocessing plants which are likely to be greatly expanded in the next decades are expected to result in a reduction of the total occupa-
tion~l dose per megawatt-year. In the United Kingdom, for mstance, nuclear power generation is expected to reach about 90 GW y ( 46) by the year 2000 and the contribution of occupational exposure to the total population dose is still likely to be relatively small compared with the natural radiation background (population doses from environmental contamination bv nuclear power stations are discussed in annex A of this report).
4 7. During the first sh: months of 1971 the exposure of the crew of the N.S. Otto Hahn was at the rate of 0.5 man-rad per megawatt-year (thermal) (71): this cannot be compared directly with the estimates of dose per megawatt-year for nuclear power stations for which .the power output ii expressed as megawatt-year ( electncal).
48. The data that have so far been referred to come mainly from the more developed countries, in which, as has been seen, average annual doses are now usually much less than one rad. A report from Pakistan ( 43) on 600 persons monitored by means of film badges, rePresenting 20-30 per cent of all radiation workers in that country, showed average weekly exposures of about 34 milliroentgens, corresponding to approximately 1.5 rads per year. Five per cent of the films were reported as showing exposures greater than 100 milliroentgens per week, or five rads per year. The Pakistani report states that in organizations having a "local radiationsafety facility" the average weekly dose was 10 milliroentgens and that 2 per cent of the films exceeded 100 milliroentgens per week; the report does not state what proportion of workers in these organizations were supplied with film badges.
49. All the preceding results relate to external exposures. Data are available from Canada (56) on the whole-body doses from tritium uptake by workers at the Chalk River Nuclear Laboratories. where tritium monitoring is performed only when it is suspected that a tritium intake has occurred. Among individuals monitored in this way the average recorded whole-body dose in 1968 was 0.24 rad. The dose from the uptake of tritium may be compared with the dose from external gamma radiation, which averaged 0.70 rad among those workers receiving detectable exposures.
50. At the Canadian heavy-water reactors, occupational exposure to tritium accounts for 12-26 per cent of the dose (table 12).
51. Estimates of the dose received by workers using tritium in industry have also been reported in the United Kingdom (33). These workers were employed in the luminous-paint industry, and in filling gas in capsules used as self-luminous warning signs etc. The doses received by the workers were derived from the measured concentration of tritiated water in their urine. Table 13 shows the distribution of doses reported in the original paper. and a calculated value of the mean doses for the years 1963-1969.
52. Data on annual mean doses are also available for luminizers usin!? tritium in France and the Federal Republic of Germ-any. A group of French workers, numbering from 15 to 35, was reported to have received mean doses of 0.17-0.86 rad in the four years 1968-1971 ( 51 ) . The results of a survey of luminizers in the Federal Republic of Germany are shown in table 14. It will be seen that over the period 1962-1969 there was a steady improvement. due to an energetic programme of radiation protection. Tritiumenergized luminous paint was introduced to reduce
177
population exposures from radium in wrist watches. Its increasing use in consumer products, and the problems of monitoring the internal exposures of workers, emphasize the need for stringent control of its use in industry, especially after the recent publication of two fatalities among tritium workers in Germany ( 61).
53. Contamination by tritium from watches at wholesale importers, retailers and refiners has been reported. A dose of 0.5 rad in a year was estimated to have been received by an individual working in a firm of wholesale importers which handled 200 Ci per year and which had poor ventilation. Contamination was negligible in retail establishments. Watch repair-men and refiners had negligible internal contamination ( 6) .
54. Several investigations of medical and paramedical personnel working with radio-nuclides have been reviewed ( 62). Individuals working with iodine radionuclides received higher doses than those working with other radio-nuclides (99mTc. 133Xe. 137Cs. 74As, 2~Na. 6BGe); 70 per cent of individuals working with mI showed contamination of their thyroid glands. with an average activity of 5 nanocuries, and a maximum level of 20 nanocuries. The degree of contamination appeared to be related to the quantity of material handled. and not to the professional category of the worker. Only 15 per cent of persons working with 131I showed the presence of the nuclide in their thyroid glands. the maximum amount being four nanocuries. These lower levels with 131I were attributed to the availability of pre-packaged forms of this nuclide for diagnostic purposes, improved procedures for radio-nuclide handling and administration, and increased emphasis on radiological protection.
55. Data were submitted from Argentina (3) on the dose to the thyroid gland among workers at the Comisi6n Nacional de Energfa At6mica involved in the production of 181I and of compounds labelled with this nuclide. In 1969 57 per cent of the workers accumulated less than 0.6 rad, 25 per cent received 0.6-3 rads, 3 per cent received 3-6 rads, and 15 per cent received a dose in the 6-30 rads range. None had a total dose greater than 30 rads, the maximum permissible dose for the thyroid gland.
56. At the same establishment 93.5 per cent of workers exposed to bone-seeking radio-active materials ( enriched uranium and 3~P) had an annual intake, by inhalation, of less than 2 per cent of the maximum permissible, and 6.5 per cent had intakes between 2 and 10 per cent of the annual maximum permissible (3).
57. A special case of internal exposure involving also some workers who are not usually recognized as radiation workers. is the exposure to radon and its radio-active daughter products in underground mines. lnhalation of radon and its daughter products in various types of underground mines has been reported, particularly in the mining of uranium (20, 68). thorium ( 45). fluorspar (13). tin (15) and h:ematite ( 15). In some uranium mines considerable practical difficulties have been experienced in keeping the concentrations of radon below currently recommended limits: for example, in Argentina in 1970. 24 per cent of about 150 uranium miners were exposed to an integrated concentration of "equilibrium equivalent radon';'' greater than 60 nCi h 1 ·1 (3) which corresponds to the maximHm permissible concentration in air recommended by ICRP, inhaled for 2,000 hours. In Swedish metal mines in
178
1969-1970 40 per cent of 4.700 workers were exposed to average concentrations greater than 30 pCi 1 ·1 ( 66).
58. In some mines where men were exposed to high concentrations of radon and its daughter products an increased incidence of lung cancer has been reported ( 40). An increased incidence of lung cancer has also been reported in fluorspar (13) and h:ematite (15) mines. Because of the difficulty in assessing luna dose from inhalation of radon, no attempt has ~been° made here to assess a population dose from occupational exposure in mines. Estimates of the risk of developing lung cancer as a result of exposure to radon and its daughter products are discussed in annex H of this report.
59. The risk of cancer in underground miners has presented one of the major problem~ in radiation protection. However, during recent years there has been a marked improvement in workina conditions in mines with a subsequent lowering of the exposure to rado~ and its daughter products.
D. THE POPULATION DOSE RESULTING FROM OCCUPATIONAL EXPOSURE
60. The Committee's 1962 report contained estimates of the genetically-significant doses ( GSD) resulting from occupational exposure, and it was c_on_cluded that 0.5 millirem represented an upper l1m1t to those doses; this conclusion was based on data from three countries.
61. !he policy adopted by the Committee for calculating average population doses is described in detail in annex A, paragraphs 5 to 13.
62. To make a precise estimate of the GSD. however .. requires knowledge of the actual gonad doses, the s12e of the groups receiving such doses, and the child expectancy of such groups. Only Ja pan and New Zealand have used these factors, and both conclude that the total value of the GSD was 0.07 millirad in the particular year studied. For New Zealand an estimate was also made of the corresponding per caput dose to the whole population. which was approximately twice the value of the GSD. The contributions to the GSD are shown in table 15.
6_3. For countries where the required data are not available, the table also shows over-all population doses. In one case (Australia) allowance was made for the dose actually received by the gonads and for the _ages of the exposed individuals. The remaining population doses were simply determined as a per caput dose to the entire population of the particular country. Since the latter doses were obtained from personal monitoring, and did not allow for depth dose or child expectancy, they are likely to be over-estimates. Nevertheless, the available data strongly indicate that the population dose is unlikely to exceed 0.5 millirad per year, and that in many cases the actual value may be less than 0.1 millirad per year.
IV. Some special problems
64. In addition to the occupational exposures that have been considered in this chapter there are a number of categories of radiation work that may present special problems for radiation protection. These include radiation exposure of television maintenance men: a survey concludes that ··occupational x-radiation exposure of television repair-men and assemblers is
virtually non-existent" ( 59). This conclusion is supported by a study of the exposure of television repair shops in Baltimore, United States, in which it was found that negligible doses were received ( 7 4). A survey of 30 aircraft-instrument repair shops in the United States revealed many cases of significant radium contamination resulting from repair and stripping operations on radium luminous dials ( 60).
65. Additional categories of radiation work about which it would be valuable to have information or associated radiation doses include exposure of radar operators to x rays emitted from klystrons and magnctrons; exposures in educational institutions, especially in schools for x-ray technologists; exposures of transportation workers; exposures of aircraft maintenance workers; and exposures of radio-pharmaceutical manufacturers.
66. Consideration is given in annex A of this report to the exposure of the crews of supersonic aircraft. The total galactic cosmic-ray dose equivalent rate at supersonic altitudes is estimated to be about 1 mrem h·1, which is approximately double the rate at subsonic altitudes. The annual dose to be received by crews of supersonic aircraft might be about 1 rem per year. depending on the length of time spent at supersonic altitudes. This may be compared with the exposure of crews in current subsonic jet aircraft, who are estimated ( 42) to receive about 0.5 rem per year. In addition, crews of supersonic aircraft may be exposed to solar flare radiation, but it is expected that appropriate measures will ensure that the dose contribution from this source will be small.
67. Astronauts in space can be exposed to a fairly constant background of 30-50 millirads per day from primary galactic radiation and its secondaries ( 34). In addition, they can also be exposed to periodic solar flares and magnetically-trapped radiations. in which the dose rates have been estimated to vary from a fraction of a rad per hour up to 20 rads per hour, and the duration from minutes to days ( 34). The total dose for space missions up to six months' duration has been estimated to range up to 2,000 rads, depending upon the phase of the solar cycle (34).
V. Accidents
68. Occasionally, radiation injuries occur in persons occupationally exposed to ionizing radiation. These can usually be attributed to severe overexposures resulting from failures of safety procedures or from carelessness. A number of injuries have been reported in x-ray analytical work (37), and in industrial radiography ( 4, 5).
69. In addition to the few accidents that have resulted in radiation injury, there has been a number of incidents, some of which have involved exposures in excess of currently accepted limits, but which have not resulted in injury (11). A survey of lost-time accidents in operations of the United States Atomic Energy Commission and its associates over the period 1943-1970 (73) showed that during that period over 4 109 man-hours were worked. Lost-time injuries attributable to all causes amounted to 17,934. of which 9,147 occurred in AEC operations. Only 3 8 of the 9.147 lost-time injuries were caused by nuclear radiation; these included three fatalities shortly after exposures received as a result of criticality accidents in the early days of atomic energy ( three additional
179
deaths caused by the explosion of the SL-1 reactor not being included). A report (76) has reviewed 400 incidents involving radium. most of which involved loss of radium sources from medical establishments with approximately one third of the sources not bein; recovered. No injuries were reported in this review: The total contribution to the population dose from all these accidents is likely to have been very small.
70. Two reports from Thailand emphasize the hazards of the hand-held fluoroscope. A prolonged exposure (about 30 minutes) with a poorly protected hand-held fluoroscope resulted in injury to a hand of an examining physician and to the foot of bis patient ( 57). The absorbed dose in the skin of the patient's foot was estimated to be greater than 6,000 rads. Another instance of severe injury occurred in the band of a physician using a mobile x-ray machine and a hand-held fluoroscope (58). The dose to the physician's hand was estimated to be between 3,000 and 6,000 rads. No injury was reported as developing in the patient, in whom the dose was calculated to be 10-15 per cent of that received by the physician. An investigation bas revealed the existence of 30 additional hand-held fluoroscopes in the same country.
VI. Summary
71. Data assembled since the Committee's 1962 report indicate that the total number of radiation workers has remained at about 1-2 per thousand of total population.
72. The majority of radiation workers receive very low exposures, and very few exceed the recommended maximum permissible doses recommended by the International Commission on Radiological Protection. The mean annual recorded dose for most types of radiation worker lies in the range of 0.2-0.6 rad per year. In particular types of work, notably industrial radiography and medical work involving the use of radium, higher exposures have been reported. Mean annual recorded doses as high as 2.7 rads per year have been reported for industrial radiographers working on site radiography.
73. The integrated dose among occupationallyexposed persons involved in the production of electricity by nuclear power is at present about 2-3 man-rads per megawatt~year, most of the dose apparently being received during the reprocessing of nuclear fuel. Improved technology is expected to result in lower values of man-rads per megawatt-year.
74. The genetically-significant dose from occupational exposure has been estimated in two countries to be 0.07 millirad in a year, with a corresponding per caput dose of about twice this value. Other estimates of the per caput dose range as high as 0.8 millirad in a year. This may be compared with the 1962 estimate of 0.5 millirem as being the likely upper limit of the genetically-significant dose from occupational exposure.
75. Over-exposures and injuries are now extremely rare in most kinds of radiation work. There are. however, several types of radiation work in which accidental high exposures and injuries are still not uncommon. Chief among these are industrial radiography and x-ray crystallography, in which careless operating procedures are nearly always the cause of reported injuries. The use of the hand-held fluoro-
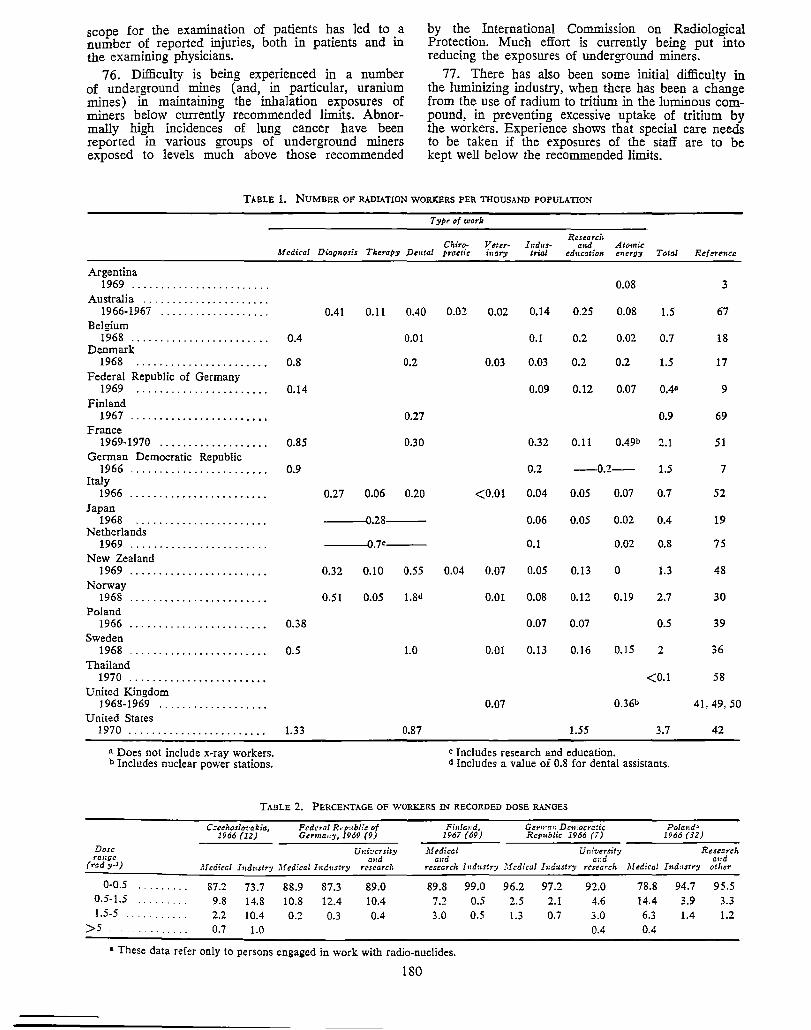
scope for the examination of patients has led to a number of reported injuries, both in patients and in the examining physicians.
76. Difficulty is being experienced in a number of underground mines (and, in particular, uranium mines) in maintaining the inhalation exposures of miners below currently recommended limits. Abnormally high incidences of lung cancer have been reported in various groups of underground miners exposed to levels much above those recommended
by the International Commission on Radiological Protection. Much effort is currently being put into reducing the exposures of underground miners.
77. There has also been some initial difficulty in the luminizing industry, when there has been a change from the use of radium to tritium in the luminous compound, in preventing excessive uptake of tritium by the workers. Experience shows that special care needs to be taken if the exposures of the staff are to be kept well below the recommended limits.
TABLE 1. NUMBER OF RADL.o.TION WORXERS PER THOUSAND POPULATION
Typ, of work
Reuucl, Chiro- Vet er- l11d11s- and Atomic
Medical Diag11osis Therapy Dental practic inary trial educatfo,i e11crgy Total Refere11ce
Argentina 1969 ........................ 0.08 3
Australia ..... - ·-· ............. 1966-1967 .. ·- ............... 0.41 0.11 0.40 0.02 0.02 0.14 0.25 0.08 1.5 67
Belgium 1968 ........................ 0.4 0.01 0.1 0.2 0.02 0.7 18
Denmark 1968 ....................... 0.8 0.2 0.03 0.03 0.2 0.2 1.5 17
Federal Republic of Germany 1969 ....................... 0.14 0.09 0.12 0.07 0.4a 9
Finland 1967 ........................ 0.27 0.9 69
France 1969-1970 ................... 0.85 0.30 0.32 0.11 0.49b 2.1 51
German Democratic Republic 1966 ........................ 0.9 0.2 --0.2-- 1.5 7
Italy 1966 ........................ 0.27 0.06 0.20 <0.01 0.04 0.05 0.07 0.7 52
Japan 1968 ....................... 0.28--- 0.06 0.05 0.02 0.4 19
Netherlands 1969 ........................ 0.7c 0.1 0.02 0.8 75
New Zealand 1969 ........................ 0.32 0.10 0.55 0.04 0.07 0.05 0.13 0 1.3 48
Norway 1968 ........................ 0.51 0.05 1.8d 0.01 0.08 0.12 0.19 2.7 30
Poland 1966 ........................ 0.38 0.07 0.07 0.5 39
Sweden 1968 ........................ 0.5 1.0 0.01 0.13 0.16 0.15 2 36
Thailand 1970 ........................ <0.1 58
United Kingdom 1968-1969 ·- - ................ 0.07 0.36b 41, 49. 50
United States 1970 ........................ 1.33 0.87 1.55 3.7 42
a Does not include x-ray workers. c Includes research and education. b Includes nuclear power stations. d Includes a value of 0.8 for dental assistants.
TABLE 2. PERCE~'TAGE OF WORKERS IN RECORDED DOSE R.iu',GES
Dose ra,:ge
(rad y·')
0-0.5 ......... 0.5-1.5 1.5-5 .. . . . ' .....
>5
C::cchosltn.·akia, 1966 (12)
Federal R,-p«blic of Germany, 1969 (9)
Unfr•crsity aHd
Medical I11d11str;• Jfrd:cal I 11dus:r:,, research
87.2 73.7 88.9 87.3 89.0 9.8 14.8 10.8 12.4 10.4 2.2 10.4 0.2 0.3 0.4 0.7 1.0
Fit:la,id, 1967 (69)
Medical a,id
Gcrn:rz;: De11:ocratic Republic 1966 (7)
uu:versitJ.' a,:d
rcsearcli lndustr:,• .:.'.!cdical lm:iustrj,1 research
89.8 99.0 96.2 97.2 92.0 7.2 0.5 2.5 2.1 4.6 3.0 0.5 1.3 0.7 3.0
0.4
• These data refer only to persons engaged in work with radio-nuclides.
180
Po/end' 1966 (32)
Resc!lrch and
Medical Ind:1str:,• otl,cr
78.8 94.7 95.5 14.4 3.9 3.3 6.3 1.4 1.2 0.4
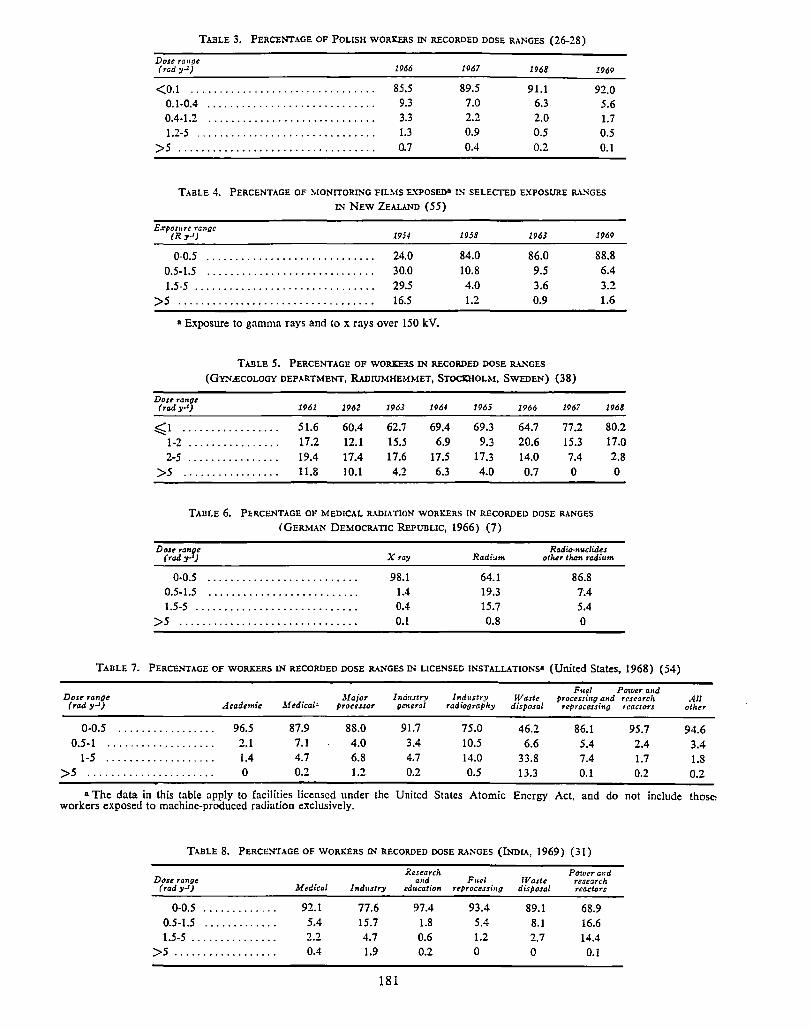
TABLE 3. PERCENTAGE OF POLISH WORKERS IN RECORDED DOSE RANGES (26-28)
Dose ra11gc (rady.l) 1966 1967 1968 1969
<O.l . . .. . . . . . . ..................... 85.5 89.5 91.1 92.0 0.1-0.4 ............................. 9.3 7.0 6.3 5.6 0.4-1.2 ............................. 3.3 2.2 2.0 1.7 1.2-5 ............................... 1.3 0.9 0.5 0.5
>5 ......................... . . . . . . . . 0.7 0.4 0.2 0.1
T . .\BLE 4. PERCENTAGE OF MONITORING FILMS E.XPOSEl)A IN SELECTED EXPOSURE RANGES
IN NEW ZEALAND (55)
E.xpos11rt range (R :,·')
0-0.5 0.5-1.5 1.5-5 .............................. .
>5 ................................. .
1954
24.0 30.0 29.5 16.5
a Exposure to gamma rays and to x rays over 150 kV.
1958
84.0 10.8 4.0 1.2
1963
86.0 9.5 3.6 0.9
TA!lLE. 5. PERCENTAGE. OF WORKERS IN RECORDED DOSE RANGES
(GYN£COLOGY DEPARTMENT, R.ADIUMHEMME.T, STOCJOIOLM, SWEDEN}
Dost range (rad y.l) 1961 1962 1963 1961 1965 1966
~1 ................. 51.6 60.4 62.7 69.4 69.3 64.7 1-2 ................ 17.2 12.1 15.5 6.9 9.3 20.6 2-5 ................ 19.4 17.4 17.6 17.5 17.3 14.0
>5 ................. 11.8 10.1 4.2 6.3 4.0 0.7
(38)
1967
77.2 15.3 7.4 0
TADLE 6. PI:RCENTAGE OF MEDICAL RADIATION WORKERS IN RECORDED DOSE RANGES
(GERMAN DEMOCRATIC REPUBLIC, 1966) (7)
1969
88.8 6.4 3.2 1.6
1968
80.2 17.0 2.8 0
Dou range (rad :,.1) Xray Radium
Radi<>-nuclides otlur than radium
0-0.5 0.5-1.5 1.5-5 ........................... .
>5 .............................. .
98.l 1.4 0.4 0.1
64.1 19.3 15.7 0.8
86.8 7.4 5.4 0
TADLE 7. PERCENTAGE OF WORKERS IN RECORDED DOSE RANGES IN LICENSED INSTALL..\TIONSB (United States, 1968) (54)
Fuel Power a11d Dose range
J.fedical' Major Industry Industry Waste processing and research
(rad:;·') Academic J,roc,sso-r oc•eral radiograp/iy disposal reprocessing reactors
0-0.5 ................. 96.5 87.9 88.0 91.7 75.0 46.2 86.1 95.7 0.5-1 ................... 2.1 7.1 4.0 3.4 10.5 6.6 5.4 2.4
1-5 ................... 1.4 4.7 6.8 4.7 14.0 33.8 7.4 1.7 >5 ...................... 0 0.2 1.2 0.2 0.5 13.3 0.1 0.2
a The data in this table apply to facilities licensed under the United States Atomic Energy workers exposed to machine-produced radiation exclusively.
Act, and do not include
TABLE 8. PERCENTAGE OF WORKERS IN RECORDED DOSE RANGES (INDIA, 1969) (31)
Research Ptr.JJer a,:d Dost range a11d F11el Waste re.search
(rad :y.l) },[ edical Indu,try education reprocessi:ig dispo,al reactors
0-0.5 ............. 92.1 77.6 97.4 93.4 89.1 68.9 0.5-1.5 ............. 5.4 15.7 1.8 5.4 8.1 16.6 1.5-5 ............... 2.2 4.7 0.6 1.2 2.7 14.4
>5 .................. 0.4 1.9 0.2 0 0 0.1
181
All other
94.6 3.4 1.8 0.2
those
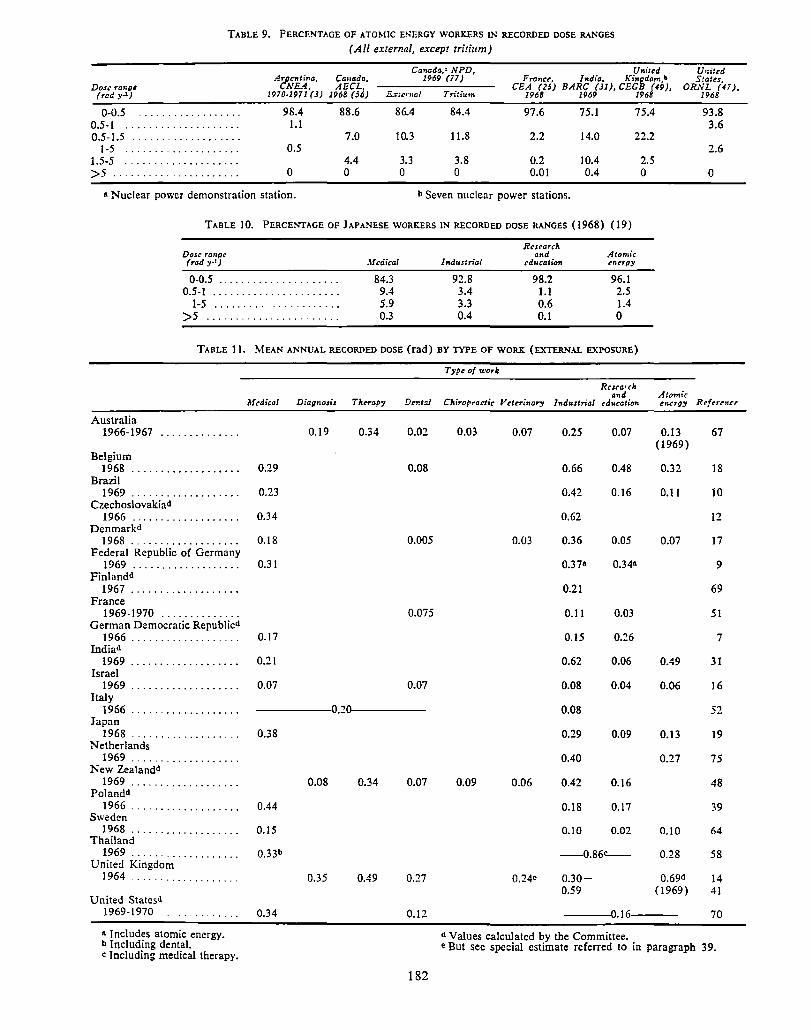
T.~BLE 9. PERCF.NTAGE OF ATOMIC ENERGY WORKERS IN RECORDED DOSE RANGES
( All external, except tritium)
Ct1na.da.~ Canada,' NPD,
1969 (77) France, United U,:ited
States, A?Jt"fltitta, India, Kin~dom,• Dose rangt NEA. AECL, CEA (25) BARC (31), CEG (49), ORNL (47),
1970,1971 (3) 1968 (56) External Triti:tm 1969 1968 (rad yJ.) 1968
0-0.5 ' ................. 98.4 88.6 86.4 84.4 97.6 75.1 75.4 0.5-1 .................... 1.1 0.5-1.5 ................... 7.0 10.3 11.8 2.2 14.0 22.2
1-5 .................... 0.5 1.5-5 .................... 4.4 3.3 3.8 0.2 10.4 2.5 >5 . . ............... 0 0 0 0 0.01 0.4 0
a Nuclear power demonstration station. b Seven nuclear power stations.
TABLE 10. PERCENTAGE OF JAPANESE WORKERS L"l RECORDED DOSE RANGES (1968) (19)
Dost ranpc (rad y•1)
0-0.5 .................... . 0.5-1 ..................... .
1-5 ..................... . >5 ..................... .
Medical
84.3 9.4 5.9 0.3
Industrial
92.8 3.4 3.3 0.4
Rcsrarch and
education
98.2 1.1 0.6 0.1
Atomic energy
96.1 2.5 1.4 0
TABLE 11. MEAN ANNUAL RECORDED DOSE (rad) BY TYPE OF WORK (EA'TER.'-lAL EXPOSURE)
Type of work
Resrarch a11d Atomic
1968
93.8 3.6
2.6
0
Medical Diag,,osis Therapy Dentol Chiropractic Veterinary Industrial education e,k•rp:, Rcfrrcnu
Australia 1966-1967
Belgium 1968 . . . . . . . . . . . . . . . . . . . 0.29
Brazil 1969 . . . . . . . . . . . . . . . . . . . 0.23
Czechoslovakiad 1966 . . . . . . . . . . . . . . . . . . . 0.34
Denmarkd 1968 . . .. .. .. .. .. . .. .. .. 0.18
Federal Republic of Germany 1969 . . . . . . . . . . . . . . . . . . . 0.31
Finlandd 1967 .................. .
France 1969-1970 ............. .
German D::mocratic Republicd 1966 .................. .
Indiad 1969 .................. .
Israel 1969
Italy 1966
Japan 1968 .................. .
Netherlands 1969 .................. .
New Zealandd 1969 .................. .
Polandd 1966 .................. .
Sweden 1968 .................. .
Thailand 1969 .................. .
United Kingdom 1964 .................. .
United Statesd 1969-1970 ............. .
a Includes atomic energy. b Including dental. e Including medical therapy.
0.17
0.21
0.07
0.38
0.44
0.15
0.33b
0.34
0.19 0.34
.,
0.08 0.34
0.35 0.49
0.02
0.08
0.005
0.075
0.07
0.07
0.27
0.12
182
0.03 0.07
0.03
0.09 0.06
0.24•
0.25
0.66
0.42
0.62
0.36
0.J7B
0.21
0.11
0.15
0.62
0.08
0.08
0.29
0.40
0.07
0.48
0.16
0.05
0.34A
0.03
0.26
0.06
0.04
0.09
0.42 0.16
0.18 0.17
0.10 0.02
--0.86C-
0.30-0.59
0.13 (1969)
0.32
0.11
0.07
0.49
0.06
0.13
0.27
0.10
0.28
0.69d (1969)
---'0.16---
67
18
10
12
17
9
69
51
7
31
16
52
19
75
48
39
64
58
14 41
70
d Values calculated by the Committee. e But see special estimate referred to in paragraph 39.
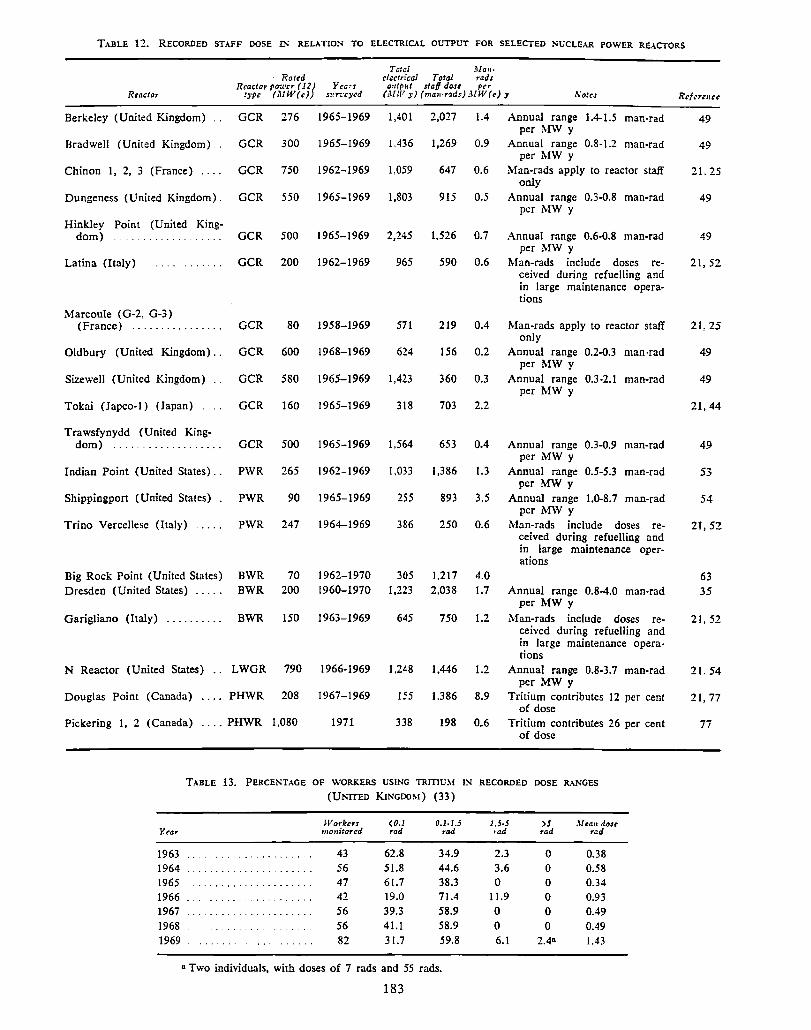
TABLE 12. RECORDED STAFF DOSE IN RELATIO'S TO ELECTRICAL OUTPUT FOR SELECTED NUCLEAR POWER REACTORS
Reactor
Berkeley (United Kingdom)
Bradwell (United Kingdom).
Chinon 1, 2, 3 (France) ....
Dungeness (United Kingdom).
Hinkley Point (United King-dom) ......... .
Latina (Italy)
Marcoule (G-2. G-3) (France) ............... .
Oldbury (United Kingdom) ..
Sizewell (United Kingdom)
Tokai (Japco-1) (Japan)
Trawsfynydd (United King-
Rattd Reactor power (12) Years
!)•Pc (Jl W ( e)) s11 r-.;eycd
GCR
GCR
GCR
GCR
GCR
GCR
GCR
GCR
GCR
276
300
750
550
500
200
80
600
580
1965-1969
1965-1969
1962-1969
1965-1969
1965-1969
1962-1969
1958-1969
1968-1969
1965-1969
GCR 160 1965-1969
Total JIIa11• electrical Total rads
outp11t staff dose per (MW y) (mau•rads) MW(e) y Notes
1,401
1.436
1,059
1,803
2,245
965
571
624
1,423
318
2,027
1,269
647
915
1,526
590
219
156
360
1.4
0.9
0.6
0.5
0.7
0.6
0.4
0.2
0.3
703 2.2
Annual range 1.4-1.5 man-rad per MW y
Annual range 0.8-1.2 man-rad per MW y
Man-rads apply to reactor staff only
Annual range 0.3-0.8 man-rad per MW y
Annual range 0.6-0.8 man-rad per MW y
Man-rads include doses received during refuelling and in large maintenance operations
Man-rads apply to reactor staff only
Annual range 0.2-0.3 man-rad per MW y
Annual range 0.3-2.1 man-rad per MW y
dom) . . . . . . . . . . . . . . . . . . . GCR 500 1965-1969 1,564 653 0.4 Annual range 0.3-0.9 man-rad
Indian Point (United States).. PWR 265 1962-1969 1,033
Shippingport (United States)
Trino Vercellese (Italy)
Big Rock Point (United States) Dresden (United States) .....
PWR
PWR
BWR BWR
90
247
70 200
1965-1969
1964-1969
1962-1970 1960-1970
255
386
305 1,223
per MW y 1,386 1.3 Annual range 0.5-5.3 man-rad
893
250
1,217 2,038
3.5
0.6
4.0 1.7
per MW y Annual range 1.0-8.7 man-rad
per MW y Man-rads include doses re
ceived during refuelling and in large maintenance operations
Annual range 0.8-4.0 man-rad per MW y
Garigliano (Italy) . . . . . . . . . . BWR 150 1963-1969 645 750 1.2 Man-rads include doses re-ceived during refuelling and in large maintenance operations
N Reactor (United States) . . LWGR 790 1966-1969 1,248 1,446 1.2 Annual range 0.8-3.7 man-rad per MW y
Douglas Point (Canada) PHWR 208 1967-1969
1971
155 1.386 8.9 Tritium contributes 12 per cent of dose
Pickering 1, 2 (Canada) .... PHWR 1,080 338 198 0.6 Tritium contributes 26 per cent
Year
1963 1964 1965 1966 1967 1968 1969
of dose
TABLE 13. PERCENTAGE OF WORKERS USING TRffiU~l IN RECORDED DOSE RANGES
(UNITED KINGDOM) (33)
Workers monitored
43 56 47 42 56 56 82
(0.1 rad
62.8 51.8 61.7 19.0 39.3 41.1 3 I.7
0.1-1.5 rad
34.9 44.6 38.3 71.4 58.9 58.9 59.8
n Two individuals, with doses of 7 rads and 55 rads.
183
1,5.5 ,ad
2.3 3.6 0
11.9 0 0 6.1
>5 rad
0 0 0 0 0 0
2.4n
Mean dose rad
0.38 0.58 0.34 0.93 0.49 0.49 1.43
49
49
21. 25
49
49
21, 52
2L 25
49
49
21, 44
49
53
54
21, 52
63 35
21, 52
21. 54
21, 77
1i
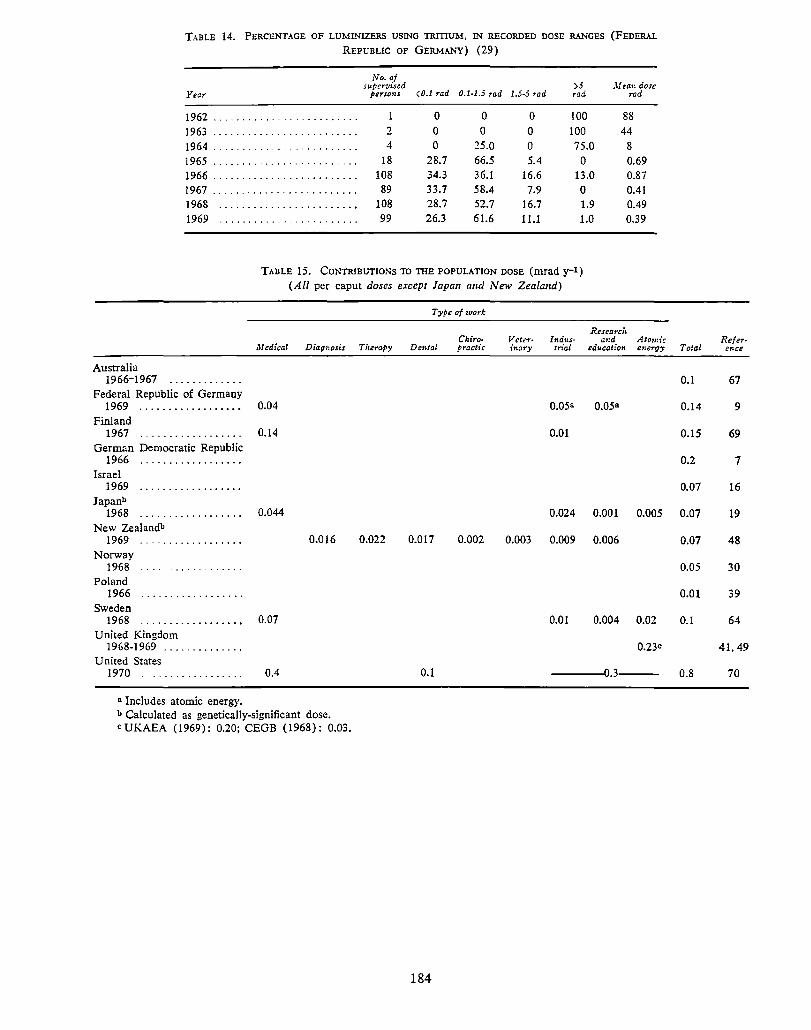
TABLE 14. PERCENTAGE OF LUMINIZERS USING TRITIUM, IN RECORDED DOSE RANGES (FEDERAL REPUBLIC OF GERMA:NY) (29)
No. of supervised )5 Mea1: dose
Year persons (0.1 rad 0.1.1.s rad 1.S-5 rad rad rad
1962 . . . . . . . . . . . . ............. 0 0 0 100 88 1963 ......................... 2 0 0 0 100 44 1964 ... . . . . . . . . .............. 4 0 25.0 0 75.0 8 1965 . . . . . . . . . . ............... 18 28.7 66.5 5.4 0 0.69 1966 ......................... 108 34.3 36.1 16.6 13.0 0.87 1967 ......................... 89 33.7 58.4 7.9 0 0.41 1968 ........................ 108 28.7 52.7 16.7 1.9 0.49 1969 ........................ 99 26.3 61.6 11.1 1.0 0.39
TABLE 15. CONTRIBUTIONS TO THE POPULATION DOSE (mrad y-1) (All per caput doses except Japan and New Zealand)
Type of work
Researcl, Cliiro- Veter- lr.dus- and Atomic
Medical Diagnosis Therapy Dental practic in.ary trial education er.ergy
Australia 1966-1967 .............
Federal Republic of Germany 1969 .................. 0.04 0.05a o.o5a
Finland 1967 ........ - ......... 0.14 0.01
German Democratic Republic 1966 ..................
Israel 1969 ..................
Japanb 1968 ................... 0.044 0.024 0.001 0.005
New Zealandb 1969 .................. 0.016 0.022 0.017 0.002 0.003 0.009 0.006
Norway 1968 ..................
Poland 1966 ..................
Sweden 1968 .................. 0.07 0.01 0.004 0.02
United Kingdom 1968-1969 .............. 0.23C
United States 1970 - ................ 0.4 0.1 0.3--
a Includes atomic energy. b Calculated as genetically-significant dose. CUKAEA (1969): 0.20; CEGB (1968): 0.03.
184
Refer-Total cnce
0.1 67
0.14 9
0.15 69
0.2 7
0.07 16
0.07 19
0.07 48
0.05 30
0.01 39
0.1 64
41, 49
0.8 70
REFERENCES
1. Adams, N. The assessment of whole-body dose, using personal dosemeters, Health Phys. 21: 105-107 (1971).
2. Atherton, N. J. and C. D. Burgess. Industrial Hygiene Division, Department of Employment, London. (Communication.)
3. Beninson, D., Comisi6n Nacional de Energfa At6-mica, Argentina. (Communication.)
4. Beninson, D., A. Placer and E. Van der Elst. Estudio de un caso de irradiaci6n humana accidental. Handling of Radiation Accidents, 415-429, IAEA, Vienna (1969).
5. Biles, M. B. Characteristics of radiation exposure accidents. Handling of Radiation Accidents, 3-18, IAEA, Vienna (1969).
6. Bradley, F. J., R. Blais and A. Jones. Impact of tritium on the watch industry. Rad. Health Data and Reports 12: 601-610 (1971).
7. Brasack, G. Occupational radiation exposure in the German Democratic Republic in 1966. Report SZS-20/68, 1968. ORNL-tr-2151.
8. Bundesminister filr Bildung und Wissenschaft. Umweltradioaktivitat und Strahlenbelastung 1956-1968. Schriftenreihe Kernforschung 2, 1970.
9. Bundesminister filr Bildung und Wissenschaft. Umweltradioaktivitat und Strahlenbelastung, Jahrcsbericht 1969, Schriftenreihe Kernforscbung 3, 1970.
10. Caldas, L. R. Universidade Federal do Rio de Janeiro, Institute de Biofisica, Brazil. ( Communication.)
11. Catlin, R. J. Radiation accident experience: causes and lessons learned. Handling of Radiation Accidents, 437-450, IAEA, Vienna (1969).
12. Chysky, J. and J. Trousil. Occupational exposure to ionizing radiation in the CSSR; United Nations document A/ AC.82/G/L.1320.
13. de Villiers, A. J. and J. P. Windish. Lung cancer in a fluorspar mining community. I. Radiation dust and mortality experience. Br. J. Ind. Med. 21:94-108 (1964).
14. Duggan, M. J., E. Greenslade and B. E. Jones. External radiation doses from occupational exposure. Nature 221: 831-833 (1969).
15. Duggan, M. J., P. J. Soilleux, J. C. Strong et al. The exposure of United Kingdom miners to radon. Br. J. Ind. Med. 27: 106-109 (1970).
16. Feige, Y. Israel Atomic Energy Commission, Soreq Nuclear Research Centre. (Communication.)
17. Grande, P. Radiation Hygiene Laboratory, Copenhagen, Denmark. (Communication.)
18. Halter, S. Ministere de la sante publique et de la famille, Brussels, Belgium. (Communication.)
19. Hashizume, T., T. Maruyama, Y. Kumamoto et al: Estimation of genetically significant dose from occupational exposure in Japan. Chiba-sbi (1970).
20. Holaday, D. A. History of the exposure of miners to radon. Health Phys. 16: 547-552 (1969).
21. International Atomic Energy Ag:ency. Power and Research Reactors in Member States. May 1970 Edition. IAEA, Vienna (1970). ·
22. International Commission on Radiation Units and Measurements. Radiation Quantities and Units. ICRU Report 19. Washington (1971).
23. International Commission on Radiolo!!ical Protection. Recommendations of the International Commission on Radiological Protection ( Adopted 17 September 1965). ICRP Publication 9. Pergamon Press, Oxford (1966).
24. International Commission on Radiological Prot~ction. Gen.era! principles of monitoring for radiation protection of workers. Committee 4 Report. (Adopted by the Commission on May 24, 1968.) ICRP Publication 12. Pergamon Press, Oxford (1969).
25. Jammet, H. Commissariat a l'energie atomique, France. (Communication.)
26. Jankowski, J. Organizacja pomiar6w dawek osobniczych promieniowania rentgenowskiego oraz wyniki za okres 1966-1967, Medycyna Pracy 19: 564-570 (1968).
27. Jankowski, J. and B. Krych. Pomiary dawek indywidualnych za pomoca dawkomierzy fotometrycznych w Polsce w roku 1969 u os6b zawodowo narazonych na Dzialanie promieniowania rentgenowskiego, Medycyna Pracy 20: 369-374 (1969).
28. Jankowski, J. and B. Krych. Wyniki pomiar6w dawek indywidualnych w Polsce w 1969 r u os6b zawodowo narazonych na dzialanie promieniowania rentgenowskiego, Medycyna Pracy 21: 385-393 (1970).
185
29. Kistner, G. Bundesgesundheitsamt, Federal Republic of Germany. (Communication.)
30. Koren, K. State Institute of Radiation Hygiene, Norway. (Communication.)
31. Krishnamoorthy, P. N. Bbabba Atomic Research Centre, Trombay, Bombay, India. (Communication.)
32. Kucharski, M., T. Musialowicz, J. Jasiak et al. Pomiary dawek indywidualnycb i ocena narazenia os6b pracujacych ze zr6dlami promieniowania jonizujacego w Polsce w roku 1966. Raport CLOR-68/D, Warsaw (1968).
33. Lambert, B. E. and J. Vennart. Radiation doses received by workers using tritium in industry. Health Phys. 22: 23-30 (1972).
34. Langham, W. H. (ed.). Radiobiological factors in manned space flight. National Academy of Sciences. Washington (1967).
35. Lee, Byron Jr. Commonwealth Edison Company, Chicago. (Communication.)
36.
37.
38.
39.
40.
Lindell. B. National Institute of Radiation Protection,' Stockholm, Sweden. (Communication.)
Lindell, B. Occupational hazards in x-ray analytical work. Health Phys. 15: 481-486 (1968).
Lindell, B. Professional responsibilities of the health physicist in relation to the medical profes-sion. Health Phys. 20: 475-484 (1971 ). Liniecki, J. Instytut Medycyny Pracy, Poland. (Communication.) Lundin, F. E. Jr., J. K. Wagoner and V. E. Archer. Radon daughter exposure and respiratory cancer quantitative and temporal aspects. U.S. Department of Health, Education, and Welfare Public Health Service. National Institute for Occupational Safety and Health, National Institute of Environmental Health Sciences, Joint Monograph No. 1, 1971.
41. McLean, A. S. National Radiological Protection Board, United Kingdom. (Communication.)
42. Minx, R. P. United States Department of Defense. (Communication.)
43. Mirza, K. F. and W. K. Malik. Average exposure to radiation workers in Pakistan. Health Phys. 18: 569 (1970).
44. Misono, K. National Institute of Radiological Science, Ja pan. (Communication.)
45. Mistry, K. B. Bhabha Atomic Research Centre, Trombay, Bombay, India. (Communication.)
46. Moore, R. V. Fast breeder reactor power stations, UKAEA Monthly Bulletin "Atom" , No. 149, p. 59, 1969.
47. Morgan, K. Z. Oak Ridge National Laboratory, Oak Ridge, Tennessee. (Communication.)
48. New Zealand, Department of Health, National Radiation Laboratory, Radiation Control and Population Dose in New Zealand. NRL-UN/2, Christchurch (1970).
49. Orchard H. C. Central Electricity Generating Board, United Kingdom. (Communication.)
50. O'Riordan, M. C. X-ray hazards in practices. Vet. Ree. 87: 640-643 (1970.)
51. Pellerin, P. Ministere de la Sante Publique et de la Securite Sociale, Service Central de Protection contre Jes Rayonnements Ionisants, France. (Communication.)
52. Polvani, C. Comitato Nazionale per !'Energia Nucleare, Italy. (Communication.)
53. Prestele, J. A. Consolidated Edison Company of New York, Inc. , New York. (Communication.)
54. Rogers , L. United States Atomic Energy Commission. (Communication.)
55. Roth , G. E. and N. F. Paris. National Radiation Laboratory, Christchurch, New Zealand. (Communication.)
56. Rowe, P. C. and G. Cowper. Analysis of personal radiation exposures in 1968. AECL-3112, Chalk River, Canada (1969.)
57. Samsen, L. and B. D. P. Williamson. The radiation hazards associated with the use of hand-held fluoroscopes in Thailand. Thai Journal of Radiology 4: 167-175 (1966.)
58. Samsen, L. Radiation Protection Service. Department of Medical Sciences, Bangkok, Thailand. (Communication.)
59. Savic, S. D. Results of a study of color television set assembly and repair workers x-ray safety. Radio!. Health Data Rep. 11: 519-525 (1970).
60. Schmidt, G. D., J. A. Halperin, E. Geiger et al. Surveys of Radium Contamination in Aircraft Instrument Repair Facilities, 1966-1967. Radial. Health Data Rep. 12: 7-16 (1971.)
61. Seelentag, W. Two cases of tritium fatality, Paper presented at Tritium Symposium, Las Vegas, Nevada, 1971.
62. Shleien. B. and E. LeCroy Jr. J. Nucl. Med. 12: 523-525 (1971.)
63. Sinderman, R. W. Consumers Power Company, Jackson, Michigan. (Communication.)
64. Snihs. J.-0. National Institute of Radiation Protection, Stockholm, Sweden. (Communication.)
65. Statens Stralskyddinstitut, Verksamheten, Stockholm (1968.)
66. Statens Stralskyddinstitut, Verksamheten, Stockholm (1970.)
67. Stevens, D. J. Commonwealth X-ray and Radium Laboratory, Australia. (Communication.)
68. Stewart, C. G. and S. D. Simpson. The hazards of inhaling Radon-222 and its short-lived daughters: consideration of proposed maximum permissible concentrations in air. Radiological Health and Safety in Mining and Milling of Nuclear Materials, Vol. 1, 333-357, IAEA, Vienna ( 1963.)
69. Toivonen, M. and A. Isola. On the exposure of radiological employees in Finland during 1965-1 967. Report SFL-A 11, Helsinki ( 1968).
70. Tompkins, P. United States Environmental Protection Agency. (Communication.)
71. Ulken. D. Gesellschaft filr Kemenergieverwertung in Schiffbau und Schiffahrt MBH, Federal Republic of Germany. (Communication.)
72. United Nations. General Assembly, Report of the United Nations Scientific Committee on the Effects of Atomic Radiation. 1962, Official Records of the General Assembly, Seventeenth Session. Supplement No. 16 (A/5216.)
73. United States Atomic Energy Commission, Operational Accidents and Radiation Exposure Experience 1943-1970. Washington (1971.)
74. United States Department of Health, Education and Welfare. A radiation survey of television repair shops in the Baltimore area. BRH/DEP 71-4, Rockville, Md. (1971.)
75. Van Daatselaar, C. J. Ministry of Social Affairs and Public Health. Netherlands. (Communication.)
186
76. Villforth, J. C., E. W. Robinson and G. J. Wold. A review of radium incidents in the United States of America. Handling of Radiation Accidents. 389-398. IAEA. Vienna (1969.)
77. Wilson, R. Ontario Hydro. Toronto, Canada. (Communication.)
78. Wilson, R ., G. B. Knight and G. A. Vivian. Operating health physics experience in heavy water reactors. Paper delivered at IRPA Congress, Brighton ( 1970.)
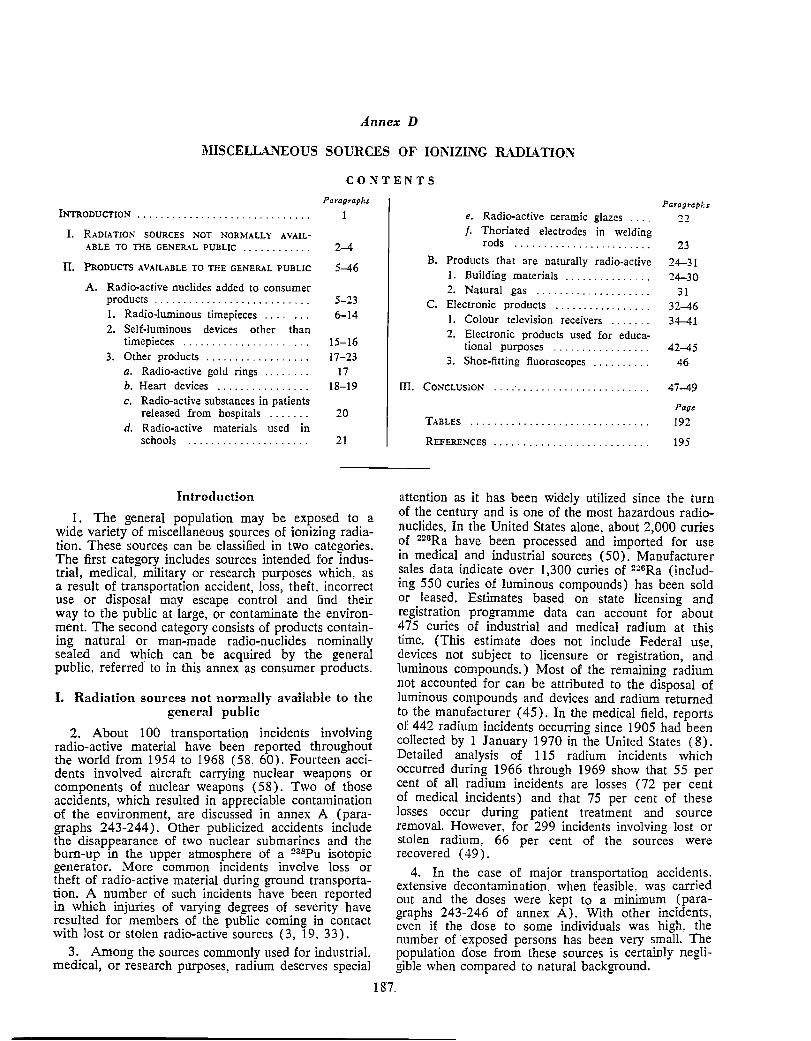
Annex D
MISCELLANEOUS SOURCES OF IONIZL~G RIDL-l110N
CONTENTS
INTRODUCTION ............................. .
l. RADIATION SOURCES NOT NORMALLY AVAIL-
ABLE TO THE GENERAL PUBLIC ........... .
II. PRODUCTS AVAILABLE TO THE GENERAL PUBLIC
A. Radio-active nuclides added to consumer products .......................... . 1. Radio-luminous timepieces ....... . 2. Self-luminous devices other than
timepieces ..................... . 3. Other products ................. .
a. Radio-active gold rings ....... . b. Heart devices ............... . c. Radio-active substances in patients
released from hospitals ...... . d. Radio-active materials used in
schools .................... .
Introduction
Paragraphs
1
2-4
5-46
5-23 6-14
15-16 17-23
17 18-19
20
21
1. The general population may be exposed to a wide variety of miscellaneous sources of ionizing radiation. These sources can be classified in two categories. The first category includes sources intended for industrial, medical, military or research purposes which. as a result of transportation accident, loss, theft, incorrect use or disposal may escape control and find their way to the public at large, or contaminate the environment. The second category consists of products containing natural or man-made radio-nuclides nominally sealed and which can be acquired by the general public. referred to in this annex as consumer products.
I. Radiation sources not normally available to the general public
2. About 100 transportation incidents involving radio-active material have been reported throughout the world from 1954 to 1968 (58, 60). Fourteen accidents involved aircraft carrying nuclear weapons or components of nuclear weapons (58). Two of those accidents, which resulted in appreciable contamination of the environment, are discussed in annex A (paragraphs 243-244). Other publicized accidents include the disappearance of two nuclear submarines and the burn-up in the upper atmosphere of a 238Pu isotopic generator. More common incidents involve loss or theft of radio-active material during ground transportation. A number of such incidents have been reported in which injuries of varying degrees of severity have resulted for members of the public coming in contact with lost or stolen radio-active sources (3, 19. 33).
3. Among the sources commonly used for industrial. medical, or research purposes, radium deserves special
187.
e. Radio-active ceramic glazes .... f. Thoriated electrodes in welding
rods ....................... .
B. Products that are naturally radio-active 1. Building materials .............. . 2. Natural gas ................... .
C. Electronic products ................ . I. Colour television receivers ...... . 2. Electronic products used for educa-
tional purposes ................ . 3. Shoe-fitting fluoroscopes ......... .
Ul. CONCLUSION
TABLES ....•..........................
REFERENCES .......................... .
Paragraphs
22
23
24-31 24-30
31 32-46 34-41
42-45 46
47-49
Page
192
195
attention as it has been widely utilized since the turn of the century and is one of the most hazardous radionuclides. In the United States alone, about 2,000 curies of 226Ra have been processed and imported for use in medical and industrial sources ( 50). Manufacturer sales data indicate over 1,300 curies of 226Ra (including 550 curies of luminous compounds) has been sold or leased. Estimates based on state licensing and registration programme data can account for about 4 7 5 curies of industrial and medical radium at this time. (This estimate does not include Federal use, devices not subject to licensure or registration, and luminous compounds.) Most of the remaining radium not accounted for can be attributed to the disposal of luminous compounds and devices and radium returned to the manufacturer ( 45). In the medical field, reports of 442 radium incidents occurring since 1905 had been collected by 1 January 1970 in the United States ( 8). Detailed analysis of 115 radium incidents which occurred during 1966 through 1969 show that 55 per cent of all radium incidents are losses (72 per cent of medical incidents) and that 75 per cent of these losses occur during patient treatment and source removal. However. for 299 incidents involving lost or stolen radium, 66 per cent of the sources were recovered ( 49).
4. In the case of major transportation accidents. extensive decontamination. when feasible. was carried out and the doses were kept to a minimum (paragraphs 243-246 of annex A). With other incidents. even if the dose to some individuals was high. the number of ·exposed persons has been very small. The population dose from these sources is certainly negligible when compared to natural background.
II. Products available to the general public
A. RADIO-ACTIVE NUCLIDES ADDED TO CONSUMER PRODUCTS
5. Radio-active materials, either natural or manmade, are often incorporated into consumer products. A list of such products, which does not pretend to be comprehensive, is presented in table 1 ( 13). The use of radio-nuclides to produce luminosity appears at present to be the largest single application of radionuclides in products available to the general public. Quantitative data on the doses resulting from the distribution of such products are scarce but it is estimated that the contribution of radi0-luminous timepieces, which is relatively well documented, amounts to more than half of the average gonad dose from all consumer products containing radio-active materials (45).
1. Radio-luminous timepieces
6. Several studies on doses arising from radioluminous timepieces were conducted around 1960, when 226Ra predominated as the activating material (12, 25, 31, 34, 51, 52). The alpha activity of such a source is the main means of producing fluorescence, while the beta activity and accompanying gamma rays give rise to the external radiation exposure of the wearer. The radium content of self-luminous timepieces was found to vary considerably, depending upon many factors such as size of hands and dials, and radium concentration in the luminous paint. In a summary of the investigations, Seelentag and Schmier (52) reported that the average radium content of men's wrist watches containing radium as a luminizing material varied from 0.014 to 0.36 microcurie, with a maximum observed value of 4.5 microcurie.
7. The actual dose received by a wearer will depend on a number of factors such as the amount of radium in the watch, the length of time that the watch is worn during the day, and the habits of the wearer. It has been estimated ( 52) that the annual gonad dose to males wearing a watch only during waking hours (16 hours per day) might be about one fifth of the 24-hour dose. and might be about 15-30 millirads per year, normalized to a watch activity of one microcurie.
8. Radium-dial pocket watches, which are worn in relatively close proximity to the gonads, are potentially a greater genetic hazard than wrist watches with equal amounts of 2~6Ra (43). However, they are not worn overnight, and measurements on a phantom indicated that the annual dose to the testes is about 60 mrad µCi-1 , which is lower than the average annual dose from a wrist watch of the same activity worn 24 hours a day (27). As regards self-luminous alarm clocks. Joyet and Miller (25) estimated the average gonad dose from that source to be on!y one tenth of the gonad dose from luminous wrist watches.
9. Estimates of the genetically-significant dose from radium in watches around the year 1960 are shown in table 2. On average. the genetically-significant dose was 2 mrad y-1 and, in all cases, less than 4 mrad y-1•
10. The fraction of ~~2Rn leaking out of the watches was reported to vary widely (12).-Tbe radon content measured after a build-up of 10 hours in an airtight box was found to varv from around 0.1 to 30 nanocuries per microcurie 2:Z0Ra for new. watertight watches and for loosely sealed, old watches, respectively. The
188
dose to the lung after inhalation of 2! 2Rn and its decay products depends on the size and ventilation rate of the room in which the watch is used but can be estimated to be in most cases a small fraction of the contribution of natural background.
11. It was already clear in the early 1960s that, probably because of radiation regulations, the average content of 226Ra in self-luminous wrist watches, as well as the annual production of such watches, was decreasing (52). At the same time, efforts were also made to use beta-active sources of low energy, which emit a small amount of gamma radiation or none at all, such as 3H or 14.Pm, to eliminate the external radiation exposure. For a period 00Sr was used but has now been discontinued on account of the beta radiation and Bremsstrahlung escaping from the watch and the hazard for the workers involved. In 1967, the ENEA and the IAEA jointly recommended that only 3H, 147Pm and 226Ra should be used as activating radio-nuclides in luminous paint for dials and hands of timepieces and that 3H or 147Pm should be preferred as far as possible (18). Average and maximum recommended values of the radio-nuclide content to be used per timepiece were also indicated.
12. In recent years, 226Ra in watches has tended to be replaced by 3H and, to a lesser extent, 147Pm. In 1968, the annual United States production and importation of timepieces activated by 226Ra was estimated to be about 3 million whereas 6 to 7 million timepieces contained 3H or 147Pm ( 45).
13. Although the use of 3H eliminates the risk of external irradiation, experience has shown that tritiated water, or a simple tritiated organic molecule, evolves from the self-luminous compound (26, 63) and leakage of 3H from watches has been found to result in annual doses to wearers of the order of one millirad ( 65).
14. The Committee is not aware of any recentlypublished survey on radiation doses resulting from the use of self-luminous timepieces. However, taking into account the increased use of nuclides giving rise to smaller exposure and the development of performance standards, it seems very likely that the geneticallysignificant dose has considerably decreased since I 960.
2. Self-luminous devices other than timepieces
15. Although nowadays radio-luminous phosphors are usually activated by 3H, radium bas been extensively used, primarily by the aircraft industry and the military. During World War II, the major United States manufacturer of luminous markers used several hundred curies of radium in production for the armed forces. Some of those products find their way into consumer outlets as government surplus ( 48).
16. The dose resulting from the normal use of the majority of self-luminous devices is probably very low but the possibility always exists that persons receive greater exposure than expected because of the release of the radio-nuclide during accidents, fire or unconventional use of the product. However, the probability of such circumstances occurring will normally be small (13).
3. Other products
a. Radio-active gold rings 17. It has been reported that spent gold-encased
radon seeds, originally intended to be implanted into
tumours, have occasionally been used in the manufacture of gold rings ( 4, 56). In one instance irradiation from long-lived daughter products of radon that became incorporated in the gold caused sufficient damage to adjacent skin to necessitate amputation of the affected finger.
b. Heart devices
18. Owing to its high ratio of power output to weight and volume, and to its long half-life, 238Pu is used as a power source for isotopic generators. In the medical field, about 10 ~38Pu sources were in use in patients in March 1972 as batteries for heart pacers. This practice has been introduced to avoid the surgical replacement of the conventional electrical batteries in heart pacers each 18 months. 238Pu is also envisaged as a power supply for a mechanical pump which would totally replace the human heart. If all the technological problems can be overcome, there might be as much as 100 megacuries of ~38Pu committed to this use by the tum of the century (29).
19. In the present state of technology, the dose equivalent received by someone staying continuously near the patient would be of the order of one rem per year for an artificial heart and of one millirem per year for a heart pacer (15). The dose to the adjacent tissue in a person wearing a pacemaker would be very much higher but is essentially a matter of medical concern only.
c. Radio-active substances in patients released from hospitals
20. Members of the families of patients who have been released from hospitals after having been treated with radio-active substances may receive some exposure from radio-active nuclides still retained in the patients. The practices concerning the amount of activity permitted in patients leaving hospitals vary from country to country but often reflect current international recommendations (22) intended to limit the dose received by other persons than the patient to less than 0.5 rad per year.
d. Radio-active materials used in schools
21. Pupils in schools sometimes use radio-active materials in science classes. Recommendations for the protection of pupils exposed to radiations used in schools have been given by the ICRP (21).
e. Radio-active ceramic glazes 22. The use of uranium compounds to produce
certain brightly colored pigmented glazes for ceramicware such as platters, pitchers, vases, water mugs and coffee cups was reported as early as 1906. For a set of tableware widely available in the United States, it is estimated that the beta-radiation dose to the hands, assuming a continuous contact with the tableware for 90 minutes per day, ranges from 2 to 10 rads per year (36).
f. Thoriated electrodes in welding rods 23. When thoriated tungsten electrodes are used to
generate an arc, thorium it released from the arc and becomes airborne as a fume. The activity released is sufficiently diluted by normal convection currents for the concentration in the air breathed by the operator to be very low. Significant concentrations might result only if the equipment is used in a small, totally enclosed, space (5).
189
B. PRODUCTS THAT ARE NATURALLY RADIO-ACTIVE
1. Building materials
24. The relative content of natural radio-nuclides in building materials may lead to a significant difference between the external radiation dose rates received indoors and outdoors. The walls of buildinos act as a shield against outside radiation but this;, effect is often offset by radiation resulting from the radioactivity of the building materials (annex A, paragraphs 132-136).
~5. Increase~ in expos?I'e occur when highly-radioactive construction matenals are used. For instance phosphate rocks often have a high content of radiu~ p7). In tI!e United States, the growth_ ?f the phosphate mdustry. linked to the use of the tailings as building material, bas possibly led to a significant increase in the exposure of local populations (32). In a United Kingdom survey, gypsum which is also a waste product from fertilizer from imported phosphate rock was found to be at least twice as active (in terms of gammaray emission rate per gramme) as any other building material ( 14). In Sweden, light-weight concrete from uranium-rich shales has been reported to give indoor dose rates two to three times the normal outdoor dose rate (59).
26. A special situation arose in Grand Junction, Colorado, in the United States, where approximately 200,000 tonnes of uranium-mill tailings were used during the period 1952-1966 as fill material under streets, driveways, swimming pools, water pipes and sewer mains, but also in habitable structures where they resulted in potential exposures from external gamma radiation and inhalation of 222Rn decay products. By August 1971, gamma levels had been assessed in approximately 10,600 structures out of 18,000. About 3,000 of these were actually found to have tailings under, or adjacent to, the building (11, 55). It is estimated that the total number of structures with tailings located under or against them in the Grand Junction area is about 3,600 (55).
27. Analyses of gamma maps of about 1,000 habitable structures, including residences, schools, business and public buildings. were completed by October 1971. Data for 670 residences show that, in 80 per cent of these, the average levels above background ( taken as 9 µ.R b-1 ) are less than 10 µ.R h-1 ;
in about 18 per cent they are in the range 10-50 µ.R b-1, and in only 0.3 per cent above 100 µ.R b-1 (11). Assuming that the average time spent indoors is 17 hours per day (paragraph 263 of annex A), doses to the gonads corresponding to levels of 10, 50 and 100 µ.R h-1 are approximately 50, 250 and 500 mrad y-1, respectively.
28. The concentration of 222Rn decay products in structures built with tailings are not readily correlated with the gamma levels. Preliminary measurements indicated levels of radon daughters ranging up to 0.4 WL1 which is 100 times the background level ( 11).
1 A working level (WL) is the term used in uranium mines to describe radon-daughter product activities in air. This term is defined as any combination of short-lived radon-daught~r products in one litre of air that will result in the ultimate eq-ussion of 1.3 105 MeV of potential alpha energy. The numerical value of the working level is derived from the alpha energy released by the total decay through 2HPo of the short-lived radon decay products 21spo, 2HPb and 214Bi at radio-active equilibrium with 100 pCi of 222Rn per litre of air.
29. So far the area of Grand Junction is the only one where it has been determined that tailings have been used extensively in construction. However, some tailings have been found under structures in other cities in Colorado and surveys are being carried out in the United States to investigate the extent of use of tailings in all areas surrounding present and former mill operations ( 11 ) . It is not known if similar situations occur in other countries.
30. By contrast it is clear that an appropriate choice of low radio-activity raw materials would cause a significant reduction in the population dose from external radiation, as several studies have shown that, on a national basis, the radio-activity of a building material varies considerably (30, 64).
2. Natural gas 31. Average 22~Rn levels in natural gas samples
collected from different geological formations of the United States were found to range from 3 to 67 pCi 1-1,
with a maximum observed value of 160 pCi 1-1 ( 6). When natural gas is used. 222Rn is released. Its maximum build-up is expected to occur in a closed area containing unvented gas appliances. In a typical dwelling. its concentration in air would be about 500 times less than its concentration in gas (24). Taking an average 2
~2Rn level in ~as of 35 pCi 1-1• the con
centration in air would be about 0.07 pCi 1-1, which, assuming average conditions of radio-active equilibrium between 222Rn and its daughters, corresponds to a dose of about 20 rnrad y-1 to the basal cell nuclei of the bronchial epithelium (annex A, paragraph 117). However. actual doses are expected to be much lower because most appliances are vented and also because any appreciable transmission time from well to consumer would decrease the 222Rn content by radioactive decay.
C. ELECTRONIC PRODUCTS
32. Electronic products may be sources of ionizing radiation when electrons are accelerated at potentials in excess of about 10 kilovolts. Potential emitters of x rays are high-voltage rectifiers. radio-transmitter tubes. klystrons. electron microscopes, etc. A large variety of those devices are used for medical, industrial. or research purposes and are outside the scope of this annex. However. it may be recalled here that the problem of stray x rays around high-voltage tubes was exemplified in 1960 when two technicians exposed to pulsed x rays from an unshielded klystron tube were seriously injured in Lockport, USA ( 17).
33. Household colour television receivers are the most common electronic products with the potential of exposing the general public to x radiation.
I. Colour television receivers
34. Since the advent of commercial television broadcasting. it has been recognized that cathode-ray tubes of television receivers produce x rays, the output of which depends sharply on tube voltage and is directly proportional to tube current.~ In monochrome sets. the x rays are produced in small amount and have a poor penetrating power. because of the relatively low accelerating voltage of about 20 kilovolts 2nd the
1 The ICRP recommends that the x-ray exposure rate 5 cm from the surface of any television set should not exceed 0.5 mR h-1, which is equivalent to an air dose rate of 0.435 mrad h-1 (20).
190
small b_e~ current of s~~e 0.1 milliampere. X-ray production m colour telev1S1on sets is enhanced because of an increase of the accelerating voltage to 25 kilovolts or more and of the beam current to about one milliampere resulting in a greater production of more penetrating radiation. High-voltage rectifiers and shunt regul_a~or tubes. are the o!her sources of x rays in a telev1s1on receiver. Certam models are designed to oper~te ,~ithout shunt regulator tube a~d some are fully !ra~s1stonzed. ~he trend. tov.:ards sohd-state circuitry 1s likely to contmue and 1mpltes that the only vacuum device remaining in a television receiver within a few years will be the picture tube (7).
35. The public-health significance of the problem is potentially greatest in the United States. where 25 million colour sets were in use in January 1970 (53) and where it is estimated. from the present rate of increase of colour television sets, that approximately 70 per cent of all homes will have them by 19 7 5 (16). In 1967, approximately 110,000 large-screen colour television receivers were modified by replacing the highvoltage shunt regulators which produced an excessive downward emission of x rays (47). A field survey conducted in the state of Florida in November 1967 on 148 sets showed that the modification programme had been effective but discovered that 43 sets had x-ray emissions from sources other than the shunt regulator tube in excess of the ICRP limit. These x rays originated from component sources that could be associated with the sets of all manufacturers. thus indicating a potential industry-wide problem (38). To obtain additional information. a home survey was conducted in the Washington (D.C.) metropolitan area in December 1967 and January 1968. It was found that 76 per cent of the 1.124 colour television receivers examined did not emit any measurable levels of x rays but that 6 per cent exhibited exposure rates above the ICRP limit, in most cases because of excessively-high voltage (39). X rays were detected regardless of the age of the sets but there was evidence of a downward trend for receivers sold from 1964 to I 967.
36. Table 3 presents the estimates of the average annual doses for both children and adults. based on average viewing habits and on the average front face exposure rate of 43 ,uR h-1 at five centimetres that were observed in the Washington survey. The average dose to the gonads of male children is estimated at I .5 mrad y-1 but the distribution of x-ray emission would suggest that about 1 per cent of the viewing population might receive doses larger than those presented in table 3 by a factor of about 60 ( 40). The annual genetically-significant dose to the United States population was estimated to be 0.5 millirad based on the assumptions that. over the country. the distribution of x rays from television sets and the viewing habits of the population are sLmilar to those observed in the Washington metropolitan area (66). However, it was pointed out that the ener!!J dependence of the detectors used in the Florida and Washington survevs led to overestimates of up to a factor of three of the- exposure rate of cathode-ray tube and rectifier tube emissions (66).
37. Other home surveys were more recently conducted in the United States in order to check if the x-ray emissions complied with the guidelines. In Pennsylvania and in Puerto Rico, Jess than I O per cent of the colour televisions surveyed were found to emit radiation in excess of the ICRP limit and none exceeded
3.0 mR h-1 (9, 28). In Suffolk County, New York. over 6,000 sets were inspected in 1968-1969; about 16 per cent emitted radiation in excess of 0.5 mR h-1, the maximum observed being 150 mR h-1 ( 1). The outstanding causes of x-ray emissions were improper adjustment of the high-voltage control and faulty shuntregulator tubes. A follow-up of this survey showed that approximately 11 per cent of the sets that were re-surveyed were emitting x rays above the ICRP limit because of improper servicing ( 2).
38. The first phase of the United States performance standard for television receivers became effective for sets manufactured after 15 January 1970, and the final and most stringent aspect was effective after June 1971. Television receivers must meet the 0.5 mR h-1
limit under conditions of extreme misadjustment and with the component and/or circuit failure that maximizes emission ( 44). This means that under typical operating conditions. the emission from recently-built colour television receivers is expected to be indistinguishable from background ( 54).
39. Smaller-scale surveys have been conducted outside the United States. In the United Kingdom, the only source of x rays in currently-produced sets is the picture tube and the maximum dose rate occurs at the front screen. A survey completed by April 1970 concluded that the average male-gonad dose from normal viewing of receivers whose picture tube is set at a typical high voltage is about 0.8 !-'rad y-1 ( 41). Allowing for high voltage regulation. variability of x-ray output and the effect of line voltage fluctuations, the dose rate in air five centimetres from any receiver leaving a factory is unlikely to exceed 15 !-'rad h-1 ,
corresponding to an average male-gonad dose of about 0.2 mrad y-1 • It was observed that under test conditions of service misadjustment or circuit failure tending to maximize x-ray emission or both conditions combined, some manufacturers' receivers could be made to exceed slightly the ICRP limit ( 4 2).
40. In Canada, in contrast to the other surveys, the front face of the sets was not monitored as it was assumed that the glass safety plate of the picture tube provided an effective shielding. About 11 per cent of the receivers tested gave dose rates above the ICRP limit but the proportion was found to decline in successive years since 1966 (10).
41. The foregoing surveys, as well as the results reported from other countries (23), tend to show that. under conditions of normal operation and proper servicing, the x-ray emission from recently-built colour television receivers is negligiole.
2. Electronic products used for educational purposes
42. Many schools in their science class demonstrations use equipment which produces ionizing radiation. During April 1969. a survey was performed in 181 high schools throughout the United States to determine the magnitude of possible radiation hazards from demonstration devices designed to emit x rays or which may emit x rays as a result of their intended use (61).
43. Survey findings showed that three types of cold cathode gas discharge tubes produced outside the tube significant levels of x rays which were not essential to the effect demonstrated. An estimate of 15.000 to 30,000 of those tubes, which were used to demonstrate
191
the beat effect, the magnetic effect, and the fluorescence effect of cathode rays, had been distributed by the United States producer from about 1910 to 1968. The x-ray exposure rate at a distance of 30 centimetres was greater than 0.1 R h-1 for 25 per cent of the 175 t~bes tested. and greater than 1 R h-1 in the proportion of 6 per cent. The number of students who might have been exposed and the average exposure were not determined. As a consequence oCthe survey, the company currently manufacturing the tubes in the United States ceased the production of the faulty tubes and redesigned them. The fluorescence-effect and the magnetic-effect tubes were then found to meet the newly-promulgated requirements of 10 mR h-1 at 30 centimetres from any surface or enclosure of the tube, and were allowed to be sold. The heat-effect tube failed to meet requirements and its production was terminated ( 62).
44. In the same survey, 103 x-ray tubes were found, of which 97 were unshielded and many were reported as not in use. Measurements were made on 21 of the unshielded tubes. Eleven emitted at rates of roentgens per hour 60 centimetres from the anode, the maximum calculated value being 108 R h-1. Some of the tubes could emit X rays in all directions at rates many times the recommended maximum. Under the new regulation. the divergence of the x-ray exit beam should not exceed 1r steradians and the enclosure must be equipped with a beam-blocking device (46).
45. In a preliminary survey conducted in Kansas schools in 1968, measurable exposure rates were recorded in the vicinity of the x-ray tubes and of some cold-cathode gas discharge tubes (57). The maximum exposure which resulted from the use of hand fluoroscopes was to the bands of 10 high school students over a school year and amounted to about 700 millirads. Other exposure rates were lower by at least an order of magnitude. Most of the x-ray-producing devices available in the schools were not in use. Subsequently, discontinuance of hand fluoroscopy was recommended.
3. Shoe-fitting fiuoroscopes
46. In its 1962 report, the Committee referred to the irradiation of individuals by shoe-fitting fluoroscopes. Information available to the Committee indicates that those devices are much less frequently used than formerly. When in use, they will cause exposure rates to the feet of about 5 rads per minute or more.
m. Conclusion
47. The widespread use of self-luminous wrist watches activated by 2~0Ra led to a genetically-significant dose of about 2 mrad y-1 around 1960. As a consequence of international recommendations and national regulations in some countries. the use of 226Ra is being gradually discontinued and is being replaced by 3H and, to a lesser extent, 147Pm. which give rise to much lower doses to the users. There is no recent estimate of the present contribution of self-luminous wrist watches to the genetically-significant dose but it is expected to be considerably reduced from the 1960 value. However. significant individual doses are likely to be received in case of accidental ingestion of the radio-luminous paint.
48. The radiation exposure from colour television receivers seems to follow the same trend. In the United

States, the genetically-significant dose from that source was estimated to be 0.5 mrad y-1 in 1967. Since then, federal performance standards for television receivers have gone into effect so that the genetically-significant dose should now be very small. In the other countries, because the proportion of colour television sets is much lower than in the United States, the geneticallysignificant dose is also certainly very small.
49. The external radiation is influenced to a large extent by the radio-active content of the building ma-
terials. Analysis of table 18 of annex A indicates that the average external dose rate indoors may be lower or higher than the outside dose rate depending upon local circumstances such as geology, choice and origin of building material, etc. It is evident that the influence of the building material on the external dose rate is very high, and that the choice of material therefore should be given proper attention. Building materials with unusually high radio-active contents should be avoided.
TABLE 1. PRODUCTS CURRENTLY .WAILABLE CONTAJN'ING RADIO-NUCLIDES (13)
Product•
A. Radio-luminous products (a) Paints and plastics
1. Timepieces ............. .
2. Aircraft instruments
3. Compasses ............. .
4. Instrument dials and mark-ers ................. .
5. Instruments, signs and indi-cators ............... .
6. Thermostat dials and point-ers ................. .
7. Automobile lock illumina-tors ................. ·{
8. Automobile shift quadrants 9. Bell pushes ............ .
10. Speedometers .......... . 11. Rims for underwater
watches ............. . 12. Fishing lights .......... . 13. Spirit levels ............ .
(b) Sealed 111bes 1. Marine compasses ...... . 2. l\farine navigational instru
ments
3. Markers ............... {
4. Instruments, signs and in-dicators .............. {
5. Exit signs for commercial buildings ............ .
6. Large signs ............ . 7. Small exit signs ......... . 8. Step markers ........... . 9. Mooring buoys and lights
10. Public telephone dials ... . 11. Light switch markers .... . 12. Bell pushes ............ . 13. Miniature light sources
B. Electronic and electrical devices
1. Electronic tubes ........ .
Nwclid,
3H 147Pm 226Ra
3H 1-t,pm 226Ra
3H 147J>m
3H
3H
3H H7pm
att 3H
147J>m
3H HC 3H
SH
3H 3H
85Kr
3H 8.5Kr
3H 3H 3H 3H 3H 3H 3H 3H 3H
3H 63Ni
H7Pm 8.5Kr SOCo ~26Ra 137Cs
192
Activity or mas• per product (ror.ge of oppro.rimote :•aluts)
5 to25 mCi 65 to 200 14Ci 0.1 to 3 µCi up to 10 Ci up to 0.3 Ci up to 20 µCi 5 to 50 rnCi
lOµCi
25mCi
0.75Ci
25 rnCi
2 to 15 rnCi 2mCi
25mCi 0.3 mCi 0.1 mCi
0.3mCi 3 to4 mCi
5 to25 mCi
0.2 to 2 Ci
0.25 Ci 4Ci
0.3Ci
2Ci 0.25 Ci
15 Ci 30 Ci 2 Ci 2Ci 2 Ci
0.5 Ci 0.2Ci lOmCi 20mCi
1 to 104 µCi 1 to 5 µCi
1 µCi 1 to 5 µCi
0.15 to 5 14Ci 0.1 µCi 5 µ.Ci
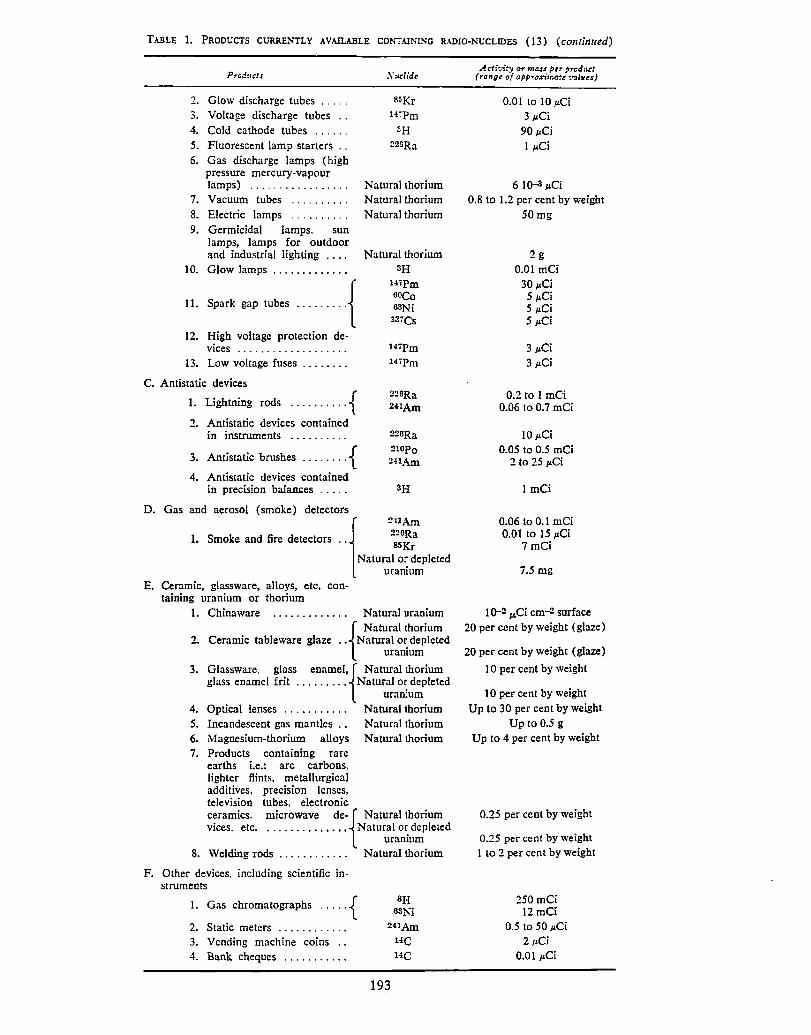
TABLE 1. PRODUCTS CURRE.'ITLY AVAILABLE CONTAINING RADIO-NUCLIDES (13) (continued)
Prod:1ds
2. Glow discharge tubes 3. Voltage discharge tubes .. 4. Cold cathode tubes ..... . 5. Fluorescent lamp starters .. 6. Gas discharge lamps (high
pressure mercury-vapour lamps) ................ .
7. Vacuum tubes ......... . 8. Electric lamps ......... . 9. Germicidal lamps. sun
lamps, lamps for outdoor and industrial lighting ... .
10. Glow lamps ............ .
11. Spa<k gap '""'' ........ ·{
12. High voltage protection de-vices .................. .
13. Low voltage fuses ....... .
C. Antistatic devices
1. Lightning rods .......... {
2. Antistatic devices contained in instruments ......... .
3. Antistatic bmshes ........ {
4. Antistatic devices contained in precision balances .....
D. Gas and aerosol (smoke) detectors
Xue/id,
22GRa
Natural thorium Natural thorium Natural thorium
Natural thorium 3H
HiPm ooco 63Ni 1arcs
147Pm
147Pm
22BRa 241Am
226Ra
210po 241Am
1. Smoke and fire detectors .. {
2;li: Natural or depleted
uranium E. Ceramic, glassware, alloys, etc. con
taining uranium or thorium 1. Chinaware . . . . . . . . . . . . . Natural uranium
{
Natural thorium 2. Ceramic tableware glaze . . Natural or. depleted
uraruum
3. Glassware. glass enamel,{ Natural thorium glass enamel frit . . . . . . . . . Natural o~ depleted
uran:um 4. Optical lenses . . . . . . . . . . . Natural thorium 5. Incandescent gas mantles . . Natural thorium 6. Magnesium-thorium alloys Natural thorium 7. Products containing rare
earths i.e.: arc carbons. lighter flints, metallurgical additives, precision lenses, television tubes. electronic ceramics, microwave de-{ Natural thorium vices, etc. . . . . . . . . . . • . . • Natural o~ depleted
uraruum 8. Welding rods . . . . . . . . . . . . Natural thorium
F. Other devices, including scientific in-struments
1. Gas chroma to graphs ..... {
2. Static meters ........... . 3. Vending machine coins .. 4. Bank cheques .......... .
241Am
uc
193
A cti-:,-i!:,, or mass f>tr prcdioct (range o; appro.rima:e :•a/uts)
0.01 to 10 ,u.Ci 3 ,u.Ci
90,u.Ci 1 ,u.Ci
6 lQ-3 µCi
0.8 to 1.2 per cent by weight 50mg
2g 0.01 mCi
30,u.Ci 5,u.Ci 5 µCi 5 ,u.Ci
3 ,u.Ci 3,u.Ci
0.2 to 1 mCi 0.06 to 0.7 mCi
10,u.Ci 0.05 to 0.5 mCi
2 to 25 ,.ci
1 mCi
0.06 to 0.1 mCi 0.01 to 15 ,u.Ci
7mCi
7.5 mg
10-2 µ.Ci cm-2 surface 20 per cent by weight (glaze)
20 per cent by weight (glaze)
10 per cent by weight
10 per cent by weight Up to 30 per cent by weight
Upto0.5g Up to 4 per cent by weight
0.25 per cent by weight
0.25 per cent by weight 1 to 2 per cent by weight
250 mCi 12mCi
0.5 to 50 µCi 2,u.Ci
0.01 ,u.Ci

TABLE 2. ESTIMATED ANNUAL GENETICALLY-SIGNIFICANT DOSES (GSD) FROM RADIUM IN SELF-LUMIKOUS WATCHES
Estimated annual GSD
Cou11try Year (,r.r<>d) Reference
Denmark 1961 1.2 34 Switzerland ........... . 1960 3.3 25 Federal Republic of Germany ......... . 1959 2.6 51 Federal Republic of Germany .......... . 1961 1.5 52
United Kingdom ..................... . 1960 0.5-1.0 35 Sweden ............................. . 1960 1-3 31
TABLE 3. EsTlMATED AVERAGE ANNUAL DOSE FROM COLOUR TELEVISION SETS, BASED UPOK THE WASHINGTON, D.C., SURVEY (40)
Organ
Skin
Thyroid ......................... · · ·. · · · · · · Male gonads .............................. . Female gonads ............................ . Lens of eye .............................. .
194
C/,ildrcn less than 15 years of agt
(mrad)
3.6 2.6 1.5 0.4 3.0
People 15 yea,, of age and older
(mrad)
1.6 0.9 0.7 0.2 1.3
REFERENCES
1. Becker, S. An investigation of x radiation from color television receivers in Suffolk County, New York. Rad. Health Data and Reports 11: 179-182 (1970).
2. Becker. S. Results of a follow-up radiation survey on color television sets, Suffolk County, New York. Rad. Health Data and Reports 12: 457-458 (1971 ).
3. Beninson, D., A. Placer and E. Vander Elst. Estudio de un caso de irradiaci6n humana accidental, p. 415-429 in Handling of Radiation Accidents. IAEA publication STI/PUB/229. Vienna, 1969.
4. Boggs, R. R.. G. D. Schmidt and R. D. Williams. Radiological health aspects of spent radon seeds. Rad. Health Data and Reports 10: 185-190 (1969).
5. Breslin, A. J. and W. B. Harris. Use of thoriated tungsten electrodes in inert gas shielded arc welding. Investigation of potential hazard. Amer. Ind. Hyg. Ann. Quart. 13: 4 (1952).
6. Bunce, L. A. and F. W. Sattler. Radon-222 in natural gas. Rad. Health Data and Reports 7: 441-444 (1966).
7. Ciuciura, A. An engineer's view of x radiation from television receivers. Paper No. 12 presented at the International symposium on radiological protection problems associated with parasitic x-ray emission from electronic products. Toulouse, November 3-6, 1970.
8. Conlon, F. B. Radium incident report. Reported during 7/01/1968-12/31/1969, United States Department of Health, Education, and Welfare (Unpublished).
9. Commonwealth of Puerto Rico, Department of Health. Results of a survey of x radiation from color television receivers in the metropolitan area of San Juan, Puerto Rico, 1969-1970. Rad. Health Data and Reports 12: 547-551 (1971).
10. Das Gupta, A. M. and K. R. Fujimoto. Radiation hazard assessment of privately owned colour television receivers in Canada, p. 221-230 in Electronic product radiation and the health physicist. United States Department of Health, Education, and Welfare report BRH/DEP 70-26. Rockville, Md., 1970.
11. Dominick, D. D. Statement before the Joint Committee on Atomic Energy, United States Congress, October 28, 1971, in Use of Uranium Mill Tailings for Construction Purposes. Washington, 1971.
12. Eikodd. A., A. Reistad, A. Storruste et al. Radioactivity of luminous watches and estimation of dose to the wrist and the gonads. Physics in Medicine and Biology 6: 25-31 (1961).
13. European Nuclear Energy Agency-Basic approach for safety analysis and control of products containing radionuclides and available to the general public. A guide prepared by an ENEA expert group (1970).
14. Hamilton, E. I. The relative radioactivity of building materials. Amer. Ind. Hyg. Ass. J. 32: 398-403 (1971).
15. Hamilton, L. D. The medical use of isotopes: patient's point of view. Presented at the Radioisotope systems of heart devices symposium of the American Nuclear Society (1971).
16. Harris, J. Y. Electronic product inventory study. United States Department of Health. Education, and Welfare report BRH/DEP 70-29. Rockville, Md., 1970.
17. Howland, J. W .. M. Ingram, H. Mermagen et al. The Lockport incident: Accidental partial body exposure of humans to large doses of x-irradiation, p. 11-26 in Diagnosis and Treatment of Acute Radiation Injury, WHO, Geneva, 1961.
18. International Atomic Energy Agency-Radiation protection standards for radioluminous timepieces. Recommendations of the European Nuclear Energy Agency and the International Atomic Energy Agency. IAEA publication STI/PVB/167, IAEA, Vienna, 1967.
19. International Atomic Energy Agency-Handling of radiation accidents. IAEA publication STI/ PUB/229, Vienna, 1969.
20. International Commission on Radiological Protection. Recommendations of the International Commission on Radiological Protection. Report of Committee III. ICRP publication 3, Pergamon Press, 1960.
21. International Commission on Radiological Protection. Radiation protection in schools for pupils up to the age of 18 years. A report by Committee Ill of the International Commission on Radiological Protection adopted by the Commission in May 1968. ICRP publication 13, Pergamon Press, 1970.
195
22. International Commission on Radiological Protection. Protection against ionizing radiation from external sources. A report of ICRP Committee Ill. Adopted by the Commission in November 1969. ICRP publication 15, Pergamon Press, 1970.
23. International symposium on radiological protection problems associated with parasitic x-ray emission from electronic products. Toulouse, November 3-6, 1970.
24. Jacobs, D. G., C. J. Barton. C. R Bowman et al. Theoretical evaluation of consumer products from project Gasbuggy. Final report. phase I: Impact of hypothetical releases of contaminated gas in the San Juan basin. Oak Ridge National Laboratory report ORNL-4646 (1971).
25. Joyet, G. and M. Miller. The radiation dose from luminous dials in Switzerland. Experientia 16: 342-346 (1960).

26. Kaufman, S. L.. M. C. Colvin, R. Liebennann et al. Investigation of tritiated luminous compounds. Environmental Protection Agency report EERL 71-2. Rockville. !\1d.. 1971.
27. Klein, H. F., E.W. Robinson, R. L. Gragg et al. Evaluation of emissions from radium dial watches. Rad. Health Data and Reports 11: 7-9 (1970).
28. Lane, R. A. Color television survey in Pennsylvania. Rad. Health Data and Reports 12: 137-138 (1971).
29. Langham, W. H. Plutonium distribution as a problem in environmental science, p. 3-11 in Proceedings of Environmental Plutonium Symposium held at LASL; August 4-5, 1971. Los Alamos Scientific Laboratory report LA-4756 (1971).
30. Lindell, B. and P. Reizenstein. A Swedish building material for low-radioactivity laboratories. Ark. Fysik 26: 65-74 (1964).
31. Lindell, B. and P. A. Wiberg. The radioactivity of watches (I 964): v. United Nations document A/ AC.82/G/L.940.
32. Lowder, W. M., A. C. George, C. V. Gogolak et al. Indoor radon daughter and radiation measurements in East Tennessee and Central Florida. Unpublished.
33. Martinez, G. R., H. G. Cassab, G. G. Ganem et al. Observaciones sobre la exposici6n accidental de una familia a una fuente de cobalt-60. Revista Medical del I.M.S.S., Vol. 3, Sup. 1 (1964).
34. McCarthy, R. and V. Mejdahl. The genetically significant dose from luminous wrist watches. Physics in Medicine and Biology 8: 279-285 (1963).
35. Medical Research Council. The hazards to man of nuclear and allied radiation. Her Majesty's Stationary Office, London, 1960.
36. Menczer, L. F. Radioactive ceramic glazes. Rad. Health Data 6: 656-658 (1965).
37. Menzel, R. G. Uranium, radium and thorium content in phosphate rocks and their possibl~ radiation hazard. J. Agr. Food Chem. 16: 231-234 (1968).
38. National Center for Radiological Health. A pilot survey of x-radiation emissions from color television receivers in Pinellas County, Florida. Rad. Health Data and Reports 9: 525-530 (1968).
39. National Center for Radiolo!rlcal Health. A summary of the Washington, D.C., metropolitan area survey of colour television receivers. Rad. Health Data and Reports 9: 531-538 (1968).
40. Neill. R. H .. H. D. Youmans and J. L. Wyatt. Estimates of potential doses to various organs from x-radiation emissions from color television picture tubes. Rad. Health Data and Reports 12: 1-6 (1971).
41. O'Riordan, M. C. and P. N. Casbolt. X-rays from domestic colour television receivers in Britain. Nature 228: 420-421 (1970).
42. O'Riordan, M. C. and P. N. Casbolt. X-ray emission from colour television receivers: British exp_erience. Paper No. 19 presented at the International symposium on radiological protection problems associated with parasitic x-ray emission from electronic products. Toulouse, November 3-6. 1970. .
196
43. Paul. I. R. Control of luminous dial watches in New York City. Rad. Health Data 4: 263-267 (1963).
44. Performance standards for electronic products. Federal Register 34: 20271-20275 (1969).
45. Pettigrew. G. L.. E. W. Robinson and G. D. Schmidt. State and federal control of health hazards from radioactive materials other than materials regulated under the Atomic Energy Act of 1954 (As of October 1, 1969). United States Department of Health. Education. and Welfare report BRH/DMRE 71-4. Rochille. Md .. 1971.
46. Properzio. W. S. Radiation emissions from demonstration type cold-cathode gas discharge tubes, p. 197-213 in Electronic product radiation and the health physicist. United States Department of Health, Education, and Welfare report BRH/ DEP 70-26. Rocb,ilJe, Md., 1971.
47. Rechen, H.J. L., T. R. Lee, R.H. Schneider et al. Measurements of X-ray exposure from a home color television receiver. Rad. Health Data and Reports 8: 687-697 (1967).
48. Robinson, E. W. The use of radium in consumer products. United States Department of Health, Education, and Welfare report MORP 68-5, Rockville, Md., 1968.
49. Schmidt. G. D. Registry of radiation incidents: radioactive materials. The 2nd annual conference on radiation control. United States Department of Health, Education, and Welfare report BRH/ ORO 70-5. Rockville, Md., 1970.
50. Scott, W. G. and J. C. Villforth. Radium usage, control. still medical problem. Your Radiologist, Vol. 8, No. 2 (1965).
51. Seelentag, W. and E. Klatz. Radiation exposure of the public from luminous dials of time pieces. Strahlentberapie llO: 605-621 (1959).
52. Seelentag, W. and H. Schmier. Radiation exposure from luminous watch dials. Rad. Health Data 4: 209-213 (1963).
53. Sheldon, J. L. Progress in the development of x-ray absorbing glasses for television picture tubes. Paper No. 24 presented at the International symposium on radiological protection problems associated with parasitic x-ray emission from electronic products. Toulouse. November 3-6. 1970.
54. Sheldon, J. L.. H. 0. Wood and H. H. Harris. The role of industry in electronic product radiation control. Paper No. 46 presented at the International symposium on radiological protection problems associated with parasitic x-ray emission from electronic products. Toulouse, November 3-6, 1970.
55. Siek, R. D. Statement before the Joint Committee on Atomic Energy. United States Comrress. October 28. 1971. Y;i Use of Uranium Mill Tailings for Construction Purposes. Washington. 1971.
56. Simon, N. and J. Harley. Skin reactions from gold jewelry contaminated with radon deposit. JAMA 200: 245-255 (1967).
57. Spencer, L. W., Jr. Preliminary survey of x-ray producing devices in Kansas schools. 1968. Rad. Health Data and Reports 11: 613-615 (1970).
58. Sutra-Fourcade. Y. L'enercie nucleaire-Accidents et incidents. Rapport du Commissariat a renergie atomique CEA-BIB-164. Saclay. 1969.
59. United Nations. Report of the United Nations Scientific Committee on the Effects of Atomic Radiation. 1962. Official Records of the General Assembly, Seventeenth Session, Supplement No. 16 (A/5216).
60. United States Atomic Energy Commission. A summary of incidents involving USAEC shipments of radioactive material, 1963-64. USAEC Report TID-16764 (Suppl. 2). Washington, 1966.
61. United States Department of Health, Education, and Welfare. Radiation sources in secondary schools. Report of a limited survey. USDHEW report ORO 69-5. Rockville, Md., 1969.
62. United States Department of Health, Education, and Welfare. 1970 Annual Report: Administration of the Radiation Control for Health and Safety Act of 1968, Public Law 90-602 (1971).
197
63. Vennart, J. The usage of radioactive luminous compound and the need for biological monitorin2 of workers. Health Phys. 13: 959-964 (1967). -
64. Wollenberg. H. A. and A. R. Smith. Radioactivity of cement raw materials. University of California report UCRL-16878 (1966).
65. Wruble. D. T., V. E. Andrews and G. A. Bovsen. Environmental tritium surveillance for pr.oject Rulison. Paper presented at the Tritium Symposium. Las Vegas, Nevada, August 30-September 2, 1971.
66. X-Radiation Ad Hoe Committee. Electronic Industries Association, Evaluation of TV contribution to the annual genetically significant radiation dose of the population. IEEE Transactions on Broadcast and Television Receivers, BTR-16: 157-164 (1970).
HOW TO OBTAIN UNITED NATIONS PUBLICAllONS
United Nation, publications may be obtained from bookstores and distributors throughout the world, Consult your bookstore or write to, United Nations, Soles Section, New York or Geneva.
COMMENT SE PROCURER LES PUBLICATIONS DES NATIONS UNIES
Les publications des Nations Unies son! en vente dons les librciries et les agences depositoires du monde enlier. lnformez-vous ouprcs de volre librcirie ou cdreuu-vous a: Nations Unies, Section des vcnles, New York ou Genova.
KAK noJIY 1H1Tb l-13AAHl-1R OPfAHl-13AUl-11-1 06bEM1HEHHblX HAUl-1'1
lla"anna Oprannaa-qnn 06'Le"nne11nL1I Ha11nit llO:tmo NJUIITI, D 1<1111:Ji1tL1I l1ara3m1ax n arcurcTDax no nccx pa1iomu )!Hpa. Hano~nre cupa111m 06 na,11.a111rn:r n IJamcll 1mnm110M l!araa11ne nJn mllllnre DO 11,11.pecy: Opraunan~ll 06'Le,1,11nenuLU Hau.ui,, Cei.1111H no npo,1,aa.e na"aunii, HLto-IlopK BJn 3\enena.
COMO CONSEGUIR PUBLICACIONES DE LAS NACIONES UNIDAS
Los publlcocioncs de las Ncciones Unidcs eslcin en ventc en librerlcs y ccsas distribuidorcs en lodos pcrlu del mundo, Contulte a su librero o dirljcse c: Ncciones Unidcs, Section de Ventas, Nuevc York o Ginebrc,
Printed in U.S.A. 11235-August 1972-3,600
Price: SU.S. 7.00 (or equivalent in other currencies) ($U.S. 12.50 for volumes I and II)
United Nations publication Sales No. E.72.IX. l 7