Hyperpolarized 129Xe Magnetic Resonance Imaging of ...
168
Western University Western University Scholarship@Western Scholarship@Western Electronic Thesis and Dissertation Repository 10-16-2015 12:00 AM Hyperpolarized 129Xe Magnetic Resonance Imaging of Radiation- Hyperpolarized 129Xe Magnetic Resonance Imaging of Radiation- Induced Lung Injury Induced Lung Injury Ozkan Doganay, The University of Western Ontario Supervisor: Giles Santyr, The University of Western Ontario A thesis submitted in partial fulfillment of the requirements for the Doctor of Philosophy degree in Medical Biophysics © Ozkan Doganay 2015 Follow this and additional works at: https://ir.lib.uwo.ca/etd Part of the Atomic, Molecular and Optical Physics Commons, Biophysics Commons, Circulatory and Respiratory Physiology Commons, Diagnosis Commons, Medical Biophysics Commons, Nuclear Commons, Respiratory Tract Diseases Commons, and the Therapeutics Commons Recommended Citation Recommended Citation Doganay, Ozkan, "Hyperpolarized 129Xe Magnetic Resonance Imaging of Radiation-Induced Lung Injury" (2015). Electronic Thesis and Dissertation Repository. 3297. https://ir.lib.uwo.ca/etd/3297 This Dissertation/Thesis is brought to you for free and open access by Scholarship@Western. It has been accepted for inclusion in Electronic Thesis and Dissertation Repository by an authorized administrator of Scholarship@Western. For more information, please contact [email protected].
-
Upload
khangminh22 -
Category
Documents
-
view
2 -
download
0
Transcript of Hyperpolarized 129Xe Magnetic Resonance Imaging of ...

Western University Western University
Scholarship@Western Scholarship@Western
Electronic Thesis and Dissertation Repository
10-16-2015 12:00 AM
Hyperpolarized 129Xe Magnetic Resonance Imaging of Radiation-Hyperpolarized 129Xe Magnetic Resonance Imaging of Radiation-
Induced Lung Injury Induced Lung Injury
Ozkan Doganay, The University of Western Ontario
Supervisor: Giles Santyr, The University of Western Ontario
A thesis submitted in partial fulfillment of the requirements for the Doctor of Philosophy degree
in Medical Biophysics
© Ozkan Doganay 2015
Follow this and additional works at: https://ir.lib.uwo.ca/etd
Part of the Atomic, Molecular and Optical Physics Commons, Biophysics Commons, Circulatory and
Respiratory Physiology Commons, Diagnosis Commons, Medical Biophysics Commons, Nuclear
Commons, Respiratory Tract Diseases Commons, and the Therapeutics Commons
Recommended Citation Recommended Citation Doganay, Ozkan, "Hyperpolarized 129Xe Magnetic Resonance Imaging of Radiation-Induced Lung Injury" (2015). Electronic Thesis and Dissertation Repository. 3297. https://ir.lib.uwo.ca/etd/3297
This Dissertation/Thesis is brought to you for free and open access by Scholarship@Western. It has been accepted for inclusion in Electronic Thesis and Dissertation Repository by an authorized administrator of Scholarship@Western. For more information, please contact [email protected].

Hyperpolarized 129Xe Magnetic Resonance Imaging of Radiation-Induced Lung Injury
Thesis format: Integrated Article
by
Ozkan Doganay
Graduate Program in Medical Biophysics
A thesis submitted in partial fulfillment
of the requirements for the degree of
Doctor of Philosophy
The School of Graduate and Postdoctoral Studies
The University of Western Ontario
London, Ontario, Canada
© Ozkan Doganay 2015
ii
Abstract
Lung cancer is the largest contributor to cancer-related mortality worldwide. Only 20% of
stage III non-small cell lung cancer patients survive after 5-years post radiation therapy
(RT). Although RT is an important treatment modality for lung cancer, it is limited by
Radiation-Induced Lung Injury (RILI). RILI develops in two phases: (i) the early phase
(days-weeks) referred to radiation pneumonitis (RP), and (ii) the late phase (months). There
is a strong interest in early detection of RP using imaging to improve outcomes of RT for
lung cancer. This thesis describes a promising approach based on 129Xe gas as a contrast
agent for Magnetic Resonance Imaging (MRI) of the lung airspace due to the large increase
in signal possible by spin exchange optical pumping, or hyperpolarization (Hp).
Additionally, 129Xe provides unique functional information due to its relatively high
solubility and significant chemical shift in pulmonary tissue (PT) and red blood cell (RBC)
compartments. In this thesis, a specialized Hp 129Xe MRI method was developed for
detection of gas exchange abnormalities in the lungs associated with thoracic RT. In
particular, the feasibility of quantifying the early phase of RILI is demonstrated in a rat
model of RILI two weeks post-irradiation with a single fraction dose of 18 Gy. The
challenge of low signal-to-noise ratio (SNR) in the dissolved phases was addressed in this
work by development and construction of a Transmit-Only/Receive-Only radiofrequency
coil. Another challenge addressed in the thesis was the lack of imaging techniques that
provide sufficient spatial and temporal information for gas exchange. Therefore, a novel
Hp 129Xe MRI technique was developed based on the multi-point IDEAL pulse sequence.
The combination of these two developments enabled investigation of regional gas
exchange changes associated with RP in the rat lung two weeks post-irradiation to assess
the feasibility of early detection of RILI. Theoretical analysis of the gas exchange curves
enabled measurements of average PT thickness (LPT) increases consistent with histology
and relative blood volume (VRBC) reductions in the irradiated animal cohort compared to a
non-irradiated cohort, and between irradiated right lungs compared to unirradiated left
lungs in the irradiated cohort.
Keywords
Radiation-induced lung injury, pneumonitis, Hyperpolarized 129Xe, MRI, lung imaging,
IDEAL, dissolved xenon, pulmonary tissue, red blood cell, gas exchange, spiral, point
spread function, rat, radiofrequency coil.
iii
Co-Authorship Statement
This thesis is based on work published in the following three manuscripts:
(1) Ozkan Doganay, Kundan Thind, Trevor Wade, Alexei Ouriadov, Giles E. Santyr,
Transmit-only/receive-only radiofrequency coil configuration for hyperpolarized 129Xe
MRI of rat lungs, Concepts in Magnetic Resonance Part B: Magnetic Resonance
Engineering 2015, DOI: 10.1002/cmr.b.21288.
For this manuscript, Ozkan Doganay was responsible for optimizing the sensitivity using
the numerical COMSOL simulations as well as building both transmit and receive coils
and corresponding electronic circuits, bench top measurements, experimental data
acquisition and analysis of data including MATLAB coding. Dr. Kundan Thind provided
meaningful discussion. Dr. Trevor Wade and Dr. Alexei Ouriadov helped with MRI
calibration experiments and in vivo imaging. Dr. Giles Santyr provided guidance
throughout the project and assistance with the manuscript preparation. Additionally, Elaine
Hegarty helped with animal preparation and Krzysztof Wawrzyn helped with Hp 129Xe gas
production.
(2) Ozkan Doganay, Trevor Wade, Elaine Hegarty, Charles McKenzie, Rolf F. Schulte,
Giles E. Santyr, Hyperpolarized Xenon-129 MR imaging of the rat lung using spiral
IDEAL, Magnetic Resonance in Medicine 2015, DOI 10.1002/mrm.25911.
For this manuscript, Ozkan Doganay was responsible for the theoretical analysis and
derivation of the corresponding equations as well as design and optimization of spiral
trajectories and corresponding gradient waveforms, experiment design, data acquisition

iv
and analysis of data, including MATLAB coding. Dr. Trevor Wade, Dr. Charles McKenzie
and Dr. Rolf F. Schulte provided meaningful discussion. Additionally, Elaine Hegarty
assisted with animal preparation, Andrew Wheatley and Krzysztof Wawrzyn helped with
Hp 129Xe gas production. Dr. Giles Santyr provided guidance throughout the project and
assistance with the manuscript preparation.
(3) Ozkan Doganay, Elaine Stirrat, Charles McKenzie, Rolf F. Schulte, Giles E. Santyr,
Quantification of Regional Gas Exchange Changes using Hyperpolarized 129Xe MRI in a
Rat Model of Early Stage Radiation-induced Lung Injury, Medical Physics 2015 (in
Revision).
For this manuscript, Ozkan Doganay was responsible for experiment design including
installation and optimization of the insert gradient and RF coils, experimental data
acquisition, and analysis of data including post-processing with MATLAB and
segmentation. Elaine Stirrat assisted with animal preparation and performing histological
preparation and interpretation. Dr. Charles McKenzie and Dr. Rolf F. Schulte provided
meaningful discussion. Dr. Giles Santyr provided guidance throughout the project and
assistance with the manuscript preparation.

v
Acknowledgments
I would like to gratefully acknowledge Dr. Giles Santyr for giving me the opportunity to
conduct this research in his group. His supervision provided me a well-rounded educational
experience. Although he moved to another institution mid-way through my PhD study, he
was always available any time I needed support. I thank him for his expertise, guidance,
encouragement, and patience throughout my research.
I also would like to thank the following people:
All of my fellow colleagues and past/present members of the Santyr lab. Specifically,
Elaine Hegarty for assisting me with animal preparation and performing tissue histology,
and Krzysztof Wawrzyn for the help with polarizing gas for my experiments as well as Dr.
Trevor Wade, Dr. Alexei Ouriadov, and Dr. Kundan Thind.
Dr. Timothy Scholl and his group for assistance with RF coil. Specifically, Yonathan Araya
for his supports, useful discussion related to research and revising my thesis.
Dr. Blaine Chronik, Dr. Carl Kumaradas, Yevgeniy Davletshin for providing access and
useful discussion about Comsol.
Dr. Eugene Wong for contributing towards the rat irradiations.
My advisory committee, Dr. Paula J. Foster and Dr. Robert Bartha, for guidance and
support throughout my graduate work.
Dr. Maria Drangova for giving me an RA position in her lab and her staff particularly Drs
Junmin Liu and Ali Tavallaei for teaching me how to do image segmentation and for useful
discussion related to research.
Finally, I would like to thank my wife for supporting me throughout my PhD. My
wonderful babies: Batuhan and Berkay have hard time to understand the reason I have to
go work on the weekends instead of playing games with them. I hope that one day they can
read this thesis and understand why I had to go work on vacations. My wife has done a
tremendous job keeping my sons happy and healthy while I am writing this thesis. I
dedicated this thesis to my lovely wife and my sons.

vi
Table of Contents
Abstract ............................................................................................................................... ii
Co-Authorship Statement................................................................................................... iii
Acknowledgments............................................................................................................... v
Table of Contents ............................................................................................................... vi
List of Tables ....................................................................................................................... i
List of Figures ..................................................................................................................... ii
List of Appendices .............................................................................................................. v
List of Abbreviations and Symbols.................................................................................... vi
Chapter 1 : Introduction .................................................................................................... 1
1.1 Overview and Motivation ....................................................................................... 1
1.2 Healthy Lung Physiology ....................................................................................... 3
1.3 Lung Cancer ............................................................................................................ 4
1.4 Advances in Treatment of Lung Cancer ................................................................. 5
1.5 Radiation Therapy ................................................................................................... 6
1.6 Radiation-Induced Lung Injury (RILI) ................................................................... 7
1.7 Diagnosis of Radiation-Induced Lung Injury ......................................................... 8
Pulmonary Function Tests .......................................................................... 9
Chest Radiography / Computed Tomography ............................................ 9
SPECT....................................................................................................... 10
PET ........................................................................................................... 11
Magnetic Resonance Imaging Methods .................................................... 12
Hyperpolarized MRI ................................................................................. 13
Hp 129Xe MR Spectroscopy ...................................................................... 14

vii
Hp 129Xe Dissolved Phase imaging........................................................... 16
1.8 Principles of MRI .................................................................................................. 17
Magnetic Moment in the Presence of a Magnetic Field ........................... 17
Conventional MR Magnetization .............................................................. 18
Hyperpolarized MR Magnetization .......................................................... 22
Hyperpolarized 129Xe Gas Production ...................................................... 22
Chemical Shift .......................................................................................... 25
RF Pulse .................................................................................................... 26
MR Signal ................................................................................................. 27
RF Coils .................................................................................................... 29
Spatial Localization of the MRI Signal .................................................... 30
1D Gradient Echo ..................................................................................... 32
2D Cartesian k-space Sampling ................................................................ 33
Spiral k-space Sampling ........................................................................... 35
IDEAL Approach for Imaging Chemical Species .................................... 37
Gas Exchange Models of Hyperpolarized 129Xe ....................................... 39
1.9 Thesis Hypothesis and Objectives ........................................................................ 41
1.10 Thesis Outline ....................................................................................................... 41
1.11 References ............................................................................................................. 43
Chapter 2 : RF Coil Configuration for Hyperpolarized 129Xe ......................................... 53
2.1 Introduction ........................................................................................................... 53
2.2 Methods................................................................................................................. 55
Numerical Modeling ................................................................................. 58
Experimental measurements ..................................................................... 60
2.3 Results ................................................................................................................... 62

viii
2.4 Discussion ............................................................................................................. 67
2.5 Conclusion ............................................................................................................ 70
2.6 References ............................................................................................................. 71
Chapter 3 : Hyperpolarized Dissolved 129Xe MRI of the Rat Lung ............................... 75
3.1 Introduction ........................................................................................................... 75
3.2 Theory ................................................................................................................... 78
Point Spread Function (PSF) Analysis ..................................................... 78
Spiral Gradient Waveform Design............................................................ 80
Optimization of Echo-Time spacing ......................................................... 80
Calibration of Flip Angles ........................................................................ 81
3.3 Methods................................................................................................................. 82
Phantom MRI Experiments....................................................................... 82
In vivo MRI experiments .......................................................................... 83
RF pulse calibration .................................................................................. 85
3.4 Results ................................................................................................................... 86
3.5 Discussion ............................................................................................................. 94
3.6 Conclusion ............................................................................................................ 98
3.7 Reference ............................................................................................................ 100
Chapter 4 : Early Detection of RILI using 129Xe Gas Exchange................................... 104
4.1 Introduction ......................................................................................................... 104
4.2 Methods............................................................................................................... 108
Animal Irradiation ................................................................................... 108
MR Image Acquisition and Analysis: ..................................................... 109
Histology ................................................................................................. 111
Gas Exchange Curve Analysis ................................................................ 112
ix
Statistical Analysis .................................................................................. 112
4.3 Results ................................................................................................................. 113
4.4 Discussion ........................................................................................................... 120
4.5 Conclusion .......................................................................................................... 125
4.6 References ........................................................................................................... 126
Chapter 5 : Thesis Discussion and Future Work ........................................................... 132
5.1 Thesis Discussion................................................................................................ 132
5.2 SNR Improvement .............................................................................................. 133
5.3 Early Detection of RILI in a Rat Model ............................................................. 134
5.4 Analysis of Gas Exchange Curves ...................................................................... 136
5.5 Future Work ........................................................................................................ 137
5.6 Thesis Summary.................................................................................................. 139
5.7 References ........................................................................................................... 141
List of Tables
Table 2.1: Network analyzer measurement of the electrical properties of the TO/RO coil in
receive mode and transmit mode respectively and the commercial T/R birdcage coil
configurations. .................................................................................................................. 62
Table 2.2: Comparison of SNR measured in the thermally-polarized gas phantom using the
TO/RO and commercial T/R birdcage coil configurations respectively. ......................... 63
Table 2.3: Experimental and Simulated Axial Percentage B1- ROI Uniformity (U) for the
Hyperpolarized Gas Phantom for both TO/RO and Commercial T/R Birdcage Coil
Configurations [as shown in Fig. 2.4(b)]. ......................................................................... 64
Table 4.1: Summary of mean PT thickness (LPT) and relative blood volume (VRBC)
calculated for all rats for both left and right lungs. ......................................................... 117
ii
List of Figures
Figure 1.1: Sketch of human lungs and alveoli. .................................................................. 4
Figure 1.2: MR spectrum of rat lungs after inhaling Hp 129Xe. ........................................ 15
Figure 1.3: Bulk magnetization vector of a spin population in the external magnetic field.
........................................................................................................................................... 19
Figure 1.4: Zeeman energy levels at thermal equilibrium and in the hyperpolarized state.
........................................................................................................................................... 21
Figure 1.5: Spin exchange optical pumping (SEOP) and spin exchange interaction. ...... 24
Figure 1.6: Full width at half-maximum (FWHM) and amplitude of a point spread function.
........................................................................................................................................... 32
Figure 1.7: 1D gradient echo timing diagram. .................................................................. 33
Figure 1.8: 2D Gradient echo pulse sequence timing diagram and Cartesian k-space
sampling trajectory............................................................................................................ 34
Figure 1.9: Coronal 2D MR FGRE gas phase image of in vivo rat lung. ......................... 35
Figure 1.10: Single-shot spiral pulse sequence timing diagram and the k-space sampling
trajectory. .......................................................................................................................... 36
Figure 1.11: A representative gas exchange curve and geometry of the Mansson’s gas
exchange model. ............................................................................................................... 40
Figure 2.1: Schematic view of the TO/RO configuration, simplified circuit diagram of
transmit coil and saddle-shaped, receive surface coil. ...................................................... 56
Figure 2.2: Plot of theoretical B1- for the receive coil at aperture angles of 100o, 120o, and
140o, respectively. ............................................................................................................. 60
iii
Figure 2.3: Schematic of thermal gas phantom and commercial T/R birdcage and TO/RO
coil configurations and corresponding axial images from the phantom. .......................... 65
Figure 2.4: Axial images of hyperpolarized gas phantom and coronal images of rat lungs
using the commercial T/R birdcage and the TO/RO coil configuration. .......................... 66
Figure 2.5: B1 map and the flip angle profile obtained from the TO/RO coil. ................. 67
Figure 3.1: Pulse sequence timing diagram for the spiral acquisition of a single echo. ... 79
Figure 3.2: Theoretical spatial resolution and normalized SNRN as a function of Tread / T2*
spiral k-space trajectories. ................................................................................................. 87
Figure 3.3: A surface plot of Tread as a function of both maximum gradient amplitude and
gradient slew rate and the read-out time as a function of resolution. ............................... 88
Figure 3.4: The NSA as a function of ΔTE for 3-point IDEAL and 4-point IDEAL. ...... 89
Figure 3.5: Experimentally measured gas and pulmonary tissue signals as a function of
image number.................................................................................................................... 90
Figure 3.6: Theoretical SNRG and SNRPT as a function of αG. ......................................... 92
Figure 3.7: Coronal gas and PT images of a representative rat lung obtained using the three-
point spiral IDEAL approach. ........................................................................................... 93
Figure 3.8: Coronal gas, PT, and RBC images obtained using the four-point spiral IDEAL
approach. ........................................................................................................................... 93
Figure 3.9: Mean signals measured from all rats for PT and RBC images as a function of
TR values. ......................................................................................................................... 94
Figure 4.1: Representative coronal gas, PT, and RBC images from an irradiated animal
obtained using three-point IDEAL.................................................................................. 114
Figure 4.2: Mean gas transfer curves and corresponding fits. ........................................ 115

iv
Figure 4.3: Scatter plots of calculated LPT and VRBC values for all animals. ................... 116
Figure 4.4: Binarized histology images of a non-irradiated and an irradiated rat lung. . 119

v
List of Appendices
Appendix A: Calculation of PSF Spiral 142
Appendix B: Calculation of PSF Cartesian 144
Appendix C: Dissolved Phase Signal Following Multiple Pulses 145
Appendix D: Animal protocol approval letter 147
Appendix E: Curriculum Vitae 148

vi
List of Abbreviations and Symbols
129Xe Xenon-129 13C Carbon-13
ADC Apparent Diffusion Coefficient
B0 Main static magnetic field
B1 Intensity of magnetic field of applied RF pulse
B1- Receive RF field obtained by the receive coil
B1+ Transmit RF field created by the transmit coil
CSSR Chemical Shift Saturation Recovery
CT Computed Tomography
FGRE Fast Gradient Recalled Echo
FID Free Induction Decay
FOV Field Of View
Gy Gray
Hp Hyperpolarized
IDEAL Iterative Decomposition of water and fat with Echo Asymmetry and Least
squares estimation
LC Capillary average thickness
LPT Pulmonary tissue average thickness
M0 Equilibrium magnetization
MR Magnetic Resonance
MRI Magnetic Resonance Imaging
Mxy Transverse magnetization
Mz Longitudinal magnetization
NMR Nuclear Magnetic Resonance
NSCLC Non-Small Cell Lung Carcinoma
PET Positron Emission Tomography
PFTs Pulmonary Function Tests
PSF Point Spread Function
PT Pulmonary Tissue
PTA Percent Tissue Area
RBC Red Blood Cell
RF Radiofrequency
RILI Radiation-Induced Lung Injury
ROI Region of interest
RP Radiation Pneumonitis
RT Radiation Therapy
SBRT Stereotactic Body Radiotherapy
SCLC Small Cell Lung Carcinoma
SPECT Single-Photon Emission Computed Tomography
SRN Signal-to-Noise Ratio
T Tesla
T1 Longitudinal relaxation time
T2 Transverse relaxation time
T2* Apparent transverse relaxation time

vii
TE Echo Time
TO/RO Transmit-Only / Receive-Only
TR Repetition Time
Tread Read-out time
α Flip angle
αG Flip angle (delivered to gas phase of 129Xe)
αPT Flip angle (delivered to dissolved phase of 129Xe in pulmonary tissue)
γ Gyromagnetic ratio
VRBC Relative RBC Volume
ω Carrier frequency of the RF pulse
ω0 Larmor frequency

1
Chapter 1 : Introduction
This chapter is intended to provide the introduction and motivation for the work presented
in chapters 2, 3 and 4. First, an overview of lung physiology, lung cancer, and radiation
induced lung injury (RILI), including the importance of early detection, will be explained.
Furthermore, the advantages and limitations of clinical imaging modalities, are discussed
with respect to lung imaging and RILI. A brief description of the principles of
hyperpolarized (Hp) Magnetic Resonance Imaging (MRI), radiofrequency (RF) coils, and
pulse sequence developments will be given. Finally, the hypothesis and specific objectives
of the thesis project will be presented.
1.1 Overview and Motivation
Lung cancer is the largest contributor to cancer related deaths worldwide due to its low
survival rate. Over 26,000 new lung cancer patients were reported in 2014 within Canada
alone (1). Most cases are diagnosed as non-small cell lung cancer (~85%), for which
radiotherapy (RT) is the most prominent treatment method (2). Although RT is successful
in treating the cancer, there are undesirable consequences to the quality of life of the patient
due to inadvertent injury of the normal lung tissue, known as Radiation-Induced Lung
Injury (RILI). Current methods for assessing the severity of RILI include pulmonary
function tests (PFTs), computed tomography (CT), single-photon emission computed
tomography (SPECT), and positron emission tomography (PET). Although great advances

2
in these fields have been made, there is still a need for a non-ionizing imaging technique
to assess regional functional (e.g. gas exchange) changes associated with RILI.
Novel Hp MRI techniques have been shown to be more sensitive to the early phase of RILI
than other clinical imaging modalities and PFTs (3). Particularly, there is a strong interest
in using Hp 129Xe gas as a contrast agent for MRI of lung due to the large increase in signal
possible by spin exchange optical pumping (factor up to 100,000), known as
hyperpolarization. Hp 129Xe has many applications in imaging of the lung airspace and in
diagnosis of lung diseases, including chronic obstructive pulmonary disease, and asthma.
In addition to imaging the lung airspace, 129Xe promises to provide unique functional
information due to its relatively high solubility and significant chemical shift in pulmonary
tissue (PT) and red blood cell (RBC) compartments. Additionally, dynamic Hp 129Xe MR
spectroscopy has been shown to be sensitive in detection of RILI in a rat model as early as
two weeks post-irradiation (4). The research described in this thesis is directed mainly to
the development of hyperpolarized MR diagnostic tools and investigation of a pre-clinical
models of RILI.
In this thesis, a novel Hp 129Xe MRI technique of the dissolved phases (i.e. PT and RBC)
is described and the feasibility of quantifying the early phase of RILI in a rat model two
weeks post-irradiation is shown. Low Signal-to-Noise Ratio (SNR) was the largest
limitation for imaging dissolved phases of Hp 129Xe in the PT and RBC, therefore, a
Transmit-Only/Receive-Only (TO/RO) RF coil is developed and constructed to increase
the sensitivity. Another challenge of imaging the dissolved phases of 129Xe, was the lack
of fast imaging techniques that provide simultaneous spatial and spectral information to
follow the gas exchange between alveolar air space and PT and RBC. Therefore, a novel

3
rapid MR pulse sequence is developed to image the gas, PT, and RBC compartments,
including temporal information about the gas exchange. Subsequently, the imaging
approach is used to measure regional gas exchange changes in rat lung at two weeks post-
irradiation using a single fraction dose of 18 Gy to assess the feasibility of early detection
of RILI.
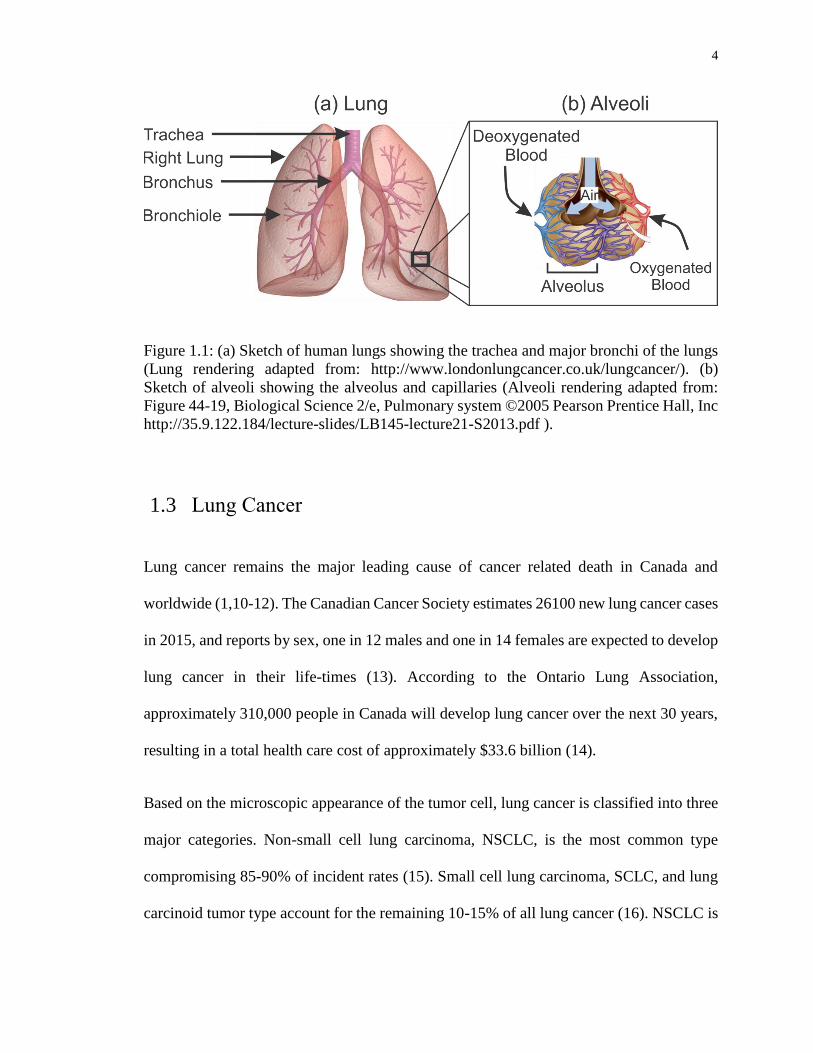
1.2 Healthy Lung Physiology
The lungs are the respiratory organ responsible for gas exchange, consisting primarily of
(i) airways (trachea, bronchi and terminal airways) and (ii) gas-exchange units known as
alveoli (5) as shown in Figure 1.1. The lung facilitates the gas exchange of oxygen and
carbon dioxide between the bloodstream and air. The lung start with the trachea, which is
composed of cartilage rings and divides into two main bronchi. Each bronchus sequentially
branches up to 23 bronchioles until the alveoli are reached. Inhaled air travels through the
trachea into the bronchi and finally into the alveoli, respectively. Human lungs have three
right lobes and two left lobes, while rat lungs consist of four right lobes and one left lobe
(6). Human lungs contain a collection of alveoli in the range of 400 to 500 million (7,8).
The alveolus is the smallest subunit of the lungs, which facilitates the site of the gas
exchange, encompassing a total gas exchange surface are of approximately 130 m2 (9).
Oxygen in the alveolus air sac diffuses into PT and finally into RBCs in the surrounding
capillaries. Then, oxygenated blood is carried to the heart via the pulmonary veins. The
total volume of the trachea, bronchi and alveolar air sacs encompasses approximately 80%
of the lungs (i.e. gas space). The remaining 20% (i.e. non-gas space) includes PT and
surrounding capillaries.
4
Figure 1.1: (a) Sketch of human lungs showing the trachea and major bronchi of the lungs
(Lung rendering adapted from: http://www.londonlungcancer.co.uk/lungcancer/). (b)
Sketch of alveoli showing the alveolus and capillaries (Alveoli rendering adapted from:
Figure 44-19, Biological Science 2/e, Pulmonary system ©2005 Pearson Prentice Hall, Inc
http://35.9.122.184/lecture-slides/LB145-lecture21-S2013.pdf ).
1.3 Lung Cancer
Lung cancer remains the major leading cause of cancer related death in Canada and
worldwide (1,10-12). The Canadian Cancer Society estimates 26100 new lung cancer cases
in 2015, and reports by sex, one in 12 males and one in 14 females are expected to develop
lung cancer in their life-times (13). According to the Ontario Lung Association,
approximately 310,000 people in Canada will develop lung cancer over the next 30 years,
resulting in a total health care cost of approximately $33.6 billion (14).
Based on the microscopic appearance of the tumor cell, lung cancer is classified into three
major categories. Non-small cell lung carcinoma, NSCLC, is the most common type
compromising 85-90% of incident rates (15). Small cell lung carcinoma, SCLC, and lung
carcinoid tumor type account for the remaining 10-15% of all lung cancer (16). NSCLC is

5
graded based on three criteria, known as TNM: (i) the size and location of tumor (T primary
tumor), (ii) whether the tumor has spread to lymph nodes (N-regional lymph nodes) and
(iii) tissues inside or outside the chest (M-distant metastasis) (17,18). After the TNM
classification stage, a grouping is assigned using the numerical subset ranging from 0 to 4
to indicate the progressive extent of the malignant cancer (18). Together, the TNM
classification and staging is used to select the most effective course of therapy and estimate
the prognosis (19).
1.4 Advances in Treatment of Lung Cancer
The treatment options for lung cancer include chemotherapy, surgical resection, and RT
(19). Chemotherapy has been the standard care of treatment in the clinic for patients with
NSCLC and stage I-III, yielding a median overall survival of nine to twelve months (20-
23). Platinum-based chemotherapy drugs (Cisplatin, Carboplatin, Oxaliplatin) are
generally used for treatment of NSCLC patients. While the platinum-based chemotherapy
drugs demonstrate substantial benefits for advanced NSCLC, the ideal number of therapy
cycles still remains unclear, resulting in a dramatic change in the quality of life due to side
effects (24).
Recent human trials using epidermal growth factor receptor tyrosine kinase (EGFR-TK)
inhibitors have shown that the median overall survival for lung cancer has increased
significantly, extending up to 30 months (25,26). The EGFR-TK molecular-based targeting
agents (i.e., gefitinib, erlotinib) have been investigated as alternatives to chemotherapy
owing to improved health outcomes while reducing previously observed toxic effects
(27,28). The clinical use of molecular-based therapeutic strategies is limited by the increase

6
in the cost of gene mutation screen tests (Bradbury et al., 2010). EGFR-TK inhibitors have
been primarily restricted to specific patient groups who are female and/or who have no
smoking history (26,28).
Surgical resection is also regarded as a treatment option for 20-30% of NSCLC and SCLC,
particularly for stages I and II (29-31). However, surgical resection often results in pain,
discomfort and decreased quality of life, including significant decline in physical, social
and mental states (30). Surgery with adjuvant chemotherapy approaches have also been
offered to patients with stage I NSCLC to provide additional therapeutic benefits, with a
reported 4% improvement in 5-year survival to 29% (32). Recently, post-operative
radiotherapy for patients with stage I NSCLC, after complete surgical resection with
adjuvant chemotherapy, seems to confer an additional improvement in overall survival
compared to adjuvant chemotherapy alone (33).
1.5 Radiation Therapy
Radiation therapy (RT) plays an important role for lung cancer treatment (19). RT has been
recommended in approximately 75% of patients with NSCLC and 79% of patients with
SCLC by Dalaney et al. in Australia (34) and 61% of all patients with lung cancer by
Tyldesley et al. in Canada (35). However, only 16-43% of patients with SCLC and 40-51%
of patients with NSCLC receive RT in the world (34). This discrepancy may be because
the clinical use of radiation therapy is limited by many confounding factors, such as
different health care policies, availability of RT units, low referral rates and limited
information about toxic effects. However, the growing clinical interest in RT has led to
more prominent guideline recommendations for RT as part of the treatment plan (36).

7
The primary goal of RT is to deliver a high radiation dose to the tumor while minimizing
the damage to surrounding normal tissues. There are two types of radiation dosing
schedules for lung cancer; (i) conventional fractionated radiation and (ii) stereotactic body
radiotherapy (SBRT). Conventional radiation therapy involves the delivery of total dose of
radiation (40-50 Gy) over many (25-30) small fractions within three to five weeks (37).
Usually, these small fractions are administered every day with radiation doses of less than
two Gy per fraction. Neoadjuvant RT followed by surgery has also improved the three-
year survival rate to 45% for Stage III NSCLC (38). SBRT uses a high dose of radiotherapy
to treat small gross tumor volumes (~60 Gy), based on using several radiation beams that
intersect at the site of the tumor. Particularly, SRBT with 3D image guidance allows high
precision with a relatively high fraction (20 Gy per fraction). A growing number of SBRT
studies have demonstrated an improved 2-year survival for medically inoperable NSCLC
patients (39,40). Although RT is mostly used for stage III NSCLC patients (40-66%),
recent studies have also reported improved survival rates of stage IV NSCLC with SBRT
and adjuvant chemotherapy treatment approaches (41). Early-phase toxic effects (i.e. RILI)
are significantly worse for SBRT compared to conventional radiation therapy (19,42),
though overall outcome is improved, for reasons that are not clear.
1.6 Radiation-Induced Lung Injury (RILI)
Irradiation of normal lung tissues during the course of RT results in RILI which includes a
range of complications such as acute toxicities, chronic symptoms, and fibrosis that can all
lead to organ failure. RILI is categorized into two phases: (i) early-phase and (ii) late-phase
depending on the development of clinical symptoms, though one can occur without the
8
other. The early-phase effect, also known as radiation pneumonitis (RP), is an acute
inflammatory response that typically occurs within weeks following RT and is
characterized with symptoms of dry cough and dyspnea (43). According to histopathology,
RP includes extensive vasculature damage as well as tissue thickening (i.e. inflammation),
alveolar edema and macrophage accumulation (44). After conventional RT, the overall
incidence rates of moderate RP ranges from 15-50%, depending on the dose of the
irradiated volume (45,46). While the incidence of severe RP is low, 5-35%, the mortality
rates are high after SBRT (47,48). Vascular injury in the early-phase progresses with an
extensive increase in collagen, which then transforms to fibrosis if the RP is not treated
(49). Late-phase RILI represents collagen deposition and fibrosis after three months
irradiation (43). Although radiation dosing strategies and adjuvant therapies have been
developed to reduce short and long-term complications, RILI remains a significant problem
for RT (50).
1.7 Diagnosis of Radiation-Induced Lung Injury
Monitoring of RP, during the course of RT, would allow for patient specific alterations to
the therapy plan based on the severity of RILI. These alterations may include modification
of radiation dose, or the use of adjuvant therapy, including chemotherapy and radio-
protective and anti-inflammatory drugs (50,51). Detection of RP in its early phase would
also help monitor the effectiveness of radio-protective changes. Minimizing normal tissue
toxic effects after RT can increase the overall patient survival rate and improve the quality
of life (50).

9
Pulmonary Function Tests
Pulmonary function tests (PFTs) are used to assess global lung function using
measurements of forced expiratory volume (FEV), vital capacity, and carbon monoxide
diffusing capacity (DLCO) (52). Changes induced in the lungs by thoracic irradiation are
commonly evaluated by spirometry (53). Thoracic irradiation typically results in a
reduction in the DLCO. However, FEV1 (FEV measured at 1 second) may show
inconsistently an increase or no changes in patients with centrally located lung lesions (54-
56). Additionally, PFT measurements depends on the patients’ breathing efforts and need
to be corrected for anemia (49). Furthermore, changes in whole lung function do not reveal
regional information, limiting the ability of PFTs to resolve regional disease
heterogeneities (57). Consequently, PFT can only detect RILI when a relatively large dose
of 25 Gy is given and only three to six months post irradiation (54).
Chest Radiography / Computed Tomography
Computed tomography (CT) is an imaging modality that detects X-rays taken at different
angles around the body to form cross-sectional images. Clinically, plane film chest X-ray
and CT imaging are commonly utilized to assess RILI based on corresponding changes in
lung density. Irreversible density gain and structural changes detected by X-rays in the
lungs due to RILI occurs mainly in late phase due to the tissue remodeling. CT is capable
of detecting late-phase fibrosis, two-three months following radiation doses of 40 Gy and
above (53,58,59). CT perfusion is a relatively new technique which measure the perfusion
by comparing the density changes in the region of interest during the intravenous injection
of iodinated contrast material (60,61). Recent imaging developments in CT perfusion have

10
shown that perfusion-based imaging techniques are more sensitive to early-phase RILI than
conventional CT (62). Hu et al. reported that CT perfusion was a promising technique for
detection of early-stage RILI after four weeks following a radiation dose of 60-62 Gy.
However, both conventional RT and SBRT use treatment plans that are administered in
two to three weeks, therefore detection of RILI four weeks post-radiation could be too late
to adjust the therapy plan (e.g. radiation fractionation) or use pharmaceuticals (radio-
protectors and anti-inflammatory drugs) (50,63,64).
SPECT
Single photon emission computed tomography (SPECT) is a nuclear imaging modality that
images the distribution of gamma-emitting radionuclides in the body. SPECT is widely
used to map both perfusion and ventilation changes due to RILI (53,65-67). SPECT
ventilation is performed by inhaling radioactive tracers such as radioactive gas (e.g. 81mKr
and 133Xe), particulate aerosols labeled with radioactive compounds (i.e. 99mTc-DTPA) and
ultrafine graphite particles labeled with 99mTc (i.e. Technegas) (68). One of the main
concerns with detecting ventilation defects by means of ventilation SPECT is the
inconsistency in intensity distribution of the radioactive gas when different radioactive
gases are used within the same isogravitational planes (69). Particulate aerosols can diffuse
to the alveolar capillary network and lead to ventilation image distortions. Furthermore,
the clinical use of Technegas has not yet been approved by the US Food and Drug and
Administration (69).
SPECT perfusion is a highly specialized lung perfusion imaging approach largely used in
research settings and capable of assessing the reduction in lung perfusion associated with
11
RILI (70). SPECT perfusion lung imaging is accomplished by intravenous administration
of albumin macroaggregates (MMA) labeled with 99mTc. Using SPECT perfusion imaging,
Marks L.B. et al. demonstrated a 20-30% drop in blood perfusion in RT patients who
received a radiation dose of 15-30 Gy (49). Despite SPECT perfusion imaging being more
sensitive to RILI than CT, correction for attenuation, scatter, is required for quantitative
imaging (71). Downscatter effects, which are caused from simultaneous ventilation and
perfusion imaging using different radiotracers is also required to correct for interactions
between ventilation and perfusion. Quantitative assessment of total blood volume is
difficult since the sensitivity of SPECT scans significantly depends on patient positioning
(69). SPECT is hampered by the poor spatial resolution (10-20 mm for 140 keV gamma
rays from 99mTc) and long scan times (10-30 minutes).
PET
Positron emission tomography (PET) is a radionuclide imaging modality that images the
distribution of intravenously injected positron emitting tracer in the region of interest. PET
utilizes collinear 511 keV gamma rays offering a better spatial resolution (5-10 mm) than
SPECT. PET with [18F] fluorodeoxyglucose (FDG) provides functional information about
metabolic activity due to the accumulation of FDG in inflamed tissue (72). Increased 18F-
FDG activity has been reported and correlated with clinical symptoms of RP in patients
undergoing thoracic radiotherapy (3-12 weeks) receiving radiation doses of as low as 20
Gy (73). Hart et al. showed corelation between RP clinical symtoms and measured 18F-
FDG activity with an accuracy of approximately 50% (73). McCurdy et al. noted a linear
relationship between post-RT 18F-FDG uptake and radiation dose response 1-3 months
12
after RT (74). Although high 18F–FDG uptake corresponded to RP in these studies, the
tumor growth was also associated with enhanced 18F-FDG uptake restricting the sensitivity
to detection of early-phase normal tissue changes (75,76). PET scans are limited by the
lack anatomical references, therefore PET imaging frequently requires another imaging
modality to provide anatomical images for the image registration such as CT (77). Another
limitation with chest X-ray, CT, SPECT and PET are the radiation exposure of 2-3mSv for
a typical ventilation and perfusion study.
Magnetic Resonance Imaging Methods
Conventional MRI provides images depicting the spatial distribution of hydrogen nuclei
(i.e. proton) within water molecules in the body. MRI achieves high sensitivity due to the
high molar concentration of water, which provides excellent soft tissue contrast with high
temporal and spatial resolution without the need for ionizing radiation. However, lung
imaging with MRI presents a challenge. The lungs have a low proton density and therefore
low SNR since the pulmonary tissue (PT) volume comprises only ~ 20% of the total lung
volume. Contrast-enhanced Gd-DTPA MRI techniques can provide perfusion
characteristics of RILI (78). Ogasawara et al. investigated the time course of the contrast
enhancement in the lungs using Gd-DTPA kinetics between irradiated- and non-irradiated
lungs. This study showed altered Gd-DTPA kinetics one-month post irradiation with a
single dose of 40 Gy in eight dogs compared to normal lungs due to a perfusion reduction.
In this study, dynamic Gd-DTPA MRI was significantly affected by long scan times (~3
minutes) that affect the measurement due to blurring from respiratory motion. Gd-DTPA
MRI lung perfusion and volume measurements are difficult to correct for quantitative
13
measurement of perfusion (79). Conventional T2* MRI techniques are sensitive to the
mobility of water molecules and therefore can assess RILI by monitoring changes in
T2*decay (80). A prolongation of the T2
* two-weeks post-irradiation (20 Gy) was observed
in ex vivo rat lungs (80). Zhang et al. have demonstrated in a rabbit model that the apparent
diffusion coefficient (ADC) in tumor lesions decreases 1-5 weeks post-irradiation of the
lungs (81). However, in that study it was difficult to obtain ADC values from the normal
PT due to low SNR and short T2* because of air/tissue magnetic susceptibility differences.
Hyperpolarized MRI
Hyperpolarized (Hp) MRI has the ability to assess the anatomical, functional and metabolic
changes associated with RILI using 3He, 129Xe, and 13C respectively (3). MR spectroscopic
imaging can detect changes due to RILI with intravenous injection of Hp contrast agent
labeled with [1-13C] pyruvate (82). Thind et al. reported the lactate-to-pyruvate signal ratio
(Lac/Pyr) in the irradiated rat lung with a radiation dose of 18.5 Gy was significantly
different from the non-irradiated rat lung two-weeks post irradiation (83). The increase in
the Lac/Pyr ratio was correlated with changes in macrophages density due to RP measured
histologically. The Lac/Pyr measurements were not able to directly measure the anatomical
and functional changes due to RP. Additionally, MR spectroscopic imaging using Hp [1-
13C] pyruvate was challenging due to low tissue concentration, requiring relatively large
voxels.
Hp 3He gas MRI has also been explored to quantify RILI. Hp 3He gas MRI can provide
Apparent Diffusion Coefficient (ADC) maps of lungs with high SNR, temporal and spatial
resolution. The first study of RILI using a rat model has shown a significant increase in
14
ADC values of Hp 3He associated with three months-post irradiation dose of 40 Gy (84).
Increases in the regional lung 3He ADC values have been associated with fibrosis in patient
groups 8-months post-RT (85). Ireland et al. investigated the feasibility of detecting the
ventilation changes in the lungs between pre- and post-RT using Hp 3He gas (86). In this
work, Ireland et al. correlated the degree of emphysema in the lungs using CT and Hp 3He
MRI in regions of RP three-months post-RT. Although Hp 3He gas, particularly ADC,
shows feasibility for detection of fibrosis. Hp 3He gas MRI is restricted to ventilated
regions of the lung since 3He has negligible solubility. Furthermore, 3He is an exceedingly
rare gas with limited abundance and unlikely to develop into a clinical tool. 129Xe on the
other hand is plentiful and has relatively high tissue solubility and chemical shift. Hp 129Xe
diffusion-weighted MR imaging has been used to measure changes in lung morphometric
parameters associated with RILI, specifically the mean airspace chord length (Lm) in a RILI
rat model (87). In this work, Ouriadov et al., measured a decrease in Lm two weeks post-
irradiation with a radiation dose of 18 Gy and successfully correlated the changes to
histology measurement of mean linear intercept.
Hp 129Xe MR Spectroscopy
In addition to lung ventilation imaging, Hp 129Xe solubility properties allow spectroscopy
techniques to be used for the measurement of exchange from the alveolar air space to the
PT and RBC compartments (88,89). There are two dissolved phase peaks relative to gas
signal in MR spectra as shown in Figure 1.2. The largest peak occurs at -6950 Hz
corresponds to Hp 129Xe in the gas phase. The peak at the center of the MR spectrum (0
Hz) (in Figure 1.2) is due to PT which also includes a small and negligible fraction of blood
15
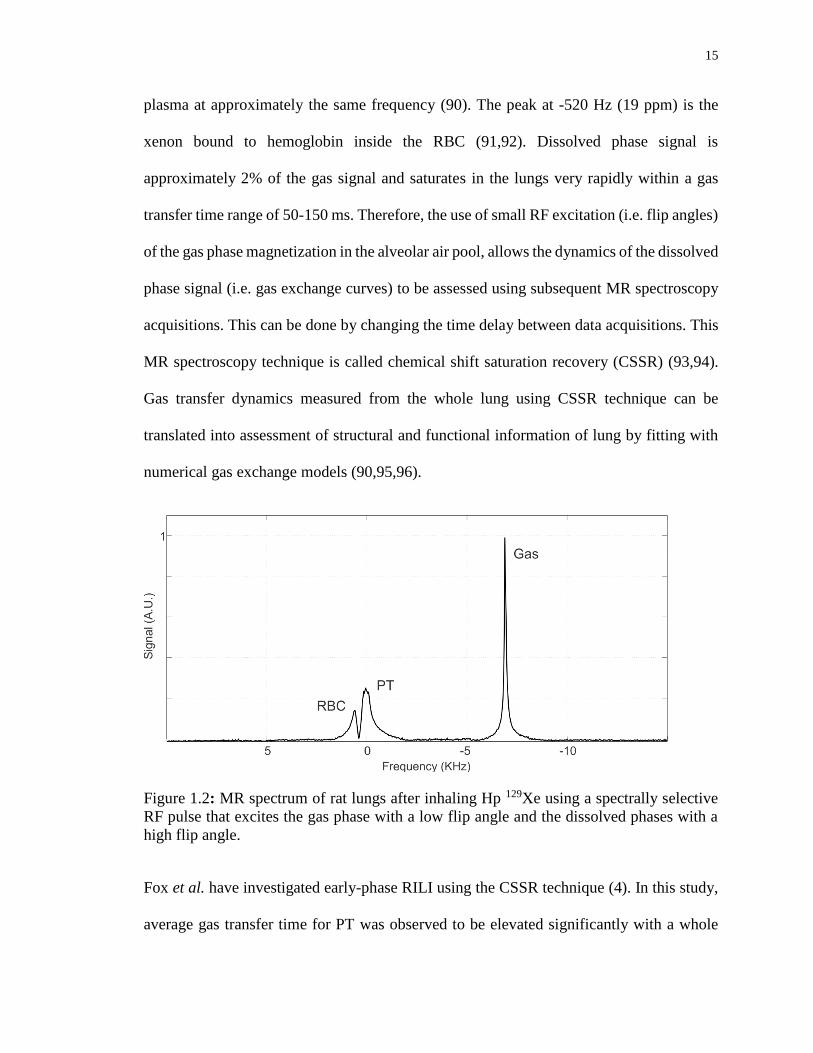
plasma at approximately the same frequency (90). The peak at -520 Hz (19 ppm) is the
xenon bound to hemoglobin inside the RBC (91,92). Dissolved phase signal is
approximately 2% of the gas signal and saturates in the lungs very rapidly within a gas
transfer time range of 50-150 ms. Therefore, the use of small RF excitation (i.e. flip angles)
of the gas phase magnetization in the alveolar air pool, allows the dynamics of the dissolved
phase signal (i.e. gas exchange curves) to be assessed using subsequent MR spectroscopy
acquisitions. This can be done by changing the time delay between data acquisitions. This
MR spectroscopy technique is called chemical shift saturation recovery (CSSR) (93,94).
Gas transfer dynamics measured from the whole lung using CSSR technique can be
translated into assessment of structural and functional information of lung by fitting with
numerical gas exchange models (90,95,96).
Figure 1.2: MR spectrum of rat lungs after inhaling Hp 129Xe using a spectrally selective
RF pulse that excites the gas phase with a low flip angle and the dissolved phases with a
high flip angle.
Fox et al. have investigated early-phase RILI using the CSSR technique (4). In this study,
average gas transfer time for PT was observed to be elevated significantly with a whole

16
lung irradiated rat model two weeks following 16 Gy irradiation compared to a control
group. In this study, correlation between early-phase RILI changes in whole-lung and RBC
gas transfer curve was not significant. This was an unexpected finding as the vascular
network is expected to be affected by RILI, and may have been due to the fact whole lung
CSSR measurement cannot identify regional changes. Saturation of 129Xe in the RBC
compartment is expected to vary regionally and temporally due to perfusion and gas
exchange of 29Xe in RBC within the capillary network. Although the Hp 129Xe gas MR
spectroscopy CSSR technique provides functional information about the global lung
physiology, regional information of the Hp 129Xe gas exchange process is expected to
increase the sensitivity for detection of RILI effects when using partial (or conformal)
radiotherapy.
Hp 129Xe Dissolved Phase imaging
Imaging the dissolved phases of 129Xe (i.e. PT, RBC) has been explored using three-point
Dixon approaches based on Cartesian k-space sampling (97), following a one-point Dixon
approach based on radial k-space sampling fashion to address short T2* (98). Cleveland et
al. extended the one-point Dixon approach to include 3D imaging (99). On the other hand,
Qing et al. also developed a 3D imaging technique using hierarchical IDEAL (Iterative
Decomposition of water and fat with Echo Asymmetry and Least-square estimation)
reducing the breath-hold time down to approximately 11 s (99,100). However, the
dissolved phase imaging techniques have yet to be explored for RILI.

17
1.8 Principles of MRI
The physical phenomenon called nuclear magnetic resonance (NMR) is concerned with the
intrinsic angular momentum (spin) of nuclei that contain unpaired protons or neutron. The
nuclei of 1H in water (and fats) serve as the primary source at the signal in MRI since water
is highly abundant in the body. The source of the NMR signal originates from the
precession of the bulk spin system in the presence of a strong static magnetic field and
subsequently excitation of spins by application of an externally applied radiofrequency
(RF) field. The NMR signal is spatially localized by MR imaging using spatially-varying
magnetic field gradients (i.e. frequency and phase encoding gradients). The type of RF
excitation (i.e. the selection of flip angle); timing in regards to acquisition of data, and data
acquisition (i.e. k-space) trajectory describe the MR pulse sequence strategy. In this
section, basic concepts of MRI are introduced including conventional and Hp MRI relevant
to the thesis. Interested readers are referred to Haacke et al. and Bernstein et al. for more
details (101,102).
Magnetic Moment in the Presence of a Magnetic Field
On closer inspection, a nuclear spin, which has a magnetic moment, µ, experiences a torque
when an external magnetic field, Bo, is applied, resulting in the precession of spins about
the direction of the magnetic field. The precession angular frequency, ω0, is called the
Larmor frequency and given by the following equation:
ω = Bo [1.1]
18
;where γ is the gyromagnetic ratio which is usually expressed as π in SI units of MHz/T.
The gyromagnetic ratio for 129Xe and 1H are -11.78 MHz/T and 42.58 MHz/T respectively.
Thus, the Larmor frequencies for 129Xe and 1H are -35.34 MHz and 127.7 MHz respectively
at a field strength of 3T.
Conventional MR Magnetization
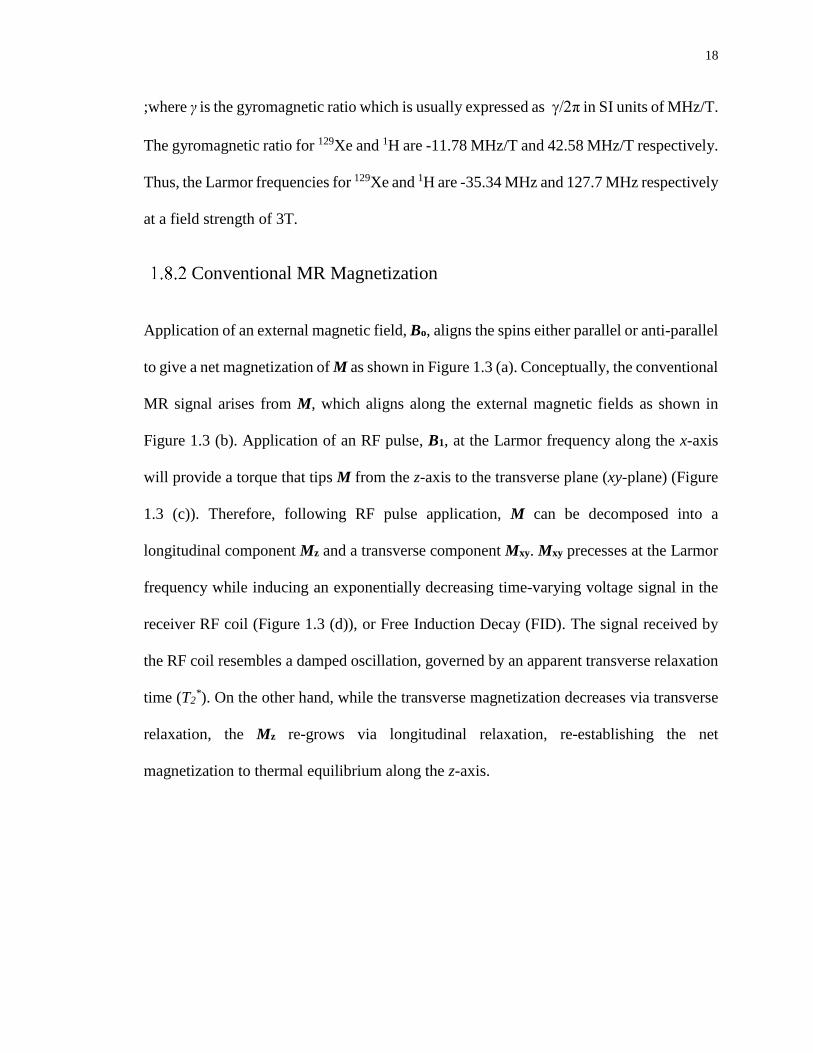
Application of an external magnetic field, Bo, aligns the spins either parallel or anti-parallel
to give a net magnetization of M as shown in Figure 1.3 (a). Conceptually, the conventional
MR signal arises from M, which aligns along the external magnetic fields as shown in
Figure 1.3 (b). Application of an RF pulse, B1, at the Larmor frequency along the x-axis
will provide a torque that tips M from the z-axis to the transverse plane (xy-plane) (Figure
1.3 (c)). Therefore, following RF pulse application, M can be decomposed into a
longitudinal component Mz and a transverse component Mxy. Mxy precesses at the Larmor
frequency while inducing an exponentially decreasing time-varying voltage signal in the
receiver RF coil (Figure 1.3 (d)), or Free Induction Decay (FID). The signal received by
the RF coil resembles a damped oscillation, governed by an apparent transverse relaxation
time (T2*). On the other hand, while the transverse magnetization decreases via transverse
relaxation, the Mz re-grows via longitudinal relaxation, re-establishing the net
magnetization to thermal equilibrium along the z-axis.

19
Figure 1.3: (a) Bulk magnetization vector, M, of a spin population in the external magnetic
field, Bo ; (b) Tipping the magnetization from z’ direction to xy plane using an RF pulse,
B1, applied in the x’ direction; (c) Precession of transverse magnetization, Mxy, in the
laboratory frame (d) Time-varying voltage signal induced in the receive coil.
For a spin 1/2 system, magnetization in a spin population arises from two quantum states.
In the presence of Bo, the nuclear spins split into low energy, S-1/2, and high energy, S+1/2,
states called Zeeman levels. The energy difference between these state is given by:
E = -µ ∙ Bo [1.2]
;where, µ is the magnetic moment of the spin, 1/2γħ for the S+1/2 and -1/2γħ for the S-1/2.
The number of spins in the S+1/2 state which are aligned with Bo, contributes to the net
magnetization M, and thereby the thermally-polarized signal for conventional MR.
Therefore, the longitudinal magnetization Mz is given by:
[1.3]
;where ħ is the Planck’s constant (ħ = 1.054571800(13)× 10−34 (J s)), N is the total number
of atoms, and P is the polarization. The magnetization, and thus the NMR signal depends
on the polarization levels. The polarization, P, is given by:
2
NPM Z
20
[1.4]
;where, N+ and N- are the number of spins in the high and low Zeeman levels respectively.
Ideally, the condition of N+ >> N- corresponds to the highest possible polarization, P ≈ 1,
and therefore provides the highest signal. However, for thermal equilibrium, polarization
is very low due to the small difference between the N+ and N- states (Figure 1.4 (a)).
Therefore, P can be re-written using the Boltzmann distribution as follows:
[1.5]
;where, k is the Boltzmann constant (k = 8.6173324×10⁻⁵ ( eV K-1)), and T is temperature
(T=300 K at laboratory temperature). For a magnetic field strength of Bo = 3T, the
achievable thermal polarization fraction for 129Xe is approximately 2.8×10⁻⁶. At room
temperatures, the percentage polarization for 129Xe is therefore very small, however this
can still detected if there are a large number of 129Xe nuclei within the volume. Therefore,
thermally-polarized 129Xe phantoms containing pressurized 129Xe gas are generally used to
achieve a measurable thermal MR signal.
N
NNP
kT
B
N
NP o
thermal2
12
1

21
Figure 1.4: Zeeman energy levels at thermal equilibrium (a) and in the hyperpolarized
state (b). S-1/2 and S+1/2 are low and high energy levels.
Substituting Eqn. [1.5] in Eqn. [1.3], the longitudinal magnetization for conventional MR
can be re-written as follows:
[1.6]
Equation [1.6] provides the basis of the MR signal, once factors including relaxation time
dependencies, and the RF coil sensitivity are considered. Conceptually, Eqn. [1.6] can also
be related to the achievable conventional MR signal (1H) from lung. Since N is low in the
lungs due to high fraction of air space, the thermally-polarized conventional MR signal is
very low. This signal can be artificially improved using hyperpolarized gas techniques as
explained in the next section.
,4
22
kT
BNM o
z
22
Hyperpolarized MR Magnetization
Hyperpolarization is a pre-magnetized form of MR in which the percentage polarization
achievable is in a range of 10-40%, typically using a spin-exchange optical pumping
(SEOP) polarization approach (103). The population of N+ nuclei is artificially increased
up to a factor of 105 compared to thermally polarized 129Xe gas as shown in Figure 1.4 (b).
While the initial magnetization is significantly higher, the Hp 129Xe gas differs from
conventional MR since the longitudinal magnetization is not renewable and the
magnetization depends on the polarization from the SEOP approach. The following
sections briefly explain the process of SEOP polarization.
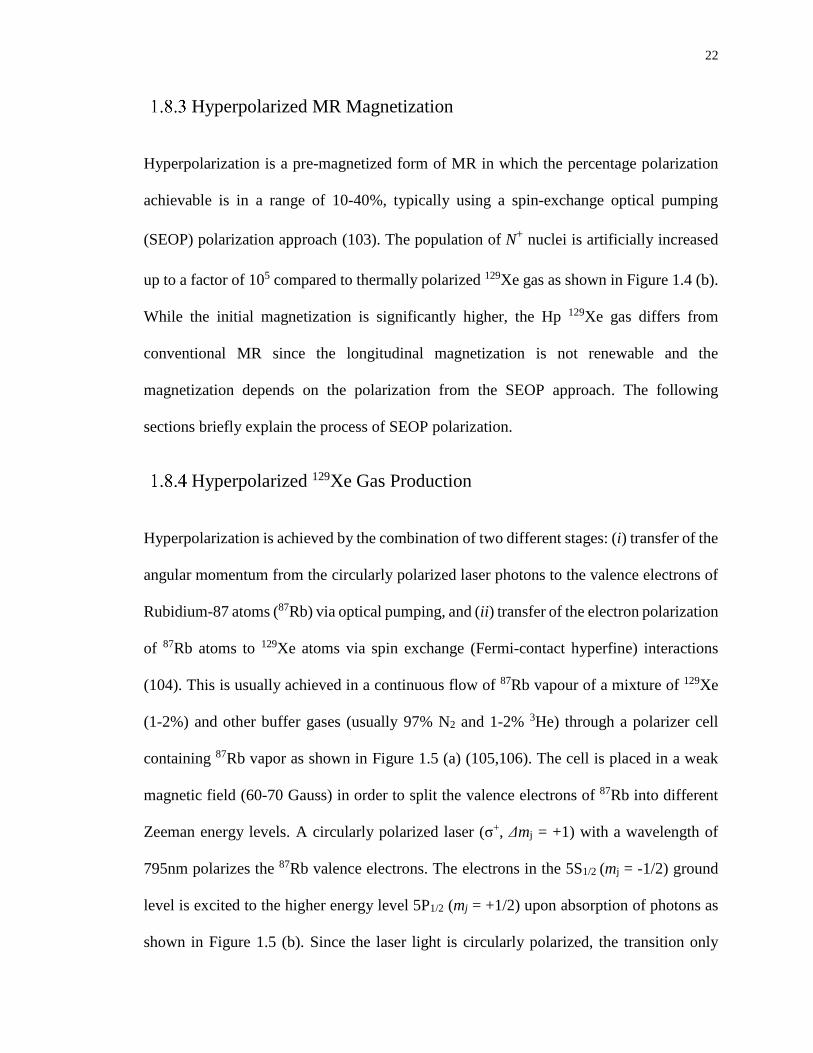
Hyperpolarized 129Xe Gas Production
Hyperpolarization is achieved by the combination of two different stages: (i) transfer of the
angular momentum from the circularly polarized laser photons to the valence electrons of
Rubidium-87 atoms (87Rb) via optical pumping, and (ii) transfer of the electron polarization
of 87Rb atoms to 129Xe atoms via spin exchange (Fermi-contact hyperfine) interactions
(104). This is usually achieved in a continuous flow of 87Rb vapour of a mixture of 129Xe
(1-2%) and other buffer gases (usually 97% N2 and 1-2% 3He) through a polarizer cell
containing 87Rb vapor as shown in Figure 1.5 (a) (105,106). The cell is placed in a weak
magnetic field (60-70 Gauss) in order to split the valence electrons of 87Rb into different
Zeeman energy levels. A circularly polarized laser (σ+, Δmj = +1) with a wavelength of
795nm polarizes the 87Rb valence electrons. The electrons in the 5S1/2 (mj = -1/2) ground
level is excited to the higher energy level 5P1/2 (mj = +1/2) upon absorption of photons as
shown in Figure 1.5 (b). Since the laser light is circularly polarized, the transition only
23
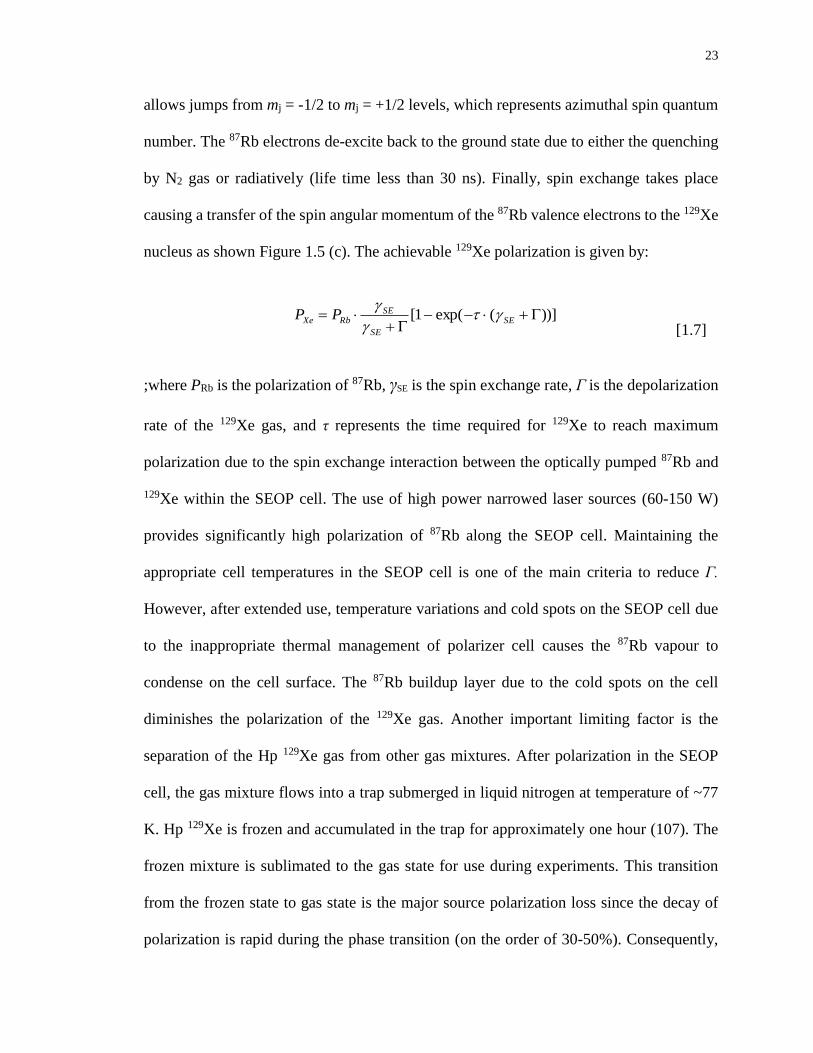
allows jumps from mj = -1/2 to mj = +1/2 levels, which represents azimuthal spin quantum
number. The 87Rb electrons de-excite back to the ground state due to either the quenching
by N2 gas or radiatively (life time less than 30 ns). Finally, spin exchange takes place
causing a transfer of the spin angular momentum of the 87Rb valence electrons to the 129Xe
nucleus as shown Figure 1.5 (c). The achievable 129Xe polarization is given by:
[1.7]
;where PRb is the polarization of 87Rb, γSE is the spin exchange rate, Γ is the depolarization
rate of the 129Xe gas, and τ represents the time required for 129Xe to reach maximum
polarization due to the spin exchange interaction between the optically pumped 87Rb and
129Xe within the SEOP cell. The use of high power narrowed laser sources (60-150 W)
provides significantly high polarization of 87Rb along the SEOP cell. Maintaining the
appropriate cell temperatures in the SEOP cell is one of the main criteria to reduce Γ.
However, after extended use, temperature variations and cold spots on the SEOP cell due
to the inappropriate thermal management of polarizer cell causes the 87Rb vapour to
condense on the cell surface. The 87Rb buildup layer due to the cold spots on the cell
diminishes the polarization of the 129Xe gas. Another important limiting factor is the
separation of the Hp 129Xe gas from other gas mixtures. After polarization in the SEOP
cell, the gas mixture flows into a trap submerged in liquid nitrogen at temperature of ~77
K. Hp 129Xe is frozen and accumulated in the trap for approximately one hour (107). The
frozen mixture is sublimated to the gas state for use during experiments. This transition
from the frozen state to gas state is the major source polarization loss since the decay of
polarization is rapid during the phase transition (on the order of 30-50%). Consequently,
))](exp(1[
SE
SE
SERbXe PP

24
10-40% is the typical level of polarization achievable; however this depends on a number
of factors, including laser power, the geometry of the SEOP cell, the thermal management
of the SEOP cell, the gas flow and fraction of the gas mixture, and the design of the xenon
freeze out trap (108).
Figure 1.5: (a) SEOP cell is shown including the Helmholtz coils, cell, and circularly
polarized (σ+) laser beam. (b) Optical pumping for polarizing the valence electrons of 87Rb.
(c) The spin exchange interactions between the 87Rb and 129Xe. τ is the time required for 129Xe to reach saturation due to the spin exchange interaction.
Substituting Eqn [1.7] in Eqn [1.3], the longitudinal magnetization is given by:
[1.8]
Another distinguishing feature of Hp MR can be seen by comparing Eqn. [1.8] to Eqn.
[1.6]. The hyperpolarized magnetization does not depend on the main magnetic field and
is approximately linearly proportional to gyromagnetic ratio of the nuclei. This feature has
implications for low field MRI that are not described in this thesis.
))](exp(1[2
1
SE
SE
SERbz PNM

25
Chemical Shift
Although the initial Hp signal strength is independent of the main magnetic field (Bo), Bo
still plays an important role in Hp 129Xe MRI. The precession frequency of spins depends
on Bo as already shown in Eqn [1.1] assuming the Bo is the same for all spins. In reality,
the spins in different chemical environments experience different amounts of de-shielding
resulting in variations of local Bo. The local magnetic field, Blocal, experienced by the
nuclear spin is given by:
Blocal = (1- σ) Bo [1.9]
;where σ is the de-shielding constant that depend on the intrinsic chemical properties of the
electron cloud on the nuclei and its environment. Therefore, Eqn. [1.1] can be rewritten as
follows:
ω = γ Blocal [1.10]
The variation in Blocal is referred to as the chemical shift of the Larmor frequency.
Sufficiently high magnetic field strength permits separation of distinct chemical shifts of
129Xe. The phenomenon of chemical shift is shown in Figure 1.2 from rat lungs at 3T. 129Xe
in the PT and RBC compartments experiences a different chemical environment and Blocal.
The frequency differences due to the chemical shift between the 129Xe gas and the dissolved
129Xe phases in the PT and RBC compartments are approximately 6950 Hz and 7475 Hz
at 3 T respectively.
26
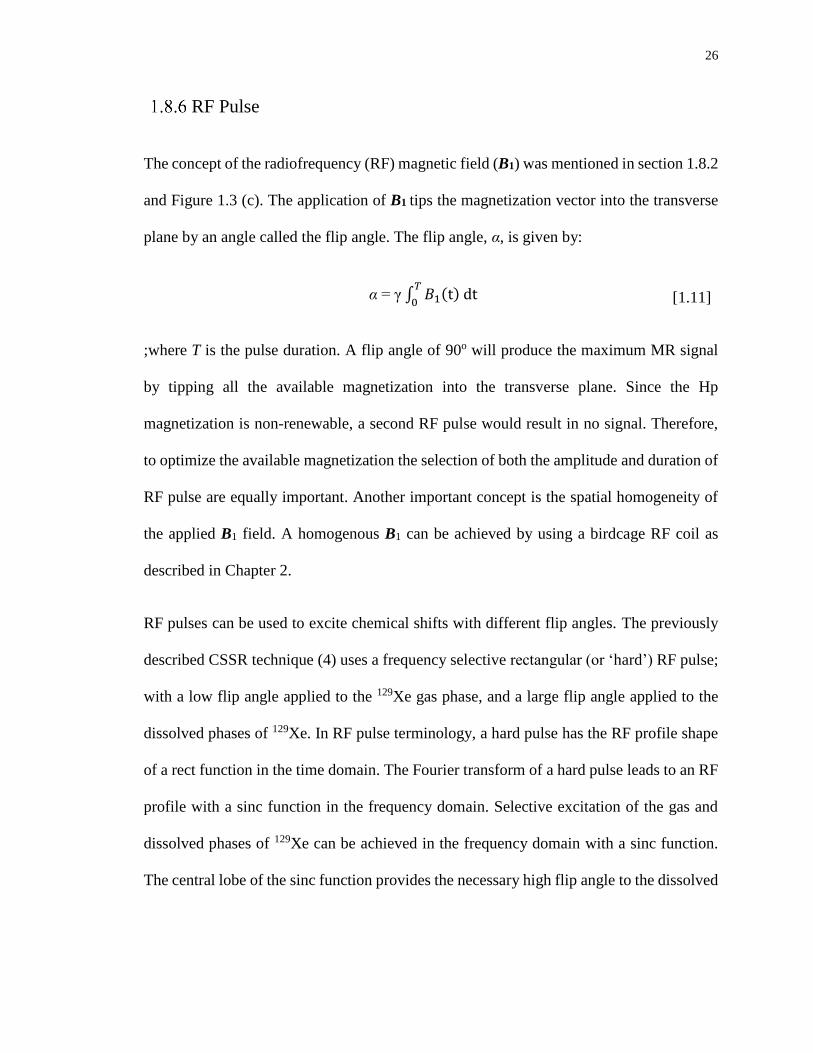
RF Pulse
The concept of the radiofrequency (RF) magnetic field (B1) was mentioned in section 1.8.2
and Figure 1.3 (c). The application of B1 tips the magnetization vector into the transverse
plane by an angle called the flip angle. The flip angle, α, is given by:
α = γ ∫ 𝐵1(t) dt𝑇
0 [1.11]
;where T is the pulse duration. A flip angle of 90o will produce the maximum MR signal
by tipping all the available magnetization into the transverse plane. Since the Hp
magnetization is non-renewable, a second RF pulse would result in no signal. Therefore,
to optimize the available magnetization the selection of both the amplitude and duration of
RF pulse are equally important. Another important concept is the spatial homogeneity of
the applied B1 field. A homogenous B1 can be achieved by using a birdcage RF coil as
described in Chapter 2.
RF pulses can be used to excite chemical shifts with different flip angles. The previously
described CSSR technique (4) uses a frequency selective rectangular (or ‘hard’) RF pulse;
with a low flip angle applied to the 129Xe gas phase, and a large flip angle applied to the
dissolved phases of 129Xe. In RF pulse terminology, a hard pulse has the RF profile shape
of a rect function in the time domain. The Fourier transform of a hard pulse leads to an RF
profile with a sinc function in the frequency domain. Selective excitation of the gas and
dissolved phases of 129Xe can be achieved in the frequency domain with a sinc function.
The central lobe of the sinc function provides the necessary high flip angle to the dissolved

27
phase of 129Xe and the side lobes provide the low flip angle excitation to the gas phase of
129Xe.
The RF pulse and magnetic moment are analyzed in a rotating reference frame to simplify
the mathematical analysis of the temporal progression of the magnetization. An effective
magnetic field is derived to explain the interaction between the B1 and spin system in the
rotating frame as follows:
Beff = (𝐵𝑜 −𝝎
𝜸)𝑧′̂ + 𝐵1𝑥′̂ [1.12]
;where, ω is the carrier frequency of the RF pulse. Thus, the effective magnetic field has
two components in the rotating frame. On-resonance (ω= ωo), Beff is in the same direction
as B1.
MR Signal
The phenomenological Bloch equations describe the behavior of the magnetization after
the application of an RF pulse, including the relaxation terms as follows:
𝑑𝑴
𝑑𝑡= 𝛾𝑴 × 𝑩𝒆𝒇𝒇 +
1
𝑇1 (𝑴𝒐 − 𝑴𝒛 ) −
1
𝑇2∗ 𝑴𝒙𝒚
[1.13]
The first term in the Bloch equation represents the relationship between the application of
the RF pulse and spin system including the off-resonance effects. The second term
describes the relaxation of the longitudinal magnetization, characterized by the spin-lattice
relaxation time (T1). The third term describes the relaxation of the transverse
magnetization, characterized by the apparent spin-spin relaxation time (T2*). The solution

28
to the Bloch equation for thermally polarized signal has been discussed previously
(101,102). In particular, the solution to the Bloch equation for Hp 129Xe imaging after the
application of an RF pulse of flip angle of α1 is given by(109) :
Mz = Mi cos(α1) (1- exp(-t/T1)) [1.14]
Mxy = Mi sin(α1) (1- exp(-t/T1)) exp(-t/T2*) [1.15]
;where Mi is the initial magnetization that depends on the polarization of the 129Xe gas. T1
describes the exponential decay of the longitudinal magnetization toward thermal
equilibrium. T1 mechanisms include the interaction with paramagnetic molecules such as
diatomic oxygen. However, the effects of T1 are generally negligible since T1 is on the
order of ~30s for 129Xe gas in the lungs and the MR acquisition is on the orders of a few
seconds.
The spin-spin relaxation time (T2*) describes the exponential decay of the transverse
magnetization. Among other factors, T2* depends on the uniformity of Bo, as such the T2
*
for Hp 129Xe in the gas phase and dissolved phases are approximately 6 ms and 2 ms at 3T
respectively. Apart from the non-renewable nature of Hp magnetization, Mxy and thereby
the SNR of dissolved phases of 129Xe strongly depends on T2*. To deal with the signal loss
due to short T2*, the signal is optimally sampled in as short a read-out time as possible using
a high flip angle. The selection of the flip angle and optimization of read-out time will be
discussed in Chapter 3 in more detail.

29
RF Coils
As discussed in the previous section 1.8.6, B1 tips the longitudinal magnetization into the
transverse plane initiating the MR signal. While the transverse magnetization is precessing
in the xy plane, it induces an exponentially decaying voltage signal (i.e. FID) that is used
to reconstruct the MR image. An RF coil is used to transmit the excitation RF field, B1+,
and receive the RF field, B1-, radiated by the spin system. To achieve a homogenous flip
angle distribution (B1+) over the imaging region, RF coils are often designed in shape of
cylinder (e.g. birdcage coils). The B1+ homogeneity generated by the transmit coil can be
derived using the Biot-Savart law for a unit current flowing in the coil elements. A receive
coil that is placed close to the object is known as a surface coil which improves the
sensitivity. The sensitivity of the receive coils can be determined using the principle of
reciprocity, where B1- for a unit current flow, I, in the receive coil element is considered to
arise from a sample associated with the density of the spin population. The MR signal for
a given volume of sample is expressed using the following equation:
𝑆(𝑡) = 𝐴 𝜔𝑜 ∫ (𝐵1−(𝑟)/𝐼)𝑥𝑦 ∙ 𝑀𝑥𝑦(𝑟, 𝑡) 𝑑𝑉
[1.16]
;where A is a constant that depends on coil filling factor, gain, and frequency deviations
due to Bo and B1+ inhomogeneities. A detailed discussion about optimization of the B+ and
B1- field and other technical details including the geometry and electrical components of
transmit and receive RF coils can be found in the Chapter 2.

30
Spatial Localization of the MRI Signal
Imaging requires spatial localization of the precession frequencies as a function of position
over the imaging region. A precise variation in precession frequencies is achieved by
applying linearly changing magnetic field gradients using gradient coils. If the gradient
coils are switched on, the net magnetic field is given by:
B(x,y,x)= (Bo + Gxx+ Gyy+ Gzz)�̂� [1.17]
;where, Gx, Gy, and Gz are the gradient amplitudes produced by the x, y, and z gradient coils
respectively. Typically, the maximum gradient amplitude for a clinical scanner is on the
order of 50 mT/m. Additionally, the rate by which the achievable gradient amplitude can
be obtained, is called the slew rate. Typical clinical values for slew rate are on the order of
200mT/m/ms for a clinical scanner. Both the slew rate and gradient amplitudes are
significantly important for establishing the temporal and spatial resolution of MR imaging
and will be discussed in detail in Chapter 3.
In this thesis, MR images were acquired in 2D projection fashion. 2D imaging is performed
without slice-selection, using a phase encoding gradient applied in y direction and
frequency encoding gradient applied in x direction. A hard pulse with a small duration (or
large bandwidth) was used to excite the whole lung as a single slab in the z direction.
Neglecting relaxation and off-resonance effects, the acquired 2D MR data is given by:
[1.18] dxdyykxkiyxmkks yxyx ))(2exp(),(),(

31
;where is the magnetization in the voxel in the imaging plane corresponding to the
spin density, and are the location in the k-space along the frequency and phase
encoding directions respectively. A 2D image is computed from the inverse Fourier
transform ( ) of the data in k-space as:
[1.19]
The sampled k-space points define the scan trajectory. The geometry of the scan trajectory
has a first-order impact on the quality of the reconstructed image. The selection of optimum
k-space trajectories must consider the trade-off between the signal dynamics and SNR
considering the gradient performance of the imaging system. Procedures for sampling of
k-space data and resulting SNR and resolution are investigated in Chapter 3 using a point
spread function (PSF) analysis as shown in Figure 1.6. Briefly, calculation of the PSF
allows for quantitative evaluation of image blurring, through the full-width at half
maximum (FWHM), and SNR for a corresponding read-out time (Tread), field-of-view
(FOV) and imaging matrix.
),( yxm
xk yk
1
yxyxyxyx dkdkykxkikkskksyxm ))(2exp(),()},({),( 1

32
Figure 1.6: Full width at half-maximum (FWHM) and amplitude of a point spread function.
1D Gradient Echo
Gradient Echo is a common frequency encoding method and considered a 1D MR signal,
which encodes spatial information in the FID signal by frequency encoding. A 1D MR
gradient echo signal is accomplished by applying a magnetic field gradient during the FID
signal. This gradient spatially encodes the FID signal by first de-phasing (with a negative
gradient lobe) and re-phasing the transverse magnetization signal (with a positive polarity
gradient) as shown in Figure 1.7. As already mentioned in the previous section, the
transverse magnetization is produced after an RF pulse application. Following the RF
pulse, the application of the negative lobe of the Gx gradient causes a very fast de-phasing
of the FID signal. Then, the positive lobe of the Gx gradient reverses the FID signal known
as re-focusing, thereby creating an ‘echo’ at the echo time (TE) Consequently, the
associated FID (or 1D k-space) data consists of a range of frequencies along the frequency-
encoding gradient direction. This can be translated to 2D k-space data using an additional
phase encoding gradient as explained in the next section.

33
Figure 1.7: 1D gradient echo timing diagram. Transverse magnetization signal re-phasing
and de-phasing is shown for the 1D frequency encoding process. TE is the echo time.
2D Cartesian k-space Sampling
Cartesian sampling (i.e. uniform grid) is the conventional way MR data is sampled in k-
space. Fast gradient recalled echo (FGRE) imaging is the most commonly used pulse
sequence based on Cartesian k-space sampling as shown in
Figure 1.8. A single line of k-space along the frequency encoding (Gx) direction is acquired
after each RF excitation. The phase encoding gradient (Gy) and another RF pulses are than
repeated to cover the next line of k-space in the y direction. The pulse repetition time (TR)
is the time duration between the RF pulse applications between k-space lines. For 2D
proton FGRE imaging, TR is often set to a value greater than 4 × T1 for maximum signal
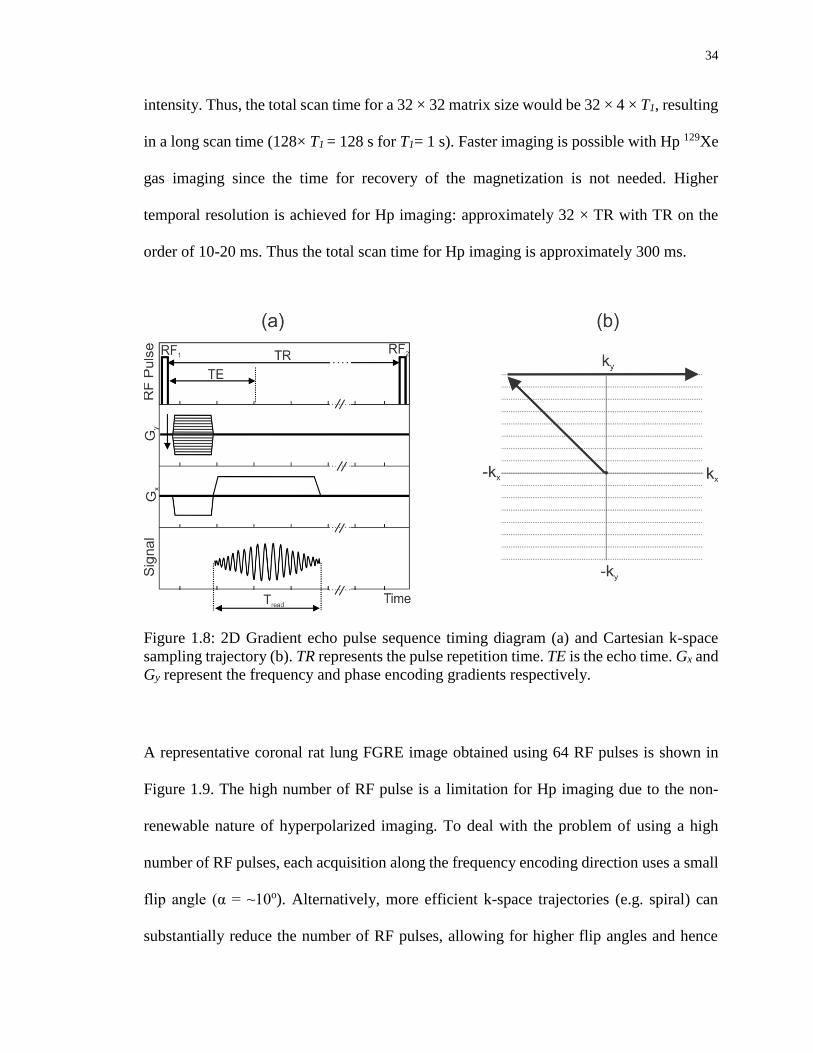
34
intensity. Thus, the total scan time for a 32 × 32 matrix size would be 32 × 4 × T1, resulting
in a long scan time (128× T1 = 128 s for T1= 1 s). Faster imaging is possible with Hp 129Xe
gas imaging since the time for recovery of the magnetization is not needed. Higher
temporal resolution is achieved for Hp imaging: approximately 32 × TR with TR on the
order of 10-20 ms. Thus the total scan time for Hp imaging is approximately 300 ms.
Figure 1.8: 2D Gradient echo pulse sequence timing diagram (a) and Cartesian k-space
sampling trajectory (b). TR represents the pulse repetition time. TE is the echo time. Gx and
Gy represent the frequency and phase encoding gradients respectively.
A representative coronal rat lung FGRE image obtained using 64 RF pulses is shown in
Figure 1.9. The high number of RF pulse is a limitation for Hp imaging due to the non-
renewable nature of hyperpolarized imaging. To deal with the problem of using a high
number of RF pulses, each acquisition along the frequency encoding direction uses a small
flip angle (α = ~10o). Alternatively, more efficient k-space trajectories (e.g. spiral) can
substantially reduce the number of RF pulses, allowing for higher flip angles and hence

35
increasing SNR. Additionally, faster k-space acquisition also allow for capturing of the gas
exchange of 129Xe.
Figure 1.9: Coronal 2D MR FGRE gas phase image of in vivo rat lung. Acquisition
parameters include: 64 × 64 matrix size, and 6 cm FOV.
Spiral k-space Sampling
An efficient approach for mapping the entire k-space following an RF excitation utilizes a
single-shot spiral acquisition. Single-shot spiral is based on acquiring the k-space data in a
spiral pattern using gradients (Gx and Gy) applied as an increasing sinusoidal function of
time as shown in
Figure 1.10. The duration of the data acquisition window is called the read-out time, Tread.
The selection of Tread on the order of T2* (~2 ms) is desirable for increasing SNR and
reducing blurring artifacts. Short Tread is usually performed using high gradient amplitudes
and slew rates. However, high gradient power can cause image artifacts including Eddy

36
current induced k-space distortions and time delay errors arising from gradient hardware
for long Tread. Fortunately, these image artifacts can be corrected using k-space trajectory
measurement methods (110). The single-shot k-space sampling provides a better tool for
imaging pulmonary functions including perfusion and gas diffusion imaging (111,112).
Additionally, TR values can be used to create functional images for detection of gas
exchange dynamics. The build-up of dissolved 129Xe signal between sequential images can
be controlled by changing the TR values taking advantage of rapid single-shot imaging
with short TE. Furthermore, obtaining TR-weighted rapid single-shot spiral images of PT,
RBC and gas compartments separately can be achieved using advanced pulse sequence
approaches such as Iterative Decomposition of water and fat with Echo Asymmetric and
Least-squares estimation (IDEAL) described next.
Figure 1.10: Single-shot spiral pulse sequence timing diagram, including the RF pulse,
gradient and read-out window (a) and the spiral k-space sampling trajectory (b).

37
IDEAL Approach for Imaging Chemical Species
IDEAL is a Dixon-based imaging method commonly used to exploit the difference in
chemical shifts between fat and water to separately image fat and water in conventional
proton MRI (113). The three-point Dixon method is based on acquisition of three
consecutive images with a phase difference of 0, π, 2π. The phase differences are achieved
by selecting echo times based on the chemical shift between fat and water. Three echo
images are acquired to estimate the Bo inhomogeneity, water and fat compartments
(114,115). On closer inspection, the complex fat/water MR signal strength after Fourier
transformation for a voxel at a chosen TE value can be expressed as follows:
[1.20]
;where, W and F are water and fat fraction respectively, and is the chemical shift
difference between the fat and water. For each voxel, the signal is a mixture of signals from
the fat and water as a function of echo time (TE). Because the chemical shift is known and
TE is controlled by the timing of the data acquisition, the corresponding signal strength
equations for each image can be simplified as follows:
[1.21]
;where is a constant which depends on TE and is the Bo inhomogeneity
factor. This equation contains three unknown contributions from F, W and .
Therefore, acquisition of three echo images with different echo shifts allows separation of
these three unknowns to purposely-separate fat and water. Since the chemical shift depends
)exp()]exp([)( nonFWn TEBiTEwiFWTES
FWw
)()]([)( nnn TEHTECFWTES
)( nTEC )( nTEH
)( nTEH

38
on the Bo inhomogeneity, three-point Dixon method correct for the effect of Bo
inhomogeneity. However, selection of echo shift with a phase difference of π causes image
artifact, reducing the accuracy of three-point Dixon for separating the water and fat (113).
Imperfect selection of echo shifts can result in inaccurate calculation of the fraction of
water to fat within each voxel. IDEAL combines asymmetrically acquired echoes with an
iterative least-squares decomposition algorithm to maximize noise performance and
address the dependence of water/fat separation on echo shift. Asymmetrically acquired
echoes helps to reduce the scan times for substances with large chemical shift. For example,
to obtain a phase difference of π between compartments with small chemical shift (~10
ppm) requires a long echo time spacing (~340 ms) but large chemical shifts (~200 ppm)
require a much shorter echo time spacing (50 ms). The iterative least-squares
decomposition part of IDEAL stands for estimation of the fraction of each chemical shift
compartments iteratively in multi steps (116). Additional improvement for estimation of
fat/water decomposition has been achieved using phase difference of 2π /3 by analyzing
the noise performance (113). The noise performance of the a water/fat separation has been
shown to be proportional to the SNR performance of the pulse sequence which is estimated
based on the effective number of signal averages (NSA) (117). NSA for three point Dixon
is given by:
[1.22]
;where is the phase encoding increment. Thus the maximum SNR can be achieved for
NSA = 3 at of 2π /3 for three-point IDEAL. Therefore, the selection of echo times can
be optimized using the NSA approach.
2
2
cos21
)cos1(2
NSA
39
Optimization of NSA and other imaging parameters for IDEAL imaging will be discussed
in detail in Chapter 3. To achieve the measurement of the gas exchange curves for PT and
RBC compartments separately in this thesis, IDEAL is used in spiral k-space sampling
fashion following a single RF pulse application. Four-point IDEAL is used to produce gas,
PT and RBC images by varying TR which controls the build-up of the dissolved phase
129Xe signal. Thereby, gas exchange curves have been calculated from the variation in the
image intensity as a function of TR.
Gas Exchange Models of Hyperpolarized 129Xe
Gas exchange curves represent the diffusion of 129Xe from gas phase to the PT
compartment and from the PT to the RBC compartment as a function of time respectively.
A representative gas exchange curve is shown in Figure 1.11(a). The concentration of 129Xe
in each of the compartments is proportional to the build-up 129Xe signal which is usually
obtained from whole lungs using the CSSR technique (89). Gas exchange curves are
usually analyzed by fitting CSSR experimental data points by the Mansson exponential
function (95). In this study, the IDEAL imaging technique is used to obtain gas exchange
curves, which have been fitted by the Mansson’s gas exchange model to explore lung
function regionally. The gas exchange curves provide information about the concentration
of 129Xe gas that diffuses from alveolar air space into the PT and RBC compartments. As
a function of time the concentration of 129Xe build-up in PT compartment increases
exponentially giving rise to MR image intensity within approximately 100 ms (Figure 1.11
(a)). The linear slope after 100 ms corresponds to the linear slope (S1) due to the saturation
of 129Xe concentration in the PT compartment. The dynamics of 129Xe transfer from

40
alveolar air space to the PT compartment is modelled using one-dimensional diffusion
equations. The diffusion from the PT to RBC is also included in the blood perfusion with
a constant flow as shown by the red color in Figure 1.11 (b).
The exponential fitting function from the Mansson model is given as follows:
[1.23]
;where, So is the y-intercept of the linear slope, τ, is the exponential gas transfer time
constant corresponding to the fast exponential increase in the dissolved phase concentration
due to the diffusion and S1 is the linear slope corresponding to the accumulation of 129Xe
concentration after fast diffusion. So, S1, and τ are subsequently used to calculate the
average pulmonary tissue thickness, LPT, and capillary thickness, LC. Detailed information
about the mathematical derivation can be found in Mansson et al. (95). Additionally, the
relative blood volume, VRBC, can be calculated by LC /(LC + LPT).
Figure 1.11: (a) A representative gas exchange curve is obtained by fitting experimental
data points by the Mansson exponential function Eqn. [1.23]. So is the y-intercept of the
linear slope, S1 is the linear slope, TR represents the pulse repetition time. (b) Geometry of
the Mansson’s gas exchange model is shown. LPT and LC are the pulmonary tissue thickness
and capillary thickness, respectively.
TRSTRSTRS o 1))/exp(1()(
41
1.9 Thesis Hypothesis and Objectives
The hypothesis of this research is that hyperpolarized 129Xe MRI will provide measurement
of gas exchange changes, specifically LPT and VRBC, in an early-phase rat model of RILI
which will correlate with histology. To address this hypothesis, new Hp 129Xe approaches
are required to increase signal-to-noise ratio (SNR), especially from the dissolved phases
of 129Xe in the PT and RBC compartments. The first specific goal of thesis was to increase
the SNR of dissolved phase 129Xe images by developing a Transmit-Only / Receive-Only
(TO/RO) RF coil. The second specific goal was to develop an MRI technique with
sufficient temporal and spatial resolution for quantification of the regional changes in the
dynamics of the 129Xe gas exchange in the RBC and PT compartments. Therefore, a 2D
IDEAL MRI pulse sequence using single-shot spiral k-space sampling was optimized and
implemented for simultaneous Hp 129Xe imaging of gas, PT, and RBC compartments.
Finally, the regional gas exchange abnormalities in a rat model of RILI associated with
partial thorax irradiation was investigated and correlated with histology measurements.
1.10 Thesis Outline
Chapter 2 describes the design and construction of a novel TO/RO RF coil for rat imaging.
Chapter 2 is a reproduction of the accepted manuscript by Concepts in Magnetic Resonance
Part B: Magnetic Resonance Engineering 2014 (DOI: 10.1002/cmr.b.21288). The coil
sensitivity was optimized through numerical simulations. Performance of the new TO/RO
coil was investigated using a thermally-polarized phantom and in vivo experiments.

42
Chapter 3 describes the development and optimization of a novel imaging technique
(IDEAL with spiral k-space sampling) that provides regional quantification of the
dynamics of the gas exchange. Chapter 3 is a reproduction of the accepted manuscript by
Magnetic Resonance in Medicine 2015, Manuscript ID: MRM-15-16025. A theoretical
analysis was performed to optimize the spiral k-space read-out time, echo time, flip angles,
spatial resolution and required gradient slew rate and amplitude respectively. The
feasibility of imaging the 129Xe gas, PT and RBC, and measuring the dynamics of the gas
exchange was investigated in vivo in healthy rat lungs.
Chapter 4 is a reproduction of a submitted manuscript to Medical Physics 2015. Chapter 4
investigates the feasibility of detecting early RP in a rat model of RILI involving right lung
irradiation 2-weeks post-irradiation. Taking advantages of developments made in Chapter
2 and 3, the gas exchange curves were measured separately for PT and RBC compartments
for the left and right lungs. Average PT thickness, (LPT) and RBC relative volumes (VRBC)
were measured from the left and right lungs separately. The average PT and RBC volumes
were statistically compared between the irradiated and non-irradiated cohorts.
Chapter 5 includes a summary of discussion of the thesis, including the contribution of this
work to the detection of RILI in its early stage. Additionally, future work is discussed
including further improvements in polarization, modeling of gas exchange, and MR pulse
sequence design for transition to clinical imaging.

43
1.11 References
1. Canadian Cancer Statistics 2014. Volume Toronto, ON.
http://www.cancer.ca/statistics: Canadian Cancer Society, Statistics Canada, Public
Health Agency of Canada, Provincial/Territorial Cancer Registries 2014. p.
http://www.cancer.ca/~/media/cancer.ca/CW/cancer%20information/cancer%201
01/Canadian%20120cancer%20120statistics/Canadian-Cancer-Statistics-22014-
EN.pdf.
2. Gilad S, Lithwick-Yanai G, Barshack I, et al. Classification of the Four Main Types
of Lung Cancer Using a MicroRNA-Based Diagnostic Assay. J Mol Diagn
2012;14(5):510-517.
3. Santyr G, Fox M, Thind K, et al. Anatomical, functional and metabolic imaging of
radiation-induced lung injury using hyperpolarized MRI. Nmr Biomed
2014;27(12):1515-1524.
4. Fox MS, Ouriadov A, Thind K, et al. Detection of radiation induced lung injury in
rats using dynamic hyperpolarized Xe-129 magnetic resonance spectroscopy. Med
Phys 2014;41(7).
5. Schwartzstein RM, Parker MJ. Respiratory Physiology: A Clinical Approach:
Lippincott Williams & Wilkins: 2006.
6. Krinke GJ, Bullock GR, Bunton T. The Laboratory Rat: Elsevier Science: 2000.
7. Angus GE, Thurlbeck WM. Number of alveoli in the human lung. J Appl Physiol
1972;32(4):483-485.
8. Ochs M, Nyengaard JR, Jung A, et al. The number of alveoli in the human lung.
Am J Respir Crit Care Med 2004;169(1):120-124.
9. Weibel ER. What makes a good lung? The morphometric basis of lung function.
Swiss Med Wkly 2009;139(27-28):375-386.
10. International Agency for Research in Cancer S, B. W., Wild, C. P. World Cancer
Report 2014. Read IARC Press 2014. p. 630.
11. Torre LA, Bray F, Siegel RL, Ferlay J, Lortet-Tieulent J, Jemal A. Global cancer
statistics, 2012. CA Cancer J Clin 2015;65(2):87-108.
12. Jemal A, Bray F, Center MM, Ferlay J, Ward E, Forman D. Global cancer statistics.
CA Cancer J Clin 2011;61(2):69-90.
13. Canadian Cancer Statistics 2015. Volume Toronto, ON.
http://www.cancer.ca/statistics: Canadian Cancer Society, Statistics Canada, Public

44
Health Agency of Canada, Provincial/Territorial Cancer Registries 2015. p.
https://www.cancer.ca/~/media/cancer.ca/CW/cancer%20information/cancer%20
101/Canadian%20120cancer%20120statistics/Canadian-Cancer-Statistics-22015-
EN.pdf.
14. Ontario Lung Association. S, P., Stiff, D., Briante, C., Ahmad, S., Ler, A., Wong,
L. Life and Economic Burden of Lung Disease in Ontario: 2011 to 2041.
RiskAnalytica, on behalf of the Ontario Lung Association, 2011. Your Lungs, Your
Life: Insights and Solutions to Lung Health in Ontario.
http://www.on.lung.ca/yourlungsyourlife: the Ontario Lung Association; 2012. p.
1-24.
15. Peters S, Adjei AA, Gridelli C, et al. Metastatic non-small-cell lung cancer
(NSCLC): ESMO Clinical Practice Guidelines for diagnosis, treatment and follow-
up. Ann Oncol 2012;23 Suppl 7:vii56-64.
16. Sher T, Dy GK, Adjei AA. Small cell lung cancer. Mayo Clin Proc 2008;83(3):355-
367.
17. Goldstraw P, Crowley J, Chanksy K, et al. The IASLC lung cancer staging project:
Proposals for the revision of the TNM stage groupings in the forthcoming (Seventh)
edition of the TNM classification of malignant tumors (vol 8, pg 706-714, 2007).
Journal of Thoracic Oncology 2007;2(10):985-985.
18. Edge S, Byrd DR, Compton CC, Fritz AG, Greene FL, Trotti A. AJCC Cancer
Staging Manual. New York: Springer-Verlag: 2010.
19. Goldstraw P, Ball D, Jett JR, et al. Non-small-cell lung cancer. Lancet
2011;378(9804):1727-1740.
20. Group NM-AC. Chemotherapy in addition to supportive care improves survival in
advanced non-small-cell lung cancer: a systematic review and meta-analysis of
individual patient data from 16 randomized controlled trials. J Clin Oncol
2008;26(28):4617-4625.
21. Kelly K, Crowley J, Bunn PA, Jr., et al. Randomized phase III trial of paclitaxel
plus carboplatin versus vinorelbine plus cisplatin in the treatment of patients with
advanced non--small-cell lung cancer: a Southwest Oncology Group trial. J Clin
Oncol 2001;19(13):3210-3218.
22. Soria JC, Mauguen A, Reck M, et al. Systematic review and meta-analysis of
randomised, phase II/III trials adding bevacizumab to platinum-based
chemotherapy as first-line treatment in patients with advanced non-small-cell lung
cancer. Annals of Oncology 2013;24(1):20-30.
23. Burdett S, Rydzewska LHM, Tierney JF, et al. Preoperative chemotherapy for non-
small-cell lung cancer: a systematic review and meta-analysis of individual
participant data. Lancet 2014;383(9928):1561-1571.
45
24. Peters S, Adjei AA. LUNG CANCER How much platinum-based chemotherapy is
enough in NSCLC? Nat Rev Clin Oncol 2015;12(1):8-9.
25. Shepherd FA, Rodrigues Pereira J, Ciuleanu T, et al. Erlotinib in previously treated
non-small-cell lung cancer. N Engl J Med 2005;353(2):123-132.
26. Bradbury PA, Tu D, Seymour L, et al. Economic analysis: randomized placebo-
controlled clinical trial of erlotinib in advanced non-small cell lung cancer. J Natl
Cancer Inst 2010;102(5):298-306.
27. Herbst RS, Fukuoka M, Baselga J. Gefitinib--a novel targeted approach to treating
cancer. Nat Rev Cancer 2004;4(12):956-965.
28. Rosell R, Carcereny E, Gervais R, et al. Erlotinib versus standard chemotherapy as
first-line treatment for European patients with advanced EGFR mutation-positive
non-small-cell lung cancer (EURTAC): a multicentre, open-label, randomised
phase 3 trial. Lancet Oncol 2012;13(3):239-246.
29. Kantarjian HM, Wolff RA, Koller CA. The MD Anderson Manual of Medical
Oncology, Second Edition: McGraw-Hill Education: 2011.
30. Handy JR, Asaph JW, Skokan L, et al. What happens to patients undergoing lung
cancer surgery? Outcomes and quality of life before and after surgery. Chest
2002;122(1):21-30.
31. Datta D, Lahiri B. Preoperative evaluation of patients undergoing lung resection
surgery. Chest 2003;123(6):2096-2103.
32. Auperin A, Le Chevalier T, Le Pechoux C, et al. Adjuvant chemotherapy, with or
without postoperative radiotherapy, in operable non-small-cell lung cancer: two
meta-analyses of individual patient data. Lancet 2010;375(9722):1267-1277.
33. Robinson CG, Patel AP, Bradley JD, et al. Postoperative Radiotherapy for
Pathologic N2 Non-Small-Cell Lung Cancer Treated With Adjuvant
Chemotherapy: A Review of the National Cancer Data Base. J Clin Oncol
2015;33(8):870.
34. Delaney G, Barton M, Jacob S, Jalaludin B. A model for decision making for the
use of radiotherapy in lung cancer. Lancet Oncol 2003;4(2):120-128.
35. Tyldesley S, Boyd C, Schulze K, Walker H, Mackillop WJ. Estimating the need for
radiotherapy for lung cancer: An evidence-based, epidemiologic approach. Int J
Radiat Oncol 2001;49(4):973-985.
36. Reck M, Popat S, Reinmuth N, et al. Metastatic non-small-cell lung cancer
(NSCLC): ESMO Clinical Practice Guidelines for diagnosis, treatment and follow-
up. Ann Oncol 2014;25 Suppl 3:iii27-39.

46
37. Fairchild A, Harris K, Barnes E, et al. Palliative thoracic radiotherapy for lung
cancer: a systematic review. J Clin Oncol 2008;26(24):4001-4011.
38. Koshy M, Goloubeva O, Suntharalingam M. Impact of Neoadjuvant Radiation on
Survival in Stage Iii Non-Small-Cell Lung Cancer. Int J Radiat Oncol
2011;79(5):1388-1394.
39. Brock J, Ashley S, Bedford J, Nioutsikou E, Partridge M, Brada M. Review of
hypofractionated small volume radiotherapy for early-stage non-small cell lung
cancer. Clin Oncol (R Coll Radiol) 2008;20(9):666-676.
40. Timmerman R, Paulus R, Galvin J, et al. Stereotactic body radiation therapy for
inoperable early stage lung cancer. JAMA 2010;303(11):1070-1076.
41. Iyengar P, Kavanagh BD, Wardak Z, et al. Phase II trial of stereotactic body
radiation therapy combined with erlotinib for patients with limited but progressive
metastatic non-small-cell lung cancer. J Clin Oncol 2014;32(34):3824-3830.
42. Hurkmans CW, Cuijpers JP, Lagerwaard FJ, et al. Recommendations for
implementing stereotactic radiotherapy in peripheral stage IA non-small cell lung
cancer: report from the Quality Assurance Working Party of the randomised phase
III ROSEL study. Radiat Oncol 2009;4:1.
43. Ghafoori P, Marks LB, Vujaskovic Z, Kelsey CR. Radiation-induced lung injury.
Assessment, management, and prevention. Oncology (Williston Park)
2008;22(1):37-47; discussion 52-33.
44. Yarnold J, Brotons MC. Pathogenetic mechanisms in radiation fibrosis.
Radiotherapy and oncology 2010;97(1):149-161.
45. Palma DA, Senan S, Tsujino K, et al. Predicting Symptomatic Radiation
Pneumonitis after Concurrent Chemoradiotherapy for Non-Small Cell Lung
Cancer: Results of an International Individual Patient Data Meta-analysis. Journal
of Thoracic Oncology 2012;7(9):S267-S267.
46. Rodrigues G, Lock M, D'Souza D, Yu E, Van Dyk J. Prediction of radiation
pneumonitis by dose - volume histogram parameters in lung cancer--a systematic
review. Radiotherapy and oncology 2004;71(2):127-138.
47. Ueki N, Matsuo Y, Togashi Y, et al. Impact of pretreatment interstitial lung disease
on radiation pneumonitis and survival after stereotactic body radiation therapy for
lung cancer. J Thorac Oncol 2015;10(1):116-125.
48. Yamashita H, Takahashi W, Haga A, Nakagawa K. Radiation pneumonitis after
stereotactic radiation therapy for lung cancer. World J Radiol 2014;6(9):708-715.
49. Marks LB, Yu X, Vujaskovic Z, Small W, Jr., Folz R, Anscher MS. Radiation-
induced lung injury. Semin Radiat Oncol 2003;13(3):333-345.
47
50. Citrin D, Cotrim AP, Hyodo F, Baum BJ, Krishna MC, Mitchell JB.
Radioprotectors and Mitigators of Radiation-Induced Normal Tissue Injury.
Oncologist 2010;15(4):360-371.
51. Dang J, Li G, Zang S, Zhang S, Yao L. Risk and predictors for early radiation
pneumonitis in patients with stage III non-small cell lung cancer treated with
concurrent or sequential chemoradiotherapy. Radiat Oncol 2014;9:172.
52. Miller MR, Hankinson J, Brusasco V, et al. Standardisation of spirometry. Eur
Respir J 2005;26(2):319-338.
53. Marks LB, Munley MT, Spencer DP, et al. Quantification of radiation-induced
regional lung injury with perfusion imaging. International journal of radiation
oncology, biology, physics 1997;38(2):399-409.
54. Gergel TJ, Leichman L, Nava HR, et al. Effect of concurrent radiation therapy and
chemotherapy on pulmonary function in patients with esophageal cancer: dose-
volume histogram analysis. Cancer J 2002;8(6):451-460.
55. Curran WJ, Jr., Moldofsky PJ, Solin LJ. Observations on the predictive value of
perfusion lung scans on post-irradiation pulmonary function among 210 patients
with bronchogenic carcinoma. International journal of radiation oncology, biology,
physics 1992;24(1):31-36.
56. Choi NC, Kanarek DJ. Toxicity of thoracic radiotherapy on pulmonary function in
lung cancer. Lung Cancer 1994;10 Suppl 1:S219-230.
57. Rabe KF, Hurd S, Anzueto A, et al. Global strategy for the diagnosis, management,
and prevention of chronic obstructive pulmonary disease: GOLD executive
summary. Am J Respir Crit Care Med 2007;176(6):532-555.
58. Movsas B, Raffin TA, Epstein AH, Link CJ, Jr. Pulmonary radiation injury. Chest
1997;111(4):1061-1076.
59. Palma DA, de Koste JRV, Verbakel WFAR, Senan S. A new approach to
quantifying lung damage after stereotactic body radiation therapy. Acta Oncologica
2011;50(4):509-517.
60. Konstas AA, Goldmakher GV, Lee TY, Lev MH. Theoretic basis and technical
implementations of CT perfusion in acute ischemic stroke, part 2: technical
implementations. AJNR Am J Neuroradiol 2009;30(5):885-892.
61. Konstas AA, Goldmakher GV, Lee TY, Lev MH. Theoretic basis and technical
implementations of CT perfusion in acute ischemic stroke, part 1: Theoretic basis.
AJNR Am J Neuroradiol 2009;30(4):662-668.

48
62. Hu XY, Fang XM, Chen HW, et al. Early detection of acute radiation-induced lung
injury with multi-section CT perfusion imaging: An initial experience. Clin Radiol
2014;69(8):853-860.
63. Tahamtan R, Shabestani Monfared A, Tahamtani Y, et al. Radioprotective effect of
melatonin on radiation-induced lung injury and lipid peroxidation in rats. Cell J
2015;17(1):111-120.
64. Serin M, Gulbas H, Gurses I, Erkal HS, Yucel N. The histopathological evaluation
of the effectiveness of melatonin as a protectant against acute lung injury induced
by radiation therapy in a rat model. International Journal of Radiation Biology
2007;83(3):187-193.
65. Woel RT, Munley MT, Hollis D, et al. The time course of radiation therapy-induced
reductions in regional perfusion: a prospective study with >5 years of follow-up.
International journal of radiation oncology, biology, physics 2002;52(1):58-67.
66. Mah K, Van Dyk J, Keane T, Poon PY. Acute radiation-induced pulmonary
damage: a clinical study on the response to fractionated radiation therapy.
International journal of radiation oncology, biology, physics 1987;13(2):179-188.
67. Damen EM, Muller SH, Boersma LJ, de Boer RW, Lebesque JV. Quantifying local
lung perfusion and ventilation using correlated SPECT and CT data. Journal of
nuclear medicine 1994;35(5):784-792.
68. Bajc M, Neilly B, Miniati M, Mortensen J, Jonson B. Methodology for
ventilation/perfusion SPECT. Semin Nucl Med 2010;40(6):415-425.
69. Petersson J, Sanchez-Crespo A, Larsson SA, Mure M. Physiological imaging of the
lung: single-photon-emission computed tomography (SPECT). Journal of applied
physiology 2007;102(1):468-476.
70. Hoover DA, Reid RH, Wong E, et al. SPECT-based functional lung imaging for
the prediction of radiation pneumonitis: a clinical and dosimetric correlation. J Med
Imaging Radiat Oncol 2014;58(2):214-222.
71. Petersson J, Sanchez-Crespo A, Rohdin M, et al. Physiological evaluation of a new
quantitative SPECT method measuring regional ventilation and perfusion. Journal
of applied physiology 2004;96(3):1127-1136.
72. Ishimori T, Saga T, Nagata Y, et al. 18F-FDG and 11C-methionine PET for
evaluation of treatment response of lung cancer after stereotactic radiotherapy. Ann
Nucl Med 2004;18(8):669-674.
73. Hart JP, McCurdy MR, Ezhil M, et al. Radiation pneumonitis: correlation of
toxicity with pulmonary metabolic radiation response. International journal of
radiation oncology, biology, physics 2008;71(4):967-971.

49
74. McCurdy MR, Castillo R, Martinez J, et al. [18F]-FDG uptake dose-response
correlates with radiation pneumonitis in lung cancer patients. Radiotherapy and
oncology 2012;104(1):52-57.
75. Moon DH, Maddahi J, Silverman DH, Glaspy JA, Phelps ME, Hoh CK. Accuracy
of whole-body fluorine-18-FDG PET for the detection of recurrent or metastatic
breast carcinoma. Journal of nuclear medicine 1998;39(3):431-435.
76. Hicks RJ, Mac Manus MP, Matthews JP, et al. Early FDG-PET imaging after
radical radiotherapy for non-small-cell lung cancer: inflammatory changes in
normal tissues correlate with tumor response and do not confound therapeutic
response evaluation. International journal of radiation oncology, biology, physics
2004;60(2):412-418.
77. Siva S, Callahan J, Kron T, et al. A prospective observational study of Gallium-68
ventilation and perfusion PET/CT during and after radiotherapy in patients with
non-small cell lung cancer. BMC Cancer 2014;14:740.
78. Ogasawara N, Suga K, Karino Y, Matsunaga N. Perfusion characteristics of
radiation-injured lung on Gd-DTPA-enhanced dynamic magnetic resonance
imaging. Invest Radiol 2002;37(8):448-457.
79. Hatabu H, Tadamura E, Levin DL, et al. Quantitative assessment of pulmonary
perfusion with dynamic contrast-enhanced MRI. Magnet Reson Med
1999;42(6):1033-1038.
80. Shioya S, Tsuji C, Kurita D, et al. Early damage to lung tissue after irradiation
detected by the magnetic resonance T2 relaxation time. Radiat Res
1997;148(4):359-364.
81. Zhang Q, Zhang M, Liu Z, et al. Role of MR-DWI and MR-PWI in the radiotherapy
of implanted pulmonary VX-2 carcinoma in rabbits. Chin J Cancer Res
2014;26(5):532-542.
82. Thind K, Chen A, Friesen-Waldner L, et al. Detection of radiation-induced lung
injury using hyperpolarized C-13 magnetic resonance spectroscopy and imaging.
Magnet Reson Med 2013;70(3):601-609.
83. Thind K, Jensen MD, Hegarty E, et al. Mapping metabolic changes associated with
early Radiation Induced Lung Injury post conformal radiotherapy using
hyperpolarized (13)C-pyruvate Magnetic Resonance Spectroscopic Imaging.
Radiotherapy and oncology 2014;110(2):317-322.
84. Ward ER, Hedlund LW, Kurylo WC, et al. Proton and hyperpolarized helium
magnetic resonance imaging of radiation-induced lung injury in rats. International
journal of radiation oncology, biology, physics 2004;58(5):1562-1569.

50
85. Mathew L, Gaede S, Wheatley A, Etemad-Rezai R, Rodrigues GB, Parraga G.
Detection of longitudinal lung structural and functional changes after diagnosis of
radiation-induced lung injury using hyperpolarized He-3 magnetic resonance
imaging. Med Phys 2010;37(1):22-31.
86. Ireland RH, Din OS, Swinscoe JA, et al. Detection of radiation-induced lung injury
in non-small cell lung cancer patients using hyperpolarized helium-3 magnetic
resonance imaging. Radiotherapy and oncology : journal of the European Society
for Therapeutic Radiology and Oncology 2010;97(2):244-248.
87. Ouriadov A, Fox M, Hegarty E, Parraga G, Wong E, Santyr EG. Early Stage
Radiation-Induced Lung Injury Detected Using Hyperpolarized 129Xe
Morphometry: Proof-of-Concept Demonstration in a Rat Model. Mag Reson Med
2015;in press.
88. Stewart NJ, Leung G, Norquay G, et al. Experimental validation of the
hyperpolarized Xe chemical shift saturation recovery technique in healthy
volunteers and subjects with interstitial lung disease. Mag Reson Med 2014.
89. Ruppert K, Altes TA, Mata JF, Ruset IC, Hersman FW, Mugler JP, 3rd. Detecting
pulmonary capillary blood pulsations using hyperpolarized xenon-129 chemical
shift saturation recovery (CSSR) MR spectroscopy. Mag Reson Med 2015.
90. Chang YV. MOXE: a model of gas exchange for hyperpolarized 129Xe magnetic
resonance of the lung. Mag Reson Med 2013;69(3):884-890.
91. Mugler JP, 3rd, Driehuys B, Brookeman JR, et al. MR imaging and spectroscopy
using hyperpolarized 129Xe gas: preliminary human results. Magn Reson Med
1997;37(6):809-815.
92. Wolber J, Cherubini A, Leach MO, Bifone A. Hyperpolarized Xe-129 NMR as a
probe for blood oxygenation. Magnet Reson Med 2000;43(4):491-496.
93. Patz S, Hersman FW, Muradian I, et al. Hyperpolarized (129)Xe MRI: a viable
functional lung imaging modality? Eur J Radiol 2007;64(3):335-344.
94. Patz S, Muradian I, Hrovat MI, et al. Human pulmonary imaging and spectroscopy
with hyperpolarized 129Xe at 0.2T. Acad Radiol 2008;15(6):713-727.
95. Mansson S, Wolber J, Driehuys B, Wollmer P, Golman K. Characterization of
diffusing capacity and perfusion of the rat lung in a lipopolysaccaride disease model
using hyperpolarized Xe-129. Mag Reson Med 2003;50(6):1170-1179.
96. Patz S, Muradyan I, Hrovat MI, et al. Diffusion of hyperpolarized Xe-129 in the
lung: a simplified model of Xe-129 septal uptake and experimental results. New J
Phys 2011;13.

51
97. Muradian I, Patz S, Butler JP, et al. Hyperpolarized 129Xe human pulmonary gas
exchange with 3-point Dixon technique. Proceedings of the 14th Annual Meeting
of ISMRM 2006;Seattle(Washington):abstract 1297.
98. Driehuys B, Cofer GP, Pollaro J, Mackel JB, Hedlund LW, Johnson GA. Imaging
alveolar-capillary gas transfer using hyperpolarized Xe-129 MRI. Proceedings of
the National Academy of Sciences of the United States of America
2006;103(48):18278-18283.
99. Cleveland ZI, Virgincar RS, Qi Y, Robertson SH, Degan S, Driehuys B. 3D MRI
of impaired hyperpolarized 129Xe uptake in a rat model of pulmonary fibrosis.
Nmr Biomed 2014;27(12):1502-1514.
100. Qing K, Ruppert K, Jiang Y, et al. Regional mapping of gas uptake by blood and
tissue in the human lung using hyperpolarized xenon-129 MRI. J Magn Reson
Imaging 2014;39(2):346-359.
101. Haacke EM, Brown RW, Thompson MR, Venkatesan R. Magnetic Resonance
Imaging: Physical Principles and Sequence Design: Wiley: 1999.
102. Bernstein MA, King KF, Zhou XJ. Handbook of MRI Pulse Sequences: Elsevier
Science: 2004.
103. Walker TG, Happer W. Spin-exchange optical pumping of noble-gas nuclei.
Reviews of Modern Physics 1997;69(2):629-642.
104. Driehuys B, Cates GD, Miron E, Sauer K, Walter DK, Happer W. High-volume
production of laser-polarized Xe-129. Appl Phys Lett 1996;69(12):1668-1670.
105. Bauer C, Raich H, Jeschke G, Blumler P. Design of a permanent magnet with a
mechanical sweep suitable for variable-temperature continuous-wave and pulsed
EPR spectroscopy. Journal of magnetic resonance 2009;198(2):222-227.
106. Chann B, Nelson IA, Anderson LW, Driehuys B, Walker TG. Xe-129-Xe
molecular spin relaxation. Physical Review Letters 2002;88(11).
107. Ruset IC, Ketel S, Hersman FW. Optical pumping system design for large
production of hyperpolarized. Phys Rev Lett 2006;96(5):053002.
108. Hersman FW, Ruset IC, Ketel S, et al. Large production system for hyperpolarized
129Xe for human lung imaging studies. Acad Radiol 2008;15(6):683-692.
109. Zhao L, Mulkern R, Tseng CH, et al. Gradient-Echo Imaging Considerations for
Hyperpolarized 129Xe MR. Journal of magnetic resonance Series B
1996;113(2):179-183.
110. Tan H, Meyer CH. Estimation of k-space trajectories in spiral MRI. Mag Reson
Med 2009;61(6):1396-1404.

52
111. Viallon M, Berthezene Y, Callot V, et al. Dynamic imaging of hyperpolarized He-
3 distribution in rat lungs using interleaved-spiral scans. Nmr Biomed
2000;13(4):207-213.
112. Mayer D, Yen YF, Takahashi A, et al. Dynamic and High-Resolution Metabolic
Imaging of Hyperpolarized [1-C-13]-Pyruvate in the Rat Brain Using a High-
Performance Gradient Insert. Magn Reson Med 2011;65(5):1228-1233.
113. Reeder SB, Pineda AR, Wen Z, et al. Iterative decomposition of water and fat with
echo asymmetry and least-squares estimation (IDEAL): application with fast spin-
echo imaging. Magn Reson Med 2005;54(3):636-644.
114. Dixon WT. Simple proton spectroscopic imaging. Radiology 1984;153(1):189-
194.
115. Hardy PA, Hinks RS, Tkach JA. Separation of fat and water in fast spin-echo MR
imaging with the three-point Dixon technique. J Magn Reson Imaging
1995;5(2):181-185.
116. Reeder SB, Wen Z, Yu H, et al. Multicoil Dixon chemical species separation with
an iterative least-squares estimation method. Magn Reson Med 2004;51(1):35-45.
117. Glover GH. Multipoint Dixon technique for water and fat proton and susceptibility
imaging. J Magn Reson Imaging 1991;1(5):521-530.
53
Chapter 2 : RF Coil Configuration for Hyperpolarized 129Xe
This chapter is adapted from the published paper: Doganay O, Thind K, Wade T, Ouriadov
A, Santyr GE. Transmit-Only/Receive-Only Radiofrequency Coil Configuration for
Hyperpolarized 129Xe MRI of Rat Lungs. Concepts Magn Reson. doi:10.1002/cmr.b.21288
2.1 Introduction
Hyperpolarized 129Xe is a useful inhaled contrast agent for Magnetic Resonance Imaging
(MRI) of the lung air space and promises to provide unique functional information due to
its solubility and significant chemical shift (200 ppm) when dissolved in lung tissues (1).
In particular, MRI of the gas and dissolved phases of 129Xe can be used to quantify the rate
of transfer of xenon between the air space and the lung tissue and the red blood cells (RBC),
providing regional information about pulmonary gas exchange (2). Hyperpolarized 129Xe
MRI has been useful for development of biomarkers in rodent (i.e. rat and mouse) models
of lung injury and disease, including emphysema (3,4). Rodent models provide a powerful
approach for modeling of lung diseases and developing new therapeutic targets (5), but the
tools are only beginning to be established.
Imaging of 129Xe dissolved in lung tissues is challenging due to modest solubility and
relatively low tissue density in the lung, resulting in a relatively low signal, which is
approximately two percent of the hyperpolarized 129Xe gas signal (6-8). Furthermore, lung
volumes in rats are typically small (~ 5 to 10 mL) (9), requiring sensitive radiofrequency
(RF) receiver coils for detection. Another important consideration is that hyperpolarized

54
MRI benefits by the use of accurate flip angles (i.e. transmit B1+ field) delivered uniformly
over the imaging volume, particularly to exploit variable flip angle approaches which make
most efficient use of the non-renewable magnetization (10,11). Hyperpolarized 129Xe MRI
of the rat lung therefore would benefit from an RF coil configuration which combines high
sensitivity in receive mode with a uniform transmit field (B1+) over the entire lung volume.
RF sensitivity can be improved by using a surface coil to maximize sensitivity (B1-) over a
smaller region of interest (12-14). However, when using this same coil to transmit, surface
coil sensitivity decreases with increasing distance from the coil elements leading to an
inhomogeneous B1+ field (15,16). A potential solution to this problem, is to use a surface
coil for receive and a birdcage transmit coil for transmission of the RF pulse, the latter
providing a homogeneous transmit field across the lungs. Such transmit-only/receive-only
(TO/RO) coil configurations have been demonstrated for clinical hyperpolarized 129Xe and
3He gas MRI of human lungs (17-19). Additionally, the use of TO/RO coil configurations
has been motivated by the desire to improve SNR or reduce image acquisition time as
previously shown for other nuclei including 13C (20) and 23Na (21) for small animal
imaging.
Despite the significant interest in hyperpolarized 129Xe MR imaging of rat lungs, the
literature mostly describes the use of birdcage transmit/receive (T/R) volume coils (9,22),
with little attention to TO/RO approaches. A custom-made TO/RO coil configuration was
developed for hyperpolarized 129Xe imaging of rat lungs at low field (0.07T) and optimized
by reducing the noise using Litz wire and geometric de-coupling between saddle-shaped
transmit coils and multi-turn saddle-shaped receive coils (23,24). Another TO/RO design
has been proposed at high field based on the use of two volumetric birdcage coils for

55
imaging of dissolved phase hyperpolarized 129Xe in rat brain (25). In this study, we present
a novel RF transmit-only/receive-only (TO/RO) coil configuration providing excellent
transmit uniformity as well as high SNR for hyperpolarized 129Xe MR lung imaging of rat
lungs at 3T (35.34 MHz). Transmission is accomplished by a birdcage coil with uniform
B1+ field uniformity and reception is performed by a closely-coupled saddle-shaped surface
coil conforming to the rat lung and accommodating ventilation, surgical access and drug
delivery. SNR and B1- uniformity improvement of the TO/RO coil configuration compared
to a commercially-made transmit/receive (T/R) birdcage volume coil are demonstrated
theoretically and verified experimentally in 129Xe gas phantoms.
2.2 Methods
A TO/RO coil configuration was designed and constructed consisting of three components:
(i) a high-pass birdcage transmit coil that produced a homogeneous B1+ magnetic field
which could also be used in T/R mode, (ii) a saddle-shaped receive-only surface coil that
couples closely to the rat lung, (iii) a fast switching circuit and RF shielding as shown in
Figure 2.1 (a). Switching between transmit and receive modes was achieved as previously
described (20). Briefly, a fast MOSFET switch circuit was gated using the DC (5 V)
component of the transmit signal from the MRI system. Since the gate threshold voltage of
the MOSFET circuit (FDP8030L, Fairchild corp., California, USA) was 2V, the 5 V bias
was more than adequate to switch between the transmit and receive modes. On transmit,
the MOSFET switch circuit was DC biased, and a fast switch power supply (U8002A,
Agilent Technologies, Malaysia) provided a 5V DC bias to activate PIN diodes in order to
switch on the transmit coil and de-tune the receive coil using a de-tuning circuit. On receive

56
(no MOSFET bias), the receive coil was returned to resonance (35.34 MHz) and the
transmit coil was deactivated through the use of PIN diodes (um9415, Microsemi corp.,
Watertown, MA), located in each rung element. DC bias from the constant current
power supply to the PIN diodes passed through two chokes (Axial RF choke 3.9 µH,
Bourns Inc., Riverside, CA) to isolate the high frequency noise of the power supply
as shown in a simplified circuit diagram in Figure 2.1 (b).
Figure 2.1: Schematic view of the TO/RO configuration (a) consisting of: (i) high-pass
birdcage transmit coil, comprised of two end-rings of 12 cm diameter and eight rungs with
a length of 16.5 cm each, (ii) saddle-shaped surface coil, and (iii) RF shielding. Tuning
capacitors are placed in the end-rings. Simplified circuit diagram of transmit coil (b). CB
denotes blocking capacitor to block DC component of the transmit signal, CM and CT are
tuning and matching capacitors, respectively. Simplified circuit diagram of saddle-shaped,
receive surface coil (c). U denotes the aperture angle. The distance from points A to B is
55 mm, from C to D is 60 mm and from E to F is 23 mm.
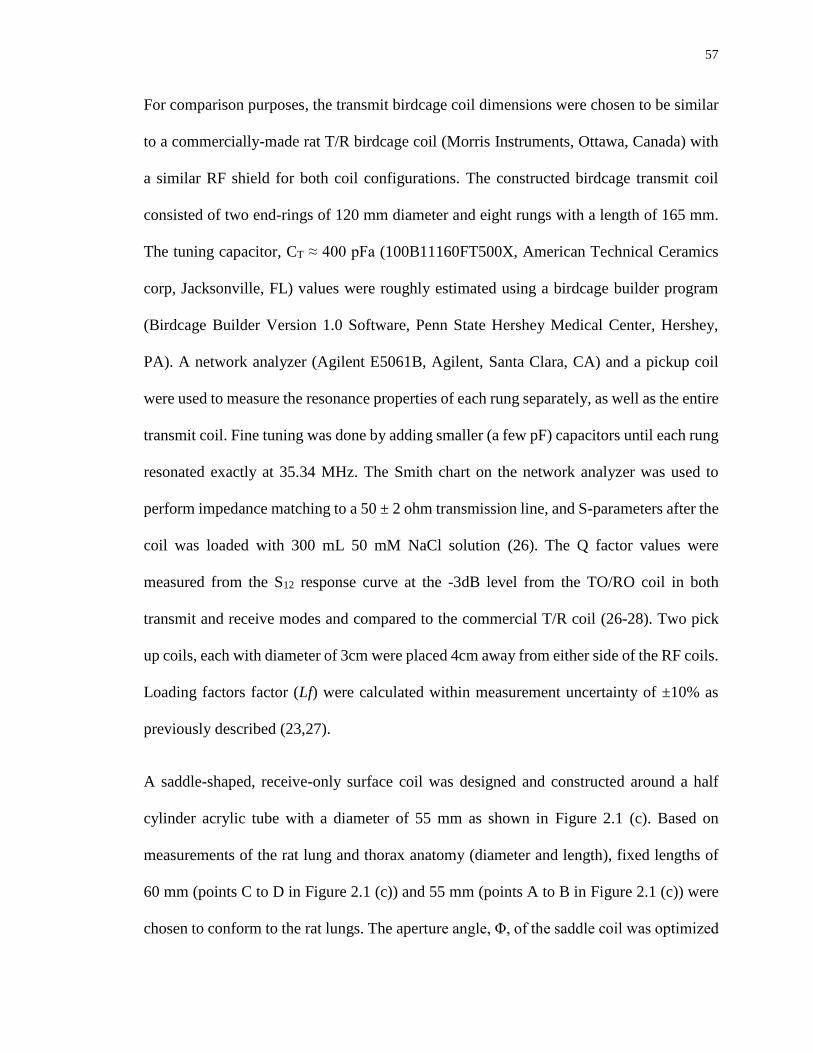
57
For comparison purposes, the transmit birdcage coil dimensions were chosen to be similar
to a commercially-made rat T/R birdcage coil (Morris Instruments, Ottawa, Canada) with
a similar RF shield for both coil configurations. The constructed birdcage transmit coil
consisted of two end-rings of 120 mm diameter and eight rungs with a length of 165 mm.
The tuning capacitor, CT ≈ 400 pFa (100B11160FT500X, American Technical Ceramics
corp, Jacksonville, FL) values were roughly estimated using a birdcage builder program
(Birdcage Builder Version 1.0 Software, Penn State Hershey Medical Center, Hershey,
PA). A network analyzer (Agilent E5061B, Agilent, Santa Clara, CA) and a pickup coil
were used to measure the resonance properties of each rung separately, as well as the entire
transmit coil. Fine tuning was done by adding smaller (a few pF) capacitors until each rung
resonated exactly at 35.34 MHz. The Smith chart on the network analyzer was used to
perform impedance matching to a 50 ± 2 ohm transmission line, and S-parameters after the
coil was loaded with 300 mL 50 mM NaCl solution (26). The Q factor values were
measured from the S12 response curve at the -3dB level from the TO/RO coil in both
transmit and receive modes and compared to the commercial T/R coil (26-28). Two pick
up coils, each with diameter of 3cm were placed 4cm away from either side of the RF coils.
Loading factors factor (Lf) were calculated within measurement uncertainty of ±10% as
previously described (23,27).
A saddle-shaped, receive-only surface coil was designed and constructed around a half
cylinder acrylic tube with a diameter of 55 mm as shown in Figure 2.1 (c). Based on
measurements of the rat lung and thorax anatomy (diameter and length), fixed lengths of
60 mm (points C to D in Figure 2.1 (c)) and 55 mm (points A to B in Figure 2.1 (c)) were
chosen to conform to the rat lungs. The aperture angle, Φ, of the saddle coil was optimized
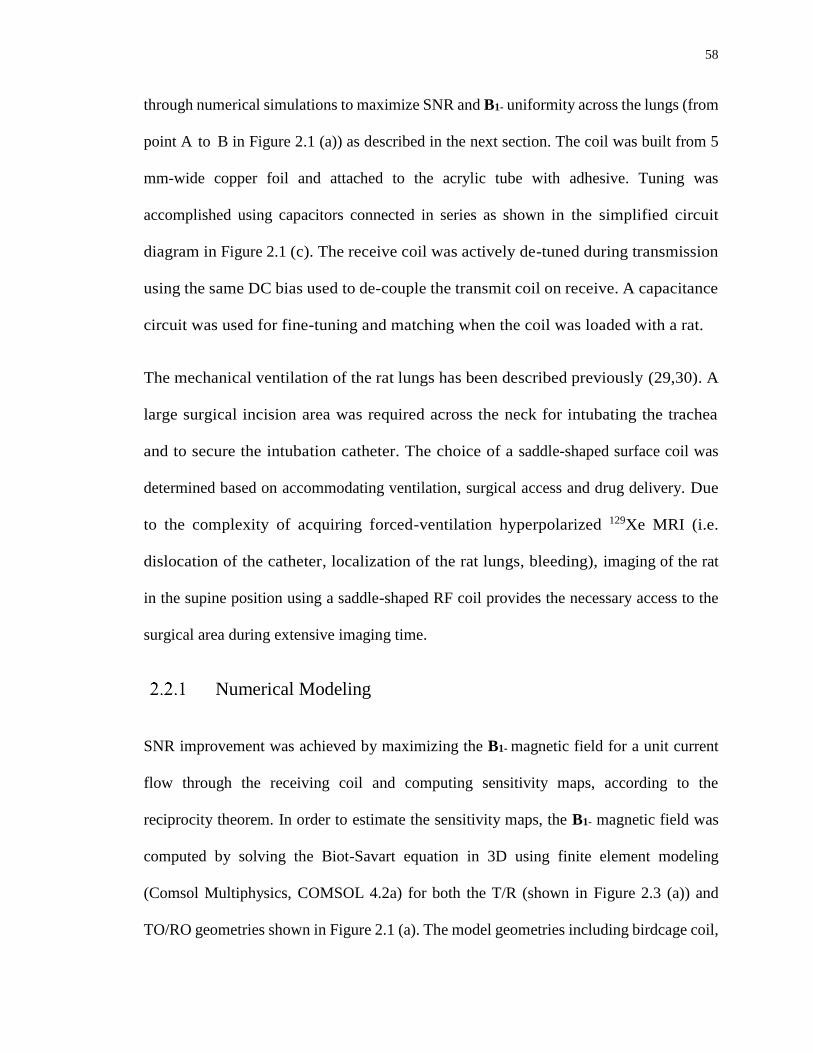
58
through numerical simulations to maximize SNR and B1- uniformity across the lungs (from
point A to B in Figure 2.1 (a)) as described in the next section. The coil was built from 5
mm-wide copper foil and attached to the acrylic tube with adhesive. Tuning was
accomplished using capacitors connected in series as shown in the simplified circuit
diagram in Figure 2.1 (c). The receive coil was actively de-tuned during transmission
using the same DC bias used to de-couple the transmit coil on receive. A capacitance
circuit was used for fine-tuning and matching when the coil was loaded with a rat.
The mechanical ventilation of the rat lungs has been described previously (29,30). A
large surgical incision area was required across the neck for intubating the trachea
and to secure the intubation catheter. The choice of a saddle-shaped surface coil was
determined based on accommodating ventilation, surgical access and drug delivery. Due
to the complexity of acquiring forced-ventilation hyperpolarized 129Xe MRI (i.e.
dislocation of the catheter, localization of the rat lungs, bleeding), imaging of the rat
in the supine position using a saddle-shaped RF coil provides the necessary access to the
surgical area during extensive imaging time.
Numerical Modeling
SNR improvement was achieved by maximizing the B1- magnetic field for a unit current
flow through the receiving coil and computing sensitivity maps, according to the
reciprocity theorem. In order to estimate the sensitivity maps, the B1- magnetic field was
computed by solving the Biot-Savart equation in 3D using finite element modeling
(Comsol Multiphysics, COMSOL 4.2a) for both the T/R (shown in Figure 2.3 (a)) and
TO/RO geometries shown in Figure 2.1 (a). The model geometries including birdcage coil,
59
receive coil and shielding were meshed using a free tetrahedral mesh with a minimum
element size of 0.01 mm. The shielding was modelled as a magnetic shielding boundary
condition with the relative permeability of 7000 and thickness of 1 mm (based on shielding
material). Rungs and rings were modeled corresponding to copper foil’s electrical
properties. The model was solved in the magnetic field interface under the AC/DC branch
(31). Next, sensitivity maps were calculated by normalizing B1- by the surface area of each
receiver coil in order to: (i) compare coil performances and (ii) calculate the image
uniformity. A percentage uniformity, U, was calculated from simulations and axial images
for both coil configurations for four identical circular regions-of-interest (ROIs) to
approximate the coverage of the lungs as shown in Figure 2.4(b) (32). The percentage
uniformity was calculated for each ROI as:
U = 100 × ( 1- [(Smax - Smin) / (Smax+Smin)] ) [2.1]
;where Smax and Smin are the maximum and minimum signal intensities within the ROI.
Considering that the rat lung occupies a volume at the center of the transmit coil with
dimensions of 4cm x 4cm x 4cm, the geometry of the saddle-shaped coil was optimized for
a body weight up to 400 g (33). B1- field profiles from point A to B, C to D and E to F were
investigated as a function of aperture angle (Φ). The total sensitivity was quantified as a
function of aperture angle using of the area under simulated B1- field profiles from point A
to B as shown in Figure 2.2 (b). The SNR was expected to be proportional to the area under
the sensitivity profiles as shown in Figure 2.2 (c) for the same RF shielding and the
phantom. The noise variations including conductivity, radiation, and sample inductive
loses, for each aperture angle was considered by scaling the area under the sensitivity
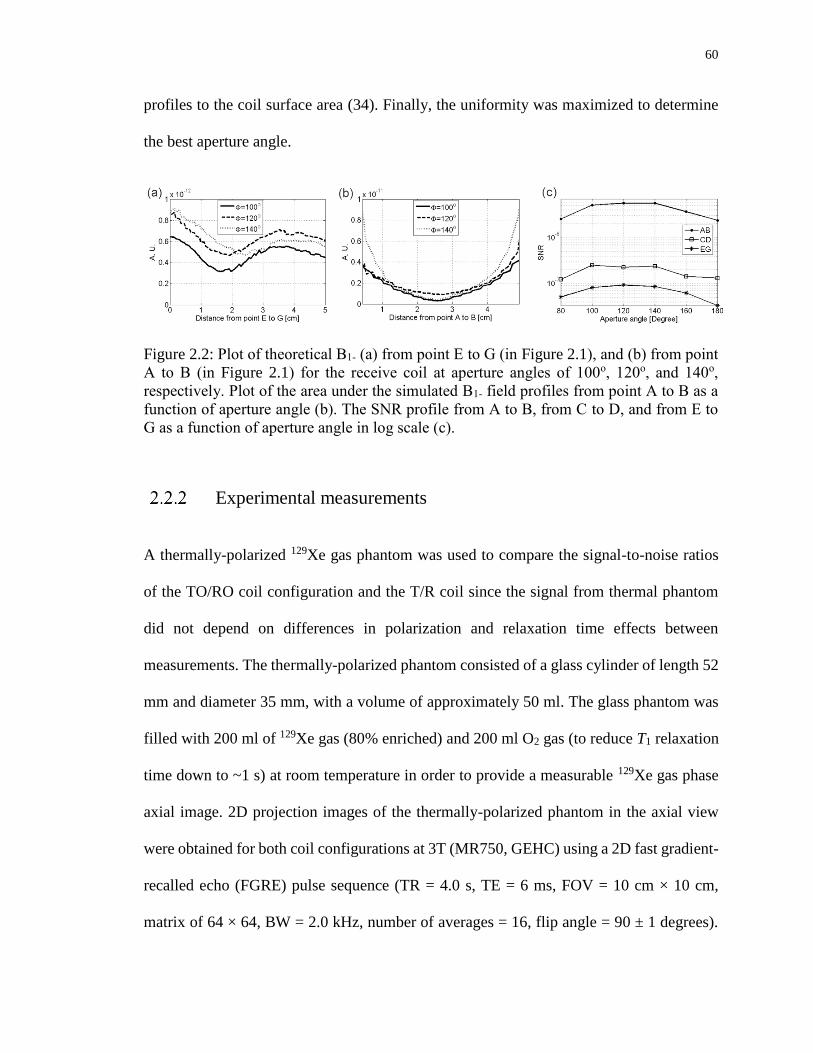
60
profiles to the coil surface area (34). Finally, the uniformity was maximized to determine
the best aperture angle.
Figure 2.2: Plot of theoretical B1- (a) from point E to G (in Figure 2.1), and (b) from point
A to B (in Figure 2.1) for the receive coil at aperture angles of 100o, 120o, and 140o,
respectively. Plot of the area under the simulated B1- field profiles from point A to B as a
function of aperture angle (b). The SNR profile from A to B, from C to D, and from E to
G as a function of aperture angle in log scale (c).
Experimental measurements
A thermally-polarized 129Xe gas phantom was used to compare the signal-to-noise ratios
of the TO/RO coil configuration and the T/R coil since the signal from thermal phantom
did not depend on differences in polarization and relaxation time effects between
measurements. The thermally-polarized phantom consisted of a glass cylinder of length 52
mm and diameter 35 mm, with a volume of approximately 50 ml. The glass phantom was
filled with 200 ml of 129Xe gas (80% enriched) and 200 ml O2 gas (to reduce T1 relaxation
time down to ~1 s) at room temperature in order to provide a measurable 129Xe gas phase
axial image. 2D projection images of the thermally-polarized phantom in the axial view
were obtained for both coil configurations at 3T (MR750, GEHC) using a 2D fast gradient-
recalled echo (FGRE) pulse sequence (TR = 4.0 s, TE = 6 ms, FOV = 10 cm × 10 cm,
matrix of 64 × 64, BW = 2.0 kHz, number of averages = 16, flip angle = 90 ± 1 degrees).

61
A free induction decay (FID) was used to find the 90o flip angle by adjusting the transmit
gain to achieve a maximum signal. Image SNR was calculated using the dual acquisition
technique (35). The mean value of a circular region of interest (15 pixel diameter) covering
most of the axial image was divided by the standard deviation from the same ROI with in
within a subtraction image. A B1+ map was obtained from the TO/RO coil using the
thermally-polarized phantom and a non-inverted double angle Look-Locker (niDALL)
technique with nominal flip angles of α1 = 60±1o and α2 = 2α1 sequence (TR = 5.0 s, FOV
= 8 cm × 8 cm, matrix of 32 × 32, BW = 2.0 kHz, number of averages = 8) (36-38).
For uniformity measurements, a 2D fast gradient-recalled echo sequence (FGRE) pulse
sequence implementing a variable flip angle (39) used to acquire projection images of a
hyperpolarized 129Xe gas phantom in the axial view for both coil configurations (TR = 100
ms, TE = 4 ms, FOV = 10 cm × 10 cm, matrix of 64 × 64, BW = 5.0 kHz). The
hyperpolarized 129Xe gas phantom consisted of a 125 mL plastic bottle (2401-0250 Wash
bottles, Thermo Scientific Nalgene, Rochester, NY) of diameter 55 mm filled with
hyperpolarized, naturally-abundant 129Xe gas (polarized to approximately 5%) using a
home-built polarizer described previously (11).
Imaging of a healthy Sprague Dawley rat (380 g, Charles River Laboratories, Saint-
Constant, Canada) was performed using a MRI-compatible mechanical ventilator (GE
Healthcare, Malmo, Sweden) for delivery of Hp 129Xe to the lung following an animal care
protocol approved by the Animal Care and Veterinary Service of Western University (30).
2D projection MR images were obtained from the same rat in the supine position following
five breaths of Hp 129Xe. The FGRE pulse sequence parameters were as follows: TR = 20
ms, TE = 4 ms, FOV = 7 cm × 7 cm, matrix of 48 × 48, BW = 4.0 kHz. Coronal images

62
were repeated six times in intervals of two minutes. A fresh bag of Hp 129Xe was used for
each coil within 15 minutes following the preparation of polarized gas to ensure that the
polarization (approximately 5%) was the same for each coil.
2.3 Results
The electrical properties of the TO/RO in both transmit and receive modes and the
commercial T/R birdcage coils using the network analyzer with a span of 5 MHz are shown
in Table 2.1. The reflected power, S11, measurements showed that the variations in
resonance frequencies for both transmit and receive modes (loaded) were less than 20 kHz
at the MR scanner (3 T) for the TO/RO coil. The loading factors were 0.27 and 0.24 for the
TO/RO in receive mode and transmit mode respectively. For comparison, the loading factor
for the commercial T/R birdcage coil was 0.23. Isolation between quadrature channels, S12,
was measured to be greater than 20 dB for the phantom and rat loading. This indicates that
there is adequate decoupling between quadrature channels in transmit. To minimize the
coupling between birdcage coil and saddle-shaped receive coil for the TO/RO
configuration, the resonance frequency for the saddle-shaped surface coil was detuned to 5
MHz away from the resonance frequency of transmit coil during the transmit mode.
Table 2.1: Network analyzer measurement of the electrical properties of the TO/RO coil
in receive mode and transmit mode respectively and the commercial T/R birdcage coil
configurations.
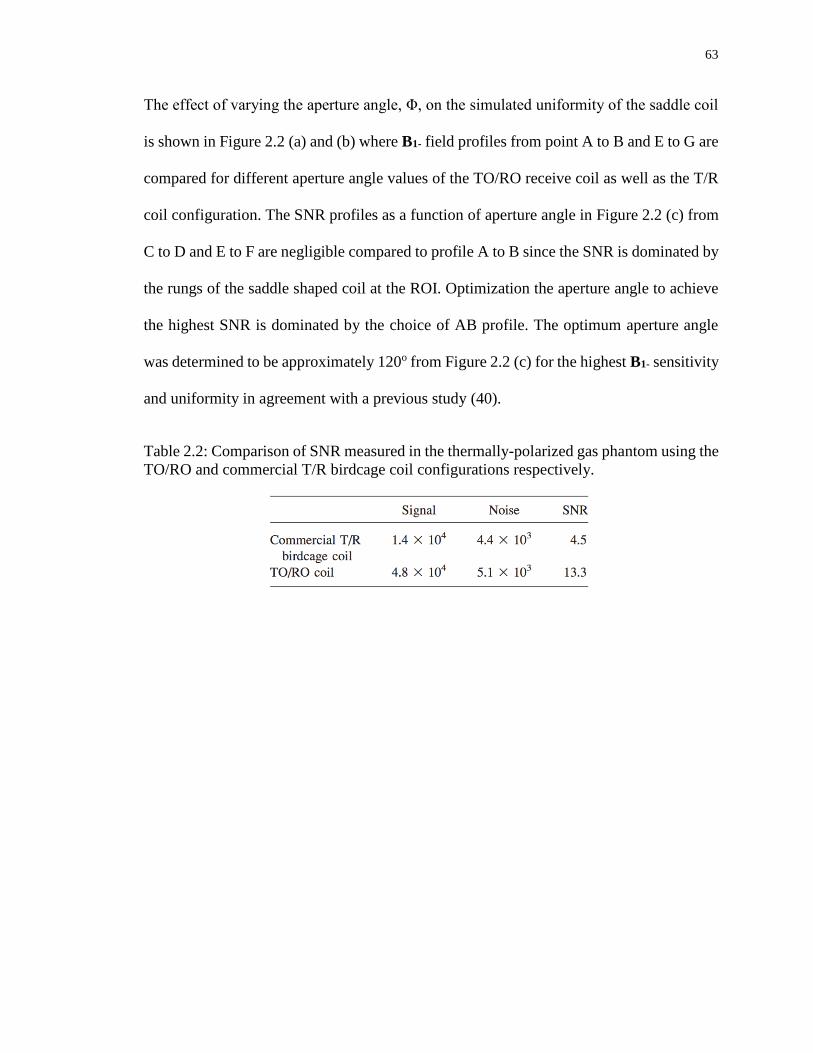
63
The effect of varying the aperture angle, Φ, on the simulated uniformity of the saddle coil
is shown in Figure 2.2 (a) and (b) where B1- field profiles from point A to B and E to G are
compared for different aperture angle values of the TO/RO receive coil as well as the T/R
coil configuration. The SNR profiles as a function of aperture angle in Figure 2.2 (c) from
C to D and E to F are negligible compared to profile A to B since the SNR is dominated by
the rungs of the saddle shaped coil at the ROI. Optimization the aperture angle to achieve
the highest SNR is dominated by the choice of AB profile. The optimum aperture angle
was determined to be approximately 120o from Figure 2.2 (c) for the highest B1- sensitivity
and uniformity in agreement with a previous study (40).
Table 2.2: Comparison of SNR measured in the thermally-polarized gas phantom using the
TO/RO and commercial T/R birdcage coil configurations respectively.
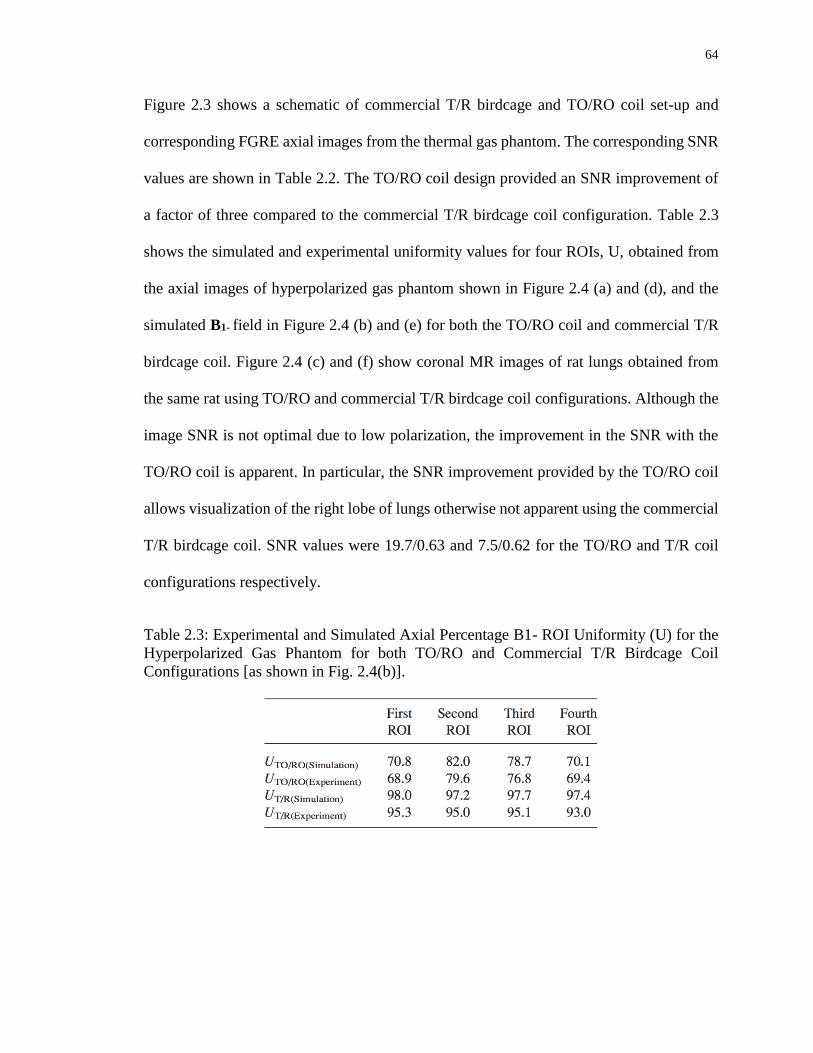
64
Figure 2.3 shows a schematic of commercial T/R birdcage and TO/RO coil set-up and
corresponding FGRE axial images from the thermal gas phantom. The corresponding SNR
values are shown in Table 2.2. The TO/RO coil design provided an SNR improvement of
a factor of three compared to the commercial T/R birdcage coil configuration. Table 2.3
shows the simulated and experimental uniformity values for four ROIs, U, obtained from
the axial images of hyperpolarized gas phantom shown in Figure 2.4 (a) and (d), and the
simulated B1- field in Figure 2.4 (b) and (e) for both the TO/RO coil and commercial T/R
birdcage coil. Figure 2.4 (c) and (f) show coronal MR images of rat lungs obtained from
the same rat using TO/RO and commercial T/R birdcage coil configurations. Although the
image SNR is not optimal due to low polarization, the improvement in the SNR with the
TO/RO coil is apparent. In particular, the SNR improvement provided by the TO/RO coil
allows visualization of the right lobe of lungs otherwise not apparent using the commercial
T/R birdcage coil. SNR values were 19.7/0.63 and 7.5/0.62 for the TO/RO and T/R coil
configurations respectively.
Table 2.3: Experimental and Simulated Axial Percentage B1- ROI Uniformity (U) for the
Hyperpolarized Gas Phantom for both TO/RO and Commercial T/R Birdcage Coil
Configurations [as shown in Fig. 2.4(b)].
65
Figure 2.3: Schematic of thermal gas phantom and commercial T/R birdcage coil
configuration (a) consisting of two end- rings of 12 cm diameter and eight rungs of length
18.0 cm each. Also shown is the corresponding axial image from the phantom (b). The
saddle-shaped surface coil is shown schematically in (c) (transmit coil has been omitted)
along with the phantom. Also shown is the corresponding axial image from the phantom
(d).

66
Figure 2.4: Axial images of hyperpolarized gas phantom using the commercial T/R
birdcage coil (a) and the corresponding simulated B1- sensitivity map (b). Coronal image
of rat lungs using the commercial T/R birdcage coil (c). Axial image of the hyperpolarized
gas phantom using the TO/RO coil configuration (d) and the corresponding simulated B1-
sensitivity map (e). Coronal image of rat lungs using the TO/RO coil (f).
The calculated B1+ map and flip angle profile for the TO/RO coil is shown in Figure 2.5
(a) and (b) respectively. The flip angle distribution was relatively homogenous with a mean
flip angle of 60.2±1.6o. As expected, the mean flip angle was approximately the same as
the prescribed nominal flip angle α1 = 60±1o.

67
Figure 2.5: (a) B1 map and (b) the flip angle profile (from A to B as shown in Figure 2.1)
obtained from the TO/RO coil using the thermally polarized phantom.
2.4 Discussion
The TO/RO coil configuration provides a homogeneous excitation field and a high
sensitivity for 129Xe MRI of the rat lung. MR images from a thermally- polarized phantom
confirm that a novel TO/RO configuration provides an improvement in SNR of up to a
factor of approximately three compared to a commercial T/R birdcage coil of comparable
geometry. The Q factor measurements allow a preliminary evaluation of the coil sensitivity
depending on the various conditions including the coil dimensions (i.e. the B1- sensitivity
and inductance), shielding, resonance frequency and loading conditions. As expected, the
Q factor of the TO/RO coil in transmit mode was 20% that of the commercial T/R birdcage
coil due to the additional required pin diodes and chokes (as shown in Figure 2.1 (b)) for
the switch circuits. We also noticed that the SNR performance of the TO/RO coil in T/R
mode reduced after adding the necessary components and receive coil. Considering the
same birdcage coil dimension used in our TO/RO and the commercial T/R coil
configurations, the SNR of TO/RO coil in T/R mode was expected to be lower than the
commercial T/R coil proportional to the square root of the Q factor (23). Although the

68
quality factors between the commercial T/R birdcage coil and our saddle-shaped receive
TO/RO coil cannot be directly compared due to the difference in dimensions, the loading
factors can be compared to estimate the ohmic and electromagnetic losses. Based on the
benchtop experiments, Lf was approximately the same for both coil configurations
confirming that the coil is operating in the coil noise dominated regime and loading the coil
with a rat-sized conductor (300 gr, 0.48S/m) does not significantly affect the SNR.
The transmit coil of the TO/RO configuration used here was designed to take advantage of
the highly homogeneous transmit field of the birdcage geometry for imaging of
hyperpolarized 129Xe gas and dissolved phases, known to be sensitive to flip angle
variations. Therefore, investigation of the TO/RO configuration in a “T/R” mode was not
considered in the imaging and SNR comparison due to the expected lower efficiency
compared to the purpose-built commercial birdcage T/R coil. The commercial T/R
birdcage coil used here did not require the additional switch circuits but had the same
birdcage coil dimensions as the TO/RO configuration. Therefore, it was considered a
reasonable gold standard for the purposes of comparison between the TO/RO mode and a
best-case T/R mode. Nonetheless, one of the limitations of the TO/RO design used here
was the lower efficiency in T/R mode which could presumably be improved in future if
required.
When the aperture angles of receive coils are compared, both 120o and 140o showed a high
sensitivity (Figure 2.2 (c)). However, the B1- sensitivity profile at 120o is much more
uniform compared to 140o with a strong increasing signal toward the edges and decreasing
at the center. This confirms that the choice of receive aperture angle of 120o was a good
trade-off between overall B1- sensitivity and uniformity. Further SNR improvements with

69
the TO/RO approach should be possible using a multichannel receiver coil design
(17,19,41).
The numerical simulations of B1+ uniformity for the TO/RO configuration shows
reasonable agreement with the experimental values (Table 3). Simulated B1+ uniformity
was approximately 70% at ROI one and four, and approximately 80% at ROI three and
four for the axial images (Figure 2.4 (e) and Table 2.3). As expected, the T/R coil had better
uniformity (~95%) for the same ROIs (Fig 4 (b)). The difference between experiments and
simulated uniformity (~3%) are likely due to the small variations in excitation flip angle.
The percentage variation in the simulated B1+ uniformity is less than 3% at each of the
ROIs, which was in agreement with the early experimental measurement of B1+ for the
commercial T/R coil (39). Although the B1+ maps of the TO/RO in T/R mode were not
measured in this work, they are expected to be better than B1+ maps of the TO/RO since it
includes the B1+ inhomogeneity due to the receive coil. B1+ profile obtained using TO/RO
coil exhibited a uniform flip angle distribution with flip angle variations less than 3% of
the nominal flip angle which was similar to the previously published study (20).
The thermally-polarized phantom experiments were more consistent for comparing the
SNR between TO/RO and T/R coil configurations since the in vivo signal strongly depends
on animal ventilation conditions, including polarized bag pressure, ventilation or surgical
related defects of the lungs while transferring from one coil to another, and the amount of
polarization. Although the signal is sensitive to the experimental conditions, similar noise
values were observed when the coils were loaded with rat and thermally-polarized
phantoms. The results show the SNR improvement corresponds to an increased sensitivity
for the surface coil for both the thermal phantom and in vivo (loaded) configurations.

70
2.5 Conclusion
The use of a TO/RO radiofrequency coil configuration is advantageous for MRI of
hyperpolarized 129Xe providing an approximate three-fold SNR improvement, with a B1+
transmit field variation of less than three percent. Although the B1- reception sensitivity is
less uniform (approximately 30 %) compared to a T/R (i.e. birdcage) coil, this can be
corrected by post-processing based on the simulated or measured reception sensitivity
profile of the receive coil.
71
2.6 References
1. Mugler JP, 3rd, Altes TA, Ruset IC, et al. Simultaneous magnetic resonance
imaging of ventilation distribution and gas uptake in the human lung using
hyperpolarized xenon-129. Proceedings of the National Academy of Sciences of
the United States of America 2010;107(50):21707-21712.
2. Freeman MS, Cleveland ZI, Qi Y, Driehuys B. Enabling hyperpolarized (129) Xe
MR spectroscopy and imaging of pulmonary gas transfer to the red blood cells in
transgenic mice expressing human hemoglobin. Magn Reson Med 2013 ;70(5):
1192-1199.
3. Boudreau M, Xu X, Santyr GE. Measurement of 129Xe gas apparent diffusion
coefficient anisotropy in an elastase-instilled rat model of emphysema. Mag Reson
in Med 2013;69(1):211-220.
4. Mansson S, Wolber J, Driehuys B, Wollmer P, Golman K. Characterization of
diffusing capacity and perfusion of the rat lung in a lipopolysaccaride disease model
using hyperpolarized Xe-129. Magn Reson Med 2003;50(6):1170-1179.
5. Santyr GE, Lam WW, Parra-Robles JM, Taves TM, Ouriadov AV. Hyperpolarized
noble gas magnetic resonance imaging of the animal lung: Approaches and
applications. J Appl Phys 2009;105(10).
6. Driehuys B, Cofer GP, Pollaro J, Mackel JB, Hedlund LW, Johnson GA. Imaging
alveolar-capillary gas transfer using hyperpolarized Xe-129 MRI. Proceedings of
the National Academy of Sciences of the United States of America
2006;103(48):18278-18283.
7. Patz S, Muradian I, Hrovat MI, et al. Human pulmonary imaging and spectroscopy
with hyperpolarized Xe-129 at 0.2T. Acad Radiol 2008;15(6):713-727.
8. Fox MS, Ouriadov A, Thind K, et al. Detection of radiation induced lung injury in
rats using dynamic hyperpolarized Xe-129 magnetic resonance spectroscopy. Med
Phys 2014;41(7).
9. Fox MS, Ouriadov A, Santyr GE. Comparison of Hyperpolarized He-3 and Xe-129
MRI for the Measurement of Absolute Ventilated Lung Volume in Rats. Magn
Reson Med 2014;71(3):1130-1136.
10. Couch MJ, Ouriadov A, Santyr GE. Regional ventilation mapping of the rat lung
using hyperpolarized 129Xe magnetic resonance imaging. Magn Reson Med
2012;68(5):1623-1631.
11. Ouriadov AV, Lam WW, Santyr GE. Rapid 3-D mapping of hyperpolarized He-3
spin-lattice relaxation times using variable flip angle gradient echo imaging with
72
application to alveolar oxygen partial pressure measurement in rat lungs. Magn
Reson Mater Phy 2009;22(5):309-318.
12. Wild JM, Paley MNJ, Viallon M, Schreiber WG, van Beek EJR, Griffiths PD. k-
space filtering in 2D gradient-echo breath-hold hyperpolarized He-3 MRI: Spatial
resolution and signal-to-noise ratio considerations. Magn Reson Med
2002;47(4):687-695.
13. Doty FD, Entzminger G, Kulkarni J, Pamarthy K, Staab JP. Radio frequency coil
technology for small-animal MRI. Nmr Biomed 2007;20(3):304-325.
14. Dominguez-Viqueira W, Lau AZ, Chen AP, Cunningham CH. Multichannel
receiver coils for improved coverage in cardiac metabolic imaging using
prepolarized 13C substrates. Mag Reson Med 2013;70(1):295-300.
15. Barberi EA, Gati JS, Rutt BK, Menon RS. A transmit-only/receive-only (TORO)
RF system for high-field MRI/MRS applications. Magn Reson Med
2000;43(2):284-289.
16. Jin J. Electromagnetic Analysis and Design in Magnetic Resonance Imaging: CRC
Press: 1998.
17. Dregely I, Ruset IC, Wiggins G, et al. 32-channel phased-array receive with
asymmetric birdcage transmit coil for hyperpolarized xenon-129 lung imaging.
Magn Reson Med 2013;70(2):576-583.
18. Deppe MH, Teh K, Parra-Robles J, Lee KJ, Wild JM. Slice profile effects in 2D
slice-selective MRI of hyperpolarized nuclei. Journal of magnetic resonance
2010;202(2):180-189.
19. Lee RF, Johnson G, Grossman RI, Stoeckel B, Trampel R, McGuinness G.
Advantages of parallel imaging in conjunction with hyperpolarized helium- A new
approach to MRI of the lung. Magn Reson Med 2006;55(5):1132-1141.
20. Lim H, Thind K, Martinez-Santiesteban FM, Scholl TJ. Construction and
Evaluation of a Switch-Tuned C-13 - H-1 Birdcage Radiofrequency Coil for
Imaging the Metabolism of Hyperpolarized C-13-Enriched Compounds. J Magn
Reson Imaging 2014;40(5):1082-1090.
21. Wetterling F, Tabbert M, Junge S, Gallagher L, Macrae IM, Fagan AJ. A double-
tuned H-1/Na-23 dual resonator system for tissue sodium concentration
measurements in the rat brain via Na-MRI. Phys Med Biol 2010;55(24):7681-7695.
22. Cleveland ZI, Moller HE, Hedlund LW, et al. In Vivo MR Imaging of Pulmonary
Perfusion and Gas Exchange in Rats via Continuous Extracorporeal Infusion of
Hyperpolarized Xe-129. PloS one 2012;7(2).

73
23. Dominguez-Viqueira W, Berger W, Parra-Robles J, Santyr GE. Litz Wire
Radiofrequency Receive Coils for Hyperpolarized Noble Gas MR Imaging of
Rodent Lungs at 73.5 mT. Concept Magn Reson B 2010;37b(2):75-85.
24. Carias MF, Dominguez-Viqueira W, Santyr GE. Improving Signal-to-Noise Ratio
of Hyperpolarized Noble Gas MR Imaging at 73.5 mT Using Multiturn Litz Wire
Radiofrequency Receive Coils. Concept Magn Reson B 2011;39b(1):37-42.
25. Asfour A. A three-coil RF probe-head at 2.35 T: potential applications to the Na-
23 and to the hyperpolarized Xe-129 MRI in small animals. Ieee Eng Med Bio
2010:5693-5699.
26. Mispelter J, Lupu M, Briguet A. NMR Probeheads for Biophysical and Biomedical
Experiments: Theoretical Principles & Practical Guidelines: Imperial College
Press: 2006.
27. Gilbert KM, Scholl TJ, Chronik BA. RF coil loading measurements between 1 and
50 MHz to guide field-cycled MRI system design. Concept Magn Reson B
2008;33b(3):177-191.
28. Hoult DI. The NMR receiver: A description and analysis of design. Progress in
Nuclear Magnetic Resonance Spectroscopy 1978;12(1):41-77.
29. Fox MS, Welch I, Hobson D, Santyr GE. A novel intubation technique for
minimally invasive longitudinal studies of rat lungs using hyperpolarized 3He
magnetic resonance imaging. Laboratory animals 2012;46(4):311-317.
30. Santyr GE, Lam WW, Ouriadov A. Rapid and efficient mapping of regional
ventilation in the rat lung using hyperpolarized 3He with Flip Angle Variation for
Offset of RF and Relaxation (FAVOR). Magn Reson Med 2008;59(6):1304-1310.
31. Multiphysics C. MRI Birdcage Coil: Comsol Model Library Version. 3.5
32. Association NEM. Determination of image uniformity in diagnostic magnetic
resonance images. Rosslyn, VA: NEMA Standards Publication MS 6-2008 2008.
p. 1-21.
33. Krinke GJ, Bullock GR, Bunton T. The Laboratory Rat: Elsevier Science: 2000.
34. Vaughan JT, Adriany G, Garwood M, et al. Detunable transverse electromagnetic
(TEM) volume coil for high-field NMR. Magn Reson Med 2002;47(5):990-1000.
35. Firbank MJ, Coulthard A, Harrison RM, Williams ED. A comparison of two
methods for measuring the signal to noise ratio on MR images. Phys Med Biol
1999;44(12):N261-N264.

74
36. Wade TP, McKenzie C, Rutt B. Theoretical and Experimental Efficiency and
Optimization of Flip Angle Mapping Techniques Proceedings of the 19th Annual
Meeting of ISMRM 2011;Montréal(Québec):(abstract 4425).
37. Stollberger R, Wach P. Imaging of the active B1 field in vivo. Magn Reson Med
1996;35(2):246-251.
38. Insko EK, Bolinger L. Mapping of the Radiofrequency Field. J Magn Reson Ser A
1993;103(1):82-85.
39. Ouriadov AV, Lam WW, Santyr GE. Rapid 3-D mapping of hyperpolarized 3He
spin-lattice relaxation times using variable flip angle gradient echo imaging with
application to alveolar oxygen partial pressure measurement in rat lungs. Magma
2009;22(5):309-318.
40. Ginsberg DM, Melchner MJ. Optimum Geometry of Saddle Shaped Coils for
Generating a Uniform Magnetic Field. Rev Sci Instrum 1970;41(1):122-123.
41. Deppe MH, Parra-Robles J, Marshall H, Lanz T, Wild JM. A Flexible 32-channel
Receive Array Combined With a Homogeneous Transmit Coil for Human Lung
Imaging With Hyperpolarized He-3 at 1.5 T. Magn Reson Med 2011;66(6):1788-
1797.

75
Chapter 3 : Hyperpolarized Dissolved 129Xe MRI
of the Rat Lung
This chapter is adapted from the published paper: Doganay O, Wade T, Hegarty E,
McKenzie C, Schulte RF, Santyr GE. Hyperpolarized 129Xe Imaging of the Rat Lung using
Spiral IDEAL. Magn. Reson. Med. doi:10.1002/mrm.25911.
3.1 Introduction
Hyperpolarized (Hp) 129Xe gas can provide an increase in NMR signal of up to a factor of
100,000 compared to thermally polarized 129Xe gas. MRI of Hp 129Xe gas following
inhalation enables unique functional and microanatomical lung imaging measurements,
including ventilation defects (1) and apparent diffusion coefficient (ADC) (2). Although
most of the inhaled Hp 129Xe lung signal originates from the gas phase, approximately 2%
of the signal originates from 129Xe dissolved in the pulmonary tissue (PT, or barrier tissues)
and red blood cell (RBC) compartments (3). These dissolved phase 129Xe signals can be
separated using MR spectroscopy approaches, taking advantage of the significant chemical
shifts, relative to the gas phase, of 129Xe dissolved in PT (197 ppm) and RBC (217 ppm)
compartments, with respect to the gas phase (4). Furthermore, by measuring the time
course of the lung RBC and PT 129Xe signals following spectrally-selective RF saturation
(e.g. chemical shift saturation recovery, CSSR), measures of perfusion (5) and pulmonary
gas exchange (6) respectively can be derived. Pulmonary gas exchange measured with Hp
129Xe CSSR spectroscopy in whole lungs has been shown to be sensitive to alveolar tissue
76
thickening, which is associated with early pneumonitis (i.e. inflammation) in radiation-
induced lung injury (RILI) (7) and in idiopathic pulmonary fibrosis (8).
MRI pulse sequences for imaging dissolved phases of Hp 129Xe in the lung need to address
the following specific challenges: (i) low lung 129Xe T2* (~2 ms at 2 T (9)) leading to rapid
signal loss and image blurring, (ii) poor SNR due to low density of 129Xe in the RBC and
PT compartments and (iii) short breath-hold time (~ 10 s). An image acquisition scheme
that acquires k-space with the fewest number of RF pulses, and a read-out time on the order
of T2* would enable high flip angles to be used, thus significantly increasing the SNR,
spatial and temporal resolution. Improved temporal resolution would also allow improved
SNR via increased replenishment by the gas phase within a short breath-hold interval, as
well as quantification of the exchange between gas, PT and RBC compartments.
A 3-point Dixon approach has been reported for separation of gas and dissolved phases
within a single breath-hold at both 0.2 T (10) and 3 T (11); however, dissolved phase SNR
was limited in that study by the use of relatively long echo times and low flip angles. PT
and RBC 129Xe signals have been spectrally resolved using a one-point variant of the Dixon
technique for 2D imaging of both rats (9) and humans (12). This approach has also been
extended to 3D rat imaging within a breath-hold time of approximately 16 seconds by using
the replenishment of xenon from the gas phase between k-space acquisitions (13). A recent
study by Qing et. al. took advantage of the use of hierarchical IDEAL (Iterative
Decomposition of water and fat with Echo Asymmetry and Least-square estimation) to
image the gas, PT and RBC phases simultaneously within a scan time of a single breath-
hold (approximately 11 s) based on the independent excitation of the gas and dissolved
phase compartments using a 3D radial pulse sequence (14). In this work, however, the
77
dissolved phase magnetization was excited with a relatively low flip angle and without
substantial replenishment of the dissolved phase compartments by the gas phase.
A robust and efficient IDEAL imaging technique based on a single-shot spiral acquisition
and echo-time shifting in between excitations has been reported for Hp 13C-pyruvate
metabolic imaging (15). Additionally, Hp [1-13C] pyruvate metabolic imaging using a
single-shot spiral acquisition within the T2* relaxation time (~40 ms) and a 90o selective
RF pulse to maximize SNR has been demonstrated in phantoms and in vivo (16).
In this study, a single-shot spiral IDEAL approach was designed and implemented for rapid
imaging of Hp 129Xe gas, PT and RBC compartments in the rat lung. The spiral read-out
time was optimized to maximize both the spatial resolution and SNR of the dissolved phase
Hp 129Xe images. The echo time spacing was also optimized using the effective number of
averages (NSA) approach. The optimal flip angles were calculated through a theoretical
Bloch equation analysis including the effect of gas exchange. The feasibility of the method
was demonstrated for three-point IDEAL imaging of gas/PT compartments and four-point
IDEAL imaging of gas/PT/RBC compartments in rat lungs. Two-dimensional IDEAL
images using separate breath-holds at different TR values were acquired to demonstrate
the feasibility of regional measurement of gas exchange.

78
3.2 Theory
Point Spread Function (PSF) Analysis
The PSF was calculated to investigate the effects of read-out time, Tread, (as shown in
Figure 3.1) on image SNR and spatial resolution. For spiral k-space sampling, the PSF was
calculated using the inverse Fourier transform of the modulation transfer function in
Matlab (R2013a, The Mathworks Inc., Massachusetts), which incorporates the effects of
sampling, truncation, and T2* (17) as described in detail in Appendix A (see Calculation of
Spiral PSF) (18) and (19). For comparison, the PSF for conventional Cartesian k-space
sampling was calculated analytically along the frequency encoding direction as described
in Appendix B (Calculation of Cartesian PSF). Spatial resolution was approximated using
the FWHM of the calculated PSF function as a function of Tread/T2* to demonstrate the
effects of T2* blurring on resolution. SNR was approximated from the corresponding PSF
amplitude, A(Tread/T2*) using the following expression:
SNRN A(Tread/T2
*) × × sin(α) [3.1]
;where, α is the flip angle, N is number of points in k-space and BW is the read-out
bandwidth. The sin(α) term accounts for the difference in the flip angle used for Cartesian
and spiral, depending on the number of RF pulses and/or views. The N/BW term accounts
for the effect of bandwidth on image noise. The BW was varied to change the read-out time,
Tread = N/BW for a fixed N. The effect of varying the BW on the noise was proportional to
the square root of the BW.
BWN
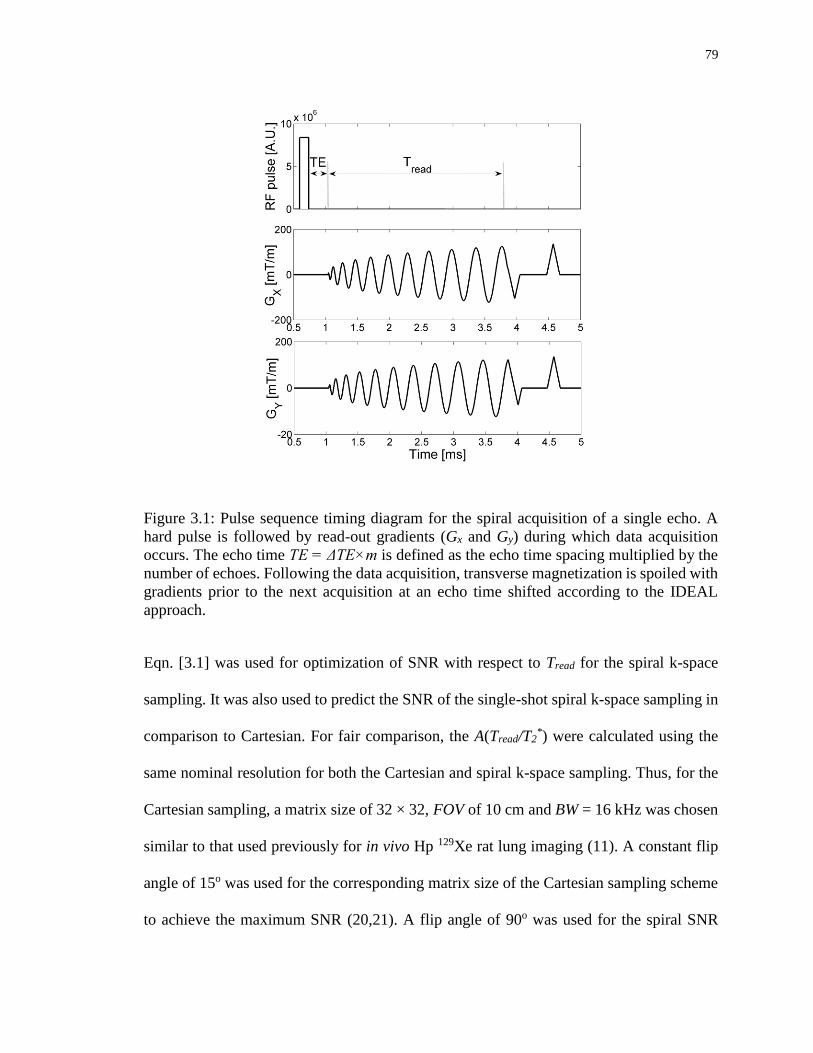
79
Figure 3.1: Pulse sequence timing diagram for the spiral acquisition of a single echo. A
hard pulse is followed by read-out gradients (Gx and Gy) during which data acquisition
occurs. The echo time TE = ΔTE×m is defined as the echo time spacing multiplied by the
number of echoes. Following the data acquisition, transverse magnetization is spoiled with
gradients prior to the next acquisition at an echo time shifted according to the IDEAL
approach.
Eqn. [3.1] was used for optimization of SNR with respect to Tread for the spiral k-space
sampling. It was also used to predict the SNR of the single-shot spiral k-space sampling in
comparison to Cartesian. For fair comparison, the A(Tread/T2*) were calculated using the
same nominal resolution for both the Cartesian and spiral k-space sampling. Thus, for the
Cartesian sampling, a matrix size of 32 × 32, FOV of 10 cm and BW = 16 kHz was chosen
similar to that used previously for in vivo Hp 129Xe rat lung imaging (11). A constant flip
angle of 15o was used for the corresponding matrix size of the Cartesian sampling scheme
to achieve the maximum SNR (20,21). A flip angle of 90o was used for the spiral SNR

80
calculation for thermally-polarized gas phantom experiments (as described in the Phantom
MRI Experiments section below).
Spiral Gradient Waveform Design
Spiral k-space trajectory and gradient waveforms (Gx(t), Gy(t)) required to achieve a given
Tread were calculated using an algorithm similar to that described by Lee et al. (22). A
surface plot of Tread as a function of both maximum gradient amplitude (Gmax) and gradient
slew rate (SR) was generated for a FOV = 70 mm and in plane voxel size of 3 mm
corresponding to typical rat imaging parameters. For the calculation, Gmax was varied
between 0 and 500 mT/m in steps of 20 mT/m and SR was varied between 0 to 3000 T/m/s
in steps of 100 T/m/s, corresponding to the capabilities of the high performance gradient
coil used in the study (23). This was also compared to a trajectory optimized for the
performance of the conventional clinical gradient system (Gmax = 50 mT/m, SR = 200
mT/m) to investigate the feasibility of human imaging.
Optimization of Echo-Time spacing
The optimal echo times, TE, for IDEAL were determined theoretically using the effective
number of signal averages (NSA) approach by including the short T2* effect as previously
described for C-13 metabolites (16,24). This approach accounts for the noise performance
as a function of echo time spacing, ΔTE, and chemical shift (24). From these analyses, the
optimal TE for each echo image, m, were calculated with TE =ΔTE×m for the
corresponding ΔTE from Figure 3.4. ΔTE was 50 us for 3-point IDEAL (m = 1, 2, 3) gas-
PT imaging and 340 us for 4-point IDEAL (m = 1, 2, 3, 4) gas-PT-RBC imaging based on

81
the known chemical shift differences (ΔfG-PT = 6950 Hz, ΔfPT-RBC = 525 Hz at a field
strength of 3 T). This choice of TE was based on measured T2* values of gas and dissolved
phases as described in the results section.
Calibration of Flip Angles
In delivering the RF excitation to each phase (e.g., gas versus dissolved phase), it was
desirable to apply a sufficiently large flip angle (e.g. 10-20 degrees) to the gas phase to
achieve reasonable gas phase image SNR without exhausting the gas phase pool, while at
the same time applying a large flip angle (i.e. 90o) to the dissolved phases. This provided
the additional benefit of improved dissolved phase SNR via replenishment from the gas
phase between each image acquisition. The dependence of Hp 3He gas image SNR on flip
angle for different varying RF pulse number (i.e., phase-encoding step) has been discussed
by Miller et al. (20). Using a similar approach, gas signal strength, SG, and PT signal
strength, SPT, equations were derived from the analytic solutions to the Bloch equations
including the effect of exchange of magnetization between the PT and gas compartments
(Appendix). The gas and PT signal dependence following the nth RF pulse are respectively
given by the following two equations:
SG = MG [cos(αG)]n-1 sin(αG) [3.2]
SPT = MPT [ M(TR) [cos(αG)]n-1 sin(αPT) + [cos(αPT)]n-1 sin(αPT)] [3.3]
;where αG and αPT are the flip angles applied to the gas phase and PT phase respectively.
MG is a scaling factor based on the gas phase image, which accounts for differences in

82
polarization and ventilation conditions between scans, M(TR) represents the percentage
replenishment of dissolved phase magnetization by the gas phase as a function of the time
between RF pulses (TR). M(TR) was calculated by fitting the Mansson gas exchange model
to CSSR experimental data previously published by Fox et al. (7). M(TR) was
approximately 0.5 for the TR used in this study (30 ms) (see Appendix [C.6] for more
details). MPT is a scaling factor based on the dissolved phase image, which accounts for
solubility, tissue density and MG. T1 relaxation of 129Xe in both the gas and dissolved phases
(25) is ignored in Eqn. [3.2] as it was assumed to be much longer than the total imaging
time. Eqn. [3.3] shows that SPT is reduced with the use of larger αG and increased with the
use of larger αPT and larger TR, the latter due to replenishment. The SNR of the gas image,
SNRG, and SNR of the PT image, SNRPT, were optimized as a function of αG and αPT,
including the SNR improvement due to the number of averages.
3.3 Methods
All images were acquired using a 3 Tesla MRI system (MR750, GEHC, Wisconsin, USA),
a custom-built transmit-only/receive-only birdcage coil (26) and high performance
insertable gradient system (23). Images were reconstructed in Matlab as described in
Schulte et al. (15,16).
Phantom MRI Experiments
A thermally-polarized phantom, containing 200 ml of 129Xe gas (80% enriched) and 200
ml O2 gas (to reduce T1 relaxation to ~1 s) at a pressure of 8 atmosphere at room
temperature, was used to experimentally confirm the theoretical dependence of spatial

83
resolution on Tread/T2*. T2
* for the thermal phantom was measured to be 28±1 ms. 2D
projection images of the thermally-polarized phantom in the axial view were obtained with
the following eight values of Tread/T2* = 0.5, 1.0, 1.5, 2.0, 2.5, 3.0, 3.5, 4.0 using a 3-point
IDEAL spiral approach with the following parameters: TR = 1.0 s, ΔTE = 50 us, FOV = 10
cm × 10 cm, with a real pixel size of 32, BW = 62.5 kHz, number of averages = 8, flip angle
= 90o. Tread was adjusted experimentally by changing the SR of the spiral gradient
waveforms (Gx(t), Gy(t)). Experimentally measured resolution including T2* blurring were
calculated from thermal phantom images by the FWHM of the PSF as described in
Appendix (19).
In vivo MRI experiments
All procedures followed animal use protocols approved by Western University’s Animal
Use Subcommittee and were consistent with the guidelines written by the Canadian
Council on Animal Care (CCAC) (27). Five Sprague Dawley rats (390±7 g, Charles River
Laboratories, Saint-Constant, Canada) were imaged in the supine position following three
breaths of Hp 129Xe using a MRI-compatible mechanical ventilator (GE Healthcare,
Malmo, Sweden) for delivery of Hp 129Xe to the lung. Hp 129Xe gas (approximately 80%
enriched with 10% polarization) was obtained from a commercial xenon polarizer system
(Polarean 9800, Durham, NH) yielding polarizations of ~10%. In vivo images were
acquired with a three-point IDEAL approach for imaging of gas-PT and four-point IDEAL
approach for imaging of gas-PT-RBC using the spiral pulse sequence as shown in Figure
3.1. A set of IDEAL coronal projection gas-PT images were obtained using a single-shot
spiral three-point IDEAL technique and three RF pulses (n = 3) and echo images with echo-

84
times of 50 us × m, (m = 1, 2, 3, resulting in a total scan time of 90 ms for TR =30 ms).
IDEAL images of gas, PT and RBC were obtained with a single-shot four-point IDEAL
technique using four RF pulses (n = 4) and four echo images with echo-times of 340 us ×
m, (m = 1, 2, 3, 4 resulting in a total scan time of 120 ms for TR = 30 ms). Other pulse
sequence parameters included: FOV = 70 mm, BW = 125 kHz, a nominal matrix resolution
of 22, number of points in the k-space equal to 660 and spiral trajectories consisting of 11
turns.
To validate Eqns. [3.2] and [3.3], multiple IDEAL gas and PT images (21 pairs) were
acquired using 63 RF pulses (n = 63) with TR fixed at 30 ms within a total scan time of
1.92 s during a single breath-hold interval. A mask that corresponded to the left lung of
each rat was created from the first gas phase image and applied to the all proceeding tissue
images. SG(j) and SPT(j) were determined by the mean values of regions of interest placed
on the gas and PT images as a function of image number (j = 1, ...., n/3 = 21). For
comparison between rats, the multiple Hp 129Xe IDEAL images were normalizing by SPT(j
= 1:21) with SG(j = 1),since the absolute values of SPT(j) depend on experiment conditions
(e.g., polarization, ventilation) through the scaling factor MPT (as explained in Eqn. [3.3]).
The mean of SG(j) and normalized SPT(j) and their standard deviations were also calculated
to investigate the reproducibility of the IDEAL images.
Ten sets of coronal IDEAL gas, PT, RBC images (j = 1:10, n = 40) were obtained using a
four-point IDEAL approach within a total scan time of approximately 4 s in a single-breath
hold (with a TR of 100 ms) in the rat lung. IDEAL gas, PT, RBC images were reconstructed
in Matlab. The ten reconstructed gas, PT, and RBC images were then averaged in Matlab
to generate a final IDEAL gas, PT, and RBC images. Similarly, representative average
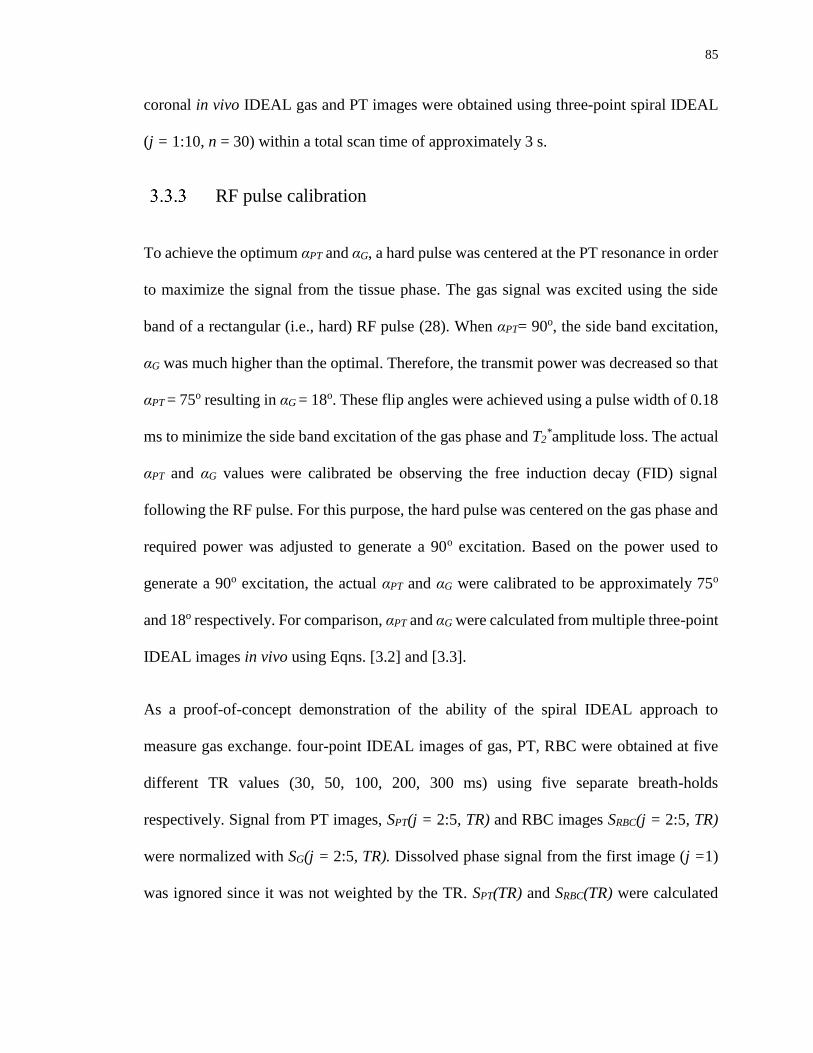
85
coronal in vivo IDEAL gas and PT images were obtained using three-point spiral IDEAL
(j = 1:10, n = 30) within a total scan time of approximately 3 s.
RF pulse calibration
To achieve the optimum αPT and αG, a hard pulse was centered at the PT resonance in order
to maximize the signal from the tissue phase. The gas signal was excited using the side
band of a rectangular (i.e., hard) RF pulse (28). When αPT= 90o, the side band excitation,
αG was much higher than the optimal. Therefore, the transmit power was decreased so that
αPT = 75o resulting in αG = 18o. These flip angles were achieved using a pulse width of 0.18
ms to minimize the side band excitation of the gas phase and T2*amplitude loss. The actual
αPT and αG values were calibrated be observing the free induction decay (FID) signal
following the RF pulse. For this purpose, the hard pulse was centered on the gas phase and
required power was adjusted to generate a 90o excitation. Based on the power used to
generate a 90o excitation, the actual αPT and αG were calibrated to be approximately 75o
and 18o respectively. For comparison, αPT and αG were calculated from multiple three-point
IDEAL images in vivo using Eqns. [3.2] and [3.3].
As a proof-of-concept demonstration of the ability of the spiral IDEAL approach to
measure gas exchange. four-point IDEAL images of gas, PT, RBC were obtained at five
different TR values (30, 50, 100, 200, 300 ms) using five separate breath-holds
respectively. Signal from PT images, SPT(j = 2:5, TR) and RBC images SRBC(j = 2:5, TR)
were normalized with SG(j = 2:5, TR). Dissolved phase signal from the first image (j =1)
was ignored since it was not weighted by the TR. SPT(TR) and SRBC(TR) were calculated

86
for the left and right lungs of five healthy rats and averaged to provide mean signals as a
function of increasing TR.
3.4 Results
Theoretical and experimental dissolved phase spatial resolution from the PSF analysis and
the thermal phantom for the eight Tread/T2* values respectively are shown in Figure 3.2 (a).
As expected, measured blurring was diminished as read-out time was reduced and
plateaued for Tread ~ 1.5 × T2*
in good agreement with theory. Theoretical SNR from Eqn.
[3.1] is shown in Figure 3.2 (b) over a similar range of Tread/T2* as in Figure 3.2 (a). The
maximum SNR was obtained for Tread values between approximately T2* and 2 × T2
*. The
optimum value of Tread/T2* was chosen to be 1.8 to achieve the maximum SNR for the
dissolved phase image while maintaining acceptable spatial resolution. Tread/T2*= 1.8
corresponded to a 33% decrease in resolution from the nominal pixel size. In particular, for
a nominal pixel size of 3.1 mm, the spatial resolution was expected to be 4.1 mm due to
T2* blurring. The theoretical maximum Cartesian SNRN was found to occur at Tread/T2
* =
0.9 similar to that previously reported (18). Compared to the Cartesian data acquisition
with the use of flip angle of 15o, the single-shot spiral showed a theoretical improvement
in the SNR of 3.3 fold. It should be noted that this SNR improvement was expected to be
less than 3.3-fold due to the dissolved signal replenishment between phase encoding steps
(i.e. TR) of the Cartesian k-space sampling. The Cartesian acquisition with a TR time of 4
ms, would allow replenishment of dissolved phase signal of approximately 10 % (see
Appendix Eqn. [C.5]. Therefore, considering the replenishment of the dissolved phase
signal, the SNR improvement would be expected to be approximately 3-fold.
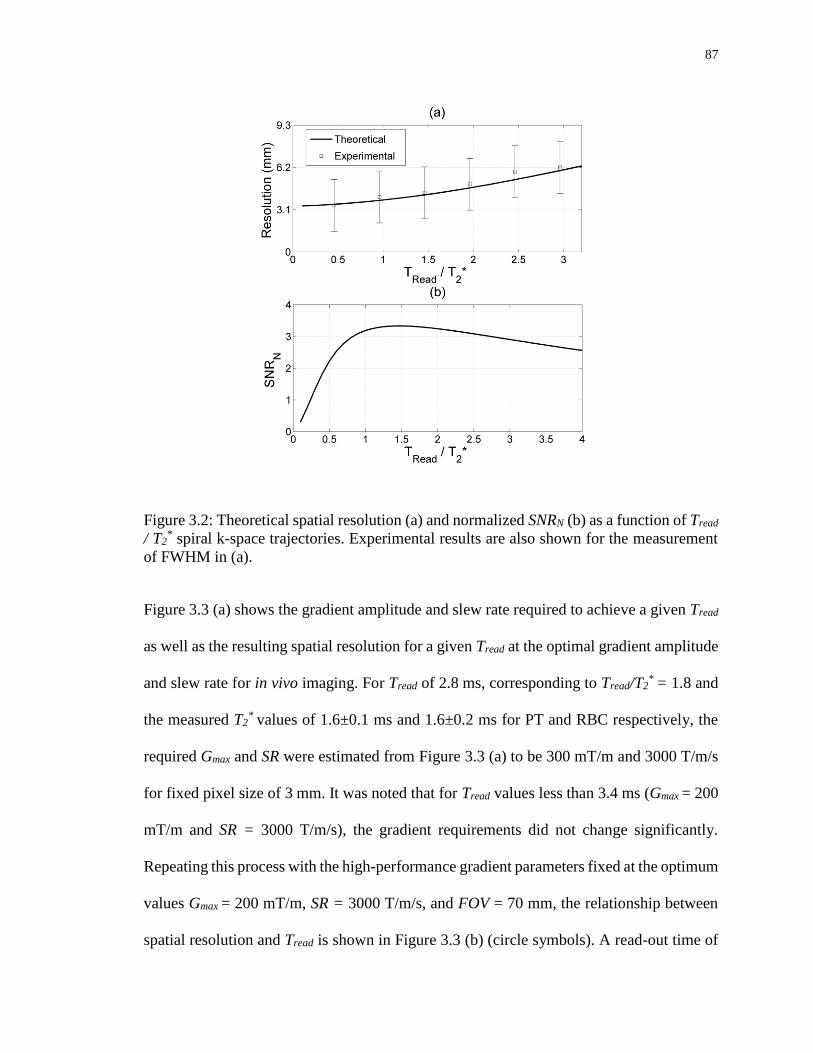
87
Figure 3.2: Theoretical spatial resolution (a) and normalized SNRN (b) as a function of Tread
/ T2* spiral k-space trajectories. Experimental results are also shown for the measurement
of FWHM in (a).
Figure 3.3 (a) shows the gradient amplitude and slew rate required to achieve a given Tread
as well as the resulting spatial resolution for a given Tread at the optimal gradient amplitude
and slew rate for in vivo imaging. For Tread of 2.8 ms, corresponding to Tread/T2* = 1.8 and
the measured T2* values of 1.6±0.1 ms and 1.6±0.2 ms for PT and RBC respectively, the
required Gmax and SR were estimated from Figure 3.3 (a) to be 300 mT/m and 3000 T/m/s
for fixed pixel size of 3 mm. It was noted that for Tread values less than 3.4 ms (Gmax = 200
mT/m and SR = 3000 T/m/s), the gradient requirements did not change significantly.
Repeating this process with the high-performance gradient parameters fixed at the optimum
values Gmax = 200 mT/m, SR = 3000 T/m/s, and FOV = 70 mm, the relationship between
spatial resolution and Tread is shown in Figure 3.3 (b) (circle symbols). A read-out time of
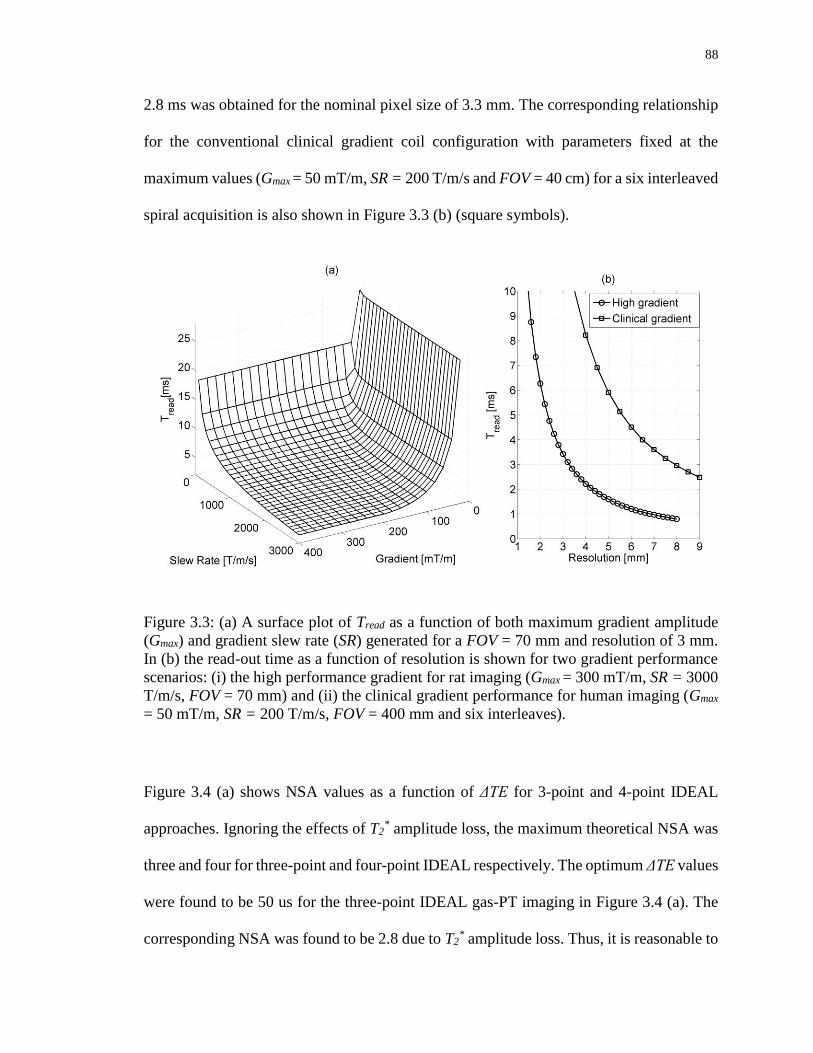
88
2.8 ms was obtained for the nominal pixel size of 3.3 mm. The corresponding relationship
for the conventional clinical gradient coil configuration with parameters fixed at the
maximum values (Gmax = 50 mT/m, SR = 200 T/m/s and FOV = 40 cm) for a six interleaved
spiral acquisition is also shown in Figure 3.3 (b) (square symbols).
Figure 3.3: (a) A surface plot of Tread as a function of both maximum gradient amplitude
(Gmax) and gradient slew rate (SR) generated for a FOV = 70 mm and resolution of 3 mm.
In (b) the read-out time as a function of resolution is shown for two gradient performance
scenarios: (i) the high performance gradient for rat imaging (Gmax = 300 mT/m, SR = 3000
T/m/s, FOV = 70 mm) and (ii) the clinical gradient performance for human imaging (Gmax
= 50 mT/m, SR = 200 T/m/s, FOV = 400 mm and six interleaves).
Figure 3.4 (a) shows NSA values as a function of ΔTE for 3-point and 4-point IDEAL
approaches. Ignoring the effects of T2* amplitude loss, the maximum theoretical NSA was
three and four for three-point and four-point IDEAL respectively. The optimum ΔTE values
were found to be 50 us for the three-point IDEAL gas-PT imaging in Figure 3.4 (a). The
corresponding NSA was found to be 2.8 due to T2* amplitude loss. Thus, it is reasonable to
89
expect that the T2* amplitude loss was negligible for the three-point IDEAL approach. For
four-point IDEAL, the optimum ΔTE that maximized NSA of all components and allowed
separation of PT and RBC signals was found to be relatively long (340 us) in Figure 3.4
(b). These relatively long echo times are required due to the relatively smaller chemical
shift difference between PT and RBC (ΔfPT-RBC= 525 Hz) leading to drop in the SNR of a
factor of approximately two compared to the scheme without the T2* amplitude loss.
Conceptually, the SNR performance of PT images from three-point IDEAL (Figure 3.4
(a)) is better than four-point IDEAL by a factor of 1.4 owing to relatively short echo times.
Figure 3.4: The NSA as a function of ΔTE for (a) 3-point IDEAL and (b) 4-point IDEAL.
Figure 3.5 (a) shows the measured mean SG(j) including standard deviation from the five
healthy rats as well as the best fit to the data based on Eqn. [3.2] yielding estimated flip
angles of 18o±0.4o and R2 value of 0.998. Figure 3.5 (b) shows the PT signal (i.e.
normalized SPT(j)) as a function of pulse number and the fit of function given by Eqn. [3.3]

90
including gas exchange, yielding an R2 value of 0.997. In the first PT image (j=1), the
percentage gas exchange percentage rate (M(TR)) was determined to be 0.1 (7) since the
first PT image (TR = 30 ms) is not weighted by gas exchange. M(TR) = 0.5 was used for
fitting the remaining 20 images. The flip angle delivered to the PT phase was determined
to be 75o±2o using Eqn. [3.3], in good agreement with the calibrated value. Normalized SG
and SPT as a function of pulse number were highly reproducible for the five healthy rats
with the maximum standard deviation value of 2.6%.
Figure 3.5: Experimentally measured gas (a) and pulmonary tissue (b) signals as a function
of image number. The solid line shows the theoretical fit to the data from Eqns. [3.2] and
[3.3].

91
Figure 3.6 shows the theoretical SNR performance of the gas and PT images as a function
of both αPT and αG, after averaging 10 sets of IDEAL images. Figure 3.6 (a) shows that the
use of αG between 15o and 20o provides sufficiently high SNR for the gas phase image, but
results in a reduction in the SNR of the tissue phase image in Figure 3.6 (b). This is because
the Hp 129Xe gas in the alveolar air space acts as a reservoir to replenish the dissolved phase
image signal in the time between averages. Notably, αG =18o was used to obtain a
sufficiently high SNR for the gas phase of approximately 23 as shown in Figure 3.6 (a) and
SNRPT was approximately 5.8 as shown in Figure 3.6 (b). The theoretical dependences of
SNRPT on αPT for TR = 30ms (circles) and TR = 100ms (square) are shown in Figure 3.6
(c), for αG fixed at 18o. SNRPT increases with αPT but displays no significant increase
beyond αPT=75o which corresponds to the use of 99% of available PT signal with a TR =
30 ms. Furthermore, Figure 3.6 (b) shows an SNR improvement of a factor of
approximately 2 for TR = 100 ms due to the increased time for gas exchange.
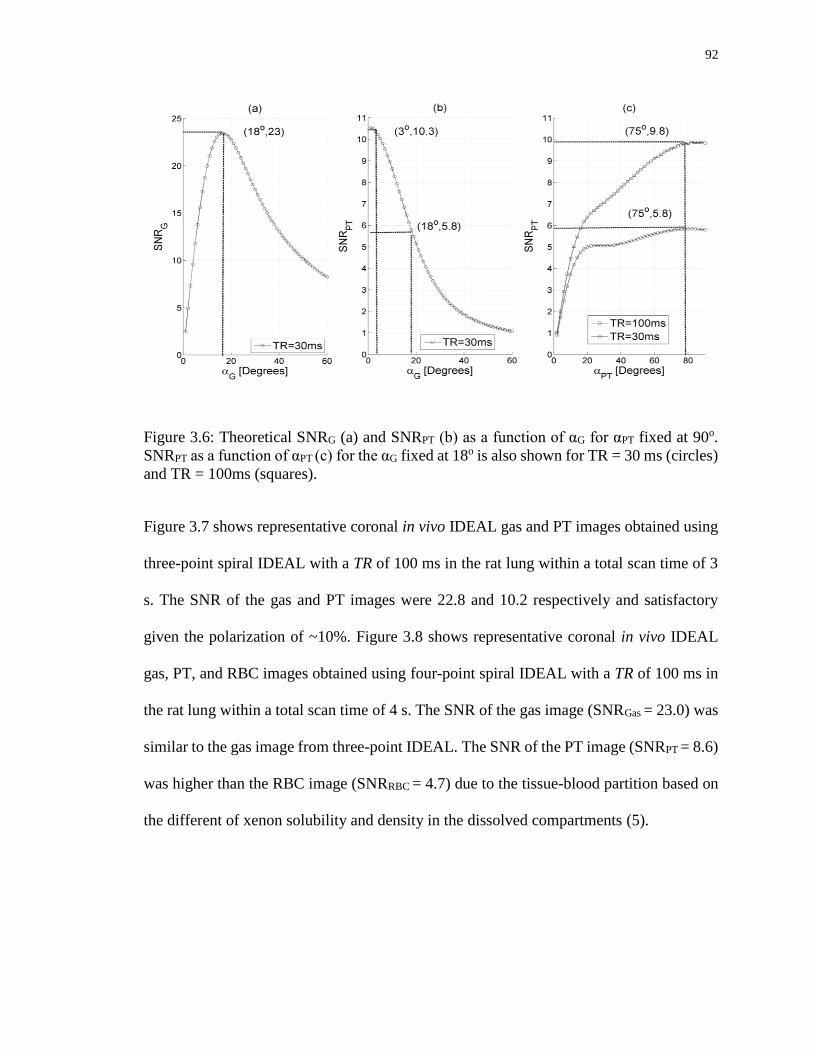
92
Figure 3.6: Theoretical SNRG (a) and SNRPT (b) as a function of αG for αPT fixed at 90o.
SNRPT as a function of αPT (c) for the αG fixed at 18o is also shown for TR = 30 ms (circles)
and TR = 100ms (squares).
Figure 3.7 shows representative coronal in vivo IDEAL gas and PT images obtained using
three-point spiral IDEAL with a TR of 100 ms in the rat lung within a total scan time of 3
s. The SNR of the gas and PT images were 22.8 and 10.2 respectively and satisfactory
given the polarization of ~10%. Figure 3.8 shows representative coronal in vivo IDEAL
gas, PT, and RBC images obtained using four-point spiral IDEAL with a TR of 100 ms in
the rat lung within a total scan time of 4 s. The SNR of the gas image (SNRGas = 23.0) was
similar to the gas image from three-point IDEAL. The SNR of the PT image (SNRPT = 8.6)
was higher than the RBC image (SNRRBC = 4.7) due to the tissue-blood partition based on
the different of xenon solubility and density in the dissolved compartments (5).
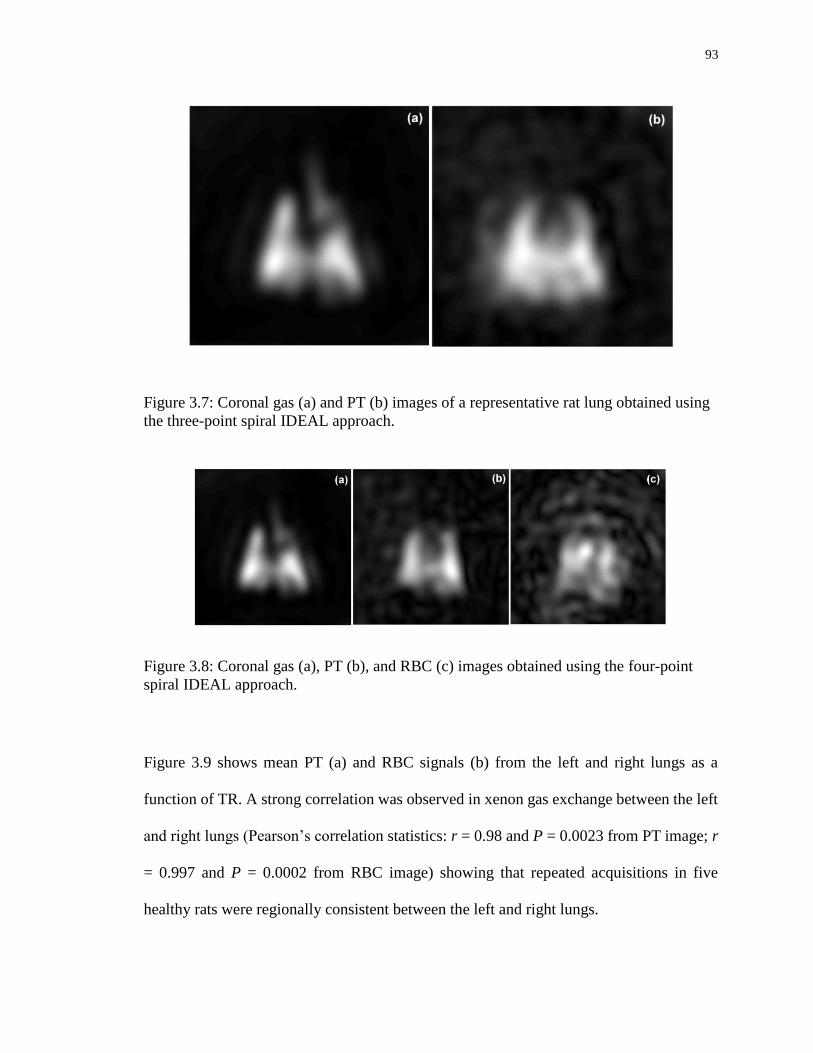
93
Figure 3.7: Coronal gas (a) and PT (b) images of a representative rat lung obtained using
the three-point spiral IDEAL approach.
Figure 3.8: Coronal gas (a), PT (b), and RBC (c) images obtained using the four-point
spiral IDEAL approach.
Figure 3.9 shows mean PT (a) and RBC signals (b) from the left and right lungs as a
function of TR. A strong correlation was observed in xenon gas exchange between the left
and right lungs (Pearson’s correlation statistics: r = 0.98 and P = 0.0023 from PT image; r
= 0.997 and P = 0.0002 from RBC image) showing that repeated acquisitions in five
healthy rats were regionally consistent between the left and right lungs.

94
Figure 3.9: Mean signals measured from all rats for PT (a) and RBC images (b) as a
function of TR values: 30, 50, 100, 200, and 300 ms.
3.5 Discussion
In this work, a single-shot spiral k-space encoding strategy was applied to IDEAL imaging
for separation of hyperpolarized 129Xe signals originating from gas, PT and RBC
compartments in the rat lung within a breath-hold interval (4 s). To achieve the necessary
spatial resolution (3.3 mm) with minimal T2* blurring, a relatively short spiral read-out
time, Tread, (2.8 ms) on the order of T2* was found to be important and was facilitated in
this study using a high performance insertable gradient system to achieve the required Gmax
and SR. Although the theoretical PSF is an approximation, good agreement was shown
with experimental spatial resolution data obtained with thermally-polarized 129Xe phantom
experiments. The single-shot spiral read-out also permitted the use of fewer, larger flip
angle pulses to improve SNR compared to Cartesian approaches. Based on the theoretical

95
PSF analysis, spiral IDEAL approaches that utilize the entire dissolved phase
magnetization should give an SNR improvement of a factor of approximately 3.3 for αG =
90o compared to Cartesian approaches with similar spatial resolution (αG = 15o).
For in vivo imaging, SNRPT depends significantly on the choice of both αG with αPT and
polarization. The optimum value for αG was found to be between 15o to 20o for the use of
10% polarization. Although the optimum value for αPT was found to be 90o, a 75o pulse
was used to reduce the side band excitation of the gas phase. In future, the use of spectrally-
selective RF pulses (28) that provide αG = 3o and αPT = 90o with higher polarization on the
order of 30% would significantly improve the SNR of the dissolved phases. Less
consumption of Hp 129Xe gas magnetization with αG = 3o would be sufficient to generate
an SNRG value of approximately 23 due to the three-fold improvement of polarization
Figure 3.6 (a)). The use of αG = 3o and a 3-fold improvement in polarization would also
result in an improvement of SNRPT from 5.8 (for αG = 18o) to 10.3 × 3 = 30.9 (for αG = 3o)
based on Figure 3.6 (b).
Obtaining gas images in concert with dissolved phase images is expected to be helpful for
identification of corresponding ventilation defects. Gas images from both 3-point and 4-
point IDEAL match well from the same rat. The reproducibility was significantly high
between five healthy rats. Gas phase images are also useful for optimization of flip angle
(Eqn.[3.2]) from multiple IDEAL images and for normalization purposes (e.g. to account
for polarization differences) for quantitative dynamic Hp 129Xe gas exchange imaging.
In comparison to the three-point IDEAL PT image, four-point IDEAL PT has lower SNR
(by a factor of 1.2) and temporal resolution performance (by a factor of 1.3) owing to the
96
use of longer echo time spacing and more RF pulses and fewer images in the reconstruction.
In principle, four-point IDEAL has the advantage of separating the PT compartment from
the RBC compartment. RBC signal intensity was strong in the region of left atrium and
ventricle due to the relatively high density of blood compared to other parts of the thorax.
The effect of short T2* and differences in T2
* between the dissolved phases of Hp 129Xe
(~1.6 ms) and gas phase of Hp 129Xe (~6.0 ms) requires further discussion. On the IDEAL
acquisition side, the appropriate T2* values for the different species is explicitly accounted
for in the NSA plot (Figure 3.4) when choosing the echo times which gives the optimum
separation of the IDEAL signal between the gas and dissolved phases. The relatively large
chemical shift between the gas phase and the dissolved phases (~ 200 ppm) means the echo
times can be quite short (~ 50 us), thereby reducing T2* amplitude losses, since a separate
excitation is used for each IDEAL echo signal. However, the longer echo time spacing (~
340 us) required for the 4-point IDEAL approach results in a more significant drop in SNR
due to T2* amplitude losses compared to the 3-point IDEAL approach. To address the
smaller chemical shift between the dissolved phases and short echo time, an unequally
spaced short echo approach could be used in future (29). On the reconstruction side, the
respective T2* values are not explicitly considered in this work which could affect the
separation of the PT and RBC images from the gas phase images (30).
The use of the high gradient amplitude and slew rate, timing delays in the gradient
waveforms, and eddy currents associated with the high performance gradient insert used in
this study may lead to characteristic spiral image artifacts, including streaking and ghosting
(31,32). The accuracy of the gradient encoding fields (GX and GY in Figure 3.1), and
corresponding geometric distortions and image quality have not been explicitly evaluated

97
in this study. However, hyperpolarized phantom experiments showed good agreement with
the geometry of the phantom and images suggesting that the k-space distortions were
negligible in our previous studies (33). Image distortion and ghosting were likely
minimized in the present study owing to the use of a relatively larger field-of-view. While
there was some streaking artifact visible, this was only apparent at the edge of the gas phase
images since the gas signal was much higher than the signal from dissolved phases. Some
spiral artifacts were visible in the RBC images, likely due to the low SNR owing to the low
polarization.
In this work, we have demonstrated the feasibility of measuring regional gas exchange
curves for the left and right rat lungs separately. The ability to image 129Xe gas exchange
at various TR values (e.g. from 30 ms to 300 ms) in separate breath-holds may permit
quantitative measurement of gas exchange similar to that obtained using the conventional
CSSR technique but with the advantage of regional information. In particular, the slopes
and intercepts of gas exchange curves (8,34-36) such as shown in Figure 3.9, allow
mapping of alterations in lung structure and function associated with pulmonary disease.
In particular, four-point IDEAL may provide quantitative measures of both the vascular
damage and tissue thickening (i.e. pneumonitis) corresponding to the early stages of RILI
following thoracic irradiation (7). By choosing smaller regions-of-interest instead of the
whole left and right lungs, the gas exchange curves could be mapped using higher
polarization (e.g. 50%) in future.
For in vivo imaging of rat lungs with the single-shot spiral IDEAL approach, high SR (3000
T/m/s) and Gmax (300 mT/m) were used to increase the spatial resolution within an optimum
read-out time. IDEAL spiral imaging could be potentially translatable to human imaging

98
with the use of an interleaved spiral approach. Conceptually, the imaging of Hp 129Xe gas
exchange at TR values (e.g. 15, 30, 50, 100, 250 ms) in a single breath-hold of 10.7 s should
be possible using six interleaved spirals. Figure 3.3 (b) shows the relationship between the
spatial resolution and read-out time with the use of clinical gradient for six RF pulses and
interleaved spiral with FOV of 40 cm. Furthermore, at lower field strength (e.g. 1.5 T) the
spatial resolution could be improved, even at longer read-out times due to the increase in
T2*(12). In future, 2D imaging can also be extended to multi-slice imaging using parallel
imaging approaches (37) and a short duration slice-selective pulse (28). Although, five TR
values would be achievable for 2D human imaging, the total scan time required for
obtaining the gas exchange curves would be challenging for the case of multi-slice
imaging. However, the total scan time for multi-slice human imaging might be reduced by
using lower TR values to obtain the gas exchange curves. Furthermore, 2D imaging can be
extended to an isotropic 3D MR imaging using an additional phase encoding gradient,
undersampling approach (38) and cylindrical (39) or radial (40) k-space sampling
techniques.
3.6 Conclusion
Single-shot spiral IDEAL imaging for separation of Hp 129Xe gas and dissolved phase
images is feasible in the rat lung. The spiral approach offers the benefits of fewer, higher
flip angle RF pulses to increase the signal from the dissolved phases of Hp 129Xe. An SNR
improvement of approximately 3 times is expected from spiral IDEAL compared to the
conventional Cartesian k-space sampling IDEAL approach. The read-out time of
approximately 1.8 time T2* was found to be optimal based on a point spread function
99
analysis to minimize T2* blurring and maximize the SNR. The rapid acquisition times of
spiral IDEAL permits multiple gas/PT and gas/PT/RBC images to be acquired within a
breath-hold time of a few seconds. This allows flip angle calibration and optimization and
permits imaging of exchange between the gas, PT and RBC compartments for regional
characterization of lung microstructure and pulmonary and vascular function. Although,
the imaging approach use here was optimized for rat imaging, it could be translated for
human imaging using an interleaved spiral approach in future.

100
3.7 Reference
1. Santyr GE, Lam WW, Ouriadov A. Rapid and efficient mapping of regional
ventilation in the rat lung using hyperpolarized 3He with Flip Angle Variation for
Offset of RF and Relaxation (FAVOR). Magn Reson Med 2008;59(6):1304-1310.
2. Ouriadov A, Farag A, Kirby M, McCormack DG, Parraga G, Santyr GE.
Pulmonary hyperpolarized Xe morphometry for mapping xenon gas concentrations
and alveolar oxygen partial pressure: Proof-of-concept demonstration in healthy
and COPD subjects. Magn Reson Med 2014.
3. Mugler JP, 3rd, Altes TA, Ruset IC, et al. Simultaneous magnetic resonance
imaging of ventilation distribution and gas uptake in the human lung using
hyperpolarized xenon-129. Proceedings of the National Academy of Sciences of
the United States of America 2010;107(50):21707-21712.
4. Qing K, Mugler JP, Altes TA, et al. Assessment of lung function in asthma and
COPD using hyperpolarized Xe-129 chemical shift saturation recovery
spectroscopy and dissolved-phase MRI. Nmr Biomed 2014;27(12):1490-1501.
5. Mansson S, Wolber J, Driehuys B, Wollmer P, Golman K. Characterization of
diffusing capacity and perfusion of the rat lung in a lipopolysaccaride disease model
using hyperpolarized Xe-129. Magn Reson Med 2003;50(6):1170-1179.
6. Abdeen N, Cross A, Cron G, et al. Measurement of xenon diffusing capacity in the
rat lung by hyperpolarized 129Xe MRI and dynamic spectroscopy in a single
breath-hold. Magn Reson Med 2006;56(2):255-264.
7. Fox MS, Ouriadov A, Thind K, et al. Detection of radiation induced lung injury in
rats using dynamic hyperpolarized Xe-129 magnetic resonance spectroscopy. Med
Phys 2014;41(7).
8. Stewart NJ, Leung G, Norquay G, et al. Experimental validation of the
hyperpolarized Xe chemical shift saturation recovery technique in healthy
volunteers and subjects with interstitial lung disease. Magn Reson Med 2014.
9. Driehuys B, Cofer GP, Pollaro J, Mackel JB, Hedlund LW, Johnson GA. Imaging
alveolar-capillary gas transfer using hyperpolarized Xe-129 MRI. Proceedings of
the National Academy of Sciences of the United States of America 2006;103(48)
:18278-18283.
10. Muradian I, Patz S, Butler JP, et al. Hyperpolarized 129Xe human pulmonary gas
exchange with 3-point Dixon technique. Proceedings of the 14th Annual Meeting
of ISMRM 2006;Seattle(Washington):abstract 1297.

101
11. Ouriadov AV, Fox M, L. F-W, McKenzie C, Santyr G. Hyperpolarized 129Xe Gas
and Dissolved Phase Lung Imaging using IDEAL. Proceedings of the 19th Annual
Meeting of ISMRM 2011;Québec( Montréal):abstract 6040.
12. Cleveland ZI, Cofer GP, Metz G, et al. Hyperpolarized Xe MR imaging of alveolar
gas uptake in humans. PloS one 2010;5(8):e12192.
13. Cleveland ZI, Virgincar RS, Qi Y, Robertson SH, Degan S, Driehuys B. 3D MRI
of impaired hyperpolarized 129Xe uptake in a rat model of pulmonary fibrosis.
Nmr Biomed 2014;27(12):1502-1514.
14. Qing K, Ruppert K, Jiang Y, et al. Regional mapping of gas uptake by blood and
tissue in the human lung using hyperpolarized xenon-129 MRI. J Magn Reson
Imaging 2014;39(2):346-359.
15. Wiesinger F, Weidl E, Menzel MI, et al. IDEAL spiral CSI for dynamic metabolic
MR imaging of hyperpolarized [1-13C]pyruvate. Magn Reson Med 2012;68(1):8-
16.
16. Schulte RF, Sperl JI, Weidl E, et al. Saturation-recovery metabolic-exchange rate
imaging with hyperpolarized [1-13C] pyruvate using spectral-spatial excitation.
Magn Reson Med 2013;69(5):1209-1216.
17. Haacke EM, Brown RW, Thompson MR, Venkatesan R. Magnetic Resonance
Imaging: Physical Principles and Sequence Design: Wiley: 1999.
18. Qin Q. Point spread functions of the T2 decay in k-space trajectories with long echo
train. Magn Reson Med 2012;30(8):1134-1142.
19. Rahmer J, Bornert P, Groen J, Bos C. Three-dimensional radial ultrashort echo-
time imaging with T2 adapted sampling. Magn Reson Med 2006;55(5):1075-1082.
20. Miller GW, Altes TA, Brookeman JR, De Lange EE, Mugler JP, 3rd.
Hyperpolarized 3He lung ventilation imaging with B1-inhomogeneity correction in
a single breath-hold scan. Magma 2004;16(5):218-226.
21. Ouriadov AV, Lam WW, Santyr GE. Rapid 3-D mapping of hyperpolarized 3He
spin-lattice relaxation times using variable flip angle gradient echo imaging with
application to alveolar oxygen partial pressure measurement in rat lungs. Magma
2009;22(5):309-318.
22. Lee JH, Hargreaves BA, Hu BS, Nishimura DG. Fast 3D imaging using variable-
density spiral trajectories with applications to limb perfusion. Magn Reson Med
2003;50(6):1276-1285.
23. Foster-Gareau P, Heyn C, Alejski A, Rutt BK. Imaging single mammalian cells
with a 1.5 T clinical MRI scanner. Magn Reson Med 2003;49(5):968-971.

102
24. Reeder SB, Brittain JH, Grist TM, Yen YF. Least-squares chemical shift separation
for (13)C metabolic imaging. J Magn Reson Imaging 2007;26(4):1145-1152.
25. Zhao L, Mulkern R, Tseng CH, et al. Gradient-Echo Imaging Considerations for
Hyperpolarized 129Xe MR. Journal of magnetic resonance Series B
1996;113(2):179-183.
26. Doganay O, Thind K, Wade TP, Ouriadov A, Santyr GE. A Transmit-
Only/Receive-Only Radiofrequency Coil Configuration for Hyperpolarized 129Xe
Imaging of the Rodent Lung. Proceedings of the 21th Annual Meeting of ISMRM
2013;Lake City(Utah):abstract 1479.
27. Fox MS, Welch I, Hobson D, Santyr GE. A novel intubation technique for
minimally invasive longitudinal studies of rat lungs using hyperpolarized 3He
magnetic resonance imaging. Laboratory animals 2012;46(4):311-317.
28. Leung G, Norquay G, Schulte RF, Wild JM. Radiofrequency pulse design for the
selective excitation of dissolved Xe. Magn Reson Med 2014.
29. Tsao J, Jiang Y. Hierarchical IDEAL: fast, robust, and multiresolution separation
of multiple chemical species from multiple echo times. Magn Reson Med 2013;7
0(1):155-159.
30. Meisamy S, Hines CD, Hamilton G, et al. Quantification of hepatic steatosis with
T1-independent, T2-corrected MR imaging with spectral modeling of fat: blinded
comparison with MR spectroscopy. Radiology 2011;258(3):767-775.
31. Lechner SM, Sipila PT, Wiesinger F, Kerr AB, Vogel MW. Spiral Imaging Artifact
Reduction: A Comparison of Two k-Trajectory Measurement Methods. J Magn
Reson Imaging 2009;29(6):1485-1492.
32. Wiesinger F, Sipilae PT, Yen Y-F, et al. k-Space trajectory mapping for ultra-short,
single-shot, non-Cartesian imaging. Proceedings of the 17th Annual Meeting of
ISMRM 2009;Honolulu(Hawaii):abstract 6755.
33. Doganay O, Wade TP, Hegarty E, Schulte RF, McKenzie C, Santyr GE.
Hyperpolarized 129Xe Imaging of the Lung using Spiral IDEAL. Proceedings of the
23th Annual Meeting of ISMRM 2015;Toronto(Ontario):abstract 1497.
34. Patz S, Muradyan I, Hrovat MI, et al. Diffusion of hyperpolarized Xe-129 in the
lung: a simplified model of Xe-129 septal uptake and experimental results. New J
Phys 2011;13.
35. Chang YV. MOXE: a model of gas exchange for hyperpolarized 129Xe magnetic
resonance of the lung. Magn Reson Med 2013;69(3):884-890.
36. Doganay O, Fox M, Santyr GE. Measurement of Pulmonary Perfusion and Gas
Exchange using Hyperpolarized 129Xe in a Rodent Model of Radiation-Induced
103
Lung Injury. Proceedings of the 22th Annual Meeting of ISMRM
2014;Milan(Italy):abstract 2290.
37. Teh K, Lee KJ, Paley MN, Wild JM. Parallel imaging of hyperpolarized helium-3
with simultaneous slice excitation. Magn Reson Med 2006;55(2):258-262.
38. Holmes JH, O'Halloran RL, Brodsky EK, Jung Y, Block WF, Fain SB. 3D
hyperpolarized he-3 MRI of ventilation using a multi-echo projection acquisition.
Magn Reson Med 2008;59(5):1062-1071.
39. Ruppert K, Miller GW, Altes TA, et al. Rapid hyperpolarized He-3 ventilation
scanning with an optimized 3D acquisition scheme. Proceedings of the 13th Annual
Meeting of ISMRM 2005;Miami(Florida):abstract 2774.
40. Kaushik SS, Robertson SH, Freeman MS, et al. Single-breath clinical imaging of
hyperpolarized xe in the airspaces, barrier, and red blood cells using an interleaved
3D radial 1-point Dixon acquisition. Magn Reson Med 2015.

104
Chapter 4 : Early Detection of RILI using 129Xe Gas Exchange
This chapter is adapted from the submitted paper: Doganay O, Stirrat E T, McKenzie C,
Schulte RF, Santyr GE. Quantification of Regional Gas Exchange Changes using
Hyperpolarized 129Xe MRI in a Rat Model of Early Stage Radiation-induced Lung Injury.
Medical Physics, 2015 (in revision).
4.1 Introduction
Radiation therapy is a primary treatment method for thoracic malignancies (2). However,
the lung is a very radiosensitive organ (3-7), and Radiation-induced Lung Injury (RILI) is
an important factor limiting thoracic radiotherapy. The incidence for moderate and severe
RILI in patients after radiation therapy is 50% and 5-35% respectively (8,9). RILI generally
progresses in two phases: (i) early-phase, radiation pneumonitis (RP) and (ii) late-phase,
pulmonary fibrosis. RP is acute and occurs within 12 weeks after radiation therapy, mainly
comprising of inflammation with symptoms of dry cough and dyspnea. Pulmonary fibrosis
is irreversible and can develop as early as three months after radiation therapy. Severe
pulmonary fibrosis may lead to organ failure and even death (10,11). Detection of early-
stage RILI (i.e. RP) can improve outcomes by reducing normal tissue injury and late-stage
effects (8,12) through adjustments in therapy plan (e.g. radiation fractionation) or use of
pharmaceuticals, including radioprotectors and anti-inflammatory drugs (13-15).
Pulmonary function tests (PFTs), such as spirometry, are often used for monitoring RILI
but provide measures of whole-lung function only, without regional information (16).
Furthermore, PFT measurements depend strongly on patient positioning and effort,

105
obstructive disease and are sensitive to hyperfractionated therapy (total dose > 25 Gy) (17-
19).
To overcome some of the limitations of PFTs and to provide regional detection of RILI,
imaging techniques have been investigated. The most commonly used imaging approach
for detection of RILI involves computed tomography (CT). CT is sensitive to increases in
lung density (ie. microanatomy) due to RILI (16,20-22), but these increases are typically
detected during the late irreversible phase of fibrosis. Furthermore, CT lung density
measurements are variable and depend on the degree of inspiration and patient posture
(23). CT perfusion imaging with intravenous injection of contrast agents has been shown
to be sensitive to vessel damage associated with RILI as soon as 4 weeks following
irradiation (6,24), but does not provide ventilation information. Single-photon emission
computed tomography (SPECT) imaging is sensitive to radiation-induced reductions in
regional perfusion and ventilation (25-27). Ventilation SPECT of the lungs can be based
on administration of radioactive gas (e.g. 81mKr and 133Xe), particulate aerosols labeled
with radioactive compounds (i.e. 99mTc-DTPA) and ultrafine graphite particles labeled with
99mTc. Perfusion SPECT of lungs typically uses intravenous administration of
macroaggregates of albumin labeled with 99mTc (28). Lung perfusion SPECT has been
shown to be more sensitive than CT to early-phase RILI (6 weeks post-irradiation), capable
of detecting approximately 20% perfusion reduction in 3D dose distributions over the range
15 to 30 Gy (29). However, quantitative SPECT images have inherently poor spatial
resolution and require corrections for image-degrading factors (i.e., photon scatter and
attenuation), leading to underestimation of ventilation-to-perfusion ratios (28,30,31).
Positron Emission Tomography (PET) using 18F-FDG offers higher spatial resolution than
106
SPECT and has been shown to detect metabolic changes associated with RILI within 1-3
months after radiotherapy (32). Hybrid nuclear imaging approaches such as SPECT/CT
and PET/CT further improve diagnostic accuracy and sensitivity to RILI by reducing
registration problems and improving corrections for image degradation (33); however, CT,
SPECT and PET are all limited by radiation exposure (~3 mSV) and SPECT and PET are
additionally limited by long scan times (10-30 minutes).
Although conventional proton Magnetic Resonance Imaging (MRI) of the lungs is limited
by low signal, the addition of hyperpolarized (Hp) nuclei including: 129Xe, 3He and 13C can
significantly improve image quality and provide functional information (34).
Hyperpolarization permits increases in signal of up to 105 from these nuclei, allowing rapid
and high spatial resolution MRI of the effects of radiation on the lung. Advances in
Dynamic Nuclear Polarization of 13C-pyruvate (35) have enabled identification of early
(days – weeks) metabolic changes in lung lactate-to-pyruvate ratios in a rat model of whole
thorax irradiation (36) and right thorax irradiation which correlates well with increases in
inflammatory cells (ie. macrophages) as confirmed by histology (37). The first case study
on rat model has shown that there is a significant increase in ADC maps of Hp 3He
associated with three months-post irradiation dose of 40 Gy (38). Hp 3He gas MRI has been
used to investigate human subjects undergoing radiotherapy suggesting that assessment of
ADC and ventilated defect percent can reveal late-phase (i.e. 6-8 months) RILI (39).
Another Hp 3He study showed the feasibility of detecting ventilation changes in image
intensity due to late RP (40). Recently, Hp 129Xe gas MRI morphometry has been shown
to be sensitive to microstructural changes in lung parenchyma in rat model of RILI after
two weeks irradiation (41).

107
Due to the relatively high solubility of xenon in biological tissues, Hp 129Xe has been
shown to be a promising approach for quantification of gas exchange between the alveolar
airspace and the dissolved phases, principally the pulmonary tissue (PT) and red blood
(RBC) compartments. Dissolved phase 129Xe exhibits a large chemical shift in PT (197
ppm) and RBCs (218 ppm) relative to the gas phase signal (42). Furthermore, the Chemical
Shift Saturation Recovery (CSSR) technique has been used for assessment of gas exchange
curves in the whole lung (43). Fitting the CSSR data to gas exchange models permits
quantification of lung function (i.e. gas exchange time constants and perfusion) as well as
microstructural (i.e. alveolar wall thickness and relative blood volume) changes (1,44-46).
Recently, whole lung CSSR has been shown to be sensitive to RILI at two weeks following
whole thorax 60Co irradiation in a rat model (47).
The above spectroscopic CSSR approaches, while quantitative, do not provide regional
information, which is expected to reflect regional heterogeneity in RILI, particularly in the
case of conformal irradiation approaches. MRI of Hp 129Xe in the dissolved phase can be
accomplished using multiple echo time MRI approaches, which exploits the phase
evolution of the MRI echo signal as a function of echo time to reconstruct images
corresponding to each dissolved compartment. In particular, IDEAL (Iterative
Decomposition of water and fat with Echo Asymmetry and Least-square estimation) MRI
has been shown to be efficient for obtaining gas and dissolved phase 129Xe images in a
breath-hold duration (48-51).
Recently, we have shown that an IDEAL approach utilizing single-shot spiral read-outs
can provide approximately a factor of ten improvement in speed, allowing measurement of
regional gas exchange curves in healthy rats (52). The purpose of this work was to

108
investigate early-stage regional RILI changes using Hp 129Xe and the rapid single shot-
spiral IDEAL approach. A rat model of RILI involving unilateral exposure of the right lung
to 60Co radiation followed by two weeks incubation period was employed. Using this
technique, separate gas, PT and RBC images were acquired at various gas transfer times in
order to obtain gas exchange curves for the left and right lungs. The ability of this approach
to distinguish regional changes between an irradiated rat cohort from a non-irradiated rat
cohort is demonstrated. The differences are correlated with histology and reconciled in
terms of pulmonary tissue thickening (i.e. RP) and vascular damage due to RILI using a
theoretical gas exchange model.
4.2 Methods
Animal Irradiation
All procedures followed animal use protocols approved by Western University’s Animal
Use Subcommittee and were consistent with the guidelines written by the Canadian
Council on Animal Care (CCAC). Animal preparation details for irradiation were
described previously (41). Two cohorts of five age-matched Sprague Dawley rats (374±26
g, Charles River Laboratories, Saint-Constant, Canada) were prepared for experiments.
The animals in the irradiated group were exposed to a total dose of 18 Gy delivered
uniformly to the right lung using a 60Co source at the London Regional Cancer Program
centre. A semi-circular collimator with a diameter of 4 cm was used to irradiate the right
thorax only. To achieve a uniform dose distribution, 9 Gy was delivered to the rat in the
supine position (at a rate of 95.1 cGy/min) and 9 Gy was delivered with the rat in the prone
position (at a rate of 80.3 cGy/min), with the collimator appropriately re-positioned to

109
irradiate only the right lung and spare the left lung. The second group of rats were not
irradiated and served as age-matched controls. The irradiated and non-irradiated cohorts
were housed in HEPA-filtered cages for two weeks prior to MRI. The image analyst (O.
D.) was blinded to the identity of the cohorts until after the analysis of the MRI results.
MR Image Acquisition and Analysis:
Imaging was performed using a 3T MRI system (MR750, GEHC, Waukesha, WI), a
custom-built transmit-only/receive-only birdcage coil (53) and a high performance
insertable gradient system as described previously (54). Hp 129Xe gas (approximately 80%
enriched with 10% polarization) was obtained from a commercial xenon polarizer system
(Polarean 9800, Durham, NH). All animals were imaged in the supine position following
three breaths of Hp 129Xe using a MRI-compatible mechanical ventilator (GE Healthcare,
Malmo, Sweden) for delivery of Hp 129Xe to the lung as described previously (47).
Four-point IDEAL: Images corresponding to gas, PT and RBC compartments were
acquired using a single-shot spiral, four-point IDEAL pulse sequence described previously
(1). Briefly, four-point IDEAL images were obtained using four echoes with a low flip
angle on the gas phase, high flip angle on the dissolved phases per echo and echo-times of
340 us × m, (m=1, 2, 3, 4). The sequence was averaged 10 times during a breath-hold period
of 3 s. The gas, PT and RBC images were reconstructed off-line using a Matlab routine
(MathWorks, Natick, MA) as described in Schulte et al. (2,3).
To obtain 129Xe gas exchange curves, the acquisition above was repeated for TR = 30, 50,
100, 200, 300 ms using separate breath-holds. Other pulse sequence parameters included:
FOV = 70 mm, BW = 125 kHz, a nominal matrix resolution of 22. The four-point gas

110
images were used to define ROIs corresponding to the left and right lungs of each rat (as
described in Figure 4.1). ROIs were used as masks to identify the lungs on all subsequent
four-point IDEAL images. The first acquired PT and RBC images were discarded since
they were not weighted by TR. The PT and RBC images were normalized by the Hp 129Xe
gas image to account for any systematic differences between breath-holds, including
polarization and ventilation. 129Xe gas exchange signal curves (SPT and SRBC vs. TR) were
then calculated corresponding to each lung (i.e. right vs. left) for the PT and RBC
compartments respectively for further analysis as described below.
Three-point IDEAL: Compared to four-point, higher SNR, temporal and spatial
resolution can be achieved using three-point IDEAL (1). However, three-point IDEAL is
a less practical imaging method for processing large cohorts since it results in long scan
times and gas consumption per animal. Therefore, for demonstration and conceptual
purposes, representative gas-PT and gas-RBC images were acquired for separate breath-
holds for only two rats in the cohort. Figure 4.1 shows a representative set of three-point
IDEAL images explaining the segmentation method (used also for the four-point IDEAL
gas exchange analysis above). Three-point IDEAL images of gas-RBC and gas-PT were
acquired for a FOV = 60 mm and TE = 50 us × m, (m = 1, 2, 3 ) from an irradiated animal
in the cohort study using two separate breath-holds. To achieve adequate SNR and spatial
resolution, the representative three-point IDEAL images were averaged 15 times during
each breath-hold taking advantage of higher temporal resolution.

111
Histology
Following MRI, rats were euthanized and lungs were extracted for histological analysis.
The rat lungs were fixed by intratracheal infusion of 9 mL of 10% neutral-buffered
formalin, and embedded in paraffin wax (57,58). The tissue was then cut into 5 µm thick
tissue sections and stained with haematoxylin-eosin (H&E). The sections were chosen to
avoid major airways and vessels and be evenly distributed between the apex and base of
each lung. Five images were acquired from both the left and right lungs at 40×
magnification corresponding to a pixel resolution of 0.23 µm using a Zeiss Axio Imager
microscope with a Retiga EXi Digical CCD camera (Q Imaging, Vancouver, BC, Canada).
Each image was then binarized using Matlab image processing functions (graythresh.m,
Matlab). The average percent tissue area (PTA), was calculated from each image by
counting the number of pixels with signal corresponding to all non-airspaces (e.g.
parenchyma, vessels etc.) and dividing by the total number of pixels in the field using an
automated binary thresh-holding approach (59). The PTA was calculated separately for
both the left and right lungs for each rat of both cohorts.

112
Gas Exchange Curve Analysis
The theoretical gas exchange model of Mansson et al. (1) was fitted to the SPT and SRBC
data as a function of TR for the left and right lungs. This analysis was similar to the fitting
of CSSR data from whole lungs described previously (46,47) and used the following
exponential function:
;where So is the y-intercept of the linear slope, τ, is the exponential gas transfer time
constant and S1 is the linear slope. From this fitting, the parameters So, S1, and τ were
obtained separately for SPT and SRBC for each of the right and left lungs of all rats. The
average alveolar tissue thickness (LPT) and the relative RBC volume (VRBC) were then
calculated for both left and right lungs of all rats as described in (1). Additionally, a total
PT and RBC signal, Stotal = SPT + SRBC, for each of the right and left lungs of each rat was
calculated based on the respective normalized image signal intensities at TR = 300 ms, for
comparison with PTA.
Statistical Analysis
Statistical analysis was performed using Tukey’s multiple comparison as part of a two-way
ANOVA analysis (Graphpad Prism software, version 6, La Jolla, CA, USA) within a
confidence interval of 95% to assess whether the differences in LPT and VRBC between left
and right lungs were significant for the irradiated and non-irradiated groups. Additionally,
Fisher’s Least Significant Difference (LSD) multiple comparison test was used to compare
the mean PTA of the irradiated and non-irradiated groups within a 95% confidence interval.
S(TR) = So ( 1 - exp( TR / τ ) ) + S1 TR [4.1]
113
Unlike the Tukey’s multiple comparison test, Fisher’s LSD test does not correct for multi
comparison of the left and right lungs, since the PTA values were not found to differentiate
between the left and right lungs of either the irradiated or unirradiated cohorts, as discussed
later. Finally, a correlation analyses between Stotal and PTA was performed using two-tailed
nonparametric Spearman correlation within a confidence interval of 95%.
4.3 Results
Figure 4.1 shows coronal three-point IDEAL images of (a) gas, (b) PT and (c) RBC
compartments from a representative irradiated animal. The gas compartment image
indicated in grey scale corresponds to the ventilation of 129Xe gas in the airways and in the
alveoli. The false color scale of the PT and RBC images allows the dissolved 129Xe signal
to be compared qualitatively and quantitatively between the left and right lungs taking
advantage of higher SNR of three-point IDEAL. In particular, the PT image shows
excellent correspondence with the gas image. The RBC image displayed signal both within
and outside the lung and is notably higher at the center of the image, corresponding to the
location of the heart and main pulmonary vessels. Figure 4.1 (d) and (e) show the RBC and
PT images respectively in false color overlaid on the corresponding gas image and cropped
to the contour lines obtained from the gas image. Regional intensity variations could be
seen between the right (irradiated) and left (unirradiated) lungs. An increase in the 129Xe
tissue image signal from the irradiated right lung compared to the unirradiated left lung is
apparent in Figure 4.1 (b) and (d). By contrast, the RBC image signal of the irradiated right
lung in Figure 4.1 (c) and (e) is reduced compared to the un-irradiated left lung.
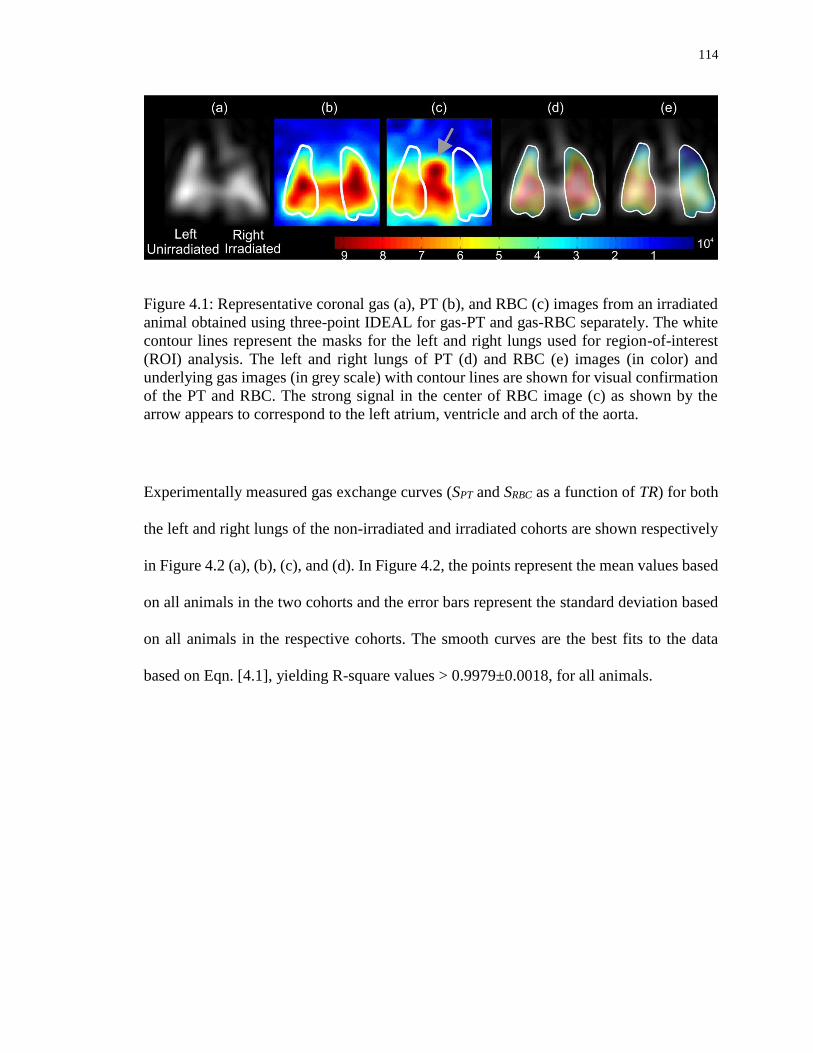
114
Figure 4.1: Representative coronal gas (a), PT (b), and RBC (c) images from an irradiated
animal obtained using three-point IDEAL for gas-PT and gas-RBC separately. The white
contour lines represent the masks for the left and right lungs used for region-of-interest
(ROI) analysis. The left and right lungs of PT (d) and RBC (e) images (in color) and
underlying gas images (in grey scale) with contour lines are shown for visual confirmation
of the PT and RBC. The strong signal in the center of RBC image (c) as shown by the
arrow appears to correspond to the left atrium, ventricle and arch of the aorta.
Experimentally measured gas exchange curves (SPT and SRBC as a function of TR) for both
the left and right lungs of the non-irradiated and irradiated cohorts are shown respectively
in Figure 4.2 (a), (b), (c), and (d). In Figure 4.2, the points represent the mean values based
on all animals in the two cohorts and the error bars represent the standard deviation based
on all animals in the respective cohorts. The smooth curves are the best fits to the data
based on Eqn. [4.1], yielding R-square values > 0.9979±0.0018, for all animals.

115
Figure 4.2: Mean gas transfer curves and corresponding fits to Eqn. [4.1] for the left and
right lungs of the unirradiated group (N=5) for PT (a) and RBC (c). Mean gas transfer data
and corresponding fits to Eqn. [4.1] for the left and right lungs of the irradiated group for
PT (b) and RBC (d). The smooth curves represent the best fits to the data and the points
and error bars represent the mean values calculated over all the animals in each respective
cohort for each lung.
The individual LPT and VRBC values are shown is a scatter plot in Figure 4.3 and summarized
in Table 4.1 for both the left and right lungs of both cohorts. The mean LPT values of the
left and right lungs (Figure 4.3 (a)) were determined to be 6.46±0.2 µm and 6.40±0.2 µm
respectively for the non-irradiated group (Table 4.1). The irradiated cohort demonstrated a
significant increase in LPT compared to the non-irradiated cohort of approximately 8.2% (P
= 0.0002) and 5.0% (P = 0.0497) for the right lungs and the left lungs respectively. As
expected, LPT was not statistically significantly different (P = 0.9682) between the left and
right lungs of the non-irradiated cohort. LPT was observed to be statistically significantly

116
different between the irradiated right lungs and unirradiated left lungs of the irradiated
cohort (P = 0.0210). The irradiated cohort exhibited a reduction in VRBC compared to the
non-irradiated cohort as shown in Figure 4.3 (b). As expected, the mean VRBC values were
not statistically different for the left and right lungs (P = 0.9353) of the non-irradiated
cohort. Compared to the non-irradiated cohort, VRBC values of the irradiated cohort
decreased by 36.1% (P = 0.0002) and 11.7% (P < 0.0354) for the right and left lungs
respectively. VRBC values were statistically significantly different (P = 0.0223) between the
irradiated right lungs and unirradiated left lungs of the irradiated group and showed
variations similar to LPT in Figure 4.3 (a).
Figure 4.3: Scatter plots of calculated LPT (a) and VRBC (b) values for all animals for both
left and right lungs from fit to Eqn. [4.1] in Figure 4.2. Corresponding p values are also
shown.

117
Table 4.1: Summary of mean PT thickness (LPT) and relative blood volume (VRBC)
calculated for all rats for both left and right lungs.
Rat number
Right Lung
LPTa [µm]
Left Lung
LPT [µm]
Right Lung
VRBCb
Left Lung
VRBC
NO
N-I
RR
AD
IAT
ED
1 6.54±0.5 6.43±0.5 0.36±0.07 0.39±0.08
2 6.34±0.3 6.25±0.6 0.41±0.08 0.44±0.10
3 6.19±0.4 6.51±0.4 0.45±0.10 0.37±0.07
4 6.47±0.4 6.26±0.5 0.38±0.11 0.44±0.08
5 6.78±0.6 6.54±0.5 0.30±0.12 0.36±0.09
M±SD 6.46±0.2 6.40±0.2 0.38±0.04 0.40±0.04
IRR
AD
IAT
ED
1 7.65±0.4 6.74±0.5 0.14±0.07 0.31±0.07
2 7.36±0.3 7.31±0.4 0.16±0.08 0.17±0.05
3 7.18±0.6 6.50±0.6 0.20±0.07 0.37±0.08
4 7.08±0.5 6.64±0.6 0.23±0.08 0.34±0.10
5 7.22±0.4 6.89±0.7 0.19±0.05 0.29±0.08
M±SD 7.30±0.2 6.82±0.3 0.18±0.03 0.30±0.03
aLPT and bVRBC are the pulmonary tissue thickness and the relative blood volume
respectively obtained from the Mansson model (4).
Figure 4.4 shows binarized histology images of (a) a non-irradiated and (b) an irradiated
rat lung chosen to visually accentuate the differences in pulmonary tissue thickening.
Figure 4.4 (c) shows a scatter plot of PTA values between the left and right lungs in the
non-irradiated and irradiated groups. The PTA values from the left (23.2 ± 4.8 %) and right
(22.2 ± 3.1 %) lungs in the non-irradiated group were not statistically significantly different
118
(P = 0.855) and close to expected values for normal animals (59) confirming that the rats
in this cohort were healthy. The PTA values of both the irradiated right lungs and
unirradiated left lungs of the irradiated cohort were observed to be significantly elevated
(~26.8 %) compared to the non-irradiated cohort for both the left (P = 0.048) and right
lungs (P = 0.0089), confirming the presence of radiation pneumonitis. However, there was
no statistically significant difference in PTA measurements between the irradiated right
lungs and unirradiated left lungs of the irradiated cohort (P = 0.524) showing that histology
was not able to distinguish differences in RP between the irradiated right lung and the
unirradiated left lung of the irradiated cohort. Figure 4.4 (d) shows a scatter plot of the
measured PTA values for all rats versus Stotal. The PTA measurements showed a significant
correlation with Stotal for both the non-irradiated (r = 0.795, P = 0.0081) and irradiated
groups (r = 0.911, P = 0.0005) and the two cohorts could be distinguished on the basis of
Stotal.

119
Figure 4.4: Binarized histology images of a non-irradiated (a) and an irradiated (b) rat lung
obtained at 10× magnification chosen to accentuate changes in pulmonary tissue thickening
(i.e. PTA). Scatter plot (c) showing PTA values for all rats and p values from Fisher’s LSD
multi-comparison test. Scatter plot (d) showing PTA and Stotal, for all rats. The
corresponding Spearman correlation coefficients were (r=0.911, p=0.0005) and (r=0.795,
p=0.0081) for the irradiated and non-irradiated groups respectively.

120
4.4 Discussion
The results of this work confirm the feasibility of measuring changes in gas exchange
curves associated with RILI regionally using Hp 129Xe MRI and a single-shot spiral four-
point IDEAL approach. Regional mapping of gas exchange curves based on imaging of PT
and RBC compartments separately enables regional differences in RILI to be resolved,
allowing contributions from RBC signal (i.e. heart and main pulmonary vessels), to be
excluded from the PT signal, and thereby provide insight into radiation pneumonitis (RP)
spatially, based on the choice of region of interest. Specifically, this work demonstrates
that SPT and SRBC gas exchange curves are significantly different for irradiated rats
compared to non-irradiated rats at two weeks following irradiation. Based on these
differences in gas exchange curves, the calculated LPT and VRBC were found to be
statistically larger and smaller respectively for the irradiated cohort compared to the non-
irradiated cohort. The LPT thickening was shown to correlate well with RP based on PTA
determined using histology. Furthermore, differences were more significant for the
irradiated right lung compared to the unirradiated left lung of the irradiated cohort, as
expected.
The sufficiently high SNR of PT images enables precise measurement of SPT gas exchange
curves from the left and right lungs separately with a standard error of less than 5% of the
mean SPT (N = 5). As expected, the SPT curves and calculated PT thickness in the non-
irradiated group were approximately the same for the left and right lungs. The signal from
blood plasma, which has the same chemical shift (197 ppm) as the PT signal, was expected
to be highest from the heart and corresponding arteries on PT image. However, it did not
121
appear to be as strong as the RBC signal from the heart. Therefore, we assume that the
contribution of blood plasma to the PT signal is not significant since the Ostwald solubility
of xenon in the blood plasma is approximately three times less than the RBC (60).
Furthermore, since the ROIs were also chosen such that the heart was excluded, the
contribution of plasma from the heart and great vessels to the tissue signal from the left
and right lungs can be safely ignored. However, it should be noted that this assumption
may not hold for the whole lung CSSR spectroscopy technique as discussed further below.
Both SPT and SRBC curves had a standard error less than reported for a whole lung CSSR
spectroscopy technique (~15%) (47) confirming the ability of the IDEAL imaging
approach to more accurately localize signal contributions. Furthermore, including the
signal from 129Xe-rich blood pool (i.e. heart and pulmonary arteries) leads to
overestimation of the linear slope (S1) and thereby the gas transfer time constant (τRBC) with
CSSR techniques for long gas transfer times (or TR) on the order of seconds. The direct
comparison of fitting parameters obtained in this study to previously-published whole lung
CSSR spectroscopy results is not straight-forward due to the confounding effects of
multiple regional PT and RBC signals affecting CSSR. As discussed previously by Chang
et. al. (44) implementing overestimated fitting parameters would also cause inaccurate
calculation of physiological parameters.
Nevertheless, the SPT from the irradiated group showed a higher linear slope compared to
the non-irradiated group, which was consistent with findings previously reported by Fox
et. al. (47) for a whole lung irradiated rat model within the transfer time interval of 300 ms
(61). The signal amplitude was correlated to increased tissue volume (48). A higher signal
amplitude on the injured right lung compared to the non-irradiated left lung was also noted
122
in the representative PT image (Figure 4.1). Although the pulmonary tissue thickening
developed in both lungs, the impact of the injury was more severe on the irradiated right
lung leading to image intensity variations when compared to the unirradiated left lung.
Presumably this is due to the development of RP in the early stages of RILI (after two
weeks of irradiation) resulting in tissue thickening from inflammation and/or edema.
Correspondingly, the time course of exchange of Hp 129Xe from the gas phase to PT will
be elevated due the increased PT thickness leading to a steeper gas exchange curve (or
increased S1) in the early TR data points. The PT gas exchange curves from the irradiated
right lungs were also statistically different from those of the unirradiated left lungs of the
irradiated cohort confirming the presence of more significant RP in the right lung. This
agrees with the findings previously reported by Thind et al. for a partially irradiated rat
lung model (37).
Despite the approximations inherent to the theoretical gas exchange model used here and
designed for global lung function with the CSSR technique, the average LPT values agree
well with previously published healthy rat pulmonary tissue thicknesses (5-6 µm) obtained
using optical microscopy techniques (57). Although the mean PTA measurements made in
this study using histology (Figure 4.4 (a) and (b)) were not capable of separating the
contributions of PT and vessels (including RBC) from each other and any other tissue
present, the mean PTA of the irradiated cohort was still found to be statistically
significantly different from the non-irradiated cohort confirming that the irradiated animals
had developed RP. This is perhaps not surprising since the tissue thickening due to
inflammation is likely more significant than any losses in blood vessels (and RBC) due to
irradiation, thus giving rise to a net increase in PTA (62). Nevertheless, in contrast to the

123
MRI approach, the PTA was not found to be different between the left and right lungs of
the irradiated cohort, suggesting that regional differences in RP and vessel damage cannot
be discriminated using histology. The densities of vessels in the histology images and
choice of the slice location could help explain discrepancies in measured PTA. Further
studies using vessel and RBC specific techniques (e.g. autofluorescence) are needed to
histologically measure the pulmonary tissue and RBC separately for comparison with the
LPT and VRBC values obtained from MRI measurements.
The selection of ROIs based on the three-point IDEAL gas images permits the assessment
of RBC gas exchange curves, SRBC, primarily from the pulmonary capillaries, excluding
the confounding signal from the heart and other great vessels. Interestingly, there was
approximately a 5% difference in SRBC observed between the left and right lungs in the non-
irradiated group which may due to the inherent difference between the normal total blood
volumes in the healthy right and left lungs of the rat (3). Another possible explanation for
the difference between the left and right lung in the non-irradiated group might be to low
signal, variation in the regional pulsation (60) and the asymmetry due to the strong signal
from the heart and corresponding arteries in the region of interest. Nevertheless, a relatively
large standard error in SRBC (~10%) compared to the SPT (~5%) was observed and the SRBC
differ, on average, approximately two-fold in the irradiated cohort compared to the non-
irradiated group.
The reduction of arterial perfusion and obstruction of capillaries in the irradiated lungs due
to RILI has been observed histologically in other studies (3-5). However, reduced perfusion
has only previously been reported after 30 days post-irradiation using SPECT. The early
and significant reductions in SRBC with irradiation observed in this study could potentially
124
provide another method by which to quantify and discern the mechanisms of RILI, for
example RP versus vascular changes known to depend on the method of radiation
fractionation. Stereotactic body radiation therapy (SBRT) which is based on giving a large
total dose (60 Gy) using fewer fractions (20 Gy/fraction) has been shown to provide better
local tumor control and higher rates of local progression-free survival (63,64). Despite the
improved survival rates with high dose approaches, lung toxicity is still a limiting factor
(65) and detection of RILI after two weeks irradiation may help to reduce incidence of
radiation pneumonitis. In particular, SBRT could benefit from early identification of RP
and vascular changes using the approach described in this study. The two-week post-
irradiation time interval chosen for this study should allow detection of the early stage
pneumonitis and re-evaluation of the dose fractionation scheme or indicate the need for
pharmaceuticals (i.e. radioprotective drugs). Further studies are needed to identify how
could this new imaging technique would help to improve RT planning for patients.
In this study, the theoretical model of Mansson et al. (1) was used to extract measures of
average pulmonary tissue thickness and relative blood volume regionally. This model is
based on one-dimensional radial diffusive exchange in a 2D compartmental geometry. It is
likely that a more sophisticated diffusive gas exchange which accounts for the 3D structure
of alveoli including blood flow within surrounding capillaries would provide more
physiologically insight and help to reveal RILI mechanisms in more detail, including
vascular damage (61). In particular, measurement of changes in surface area between the
capillaries and alveolar walls independent of changes in perfusion would help to assess
early RILI. This approach could also be applied to perfusion of other organs specifically
the heart using a dedicated TO/RO RF coils optimized for heart imaging (53).

125
The four-point IDEAL method used here should be translatable to clinical early-phase RILI
detection within a single breath-hold time of 10.7 seconds using an interleaved spiral
approach with TR values of 15, 30, 50, 100, 250 ms and would benefit by acceleration
provided by parallel MRI. Higher polarizations (30-40%) should also allow measurement
of regional gas exchange curves and mapping on a voxel-by-voxel basis and, potentially,
isotropic 3D imaging allowing resolution of early-phase RILI regional effects associated
with complex dose distributions in the lung.
4.5 Conclusion
Regional gas exchange changes associated with early (two week) radiation pneumonitis in
a rat model of Radiation-Induced Lung Injury (RILI) can be measured using Hp 129Xe MRI
and a single-shot spiral IDEAL approach. The pulmonary tissue (PT) and red blood cell
(RBC) compartments are significantly different in irradiated rats compared to non-
irradiated rats. The novel approach was also capable of distinguishing irradiated lung from
the non-irradiating lung suggesting that the early-phase changes can be measured
regionally. The measured pulmonary tissue thickness (LPT) of non-irradiated rats is in
agreement with previously reported histology measurements, and the LPT from irradiated
rat lungs is significantly elevated compared to unirradiated lung and correlates with
histology. In addition, the RBC volume (VRBC) is reduced in the irradiated lung. These
preliminary in vivo results confirm that this new approach can be used to quantify regional
gas exchange changes associated with a rat model of early stage RILI two weeks post
irradiation and potentially could be translated to humans for improving thoracic
radiotherapy outcomes.
126
4.6 References
1. Mansson S, Wolber J, Driehuys B, Wollmer P, Golman K. Characterization of
diffusing capacity and perfusion of the rat lung in a lipopolysaccaride disease model
using hyperpolarized Xe-129. Magn Reson Med 2003;50(6):1170-1179.
2. Ghafoori P, Marks LB, Vujaskovic Z, Kelsey CR. Radiation-induced lung injury.
Assessment, management, and prevention. Oncology 2008;22(1):37-47;52-33.
3. Ts'ao CH, Ward WF, Port CD. Radiation injury in rat lung. I. Prostacyclin (PGI2)
production, arterial perfusion, and ultrastructure. Radiat Res 1983;96(2):284-293.
4. Ts'ao CH, Ward WF, Port CD. Radiation injury in rat lung. III. Plasminogen activator
and fibrinolytic inhibitor activities. Radiat Res 1983;96(2):301-308.
5. Ward WF, Solliday NH, Molteni A, Port CD. Radiation injury in rat lung. II.
Angiotensin-converting enzyme activity. Radiat Res 1983;96(2):294-300.
6. Milliat F, Francois A, Isoir M, Deutsch E, Tamarat R, Tarlet G, Atfi A, Validire P,
Bourhis J, Sabourin JC, Benderitter M. Influence of endothelial cells on vascular
smooth muscle cells phenotype after irradiation: implication in radiation-induced
vascular damages. Am J Pathol 2006;169(4):1484-1495.
7. Hill RP. Radiation effects on the respiratory system. The British Journal of Radiology
2005;27(1):75-81.
8. Bentzen SM. Preventing or reducing late side effects of radiation therapy:
radiobiology meets molecular pathology. Nat Rev Cancer 2006;6(9):702-713.
9. Evans ES, Hahn CA, Kocak Z, Zhou SM, Marks LB. The role of functional imaging
in the diagnosis and management of late normal tissue injury. Semin Radiat Oncol
2007;17(2):72-80.
10. Koh WJ, Stelzer KJ, Peterson LM, Staker BL, Ward WF, Russell KJ, Griffin TW.
Effect of pentoxifylline on radiation-induced lung and skin toxicity in rats.
International journal of radiation oncology, biology, physics 1995;31(1):71-77.
11. Dion MW, Hussey DH, Doornbos JF, Vigliotti AP, Wen BC, Anderson B.
Preliminary results of a pilot study of pentoxifylline in the treatment of late radiation
soft tissue necrosis. International journal of radiation oncology, biology, physics
1990;19(2):401-407.
12. Rubin P, Johnston CJ, Williams JP, McDonald S, Finkelstein JN. A perpetual
cascade of cytokines postirradiation leads to pulmonary fibrosis. International
journal of radiation oncology, biology, physics 1995;33(1):99-109.

127
13. Tahamtan R, Shabestani Monfared A, Tahamtani Y, Tavassoli A, Akmali M,
Mosleh-Shirazi MA, Naghizadeh MM, Ghasemi D, Keshavarz M, Haddadi GH.
Radioprotective effect of melatonin on radiation-induced lung injury and lipid
peroxidation in rats. Cell J 2015;17(1):111-120.
14. Citrin D, Cotrim AP, Hyodo F, Baum BJ, Krishna MC, Mitchell JB. Radioprotectors
and Mitigators of Radiation-Induced Normal Tissue Injury. Oncologist
2010;15(4):360-371.
15. Serin M, Gulbas H, Gurses I, Erkal HS, Yucel N. The histopathological evaluation
of the effectiveness of melatonin as a protectant against acute lung injury induced by
radiation therapy in a rat model. International Journal of Radiation Biology
2007;83(3):187-193.
16. Marks LB, Munley MT, Spencer DP, Sherouse GW, Bentel GC, Hoppenworth J,
Chew M, Jaszczak RJ, Coleman RE, Prosnitz LR. Quantification of radiation-
induced regional lung injury with perfusion imaging. International journal of
radiation oncology, biology, physics 1997;38(2):399-409.
17. Choi NC, Kanarek DJ. Toxicity of thoracic radiotherapy on pulmonary function in
lung cancer. Lung Cancer 1994;10(1):S219-230.
18. Curran WJ, Jr., Moldofsky PJ, Solin LJ. Observations on the predictive value of
perfusion lung scans on post-irradiation pulmonary function among 210 patients with
bronchogenic carcinoma. International journal of radiation oncology, biology,
physics 1992;24(1):31-36.
19. Gergel TJ, Leichman L, Nava HR, Blumenson LE, Loewen GM, Gibbs JF,
Khushalani NI, Leichman CG, Bodnar LM, Douglass HO, Smith JL, Kuettel MR,
Proulx GM. Effect of concurrent radiation therapy and chemotherapy on pulmonary
function in patients with esophageal cancer: dose-volume histogram analysis. Cancer
J 2002;8(6):451-460.
20. Wennberg B, Gagliardi G, Sundbom L, Svane G, Lind P. Early response of lung in
breast cancer irradiation: radiologic density changes measured by CT and
symptomatic radiation pneumonitis. International journal of radiation oncology,
biology, physics 2002;52(5):1196-1206.
21. Jenkins P, Welsh A. Computed Tomography Appearance of Early Radiation Injury
to the Lung: Correlation with Clinical and Dosimetric Factors. Int J Radiat Oncol
2011;81(1):97-103.
22. Mah K, Van Dyk J. Quantitative measurement of changes in human lung density
following irradiation. Radiotherapy and oncology 1988;11(2):169-179.
23. Palma DA, de Koste JRV, Verbakel WFAR, Senan S. A new approach to quantifying
lung damage after stereotactic body radiation therapy. Acta Oncologica
2011;50(4):509-517.
128
24. Hu XY, Fang XM, Chen HW, Yao XJ, Qian PY, Zhou JY, Guo J, Lerner A, Hu CH.
Early detection of acute radiation-induced lung injury with multi-section CT
perfusion imaging: An initial experience. Clin Radiol 2014;69(8):853-860.
25. Woel RT, Munley MT, Hollis D, Fan M, Bentel G, Anscher MS, Shafman T,
Coleman RE, Jaszczak RJ, Marks LB. The time course of radiation therapy-induced
reductions in regional perfusion: a prospective study with >5 years of follow-up.
International journal of radiation oncology, biology, physics 2002;52(1):58-67.
26. Boersma LJ, Damen EM, de Boer RW, Muller SH, Roos CM, Valdes Olmos RA,
van Zandwijk N, Lebesque JV. Dose-effect relations for local functional and
structural changes of the lung after irradiation for malignant lymphoma.
Radiotherapy and oncology 1994;32(3):201-209.
27. Damen EM, Muller SH, Boersma LJ, de Boer RW, Lebesque JV. Quantifying local
lung perfusion and ventilation using correlated SPECT and CT data. Journal of
nuclear medicine 1994;35(5):784-792.
28. Petersson J, Sanchez-Crespo A, Larsson SA, Mure M. Physiological imaging of the
lung: single-photon-emission computed tomography (SPECT). Journal of applied
physiology 2007;102(1):468-476.
29. Marks LB, Yu X, Vujaskovic Z, Small W, Jr., Folz R, Anscher MS. Radiation-
induced lung injury. Semin Radiat Oncol 2003;13(3):333-345.
30. Petersson J, Sanchez-Crespo A, Rohdin M, Montmerle S, Nyren S, Jacobsson H,
Larsson SA, Lindahl SG, Linnarsson D, Glenny RW, Mure M. Physiological
evaluation of a new quantitative SPECT method measuring regional ventilation and
perfusion. Journal of applied physiology 2004;96(3):1127-1136.
31. Zhang W, Wang J, Tang M, Pan J, Bai P, Lin D, Qian F, Lin F, Yang X, Zhang S.
Quantitative study of lung perfusion SPECT scanning and pulmonary function
testing for early radiation-induced lung injury in patients with locally advanced non-
small cell lung cancer. Exp Ther Med 2012;3(4):631-635.
32. McCurdy MR, Castillo R, Martinez J, Al Hallack MN, Lichter J, Zouain N, Guerrero
T. [18F]-FDG uptake dose-response correlates with radiation pneumonitis in lung
cancer patients. Radiotherapy and oncology 2012;104(1):52-57.
33. Siva S, Callahan J, Kron T, Martin OA, MacManus MP, Ball DL, Hicks RJ, Hofman
MS. A prospective observational study of Gallium-68 ventilation and perfusion
PET/CT during and after radiotherapy in patients with non-small cell lung cancer.
BMC Cancer 2014;14:740.
34. Santyr G, Fox M, Thind K, Hegarty E, Ouriadov A, Jensen M, Scholl TJ, Van Dyk
J, Wong E. Anatomical, functional and metabolic imaging of radiation-induced lung
injury using hyperpolarized MRI. Nmr Biomed 2014;27(12):1515-1524.

129
35. Ardenkjaer-Larsen JH, Fridlund B, Gram A, Hansson G, Hansson L, Lerche MH,
Servin R, Thaning M, Golman K. Increase in signal-to-noise ratio of > 10,000 times
in liquid-state NMR. Proceedings of the National Academy of Sciences of the United
States of America 2003;100(18):10158-10163.
36. Thind K, Chen A, Friesen-Waldner L, Ouriadov A, Scholl TJ, Fox M, Wong E,
VanDyk J, Hope A, Santyr G. Detection of radiation-induced lung injury using
hyperpolarized C-13 magnetic resonance spectroscopy and imaging. Magn Reson
Med 2013;70(3):601-609.
37. Thind K, Jensen MD, Hegarty E, Chen AP, Lim H, Martinez-Santiesteban F, Van
Dyk J, Wong E, Scholl TJ, Santyr GE. Mapping metabolic changes associated with
early Radiation Induced Lung Injury post conformal radiotherapy using
hyperpolarized (1)(3)C-pyruvate Magnetic Resonance Spectroscopic Imaging.
Radiotherapy and oncology;110(2):317-322.
38. Ward ER, Hedlund LW, Kurylo WC, Wheeler CT, Cofer GP, Dewhirst MW, Marks
LB, Vujaskovic Z. Proton and hyperpolarized helium magnetic resonance imaging
of radiation-induced lung injury in rats. International journal of radiation oncology,
biology, physics 2004;58(5):1562-1569.
39. Mathew L, Gaede S, Wheatley A, Etemad-Rezai R, Rodrigues GB, Parraga G.
Detection of longitudinal lung structural and functional changes after diagnosis of
radiation-induced lung injury using hyperpolarized He-3 magnetic resonance
imaging. Med Phys 2010;37(1):22-31.
40. Ireland RH, Din OS, Swinscoe JA, Woodhouse N, van Beek EJR, Wild JM, Hatton
MQ. Detection of radiation-induced lung injury in non-small cell lung cancer patients
using hyperpolarized helium-3 magnetic resonance imaging. Radiotherapy and
Oncology 2010;97(2):244-248.
41. Ouriadov A, Fox M, Hegarty E, Parraga G, Wong E, Santyr EG. Early Stage
Radiation-Induced Lung Injury Detected Using Hyperpolarized 129Xe
Morphometry: Proof-of-Concept Demonstration in a Rat Model. Magn Reson Med
2015;in press.
42. Mugler JP, Driehuys B, Brookeman JR, Cates GD, Berr SS, Bryant RG, Daniel TM,
deLange EE, Downs JH, Erickson CJ, Happer W, Hinton DP, Kassel NF, Maier T,
Phillips CD, Saam BT, Sauer KL, Wagshul ME. MR imaging and spectroscopy using
hyperpolarized Xe-129 gas: Preliminary human results. Mag Reson Med
1997;37(6):809-815.
43. Patz S, Muradian I, Hrovat MI, Ruset IC, Topulos G, Covrig SD, Frederick E, Hatabu
H, Hersman FW, Butler JP. Human pulmonary imaging and spectroscopy with
hyperpolarized Xe-129 at 0.2T. Acad Radiol 2008;15(6):713-727.
44. Chang YV. MOXE: a model of gas exchange for hyperpolarized 129Xe magnetic
resonance of the lung. Magn Reson Med 2013;69(3):884-890.

130
45. Patz S, Muradyan I, Hrovat MI, Dabaghyan M, Washko GR, Hatabu H, Butler JP.
Diffusion of hyperpolarized Xe-129 in the lung: a simplified model of Xe-129 septal
uptake and experimental results. New J Phys 2011;13.
46. Stewart NJ, Leung G, Norquay G, Marshall H, Parra-Robles J, Murphy PS, Schulte
RF, Elliot C, Condliffe R, Griffiths PD, Kiely DG, Whyte MK, Wolber J, Wild JM.
Experimental validation of the hyperpolarized Xe chemical shift saturation recovery
technique in healthy volunteers and subjects with interstitial lung disease. Magn
Reson Med 2014.
47. Fox MS, Ouriadov A, Thind K, Hegarty E, Wong E, Hope A, Santyr GE. Detection
of radiation induced lung injury in rats using dynamic hyperpolarized Xe-129
magnetic resonance spectroscopy. Med Phys 2014;41(7).
48. Driehuys B, Cofer GP, Pollaro J, Mackel JB, Hedlund LW, Johnson GA. Imaging
alveolar-capillary gas transfer using hyperpolarized Xe-129 MRI. Proceedings of the
National Academy of Sciences of the United States of America 2006;103(48):18278-
18283.
49. Kaushik SS, Robertson SH, Freeman MS, He M, Kelly KT, Roos JE, Rackley CR,
Foster WM, McAdams HP, Driehuys B. Single-breath clinical imaging of
hyperpolarized xe in the airspaces, barrier, and red blood cells using an interleaved
3D radial 1-point Dixon acquisition. Magn Reson Med 2015.
50. Qing K, Mugler JP, Altes TA, Jiang Y, Mata JF, Miller GW, Ruset IC, Hersman FW,
Ruppert K. Assessment of lung function in asthma and COPD using hyperpolarized
Xe-129 chemical shift saturation recovery spectroscopy and dissolved-phase MRI.
Nmr Biomed 2014;27(12):1490-1501.
51. Qing K, Ruppert K, Jiang Y, Mata JF, Miller GW, Shim YM, Wang C, Ruset IC,
Hersman FW, Altes TA, Mugler JP, 3rd. Regional mapping of gas uptake by blood
and tissue in the human lung using hyperpolarized xenon-129 MRI. J Magn Reson
Imaging 2014;39(2):346-359.
52. Doganay O, Wade TP, Hegarty E, McKenzie C, Schulte RF, Santyr EG.
Hyperpolarized 129Xe Imaging of the Rat Lung using Spiral IDEAL. Magn Reson
Med 2015; DOI 10.1002/mrm.25911.
53. Doganay O, Thind K, Wade T, Ouriadov A, Santyr GE. Transmit-only/receive-only
radiofrequency coil configuration for hyperpolarized 129Xe MRI of rat lungs.
Concepts in Magnetic Resonance Part B: Magnetic Resonance Engineering 2015:
DOI: 10.1002/cmr.b.21288.
54. Foster-Gareau P, Heyn C, Alejski A, Rutt BK. Imaging single mammalian cells with
a 1.5 T clinical MRI scanner. Magn Reson Med 2003;49(5):968-971.
131
55. Wiesinger F, Weidl E, Menzel MI, Janich MA, Khegai O, Glaser SJ, Haase A,
Schwaiger M, Schulte RF. IDEAL spiral CSI for dynamic metabolic MR imaging of
hyperpolarized [1-13C]pyruvate. Magn Reson Med 2012;68(1):8-16.
56. Schulte RF, Sperl JI, Weidl E, Menzel MI, Janich MA, Khegai O, Durst M,
Ardenkjaer-Larsen JH, Glaser SJ, Haase A, Schwaiger M, Wiesinger F. Saturation-
recovery metabolic-exchange rate imaging with hyperpolarized [1-13C] pyruvate
using spectral-spatial excitation. Magn Reson Med 2013;69(5):1209-1216.
57. Tanaka R, Al-Jamal R, Ludwig MS. Maturational changes in extracellular matrix and
lung tissue mechanics. Journal of applied physiology 2001;91(5):2314-2321.
58. Sukstanskii AL, Yablonskiy DA. Lung morphometry with hyperpolarized 129Xe:
theoretical background. Magn Reson Med 2012;67(3):856-866.
59. Takahashi A, Hamakawa H, Sakai H, Zhao X, Chen F, Fujinaga T, Shoji T, Bando
T, Wada H, Date H. Noninvasive assessment for acute allograft rejection in a rat lung
transplantation model. Physiol Rep 2014;2(12).
60. Ruppert K, Altes TA, Mata JF, Ruset IC, Hersman FW, Mugler JP, 3rd. Detecting
pulmonary capillary blood pulsations using hyperpolarized xenon-129 chemical shift
saturation recovery (CSSR) MR spectroscopy. Magn Reson Med 2015.
61. Doganay O, Fox M, Santyr GE. Measurement of Pulmonary Perfusion and Gas
Exchange using Hyperpolarized 129Xe in a Rodent Model of Radiation-Induced
Lung Injury. Proceedings of the 22th Annual Meeting of ISMRM
2014;Milan(Italy):abstract 2290.
62. Gayzik FS, Hoth JJ, Stitzel JD. Quantitative histology of contused lung tissue with
comparison to computed tomography. Biomed Sci Instrum 2008;44:225-230.
63. Goldstraw P, Ball D, Jett JR, Le Chevalier T, Lim E, Nicholson AG, Shepherd FA.
Non-small-cell lung cancer. Lancet 2011;378(9804):1727-1740.
64. Salama JK, Schild SE. Radiation therapy for oligometastatic non-small cell lung
cancer. Cancer Metastasis Rev 2015.
65. Fairchild A, Harris K, Barnes E, Wong R, Lutz S, Bezjak A, Cheung P, Chow E.
Palliative thoracic radiotherapy for lung cancer: a systematic review. J Clin Oncol
2008;26(24):4001-4011.

132
Chapter 5 : Thesis Discussion and Future Work
5.1 Thesis Discussion
Various imaging modalities such as SPECT, PET, CT, Hp MRI, and non-imaging
techniques (eg. PFTs) are capable of providing functional information about RILI. Among
them, Hp 129Xe MR imaging technique may exceed the capacities of established modalities
for detection of early phase RILI. The reason for this is 129Xe diffuses in the lung air space,
PT and RBC in a way similar to O2 providing relevant functional information about the gas
exchange (ie. gas exchange curves). Additionally, 129Xe is a chemically inert and
metabolically inactive gas in the PT and RBC. 129Xe gas exchange curves can be
quantitatively used to explore regional lung function when fitted to appropriate theoretical
models.
In this work, a new approach using Hp 129Xe MRI was developed to quantitatively measure
the early phase of RILI in a rat model two weeks post-irradiation. The design and
development of this approach required the establishment of multi-disciplinary interactions,
including technical developments for improved Hp MRI tools. Firstly, SNR was increased
by designing, constructing and optimizing a custom transmit-only / receive-only (TO/RO)
coil consisting of two components: (i) a high-pass birdcage transmit-only coil that
produced a homogenous B1 magnetic field, and (ii) a saddle-shaped receive-only surface
coil that allowed high sensitivity for the lung. Next, a single-shot spiral IDEAL imaging
technique was implemented and optimized for Hp 129Xe dissolved phase imaging. In vivo
results using a rat model showed regional detection of xenon exchange curves. Finally,
133
with the use of the TO/RO coil in combination with the single-shot spiral IDEAL pulse
sequence, the feasibility of early detection of RILI in a rat model two weeks-post irradiation
(18 Gy) was investigated. Lung tissue for histological examinations were obtained from
both an irradiated (N=5) and a non-irradiated (N=5) cohort on order to confirm whether
the rats developed RILI at two weeks following irradiation. The following sections provide
an overall discussion about each chapter and addresses the potential of translating this Hp
129Xe MRI technique to clinical imaging.
5.2 SNR Improvement
Chapter 2 described the study performed to improve the SNR by developing a TO/RO coil
configuration for rat imaging. In general, Hp 129Xe gas phase imaging is conventionally
achieved using birdcage volume coils, which provide acceptable transmit RF field and
image homogeneity for gas imaging. However, improved SNR is necessary for imaging
the dissolved phases of 129Xe as they represent only 2% of the total signal available. To
demonstrate the efficiency of our novel TO/RO RF coil configuration, a thermally-
polarized phantom was imaged in Chapter 2. Since there was not an available dissolved
phase MR sequence and the polarization of the 129Xe gas was limited (~ 5%), the feasibility
of the TO/RO RF coil was initially tested for imaging only the gas phase in vivo in rat
lungs. FGRE coronal images showed an SNR improvement factor of approximately three
with the new TO/RO coil configuration compared to the conventional T/R coil
configuration. Although this SNR improvement was encouraging, further development
was required for imaging the dissolved phases of 129Xe.

134
In Chapter 3, an additional improvement of approximately three-fold in SNR was
accomplished using a single shot-spiral IDEAL pulse sequence. The total improvement in
SNR, using both the new TO/RO RF coil configuration and the single-shot IDEAL spiral
imaging sequence, enabled imaging of gas, PT and RBC compartments separately. Even
though polarization levels of 10% with enriched 129Xe gas was used during the study, the
SNR was not sufficient to achieve the necessary image quality to capture the gas exchange
curves within a single breath-hold (6-10s). To address this problem, 10 sets of IDEAL
images were acquired for a specific TR value within a single breath-hold time. Apart from
the non-renewable nature of the noble gas polarization, the dissolved phase signal
replenishes during the TR value due to transfer from the gas phase reservoir. The IDEAL
sequence used this property to improve SNR by additional factor of three. Altogether, a
total improvement in SNR was approximately 27-fold for each breath-hold image.
Consequently, the measurement of gas exchange curves was achievable by analyzing the
image intensity variations as a function of TR.
5.3 Early Detection of RILI in a Rat Model
Chapter 4 discussed the use of the new TO/RO RF coil and single-shot spiral IDEAL pulse
sequence for detection of RILI in a partially irradiated rat thorax. The dynamics of gas
exchange significantly changed within the two weeks post-irradiated group compared to
the control group. This was consistent with previously published 129Xe CSSR MR results
in a whole-lung irradiated rat model (1). In particularly, we investigated whether the new
imaging approach would allow detect of regional changes due to the partial-irradiation of

135
the right thorax. This new technique was able to distinguish the irradiated lung from the
unirradiated lung in the irradiated cohort group.
Compared to previous published studies using SPECT, PET, and CT, Hp 129Xe MRI was
also capable of differentiating the effects of RILI on the PT and RBC compartments. An
increase in LT was observed in both the left and right lungs in the irradiated cohort
compared to the non-irradiated cohort (Table 4.1). Although, the increase in LT was less in
the unirradiated (left) lungs compared to the irradiated right lungs of the irradiated cohort,
this result was not surprising, since it was also observed in the histology and has been
reported previously in other imaging studies such as Hp 13C (2). One hypothesis to explain
this effect is that the whole organ responded to the irradiation delivered to one side. A
significant drop in VRBC was observed in the irradiated lungs, which was similar to
observations in studies using SPECT lung perfusion (3,4). However, SPECT was only able
to detect RILI with doses greater than 20 Gy and four weeks post-irradiation. Therefore,
Hp 129Xe MRI was highly sensitive to the regional changes of RILI as early as to two weeks
post-irradiation with 18 Gy in the rat model.
The PTA values derived from the histology of the total pulmonary tissue and surrounding
capillaries were unable to distinguish between the irradiated and unirradiated lungs in the
irradiated cohort as discussed in Chapter 4. However, PTA measurements showed a
statistically significant difference between the irradiated and non-irradiated rat cohorts. In
the future, the histological measurements could be improved using better techniques to
validate LT and VRBC measurements separately. For example, autofluorescent microscopy
techniques could be used in future to verify changes in VRBC (5).

136
5.4 Analysis of Gas Exchange Curves
The quantification of lung function using theoretical 1D gas exchange models as used in
this thesis are often based on assumptions that over-simplify the alveolar geometry as
shown in Figure 1.11 (b) (6). Therefore, the 1D-gas exchange model used in this thesis can
only be used to calculate the variations in the 1D (i.e. radial) diffusion path length (i.e. LT
and Lc) separately for the PT and RBC compartments. Changes in the diffusion path length
are then interpreted in terms of other estimations of global function of the lungs, including
the relative blood volume by integration of the 1D-geometry over the entire alveolar cell
volume. The 1D circularly symmetric gas exchange model excludes information about the
gas exchange volume and diffusion surface area between (i) the alveolar air space and the
PT compartment, and (ii) the PT and RBC compartments. This information is more
appropriately extracted using a 3D-gas exchange model of the alveolus.
Another 1D-gas exchange model, the MOXE model, also interprets CSSR gas exchange
data through diffusion path lengths by solving diffusion equations (7). In the MOXE model,
the missing link between the diffusion path length and the CSSR measurement is provided
using two normalization factors including the surface-to-volume ratio and barrier-to-
septum ratio. The normalization factors are empirically obtained from the fitting
parameters of the gas exchange curves. The first normalization factor is used to scale the
solution of the diffusion equations between the gas and PT (8). The second normalization
factor is used to scale the solution of the diffusion equations between the PT and RBC (7).
Overall, all the existing analytical gas exchange models treat the lung as a simplified
uniform 1D model to fit to the CSSR data from the whole lung. In this study, the Mansson

137
model was used to analyze the gas exchange curves because the Mansson model was easy
to implement and did not require additional normalization factors. However, as already
discussed in Chapter 4 (Figure 4.1), the RBC image intensity distribution was significantly
different regionally from both the gas and PT compartment images. Therefore, an improved
theoretical model with a more a sophisticated 3D geometry may be important to consider
for explaining the spatial variation in RBC signal intensity. Additionally, the dynamics of
the gas diffusion from the PT to RBC has to consider the diffusion area, possible using a
3D numerical model (9). In future, using a 3D model, the RBC compartments could be
simulated without using a scaling factor from the PT signal. In this way, a study using a
3D numerical model may reveal mechanisms of RILI changes in the RBC compartment
independently from the PT compartment.
5.5 Future Work
Although SNR improvement accomplished in this thesis with the TO/RO RF coil and
single-shot spiral IDEAL pulse sequence design, was able to capture the dynamics of gas
exchange within a single breath-hold, this was still challenging with the relatively modest
10% polarization and required multiple breath-holds to perform averaging, especially for
the low TR values. The SNR can be significantly elevated using new commercially
available polarizers (i.e. Polarean 9820 129Xe hyperpolarizer, Polarean Inc., Durham) that
can produce polarization levels of approximately 45%. Further improvement in
polarization can be achieved by addressing the unwanted thermal gradients along the SEOP
cell, improving the spin exchange interaction time between 129Xe and polarized 87Rb, and
improving the filtration of 129Xe process traps. The use of higher polarizations (~30% or

138
higher) in future would significantly improve the 129Xe dissolved phase signal. In this case,
smaller flip angle values, on the order of 1-2 degrees, would be sufficient to produce
enough SNR for the gas phase images. Since the low flip angles do not consume the gas
reservoir magnetization, a further increase in dissolved phase SNR would be achieved due
to the replenishment of dissolved phase magnetization. This could be accomplished by
using a selective excitation RF pulse based on a composite pulse approach (10).
As discussed previously in Chapter 3, the read-out time (Tread) of the spiral k-space
sampling scheme should be as low as possible to achieve the desired resolution. In this
thesis, Tread values of 2-3 ms were obtained using a high performance insertable gradient
system. Unfortunately, typical clinical gradient coil strengths are not strong enough to
sample the whole k-space data within such a short Tread. Therefore, interleaved spiral
approaches could be used to address this limitation in future. With interleaved spirals, the
whole k-space data could be divided into six interleaves and sampled after the application
of independent RF pulses. Using an interleaved spiral approach, the dependence on high
slew rates and gradient amplitudes could be eliminated for clinical MR imaging. This could
also be tested using a healthy rat.
Imaging at low magnetic field strengths (0.5 T – 1.5 T) could significantly improve the
spatial resolution. The T2* is inversely proportional to the magnetic field strength allowing
for the use of longer Tread. The longer Tread would be beneficial for improving spatial
resolution or reducing the number of interleaved acquisitions required for clinical gradient
configurations. Therefore, translation of the technique presented in this thesis towards
human imaging would benefit from the use of an interleaved spiral approach, higher
polarization, and a selective excitation RF pulse.

139
The MRI technique developed in this thesis can potentially be used to diagnose gas
exchange abnormalities resulting in other lung diseases such as chronic obstructive
pulmonary disease (COPD), asthma, and cystic fibrosis. Corresponding changes in the gas
exchange curves can be helpful to detect regional physiological abnormalities.
Additionally, the strong dissolved phase signal from the RBC compartment of the heart
can be translated to a perfusion image by taking advantage of high polarization and
optimized RF coil configurations. Similarly, white matter, grey matter and blood flow of
the brain can be imaged by taking advantage of the different chemical shifts using a spiral
IDEAL imaging approach in the future.
5.6 Thesis Summary
A novel Hp 129Xe MRI technique was developed and used to successfully detect Radiation-
Induced Lung Injury (RILI) in a rodent model as early as two-weeks post-irradiation. To
test the hypothesis, firstly, a TO/RO radiofrequency coil configuration was optimized and
built for hyperpolarized 129Xe MRI providing a three-fold SNR improvement compared to
the commercially available RF coils. Next, a single-shot spiral IDEAL MRI pulse
sequence, capable of separating the Hp 129Xe gas and dissolved phase images, was
implemented to image rat lungs. This new imaging approach offered benefits of fewer and
higher flip angle RF pulses to increase the SNR of the PT and RBC images. Additionally,
the short read-out times of single-shot spiral IDEAL permitted multiple gas, PT, and RBC
images to be acquired within a single breath-hold time of a few seconds. Substantially
improved SNR of the PT and RBC images and short scan time permitted imaging of the
exchange between the gas, PT and RBC compartments for regional characterization of lung
140
microstructure and pulmonary and vascular function. Finally, regional gas exchange
changes associated with radiation pneumonitis in a rat model of RILI was measured using
a single-shot spiral IDEAL approach. An in vivo proof-of-concept approach was able to
distinguish the irradiated lung from the non-irradiating lung. The measured pulmonary
tissue thickness (LPT) of non-irradiated rats were found to increase in the irradiated cohort
and was in agreement with previously reported studies. Additionally, in the irradiated
cohort, the LPT from the irradiated rat lungs was significantly elevated compared to
unirradiated lung. Furthermore, again in the irradiated cohort, the RBC volume (VRBC) was
significantly reduced in the irradiated lung compared to unirradiated lungs. A histological
measurement of the percent tissue area (PTA) was correlated to the pathology of the
irradiated and non-irradiated cohorts. The novel Hp 129Xe MRI method presented in this
thesis showed regional change in gas exchange curves associated with a rat model of early-
phase RILI two-weeks post-irradiation. The method is a promising approach for detection
of early-phase RILI and has considerable potential for translation clinic, including radiation
therapy, for management of RILI.

141
5.7 References
1. Fox MS, Ouriadov A, Thind K, et al. Detection of radiation induced lung injury in
rats using dynamic hyperpolarized Xe-129 magnetic resonance spectroscopy. Med
Phys 2014;41(7).
2. Thind K, Jensen MD, Hegarty E, et al. Mapping metabolic changes associated with
early Radiation Induced Lung Injury post conformal radiotherapy using
hyperpolarized (13)C-pyruvate Magnetic Resonance Spectroscopic Imaging.
Radiotherapy and oncology 2014;110(2):317-322.
3. Woel RT, Munley MT, Hollis D, et al. The time course of radiation therapy-induced
reductions in regional perfusion: a prospective study with >5 years of follow-up.
International journal of radiation oncology, biology, physics 2002;52(1):58-67.
4. Hoover DA, Reid RH, Wong E, et al. SPECT-based functional lung imaging for
the prediction of radiation pneumonitis: a clinical and dosimetric correlation. J Med
Imaging Radiat Oncol 2014;58(2):214-222.
5. Kuebler WM. Real-time imaging assessment of pulmonary vascular responses.
Proc Am Thorac Soc 2011;8(6):458-465.
6. Mansson S, Wolber J, Driehuys B, Wollmer P, Golman K. Characterization of
diffusing capacity and perfusion of the rat lung in a lipopolysaccaride disease model
using hyperpolarized Xe-129. Magn Reson Med 2003;50(6):1170-1179.
7. Chang YV. MOXE: a model of gas exchange for hyperpolarized 129Xe magnetic
resonance of the lung. Magn Reson Med 2013;69(3):884-890.
8. Patz S, Muradyan I, Hrovat MI, et al. Diffusion of hyperpolarized Xe-129 in the
lung: a simplified model of Xe-129 septal uptake and experimental results. New J
Phys 2011;13.
9. Doganay O, Fox M, Santyr GE. Measurement of Pulmonary Perfusion and Gas
Exchange using Hyperpolarized 129Xe in a Rodent Model of Radiation-Induced
Lung Injury. Proceedings of the 22th Annual Meeting of ISMRM
2014;Milan(Italy):abstract 2290.
10. Leung G, Norquay G, Schulte RF, Wild JM. Radiofrequency pulse design for the
selective excitation of dissolved Xe. Magn Reson Med 2014.

142
Appendix A: Calculation of Spiral PSF
H(kr, kθ) is the modulation transfer function in polar coordinates for the spiral k-space
trajectory given by:
[A.1]
;where, Hw( ) is a rect function used for truncation of k-space invoking circular
symmetry and can be reduced to Hw(kr) for 1D in the radial direction, Δr is the nominal
resolution in k-space, Tread is k-space readout time. The point spread function, h(r,θ), is
calculated by the inverse Fourier transform of the modulation transfer function, H(kr, kθ):
, [A.2]
Substituting Eqn [A.1] in Eqn. [A.2], using the convolution identity and invoking circular
symmetry, Eqn. [A.2] can be re-written as follows:
h(r) = Ho(2 f1(kr) f2(kr)) = F1(r) * F2(r) [A.3]
;where F1(r) is the Hankel transform of the rect function, f1(kr), and integral transformations
whose kernels are Bessel functions. F1(r) was calculated using besselj.m function for
solution of zero-order Bessel functions of the first kind in Matlab (Natick MA, USA) as
follows:
)))),((2
(exp(),(),(*
2
Re
rkT
rTkkHkkH ad
rwr
kkr ,
dkdkkrkikkHkkHrh rrrrr
2
0 0
1 )cos2exp(),()},({),(

143
[A.4]
In Eqn. [A.4], F2(r) is the Hankel transform of f2(kr) which is dependent on Tread/T2 and can
be solved by differentiation in the Laplace transform domain as follows:
[A.5]
;where, , . F2(r) was normalized by the global
minimum of F2(r) (for Tread/T2*=0.01) before the convolution.
)2()(
)]2([2
12)]2([
2
12
)2(2)2()(2)}(2{)(
max1max
1
00
00
11
maxmax
max
rr
k
rror
r
k
rror
r
k
rrorrrorrwro
rkJr
krF
dkrkJkdk
d
rdkrkJk
dk
d
r
dkrkJkdkrkJkkHkfHrF
rr
r
2/322
0
22][
)()exp()}({)(Br
BrkJdkkBkrfHrF rorrro
)2
exp()(*
2
Re2
T
Trkkf adr
r
*
2
Re
2 T
TrB ad
144
Appendix B: Calculation of Cartesian PSF
H(k) is the modulation transfer function in Cartesian coordinates where k-space trajectories
are sampled along the frequency encoding direction, kx from -kx max to kx max and is given by
(1,2):
[B.1]
;where, and Δx is the nominal resolution. Since the signal decay is
dominated by T2*effect along the frequency encoding direction, h(x) is calculated
analytically along x, as follows:
[B.2]
;where .
1. Qin Q. Point spread functions of the T2 decay in k-space trajectories with long
echo train. Magnetic resonance imaging 2012;30(8):1134-1142.
2. Haacke EM, Brown RW, Thompson MR, Venkatesan R. Magnetic Resonance
Imaging: Physical Principles and Sequence Design: Wiley: 1999.
)/)(exp()/()( *
2TktWkrectkH
)(2
)( Rex
ad kxT
kt
)))(exp())((exp()(
1)exp()( maxmaxmax AixkAixk
AixAkxh
*
2
Re
2 T
xTA ad

145
Appendix C: Dissolved Phase Signal Following Multiple Pulses
A Bloch equation analysis was performed including the replenishment of dissolved tissue
magnetization between RF pulses. Assuming the signal from Hp 129Xe is much larger than
the thermal equilibrium magnetization and ignoring T1 relaxation, the transverse (Mxy) and
longitudinal (Mz) magnetizations following the first RF pulses (n = 1) are given
respectively by:
Mz(n=1) = Mi cos(αG) [C.1]
Mxy(n=1) = Mi λ sin(αPT) [C.2]
;where, λ is the solubility of xenon, αG and αPT are the flip angles delivered to the gas and
pulmonary tissue phases respectively and Mi is the initial gas phase magnetization
dependent on the polarization.
The corresponding magnetizations following the second RF pulse (n = 2) are given by:
Mz(n=2) = Mz(n=1)cos(αG) [C.3]
Mxy(n=2) = M(TR) Mz(n=1) λ sin(αPT) + Mi λ cos(αPT) sin(αPT) [C.4]
;where, M(TR) is the percentage replenishment of 129Xe in pulmonary tissue depending on
TR. M(TR) was calculated by dividing the gas exchange curves by its maximum value
thereby making it independent of the MRI parameters. Mansson’s gas exchange model was
fitted to previously published CSSR data set of the gas transfer curve for healthy rats. Then,
M(TR) was calculated as follows:
M(TR) = (So [1 - exp(-Δ / τ1)] + S1Δ) / M(TRmax) [C.5]

146
;where, the pulse repetition time, TR, corresponds to Δ in Mansson’s model which is the
time duration for the replenishment of Hp 129Xe. τ1, So, S1 were the fitting parameters for
the healthy animal respectively. Thus, M(TR=30 ms) and M(TR=4 ms) were found to be
0.5 and 0.1 respectively within a measurement uncertainty of ±5%. In other word, M(TR)
represents the percentage concentration of Hp 129Xe molecules in the pulmonary tissue pool
at the end of each TR period and independent from the use of excitation flip angle.
Extending to the nth excitation, the dissolved signal is given by the following:
SPT= MPT [ M(TR) [cos(αG)]n-1 sin(αPT) + [cos(αPT)]n-1 sin(αPT)] [C.6]
;where MPT term represents the total contribution from polarization Mi, solubility of xenon
λ, and other imaging parameters (e.g., resolution, coil sensitivity etc.). The first term is the
signal contribution from the kinetics of gas exchange including the effect of the flip angle
on the gas phase pool and the pulmonary tissue phase pool. The second term is
magnetization in the pulmonary tissue phase, which was left over after the nth-1 excitation.
Additionally, RF pulse width is short (<<1 ms) with respect to the relevant exchange times
(tens to hundreds of ms). Therefore, exchange during the application of the RF pulse is
ignored.

147
Appendix D: Animal Use Protocol Approval

148
Curriculum Vitae DEGREES
Ph.D. Candidate September 2011 to present
Medical Biophysics
University of Western Ontario, London, ON, CANADA
Thesis: Hyperpolarized Xenon-129 Magnetic Resonance Imaging
of Radiation-Induced Lung Injury.
M.Sc. August 2010
Biomedical Physics
Ryerson University, Toronto, ON, CANADA
Thesis: Monitoring electric field-induced changes in biological
tissues by using ultrasound.
B.Sc. June 2007
Physics
Ege University, Izmir, TURKEY
Thesis: Sub-Nuclear Particles, Weak Interactions and Unitary
Symmetry U(1), SU(2), SU(3).
PROFESSIONAL EXPERIENCE
Teaching Assistant
Western University, Department of Mathematics, London, ON., from Sep 2014 to Apr
2015.
Duties: Tutorial, invigilation, and marking for following undergrad courses:
Calculus I (1000a)
Applied Math (1413)
Ryerson University, Department of Physics, Toronto, ON., from Sep 2008 to May 2011.
Duties: Tutorial, laboratory instruction, invigilation, and marking for following
undergrad and graduate courses:
Medical Imaging (PCS405)
Solid State Physics (PCS224)
Physics I and II (PCS130)
149
Research Assistant
Western University, Imaging Department, London, ON., from Jun 2011 to Sep 2014.
Duties: MR technical support, RF coils design, MR sequence design, animal
preparation and surgery, etc.
Ryerson University, Ultrasound Imaging, Toronto, ON., from Sep 2010 to Jun 2011.
Duties: Design magneto acoustic electrical signal experiments and analyze data,
design single element ultrasound experiments, collect and analyze data, etc.
PUBLICATIONS
Refereed Journal Articles
Submitted and/or Accepted (pending revisions)
1. O. Doganay, E. Hegarty, C. McKenzie, R. F. Schulte, G. E. Santyr. Quantification
of Regional Gas Exchange Changes using Hyperpolarized 129Xe MRI in a Rat
Model of Early Stage Radiation-induced Lung Injury, Medical Physics 2015 (in
Revision).
Published or In Press
1. O. Doganay, T. Wade, E. Hegarty, C. McKenzie, R. F. Schulte, G. E. Santyr.
Hyperpolarized Xenon-129 MR imaging of the rat lung using spiral IDEAL,
Magnetic Resonance in Medicine 2015, DOI 10.1002/mrm.25911 (in Press).
2. O. Doganay, K. Thind, T. Wade, A. Ouriadov, and G. E. Santyr. Transmit-
only/receive-only radiofrequency coil configuration for hyperpolarized 129Xe MRI
of rat lungs, Concepts in Magnetic Resonance Part B: Magnetic Resonance
Engineering 2015, DOI: 10.1002/cmr.b.21288.
3. K. Wawrzyn, V. Demidov, B. Vuong, M. Harduar, C. Sun, V. X. D. Yang, O.
Doganay, V. Toronov, and Y. Xu. Imaging the electro-kinetic response of
biological tissues with optical coherence tomography, Optics Letters 2013, Vol. 38,
pp. 2572-4.
4. O. Doganay and Y. Xu. Reversibility of electric-field induced mechanical changes
(EIMC) in soft tissues, IEEE Ultrasonics, Ferroelectrics, and Frequency Control
2011, Vol. 59, pp. 552-6.
5. O. Doganay and Y. Xu. Electric-field induced strain in biological tissues. The
Journal of the Acoustical Society of America 2010, Vol. 128, pp. 261-7.
Published Proceedings of Conferences
1. A. Pandya, O. Doganay, Y. Xu. Ultrasound-mediated study of the electrokinetic
effects in gelatin phantoms, International Federation for Medical and Biological
Engineering (IFMBE) Proceedings 2013, Vol. 39, pp 1109-12.
2. O. Doganay and Y. Xu. The effect of electric current in biological tissue on
ultrasound echoes, Ultrasonics Symposium (IUS), IEEE International 2009, DOI:
10.1109/ULTSYM.2009.5441825, pp. 2103-6.

150
Refereed Proceedings of Conferences:
1. O. Doganay, E. Hegarty, C. McKenzie, R. F. Schulte, G. E. Santyr. Hyperpolarized 129Xe Magnetic Resonance Imaging of a Rat Model of Radiation-Induced Lung
Injury Involving Single-Lung Irradiation, World Congress on Medical Physics and
Biomedical Engineering 2015, Abstract 2197, Toronto, ON.
2. O. Doganay, T. Wade, E. Hegarty, C. McKenzie, R. F. Schulte, G. E. Santyr.
Hyperpolarized 129Xe Imaging of the Lung using Spiral IDEAL, Proceedings of the
23th Annual Meeting of ISMRM 2015, Abstract 1497, Toronto, ON.
3. B. Zanette, O. Doganay, E. Hegarty, G. E. Santyr. Effect of Gas Phase
Replenishment on Dissolved Phase Hyperpolarized 129Xe MRI. World Congress on
Medical Physics and Biomedical Engineering 2015, Abstract 1252, Toronto, ON.
4. B. Zanette, O. Doganay, E. Hegarty, G. E. Santyr. Effect of RF Pulse Repetition
Time on Gas Transfer for Dissolved Hyperpolarized 129Xe MRI, Proceedings of the
23th Annual Meeting of ISMRM 2015, Abstract 1493, Toronto, ON.
5. O. Doganay, E. Hegarty, C. McKenzie, R. F. Schulte, G. E. Santyr. Detection of
Regional Radiation-Induced Lung Injury using Hyperpolarized 129Xe Localized
Magnetic Resonance Spectroscopy, 13th Imaging Network Ontario Symposium
2015, pp. 128, London, ON.
6. A. Lindenmaier, E. Hegarty, O. Doganay, A. Ouriadov, G. E. Santyr. Dependence
of Hyperpolarized 129Xe Lung MRI Morphometry on the Free Diffusion Coefficient
of Xenon Gas, 13th Imaging Network Ontario Symposium 2015, pp. 139, London,
ON.
7. B. Zanette, O. Doganay, E. Hegarty, G. E. Santyr. Effect of Gas Phase
Replenishment on Dissolved Phase Hyperpolarized 129Xe MRI, 13th Imaging
Network Ontario Symposium 2015, pp. 154, London, ON.
8. E. Hegarty, O. Doganay, B. Zanette, A. Lindenmaier, G. E. Santyr. Hyperpolarized
129Xe Magnetic Resonance Imaging of Radiation-Induced Lung Injury with
Correlation to Histology, 13th Imaging Network Ontario Symposium 2015, pp.
133, London, ON.
9. O. Doganay, M. Fox, G. E. Santyr. Measurement of Pulmonary Perfusion and Gas
Exchange using Hyperpolarized 129Xe in a Rodent Model of Radiation-Induced
Lung Injury. Proceedings of the 22th Annual Meeting of ISMRM 2014, Abstract
2290, Milan, Italy.
10. E. Hegarty, D. Engelberts, T. Wade, K. Wawrzyn, O. Doganay, B. Kavanagh, G.
E. Santyr. Hyperpolarized 129Xe MRI for evaluation of a continuous negatively-
applied pressure (CNAP) approach for recruitment of atelectasis in a rat model,
American Thoracic Society (ATS) 2014, San Diego, USA.
11. O. Doganay, K. Thind, T.P. Wade, A. Ouriadov, G. E. Santyr. A Transmit-
Only/Receive-Only Radiofrequency Coil Configuration for Hyperpolarized 129Xe
Imaging of the Rodent Lung. Proceedings of the 21th Annual Meeting of ISMRM
2013, Abstract 1479, Lake City, Utah.
12. O. Doganay, A. Farag, A. Ouriadov and G. E. Santyr. Hyperpolarized Xenon-129
Production System for MRI of the Lung, 12th Imaging Network Ontario
Symposium 2013, pp. 133, London, ON.
151
13. Y. Xu and O. Doganay. Ultrasound methods to image the electrical/electrokinetic
properties of biomaterials, MITACS-Fields Conference on the Mathematics of
Medical Imaging 2011, Toronto, ON.
14. Y. Xu and O. Doganay. Monitoring the physiological-level electric-field-induced
mechanical changes (PLEFIMC) in general soft biological tissues with ultrasound.
Ultrasonic Imaging and Tissue Characterization (UITC) 2011, Arlington, VA.
AWARDS
1. CIHR in Cancer Research and Technology Transfer (CaRTT), London, ON.
Amount: $19100/year, Sep 2013 – Present.
2. Western Graduate Research Scholarship, University of Western Ontario, London,
ON. Amount: $2452/term, Sep 2011 – Present.
3. Ryerson Graduate Scholarship, Ryerson University, Toronto, ON. Amount:
$7500/yearly, Sep 2008 – Sep 2010.
4. Ontario Student Opportunity Grant, Ontario Ministry of Training Colleges and
Universities. Amount: $11,500, Sep 2008 – Sep 2009.