Nanoarchitecture and Global warming New Revolution for Nanomaterials
Upload
independentCategory
view
4download
0
Accepted Manuscript
Title: Hydrothermal synthesis of doped lanthanum zirconatenanomaterials and the effect of V-Ge substitution on theirstructural, electrical and dielectric properties
Author: Muhammad Asim Farid Muhammad Adnan AsgharMuhammad Naeem Ashiq Muhammad Fahad EhsanMuhammad Athar
PII: S0025-5408(14)00428-0DOI: http://dx.doi.org/doi:10.1016/j.materresbull.2014.07.052Reference: MRB 7577
To appear in: MRB
Received date: 3-10-2013Revised date: 5-2-2014Accepted date: 26-7-2014
Please cite this article as: Muhammad Asim Farid, Muhammad Adnan Asghar,Muhammad Naeem Ashiq, Muhammad Fahad Ehsan, Muhammad Athar, Hydrothermalsynthesis of doped lanthanum zirconate nanomaterials and the effect of V-Gesubstitution on their structural, electrical and dielectric properties, Materials ResearchBulletin http://dx.doi.org/10.1016/j.materresbull.2014.07.052
This is a PDF file of an unedited manuscript that has been accepted for publication.As a service to our customers we are providing this early version of the manuscript.The manuscript will undergo copyediting, typesetting, and review of the resulting proofbefore it is published in its final form. Please note that during the production processerrors may be discovered which could affect the content, and all legal disclaimers thatapply to the journal pertain.
Page 1 of 24
Accep
ted
Man
uscr
ipt
Hydrothermal synthesis of doped lanthanum zirconate nanomaterials and the effect of V-Ge
substitution on their structural, electrical and dielectric properties
Muhammad Asim Farid, Muhammad Adnan Asghar, Muhammad Naeem Ashiq*, Muhammad
Fahad Ehsan and Muhammad Athar*
Institute of Chemical Sciences, Bahauddin Zakariya University, Multan 60800, Pakistan
*Corresponding author.E-mail: [email protected] (M. Athar);[email protected] (M. N. Ashiq), Tel.: +923234548374; fax: +92619210085.
Graphical abstract
Variation of dielectric constant with frequency for all the synthesized materials
Highlights
Hydrothermal method has been successfully employed to synthesize the zirconates.
XRD confirmed the formation of required phase.
Increased electrical resistivity makes these materials useful for microwave devices.
Dielectric Parameters of zirconates decrease with increasing frequency.
Dielectric Constant decreases with increasing substituents concentration.
ABSTRACT
A hydrothermal method was successfully employed for the synthesis of a series of vanadium and
germanium co-doped Pyrochlore Lanthanum Zirconates with composition La2-xVxZr2-yGeyO7
(where x, y = 0.0, 0.25, 0.50, 0.75 and 1.0). The XRD and FTIR analyses confirmed the
formation of single phase except vanadium and germanium substituted samples and the
crystallite sizes are in the range of 7-31 nm for V3+-Ge4+ substituted samples. The theoretical
Page 2 of 24
Accep
ted
Man
uscr
ipt
compositions are confirmed by the ED-XRF studies. The room temperature electrical resistivity
increase with the substituents concentration which suggests that the synthesized materials can be
used for microwave devices as such devices required highly resistive materials. Dielectric
properties were measured in the frequency range of 6 kHz to 1 MHz. The dielectric parameters
decrease with increase in frequency. The DC resistivity data is in good agreement with the
dielectric data.
Keywords: Nanostructures; X-ray diffraction; Electrical properties; Dielectric properties
1. Introduction
As the dimensions of materials are reduced to nanometer scale, the peculiar properties differing
from bulk materials become prominent. For the last two decades, the study of preparation and
properties of various nanostructured materials has attracted extensive attention due to the fact
that physicochemical properties of particles in the size range of 1–100 nm are dramatically
different from those of their bulk counterparts [1-3]. Pyrochlore type of rare earth zirconium
oxides (Re2Zr2O7, Re = rare earth) has received considerable attention in recent years [4, 5].
Great interests have been focused on the synthesis and investigation of the properties of
Re2Zr2O7, due to their excellent properties, such as low thermal conductivity, high thermal
expansion coefficient, metal–insulator transitions, geometrically frustrated Kagome-type spin
lattices, dielectric properties, high ionic conductivity, superconductivity, luminescence and
ferromagnetism [6-11]. Among these rare earth pyrochlore materials, La2Zr2O7 has been selected
due to its high melting point (2573 K), low thermal conductivity (1.56 Wm-1K-1), relatively low
thermal expansion coefficient (9×10⁻⁶ K-1), good chemical stability and no phase transformation
up to its melting point [12-13]. Recently, they have attracted attention as geometrically frustrated
magnets, exhibiting ‘spin ice’ behavior [14]. These materials can also be used for nuclear
Page 3 of 24
Accep
ted
Man
uscr
ipt
applications [15], sub-catalysts for automotive exhaust gases [16], high-temperature thermal-
barrier-coating materials [17], hosts for fluorescence centers [18] and oxidation catalysts [19].
The synthesis of La2Zr2O7 has been achieved by many methods, including traditional solid-state
reaction, co-precipitation, sol–gel, moltan salt assisted method and hydrothermal methods [20–
29]. The hydrothermal method was used due to some advantages over other methods like
morphology and homogeneity control and kinetic control of reaction. The main advantage is the
low temperature range used during the reaction. The simultaneous substitution at La3+ as well as
at Zr4+ site with transition metals like Vanadium and Germanium can improve the electrical and
dielectric properties of the lanthanum zirconates. The double ions substitution philosophy in
La2Zr2O7 have not been reported previously. In the present work, synthesis of nanosized
vanadium and germanium co-doped lanthanum zirconates and the effect of vanadium and
germanium substitution on its structure have been reported. Moreover, DC electrical resistivity,
dielectric constant (έ) and dielectric loss (tan δ) have been studied for these nanoparticles
2. Materials and Methods
2.1 Experimental
The chemicals used for the synthesis of La2Zr2O7 and its derivatives are La(NO3)3·6H2O,
ZrOCl2·8H2O, VCl3, GeO2, C12H25NaO4S (sodium dodecyl sulphate) and NaOH. These
chemicals were obtained from Sigma-Aldrich and Merck and were used without further
purifications. The pyrochlore Lanthanum Zirconates (La2Zr2O7, Compound 1) was prepared by
hydrothermal method. For this purpose 1mmol (0.322g) ZrOCl2·8H2O and 1mmol (0.434g)
Page 4 of 24
Accep
ted
Man
uscr
ipt
La(NO3)3·6H2O were dissolved in 10 mL deionized water in a beaker. 1mmol (0.288g) of
sodium dodecyl sulphate (SDS) was added to the above mixture. This solution mixture was
stirred on a hot plate at 40°C for half an hour. After that NaOH solution (2M) was added drop-
wise to maintain the pH of the solution at 12, which resulted in precipitation due to the formation
of metal hydroxides. The precipitated mixture was further stirred for half hour. This mixture was
then poured into a 23-mL stainless steel autoclave. The autoclave was sealed and placed in oven
at 120°C for 8 hours [30-37]. After the room temperature cooling of the autoclaves the powdered
material produced in the autoclave was washed several times with deionized water and
centrifuged at each washing to remove the impurities. The synthesized powder materials were
dried at 100°C to remove the moisture contents. Vanadium and Germanium co-doped
Lanthanum Zirconates were synthesized by employing the same method as described for the
synthesis of compound-1. The initial composition of the reaction mixture before adding SDS was
maintained by varying the amounts of all the components as mentioned in the Table 1. In this
way four different compounds (2-5) were synthesized.
2.2 Characterization Techniques
Fourier transform infra-red (FTIR) spectrophotometer (8400 Shimadzu model) was used to record
the FTIR spectra of as-synthesized samples. Philips X’Pert 3040/60 diffractometer with Cu-Kα
radiation source was used to confirm the phase of the materials. The surface morphology of the
materials was studied by SEM analysis using SEM (JEOL, JSM-6490A). The energy dispersive
X-ray fluorescence (ED-XRF) analysis was performed by Horiba MESA-500 with 0-20keV energy
range to confirm the composition. The electrical resistivity was measured by the two point probe
Page 5 of 24
Accep
ted
Man
uscr
ipt
method using Keithley Source Meter-2400. Dielectric parameters were recorded by using LCR
meter (Waykner LCR 6600) in 6 kHz–1 MHz frequency range.
3. Results and Discussions
3.1 Powder X-Ray Diffraction Analysis
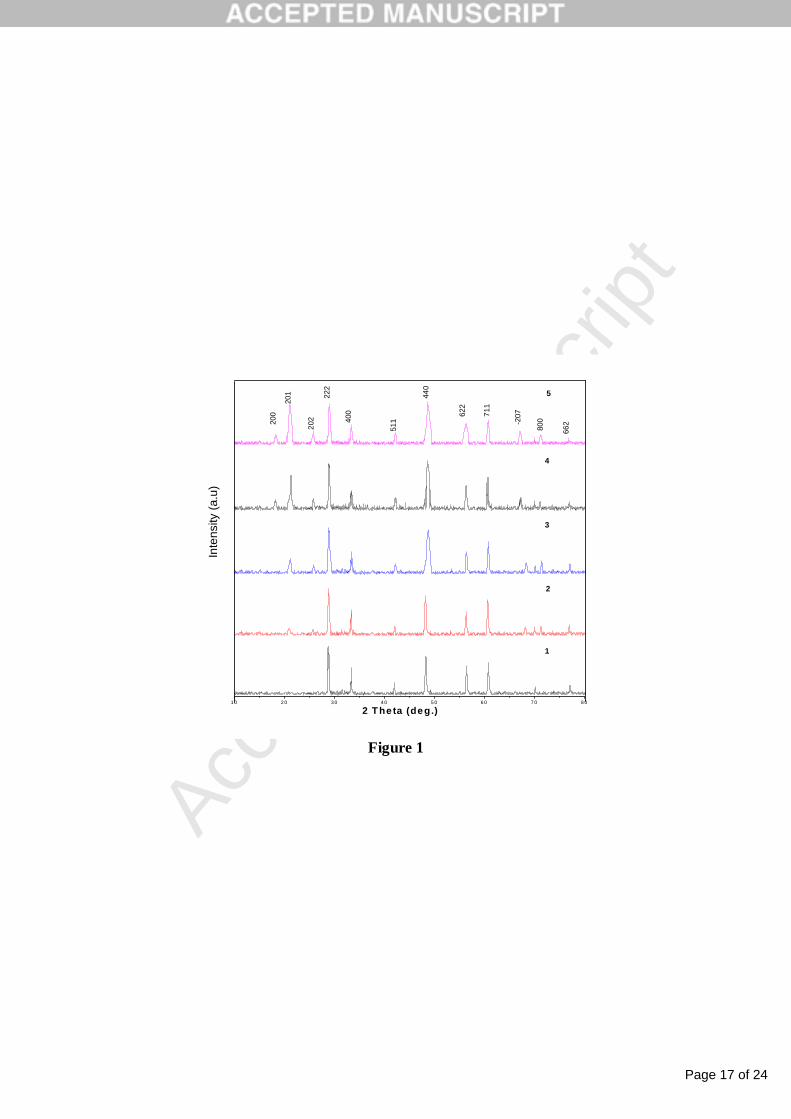
The powder XRD patterns of all synthesized compounds (1-5) are shown in (Figure 1). These
patterns were matched with standard pattern ICDD-01-071-2363. All the peaks matched
perfectly which confirm the production of single phase. A number of small peaks are appeared in
the XRD patterns when substituted with V-Ge. These peaks originate due to additional phase of
vanadium/germanium zirconates.
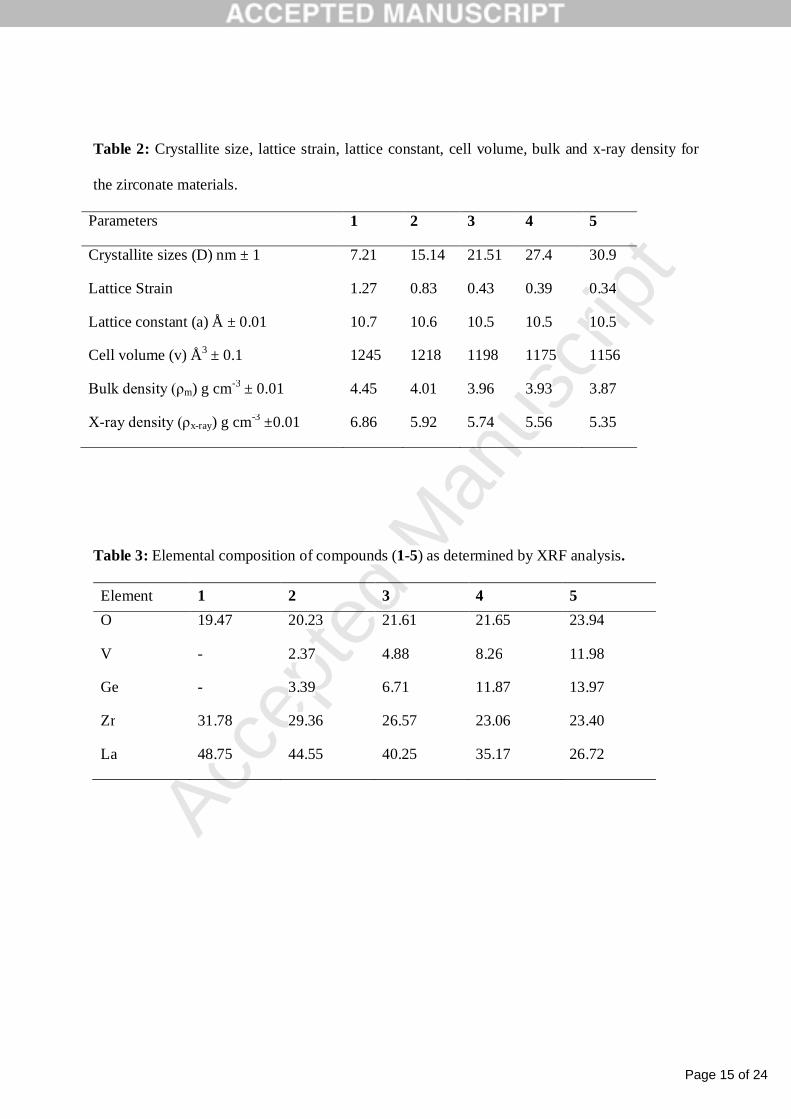
Various parameters calculated by using the Powder XRD data are presented in Table 2. The
crystallite size was calculated by the Scherrer’s formula (equation 1).
(1)
Where λ is X- ray wavelength and its value is 1.542 Å, β the half-peak width, θ is the Bragg
angle and K is a constant having value 0.9. The crystallite size is found in the range of 7-31nm.
The crystallite size in the present work is much smaller as compared to reported earlier 50 nm
[38]. The crystallite size is observed to increase with the substituents might be due to phase
transition [39, 40].
The lattice constant (a), cell volume (V), X-ray density (ρx-ray), bulk density (ρm) and porosity (P) are
calculated through the equations (2-6) by using XRD data.
(2)
Page 6 of 24
Accep
ted
Man
uscr
ipt
(3)
(4)
(5)
Where Z is the number of formula units in a unit cell which is 8 for cubic pyrochlore, M is the molecular
mass of the sample, NA is the Avogadro’s number, m is the mass of the pellet, h is the height of the pellet
and r is the radius of the pellet. The values of lattice constant (a) are found to be decreased slightly
from 10.7 to 10.5 and the cell volume (V) from 1245 to 1156 Å3 with the vanadium/ germanium
concentration. The smaller ionic radii of V3+ (0.59 Å)+ and of Ga4+(0.53 Å) as compared with
1.061 Å of La3+ and 0.72 Å of Zr4+ cause a decrease in values of cell volume as well as lattice
constant. The values of X-ray density for the substituted materials are also decreased with an
increased vanadium/ germanium concentration which is due to smaller atomic masses of the
vanadium and germanium as compared to lanthanum and zirconium. The calculated lattice strain
is decreased from 12.7 ×10⁻¹ to 3.4 × 10⁻¹. The variations in lattice constant, cell volume and
lattice strain with substituents indicate that the V and Ge are doped at the lanthanum zirconates
lattices. The crystallinity is increased with the substituents which are indicated by the sharpening
of peaks in the XRD patterns.
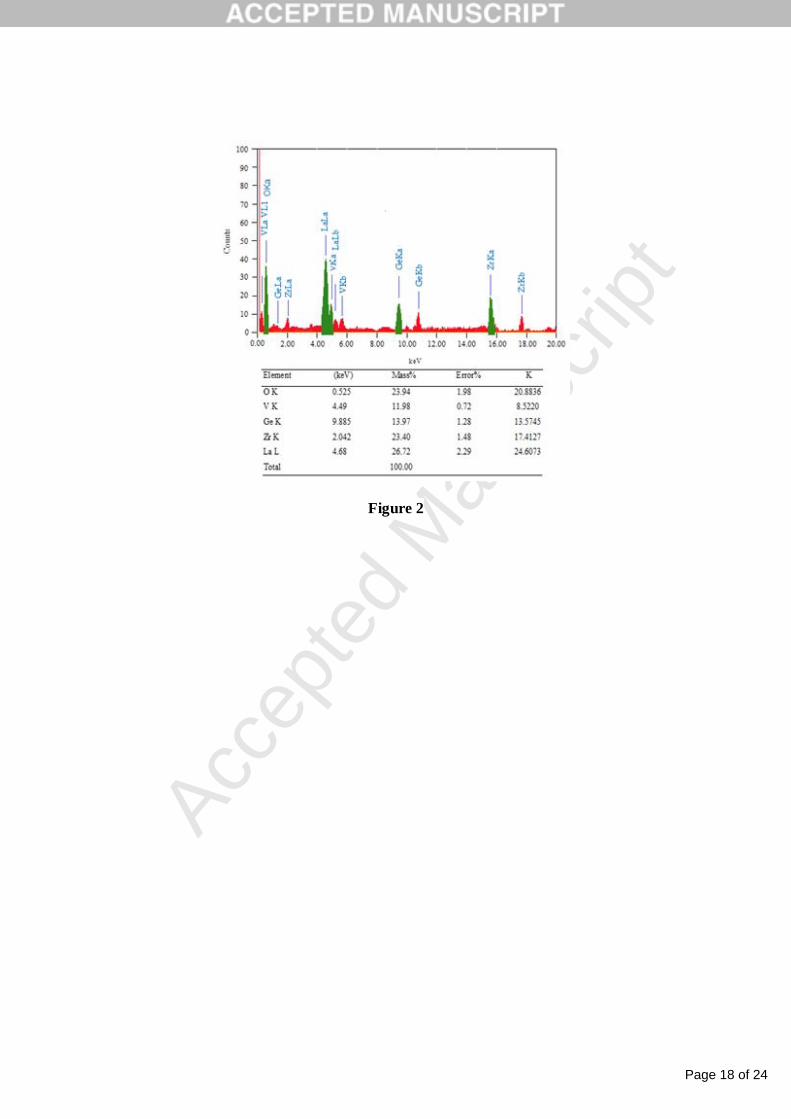
3.2 Energy Dispersive X-ray Fluorescence (ED-XRF) Analysis.
The elemental compositions of compounds 1-5 as determined by ED-XRF are shown in Table 3. It
shows that the theoretical composition and experimental values are comparable. As the amount of
V3+ and Ge4+ ions are increased the concentrations of La3+ and Zr4+ are decreased. The XRF spectrum
of compound 5 is shown in (Figure 2).
Page 7 of 24
Accep
ted
Man
uscr
ipt
3.3 FTIR Analysis
FTIR spectra of compounds 1-5 are shown in supplementary information (Figures S1-S5). The
FTIR spectrum of compound 1 shows absorption peaks at 530 and 490 cm-1 which corresponds
to Zr-O and La-O vibrational modes, respectively [41]. The FTIR Spectra of the compounds 2 -5
in which V and Ge were doped show the peaks at 830 and 600 cm-1, which can be related to the
vibrational modes of V-O bonds.
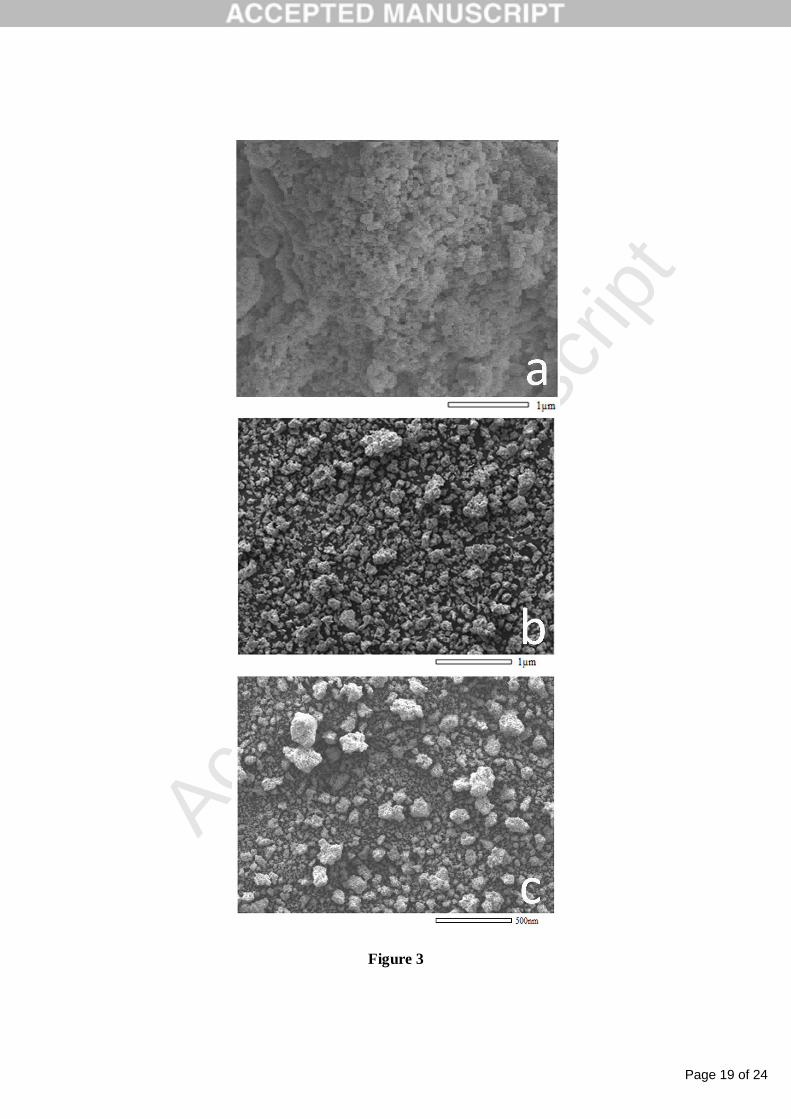
3.4 Scanning Electron Microscopy Analysis.
The SEM images of compounds 1, 3 and 5 are shown in Figures 3 (a-c). The effectiveness of
Vanadium and Germanium addition as substituents regarding the morphology of the particles is
evident from the SEM images. The particle size is increased with the increase in substituent
concentration and some of the particles are agglomerated.
3.5 Electrical Measurement
The resistivity calculations were done by equation as given
(7)
Where R is resistance, A is area of prepared pellets and L shows the length.
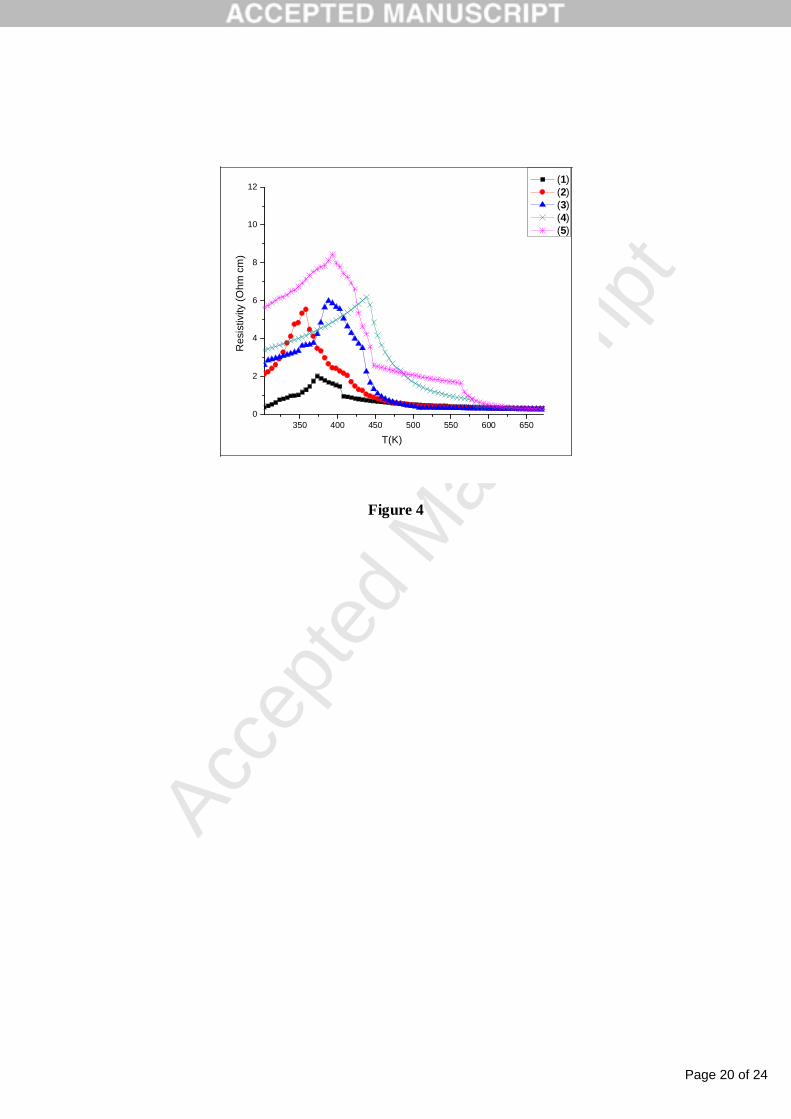
Figure 4 shows the temperature dependence of electrical resistivity of compounds 1-5 in the
temperature range of 303-673K. The electrical resistivity of compound 1 first increases with the
increase in temperature up to 372 K showing metallic behavior (Region I). Then it decreases
with the increase in temperature exhibiting semiconductor properties (Region II). Vanadium and
germanium substituted at the La and Zr sites show the same resistivity trend. Region I possesses
Page 8 of 24
Accep
ted
Man
uscr
ipt
the electronic conduction and region II comprises ionic conduction involving oxygen ions at
higher temperature (Arrhenius behavior). Such kind of temperature dependence of resistivity is
mainly due to the occurrence of phase transition, cation migration, cations re-ordering, presence
of impurities, structure disorders and magneto-transport effect.
In the present case, the presence of two different phases i.e. lanthanum and vanadium zirconate
may cause this type of resistivity behavior. The other possibility is structure disorder which can
be related to the change in rA/rB and this may be responsible for such behavior of resistivity. The
temperature for maximum value of electrical resistivity (ρ) is known as metal to semiconductor
transition temperature (TM-S). The value of TM-S increases with the increase in V and Ge
concentration up to x = 1.0 as shown in figure 4 which may be due to presence of second phase.
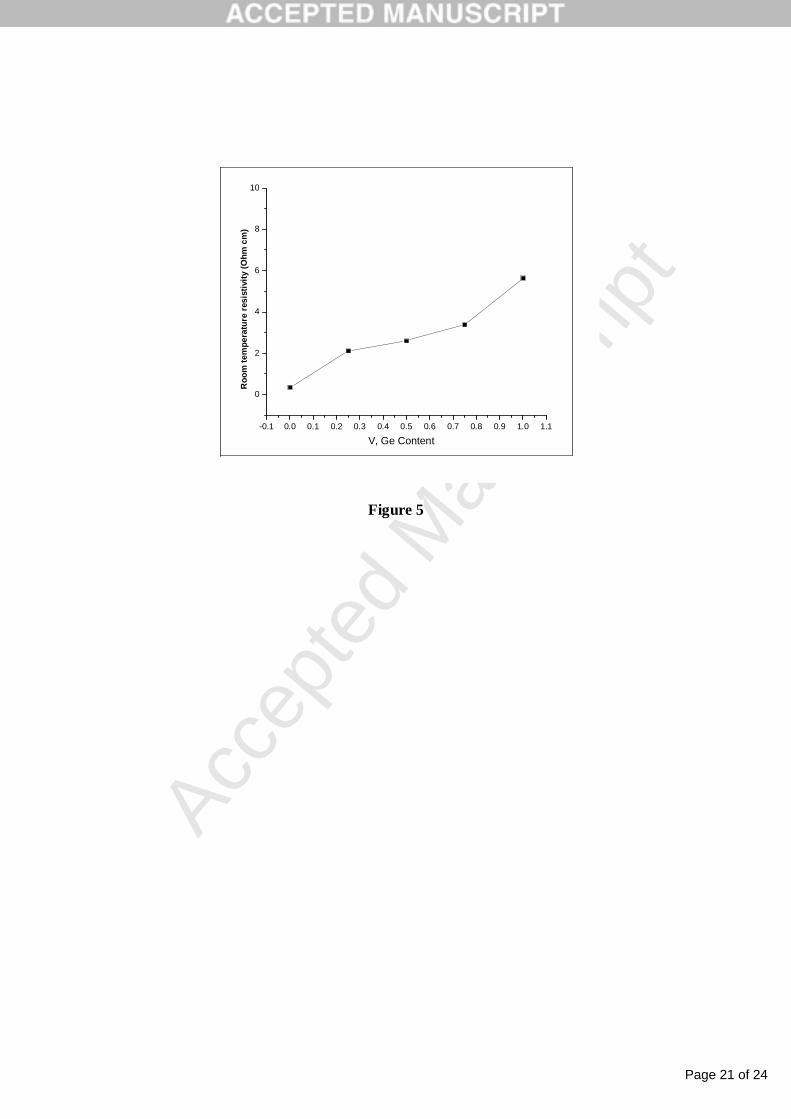
The variation of room temperature resistivity with V-Ge content is shown in figure 5. It is clear
from the Figure that the resistivity is increased by increasing V-Ge content. It has been reported
that the resistivity for germanium (46×106 µΩ-cm) is greater than that of zirconium (40µΩ-cm).
The highly resistive substituent causes the increase in resistivity. The decrease in the lattice
strain also supports the increase in resistivity due to decrease in defects (Table 1). Because of
very high resistivity these materials can be used in microwave devices, which usually involve the
high frequency radiations and also for switching applications in electronic devices.
3.6 Dielectric Measurement
The dielectric constant was determined by using the following formula.
(7)
Where C is the capacitance of the pellet in faraday, d is the thickness of the pellet in meter, A is the
cross-sectional area of the flat surface of the pellet and εo is the constant of permittivity of free
Page 9 of 24
Accep
ted
Man
uscr
ipt
space.
The dielectric tangent loss factor was calculated using the relation
(8)
Where δ is the loss angle, ƒ is the frequency, Rp is the equivalent parallel resistance and Cp is the
equivalent parallel capacitance. The relation given below gave dielectric loss factor.
(9)
Where, tanδ is dielectric loss factor, έ is the dielectric constant, and ἔ is the dielectric loss.
Dielectric constant, which is a measure of extent of polarization of a material, depends upon the
structure of the materials, composition and synthesis method. Frequency dependence of
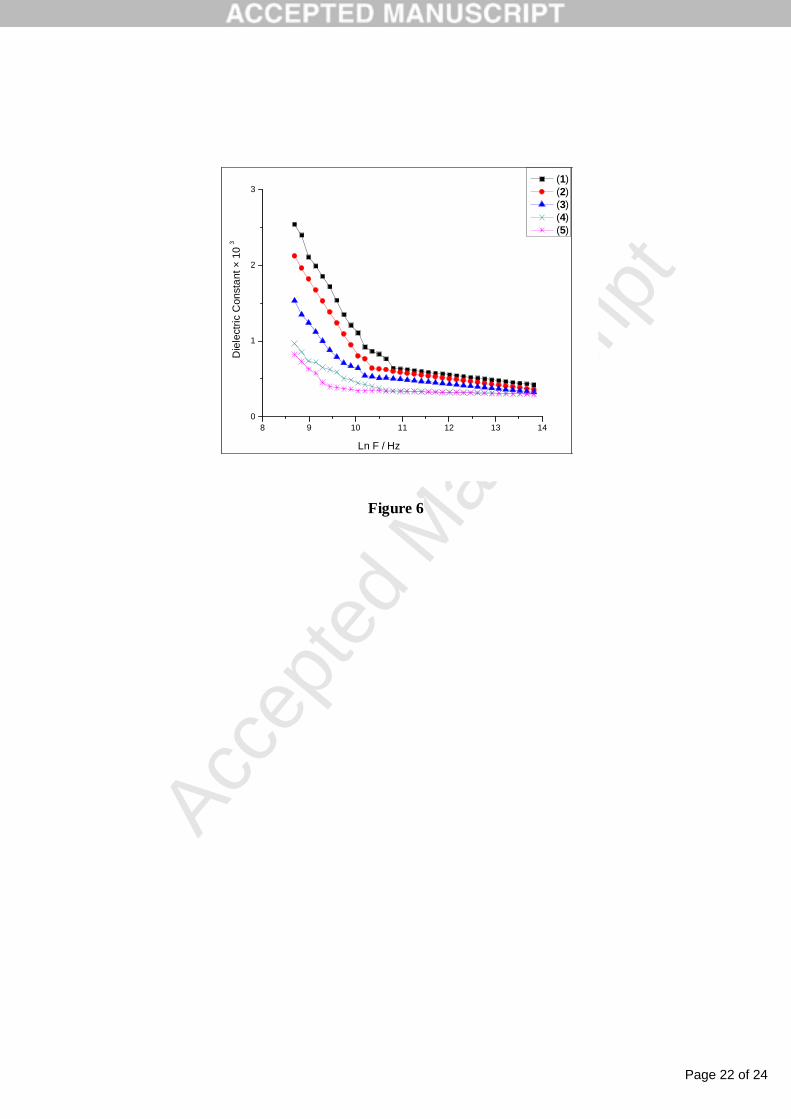
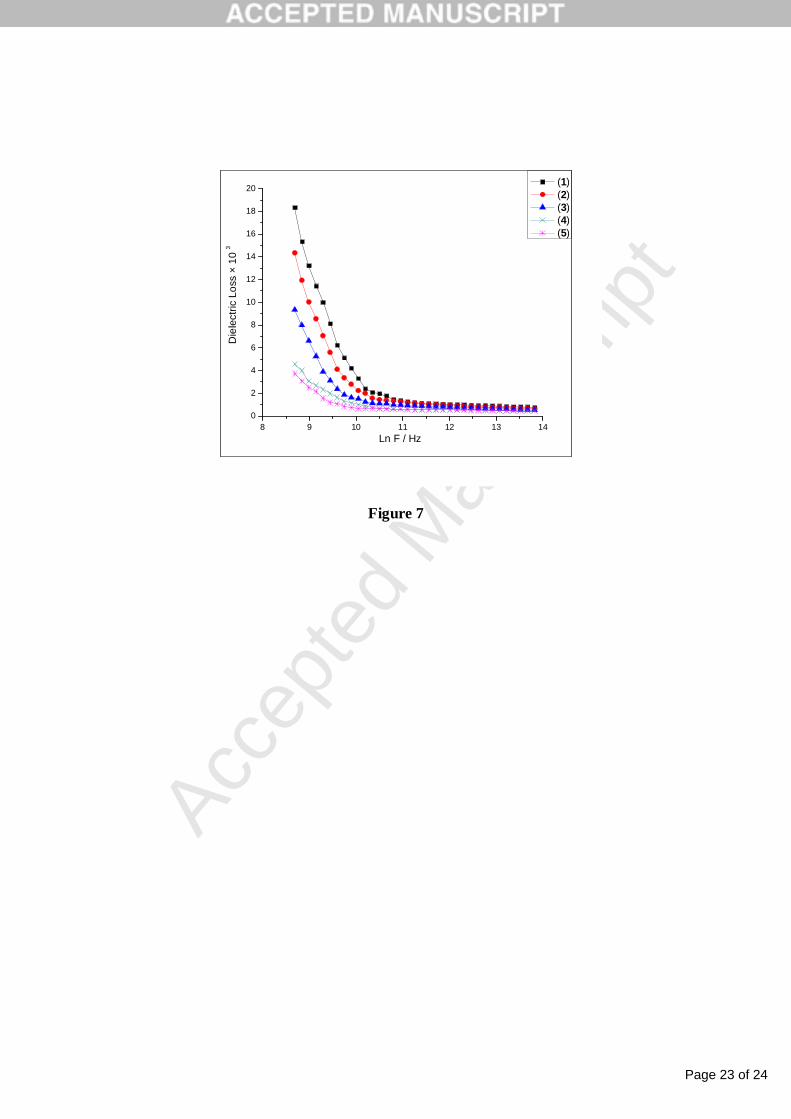
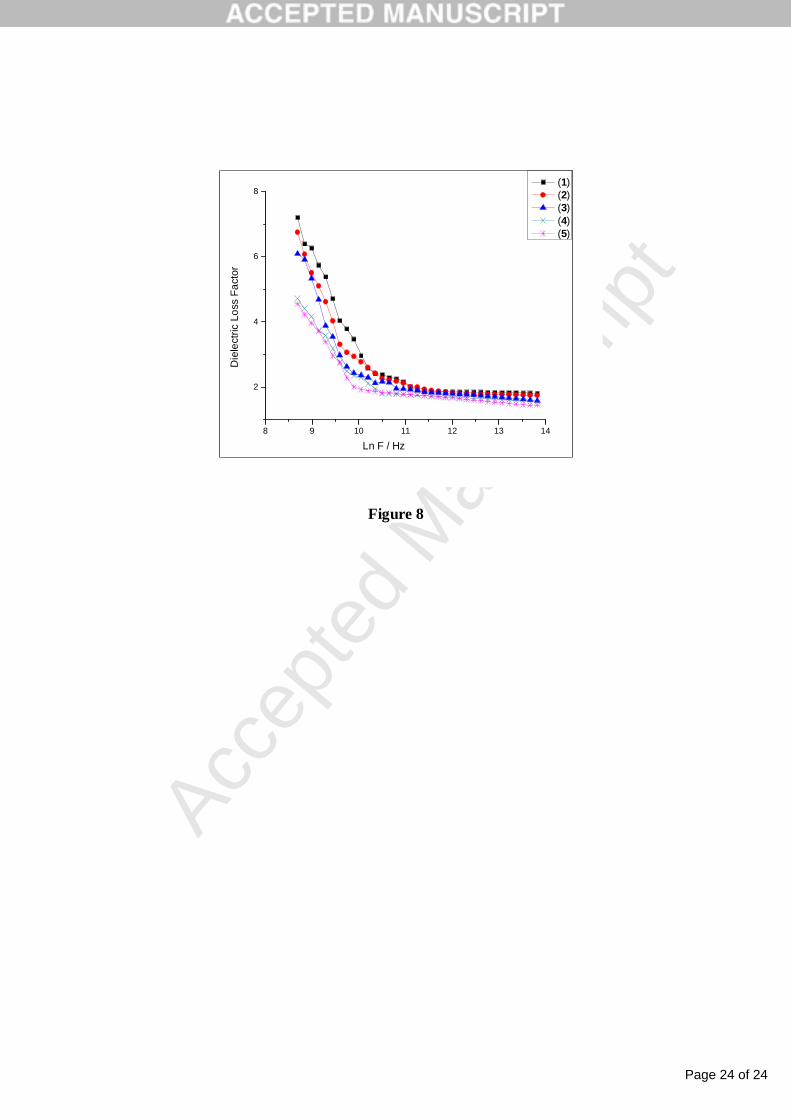
dielectric constants, dielectric loss and dielectric loss factor for compounds 1-5 are shown in
Figs. 6-8, respectively. At low frequency region, high value of dielectric constant is observed,
which is found to decrease with increase in frequency. At very high frequency range, the values
of dielectric constant become constant. The dielectric loss and dielectric loss factor also shows
the same frequency dependence. This effect of frequency on dielectric constant of compounds 1-
5 is explained on the basis of polarization mechanism. The dielectric materials polarize via one
of the three mechanisms i.e. electronic, ionic or orientational polarization. The electronic
polarization and conduction mechanism are similar [42]. The relaxation time for the polarized
material is 10-11 s, therefore at higher frequencies (>1011 Hz) the dipole orientation cannot keep
up with the alternating field and thus dielectric constant become constant at higher frequencies
[43]. This effect of very high frequency on dielectric phenomena has been predicted by
Maxwell-Wagner [44].
Page 10 of 24
Accep
ted
Man
uscr
ipt
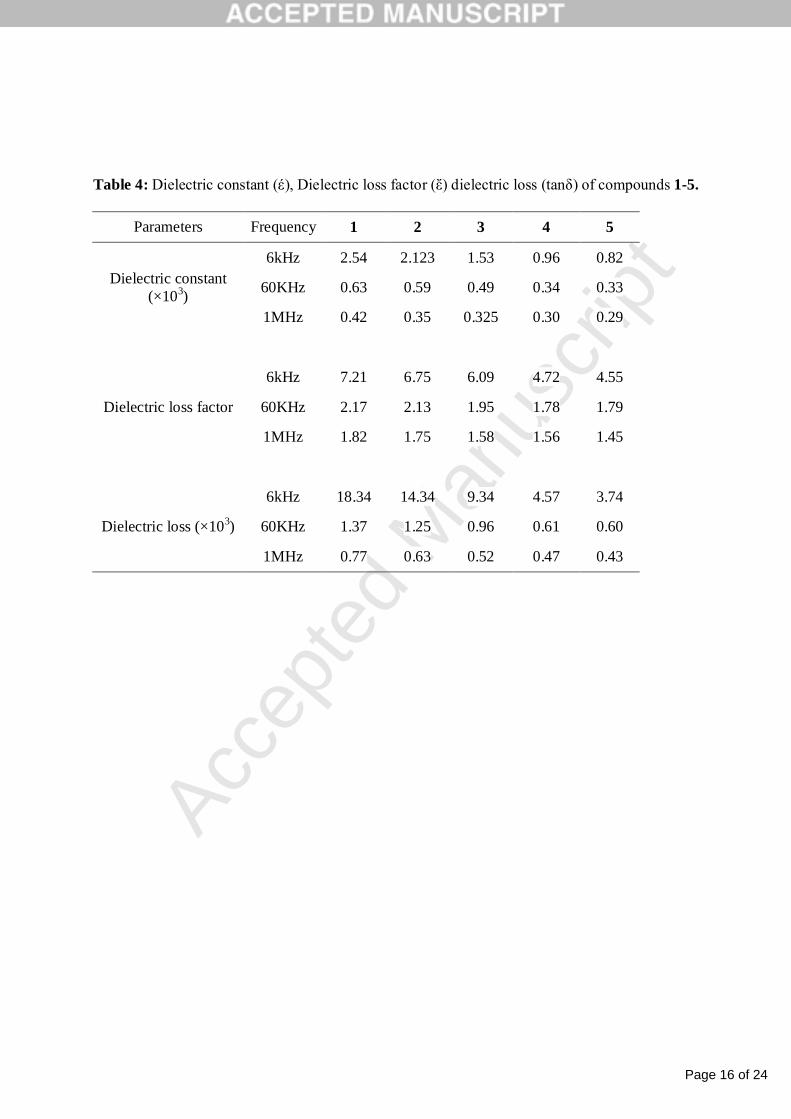
The compositional dependence of dielectric constant, dielectric loss and dielectric loss factor at 6
kHz, 60 kHz and 1 MHz is shown in Table 4. The dielectric constant values found to be
decreased with increased concentration of vanadium and germanium. The maximum value of
dielectric constant (2.54×10³) is observed for compound 1 and the minimum value of dielectric
constant (0.82×10³) is observed for compound 5 at 6 kHz frequency. This can be explained by
the conduction mechanism. As the La and Zr are replaced with V and Ge respectively, the
resistivity of the system is increased. This increase in resistivity is attributed to decreased
polarization. Dielectric loss and dielectric loss factor of compound 1-5 also decreased with
increased concentration of vanadium and geranium. The maximum value of dielectric loss
(18.34×10³) and dielectric loss factor (7.211954) is observed for compound 1 at 6 kHz
frequency. Similarly Compound 5 shows minimum dielectric loss (3.74×10³) and dielectric loss
factor value (4.554745) at 6 kHz frequency. The increase in dc electrical resistivity while
decrease in dielectric constant with substituents suggests that these materials can be used for
applications in microwave devices as such devices require highly resistive materials.
Conclusion
The hydrothermal method has been employed for the synthesis of V-Ge substituted lanthanum
zirconates. The XRD analysis confirmed the formation of pyrochlor structure in the undoped
sample while V-Ge doped materials showed some impurity peaks along with pyrochlor phase.
The XRF confirmed the composition of the synthesized materials. The room temperature dc
resistivity increase with the V-Ge content which is beneficial for their in the microwave devices.
The dielectric constant, dielectric loss and dielectric loss factor decrease with the frequency as
well as with the substituent concentration. The dc resistivity and dielectric data are in good
Page 11 of 24
Accep
ted
Man
uscr
ipt
agreement with each other. These materials can be used in microwave devices as the electrical
resistivity increase while dielectric constant decreases with the V-Ge content.
References
[1] J.W.P. Hsu, Z.R. Tian, N.C. Simmons, C.M. Matzke, J.A. Voigt, and J. Liu, Nano Lett. 5
(2005) 83–86.
[2] J. Yang, D. Li, X. Wang, X.J. Yang, L.D. Lu, J. Solid State Chem. 165 (2002) 193–198.
[3] G. Xiong, G. Wei, X. Yang, L. Lu, X. Wang, J. Mater. Sci. 35 (2000) 931-936.
[4] M. Uno, A. Kosuga, M. Okui, K. Horisaka, H. Muta, K. Kurosaki, S. Yamanaka, J. Alloys
Compd. 420 (2006) 291–297.
[5] B.P. Mandal, A.K. Tyagi, J. Alloys Compd. 437 (2007) 260–263.
[6] R. Vassen, X. Cao, F. Tietz, D. Basu, D. Stover, J. Am. Ceram. Soc. 83 (2000) 2023–2028.
[7] S. Lutique, R.J.M. Konings, V.V. Rondinella, J. Somers, T. Wiss, J. Alloys Compd. 352
(2003) 1–5.
[8] B.J. Wuensch, K.W. Eberman, C. Heremans, E.M. Ku, P. Onnerud, E. M. E. Yeo, S.M.
Haile, J.K. Stalick, J.D. Jorgensen, Solid State Ionics. 129 (2000) 111-133.
[9] J. Yamaura, Y. Muraoka, F. Sakai, Z. J. Hiroi, Phys. Chem. Solids. 63 (2002) 1027-1030.
[10] J.K. Park, C.H. Kim, K.J. Choi, H.D. Park, S.Y. Choi, J. Mater. Res. 16 (2001) 2568-2571.
[11] M.J.P. Gingras, B.C. den Hertog, M. Faucher, J.S. Gardner, S.R. Dunsiger, L.J. Chang, B.
D. Gaulin, N. P. Raju, J. E. Greedan, Phys. Rev. B. 62 (2000) 6496-6511.
[12] H. Tang, H. Sun, D. Chen, X. Jiao, Mater. Lett. 70 (2012) 48-50,
[13] S. Yugeswaran, A. Kobayashi, P. V. Ananthapadmanabhan, J. Europ. Ceram. Soc. 32
(2012) 823-834
Page 12 of 24
Accep
ted
Man
uscr
ipt
[14] A.P. Ramirez, A. Hayashi, R.J. Cava, R. Siddharthan, B.S. Shastry, Nature. 399 (1999)
333-335.
[15] S. Lutique, R.J.M. Konings, V.V. Rondinella, J. Somers, D. Staicu, T. Wiss, J. Nucl.
Mater. 319 (2003) 59-64.
[16] N. Izu, T. Omata, S. Otsuka-Yao-Matsuo, J. Alloys Compd. 270 (1998) 107-114.
[17] J. Wu, X. Wei, N.P. Padture, P.G. Klemens, M. Gell, E. Garcia, P. Miranzo, M.I. Osendi, J.
Am. Ceram. Soc. 85 (2002) 3031-3035.
[18] H. Otaki, H. Kido, T. Hoshikawa, M. Shimada, M. Koizumi, J. Ceram. Soc. Jpn. 96 (1988)
124-126.
[19] S.J. Korf, H.J.A. Koopmans, B.C. Lippens, A.J. Burggrasst, P.J. Gellings, J. Chem. Soc.,
Faraday Trans. 83 (1987) 1485-1491.
[20] R.A. McCauley, F.A. Hummel, J. Lumin. 6 (1973) 105-115.
[21] R.A. McCauley, J. Appl. Phys. 51 (1980) 290-294.
[22] O. Knop, F. Brisse, L. Castelliz, Can, J. Chem. 47 (1969) 971-990.
[23] P.A. Fuierer, R.E. Newnham, J. Am. Ceram. Soc. 74 (1991) 2876-2881.
[24] R. Vassen, X. Cao, F. Tietz, D. Basu, D. Stover, J. Am. Ceram. Soc. 83 (2000) 2023-2028.
[25] D. Chen, R. Xu, Mater. Res. Bull. 33 (1998) 409–417.
[26] K. Koteswara Rao, Taqveem Banu, M. Vithal, G.Y.S.K. Swamy, K. Ravi Kumar, Mater.
Lett. 54 (2002) 205-210.
[27] Y. Matsumura, M. Yoshinaka, K. Hirota, O. Yamaguchi, Solid State Commun. 104 (1997)
341-345.
[28] H. Chen, Y.F. Gao, Y. Liu, H. J. Luo, Inorg. Chem. 49, 1942-1946(2010).
[29] X.P. Tang, Y.F. Gao, H,F. Chen, H.J. Luo, Funct. Mater. Lett., 4(3), 1- 6(2011).
Page 13 of 24
Accep
ted
Man
uscr
ipt
[30] J. Yang, Y. Su, H. Li, X. Liu, Z. Chen, J. Alloys Compd. 509 (2011) 8008-8012.
[31] H. Jin, D. Huang, Q. Gao, L. Li, N. Wang, Y. Wang, S. Hou , Mater. Res. Bull. 47 (2012)
51-53.
[32] A. Rujiwatra, S. Tapala, S. Luachan, O. Khamman and S. Ananta, Mater. Lett. 60 (2006)
2893-2895.
[33] C. Wang, W. Huang, Y. Wang, Y. Cheng, B. Zou, X. Fan, J. Yang and X. Cao, Int. J.
Refrect. Met. H. 31 (2012) 242-246.
[34] R. Zhu, K. Zhu, J. Qiu, L. Bai and H. Ji, Mater. Res. Bull. 45 (2010) 969-973.
[35] T. Putjuso, S. Maensiri, S. Hunpratub and E. Swatsitang, Mater. Res. Bull. 47 (2012) 2270-
2276.
[36] A. A. Athawale, A. Chandwadkar, P. Karandikar and M. Bapat, Mater. Sci. Eng. B. 119
(2005) 87-93.
[37] S. H. Kim and S. Komarneni, Ceram. Int. 37 (2011) 1101-1107.
[38] L. M. Rodiguez, J. Alcaraz, M. Hernandez, M. Dufaux, Y. Ben Taarit, M. Vinat, Appl.
Catal. A. 189 (1999) 53-61.
[39] J. Ahmad, M.E. Mazhar, M.Q. Awan, M.N. Ashiq, Physica B. 406 (2011) 3484–3488
[40] M.J. Iqbal, M.N. Ashiq, P.H. Gomez, J. Alloy Compd. 478 (2009) 736–740
[41] Y. Bai, L. Lu and J. Bao, J. Inorg. Organomet. Polym. 21 (2011) 590-594.
[42] M. J. Iqbal, M. N. Ashiq, I. H. Gul, J. Magn. Magn. Mater. 322 (2010) 1720–1726.
[43] Y.J. Hsiao, Y.H. Chang, T.H. Fang, Y.S. Chang, Y.L. Chai, J. Alloy Compd. 421 (2006)
240–246.
[44] K.W. Wagner, Ann. Phys. 40 (1913) 817–855.
Page 14 of 24
Accep
ted
Man
uscr
ipt
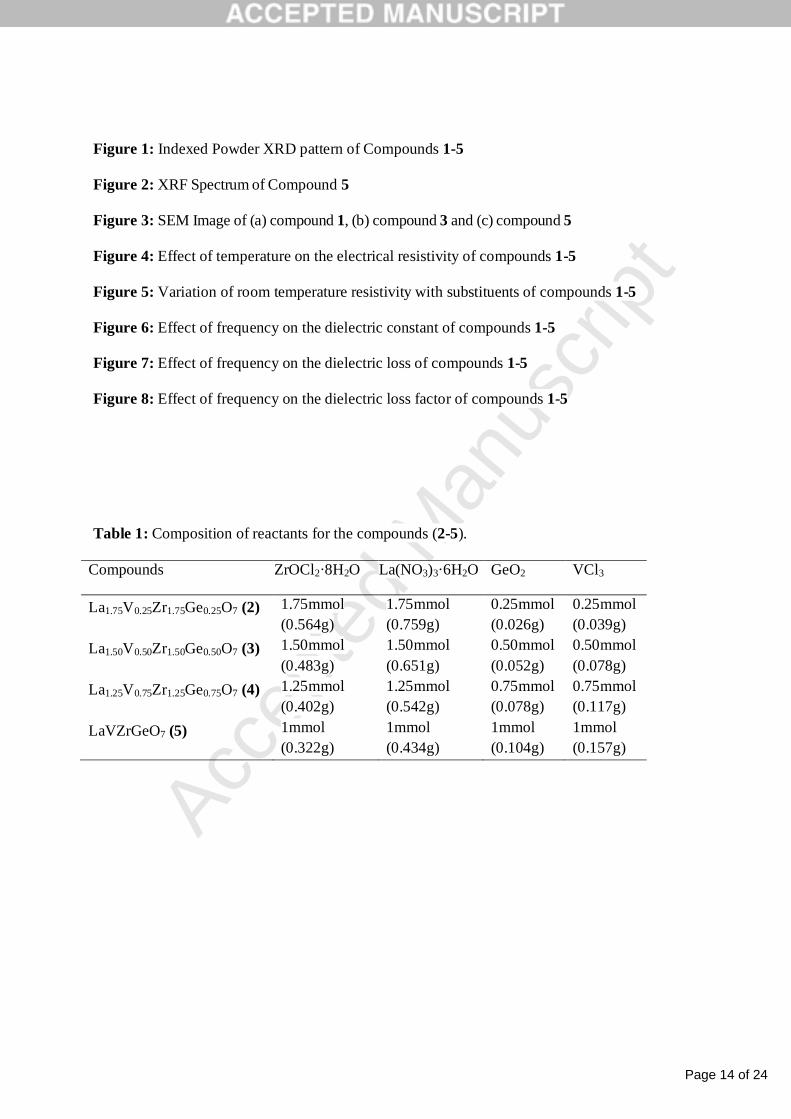
Figure 1: Indexed Powder XRD pattern of Compounds 1-5
Figure 2: XRF Spectrum of Compound 5
Figure 3: SEM Image of (a) compound 1, (b) compound 3 and (c) compound 5
Figure 4: Effect of temperature on the electrical resistivity of compounds 1-5
Figure 5: Variation of room temperature resistivity with substituents of compounds 1-5
Figure 6: Effect of frequency on the dielectric constant of compounds 1-5
Figure 7: Effect of frequency on the dielectric loss of compounds 1-5
Figure 8: Effect of frequency on the dielectric loss factor of compounds 1-5
Table 1: Composition of reactants for the compounds (2-5).
Compounds ZrOCl2·8H2O La(NO3)3·6H2O GeO2 VCl3
La1.75V0.25Zr1.75Ge0.25O7 (2) 1.75mmol (0.564g)
1.75mmol (0.759g)
0.25mmol (0.026g)
0.25mmol (0.039g)
La1.50V0.50Zr1.50Ge0.50O7 (3) 1.50mmol (0.483g)
1.50mmol (0.651g)
0.50mmol (0.052g)
0.50mmol (0.078g)
La1.25V0.75Zr1.25Ge0.75O7 (4) 1.25mmol (0.402g)
1.25mmol (0.542g)
0.75mmol (0.078g)
0.75mmol (0.117g)
LaVZrGeO7 (5) 1mmol (0.322g)
1mmol (0.434g)
1mmol (0.104g)
1mmol (0.157g)
Page 15 of 24
Accep
ted
Man
uscr
ipt
Table 2: Crystallite size, lattice strain, lattice constant, cell volume, bulk and x-ray density for
the zirconate materials.
Parameters 1 2 3 4 5
Crystallite sizes (D) nm ± 1 7.21 15.14 21.51 27.4 30.9
Lattice Strain 1.27 0.83 0.43 0.39 0.34
Lattice constant (a) Å ± 0.01 10.7 10.6 10.5 10.5 10.5
Cell volume (v) Å3 ± 0.1 1245 1218 1198 1175 1156
Bulk density (ρm) g cm-3 ± 0.01 4.45 4.01 3.96 3.93 3.87
X-ray density (ρx-ray) g cm-3 ±0.01 6.86 5.92 5.74 5.56 5.35
Table 3: Elemental composition of compounds (1-5) as determined by XRF analysis.
Element 1 2 3 4 5 O 19.47 20.23 21.61 21.65 23.94
V - 2.37 4.88 8.26 11.98
Ge - 3.39 6.71 11.87 13.97
Zr 31.78 29.36 26.57 23.06 23.40
La 48.75 44.55 40.25 35.17 26.72
Page 16 of 24
Accep
ted
Man
uscr
ipt
Table 4: Dielectric constant (έ), Dielectric loss factor (ἔ) dielectric loss (tanδ) of compounds 1-5.
Parameters Frequency 1 2 3 4 5
Dielectric constant (×103)
6kHz 2.54 2.123 1.53 0.96 0.82
60KHz 0.63 0.59 0.49 0.34 0.33
1MHz 0.42 0.35 0.325 0.30 0.29
Dielectric loss factor
6kHz 7.21 6.75 6.09 4.72 4.55
60KHz 2.17 2.13 1.95 1.78 1.79
1MHz 1.82 1.75 1.58 1.56 1.45
Dielectric loss (×103)
6kHz 18.34 14.34 9.34 4.57 3.74
60KHz 1.37 1.25 0.96 0.61 0.60
1MHz 0.77 0.63 0.52 0.47 0.43
Page 17 of 24
Accep
ted
Man
uscr
ipt
1 0 2 0 3 0 4 0 5 0 6 0 7 0 8 0
2 T heta (deg.)
2
3
4
222
5
662
800-2
07711
622
440
51140
0
202
201
200
1
Inte
nsity
(a.u
)
Figure 1
Page 18 of 24
Accep
ted
Man
uscr
ipt
Figure 2
Page 19 of 24
Accep
ted
Man
uscr
ipt
Figure 3
Page 20 of 24
Accep
ted
Man
uscr
ipt
350 400 450 500 550 600 6500
2
4
6
8
10
12
Res
istiv
ity (O
hm c
m)
(1) (2) (3) (4) (5)
T(K)
Figure 4
Page 21 of 24
Accep
ted
Man
uscr
ipt
-0.1 0.0 0.1 0.2 0.3 0.4 0.5 0.6 0.7 0.8 0.9 1.0 1.1
0
2
4
6
8
10
Roo
m te
mpe
ratu
re re
sist
ivity
(Ohm
cm
)
V, Ge Content
Figure 5
Page 22 of 24
Accep
ted
Man
uscr
ipt
8 9 10 11 12 13 140
1
2
3 (1) (2) (3) (4) (5)
Ln F / Hz
Die
lect
ric C
onst
ant ×
10
3
Figure 6
Page 23 of 24
Accep
ted
Man
uscr
ipt
8 9 10 11 12 13 140
2
4
6
8
10
12
14
16
18
20 (1) (2) (3) (4) (5)
Ln F / Hz
Die
lect
ric L
oss
× 10
3
Figure 7
Page 24 of 24
Accep
ted
Man
uscr
ipt
8 9 10 11 12 13 14
2
4
6
8 (1) (2) (3) (4) (5)
Die
lect
ric L
oss
Fact
or
Ln F / Hz
Figure 8
Copyright © 2022 FDOKUMEN