Hydrology and water quality in two mountain basins of the northeastern US: assessing baseline...
12
HYDROLOGICAL PROCESSES Hydrol. Process. 21, 1639 – 1650 (2007) Published online 24 April 2007 in Wiley InterScience (www.interscience.wiley.com). DOI: 10.1002/hyp.6700 Hydrology and water quality in two mountain basins of the northeastern US: assessing baseline conditions and effects of ski area development †,‡ Beverley Wemple 1 * James Shanley 2 Jon Denner 2 Donald Ross 3 and Kevin Mills 1 1 Department of Geography, University of Vermont, 202 Old Mill, Burlington, VT 05405, USA 2 US Geological Survey, Montpelier, Vermont, USA 3 Department of Plant and Soil Science, University of Vermont, 202 Old Mill, Burlington, VT 05405, USA *Correspondence to: Beverley Wemple, Department of Geography, University of Vermont, 202 Old Mill, Burlington, VT 05405, USA. E-mail: [email protected] † Trade names are in this article for informational purposes only and do not imply endorsement by the University of Vermont or US Geological Survey. ‡ This article is a US Government work and is in the public domain in the USA. Received 23 July 2006 Accepted 29 January 2007 Abstract Mountain regions throughout the world face intense development pressures associated with recreational and tourism uses. Despite these pressures, much of the research on bio-geophysical impacts of humans in mountain regions has focused on the effects of natural resource extraction. This paper describes findings from the first 3 years of a study examining high elevation watershed processes in a region undergoing alpine resort development. Our study is designed as a paired-watershed experiment. The Ranch Brook watershed (9·6 km 2 ) is a relatively pristine, forested watershed and serves as the undeveloped ‘control’ basin. West Branch (11·7 km 2 ) encompasses an existing alpine ski resort, with approximately 17% of the basin occupied by ski trails and impervious surfaces, and an additional 7% slated for clearing and development. Here, we report results for water years 2001–2003 of streamflow and water quality dynamics for these watersheds. Precipitation increases significantly with elevation in the watersheds, and winter precipitation represents 36–46% of annual precipitation. Artificial snowmaking from water within West Branch watershed currently augments annual precipitation by only 3 – 4%. Water yield in the developed basin exceeded that in the control by 18 – 36%. Suspended sediment yield was more than two and a half times greater and fluxes of all major solutes were higher in the developed basin. Our study is the first to document the effects of existing ski area development on hydrology and water quality in the northeastern US and will serve as an important baseline for evaluating the effects of planned resort expansion activities in this area. Published in 2007 John Wiley & Sons, Ltd. Key Words alpine hydrology and water quality; ski areas; snowmaking Introduction Mountain regions throughout the world face intense development pressures, a concern that has recently drawn national and international attention (Price and Messerli, 2002; Williams, 2002; Stein et al., 2005). Although these development pressures are often associated with recreational and tourism uses, much of the research on bio-geophysical impacts of humans in mountain environments has been focused on the effects of natural resource extraction (e.g. forestry, mining). While analogous in some respects, development of mountain regions for recreation and tourism may be expected to produce effects that differ from those produced by resource extraction. In particular, recreation and tourism may result in higher concentrations of humans in developed settings and a more extensive and denser network of buildings and infrastructure that are intended to persist over time. The mountain landscape of the northeastern US is one region fac- ing such intense development pressure. More than 40 million people live within one day’s drive of the Northern Forest, a region span- ning the northern tier of New England and New York and southeastern Canada (Harper et al., 1990). The mountain settings of the region draw recreational users who engage in a variety of activities including leaf peep- ing, fishing, boating, and skiing. To meet these recreational demands and attract a greater share of the recreational market, many alpine resorts in the northeastern US are undergoing major expansion in an attempt to compete Published in 2007 John Wiley & Sons, Ltd. 1639
Transcript of Hydrology and water quality in two mountain basins of the northeastern US: assessing baseline...

HYDROLOGICAL PROCESSESHydrol. Process. 21, 1639–1650 (2007)Published online 24 April 2007 in Wiley InterScience (www.interscience.wiley.com). DOI: 10.1002/hyp.6700
Hydrology and water quality in two mountain basins of thenortheastern US: assessing baseline conditions and effects ofski area development†,‡
Beverley Wemple1*James Shanley2
Jon Denner2
Donald Ross3 andKevin Mills1
1 Department of Geography, Universityof Vermont, 202 Old Mill, Burlington,VT 05405, USA2 US Geological Survey, Montpelier,Vermont, USA3 Department of Plant and SoilScience, University of Vermont, 202Old Mill, Burlington, VT 05405, USA
*Correspondence to:Beverley Wemple, Department ofGeography, University of Vermont,202 Old Mill, Burlington, VT05405, USA.E-mail: [email protected]
† Trade names are in this article forinformational purposes only and do notimply endorsement by the Universityof Vermont or US Geological Survey.
‡ This article is a US Governmentwork and is in the public domain inthe USA.
Received 23 July 2006Accepted 29 January 2007
Abstract
Mountain regions throughout the world face intense development pressuresassociated with recreational and tourism uses. Despite these pressures, much of theresearch on bio-geophysical impacts of humans in mountain regions has focused onthe effects of natural resource extraction. This paper describes findings from thefirst 3 years of a study examining high elevation watershed processes in a regionundergoing alpine resort development. Our study is designed as a paired-watershedexperiment. The Ranch Brook watershed (9·6 km2) is a relatively pristine, forestedwatershed and serves as the undeveloped ‘control’ basin. West Branch (11·7 km2)encompasses an existing alpine ski resort, with approximately 17% of the basinoccupied by ski trails and impervious surfaces, and an additional 7% slated forclearing and development. Here, we report results for water years 2001–2003of streamflow and water quality dynamics for these watersheds. Precipitationincreases significantly with elevation in the watersheds, and winter precipitationrepresents 36–46% of annual precipitation. Artificial snowmaking from waterwithin West Branch watershed currently augments annual precipitation by only3–4%. Water yield in the developed basin exceeded that in the control by 18–36%.Suspended sediment yield was more than two and a half times greater andfluxes of all major solutes were higher in the developed basin. Our study is thefirst to document the effects of existing ski area development on hydrology andwater quality in the northeastern US and will serve as an important baseline forevaluating the effects of planned resort expansion activities in this area. Publishedin 2007 John Wiley & Sons, Ltd.
Key Words alpine hydrology and water quality; ski areas; snowmaking
IntroductionMountain regions throughout the world face intense development pressures,a concern that has recently drawn national and international attention (Priceand Messerli, 2002; Williams, 2002; Stein et al., 2005). Although thesedevelopment pressures are often associated with recreational and tourismuses, much of the research on bio-geophysical impacts of humans in mountainenvironments has been focused on the effects of natural resource extraction(e.g. forestry, mining). While analogous in some respects, development ofmountain regions for recreation and tourism may be expected to produceeffects that differ from those produced by resource extraction. In particular,recreation and tourism may result in higher concentrations of humans indeveloped settings and a more extensive and denser network of buildingsand infrastructure that are intended to persist over time.
The mountain landscape of the northeastern US is one region fac-ing such intense development pressure. More than 40 million peoplelive within one day’s drive of the Northern Forest, a region span-ning the northern tier of New England and New York and southeasternCanada (Harper et al., 1990). The mountain settings of the region drawrecreational users who engage in a variety of activities including leaf peep-ing, fishing, boating, and skiing. To meet these recreational demands andattract a greater share of the recreational market, many alpine resorts in thenortheastern US are undergoing major expansion in an attempt to compete
Published in 2007 John Wiley & Sons, Ltd. 1639

B. WEMPLE ET AL.
West Branch
Legend
watershed boundaries
streams
stream gauges
rain gauges
snow survey points
NWS precipitation gauge
Ranch Brook
Kilometers0 0.5 1 2
Area of detail
Figure 1. West Branch and Ranch Brook watersheds with locations of gauging and precipitation monitoring stations. USGS precipitation gauge is onthe roof of the West Branch gauging station and not shown as a separate symbol on the map. The inset map shows the extent of development in ski
trails (stippled pattern) and roads and parking lots (shaded grey) in the West Branch basin
with Rocky Mountain and European destinations. Expan-sion activities include the development of slope-side vil-lages, expansion of trail networks, enhancing artificialsnowmaking capacity to provide reliable snow cover andextend the ski season, and a diversification into four-season resorts through development of golf courses, waterparks, and other non-winter sporting activities.
The body of scientific literature in the US on theeffects of alpine ski area operations on watershed pro-cesses is sparse and drawn largely from a few studiesconducted in the western states (Shanley and Wemple,2002). A series of studies in the southern Rocky Moun-tains documented minimal impacts of ski area opera-tions on bacteriological water quality, elevated levelsof heavy metals, elevated levels of dissolved ions, and
some impacts on the aquatic macroinvertebrate commu-nity (Gosz, 1977; Moore et al., 1978; White et al., 1978;Molles and Gosz, 1980). Studies in Colorado have esti-mated consumptive losses from man-made snowmakingthat range from 13–37% of water used for snowmaking,but the authors caution that consumptive losses would beconsiderably less in more humid areas such as the east-ern USA (Eisel et al., 1988, 1990). Several studies haveattempted to understand how compaction of snow by trailgrooming at ski areas influences snowpack depth, snowwater content, and melt rates at ski areas in the westernUS (Grady, 1982; Kattelmann, 1985) and in New Eng-land (Chase, 1984). Recent explorations are probing theimplications of acid rock drainage on the growth poten-tial of western US ski resorts (Todd et al., 2003). We areaware of only one peer-reviewed scientific study aimed
Published in 2007 John Wiley & Sons, Ltd. 1640 Hydrol. Process. 21, 1639–1650 (2007)DOI: 10.1002/hyp
SCIENTIFIC BRIEFING
at evaluating the effects of ski area operations on water-shed hydrology and water quality in the northeastern USThis study is based on strip cutting at the Hubbard BrookExperimental Forest as an analog for ski trail develop-ment (Hornbeck and Stuart, 1976). The authors suggestthat only modest changes in streamflow and water qual-ity might occur from ski areas, though they acknowledgedistinct differences between the strip cutting example andalpine ski area development.
At least four factors associated with ski area devel-opment may lead to effects on watershed processes thatare distinct from those associated with traditional for-est management practices. First, forest clearings createdfor ski trails are oriented along gravitational flow paths,enhancing the potential for efficient down slope routingof water, solutes and particulates. Second, forest clear-ings for ski trails are intended to persist over time andrepresent a relatively permanent alteration of the forestlandscape. Third, certain activities associated with skiarea development, particularly artificial snowmaking, arenot present in traditional forest management operations.Finally, other practices, including creation of impervi-ous surfaces and development of drainage infrastructureare more extensive than those associated with traditionalforest management practices.
Here, we report findings for water years (WY)2001–2003 of a study examining high elevation water-shed processes in a region undergoing alpine resort devel-opment. Our study is designed as a paired watershedexperiment, encompassing two adjacent watersheds onthe eastern slope of Mt Mansfield, Vermont’s highestpeak. Our goals include documenting the hydrologic andbiogeochemical behaviour of these high-elevation water-sheds and the effects of current resort development. Ourobservations will also provide baseline data to examinefuture development in one of the watersheds and to val-idate hydrologic models of development effects.
ApproachStudy area
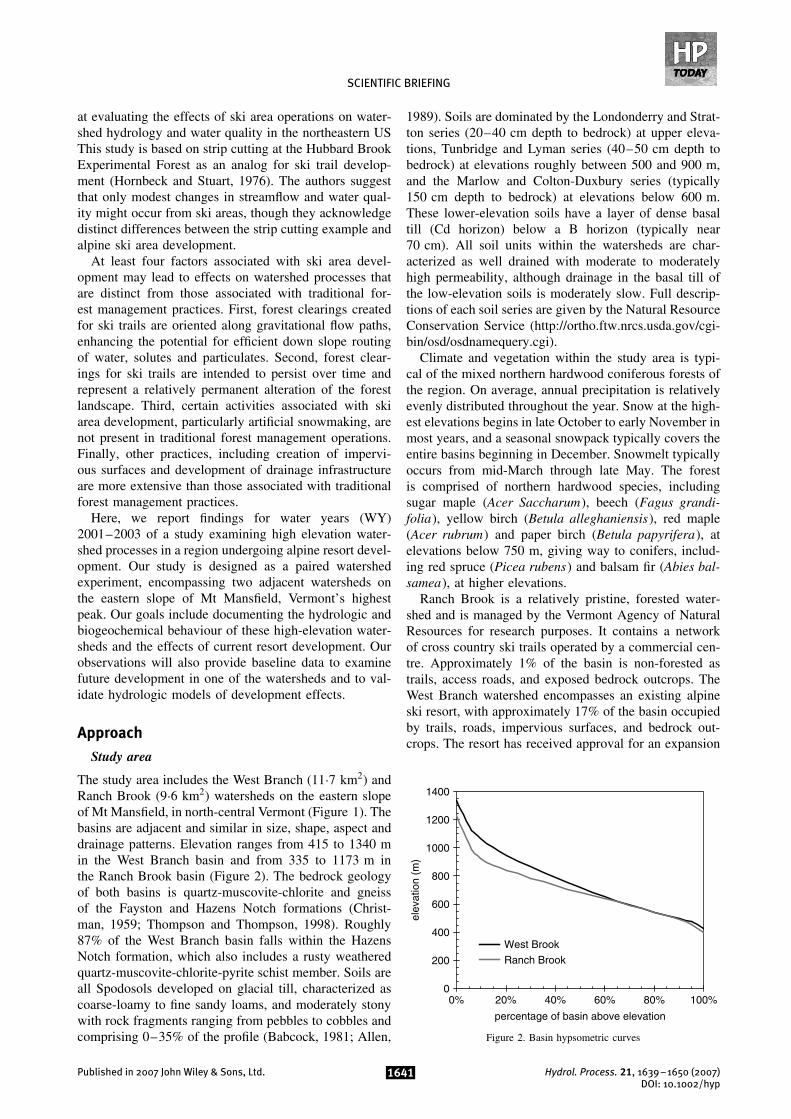
The study area includes the West Branch (11Ð7 km2) andRanch Brook (9Ð6 km2) watersheds on the eastern slopeof Mt Mansfield, in north-central Vermont (Figure 1). Thebasins are adjacent and similar in size, shape, aspect anddrainage patterns. Elevation ranges from 415 to 1340 min the West Branch basin and from 335 to 1173 m inthe Ranch Brook basin (Figure 2). The bedrock geologyof both basins is quartz-muscovite-chlorite and gneissof the Fayston and Hazens Notch formations (Christ-man, 1959; Thompson and Thompson, 1998). Roughly87% of the West Branch basin falls within the HazensNotch formation, which also includes a rusty weatheredquartz-muscovite-chlorite-pyrite schist member. Soils areall Spodosols developed on glacial till, characterized ascoarse-loamy to fine sandy loams, and moderately stonywith rock fragments ranging from pebbles to cobbles andcomprising 0–35% of the profile (Babcock, 1981; Allen,
1989). Soils are dominated by the Londonderry and Strat-ton series (20–40 cm depth to bedrock) at upper eleva-tions, Tunbridge and Lyman series (40–50 cm depth tobedrock) at elevations roughly between 500 and 900 m,and the Marlow and Colton-Duxbury series (typically150 cm depth to bedrock) at elevations below 600 m.These lower-elevation soils have a layer of dense basaltill (Cd horizon) below a B horizon (typically near70 cm). All soil units within the watersheds are char-acterized as well drained with moderate to moderatelyhigh permeability, although drainage in the basal till ofthe low-elevation soils is moderately slow. Full descrip-tions of each soil series are given by the Natural ResourceConservation Service (http://ortho.ftw.nrcs.usda.gov/cgi-bin/osd/osdnamequery.cgi).
Climate and vegetation within the study area is typi-cal of the mixed northern hardwood coniferous forests ofthe region. On average, annual precipitation is relativelyevenly distributed throughout the year. Snow at the high-est elevations begins in late October to early November inmost years, and a seasonal snowpack typically covers theentire basins beginning in December. Snowmelt typicallyoccurs from mid-March through late May. The forestis comprised of northern hardwood species, includingsugar maple (Acer Saccharum), beech (Fagus grandi-folia), yellow birch (Betula alleghaniensis), red maple(Acer rubrum) and paper birch (Betula papyrifera), atelevations below 750 m, giving way to conifers, includ-ing red spruce (Picea rubens) and balsam fir (Abies bal-samea), at higher elevations.
Ranch Brook is a relatively pristine, forested water-shed and is managed by the Vermont Agency of NaturalResources for research purposes. It contains a networkof cross country ski trails operated by a commercial cen-tre. Approximately 1% of the basin is non-forested astrails, access roads, and exposed bedrock outcrops. TheWest Branch watershed encompasses an existing alpineski resort, with approximately 17% of the basin occupiedby trails, roads, impervious surfaces, and bedrock out-crops. The resort has received approval for an expansion
0
200
400
600
800
1000
1200
1400
0% 20% 40% 60% 80% 100%
percentage of basin above elevation
elev
atio
n (m
)
Ranch Brook
West Brook
Figure 2. Basin hypsometric curves
Published in 2007 John Wiley & Sons, Ltd. 1641 Hydrol. Process. 21, 1639–1650 (2007)DOI: 10.1002/hyp

B. WEMPLE ET AL.
that will include development of a base village (condo-miniums, shops and restaurants), mountainside vacationhomes, new clearings for ski trails and a golf course,construction of a new water storage pond, and exten-sion of snowmaking coverage to 100% of all ski trails.After the expansion, cleared and impervious areas willcover approximately 24% of the basin. Ground break-ing for construction of the new base village began in thesummer of 2003.
Field measurements and sampling
Our measurement program began in October 2000 withthe installation of gauging stations for continuous mon-itoring of stream flow (Table I). At each site, stage ismeasured by a pressure transducer and recorded at 5 minintervals by a Campbell CR-10 datalogger. The RanchBrook gauge utilizes natural channel control, whereasthe West Branch gauge has a thin plate rectangular weir.When needed, water for snowmaking is diverted fromthe weir pool at West Branch to an adjacent snowmakingpond by opening a gate. Water diverted to the snowmak-ing pond does not flow through the weir and does notcontribute to measured streamflow; hence, water recy-cled within the basin for artificial snowmaking is onlymeasured when it ultimately flows out of the basin andpast our gauging station. Stage-discharge relations at bothgauges were determined empirically and are reevaluatedannually. Descriptions of the stream gauging stations andpublished streamflow data are available through the USGeological Survey (USGS) (Coakley et al., 2002).
Flow-activated water sampling using TeledyneISCO automated samplers for analysis of suspended sed-iment concentration (SSC) and major dissolved solutesbegan in March 2001 at the gauging stations of bothbasins. The intake nozzle was a standard ISCO strainer,approximately 20 cm long with multiple holes. It waselevated approximately 0Ð3 m above the stream bed and
approximately 1 m from a vertical retaining wall, ori-ented downstream, and located in a riffle where sus-pended sediment is generally thought to be well mixedin mountain streams (Thomas, 1985). Sampling occurredover a wide range of flow events, typically including upto 12 samples per storm event at each watershed, ensur-ing characterization of temporal variability in suspendedsediment and solute concentrations.
Precipitation was monitored using two permanentinstallations and a distributed network of rain gaugesand snow pack surveys that were operated for lim-ited time periods (Figure 1, Table I). Permanent instal-lations include a standard (20 cm diameter) shieldednon-recording precipitation gauge at 1204 m, below thesummit of Mt Mansfield near the divide between theWest Branch and Ranch Brook watersheds and oper-ated by the National Weather Service (NWS) since 1953,and a MetOne unshielded, heated tipping bucket raingauge located at 430 m, at the West Branch gaugingstation and operated by the USGS since its installa-tion in October 2002. During the summer and fall of2002 and 2003, we installed and monitored a networkof unshielded Hobo recording rain gauges along threeelevational transects in the watersheds. In April 2004,we conducted snow surveys to measure snow depthand water equivalent at 77 points along seven eleva-tional transects in the two basins. For each snow waterequivalent (SWE) determination, five measurements wereaveraged. SWE was measured near peak accumulationbefore appreciable melt had occurred. Though some mid-winter rain or melt may have caused limited runoff, theSWE measurements should represent most of the winterprecipitation.
Laboratory analysis
Water quality analyses were conducted using standardmethods in laboratories at the University of Vermont.
Table I. Details of existing physical measurements and stream water quality sampling in the study basins
Measurement/Sampling Measurement period Frequency Method
Streamflow 10/2000—present Continuous (5 min) Pressure transducerAir temperature 10/2001—present Continuous (5 min) ThermisterWater temperature 10/2001—present Continuous (5 min) ThermisterPrecipitation—low
elevation (430 m)a10/2001—present Continuous (5 min) when
rainingTipping bucket (heated),
unshieldedPrecipitation—high
elevation (1204 m)b11/1953—present Daily totals measured at
1800 ESTStandard, non-recording,
shieldedPrecipitation—distributedc 7/2002–9/2002 and
5/2003–10/2003Continuous with rainfall Tipping bucket,
unshieldedSuspended sediment 3/2001—present Periodic (stage activated
and grab)ISCO automated sampler
Cations (Ca, K, Mg, Na,Si)
3/2001—present Periodic (stage activatedand grab)
ISCO automated sampler
Anions (Cl, NO3, SO4) 3/2001—present Periodic (stage activatedand grab)
ISCO automated sampler
a Represents USGS precipitation gauge at West Branch gauging station.b Represents NWS precipitation gauge near the summit of Mt Mansfield.c Represents distributed precipitation network of 12 tipping bucket gauges arrayed in three transects to capture controls of elevation and aspect onprecipitation. All other measurements are at gauging stations for each watershed. See Figure 1 for locations of measurement points.
Published in 2007 John Wiley & Sons, Ltd. 1642 Hydrol. Process. 21, 1639–1650 (2007)DOI: 10.1002/hyp
SCIENTIFIC BRIEFING
Total suspended solids were measured on 1-L samplesfiltered on 1Ð5-µm fibreglass filters and oven driedovernight at 105 °C. The organic fraction was determinedby loss on ignition at 550 °C for 30 min. Major anionconcentrations were measured on a Dionex 600DX modelion chromatograph (Dionex Corp., Sunnyvale, CA) withan AS14A anion column. Major cation and siliconconcentrations were measured on a Perkin-Elmer Optima3000DV Inductively-Coupled Plasma Optical EmissionsSpectrometer (Perkin-Elmer, Norwalk, CT).
Data analysisSpatial patterns and elevation trends in precipitation dis-tribution for the watersheds were assessed using mea-surements from the two permanent precipitation stationsand our distributed precipitation monitoring network.Annual precipitation lapse rates were derived from thedifference in precipitation depths recorded at the USGSand NWS stations in WY 2002 and 2003, when datafrom both sites were available. Trends in precipitationwith elevation were assessed with linear regression mod-els fit to data collected from our distributed networkof Hobo rain gauges and the USGS and NWS sta-tions for two periods: 1 month in summer, 2002 and4 months in the summer and fall of 2003. Snow sur-vey data were used to assess precipitation–elevationtrends for the snow season spanning the period from20, November 2003 (when a seasonal snowpack devel-oped at 400 m) to 4, April 2004, when our survey wasconducted.
Annual precipitation depths for each watershed wereestimated from simple linear interpolation between thetwo continuously recording precipitation gauges of theUSGS and NWS. The interpolation was accomplishedby applying an annual precipitation lapse rate to thehypsometric curve of each watershed to determine anannual areally averaged precipitation depth. The annuallapse rate for WY 2002 and WY2003 was derivedfrom the difference in annual precipitation totals at thetwo stations. For WY 2001, when precipitation was notmeasured at the USGS station, an average of the WY2002and WY2003 lapse rate was used (Table II).
Artificial snowmaking water consumption wastaken from values reported to the Vermont Agency ofNatural Resources (ANR) by the resort operating in the
Table II. Annual precipitation totals (mm) and precipitation lapserates (mm m�1 year�1) used in estimates of basin total precipi-
tation depth. See Figure 1 for station locations
Station (elevation)
USGS(430 m)
NWS(1204 m)
Lapserate
WY 2001 — 1853 0.893a
WY 2002 1395 2018 0.805WY 2003 1053 1812 0.981
a Precipitation depth not available for USGS station in WY2001. Lapserate used in calculations is average of WY 2002 and WY2003 values.
West Branch watershed (unpublished data provided by J.Cueto, Hydrologist, Vermont ANR). Snowmaking wateruse is reported as a volume of water applied to the slopesfrom the snowmaking pond and was divided by areaof the West Branch watershed and given as a depth inTable III.
Runoff metrics were determined from continuoushydrograph records. Annual water yield was summedfrom hourly discharge values and normalized to basinarea. Spring runoff (‘snowmelt’) was determined in eachbasin by summing the discharge over the period from 15March to 31 May. Runoff during this period is dominatedby snowmelt, but also includes baseflow and rain-on-snow events.
Empirical equations were used to establish the rela-tionship between streamflow and both solute and sedi-ment concentrations in order to estimate annual fluxes(Table IV). Concentration–discharge relationships fordissolved solutes took the general form
Y D b0 C b1QJ C b2 sin � C b3 cos � �1�
where Y is solute concentration, � is a time term equalto (2 ð � ð day of year/365), QJ is a transformation ofthe discharge (Q) of the form
QJ D 1/�1 C ˇ Q� �2�
(after Johnson et al., 1969), the bi terms are regressioncoefficients, and the parameter ˇ is estimated throughoptimization of the regression model given in (1). Useof the sine and cosine terms incorporates seasonal fluctu-ations in solute concentrations (Aulenbach and Hooper,2006). The rating curves for total suspended solids tookthe form
ln Y D b0 C b1 ln Q C b2 season C b3 ISQ
C b3 rising C b3 ISR �3�
where lnY is the natural logarithm of the concentrationsuspended solids, lnQ is the natural logarithm of dis-charge (cfs); season is a binary variable set to 0 forthe period from 1, December to 31, May and 1 other-wise; rising is a binary variable set to 1 on the risinglimb of the hydrograph up to 2 h before the hydro-graph peak, and 0 otherwise, ISQ is an interaction termbetween season and discharge (season ð ln Q) and ISR
is an interaction term between season and rising limb(season ð rising). Regression models were based on the3 years of samples for solutes but only on samples col-lected during WY 2001 and WY 2002 for total suspendedsolids, to eliminate samples collected during late sum-mer 2003 after construction activity began and substantialground disturbance near the West Branch gauging stationoccurred. Annual suspended sediment and solute yieldswere computed from the continuous hydrograph recordusing regression-derived concentrations multiplied by theaverage hourly discharge and summed for the water year.Uncertainty ranges in annual load estimates were assessedusing 95% confidence bounds for predictions of average
Published in 2007 John Wiley & Sons, Ltd. 1643 Hydrol. Process. 21, 1639–1650 (2007)DOI: 10.1002/hyp

B. WEMPLE ET AL.
Table III. Estimates of water balance terms for the Ranch Brook and West Branch watersheds, water years 2001–2003
Ranch Brook West Branch
WY01
WY02
WY03
WY01
WY02
WY03
Precipitation depth (mm) 1404 1613 1318 1449 1653 1368Runoff depth (mm) 872 1173 958 1190 1416 1132Runoff/precip ratio 0.62 0.73 0.73 0.82 0.86 0.83Precip-runoff (mm) 532 440 360 259 237 236Snowmaking depth (mm) 47 45 53Snowmaking/natural precip 0.03 0.03 0.04Snowmelt depth (mm) 442 554 458 569 699 575Fraction of runoff as snowmelt 0.51 0.47 0.48 0.50 0.49 0.51
Table IV. Regression models for solutes and suspended load concentrations. See text for definition of regression terms
Variable(units)
Regression coefficients (and standard errors) Adj
WSa Constant QJ sin � cos � ˇb Rb
Na (mg/L) RB 0Ð56 (0Ð02)c — —WB �0Ð51 (0Ð42) 17Ð24 (0Ð94) 3Ð89 (0Ð26) 3Ð20 (0Ð53) 0Ð075 0Ð63
Ca (mg/L) RB 1Ð73 (0Ð04) 1Ð63 (0Ð09) 0Ð05 (0Ð02) 0Ð37 (0Ð05) 0Ð13 0Ð58WB 2Ð29 (0Ð01) 6Ð04 (0Ð22) 0Ð58 (0Ð06) 0Ð55 (0Ð13) 0Ð075 0Ð73
Mg (mg/L) RB 0Ð33 (0Ð01) 0Ð35 (0Ð02) 0Ð02 (0Ð01) 0Ð10 (0Ð01) 0Ð155 0Ð53WB 0Ð37 (0Ð02) 0Ð84 (0Ð03) 0Ð09 (0Ð01) 0Ð11 (0Ð02) 0Ð055 0Ð71
K (mg/L) RB 0Ð46 (0Ð06)c — —WB 0Ð51 (0Ð01)c — —
Si (mg/L) RB 0Ð96 (0Ð04) 1Ð20 (0Ð10) �0Ð07 (0Ð03) 0Ð02 (0Ð05) 0Ð14 0Ð40WB 0Ð94 (0Ð03) 1Ð17 (0Ð06) �0Ð08 (0Ð02) 0Ð16 (0Ð03) 0Ð065 0Ð66
NO3 (mg/L) RB 0Ð41 (0Ð02) 1Ð17 (0Ð42) 0Ð31 (0Ð02) 0Ð26 (0Ð03) 5Ð01 0Ð63WB 0Ð52 (0Ð01) �0Ð01 (0Ð002) 0Ð29 (0Ð01) 0Ð19 (0Ð03) 0Ð275 0Ð67
SO4 (mg/L) RB 1Ð12 (0Ð02) 0Ð67 (0Ð04) �0Ð09 (0Ð01) 0Ð17 (0Ð02) 0Ð12 0Ð71WB 1Ð42 (0Ð03) 1Ð08 (0Ð06) �0Ð08 (0Ð02) 0Ð17 (0Ð04) 0Ð055 0Ð58
Cl (mg/L) RB 0Ð40 (0Ð02)c — —WB �3Ð85 (0Ð74) 29Ð67 (1Ð47) 7Ð00 (0Ð44) 6Ð08 (0Ð93) 0Ð05 0Ð61
Constant lnQ Season ISQ Rising ISR
SSC (mg/L) RB �2Ð25 (0Ð43) 1Ð03 (0Ð11) 3Ð31 (0Ð54) �1Ð03 (0Ð15) 0Ð01 (0Ð26) 0Ð92 (0Ð37) — 0Ð36WB �1Ð32 (0Ð42) 0Ð82 (0Ð11) 3Ð85 (0Ð60) �1Ð07 (0Ð15) 1Ð08 (0Ð28) 0Ð86 (0Ð40) — 0Ð40
a Watershed: RB, Ranch Brook; WB, West Branch.b Transformation parameter for flow variable QJ D 1/�1 C ˇQ� (Q in cfs).c Denotes average concentration values used for variables with no significant relationship to discharge or season.
solute or sediment concentration at each hourly dischargevalue over the 3-year period of record, multiplied by theaverage hourly discharge, and summed for the water year.Annual solute inputs in precipitation and dry depositionwere estimated using the regional model of Ollinger et al.(1993).
ResultsHydrology
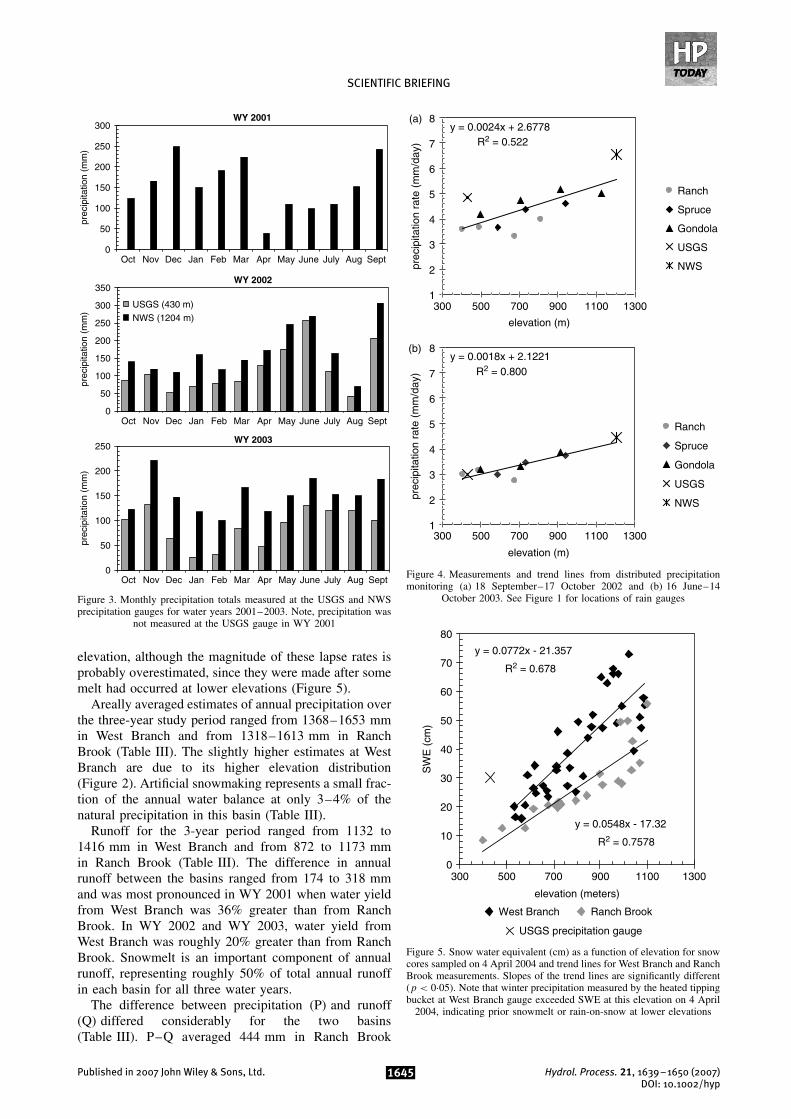
Precipitation is relatively evenly distributed throughthe year in our study area and increases substantiallywith elevation (Figure 3). Monthly precipitation averaged102 mm for the 2 years monitored during our study atthe USGS gauge at 430 m, and 160 mm for the 3 yearsof our study at the NWS gauge at 1204 m, a differ-ence of roughly 0Ð075 mm m�1 month�1 or 0Ð899 mmm�1 year�1. These trends vary slightly on a year-to-yearbasis with precipitation increasing 0Ð804 mm m�1 year�1
in WY2002 and 0Ð9815 mm m�1 year�1 in WY2003(Table II). Winter precipitation recorded at the NWS sta-tion between 1, December and 30, April the period whensnowfall typically occurs, totaled 46% of annual pre-cipitation at this station in WY01 and 36% of annualprecipitation in WY02 and WY03
Our distributed precipitation measurements show sim-ilar trends in increasing precipitation with elevationand suggest some differences between basins in win-ter precipitation patterns. Rainfall increased 0Ð0024 mmm�1 day�1 (0Ð876 mm m�1 year�1) for a 30-day periodin fall, 2002 and 0Ð0018 mm m�1 day�1 (0Ð675 mmm�1 year�1) for a 4-month period in summer/fall of2003 (Figure 4). During these two monitoring periods,no differences between basins were apparent in the rain-fall depths. In contrast, snowpack measurements record-ing 4Ð5 months of snow accumulation in the winterof 2003–2004 indicate significant differences betweenbasins in the relationship between precipitation and
Published in 2007 John Wiley & Sons, Ltd. 1644 Hydrol. Process. 21, 1639–1650 (2007)DOI: 10.1002/hyp
SCIENTIFIC BRIEFING
WY 2002
0
50
100
150
200
250
300
350
Oct Nov Dec Jan Feb Mar Apr May June July Aug Sept
prec
ipita
tion
(mm
)
USGS (430 m)
NWS (1204 m)
WY 2001
0
50
100
150
200
250
300
Oct Nov Dec Jan Feb Mar Apr May June July Aug Sept
prec
ipita
tion
(mm
)
WY 2003
0
50
100
150
200
250
Oct Nov Dec Jan Feb Mar Apr May June July Aug Sept
prec
ipita
tion
(mm
)
Figure 3. Monthly precipitation totals measured at the USGS and NWSprecipitation gauges for water years 2001–2003. Note, precipitation was
not measured at the USGS gauge in WY 2001
elevation, although the magnitude of these lapse rates isprobably overestimated, since they were made after somemelt had occurred at lower elevations (Figure 5).
Areally averaged estimates of annual precipitation overthe three-year study period ranged from 1368–1653 mmin West Branch and from 1318–1613 mm in RanchBrook (Table III). The slightly higher estimates at WestBranch are due to its higher elevation distribution(Figure 2). Artificial snowmaking represents a small frac-tion of the annual water balance at only 3–4% of thenatural precipitation in this basin (Table III).
Runoff for the 3-year period ranged from 1132 to1416 mm in West Branch and from 872 to 1173 mmin Ranch Brook (Table III). The difference in annualrunoff between the basins ranged from 174 to 318 mmand was most pronounced in WY 2001 when water yieldfrom West Branch was 36% greater than from RanchBrook. In WY 2002 and WY 2003, water yield fromWest Branch was roughly 20% greater than from RanchBrook. Snowmelt is an important component of annualrunoff, representing roughly 50% of total annual runoffin each basin for all three water years.
The difference between precipitation (P) and runoff(Q) differed considerably for the two basins(Table III). P–Q averaged 444 mm in Ranch Brook
y = 0.0024x + 2.6778R2 = 0.522
1
2
3
4
5
6
7
8
300 500 700 900 1100 1300
elevation (m)
prec
ipita
tion
rate
(m
m/d
ay)
Ranch
Spruce
Gondola
USGS
NWS
(b)
(a)
y = 0.0018x + 2.1221R2 = 0.800
1
2
3
4
5
6
7
8
300 500 700 900 1100 1300
elevation (m)
prec
ipita
tion
rate
(m
m/d
ay)
Ranch
Spruce
Gondola
USGS
NWS
Figure 4. Measurements and trend lines from distributed precipitationmonitoring (a) 18 September–17 October 2002 and (b) 16 June–14
October 2003. See Figure 1 for locations of rain gauges
y = 0.0548x - 17.32
R2 = 0.7578
y = 0.0772x - 21.357
R2 = 0.678
0
10
20
30
40
50
60
70
80
300 500 700 900 1100 1300
elevation (meters)
SW
E (
cm)
West Branch Ranch Brook
USGS precipitation gauge
Figure 5. Snow water equivalent (cm) as a function of elevation for snowcores sampled on 4 April 2004 and trend lines for West Branch and RanchBrook measurements. Slopes of the trend lines are significantly different(p < 0Ð05). Note that winter precipitation measured by the heated tippingbucket at West Branch gauge exceeded SWE at this elevation on 4 April
2004, indicating prior snowmelt or rain-on-snow at lower elevations
Published in 2007 John Wiley & Sons, Ltd. 1645 Hydrol. Process. 21, 1639–1650 (2007)DOI: 10.1002/hyp

B. WEMPLE ET AL.
and 244 mm in West Branch, a difference of 200 mm/year, but year-to-year differences in P–Q between thetwo basins varied considerably, ranging from 273 mm inWY01 to only 124 mm in WY03.
Suspended sediment
Suspended sediment concentrations during springsnowmelt and summer/fall storms displayed seasonal andinter-basin differences (Figure 6). Sediment concentra-tions remained relatively low in both watersheds duringthe spring snowmelt period and were relatively insensi-tive to changes in discharge, a result that is likely due tothe ground surface protection provided by snow cover.During storms in summer and fall, sediment concentra-tions increased in both watersheds on the rising limbof storm hydrographs, peaking in advance of the runoffpeak, a pattern common in streams with limited sedi-ment supply. Despite this common pattern during rainfallevents, sediment concentrations were consistently higherin West Branch than in Ranch Brook throughout the 3-year study period (Figure 7). During the summer of 2003,after construction began in West Branch, sediment con-centrations reached higher levels than noted in the previ-ous 2 years. Estimated suspended sediment yields aver-aged 163 kg/ha/year in West Branch and 61 kg/ha/yearin Ranch Brook over the 3-year study period (Figure 8).Uncertainty in these estimates is great, however, owing tothe wide variation in sediment concentrations over sam-pled discharges and the marginal explanatory power ofthe regression model used to relate sediment concentra-tion to discharge (Figure 8; Table IV).
Major solute chemistry
In both basins, all major solutes except nitrate var-ied inversely with stream discharge. Nitrate generallyincreased with increasing flow. Solute concentrationswere more strongly linked to stream discharge at WestBranch than at Ranch Brook, as evidenced by the gener-ally higher percent variance explained by the regressionmodels (Table IV). Where significant, regression mod-els explained roughly 60–70% of the variance in solute
concentrations, and thus provided an excellent basis forthe solute flux calculations. The regression models weredominated by the discharge term, but also contained aseasonal component that generally accounted for about10% of the variance. For Na and Cl, highly significantmodels were developed for West Branch while none waspossible for Ranch Brook. Neither basin yielded a signif-icant model for K (Table IV).
Input fluxes in precipitation, as estimated from theOllinger et al. (1993) regional model, were similar for thetwo basins. The model estimates average annual soluteconcentrations in precipitation based on latitude andlongitude, and assumes concentration does not vary withelevation. West Branch thus had slightly higher inputs ofall solutes because of its higher precipitation. Inputs weregenerally small relative to streamwater outputs, exceptfor sulfate and nitrate, for which inputs and outputs weresimilar in magnitude (Figure 8).
Output fluxes in streamwater were higher for all solutesin all three water years at West Branch compared toRanch Brook, by factors generally ranging from 1Ð2to 2Ð5 (Figure 8). However, fluxes of Na and Ca wereabout an order of magnitude greater at West Branch asa result of deicing salt applications in the West Branchbasin. Despite the seasonal (winter) application of deicingsalts, elevated Cl concentrations persisted throughout theyear in West Branch stream water (Figure 6). The excesssolute flux at West Branch relative to Ranch Brook wasmore than could be explained by the greater water fluxat West Branch, except for Si, where the differential wasabout equal to that of water. Uncertainty in the estimatesof annual solute yields was greatest for Na and Cl inWest Branch and quite small for all other solutes in bothwatersheds (Figure 8).
Discussion
Hydrological and chemical patterns in the control water-shed correspond well to observations from other studiesin the northeastern US, indicating that these basins rep-resent an excellent setting for the study of high-elevation
0.0
1.0
2.0
3.0
4.0
9/10/02 9/14/02 9/18/02 9/22/02 9/26/02 9/30/020
50
100
150
200
250
300
350
400
chlo
ride
(um
ol/L
), S
SC
(m
g/L)
0.0
1.0
2.0
3.0
4.0
04/09/02 04/13/02 04/17/02 04/21/02
runo
ff (m
m/h
r)
0
50
100
150
200
250
300
350
400
Figure 6. Hydrographs (lines) and concentrations of suspended sediment (boxes) and chloride (crosses) in the Ranch Brook (grey lines and symbols)and West Branch (black lines and symbols) basins during spring snowmelt and summer storms in 2003
Published in 2007 John Wiley & Sons, Ltd. 1646 Hydrol. Process. 21, 1639–1650 (2007)DOI: 10.1002/hyp

SCIENTIFIC BRIEFING
WY 2001 WY 2002 WY 2003
0
50
100
150
200
250
SS
C (
mg/
L) -
Mea
n +
- 2
SE
0
50
100
150
200
250
0
50
100
150
200
250
n = 69 n = 53
n = 81
n = 66
n = 25n = 92
n = 46
n = 67
n = 38 n = 77 n = 46
n = 86
West BranchRanch Brook Ranch Brook West Branch Ranch Brook West Branch
Figure 7. Mean (š2 standard errors) concentration of suspended sediment for samples collected during spring snowmelt (grey bars) and summer/fallstorms (black bars) for water years 2001–2003. Note, samples are not collected between late November and early March when streams are frozen
development for generalization to the region. Precipita-tion lapse rates noted here agree closely with those doc-umented by Dingman (1981) and Ollinger et al. (1995)for the region. The difference between precipitation andrunoff (P–Q) in Ranch Brook falls within the rangenoted by Dingman (1981) for other New England water-sheds, and the average value of P–Q in Ranch Brook,444 mm/year, is comparable to estimates of evapotranspi-ration at the Hubbard Brook Experimental Forest in NewHampshire (Likens and Bormann, 1995). Annual wateryield in Ranch Brook is at the upper range of observedvalues in the eastern US (Sopper and Lull, 1965) but notbeyond what might be expected for basins at this eleva-tion (Dingman, 1981). The fluxes of all solutes in RanchBrook are comparable to those reported at Hubbard Brook(Likens and Bormann, 1995). These findings suggest thatthese basins are generally representative of base-poorsites in the northeastern US and that results noted heremay be extended to similar environments throughout theregion.
Solute fluxes in stream water (Figure 8) generallyreflect the regionally elevated levels of nitrate andsulfate in atmospheric deposition and the fairly lowbase cation fluxes expected from low weathering ratesof the unreactive gneiss bedrock, highlighting certainregional behaviours. Streamwater outputs of cations atRanch Brook were about an order of magnitude greaterthan precipitation inputs, except only a 3- to 4-foldincrease for Na. Nitrate export is somewhat less than thetotal estimated N deposition (wet plus dry), suggestingsome watershed retention of nitrogen, although dissolvedorganic nitrogen is an additional output that was notmeasured. Some N retention would be expected inan aging second growth forest (Aber et al., 1998).The somewhat greater nitrate fluxes at West Branchcould potentially be a result of nitrate loading fromseptage or other anthropogenic sources, and/or from netmineralization due to land disturbance on the mountain.Sulfate export is in approximate balance with estimated Sinputs at Ranch Brook, as is typical for northeastern USAwatersheds (Rochelle et al., 1987; Likens and Bormann,1995). The greater export of sulfate at West Branch ismost likely caused by the weathering of sulfides in the
Hazens Notch Formation which underlies most of thatbasin.
Some patterns in water quality dynamics noted hereare consistent with differences in land use in the twobasins and suggest some detectable water quality effectsof the existing ski area. Annual sediment yield in thedeveloped basin exceeded that in the control basin by afactor greater than 2Ð5, and output fluxes of all solutes inthe developed basin exceeded those in the control basin,owing either to greater water fluxes or contamination ofstreamwater by deicing salts. Higher concentrations ofsuspended sediment and chloride at West Branch reflectthe contributions of road surfaces and parking lots thatreceive high traffic levels and are located close to streams.The contribution of suspended sediment from developedsurfaces was evidenced by marked increases in suspendedsediment concentrations in water samples collected afterground breaking on new development in the summerof 2003. Na and Cl fluxes were an order of magnitudegreater at West Branch from deicing salts, but the molarNa/Cl ratio at West Branch was less than 1Ð0, indicatingthat some of the added Na exchanged for Ca and Mgon soil exchange sites (Shanley, 1994). This mechanismmay explain the differentially greater export of Ca andMg at West Branch relative to Si and K. The greater fluxof the latter two solutes is in proportion to the greaterwater flux.
Differences in annual water yield between the twobasins ranged from 18 to 36% and were greater than weexpected based on regional studies of forest treatmenteffects on water yield (Hornbeck et al., 1993). Threepossible explanations exist for the greater-than-expecteddifferences in runoff in West Branch relative to RanchBrook: (1) less groundwater loss or extra-basin ground-water inputs; (2) greater precipitation capture; or (3) lessevapotranspiration and lower recharge due to forestremoval and runoff over impervious surfaces. Dingman(1981) speculated that groundwater loss may be commonin high-elevation watersheds, based on a regional waterbalance analysis. It seems unlikely that groundwaterlosses at Ranch Brook explain differences in water yield,since water yield at this site is already at the upper mar-gin of annual runoff in the region at this elevation. It is
Published in 2007 John Wiley & Sons, Ltd. 1647 Hydrol. Process. 21, 1639–1650 (2007)DOI: 10.1002/hyp

B. WEMPLE ET AL.
0
20
40
60
WY01 WY02 WY03
Ca
(kg/
ha)
0
2
4
6
8
10
WY01 WY02 WY03
K (
kg/h
a)
0
2
4
6
8
10
WY01 WY02 WY03
NO
3-N
(kg
/ha)
0
40
80
120
WY01 WY02 WY03
Cl (
kg/h
a)
0
20
40
60
80
WY01 WY02 WY03
Na
(kg/
ha)
0
2
4
6
8
10
12
WY01 WY02 WY03
Mg
(kg/
ha)
0
5
10
15
20
WY01 WY02 WY03
Si (
kg/h
a)
0
10
20
30
WY01 WY02 WY03
SO
4-S
(kg
/ha)
0
100
200
300
WY01 WY02 WY03
SS
C (
kg/h
a)
Figure 8. Annual estimated precipitation inputs (dotted bars) and calculated streamwater outputs for Ranch Brook (white bars) and West Branch (greybars) for solutes and suspended sediment. Wet and dry deposition inputs are estimated as described in Ollinger et al. (1993). For nitrate and sulfateinputs, wet (heavy dots) and dry (light dots) depositions are shown. Inputs were computed separately for each basin but are presented in a single barrepresenting basin averages because differences were relatively minor. Error bars on streamwater outputs are uncertainty ranges for annual estimates
based on 95% confidence intervals of hourly concentration predictions from regression models (see text for explanation)
possible, though, that West Branch captures groundwaterfrom outside the surface watershed boundaries. Recentfield studies indicate that streamflow in West Branchhas a chemical signature that more closely matches deepgroundwater than in Ranch Brook (Zinni, 2006), but wedo not have sufficient data to determine whether any ofthis water originates from outside the basin. Another pos-sible explanation for the differential water yield is error inour precipitation estimates. Our estimate of basin-averageprecipitation does not incorporate the known influences of
other factors including slope, aspect, radiation, wind andvegetation (Wooldridge et al., 1996; Elder et al., 1998,Winstral et al., 2002) since we lack these data at ourstudy sites, and does not incorporate more sophisticatedestimation approaches (Dingman et al., 1988; Daly et al.,1994; Erxleben et al., 2002) that have been applied atsites with denser networks of meteorological stations andmeasured variables. We cannot quantify the uncertainty inour precipitation estimates and we have not incorporatedseasonal differences in precipitation variability. The snow
Published in 2007 John Wiley & Sons, Ltd. 1648 Hydrol. Process. 21, 1639–1650 (2007)DOI: 10.1002/hyp
SCIENTIFIC BRIEFING
survey data for 2004 indicate that snow water equivalentwas significantly greater in West Branch than in RanchBrook (Figure 5). The higher water yield from the WestBranch watershed may be due, in part, to greater precip-itation input to this basin. This seems a likely scenariobut one that requires expanded precipitation monitoringto verify. Finally, the spatial configuration of clearingand development in West Branch may enhance differ-ences in water yield relative to Ranch Brook. Hornbecket al. (1993) note that optimal configuration of clearings,particularly when clearings are made in large blocks nearthe watershed outlet, appears to have the effect of enhanc-ing water yield for a given area cut. At West Branch, theconfiguration of clearings, including trails that are ori-ented along slope gradients and impervious areas situatednear the watershed outlet, probably interact to efficientlyconvert precipitation to runoff.
This study lacks the control of a traditional paired-watershed study, in that there was no pre-developmentmonitoring period; hence we cannot, with confidence,attribute all differences noted here to existing forestclearing and ski resort development. Differences in basinhypsometry, precipitation capture or groundwater fluxesmay explain some of the difference in water yield.Elevated yield of sulfate in West Branch can be attributedto pyrite in the bedrock within this basin. Other subtledifferences in watershed conditions can be expected, asreflected in regional comparisons of forested watersheds(Sopper and Lull, 1965). We can, however, see cleardifferences in some aspects of water quality that areconsistent with the current land use conditions in the WestBranch basin.
The results of this study are important in at least threerespects. First, there exist few high-elevation hydrologicobservatories for studying watershed processes in north-eastern US, despite the recognised importance of eleva-tion in determining hydrologic behaviour in the region(Dingman, 1981). In fact, previous analyses in the regionnoted that only four long-term stream gauging stationslocated at mean basin elevations at or above 700 metersexist in Vermont and New Hampshire (Dingman, 1981;Olson, 2002). This study provides an important baselinedataset for high-elevation hydrologic processes. Second,there is little scientific literature specifically addressingthe effects of recreational or resort development in moun-tain settings, particularly in eastern North America. Ourresults provide insight into how alpine ski resort devel-opment affects hydrology and water quality and couldbe used as a basis for understanding the effects of sub-urban development in the mountain landscape, a trendthat is increasingly common in this and other regions(Stein et al., 2005). Finally, models and analytical meth-ods applied to evaluating development effects are oftenunsuitable for the mountain setting in that they lack algo-rithms to treat snow pack accumulation and ablation,obscure a range of hydrologic processes through empir-ical approaches to rainfall/runoff relationships, and arelargely unvalidated against observed conditions (due tothe lack of a high-elevation monitoring network). This
study provides a baseline dataset for model developmentand validation for future research and management deci-sion making in high-elevation landscapes.
AcknowledgementsThis research was funded by grants from the VermontMonitoring Cooperative, the Vermont EPA-EPSCoR pro-gram and the Vermont Water Resources and Lake Stud-ies Centre (through the USGS Water Resource Instituteprogram). We gratefully acknowledge the assistance ofR. Apple, J. Cueto, S. Lawson, K. Musselman and S.Wilmot, and the cooperation of the Vermont Depart-ment of Forests, Parks and Recreation (Agency of Nat-ural Resources) and Stowe Mountain Resort for provid-ing access to research sites. K. Gardner, J. Risely, L.Dingman and two anonymous reviewers provided helpfulcomments on earlier drafts of the manuscript.
References
Aber JD, McDowell WH, Nadelhoffer KJ, Magill A, Berntson G,Kamakea M, McNulty SG, Currie W, Rustad L, Fernandez I. 1998.Nitrogen saturation in temperate forest ecosystems: hypotheses revisited.BioScience 48: 921–934.
Allen GW. 1989. Soil Survey of Chittenden County, Vermont . UnitedStates Department of Agriculture, Soil Conservation Service. Washington,DC, USA; 149.
Aulenbach BT, Hooper RP. 2006. The composite method: an improvedmethod for stream-water solute load estimation. Hydrological Processes20: 3029–3047. DOI 10Ð1002/hyp.6147.
Babcock RD. 1981. Soil Survey of Lamoille County, Vermont . UnitedStates Department of Agriculture, Soil Conservation Service. Washington,DC, USA; 152.
Chase JE. 1984. The physical characteristics and meltwater output froma snow cover compacted by ski-area operations . MS thesis, University ofNew Hampshire, Durham, NH, USA.
Christman RA. 1959. Geology of the Mount Mansfield Quadrangle Ver-mont . Vermont Geological Survey, Vermont Development Commission:Montpelier, VT, Bulletin No. 12.
Coakley MF, Ward SL, Hilgendorf GS, Kiah RG. 2002. Water resourcesdata, New Hampshire and Vermont, Water Year 2001 , Open File ReportNH-VT-01-1. U. S. Geological Survey: Washington, DC, USA.
Daly C, Neilson RP, Phillips DL. 1994. A statistical-topographic modelfor mapping climatological precipitation over mountainous terrain. Jour-nal of Applied Meteorology 33: 140–158.
Dingman SL. 1981. Elevation: a major influence on the hydrology ofNew Hampshire and Vermont, USA. Hydrological Sciences Bulletin 26:399–413.
Dingman SL, Seely-Reynolds D, Reynolds RC III. 1988. Applicationof kriging to estimation of mean annual precipitation in a region oforographic influence. Water Resources Bulletin 24(2): 329–339.
Eisel LM, Mills KD, Leaf CF. 1988. Estimated consumptive loss fromman-made snow. Water Resources Bulletin 24(4): 815–820.
Eisel LM, Bradley KM, Leaf CF. 1990. Estimated runoff from man-madesnow. Water Resources Bulletin 26(3): 519–526.
Elder K, Rosenthal W, Davis RE. 1998. Estimating the spatial distribu-tion of snow water equivalence in a montane watershed. HydrologicalProcesses 12: 1793–1808.
Erxleben J, Elder K, Davis R. 2002. Comparison of spatial interpolationmethods for estimating snow distribution in the Colorado Rocky Moun-tains. Hydrological Processes 16: 3627–3649.
Gosz JR. 1977. Effects of ski area development and use on streamwater quality of the Santa Fe Basin, New Mexico. Forest Science 23(2):167–179.
Published in 2007 John Wiley & Sons, Ltd. 1649 Hydrol. Process. 21, 1639–1650 (2007)DOI: 10.1002/hyp

B. WEMPLE ET AL.
Grady TR. 1982. The effects of snow compaction on water release andsediment yield . MS thesis, Montana State University Bozeman, MT, USA.
Harper SC, Falk LL, Rankin EW. 1990. The Northern Forest Lands Studyof New England and New York . U.S. Department of Agriculture, ForestService: Rutland, VT.
Hornbeck J, Stuart G. 1976. When ski trails are cut through forest land,what happens to streamflow? Ski Area Management 15(4): 34–36, 47.
Hornbeck JW, Adams MB, Corbett ES, Verry ES, Lunch JA. 1993.Long-term impacts of forest treatments on water yield: a summary fornortheastern USA. Journal of Hydrology 150: 323–344.
Johnson NM, Likens GE, Bormann FH, Fisher DW, Pierce RS. 1969. Aworking model for the variation in stream water chemistry at the HubbardBrook Experimental Forest, New Hampshire. Water Resources Research5(6): 1353–1363.
Kattelmann R. 1985. Snow management at ski areas: hydrologic effects.In Watershed Management in the Eighties , Jones EB, Ward TJ (eds). Pro-ceedings of the Watershed management Symposium, American Societyof Civil Engineers: Denver, CO, New York.
Likens G, Bormann FH. 1995. Biogeochemistry of a Forested Ecosystem ,2nd edn. Springer-Verlag: New York.
Molles MC, Gosz JR. 1980. Effects of a ski area on the water qualityand invertebrates of a mountain stream. Water Air and Soil Pollution 14:187–205.
Moore DI, Gosz JR, White CS. 1978. Impact of a ski basin on a mountainwatershed. II. Heavy metals. Water Air and Soil Pollution 10: 81–93.
Ollinger SV, Aber JD, Federer CA, Lovett GM, Ellis JM. 1995. Model-ing physical and chemical climate of the northeastern United States fora geographic information system, General Technical Report NE-191.USDA Forest Service: Radnor, PA, USA; 30.
Ollinger SV, Aber JD, Lovett GM, Millham SE, Lathrop RG, Ellis JM.1993. A spatial model for atmospheric deposition for the NortheasternU.S. Ecological Applications 3(3): 459–472.
Olson SA. 2002. Flow-frequency characteristics of Vermont streams ,Water Resources Investigations Report 02-4238. U.S. Geological Survey:Pembroke, NH, USA.
Price MF, Messerli B. 2002. Fostering sustainable mountain develop-ment: From Rio to the international Year of Mountains, and beyond.Unasylva 53(208): 6–17.
Rochelle BP, Church MR, David MB. 1987. Sulfur retention at inten-sively studies sites in the U.S. and Canada. Water Air and Soil Pollution33: 73–83.
Shanley JB. 1994. Effects of ion exchange on stream solute fluxes ina basin receiving deicing salts. Journal of Environmental Quality 23:977–986.
Shanley JB, Wemple BC. 2002. Water quantity and quality in themountain environment. In Mountain Resorts: Ecology and the LawSpecial Issue of the Vermont Law Review , Vol. 26(3), Milne J, Miller E(eds). Vermont Law School: So Royalton, VT, USA; 717–751.
Sopper WE, Lull HW. 1965. The representativeness of small forestedexperimental watersheds in northeastern United States. InternationalAssociation of Hydrological Sciences 66(2): 441–456.
Stein SM, McRoberts RE, Alig RJ, Nelson MD, Theobold DM, Eley M,Dechter M, Carr M. 2005. Forests on the edge: housing development onAmerica’s private forests , General Technical Report PNW-636. USDAForest Service: Portland, OR, USA; 15.
Thomas RB. 1985. Measuring suspended sediment in small mountainstreams , General Technical Report PSW-83. USDA Forest Service:Berkeley, OR, USA; 9.
Thompson P, Thompson TB. 1998. Bedrock geology of the Mt. MansfieldQuadrangle, VGS Open File Report VG99-3B, Vermont GeologicalSurvey, Department of Environmental Conservation, Vermont Agencyof Natural Resources, Waterbury, VT, USA.
Todd A, McKnight D, Wyatt L. 2003. Abandoned mines, mountainsports, and climate variability: implications for the Colorado tourismeconomy. EOS Transactions of the American Geophysical Union 84(38):377, 386.
White CS, Gosz JR, Moore DI. 1978. Impact of a ski basin on a mountainwatershed. I. Bacteriological water quality. Water Air and Soil Pollution10: 71–79.
Williams MW. 2002. United Nations international year of the mountains:editorial. Arctic Antarctic and Alpine Research 34(1): 1–2.
Winstral A, Elder K, Davis RE. 2002. Spatial snow modeling of wind-redistributed snow using terrain-based parameters. Journal of Hydrome-teorology 3: 524–538.
Wooldridge GL, Musselman RC, Sommerfeld RA, Fox DG, Connell BH.1996. Mean wind patterns and snow depths in an alpine-subalpine ecosys-tem as measured by damage to coniferous trees. Journal of AppliedEcology 33(1): 100–108.
Zinni B. 2006. New applications of traditional end member mixingmethods: stream water generation and the effects of ski resort expansionon Mt. Mansfield , MS thesis, University of Vermont Department ofGeology, Vermont; 151.
Published in 2007 John Wiley & Sons, Ltd. 1650 Hydrol. Process. 21, 1639–1650 (2007)DOI: 10.1002/hyp