Hydrogeologic Model for the Gable Gap Area, Hanford Site
115
PNNL-19702 Prepared for the U.S. Department of Energy under Contract DE-AC05-76RL01830 Hydrogeologic Model for the Gable Gap Area, Hanford Site BN Bjornstad GS Thomas PD Thorne MD Thompson BA Williams JL Ludwig GV Last DC Lanigan September 2010
-
Upload
independent -
Category
Documents
-
view
3 -
download
0
Transcript of Hydrogeologic Model for the Gable Gap Area, Hanford Site

PNNL-19702
Prepared for the U.S. Department of Energy under Contract DE-AC05-76RL01830
Hydrogeologic Model for the Gable Gap Area, Hanford Site BN Bjornstad GS Thomas PD Thorne MD Thompson BA Williams JL Ludwig GV Last DC Lanigan September 2010


PNNL-19702
Hydrogeologic Model for the Gable Gap Area, Hanford Site BN Bjornstad PD Thorne BA Williams1 GV Last GS Thomas1 MD Thompson2 JL Ludwig3
DC Lanigan
1CH2M HILL Plateau Remediation Company 2MDT Associates 3Intera Inc. September 2010 Prepared for the U.S. Department of Energy under Contract DE-AC05-76RL01830 Pacific Northwest National Laboratory Richland, Washington 99352

iii
Executive Summary
Gable Gap is a structural and topographic depression between Gable Mountain and Gable Butte within the central Hanford Site. It has a long and complex geologic history, which includes tectonic uplift synchronous with erosional downcutting associated with the ancestral Columbia River during both Ringold and Cold Creek time intervals, and by the later Ice Age (mostly glacial Lake Missoula) floods. The gap was subsequently partially backfilled by mostly coarse-grained, Ice Age flood deposits (Hanford formation). Erosional remnants of both the Ringold Formation and Cold Creek unit locally underlie the high-energy flood deposits. A large window exists in the gap where confined basalt aquifers are in contact with the unconfined suprabasalt aquifer.
Multiple paleochannels, of both Hanford and Ringold formation age, were eroded into the deformed basalt bedrock across Gable Gap. Groundwater from the Central Plateau presently moves through Gable Gap via one or more of these paleochannels. As groundwater levels continue to decline in the region, most groundwater flow may eventually be diverted from flowing through Gable Gap. However, the base of the aquifer is poorly constrained in the area of the basalt divide; other unidentified buried channels may exist across the divide that could provide flow paths across Gable Gap for an indefinitely longer period.
An updated hydrogeologic conceptual model of the Gable Gap area is presented in this report. This model is based on analysis of the old and new geologic, hydrologic, and groundwater chemistry data needed to understand groundwater and contaminant movement through the Gap. Because of the sparse and uneven distribution of boreholes in portions of Gable Gap, uncertainties in the model still exist. Therefore, the model presented herein is subject to refinement with the inclusion of more data in the future.

v
Acknowledgments
We appreciate the support of CH2M HILL Plateau Remediation Company and members of the Central Plateau Hydrogeology Working Group, including Pat Cabbage and Steve Airhart of Freestone Environmental Services, and Steve Miller. We also appreciate the helpful reviews of Virginia Rohay, John McDonald, Frank Spane, and Mickie Chamness. Lastly, we thank Steve Reidel and Karl Fecht for sharing their extensive knowledge on the structure and top of basalt within Gable Gap.

vii
Acronyms and Abbreviations
BP-5 BP-5 Groundwater Operable Unit
BWIP Basalt Waste Isolation Project
CCU Cold Creek unit
CCUc Cold Creek unit - caliche
CCUg Cold Creek unit - gravel-dominated
CCUz Cold Creek unit - silt-dominated
CRBG Columbia River Basalt Group
H1 Hanford formation unit 1
H2 Hanford formation unit 2
H3 Hanford formation unit 3
HEIS Hanford Environmental Information System
YFB Yakima Fold Belt

ix
Contents
Executive Summary .............................................................................................................................. iii
Acknowledgments ................................................................................................................................. v
Acronyms and Abbreviations ............................................................................................................... vii
1.0 Introduction and Background ....................................................................................................... 1.1
2.0 Methods ........................................................................................................................................ 2.1
2.1 Borehole Data Used to Differentiate Lithologic/Stratigraphic Units ..................................... 2.1
2.2 Quality Ranking of Boreholes .............................................................................................. 2.7
2.3 Development of Conceptual Hydrogeologic Model ............................................................ 2.8
2.4 Integration of Geophysics Data ............................................................................................ 2.8
3.0 Regional Geologic Setting ............................................................................................................ 3.1
3.1 Columbia River Basalt Group and Ellensburg Formation ................................................... 3.2
3.2 Suprabasalt Sediments .......................................................................................................... 3.3
3.2.1 Ringold Formation .................................................................................................... 3.3
3.2.2 Cold Creek Unit ........................................................................................................ 3.3
3.2.3 Hanford Formation .................................................................................................... 3.4
4.0 Stratigraphy and Lithology of Gable Gap .................................................................................... 4.1
4.1 Columbia River Basalt Group and Interbedded Sediments of the Ellensburg Formation ............................................................................................................................. 4.3
4.2 Suprabasalt Sediments .......................................................................................................... 4.6
4.2.1 Ringold Formation .................................................................................................... 4.6
4.2.2 Cold Creek Unit ........................................................................................................ 4.7
4.2.3 Hanford Formation .................................................................................................... 4.14
4.2.4 Holocene Deposits ..................................................................................................... 4.17
4.2.5 Clastic Dikes ............................................................................................................. 4.18
5.0 Structure ....................................................................................................................................... 5.1
6.0 Geomorphology ............................................................................................................................ 6.1
6.1 Late-Pleistocene Flood Channels and Bars .......................................................................... 6.1
6.2 Buried Paleochannels ........................................................................................................... 6.3
7.0 Hydrology ..................................................................................................................................... 7.1
8.0 Conclusions .................................................................................................................................. 8.1
9.0 References .................................................................................................................................... 9.1
Appendix A – Hydrogeologic Cross Sections ...................................................................................... A.1
Appendix B – Structure-Contour Maps Based on EarthVision® Model .............................................. B.1
Appendix C – Isopach Maps Based on EarthVision® Model .............................................................. C.1
Appendix D – Three-dimensional EarthVision® Model ...................................................................... D.1
Appendix E – Borehole Information and Tops of Stratigraphic Unit Contacts ................................... E.1

x
Figures
1.1 Shaded-relief map of the Gable Gap study area. ......................................................................... 1.1
2.1 Borehole index map. ................................................................................................................... 2.1
2.2 Example summary log for Gable Gap well 699-48-50B illustrating the various parameters used to distinguish among stratigraphic units. ............................................................................ 2.6
2.3 Quality ranking comparison of ~150 boreholes in the Gable Gap study area............................. 2.7
2.4 Locations of five hydrogeologic cross sections within the study area ........................................ 2.9
2.5 Latest top of basalt interpretation based on borehole and seismic-reflection-survey data in the Gable Gap area. ..................................................................................................................... 2.10
3.1 Regional stratigraphy for the Pasco Basin and Hanford Site. Modified after DOE/RL (2010). ......................................................................................................................................... 3.1
3.2 Stratigraphic nomenclature for the Columbia River Basalt Group. ............................................ 3.2
3.3 Thickness and distribution of cataclysmic flood deposits (i.e., Hanford formation) within the central Pasco Basin ............................................................................................................... 3.5
4.1 Hanford Site stratigraphy. ........................................................................................................... 4.2
4.2 Stratigraphy in the vicinity of Gable Gap ................................................................................... 4.4
4.3 Example hydrogeologic cross section (A-A’) for Gable Gap ..................................................... 4.5
4.4 Erosional remnants of the Ringold Formation in Gable Gap well 699-48-50B (C5196). .......... 4.6
4.5 Gravel-dominated facies of the Cold Creek unit (CCUg) from boreholes in the vicinity of Gable Gap. .................................................................................................................................. 4.11
4.6 Cold Creek unit silt. .................................................................................................................... 4.12
4.7 EarthVision® model showing the mound-like form of the Cold Creek silt (CCUz) subunit extending south from Gable Gap ................................................................................................ 4.13
4.8 Example of high-relief, streamlined and scarped hills of silty Palouse Formation located in the eastern Channeled Scabland. ................................................................................................. 4.13
4.9 Hanford formation H2 unit in 200 East Area. ............................................................................. 4.16
4.10 Hanford formation H1 unit from the B-BX-BY Tank Farm, 200 East Area. ............................. 4.17
4.11 Outburst-flood deposits of the Hanford formation exposed along the north wall of the 218-E-12B Burial Ground located along the north flank of the Cold Creek Flood Bar ............. 4.18
5.1 Geologic structures in the vicinity of Gable Gap. ....................................................................... 5.1
5.2 Flood-swept, hogback ridge of western Gable Mountain, looking southeast. ............................ 5.2
6.1 EarthVision® model of the present-day surface topography within the Gable Gap study area .............................................................................................................................................. 6.1
6.2 Surface-geomorphic map of the Gable Gap study area ............................................................... 6.2
6.3 Buried paleochannels within the Gable Gap area ....................................................................... 6.3
6.4 Example of highly irregular topography eroded by Ice Age floods, Lower Grand Coulee, Channeled Scabland. ................................................................................................................... 6.4
7.1 Location of window eroded through the upper flows of Columbia River Basalt Group within Gable Gap ........................................................................................................................ 7.2
7.2 Distribution of stratigraphic units encountered at the 2009 water table. .................................... 7.3

xi
7.3 Aquifer thickness (in meters) map in the vicinity of Gable Gap. ............................................... 7.4
7.4 Selected hydrographs of Gable Gap wells open to the unconfined aquifer (Hanford formation) ................................................................................................................................... 7.6
7.5 Discharge history for the B Pond and the Gable Mountain Pond systems.................................. 7.6
8.1 Late-Cenozoic history and evolution of paleodrainage in the vicinity of Gable Gap ................. 8.2
8.2 Ice Age floods in geologic time. The Ice Age, equivalent to the Pleistocene Epoch, lasted from 2.6 million years ago until about 15,000 years ago. ........................................................... 8.3
8.3 Areas of suspected groundwater flow through Gable Gap from the Central Plateau. ................ 8.5
Tables
2.1 Quality ranking of 160 boreholes, located in Figure 2.1, used in Gable Gap conceptual mode ......................................................................................................................... 2.2
4.1 Characteristics used to distinguish between suprabasalt stratigraphic units within Gable Gap ................................................................................................................................... 4.9

1.1
1.0 Introduction and Background
Gable Gap refers to a topographic and structural saddle that lies between Gable Mountain and Gable Butte (Figure 1.1) in the north-central portion of the U.S. Department of Energy’s Hanford Site. The Gable Gap area lies north of the Central Plateau and is superimposed on the Cold Creek Bar north of the 200 East and 200 West Areas. The Central Plateau is where much of the hazardous and nuclear liquid wastes from the Hanford Site were discharged to the subsurface through various tanks, cribs, and trenches. Groundwater beneath the 200 Areas flows east to southeast; however, some groundwater also appears to flow northwestward through Gable Gap (DOE/RL 2010). This pathway is indicated by groundwater-contaminant plumes (uranium and technetium-99) that extend northwestward from the presumed source in the 200 East Area (Serne et al. 2010). As such, Gable Gap may represent a potential flow path to the Columbia River for some groundwater contaminants on the Hanford Site.
Figure 1.1. Shaded-relief map of the Gable Gap study area.
The purpose of this report is to present the latest hydrogeologic conceptual model for the area based
on a comprehensive analysis of available stratigraphic, structural, geomorphic, and hydrologic information pertinent to understanding the groundwater flow and movement of contaminants within the Gable Gap region. Included are discussions of the stratigraphy and lithology of the various stratigraphic units and how these are used to interpret the geologic history of the central Pasco Basin. This information

1.2
forms the basis for interpreting the complex erosional and tectonic history, as well as the geomorphology and hydrogeology of the Gable Gap area. Data used to support interpretations and conclusions are presented in five appendices:
• Appendix A – Five hydrogeologic cross sections
• Appendix B – EarthVision®-based structure contour maps
• Appendix C – EarthVision®-based isopach maps.
• Appendix D – Three-dimensional EarthVision® Model
• Appendix E - Borehole Information and Tops of Stratigraphic Unit Contacts
Numerous studies describing the hydrogeology of the area create the foundation from which the conceptual model has evolved (e.g., Tallman et al. 1979; DOE 1988; Last et al. 1989; Hoffman et al. 1992; WHC 1992; Lindsey et al. 1992; Lindsey 1995; Williams et al. 2000; Wood et al. 2000; Reidel and Chamness 2007; and Serne et al. 2010). Previous investigations focusing more specifically on Gable Gap include surface geologic mapping (Fecht 1978; Myers et al. 1979), subsurface geophysical investigations (Holmes and Mitchell 1981; Ault 1981, Repasky et al. 2009), and aquifer intercommunication studies between the unconfined aquifer and the Rattlesnake Ridge interbed (Strait and Moore 1982; Graham et al. 1984; Jensen 1987; Spane and Webber 1995). All these previous studies established the foundation for the conceptual hydrogeologic model presented in this report.

2.1
2.0 Methods
The present study included a re-evaluation of borehole data from ~160 boreholes drilled in the vicinity of Gable Gap since 1944 (Figure 2.1, Table 2.1), including a number of new borings drilled over the last few years. Data analyzed include all available drillers’, geologists’, and geophysical logs; archived sediment samples; and photographs, as well as field and laboratory characterization data. Aquifer-test results were also considered (Thorne et al. 2006) and in some cases were used in identifying the geologic formation exposed along the open intervals of monitoring wells. In addition, surface geophysical surveys were integrated to better define the surface of the top of basalt between boreholes. The uppermost basalt flow encountered in boreholes was interpreted based on chemical signatures for the different basalt flows using X-ray fluorescence reported in Graham et al. (1984) and Reidel and Fecht (unpublished data).
Figure 2.1. Borehole index map. Located are most of the ~160 boreholes used to construct the
conceptual hydrogeologic model for the Gable Gap study area.
2.1 Borehole Data Used to Differentiate Lithologic/Stratigraphic Units
Common types of borehole data available to discriminate between lithologic and stratigraphic units include geologists’ descriptions, drillers’ descriptions, as-built diagrams, grain-size analyses, geophysical logs (i.e., natural gamma, spectral gamma, and/or neutron-moisture), sediment photographs, as well as drilling information (e.g., drill rate, ease of driving casing, open hole, heaving, etc.). These data were used to determine the lithologic and stratigraphic units present in each of the boreholes analyzed in the study area. Most boreholes are lacking in one or more of these datasets; many are lacking in all but one or two.

2.2
Table 2.1. Quality ranking of 160 boreholes, located in Figure 2.1, used in Gable Gap conceptual model.
Well Name Well ID Total Depth
(ft) Completed Data Quality
Ranking^ Well Name Well ID Total Depth
(ft) Completed Data Quality
Ranking^
299-E26-77 C6455 224.8 2008 1 299-E33-205 C5989 270.6 2008 1
299-E26-79 C6826 224.8 2008 1 299-E33-333 B8079 254 1998 2
299-E27-16 A4814 269 1990 3 299-E33-337 C3390 286 2001 2
299-E28-26 A4822 328.5 1987 2 299-E33-338 C3391 275.8 2001 1
299-E28-27 A4823 301.5 1987 3 299-E33-340 C5853 325.7 2008 1
299-E28-28 A4824 296 1990 3 299-E33-341 C5856 237 2008 1
299-E32-2 A4830 289.2 1987 2 299-E33-342 C5857 245.5 2008 1
299-E32-3 A4831 304 1987 2 299-E33-343 C5858 263.8 2008 1
299-E32-4 A4832 311 1987 2 299-E33-345 C6226 263.8 2008 1
299-E32-5 A4833 293.6 1989 2 299-E34-2 A4877 241.5 1987 2
299-E32-6 A4834 278.8 1991 3 299-E34-5 A4880 190.5 1987 2
299-E32-7 A4835 273.8 1991 2 299-E34-7 A4882 205.5 1989 3
299-E32-8 A4836 256.7 1991 2 299-E34-9 A4884 234.5 1991 2
299-E32-9 A4837 254.6 1991 2 299-E34-11 A4876 219.3 1991 2
299-E32-10 A5432 245.8 1992 2 299-E35-1 A4885 193.8 1989 2
299-E33-28 A4852 278.3 1987 3 299-W11-88 C5572 490.2 2008 1
299-E33-29 A4853 290 1987 2 299-W12-1 A4912 314 1956 4
299-E33-30 A4855 280.1 1987 2 699-44-64 A5188 452 1960 3
299-E33-33 A4858 252 1989 2 699-45-42 A5195 195 1948 4
299-E33-34 A4859 240 1990 2 699-45-69C C5574 455 2007 2
299-E33-35 A4860 250 1990 3 699-47-42 A8749 1971 1979 5
299-E33-36 A4861 264 1990 2 699-47-46A A5200 207 1961 3
299-E33-45 C3269 261 2001 1 699-47-50 A5201 295 1980 4
299-E33-46 C3360 264.4 2001 1 699-47-51 A8752 167 1959 4
299-E33-49 C4261 288.8 2004 1 699-47-60 A5202 287 1948 3
299-E33-50 C5195 381 2006 1 699-48-48A A8768 5661 1972 5
699-48-48B A8769 3374 1977 4
699-48-49 A8770 -- -- 5
699-48-50 A5212 197 1990 25
^1= best, 5 = worst.

2.3
Table 2.1. (contd)
Well Name Well ID Total Depth
(ft) Completed Data Quality
Ranking^ Well Name Well ID Total Depth
(ft) Completed Data Quality
Ranking^
699-48-50B C5196 215.2 2006 1 699-52-57 A5237 165.5 1991 2
699-48-71 A5214 305 1956 4 699-53-47A A5239 41.5 1966 4
699-49-55A A5217 149 1961 4 699-53-48A A5241 53 1984 4
699-49-55B A5218 227 1982 4 699-53-48B A5242 44 1984 4
699-49-57A A5219 168 1956 3 699-53-50 A5243 194 1980 3
699-49-57B A5220 230.4 1990 2 699-53-55A A5244 455 1961 4
699-49-71 A9918 30 1993 5 699-53-55B A5245 252 1975 4
699-50-42 A5224 125 1955 3 699-54-42 A5250 210 1948 4
699-50-45 A5225 178 1980 3 699-54-45A A5251 105 1971 3
699-50-48A A8812 1,165 1955/1969 3 699-54-45B A8862 314 1980 4
699-50-48B A5226 250 1980 3 699-54-48 A5252 101 1984 4
699-50-53A A5227 185 1955 3 699-54-49 A8863 62 1984 3
699-50-53B A5228 225 1990 2 699-54-57 A5253 321 1955, 1982 3
699-50-56 C5197 164.1 2006 1 699-55-40 A5255 145 1971 4
699-50-59 C4882 173.2 2005 2 699-55-44 A5256 160 1971 4
699-50-74 C4697 338.8 2005 2 699-55-50A A8865 110 1948 3
699-51-46 A5230 168 1980 4 699-55-50D A8867 100 1956 3
699-51-63 A5231 184.5 1956 3 699-55-55 A5258 312 1990 2
699-52-46A A5234 225 1980 3 699-55-57 A5259 180 1975 3
699-52-46B A8841 44 1980 4 699-55-60A A8868 233 1943 4
699-52-48 A5235 197 1980 3 699-55-60B A8869 288 1944 4
699-52-52 A8842 903 1974 3 699-55-63 A8871 198 1944 4
699-52-54 A5236 168.6 1990 2 699-55-65A A8872 136 1944 4
699-52-55 C5861 183.3 2007 1 699-55-65B A8873 146 1944 4
699-52-55B C5862 292 2008 1 699-55-65C A8874 146 1944 5
699-55-70 A5260 205 1948 3
^1= best, 5 = worst.

2.4
Table 2.1. (contd)
Well Name Well ID Total Depth
(ft) Completed Data Quality
Ranking^ Well Name Well ID Total Depth
(ft) Completed Data Quality
Ranking^
699-56-42A A8885 245 1981 2 699-60-60 A5282 133 1948 4
699-56-42B A8886 250 1981 2 699-61-53 A8932 385 1978 3
699-56-42C A8887 354 1981 2 699-61-55A A8933 249 1976 3
699-56-42D A8888 670 1981 3 699-61-55B A8934 327 1976 5
699-56-42E A8889 700 1981 3 699-61-57 A8935 589 1977 3
699-56-42F A8890 520 1981 3 699-61-62 A5285 188 1972 2
699-56-43 A5264 155 1971 3 699-61-66 A5286 225 1955 3
699-56-51 A8891 105 1984 3 699-62-43B A8940 68 1959 3
699-56-53 A5265 270 1982 3 699-62-53 A8953 456 1977 3
699-57-41A A8896 512 1981 3 699-63-51 A5290 36 1971 3
699-57-41B A8897 461 1981 3 699-63-55 A5291 121 1972 3
699-57-41C A8898 430 1981 3 699-63-58 A5292 133 1972 3
699-57-41E A8900 554 1981 3 699-64-62 A5296 116 1972 3
699-57-41F A8901 608 1981 2 699-65-50 A5300 585 1955 3
699-57-59 A5269 190.5 1980 2 699-65-59A A5301 200 1958 4
699-58-41A A8908 274 1980 2 699-65-59B A8960 200 1976 3
699-58-41B A8909 225 1980 2 699-65-59C A8961 140 1976 3
699-58-41C A8910 130 1980 3 699-65-72 A5302 216 -- 5
699-58-41D A8911 79 1980 2 699-66-64 A5310 118 1972 4
699-58-41E A8912 390 1981 3 699-67-51 A5312 250 1961 4
699-58-41F A8913 600 1981 3 699-69-45 A8967 300 1961 3
699-58-48 A8914 -- -- 5 699-70-68 A5319 149 1954 3
699-59-55 A8918 145 1976 5 699-71-52 A5321 210 1954 3
699-59-58 A5277 117 1972 3 699-72-73 A5323 200 1961 4
699-60-53B A8922 160 1980 5 699-73-61 A5327 150 1962 3
699-60-53C A8923 150 1980 5
699-60-53F A8926 290 1980 5
699-60-57 A5280 155 1972 3
699-60-59 A5281 1561 1986 2
^1= best, 5 = worst.

2.5
Early boreholes drilled prior to 1980 generally have only drillers’ logs and uncalibrated down-hole natural gamma geophysical logs, but were routinely analyzed for grain-size analysis and sometimes calcium-carbonate (CaCO3) content (an indication of soil development). Drillers would collect sediment samples every 5 ft (1.5 m) and record general descriptions of the drill cuttings and other observations onto drilling-summary forms. Most of the archived sediment samples from these early (pre-1980) wells were subsequently analyzed in the laboratory for grain-size distribution and CaCO3 content; these results are maintained in a database located within the Hanford Virtual Library (http://vlprod.rl.gov/vlib/app/index).
The quality of the grain-size distribution data largely depends on the drilling method used. Before the 1990s, most wells were drilled using a cable-tool drill rig. Those intervals drilled with a hard tool tend to produce more fines because of the pulverizing action of the hard-tool bit. An alternative method is the drive-barrel, which preserves much of the original grain-size distribution and is far superior in producing representative geologic samples.
Sample retrieval is sometimes difficult and often does not permit a determination of the exact depth of contacts. The gross-gamma log is useful for more accurately determining contacts and depths of fine-grained layers, especially those a meter or more thick. However, thin clay and/or silt layers often go undetected on gross-gamma logs due to volume averaging. Geophysical logs (e.g., gross-gamma ray), available for most of the boreholes, are useful for identifying some―but not all―stratigraphic contacts. Geophysical logs sometimes show lithologic differences because of differing amounts of natural gamma-ray emitters (most commonly 40K). The proportion of 40K generally increases with decreasing grain size; therefore, clay and silt generally emit more natural-gamma rays.
Another data source useful for the interpretation of the lithology is moisture content either measured directly in the laboratory on geologic samples or remotely via down-hole neutron logs (Figure 2.2). Within the vadose zone, moisture content generally increases along interfaces between materials with highly contrasting grain size. This is particularly true where high-permeability material (gravel and/or sand) overlies lower-permeability material (sand and/or silt). However, moisture may also concentrate along interfaces where a fine-grained unit overlies a coarse sand or gravel and in fine-grained units themselves due to their greater water-retention capacity.
Using neutron-moisture logs, in combination with gross-gamma logs, further aids in the lithologic interpretation. For example, a sudden moderate increase in gamma-ray activity coincident with an increase in moisture may be indicative of a fine-grained bed. An increase in moisture without an increase in the gross-gamma log may signify a sedimentary interface without the presence of a measurable, less-permeable fine-grained layer.
Most recent boreholes drilled after 1980 have overall better data (geologic descriptions recorded by field geologists, and calibrated geophysical logs) but generally lack any quantitative granulometric (grain size) information. Beginning in the mid-1980s samples were no longer routinely analyzed in the laboratory. Therefore, quantitative grain-size distribution and CaCO3 data are not available for most boreholes drilled since the mid-1980s; these parameters are provided, qualitatively, in geologists’ logs.

2.6
Figure 2.2. Example summary log for Gable Gap well 699-48-50B illustrating the various parameters used to distinguish among stratigraphic units.
Prior to the 1980s, many holes were at least partially drilled via the hard-tool (cable tool) method,
which tended to pulverize sediment samples, especially those with high gravel content. Pulverization during drilling has the tendency to skew estimates of grain size and lithology by reducing the size of the coarse (gravel) sedimentary particles and artificially generating more fines. After 1980, there was an increased emphasis on collecting samples via the cable-tooled, core barrel (drive barrel) method, which provided samples that were less fragmented and more lithologically representative of the formation.
Since 2002, a small number of boreholes in the BP-5/Gable Gap area were characterized by collecting nearly continuous, intact sediment core via split-spoon, drive barrel, or direct-push methods. These core samples were described in detail within the laboratory to more accurately evaluate the types and vertical distribution of contaminants within the vadose zone (Brown et al. 2007; Lindenmeier et al. 2002, 2003;

2.7
Serne et al. 2002, 2003, 2010). Much of what researchers know about the intact character of the post-basalt sediments was derived from these recent, more-detailed characterization studies.
2.2 Quality Ranking of Boreholes
Because of the wide range in quality of these data associated with the multitude of wells drilled over the past 60 years, each borehole was first examined for the relative quality of the data. Each borehole was assigned a data-quality rank from 1 to 5, with #1 having the highest confidence and least uncertainty in the geologic interpretation (Table 2.1). Those boreholes ranked #5 (least confidence and highest uncertainty) are associated with boreholes with only a driller’s log available. In contrast, boreholes ranked #1 (highest confidence and least uncertainty) may have geologist’s logs accompanied by gamma and neutron-moisture logs, as well as grain-size, CaCO3, and/or other characterization data.
Boreholes with the highest ranking (#1) include more recently drilled boreholes possessing the most and best quality of data. Ranking is also strongly affected by the drill method, which can alter the original character of the sediments used to distinguish one stratigraphic unit from another. Thus, those boreholes drilled using the open drive-barrel, split-spoon, or direct-push methods generally received a higher ranking than those drilled via the percussion-type, hard-tool method. Data from 36% of the boreholes are considered good quality, while 38% are considered of moderate quality, indicating that overall the data are usable for developing the Gable Gap conceptual model (Figure 2.3).
Figure 2.3. Quality ranking comparison of ~150 boreholes in the Gable Gap study area. 1 = highest quality and 5 = lowest quality. About 75% of the boreholes are considered to be of moderate to good quality. The remaining 25% are older boreholes with limited amounts of useful data for evaluating the hydrogeology of the study area.
Nearby boreholes frequently show conflicts in interpreted lithology and stratigraphy. In some cases,
true differences may exist between the boreholes, but conflicts are often the result of comparing a sparse data set from an older well with a more robust data set from a modern well. The ranking system provides
0
10
20
30
40
50
60
1 2 3 4 5Data Quality Ranking
# Bo
reho
les
Excellent Poor

2.8
a way to resolve conflicts among wells; preference is simply given to the higher-ranking wells. Interpretations are therefore justifiably biased in favor of the wells with the greatest quantity and highest quality of data.
2.3 Development of Conceptual Hydrogeologic Model
Defining contact picks for stratigraphic units (Appendix E) from borehole data is an iterative process. The process of building the model followed a series of investigative steps that were designed to honor the data and give preferential treatment to the higher-ranked boreholes. First, the main stratigraphic units and contacts were identified in boreholes ranked #1 or #2. This was done by comparing available data and picking depths to major lithologic contacts (i.e., units with roughly uniform grain size or geologic character). Elevations and thicknesses of the major stratigraphic contacts were then calculated from the depths. The same procedure was next performed on the lower-ranked boreholes.
The next step in building a geohydrologic model of the subsurface was to construct scaled cross sections linking boreholes together. A total of five cross sections (located in Figure 2.4) are presented in Appendix A (Figures A.2 to A.6).
Subsequently, elevations and thicknesses of these major units were spatially plotted onto structure-contour (Appendix B) and isopach (Appendix C) maps. These maps were used to evaluate if the contacts appear realistic and make sense geologically. If the contacts are chosen correctly, the data should plot as relatively smooth surfaces, transitioning from one borehole to another. Isolated, large, steep-gradient “bull eyes” on contour maps indicate the contact may be miscalculated; in these cases, boreholes would be re-evaluated and contacts adjusted as necessary. Structure contour and isopach maps were replotted and further evaluated to ensure the best possible picks were made for each stratigraphic unit. The final spreadsheet of stratigraphic picks used to construct contour maps for the different units is presented in Appendix E. These data are now managed and maintained in the Hanford Geologic Contacts Database at PNNL, with future accessibility through the Hanford Environmental Information System (HEIS).
Another step in developing the hydrogeologic model is to evaluate groundwater-contaminant plumes from nearby waste-management areas. Contaminants are a type of tracer, which conveniently provide a means to evaluate the rate and direction of groundwater flow. Figure 2.5 shows the distribution of two contaminant plumes (uranium and 99Tc) in the vicinity of Gable Gap. The plumes appear to emanate from waste facilities associated with the B-BX-BY Tank Farms (Serne et al. 2010), and move in a northwesterly direction via at least one paleochannel across a buried divide in the basalt bedrock.
2.4 Integration of Geophysics Data
Where available, surface-geophysical surveys (i.e., seismic-reflection profiles) were also used for interpolating the top of basalt between boreholes (Figure 2.5). These data were especially useful for estimating the top of basalt in hydrogeologic cross sections (Figure 2.3; Appendix A). One long and several shorter seismic-reflection lines collected in the late 1970s as part of the Basalt Waste Isolation Project (BWIP) (Holmes and Mitchell 1981; Ault 1981) were evaluated and reprocessed. These have been augmented with data from eight new shorter lines of seismic-reflection lines, totaling 11 km in length, via the Landstreamer device (Repasky et al. 2009). The uppermost reflector observed along seismic-reflection profiles is often interpreted as the top of basalt, which has significantly higher density

2.9
than the overlying suprabasalt sediments. However, reflection surfaces and other anomalies on seismic profiles can be generated in many other ways, including erosional surfaces, lateral lithologic (i.e., facies) changes, unconformities, faults and folds, poor quality data, seismic-signal attenuation, and inconsistencies in data processing (Holmes and Mitchell 1981). Therefore, the uppermost seismic-reflector may not always represent the top of basalt, and the seismic data need to be carefully evaluated with other reflection sources in mind. Lithologic data collected in boreholes should always be honored foremost, and where present, used to effectively constrain and calibrate the seismic data.
Figure 2.4. Locations of five hydrogeologic cross sections within the study area. See Appendix A for cross sections.

2.10
Figure 2.5. Latest top of basalt interpretation based on borehole and seismic-reflection-survey data in the Gable Gap area. Also shown are groundwater-contaminant plumes for uranium and 99Tc in the vicinity of Gable Gap. Purple lines are seismic lines collected in 1979-1980 as part of the BWIP Project (Ault 1981); green lines show locations of Landstreamer seismic-reflection surveys (Repasky et al. 2009). Note: top of basalt contours are in meters. Dashed red line connects high points of basalt divide.

3.1
3.0 Regional Geologic Setting
The Hanford Site and Pasco Basin lie within the Columbia Plateau of southeastern Washington State. This broad plain, situated between the Cascade Mountains to the west and the Rocky Mountains to the east, is underlain by a thick sequence of volcanic Columbia River basalt, which forms the basement rock for the region.
The generalized stratigraphy beneath the Hanford Site consists of, in ascending order, the Columbia River Basalt Group (CRBG) and intercalated sediments of the Ellensburg Formation, the Ringold Formation, the Cold Creek unit (formerly named the Plio-Pleistocene unit), and the Hanford formation (Figure 3.1). The Cold Creek unit and Hanford formation are both informal designations. Thin veneers of Holocene alluvium, colluvium, and/or eolian sediments discontinuously overlie these principle geologic units. The regional suprabasalt stratigraphy is described in more detail elsewhere (DOE 1988; Lindsey 1995, 1996; DOE/RL 2002).
Figure 3.1. Regional stratigraphy for the Pasco Basin and Hanford Site. Modified after DOE/RL (2010).

3.2
3.1 Columbia River Basalt Group and Ellensburg Formation
The CRBG in eastern Washington is divided into three formations: 1) Grand Ronde Basalt, 2) Wanapum Basalt, and 3) Saddle Mountains Basalt (Figure 3.2). About 300 separate flows have been identified; the basalt reaches its maximum thickness, ~15,000 ft (4570 m), in the southern Pasco Basin. The last basalt flows to reach the Pasco Basin occurred between 8.5 to 10.5 million years ago (DOE 1988). The extrusion of volcanic basalt flows occurred very rapidly at first and then slowed down over time. More time between basalt eruptions allowed for more accumulation of sediments between the younger basalt flows (i.e., Saddle Mountains Basalt). The sedimentary interbeds of the Ellensburg Formation, along with the porous basalt flow tops and bottoms, form confined aquifers that may extend across the Pasco Basin (DOE 1988).
l
Figure 3.2. Stratigraphic nomenclature for the Columbia River Basalt Group. All basalt formations but the Imnaha Basalt are present in eastern Washington State. Source: Martin et al. (2005).

3.3
The basalt flows and interbeds have been folded and faulted, creating broad structural and topographic lows, separated by tighter asymmetric anticlinal ridges. Tectonic folding and faulting, which began with extrusion of the CRBG, continues to the present day (Reidel 1984; DOE 1988). Sediments of late Miocene, Pliocene, and Pleistocene age have accumulated up to 1700 ft (520 m) thick in the Pasco Basin, one of the larger structural basins. The Pasco Basin is partially bisected by the first-order Umtanum Ridge-Gable Mountain anticline creating two subordinate synclinal basins (Cold Creek and Wahluke synclines).
3.2 Suprabasalt Sediments
3.2.1 Ringold Formation
The Ringold Formation records fluvial-lacustrine deposition associated with the ancestral Columbia River drainage system, following the last eruption of basalt at the Hanford Site (Tallman et al. 1981; DOE 1988; Lindsey 1995, 1996). Deformation of the Yakima folds, which began in the middle Miocene Epoch coincident with emplacement of the Columbia River basalt flows, continued into Ringold time so the centers of down-warped basins received more sediment than the margins. The Ringold Formation is up to 600 ft (185 m) thick in the center of the basin and pinches out against the basin-bounding basalt ridges.
The Ringold Formation consists of semi-indurated clay, silt, fine- to coarse-grained sand, and variably cemented, multilithic, granule to cobble gravel. Ringold Formation sediments have been classified into five sediment facies associations:
1. fluvial gravel
2. fluvial sand
3. overbank deposits
4. lacustrine deposits
5. alluvial fan deposits.
See Lindsey (1995, 1996) for more detailed descriptions of these facies.
3.2.2 Cold Creek Unit
After a period of post-Ringold incision, the eroded surface of the Ringold Formation was locally weathered and/or covered with accretionary deposits of the Cold Creek unit. These deposits consist of fluvial, eolian and/or colluvial sediment, often pedogenically altered (DOE/RL 2002). The Cold Creek unit includes those deposits formerly referred to as the “Plio-Pleistocene unit” and “Pre-Missoula Gravels,” as well as the “early Palouse soil” and “caliche layer” within the 200 West Area. These deposits were renamed because of the uncertainty in their exact age, and to better reflect their geographic extent, which is generally confined to the boundaries of the Cold Creek syncline within the west-central Pasco Basin (DOE/RL 2002).

3.4
Five different facies of the Cold Creek unit have been differentiated based on grain size, sedimentary structure, sorting, roundness, fabric, and mineralogic composition (DOE/RL 2002). These facies include the following:
1. fluvial-overbank and/or eolian (early Palouse soil)
2. calcic paleosol (caliche)
3. mainstream alluvium (Pre-Missoula Gravels)
4. colluvium
5. sidestream alluvium.
3.2.3 Hanford Formation
The Hanford formation is an informal name used within the Pasco Basin to describe Pleistocene-age cataclysmic flood deposits (Tallman et al. 1979, 1981; DOE 1988; DOE/RL 2002). Ice-Age floods originated from outbursts of glacial Lake Missoula, as well as other ice-dammed lakes (Baker and Bunker 1985), pluvial lake Bonneville (O’Connor 1993), or possible subglacial floods (Shaw et al. 1999) associated with the Cordilleran Ice Sheet. At least one flood also occurred from the draining of glacial Lake Columbia at the very end of the Ice Age (Bjornstad 2006). The Hanford formation may include some minor fluvial, colluvial, and/or eolian deposits interbedded with flood deposits.
As mentioned above, the Hanford formation consists predominantly of unconsolidated sediments that cover a wide range in grain size, from boulder-size gravel to sand, silty sand, and silt. The sorting ranges from poorly sorted (for gravel facies) to well sorted (for fine sand to silt facies). Traditionally, the Hanford formation has been subdivided into three lithofacies (gravel dominated, sand dominated, and interbedded sand and silt-dominated), which grade into one another both vertically and laterally (DOE/RL 2002).
The interbedded sand- and silt-dominated facies (DOE/RL 2002) occurs in backflooded, slackwater areas marginal to the Ice Age floods. As such, this facies is not present in the vicinity of Gable Gap due to extremely high-energy, turbulent flood flow through the Gap. Sand-dominated facies of the Hanford formation consist of relatively thick (>1 m), predominantly horizontally laminated, loose, basalt-rich, fine- to coarse-grained sand, sometimes grading upward into a thinner sequence of ripple-laminated fine sand to silt. Typically, sand-dominated facies contain approximately equal amounts of mafic (i.e., basalt) and quartz-feldspar grains (Tallman et al. 1979); this composition gives the Hanford formation its characteristic “salt and pepper” appearance. Gravel-dominated facies consist of loose, massive to horizontal and large-scale, planar-tabular cross-bedded, poorly sorted mixtures of gravel, sand, and silt. Gravel clasts in flood gravels generally consist of 50% to 75% subangular to subrounded basalt (DOE/RL 2002). Rounded rip-up clasts of caliche and/or semi-indurated silt and clay are common in the gravel-dominated facies.
Below an elevation of approximately 1,000 ft (300 m) within the central Pasco Basin, the Hanford formation unconformably overlies the Cold Creek unit, and where the unit is not present, lies directly on the Ringold Formation or Columbia River basalt. Within the central Pasco Basin buildup of flood deposits occurred along Priest Rapids, Cold Creek and Gable Mountain flood bars, which developed as the floods initially expanded into the Pasco Basin (Figure 3.3). The bulk of the vadose zone at the Hanford Site lies within Ice Age flood sediments of the Hanford formation.

3.5
Ice-Age floods created the Cold Creek Bar, a giant, streamlined deposit of mostly gravel and sand that extends for 12 miles downstream of Umtanum Ridge (Figure 3.3). Gravel-dominated deposits, laid down under the strongest flood currents, are generally restricted to the north side of the bar. At the southern end of the bar, where flood currents were less vigorous, sand-dominated sediments were laid down. The Hanford formation reaches its maximum thickness (~300 ft [100 m]) in the sand-dominated facies beneath the Cold Creek Bar just south of the study area.
Figure 3.3. Thickness and distribution of cataclysmic flood deposits (i.e., Hanford formation) within the central Pasco Basin. Modified after DOE/RL (2002).
Umtanum Ridge

4.1
4.0 Stratigraphy and Lithology of Gable Gap
The following discussion on the hydrogeology of Gable Gap presents background information on the stratigraphy, lithology, structure, paleogeomorphology, and hydrology, which forms the basis for the three-dimensional hydrogeologic model developed herein.
A total of nine stratigraphic units are recognized in the Gable Gap area (Figure 4.1).
• Recent eolian or backfill material
• Hanford formation - upper gravel-dominated sequence (H1 unit)
• Hanford formation – sand-dominated sequence (H2 unit)
• Hanford formation - lower gravel-dominated sequence (H3 unit)
• Cold Creek unit – silt-dominated subunit
• Cold Creek unit – gravel-dominated subunit
• Ringold Formation (undifferentiated)
• Columbia River Basalt Group (CRBG)
• Sedimentary interbeds between Columbia River basalt flows (Ellensburg Formation).
Stratigraphic relationships and images for these units are illustrated in Figures 4.1 and 4.2, and tabulated in Table 4.1. Hydrogeologic cross sections (e.g., Figure 4.2) displaying more of the stratigraphic and structural relationships among lithologic units are presented in Appendix A. Structure-contour and isopach maps for most of the units are also presented in Appendices B and C, respectively. As illustrated in these appendices, all but the Hanford formation H1 unit are discontinuous across the Gable Gap study area. More detailed discussions of each unit, beginning with the oldest unit, are presented in the following sections.

4.2
Figure 4.1. Hanford Site stratigraphy. Photos show examples of strata, both in drill core and outcrop, which are representative of the Gable Gap study area. Borehole number and depth of sample below ground surface (bgs) are shown where appropriate.

4.3
4.1 Columbia River Basalt Group and Interbedded Sediments of the Ellensburg Formation
The surface of the volcanic CRBG forms the bedrock base beneath sedimentary deposits over the Hanford Site. Volcaniclastic sedimentary interbeds of the Ellensburg Formation accumulated between basalt flow eruptions. Sediments of the Ellensburg Formation commonly thin or disappear in adjacent anticlines that lay above the ancient valley floors.
The Elephant Mountain Member of the CRBG’s Saddle Mountains Basalt (Figure 4.2) is the youngest basalt flow within the Gable Gap study area and where present forms the basement rock (Figure 4.3). The Elephant Mountain Member has been dated by the K-Ar method to be about 10.5 Ma (McKee et al. 1977) and consists of two flows beneath the 200 East Area. However, within the northern portion of Gable Gap, the uppermost basalt flows that include the Elephant Mountain Member, were locally folded, faulted, and subsequently eroded by the ancestral Columbia River and Pleistocene Ice Age floods (Figures 4.3 and C.10). A large erosional window exists across a sizable portion of the gap where the Elephant Mountain Member was completely eroded, exposing older basalt flows and the Ellensburg Formation to the unconfined aquifer. Locally, this erosional window extends all the way down to the Umatilla Member of the CRBG. This deep cavity allows hydraulic communication between confined and unconfined aquifers in this area (Strait and Moore 1982; Graham et al. 1984; Jensen 1987). Both north and south of the anticlinal axis at Gable Gap, however, the basalt of the Elephant Mountain Member forms a continuous unit that dips uniformly into synclinal basins on either side.
The Ellensburg Formation consists mostly of fine-grained tuffaceous beds of clay and silt, interstratified with sandy layers (see Figures A.1, A.3, and A.5). No gravel facies are reported for the Ellensburg Formation within the study area, except locally within the uppermost interbed (Rattlesnake Ridge) along the basal contact with the Pomona Member (Jensen 1987). The Rattlesnake Ridge interbed is up to 60 ft (18 m) thick in the study area (see Figure C.10); however, it was totally removed by erosion associated with the ancestral Columbia River and/or Ice Age floods within Gable Gap where it crosses the axis of the Umtanum Ridge-Gable Mountain anticline.

4.4
Figure 4.2. Stratigraphy in the vicinity of Gable Gap

4.5
Figure 4.3. Example hydrogeologic cross section (A-A’) for Gable Gap. See Figure 2.4 for location and Appendix A for other cross sections.

4.6
4.2 Suprabasalt Sediments
Suprabasalt sediments are those deposits that lie above and are younger than the basalt flows of the CRBG and interbedded sediments of the Ellensburg Formation. The suprabasalt sediments in Gable Gap include the Ringold Formation, the Cold Creek unit, and the Hanford formation. The characteristics of these stratigraphic units are summarized in Table 4.1. A thin veneer of Holocene sediments (eolian sand, slopewash, or manmade backfill) also locally covers the surface.
4.2.1 Ringold Formation
Only a few thin, erosional remnants of the fluvial-lacustrine Ringold Formation are preserved within Gable Gap; these lie mostly within Ringold-age paleochannels and beneath protective caps of the cohesive Cold Creek unit silt (CCUz) (see Figures A.2 to A.5). At one time, the Ringold Formation was much thicker and more widely distributed across the Gable Gap area when it filled the Pasco Basin to ~900 ft (274 m) elevation (Lindsey 1995) during the late Miocene to Pliocene time (10.5-3.4 Ma). However, either during, or since, Ringold time uplift of the Umtanum Ridge-Gable Mountain anticline caused subsequently incision and removal of the Ringold Formation. Additional downcutting occurred via the post-Ringold Columbia River, followed by scouring from multiple, cataclysmic Ice Age floods.
Figure C.8 shows the wells within Gable Gap that encountered the Ringold Formation. These wells are mostly restricted to lower-elevation paleochannels or margins of paleochannels within Gable Gap. In general, the Ringold sediments in Gable Gap wells represent a variety of different lithofacies (see Figures 4.3 and 4.4) from fine-grained silt and clay to sand and gravel. Because only a thin sequence and
gg.ringold.png
Figure 4.4. Erosional remnants of the Ringold Formation in Gable Gap well 699-48-50B (C5196). See borehole location map in Figure 2.1. Left: Weakly laminated, pale yellow, micaceous, well-sorted, fine- to medium-grained sand. Note the felsic composition with only a few percent dark mafic grains, 194 ft (59 m) depth. Right: Well-laminated, slightly plastic, clayey silt from 199-ft (61-m) depth. The gleyed (olive gray) color and sulfide smell of these sediments are indicative of ongoing chemical reduction within this facies. Both of these Ringold sediments are interpreted as fine-grained, fluvial-overbank deposits of the ancestral Columbia River. See also summary log for this well in Figure 2.2.

4.7
multiple lithofacies of the Ringold Formation are represented in Gable Gap, it is presently not possible to positively identify to which specific Ringold units (i.e., Lindsey 1995; Williams et al. 2000) these sediments belong. For this report, we are designating gravelly Ringold facies as belonging to Ringold Formation unit A, and overlying fine-grained strata to the Ringold lower mud unit. These units may or may not correlate with similarly named units outside the Gable Gap study area.
Distinguishing characteristics of the gravel-dominated Ringold facies (described in Table 4.1) are generally moderately sorted and bimodal consisting of rounded, clast-supported, pebble-cobble conglomerate in a sand to silt matrix. The sand fraction is predominantly light-colored and felsic (quartz, feldspar, and mica) with only a few percent mafic grains. Individual sediment grains and clasts in coarser Ringold facies are frequently coated with a red, yellow, orange, and/or brown cement that weakly to moderately binds particles together. Gravel clasts are normally described as multilithic and often display clay coatings. Gravels are composed of a mixture of mostly quartzite, granitic, gneissic, and basalt clasts. Basalt clasts in particular often show significant weathering rinds while granitic/gneissic clasts can be strongly weathered and friable―all signs of significant in-situ weathering caused by millions of years of contact with groundwater. Ringold gravel clasts are typically highly rounded and polished, characteristic of a fluvial setting (i.e., ancestral Columbia River). Another characteristic of the gravel-dominated Ringold Formation is its ability to maintain an open-hole during drilling due to its older age, which produces sediments that are more compacted, cemented, and/or consolidated.
Finer-grained Ringold strata are also present in Gable Gap; these are composed of interstratified beds of massive to laminated clay, silt, and sand (Figure 4.4).
4.2.2 Cold Creek Unit
A geologic unit of late Pliocene to possibly early Pleistocene age is also present in the vicinity of Gable Gap. The unit consists of a thick (up to 55 ft [17 m] in well 699-49-55A) layer of fine-grained, well-sorted, calcareous silt and/or fine sand that generally lies several tens of feet above the top of basalt. Two different facies of the Cold Creek unit (DOE/RL 2002) appear to be present in Gable Gap: 1) a gravel-dominated subunit (CCUg), overlain by 2) a fine-grained, silt-dominated subunit (CCUz).
Gravel-Dominated Subunit (CCUg). The lower portion of the Cold Creek unit in Gable Gap typically consists of multilithic sand and gravel, similar to the Ringold Formation, except for a higher concentration of basalt clasts (Figure 4.5). However, unlike the Ringold Formation, the Cold Creek unit gravels (CCUg) subunit generally lacks significant weathering and/or consolidation, due to its generally younger age (~2 to 3 million years, compared to up to 10 million years for the Ringold Formation) (see Figure 4.1). The CCUg contains a moderate amount (generally 20-50 vol%) of basalt in the sand fraction. This is an intermediate composition between that of the Ringold Formation (generally 0-10%) and the Hanford formation (40-90%), although there can be some overlap in the mafic content for the different stratigraphic units. The loose, unconsolidated, and generally unweathered nature of CCUg suggests this subunit is post-Ringold Formation in age. These facies likely represent fluvial deposits from the main channel of the ancestral Columbia River, which incised into and reworked the older, more felsic Ringold Formation, which was mixed with alluvium from other, more-local, basalt-dominated sidestreams. The CCUg typically displays various shades of gray, including brown and olive.

Note: Diagnostic features in red type. N/A = Not applicable.
4.9
Table 4.1. Characteristics used to distinguish between suprabasalt stratigraphic units within Gable Gap
Stratigraphic Unit Lithofacies Age
Principal Lithology
Subordinate Lithology
Depositional Process
Depositional Environment/
Spatial Distribution Matrix Color
% Basalt (Mafic) in
Sand Fraction
General Gravel
Roundness Sorting Structure
Calcium Carbon-
ate (wt%) Induration
Natural-Gamma
Response Other Characteristics
Hanford formation
Sand-dominated (H2 unit)
Pleistocene Fine- to coarse-grained sand (S)
Lenses of pebbly sand (gS), silty fine sand (mS), fine sandy silt (sM); thin, weakly developed paleosols
Ice-age cataclysmic flood
Moderate to high-energy flood deposition in areas marginal to high-energy flood currents, including most of Cold Creek bar (200 Area Plateau)
Brownish gray to olive gray
40-90 Subangular to subrounded
Moderate to well sorted
Low-angle horizontal laminations; normal and reverse gradations (rhythmites); occasional cut and fill
2-10 Loose Consistently low
“Salt and pepper”-like appearance; graded, rhythmic bedding; clastic dikes; soft-sediment deformation along bed contacts; where exposed individual beds can be traced laterally for tens of meters or more; localized minor cut and fill channels; occasional rip-up clasts
Gravel-dominated (H1 and H3 units)
Pleistocene Sandy gravel (sG) to silty sandy gravel (msG)
Lenses and sheets of pebbly sand (gS); fine- to coarse-grained sand (S)
Ice-age cataclysmic flood
High-energy flood deposits within and along cataclysmic flood channels
Dark gray, brownish gray, to olive gray
40-90 Subangular to subrounded
Poor to moderately sorted
Horizontal to large-scale planar-tabular (i.e., foreset) cross-bedding; cut and fill
2-5 Loose Consistently very low
Basaltic; silt coatings on gravel clasts; laterally discontinuous beds with ubiquitous cut and fill channels; unconsolidated, fine-grained, angular rip-up clasts common; boulders, caving hole
Cold Creek unit CCUz Late Pliocene to early Pleistocene
Fine sand and silt, (S, mS, sM, M)
Thin, weakly developed paleosols
Fluvial and/or eolian
Fluvial overbank to eolian deposits; mostly limited to beneath 200 West Area
Buff, pale to dark brown, olive brown
<5 NA Well sorted to very well sorted
Laminated and bedded to massive
5-20 Moderately to very strongly cohesive/ compact
Consistently high
Micaceous; weakly to moderately calcareous
CCUg Late Pliocene to early Pleistocene
Sandy gravel (sG) to silty sandy gravel (msG)
Well sorted, medium- to coarse-grained sand (S) to pebbly sand (gS)
Mainstream fluvial
Alluvial deposits from ancestral Columbia River found in central Pasco Basin near Southeast Anticline and southeast of Gable Gap
Light gray to olive gray, “whitish” or “bleached” clast coatings
20-50 Subrounded to well rounded
Moderately sorted, bimodal
Unknown because unit is has only been described from drill cuttings, which do not preserve sedimentary structure
0-5 Loose to weakly compacted and/or cemented
Consistently low to moderate
Multilithic gravels; unaltered to slightly altered, locally carbonate cemented; open hole possible
Ringold Formation
Coarse Miocene to Pliocene
Sandy gravel (sG) to silty sandy gravel (msG)
Gravelly sand (gS) to sand (S)
Mainstream fluvial
Alluvial channel and crevasse-splay deposits
Rusty brown, orange, or yellow
0 to 10% Subrounded to well rounded
Moderately sorted, bimodal
Bedded to massive
0-3 Weakly to semi-consolidated
Variable Weathering rinds, clay skins, multilithic; pervasive rusty brown color, felsic matrix; open hole common
Fine Miocene to Pliocene
Clay (C) to silt (Z)
Sand lenses, paleosols
Fluvial-lacustrine
Overbank alluvial or lake
Brown, orange, yellow to gleyed grey, olive, green, or blue
0 N/A Well sorted to very well sorted
Laminated to massive
0-15 Cohesive and compact
Consistently high
Gleyed color

4.11
GG.CCUg.png
Figure 4.5. Gravel-dominated facies of the Cold Creek unit (CCUg) from boreholes in the vicinity of Gable Gap. A) Grayish brown, silty sandy gravel in core from well 299-E33-338; 233 ft (71 m) depth. B) Comparable drill cuttings from well 299-E33-342; 212.5 ft (65 m) depth. C) 299-E33-205; 258 ft (78 m) depth). D) 699-50-56; 153 ft (47 m) depth. Note the general lack of consolidation and moderate amount of basalt in the sand fraction. The few very well rounded and polished pebbles and cobbles are likely older, reworked Ringold Formation clasts.
Silt-Dominated Subunit (CCUz). A locally thick, silt-dominated sequence preserved in Gable Gap is
dissimilar to either the Ringold Formation or the overlying Hanford formation. Drill samples show the

4.12
unit to be well-sorted, weakly stratified silt to micaceous, silty fine sand (Figure 4.6). Colors are various shades and combinations of olive and brown. Calcareous horizons within the unit appear to represent periods of calcic soil development during accumulation of the strata. Owing to the high silt content, the CCUz subunit is generally cohesive and compact, which likely prevented complete disintegration and erosion by Ice Age floods. This subunit is interpreted to represent deposition within an overbank-fluvial environment, associated with the ancestral Columbia River. Massive intervals in the CCUz may also be present, suggesting eolian deposition may also have occurred locally. These silt-dominated deposits could be equivalent or partially equivalent to the similar-appearing deposits of the Cold Creek unit that overlie the calcrete horizon(s) (Cold Creek unit - caliche [CCUc] facies) in the 200 West Area (DOE/RL 2002).
GG.CCUz.png
Figure 4.6. Cold Creek unit silt (CCUz). Left: Percussion core of micaceous, olive-brown, laminated silt from borehole 299-E33-45; 224 ft (68 m) depth. Note: Original stratification of drab-colored silt still preserved. Right: Drill cuttings of compact and cohesive CCUz from borehole 299-E33-343; 235 ft (72 m) depth.
The CCUz subunit exists as an unusual, elongated buried mound that begins near the B Tank Farm in
the northern 200 East Area and trends northwest toward Gable Gap (Figures 4.7, A.2, A.5, B.5, and C.6). The buried mound is elongated parallel to the direction as the floodwaters that swept through Gable Gap, suggesting the mound may be a streamlined landform molded by the floods. Similar streamlined landforms are a common occurrence on the surface of the Channeled Scabland (Figure 4.8) where the floods eroded through the silt-dominated Palouse Formation (Baker 1978). Minor beds of sand may also occur within the CCUz, especially in the thicker, silt-dominated sequences (see Figure 2.2).

4.13
Figure 4.7. EarthVision® model showing the mound-like form of the Cold Creek silt (CCUz) subunit extending south from Gable Gap. View looking northwest. Vertical exaggeration = 5X.
Figure 4.8. Example of high-relief, streamlined and scarped hills of silty Palouse Formation located in the eastern Channeled Scabland. Ice Age floods, moving toward viewer in this image, eroded through a once-continuous blanket of windblown silt, leaving behind these streamlined remnants. The streamlined hills rest on basalt bedrock, eroded into scabland by the floods. These are analogous to the elongated, isolated ridge of Cold Creek unit silt (CCUz) buried near Gable Gap (see Figure B.5 and C.6).

4.14
The transition from the mainstream fluvial gravel facies (CCUg) to overbank facies (CCUz) during the Cold Creek period may signify the shift of the Columbia River out of Gable Gap northward toward the horn of the Columbia River. Such a shift may have been the result of ongoing tectonic uplift along the Umtanum Ridge-Gable Mountain anticline, which perhaps defeated the river and forced it northward towards the end of Cold Creek time.
4.2.3 Hanford Formation
The Hanford formation in the vicinity of Gable Gap is subdivided into either 1) gravel-dominated, or 2) sand-dominated lithofacies, which transition laterally into one another depending on distance from the main, high-energy flood currents (see Figure 3.3).
1. Gravel-Dominated Lithofacies. This facies generally consists of coarse-grained basaltic sand and granule to boulder gravel. These deposits display an open framework texture, massive bedding, plane to low-angle bedding, and large-scale planar cross bedding in outcrop. Gravel-dominated beds sometimes grade upward into thinner, laterally discontinuous beds of sand- and/or silt. Gravel clasts are dominantly basalt with lesser amounts of mostly reworked Ringold Formation clasts, including granite, quartzite, and gneiss. In the Gable Gap study area, two gravel-dominated sequences are recognized―the H3 and H1 units.
2. Sand-Dominated Lithofacies. This facies consists of fine- to coarse-grained sand and granule gravel. The sands typically consist of 40-90% basaltic rock fragments (Table 4.1). They may contain small pebbles and rip-up clasts, pebble-gravel interbeds, and often grade upward into thin (<1 ft [0.3 m]) zones of silt-dominated facies. Sand-dominated facies commonly display plane lamination and bedding, and less commonly, channel cut-and-fill sequences. The facies transitions laterally into gravel-dominated facies northward into Gable Gap. In the Gable Gap study area, only a single thick sand-dominated sequence (H2 unit) is recognized in the southern portion of the study area (Figures A.2, B.2, and C.3).
The higher basalt content for the Hanford formation is due to the flow path of the Ice Age floodwaters, which passed over the purely basaltic terrain of the Columbia Plateau (e.g., Channeled Scabland). In contrast the origin for the older strata of the Ringold and Cold Creek units were derived from rivers draining over non-basaltic rocks around the perimeter of the plateau. This mineral assemblage gives the Hanford formation its distinctive “salt and pepper” appearance, often noted in drillers’ and geologists’ logs.
The Hanford formation in the Gable Gap area is informally subdivided into three main subunits: H1, H2, and H3. The H2 unit is the sand-dominated sequence, which frequently separates upper and lower gravel-dominated flood sequences. The H2 unit is generally restricted to the southern third of the study area (Figure C.3), where it is almost 200 ft (61 m) thick. This unit rapidly transitions into the gravel-dominated H1 unit northward, where floodwaters increased in velocity through Gable Gap.
It is important to note that H1, H2, and H3 units are purely lithostratigraphic units and NOT time-stratigraphic units―thus, they are flood facies that may have been deposited simultaneously or may represent a composite of similar facies from different flood events. From one place to another, the type of sediment deposited was strongly dependent on its location relative to the changing energy level of the floods, which transitioned laterally from high energy to lower energy southward to southeastward through
4.15
Gable Gap. Thus, the H1, H2, and H3 units recognized in the Gable Gap area do not necessarily correlate with similarly named units of the Hanford formation recognized elsewhere within the Hanford Site.
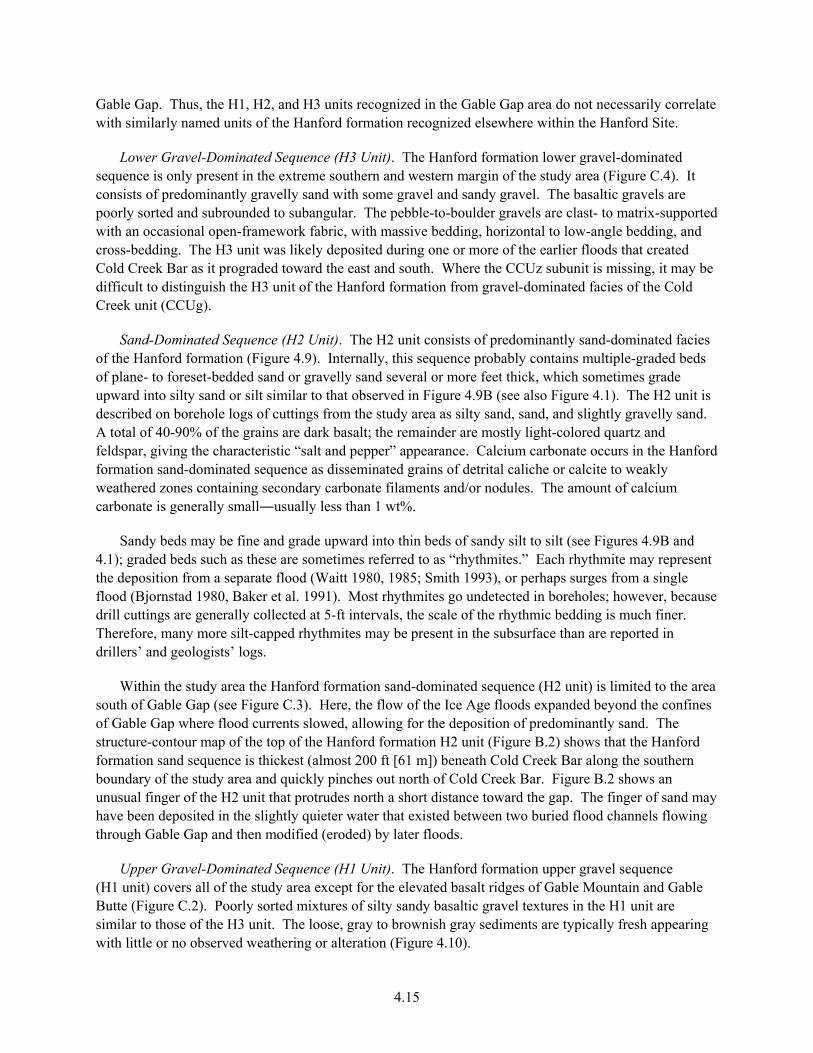
Lower Gravel-Dominated Sequence (H3 Unit). The Hanford formation lower gravel-dominated sequence is only present in the extreme southern and western margin of the study area (Figure C.4). It consists of predominantly gravelly sand with some gravel and sandy gravel. The basaltic gravels are poorly sorted and subrounded to subangular. The pebble-to-boulder gravels are clast- to matrix-supported with an occasional open-framework fabric, with massive bedding, horizontal to low-angle bedding, and cross-bedding. The H3 unit was likely deposited during one or more of the earlier floods that created Cold Creek Bar as it prograded toward the east and south. Where the CCUz subunit is missing, it may be difficult to distinguish the H3 unit of the Hanford formation from gravel-dominated facies of the Cold Creek unit (CCUg).
Sand-Dominated Sequence (H2 Unit). The H2 unit consists of predominantly sand-dominated facies of the Hanford formation (Figure 4.9). Internally, this sequence probably contains multiple-graded beds of plane- to foreset-bedded sand or gravelly sand several or more feet thick, which sometimes grade upward into silty sand or silt similar to that observed in Figure 4.9B (see also Figure 4.1). The H2 unit is described on borehole logs of cuttings from the study area as silty sand, sand, and slightly gravelly sand. A total of 40-90% of the grains are dark basalt; the remainder are mostly light-colored quartz and feldspar, giving the characteristic “salt and pepper” appearance. Calcium carbonate occurs in the Hanford formation sand-dominated sequence as disseminated grains of detrital caliche or calcite to weakly weathered zones containing secondary carbonate filaments and/or nodules. The amount of calcium carbonate is generally small―usually less than 1 wt%.
Sandy beds may be fine and grade upward into thin beds of sandy silt to silt (see Figures 4.9B and 4.1); graded beds such as these are sometimes referred to as “rhythmites.” Each rhythmite may represent the deposition from a separate flood (Waitt 1980, 1985; Smith 1993), or perhaps surges from a single flood (Bjornstad 1980, Baker et al. 1991). Most rhythmites go undetected in boreholes; however, because drill cuttings are generally collected at 5-ft intervals, the scale of the rhythmic bedding is much finer. Therefore, many more silt-capped rhythmites may be present in the subsurface than are reported in drillers’ and geologists’ logs.
Within the study area the Hanford formation sand-dominated sequence (H2 unit) is limited to the area south of Gable Gap (see Figure C.3). Here, the flow of the Ice Age floods expanded beyond the confines of Gable Gap where flood currents slowed, allowing for the deposition of predominantly sand. The structure-contour map of the top of the Hanford formation H2 unit (Figure B.2) shows that the Hanford formation sand sequence is thickest (almost 200 ft [61 m]) beneath Cold Creek Bar along the southern boundary of the study area and quickly pinches out north of Cold Creek Bar. Figure B.2 shows an unusual finger of the H2 unit that protrudes north a short distance toward the gap. The finger of sand may have been deposited in the slightly quieter water that existed between two buried flood channels flowing through Gable Gap and then modified (eroded) by later floods.
Upper Gravel-Dominated Sequence (H1 Unit). The Hanford formation upper gravel sequence (H1 unit) covers all of the study area except for the elevated basalt ridges of Gable Mountain and Gable Butte (Figure C.2). Poorly sorted mixtures of silty sandy basaltic gravel textures in the H1 unit are similar to those of the H3 unit. The loose, gray to brownish gray sediments are typically fresh appearing with little or no observed weathering or alteration (Figure 4.10).

4.16
GG.H2.png
Figure 4.9. Hanford formation H2 unit in 200 East Area. A) Laminated, “salt and pepper” sands from 63 ft (19 m) depth in direct push core from C5132, BX Tank Farm. B) Direct-push core 17 ft (5 m) depth from C5168, B Tank Farm. Notice graded-bed contact between flood rhythmites; brown silt marks the top of one rhythmite (arrow), overlain by coarse sand at the base of the succeeding flood rhythmite. C and D) Drill cuttings of typically loose, moderately sorted, medium- to coarse-grained, basaltic sand in wells 299-E33-342 and -343, respectively.
Basalt boulders are another characteristic of the coarse-grained Hanford formation, both within the
H1, as well as the H3 units. Boulder-sized clasts (>10 in. [256 mm] diameter) are rarely―if ever―reported for either the Ringold Formation or the Cold Creek unit. Unlike huge Ice Age floods, normal rivers are not swift enough to transport boulder-sized clasts; boulders are therefore diagnostic of the Hanford formation.
Based on observations of outcrop (see Figure 4.1) and intact core samples, the Hanford formation upper gravel sequence is interpreted to consist of the high-energy, gravel-dominated facies with discontinuous lenses of the sand-dominated facies. Occasionally, silt-lenses are draped between flood sequences, but these constitute a relatively small percentage of the total volume of the H1 unit. Within

4.17
the Gable Gap study area, this unit is well exposed in the northeast corner of the 200 East Area in the 50-ft (15-m) deep 218-E-12B Burial Ground (Figure 4.11).
GG.H1.png
Figure 4.10. Hanford formation H1 unit from the B-BX-BY Tank Farm, 200 East Area. The H1 unit is a loose, gravel-dominated, poorly to moderately sorted unit composed of mostly unweathered, subangular basalt rock fragments in a matrix of sand and silt. A) Boring C5164; B) 299-E33-341; and C) 299-E33-205.
4.2.4 Holocene Deposits
Holocene deposits within the study area consist of up to 30-50 ft (10-15 m) of backfill material within tank farms, cribs, and trenches located in the northern 200 East Area. This backfill material is composed mostly of gravel-dominated deposits of the Hanford formation H1 unit removed during construction of the waste facilities. In places, such as the BY Tank Farm within the north-central 200 East Area, all the Hanford formation H1 unit was removed and replaced with backfill (e.g., see Figure B.1). Thin (few feet [1-2 m]) sheets of eolian sand also locally cover the surface. Holocene-age debris in the form of slopewash and talus has also been shed off the higher-relief slopes of Gable Mountain and Gable Butte.

4.18
Subpit.ripples.jpg
Figure 4.11. Outburst-flood deposits of the Hanford formation exposed along the north wall of the 218-E-12B Burial Ground located along the north flank of the Cold Creek Flood Bar (Wood et al. 2000; Bjornstad 2006). The upper half of the exposure is composed of gravel-dominated (H1) flood deposits, underlain by sand-dominated (H2) deposits of the Hanford formation. In between are a series of buried, long-amplitude, giant current ripples; ripple crests are indicated by the letter “C” and ripple troughs by the letter “T.” Slackwater deposits of silt (indicated by vegetation growth) drape over the ripples, thickening in the ripple troughs and thinning over the crests.
4.2.5 Clastic Dikes
Clastic dikes are vertical to subvertical sedimentary structures that crosscut normal sedimentary layering, especially in Ice-Age flood deposits of the Hanford formation (Black 1979; Fecht and Weekes 1996; Fecht et al. 1999). The dikes are believed to result from dewatering of saturated, rapidly deposited sediment and/or hydraulic injection into overlying sediment layers associated with sudden lowering of flood levels immediately following Ice Age flood events. Clastic dikes are common to the sand-dominated facies of the Hanford formation, but rarely identified in the gravel-dominated facies based on observations of outcrop exposures. Thus, clastic dikes may be mostly absent in the Gable Gap study area except along the southern boundary where up to 200 ft (61 m) of the sand-dominated Hanford formation H2 unit is located (Figure C.3).
H1
H2

5.1
5.0 Structure
Structural features in the vicinity of Gable Gap include first- and second-order folds, as well as faults (Figure 5.1) associated with the Yakima Fold Belt (YFB). East-west trending ridges of the YFB resulted from tectonism via north-south compression of Earth’s crust since the Miocene Epoch (Reidel and Fecht 1981; DOE 1988). Structures exposed at the surface were mapped by Fecht (1978) and Myers and Price (1979); subsurface structures are inferred from the basalt units and elevations of top of basalt in geologic cross sections (Appendix A). Subsurface structures have also been interpreted based on a combination of geophysical techniques, including magnetic, gravity, and seismic-reflection surveys (Ault 1981; Repasky et al. 2009). Most recently, the structural relief on the top of basalt between known points (i.e., boreholes) in Figure 2.5 was interpolated from an integration and re-evaluation of the seismic-reflection data.
Figure 5.1. Geologic structures in the vicinity of Gable Gap. Compiled from surface and subsurface maps in Fecht (1978), Ault (1981), Myers and Price (1979), and Graham et al. (1984).
Gable Gap lies along a major first-order structure (Umtanum Ridge-Gable Mountain anticline) of the
YFB. Gable Gap formed between two, second-order, en echlon, asymmetric folds (Gable Mountain and Gable Butte) superimposed onto the larger structure. Overall, the first-order structures appear to plunge downward to the southeast (Figure 5.1). A series of en echelon folds lies along either side of the

5.2
first-order Gable Butte-Gable Mountain anticline (Myers and Price 1979; Ault 1981). From the upfolded ridges, the top of basalt dips north into the Wahluke syncline and south into the Cold Creek syncline.
In general, basalt flows and the overlying suprabasalt sediments thicken to the north and south into the synclinal basins. In addition, sedimentary interbeds of the Ellensburg Formation thin or disappear over the anticlinal ridges, indicating these structures were actively growing during eruption and emplacement of Columbia River basalt flows. Cumulative deformation on the suprabasalt sediments suggest development of the Yakima Folds has continued at a long-term, low-average rate to the present (Reidel 1984; DOE 1988).
At Gable Mountain, the more fractured hinge area and steeper south limb of the fold were preferentially eroded away during massive Ice Age floods (Figures 5.1 and 5.2). Considerable relief appears to exist in the subsurface on the top of basalt north of Gable Mountain, some of which may be the result of a high-angle reverse and/or thrust fault in this region. Reverse or thrust faults commonly develop on the steeper, overstrained sections of other Yakima folds (Myers and Price 1979).
Figure 5.2. Flood-swept, hogback ridge of western Gable Mountain, looking southeast. Low-angle (10-20 degree) tilt of the Columbia River basalt flows show prominently along the gentler north limb of the anticline. Ice Age flood channels (blue arrows) run along both sides of Gable Mountain. Floods racing down the right side of the ridge completely removed the hingeline and steeper south limb of the anticline, leaving only the north limb exposed as a hogback. The largest Ice Age floods rose another 100 ft (30 m) over the ridge crest. A number of other Ice Age flood landforms, including channels and potholes, lie buried within Gable Gap, located in the foreground.

6.1
6.0 Geomorphology
Landforms in the Gable Gap area are primarily the result of structural deformation and cataclysmic Ice Age floods (Fecht 1978), the earliest of which occurred 1 to 2 million years ago (Bjornstad et al. 2001). Outburst floods continued intermittently until about 14,000 to 15,000 years ago (Bjornstad 2006). Little or no change has occurred to the land surface since that period except for localized eolian (i.e., wind) reworking of flood deposits and manmade constructional activities. Figure 1.1 shows the major landforms surrounding the Gable Gap study area and Figure 6.1 as an EarthVision® model representation of the surface topography within the study area.
Gable Gap lies along the northern flank of Cold Creek Bar, a large compound flood bar formed during cataclysmic, Ice-Age floods (see Figure 3.3). The upper surface of the bar in the 200 East Area forms a broad plain at about 700 ft (210 m) elevation, otherwise known as the “Central Plateau” (see Figure 1.1). The bar extends westward for several miles; the northern boundary of the bar is flanked by a series of younger northwest-southeast trending flood channels (Fecht 1978; DOE 1988).
Figure 6.1. EarthVision® model of the present-day surface topography within the Gable Gap study area. Oblique view looking northwest. Vertical exaggeration = 5X.
6.1 Late-Pleistocene Flood Channels and Bars
Multiple channels and bars from the last Ice Age floods trend northwest to southeast through Gable Gap. Bars and channels of at least three different ages are preserved in this location. The oldest preserved flood surface is Cold Creek Bar (north end of which is represented by “B” in Figure 6.2). Cold Creek Bar developed as flood deposits prograded to Gable Gap from the eastern end of Umtanum Ridge (see Figure 3.3). North of Cold Creek Bar, later smaller floods (or later stages of the last flood) that did not flood Cold Creek Bar created the “south terrace” and “north bar” geomorphic surfaces (“C”). These surfaces were last incised by the most recent flood (i.e., Lake Columbia flood) that created the West Lake

6.2
channel and scour depressions at the head of Gable Mountain (“D”). This last flood that created the West Lake channel occurred sometime between 14,000-15,000 calendar years ago (Bjornstad 2006).
The oldest surfaces (indicated with the letter “A” in Figure 6.2) are the basalt uplands of Gable Mountain and Gable Gap. All subsequent landforms developed during Ice Age flooding, starting with Cold Creek Bar (“B”). Floods decreased in size toward the end of the Ice Age; these floods were responsible for the development of the south terrace and north bar (“C”). A secondary, sinuous flood channel (dashed arrow) appears to have developed atop the south terrace during the end of a flooding event. The south terrace and north bar, once connected, were subsequently incised by the last flood(s) that created the West Lake and north channels (“D”). Several depressions were also scoured out around the nose of Gable Mountain by the last of the floodwaters that squeezed through these channels.
Figure 6.2. Surface-geomorphic map of the Gable Gap study area. Entire area was underwater during multiple Ice Age floods. Block arrows show general flow direction for the last Pleistocene megafloods through Gable Gap.

6.3
6.2 Buried Paleochannels
Multiple paleochannels lie within Gable Gap area (Figure 6.3) buried beneath younger flood deposits of the Hanford formation. Locations for these channels are inferred from dozens of boreholes and seismic-reflection data collected within Gable Gap. The age of a paleochannel can be inferred based on the age of the sediments that fills the base of the channel. At least one channel (Channel F) was formed during Ringold time since it holds remnants of the Ringold Formation preserved within it. The remaining five paleochannels (A through E) are filled with coarse-grained, highly permeable flood deposits of the Hanford formation. These paleochannels may have initially formed during Ringold time, but if so, were further deepened during cataclysmic flooding, which removed all Ringold-age deposits from the channel. Paleochannel D, which has a remnant of Ringold Formation along its east side, might be an example of a Ringold-age channel that was cut deeper during Ice Age flooding. Figure 6.4 shows an example of the types of extreme erosion that can occur associated with Ice Age flooding, analogous to the erosional environment of Gable Gap.
Figure 6.3. Buried paleochannels within the Gable Gap area. Most of the channels were carved out during Pleistocene Ice Age floods, except for Channel F, which was created prior to backfilling with deposits of the Pliocene Ringold Formation.

6.4
Figure 6.4. Example of highly irregular topography eroded by Ice Age floods, Lower Grand Coulee, Channeled Scabland. View looking north. Blue block arrows show general movement of floodwaters, which scoured and overtopped the crest of the basalt ridge along left side of image. Notice the numerous circular potholes in basalt bedrock, plucked out by violently swirling and turbulent floodwaters.
Paleochannel A was carved by floodwaters flowing east through the Pasco Basin. Upon colliding
with Gable Mountain, the floodwaters divided (as shown in Figure 5.2) with some of the floodwater diverted north of Gable Mountain (Paleochannel B) and the remainder flowing south through Gable Gap via Paleochannels D, E, and F. Paleochannel C formed from Ice Age floodwaters that flowed east between Gable Butte and Cold Creek Bar (see Figure 3.3).
Paleochannel D, identified by Ault (1981) using a combination of geophysical techniques (i.e., gravity, magnetics, and seismic reflection), formed when floodwaters from Paleochannel A divided, sending vigorous streams of floodwater south through Gable Gap. Paleochannel D may have preferentially developed here along the structural axis of a buried syncline (see Figure 5.1). Just to the east, Paleochannel E appears to have incised into an anticline in basalt subparallel to Paleochannel D. This paleochannel is poorly defined via borehole data but suggested based on the seismic-reflection data (see Figure 2.5). At the southeast end of Paleochannel E lies a large pothole eroded into the Elephant Mountain Member basalt (defined by wells 699-48-48, 699-48-50, and 699-47-50) near the northeast corner of the 200 East Area (Figures 6.3 and D.1).

7.1
7.0 Hydrology
The hydrologic system of Gable Gap includes the 1) vadose zone, mostly composed of the Hanford formation; 2) the suprabasalt unconfined aquifer; and 3) multiple confined aquifers within and between flows of volcanic Columbia River basalt. Within the vadose zone, movement of moisture and liquid effluent from the 200 East Area is strongly influenced by anisotropic sedimentary layering within the Hanford formation and the underlying Cold Creek unit (Serne et al. 2010). This includes a sizable, elongated, and streamlined mound of CCUz, up to 55 ft (17 m) thick, ½ mile (0.8 km) wide, and up to 2 mi (3.2 km) long that extends northwestward into Gable Gap from the northern 200 East Area (see Figures 4.7, B.5, and C.6). Additional anisotropic features exist in the layered flood deposits of the Hanford formation, which drape across the Cold Creek flood bar (see Figures 1.1 and 3.3). Hanford formation strata appear to dip north and east off the north side of the bar into Gable Gap―the expected direction for lateral movement of moisture and effluents within the vadose zone (Serne et al. 2010).
A large window occurs in central Gable Gap where the uppermost Saddle Mountains Basalt members (Elephant Mountain, Pomona, Asotin, and Esquatzel Members) were locally eroded away by the ancestral Columbia River as well as cataclysmic megafloods (Figure 7.1). This is an area for potential comingling of groundwater from unconfined and confined aquifers. The potential for aquifer intercommunication within this erosional window has long been recognized (Strait and Moore 1982; Graham et al. 1984; Jensen 1987; Spane and Webber 1995). However, vertical head differences measured between the confined and unconfined aquifers suggests that any local groundwater contamination will not travel far within interbeds of the Ellensburg Formation. While groundwater may be locally driven into the upper-basalt confined aquifer system due to previous water-table mounding conditions within the Gable Gap area, this groundwater will likely discharge back into the overlying unconfined aquifer due to the reversal in vertical hydraulic head conditions (Graham et al. 1984; Jensen 1987; Spane and Webber 1995).
Figure 7.2 shows the elevation of the water table in the study area; also shown is the stratigraphic unit in contact with the top of the unconfined aquifer. Groundwater, following the regional gradient, enters the study area from the west. The steep gradient just east of the 200 West Area is the result of groundwater flow being restricted to the lower-hydraulic-conductivity Ringold Formation sediments. However, the hydraulic gradient flattens rapidly to the east where the Ringold Formation is eroded below the water table. Here, the unconfined aquifer lies mostly within higher hydraulic conductivity sediments of the Cold Creek unit and Hanford formation. The flow of groundwater appears to divide in the 200 East Area, with some of the flow going north through Gable Gap and the remainder continuing east to southeast through the central and southern portions of the 200 East Area (beyond the southern boundary of Figure 7.2). Because of the extremely low hydraulic gradient conditions in this area, the exact location of the groundwater divide is difficult to delineate; however, based on currently available data, the general divide appears to lie near the northwest corner of the 200 East Area.
As mentioned, the extremely flat gradient in the vicinity of Gable Gap is a reflection of the relatively high hydraulic conductivity for the Hanford formation and Cold Creek unit gravel-dominated facies in this area. In general, the Hanford formation has a hydraulic conductivity that is frequently an order of magnitude (or more) greater than the Ringold Formation (Bjornstad 1990; Thorne et al. 2006). The Cold Creek unit gravel-dominated facies (CCUg) are of an intermediate hydraulic conductivity. Thus, the ability to transmit groundwater is greatest in the relatively young, coarse-grained Hanford formation, followed by the CCUg subunit, in contrast with the low-K Ringold and Ellensburg Formations.

7.2
Figure 7.1. Location of window eroded through the upper flows of Columbia River Basalt Group within Gable Gap

7.3
Figure 7.2. Distribution of stratigraphic units encountered at the 2009 water table. Arrows indicate flow of groundwater in the unconfined aquifer under the present flow regime. Flow occurs along buried Paleochannels D, E, and F shown in Figure 6.3.
The thickness of the unconfined aquifer is highly variable across Gable Gap (Figure 7.3). This is due to the irregular, tectonically deformed and eroded surface at the top of basalt (see Figure 2.5). The unconfined aquifer is relatively thick in the northwestern portion of the study area where erosion was most extreme. However, the amount of erosion decreases to the south and therefore so does the aquifer thickness. The thickness of unconfined aquifer thins to only a few feet or less, including the less-eroded high points along Paleochannels D, E, and F (Figure 6.3) discussed previously in Section 6.2. Because of a limited number of wells in the area of question, considerable uncertainty exists on the configuration of the paleochannels and top of basalt. Thus, there could be areas across the basalt divide that are incised deeper into the basalt, resulting in a localized conduits for the preferential flow of groundwater.

7.4
Figure 7.3. Aquifer thickness (in meters) map in the vicinity of Gable Gap. Thickness is based on the difference between the 2009 site-wide groundwater table and estimated top of basalt map shown in Figure 2.5. Blue arrows show possible groundwater flow paths across Gable Gap along buried paleochannels. Dashed red line marks the high basalt divide that separates the Wahluke and Cold Creek synclinal structural basins. Green rectangle marks critical area of uncertainty for the future of contaminated groundwater moving through Gable Gap.
Note that the thickness of the unconfined aquifer, represented in Figure 7.3, includes all strata down
to the top of basalt, which includes the uppermost sedimentary interbed of the Ellensburg Formation in the area of the erosional window shown in Figure 7.1. Because of its impermeable, fine-grained, and semi-lithified nature, the Ellensburg Formation may behave more like an aquitard than an aquifer. If so, then the true unconfined aquifer thickness would be something less than that represented in Figure 7.3 in the area of the erosional window.
Groundwater appears to flow northward through Gable Gap via one or more paleochannels eroded into basalt (Figure 7.3). At least three paleochannels (D, E, and F) transect Gable Gap (see Figure 6.3). In some places, these channels are many tens of feet deep (e.g., see hydrogeologic cross sections B-B’ and C-C’ in Appendix A). Elsewhere, along the lengths of the paleochannels, the top of basalt rises toward the water table. Significant thinning of the aquifer along these paleochannels occurs at the basalt divide well south of Gable Gap (red dashed line in Figure 7.3). The thinning of the unconfined aquifer near this divide is apparent along the west side of the hydrogeologic cross section D-D’ (Figure A.5).
Among the paleochannels that transect Gable Gap, Paleochannel E is interpreted here to be completely cut off from the flow of groundwater under the present hydrologic regime, although some investigators believe the northern of two Tc-99 plumes in Figure 2.5 is evidence for contaminated
F
ED

7.5
groundwater flowing through this paleochannel. However, Paleochannel D definitely appears to be transferring groundwater across Gable Gap to the northwest. This is based on historical contaminant flow associated with tritium, and more recently with detection of Tc-99 and I-129 (DOE/RL 2010). The southern of two Tc-99 plumes (Figure 2.5) is believed coincident with Paleochannel D.
Groundwater may also be moving northwestward through Gable Gap along Paleochannel F as well. However, the rate of groundwater flow may be significantly reduced in comparison to Paleochannel D considering the flow of groundwater is through low-K Ringold Formation sediments. Furthermore, if groundwater flows through Paleochannel F it does not appear to be impacted by any Hanford waste-management activities.
Groundwater levels in Gable Gap wells have fluctuated considerably since artificial recharge at the Hanford Site began around 1944 (Figure 7.4). These reflect changes in discharges to ground in the vicinity of the 200 East Area (Figure 7.5). Groundwater levels increased dramatically and steadily from 1954 to 1963, reaching a maximum between 1968-1969. This spike in water levels was the result of groundwater mounding associated with discharges to Gable Mountain pond. Maximum water levels were followed by a temporary low between 1978-1979 when artificial recharge was significantly reduced (Serne et al. 2010). Another rise in the water table occurred in 1986-1987 associated with increased discharge to the B Pond system, just east of the 200 East Area (see Figure 7.3 for location). Hanford Site well-water levels have been steadily declining since 1990, when wastewater discharges to the ground were terminated. Water levels have dropped an average rate of ~0.5 ft/y (0.14 m/y) in the northern portion of the 200 East Area since the cessation of these disposal practices (Horton 2007). The rate of decline can be expected to diminish as the water table continues to drop to pre-Hanford levels. As the water table approaches pre-Hanford levels, groundwater flow northwestward through Gable Gap may be more restricted to the incised portion of Paleochannel D. Eventually, the flow of groundwater may be diverted away from Gable Gap altogether if water levels continue to decline across the basalt divide within Gable Gap. However, because of a limited number of wells in the area of question, considerable uncertainty exists on the configuration of the Paleochannel D and the top of basalt (represented by a green rectangle in Figure 7.3). Therefore, the possibility exists there could be localized areas along the basalt divide that are incised deeper and therefore might transport groundwater indefinitely. Significant relief is known to exist in other eroded areas exposed by cataclysmic Ice Age floods (e.g., see Figure 6.4).
As groundwater levels continue to decline in the region, most groundwater flow may eventually be diverted from flowing through Gable Gap. However, localized flow may continue indefinitely in the vicinity of Paleochannel D if there are any as-yet undetected, locally deeper channels across the basalt divide shown in Figure 7.3.

7.6
Figure 7.4. Selected hydrographs of Gable Gap wells open to the unconfined aquifer (Hanford formation). Present water levels appear to be a few feet (1 m) above pre-Hanford Site (1944) conditions, after once being almost 15 ft (4.6 m) above the pre-Hanford Site water level.
Figure 7.5. Discharge history for the B Pond and the Gable Mountain Pond systems. Source: Horton (2008).
Liquid Discharges to 200 East Area Ponds
0.00E+00
5.00E+09
1.00E+10
1.50E+10
2.00E+10
2.50E+10
3.00E+10
1945 1950 1955 1960 1965 1970 1975 1980 1985 1990
Year
Volu
me
(lite
rs)
B PondGable Mountain Pond

8.1
8.0 Conclusions
Gable Gap has a complex geologic history based on the long record of tectonism, erosion, and deposition located in an ancient water gap of the Columbia River. The following provides a synopsis of Gable Gap’s geologic history.
Gable Gap’s origins go back to the Miocene Epoch when lava flows of Columbia River basalt blanketed the area. Simultaneous with emplacement of the lava flows was north-south tectonic compression, which resulted in the growth of the YFB including the Umtanum Ridge-Gable Mountain anticline. This central anticline bisects the Pasco Basin and includes the second-order, en echelon folds of Gable Mountain and Gable Butte, which slowly uplifted between lava eruptions. This is indicated by the thickness of the lava flows and sedimentary interbeds of the Ellensburg Formation, which thin over the anticlinal ridges. More and more time separated basalt eruptions, so that towards the end of Columbia River basalt time, hundreds of thousands to millions of years separated basalt flows until the last flow covered the gap about 10.5 million years ago. Following basalt volcanism, the Umtanum Ridge-Gable Mountain uplift continued its long-term average slow growth.
The ancestral Columbia River continued to slowly fill the subsiding synclinal basins north and south of Gable Mountain/Gable Butte with sediments of the Ringold Formation (Fecht et al. 1987; DOE 1988; Lindsey 1995). During much of the Ringold time period, the Columbia River maintained a channel southeastward through the central Pasco Basin including Gable Gap (Fecht et al. 1987; Lindsey 1996). Aggradation of the Ringold Formation continued for another 7 million years, slowly filling in the Pasco Basin with fluvial and lacustrine sediments. During some of the Ringold time period, it appears the antecedent Columbia River may have flowed over bedrock to expose the Columbia River basalt across the axis of the Umtanum Ridge-Gable Mountain anticline within Gable Gap. Several of the upper basalt layers, along with intercalated sedimentary interbeds of the Ellensburg Formation, were locally removed along the crest of the tightly folded and fractured anticline during this time (Figure 8.1, Stage A). Infilling of the ancestral Columbia River channels with Ringold-age deposits suggest the earliest channels developed during the Ringold time interval.
Suddenly (with respect to geologic time) about 3 million years ago, infilling of the synclinal basins ceased and the Columbia River began to erode and incise back down into the Ringold Formation, removing much of the sediment previously deposited from the center of the basin. (The area known as White Bluffs is an erosional remnant of the former Ringold surface.) The cause for the incision is believed to be the result of regional tectonic uplift and Cascade volcanism associated with the ancestral Cascade Range, or perhaps the downstream breaching of a volcanic dam in the Columbia River Gorge (Fecht et al. 1987). Within a relatively short time, the Columbia River found a new base level that was ~500 ft (150 m) lower than at the end of the Ringold time period.
The ancestral post-Ringold Columbia River continued to flow through Gable Gap into early Cold Creek time (Figure 8.1, Stage A). Along the new channel, the Columbia River partially backfilled low areas with additional fluvial-channel deposits, creating the Cold Creek unit. A train of Cold Creek gravels spreads out southeast of Gable Gap, marking the former path of the Columbia River through the central Hanford Site. The transition from gravel-dominated to silt-dominated sediments of the Cold Creek unit marks the shift of the ancestral Columbia River out of Gable Gap and into the Wahluke syncline north of Gable Mountain (Figure 8.1, Stage B). The cause for this dramatic, permanent shift in the river channel

8.2
may have been due to tectonic uplift along the Umtanum Ridge-Gable Mountain structure. With the river channel out of the gap, fluvial overbank deposits (CCUz) would have begun to accumulate within the abandoned Gable Gap.
gg.chron.comp.jpg
Figure 8.1. Late-Cenozoic history and evolution of paleodrainage in the vicinity of Gable Gap
During the Ice Age (Pleistocene Epoch), massive cataclysmic floods repeatedly occurred. Erosion
and deposition by Ice Age floods had a profound effect on the Pasco Basin and overwhelmed all other geologic processes occurring during or since the Pleistocene. The exact age of the earliest Ice Age floods to pass through the Pasco Basin is unknown. The oldest documented floods were at least 780,000 years ago (Bjornstad et al. 2001; Pluhar et al. 2006), although the first floods may have occurred closer to the beginning of the Ice Age around 2.6 million years ago. Evidence for the earliest floods has since either been eroded away by a hundred or more younger floods, or lies buried beneath the cover of younger flood

8.3
deposits. The Ice Age was not a single climatic event―instead, glacial periods were cyclic, occurring about every 100,000 years over at least the last million years (Figure 8.2). Ice Age floods may be associated with each major glacial advance. In between glacial cycles were several tens of thousands of years of interglacial conditions similar to those of today. It is possible the earliest cycles going back to the beginning of the Pleistocene Epoch were not as regular or well behaved as the last cycles shown in Figure 8.2.
Figure 8.2. Ice Age floods in geologic time. The Ice Age, equivalent to the Pleistocene Epoch, lasted from 2.6 million years ago until about 15,000 years ago. Source: Bjornstad (2006).

8.4
Intense erosion occurred with the earliest Ice Age floods as they squeezed through the narrowed hydraulic constriction at Gable Gap. Locally, the floods scoured out deep rock basins and potholes in the uppermost basalt flows and interbeds (e.g., wells 6-55-60 and 6-55-55 in cross section C-C’ [Figure A.4]). This resulted in the local removal of all pre-existing suprabasalt sediments along the narrowest section of the gap. In the south part of Gable Gap, the floods shaped a cohesive, flood-resistant sequence of CCUz into an elongated mound, reminiscent of those eroded by Missoula floods within the Channeled Scabland (see Figure 4.8). The streamlined island, capped with a thick cover of cohesive silt, effectively protected an underlying Cold Creek unit gravel sequence and Ringold Formation sediments from flood erosion at the core of the islands (see Figures 2.2, 4.7, A.2, and A.5). Seismic-reflection data also support the presence of remnant, pre-Hanford-formation mounds in the subsurface (Repasky et al. 2009).
Several huge flood bars, including the Cold Creek, Priest Rapids, and Gable Mountain bars, probably began developing with the first floods early in the Pleistocene age (see Figure 8.1, Stage C). Erosional flood channels and streamlined islands capped with CCUz in Gable Gap were eventually buried as each flood deposited more sediment and the flood bars expanded and prograded east from Umtanum Ridge (see Figure 3.3). Eventually the bars expanded across Gable Gap, covering the older flood channels and streamlined hills with younger flood-bar deposits (Figure 8.1, Stage D). Even though the Columbia River had permanently shifted north, subsequent Ice Age floods continued to periodically flow through Gable Gap, reworking and carving shallow channels into the flood deposits. The configuration of the flood bars and channels from the last Ice Age flood about 15,000 years ago is as it appears today (see Figure 6.2). Since the end of the Ice Age, only minor changes to Gable Gap have been those caused by localized wind deposition or by humans.
Today, basalt extends above the water table and groundwater from the Central Plateau moves through Gable Gap within one or more paleochannels eroded into the basalt (Figure 8.3). If groundwater levels continue to decline, groundwater flow to the northwest of the 200 East Area through Gable Gap may become more restricted or cut off as water levels drop across the buried basalt divide. However, other as-yet unidentified deeper channels across the basalt divide may allow for flow of groundwater to continue indefinitely.

8.5
Figure 8.3. Areas of suspected groundwater flow through Gable Gap from the Central Plateau. Flow appears to be occurring along deeply buried paleochannels within the Gap (Paleochannels D, E, and F in Figure 6.3). Flow continues via a Paleochannel D from the northwest corner of the 200 East Area. Flow through Paleochannels E and F may also be moving through Gable Gap. Red dotted line marks maximum elevation along a basalt divide.

9.1
9.0 References
Ault TD. 1981. “Appendix D – Geophysical Investigations of the Gable Mountain-Gable Butte Area.” Appendix in Subsurface Geology of the Cold Creek Syncline Area, eds CW Myers and SM Price. RHO-BWI-ST-14, Rockwell Hanford Operations, Richland, Washington, pp. D-1 to D-24.
Baker VR. 1978. “Large-scale Erosional and Depositional Features of the Channeled Scabland.” Chapter in The Channeled Scabland, eds VR Baker and D Nummedal. National Aeronautics and Space Administration, Washington D.C., pp. 186.
Baker VR and RC Bunker. 1985. “Cataclysmic Late Pleistocene Flooding from Glacial Lake Missoula: A Review.” Quaternary Science Reviews 4:1-41.
Baker VR, BN Bjornstad, AJ Busacca, KR Fecht, EP Kiver, UL Moody, JG Rigby, DF Stradling, and AM Tallman. 1991. “Quaternary Geology of the Columbia Plateau.” Chapter in Quaternary Nonglacial Geology: Conterminous U.S./With Plates (Geology of North America), ed. RB Morrison. Series: The Geology of North America; v. K-2. Geological Society of America, Boulder, Colorado.
Bjornstad BN. 1980. “Sedimentology and Depositional Environment of the Touchet Beds, Walla Walla River Basin, Washington.” Eastern Washington University Master’s Thesis, Cheney, Washington, 83 p.
Bjornstad BN. 1990. Geohydrology of the 218-W-5 Burial Ground, 200-West Area, Hanford Site. PNL-7336, Pacific Northwest Laboratory, Richland, Washington.
Bjornstad BN. 2006. On the Trail of the Ice-Age Floods: A Geological Field Guide to the Mid-Columbia Basin. Keokee Company Publishing, Inc., Sandpoint, Idaho, pp. 307.
Bjornstad, BN, KR Fecht, and CJ Pluhar. 2001. “Long History of Pre-Wisconsin, Ice Age Cataclysmic Floods: Evidence from Southeastern Washington State.” Journal of Geology 109:695-713.
Black RF. 1979. Clastic Dikes of the Pasco Basin, Southeastern Washington. RHO-BWI-C-64, Rockwell Hanford Operations, Richland, Washington.
Brown, CF, RE Clayton, JP Icenhower, W Um, BN Bjornstad et al. 2007. Characterization of Direct-Push Vadose Zone Sediments from the 241-B and 241-BX Tank Farms. PNNL-17162, Pacific Northwest National Laboratory, Richland, Washington.
DOE. 1988. Site Characterization Plan: Reference Repository Location, Hanford Site, Washington. DOE/RW-0164, Vol. 1, U.S. Department of Energy, Washington, D.C.
DOE/RL. 2002. Standardized Stratigraphic Nomenclature for the Post-Ringold-Formation Sediments Within the Central Pasco Basin. DOE/RL-2002-39, Rev. 0, U.S. Department of Energy, Richland Operations Office, Richland, Washington.
DOE/RL. 2010. Hanford Site Groundwater Monitoring and Performance Report for 2009. DOE/RL-2010-11, Rev. 1, U.S. Department of Energy, Richland Operations Office, Richland, Washington.

9.2
Fecht KR. 1978. Geology of Gable Mountain-Gable Butte Area. RHO-BWI-LD-5, Rockwell Hanford Operations, Richland, Washington.
Fecht KR, SP Reidel, and AM Tallman. 1987. “Paleodrainage of the Columbia River System on the Columbia Plateau of Washington State - A Summary.” Chapter in Selected Papers on the Geology of Washington, JE Schuster, ed., Washington Division of Geology and Earth Resources, Bulletin 77, pp. 219-248.
Fecht KR and DC Weekes. 1996. Geologic Field Inspection of the Sedimentary Sequence at the Environmental Restoration Disposal Facility. BHI-00230, Bechtel Hanford, Inc., Richland, Washington.
Fecht KR, BN Bjornstad, DG Horton, GV Last, SP Reidel, and KA Lindsey. 1999. Clastic Injection Dikes of the Pasco Basin and Vicinity: Geologic Atlas Series. BHI-01103, Rev. 0, Bechtel Hanford, Inc., Richland, Washington.
Graham MJ, GV Last, and KR Fecht. 1984. An Assessment of Aquifer Intercommunication in the B Pond-Gable Mountain Pond Area of the Hanford Site. RHO-RE-ST-12P, Rockwell Hanford Operations, Richland, Washington.
Hoffman KM, SJ Trent, KA Lindsey, and BN Bjornstad. 1992. Summary of the Geology of the 200-BP-1 Operable Unit. WHC-SD-EN-TI-037, Westinghouse Hanford Company, Richland, Washington.
Holmes GE and TH Mitchell. 1981. “Appendix B-Seismic-Reflection and Multilevel Aeromagnetic Surveys in the Cold Creek Syncline Area.” Chapter in Subsurface Geology of the Cold Creek Syncline Area, eds CW Myers and SM Price. RHO-BWI-ST-14, Rockwell Hanford Operations, Richland, Washington, pp. B-1 to B-56.
Horton DG. 2007. Data Package for Past and Current Groundwater Flow and Contamination Beneath Single-Shell Tank Waste Management Areas. PNNL-15837, Pacific Northwest National Laboratory, Richland, Washington.
Horton DG. 2008. “Appendix H: Past and Current Groundwater Flow and Contamination Beneath Shell Tank Waste Management Areas.” (Published in 2007 as PNNL-15837). In The Resource Conservation and Recovery Act Facility Investigation (RFI) Report for Hanford Single-Shell Tank Waste Management Areas, DOE/ORP-2008-01, Rev. 0, Vol. Tier 2, ed. FM Mann. U.S. Department of Energy, Office of River Protection, Richland, Washington.
Jensen EJ. 1987. An Evaluation of Aquifer Intercommunication Between the Unconfined and Rattlesnake Ridge Aquifers on the Hanford Site. PNL-6313, Pacific Northwest Laboratory, Richland, Washington.
Last GV, BN Bjornstad, MP Bergeron, DW Wallace, DR Newcomer, JA Schramke, MA Chamness, CS Cline, SP Airhart, JS Wilbur. 1989. Hydrogeology of the 200 Areas Low-Level Burial Grounds - An Interim Report. PNL-6820, 2 volumes, Pacific Northwest Laboratory, Richland, Washington.
Lindenmeier CW, RJ Serne, BN Bjornstad, GV Last, DC Lanigan, MJ Lindberg, RE Clayton, VL Legore, IV Kutnyakov, SR Baum, KN Geiszler, MM Valenta, and TS Vickerman. 2002. Characterization of Vadose Zone Sediment: Borehole C3103 Located in the 216-B-7A Crib Near the B Tank Farm. PNNL-14128, Pacific Northwest National Laboratory, Richland, Washington.

9.3
Lindenmeier CW, RJ Serne, BN Bjornstad, GW Gee, HT Schaef, DC Lanigan, MJ Lindberg, RE Clayton, VL Legore, IV Kutnyakov, SR Baum, KN Geiszler, CF Brown, MM Valenta, TS Vickerman, and LJ Royack. 2003. Characterization of Vadose Zone Sediment: RCRA Borehole 299-E33-338 Located Near the B-BX-BY Waste Management Area. PNNL-14121, Rev. 1, Pacific Northwest National Laboratory, Richland, Washington.
Lindsey KA. 1995. “Miocene- to Pliocene-Aged Suprabasalt Sediments of the Hanford Site, South-Central Washington.” BHI-00184, Bechtel Hanford, Inc., Richland, Washington.
Lindsey KA. 1996. “The Miocene to Pliocene Ringold Formation and Associated Deposits of the Ancestral Columbia River System, South-Central Washington and North-Central Oregon.” Open-File Report 96-8, Washington Division of Geology and Earth Resources, Department of Natural Resources, Olympia, Washington.
Lindsey KA, BN Bjornstad, J Lindberg, and KM Hoffman. 1992. Geologic Setting of the 200 East Area: An Update. WHC-SD-EN-TI-012, Rev. 0, Westinghouse Hanford Company, Richland, Washington.
Martin BH, HL Petcovic, and SP Reidel. 2005. Goldschmidt Conference 2005: Field Trip Guide to the Columbia River Basalt Group. PNNL-15221, Pacific Northwest National Laboratory, Richland, Washington.
McKee EH, DA Swanson, and TL Wright. 1977. Duration and Volume of Columbia River Basalt Volcanism: Washington, Oregon, and Idaho, Geological Society of America, Abstracts with Programs, Vol. 9, no. 4, p. 463-464.
Myers CW and SM Price, eds. 1979. Geologic Studies of the Columbia Plateau: A Status Report. RHO-BWI-ST-4, Rockwell Hanford Operations, Richland, Washington.
O’Connor JE. 1993. “Hydrology, Hydraulics, and Geomorphology of the Bonneville Flood.” GSA Special Paper No. 274, Geological Society of America, Boulder, Colorado, pp. 83.
Petersen RE. 1992. Hydrologic and Geologic Data Available for the Region North of Gable Mountain, Hanford Site, Washington. WHC-SD-EN-TI-006, Westinghouse Hanford Company, Richland, Washington.
Pluhar CJ, BN Bjornstad, SP Reidel, RS Coe, and PB Nelson. 2006. “Magnetostratigraphic Evidence from the Cold Creek Bar for Onset of Ice-Age Cataclysmic Floods in Eastern Washington During the Early Pleistocene.” Quaternary Research 65:123-135.
PSPL - Puget Sound Power and Light Company. 1982. Skagit/Hanford Nuclear Project, Preliminary Safety Analysis Report, v. 4, App. 20, Amendment 23. Puget Sound Power and Light Company, Bellevue, Washington.
Reidel SP. 1984. “The Saddle Mountains: The Evolution of an Anticline in the Yakima Fold Belt.” American Journal of Science 284:942-978.

9.4
Reidel SP and KR Fecht. 1981. “Wanapum and Saddle Mountains Basalts of the Cold Creek Syncline Area.” Chapter in Subsurface Geology of the Cold Creek Syncline Area, eds CW Myers and SM Price. RHO-BWI-ST-14, Rockwell Hanford Operations, Richland, Washington.
Reidel SP and MA Chamness. 2007. Geology Data Package for the Single-Shell Tank Waste Management Areas at the Hanford Site. PNNL-15955, Pacific Northwest National Laboratory, Richland, Washington.
Repasky TR, ER Hyde, CA Link, and MA Speece. 2009. Landstreamer/Gimbaled Geophone Acquisition of High-Resolution Seismic Reflection Data North of the 200 Areas – Hanford Site. SGW-43746, Rev. 0, prepared for the U.S. Department of Energy by CH2M HILL Plateau Remediation Company, pp. 68.
Rhoads K, BN Bjornstad, RE Lewis, SS Teel, KJ Cantrell, RJ Serne, JL Smoot, CT Kincaid, and SK Wurstner. 1994. Estimation of the Release and Migration of Lead Through Soils and Groundwater at the Hanford Site 218-E-12B Burial Ground. PNL-8356, Vol. 1, Pacific Northwest Laboratory, Richland, Washington.
Serne RJ, GV Last, GW Gee, HT Schaef, DC Lanigan, CW Lindenmeier, MJ Lindberg, RE Clayton, VL Legore, RD Orr, IV Kutnyakov, SR Baum, KN Geiszler, CF Brown, MM Valenta, and TS Vickerman. 2002. Characterization of Vadose Zone Sediment: Borehole 299-E33-45 Near BX-102 in the B-BX-BY Waste Management Area. PNNL-14083, Pacific Northwest National Laboratory, Richland, Washington.
Serne RJ, BN Bjornstad, GW Gee, HT Schaef, DC Lanigan, RG McCain, CW Lindenmeier, RD Orr, VL LeGore, RE Clayton, MJ Lindberg, IV Kutnyakov, SR Baum, KN Geiszler, MM Valenta, TS Vickerman, LJ Royack. 2003. Characterization of Vadose Zone Sediment: Borehole 299-E33-46 Near B 110 in the B BX-BY Waste Management Area. PNNL-14119, Pacific Northwest National Laboratory, Richland, Washington.
Serne RJ, BN Bjornstad, PD Thorne, JM Keller, DC Lanigan, JN Christensen, and GS Thomas. 2010. Conceptual Models for Migration of Key Groundwater Risk Contaminants Through the Vadose Zone and Into the Upper Unconfined Aquifer Below the B-Complex. PNNL-19277, Pacific Northwest National Laboratory, Richland, Washington.
Shaw J, M Munro-Stasuik, B Sawyer, C Beaney, J-E Lesemann, A Musacchio, B Rains, and RR Young. 1999. “The Channeled Scabland: Back to Bretz.” Geology 27:605-608.
Smith GA. 1993. “Missoula Flood Dynamics and Magnitudes Inferred Form Sedimentology of Slack-Water Deposits on the Columbia Plateau.” Geological Society of America Bulletin 195:77-100.
Spane FA and WD Webber. 1995. Hydrochemistry and Hydrogeologic Conditions Within the Hanford Site Upper-Basalt Confined Aquifer System. PNL-10817, Pacific Northwest Laboratory, Richland, Washington.
Strait SR and BA Moore. 1982. “Geohydrology of the Rattlesnake Ridge Interbed in the Gable Mountain Pond Area.” RHO-ST-38, Rockwell Hanford Operations, Richland, Washington.

9.5
Tallman AM, KR Fecht, MC Marratt, and GV Last. 1979. Geology of the Separations Areas, Hanford Site, South-Central Washington. RHO-ST-23, Rockwell Hanford Operations, Richland, Washington.
Tallman AM, JT Lillie, and KR Fecht. 1981. “Suprabasalt Sediments of the Cold Creek Syncline Area.” Chapter in Subsurface Geology of the Cold Creek Syncline Area, eds CW Myers, and SM Price. RHO-BWI-ST-14, Rockwell Hanford Operations, Richland, Washington, pp. 2.1-2.28.
Thorne PD, MP Bergeron, MD Williams, and VL Freedman. 2006. Groundwater Data Package for Hanford Assessments. PNNL-14753, Rev. 1, Pacific Northwest National Laboratory, Richland, Washington.
Vermeul VR, CR Cole, MP Bergeron, PD Thorne, and SK Wurstner. 2001. Transient Inverse Calibration of Sitewide Groundwater Model to Hanford Operational Impacts from 1943 to 1996 – Alternative Conceptual Model Considering Interaction with Uppermost Basalt Confined Aquifer. PNNL-13623, Pacific Northwest National Laboratory, Richland, Washington.
Waitt RB Jr. 1980. “About Forty Last-Glacial Lake Missoula Jokulhlaups Through Southern Washington.” Journal of Geology 88:653-679.
Waitt, RB Jr. 1985. “Case for Periodic, Colossal Jokulhlaups from Pleistocene Glacial Lake Missoula.” Geological Society of America Bulletin 96:1271-1286.
WHC – Westinghouse Hanford Company. 1992. Geologic Setting of the 200 East Area: An Update. WHC-SD-EN-TI-012, Rev. 0, prepared by BN Bjornstad, Pacific Northwest Laboratory; and KA Lindsey, JW Lindberg, KM Hoffman, and MP Connelly, Westinghouse Hanford Company, Richland, Washington.
Williams, BA, BN Bjornstad, R Schalla, and WD Webber. 2000. Revised Hydrogeology for the Suprabasalt Aquifer System, 200 East Area and Vicinity, Hanford Site, Washington. PNNL-12261, Pacific Northwest National Laboratory, Richland, Washington.
Wood MJ, TE Jones, R Schalla, BN Bjornstad, and SM Narbutovskih. 2000. Subsurface Conditions Description of the B-BX-BY Waste Management Area. HNF-5507, Rev. 0, CH2M HILL Hanford Group, Inc., Richland, Washington.

Appendix A
Hydrogeologic Cross Sections

A.1
A.1
Figure A.1. Cross-section location map

A.3
Figure A.2. Hydrogeologic cross section A-A’

A.5
Figure A.3. Hydrogeologic cross section B-B’

A.7
Figure A.4. Hydrogeologic cross section C-C’

A.9
Figure A.5. Hydrogeologic cross section D-D’

A.11
Figure A.6. Hydrogeologic cross section E-E’

Appendix B
Structure-Contour Maps Based on EarthVision® Model

B.1
Figure B.1. Top of the Hanford formation H1 (upper gravel-dominated) unit. Contour interval = 25 ft (7.6 m)

B.2
Figure B.2. Top of the Hanford formation H2 (sand-dominated) unit. Contour interval = 25 ft (7.6 m)

B.3
Figure B.3. Top of the Hanford formation H3 (lower gravel-dominated) unit. Contour interval = 25 ft (7.6 m).

B.4
Figure B.4. Top of the Cold Creek unit (undifferentiated). Contour interval = 25 ft (7.6 m).

B.5
Figure B.5. Top of the Cold Creek silt (CCUz) subunit. Contour interval = 25 ft (7.6 m).

B.6
Figure B.6. Top of the Cold Creek gravel (CCUg) subunit. Contour interval = 25 ft (7.6 m).

B.7
Figure B.7. Top of the Ringold Formation (undifferentiated). Contour interval = 25 ft (7.6 m).

B.8
Figure B.8. Base of the suprabasalt sediments (top of the Columbia River Basalt Group and Ellensburg Formation – undifferentiated). Contour interval = 25 ft (7.6 m).

Appendix C
Isopach Maps Based on EarthVision® Model

C.1
Figure C.1. Total thickness of the Hanford formation (undifferentiated). Contour interval = 20 ft (6.1 m).

C.2
Figure C.2. Thickness of the Hanford formation H1 (upper gravel-dominated) unit. Contour interval = 20 ft (6.1 m).

C.3
Figure C.3. Thickness of the Hanford formation H2 (sand-dominated) unit. Contour interval = 20 ft (6.1 m).

C.4
Figure C.4. Thickness of the Hanford formation H3 (lower gravel-dominated) unit. Contour interval = 20 ft (6.1 m).

C.5
Figure C.5. Total thickness of the Cold Creek unit (undifferentiated). Contour interval = 20 ft (6.1 m).

C.6
Figure C.6. Thickness of the Cold Creek silt (CCUz) subunit. Contour interval = 20 ft (6.1 m).

C.7
Figure C.7. Thickness of the Cold Creek gravel (CCUg) subunit. Contour interval = 20 ft (6.1 m).

C.8
Figure C.8. Total thickness of the Ringold Formation (undifferentiated). Contour interval = 20 ft (6.1 m).

C.9
Figure C.9. Thickness of the Elephant Mountain Member basalt. Contour interval = 20 ft (6.1 m).

C.10
Figure C.10. Thickness of the Rattlesnake Ridge interbed (uppermost Ellensburg Formation). Contour interval = 20 ft (6.1 m).

Appendix D
Three-dimensional EarthVision® Model

D.1
Figure D.1. Base of the suprabasalt sediments (top of Columbia River Basalt Group and Ellensburg Formation - undifferentiated). Oblique view looking northwest. Vertical exaggeration = 5X.
Figure D.2. Distribution of the Ringold Formation (undifferentiated). Oblique view looking northwest. Vertical exaggeration = 5X.

D.2
Figure D.3. Distribution of the Cold Creek gravel (CCUg) subunit. Oblique view looking northwest. Vertical exaggeration = 5X.
Figure D.4. Distribution of the Cold Creek silt (CCUz) subunit. Oblique view looking northwest. Vertical exaggeration = 5X.

D.3
Figure D.5. Distribution of the Hanford formation H3 (lower gravel-dominated) unit. Oblique view looking northwest. Vertical exaggeration = 5X.
Figure D.6. Distribution of the Hanford formation H2 (sand-dominated) unit. Oblique view looking northwest. Vertical exaggeration = 5X.

D.4
Figure D.7. Distribution of the combined Hanford formation H1 (upper gravel-dominated) unit and overlying Holocene deposits. Oblique view looking northwest. Vertical exaggeration = 5X.

Appendix E
Borehole Information and Tops of Stratigraphic Unit Contacts
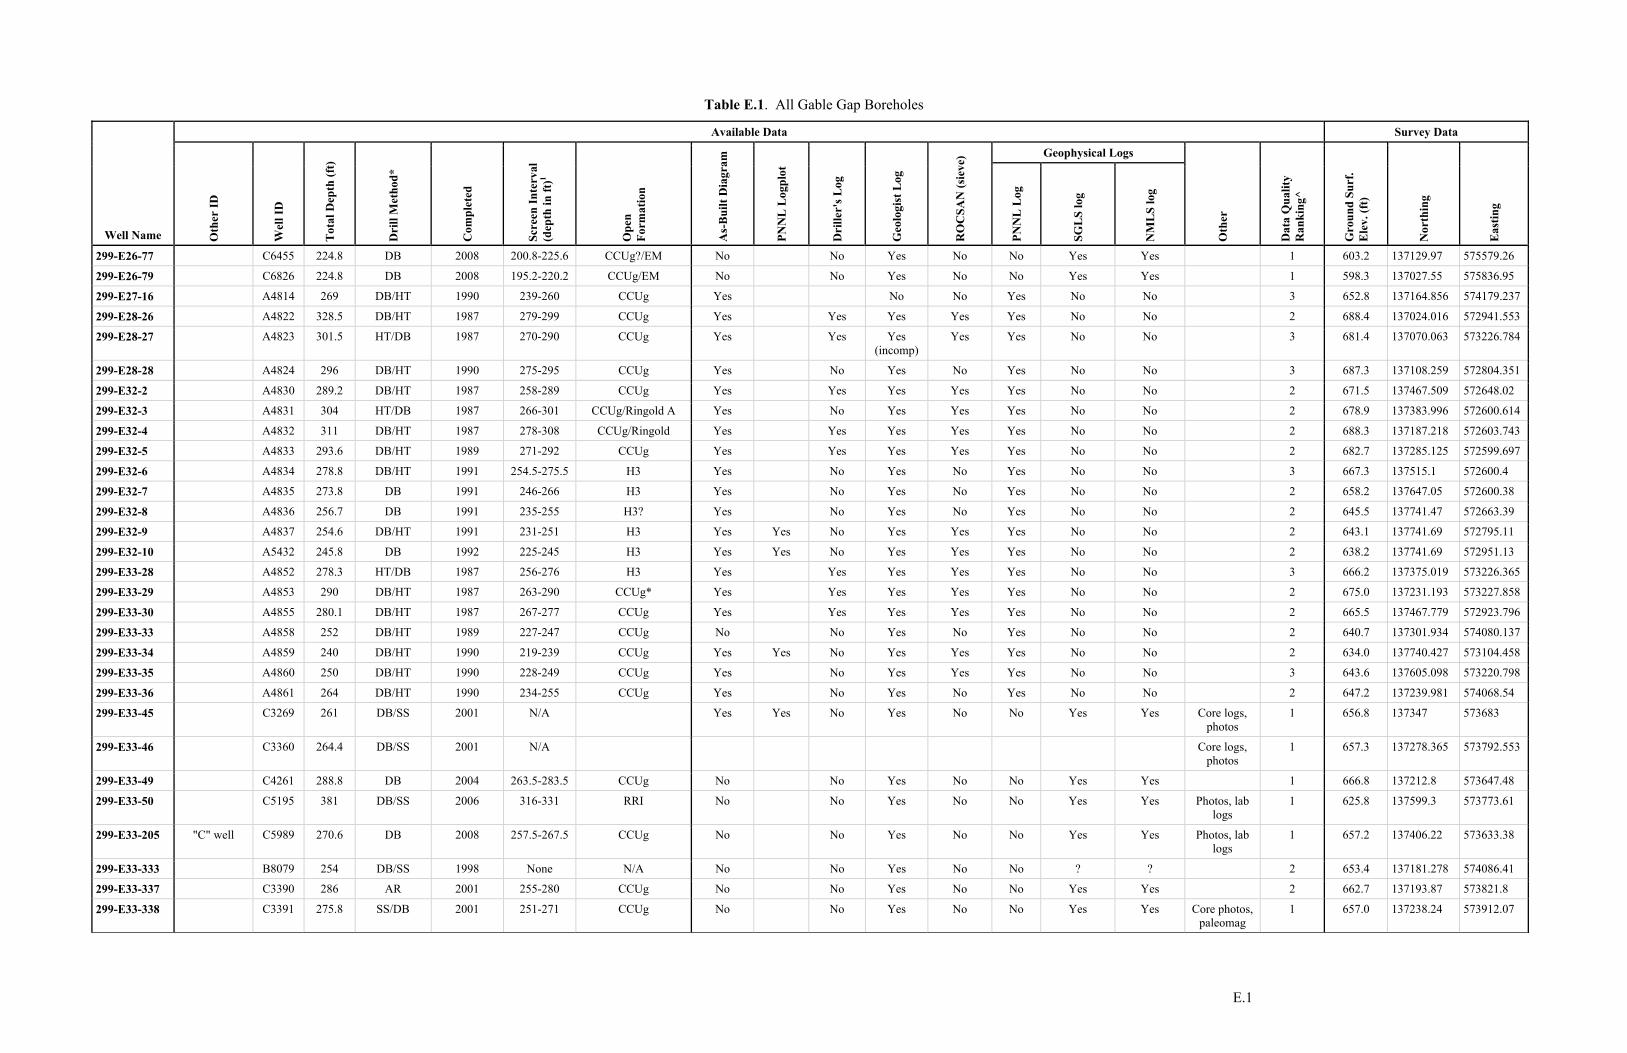
E.1
Table E.1. All Gable Gap Boreholes
Well Name
Available Data Survey Data
Oth
er ID
Wel
l ID
Tot
al D
epth
(ft)
Dri
ll M
etho
d*
Com
plet
ed
Scre
en In
terv
al
(dep
th in
ft)1
Ope
n
Form
atio
n
As-
Bui
lt D
iagr
am
PNN
L L
ogpl
ot
Dri
ller'
s Log
Geo
logi
st L
og
RO
CSA
N (s
ieve
) Geophysical Logs
Oth
er
Dat
a Q
ualit
y R
anki
ng^
Gro
und
Surf
. E
lev.
(ft)
Nor
thin
g
Eas
ting
PNN
L L
og
SGL
S lo
g
NM
LS
log
299-E26-77 C6455 224.8 DB 2008 200.8-225.6 CCUg?/EM No No Yes No No Yes Yes 1 603.2 137129.97 575579.26
299-E26-79 C6826 224.8 DB 2008 195.2-220.2 CCUg/EM No No Yes No No Yes Yes 1 598.3 137027.55 575836.95
299-E27-16 A4814 269 DB/HT 1990 239-260 CCUg Yes No No Yes No No 3 652.8 137164.856 574179.237
299-E28-26 A4822 328.5 DB/HT 1987 279-299 CCUg Yes Yes Yes Yes Yes No No 2 688.4 137024.016 572941.553
299-E28-27 A4823 301.5 HT/DB 1987 270-290 CCUg Yes Yes Yes (incomp)
Yes Yes No No 3 681.4 137070.063 573226.784
299-E28-28 A4824 296 DB/HT 1990 275-295 CCUg Yes No Yes No Yes No No 3 687.3 137108.259 572804.351
299-E32-2 A4830 289.2 DB/HT 1987 258-289 CCUg Yes Yes Yes Yes Yes No No 2 671.5 137467.509 572648.02
299-E32-3 A4831 304 HT/DB 1987 266-301 CCUg/Ringold A Yes No Yes Yes Yes No No 2 678.9 137383.996 572600.614
299-E32-4 A4832 311 DB/HT 1987 278-308 CCUg/Ringold Yes Yes Yes Yes Yes No No 2 688.3 137187.218 572603.743
299-E32-5 A4833 293.6 DB/HT 1989 271-292 CCUg Yes Yes Yes Yes Yes No No 2 682.7 137285.125 572599.697
299-E32-6 A4834 278.8 DB/HT 1991 254.5-275.5 H3 Yes No Yes No Yes No No 3 667.3 137515.1 572600.4
299-E32-7 A4835 273.8 DB 1991 246-266 H3 Yes No Yes No Yes No No 2 658.2 137647.05 572600.38
299-E32-8 A4836 256.7 DB 1991 235-255 H3? Yes No Yes No Yes No No 2 645.5 137741.47 572663.39
299-E32-9 A4837 254.6 DB/HT 1991 231-251 H3 Yes Yes No Yes Yes Yes No No 2 643.1 137741.69 572795.11
299-E32-10 A5432 245.8 DB 1992 225-245 H3 Yes Yes No Yes Yes Yes No No 2 638.2 137741.69 572951.13
299-E33-28 A4852 278.3 HT/DB 1987 256-276 H3 Yes Yes Yes Yes Yes No No 3 666.2 137375.019 573226.365
299-E33-29 A4853 290 DB/HT 1987 263-290 CCUg* Yes Yes Yes Yes Yes No No 2 675.0 137231.193 573227.858
299-E33-30 A4855 280.1 DB/HT 1987 267-277 CCUg Yes Yes Yes Yes Yes No No 2 665.5 137467.779 572923.796
299-E33-33 A4858 252 DB/HT 1989 227-247 CCUg No No Yes No Yes No No 2 640.7 137301.934 574080.137
299-E33-34 A4859 240 DB/HT 1990 219-239 CCUg Yes Yes No Yes Yes Yes No No 2 634.0 137740.427 573104.458
299-E33-35 A4860 250 DB/HT 1990 228-249 CCUg Yes No Yes Yes Yes No No 3 643.6 137605.098 573220.798
299-E33-36 A4861 264 DB/HT 1990 234-255 CCUg Yes No Yes No Yes No No 2 647.2 137239.981 574068.54
299-E33-45 C3269 261 DB/SS 2001 N/A Yes Yes No Yes No No Yes Yes Core logs, photos
1 656.8 137347 573683
299-E33-46 C3360 264.4 DB/SS 2001 N/A Core logs, photos
1 657.3 137278.365 573792.553
299-E33-49 C4261 288.8 DB 2004 263.5-283.5 CCUg No No Yes No No Yes Yes 1 666.8 137212.8 573647.48
299-E33-50 C5195 381 DB/SS 2006 316-331 RRI No No Yes No No Yes Yes Photos, lab logs
1 625.8 137599.3 573773.61
299-E33-205 "C" well C5989 270.6 DB 2008 257.5-267.5 CCUg No No Yes No No Yes Yes Photos, lab logs
1 657.2 137406.22 573633.38
299-E33-333 B8079 254 DB/SS 1998 None N/A No No Yes No No ? ? 2 653.4 137181.278 574086.41
299-E33-337 C3390 286 AR 2001 255-280 CCUg No No Yes No No Yes Yes 2 662.7 137193.87 573821.8
299-E33-338 C3391 275.8 SS/DB 2001 251-271 CCUg No No Yes No No Yes Yes Core photos, paleomag
1 657.0 137238.24 573912.07

E.2
Table E.1. (contd)
Well Name
Available Data Survey Data
Oth
er ID
Wel
l ID
Tot
al D
epth
(ft)
Dri
ll M
etho
d*
Com
plet
ed
Scre
en In
terv
al
(dep
th in
ft)1
Ope
n
Form
atio
n
As-
Bui
lt D
iagr
am
PNN
L L
ogpl
ot
Dri
ller'
s Log
Geo
logi
st L
og
RO
CSA
N (s
ieve
) Geophysical Logs
Oth
er
Dat
a Q
ualit
y R
anki
ng^
Gro
und
Surf
. E
lev.
(ft)
Nor
thin
g
Eas
ting
PNN
L L
og
SGL
S lo
g
NM
LS
log
299-E33-340 "G" Well C5853 325.7 CT/AR 2008 308.2-323.2 RRI No Yes No Yes No Yes Yes Lab char., hi-res photos
1 617.9 137766.194 573779.325
299-E33-341 "D" well C5856 237 DB/SS 2008 223-233 CCUg No No Yes No No Yes Yes Photos, lab logs
1 627.5 137652.5 573565.21
299-E33-342 "E" well C5857 245.5 DB 2008 232.6-242.6 CCUg No No Yes No No Yes Yes Photos, lab logs
1 636.9 137579.96 573625.68
299-E33-343 "A" well C5858 263.8 DB 2008 250-260 CCUg No No Yes No No Yes Yes Photos, lab logs
1 652.3 137382.25 573743.98
299-E33-345 "Br" well C6226 263.8 DB 2008 249.7-259.7 CCUg No No Yes No No Yes Yes Photos, lab logs
1 653.2 137388.24 573780.87
299-E34-2 A4877 241.5 HT 1987 222-242 CCUg No No Yes Yes Yes No No 2 632.6 137220.694 574634.81
299-E34-5 A4880 190.5 HT 1987 170-190 CCUg Yes No Yes Yes Yes No No 2 592.6 137743.332 574643.809
299-E34-7 A4882 205.5 HT/DB 1989 194-204 CCUg? Yes Yes Yes No Yes No No 3 604.7 137357.745 575274.184
299-E34-9 A4884 234.5 BH/DB 1991 212-232 CCUg? Yes No Yes No Yes No No CaCo3, moisture
2 629.3 137429.82 574186.02
299-E34-11 A4876 219.3 DB 1991 207.5-2117.5 CCUg Yes No Yes No Yes No No CaCo3, moisture
2 618.1 137581.78 574176.16
299-E35-1 A4885 193.8 DB/HT 1989 181-192 H1 Yes Yes Yes 0-80' Yes No No 2 598.8 137464.956 575459.729
299-W11-88 C5572 490.2 Sonic/rotary 2008 445-485 No No Yes No No Yes No 1 725.5 137113.09 567874.67
299-W12-1 A4912 314 CT 1956 274-309 (P) Yes Yes No Yes No No No 4 727.6 137206.116 568331.248
699-44-64 A5188 452 DB/HT 1960 316-360 (P) Yes Yes No Yes No No No 3 726.7 136897.43 570390.65
699-45-42 699-46-43 A5195 195 CT 1948 158-180 ? Yes Yes No No No No No 4 579.2 137286.372 577055.094
699-45-69C C5574 455 Rotary/sonic 2007 367-382 Ringold No No Yes No No Yes No 2 727.3 137233.81 568947.12
699-47-42 BWIP DB-15 A8749 1971 CT/MR 1979 None N/A Yes No Not for post-basalt sediments
No 5 470.9 137909.026 577156.481
699-47-46A A5200 207 CT 1961 168-181 Hanford fm and basalt Yes Yes No 10-200' No No No 3 581.7 137820.739 575869.826
699-47-50 A5201 295 CT 1980 260-295 RRI No Yes No 265-295' No No No 4 585.1 137887.166 574798.717
699-47-51 A8752 167 CT 1959 None N/A No Yes No 0-160' Yes 4 585.0 137953.171 574352.297
699-47-60 A5202 287 CT 1948 250-287 Hanford/CCUg/CRB Yes Yes Yes No 5-250' No No No 3 652.3 137968.732 571474.38
699-48-48A ARH-DC-1 A8768 5661 MR 1972 None N/A No No No No No No 5 575.0 138112.7 575196.576
699-48-48B BWIP DC-2 A8769 3374 CT 1977 None N/A No Yes Yes No No No 4 573.1 138104.005 575179.031
699-48-49 A8770 ? ? ? ? ? No No No No No No No No 5 572.5 138113.13 574951.895
699-48-50 A5212 197 DB/HT 1990 160-180 Hanford No No No Yes No Yes No No 2 574.6 138227.088 574817.584
699-48-50B C5196 215.2 DB 2006 204.2-214.5 Ringold/CRB No Yes No Yes No No Yes Yes 138056.941 1 608.8 138044.28 573334.48
699-48-71 A5214 305 CT 1956 239-302 Ringold Yes Yes No Yes No No No 4 690.3 138056.941 568387.914
699-49-55A A5217 149 HT/DB 1961 124-139 Ringold/CRB Yes Yes No No No No No 4 531.8 138351.781 573146.301

E.3
Table E.1. (contd)
Well Name
Available Data Survey Data
Oth
er ID
Wel
l ID
Tot
al D
epth
(ft)
Dri
ll M
etho
d*
Com
plet
ed
Scre
en In
terv
al
(dep
th in
ft)1
Ope
n
Form
atio
n
As-
Bui
lt D
iagr
am
PNN
L L
ogpl
ot
Dri
ller'
s Log
Geo
logi
st L
og
RO
CSA
N (s
ieve
) Geophysical Logs
Oth
er
Dat
a Q
ualit
y R
anki
ng^
Gro
und
Surf
. E
lev.
(ft)
Nor
thin
g
Eas
ting
PNN
L L
og
SGL
S lo
g
NM
LS
log
699-49-55B A5218 227 CT/AR 1982 175-226 CRB/RRI Yes Yes Yes No No No No No 4 531.8 138350.879 573138.718
699-49-57A A5219 168 HT/AR 1956 144-161 (P) CCUg Yes Yes No 5-168' No No 3 554.3 138389.24 572544.276
699-49-57B A5220 230.4 DB/HT 1990 220-230 RRI No Yes No Yes Yes No No 2 556.5 138381.034 572536.452
699-49-71 A9918 30 DB 1993 None N/A No Yes No No No 5 138223 568580
699-50-42 A5224 125 CT 1955 53-64 (P); 110-115'
Ringold;CRB Yes Yes No 5-65' No No No 3 468.4 138786.691 577111.013
699-50-45 A5225 178 CT/AR 1980 133-178 RRI Yes Yes No 135-175' (RRI)
No No No 3 452.6 138783.367 576172.755
699-50-48A BWIP DDH-1 A8812 1,165 CT/RC 1955/1969 None N/A Yes Yes Yes No 5-170' No No No 3 553.4 138684.761 575154.969
699-50-48B A5226 250 CT/AR 1980 210-250 RRI Yes Yes No 225-250' (RRI)
No No No 3 552.0 138715.913 575390.732
699-50-53A A5227 185 CT 1955 142-159 Hanford Yes Yes No 5-185' No No No 3 558.3 138670.477 573649.666
699-50-53B A5228 225 DB/SS 1990 215-225 RRI No No Yes Yes No No 2 558.4 138659.519 573655.45
699-50-56 C5197 164.1 DB 2006 151-161 Ringold No Yes No Yes No No Yes Yes Photos, core log
1 551.8 138841.55 572748.21
699-50-59 C4882 173.2 BH 2005 163-168 Hanford No Yes No Yes No No No No Core log 2 564.6 138741.72 571946.9
699-50-74 C4697 338.8 BH 2005 ? ? No No Yes No No Yes No 2 658.3 138646.73 567359.52
699-51-46 699-51-47 A5230 168 AR/HT 1980 113-163 RRI Yes Yes No 125-165' (RRI)
No No No 4 446.0 139001.588 575738.496
699-51-63 A5231 184.5 CT 1956 157-183 Hanford Yes Yes No 5-185 No No No 3 573.4 139148.408 570664.4
699-52-46A A5234 225 CT/AR 1980 175-225 RRI Yes Yes Yes No 175-225' (RRI)
No No No 3 457.2 139358.005 575903.296
699-52-46B A8841 44 CT 1980 39-44 Hanford? Yes Yes No No No No No 4 ? 139395 575952.5
699-52-48 A5235 197 CT/AR 1980 153-195 RRI Yes Yes No 155-190' (RRI)
No No No 3 468.6 139195.665 575231.474
699-52-52 BWIP DB-5 A8842 903 AR/RC 1974 None N/A Yes Yes Yes 5-145' No No No 3 560.8 139293.862 573920.523
699-52-54 A5236 168.6 DB/HT/SS 1990 156-166 Hanford No No Yes No Yes No No 2 568.9 139193.172 573254.242
699-52-55 699-52-55A; "N" well
C5861 183.3 DB 2007 170-180 CCUg No Yes No Yes No No Yes yes Photos 1 574 139443.2 573102.44
699-52-55B "H" well C5862 292 DB 2008 228.5-243.5 RRI No Yes No Yes No No Yes Yes Core log (RRI)
1 573.7 139440.66 573102.17
699-52-57 699-51-56 A5237 165.5 DB/SS/HT 1991 149-159 CCUg Yes Yes No Yes No Yes No No 2 561.7 139115.316 572761.346
699-53-47A A5239 41.5 DB/HT 1966 22-33 Hanford Yes Yes No No No No No 4 439.2 139489.296 575417.545
699-53-48A A5241 53 DB/HT 1984 None N/A Yes Yes No No No No No 4 443.4 139593.885 575338.712
699-53-48B A5242 44 CT 1984 24-44 Hanford/CCUz Yes Yes No No No No No 4 443.6 139595.705 575336.306
699-53-50 A5243 194 HT/AR 1980 144-194 RRI Yes Yes No 160-190' (RRI)
Yes No No 3 445.8 139700.592 574584.129
699-53-55A A5244 455 CT 1961 165-280 (P) Hanford/RRI Yes Yes No No No No No 4 577.3 139631.884 573115.859

E.4
Table E.1. (contd)
Well Name
Available Data Survey Data
Oth
er ID
Wel
l ID
Tot
al D
epth
(ft)
Dri
ll M
etho
d*
Com
plet
ed
Scre
en In
terv
al
(dep
th in
ft)1
Ope
n
Form
atio
n
As-
Bui
lt D
iagr
am
PNN
L L
ogpl
ot
Dri
ller'
s Log
Geo
logi
st L
og
RO
CSA
N (s
ieve
) Geophysical Logs
Oth
er
Dat
a Q
ualit
y R
anki
ng^
Gro
und
Surf
. E
lev.
(ft)
Nor
thin
g
Eas
ting
PNN
L L
og
SGL
S lo
g
NM
LS
log
699-53-55B A5245 252 AR 1975 232-252 (P) Hanford Yes Yes No No No No No 4 577.6 139624.964 573110.622
699-54-42 A5250 210 CT 1948 100-145 (P), 180-200 (P)
RRI Yes Yes No 85-210' No No No 4 513.4 140099.176 576933.16
699-54-45A A5251 105 CT 1971 95-105 Hanford Yes Yes No 5-105 No No No 3 494.7 140001.429 576314.759
699-54-45B A8862 314 HT/AR 1980 299-314 Ellensburg/CRB Yes Yes Yes No No No No No 4 495.3 140015.663 576316.062
699-54-48 A5252 101 CT 1984 42-62 Yes Yes No No No No No 4 458.1 139821.176 575357.767
699-54-49 A8863 62 HT 1984 32-52 Hanford Yes Yes Yes No No No No 3 441.2 139825.684 574988.009
699-54-57 A5253 321 HT/AR 1955, 1982 159-180 (P), 236-321
Hanford/CRB/Selah Interbed
Yes Yes Yes No 5-199 Yes No No 3 577 140029.626 572619.411
699-55-40 A5255 145 CT 1971 135-145 Ringold Yes Yes No 5-145 No No No 4 543.3 140346.524 577550.24
699-55-44 A5256 160 DB/HT 1971 140-150 Ringold or RRI Yes Yes No No No No No 4 520.9 140384.107 576565.593
699-55-50A A8865 110 CT 1948 40-100 (P) Hanford Yes Yes No 5-110' No No No 3 444.9 140245.044 574642.279
699-55-50D A8867 100 CT 1956 33-90 (P) Hanford Yes Yes No No Yes No No 3 442.2 140248.355 574596.5
699-55-55 A5258 312 DB/SS/HT 1990 148-169 Hanford No Yes No Yes No Yes No No 2 563.8 140150.538 573227.561
699-55-57 A5259 180 AR 1975 139-169 (P) CCUg Yes Yes Yes No 0-175' Yes No No 3 569 140119.853 572445.432
699-55-60A A8868 233 HT 1943 190-230 Hanford Yes No No No No No No 4 574.2 140268.28 571563.5
699-55-60B A8869 288 HT 1944 230-285 Hanford Yes Yes No No No Yes No No 4 576.0 140366.395 571550.483
699-55-63 A8871 198 CT 1944 None N/A Yes Yes No No No No No No 4 573.0 140265.131 570758.372
699-55-65A A8872 136 CT 1944 None N/A Yes No No No No No No 4 581.0 140262.888 569953.789
699-55-65B A8873 146 CT 1944 None N/A Yes Yes No No No No No No 4 581.0 140323.845 569953.617
699-55-65C A8874 146 CT 1944 ? ? No No No No No No No 5 581.0 140262.956 569978.17
699-55-70 A5260 205 CT 1948 136-202 (P) Ringold Yes Yes No 5-205' No No No 3 571.0 140318.965 568529.958
699-56-42A Golder #GH-7 A8885 245 AR/RC 1981 None N/A No No Yes No No No No 2 535.3
699-56-42B Golder #GH-9 A8886 250 AR/RC 1981 None N/A No No Yes No No No No 2 546.8
699-56-42C Golder #GH-11
A8887 354 AR/RC 1981 None N/A No No Yes No No No No 2 530.8 140474.664 577186.675
699-56-42D Golder #GH-18
A8888 670 AR 1981 None N/A No No Yes No No No No 3 562.6
699-56-42E Golder #GH-19
A8889 700 AR/MR 1981 None N/A No No Yes No No No No 3 541.1
699-56-42F Golder #GH-21
A8890 520 AR 1981 None N/A No No Yes No No No No 3 578.1
699-56-43 A5264 155 DB/HT 1971 145-155 CRB/Ellensburg Yes Yes Yes No 5-150' Yes No No 3 540.9 140627.536 576756.291
699-56-51 699-56-50 A8891 105 HT 1984 55-105 Hanford Yes Yes No No No No No 3 440.5 140605.596 574312.679
699-56-53 699-57-53 A5265 270 HT/AR 1982 190-270 EM/RRI Yes Yes Yes No No No No No 3 435.9 140650.663 573794.188
699-57-41A Golder #GH-14
A8896 512 AR 1981 None N/A No No Yes No No No No 3 707.0

E.5
Table E.1. (contd)
Well Name
Available Data Survey Data
Oth
er ID
Wel
l ID
Tot
al D
epth
(ft)
Dri
ll M
etho
d*
Com
plet
ed
Scre
en In
terv
al
(dep
th in
ft)1
Ope
n
Form
atio
n
As-
Bui
lt D
iagr
am
PNN
L L
ogpl
ot
Dri
ller'
s Log
Geo
logi
st L
og
RO
CSA
N (s
ieve
) Geophysical Logs
Oth
er
Dat
a Q
ualit
y R
anki
ng^
Gro
und
Surf
. E
lev.
(ft)
Nor
thin
g
Eas
ting
PNN
L L
og
SGL
S lo
g
NM
LS
log
699-57-41B Golder #GH-15
A8897 461 AR 1981 None N/A No No Yes No No No No 3 710.6
699-57-41C Golder #GH-16
A8898 430 AR 1981 None N/A No No Yes No No No No 3 709.3
699-57-41E Golder #GH-22
A8900 554 AR 1981 None N/A No No Yes No No No No 3 698.4
699-57-41F Golder #GH-23
A8901 608 AR/RC 1981 None N/A No No Yes No No No No 2 707.6 140986.334 577362.842
699-57-59 A5269 190.5 DB 1980 166-186 CCUg or Ringold No Yes Yes Yes 0-188' Yes No No 2 576.6 140923.719 571830.216
699-58-41A Golder #GH-1 A8908 274 AR/RC 1980 None N/A No No Yes No No No No 2 709.9
699-58-41B Golder #GH-2 A8909 225 AR/RC 1980 None N/A No No Yes No No No No 2 704.0
699-58-41C Golder #GH-3 A8910 130 AR 1980 None N/A No No Yes No No No No 3 702.9
699-58-41D Golder #GH-4 A8911 79 AR/RC 1980 None N/A No No Yes No No No No 2 701.8
699-58-41E Golder #GH-13
A8912 390 AR 1981 None N/A No No Yes No No No No 3 700.4 141188.31 577473.22
699-58-41F Golder #GH-20
A8913 600 AR/MR 1981 None N/A No No Yes No No No No 3 699.5 141051.482 577435.757
699-58-48 A8914 ? ? ? ? ? No No No No No No No 5 ? 141153.4 575262.6
699-59-55 BWIP DH-10 A8918 145 AR 1976 None N/A Yes No No No No No No 5 432.2 141544.108 573049.268
699-59-58 GBM-8 A5277 117 CT 1972 85-105 Hanford Yes Yes Yes No 60-110' Yes No No 3 498.8 141414.963 572273.618
699-60-53B CH-2 A8922 160 RC 1980 None N/A Yes No No No No No No 5 ? 141766.917 573722.707
699-60-53C CH-3 A8923 150 RC 1980 None N/A Yes No No No No No No 5 ?
699-60-53F CH-6 A8926 290 RC 1980 None N/A Yes No No No No No No 5 821.0
699-60-57 A5280 155 HT 1972 60-70, 127-147
Hanford, Hanford/Ringold
Yes Yes Yes No 40-143' Yes No No 3 470.6 141870.325 572623.495
699-60-59 BWIP DC-18 A5281 1561 CT/RC 1986 None N/A Yes Yes Yes No Yes No No 2 509.2 141854.447 572038.132
699-60-60 A5282 133 CT 1948 100-127 (P) Hanford Yes Yes Yes No No No No No 4 513 141763.907 571588.581
699-61-53 BWIP DC-11 A8932 385 RC 1978 None N/A Yes No Yes No No No No 3 764.8 141978.102 573714.117
699-61-55A BWIP DH-8A A8933 249 RC 1976 None N/A Yes No Yes No No No No 3 463.0 141983.739 573009.153
699-61-55B BWIP DH-8B A8934 327 AR/CT 1976 None N/A No No No No No No No 5 464.1
699-61-57 BWIP DB-9 A8935 589 RC 1977 490-589 Mabton Yes No Yes No No No No 3 444 142435.066 572608.219
699-61-62 GBM-1 A5285 188 DB/HT 1972 86-100 (P) Hanford Yes Yes Yes Yes No Yes No No 2 497.9 141921.659 570914.859
699-61-66 A5286 225 CT 1955 105-160 Hanford/Ringold Yes Yes Yes No 5-225' Yes No No 3 523.9 142007.963 569787.591
699-62-43B A8940 68 CT 1959 3-50 (P) Hanford Yes Yes No No Yes No No 3 422.4 142488.248 576805.215
699-62-53 BWIP DC-10 A8953 456 RC 1977 None N/A No No Yes No No No No 3 439.4 142518.932 573646.175
699-63-51 GM-17 A5290 36 CT 1971 18-31 (P) Hanford/Ringold Yes Yes No 5-35' No No No 3 425.4 142553.674 574446.762
699-63-55 A5291 121 DB/HT 1972 23-65 (P) Hanford Yes Yes No Yes No No No 3 427.1 142562.319 573094.386

E.6
Table E.1. (contd)
Well Name
Available Data Survey Data
Oth
er ID
Wel
l ID
Tot
al D
epth
(ft)
Dri
ll M
etho
d*
Com
plet
ed
Scre
en In
terv
al
(dep
th in
ft)1
Ope
n
Form
atio
n
As-
Bui
lt D
iagr
am
PNN
L L
ogpl
ot
Dri
ller'
s Log
Geo
logi
st L
og
RO
CSA
N (s
ieve
) Geophysical Logs
Oth
er
Dat
a Q
ualit
y R
anki
ng^
Gro
und
Surf
. E
lev.
(ft)
Nor
thin
g
Eas
ting
PNN
L L
og
SGL
S lo
g
NM
LS
log
699-63-58 A5292 133 DB/HT 1972 80-120 Hanford Yes Yes Yes No 55-118' No No No 3 493.3 142583.069 572262.686
699-64-62 GBM-2 A5296 116 DB/HT 1972 90.5-110.5 Ringold? Yes Yes Yes No 5-116 Yes No No 3 500.6 142913.859 571055.768
699-65-50 A5300 585 CT 1955 55-85 (P) Hanford/Ringold Yes Yes No 5-585' No No No 3 468.9 143187.852 574590.787
699-65-59A A5301 200 CT 1958 170-190 (P) Ringold? Yes Yes No 5-200' Yes No No 4 508.5 143278.674 571913.723
699-65-59B A8960 200 AR 1976 100-190 (P) Ringold? Yes Yes No No Yes No No 3 507.6
699-65-59C A8961 140 AR 1976 100-140 (P) Ringold? Yes Yes No No Yes No No 3 506.1
699-65-72 A5302 216 CT ? 137-157 (P) Hanford? Yes No No No No No No 5 541.1 143107.924 567883.669
699-66-64 GBM-3 A5310 118 CT 1972 96-116 Hanford? Yes Yes Yes No 5-116' No No No 4 506.7 143734.119 570290.742
699-67-51 A5312 250 CT 1961 184-194^, 230-235^
Yes Yes No No No No No 4 525.0 143933.215 574178.927
699-69-45 A8967 300 DB/HT 1961 97-117, 152-178, 210-235, 255-277^
Ringold Yes Yes No 0-300' No No No 3 487.8 144556.307 576157.407
699-70-68 A5319 149 CT 1954 126-147 (P) Ringold Yes Yes No 5-145' No No No 3 527.0 144845.401 569021.847
699-71-52 A5321 210 CT 1954 120-160 Ringold Yes Yes No Yes No No No 3 524.7 145214.843 573907.901
699-72-73 A5323 200 DB/HT 1961 60-176 (P) Hanford/Ringold Yes Yes No No No No No 4 483.5 145418.782 567551.544
699-73-61 699-74-60 A5327 150 CT 1962 107-146 (P) Hanford/Ringold Yes Yes No No No No No 3 533.1 145781.525 571420.823
*AR = air rotary (P) perforated BH = Becker hammer ^ piezometer CT = cable tool DB = drive barrel HT = hard tool MR = mud rotary RC = rotary core SS = split spoon
^1 = best 5 = worst
Surface Elev. Brass Cap Survey Ground Surface Survey Disc_Z TOC - Recorded Stickup TOC – Assumed 2.5 ft stickup

E.7
Table E.1. (contd)
Well Name
Contact Depths (ft) Contact Elevations (ft) Thickness (ft)
CommentsHol
ocen
e
Top
H1
Top
H2
Top
H3
Top
CC
U
Top
CC
Uz
Top
CC
Ug
Top
Rin
gold
TO
B
Bas
alt M
embe
r
Dee
per
Con
tact
s
Hol
ocen
e
Top
H1
Top
H2
Top
H3
Top
CC
U
Top
CC
Uz
Top
CC
Ug
Top
Rin
gold
TO
B
Hol
ocen
e
Han
ford
fm
H1
H2
H3
CC
U
CC
Uz
CC
Ug
Rin
gold
Fm
Ele
phan
t Mtn
Rat
tlesn
ake
Rid
ge In
terb
ed
299-E26-77 0 3 NP 178? NP 178? NP 205.5 603 600 NP 425? NP 425? NP 397.7 3 175? 175? NP NP 27 0 27 NP Geophys. Anomaly from 178-183 = top of CCUg?
299-E26-79 0 1 NP NP 163 NP 163 NP 207 597 597 NP 435? NP 435? NP 391 1 162 162 NP NP 44? 0 44? NP
299-E27-16 NP 0 37 NP 205 NP 205 NP 269 NP 653 616 NP 448 NP 448 NP 383.8 0 205 37 168 NP 64 NP 64 NP
299-E28-26 NP 0 70 225 ? NP ? NP 326 NP 688 618 463 ? NP ? NP 362.4 0 ? 70 155 ? ? NP ? NP
299-E28-27 NP 0 45 190? 235? NP 235? NP ETD NP 681 636 491? 446? NP 446? NP ETD 0 235? 45 145? 45? >66 NP >66 NP 150 m/day constant rate aquifer test
299-E28-28 NP 0 70 205 255? NP 255? ? ETD NP 687 617 482 432? NP 432? ? ETD 0 255? 70 135 50? >41 NP >41 ?
299-E32-2 NP 0 55 210 NP NP 287 NP 672 617 466 ? NP ? NP 384.5 0 ? 55 150 ? ? NP ? NP
299-E32-3 NP 0 60 195 ? NP ? 293 ETD NP 679 619 484 ? NP ? 386 ETD 0 ? 60 135 ? ? NP ? >11
299-E32-4 0 5 65 200 ? NP ? 297 ETD 688 683 623 488 ? NP ? 391 ETD 5 ? 60 135 ? ? NP ? >14 >264 m/day constant rate aquifer test
299-E32-5 NP 0 60 203 ? ? ETD NP 683 623 480 ? ? ? ETD 0 ? 60 143 ? ? ? ? 175 m/day slug test
299-E32-6 NP 0 55 210 ? NP ? ? ETD NP 667 612 457 ? NP ? ? ETD 0 ? 55 155 ? ? NP ? ?
299-E32-7 NP 0 60 190 ? NP ? 270 ETD NP 658 598 468 ? NP ? 388 ETD 0 >274 60 130 ? ? NP ? ?
299-E32-8 NP 0 20 166 ? ? ? ETD NP 645 625 479 ? ? ? ETD 0 ? 20 146 ? ? ? ?
299-E32-9 NP 0 39 180 ? NP ? ? ETD NP 643 604 463 ? NP ? ? ETD 0 ? 39 141 ? ? NP ? ?
299-E32-10 NP 0 50 NP 185 185 190 NP 247 NP 638 588 NP 448 448 443 NP 391.2 0 190 50 140 NP 57 5 52 NP
299-E33-28 NP 0 36 209 ? NP ? NP ETD NP 666 630 457 ? NP ? NP ETD 0 ? 36 173 ? ? NP ? NP
299-E33-29 NP 0 55 214 233 233 234 290 NP 675 620 461 442 442 441 NP 385.0 0 233 55 159 19 57 1 56 NP *>1400 m/d constant-rate aquifer test = discrepancy
299-E33-30 NP 0 56 202 224 224 227 NP 277 NP 666 610 463 441.5 441.5 438.5 NP 388.5 0 225 56 147 21 53 3 50 NP
299-E33-33 NP 0 37 202 202 216 NP 252 NP 641 604 439 439 425 NP 389 0 202 37 165 NP 50 14 36 NP
299-E33-34 NP 0 20 NP 195 195 200 NP 240 NP 634 614 NP 439 439 434 NP 394 0 195 20 175 NP 45 5 40 0
299-E33-35 NP 0 10 NP 200 200 205 NP 250 NP 644 634 NP 444 444 439 NP 394 0 200 10 190 NP 50 5 45 0
299-E33-36 NP 0 30 NP 203 203 205 NP 263.8 NP 647 617 NP 444 444 442 NP 383.4 0 203 30 173 NP 61 2 59 NP
299-E33-45 0 NP 40 NP 218 218 239 NP? ETD 657 NP 617 NP 439 439 418 NP? ETD 40 178 NP 178 NP >43 20 >23 NP? 40' backfill at surface
299-E33-46 0 NP 38.5 NP 215 215 228 NP? ETD 657 NP 619 NP 442 442 429 NP? ETD 38.5 177 NP 177 NP >49 13 >36 NP? 38 ft of backfill at surface
299-E33-49 0 45 49 NP 217 217 218 NP 283.5 667 622 618 NP 450 450 449 NP 383.5 45 172 4 168 NP 66.5 1 65.5 NP Holocene = 45' backfill
299-E33-50 0 2 11 NP 149 149 187.5 NP 233.6 Elephant Mtn
RRI = 316.5, Pomona = 375.5
626 624 615 NP 477 477 438.5 NP 392 2 147 9 138 NP 85 38.5 46 NP 83 59
299-E33-205 0 2 31 NP 221 221 238 NP 267 Elephant Mtn
657 655 626 NP 436 436 419 NP 390 2 219 29 190 NP 46 17 29 NP
299-E33-333 0 9 30 NP 173.5 173.5 212 NP? ETD 653 644 623 NP 480 480 441 NP? ETD 9 164 21 143 NP >80 38.5 >42 NP? ETD Holocene = 9' ditch fill; can't find Stoller logs
299-E33-337 NP 0 55 NP 215 NP? 215 NP 281 NP 663 608 NP 448 NP? 448 NP 382 0 215 55 160 NP 66 NP? 66 NP
299-E33-338 NP 0 51.5 NP 212.5 212.5 222 NP 271 NP 657 605.5 NP 444.5 444.5 435 NP 386 0 212.5 51.5 161 NP 58.5 10 48.5 NP

E.8
Table E.1. (contd)
Well Name
Contact Depths (ft) Contact Elevations (ft) Thickness (ft)
CommentsHol
ocen
e
Top
H1
Top
H2
Top
H3
Top
CC
U
Top
CC
Uz
Top
CC
Ug
Top
Rin
gold
TO
B
Bas
alt M
embe
r
Dee
per
Con
tact
s
Hol
ocen
e
Top
H1
Top
H2
Top
H3
Top
CC
U
Top
CC
Uz
Top
CC
Ug
Top
Rin
gold
TO
B
Hol
ocen
e
Han
ford
fm
H1
H2
H3
CC
U
CC
Uz
CC
Ug
Rin
gold
Fm
Ele
phan
t Mtn
Rat
tlesn
ake
Rid
ge In
terb
ed
299-E33-340 NP 0 33 NP 131 131 154.5 NP 226 Elephant Mtn
RRI = 298.5', Pomona = 357.5'
NP 618 585 NP 487 487 463 NP 392 0 131 33 98 NP 95 23 72 NP 73 59
299-E33-341 NP 0 40 NP 187 187 189 NP 232.5 NP 628 588 NP 441 441 439 NP 395 0 187 40 147 NP 46 2 44 NP
299-E33-342 0 NP 13 NP 189.5 189.5 189.6 NP 242.4 637 NP 624 NP 447 447 446.9 NP 394.5 13 177 0 177 NP 53 0.1 52.9 NP
299-E33-343 NP 0 37 NP 213 213 239 NP 260.9 NP 652 615 NP 439 439 413 NP 391 0 213 37 176 NP 48 26 22 NP
299-E33-345 0 20 36 NP 217 217 244 NP 260.3 653 633 617 NP 436 436 409 NP 392.9 20 197 16 181 NP 43 27 16 NP
299-E34-2 NP 0 65 NP 205 NP 205 NP ~241 NP 637 572 NP 432 NP 432 NP 396 0 205 65 140 NP 36 0 36 NP
299-E34-5 NP 0 NP NP NP NP NP NP ~190 NP 593 NP NP NP NP NP NP 403 0 190 190 NP NP NP 0 NP NP
299-E34-7 NP 0 NP NP 190? NP 190? NP 205 NP 605 NP NP 415 NP 415 NP 400 0 190 190 NP NP 15 NP 15 NP
299-E34-9 NP 0 50 NP 197? NP 197? NP 234.5 NP 629 579 NP 432? NP 432? NP 394.8 0 197? 50 147? NP 37.5 NP 37.5 NP
299-E34-11 0 20 50 NP 198? NP 198? NP 219 618 598 568 NP 420? NP 420? NP 399 20 178? 30 148? NP 21? NP 21? NP
299-E35-1 NP 0 NP NP NP NP 192 Elephant Mtn
NP 599 NP NP NP NP 406.8 NP 192 192 NP NP NP NP
299-W11-88 0 7 NP NP 70 70 NP* 155 487 726 719 NP NP 656 656 NP 571 238.5 7 63 63 NP NP 85 50 NP 332 CCUz = 70-120'; *CCUc =120-155', Rtf = 155-163', Re = 163-487'; Changed from sonic to rotary @460'
299-W12-1 NP 0 45 120 NP 190 ETD NP 728 683 608 NP 538 ETD NP 120 45 75 70 NP >190
699-44-64 NP 0 70 260? NP? 354? 410 NP 727 657 467? NP? 373? 317 0 260 70 190 94? NP 56?
699-45-42 NP 0 NP NP 160? 190 Elephant Mtn?
NP 579 NP NP NP NP 419? 389 0 160 160 NP NP 30?
699-45-69C 0 1 140 220? ? 295 455 727 726 587 507? ? 432 272 1 219 139 80 75 ? 160 Almost 40' of Rlm starting @ 325'; Ra @ 364' depth. Changed from rotary to sonic ~20 ft above basalt
699-47-42 ? ? ? NP ? ? 68 Elephant Mtn
RRI = 166', Pomona = 216', Selah, 400', Esquatzel = 426, Cold Cr. Interbed = 518', Asotin = 612', Umatilla = 665', Mabton 745', Priest Rapids = 839'
? ? ? NP ? ? 403 ? ? ? ? NP ? ? ? ? 98 50 Little or no information on post-basalt sediments
699-47-46A 0 1 NP NP NP? NP NP? NP 174 Elephant Mtn
582 581 NP NP NP? NP NP? NP 408 1 173 173 NP NP NP? NP NP? NP

E.9
Table E.1. (contd)
Well Name
Contact Depths (ft) Contact Elevations (ft) Thickness (ft)
CommentsHol
ocen
e
Top
H1
Top
H2
Top
H3
Top
CC
U
Top
CC
Uz
Top
CC
Ug
Top
Rin
gold
TO
B
Bas
alt M
embe
r
Dee
per
Con
tact
s
Hol
ocen
e
Top
H1
Top
H2
Top
H3
Top
CC
U
Top
CC
Uz
Top
CC
Ug
Top
Rin
gold
TO
B
Hol
ocen
e
Han
ford
fm
H1
H2
H3
CC
U
CC
Uz
CC
Ug
Rin
gold
Fm
Ele
phan
t Mtn
Rat
tlesn
ake
Rid
ge In
terb
ed
699-47-50 NP 0 NP NP NP? NP NP? NP 215 Elephant Mtn
RRI = 260' NP 585 NP NP NP? NP NP? NP 370 NP 215 215 NP NP NP? NP NP? NP 45 Drillers log mislabeled as 699-48-50
699-47-51 NP 0 NP NP NP NP NP NP 159 NP 585 NP NP NP NP NP NP 426 NP 159 159 NP NP NP NP NP NP No water encountered during drilling
699-47-60 0 5 NP NP 255 NP 255 NP 277.5 Elephant Mtn
652 647 NP NP 397 NP 397 NP 375 5 250 250 NP NP 22 NP 22 NP TOB reported at 284' but casing stopped at 277.5 = prob. TOB
699-48-48A NP 0 NP NP ? ? 205 Elephant Mtn
NP 575 NP NP ? ? 370 NP ? ? NP NP ? ? ? ?
699-48-48B NP 0 NP NP NP NP 205 Elephant Mtn
RRI = 244', Pomona = 292', Selah = 484', Esquatzel = 504', Cold Cr Interbed = 602', Umatilla = 695', Mabton = 835', Priest Rapds = 933'
NP 573 NP NP NP NP 368 NP 205 205 NP NP ? ? ? NP 39 48 Consolidated, open hole, brownish starting @140' = Ringold?
699-48-49 ? ? ? NP ? ? ? ? ? ? ? ? NP ? ? ? ? ? ? ? ? ? NP ? ? ? ?
699-48-50 NP 0 NP NP NP NP 195.6 Elephant Mtn
NP 575 NP NP NP NP 379 NP 196 196 NP NP NP NP NP NP Change to hard tool @177'
699-48-50B NP 0 43 NP 121 121 170? 185 209.5 Elephant Mtn
NP 609 599 NP 488 488 439? 424 399 NP 121 10 111 NP 64 49? 15? 25
699-48-71 NP 0 NP NP NP 170? ETD NP 690 NP NP NP 520? ETD NP 170 170 NP NP NP >135
699-49-55A NP 0 15 NP 50 50 99 118? 135 Elephant Mtn
NP 532 517 NP 482 482 433 ? 397 NP 50 15 35 NP 68 49 6 ? >30 ' = DB, casing stopped driving @135' = TOB?
699-49-55B NP 0 ? NP ? ? ? 105 136 Elephant Mtn
RRI = 183', Pomona = 226'
NP 532 ? NP ? ? ? 427 396 NP ? ? NP ? ? ? 31 47 43
699-49-57A 0 3 25 NP 95 95 115 NP 162 Elephant Mtn
554 551 529 NP 459 459 439 NP 392 3 42 22 20 NP 67 20 47 NP
699-49-57B 0 4 18 NP 111 111 115 NP 162.5 Elephant Mtn
RRI = 215' 556.5 553 539 NP 446 446 442 NP 394 4 107 14 93 NP 52 4 48 NP 53
699-49-71 0 3
699-50-42 NP 0 NP NP NP NP NP 38 65 Elephant Mtn
NP 468 NP NP NP NP NP 430 403 NP 38 38 NP NP NP NP NP 27 Calcareous fines from 35-45'
699-50-45 NP 0 NP NP NP NP 37 Elephant Mtn
RRI = 130' NP 453 NP NP NP NP 416 NP 37 37 NP NP NP NP NP NP 93 Air rotary through basalt from 41-134'

E.10
Table E.1. (contd)
Well Name
Contact Depths (ft) Contact Elevations (ft) Thickness (ft)
CommentsHol
ocen
e
Top
H1
Top
H2
Top
H3
Top
CC
U
Top
CC
Uz
Top
CC
Ug
Top
Rin
gold
TO
B
Bas
alt M
embe
r
Dee
per
Con
tact
s
Hol
ocen
e
Top
H1
Top
H2
Top
H3
Top
CC
U
Top
CC
Uz
Top
CC
Ug
Top
Rin
gold
TO
B
Hol
ocen
e
Han
ford
fm
H1
H2
H3
CC
U
CC
Uz
CC
Ug
Rin
gold
Fm
Ele
phan
t Mtn
Rat
tlesn
ake
Rid
ge In
terb
ed
699-50-48A NP 0 NP NP NP NP 118 Elephant Mtn
RRI = 200', Pomona = 246', Selah = 442', Esquatzel = 460', Asotin = 608', Umatilla = 666', Mabton = 794', Priest Rapids = 904'
NP 553 NP NP NP NP 435 NP 118? 118? NP NP NP? NP? NP? NP 82 46 CT to 173', deepened via RC in 1969
699-50-48B NP 0 NP NP NP NP NP NP 111 Elephant Mtn
RRI = 210', Pomona = 250'
NP 552 NP NP NP NP NP NP 441 NP 111 111 NP NP NP NP NP NP 99 40 AR from 119-213'; no bldrs, compacted starting at 45'
699-50-53A NP 0 80 NP 140 NP 140 NP 156.5 Elephant Mtn
NP 558 478 NP 418 NP 418 NP 402 NP 140 80 60 NP 16 NP 16 NP
699-50-53B NP 0 61 NP 140 NP 140 NP 155.8 Elephant Mtn
RRI = 205' NP 558 497 NP 418 NP 418 NP 403 NP 140 61 79 NP 15 NP 15 NP 49 Geologist log should be available but can't find anywhere
699-50-56 NP 0 48 NP 90 90 115 123 161 Elephant Mtn
NP 552 504 NP 462 462 437 429 391 NP 90 48 42 NP 33 25 8 38
699-50-59 0 1 NP NP NP NP 167 Elephant Mtn
565 564 NP NP NP NP 397 1 167 167 NP NP NP NP NP NP
699-50-74 0 7 NP NP NP NP NP 90? ~336 658 651 NP NP NP NP NP 568? ~322 7 83? 83 NP NP NP NP NP 123?
699-51-46 NP 0 NP NP NP NP 12 Elephant Mtn
RRI = 119', Pomona = 165'
NP 446 NP NP NP NP 434 NP 12 12 NP NP NP NP NP NP 107 46 Drill log mislabeled 51-47, HT from 0-17' and 120-163'
699-51-63 NP 0 NP NP NP NP 183.5? Elephant Mtn
NP 573 NP NP NP NP 390? NP 184 183.5 NP NP NP NP NP NP TOB or boulder?
699-52-46A NP 0 NP NP NP? 40 50 Elephant Mtn
RRI = 169', Pomona = 225'
NP 457 NP NP NP? 417 407 NP 40 40 NP NP NP? NP? NP? 10 119 56 Sticky clay @40'
699-52-46B ? ? ? NP ? ? 44 Elephant Mtn
? ? ? NP ? ? ? ? ? ? ? NP ? ? ? ?
699-52-48 0 5 NP NP NP NP 28 Elephant Mtn
RRI = 149', Pomona = 195'
469 464 NP NP NP NP 441 5 23 23 NP NP NP NP NP NP 121 46

E.11
Table E.1. (contd)
Well Name
Contact Depths (ft) Contact Elevations (ft) Thickness (ft)
CommentsHol
ocen
e
Top
H1
Top
H2
Top
H3
Top
CC
U
Top
CC
Uz
Top
CC
Ug
Top
Rin
gold
TO
B
Bas
alt M
embe
r
Dee
per
Con
tact
s
Hol
ocen
e
Top
H1
Top
H2
Top
H3
Top
CC
U
Top
CC
Uz
Top
CC
Ug
Top
Rin
gold
TO
B
Hol
ocen
e
Han
ford
fm
H1
H2
H3
CC
U
CC
Uz
CC
Ug
Rin
gold
Fm
Ele
phan
t Mtn
Rat
tlesn
ake
Rid
ge In
terb
ed
699-52-52 NP 0 NP NP NP NP 148 Elephant Mtn
RRI = 222', Pomona = 277', Selah = 462', Esquatzel = 484', Cold Cr. Interbed = 594', Asotin = 614', Umatilla = 692', Mabton = 933'
NP 561 NP NP NP NP 413 NP 148 148 NP NP NP NP NP NP 74 55
699-52-54 NP 0 92 NP NP NP 167.4 Elephant Mtn
NP 569 477 NP NP NP 402 NP 167 92 75 NP NP NP NP NP
699-52-55 0 3 123 NP 146 146 154 NP 177.2 Elephant Mtn
574 571 451 NP 428 428 420 NP 397 3 143 120 23 NP 31 8 23 NP Low-K constant-rate pump test in CCUg
699-52-55B 0 5 127 NP 144 144 158 NP 176.5 Elephant Mtn
RRI = 222', Pomona = 286'
574 569 447 NP 430 430 416 NP 397 5 139 122 17 NP 33 14 19 NP 46 64
699-52-57 NP 0 75 NP 105 105 118 NP 159.7 Elephant Mtn
NP 562 487 NP 457 457 444 NP 402 NP 105 75 30 NP 55 13 42 NP Same well as 699-51-56 (A8828)
699-53-47A NP 0 NP NP NP NP 41.5 Elephant Mtn?
NP 439 NP NP NP NP 398 NP 42 41.5 NP NP NP NP NP NP No TOB on drillers log
699-53-48A 0 1 NP NP NP NP NP 37 43 Elephant Mtn?
443 442 NP NP NP NP NP 406 400 1 36 36 NP NP NP NP NP 6
699-53-48B NP 0 NP NP NP NP NP 37 44 Elephant Mtn?
NP 444 NP NP NP NP NP 407 400 NP 37 37 NP NP NP NP NP 7
699-53-50 NP 0 NP NP NP NP 36 Elephant Mtn
RRI = 145', Pomona = 192'
NP 446 NP NP NP NP 410 NP 36 36 NP NP NP NP NP NP 109 47
699-53-55A NP 0 NP NP NP NP 258* *RRI window
RRI= 258', Pomona = 295',
NP 577 NP NP NP NP 319?* NP 258 258 NP NP NP NP NP NP NP 37 TOB may be down to 300 ft depth; Hanford fm over Ellensburg
699-53-55B 0 5 NP NP NP NP 251* *RRI window
RRI = 251' 578 573 NP NP NP NP 327?* 5 246 246 NP NP NP NP NP NP NP
699-54-42 0 15 NP NP NP 75? 100* *RRI window
RRI = 100', Pomona = 199'
513 498 NP NP NP 438? 413* 15 60? 60? NP NP NP NP NP 25? NP 99
699-54-45A NP 0 NP NP NP NP 75* *RRI window?
NP 495 NP NP NP NP 420* NP 75 75 NP NP NP NP NP NP NP
699-54-45B NP 0 NP NP NP 50 <180 ? Selah? = 304'
NP 495 NP NP NP 445 >315 NP 50 50 NP NP NP NP NP >24 74-175' undocumented across TOB

E.12
Table E.1. (contd)
Well Name
Contact Depths (ft) Contact Elevations (ft) Thickness (ft)
CommentsHol
ocen
e
Top
H1
Top
H2
Top
H3
Top
CC
U
Top
CC
Uz
Top
CC
Ug
Top
Rin
gold
TO
B
Bas
alt M
embe
r
Dee
per
Con
tact
s
Hol
ocen
e
Top
H1
Top
H2
Top
H3
Top
CC
U
Top
CC
Uz
Top
CC
Ug
Top
Rin
gold
TO
B
Hol
ocen
e
Han
ford
fm
H1
H2
H3
CC
U
CC
Uz
CC
Ug
Rin
gold
Fm
Ele
phan
t Mtn
Rat
tlesn
ake
Rid
ge In
terb
ed
699-54-48 0 4 NP NP ? ? 63* *RRI window?
RRI? = 63', Pomona? = 94'
458 454 NP NP ? ? 395* 4 ? ? NP NP ? ? ? ? NP 31 Perched water @43'
699-54-49 NP 0 NP NP NP NP NP 52 59 Elephant Mtn
NP 441 NP NP NP NP NP 389 382 NP 52 52 NP NP NP NP NP 7
699-54-57 NP 0 NP NP NP NP 181 Elephant Mtn
RRI = 248', Pomona = 309'
NP 577 NP NP NP NP 396 NP 181 181 NP NP NP NP NP NP 67 61 Deepened from 199' in 1982; driller's log mislabeled as 699-55-55
699-55-40 NP 0 NP NP NP 95? ETD NP 543 NP NP NP 448? ETD NP 95? 95? NP NP NP NP NP ?
699-55-44 0 10 NP NP NP NP ETD RRI = 100'? 521 511 NP NP NP NP 421?* 10 90? 90? NP NP NP NP NP NP >60' >100' = RRI?
699-55-50A 0 10 NP NP NP ? 100 Elephant Mtn
445 435 NP NP NP ? 345 10 90 90 NP NP NP NP NP ?
699-55-50D 0 10 NP NP NP NP 91 Elephant Mtn
442 432 NP NP NP NP 351 10 81 81 NP NP NP NP NP NP
699-55-55 0 2 NP NP NP NP 294* *Window into
Selah Interbed
564 561.8 NP NP NP NP 270* 2 292 292 NP NP NP NP NP NP NP Older well (699-54-57) from 1955 with same name, TOB = 180 ft; Window thru basalt recharges Ellensburg Fm
699-55-57 0 2 NP NP NP NP 170 Elephant Mtn
569 567 NP NP NP NP NP NP 399 2 168 168 NP NP NP NP NP NP
699-55-60A 0 4 NP NP NP NP ETD 574 570 NP NP NP NP ETD 4 ? ? NP NP NP NP NP NP
699-55-60B NP 0 NP NP NP NP 278* *Window into RRI?
NP 576 NP NP NP NP 298* NP 278 278? NP NP NP NP NP NP NP
699-55-63 NP 0 NP NP NP NP 179 Elephant Mtn
NP 573 NP NP NP NP 394.0 NP 179 179 NP NP NP NP NP NP Hole abandoned
699-55-65A 0 2 NP NP NP ? ETD 581 579 NP NP NP ? ETD 2 ? ? NP NP NP NP NP ? Hole abandoned
699-55-65B 0 2 NP NP NP 125? 140 Elephant Mtn
581 579 NP NP NP 456? 441 2 123? 123? NP NP NP NP NP 15? Hole abandoned
699-55-65C NP 0 NP NP NP 135 140 Elephant Mtn
NP 581 NP NP NP 446 441 NP 135 135 NP NP NP NP NP 5
699-55-70 0 1 NP NP NP 83? 205 Elephant Mtn?
571 570 NP NP NP 488? 366 1 82? 82? NP NP NP NP NP 122?
699-56-42A NP 0 NP NP NP NP 90 Elephant Mtn
RRI= 114' NP 535 NP NP NP NP 445 NP 90 90 NP NP NP NP NP NP 24 Picks from Golder geologist (Moser) log; Fault @180' repeats EM/RRI section?
699-56-42B NP 0 NP NP NP NP 100 Elephant Mtn
RRI = 137' NP 547 NP NP NP NP 447 NP 100 100 NP NP NP NP NP NP 37 Picks from Golder geologist (Moser) log; Fault zones from 120-137' and 160' repeats EM/RRI section?
699-56-42C NP 0 NP NP NP NP 95 Elephant Mtn
RRI = 161' NP 531 NP NP NP NP 436 NP 95 95 NP NP NP NP NP NP 66 Picks from Golder geologist (Moser) log; Fault zones from 200-210' repeats EM/RRI section?

E.13
Table E.1. (contd)
Well Name
Contact Depths (ft) Contact Elevations (ft) Thickness (ft)
CommentsHol
ocen
e
Top
H1
Top
H2
Top
H3
Top
CC
U
Top
CC
Uz
Top
CC
Ug
Top
Rin
gold
TO
B
Bas
alt M
embe
r
Dee
per
Con
tact
s
Hol
ocen
e
Top
H1
Top
H2
Top
H3
Top
CC
U
Top
CC
Uz
Top
CC
Ug
Top
Rin
gold
TO
B
Hol
ocen
e
Han
ford
fm
H1
H2
H3
CC
U
CC
Uz
CC
Ug
Rin
gold
Fm
Ele
phan
t Mtn
Rat
tlesn
ake
Rid
ge In
terb
ed
699-56-42D NP 0 NP NP NP NP 48 Elephant Mtn
RRI = 360', Pomona = 406.5', Selah = 593.5, Esquatzel = 624'
NP 563 NP NP NP NP 515 NP 48 48 NP NP NP NP NP NP 312 47 No faulting reported
699-56-42E NP 0 NP NP NP NP 85 Elephant Mtn
RRI = 180', Pomona = 395', Selah = 575', Esquatzel = 601'
NP 541 NP NP NP NP 456 NP 85 85 NP NP NP NP NP NP 95 215 Picks from Golder geologist (Moser) log; Fault zones at 229' repeats EM/RRI section?
699-56-42F NP 0 NP NP NP NP 40 Elephant Mtn
RRI = 386', Pomona = 422'
NP 578 NP NP NP NP 538 NP 40 40 NP NP NP NP NP NP 346 36 No faulting reported
699-56-43 0 NP 15 NP 53 NP 53 NP 65 Elephant Mtn?
? 541 NP 526 NP 488 NP 488 NP 475.9 15 38 NP 38 NP 12 NP 12 NP? Switch to HT @53'
699-56-51 0 2 NP NP NP NP 103 Elephant Mtn?
440.5 438.5 NP NP NP NP 337.5 2 101 101 NP NP NP NP NP NP Driller log mislabled well 699-56-50
699-56-53 NP 0 NP NP NP NP NP ? 100 Elephant Mtn
RRI = 204, Pomona = 266'
NP 436 NP NP NP NP NP ? 336 NP 42? 42? NP NP NP NP NP 58 104 62 Unclear where (or if) CCU and Ringold are present; driller log mislabeled 699-57-53
699-57-41A 0 10 NP NP NP NP 75 Pomona? Selah = 250', Esquatzel = 260, Asotin = 329', unnamed interbed = 480'
707 697 NP NP NP NP 632 10 65 65 NP NP NP NP NP NP NP NP Fault zone @ 395' produces repeated section?
699-57-41B NP 0 NP NP NP NP 65 Pomona? Selah = 203', Esquatzel = 218', Cold Cr Interbed = 283'. Asotin = 302, unnamed interbed = 416, Umatilla = 431'
NP 711 NP NP NP NP 646 NP 65 65 NP NP NP NP NP NP NP NP

E.14
Table E.1. (contd)
Well Name
Contact Depths (ft) Contact Elevations (ft) Thickness (ft)
CommentsHol
ocen
e
Top
H1
Top
H2
Top
H3
Top
CC
U
Top
CC
Uz
Top
CC
Ug
Top
Rin
gold
TO
B
Bas
alt M
embe
r
Dee
per
Con
tact
s
Hol
ocen
e
Top
H1
Top
H2
Top
H3
Top
CC
U
Top
CC
Uz
Top
CC
Ug
Top
Rin
gold
TO
B
Hol
ocen
e
Han
ford
fm
H1
H2
H3
CC
U
CC
Uz
CC
Ug
Rin
gold
Fm
Ele
phan
t Mtn
Rat
tlesn
ake
Rid
ge In
terb
ed
699-57-41C NP 0 NP NP NP NP 123 *Window into
Selah Interbed
Esquatzel = 142', Asotin = 238'
NP 709 NP NP NP NP 586 NP 123 123 NP NP NP NP NP NP NP NP
699-57-41E NP 0 NP NP NP NP 35 Pomona NP 698 NP NP NP NP 663 NP 35 35 NP NP NP NP NP NP NP NP
699-57-41F NP 0 NP NP NP NP 80 Pomona Selah = 261, Esquatzel = 272', Asotin = 440'
NP 708 NP NP NP NP 628 NP 80 80 NP NP NP NP NP NP NP NP Fault zones 190-194.5', 220', 335-357', 571-573 - repeated sections
699-57-59 0 1.5 NP NP 154 154 158 NP? ETD 576.5 575 NP NP 423 423 419 NP? ETD 1.5 152 152 NP NP >36 4 >36? NP?
699-58-41A 0 NP NP NP NP NP 15 Pomona 710 NP NP NP NP NP 695 15 NP NP NP NP NP NP NP NP NP NP 15' loess over basalt; fault zone from 110-185' repeats section of Pomona basalt
699-58-41B 0 15 NP NP NP NP 75 Pomona 704 689 NP NP NP NP 629 15 60 60 NP NP NP NP NP NP NP NP Fault zone from 155-195' repeats section of Pomona basalt
699-58-41C 0 15 NP NP NP NP 80* *Window into RRI
Pomona = 96'
703 688 NP NP NP NP 623* 15 65 65 NP NP NP NP NP NP NP 16 TOB = top RRI
699-58-41D NP 0 NP NP NP NP 18 Elephant Mtn
RRI = 49', Pomona = 72'
NP 702 NP NP NP NP 684 NP 18 18 NP NP NP NP NP NP 31 23
699-58-41E 0 NP NP NP NP NP 10 Elephant Mtn
RRI = 50', Pomona = 115', Selah = 345', Esquatzel = 365'
700 NP NP NP NP NP 690 10 NP NP NP NP NP NP NP NP 40 65 Fault zone 75-90' repeats RRI?
699-58-41F 0 5 NP NP NP NP 70 Pomona Selah = 248', Esquatzel = 390', Cold Cr Interbed = 492', Asotin = 538'
699.5 694.5 NP NP NP NP 629.5 5 65 65 NP NP NP NP NP NP NP NP Fault zone at 283' repeats Selah/Pomona section
699-58-48 NP NP NP NP NP NP 0 NP NP NP NP NP NP ? NP NP NP NP NP NP NP NP NP CRB at surface
699-59-55 NP 0 NP NP NP? ? ETD NP 432 NP NP NP? ? ETD NP ? ? NP NP NP? NP? NP? NP Drilling terminated prematurely because of potential for cave in from sand removal via air rotary drilling.
699-59-58 NP 0 NP NP 92 92 NP? NP? ETD NP 499 NP NP 407 407 ETD (379?)
NP? ETD NP 92 92 NP NP >25? >25 (28?)
<140 (129?)
NP? Uniform zS bed from 92-104'
699-60-53B NP NP NP NP NP NP 0 Elephant Mtn
RRI = 78', Pomona 102'
NP NP NP NP NP NP ? NP NP NP NP NP NP NP NP NP 78 24 Basalt at surface

E.15
Table E.1. (contd)
Well Name
Contact Depths (ft) Contact Elevations (ft) Thickness (ft)
CommentsHol
ocen
e
Top
H1
Top
H2
Top
H3
Top
CC
U
Top
CC
Uz
Top
CC
Ug
Top
Rin
gold
TO
B
Bas
alt M
embe
r
Dee
per
Con
tact
s
Hol
ocen
e
Top
H1
Top
H2
Top
H3
Top
CC
U
Top
CC
Uz
Top
CC
Ug
Top
Rin
gold
TO
B
Hol
ocen
e
Han
ford
fm
H1
H2
H3
CC
U
CC
Uz
CC
Ug
Rin
gold
Fm
Ele
phan
t Mtn
Rat
tlesn
ake
Rid
ge In
terb
ed
699-60-53C NP NP NP NP NP NP 0 Elephant Mtn
RRI = 77', Pomona = 102'
NP NP NP NP NP NP ? NP NP NP NP NP NP NP NP NP 77 25 Basalt at surface
699-60-53F NP NP NP NP NP NP 0 Elephant Mtn
RRI = 76', Pomona = 100', Selah = 286'
NP NP NP NP NP NP 821 NP NP NP NP NP NP NP NP NP 76 24 Basalt at surface
699-60-57 NP 0 NP NP NP 133 145 Asotin NP 471 NP NP NP 338 326 NP 133 125 8 NP NP NP NP 12 NP NP
699-60-59 NP 0 NP NP NP NP 180 Asotin Umatilla = 221', Mabton = 462', Priest Rapids = 574'
NP 509 NP NP NP NP 329 NP 180 180 NP NP NP NP NP NP NP NP
699-60-60 NP 0 NP NP NP NP 128 Esquatzel NP 513 NP NP NP NP 385 NP 128 128 NP NP NP NP NP NP NP NP
699-61-53 NP NP NP NP NP NP 0 Elephant Mtn
RRI = 76', Pomona = 96', Selah = 278', Esquatzel = 295', Asotin = 362'
NP NP NP NP NP NP 765 NP NP NP NP NP NP NP NP NP 76 20 On Gable Mtn, basalt at surface
699-61-55A NP NP NP NP NP NP 0 Asotin Unnamed Interbed = 69', Umatilla = 71', Mabton = 223'
NP NP NP NP NP NP 463.0 NP NP NP NP NP NP NP NP NP NP NP
699-61-55B NP NP NP NP NP NP 0 Asotin Umatilla = 60', Mabton = 218', Priest Rapids = 326'
NP NP NP NP NP NP 464 NP NP NP NP NP NP NP NP NP NP NP
699-61-57 NP NP NP NP NP NP 0 Pomona Selah = 121', Esquatzel = 150', Asotin = 249', Cold Creek = 330, Umatilla = 337', Mabton = 503'
NP NP NP NP NP NP 444 NP NP NP NP NP NP NP NP NP NP NP
699-61-62 0 2 NP NP NP 115? 177.5 Umatilla 498 496 NP NP NP 383? 320 2 113? 113? NP NP NP NP NP 63? NP NP

E.16
Table E.1. (contd)
Well Name
Contact Depths (ft) Contact Elevations (ft) Thickness (ft)
CommentsHol
ocen
e
Top
H1
Top
H2
Top
H3
Top
CC
U
Top
CC
Uz
Top
CC
Ug
Top
Rin
gold
TO
B
Bas
alt M
embe
r
Dee
per
Con
tact
s
Hol
ocen
e
Top
H1
Top
H2
Top
H3
Top
CC
U
Top
CC
Uz
Top
CC
Ug
Top
Rin
gold
TO
B
Hol
ocen
e
Han
ford
fm
H1
H2
H3
CC
U
CC
Uz
CC
Ug
Rin
gold
Fm
Ele
phan
t Mtn
Rat
tlesn
ake
Rid
ge In
terb
ed
699-61-66 NP 0 NP NP NP 140? 216.5 Umatilla NP 524 NP NP NP 384? 307.4 NP 140? 140? NP NP NP NP NP 77? NP NP Increase in CaCO3 + mud @140'
699-62-43B 0 5 NP NP NP 65 ETD 422 417 NP NP NP 357 ETD 5 65 65 NP NP NP NP NP >3
699-62-53 NP 0 NP NP NP NP 26 Elephant Mtn
RRI = 56', Pomona = 124', Selah = 298', Esquatzel= 340'
NP 439 NP NP NP NP 413 NP 26 26 NP NP NP NP NP NP 30 68 Drilled ~30 degrees from vertical - therefore true depths are different
699-63-51 0 2 NP NP NP 20 ETD 425 423 NP NP NP 405 ETD 2 18 18 NP NP NP NP NP ? Ringold lower mud @25'?
699-63-55 NP 0 NP NP NP NP? 112* *Window into RRI
RRI = 70, Pomona = 112'
NP 427.1 NP NP NP NP? 357* 0 68 68 NP NP NP NP NP? NP NP 42 Changed from DB to HT @70'
699-63-58 0 2 NP NP NP NP 120 Pomona 493 491 NP NP NP NP 373 2 118 118 NP NP NP NP NP NP NP NP
699-64-62 NP 0 NP NP NP 90? ETD NP 501 NP NP NP 411? ETD NP 90? 90? NP NP NP NP NP ?
699-65-50 0 40 NP NP NP 102? 578 Elephant Mtn
469 429 NP NP NP 367? -109 40 62? 62? NP NP NP NP NP 476? TOR = LM @105, TOR could be as high as 60'
699-65-59A 0 2 NP NP NP 108? ETD 508.5 506.5 NP NP NP 400.5? ETD 2 106? 106? NP NP NP NP NP ? Ringold LM @200'
699-65-59B NP 0 NP NP NP 95? ETD NP 507.6 NP NP NP 413? ETD NP 95? 95? NP NP NP NP NP ? Decommissioned in 1995
699-65-59C NP 0 NP NP NP 105? ETD NP 506.1 NP NP NP 401? ETD NP 105? 105? NP NP NP NP NP ?
699-65-72 ? ? ? NP ? ? ? ? ? ? ? ? NP ? ? ? ? ? ? ? NP ? ? ? ?
699-66-64 NP 0 NP NP NP ? ETD NP 506.7 NP NP NP ? ETD NP ? ? NP NP NP NP NP ?
699-67-51 NP 0 NP NP NP NP NP 145 ETD NP 525 NP NP NP NP NP 380 ETD NP 145 145 NP NP NP NP NP >105
699-69-45 0 5 NP NP 90 ETD 488 483 NP NP NP 398 ETD 5 85 85 NP NP NP NP NP >210
699-70-68 NP 0 NP NP NP 50? ETD NP 527 NP NP NP 477? ETD NP 50? 50? NP NP NP NP NP ?
699-71-52 0 3 NP NP NP 120 ETD 525 522 NP NP NP 405 ETD 3 117 117 NP NP NP NP NP >90
699-72-73 NP 0 NP NP NP 90? ETD NP 483.5 NP NP NP 393.5? ETD NP 90? 90? NP NP NP NP NP >110 Cemented starting @90', Ringold LM @170'
699-73-61 NP 0 NP NP NP 120? ETD NP 533 NP NP NP 413? ETD NP 120? 120? NP NP NP NP NP ? Color change from gray to tan/brown @ 120'
NP = not present; NR = not reached; ETD = exceeds total depth

PNNL-19702
Distribution
No. of No. of Copies Copies
Distr.1
OFFSITE SP Airhart Freestone Environmental Services 1100 Jadwin Avenue #250 Richland, WA 99352-3425 P Cabbage Freestone Environmental Services 1100 Jadwin Avenue #250 Richland, WA 99352-3425 JL Ludwig Intera, Inc. 1933 Jadwin Avenue #130 Richland, WA 99354-2280 ONSITE 3 DOE Richland Operations Office JP Hanson A5-11 RD Hildebrand A6-38 KM Thompson A6-38
15 CH2M HILL Plateau Remediation Company
AH Aly H8-51 GD Cummins H8-15 BH Ford H8-43 GG Kelty R3-50 SP Luttrell R3-50 JP McDonald R3-50 SD Miller H8-51 WE Nichols H8-51 VJ Rohay H8-15 LC Swanson R3-50 GS Thomas R3-50 MD Thompson H8-51 LD Walker K3-60 WD Webber H8-51 BA Williams H8-51 16 Pacific Northwest National Laboratory BN Bjornstad (5) K6-81 CF Brown K6-81 MA Chamness K6-85 TJ Gilmore K6-96 JA Horner K6-96 DC Lanigan K6-75 GV Last K6-81 RE Peterson K6-75 RJ Serne K6-81 FA Spane K6-96 C Sullivan K6-81 PD Thorne K6-96