Association of Hanford Origin Radionuclides with Columbia ...
104
Association of Hanford Origin Radionuclides with Columbia River Sediment by D. E. Robertson J. J. Fix August 1977 Prepared for the Energy Research and Development Administration under Contract EY-76-C-06-1830 Pacific Northwest Laborator~es
-
Upload
khangminh22 -
Category
Documents
-
view
0 -
download
0
Transcript of Association of Hanford Origin Radionuclides with Columbia ...

Association of Hanford Origin Radionuclides with Columbia River Sediment
by D. E. Robertson J. J. Fix
August 1977
Prepared for the Energy Research and Development Administration under Contract EY-76-C-06-1830
Paci f ic Northwest Laborator~es

This L:ni:cd Stat coniractors or respcjns~ ;<is<ioj~?d, c
i'i
re tiu
!port wa aor the
iibconrr I ty for represer
ews, op lpresfnt In.
IS prefjared as Energy Reseal
actcrs, or thei~ the accuracy, i t s thzt its uce
~inlons and cr ;hose of the I.
ENERGY RZ

ASSOCIATION OF HANFORD O R I G I N RADIONUCLIDES WITH COLUMBIA RIVER SEDIMENT
D. E. Robertson J. J. F i x
August 1977
BATTELLE P a c i f i c Northwest Labora to ry Richland, Washington 99352

SUMMARY
Dur ing t h e pas t year, t he t h r e e major o b j e c t i v e s o f t h i s s tudy have been
accomplished: 1 ) measurement o f p resen t r a d i o n u c l i d e concent ra t ions i n Colum-
b i a R i ve r sediments and a d e s c r i p t i o n of t he r a t e s and mechanisms govern ing
t he decrease i n r a d i o a c t i v i t y l e v e l s i n t he r i v e r sediments between 1971 and
1976; 2 ) a c h a r a c t e r i z a t i o n o f t he a rea l and depth d i s t r i b u t i o n o f f i n e g ra in ,
s i l t y sediments i n t h e McNary Reservo i r by sub-bottom se ismic surveying; and
3 ) o b t a i n i n g deep p i s t o n cores which penet ra te t h e e n t i r e th ickness o f sed i -
ment depos i ts a t se lec ted s i t e s i n McNary Reservo i r t o p rov ide r a d i o n u c l i d e
data f o r e s t i m a t i n g the i n v e n t o r i e s o f r ad ionuc l i des i n t h e sediment depos i ts
i n t h e McNary Reservo i r .
The r e s u l t s o f these s tud ies have shown t h a t t h e s h o r t - and in te rmed ia te -
l i v e d rad ionuc l i des have now decayed t o i n s i g n i f i c a n t l e v e l s , and o n l y a few
l o n g - l i v e d rad ionuc l i des ( i - e . , 54Mn, 55Fe, 60Coy 137Cs, 1 5 2 - 1 5 4 ~ ~ 238Pu,
2 3 9 - 2 4 0 P ~ , and 2 4 'Am) a t t r a c e concent ra t ions remain b u r i e d i n t he sediment
depos i ts . The sur face sediments i n t he McNary Reservo i r c o n t a i n much lower
r a d i o n u c l i d e concent ra t ions than deeper sediments because o f t h e bu i l d -up o f
40 t o 80 cm o f f resh , r e l a t i v e l y uncontaminated new sediment depos i t s s ince
1971. The n a t u r a l l y o c c u r r i n g r a d i o n u c l i d e 4 0 K now accounts f o r over 48% o f
t h e t o t a l a c t i v i t y o f t he sur face sediments. The 137Cs, 2 3 8 P ~ , 2 3 9 - 2 4 0 P ~ ,
and 241Am concent ra t ions i n McNary Reservo i r sediments a r e t y p i c a l o f t he f a l l -
ou t "background" l e v e l s observed i n sediments c o l l ec ted u p r i v e r f rom Hanford
a t P r i e s t Rapids Dam. Deep p i s t o n cores t h a t appear t o have penet ra ted t h e
e n t i r e sediment l a y e r s i n t he McNary Reservo i r c l e a r l y show t h a t t h e deepest
sediments ( l a i d down between 1953 and 1960) c o n t a i n u l t r a low l e v e l s o f Han-
f o r d o r i g i n r ad ionuc l ides . Th is i n d i c a t e s t h a t t h e e a r l y opera t ions o f the
Hanford r e a c t o r s du r i ng peak p roduc t ion years i n t h e l a t e 1950 's and e a r l y
1960's d i d n o t i n t r oduce any unusua l l y h i gh concent ra t ions o f r ad ionuc l i des ,
as compared t o l a t e r years when more e f f e c t i v e measures were taken t o m i n i -
mize t he r a d i o n u c l i d e re leases t o t he Columbia R iver .
The sub-bottom se ismic surveys o f t h e r i v e r bottom i n t h e McNary Reser-
v o i r revea led t he presence o f f i n e s i l t y sediment depos i ts 1 t o 5 meters
t h i c k , which a r e l o c a t e d a long t he Oregon s i d e o f t he r i v e r between P o r t
K e l l e y and McNary Dam and extend f rom near t h e s h o r e l i n e t o approx imate ly
500 meters o f f t he Oregon shore. A p r e v i o u s l y undiscovered major sediment

depos i t was a l s o observed along the Washington s ide o f the r i v e r j u s t upstream
from McNary Dam. The sediment deposi ts i n mid-channel and a long most o f the
Washington s ide a re u s u a l l y o f a sandier nature and are l e s s t h i c k . Using the
p i s t o n core rad ionuc l i de data and the observed d i s t r i b u t i o n o f sediments i n
McNary Reservoir, rad ionuc l i d e i n v e n t o r i e s f o r the photon e m i t t i n g rad io - - -.
nuc l ides were est imated t o range from about 4000 cu r ies f o r 55Fe t o about 9
cu r ies f o r 54Mn. The i n v e n t o r i e s o f t he alpha emi t te rs 2 3 8 P ~ , 2 3 9 - 2 4 u P ~ , and I
241Am were est imated t o be 0.32, 6.3, and 1.5 cur ies , respec t i ve l y . 9
The f u t u r e f a t e o f t he rad ionuc l ides i n Columbia R iver sediments (assum- . =
i n g no new a d d i t i o n s ) w i l l be a cont inu ing deeper b u r i a l by r e l a t i v e l y un- t *
contaminated new sediment deposi ts . Cont inuing r a d i o a c t i v e decay w i l l reduce
the spectrum o f s i g n i f i c a n t rad ionuc l i des t o i nc lude o n l y those w i t h very long
h a l f - l i v e s , i .e . , 60Co, '37Cs, 1 5 2 - 1 5 4 E ~ , 2 3 8 P ~ , 2 3 0 - 2 4 0 P ~ , and 241Am.
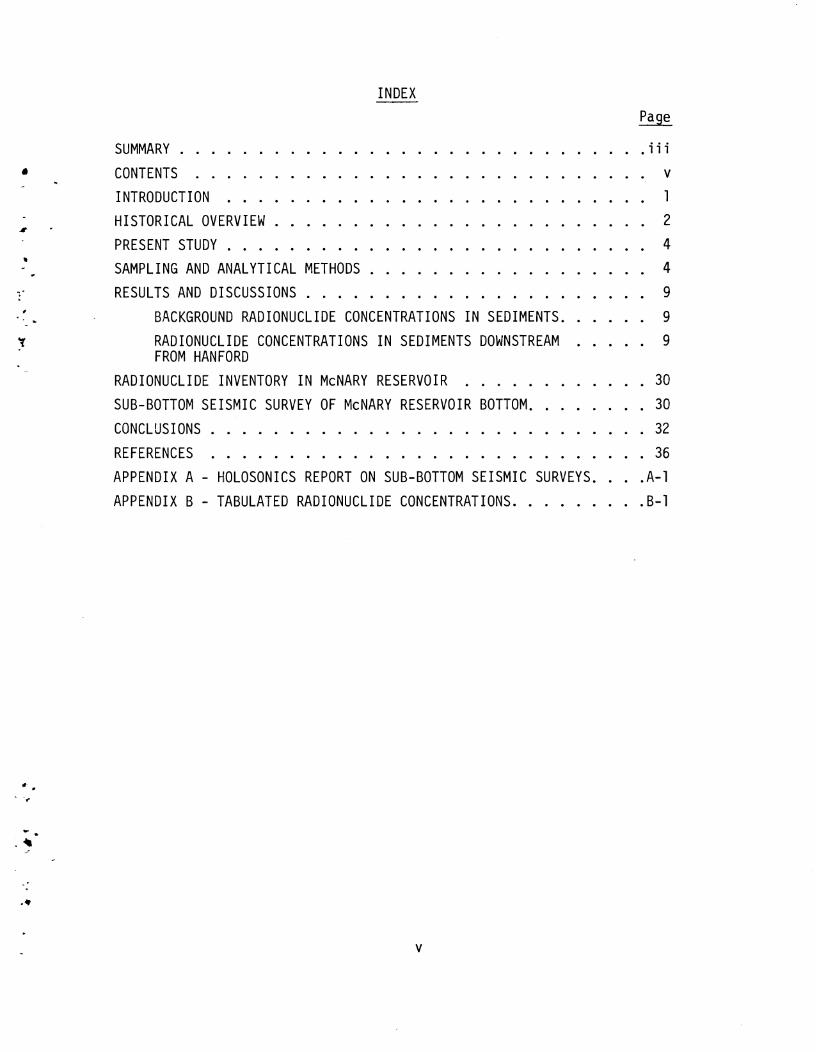
INDEX
P a g e
. . . . . . . . . . . . . . . . . . . . . . . . . . . . . . SUMMARY i i i
CONTENTS . . . . . . . . . . . . . . . . . . . . . . . . . . . . . v
INTRODUCTION . . . . . . . . . . . . . . . . . . . . . . . . . . . 1
H I S T O R I C A L OVERVIEW . . . . . . . . . . . . . . . . . . . . . . . . 2
PRESENT STUDY . . . . . . . . . . . . . . . . . . . . . . . . . . . 4
. . . . . . . . . . . . . . . . . . SAMPLING AND A N A L Y T I C A L METHODS 4
. . . . . . . . . . . . . . . . . . . . . . RESULTS AND DISCUSSIONS 9
. . . . . . BACKGROUND RADIONUCLIDE CONCENTRATIONS I N SEDIMENTS 9
RADIONUCLIDE CONCENTRATIONS I N SEDIMENTS DOWNSTREAM . . . . . 9 FROM HANFORD
. . . . . . . . . . . . RADIONUCLIDE INVENTORY I N McNARY RESERVOIR 3 0
SUB-BOTTOM S E I S M I C SURVEY OF McNARY RESERVOIR BOTTOM . . . . . . . . 30
CONCLUSIONS . . . . . . . . . . . . . . . . . . . . . . . . . . . . 3 2
REFERENCES . . . . . . . . . . . . . . . . . . . . . . . . . . . . 3 6
. . . . APPENDIX A . HOLOSONICS REPORT ON SUB-BOTTOM S E I S M I C SURVEYS A.1
APPENDIX B . TABULATED RADIONUCLIDE CONCENTRATIONS . . . . . . . . . B.1

FIGURES
Opera t ing H i s t o r y o f P lu ton ium Producing Reactors a t Hanford, 1944 t o 1976
Sediment Sampl i n g Locat ions, September, 1976
G r a v i t y Core Sampling i n t h e McNary Reservo i r
Deep Sediment P i s t o n Core (300 cm) Obtained Behind McNary Dam
G r a v i t y Cores - 1976
G r a v i t y Core f rom McNary Reservo i r , Wall u l a (M-A)
Typ i ca l Radionucl i d e Composit ion i n Sur face Sediments Behind McNary Dam, September 1976
Temporal V a r i a t i o n o f 60Co D i s t r i b u t i o n s i n Sediment Cores f rom McNary Reservo i r (Bouy 3 S i t e )
G r a v i t y Core f rom McNary Reservo i r , Refuge I s l a n d (M-D)
G r a v i t y Core f rom McNary Reservo i r , Refuge I s 1 and (M-C)
G r a v i t y Core f rom McNary Reservo i r , Hat Rock (M-E)
G r a v i t y Core f rom McNary Reservo i r , 1-1 12 M i 1 es Upstream f rom Dam (M-F)
G r a v i t y Core f rom The Dal l e s Dam, Rabb i t I s l a n d (D-A)
G r a v i t y Core f rom The Dal l e s Dam (D-C)
G r a v i t y Core f rom Bonnevi l l e Dam - Stevenson (B-A)
P i s t o n Core f r om McNary Reservo i r - P o r t Kel l e y (M-B)
P i s t o n Core f rom McNary Reservo i r - Hat Rock (M-E)
P i s t o n Core #1 f rom McNary Dam (M-G)
P i s t o n Core #2 f rom McNary Dam (M-G)
Est imated I n v e n t o r i e s o f Radionucl i des ( i n Cu r i es ) Assoc ia ted w i t h Sediment Deposi ts Behind McNary Dam September 1976
Sub-bottom Seismic Survey Tracks i n McNary Reservo i r
TABLES
Decrease i n Concentrat ions o f Radionuc l ides i n Sur face Sediments i n McNary Reservo i r Between 1971 and 1976

INTRODUCTION
Dur ing t h e peak years o f p lu ton ium p roduc t i on a t Hanford, thousands o f
c u r i e s o f 5 1 ~ r and one t o tens o f c u r i e s o f o t h e r in te rmed ia te -1 i v e d r a d i o -
n u c l i d e s were re leased each day from t h e Hanford r e a c t o r s t o t h e Columbia
R i ve r and t r anspo r ted downstream.' Numerous s tud ies o f t h e r a d i o n u c l i d e t r a n s
p o r t and accumulat ion processes i n t h e Columbia R i v e r were conducted d u r i n g
t h e years o f r e a c t o r opera t ions . The p r imary focus o f these s tud ies was
t o assess t h e t r a n s p o r t , b ioaccumulat ion, and a v a i l a b i l i t y t o t h e p u b l i c o f
t h e s h o r t - and i n t e r m e d i a t e - l i v e d rad ionuc l i des i n t h e Columbia R i ve r and i t s
es tuary . These rad ionuc l i des ( i . e . , 32P, 4 6 S ~ , 51Cr , 54Mn, 58Co, "Fey 60Co,
5Zn, 95Zr-95Nb, l o 6 ~ u , and 140Ba) were o f ma jo r importance i n terms o f con-
c e n t r a t i o n and p o t e n t i a l dose t o t he p u b l i c .
Immediately f o l l o w i n g d e a c t i v a t i o n i n January, 1971 o f t h e l a s t r e a c t o r
(KE) us ing once-through c o o l i n g w i t h t r e a t e d Columbia R i v e r water, an i n t e n -
s i v e s tudy o f t h e t r a n s p o r t and d e p l e t i o n o f both s h o r t - and l o n g - l i v e d r a d i o -
nuc l i des i n the r i v e r was conducted.' Th i s s tudy showed t h a t t he sediments
were t h e major r e p o s i t o r y o f Hanfo rd -o r ig in r ad ionuc l i des , and t h a t , except
f o r 55Fe, 60Co, and 1 5 2 - 1 5 4 E ~ , the sho r t - and in te rmed ia te -1 i v e d rad ionuc l i des
i n t h e sediments would now have decayed t o i n s i g n i f i c a n t amounts. The Colum-
b i a R i v e r sediments now c o n t a i n a comple te ly d i f f e r e n t spectrum o f long-1 i ved
rad ionuc l ides, i n c l u d i n g 60Co, 137Cs, 1 5 2 - 1 5 4 E ~ , and t h e t ransuranium r a d i o -
n u c l i d e s 2 3 8 P ~ , 2 3 9 - 2 4 0 P ~ and 241Am.
The p resen t document i nc l udes data ob ta ined d u r i n g 1976 which descr ibes
the decrease i n r a d i o a c t i v i t y l e v e l s i n t h e r i v e r sediments and t h e sedimenta-
t i o n processes which occur red between 1971 and 1976. Th i s s tudy a l s o inc ludes
a d d i t i o n a l new in fo rmat ion , ob ta ined by sub-bottom se ismic survey ing of t he
McNary Reservo i r r i v e r bottom, which descr ibes t h e l o c a t i o n s and depths o f
t h e f i n e g r a i n sediment depos i ts . Deep-sea p i s t o n c o r i n g techniques were
employed t o pene t ra te t h e deepest sediment depos i t s behind McNary Dam i n o rde r
t o measure f o r t h e f i r s t t ime t h e rad ionuc l i d e concent ra t ions and d i s t r i bu-
t i o n s i n t h e very deepest sediments, which were depos i ted between 1960 and
1953. The combinat ion o f these data a l l o w s an approx imat ion o f t h e t o t a l i n -
ven to r y o f r ad ionuc l i des i n t h e sediments behind McNary Dam, which has been
shown d u r i n g t h i s and e a r l i e r s t u d i e s t o be t h e major r e s e r v o i r o f r e s i d u a l

Hanford or igin radionucl ides in the Columbia River system. A1 so, comparison of the data obtained in 1976 with the 1971 data (and i n some cases 1972 and 1973 data) allows a description of the changing pattern of radionuclide d i s -
t r ibu t ions i n the sediments since shutdown of the single-pass cooling pro-
duction reactors.
HISTORICAL OVERVIEW
The discharge of reactor e f f luen t water from the Hanford reactors t o the
Columbia River began i n 1944 upon s tar t -up of the f i r s t of nine production
reactors , e ight with once-through cooling using t reated Columbia River water
(see Figure 1 ). With the deactivation of the l a s t once-through production
reactor , K E , in January, 1971, re leases of radionucl ides to the r i ve r by Han-
ford operations became r e l a t i ve ly ins ign i f ican t . The remaining reactor i n
operation, N-Reactor, i s a dual-purpose reactor producing plutonium as well
as 860 megawatts of e l ec t r i c a l power. The reactor has a closed primary cool-
ing loop, and the only radioact ivi ty entering the Columbia River from
N-Reactor i s from very small amounts of radionuclides which migrate through
a so i l bank t o the r i ve r from a low level l iquid waste disposal trench located several hundred yards from the r i ve r .
During operation of the e ight reactors w i t h once-through cool ing, t reated Columbia River water was passed through the reactors and returned t o the
Columbia River a f t e r a few hours' holding time. During passage through the
reactors , the cooling water was subjected t o the ambient neutron f lux which resulted in neutron act ivat ion of the various t race elements present in the water. In addit ion, occasional fuel element f a i l u r e s occurred and t race amounts of i r rad ia ted fuel were leached by the cooling water and carr ied in to
the Columbia River. The radionuclides discharged t o the r i ve r in reactor e f -
f l uent water included neutron act ivat ion products, f i ssion products, and
t races of transuranium radionuclides. Upon entering the Columbia River, the
radionucl ides were rapidly dispersed i n the r i ve r water, sorbed onto de t r i t u s
and inorganic par t i cu la tes , o r incorporated in to the aquatic biota. While
the t o t a l amounts of radioact iv i ty added to the r iver were ra ther large, the flow volume of the r i ve r i s enormous, and a careful monitoring program as- sured t ha t the r i ve r water radionuclide concentrations a t downstream locations
of domestic water consumption never exceeded regulation l imi t s .


E s s e n t i a l l y a l l o f t h e shor t -1 i v e d rad ionuc l i des i n t he r i v e r f rom Hanford
o r i g i n have now decayed l e a v i n g a few l o n g - l i v e d rad ionuc l i des . Much i n f o r -
mat ion p e r t a i n i n g t o t he s tud ies o f p r i m a r i l y s h o r t - l i v e d r a d i o n u c l i d e s i n t he
r i v e r i s g iven i n References 1-8.
I n 1971, s h o r t l y a f t e r shutdown o f KE r e a c t o r , sampl ing programs were
i n i t i a t e d t o s tudy t h e d i s t r i b u t i o n and d e p l e t i o n o f r ad ionuc l i des i n Columbia
R i v e r water, sediments, and b i o t a . (8 '9) As p a r t o f t h i s program, sediment
cores were c o l l e c t e d a t se lec ted 1 oca t ions behind McNary, John Day, The Da l les ,
and Bonnev i l l e Dams t o determine t he t r a n s p o r t o f r ad ionuc l i des th rough t h e
major sed imenta t ion bas ins l o c a t e d behind each dam. The l o c a t i o n s o f these
sampling s t a t i o n s a r e shown i n F igu re 2.
PRESENT STUDY
I n 1976, f und ing was p rov ided t o r epea t t h e 1971 measurements o f t h e r a d i o -
n u c l i d e concen t ra t i ons i n t h e sediments and, i n a d d i t i o n , t o map t h e a rea l and
depth d i s t r i b u t i o n o f sediments behind McNary Dam us ing sub-bottom se ismic pro-
f i l i n g techniques. The areas o f g rea tes t sediment accumulat ion were then sampled
by deep-sea p i s t o n c o r i n g techniques t o pene t ra te t h e e n t i r e sediment overburden
l a i d down s i nce t h e complet ion o f McNary Dam and t h e f i l l i n g o f t h e r e s e r v o i r
i n 1953.
Th is s tudy was in tended t o assess t he present s t a t u s o f Hanford o r i g i n
r ad ionuc l i des i n t he Columbia River , t o p rov ide a d d i t i o n a l i n f o r m a t i o n on t h e
l o n g - l i v e d rad ionuc l i des , and t o p rov ide an e s t i m a t i o n o f t h e i n v e n t o r y o f
r ad ionuc l i des deposi t e d behind McNary Dam.
SAMPLING AND ANALYTICAL METHODS
A number o f sampl ing l o c a t i o n s rang ing f rom P r i e s t Rapids Dam above t he
Hanford P r o j e c t t o Bonnev i l l e Dam, some 360 k i l ome te rs downstream f rom Hanford,
have been e s t a b l i s h e d as p r imary sampl ing s t a t i o n s (see F igu re 2 ) . These s ta -
t i o n s were se lec ted f rom areas o f known f i n e sediment accumulat ion, and t h e i r
sediments c o n t a i n a r e c o r d o f t h e r a d i o n u c l i d e d ischarges t o t he r i v e r . Because
t h e McNary Reservo i r , l oca ted approx imate ly 80 km downstream f rom t h e reac to r s ,
represen ts t he major r e p o s i t o r y o f r a d i o a c t i v e sediments, a more i n t e n s i f i e d
sampl ing e f f o r t was conducted t he re t o b e t t e r c h a r a c t e r i z e t h i s area.

ki lometers
LITTLE WHITE
ICE HARBOR
Y A K I M A R. SNAKE R.
R' WHl TE SALMON R. /KLICKITAT R. JD-A
JOHN DAY R.
McNARY DAM M-F
1. lHE DALLEs DESCHUTES R.
WALLA R.
FIGURE 2 . Sediment Sampling Loca t ions - September, 1976

To determine t h e rad ionuc l i de concent ra t ions i n sur face sediments and i n
depth p r o f i l e s down t o approximately 55 cm, a 15 cni diameter g r a v i t y co re r was
used throughout t h i s study (see F igure 3). This c o r i n g device has been used
i n prev ious s tud ies o f Columbia R iver sediments, and has been shown t o c o l l e c t
r e l a t i v e l y undisturbed, representa t i ve sediment cores.
Immediately a f t e r sampling, t h e sediment cores were capped on each end
and were f rozen i n t h e i r p l a s t i c b a r r e l 1 i n e r s . A t the l abo ra to ry t he cores
were then removed, s t i l l f rozen s o l i d , f rom the p l a s t i c core b a r r e l s and 2.5 cm
t h i c k s labs were c u t f rom t h e core by a f i n e j e t o f ho t water. The ou ts ide
cent imeter o f r a d i u s was trimmed from each s lab t o remove any poss ib le contami-
n a t i o n from o v e r l y i n g sediment which may have been t ranspor ted downward du r i ng
the c o r i n g process. The s labs were then thawed, d r i e d a t 105OC, pu lver ized ,
and then approximately 150 g a l i q u o t s were weighed and p laced i n t o 2-cm t h i c k
by 10-cm diameter p l a s t i c count ing conta iners . The concentrat ions o f gamna-
e m i t t i n g rad ionuc l i des i n t h e samples were then measured by count ing on a l a r g e
dual coincidence NaI (T I ) gamma-ray spectrometer and on a Ge(Li ) diode deJ
The transuranium rad ionuc l ides 2 3 8 P ~ , 2 3 9 - 2 4 0 P ~ and 241Am were n
i n 100 gram a l i q u o t s a t LFE Corp., Richmond, C a l i f o r n i a . The p lutonium .
americium were removed from the sediments by a c i d leaching, p u r i f i e d by r a d i o -
chemical separat ions and e lec t rodepos i ted on s t a i n l e s s s tee l d i scs . The p lutonium
and americium on the d i scs were then measured by alpha spectrometry by count ing
f o r 1000 minutes o r longer on a S i ( L i ) diode de tec to r o r i n g r idded i o n i z a t i o n
chambers. P l u t o n i um-236 and 243Am were added t o each sample as t r a c e r s i n
determin ing the chemical y i e l d through the procedure.
I n September, 1976 two personnel f rom the Oceanography Department o f t he
U n i v e r s i t y o f Washington were employed t o a s s i s t us i n o b t a i n i n g deep 5-cm
diameter sediment cores (up t o 300 cm i n l eng th ) from known h igh sedimentat ion
areas us ing deep-sea p i s t o n c o r i n g techniques. The o b j e c t i v e o f the deep c o r i n g
was t o penet ra te the e n t i r e f i n e sediment deposi ts l a i d down behind McNary Dam
s ince 1953, and thus determine the rad ionuc l i de concentrat ions i n t he very
deepest sediments which had never been measured. Four p i s t o n cores, ranging
from 218 cm t o 295 cm i n l eng th (see Figure 4 ) were obta ined a t th ree l o c a t i o n s
i n t h e McNary r e s e r v o i r : immediately behind McNary Dam (M-G), a t Hat Rock (M-E)
and a t Po r t Ke l l ey (M-B). A t the l a b o r a t o r y t he p i s t o n cores were sect ioned

FIGURE 3. Gravity Core Sampling in the McNary Reservoir

FIGURE 4. Deep Sediment P i s ton Core (300 cm) Obtained Behind McNary Dam
-8-
i n t o 10-cni 1 ong segments, and t h e sediments were d r i ed, pu l v e r i zed, packaged
and measured f o r r a d i o n u c l i d e con ten ts as descr ibed above. A t McNary Dam and
P o r t K e l l y i t appeared t h a t t he p i s t o n cores (274 cm and 234 cm long, r e s p e c t i v e l y )
had penet ra ted t he f i n e sediment depos i ts t o t he o r i g i n a l r i v e r bed. However,
a t Hat Rock, where sediment depos i ts a re es t imated t o be about 300 t o 420 cm
deep, a 295-cm long p i s t o n core d i d n o t appear t o pene t ra te t he e n t i r e t h i c k -
ness o f f i n e deposi ts .
RESULTS AND DISCUSSION
BACKGROUND RADIONUCLIDE CONCENTRATIONS I N SEDIMENTS
The 38-cm l ong g r a v i t y co re c o l l e c t e d j u s t above P r i e s t Rapids Dam serves
as a "background" sediment sample f o r comparing sediments c o l l e c t e d downstream
from Hanford, s i nce i t con ta ins o n l y f a l l o u t r ad ionuc l i des f rom weapons t e s t i n g
o r i g i n (see F igure 5). Cesium-137 i s t he most abundant f a l l o u t r a d i o n u c l i d e
p resen t i n t he P r i e s t Rapids sediments. Trace amounts o f 2 3 8 P ~ , 2 3 9 - 2 4 0 P ~ and
241Am o f fa1 l o u t o r i g i n a r e a1 so present . The 137Cs, PU and Am concent ra t ions
i n P r i e s t Rapids sediments a r e very s i m i l a r t o those observed i n sediments f rom
the McNary R e s e r ~ o i r ~ i n d i c a t i n g f a l l o u t t o be an impo r tan t source o f these
r a d i o n u c l i des i n r i v e r sediments downstream f rom Hanford. The bottom sediment
o f t h e P r i e s t Rapids core (30-38 cm) appears t o pre-date t he per iods o f maximum
f a l l o u t i n t he e a r l y 1960 's s ince t h e 137Cs, PU and Am concent ra t ions decrease
r a p i d l y t o ext remely low values below 30 cm. The lHCs maximum a t a depth of
25-28 cm apparen t l y corresponds t o sediments depos i ted i n 1961-63, t h e peak
f a l l o u t years f o r t h i s r ad ionuc l i de . Using 137Cs as a t r a c e r o f sediment depo-
s i t i o n , a sediment accumulat ion r a t e o f approx imate ly 1.8 cmlyear i s est imated,
a r a t e much lower than t he accumulat ion o f sediments i n t h e downstream McNary
Reservo i r , which rece ives h i gh suspended loads f rom the Yakima, Snake and
Wal la Wal la Rivers .
RADIONUCLIDE CONCENTRATIONS I N SEDIMENTS DOWNSTREAM FROM HANFORD
The s t r e t c h o f r i v e r between Hanford and t h e conf luence o f the Walla Walla
R i v e r (see F igure 2 ) i s f a s t moving water, and no major sedimentat ion occurs
i n t h i s s t r e t c h o f t he r i v e r . However, one smal l s a n d y - s i l t co re was obta ined
near-shore a t t h e o l d Hanford f e r r y s i t e (H-A). Cobalt-60, 54Mn and 1 5 2 - 1 5 4 E ~
of Hanford r e a c t o r o r i g i n were p resen t i n concen t ra t ions t y p i c a l l y observed i n

( l H 3 13M Atla f i l l u l ~ 'NO l lV l l lN33N03

t h e McNary Reservo i r , b u t t he p lu ton ium and americium concent ra t ions were much
lower (see F igure 5) .
A 40-cm l ong sandy-s i l t core was c o l l e c t e d a t Wal l u l a (M-A) which con ta ined
very low l e v e l s o f Hanford o r i g i n r ad ionuc l i des (see F igu re 6 ) . The r e l a t i v e l y
coarse sand depos i ts i n t h i s s t r e t c h o f t h e r i v e r a r e t y p i c a l l y cha rac te r i zed
by low l e v e l s o f adsorbed r a d i o a c t i v i t y compared t o f i ne -g ra ined sediments which
a re found severa l k i l o m t e r s downstream.
The n a t u r a l l y o c c u r r i n g gamma-emitter 4 0 K i s now t h e most abundant r a d i o -
. nuc l i de i n sur face sediments behind McNary Dam, and accounts f o r approx imate ly
48% o f t h e t o t a l r a d i o a c t i v i t y (see F igu re 7 ) . The n a t u r a l l y o c c u r r i n g 226Ra
and 228Th account f o r about 4% and 1.8%, r e s p e c t i v e l y , o f t h e t o t a l a c t i v i t y .
The major gamma-emitting rad ionuc l i des o f Hanford o r i g i n i n Columbia R i ve r
sediments a t McNary a r e now 60Co (5.27 y r ) , 137Cs (30.1 y r ) , and 1 5 2 - 1 5 4 E ~
(1 3 y r , 8.6 y r ) (see F igure 5 ) . The sho r te r -1 i v e d 65Zn, 4 6 S ~ and 54Mn, which
were i n r e l a t i v e l y h i gh concent ra t ions s h o r t l y a f t e r t he shutdown o f t h e Hanford
reac to r s , have now decayed t o ext remely low concent ra t ions . The X-ray e m i t t e r
55Fe (2.7 y r ) i s s t i l l t h e most abundant Hanford o r i g i n r a d i o n u c l i d e i n t h e sed i -
ments, b u t i s o f minor importance f rom r a d i a t i o n dose cons idera t ions . Dur ing
the n e x t decade the 55Fe concent ra t ions wi 11 become i n s i g n i f i c a n t compared t o
the above l o n g e r - l i v e d rad ionuc l i des . The decrease i n concen t ra t ions o f these
r a d i onucl i des i n t he sur face sediments behind McNary Dam between A p r i l , 1971
and August, 1976 a r e shown i n Table I.
The t r ansu ran i um alpha-emi t t i n g rad ionuc l ides 238Pu, 2 3 9 - 2 4 0 P ~ and 241Am
are p resen t i n su r face sediments i n ext remely low concent ra t ions , as shown i n
F igu re 5, and a r e t y p i c a l o f concen t ra t ions observed i n P r i e s t Rapids Dam sed i -
ments upstream from Hanford.
The sur face sediments i n t h e McNary Reservo i r now c o n t a i n t h e lowes t con-
c e n t r a t i o n s o f r ad ionuc l i des i n t h e accumulated s i l t y depos i ts . Th i s i s due t o
f resh depos i ts o f r e l a t i v e l y uncontaminated sediments which have accumulated
between 1971 and 1976. The bu i l dup o f these r e l a t i v e l y uncontaminated sediments
s i nce 1971 can be g r a p h i c a l l y seen i n F igure 8 which shows t h e depth d i s t r i b u t i o n
o f 60Co i n f o u r 6" diameter by 50 cm deep g r a v i t y cores c o l l e c t e d between A p r i l ,
1971 and August, 1976. These cores were c o l l e c t e d a t approx imate ly t h e same
l o c a t i o n , 450 meters upstream f rom McNary Dam on t he Oregon s i de o f the r i v e r .

t I NDI CATES LESS THAN DETECT1 BLE RESULT
- - - 0 6 0 ~ o McNARY RESERVOI R, WALLULA (M-A) - - 0137cs GRAVl TY CORE - - 54 815l76
M n - 152- 154Eu
- - - - - - - -
-
- - - - - - -
-
7
I 0.01 10 20 30 40 50 60 70
SEDIMENT DEPTH, CM FIGURE 6. G r a v i t y Core f r om McNary Reservo i r , Wal l u l a (M-A)
-1 2-


TABLE 1. Decrease i n Concentrat ions o f Radionucl i des i n Surface Sediments i n McNary Reservoi r Between 1971 and 1976
Typ ica l Concentrat ions i n D/M/g Dry Sediment
A p r i l , 1971 August, 1976
1100 30 (es t . )
240 0.14
120 0.34
60 2.7
5 1 2.2
25 0.32
9 2.7
0.06 0.03

CORE DEPTH (cm)
CORE COLLECTED CORE COLLECTED - APRIL 15, 1971 FEBRUARY 24, 1972
+APR I L,
-\ -
i / -
- \ \
FIGURE 8. Temporal V a r i a t i o n o f 60C0 D i s t r i b u t i o n s i n Sediment Cores f rom McNary Reservo i r (Bouy 3 S i t e )
-
- APRIL
- MAR,
1971
*' I I I
I I I I I
CORE COLLECTED - MARCH 6, 1973
- APRIL, 1971
CORE COLLECTED AUGUST 5, 1976

I n A p r i l , 1971 j u s t f o l l o w i n g the shutdown o f KE reac tor , t he h ighes t 60Co
concent ra t ions were observed i n the surface sediments, and a sub-surface peak
a t a depth o f approximately 27 cm was observed which c o r r e l a t e d w i t h an unusua l l y
h igh r i v e r r u n - o f f i n June, 1967. This h igh r u n o f f r e s u l t e d i n ex tens ive upstream - scour ing o f t h e r i v e r bottom, which re leased pre-deposited r a d i o a c t i v i t y f rom
the s t r e t c h o f r i v e r between Hanford and Richland r e s u l t i n g i n increased r a d i o -
n u c l i d e l e v e l s being t ranspor ted t o the McNary Reservoir . The core c o l l e c t e d
i n February, 1972, ten months l a t e r , shows the a d d i t i o n o f about 17 cm o f new,
less-contaminated sediment deposits; sur face concentrat ions deposi ted i n
A p r i l , 1971 showed a maximum a t 17 cm, and the 1967 maximum peak moved down t o
about 37 cm. The 1971 peak has made a g rea ter s h i f t downward compared t o t h e
1967 peak because the subsurface sediments become more compacted as a f u n c t i o n
o f depth, whereas the upper 10-15 cm o f sediment a re r e l a t i v e l y f l o c c u l e n t and
l e s s dense. The core c o l l e c t e d i n March, 1973 shows t h a t approx imate ly 27 cni o f
new, r e l a t i v e l y uncontaminated sediments have been deposi ted over t he 1971 sed i -
ments o f maximum r a d i o a c t i v i t y . From t h e August, 1976 core i t i s ev ident t h a t
t h e bu i l dup o f f r e s h sediment has now amounted t o approx imate ly 40 cm. Thus, i t
becomes obvious t h a t the f a t e o f the r a d i o a c t i v e sediments which were deposited
du r i ng the years o f r e a c t o r operat ions w i l l be a b u r i a l by new, r e l a t i v e l y uncon-
taminated sediments. This na tu ra l b u r i a l process should cont inue a t approx i -
mate ly the same r a t e unless the sediment accumulation dynamics s i g n i f i c a n t l y
change.
Two g r a v i t y cores were c o l l e c t e d i n the McNary Reservoi r a t Refuge Is land,
approximately 15 km upstream f rom McNary Dam. One core was c o l l e c t e d on the
Washington s i d e and t h e o the r d i r e c t l y across the r i v e r on t h e Oregon side. The
Hanford o r i g i n rad ionuc l i de composit ion o f the sediments f rom the Washington
s i d e was about 2 t o 3 t imes h igher compared t o sediments from the Oregon s ide
(see Figures 9 and 10). This presumably i s due t o t he g rea te r d i l u t i o n o f t he
r a d i o a c t i v i t y i n t he sediments on t h e Oregon s ide o f t h e r i v e r by t he h igher
i n f l u x o f uncontaminated sediments from the Snake and Walla Wal la Rivers. It
i s known from our pas t sediment c o r i n g experience, and r e c e n t l y v e r i f i e d by
t h e sub-bottom seismic survey (see Appendix) , t h a t t h e major sediment deposi ts
i n McNary Reservoi r occur on the Oregon s ide o f t he r i v e r and a r e of Snake and
Wal la Walla R i ve r o r i g i n .

McNARY RESERVOI R,REFUGE I SLAND (M-D) GRAVITY CORE
I t I N D I CATES LESS THAN DETECT1 BLE RESULT
0.011 1 10 20 30 40 50
SE D l MENT DEPTH, C M
FIGURE 9. Gravity Core from McNary Reservoir, Refuge Island ( M - D )

t INDICATES LESS THAN DETECT1 BLE RESULT
5 4 ~ n M c N A R Y RESERVOIR, REFUGE I S L k N D (M-C) 152- 154Eu GRAVITY CORE
O 6 0 ~ 0 815176
A137 C s
10G 6SZn
+ I C3
0.91 I I I 10 20 30 43 50 09
SE D l MENT DEPTH. C M
- 10
> rn a - m 1
E \
-a
2 0 - + Q:
1 .0 - + 5 0 Z 0 0
0 .1
FIGURE 10. Gravity Core from McNary Reservoir, Refuge Island ( M - C )
- - - - - - -
-
- - - - - -
- - - - - - -

G r a v i t y cores were a l s o c o l l e c t e d a t Ha t Rock ( S t a t i o n M-E) and approx i -
mate ly 4 km upstream f rom McNary Dam ( S t a t i o n M-F). These cores showed r a d i o -
n u c l i d e depth p r o f i l e s very s i m i l a r t o t h a t observed a t S t a t i o n M-G j u s t above
McNary Dam (See F igures 11 and 12).
Wi th the complet ion o f John Day Dam i n 1972 a r e l a t i v e l y s l a c k water
r e s e r v o i r was c rea ted which serves as a p a r t i a l r e p o s i t o r y f o r suspended sed i -
ments t r anspo r ted pas t McNary Dam. I n August, 1976 t h e f i r s t g r a v i t y co re
c o l l e c t e d behind John Day Dam ( S t a t i o n JD-A) e x h i b i t e d a r a d i o a c t i v i t y depth
p r o f i l e very s i m i l a r i n concen t ra t i on t o t h a t observed i n cores c o l l e c t e d behind
McNary Dam.
The r a d i o n u c l i d e concent ra t ions i n cores c o l l e c t e d behind t h e Da l l es Dam
( S t a t i o n s D-A, D-B and D-C) showed s l i g h t l y decreased l e v e l s compared t o sedi - ments f rom McNary Dam (see F igures 13 and 14). The g r a v i t y core c o l l e c t e d
behind Bonnevi 1 l e Dam a t Stevenson, Washington ( S t a t i o n B-A) conta ined t h e lowes t
r a d i o n u c l i d e concent ra t ions , and appeared t o be a very s l ow l y sediment ing area
(see F igure 15). Below a core depth o f 20 cm the r a d i o n u c l i d e concent ra t ions
decreased very r a p i d l y t o n e a r l y undetectab l e l e v e l s f o r a1 1 r a d i onucl ides.
I t appears t h a t sediments below a depth o f 20 cm were depos i ted be fo re t h e Hanford
opera t ions , began, and would thus represen t t he o l d e s t f i n e sediment depos i ts we
have y e t observed i n the r i v e r .
P i s t o n Cores
Using t h e Hanford o r i g i n r ad ionuc l i des as t r a c e r s o f sediment depos i t i on
ra tes , i t has been es t imated t h a t up t o 3 t o 7 meters o f sediment have accumulated
i n some areas o f t h e McNary Reservo i r . The h igh sedimentat ion areas a r e l oca ted
on the Oregon s i d e o f t he r i v e r between Wa l l u l a Gap and McNary Dam. These sed i -
ments a re ma in l y o f Snake R i v e r and Walla Walla R i ve r o r i g i n . The r a d i o n u c l i d e
concent ra t ions i n about t h e deepest t h i r d o f these sediment l a y e r s have,previous
t o t h i s t ime, never been measured and would represen t sediment depos i ted between
about 1960 and 1953. McNary Reservo i r began f i l l i n g i n 1953. Dur ing t h i s p e r i o d
a l l e i g h t o f t h e Hanford r e a c t o r s were i n opera t ion , and conceivably , radionucl ide
d ischarges t o the r i v e r du r i ng t h i s t ime would rep resen t maximum amounts. Thus,
deep-sea p i s t o n c o r i n g techniques were employed t o pene t ra te t h e e n t i r e s i l t y
sediment depos i ts a t 3 l o c a t i o n s between Wal lu la Gap and McNary Dam. A t two o f

FIGURE 11. G r a v i t y Core f rom McNary Reservo i r , Hat Rock (M-E)

- - - - 5 4 ~ n McNARY RESERVOI R, 1 112 MI LES UPSTREAM - - 6oco
FROM D A M (M-F) GRAVITY CORE
- 137cs 8/18/76
- 152-154Eu
7 - - - - - - -
-
-
- - - - - - - - -
- - - - - - - INDICATES LESS THAN DETECT1 BLE RESULT -
-
I I 0.01 10 20 30 40 50 60 70
SEDIMENT DEPTH, C M
FIGURE 12. G r a v i t y Core Froni McNary R e s e r v o i r , 1 112 M i l e s Upstream f r o m Dam (M-F)

1 INDICA lES LESS THAN DETECTIBLE RESULT
SEDIMENT DEPTH, CM
FIGURE 13. G r a v i t y Core f rom The D a l l e s Dam, Rabb i t I s l a n d (D-A)

THE DALLES DAM (D-C) GRAVITY CORE
SEDIMENT DEPTH, C M
FIGURE 14. G r a v i t y Core f rom The D a l l e s Dam (D-C)

SEDIMENT DEPTH, C M
FIGURE 15. G r a v i t y Core from Bonnevil l e Dam - Stevenson (B-A)

these l o c a t i o n s (M-B and M-G) i t appeared t h a t t h e p i s t o n cores had indeed pene-
t r a t e d these depos i ts s i nce t h e v e r y bottom o f these cores con ta ined coarser
sand and d e b r i s which would be c h a r a c t e r i s t i c o f t h e o r i g i n a l r i v e r bottom.
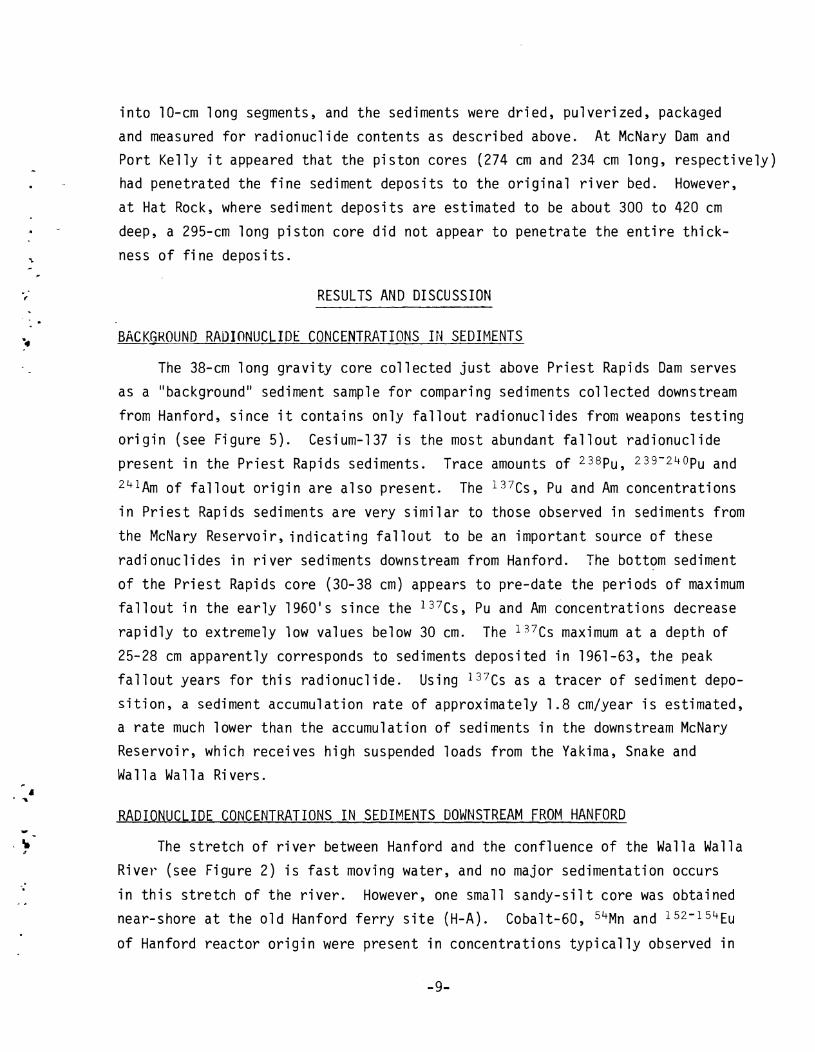
F igures 16, 17, 18 and 19 show the depth d i s t r i b u t i o n s o f a number o f r a d i o -
nuc l i des i n p i s t o n cores c o l l e c t e d a t these l o c a t i o n s . The c h a r a c t e r i s t i c 60Co
peaks seen i n t h e 15-cm d iameter by 50-cm deep g r a v i t y cores (compare w i t h
F igure 5 ) can e a s i l y be i d e n t i f i e d i n t he upper 100 cm o f t he McNary #2 p i s t o n
core. I n a d d i t i o n , a 60Co concen t ra t i on maxima e x i s t s a t a depth o f about 120 cm,
which corresponds t o sediment depos i ted about 1963. Th i s da te can be de r i ved
f rom t h e depth d i s t r i b u t i o n o f 137Cs, which shows a broad maxima peaking a t a
depth o f about 120 cm. A l a r g e f r a c t i o n o f t h e 137Cs i n t h e r i v e r sediments
o r i g i n a t e d f rom f a l l o u t f rom nuc lea r weapons t e s t i n g . The peak f a l l o u t year
was 1963 and t he 137Cs maxima i n t he sediments corresponds w i t h sediments depos i ted
d u r i n g t h a t pe r i od .
It i s r eassu r i ng t o no te t h a t t h e 60Co, 1 3 7 C ~ , 1 5 2 - 1 5 4 ~ ~ and t r ansu ran i c
r a d i o n u c l i d e concent ra t ions i n t he bottom 100 cm o f t h e p i s t o n cores a r e very
low. Th is i n d i c a t e s t h a t no abnormal ly h i gh d ischarges o f r ad ionuc l i des t o t h e
r i v e r from t h e Hanford r e a c t o r s occurred du r i ng t he e a r l y years o f t h e i r ope ra t i on
a t peak p lu ton ium produc t ion . These very low concent ra t ions o f r ad ionuc l i des i n
t he Columbia R i ve r sediments a r e t r u l y remarkable, cons ide r i ng t h e l a r g e quan-
t i t i e s o f r a d i o a c t i v i t y which were re leased t o t he r i v e r d u r i n g t he years o f
r e a c t o r opera t ions .
From s t u d i e s of sedimentat ion r a t e s us ing r a d i o n u c l i d e r a t i o s , and from
the observed r a p i d bu i l dup o f new sediments a t t he Hat Rock (M-E) p i s t o n c o r i n g
s i t e , i t has been es t imated t h a t t h i s l o c a t i o n i s t h e f a s t e s t sediment ing area
o f t h e r i v e r observed thus f a r . Sedimentat ion r a t e s o f 16 t o 30 cm/yr have been
es t imated f o r t h i s l o c a t i o n (sed imenta t ion r a t e s a r e v a r i a b l e f rom yea r t o yea r
and appear t o be d i r e c t l y r e l a t e d t o annual r u n o f f volumes). I t appears obvious
from the depth d i s t r i b u t i o n s o f r ad ionuc l i des i n t h e bottom p o r t i o n o f t h e
Hat Rock p i s t o n core (295 cm l o n g ) t h a t t h i s co re had n o t pene t ra ted t h e e n t i r e
f i n e sediment depos i t s t o t h e o r i g i n a l r i v e r bed (see F igu re 17) . No r a p i d
decrease i n r a d i o n u c l i d e concent ra t ions was observed i n t h e bottom sediment
sec t i ons as observed i n t he McNary Dam and P o r t Ke l l ey p i s t o n cores, which
migh t i n d i c a t e the presence o f t he o r i g i n a l r i v e r bed. However, f rom t h e depth

( l H 9 13M Atla) 6 l lu lp 'NO l l t l t l lN33N03


(lH3 13M A t r a 1 ~ I W P 'NO l l ~ t r l N 3 3 ~ 0 3

d i s t r i b u t i o n s o f t he rad ionuc l i des i n t he o t h e r p i s t o n cores i t appears c e r t a i n
t h a t t h e bottom sediments a t t h e Hat Rock l o c a t i o n would con ta in very low l e v e l s
o f r a d i o a c t i v i t y .
RADIONUCLIDE INVENTORY I N McNARY RESERVOIR
With t h e a c q u i s i t i o n o f the rad ionuc l i de concentrat ions i n t he p i s t o n cores - w - and from t h e c h a r a c t e r i z a t i o n o f sediment depos i ts f rom the sub-bottom seismic
4
survey, an es t imate o f t h e t o t a l q u a n t i t i e s o f gamma-emitting rad ionuc l i des i n
t h e sediment o f McNary Reservoir can now be made. I f we assume t h a t t h e deepest - -
s i 1 ty sediment depos i ts extend approx imate ly 500 meters f rom the Oregon shore - . ( t h i s es t imate i s based on seismic p r o f i l i n g of the r i v e r bottom) a t an average %
sediment depth o f 3 meters throughout t he 40 km s t r e t c h o f r i v e r between Wal lu la
Gap and McNary Dam, and assuming a sediment dens i t y o f 2.4 g/cm3, then approx i -
mate ly 1 . 4 ~ 1 0 ~ ~ g of sediment are present i n t h i s s t r e t c h o f t he r i v e r . The
average concent ra t ion o f the f o l l o w i n g rad ionuc l ides , i n D/M/g, was measured i n
t he p i s ton cores f rom top t o bottom t o be: 4 0 ~ - 30; 55Fe - 70 (est imated) ;
60Co - 9.6; 1 3 7 C ~ - 7.5; 1 5 2 - 1 5 4 ~ ~ - 8.2; 2 3 9 - 2 4 0 P ~ - 0.10, 2 3 8 P ~ - 0.0050;
54Mn - 0.15; 241Am - 0.023; 228Th - 1.0; 226Ra - 3.0; and 65Zn - <0.3. M u l t i -
p l y i n g these average concentrat ions by t h e t o t a l sediment deposi ts g i ves t h e
f o l l o w i n g rad ionuc l i de i n v e n t o r i e s i n t o t a l cu r i es (see F igure 20): ' 40K - 1900;
55Fe - 4000; 60Co - 600; 137Cs - 470; 1 5 2 - 1 5 4 ~ ~ - 520; 239-240Pu - 6.3; 54Mn- 9.4;
241Am - 1.5; 228Th - 63; 226Ra - 190; and 65Zn - 18. When d i s t r i b u t e d throughout
t h e vas t sediment deposi ts behind McNary Dam these i n v e n t o r i e s a r e present i n
very d i 1 u t e concent ra t ions i n t he sediments.
I f we assumed t h a t the remaining 1000 meters across t h e r i v e r was charac-
t e r i z e d by a s i l t y bottom one meter t h i c k (a very l i b e r a l es t imate based on
c u r r e n t knowledge), t h i s would increase the rad ionuc l i d e i n v e n t o r i e s by o n l y
25%.
SUB-BOTTOM SEISMIC SURVEY OF McNARY RESERVOIR BOTTOM
Previous s tud ies have shown t h a t the sediment deposi ts behind McNary Dam
represent a s i g n i f i c a n t r e p o s i t o r y o f Hanford o r i g i n rad ionuc l i des (1,3,8)
I nven to r i es o f 4 6 S ~ , 5 1 C r , 54Mn, 60Co and 65Zn conta ined i n t h e sediment
depos i ts between Pasco and McNary Dam and between Pasco and Vancouver were
est imated i n 1966 y3). However, these i nventory est imates were concerned

NOTE: PERCENTAGES I N PARENTHESES REPRESENT THE FRACTION OF THE TOTAL RADIOACTIVITY CONTRI BUTED BY EACH RADIONUCLI DE.
FIGURE 20. Est imated I n v e n t o r i e s o f Radionucl ides ( i n Cur ies) Associated w i t h Sediment Deposits Behind McNary Dam September 1976

w i t h on ly the upper few tens o f cent imeters o f sediments, s ince the concen-
t r a t i o n s o f the s h o r t - l i v e d rad ionuc l ides decreased f a i r l y r a p i d l y w i t h sediment
depth and the deep sediments were ignored. I n order t o est imate the i n v e n t o r i e s
o f the l o n g - l i v e d rad ionuc l ides now contained i n McNary Reservoi r sediments
i t i s necessary t o know the ex ten t o f t h e area l and v e r t i c a l d i s t r i b u t i o n s of
sediments and t h e i r rad ionuc l i de concentrat ions from top t o bottom. From our
previous sediment sampling experience and from est imates o f sedimentat ion r a t e s
ca l cu la ted from the change i n rad ionuc l i de concent ra t ion r a t i o s as a f u n c t i o n
o f sediment depth, we knew t h a t as much as 3 t o 7 meters o f sediment had accu-
.mulated i n r a p i d l y sedimenting areas o f the McNary Reservoir . We a l so knew
t h a t these h i g h l y sedimenting areas were loca ted along the Oregon s ide o f t he
Columbia R iver between Por t Ke l l ey and McNary Dam. However, we d i d n o t know
any o f t he d e t a i l s concerning the ex ten t of the area l and v e r t i c a l d i s t r i b u t i o n s
o f sediments throughout the e n t i r e McNary Reservoir . This i n fo rma t ion i s
essen t i a l f o r es t imat ing rad ionuc l i de i nven to r i es i n the sediment deposi ts .
Therefore, Hol osoni cs , Inc. o f R i ch l and, Washington was empl oyed t o conduct
a sub-bottom seismic survey of the McNary Reservoir bottom t o charac ter ize the
sediment deposi ts . A d e t a i l e d r e p o r t prepared by Hol osonics, Inc . i s inc luded
i n the Appendix, which describes the techniques employed and the r e s u l t s t h a t
were obtained.
I n general, the Holosonics survey v e r i f i e s what we had conceived the sedi -
ment d i s t r i b u t i o n would resemble (see Figure 21 ). The seismic survey d i d reveal
the presence o f deep pockets o f sediments i n roughly contoured areas near the
Oregon s ide o f t he r i v e r . A major d iscovery was the presence o f f i n e sediment
deposi ts along a sec t i on o f the Washington s ide o f t h e r i v e r several k i lometers
above McNary Dam.
The average th ickness o f t he f i n e sediment deposi ts a long the Oregon s ide
o f the r i v e r i s approximately 3 meters. This value was used i n computing the
mass o f t h e major f ine-gra ined sediment deposi ts i n the r e s e r v o i r . - .
a '
CONCLUSIONS
The Columbia R iver has shown the a b i l i t y t o s a f e l y and e f f i c i e n t l y
a s s i m i l a t e the res idua l r a d i o a c t i v i t y remaining the the r i v e r sediments f rom c
-a
past Hanford operat ions.
I n f a s t - f l o w i n g s t re tches o f the r i v e r between Hanford and Wal lu la Gap (and
o the r l o c a t i o n s downstream from McNary Dam) the rad ionuc l ides associated w i t h


bottom depos i t s a r e scoured f rom t h e r i v e r d u r i n g t h e s p r i n g f r e s h e t s and
depos i ted i n r e l a t i v e l y s l a c k water reg ions o f t he r i v e r , p r i m a r i l y behind
McNary Dam. Fo l l ow ing the shut-down o f t h e Hanford r e a c t o r s no ma jo r r e l eases
o f r ad ionuc l i d e s t o t h e r i v e r has occur red (N-Reactor o c c a s i o n a l l y re leases
very smal l amounts o f s p e c i f i c r ad ionuc l i d e s ) , and the areas o f h i g h sed i -
menta t ion a r e now be ing b lanke ted w i t h r e l a t i v e l y uncontaminated sediment
depos i ts . The f o l l o w i n g conc lus ions can be drawn rega rd ing t h e f a t e o f t h e
remain ing i n v e n t o r y of r a d i onucl i d e s con ta ined i n t h e sediments:
1 ) Sur face sediments behind McNary Dam now c o n t a i n ext remely low
concen t ra t i ons o f Hanford o r i g i n r ad ionuc l i des due t o d i l u t i o n
wi t h uncontaminated sediments and t o r a d i o a c t i v e decay. The
ma jo r gamma-emitters a r e now 60Co, 1 3 7 C ~ and 1 5 2 - 1 5 4 E ~ . Trans-
uranium rad ionuc l i des (Pu and Am) a r e p resen t i n t h e sediments
a t n e a r - f a l l o u t l e v e l s .
2 ) S ince t h e shut-down o f t h e l a s t r e a c t o r w i t h s i n g l e pass c o o l i n g
i n 1971 approx imate ly 40 t o 80 cm o f new, r e l a t i v e l y uncontaminated
sediments have now covered t h e most r a d i o a c t i v e sediments.
3 ) Sub-bottom se ismic surveys revea l t h a t approx imate ly 3-meter t h i c k
s i l t y sediment depos i t s have accumulated i n t h e McNary Reservo i r
between Wal lu la Gap and McNary Dam on t he Oregon s i d e o f t h e r i v e r
s i nce t h e c r e a t i o n o f t he McNary Reservo i r i n 1953. Occas iona l l y
deeper sediment depos i t s appear t o occur i n pockets. The average
sed imenta t ion r a t e between 1953 and 1976 f o r these l o c a t i o n s v a r i e d
from about 5 t o 18 cm/yr. The mid-channel and Washington s i d e sed i -
ments appear t o be composed ma in l y of coarser sands, p o s s i b l y o l d
sand bars f rom the o r i g i n a l r i v e r bed.
4 ) Radi onucl i d e concent ra t ions i n deep p i s ton core sediments i n d i c a t e
t h a t no unusua l l y h i gh r a d i o a c t i v i t y re leases t o t h e r i v e r occur red
d u r i n g t he e a r l y peak years (1953-1963) o f ope ra t i ons a t Hanford.
5) T o t a l i n v e n t o r i e s o f gamma-emi t t i n g r a d i onucl i d e s i n t he major
sediment depos i t s behind McNary Dam have been es t imated t o range
from approx imate ly 600 c u r i e s f o r 60Co t o 9.4 c u r i e s f o r 54Mn.
The 2 3 9 - 2 4 0 P ~ i nven to ry i s es t imated t o be about 6.3 c u r i e s . The
X-ray e m i t t e r 55Fe i n v e n t o r y i s es t imated a t 4000 c u r i e s .

6 ) The buried inventory of sediment associated residual radio- nucl i des i n McNary Reservoi r poses no radi 01 ogi cal hazard t o human or animal populations.

REFERENCES
R. W. Perkins, J. L. Nelson and W. L. Haushild, "Behavior and Transpor t o f Radionucl ides i n the Columbia R iver Between Hanford and Vancouver, Wash- i ngton," Limn01 ogy and Oceanography 11 , 235-248 (1 966).
C. D. Becker, "Aquat ic Bioenvironmental Studies i n the Columbia R iver a t Hanford, 1945-1971. A B ib l iography w i t h Abstracts . " BNWL-1738, UC-48, B a t t e l l e y Paci f i c Northwest Laborator ies, Rich1 and, WA, Rebruary , 1973.
J. L. Nelson and W . L. Haushild, "Accumulation o f Radionucl ides i n Bed Sediments o f the Columbia R ive r Between the Hanford Reactors and McNary Dam, " Water Resources Research 6, 130-1 37 (1 970).
W. L. Haushild, H. H. Stevens, J r . , J. L. Nelson, and G. R. Dempster, J r . , "Radionucl ides i n Transpor t i n the Columbia R iver f rom Pasco t o Vancouver, Washington," Open F i l e Report (TID-25894), U. S. Dept. o f I n t e r i o r , Geo- l o g i c a l Survey, Water Resources D iv i s i on , Por t land, Oregon, 1971.
J. L. Glenn and R. 0. Van At ta , "Relat ions Among Radionucl i d e Content and Physica l , Chemical and Minera l Character i s t i c s o f Columbia R iver Sediments, " Geological Survey Pro fess iona l Paper 433-M, U. S. Dept. o f I n t e r i o r , Geological Survey, 1973, ava i lab1 e from: Superintendent of Documents, U. S. Government P r i n t i n g O f f i c e , Washington, D. C. 20402.
D. W. Habbell and J. L. Glenn, " D i s t r i b u t i o n o f Radionucl ides i n Bottom Sediments o f t he Columbia R iver Estuary," Open F i l e Report (TID-25724), U. S. Dept. of I n t e r i o r , Geologica l Survey, Water Resources D iv i s i on , Por t1 and, Oregon, 1971.
G. L. Toombs, "Lower Columbia R iver Environmental Survey i n Oregon," D i v i - s i on o f S a n i t a t i o n and Engineering, Oregon Sta te Board o f hea l th , Por t land, Oregon, 1966.
D. E. Robertson, W. B. S i l k e r , J. C. Langford, M. R. Petersen and R. W. Perkins, "Transpor t and Dep le t ion o f Radionucl ides i n the Columbia River," I n : Radioact ive Contamination o f t he Marine Environment -- Proceedings o f a Symposium, Seat t le , J u l y 10-14, 1972, IAEAy Vienna, 1973.
C. E. Cushing, D. G. Watson, D. E. Robertson and W. B. S i l k e r , "Decl ine of R a d i o a c t i v i t y i n the Columbia R iver - McNary Reservoi r Ecosystem Fol lowing Shutdown o f Hanford Reactors", BNWL-1850, Pt . 2, UC-48, pp. 84-88, January, 1974.

APPENDIX A
HOLOSONICS, INC. REPORT ON:
Sub-bottom Seismic Survey P o r t o f Walla Walla t o McNary Dam, Columbia R i v e r

SUBBOTTOM SEISMIC SURVEY
PORT OF WALLA WALLA TO
McNARY DAM, COLUhlBIA RIVER
S u b m i t t e d T o :
BATTELLE NORTHWEST LABORATORIES B a t t e l l e B o u l e v a r d
R i c h l a n d , W a s h i n g t o n 99352
S u b m i t t e d By:
HOLOSONICS, INC. 2400 S t e v e n s D r i v e
R i c h l a n d , W a s h i n g t o n 99352
June 8, 1977

SUMMARY O F
CONCLUSIONS AND RECOMMENDATIONS
A . Fine g ra ined sediments ( s i l t ) w e r e l o c a t e d a d j a c e n t t o
t h e Oregon shore l i n e between Twin S i s t e r s and McNary
Dam a s shown i n Appendix A .
B. Coarser g ra ined sediments (Sand) w e r e l o c a t e d above
Twin sisters and a r e p r e s e n t a c r o s s t h e e n t i r e a r e a
surveyed.
C . Surveys run p a r a l l e l t o t h e r i v e r channe l (Numbers 1,
2 , 3 , 4 , l A , 2A, 3A and 4A) were c h i e f l y used i n d a t a
r educ t ion . Cross surveys t r a n s e c t s A through G and A ' ,
AA, AA') were of l e s s e r va lue i n sediment l o c a t i o n s .
D. B y p rov id ing minor mod i f i ca t ions t o t h e survey system
a s p re sen ted , a more e f f e c t i v e system can be provided.

INTRODUCTION
The e a r t h and p l a n e t a r y chemis t ry s e c t i o n of B a t t e l l e Pac i -
f i c Northwest L a b o r a t o r i e s i s conduct ing a program t o s t u d y
t h e t r a n s p o r t and d e p l e t i o n of r a d i o n u c l i d e s i n t h e Columbia T
River . I n t h e conduct of t h i s s t u d y , it i s neces sa ry t o
s e c u r e sediment samples from t h e r i v e r bottom which i n t u r n
w i l l be s u b j e c t e d t o l a b o r a t o r y a n a l y s e s . To more e f f i - . i
c i e n t l y d e f i n e l o c a t i o n s where such samples should be ob-
t a i n e d , a thorough knowledge of sediment d e p o s i t s should be r e
known. Because of t h e l a c k of d e t a i l e d d a t a on t h e l oca - s t -
t i o n s and t h i c k n e s s of t h o s e d e p o s i t s , Holosonics t F i e l d
S e r v i c e s Department i n con junc t ion w i t h B a t t e l l e P a c i f i c
Northwest L a b o r a t o r i e s , has conducted a s e r i e s of sub-bottom
se i smic su rveys on t h e Columbia River . The su rveys w e r e
des igned t o determine a r e a s of maximum sediment bu i ld -up t o
assist i n t h e l o c a t i o n of f u t u r e sampling p o i n t s .
A t o t a l of f o u r , 26-mile t r a v e r s e s were performed p a r a l l e l
t o t h e r i v e r channel . A t o t a l of n i n e t r a n s e c t s w e r e p e r -
formed a t r i g h t a n g l e s t o t h e r i v e r a x i s a t l o c a t i o n s 'de-
termined by B a t t e l l e P a c i f i c Northwest L a b o r a t o r i e s . From
t h e s e surveys , a u sab le sediment i n v e n t o r y has been ob ta ined .
P r o j e c t Methodology
To accomplish t h e d e l i n e a t i o n of t h e d e p o s i t s , Ho loson ic s t
F i e l d S e r v i c e s Department provided a water-borne a c o u s t i c a l
surveying technique . This t echn ique , e f f e c t i v e l y r e f l e c t i o n
seismology, i n v o l v e s t h e u se of a s p e c i a l l y des igned acous- - .
t i c t r a n s c e i v e r system. . . rl
The technique employs t h e u se of an a c o u s t i c a l e lement C .
( t r a n s m i t t e r ) p u l l e d by a boa t . The t r a n s m i t t e r i s a c t i -
v a t e d , g e n e r a t i n g an a c o u s t i c p u l s e which i n t u r n p e n e t r a t e s .

t h e s u b s u r f a c e b e n e a t h t h e r i v e r . When t h e p u l s e s t r i k e s an
a c o u s t i c impedance mismatch, a s i g n a l i s r e f l e c t e d back t o
t h e r e c e i v e r . These s i g n a l s are t h e n p r o c e s s e d and d i s -
p l a y e d on a permanent t i m e h i s t o r y r e c o r d . Knowledge of t h e
approximate a c o u s t i c wave v e l o c i t y ( c o m p r e s s i o n a l wave)
a l l o w s f o r t h e c o n v e r s i o n of t h e t i m e - h i s t o r y d a t a i n t o
d e p t h s ' o f t h e r e f l e c t i n g h o r i z o n s . By o b t a i n i n g numerous
d e p t h sound ings on a t r a v e r s e i n t h e r i v e r a p r o f i l e o f t h e * s u b s u r f a c e c o n d i t i o n s can be o b t a i n e d .
The p e n e t r a t i o n of t h e a c o u s t i c waves i n t o t h e s e d i m e n t s i s
c o n t r o l l e d by t h e a c o u s t i c f r e q u e n c y and a t t e n u a t i o n c h a r -
a c t e r i s t i c s of t h e sed iment . F u r t h e r , t h e r e s o l u t i o n o f
s p e c i f i c boundary c o n d i t i o n s i s c o n t r o l l e d by t h e a c o u s t i c
f r equency . T h e r e f o r e , a s u r v e y f r e q u e n c y must be chosen
which e n a b l e s b e s t p e n e t r a t i o n w i t h maximum r e s o l u t i o n . For
t h e s e s u r v e y s a f r e q u e n c y of 7.5kHz was chosen a s optimum.
During a c t u a l s u r v e y s a c o n s t a n t b o a t speed i s o b t a i n e d and
i t s d i r e c t i o n of t r a v e r s e i s r e c o r d e d . The a c o u s t i c i n -
s t r u m e n t s a r e t h e n p u l s e d a t a c o n s t a n t r a t e and r e f l e c t e d
d a t a i s r e c o r d e d . The p u l s e rate and p u l s e package w i d t h i s
o p t i m i z e d based on w a t e r d e p t h and assumed sed iment t h i c k -
n e s s . I n t h e s e s u r v e y s a p u l s e rate o f 8 p u l s e s p e r second
w i t h a .2ms p u l s e w i d t h was d e t e r m i n e d t o b e optimum.
Once t h e s e optimum boundary c o n d i t i o n s a r e e s t a b l i s h e d ,
changes i n t h e q u a l i t y o f r e c o r d e d d a t a c a n be made by
r e c e i v e r g a i n and r e c o r d e r c o n t r a s t c o n t r o l s . During t h e
s u r v e y , t h e seismic o b s e r v e r m o n i t o r s t h e r e c o r d e d d a t a and
a d j u s t s t h e i n s t r u m e n t t o m a i n t a i n q u a l i t y d a t a r e c e p t i o n .

Survey Equipment
The su rvey equipment c o n s i s t s o f t h r e e major subsys tems . An
ED0 Western P r e c i s i o n Bathymetr ic /Seismic Recorder Plodel
550A, a n ED0 Western Model 6 2 6 9 Hul l Mount Cone Transducer t
and Holoson ics ' MAP sys tem (Minera l Acous t ic P r o s p e c t i n g )
Model 7 5 A High Energy Acous t ic T r a n s c e i v e r . F i g u r e 1 shows
a b lock diagram of t h e survey sys tem. 4
,
The MAP System Model 75A p r o v i d e s e l e c t r i c a l energy a t a
s p e c i f i c f requency , power l e v e l and p u l s e w id th t o t h e cone - . - t r a n s d u c e r . F u r t h e r , t h e system a l s o p r o v i d e s a series of
a m p l i f i e r s and f i l t e r s f o r c o n d i t i o n i n g t h e r e c e i v e d s i g n a l s
b e f o r e t h e y are d i s p l a y e d on t h e s e i s m i c r e c o r d e r .
The ba thyme t r i c / s e i smic r e c o r d e r r e c e i v e s t h e d a t a from t h e
MAP System and r e c o r d s t h e r e c e i v e d s i g n a l th rough amp l i t ude
d i s c r i m i n a t i o n on h e a t s e n s i t i v e paper . T h i s - s y s t e m a l s o
p r o v i d e s command s i g n a l s t o t h e t r a n s c e i v e r t o e n s u r e p r o p e r
f i r i n g sequence of t h e t r a n s d u c e r .
The h u l l mounted cone t r a n s d u c e r p r o v i d e s t h e a c o u s t i c wave
package and s e r v e s a s t h e r e c e i v e r f o r t h e r e f l e c t e d acous-
t i c s i g n a l s . The t r a n s d u c e r i s des igned t o have a s p e c i f i c
beam p a t t e r n t o ensu re p roper d a t a r e c e p t i o n . F i g u r e 2
shows t h e beam c a l i b r a t i o n f o r t h e p a r t i c u l a r t r a n s d u c e r
used f o r t h i s p r o j e c t .
The t r a n s d u c e r was mounted on a t u b u l a r frame and was l o -
c a t e d on t h e s i d e o f t h e su rvey b o a t by means o f c o n t r o l
r o p e s and an e x i s t i n g boom. The bottom o f t h e t r a n s d u c e r
w a s l o c a t e d approx imate ly t h r e e f e e t underwater and i n a
f i x e d p o s i t i o n t o ensu re no c a v i t a t i o n and e l i m i n a t e minor
e f f e c t s from t h e survey boa t .

TRANSMIT
HULL MOUNT TRANSDUCER t-7
BATHYMETRIC/ S E I S M I C RECORDER
TRANSCEIVER MAP 75-A r CATHODE RAY TUBE
SUB-BOTTOM PROFILING SYSTEM
FIGURE 1 - A- 7

ACO-USTIC CALIBRATION FACILITY E0.-
Remarks
FIGURE 2
A-8

F i e l d Program
The conduc t of t h e sub-bottom s u r v e y s consumed e i g h t d a y s
s t a r t i n g A p r i l 11, 1977 and c o n c l u d i n g on A p r i l 20, 1977.
The i n i t i a l t h r e e d a y s w e r e s p e n t i n c a l i b r a t i o n , sys tem
performance check , c o r r e c t i n g minor m a l f u n c t i o n s and w a i t i n g
f o r s u i t a b l e wea the r c o n d i t i o n s .
A t o t a l of 17 s u r v e y s were t h e n conducted from A p r i l 1 4 t o
A p r i l 20th . E i g h t of t h e s u r v e y s were performed p a r a l l e l t o
t h e r i v e r c h a n n e l a s f o l l o w s :
Twin sisters to M c N a r y Darn, 100 yards off the Oregon shore
line, 2 1 miles length
April 15 - S u w e y # 2
Twin Sis ters to !.lcNary Darn, 200 yards off the Oregon shore
l ine , 21 miles length
. April 18 - Survey #3
Twin Sis ters to McNary Dam, mid-channel, 21 miles length .
nYin Sis ters to M c N a r y Dam, 200 yards off Washington shore
line, 21 miles length
Cantinuation of Surveys #1 through #4 upstream fran Win
S i s e r s adjacent to the Port of Walla Walla, 20 miles total

A t o t a l o f n i n e surveys were performed a t r i g h t a n g l e s t o
t h e r i v e r a x i s from A p r i l 15 t o A p r i l 20th as fo l lows:
8 . April 15 - Transect A - M d d a r y Dam, 100 yards upstream f r m
bmy l ine
April 15 - Transect B - Center of M c N a r y Park, swhning lagoon
April 18 - Transect C - Hat Rock State Park, a t navigation
range marker
~i l i t . ~ ~ 1 i~ d L A . , 7 , L L - . ~ - ; ~ ~ L ~ ~ L ] - L ~ & - A , ~ ~ ~ ~ ~ ~ ~ ~ - l x ~ w ~ ~ ~ n ~ i ~ ~ LLAIS - -- -- . - - - .- - - --- Apqi;1, ,$8,T ,%ansect AA - & N a r y Dam, halfway between buoy l i ne
@ AI ,1 I I 1 a 1 L ~i iL,t>~ ' L --& . - - - - - - - --- :,1u';,r\+ ; h . ; i , lid1 hidl I X E V J e a ' k ~ d l ,L,.XIt
4~!r&,l8~ ,:, , R q g e c t AA ' - McNary Dam, halfway between Transec t
AA and p e r h o u s e
April 19 - Transect F - Port Kelley
m April 19 - Transect E - Juniper -. A ~ L L : - '*'icu,a,Lt J - u ~ L S * ~ - a n d i d tk tqc isldd ---
a April 19 - Transect D - Upstream end of Refuge Island
April 19 - Transect A l l - McNary Dam upseeam from buoy l ine
(sarrre a s Transect A)
April 20 - Transect G - Adjacent to Port of Walla Walla
1nc luded . i -n Appendix A , "River c h a r t s 1 ' a r e t h e l o c a t i o n s of
a l l surveys performed.
Survey Data
Appendix B c o n t a i n s p e r t i n e n t examples of o r i g i n a l f i e l d
d a t a ob ta ined du r ing t h e f i e l d surveys . Located a long the
t o p edge of t h e s e survey r e c o r d s a r e t i c marks and d a t a
concerning t h e l a t e r a l e x t e n t and sediment t h i c k n e s s as
ana lyzed by Holosonics ' F i e l d S e r v i c e s Department s t a f f .

Appendix A "River Cha r t s " a l s o c o n t a i n s p l o t t e d d a t a a s t o
sediment ( s i l t and sandy s i l t ) l o c a t i o n s based on ou r ana-
l y s e s of survey d a t a and geo log ic i n t e r p r e t a t i o n , and r e -
s u l t s of f i e l d sampling programs conducted by B a t t e l l e
P a c i f i c Northwest Labora to r i e s .
Contained i n Tables I through I V i s a sediment i n v e n t o r y
taken from t h e f i e l d d a t a . The l o c a t i o n (yardage from
survey c o n t r o l po in ' t s ) i s based on ou r c a l i b r a t i o n of b o a t
speed and l o c a t i o n , v e r s u s r eco rd l e n g t h . The a c t u a l l o -
c a t i o n s of t h e sediment d e p o s i t s w i l l v a ry from t a b u l a t e d
d a t a due t o i n a c c u r a c i e s of b o a t speed and a b s o l u t e l o c a t i o n
of boa t . However, by us ing f i e l d r e c o r d s , t h e l o c a t i o n of
d e p o s i t s can be d u p l i c a t e d t o approximately + 2 0 ya rds .
Also conta ined wi th t h e sediment i nven to ry i s ou r e s t i m a t e
of sediment t ype base of f i e l d d a t a and geo log ic i n t e r p r e -
t a t i o n .
During d a t a a n a l y s i s it became apparen t t o ou r s t a f f t h a t
t h e c r o s s surveys were of l e s s e r va lue than t h e down r i v e r
t r a v e r s e s . This i s due t o t h e spacing of t h e c r o s s t r a n s -
e c t s which does n o t a l l ow c o r r e l a t i o n between a d j a c e n t s e t s
of d a t a . These surveys con ta in v a l u a b l e d a t a and provide a
b a s i c unders tanding of t h e r i v e r system neces sa ry t o any
i n t e r p r e t a t i o n . However, t h e d a t a could n o t be used t o any
g r e a t e x t e n t f o r sediment d e p o s i t l o c a t i o n ( excep t a t McNary
Dam) and a l l r e s u l t s a r e based on down r i v e r t r a v e r s e s .
Survey R e s u l t s
A s can be seen i n Appendix A , our i n t e r p r e t a t i o n shows s i l t
and sandy s i l t type d e p o s i t s l oca t ed g e n e r a l l y a long t h e
Oregon sho re l i n e . These d e p o s i t s are f e l t t o be l o c a t e d on
t h e low a n g l e s l o p e s a d j a c e n t t o t h e s h o r e l i n e and g e n e r a l l y

d o n o t e x t e n d t o t h e c e n t e r l i n e of t h e r i v e r . The c e n t r a l
s e c t i o n and Washington s i d e o f t h e r i v e r e x c e p t a s p l o t t e d
i n Appendix A , i s composed o f s i l t y s a n d , sand and c o a r s e
a g g r e g a t e o r rocky bot tom d e p o s i t s .
G e n e r a l l y , t h e a r e a s u r v e y e d , l y i n g ups t ream from P o r t
K e l l e y , i s composed m o s t l y o f sand and c o n t a i n s l a r g e r i p p l e
marks a s shown i n Appendix A & B.
9
. A l l s ed iment t h i c k n e s s e s a r e based on t h e zssumed p r i m a r y
wave v e l o c i t y of 5 0 0 0 f e e t p e r second. . T h i s v e l o c i t y s h o u l d
be v e r i f i e d by l a b o r a t o r y t es t s on c o r e samples from a c t u a l
r i v e r d e p o s i t s .

SUHVEY #1
100 Yards Off Oregon Shore Line - ! l W h Sis te r s to Mary Dam *
PROBABLE SEDli'rn IDCATION* LENGTH 'MICKNESS** TYPE
1- 1 + 1,180 yds. 100 yds.
_I 1- 2 + 380 yds. 1,440 yds. d
1- 3 + 960 yds. t o - 1 - 4 + 4Oyds.
6 80yds. - 1 - 6 + 44Oyds. 600 yds.
1 - 7 + 960yds. 360 yds.
1- 8 + 100 yds. 200 yds.
1- 9 - 360 yds. 360 yds.
1-10 + 650 yds. 200 yds.
1-11 + 660 yds. t o 1-12 + 770 yds. - 1-14 + 280 yds. t o 1-15 + 190 yds. -
1-15 + 190 yds. t o 1-16+ 50yds.
1-16 + 960 yds. t o 1-17+ 50yds. -
1-19 + 660 yds. to . . 1-21 - - - 1-21 + 140 yds. 680 yds.
; '#
1-21 + 720 yds. 480 yds.
1-22+ 48Oyds. 480 yds. .d
1-2 3 800 yds.
Si l t y
2' up to 12' pock. S i l t y
9 ' s i l t y (
S i l t y
s i l t y (~~~~ -
5-7 ' Si l t y I Star t 3-4', Center 15-18', Ehd 4-6' Si l t y
1-3 ' S i l t t o Sandy S i l t I S i l t t o Sandy S i l t
A I S i l t to Sandy S i l t
8-14 ' Si l t y to Sand S i l t J *Based on our calibration of f i e ld data
*XVp asfllmed at 5000 ft/sec.

SURVEY #1
100 Yards Off Oregon Shore Line - Twin S i s t e r s to M c N a r y Dam
1 - 2 5 + 42Oyds. 500 yds.
800 yds.
1-27 + 800 yds. to 1-28 - 350 MS. -
1-28+ 72Oyds. 400 yds.
1-28 + 1,120 yds. t o E d o f Survey
PROBABLE SEDIMENT THICKNESS** TYPE
L
1-3 '
Var . t o 15 '
Var. to 20' '
10-12'
S i l t y
S i l t y
10-15' w i t h thin pockets a t i r r e g u l a r intervals
*Based on our c a l i b r a t i o n of f i e l d d a t a **Vp assumed a t 5000 ft/sec

TABLE I1
200 Yards O f f Oregon Shore Line - Twin Sistersto M c N a r y Dam
PROBABLE s m m LENGTH THICKNESSk* TYPE
800 yds. 8-12 ' s a r d y S i l t to S i l q d 2- 3 + 100 yds. t o e
i 2- 4 + 60 yds. - . + Var. 4-10' .
2- 7 1,000 yds. 6-12 ' S i l t y
2- 8 to 2-9 - 2-4 '
2- 9 + 850 yds. t o 2-10 + 1,100 yds. 4-8 ' f.ilty
2-10 + 1,100 yds. t o 2-14 + 400 yds. 1-3 ' S i l t to S i l t y Sand
2-14 + 400 yds. to 2-14 + 2,700 yds. 2-5 ' w/ Sandy S i l t to Sand
10-15' Pockets
2-14 + 2,700.yds. t o J 2-16 + 1,500 yds. - S& S i l t to Sand
2-16 + 1,500 yds. 500 yds . 5-7 ' S i l t y Sand to S i l t
2-16 + 2,000 yds. t o 2-21 - 2-3 '
2-22 to 2-23 200 yds. 2-3 ' S i l t y
2-23 - 200 yds. to 2-23 + 200 yds. 4-5' Local Pockets
. - 2-24 to Erad 5-12' Thick pocket - in 1-3 ' -era1 Thickness
-. ; b
*Based o n our c a l i b r a t i o n of field data + *Vp assurred a t 5 ~ 0 0 f t / s e c .

TABLE I11
SURVEY #3
Mid-Channel - M n Sis te r s to Mary Dam
. PROBABLE SEDIMENT
TYPE
L
Sand 3- 1 + 1,300 yds. t o 3- 6 - Var. up to 8'.
' Sand - Sand Maybe Sane S i l t 5-12' Pockets
Sand Maybe Sane S i l - @ 4-5' Occasional 12 ' , Pockets
3-14 + 400 yds a t Hat Rock Sta te Park Transect C - Weak Indication
of 12' Pockets Sand Maybe sane
Sand 3-14 + 1,100 yds. - 4-5' Pockets
3-14 + 1,400 yds. 200 yds. 3-4 ' Sand Pockets Gradin To S i l t t
Sand & S i l t
Sandy S i l t to S i l t
3-1 0 ' Variable
3-15 + 1,150 yds. 500 yds. 10 '
Sandy KT 5-8 ' Sandy S i l t To S i l t I
I - .
10-12 ' Sand - 3-17 + 600 yds. 400 yds.
Faugh Bottan with Pock & Sand Uxal Pockets
of Sand
*Based on our calibration of f i e l d data **Vp assurred a t 5000 ft/sec.

TABLE I V
200 Yards Off Washington Shore - Twin Sis ters to M c N a r y Dam w
PIiOBABLE SEDIMENT
ttf . LQCATION* LJmZTH THICKNESSk* TYPE
-. - 4- 1 to 4-2 - 200 yds.
-$
4- 4 + 900 yds. t o ' r - 4- 5 + . 300 yds. - -
4- 5 + 300 yds. 200 yds.
-1 Sand
4- 5 + 500 yds. 900 yds. 6-10' Grading to 3-6' s m n
4- 6 + 900 yds. 700 yds. - Rock Bottom and Gravel
4-10 + 1,400 yds. 75 yds. 3-5 ' Pockets t o 1 2 '
4-12 + 750 yds. t o 4-13 + 300 yds. 5-10 ' Variable Sand & S i l t
4-13 + 300 yds. t o 4-15 - 2-5' Variable Sandy S i l r' '\
I i
4-17 - 1,100 yds. t o 4-18 + 800 yds. -
4-18 to Finish - Variable to None
*Based on our calibration of f i e ld data *Wp assumed a t 5000 ft/sec.
. - -

TABLE V
All hca t ions are Referenced F'ran Oregon Shore Line
0 yds. t o 500 yds. 10-12 '
. 600 yds. to130U yds. 2-6 '
1400 yds. t o 1550 yds. 3-9 '
1600 yds. t o 1800 yds. 3-4'
0 yds. t o 550 yds. 6-12 '
630 yds. t o 680 yds. 2-4 '
770 yds. t o 1020 yds. 6-7 '
1020 yds. t o 1530 yds. 10-12 '
0 yds. t o 730 yds.
700 yds. t o 1225 yds.
SURVEY AA'
P m m s m m t
TYPE
Si l t y
S i l ty
S i l t y
S i l t y
S i l t y
S i l t y
S i l ty
S i l t y
S i l t y

CONCLUSIONS
Based on sub-bottom surveys and geo log ic i n t e r p r e t a t i o n it
i s ou r op in ion t h a t t h e m a j o r i t y of f i n e g r a i n e d sediments
a r e l o c a t e d a d j a c e n t t o t h e Oregon sho re l i n e and are l o -
c a t e d on t h e bench (low ang le ) s t r u c t u r e s .
During t h e conduct and a n a l y s e s of surveys it became ap-
p a r e n t t h a t t h e a c o u s t i c n a t u r e of t h e sediment d e p o s i t s
were complex. That i s , t h e impedance mismatch ( u l t i m a t e l y
t h e r e f l e c t i o n c o - e f f i c i e n t ) of t h e r i v e r d e p o s i t e d s i l t s
ove r ly ing t h e t e r r e s t r i a l s i l t s i n t h o s e a r e a s where t h e
pool inunda ted t h e sur rounding land i s v e r y low. Th i s low
mis-match c r e a t e s a low ampli tude ( r e l a t i v e ) r e t u r n s i g n a l
which i s d i f f i c u l t t o r eco rd . F u r t h e r , t h e a t t e n u a t i o n of
some of t h e s i l t d e p o s i t s appears t o be h igh a t t h e £re -
quency used (7 .5 kHz) .
These two a c o u s t i c c h a r a c t e r i s t i c s coupled w i t h t h e l a r g e
v a r i a t i o n i n wate r dep th , compound t h e d a t a complex i ty .and
make i n t e r p r e t a t i o n d i f f i c u l t . F u r t h e r , p r o f i n g i n shal low
water approximately f i f t e e n f e e t o r l e s s adds f u r t h e r com-
p l e x i t y t o d a t a r e d u c t i o n because t h e r e t u r n s i g n a l s a r e
l o c a t e d w i t h i n t h e i n s t rumen t ringdown and m u l t i p l e r e f l e c -
t i o n s of t h e f i r s t bottom. Although t h e s e c o n d i t i o n s e s -
s e n t i a l l y degrade t h e sub-bottom d a t a , t h e i r e f f e c t can be
reduced o r e l imina t ed by provid ing m o d i f i c a t i o n t o t h e
survey techniques and systems a s o u t l i n e d under recommendations.
The sub-bottom p r o f i l i n g technique has t h e a b i l i t y t o de-
l i n e a t e t h e s e and o t h e r sediment d e p o s i t s w i t h t h e h e l p of
geo log ic a n a l y s e s and d a t a from a c t u a l sampling programs.
I t i s f e l t t h a t t h i s survey technique and systems w i t h minor
mod i f i ca t ion can provide enhanced d a t a on sediment l o c a t i o n

which would not require extensive geologic analyses or pre-
. survey sampling if the recommendations contained below are
followed.
Recommendations
To provide complete sub-bottom profiling capabilities for
the Columbia River sediment deposits, the f,-illowing recom- t.
mendations and modifications are suggested:
a Provide greater control on position of survey
vehicle. This will allow for more accurate re-
construction of data points for sampling programs.
a Provide a dual frequency (3.5 and 7.5 kHz) pro-
filing system. This will effectively eliminate
attenuation problems and reduce the effect. of low
impedance mismatch at boundaries.
a. Obtain occasional core samples for acoustic yelo-
city control.
Conduct additional cross river surveys to enable
better correlation of data.
Provide a calibration site near McNary Dam for
periodic system check.
a In shallow water areas, readjust the instrumen-
tation from normal settings to enhance the signals
contained in the ringdown and first bottom multiple.

APPENDIX A
Shown i n F i g u r e s 1, 2 and 3 are t h e l o c a t i o n s of a l l su rveys
conducted f o r t h i s p r o j e c t and approximate bounda r i e s o f
major sediment bui ld-up ( s i l t and sandy s i l t ) .
Traverses Run Parallel t o River Channel
=---IP - Transects R.m Perpendicular to River Channel
I%i jor Sedimnt Areas


APPENDIX B
The f o l l o w i n g c o n t a i n s a b r i e f d e s c r i p t i o n o'f d a t a r e d u c t i o n
methods and examples o f d a t a o b t a i n e d d u r i n g t h e s u r v e y s .
Data Reduct ion
Subbottom p r o f i l i n g d a t a i s reduced i n t h e same f a s h i o n a s
s t a n d a r d l a n d born seismic r e f l e c t i o n surT-;ing. Tha t i s , a
series o f t i m e - h i s t o r y r e c o r d s a r e o b t a i n e ? a t d i s c r e t e
p o i n t s a l o n g a su rvey l i n e and c o r r e l a t i o n i s made between
r e c o r d s based on a r r i v a l t i m e s of s i g n i f i c a n t s i g n a l sets.
F i g u r e B-IA shows a h y p o t h e t i c a l c r o s s - s e c t i o n o f a s u r v e y
a r e a . I n t h i s example, t h e t r a n s m i t t e r - r e c e i v e r e l ement i s
l o c a t e d a t t h e w a t e r s u r f a c e and i s towed from l e f t t o
r i g h t . Ray p a t h s a r e p rov ided t o show a c o u s t i c wave p r o -
p a g a t i o n . Ray p a t h Number 2 i s a c o n t i n u a t i o n o f P a t h 1
showing r i n g i n g i n t h e s u r f a c e l a y e r ( w a t e r l a y e r ) . Addi-
t i o n a l r i n g i n g o f t h i s t y p e w i l l o c c u r between Boundary A &
B i n t h e sed iment l a y e r b u t i s n o t shown t o a v o i d c o n f u s i o n .
F i g u r e B- IB shows t h e t i m e - h i s t o r y r e c o r d r e c e i v e d by t h e
i n s t r u m e n t b e f o r e s i g n a l p r o c e s s i n g ( t h i s s i g n a l would b e
symmet r i ca l a b o u t t h e Y-axis i n r e a l f i e l d d a t a ) . The
l o c a t i o n ( t i m e ) of e a c h r e c e i v e d s i g n a l i s a f u n c t i o n o f
wave p r o p a g a t i o n v e l o c i t y and p a t h l e n g t h . ~ a c h s i g n i f i c a n t
set o f s i g n a l s i s i d e n t i f i e d by t h e r a y p a t h t r a v e r s e d and
t h e boundary a t which it r e f l e c t s . S i g n a l A-2 i n d i c a t e s a
m u l t i p l e r e f l e c t i o n ( g h o s t ) from Boundary A caused by t h e
r i n g i n g o f t h e waves i n t h e s u r f a c e l a y e r .
The r e c e i v e d waves a r e t h e n p r o c e s s e d by a m p l i t u d e d i s -
c r i m i n a t i o n and d i s p l a y e d by t h e b a t h y m e t r i c / s e i s m i c re-
c o r d e r i n t h i r t e e n s h a d e s o f g r a y . T h e r e f o r e , e a c h t i c k
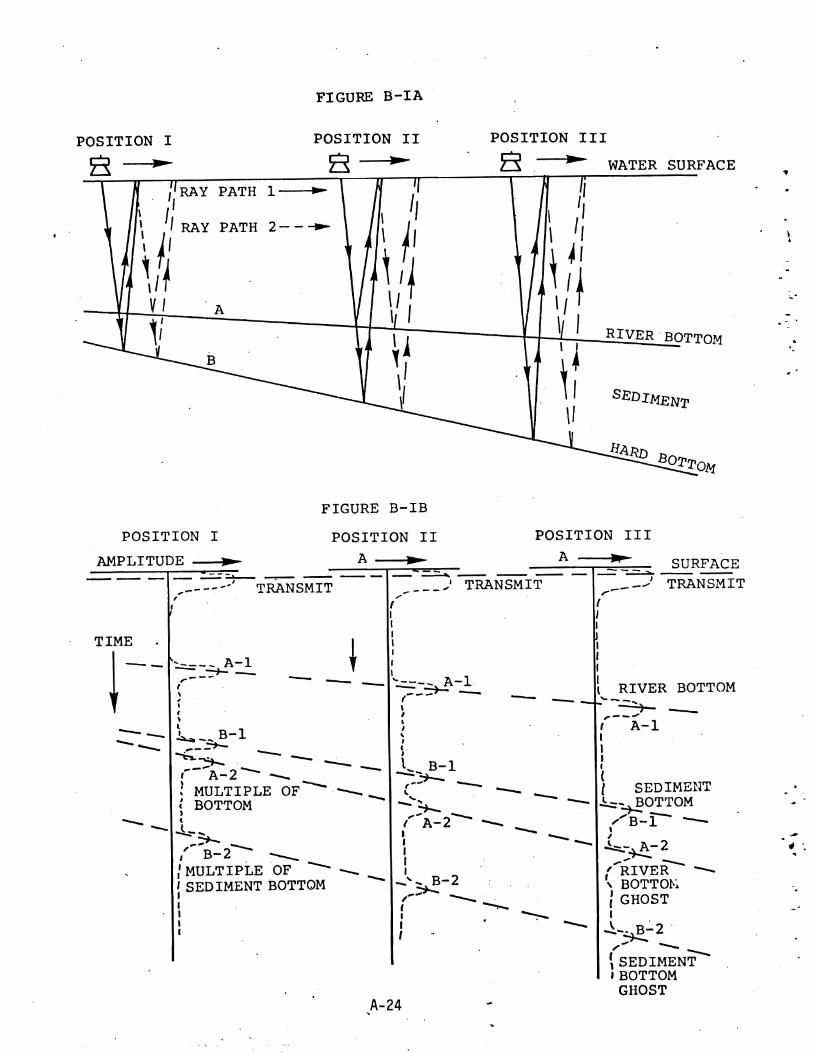
FIGURE Ei-IA
POSITION I POSITION I1 POSITION I11
23- !a- WATER SURFACE
FIGURE B-IB
POSITION I POSITION I1 POSITION I11

mark shown on t h e r e c o r d s r e p r e s e n t s t h e a m p l i t u d e of i n -
d i v i d u a l waves r e c e i v e d by t h e sys tem. I f t h e a r r i v a l t i m e s
of t h e , i n d i v i d u a l waves i s c o n s i s t e n t a l o n g t h e t r a v e r s e ,
t h e n t h e y a p p e a r a s l i n e a r f e a t u r e s . The l i n e a r f e a t u r e s
c a n be i n t e r p r e t e d a s e i t h e r t h e r i v e r bot tom o r boundary
c o n d i t i o n s p r e s e n t i n t h e s e d i m e n t s a s shown i n F i g u r e s B - I
A & B.
F i g u r e B - I 1 shows f i e l d d a t a w i t h t h e r e f l e c t i n g b o u n d a r i e s
h i g h l i g h t e d . The p a r a l l e l l i n e a t t h e b o u n d a r i e s a r e c r e a t e d
b e c a u s e t h e a c t u a l t r a n s m i t t e d energy i s a wave p a c k e t and
t h e r e c o r d e r a m p l i t u d e d i s c r i m i n a t e s e a c h i n d i v i d u a l wave i n
t h e p a c k e t .

WATER SURFACE (BOTTOM OF TRANSDUCER)
FIGURE B-I1 FIELD RECORD SHOWING FIRST ARRIVAL AND MULTIPLE REFLECTIONS
SEDIMENT REFLECTION (SEDIMENT-- BOTTOM BOUNDARY)
7 IU SEDIMENT MULTIPLE QI (SEDIMENT GHOST )
----- ----. ..- ----"-----" -------.--.----- --me-- .----..a"- ----P--.-,---*--- .-" .----.--- -.---- -..- -- --a --- ---------- --.- ---- --- ---- -------- -- ----- - .- - - - - - - - ---- -----
I - -
-- _--. = I t - . - - - - -
1- - -- . - - - - . - - - <.- ::-- -+
t! ,- -.-> < - - - .- - - - - - - - -- -. - = =d - -= < _ _ .- - --x. ; - . - . . - , 1. : - 2 . I
. - . . . .
< . ' - I : : ? ? A : L - C , L -, t -
I I
I f
I I I
BOTTOM REFLECTION (WATER-SEDIMENT BOUND?
BOTTOM MULTIPLE (BOTTOM GHOST)
P


.,!.. -. ST..'.-
..! *, . ...., . ;;:,;:. .: ,' ,.:"." ' .,,.,, .+z: .,;:."; ..... , . ,
I,. , ..... , ... . .+>. .. ..,. *.,. . :1. . .
. "!..,.? ',. ..__ ...... , I.) . . . . . .


- . =..U*UM -"--.M#".--.-.---* UUuUUUUUUU-.r--.-.DI MM*Uuu-"--~~-~~~-~~-~~"~~-~~.~-m"~~nrunru.nrunrunrunrunrunru~-----'~~~
~ * ~ ~ - ~ ~ ~ Y - . ~ ~ ~ . ~ ~ ~ Y I I O I X ~ O N ~ I * I - ~ ~ U I W I W ~ - I ~ ~ ~ - - U U P ~ , - ~ - ~ I M ~ ~ I I I ~ ~ L M W ~ I ~ I ~ . . ~ - ~ ~ ~ U U + W ~ ~ ~ U * , P . I ~ L ~ I U U W ~ ~ M ~ ~ ~W,IIL(N-~L,.MM~ I I ~ u ~ ~ ~ ~ ~ ~ - Y ~ Y ~ L V L V C I ~ ~ ~ U ~ -z-lldl~11*- D I I W - - . C ~ ~ ~ ~ ~ - ~ ~ ~ * ~ ~ ~ *wJ4Mw* 6-h- - - ~ - - ~ I L U ) - ~ - ~ ~ - ~ ~ ~ ~ V ' I ~ ~ , , ~ W - ~ ~ M Q F ) . , - ~ ~ - ~ ~ I ~ ~ ~ ~ ~ I - J . ~ Z m ~ ~ - - w m ~ w m w ~ m ~ ~ ~ . . - v c m * n n ~ n r n M ( ~ ~ w I ~ ~ * u I Y D u ~ L I T ~ w ~ ~ - ~ ~ ~ ~ ~ .'Y~~W~~"~~~UM-.YIIWCL-C-~*--~,.-~~".II~~IIII~P~.~~OY~*OY~*OY~*~~OY~*OY~*"OY~*OY~*.~~CCIIP*UVI"OY~*-OY~*.OY~*-"OY~*.OY~*-OY~*OY~*--*-~----~-~~ -.-"..I*". " m r w r - a - -u.r.---*-*- Y . . , N I . - o n u - - * s . . %--.,,.--- *.- ." ..,.=-. r..aruMw,".rrrwn,.-rY~,w.l*u*WNr " m . m s . u l w r . - r l l n o * . o ~ m . . n ~ # ~ - - . . - - - -
-C'.UC-P.rr-rOr_-^l-,-m"-~--*---"- -..-.-. -<...... Dl"--...7b-" ......... .,IQ___Q___Y-YQ___Q___Q___Q___."..Q___,~Q___ Q___-.-i*----- "-PC".WL..P-..""Y-~.-~YU~Cn-..MI---.--U- --4. . .vy:":E- --.. ,.. . I.. L.......... ..,. ...... ---"...--...--..__,I".... .....-. --.,..,.,,.. ............I....................... -., -..,* ............I......... I. ......................--.̂ -.----... . * - - . - - . - - - ..-.. - . . . . . . . , .. .* ,. . \ - . . < - . ., -. . -
. . . i . . . . ,
. . .: . . . . . / . . , . . . . . . . . . . - .
. . - - . , . : -.:
... . - . . . . . . . . . - . - , . - . . , . . : . . . . . . . . . . . . . . . . . . , . . < . ,. , , : : , . . - . . . . . . . . %
I- , . . . - . . . . . . . .
. . . . . .
. . . . . . . . . ' , . ' . .-. . . . . - . - . . , . . . . . I : - . . , . . . . .
. . , . .
. . . .
. . . . . ,
. : b : .. . . . . . . . . . ~. I :, .- . . -
, . . . . . . . . . . . 1' . :
. . . . . . . . , : . . . i ! > . . . I j I
LIIILTIPLE REFLECTION i , . i OF BOTTOM i
- . . , > : ! . . . . ,
. . . . . , . . . . , ..--,. - . . ...... , . , . . . . .
...... . - . < . . J : > y i . . ... ... . ..,.
, ,, ... ;.:.<. :. .: : . ,:$;:I: ;: !,+..',;i:::>:. :::- ....... . . . . . . . %a:,;:.:.: :;. ?. ;:,;;~.-~~~; ...: : . . . -.. .. ; ,: .....- *q: . ..... . . .. . . . . . ' .......... I,.: ..,,, n;:.:, , : :. , :, ):..; ~ ~ ~ ~ ; > f $ ' ; .,::,.
. . . . . >
:. ! . . . . I . . .,. . . .. . . . . . . . . . . -.; 5 : : . ;. . . . . . . .,:,: ,-c..". . . , "". ...(,, :
. . r . . . . . , - . . . . . . . . . . . . : . . - - 7 ' ; ; : - . . . ; : .;. -: :: =.:: :: ..;-. . . . . . . . . .
; ,;{:~'::,'.::. . . . ; .::.:.<:j:z: :; : ; ' , ; : . -.* < ,-,.:.'<,,::.> . . . . . . . . . . . . . .< ,
, . . . . . . ..... . . I . . . . . . . . . . . . . . . . . . . .
! -., .: .; ;:: . . . . . . . . . . . . . . . . . . . . . . ,
. . . . . . . . . . - . . . . , . . 7 . .
. ., . . : /
> i , .
. . . . , .
. . . . , .
.^ , . ..;.
. . hrnTIPLE W m C T I o N OF I . . . ... .- . i .
.- : . :. .
. . . . . . . . . .
. . . . . . . . . . . . . . 7 , . 1 I
. . . . . . . . . .
. . I , . _ > _ . . : . . . .
SEDIhIENT EDLJNDARY . _ . . . . . _: . i . ' . [
. . . . . . . . . .. , . .
. . . . . . . . . - ,' . ,. .; ::.. I ' . . . . j . . . . j . . < ! . . ,
. . . ' t I - . , < I : . . < .:,: . . ,. . - . . . . . . i '
. . . . I - ' . . . .'. s . . .
. . . . . . I i SURVEY #2 I i
I . .
. , i !! . . . . . . AT SAIvPLF: POINT, BUOY D: THIS RECORD WAS TAKEN I
. . . . -- 1 . . . - . .. . . . .*. . . . . - ..:;$; \ W I L E C I R C L I N G A M ) D R I l " r I N G ~ U N D T H E S ~ U N D P L E 1 .
. .- ....... : il ̂-.,". .. .- - . .... ... . -. . - .. .- . . . . .; <,,./.. . . .C $ 2:' ' - ..
. . . . . . ' l . . . . !
_. ... .. - z= . : ..... .. ..z<z--- . -.:-:=s;. ..=2-7:,72 --; z>;;:. . . . <. ARl3A. KYI'ICE THE INCLINED LINEAR S?XWJVEE
. .:=-.. + .-. ., .. . . :, . 1 .. -. :... ::+ 1::; ..... ..z .:: . ,: ::. ;;Y+-.~ + >?.- +-.-$; <, . . . . ;:.,. . . . - :-.. . .-- . . . .:.: . . t . ..< . - PRESENT WHICH INDICATES A MINIMUM SEDIh.IENT THICK-
f . . . . : :- . . . . . . . . . . . . . . . ,: .- ...; ;< &:s . 7: .. + ,.::-.; .-::: .?-.: ; -;. . .. . . . :<+-
- . . . . .. ~ :. . .-: < t' : : . . t , ;: . . . . . . . . . .
NESS OF 5 TO 12 FEET. THIS AREA KXJLD ALSO BE .... . .
,.;. . -'. > , .:::7 : . . ,, ,:;.,- . * :-= . .z* .......... --.--::>.:2" !, .. . . . . . . . . . . , . . . . . . . - . '
*. > -..-: ;T.=,.T-::.' , . . : . - . . , .> : . .' ' . . '.. - - . . IDEAL AS A CALIBRATION FOINT FOR FUIWE SURVEYS.
:: .... +, 4: ::;-:*. + :;z- . .. .Gy, FL+ *:-:+;. G: .. * .
..;A: . : . . ,. Fi ' . , . . . . . - - ; - I . . - . :: 2 ' . . . . . .. - . 2.2 .,.... ( '.i<:: . . . . . . . .
AVERAGE WATER DEP2II I S 38 FEET. + : ' - :: . : . - 1: 5 . .- . . . . ; : - " f :'.': * : '. ,- --, : 7 .: .; $:: > [. . . . . . :. ;. b; , . . .. . ............ .... ..... . . . .
, - 7 - . - . , . . , C _ . . . . . . - - - . " , .- '; - .- . .;. 'C -. ..-.t- ?.. 7.-,::., ...... . :. . . : :;..:,;. ; - i . - - ... + . .. ... . . . . . .! . 7 . . . . .
. . . . :L : : 3. > ;. , . - . ,:, :.. , . . . . . . A . ,,.. :i ., . , 1 '::;; <.;: :::.;:, . ,:: . ~ ,
, . . . . . ': . . . . . . , : . . ;: .(. . .,


A P P E N D I X B
TABULATED RADIOtdUCLIDE CONCENTRATIONS

R A D I O N U C L I D E C O N C E N T K A T I O N S I N C O L U M B l A K I V E K S E D I M E N T
SAMPLE DATE: AUGUST 3, 1976 SAMPLE LOCATION: Pk IEST K A P I DS ( P k - A ) SAMPLING METHOD: GKAVITY COk lNG
dlm lg m
CORE DEPTH (cm)

R A D I O N U C L I D E C O N C E N T R A T I O N S I N C O L U M B l A R I V E R S E D I M E N T
SAMPLE DATE: AUGUST 4, 1976 SAMPLE LOCATION: HANFOKD FERRY, FAR SHORE (H-4) SAMPLING METHOD: GRAVITY COR ING
dlmlgm
CORE DEPTH (cm) - - --- 4 0 ~ 5 4 ~ n 6 0 ~ o 6 5 ~ n 1 3 7 ~ s 152-154E 22gTh 226ka 2 3 8 ~ u 239-240pu 2 4 1 ~ m - [XI
-- w 0-5.1 46.6 0.196 1.93 (0.5 2.06 1.34 1.43 7.54 Q00067 * 27 0.0104 * 6 0.0016 + 35
GRAB SAMPLE 35.9 0.087 0.944 <0.5 1.75 0. 666 0.628 3.98 HANFORD SLOUGH

L n N O - W S rn a r n O 3 0 N d r - i d d 0 d d ~ d O d t - 7 A N - A d d d d d d d d d d d
v v v v v v v v v v


"p e z z s > j8 0."~ Z
E E E rnzc 5 % I- .. a W i ' D mag - izLi 282 a-Jz w w - JJJ aaa S E E a a a
v v v v v v v v v v v

W 0 Z? Z
lx 0 O m 0 dz W 5 %
emo -. s z 0 > = - ? a Z I - w c r 0 - n . .
IS=' a " 0 2 r3c
i=t k i Z E < o m n J Z W W - JJ.J C L a C L E E S 6 6 6
m I + a u \ m ~ u \ ~ c u o 0 r - r n ~ % B g ~ a m r n h ~ - a o o 4 c u e b a d 0 1 S 2 2 3 E E k b 2 f 2 b O b b b b b b b b b
CV CV dddddddddddidddddddddd

a - - C T d \ O M \ O b W L n 0 - 0 Z - - a S m L n - O o a - o 1 8 - - - $ ;
m - b I c . ~ \ O \ O \ O \ O \ O \ O - \ O \ O \ O L n
E n cv d d d d d d d d d d d d d d d 3 1
5 0 0
3 W b C V O C ) C V e ~ ~ ~ \ O O ~ ~ d O ~ ~ L n C V ~ ~
Z I- - rn CL E 3 e
v,
d c 6 c 6 $ $ p $ ~ $ ~ & d d A
Z -
W E
Q* CTCTO -9 - y \ - a u
0 - n drid-*o:ddod&Sd<d,dd C r \ y r ' , U 0 0 h L n C V y r ' , Q * W M m C V b - - rn d d I- d d
a z cf I- C3 Z Z - W 0 I Z v, a 0 S a 0 -z W s z n - Z E Z Z d w N d d d d A - d d d N ca rn do . 1 E e z ddt-ldddddddddddd s w - Ln v v v v v v v v v v v v 3 ,a > Z Ln3a 0 I - b X
m m - C T ~ u ~ u - Q * o ~ . q q ~ - mwC3 ~ " g ~ g ~ ~ ~ ~ ~ ? ~ ~ ~ ~ ~ n 3 . . 4 s f a " a o g n - E
&?gLl s I-0s ZS,o g W W - W -A J a a a a w E E S E a a a o m v , v , 0
L?Y\qdCV q'%Ln C V L n b d d
I I I I q ~ $ & L n ~ \ O C V ~ C V o O r r \ Q * ~ C T L n c r \ U
ddd~~~~~~$~$d~

C T C O d C V 9 d-01 00- b m d d ~ N C V L n h C V d d m L n d m ~ ~ d 9 9 L n 8 d u L n h N N d C V d d d d d d u N C V C V m N m C V N m N m 4 d d d d d d d d d d d d d d d d d d d d d d d d
I v v v v v v v v v
&.gtz + U S aoC3 a d z W W - J d d C l C L a s z s a a a tntntn

R A D I O N U C L I D E C O N C E N T R A T I O N S I N C O L U M B I A K l V E K S E D I M E N T
SAMPLE DATE: SEPTEMBER 9, 1976 SAMPLE LOCATION: HAT ROCK (M-E) SAMPLING METHOD: PlSTON CORING
dlmh m
CORE DEPTH (cm) - 4 0 ~
0-10.2 38.7 10.2-20.3 20.3-30.5 30.5-40.6 40.6-50.8 50.8-61.0 61.0-71.1 40.1 71.1-81.3 81.3-91.4 91.4-101.6
101.6-111.8 111.8-121.9 121.9-132.1 39.8 132.1-142.2 142.2 -152.4 152.4-162.6 162.6-172.7 172.7-132.9 182.9-193.0 41.9 193.0-203.2 203.2-213.4 213.4-223.5 223.5 -233.7 233.7 -243.8 243.8-254.0 39.7 254.0-264.2 264.2-274.3 274.0-234.5 284.5-294.6 39.4

R A D I O N U C L I D E C O N C E N T R A T I O N S I N C O L U M B I A K I V E R S E D I M E N T
SAMPLE DATE: AUGUST 13, 1976 SAMPLE LOCATION: 1-112 MILES UPSTREAM FROM MCNARY DAM, OREGON S I DE (M-F) SAMPLING METHOD: GRAVITY CORING
CORE DEPTH (cm) - 40 K
0-5.1 37.2 5.1-7.6 7.6-10.2
10.2-12.7 12.7-15.2 15.2-17.9 17.8-20.3 37.1 20.3 -22.9 22.9 -25.4 25.4-27.9 27.9-30.5 30.5 -33.0 33.0-35.6 37.0 35.6-38.1 38.1-40.6 4Q6-43.2 43.2 -45.7 45.7-48.3 48.3 -50.8 38.2 50.8-53.5 53.5 -55.9 55.9-58.4 58.4 -60.0 37.7
dlm lg rn
137c 5 152-154Eu 228 226R, Th --

In 9 s s S 8 O d d d d d
l o '
L 2,
u 9 mcv In In In s z ~ ~ E s Q E a 3 s % ~ 3 ( V 9 3 s % ~ r - 9 9 9 ddddddddddo*o*o'driddddddddd v v v v v v v v v v v v v v v v v v v v v v v v
~ ~ % ~ s ~ ~ c z ~ ~ s ~ ~ s % % ~ ~ ~ ~ ~ a e M ( V N ( V d N ( V O d d N N N ( V I n M b N M d N d d d d d d d d d d d d d d d d d d d d d d d d d d d
v v v v v
&t; I -oE n J z W W - JJJ a a a E E S a a a


K A D I O N U C L I D E C O N C E N T R A T I O N S I N C O L U M B I A R I V E R S E D I M E N T
SAMPLE DATE: SEPTEMBER 9, 1976 SAMPLE LOCAT ION: McNARY, BOUY #3 (M-G SAMPLING METHOD: P I STON COK ING
d l m lq rn
COKE DEPTH (cm)
0-15.2 15.2-25.4 25.4 -35.6 35.6 -45.7 45.7 -55.9
m I 4
55.9 -66.0 P 66.0-76.2
76.2 -86.4 86.4-96.5 96.5-106.7
106.7-116.8 116.8-127.0 127.0-137.2 137.2-147.3 147.3 -157.4 157.4-167.6 167.6-177.8 177.8-188.0 188.0-198.1 198.1-208.3 208.3 -218.4

O ( r \ V \ d O I V \ G N Y \ Y \ O O ~ D N C O ~ C ( J N N ~ ~ ~ ~ O ~ ~ ~ % F NCr\OdO(u\ 0
N N N m C u d m b m a m m m m ~ m d d d d d d d o * d d d d d d A d A d d d v v v v v v v v v v v v v v v v v v v v

R A D I O N U C L I D E C O N C E N T R A T I O N S I N C O L U M B I A R I V E R S E D I M E N T
SAMPLE DATE: AUGUST 10, 1976 SAMPLE LOCATION: THE DALLES, DOWNSTREAM FROM RABBIT ISLAND IN -35' OF WATER (D-A) SAMPLING METHOD: GRAVITY COKING
COKE DEPTH (cm)
dlm lg rn
137cs 152-154Eu 228Th 226Ra 23Spu 239-240pu --- --- - - 241~rn
1.31 1.66 a910 5.50 1.40 1.59 2.28 6.14 3.48 10.1 3.23 7.99 2.60 4.57 0.823 5.18 4.16 7.46 5.10 11.6 9.15 22.2 8.29 19.9 6.25 11.8 0.891 5.54

a: Iff
W W - -J --I a a a z s s 646 V)vlvl

K A D I O N U C L I D E C O N C E N T R A T I O N S I N C O L U M B l A R I V E R S E D I M E N T
SAMPLE DATE: AUGUST 10, 1976 SAMPLE LOCATION: THE DALLES DAM, WASHINGTON SIDE BOAT BAS I N I N -25' OF WATER ( D C ) SAMPLING METHOD: GRAVITY CORING
dlmlgm
CORE DEPTH (cm)

R A D I O N U C L I D E CONCENTRATIONS I N C O L U M B I A H I VER S E D I M E N T
SAMPLE DATE: AUGUST 11, 1976 SAMPLE LOCATION: STEVENSON, WASHINGTON, OFF CEMETERY IN--20'OFWATER (B-A1 SAMPLING METHOD: GRAVITY CORING
COKE DEPTH (cm)
0-2.5 2.5-5.1 5.1-7.6 7.6-10.2
10.2-12.7 12.7-15.2 15.2 -17.8 17.5 -20.3 20.3-22.9 22.9-25.4 25.4-27.9 27.9-30.5 30.5 -34.3 34.3 -39.4

DISTRIBUTION
No. o f Copies
I
No. o f Copies
ClFFSITE R. L. Kathren ', , ? Po r t 1 and General E l e c t r i c
A. A. Churm 121 S.W. Salmon S t r e e t ERDA Chicago Pa ten t Group Po r t l and , OR 97204 9800 South Cass Avenue
v Argonne, I L 60439 -- ONSITE
. L J. L . L iverman '1 0 ERDA R i ch land Operat ions O f f i x , ERDA D i v i s i o n o f Biomedical and Environmental A f f a i r s
Envi ronmental Research Washington, DC 20545 0. J. E l g e r t
R . L. Ferguson 27 ERDA -- Techn ica l I n f o r m a t i o n Center L . F. Perk ins
H. E. Ransom M. 0. F r e t w e l l U. S. G. S. 1201 P a c i f i c Avenue S u i t e 600 Tacoma, WA 98402
S . I . Reed Washington S t a t e Department o f
Soc ia l and H e a l t h Serv ices P.O. Box 1788, MS 56-1 Olympia, WA 98504
1 G. Toornbs Oregon S t a t e Heal t h D i v i s i on P.O. Box 231 P o r t l a n d , OR 97207
F. R . S tande r f e r M. W. T ie rnan ( 6 )
Rockwell I n t e r n a t i o n a l --
W . F. Heine R . V . Lyon G. C. Owens J. V . Panesko Rockwell F i l e s
Hanford Environmental Heal t h Foundat ion
R . G. Andersen
2 Un i t ed Nuc lear I n d u s t r i e s , I n c . R. A . Chitwood Washington P u b l i c Power Supply T . E. Dabrowski
S.ys tern UNI F i l e s 3000 G 2 3 r g ~ l a s h i n g t o n Way R ich land , WA 99352 2 Westinqhouse Hanford Company
R. K. Woodruff G. D. Carpenter Washington P u b l i c Power Supply R. B. H a l l
Sys tern 3000 George Washington Way Rich land, WA 99352

NO. of Copies
82 Battelle-Northwest
P. E . Bramson J. P. Corley J . R . Eliason J. J. Fix (30) R . F. Foster J . J . Fuquay H. V . Larson D. A. Myers J . M. Nielsen R . W . Perkins L . A . Rancitell i W . H . Rickard D. E . Robertson (30) J . K. Soldat W. L . Templeton C . M. Unruh B. E. Vaughan D . G . Watson Technical Information ( 5 ) Technical Pub1 ications