A Biological Management Study of Bukit Larut and its Surroundings, Perak, Malaysia

lable at ScienceDirect
Journal of Environmental Radioactivity 100 (2009) 368–374
Contents lists avai
Journal of Environmental Radioactivity
journal homepage: www.elsevier .com/locate/ jenvrad
Radiological monitoring: terrestrial natural radionuclidesin Kinta District, Perak, Malaysia
Siak Kuan Lee a,*, Husin Wagiran a, Ahmad Termizi Ramli a, Nursama Heru Apriantoro a, A. Khalik Wood b
a Department of Physics, Faculty of Science, University Teknologi Malaysia, 81310 Skudai, Johor Bahru, Malaysiab Malaysia Nuclear Agency, Bangi, 43000 Kajang, Selangor, Malaysia
a r t i c l e i n f o
Article history:Received 10 August 2008Received in revised form5 January 2009Accepted 11 January 2009Available online 19 March 2009
Keywords:Terrestrial238U232Th and 40KRadioactivitySoil typeIsodose
* Corresponding author. Tel.: þ607 5534276; fax: þE-mail addresses: [email protected], sklee@ut
0265-931X/$ – see front matter � 2009 Elsevier Ltd.doi:10.1016/j.jenvrad.2009.01.001
a b s t r a c t
Natural background gamma radiation and radioactivity concentrations were investigated from 2003 to2005 in Kinta District, Perak, Malaysia. Sample locations were distant from any ‘amang’ processingplants. The external gamma dose rates ranged from 39 to 1039 nGy h�1. The mean external gamma doserate was 222� 191 nGy h�1. Small areas of relatively enhanced activity were located having externalgamma dose rates of up to 1039� 104 nGy h�1. The activity concentrations of 238U, 232Th and 40K wereanalyzed by using a high-resolution co-axial HPGe detector system. The activity concentration rangeswere 12–426 Bq kg�1 for 238U, 19–1377 Bq kg�1 for 232Th and <19–2204 Bq kg�1 for 40 K. Based on theradioactivity levels determined, the gamma-absorbed dose rates in air at 1 m above the ground werecalculated. The calculated dose rates and measured dose rates had a good correlation coefficient, R of0.94. To evaluate the radiological hazard of the natural radioactivity, the radium equivalent activity, thegamma-absorbed dose rate and the mean population weighted dose rate were calculated. An isodosemap for the Kinta District was also produced.
� 2009 Elsevier Ltd. All rights reserved.
1. Introduction
The Kinta District was the largest producer of tin in the world.Over a century of tin mining has produced a large amount of tintailing or ‘‘amang’’, a by-product of tin mining. ‘‘Amang’’ isa Malaysian term. It consists of group of heavy minerals whichoccur together with the tin ore recovered from the alluvium. Theconstituents of amang are monazite, ilmenite, zircon, xenotime,rutile and some other minerals. The amang industry involves theprocessing of these minerals. Of the amang contents monazite andxenotime have substantial amounts of thorium and uranium whichare radioactive and provide high external dose rates in the workplace, storage room and to the environment (Hu et al., 1981, 1984;Hu and Koo, 1983; Hu and Kandaiya, 1985; Lee et al., 2004). Theexposure rate readings at the amang plants ranged from260 nGy h�1 to greater than 50 mGy h�1 depending on the quantityand grade of the amang by-products stored (Lee, 2007). Accordingto Omar et al. (2006), the level of 1560 nGy h�1 was measuredwhile passing by one of the amang plants due to mineral stockpilesaccumulated near the roadside. The annual external radiation doseat the amang processing plants was 4.1 mSv (Omar et al., 2007).
607 5566162.m.my (S.K. Lee).
All rights reserved.
External gamma dose contributions are predominantly from thepresence of 40K and of 232Th and 238U and their progeny in variousrocks and soils; estimates of such activities at a height of about 1 mover granite areas are typically in the order of 1.5 mGy y�1 and overlimestone of the order of 0.2 mGy y�1 (Henry, 1969). Obviously, theactual level of radiation caused by the radionuclide content of rocksand soil varies widely from place to place, and the actual back-ground contributions to the external gamma dose rate at a givenlocation can be determined only by measurement. Thus the doserate depends on the geological location (Martin and Harbison,1972). In order to predict the environment quality, monitorcontinuously the air gamma radiation level for 24 h and detect theabnormality, we need to know the natural background of gammaradiation (Wei et al., 1996).
Granite is the major igneous rock that is abundantly available inPeninsular Malaysia. It is distributed in the Western Belt andEastern Belt, running roughly north to south along the length of thePeninsula. The Western Belt consists of the Main Range, the Kle-dang Range and other granite further west. The ages of the granitesrange from Permian to Cretaceous, with the majority of Triassic age(Bignell and Snelling, 1977).
The Kinta District is an extensive area flanked by granites to theeast and west. It is underlined by a sequence of sedimentary rocksranging in age from Silurian to Permian, which have been intrudedby granitoids towards the end of probable Jurassic to Triassic age.

Table 1Soil types and parent material (Paramanthan, 1978).
Soiltype No.
Soil type (FAO/UNESCO) Parent material Numberof readings
10 Dystric Histosols Organic deposit 518 Xanthic Ferrasols–Dystric
GleysolsSubrecent and olderalluvium
233
31 Ferric Acrisols–FerricAcrisols–Orthic Ferrasol
Shale, sandstones andschists
47
48 Haplic Acrisols Granites 24949 Steep land Steep land 5550 Urban land Disturbed land 418
FAO¼ Food and Agriculture Organization.
S.K. Lee et al. / Journal of Environmental Radioactivity 100 (2009) 368–374 369
Most of the sedimentary rocks in the valley are Devonian in age.Rocks of Silurian age are present in the northern part, whereasrocks of Carboniferous underline areas in the southwestern part ofthe District. Alluvium covers almost the entire valley part of theDistrict (Rajah, 1979).
The Kinta District is mainly overlaid by six different types ofsoil namely Dystric Histosols (soil type 10), Xanthic Ferrasols–
Fig. 1. Locations of
Dystric Gleysols (soil type 18), Ferric Acrisols–Ferric Acrisols–Orthic Ferrasol (soil type 31), Haplic Acrisols (soil type 48),Steep land (soil type 49) and Urban land (soil type 50) wereclassified by FAO/UNESCO (Paramanthan, 1978) as shown inTable 1.
Measurement of natural background radiation and radioac-tivity in soil has been carried out in many countries to establishbase line data of natural radiation levels (Ibrahiem et al., 1993;Quindos et al., 1994; Mireles et al., 2003). The base line data canbe used to assess any changes in the radioactivity backgroundlevel due to various activities involving radioactive materials orany fallout in the near future. The measurement will also help inthe development of standards and guidelines for use andmanagement of these materials. In order to manage the radiationhazard resulting from activities involving amang it is veryimportant to conduct radiological studies to determine therelevant base line data.
In this study, the natural background radiation was measureddistant from the amang processing plants for establishing baseline data.
soil samples.
300
S.K. Lee et al. / Journal of Environmental Radioactivity 100 (2009) 368–374370
2. Methods and materials
2.1. Survey instrument
Gamma dose rate measurements were performed using a portable survey metermanufactured by Ludlum (Model 19 Micro R Meter, USA). The equipment usesa 2.54 cm� 2.54 cm NaI crystal doped with thallium [NaI(Tl)] to offer an optimumperformance in counting low-level gamma radiation. This instrument had a repor-ted accuracy of �10%. (Ludlum Measurements, Inc., 1993). The detection of gammarays from cosmic sources is negligible due to the low response of the instrument tohigh energy gamma radiation. This was observed when external gamma radiationmeasurements were made on board a ferry distant from land. It detected a readingof only about half a division on the smallest scale of 1 mR h�1 (w8.7 nGy h�1). TheNaI(Tl) detector is the most widely used device for all kinds of gamma ray surveysdue to its efficiency (IAEA, 1979). This instrument was calibrated for the higher countrates by the Malaysian Nuclear Agency (MNA) an IAEA recognized secondary stan-dard calibration laboratory.
2.2. Dose measurement, sample collection and preparation
Dose measurements were made at approximately every 1 km (more frequentlyif significant change in radiation level was detected), wherever access was possibleby road throughout the District. The position of the locations was determined byusing global positioning system, GPS Garmin Model 12X (Garmin Corporation, 1988)which has a practical accuracy of �50 m. Dose measurements were conducted andsoil samples were collected according to established procedures (Goddard, 2002;Mireles, 2003).
Soil samples were collected from areas of different soil types at 128 locations asshown in Fig. 1. About 2–3 kg of soils samples were collected from the top 10 cm ofthe soil. The samples were dried at 110 �C for 2–3 days in an oven. Dried samples werepulverized and sifted through a 325 micron sieve. Each of the samples were thenweighed and sealed in Marinelli beakers. They were stored for 4 weeks to achieveequilibrium for 238U and 232Th with their respective progeny (Myrick et al., 1983).
2.3. Gamma-ray spectrometry
A hyperpure germanium (HPGe) detector manufactured by Ortec with anefficiency of 20% relative to a 7.62 cm� 7.62 cm NaI(Tl) detector and a resolution of1.8 keV at 1332 keV was used for the measurement of the gamma energy spectrum.Advanced Analyzer emulation software (MAESTRO-32) enables data acquisition,storage and display of the acquired spectra. The detector was surrounded by leadshielding to reduce background radiation (Tsoulfanidis, 1995). Under conditions ofsecular equilibrium, the 232Th concentration was determined from the averageconcentration of 208Tl using the 583 keV peak and 228Ac by using the 911 keV peak.238U was determined from the average concentrations of the 214Pb by using the352 keV peak and 214Bi by using the 609 keV peak (Hamby and Tynybekov, 2002).The 1460 keV peak was used to determine the 40K concentration. Each sample wasput into a shielded HPGe detector and measured for 3 h. The background gamma-rayspectrum of the detection system was determined with an empty Marinelli beakerunder identical conditions, and was subtracted from the spectra of each sample. Theminimum detection limits for a counting time of 10,800 s were estimated to be4 Bq kg�1 for 238U, 9 Bq kg�1 for 232Th and 19 Bq kg�1 for 40K.
y = 1.3396x + 24.594R2 = 0.8814, n = 128
0
200
400
600
800
1000
1200
1400
1600
0 200 400 600 800 1000
Calculated dose rate (nGy/h)
Mea
sure
d do
se r
ate
(nG
y/h)
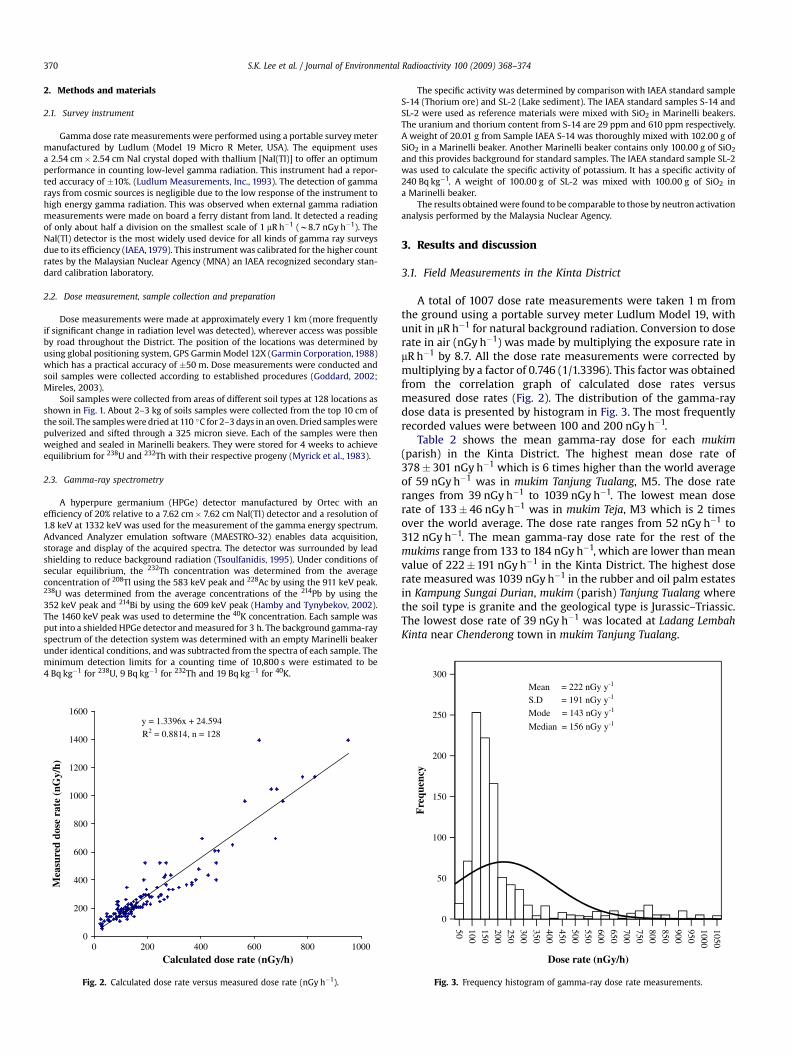
Fig. 2. Calculated dose rate versus measured dose rate (nGy h�1).
The specific activity was determined by comparison with IAEA standard sampleS-14 (Thorium ore) and SL-2 (Lake sediment). The IAEA standard samples S-14 andSL-2 were used as reference materials were mixed with SiO2 in Marinelli beakers.The uranium and thorium content from S-14 are 29 ppm and 610 ppm respectively.A weight of 20.01 g from Sample IAEA S-14 was thoroughly mixed with 102.00 g ofSiO2 in a Marinelli beaker. Another Marinelli beaker contains only 100.00 g of SiO2
and this provides background for standard samples. The IAEA standard sample SL-2was used to calculate the specific activity of potassium. It has a specific activity of240 Bq kg�1. A weight of 100.00 g of SL-2 was mixed with 100.00 g of SiO2 ina Marinelli beaker.
The results obtained were found to be comparable to those by neutron activationanalysis performed by the Malaysia Nuclear Agency.
3. Results and discussion
3.1. Field Measurements in the Kinta District
A total of 1007 dose rate measurements were taken 1 m fromthe ground using a portable survey meter Ludlum Model 19, withunit in mR h�1 for natural background radiation. Conversion to doserate in air (nGy h�1) was made by multiplying the exposure rate inmR h�1 by 8.7. All the dose rate measurements were corrected bymultiplying by a factor of 0.746 (1/1.3396). This factor was obtainedfrom the correlation graph of calculated dose rates versusmeasured dose rates (Fig. 2). The distribution of the gamma-raydose data is presented by histogram in Fig. 3. The most frequentlyrecorded values were between 100 and 200 nGy h�1.
Table 2 shows the mean gamma-ray dose for each mukim(parish) in the Kinta District. The highest mean dose rate of378� 301 nGy h�1 which is 6 times higher than the world averageof 59 nGy h�1 was in mukim Tanjung Tualang, M5. The dose rateranges from 39 nGy h�1 to 1039 nGy h�1. The lowest mean doserate of 133� 46 nGy h�1 was in mukim Teja, M3 which is 2 timesover the world average. The dose rate ranges from 52 nGy h�1 to312 nGy h�1. The mean gamma-ray dose rate for the rest of themukims range from 133 to 184 nGy h�1, which are lower than meanvalue of 222�191 nGy h�1 in the Kinta District. The highest doserate measured was 1039 nGy h�1 in the rubber and oil palm estatesin Kampung Sungai Durian, mukim (parish) Tanjung Tualang wherethe soil type is granite and the geological type is Jurassic–Triassic.The lowest dose rate of 39 nGy h�1 was located at Ladang LembahKinta near Chenderong town in mukim Tanjung Tualang.
50 10015020025030035040045050055060065070075080085090095010001050
Dose rate (nGy/h)
0
50
100
150
200
250
Fre
quen
cy
Mean = 222 nGy y-1
S.D = 191 nGy y-1
Mode = 143 nGy y-1
Median = 156 nGy y-1
Fig. 3. Frequency histogram of gamma-ray dose rate measurements.
1200
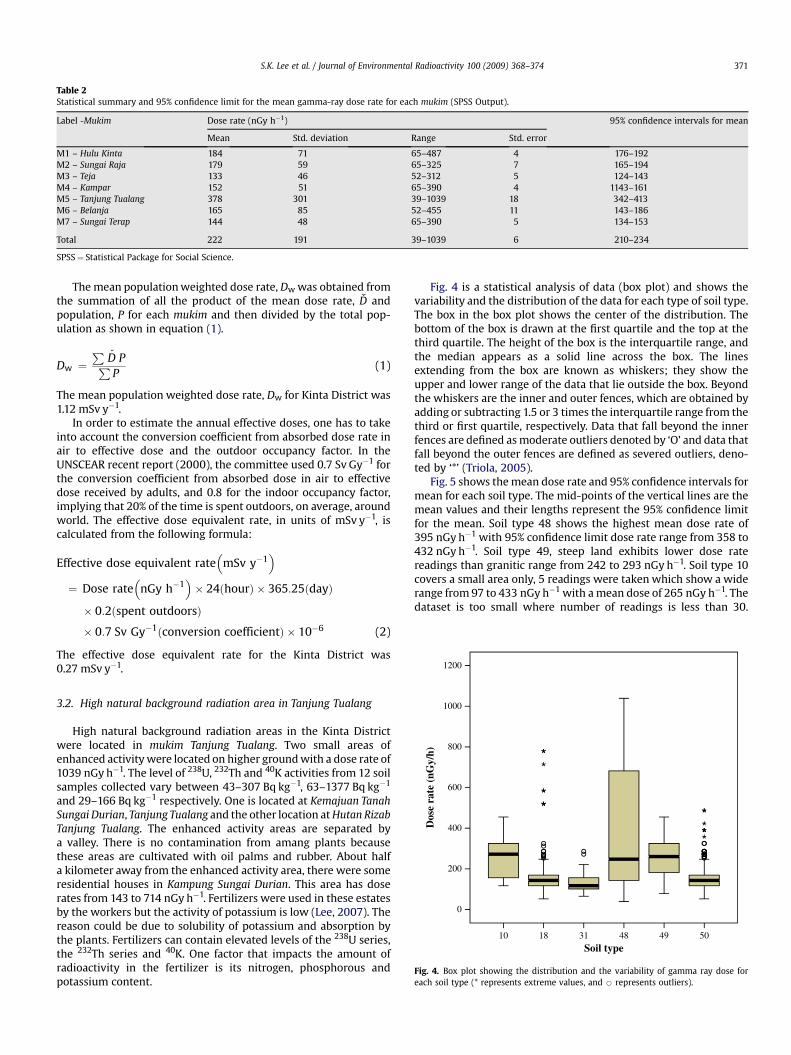
Table 2Statistical summary and 95% confidence limit for the mean gamma-ray dose rate for each mukim (SPSS Output).
Label -Mukim Dose rate (nGy h�1) 95% confidence intervals for mean
Mean Std. deviation Range Std. error
M1 – Hulu Kinta 184 71 65–487 4 176–192M2 – Sungai Raja 179 59 65–325 7 165–194M3 – Teja 133 46 52–312 5 124–143M4 – Kampar 152 51 65–390 4 1143–161M5 – Tanjung Tualang 378 301 39–1039 18 342–413M6 – Belanja 165 85 52–455 11 143–186M7 – Sungai Terap 144 48 65–390 5 134–153
Total 222 191 39–1039 6 210–234
SPSS¼ Statistical Package for Social Science.
S.K. Lee et al. / Journal of Environmental Radioactivity 100 (2009) 368–374 371
The mean population weighted dose rate, Dw was obtained fromthe summation of all the product of the mean dose rate, D andpopulation, P for each mukim and then divided by the total pop-ulation as shown in equation (1).
Dw ¼P
Dˇ PPP
(1)
The mean population weighted dose rate, Dw for Kinta District was1.12 mSv y�1.
In order to estimate the annual effective doses, one has to takeinto account the conversion coefficient from absorbed dose rate inair to effective dose and the outdoor occupancy factor. In theUNSCEAR recent report (2000), the committee used 0.7 Sv Gy�1 forthe conversion coefficient from absorbed dose in air to effectivedose received by adults, and 0.8 for the indoor occupancy factor,implying that 20% of the time is spent outdoors, on average, aroundworld. The effective dose equivalent rate, in units of mSv y�1, iscalculated from the following formula:
Effective dose equivalent rate�
mSv y�1�
¼ Dose rate�
nGy h�1�� 24ðhourÞ � 365:25ðdayÞ
� 0:2ðspent outdoorsÞ
� 0:7 Sv Gy�1ðconversion coefficientÞ � 10�6 (2)
The effective dose equivalent rate for the Kinta District was0.27 mSv y�1.
10 18 31 48 49 50
Soil type
0
200
400
600
800
1000
Dos
e ra
te (
nGy/
h)
Fig. 4. Box plot showing the distribution and the variability of gamma ray dose foreach soil type (* represents extreme values, and B represents outliers).
3.2. High natural background radiation area in Tanjung Tualang
High natural background radiation areas in the Kinta Districtwere located in mukim Tanjung Tualang. Two small areas ofenhanced activity were located on higher ground with a dose rate of1039 nGy h�1. The level of 238U, 232Th and 40K activities from 12 soilsamples collected vary between 43–307 Bq kg�1, 63–1377 Bq kg�1
and 29–166 Bq kg�1 respectively. One is located at Kemajuan TanahSungai Durian, Tanjung Tualang and the other location at Hutan RizabTanjung Tualang. The enhanced activity areas are separated bya valley. There is no contamination from amang plants becausethese areas are cultivated with oil palms and rubber. About halfa kilometer away from the enhanced activity area, there were someresidential houses in Kampung Sungai Durian. This area has doserates from 143 to 714 nGy h�1. Fertilizers were used in these estatesby the workers but the activity of potassium is low (Lee, 2007). Thereason could be due to solubility of potassium and absorption bythe plants. Fertilizers can contain elevated levels of the 238U series,the 232Th series and 40K. One factor that impacts the amount ofradioactivity in the fertilizer is its nitrogen, phosphorous andpotassium content.
Fig. 4 is a statistical analysis of data (box plot) and shows thevariability and the distribution of the data for each type of soil type.The box in the box plot shows the center of the distribution. Thebottom of the box is drawn at the first quartile and the top at thethird quartile. The height of the box is the interquartile range, andthe median appears as a solid line across the box. The linesextending from the box are known as whiskers; they show theupper and lower range of the data that lie outside the box. Beyondthe whiskers are the inner and outer fences, which are obtained byadding or subtracting 1.5 or 3 times the interquartile range from thethird or first quartile, respectively. Data that fall beyond the innerfences are defined as moderate outliers denoted by ‘O’ and data thatfall beyond the outer fences are defined as severed outliers, deno-ted by ‘*’ (Triola, 2005).
Fig. 5 shows the mean dose rate and 95% confidence intervals formean for each soil type. The mid-points of the vertical lines are themean values and their lengths represent the 95% confidence limitfor the mean. Soil type 48 shows the highest mean dose rate of395 nGy h�1 with 95% confidence limit dose rate range from 358 to432 nGy h�1. Soil type 49, steep land exhibits lower dose ratereadings than granitic range from 242 to 293 nGy h�1. Soil type 10covers a small area only, 5 readings were taken which show a widerange from 97 to 433 nGy h�1 with a mean dose of 265 nGy h�1. Thedataset is too small where number of readings is less than 30.

10 18 31 48 49 50
Soil type
100
200
300
400
95
CI
Dos
e ra
te (
nGy/
h)
Fig. 5. Mean dose rate and 95% confidence interval for the mean for the various soiltype. (Statistical Package for Social Science Output).
S.K. Lee et al. / Journal of Environmental Radioactivity 100 (2009) 368–374372
Except for soil type 10, each soil type shows a different range ofreadings. The 95% confidence limit for the mean dose rate range forsoil type 18 (151–177 nGy h�1) and soil type 50 (150–161 nGy h�1).These two soil types can be grouped together (Wahab, 1988). Themean dose rate for soil types 18 and 50 is 164 and 155 nGy h�1
respectively. Soil type 31 shows the lowest dose rate range from 119to 149 nGy h�1 mainly made up of shale, sandstones and schists.From Fig. 6, the 95% confidence intervals for mean gamma-ray doseclearly shows that the dose rate for soil type 48> soil type 49> soiltypes 18 and 50> soil type 31. It shows that the mean dose rates areassociated with the soil types.
Potasium Thorium Uranium
Radionuclides
0
500
1000
1500
2000
2500
Act
ivit
y co
ncen
trat
ion
(Bq/
kg)
Fig. 6. Shows the variability of the activity of the radionuclides.
3.3. Uranium, thorium and potassium concentration
Table 3 summarizes the natural radioactivity levels and doserates obtained in some of world regions (UNSCEAR, 1998, 2000)and from this study. The mean activity for 238U and 232Thmeasured in this study is higher than the activity values for otherlisted regions around the world but for 40K lower activityconcentrations were measured. Fig. 6 shows the variability of theactivity of the radionuclides. The 238U concentration ranges from12 to 426 Bq kg�1, with a mean value of 112�18 Bq kg�1, which isthree times higher than the world average. 232Th concentrationranges from 19 to 1377 Bq kg�1, with a mean value of246� 21 Bq kg�1 which is about seven times world average and40K concentration ranges from less than 19–2204 Bq kg�1 and themean value is 277�127 Bq kg�1 which is less than the worldaverage. World average concentrations are 35 Bq kg�1 and45 Bq kg�1 for 226Ra and 232Th respectively; and typical rangesare 16–116 Bq kg�1 for 226Ra and 7–50 Bq kg�1 for 232Th. Theworld average concentration is 420 Bq kg�1 for 40K, and thetypical range is 100–700 Bq kg�1 for 40K (UNSCEAR, 2000). Itshould be noted that the 137Cs peak at 662 keV was not found inany of the 128 soil samples analyzed.
Table 4 shows the gamma dose rates in air in the Kinta Districtcompared with values reported from other Districts in Malaysia andthe World. Dose rates from the 3 Districts and a Johor State we canderive a new average of 153 nGy h�1 for Malaysia which is higherthan reported 92 nGy h�1 (UNSCEAR, 2000).
Table 5 shows the natural radionuclides in soil and the corre-sponding absorbed dose rate in air 1 m above ground and thepercentage contributions from each individual nuclide. 232Thcontributes about 70% of the dose rate which is considered highcompared with the world average of 45% whereas 238U contributesabout 25% which is the same as the world average and only 5.7%from 40K in the Kinta District.
3.4. Radium equivalent activity (Raeq)
It is important to assess the gamma radiation hazards to humanassociated with the used of sand, limestone, shale and granite forbuilding materials. To represent the activities due to 226Ra, 232Thand 40K by a single quantity which takes into account the radiationhazard with them, a common index called the radium equivalentactivity (Raeq) in Bq kg�1 has been introduced, defined as: (Beretkaand Mathew, 1985; Malanca et al., 1993; Equal et al., 2000)
Raeq ¼ ARa þ 1:43ATh þ 0:077AK (3)
where ARa, ATh and AK are the activity concentrations of 226Ra z 238U,232Th and 40K in Bq kg�1, respectively. While defining Raeq, it hasbeen assumed that 1 Bq kg�1 of 226Ra, 0.7 Bq kg�1 of 232Th and13 Bq kg�1of 40K produce the same gamma-ray dose (Beretka andMathew, 1985; Malanca et al., 1993; Iqbal et al., 2000).
The world average in soils is 89 Bq kg�1 (UNSCEAR, 1988). Asreference, the permissible dose limit for public which is recom-mended by ICRP (1991) is 1.5 mSv y�1 or equivalent to 370 Bq kg�1.The radium equivalent activity for soil ranges from 52 to2227 Bq kg�1. The average value of Raeq for the soil is 478 Bq kg�1
(1.94 mSv y�1) is over five times the world average. The calculatedvalues of Raeq range from 0.14 to 6.01 mSv y�1. This value issignificantly higher than the typical world’s average for Raeq. It maypose radiological risk should the soils are used for building mate-rials. For comparison, sediments collected in the recycling pondsfrom amang processing plants ranged from 244.2 to 933.5 Bq kg�1
(Ismail et al., 2007). This shows that the amang processing hadtechnologically enhanced the activity concentrations in sediments
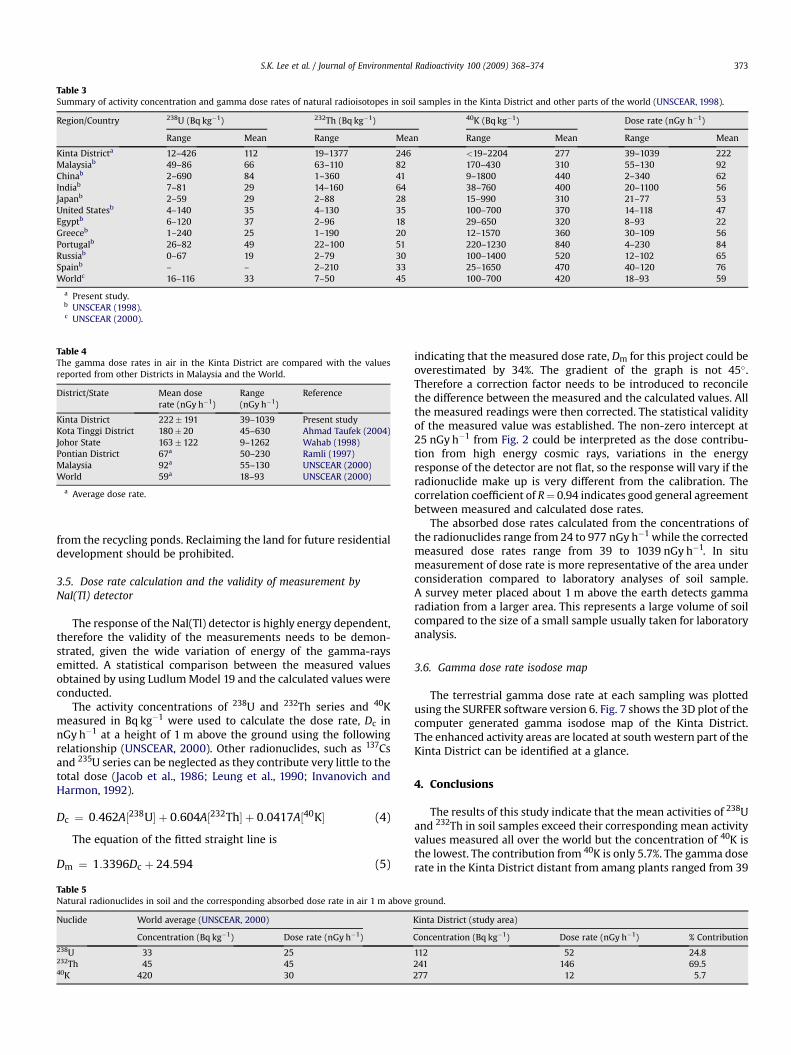
Table 3Summary of activity concentration and gamma dose rates of natural radioisotopes in soil samples in the Kinta District and other parts of the world (UNSCEAR, 1998).
Region/Country 238U (Bq kg�1) 232Th (Bq kg�1) 40K (Bq kg�1) Dose rate (nGy h�1)
Range Mean Range Mean Range Mean Range Mean
Kinta Districta 12–426 112 19–1377 246 <19–2204 277 39–1039 222Malaysiab 49–86 66 63–110 82 170–430 310 55–130 92Chinab 2–690 84 1–360 41 9–1800 440 2–340 62Indiab 7–81 29 14–160 64 38–760 400 20–1100 56Japanb 2–59 29 2–88 28 15–990 310 21–77 53United Statesb 4–140 35 4–130 35 100–700 370 14–118 47Egyptb 6–120 37 2–96 18 29–650 320 8–93 22Greeceb 1–240 25 1–190 20 12–1570 360 30–109 56Portugalb 26–82 49 22–100 51 220–1230 840 4–230 84Russiab 0–67 19 2–79 30 100–1400 520 12–102 65Spainb – – 2–210 33 25–1650 470 40–120 76Worldc 16–116 33 7–50 45 100–700 420 18–93 59
a Present study.b UNSCEAR (1998).c UNSCEAR (2000).
Table 4The gamma dose rates in air in the Kinta District are compared with the valuesreported from other Districts in Malaysia and the World.
District/State Mean doserate (nGy h�1)
Range(nGy h�1)
Reference
Kinta District 222� 191 39–1039 Present studyKota Tinggi District 180� 20 45–630 Ahmad Taufek (2004)Johor State 163� 122 9–1262 Wahab (1998)Pontian District 67a 50–230 Ramli (1997)Malaysia 92a 55–130 UNSCEAR (2000)World 59a 18–93 UNSCEAR (2000)
a Average dose rate.
S.K. Lee et al. / Journal of Environmental Radioactivity 100 (2009) 368–374 373
from the recycling ponds. Reclaiming the land for future residentialdevelopment should be prohibited.
3.5. Dose rate calculation and the validity of measurement byNaI(Tl) detector
The response of the NaI(Tl) detector is highly energy dependent,therefore the validity of the measurements needs to be demon-strated, given the wide variation of energy of the gamma-raysemitted. A statistical comparison between the measured valuesobtained by using Ludlum Model 19 and the calculated values wereconducted.
The activity concentrations of 238U and 232Th series and 40Kmeasured in Bq kg�1 were used to calculate the dose rate, Dc innGy h�1 at a height of 1 m above the ground using the followingrelationship (UNSCEAR, 2000). Other radionuclides, such as 137Csand 235U series can be neglected as they contribute very little to thetotal dose (Jacob et al., 1986; Leung et al., 1990; Invanovich andHarmon, 1992).
Dc ¼ 0:462A½238U� þ 0:604A½232Th� þ 0:0417A½40K� (4)
The equation of the fitted straight line is
Dm ¼ 1:3396Dc þ 24:594 (5)
Table 5Natural radionuclides in soil and the corresponding absorbed dose rate in air 1 m above
Nuclide World average (UNSCEAR, 2000)
Concentration (Bq kg�1) Dose rate (nGy h�1)238U 33 25232Th 45 4540K 420 30
indicating that the measured dose rate, Dm for this project could beoverestimated by 34%. The gradient of the graph is not 45�.Therefore a correction factor needs to be introduced to reconcilethe difference between the measured and the calculated values. Allthe measured readings were then corrected. The statistical validityof the measured value was established. The non-zero intercept at25 nGy h�1 from Fig. 2 could be interpreted as the dose contribu-tion from high energy cosmic rays, variations in the energyresponse of the detector are not flat, so the response will vary if theradionuclide make up is very different from the calibration. Thecorrelation coefficient of R¼ 0.94 indicates good general agreementbetween measured and calculated dose rates.
The absorbed dose rates calculated from the concentrations ofthe radionuclides range from 24 to 977 nGy h�1 while the correctedmeasured dose rates range from 39 to 1039 nGy h�1. In situmeasurement of dose rate is more representative of the area underconsideration compared to laboratory analyses of soil sample.A survey meter placed about 1 m above the earth detects gammaradiation from a larger area. This represents a large volume of soilcompared to the size of a small sample usually taken for laboratoryanalysis.
3.6. Gamma dose rate isodose map
The terrestrial gamma dose rate at each sampling was plottedusing the SURFER software version 6. Fig. 7 shows the 3D plot of thecomputer generated gamma isodose map of the Kinta District.The enhanced activity areas are located at south western part of theKinta District can be identified at a glance.
4. Conclusions
The results of this study indicate that the mean activities of 238Uand 232Th in soil samples exceed their corresponding mean activityvalues measured all over the world but the concentration of 40K isthe lowest. The contribution from 40K is only 5.7%. The gamma doserate in the Kinta District distant from amang plants ranged from 39
ground.
Kinta District (study area)
Concentration (Bq kg�1) Dose rate (nGy h�1) % Contribution
112 52 24.8241 146 69.5277 12 5.7

Fig. 7. The 3D plots of gamma isodose map of the Kinta District.
S.K. Lee et al. / Journal of Environmental Radioactivity 100 (2009) 368–374374
to 1039 nGy h�1. The mean of gamma dose rate is222�191 nGy h�1 (1.36 mSv y�1) which is about twice the Malay-sian average and about 4 times the world average (59 nGy h�1). Theenhanced activity areas were identified at Kampung Sungai Durianwith the highest dose rate of 1039�104 nGy h�1 in the granitearea. The lowest level recorded is 39� 4 nGy h�1 on the sandstonesin Tanjung Tualang District. The present study has pointed out theenhanced activity areas under investigation need further studies inorder to better understand the presence of high dose rate. Anychanges or increased to the dose rates in future we can deduce thatcontamination have taken place. The data can be used as a base linefor preparing a radiological map of Malaysia.
Acknowledgement
This project is funded by the Atomic Energy Licensing Board,Malaysia (Vot. No. 68876). This project also used various facilitiesprovided by Universiti Teknologi Malaysia and Malaysian NuclearAgency.
The author would like thank Prof. Dr. Noorddin Ibrahim andAssoc. Prof. Dr. Wan Muhamad Saridan Wan Hassan for theirconstructive suggestions.
References
Ahmad Taufek bin Abdul Rahman, 2004. Ujian kesahihan jangkaan kadar dos sinargama daratan dan kajian implikasi radiologi persekitaran di daerah Kota Tinggi,Johor, Malaysia. UTM. Tesis Sarjana.
Beretka, J., Mathew, P.J., 1985. Natural radioactivity of Australian building materials,industrial wastes and by-products. Health Phys. 48 (1), 87–95.
Bignell, J.D., Snelling, N.J., 1977. Geochronology of Malaysian granites. In: OverseasGeology and Mineral Resources. Institute of Geological Science, London, pp. 30–45.
Garmin Corporation, 1988. GPS 12XL Personal Navigator, Operator’s manual &Reference.
Goddard, C.C., 2002. Measurement of outdoor terrestrial gamma radiation in theSultanate of Oman. Health Phys. 82, 869–872.
Hamby, D.M., Tynybekov, A.K., 2002. Uranium, thorium and potassium in soils alongthe shore of the Lake Issyk-Kyol in the Kyrghyz Republic. Environ. Monitor.Assess. 73, 01–108.
Henry, H.F., 1969. Fundamentals of Radiation Protection. John Wiley & Sons, USA.Hu, S.J., Kandaiya, S., 1985. Radium and thorium concentrations in amang. Health
Phys. 49, 1003–1007.Hu, S.J., Koo, W.K., 1983. Measurement of airborne radioactivity in amang plants.
Bull. Phys. University Science of Malaysia.Hu, S.J., Chong, C.S., Subas, S., 1981. 238U and 232Th in Cassiterites samples and
amang by-products. Health Phys. 40, 248–250.Hu, S.J., Koo, W.K., Tan, K.L., 1984. Radioactivity associated with amang up grading
plants. Health Phys. 46, 452–455.Ibrahiem, N.M., Abd El Ghani, A.H., Shawky, S.M., Ashraf, E.M., Farouk, M.A., 1993.
Measurement of radioactivity levels in soil in Nile Delta and Middle Egypt.Health Phys. 4, 620–627.
International Atomic Energy Agency, 1979. Gamma ray surveys in uranium explo-ration. Technical reports series No. 186; Vienna, IAEA.
International Commission on Radiological Protection, 1991. 1990 Recommendationof the International Commission on Radiological Protection. Pergamon Press,Oxford. ICRU Publication 60.
Invanovich, M., Harmon, R.S. (Eds.), 1992. Uranium-Series Disequilibrium: Appli-cations to Earth, Marine and Environmental Sciences, second ed. ClarendonPress, Oxford, pp. 290–333.
Iqbal, M., Tufail, M., Mirza, S.M., 2000. Measurement of natural radioactivity inmarble found in Pakistan using a NaI(Tl) gamma-ray spectrometer. J. Environ.Radioact. 51, 255–256.
Ismail, B., Mohsen, N., Abdullah, P., 2007. Radioactivity and radiological risk asso-ciated with effluent sediment containing technologically enhanced naturallyoccurring radioactive materials in amang (tin tailings) processing industry.J. Environ. Radioact. 95, 161–170.
Jacob, P., Paretzke, H.G., Rosenbaum, H., Zankl, M., 1986. Effective dose equivalents forphoton exposures from plane sources on the ground. Radiat. Prot. Dosim.14, 299–310.
Lee, S.K., 2007. Natural background radiation in the Kinta District, Perak, Malaysia.MSc thesis, Universiti Teknologi Malaysia.
Lee, S.K., Wagiran, H., Lim, S.E., Ramli, A.T., Sudin, M.Y., 2004. The concentration ofuranium and thorium in amang and Ilmenite sample collected from industry.National Seminar on Medical Physics. Malaysian Association of Medical Physicsand School of Physics, Universiti Sains Malaysia, Pulau Pinang. Paradise SandyBeach Resort, Tanjung Bunga, Pulau Pinang. 27–28, March.
Leung, K.C., Lau, S.Y., Poon, C.B., 1990. Gamma radiation dose rate from radionu-clides in Hong kong soil. J. Environ. Radioact. 11, 279–290.
Ludlum, 1993. Instruction Manual of Ludlum Model 19 Micro R Meter. LudlumMeasurements, Inc, Sweetwater Texas.
Malanca, A., Passina, V., Dallara, G., 1993. Radionuclide content of building materialsand gamma ray dose rates in dwellings of Rio Grande Do Norte, Brazil. Radiat.Prot. Dosim. 48, 199.
Martin, A., Harbison, S.A., 1972. An Introduction to Radiation Protection. John Wiley& Sons, Inc., New York.
Mireles, F., Davila, J.I., Quirino, L.L., Lugo, J.F., Pinedo, J.L., Rios, C., 2003. Natural soilgamma radioactivity levels and resultant population dose in the cities ofZacatecas and Guadalupe, Zacatecas, Mexico. Health Phys. 84 (3), 368–372.
Myrick, T.E., Berven, B.A., Haywood, F.F., 1983. Determination of concentrations ofselected radionuclides in surface soil in the U.S. Health Phys. 45 (3), 31–642.
Omar, M., Hassan, A., Sulaiman, I., 2006. Radiation exposure during traveling inMalaysia. Radiat. Prot. Dosim. 121 (4), 456–460.
Omar, M., Sulaiman, I., Hassan, A., Wood, A.K., 2007. Radiation dose assessment atamang processing plants in Malaysia. Radiat. Prot. Dosim. Oxford University Press.
Paramanthan, S., 1978. Resister of soils, Peninsular Malaysia. Soils Analyt. Serv. Bull.7 Malaysia: Ministry of Agriculture.
Quindos, L.S., Fernandez, P.L., Soto, J., Rodenas, C., Gomez, J., 1994. Natural radio-activity in Spanish soils. Health Phys. 66 (2), 194–200.
Ramli, A.T., 1997. Environmental terrestrial gamma dose and its relationship withsoil type and underlying geological formations in Pontian District, Malaysia.Appl. Radiat. Isot. 48 (3), 407–412. Elsevier Science Ltd.
Rajah, S.S., 1979. The Kinta Tinfield, Malaysia. Geo. Soc. Malaysia Bull. 11, 111–136.Triola, M.F., 2005. Essentials of Statistics, second ed. Pearson Education, Inc.Tsoulfanidis, N., 1995. Measurement and Detection of Radiation. Taylor & Francis.United Nations Scientific Committee on the Effect of Atomic Radiation, 1998,.
Sources Effect and Risk of Ionizing Radiation, New York 1990.United Nations Scientific Committee on the Effect of Atomic Radiation, 2000.
Sources and Effects of Ionizing Radiation. Report to General Assembly, withScientific Annexes, United Nations, New York.
Wahab, A., 1998. Terrestrial gamma radiation dose and its relationship with soiltype and geology in Johor State, Malaysia. UTM: M.Sc. thesis.
Wei, L., Sugahara, L., Tao, Z., 1996. High Levels of Natural Radiation. InternationalConference on High Levels of Natural Radiation, Beijing, China, 21–25 October1996. Elsevier Science B.V.
Copyright © 2022 FDOKUMEN