"1991 Annual Environ Rept,Radiological."
162
n.-c DUQUESNE LIGHT COMPANY BEAVER VALLEY POWER STATION UNITS 1 AND-2 1991 ANNUAL ENVIRONMENTAL REPOR1 RADIOLOGICAL , l i 1 , PDR - PDR R' > .m_
-
Upload
khangminh22 -
Category
Documents
-
view
0 -
download
0
Transcript of "1991 Annual Environ Rept,Radiological."

n.-c
DUQUESNE LIGHT COMPANYBEAVER VALLEY POWER STATION
UNITS 1 AND-2
1991 ANNUAL ENVIRONMENTAL REPOR1RADIOLOGICAL
,
l
i
1
,
PDR - PDRR'
>.m_

.-. . . -- ._ . -
Duquesre Light Company1991 Anaual Radiological Environmental Report
EXECUTIVE SUMMARY
This report describes the Radiological Environmental Momtoring Program conductedduring 1991 in the vicinity of the Beaver Valley Power Station Units 1 and 2. TheRadiological Environmental Program consists of off-site monitoring of water, air,river sediments, soils, food pathway samples, and radiation levels in the vicimty ofthe site. This report discusses the results of this monitoring during 1991.
Duquesne Light Company operates the Beaver Valley Power Station Umts 1 and 2pressurized water reactors as part of the Central Area Power Coordination Group.
The Beaver Valley Power Station Unit 1 operated throughout 1991 except during theEighth Refueling Outage April 12 through July 20, 1991, and dining threemaintenance outages January 17 through January 31, Septerr ber iS throughSeptember 25, and October 22 through November 28, 1991. The highest average l
daily output generated during the year was 836 megawatts net in Decembr- 991, |and the total gross eiectrical generation during the year was 3.921.000 !megawatt-hours. |
Beaver Valley Power Station Unit 2 operated throughout the year except for a brief j
outage, November 26 through November 28,1991. The highest average daily output I
generated during the year was 823 megawatts net in February,1991, and the totalgross electrical generation during the year was 7,099,800 megawatt hours.
in 1991, samples were taken from over 60 sites around Beaver Valley Power Stationthat ' included the aquatic, atmospheric and terrestrial environments. More than3,000 analyses were performed on these samples.
During the year, the radioactive releases from BVPS Units 1 and 2 did not exceed jthe Limiting Conditions for Operation identified m the Beaver Valley Power Station
IOperating License Technical Specifications for Units 1 and 2. Based upon theestimated dose to individuals from the natural background radiation exposure, theincremental increase in total body dose to the 50-mile population (4 million people),from the operation of Beaver Valley Power Station - Unit No.1 and No. 2, is less |than 0.0001% of the annual background, See Section V.! for specific details. TheNational Academy of Sciences 1990 BEIR Report shows that the typical dose to anindividual from background (natural radiation exposure includmg radon) is 296 mremper year.
The environmental monitoring program outlined in the Beaver Valley Power StationUnits 1 and 2 Technical Specifications was followed throughout 1991 The results foreach media are contained in Section V of this report, Examination of effluents andenvironmental media show that it'e Beaver Valiey Power Station Units 1 and 2operations have not adversely affected the surrounding environment.
II EXECUTIVE SuuMARY

_ _ _ . . _ . _ _ _ . . _ . . _ _ _ . _ _ _ _ _ - ..
Duquesne Light Company -1991 Annual Radiological Environmental Report
i
Table of Contents i
; Section 1. INTRODUCTION 1-1
A. Scope and Objectives of the Program 11B. Description of the Beaver Valley Site 1-1
Section 2. RESULTS AND CONCLUSIONS 2-1
|'
Section 3. ENVIRONMENTAL MONITORING CONSIDERATIONS 3-1A. Environmental Quahty Control Programs 31B. Evaluation of the Quality Control (QC) Prograrn Data 3 17C. Standard Requirements and Limitations for Radiological
and Other Effluents 3-17-D. Reportmg Levels 3-13
Section 4. MONITORING EFFLUENTS 41A. Monitoring of Liquid Effluents 41 +
1. Description of Liquid Ettluents at the Beaver ValleyPower Station. 4-1
2. Effluent Treatment. Sampling. and AnalyticalProcedures 41
3. Results of Liquid Effluent Discharge to the Environment 418. Monitoring of Atmospheric Effluents 4-8
1. Description of Atmospheric Effluent Sources 482. Atmospheric Effluent Treatment and Samphng 4-11'
3. Results 4-15C, Solid Waste Disposal at the Beaver '/alle, Power Station 4 15
! Section 5. ENVIRONMENTAL MONITORING PROGRAM 5-1A. Environmental Radioactivity Monitoring Frograrn 5-1
1. Program Description . 512. Summar/ of Results 5-63. _ _ Quahty Control Program 56
8. Air Monitoring 5-22- 1.- Characterization of Air and Meteorology 5-222. Air Sampling Program and Aaalytical Techniques 5 223. -Results and Conclusions 5-24
C. Monitoring of Sediments and Soils (Soil Monitoring isrequired every 3 years and was required in 1991) 5-261. Characterization of Stream Sediments and Soils 5-262. Samphng Program and-Analytical Techniques 5-263. Results and Conclusions 5-28._
D. Monitoring of Feedcrops and Foodcrops 5-291. Characterization of Vegetation and Foodcrops 5-292. Sampling Program and Analytical Techniques 5-293. .Results and Conclusions 5-32
E. Monitoring of Local Cows Milk 5-331. Description - Milch Anirnal Locations 5-33
-2. Sampling Program and Analytical Techniques 5 333. Results and Conc usions 5-36
ranie of Contems lil

Duquesne Li ht Company01991 Annual Radiological Environmental Report
F, Environmental Radiation Monitoring 5-371, Description of Regional Background Radiation and
Sources 5-37.
2. Locations and Analytical Procedures 5-37
3. Results and Conclusions 5-38
G. Monitoring of Fish 5-45
1. Description 5-45
2. Sampling Program and Analytical Techniques 5-45
3. Results and Conclusions 5-45
H. Monitoring of Surface Drinking, Well Waters andPrecipitation 5-47
1. Description of Water Sources 5-47
2. Sampling and Analytical Techniques 5-48
3. Results and Conclusions 5-51
1. Estimates of Radiation Dose to Man 5-54
1. Pathways to Man - Calculational Models 5-54S
2. Results of Calculated Radiation Dose to Man - LiquidReleases 5 55
3. Results of Calculated Radiation Dose to Man -Almospheric Releases 5-53
4. Conclusions - (Beaver Valley Power Station) 5 59
I
IV Taole of Contents___ ___ _ _ _ __ _ _ _ _ _ ___ _ _ _ _ _ ____ _ _ _ _ _ _ _ _ _ _ _ __ _ _ _ ___ _ __ _ _

-_ _-_ _ _ _ _ _
Duquesne Light Company1991 Annual Radiological Environmental Report
List of Tables
3-1. Quality Control Data - Contractor /Quahty Control Laboratory ComparisonThermoluminescent Dosimeters - mR! day 3-2
3-2. Quality Control Data - Co.. tractor /Quahty Control Laboratory ComparisonSplit Surface Water Samples 3-3
3-3. Quality Control Data - Contractor /Quahty Control Laboratory CornparisonSplit Drmking Water Samples 3-4
3-4 Quahty Control Data - Contractor /Quahty Control Laboratory ComparisonSpht Milk Samples 35
3-5, Quahty Control Data - Contractor /Quahty Control Laboratory ComparisonSplit Feed. Food and Sediment Samples 3-6
3-6. Quahty Contrcl Data - Contractor /Quahty Control Laboratory Comparison -
Spiked Water Samples 3-93-7. Quality Control Data - Contractor /Quahty Control Laboratory
Comparison Spiked Milk Samples 3-103-8. Quahty Control Data - Contractor /Quahty Control Laboratory
Comparison Split Air Particutate and Charcoal Filter Samples 3-11
3-9. Quality Control Data - Contractor / Quality Controi LaboratoryComparison Split Air Particulate Samples (gamma) 3-13
3-10. Quality Control Data - Contractor / Quality Control LaboratoryComparison Split Sr 89,90 Composite Samples 3-14
3-11. Ouclity Control Data - Independent Laboratory / Contractor /Quahty '
Control Laboratory Comparison Spiked Water Samples 3-153-12. Quality Control Data - Independent Laboratory / Contractor /Quahty
Control Laboratory Comparison Spiked Milk Samples 3-164-1. Effluent Treatment. Sampling and Analytical Procedures - Beaver Valley 4-7
4-2. Results of Liquid Effluent Discharges to the Environment - Beaver Valley 4-74-3. Radioactive Gaseous Waste Samphng and Analysis Program 4-t35-1. Radiological Environmental Momtoring Program 5-2 -
5-2. Environmental Monitoring Program Results (1991) 5-7
5-3. Pre-operational Environmental Radiological Monitormg Program i
Summary 5-185-4. Typical LLDs For Gamma Spectrometry 5-21
5-5. Closest Residence and Garden in Each Sector 5-31
5-6. Pressurized 10n Chanbers - 1991 Results (mR/ day) 5-445-7. Radiation Dose to Maximum Individual, mrem /yr, BVPS - Liquid
Releases 5-565-8. Results of Calculated Radiation Dose to Man BVPS - Liquid Releases 5-57
5-9. Results of Calculated R.adiation Dose to Man (1991) BVPS -Atmospheric Releases 5-60
Ust of toes v
__ - _ _ _ _ _ _ _ _ _ _ _ - _ - _ - _ _ - _ _ _ _ - _ __

r
| .--
'
Duquesne Light Company1991 Annual Radiological Environmental Report
List of Figures
t
-11. - View of the Beaver Valley Power Station (BVPS)- 1-2 -S1-2. Geographical Map and Principal Communities in 40-mile Radius of the
Beaver Valley Power Station 134-1. Liquid Discharge Points to Ohio River 424-2. Unit 1 Water Flow Schematic 4-34-3. Unit 2 Water Flow Schematic 4444. Unit 1 Liquid Waste System 4-54 5. Unit-2 Liquid Waste System 4-64 0. Units 1 and 2 Gaseous Radwaste System 49
-4-7. Units 1 and 2 Gaseous Release Points 4-104-8. Solid Waste Disposal Diagram 4 16
-
5-1. Air Sampling Stations 5 235-2. Aver ge Concentration of Gross Beta in Air Particulates 1991 5 255-3. Environmental Monitoring Locations - Shoreline Sediments and Soil 5-275 4. Environrr. ental Monitoring Program - Feederop and Foodcrop Locations 5-305-5. Beaver Valley Power Station Milch Animal Census 5-345-6. Environmental Monitoring Locations - Milk 5-355-7. TLD Locations Northwest Quadrant Beaver Valley Power Station 5-395-8. TLD Locations Northeast Quadrant Beaver Valley Power Station 5-405-9. TLD Locations Southeast Quadrant Beaver Valley Power Station 5-41
5-10. TLD Locations Southwest Quadrant Beaver Valley Power Station 5-42-5-11. Environmental Monitoring Locations - Pressurized lon Chambers 5-435-12. Environmental Monitoring Program - Fish Sampling Locations 5-46. - 13. Environmental Monitoring Stations Locations - Wells. Surface Water."
Drinking Water and Precipitation 5-50
s
vi - i.;st or rig #es_ _ - _

- ._ _ _ __
Duquesne Li h! _ Company01991 Annual Radiological Environmental Report
Section 1. INTRODUCTION
.
A. Scope and Objectives of the ProgramzThe environmental p cgram consists of environmental momtoring for radioactivity in -the vicinity of the Beaver Valley Power Station. Environmental sampiing andanalyses included air. water, milk, soil, vegetation river sediments, fish, andambient radiation levels in areas surroundmg'the site. The results of these mediaare assessed to determine impacts of the plant operation on the environment. The
'Annual--Radiological Environmental Report for the Beaver Valley Power Stationsummarizes the radiological environmental program conducted by the DuquesneLight Company in 1991.
B. Description of the Beaver Valley SiteThe Beaver Valley Power Station is located on the south bank of the Ohio River mthe Borough of Shippingport, Beaver County, Penns,:vania on a 501 acre tract of
- land, Figure 11 is a view of the Beaver Valley Power Stahon. The site isapproximately one mile from Midland, Pennsylvania; 5 miles from East Liverpool._ Ohio; and 25 miles from Pittsburgh, Pennsylvania. Figure 1-2 shows the sitelocation in relation to the principal population centers. Population density in theimmediate vicinity of the site is relatively low. The population within a 5 mile radius
- of the plant is approximately 18,000 and the only area wit hin the radius ofconcentrated papulation is the Borough of Mir' 'd, Pennsylvania, with a populationof approximately 3,300.
The site ties in a valley along the Ohio River. It extends from the river (elevation665 feet above sea level) to a ridge along the border south of the Beaver ValleyPower Station at an elevation of 1.160 feet, Diant ground level is approximately 735feet above sea level
! The Beaver Valley Power Station is on the Ohio River at river mite 34.8. at a locationon the New Cumberland Pool that is 3.3 river miles riownstream from MontgomeryLock and Dam, and 19.4 miles upstream from New Cumberland Lock and Dam. ThePenns'ylvania-Ohio-West Virginia border is located 5.2 river miles downstream f.omthe site. The river flow is regulated by a series of dams and reservoirs on the"
Beaver, Allegheny. Monongahela and Ohio Rivers and their tributaries. Flow rangesfrom a minimum of approximately 5000 cubic feet per second (CFS) to a maximurnof approximately 100,000 CFS. The mean annual flow is approximately 25.000 CFS.
; -
Water temperature of the Ohio River varies from 32 F. to 84 F, the minimumtemperatures occur in January and/or February and maximum temperatures in Julyand August. Water quality in the Ohio River at the site location is affected primarilyby the water quality of the Allegheny, Monongahela, and Beaver rivers.
The climate of the area may be classified as humid continental. Annualprecipitation is approximately 36 inches, typical yearly temperatures vary fromapproximately - 3'F to 95 F with an annual average temperature of 52.3 F. The-predominant wind direction is typically from the southwest in summer and from thenorthwest in winter.
Section 1 IN T RoouCTioN 11
. . . _

i 2 4 - e e 4 - sua a i. 4-ec- .-h_== 432-u.aaa..-. a --x- m4 2 a~6 m =. . . . . . _ , -., = .m . +.Aa,.a. .-
1r
d
. .-
|4
.-
- ,w, -
_h *: '-11
)7.||
'
)
. .,+ a
?
N ,4
L
. 11-
I
- ? I-r ''
i
-
.
d
1
11
I ' |
4
1
-. .I
rf
F I
-Ij
l
J
# 1
3
J
+ t
4
', .l4
|
i.J-%
f
,''c.-
'- . - .,
h
- 6 - - , - . , , . y .. 3.- _ -n- .e-. 3,-, -.n - - - , --

- .~.~ . . - . . - . - . . . . . . ~ . _ _ . _ . . . . . . . - - - - - . . . . _ _ _ _ _ . - . . _ _ - _ . _ _ _ _ _ . __
|
DUQUESNE lilGilT UOMPANY'
I
! ANNUAL. ENVIRONMENTAL. REPORTi
,.
-
("-
i ..~
J . .-' '
I: ., . ,,
, . ,- , .
,.
..
-- : s;_ .
, . .
i' - .|
,
'
,
I ,
|_ '. :' %
r \.<
..
-
, , ..
.
, .
.
. q e,-~
'
( ,
...
- 4. ,
.Ti- --, ;> . , , ,
e .{B 1 ,7.. .
,.
,.> . .
f- . . ; " . Ffn . |
- - }t . g'
. ,
.i - '|- C |
.,.
11 . r .., -
1Q )f. ) . 'j
[, -
yi' t .
U'
, .
- .___
Duquesne Ls0ht Company1991 Annual Radiological Environmental Report
,
Figure 12 Geograchtc.il Map innd Principal Communities in 40-mile Rad 4us of the Beher Va' ley Power Stab 0n
. .
$ }'
5
90 I //I
\ :stW CAS*1.I
W I/ g\
\ ,,62. - '
ALI!ASCE ;
43) .
\ . 3UTLIR [M |
-% qh>, 6.10
f'f ' +# 8
--
'
30R0 0F30 fMI??!NCPOC g j*
EAST e.:qcuPA ' nssISG.ONLIVERPIL',' .
'\ $
\qi
j 21h!.
1
l ".7 PI- 53URC'd 3*9
'aTIITCN, //r, eKIESPORI A"
gggg.g
92
2 WASHINGTCN ,
40W| i
,
'#WEIIIING '
I -\i
Reds*Rivers-
Q- Ci:les-
GEOGRAPHaCAL ItAP AND PRINCIPAL Cott! UNITIES IN 40-:!ILE RADIUS OF THE
BEAVER VALLEY POWER STATION.,-
FIGURE 1-2'
secnon t mtacoucten 1-3
, . - . _ - .--. . __ _- _ _ _ _ _ . - . _ _ . . . _ _

. -. . . . . - . -. . . - . - . . . - ~ - _- -
.
Duquesne Light Company .:1991 Annual Radiological Environmental Report
'The desi n ratings'and basic features of the Beaver Valley Power Station Units 10and 2 are tabulated below:
*,
Beaver Vallev Unit 1 Beaver Vallev Unit 2
' Therrnal & Elec, RatinD -(Net MW,) . 2660 MW,835 MW, 2660 MW,836 MW,
Type of Power PWR PWR
No. of Reactor Coolant_ Loops-- 3 3_
No. of Steam Generators-& Type 3 - Vertical 3 - Vertical
Steam Used by Main-Turbine Saturated Saturated
:The units utilize two separate systems (primary and secondary) for transferring heatfrom the source (the reactor) to the receiving component (turbine-generator).
1Because. the'two. systems are isolated from each other. _ primary and secondary- waters _do not_ mix; therefore, radioactivity in the primary system water is normallyisolated from the' secondary system. Reactor coolant m the primary system is '
pumped through the reactor core and steam generators by means of reactor coolant,
pumps. , Heat is given up from the prirnary system to the secondary system in the-steam generators, where steam is formed and delivered to the main umt turbine.- which drives; the: electrical generator. The' steam is condensed after passingthrough f the turbine, and returned to the steam generators to begin anothersteam / water cycle.,
NOTE: MW,- megawatts thermal
-:MW, - megawatts electrical~
.,
. -
71-4 :Secton 1. INTRCOUCTION -
-

, . . - .. - .-- . . . - . - .
Duquesne Light Company _ i1991 Annual Radiological Environmental Report J
Section 2. RESULTS AND CONCLUSIONS=
Plant operations at the Beaver Valley Power Station had no adverse effects on theenvironment as a result of activity at the station during 1991;
The Beaver Valley Power Station Umt 1 operated throu0 out 1991, except during theh
Eighth Refueling Outage April 12 through July 20, 1991, and three maintenanceoutages January 17-31. September 18-25, and October 22 - November 28,1991. Umt,
2 operated throughout the year except for a brief outage. November 26-28, 1991.During the year, the radioactive releases were below the hmits of 10 CFR Part 50,Appendix 1. The releases at Beaver Valley Power Station Umts 1 and 2 did not
exceed the limiting conditions identified in the Beaver Valley Power Station Omts 1and 2 Operating License Technical Specificahons.
The environmental piogram for 1991 was the same as in 1990 except for severalchanges in dairy locations which were revised as required by the Beaver ValleyTechnical Specifications. (Refer to Table 5-1 for the 1991 Radiological MonitoringProgram Outline).
The Beaver Valley Power Station Technicat Specifications require s. apling of three(3) dairies which have the highest calculated milk pathway potentia. and one largelocal dairy. The three dairies are determined from calculations cased on themeteorological data and the latest milch animat survey. However, these dairies arefrequently small, consisting of as few as one cow or goat. The availabihty of m:lkfrom single cow dairies 'and revisions due to updated calculations and surveysnorrnally result in sampling of several additional dairies during the year in differentsampling periods,
The Environmental Monitoring Program also includes two larger dairies in order toprovide continuity in the sampling / analyses program and a control location.Sarnples from each of these. dairies are obtained in addition to the four dairiesrequired -by the Environmental Technical Specifications. The collection periodsassociated with each of the locations are provided in the detailed summary of themilk monitoring program of this report (Section 5-E).
Activity detected was attributable to naturally occurring radionuclides, BVPSeffluents, previous nuclear weapons tests, medical procedures or to the normalstatistical fluctuation for activities near the lower limit of detection (LLD). Thepositive results attributable to the Beaver Valley Power Station were consistent withstation data of authorized radioactive discharges and were within limits permitted bythe NRC license.
The results and conclusions for each media of the 1991 Radiolo@al Environnsna. Monitoring Program are contained in Sectir 7 5 of this report. A summary of the1991 operational environmental data is found . in Table 5-2 and a summar / off reoperational data (1974-1975) environmental data is found in Table 5-3.
Examination of effluenis from the Beaver Valley Power Station and environmentalmedia demonstrated compliance with regulations and Station TechnicalSpecifications.
Section 2. RESu Ts AND CoNCluS!oNS -2-1
.. -. - - - --

Duquesne Light Company1991 Annual Radiological Environmental Report
!
Section 3, ENVIRONMENTAL MONITORING CONSIDERATIONS
.
A. Environmental Quality Control Programs,
The Quality Control (QC) Program used for the Beaver Valley Environmental )Radioactivity Monitoring Program consisted of seven (7) elements. It should benoted that the comparisons made v.ere at very low levels of radioactivity and |
consequently, the activities at these levels are difficult to measure. However, |
acceptable correlation was achievad in most instances as outhned in the |'
dHcussions and tables which follow.
1. TLD Monitoring (Duquesne Light Company (DLC) Contractor Laboratory and OCLaboratory)
.||Thirteen (13) TLDs from the Contractor Laboratory and OC Laboratory are
co-located, replaced quarterly and results compared. The average of the
contractor laboratory and the average of the quahty control laboratory agreewithin 7.9% of the mean of all results. This is well within the 7 cision oftypical TLD Systems. Summary data of the TLD Monitoring Frograrn isprovided in Table 3-1,
2. Spht Sample Program (DLC Contractor Laboratory - DLC QC Laboratory)
Samples of surf ace (river) water and drinking water were routinely split andanalyzed by the DLC Contractor Laboratory and the DLC QC Laboratory. inaddition, samples of other media, st.ch as milk, soil, sediment and feedcropwere also sp"t with the DLC QC Laboratory.
A summary of results of spht water sampias is provided in Table 3-2 andTable 3-3. In 1989 and 1990 disagreement in surface and drinking gross betawater ramples had been noted. Changes in laboratory procedures were madeand in 1.i91 seven of eight split gross beta's were in agreement and one wasclose to agreement. Six extra surface and drinking water samples were sphiand processed for gross beta. All meet agreement criteria. Summaries ofmilk, sediment and feed / food crop split samples is provided i1 Table 3.t andT1ble 3-5. Some variation may be expected due to small variations in
duplicate samples, variations in analytical procedures, and in calibration,
source type, etc.
Sects.in 1 ENVIRONMENTAL MONITORING CONSIDERATIONS 3-1
_ .__ _____ _ _ - - . . _. __ _ _ _ _ -

_ . . . _ . . ._ .
Duquesne Light Company,
1991 Annual. Radiological Environmental Report
Table 3-L Ouahty Control Data - Contractor 'Ouality Control Latrratory ComparisonThermoluminescent Oosimeters - m%f ay
i TABLE 31
QUALITY CONTROL DATA CONTRACTOR / QUALITY CONTROL LABORATORYCOMPARISON THERMOLUMINESCENT DOSIMETERS mRIday
SST QUARTER 2ND QUARTER
DLC OLC - QC DLC DLC , CC,
Locat+on No Cont' actor Lab Location No Contrxtor - LaoiCaSO. Dyl 10a504 Dy} ,Ca 50. Dy l 1CaSO4 Ovi,
10 0.17 0.18 10 0.14 0.1713 0.17 0.17 13 C.14 0.1 G14 0 *6 0.18 14 0.14 0.1715 0.14 0.16 15 Lost Lost27 0.16 0.18 27 0.14 0.1728 0.17 0.19 26 0.16 0.17229 0.21 022 298 0.17 02032 0.16 0.19 32 0.16 0.1945 0.16 0.18 45 0.16 0.99 ,
46 0.14 0.16 46 0,13 0.1347 0.16 0.21 47 0.17 02248 0.16 c.19 46 0.15 OAe51 0.17 0.2 t 51 0.15 O6
_| 3RD QU ARTER 4Tri QU ARTER
.| DLC OLC-QC DLC l Ox0-QCLocatron No. Cont < actor - Lac Locat.on No Contractor ! Lao
(Ca504 Dy) (CaSO4 Dy) (CaSO4 Dy1 } ;CaSO4Do# 10 0.14 0.18 10 0.16 0.19
*13 0.t3 0.16 13 0.17 0.1814 0.14 0.18 | 14 0.1t! 020
I15 Lest Lost 15 0.13 0.1527 0.15 0.16 27 0.16 020
- 25 0,16 0.18 28 0.11 0.20298 0,18 0.23 298 0.20 02332 0.16 0.18 32 0.t 7 0.21 - *
45 0.17 0.18 45 0.16 02346 0,14 0.t 6 46 0.15 0.1547 0.11 0.20 47 0.19 02348 0.15 0.19 48 0.17 0.21
'51 0.16 0.19 51 0.17. 0.20
ANNUAL
DLC DLC - QCLuation No- Coctractor Lao
(CaSO4 Dy) (CaSO4.Dy)
to 0.15 0.1813 0.14- 0.1714 0.15 0.1715 Lost Lost27 0.15 0.1729 0.16 0.1929B 0.19 0 21
32 '0.16 0.1945 0.15 0.1846 0.13 0.1647 0.17 0.21
. J 43 0.17 0.19
}51 0.16 0.19
L '32 Secton 1 ENVIRONMEN3L MONITORING CO+4SIDERATIONS
-- . ,- , . . . . - ,, -

. . , . . . . . - . . -- . . - , . . - , . . .. -
.
Duquesne Oght Company _-_1991 Annual Radiological Environmental Report
il.
Table; 3 2f Ocahty -Controt Data Contractor /Ovahty Control Laboratory Comparison Spht Surface- Water Samples 'l
. , A.
-i -f ]3
T ABd 3 *
QU4ff Y CONTROL DAT ACONTR ACT OR QUALif Y CONT ROL (ASORATOR f COMP ARISQN $PLIT SJRFaCE WMf ? SWPLES
9mpug . tst Contractor M L ' Q4 i; u#2.a Malf*>* umis
per.,4 up41, . Lab t h
~ $ dace Water G*c n A Dha . Ja%a3 $ LB 0.9J t C.$6 pC M
A pnt $ t=3 Li103 { pC n
Jsy su to i U pcm-
1
Octotter i 1.9 f .$ 1 1.1 pM'
6432.7 5.4105 p NIS#xe harer . Grou Beta Ja%arr
bra | 4.210.5 5.$ t c 6 pCm
Juy 1.2113 5.$ t C.6 oCm
Octater i t i 2' 6.3 : 0.6 oc./ 4
5# ace Water . Cp 60 Ja%ary -$4 <j 2 pCm
#,ont 5) s 4.2 pCi/t-
Jdy 5l $ 4.4 I "toOc+oter i3 54.3 | pCW
~ S# ace Water - Cs,t34 JaNary s4 5 i,4 pCm
Avd .s3 13,4 pCat
JW, $ 0.9 s 3.4 pCa
- OctoDer S4 $ 3.5 pCm
5# ace Water Cs-137 - JaNag 5$ $ t.6 pCm - .|Apro - $3 5 4,t pCm 1,,
_
Ju* y 5 .1 54.0 pCm~
Octot4r 54 54.6 pCm
$# ace waier f ntwm IstQuaner 3000 g 100 3t% 2178 pOnComposite
,.
3ra ovarter [. i30170 $ iso pcm: Compayte }
*
s# ace water . sr-se 2nd Quarter 5 t.i s 0.6 pCWComposte -
' 4th Quarter $ O.74 $ 0.5 ACmCornpoute
$w face Water S r -90 2nd Quarter - ,S 0.35 . 5 0. 7 - PCdtr
Composite
4tn Quarter 5 0.1L $03 pCa-Cornoo9te
S# ace Water Co-60 2nd Quar 1er $ 1,0 5 f.8 pC*ilf.h>gn Composte -
* 4th Quarter - 5 0,,9 $ 2.0 pCW *a * ayl 58 5 # g,
i Extra Sont sampees For Gross Beta
Surface Water Gross Geta March ( A) 4.910.9 3.410.9 pCdt
Mar;h (B) 5.610.8 2.110.9 pCai
March (C) 4.410.0 3.110.9 pCm
. til - Uncerta#nt>es a'e based on counting s!atistics and are specified at the 95% cont.oence coe%cient
jL seg section s.4 2-
|
a
Section 3. ENV;RONMENTAL MONITORING CONSDERAllONs 3-3
. - -- . . . . . , . - . .. .- . - - - - - .-

, . - - , - .
- ,. ._ _
_
Duquesne Light Company _1991 Annual Radiological Environmental Report,
Table 13-3 Quahty Controt Data - Cortractor/Ouahty' Control Laboratory Comparison Split DrinkingWater Sa rtples'
i
,.
T ABLE 3-3 *
.
.
quality CONTRot CATA
CONTRAC!ORIOUAtttY CONTRO'% LABORAf 0Rf COMP ARiSON SP' '7 DRINK!NG W ATER $AMFLES '
S a ms"'N ote cont act:< ote oc. w3,. .in. ,g, s ,Pencyj Lacgh Lab ila'
, Ct# s teg )%Jter C U137 Feteva) $ (A S 4,2 t/iM
May 5 40_ s ?.0 pCat.
# V Augu st s $.0 $ ti. 8 pC e 'l -
,
Ihowemtwr s 4.0 S 4.0 pCd
TJrd4:q Wret :- Cs 04 fetirwJ7 < 4.0 $ 3.4 pCA 2
May 53.0 54.3 pCin
Augu sf 550 $ ?.5 - pCat '
Novemter . $ 4.0 53.6 gl .M
nnung Water C0 50 ~ N%#wa9 56.0 54) I PCM***68(SP"U u,y 33,o s4e pCA
A ugu st f A,0 *; 5,3 pCut
- Nov+mov 54.0 g 4.0 pCd
Orimng Water - Cross Arpaa - March i 1.6 s 1.1 pCW
Og,e,. m ne s ,.s s ..i pCm.
August - $ t,6 $ f,7 pCthi
Novemtef - 11.4 S 1,3 pCM
Doeong wate* Gross Beta Mrch 2910.9 2.110,8- pCv1~
June ~ ~ 2.01 10 l'110,5 PCW1 *
August- 6.811,4 4,310,6 pCs/l8
hovemt.ee . 6.210.8 4,7 t 0,4 pC.A
- De am eng water f eit,vm 2nd Quarter s 100 s 178 pCds
4tn Quade s 100. s 165 pC>n
. Emira Spo! Samotes Foe Gross Beta
Dnning wate- - Gross Beta varen IA} 3 t t 03 1520,8 pCm_
March tB) 3,0 + 03 . -2.0 t 0.8 pCui--
March (C) 4.1 0.8 2.6 t 0.8 ,DC+h
(4 Uncenaint.es are baud on count *g statist cs and are spoofied at the 95% conficence coeft.caent_
See section 3-A 2*
~
4
.- -
!
|
,
i
- ' 3-4 Sectioni ENVIRONMENTAL MONITORING CONSIDERATIONS,
e e< *rr,- ge- e . . , - , , - , r-.--- - , # . . .- ,--me.' we

. - . .. . . - . _ _ _ . _ . . - . . _ _ . _ ._. < . - . _ - . . - _ - -. _ - - _ ._-_
~ Duquebe Light C'ompany-'1991 Annual R~ jioiogical Environmental Report
a-
_
LTable . 3-4 Ouality Control Data + Contractor!Ouahty control Laboratory Comparison Soht Milk~ Samples
- i
,
TABLE 3-4
- QU ALITY CONTROL DATA.- CONTRACTORtQUAttTY CONTROL LABORATORY COVPARiSON SP IT WLK SAVPLES -L.,
Sammng ' O' **##' ' ' IJitsAnasysis. F eriod Lao (1) tad p).
*
u m (25) 31091 Sr-eo 51,3 s o.4 $nSr 90 2J 10.3 2.0105 $4
'Co 60 - s 4,0 54.9 rCA
t-131 5 0.45 50.2 Sh ,
C5 134 54.0 53.9 $ 'l
C5-13? 54.0 5 4.9 pCv1
K ,40 1183 123 1165 i 117 DCu!H
M A (25) = 618 91 Co.60 < 3.5 pCiti"
f i4 31- 5 0.12 $ C.10 pCin
C$-134 $ 3.4 pCdl''s
Cs-137 5 42 | cCvt"
K-40 " 1407 i 96 pCat
Mck (25) 9 17-91' Sr 80 51,5 s 0.6 pCin
Sr 90 - 2.010.4- 2.8 i 0.5 pCat --
Co -60 54.0 $ 3.2 pCut
I-131 $ n.09 50,3 pCin,
Os-134 54,0 54.9 oCut
Cs 137 $ 4.0 56.5 pCut
K-40 1300 i 130 1363 i 143 pCut -;
Milk (25) 12-17-91 Co-60 $ 3.0 $ 7.4 pCdl
-1131 50,1 50,2 pCi/l .
Cs 134 53.0 $ 6.2 pCat
Cs 137 53,0- 5 7J PCat
K +40 1390 i 140 1250 1 152 pCut'
. O} Uncertamties are based on counting statistics and are speofM at the 95% confiaence coefficen** See Section 3-8;
" ' Analysis cDiamed on $nerent sampre
'
.
.: ,
0
k
-
. Section 3 ENVIRONMENTAL MONITORING CONSIDERATIONS 3-5't. _ . . _ . -_ _ . . ._ _ . _ _ -. _ __ _ _ - - _ .

. Duquesno L'ight Company1991 Annual Radiological Er*vironmental Report
4
Table '3 5 Ouahty Control Data _ Contractor!Ouakty Control Laboratory Companson Spht Feed food'and Sediment Samples
S
.
tT ABL ; 3 5
r
-- - -
' QUAtt1ICONTROL DATA -.
CONTR ACTOCQUAUTY CONTROL LABOR ATORY. COMPAR SON SPLIT FEED. FOOD AND SEOtVENT SAMPLES |
r
Sa P""9Ve09 - Ana4ysts'
Unds *
9 eros Lao 11) Lantie
-Fees 1256 61691 Be-7 50.4 5 0.23 PCoqm 10* y!-
K-40 32 1 3' 14.111.0 pCJgm icty) r
Co 60 5 0.03 [ 5 0.047 pCsgm tory)
|1 13 t 5 0.004 5 0.033 PCUgm teryl
C5 134 .5 0.03 $ C,03 pCagm to y)
Cs 137 5 0.03 $ 0.033 pCagm idry)
feed 125) ' 61891. Sr-90 _ 0.061 i 0.007 0.040 1 0.007 pCagm tary) [Food (10) 82991 *( 40 2.5910.26 1.91 10.2c pCegm-4 we:1
Co 63 $ C.005 5 0,011 pCogm tweti I
1 131 $ 0.02 5 0.011 pC gm twet) -(Cs,134 5 0.005 5 0.010 pCugm twet; -l
#Cs.137 5 0.006 5 0.011 pCvgm twet)
. -
- Seoiment (2A) 10-23 91 Gross A!pha -14,016.0 - 16.40 t 4.42 pCu p tory)
Gross Deta 37.0 t 3,0 25.97 t 2f i pCvgm ict yt ..
5r.89 - . s 0.15 5 0,018 pCagm taryiI Sr90 $ 0.029 - $ 0.02210.007 PCvg m (dry)
*Co 58 ' O.743 0.061 0.91 1 0.088 pCugm vary)
*
Co-60 : 2 42 i Co?4 2.80 0.14 pCagm tory). _ _ -
CS 134 $ 0.07 $ 0.054' ' pCvgm toryr
Cs-137 0.177 1 0.071 0.24 1 0.061 pCagm tory)-
1 Ra 226 t.84 10.6 7 -3.3910.87 pC#gm tarY)
K 40. 12.7 t.1.3 17,66 i 0,85 pCdgm (cry)
'(11. Uncertarnt4es are cased on countmg statistics and are specihed at the 95% conhcence coeffcent.,
* See sect;oo 3 8.
'' Analysis obta:ned on datterer.; sample.
<
L
J
n
, 36' Section 3 ENVIRONMENTA!. MONITORING CONSIDERATIONS. g. -
. _ _ . _ _ _ _ _ _ _ _ _ _ _ _ _ .
4 . . , , _- .. _ = _ . . _ . _ _ . . _ . . _ . . - . __ _ - _ - - . . _ . _ . _ . . .
|
.
-- Duquesne Light Company _ j,
1991 Annual Radiological Environmental Report '
. .i
-3L DLC QC Laboratory Program
Spiked samples prepared _by DLC QC Laboratory were routinely submitted to-~
the Contractor Laboratory for. analysis. Table 3-6 (water) and Table 3-7 (milk) .provide data from this portion of the QC Program.
4 Comparisons of Similar - Samples (DLC Contractor Laboratory -' DLC QC-
4
Laboratory),
Duplicate air particulate - and charcoal - fillers - (radiciodine) samples were,
collec%d at Location =30 and compared during the year on a weekly basis. ;i- . Comparison of particulate and charcoal samples alternated from week to week.
Duplicate monthly air' particulate filters, composited from the weekly, air *
oarticulate fiiters, were analyzed 6 months out of the year for gamma activity.Duplicate' quarterly air- particulate filters, composited from the weekly ait'particulate filters, were analyzed for Sr-89 and St-90 activity for each quarter ofthe . year, Table 3-8, Table 3-9 and Table 3-10 provides data for this portion ofthe QC program.
5. Contractor and OC Laboratory - Internal _ QC Program ,
;
"The' Contractor and -QC Laboratory maintained their own QC Progr.am which -!
included participation in the Environmental Protection Agency - Environrnental '
Monitorin0 Safety Laboratory (EPA - EMSL) Interlaboratory Cross Check.
Program. This cross check program indicated that _the Contractor and QCLaboratory results were in' agreement with EPA EMSL. See Appendix I and ll.
:DLC: also audited the Contractor and QC Laboratory and determined -thatinternal. QC practices were in effect and that procedures ~ and laboratory
1- analytical techniques conformed to approved DLC procedures.
6. Speda! QC. Program (DLC Contractor Laboratory - Independent Laboratory -DLC QC Laboratory)
,~ Milk and water samples were prepared by an Indoendent Laboratory. Thisincluded-low level spiking of specified nuclides. - The prepared samples weresplit: three ways and analyzed. by the- DLC-QC ' Laboratory and Independent
~
; Laboratory as well as the Contractor Laboratory. A summary of results of thisportion - of the QC program 'is provided in Table 3-11. Contractornon-comparison with the Independent Laboratory for i+131 in water provided inTable 3-11 and Sr-89-90 in milk provided -in Table 3-12 is discussed in thefollowing paragraphs;
.
,'
,
.
Section 3. ENVIRONMENT AL MONITORING CONSIDERATIONS 3-7-. , ,_ , -, ._ _ . . _ . . . _.

__ _ - _ _ _ . _ _ _ _ . _ _ _ _ _ _ _ _ . . _ _ _ _ __ _--
. ,
Duquesne Light Company1991 Annual Radiological Environmental Report-
i|^
The contractor _ laboratory 1-131 in water results were noted to have a low bias_
compared; to the independent' and the QC laboratory for sample _ spikes~ produced by the independent laboratory. All laboratory work and calculations'.
for these 1-131 samples were verified by the contractor. This low bias had not ij- .been observed in the previous year and no known changes which could effect
results had been inade in the laboratories or procedures. Essentially the same_ procedure is _used by the contractor._for both milk and water samples and in .1991- all' milk samples for 1131 produced by the independent laboratory and - i
analyzed by the contractor met agreement criteria. Also in 1991, agreementwas obtained in spike samples produced by the QC laboratory for 1131 in water
| and milk with one exception where the contractor result was high rather thanp Llow. The most probable cause of the low bias in 1-131 results by the contractor' ,
is differences in the sample preservation of the independent laboratoryprepared spike compared to routine samples and/or QC laboratory preparedspikes. Such a bias would not effect routine sample results. In 1992 a differentvendor will supply the independent laboratory spike samples and the contractor .
has also re-issued (for other reasons) the analytical procedure for iodine in _,
,. water. Results of iodine in water spikes will be followed closely m 1992 to'
obtain resolution of any corfinued bias,
i The contractor laboratory obtained background results for Strantium 89 and 90_on;two spiked milk sant es (52-259 and 59-260) prepared by the independentl
l' laboratory. The. independent laboratory stated the split samples were'madefrom -or'e batch and that. no preservatives were used. Although the _ split
,
samples were not treated in the same manner as routine samples (bisulfiteaddition) no previous problems _had been observed. Gamma activities presentin the sample were comparable between laboratorie . Although the contractorlaboratory did 'not obtain comparison- for Sr 89-90 for the abcve samplesprovided by the independent laboratory, in the same time period comparisons,
[ were obtamed for Sr 89-90 in milk on samples provided by the QC laboratoryand also by. the EPA Interlaboratory Cross Check Program. Agreement wasobtained between the contractor and independent: laboratories for Sr-89-90 in
. milk on the last scheduled sample of the year (52-261) and also on a specially,
arranged extra sample (52 261-A). It remains unclear whetrar the discrepancy'
in Sr 89-90 results were due to the sample provided on the analysis' performed.In.the following year, a different vendor will supply _ the independent _ laboratory_ spike samples'and the.-contractor has also made a procedure revision. Thecomparison of Strontium 89-90 in milk will be followed closely in 1992.
;
:f
|'
!
.3-8- Secnon 3' EN'/lRCNMENTAL MONIroRING CONSIDERATIONS
- _ _ . . , _ ___ _ - _ __ _

.. ._ _ __ . _ - _ _ _
i
Duquesne Light Company.1991 Annual Radiological Environmental Report
I|Cuahty Control Data Contractot Ouakty Control Laboratory ' Comparison Spiked WaterTable 3<6s
Sampfes -
i
TA3LE 3 6 '
QUALITY CONTROL DATACONTRACTOR / QUALITY CONTROL
LABORATORY COMPARISON SPlKED WATER SAMPLES
DLC lSample Identification Sample DLC - QCCeam Units
Date ~ N o. Analysis Lab (1) '
3 12-91 W 75 Sr-89 27 i 3 18.8 1.5 - pCill 1
St-90 16 1 16.0 0.8 pCill '
_
4-24 91 .W 76 l-131 56 t 1.0 56.5 i 1.7 pCiti
4-24-91 W-77 Co-60 15 2 2.1 16.4 2.2 pCillCs-134 18.8 i 2.4 23.8 2.5 pCillC3-137 24.2 i 2.4 25.0 2.4 pCill
4-24-91 W-78 H3 4000 i 100 4027 i 188 pCill 1
6-28-91- W-79 Gross 5.2 i .1.2 7.4 0.7 pCill .;
AlphaGross 9.3 1.1 11.0 0.7 pCillBeta
10-22-91 W-80 St-89 - 26 a. 27A i 6.9 pCi/l': Sr-90 15 i 1.0 11.7 1.4 pCill
'10-22-91 .W-81 1-131 18 1.0 19.1. 0.7 - pCill
10-22-91 W-82 Co-60 21.5 i 2.2 22.6 t 2,7 - - pCillCs 134 16.2 1.6 15.5 1.8 pCillCs-137 18.7 1.9 17.5 2.1 pCill
10-22-91 W-83- H-3 4900 100 4639 i 137. pCill-
12-19-91 - W-84 Gross 7.4 i 1.5 6.2 i 0.6 pCill- Alpha pCillGross 12.0 i 1.0 11.0 0.7Beta '
,
(1) Uncertainties are based on counting statistics and are specified at the 95%confidence coefficient.
.
$
Section 3. ENVIRONMENTAL MONITORING CONSIDERATIONS 39_ _ _

. . . .
Duquesne Light Company1991 Annual Radiological Environmental Report
:y
Table i3 7. Ooahty- Control _ Oata Contiactor/Ouahty Controi Laboratory Comparison Spiked udk'
Samt45:i
TABLE 3 7-
QUALITY CONTROL DATACONTRACTOR / QUALITY CONTROL
. LABORATORY COMPARISON SPlKED MILK SAMPLES_,
Sample identification Sample DLC - QC"" ' ""
D at e' N o. Analysis Lab (1)
1 31-91 Mi 33 S r-89 20 i 5 20.7 3.3 pCillSr-90 22 1 19.0 1.4 pCill
Cs-134 17.4 4.0 22.2 1.7 pCillCs-137 25.214.0 26.1 i 1.6 pCill
K-40 ' 1300 130 1280 40 pCill
2-11-91 Mi-34 l-131 36 1.0 40.7 1.8 pCill
4-24-91 Mi-35 1131 44 i 1.0 48.0 0.8 pCillCs-134' -17.7 i 4.2 19.212.0 pCi/lCs-137 21 4,8 22.8 2.2 pCill
K-40 1260 130 1320 57 pCill
7-31-91 Mi-36 - Sr-89 28.0 2.0 28.112.1 pCillSr-90 11.0 1.0 11.6 i_0.7 pCill1131 48.0 2.0* 14.4 1.9 ' pCill
'
Cs-134 53.0 $ 1.8 pCillCs-137 33.6 i 4.0 34.3 i 3.0 pCill
K 40 719 1 72 675 45 pCill -
10-22-91 Ml-37 l131 22 1.0 23.6 i 3.2 pCi/lCs 134 19.7 5.0 22.8 2B pCill
,
Cs-137 33.8 i 5.4 38.3 i 3.0 pCillK-40 1230 i~ 120. 1233 53 pCill
(1)' Uncertainties are based on counting statistics and are specified at the 95%confidence coefficient.
See Section 3 B*
>
3-10- ' Section 3 ENVIRONMENTAL MONITORING CONSIDERATIONS.. .

~ - _ . _ _ . _ . _ _ . . . . _ . _ _ _ - _ _ . _ _ . . . . _ _ > . . _ . . _ . _ _ _ _ _ . _ _ _ _ _
,
Duquesno Light Company,
1991 Annual Radiological Environmental Report jL
Table 3 8 Ovahty Control Data . Contractor Qualdy CoNrol Lat> oratory Compans,on Split AirParticulato and Charc. cal rdter Samples
i--. . . _ , .
B I- - - - - - - - - -. - - -
10 C. O o. o C. o. C. C. o 0.~ o 0
o o o o r o o o o o e o o o33 y v v v v v v v v v v v vO
,
4.-1
t
t - i.* 3 It' 2 U X ;- m n n - .- m - ~ -o o o o o o o o o o o o o |
| k .J - o o 6 6 6 o 6 6 6 6 4 6 6gO'O[oj V V V V V V V V V V V V V.t
<8 vz -
o m a e$2 m i
1 a g' y I
-g u - -- g ,
|ma uo , ,
yE i,, ;=>m - e . ~ ,>- x e. ., ,~ = .
. n o .
v uuaa = >- - .
g, d a o e +-a
,
-- N M 9N m
Q 40C
6 b h b b b b ? h,o? h 5 $ b$$$ h.i
'
co8 2 = n N m m 4 e s e a ?-
.J o M *g *03< ,mn u x 1 .
9 Edu :;
b. one m -
4 O t- Z '
& "z <r O n n n n n n n n n n n n 5
3(# v 88 8 8 8 8 8 8 8 8 8 8 Y t
y $ aE aa 6 6 6 6 6 6 & 6 a o o &oa8 /o u +1 +i +1 +1 +1 +1 +1 +1 +i u 41 +1 .
53: d3 2 2 R : R C 4 O E b R c 4 .
*
02 O o o o o o o o o e o 6 q p *
yk o d d d d d 6 o' d 6 6 ., o ),o , ,g
UQ M< *
%g3 7 3 ..
;
zA .I *0" * m N m a m m m m N m a m m pV 3 S- k 8 k O. -8. k k - O 8 O. O, k S. !~
O* * o o o o o o o o o o o o o
3u-"5 +1 H H +1 +1 y +1 +1 44 +1 +1 +t +1 y'3 **k *13 : 2 c e c 1 B b. o. o. o. o
* * 1 e n "2 ;
b $d" V o C. o. o C. C. o. .
7. g-<.
-
'q3 o o o o o o o. > o o o o ou >
4 'Ri .
M o1~G .G& $3. m !
9 - +>
55 !3 5 : E 0 0 ? E, $ b O $ C9 y a. ;n ~ n n ,
, = o-
} $ $ 4 5 5 5 E5 6, $ 0 5 6 |},
o. - e n e a a a e a o a e-M
i7. ..
,
!
section 3. ENVmONMENTA1. MOMTOmHG CDNSIDERAT'ONs 3 11- |. ...a . . . - --.--__..-_.-._z_.--_.........._. - - . . . - . - - - ,

Duquesno Light Company1991 Annual Radiological Environmental Report
.
8 -
e-. o. o c. o o e o o o o. o- - -. - - - - - - - -
.- e.a o o o o o o o o <> o o o o
33 v v v v v v- v v v v v v v0
t
}|3 55- ~ . - - ~ ~. -
~o-
v o g -- o. o, o. o. o. o. c. o o o. o o.3 3 Jam o o o o o c. o o o o o. o og ga y v v v v v v v v v v v va
2 <u u ;_o m aa3 p*
ee,, (m t,'
s-au *d $o yom >m . . m n' ~su % S e C e o R O e e c i.
% M o 2 ; ; U U e,i
O R- ~ * W *oC<r s g. -. . . . . . .
42a -P 0 $ D w@4 F: $ 5 d ".< e * *;008 "
o : U k ?.a n k a m % o -.
- e=- m - -- - - .n< .9 g a <r Ea .
rnu
3,zooma eurz
E boo n n n n n ~ n , e n n -
3"3 g- $ $ 88 ? 8 8 8 ? 8 8 8 ( -D 1c o o o o o o o o o o o o3 ,
o s8 - +i +1 : u u u +i +i u +i +1 e u .EP 3 .o .3 2 * R R 2 R R A ;0 2 F: F: 4om o e o o e o o o o o o e o 7 -
o{p d 6 6 6 6 6 6 6 6 o d 6 4 {Dm
.ty! ;
<a >
rgo 7 3z a .l x *oM ee e n n n n n n n n n n - n i
t 88 8 8 8 8 8 8 8 8 $- 8 ~E~
}E o R E.8u W -
-
6 o' o o o e o 6 o 6 6 o o' 5-r a .o +1 +1 +1 +1 +1 +1 H +1 +1 +1 +t +l +1 4 4*
R S T $ $f , E0 $ 0 8 & Z D 4 S *b*8 o o o o3 y o o o e o o o o
Qy 6 6 6 6 6 6 6 6 6 6 6 6 6
% Eoo
78 -b te v
. - e o G -O * D D C Q hh5 m @ N U T U 6 6G - N ~a - -
7 0 ~.g
.7g s a e e m - e r-
_3. . . . . . ..'E '
to o 4 ** * ON m M &
Q** U E' D E#?E C4 0- - - - n,~
a N 4 * 4 E m o S 3 : D 6 3 mm - -
0 I '
-
3 12: = sewi 3 - E sviRONMENT AL MOMTORING CONSIDERATIONS; _ ,- _ . . . . _ _ . _ . , _ . , , _ . _ _ . , _ _ , . , _ _ _ _ _ _ _ _ _ . - . . ~ _ . . _ . _ _ . - - _ , _ - ~ . - -_

. . - . . - -. --. . _ . - - - - - . . - - - . - - . . ._ ,-
Duquesno Light Company1991 Ant;ual Radiological Environmental Report
= Table 3-9 Quahty Control Data . Contractor /Ouahty Control Laboratory Compamon Spht AirParti ulate Sampler. (gamma's !t
I-_
TABLE 3 9.
i
QUALITY CONTROL DATA l
CONTRACTOR / QUALITY CONTROL LABORATORY 1
COMPARISON SPLIT AIR PARTICULATE SAMPLES (GAMMA) -|.A
DLC + Contractor DLC - QCSample Date Nuclide
Ba 7 0.093 i 0.009 0.047 i 0.01'January
Others LLD LLD.
| Be 7 0,136 i 0.014 0.098 0.017
Others LLD LLOg
Be+7 0.074 1 0.007 0 086 i 0.024May
JOthers LLD LLD :|
Be 7 _0.138 i 0.014 0.103 i 0.026 !July -
1
Others LLO -LLD j_
Be 7 0.005 i 0.010 0.078 1 0.026 I
Othcts LLD LLD,
Be 7 0.100 0.010 0.075 1 0.031
Others LLD LLO_
(1) Uncertainties are based on counting statistics and are specified at the 95%confidence coefficient, I
LLD + Lower Limit of Detection-
.
I
!
.
!
Section 3. ENVIRONMENTAL MONITORING CONSIDER ATtONs 3-13
, _ _ _ - . . _ , . _ . _ . . . . . _ . . _ . - . . _ _ . - . _ . . . . _ _ . , _ . _ . , , _ . _ , - - , . . . . . _ _ . _ _ _ _ , _ _ _ _ _ _ , - . . . . . - - , . - - _ ,

. - . - . .- . . - .._ - .. - ~ - . . .. - . _, _
i'
Duquesne Light Company1991 Annual Radiological Environtnental Report i
,
Table 310.Quahty Control Data Contrattr,e/Ouahty Control Laboratory Comparison Spht Sr49 90Compo64tc Samples
i
TABLE 310 !
QUALITY CONTROL DATA ,
CCNTRACTORIQUALITY CONTROL LABORATORY !
COMPARISON SPLIT SR 89,90 COMPOSITE SAMPLES,
DLC - Contractor DLC - QCSample Date NuclideLab (1) Lab (1) ;
ist Quarter Sr-89 $ 0.0001 5 0.0003Cornposite St-90 $ 0 0001 5 0.0003
2nd Quarter Sr 89 5 0.0013 $ 0.0003'Composite Sr 90 $ 0.00014 5 0.0003
3rd Quarter Sr-89 5 0.00091 $ 0,0004
Composite Sr 90 $ 050016 $ 0.0002
4th Quarter Sr 89 5 0.00027 5 0 0004Composite Sr 90 $ 0.00007 j $ 0.0004 *
(1) Uncertainties are based on countiri0 statistics and are specified at the 95%confidence coefficient.
L
I4
1
31'4- Section l' ENVIRONMENTAL MON'tTORING CONSIDERATiuNS
- - . . . . - .- -- - .. . - . - _ - . . - - ,- - - , - . - , -.

- ~ -. - . . .. - . . - -
Duquesr.e Light Companys'
1991 Annual Radiological Environmental Report ii
Table 311. Quahty Control Data . Independent Laboratory / Contractor /Ouahty controt Laborainry |Companson Spa.ed Water Samples !
i.
1 ABLE 311 i
QUAlliY CONTROL DAT A i'
IND(P(NDfNT LABORATORY / CONTRACTOR /QUAlif YCONTROL LABORATORY COMPARI5ON SpikfD WAf f R SAMPLES i
US ample loentihcation Sampie independent DLC OC"Date No Analysts L ab (1) lati(1)g
.-
Sr 89 2812 2211 12.3 i 2.5' ;
S' 7) 18105 1911 .12.910.9' !,
2 + 91 53 311 1 131 7,110.2 5.010.2* 6J i 0.4'
*
CS 134 161 3 k0.4 1 5.2 N.T i 2.2 -
C$.13? $i3 ' 6.5 t 4.0 13,0104 5
2-5 91- | 53 312 H3 1150 1 90 9200 i no 12M i 29 !
Sr-87 16.211.5 15.0 i 1.0 92.511.1 .
Sr.93 10.410.5 7.6 i 5.0* 10.310.2 |
43091 53 313 1131 13J i 0.2 ?.i i 3.0* '?.912 ACs.137 *0.013.0 17.214.3 14.411.2
'
Co-60 14.013.0 11.714.2 15.5 0.6
4-30 91. 53 314 H3 1643 1 90 21YJ i 100 1628 i 65 ,
$r 89 18.611.3 14.014,0 9.611.3.3 r
Sr 90 16.211.0 12.011.0 11512.38691- 53 315 4 131 11.010.3 3.512.0* 9.510.2
- un.54 31.014.0 32.7 i 4,1 35.? i 3.6 j
Cs.131 1 T.01 3.0 17.114.0 21.6 i 1.6 ;6-6 91 53 316- H.3 - 1600 1 100 14001 17 1434 1 97
Sr.89 15.111.3 15.0 i 1.0 11.412.4Sr-93 14.311,0 11.0 i 1.0 a.5 10.8 .;
10 29 f 1 $3 317 1131 20.010.3 7.113.0* 12.710./* !
Cs.137 14.013.0 ifA i 3 9 16.015.6
Co fio 10.0 1 340 6.012.1 12.7 i 5.5,
10-29 91 $3 316 H .3 100 i 70 700 i W T60 i 80
~ (il uncertaat<es are Da$ed on counting statistics and are reported at the 95% conhoence coethc4ent.* See Sections 3 A 6 and 3 B.
>
$
:.
'e
'f
.
. Section 3 ENVIRONMENT AL MONITORtHG CONSIDERATIONS . 3 15
.

- - - _ _. .. -. . . _ . _ - - -- _ . - - - --_
g- >
Ig. Duquesne Light Company
1991 Annual Radiological Environmental Report,
,f, hte , ' '1 Ova 5ty Control Data Independent Latoratory Contractor'Ouahty Control L.iboratory-
p. Comparison Spiked Milk Samples .
. =>,
j? 1ADLE312f
1' QUAllf Y CONTROL DATAIND(P[ND( Ni LABOR AT OR Y/ CON T R ACT OR/QU All1 Y
CONTROL LABORATORY COMP ARISON SPIKED MILK SAMPLES
Sample idenhfication Sample independent DLC.QCDate No Anafyses Lab (1) Lab (1)g
Sr-69 10.2 i 1.2 7.314.0 C.9 10.9
S' WJ 12.$ 1 0.6 13.0 i 1.0 13.010.6 ,
t 131 19.010.3 17.0 ~+ 1.0 20.5 + 0.9 -
2591 52 25e %Ci 134 29.014.0 is 6 i 6.3 N.1 1 3.1
C5 13? 23.014.0 23.314,4 20.210.7K40 1420 1 90 1240 i 20 1257 i 04 ,
#
$<-82 17.012 5 1.C* 16.912.6Sr W 14.210.5 0.65 t 0.2' 13.311.20131 16210.3 17.710.0 i?.811.9
C s.134 10.013.0 t $.61 3,7 18.312.2,
Cs 137 12.013.0 19.fi i 3.7' 18.1 i 1.6
K 40 1220 1 90 1250 i 130 1240 1 64
$r-69 9.$ i 1.3 5 0.84' 11.6 i 2.0S' 90 it i 2.0 S 0.16* 12.410.6S131 14.410.3 12.9 i 0.6 12.9 i 1.0
84 91 $2-260- -,
Cs 134 12.313 12.113,7 1$ 711.5Cs-137 10 i 3 17.113.9 12.212.0 ',
- iK 40 1100 i 90 1230 1 120 1204 i f4 ',
St 89 12.012.0 13.012.0 1.0 i 2,4 .
.
Sr 30 15.0 i 1.0 13.011.0 10.6 1 0.9'
'
10-29 ~91 52-201Cs 134 11.0 i 3.0 10.714.5 12.7 i 6.0
C5-137 13.013.0 10.C i 4.1 17.017,1
K.40 1230 i 120 1284 i 141"
12 17-91 52-261 A -Sr 90 10.310.7 12.0 t 1.0 10.7 i 0.2
(1) Unceriainties are based on counting statit,bcs and are bned on the 95% confioence cWfoent.* See Sections 3-A 6 and 3.B." Not reportec
3 16 Section 3. ENVIRONMENT AL MONITORING CONSIDERATIONS

_ _ _ _ _ _ _ _ _ _ _ _ _ _ _ - _ . _ .____________-__ - _-________________-_ ___-_____ _ _ ___
Duquesne Light Conipany1991 Annual Radiological Environmental Report
7, Pennsylvania Department of Environmental Resources Program
The Pennsylvania Department of Environrnental Resourt es (PDER) alsoconducted a surseillance program in the vicmity of the site. Samples of an,river water. drmking water, sediment, milk, vegetation, hsh and radiahonrnonitoring . ire included in their program. Comparison of results also mdicatedagreement Detween the PDER Laboratory and the Duquesne Light CompanyContractor Laboratory.
|<
D. Evaluation of the Quality Control (QC) Program DataThe spht and spiked sample program indicates that the Contractor and CCLaboratory are generally performing satisfactors|y m accordance with * Criteria forComparing Analytical Measurements from NRC Comphanc e Ufhce." In addition, anindependent taboratory is used to supplement the regular program. Compansonsbetween the mdependent, QC and Contrattor laboratories are generally acceptableand demonstrate a satisfactory performance by the DLC contractor All media werefound to be in agrnement in accordance with NRC criteria as hsted in InspechonGuidance 84750-03 dated 12/04/90 with the exception of those media m Table 3 2through Table 312 identified with an asterisk (*).
Based on all available QC data and the data from the Contractor and QCLaboratory's internal EPA Intertaboratory Cross Check Program, the EnvironmentalMonitoring Prograrn for 1991 is acceptable with respect to both accuracy andmeasurement.
C. Standard Requirernents and Limitations for Radiological and Other EffluentsThe Beaver Valley Power Station is governed by rules and regulations of theFederal Government and the Commonwealth of Pennsylvania, Ettluent releases arecontrolled to ensure that hmits set by Federal or Stato governments are notexceeded, in addition, self-imposed hmits have been established to further hmitdischarges to the environment.
Beaver Valley Power Station is subject to regulations which include the Code of- Federal Regulations 10 CFR (Energy). Pennsylvania Department of EnvironmentalResources (PDER) Industr:al Waste Permit 1d473211, Gaseous Discharge Permit904 306-001, PA Code Tit |e 24, Part I, Ohio River Valley Water Sanitation
Commission (ORSANCO) Standards No.170 and 2-70 Environrnental ProtectionAgency (EPA), National Pollution Discharge Elimmation (NPDES) Permit 1:0025615 Fand the Beaver Valley Power Station Technical Specificahons. ',
1'
/ $, >
e
Section 3. [NVIRoWENT A1. McNIToRING CONCf der < ATQNs 3 17- - - - - - --- . , .

. ._ -. . _ _ _ _ . _ . . _ _ . . _ _ . _ _ _-_ _ _ . _ . _ _ _ _ _ _ . _ _ _ _ _ _ _ _ _ . _ _ . ,1
Duquesne Light Company1991 Annual Radiciogical Environmental Report
D. Reporting LevelsA report is required to be submitted to the Nuclear Regulatory Conunission whenthe level of radioattivity in an environinental samplinD medium exceeds lho limitsspecified in the Beaver Valley Power Station Tect nical Specifications whenaveraged over any calendar quarter. Also, when more than one of the radionuclidesare dOleCled in the sampling medium, this report Shall be Submitted it. ;
1i|Concentration (1) Concentration i2)
+ + > 1.0Limit Level (1 > Limit Level (2)
~
There were no analytical results of environtnental samples during 1931 whichexceeded Beaver Valley Power Station reporting levels.
||
1
i
|
1
l
1
:P
h
<
|
!
3-18- Sect *on 3 ENViRONVENTAL MONITORING CONSIDERATIONS
, . - . . . - .- -.-. .

Duquesne Light Company1901 A'tual Radiological Environmental Report
Section 4. MONITORING EFFLUENTS
A. Monitoring of Liquid Effluents
1. Descriptson of Liquid Effluents at tho Beaver Valley Power Station.
Most of the water required for the operation of the Beaver Valley station is takenfrom the Ohio River. and returned to the river, used for make ip to various p; antsystems, consumed by statien personnel, or discharged via a sanitary wastesystem. in addition, small amounts of well water and hquid effluents are
discharged to the Ohio River using discharge points shown m Figure 41.Figure 4-2 Figure 4-3. Figure 4-4 and Figure 4 5 are schematic diagrams ofliquid flow paths for the Beaver Valley Power Station.
2. Effluent Treatment. Sampling, and Analytical Procedures
See Tab!e 4 t
:
3. Results of Liquid Elfluent Discharge to the Environment
See Table 4 2.
.
vototor tsa Errtuens 41see.on4 u
. - . - . .. . . ._- - - -

_ _ - _ _ - _ _ _ _ _ _ _ _ _ - _ _ _ - _ _ _ _ _ _
!.
Duquesne Light Company1991 Annual Radiological Enveronnwnf al Report -
5
Figure 4l t.iquid Dir.ch.vge Points to Ohio Riv r ie
t
t
i
i1 '
f!Eg s!!! 5gI
's o
-
une ns v i,
o,# N
I i!- :
:- my - ,
lif ;,
{;5 ;' ', , -
:* ! 3 y f
1 .: :.
Id tag' 3111f C-
v. .a z rmt s. m
i!! ;i' lin'
!' ?- - \).~1 ,
w x
][Isigh{g;
-
'
m.
(h EI'...,
-11152
U- e; .__ r =-
IEEi: af . ,s
e*
' ,
. .
QIw ra E-3:{ Es!. E 'h .
c v--e
N :.a* -E3: w.54MN I*II N
$'s', - -
s. CIE fit -1. _v -
,
=g*. .!| !o .
Esga ;:a
c --
a. g | -1: --... *
3 a'
TA,.
,-
= nr : -
Dw -
_t).sw. n, ,.
s n _::=g |. -
8' ~ '
!I T ,E :, - v s .
65{ | J".n u{s,.=E
. -,W
i!!|,
m!'.-r. '
.
,
42: Section 4.- vowitoR;NG ErrtutNTS
4.. . .. . , _ . _ . , , - . _ , - . . . . . _ . . _ . , _ _ . , _ , . _ _ . __, . . . ,

. - - _ - _ _ _ _ _ _ _ _ _-__ ______-_______ -_ ____-_ _____ _- _ _ - - . _ _ _ _ . _ _ _ _ _ _ _ _ _ - _ - _ --_____ . _ _ _ - _ _ _ _ _ - _ _ ._
Duquesne Light Company1991 Annual Radiological Environmental Report
i
!
i .
4 2 Ur t 1 Water Flon 5 thematicF.gure u
3 '? ,'
If7=5 2 *2f |
-2
3 N88~$||!!i |==.s ,
7,,
Ir <
li1
1X - ,r
ii - = c$.. -
= - 1-
b. ;.1.
: : .5'l ;
a s ::: i-
1 : : C.r 8 : :.-
3 5 5 X 2 #3g. a a E I f- 1
,
- -
'a.- : : n ,'u-
'
.t . 2 7 .. . ,
.
g- -
> $ =c . c,.1It. . . .nA /3 /\ /\
4, : u-
1 g, -,
'g Wu {E E '-++ --
a 8< hgm .--&4-
=l:y ..
4 5-.= .c.
. n w. ~
> i 'h '
- -e r.v,. , -_
; y s.s
.h h W '
D '
- -a e a aM- 1 a
h; J h E, $ $ ~
1:_fx == -x - > a. : .-
a = .-
e m' = v 5 :.
::a =-
n'-
'"
$2 I d.9 $"
' , , , - = ., ,
.... -- t ,
dj 424'.I N ;-e -
at .j "'
-. m..g w n. y3- .- e
' 'W /( (I $ Y $
g
@p '-=-
.os. > $.itb ,s , m
'S, m' n *g- + R,w
5 5 t E, _: re
'N '
A h 2 **. 5
' l: No 5. _w .3 *
3.
<- x .1w|-5 - 3: 3 < u >
'I :.W- I | 3 k3
.- ,
Lj y!, | [- ]'
#3 d
,, ,, ,, u ,,c
3 3 ^ / b' O / H () '
,
_ sect on 4 voNiToroNG EFFwE*d s 43__..:_ _ . _ _ - _ _ . . . . . . . _ _ . . _ . . _ _ _ . . -.a._._-.__..._ , , , . _ _ , _ , , , _ _ . . - , , , , _ _ . .

_
._ . - . - - - . - _ . . . .- . - . - . _ _ , . . _ _ _ _ _ . _ _ _ _ ,.
1i
D'Jguesne Light CompJnyi
1991 Annual Radiological Environmental Report |! |
|
T. gyre -. 4,3 Urut 2 W iter Flon $( hematsC
't
Av ~g-
=h=#5f5$'3
.I-=
e pt" A
5-
A
7:3r !! .g e-
*
i
S~
b5 :gu
=> 70 |n G2
y if i
$ .O a-
>
g- =. .
*v.
e .; r , ;-.
I i Nw - a f a # w
O"
~ 1E ~.
e ga .c eg B: .:- : s e
A A AA /\ $E2- s ,
'$ k h'
NI ZO . .
$. ~I"
8 (Ei ~ (a g '*:v : e.
f h 5 (" "w.
-i 3 s y~g .
= i 1 s 1 _8.
! k E S '- ..._
a t.-t E. W- s: c
2I-
t' Ys-
. s .
E C. -
. - -,W 5 =
| . E-|w *
.
~7 . g.
$*s, v - s/ sr
NJAlh O/NQ
4 41 Section 4 . MONITORING EFFLUENTS '
-, , - - - . ~ . . . . . _ , . . _ . _ _ _ - - . _ _ _ _ . _ _ _ . . . _ , _ _

|
STREAM STREAM FLOW COLLECTIOti, T R E AT M E N T. C. DISCH A RGENo. RATE 8ves-2 A
C00uNG EI. CONT $Uup 40gpo TOWER S
HIGM -LEVEL L10010 EV APOR ATOR g(QwDowg2. AUK BLOG SUMP 200GPO WASTE 6 GPM *AITE IEST- 7.4 00 0 * u . [0R AIN S E VAPOR AT088 "O GPu'
3. L A8 DR AINS 400G70 TAHMS (2)- TANN$(2)
}3,000 G A L 3.0 0 0 G A L
h [4 R.P. S A uPLES 35GPO 8 |
*
JT0*ER ES. MISC. SOURCE S 660GPO a. Slowo0* N 9
LO w-L EV E L i3,000 cpu $6. MISC. SOURC E S 40CPD
OR A HS 30 GPM*
"g*
7 5G PRE FILTER 1LJP0 * 4 M S f 21 B M -lb2 ~_#,,
8 ACK WASH 2000 GAL CC NEg
50 GPM P0 TNT } 3
BORON hoTEST xg
TANKS (2) b cCL o
t4,500 CAL 5w5bcRC, ucPU Rt FIC AT ION C5 IO re Sonow 30 stare - r
t. CVCS LE700wN 60GPu 40N E XCH ANGER 500 # EECHANGER REC 0%E W [ VAPOR ATCPS(Z) '" ~*
18 vP S -1) DEG A SIFIER ISQPW 3 0* T A Nu s t:) *=
195.000 59/H# '
G4L c :a=
8vPs-2 35PURIFsCA f s0N C$ 30N IIEAM O -[CvCS LETOjWN IO N E R CH ANGER 500 * CECM ANGEp GENEWATOR 3S- 6 0 G,M
.,(8vPS- 21 - ~ c[ GAS Fits SLO *DowN s-
-
j / en E VA P om AT OR< g _ F.n
e O3 10. BV85-4 TU R 8tNE 7. 2 0 0 G P O NO COLL ECTION OR TREATuEnf c,
8 LOG ORAIN$* ~
DISCHARGES TO SVPS-1c E NviR o n u C N T3 COOLING TOWER1avPs-i rAa0[3 OR aiNe.c E BLOWDOWN ATIO EtJVIRONMENT? DISCH A9GE point)
5;"
FIGURE 4-4 - UNIT 1 LIQll10 WASTE SYSTEMct vi _.
3
Pu, .
. . - . .

- _ _ _ _ _ _ _ _ _ _ _ _ _ _ _ _ - _ _ _ .. . _ _
Duquesne Light Con'pany1991 Annual Radiological Environmental Report
F'gwe 15 Un. ? L uwd Wcate 5, stem
2 3g a
NfE O Or wQ*
". OJg 3 OO t E# O O O O be g ~. ' N. O.W
o o 2o00o e. a r a aw yV w4r*o =dar- 2o .
0 u0t o. m 2 ,
9" N O''e
3" "u u O ua=n >u> ~ I Z*m o 3** a tr) -
') & >0 N 29 h d
F w-. 9.-O
g .a: > <tw o 00"m*"w"m, o wpZq z o
H 4 O fy# O -
$$ 20 0* 4 4-* zy at Z o-
& E 6 IU3$ 55' 0 0o xe- 2 90 J w
4 -
|Ow *-fso OUmI mo nu
~> Z>.
$ $ $ z Nuo M M wdM W>=E QC 2 ,~go a0 wo2
w- a z 8L . erg- M4 o og C - 3
WE o -4 O Q, ,5O N Z ==mSW y
K DE > OW 9p w M24 ] w WW L 3 NC' 2
- -4pW >=
* a2 .J H -.
E * O o Eg g
*$ qO ,2 OF 2o <a . -Z o-
. ,0 - , Wo W 5 O OW E <
h" hg
MhD I O q nzo gJ ga u&<w e m I NoO >>w -
w Wsu mww .h 5t-
O JQ U
m
O 6%
O O O O O O O3W A CA 4L w a a "QF o o u o o o.J 4 O O O c O n
h $_ $kE ? ".n
N N>?.
E m W2 W O 2-
NEE & g w' m eW* Qm TO4 3 3 J z
D"W D 0 O E m,4 oO m 3 g Hy gV @ A $ 0 ww "66 e% o 2; aem 2 - - -.O 3
~ .. 4 o- >b2 w a un omu 4
24 .y@ * A d 4 d i AHto
46 secon 4 vomicaiNo EFFLUENTS

_ _ _ _ _ _ _ _ _ _ _ _ _ _ _ _ _ _ _ _ _ _ _ - _ _ _ _ _ _ _ _ _ _ _ _ _ _ _ _ - _ _ _ _ _ _ _ _ _ _ _ _ - _ _ _ _ _ _ _ _ _ _ - _ _ _ - _ _ - _ _ _ _ _ _ _ _ _ _ _ _ _ _ _
i
Duquesne Light Company |1991 Annual Radiological Environmental Report |
Tabte 41 Effluent Treatment, Samphng and Analytical Procedures Beaver Valley i
;
,
I TABLE 41
EFFLUENT TREATMENT, SAMPLING ANDANALYTICAL PROCEDURES - BEAVER VALLEY
4
Treatment, Sampling and/or Standard and/or Analytical"'"' YE' Monitoring Procedures
Steam Recycled or dirActed to if discharged, proceduresSystem Radwaste System for adhere to TechnicalBlowdown discharDe- Specifications-
Radioactive Effluents shall not exceed Procedures adhere to .
Waste values specified in the requirements of TechnicalTechnical Specifications. All Specifications.dischar0es are performed inaccordance with the OffsiteDose Calculation Manual(ODCM). ,
,
,
Table 4 2. Results of t.iquid Effluent Dir, charges to the Environment Beaver Vat!ey
TABLE 4 2,
RESULTS OF LIQUID EFFLUENTDISCHARGES TO THE CNVIRONMENT BEAVER VALLEY
Effluent Type Results for 1991
Steam System The Steam System Blowdown was recycled.Blowdown
Radioactive Routine planned releases of liquid eftfuents from theWaste Liquids Beaver Valley Power Station were released in accordance
with conditions noted in Section 3/4.11.1 of the TechnicalSpecifications for Units 1 and 2 and no limits wereexceeded. These values have been reported in the BeaverValley Power Station Semi-annual Radioactive EffluentRelease Reports for 1991,
section t MON!TORING EFFLUENTS 4*7_- __. ,_ _ _ _ , . _ _ _ _ _ _ _ _ . _ _ _ _ _ _ _ .. _ .._. _

- _ ._ __ _ _ _ _ _ . _ _ _ . _ - .._ _ . _ . . _ _ _ _ _ _ _ _.
I
Duquesne Light Company1991 Annual Radiological Environmentat Report )
;
B. Monitoring of Atmospheric Effluents ;
,
1. Description of Atmospheric Effluent sources
Beaver Valley Power Station (Umts 1 and 2)
The Beaver Valley Power Station identities isotopes according to the Technical '
Specifications and Regulatory Guide 1.21. Prior to waste gas decay tank batch.
releases and containment purge releases, an analysis 'of the principal gamma |emitters is performed. The principal gamma etnitters include noble gases,iodines, and particulates. Figure 4-6 shows the gaseous radwaste sustem atBeaver Valley Power Station.
The environmental gaseous release points also require specific nuclideidentification. These points include:
a. Unit 1 Release Points:
1)- The Ventilation Vent located on top of the Unit 1 Primary AuxiliaryBuilding.
2) The Supplementary Leak Collection and Release System (SLCRS)Vent located on top of the Unit 1 Containment Building.
b. Unit 2 Release Points:
1) The Ventilation Vent located on top of the Unit 2 Primary Ausiliary fBuilding..
2) The Supplementary Leak Collection and Release System (SLCRS)Vent located on top of the Unit 2 Containment Buildmg.
3) The Condensate Polishing Building Vent located on top of the Umt 2 '
Condensate Polishing Buildmg.
4) The Waste Gas Storage Vault Vent located on top of the Unit 2 :
Decontamination Buitding.
5) The Decontamination Building Vent located on top of the Unit 2Decontamination Building,
c. Unit 1_ and Unit 2 shared release points;,
1) The _ Process Vent located on top of the Unit 1 Cooling Tower.-
These points are continuously monitored for- particulates and gases. Grabsamples are obtained on a weekly basis and are analyzed for noble gas gammaemitting isotepes and tritium, Weekly continuous samples are obtained on fitterpaper and charcoal-cartridges. The filter papers are analyzed for particulate <
gamma emitting isotopes and gross alpha. Composites of the filter papers are' analyzed monthly for Sr-89 and Sr-90. The charcoal cartridges are analyzed for,
1-131,1133 and 1135.
Figure _4 7 shows these gaseous release points.
48 secton4 ucNITokiNG EFFLUENTS ' ,
_ _ . _ _ _ _ _ _ _ _ _ _ , _ _ ,-
-
, _ , _ _ --

_ . _ . . _ . _ . . _ . . ._. _. ._ _ ._ _ . _ _ - _ _ _ _ _ _ - . . _ . - _ _
Duquesne Light Company1991 Annual Ractiological Environmental Report
Figur e 4 6 Units 1 and 2 Caseous Rad 4aste System
e
e' 4 ,
<INfdtYo ffY~
10 atmos &tu
I J 1,,
(M bu' ' ' '
,,,, , ,,,, ,
ftDiL1D$ Wl W5
k_ *
Court 15 tot (MrkulM -
-m, , , ,, ,
I t
SUME164f' '
letGt 16*
CmeKMLBG
, _
' ~
r. . . .... gig j
- f Heat 16e" '
'
meKmL so
i_ ,_ i :t i ;
makest 3D
HCat fee f ,
C _ -) _ ,_ ._.
: tMCatiM HCatIw I l
OilLIJIB '
fILttIBn90 Cat I M HCat i w *
*.
,
MCat f M HCat !n*.-
0 Is.g . .
,- ,pS ..
~
Hlaft m .It DUm
thOrVWM WLf15
Co H .it i ,Cf ,n-"*"""
noi fim amita nai .Q--
"O~' ' " ' ' " " " ' ' " " " **C-
iterFIGURE 4-6 - UNITS l'AND 2 GASEOUS RADWASTE SYSTEM
sect,on 4. MONdORING EFFtupas 49
- . _ _ _ _ _ _u. ,. _ . - _ . . _ _ _ , - ... ._ _ . _ ---

i
Duquesne Light Company1991 A inual Radiological Environmental Report
rigure M Unos i and 2 Cneoss helease Pcunts_ _ _
Ohio N'*"'
CN N Q W u i7-
.'.
_
O| |i .A
'
s'
x/e ex p. -mN -. - r
*
Tq, ,
l
-. > ec j_ unit 2e
/ Unit 1 | 1 ~~lm s
0 &a_-
,
i
UL1151 '0!If & ItSCRIPt!3 IUfat!05,
' >
1. Unit 1: Ventilationtent 79 feet: 24 w ters N2. Unit 1: Containust/SLCt: Test 154 feet: 47 u ters3. Osit 1 & 2: Process fest 475 fut : 145 meters [14.Dait2: fentilatter, inst 05 feet: 16 meters 17'5.Delt2: Centainment/SLCISfeet 154 feet : 47 meters D6. 0 lt 2: Condetsste Poliding Bollding init 80 fut : 24 wters7. Unit 2: VasteGasStoragefanitfeat 80 feet: 24 meters6.Usit2: k contaaliation h ilding Test 50 feet: 24 noter
,
FIGURE 4-7 - UNITS 1 AND 2 GASE0US RELEASC POINT 5_
4 10 secon 4 vomtomso ruwtsts -
- _ _ _ _ - _ _ _ _ _ _ _ _ _ _ - - _ _ _ _ - _ _ _ _ _ _ _ _ _ _ .

..__-..____..__m._._.__._.____________..
Duquesne Light Company1991 Annual Radiological Environmental Report
2. Atmospheric Effluent Treatment and Sampling
.
. Beavet Valley Power Station (Umts 1 and 2)
Radioactive gases enter the gaseous waste disposal system from the degasifiervent chiller of the boron recovery system, and are directed to the gaseous wastecharcoal delay subsystem upstream of the overhead gas compressor where thegas is chilled to condense most of the water vapor. Gases from the degasibervent chillers contain primardy hydrogen and water vapor. A small amount ofnitrogen - and radioisotopes consisting of noble . gases, particulates andradiciodmos are also present in the eight continuous ventilation system
pathways.
The overhead gas compressor directs the radioactive gas stream to a gas surge ;
tank. Gas is periodically transferred from the Unit 1 or Unit 2 surge tank to oneof the three (3) decay tanks at Umt 1 or one of the seven (7) decay tanks at Umt
,
2. After the decay tanks are sampled and authoritation obtained for discharge. -;
the flow of the waste gast' from the decay tanks (2 sctm) is recorded and,
tapidly diluted with about 1000 scfm of air in order to dilute hydrogen andradioactive effluent concentration. The gases are then combmed with nitrogenpurge from the oxygen analyters, cahbration gas from the oxygen analyters, themain condenser air ejec|or exhaust, the containment vLcuum system exhaust,aerated vents of the vent and drain system, discharge of the overhead gascompressor and the purge from the multi sample point radiation mnnitor. Themixture is then fjltered through one of the gaseous waste disposal filters, each .
'
of which consists of a charcoal bed and a high efficiency filter. The filteredgases are then discharged by one of the gaseous waste disposal blowers to theatmosphere via the process vent on the top of the Unit 1 cooling tower. The
.
radioactivity levels of th'e stream are monitored continuously.
Should the radioactivity release concentration of the stream go at:ove theallawable setpoint, a signal from the radiation monitor will stop all flow from the
,
Unit 1 or Unit 2 decay tanks being discharged.'
,
During a shutdown period after the Unit 1 or Umt 2 containment has been,
sampled and the activity levels determined, purging may commente through theVentilation Vent located on top of the Auxiliary Building or the Supplementary |
'
Leak Collection and Releaso' System (SLCRS) Vent located on top of the Reactor 6
Containment BuHding or the Process Vent located on top of the Cooling Tower.
Areas in the Unit 1 Auxiliary Building (subject to radioactive contamination) are,
mc.mtored for radioactivity prior to entering the common Ventilation Vent. These,
individual radiation monitors aid in identifying any sources of contaminated air. I
!: The Ventilanon Vent is also monitored continuously by' several redundantchannels of the Radiation Monitoring System (RMS) and is sampled periodically. ;
Upon a high activity Plarm, automatic dampers divert the . system's exhaust air '
'' ~
stream through one _of the main filter banks in the Supplementary LeakCollection and Release System (SLCRS) and to the SLCRS Vent. ,
sect.on 4- voNiromNs Urtuu4Ts "4 11-_

..
- - _ . _ _ _ _ _ _ _ _ . _ _ - . _ . _ _ _ _ - - _
Duquesne Ught Company1991 Annual Radiological Environmental Report
Areas in the Unit 2 Auxihary Building (subject to radioactive contamination) are- monitored for 'ad,Jactivity prior to entering the filter banks for the
. Supplementary Leak Collection and Release System (SLCRS) Fant. Tins system'
is samp?9d penodically for determination of radioactive material and is
monitored coot;nuously by other channels of the Digital Radiabon Monitcrmg .
System (DRM.5 ).
Each Unit 1 and Unit 2 futer bank consists of roughing filters, charcoal fdters.andc pleated p' ass liber type HEPA filters. The roughing hiters remove targo; particulates to prevent excessive pressure drop buildup on the charcoal and
tiEPA litters The chaiccol filters are effective for radioactive iodino removal andthe HEP A fdters remove particulates ano e.harcoal fines.
:Release poir-ts f or Uni! 1 and Unit 2 of the Beaver Valley Power-Station are
- showr, in Fqturc A 7.>
See Table 4 3 for Radioactive Gaseous Wasto Sampling anu Analysis Program.,
i
!
|
|,
.
.
!
s
f
l-
L a.
o ;
I
c
1
'
.
!
..4 12 section ( vomvoamG EFFLUENTS '. . .
-._

t 4
Occc@go rgE @= *o3 cCE [Eg_j O m5[ $E u yo -e - o
.
eS 4'" m> g X:<* 9 @,5 Ee csjr2 $I3 y? bnwT_
_
___
_.
__
-
_
_..
.
* 6 4 4 4 G 1o.
) 2
c 0 0 0 o o -
' " " 0 6ce 1 1 1 t t 10 0 0 o 0 0 o
-t1 1 t 1 1
C r s x = a s .
n _a e n a = _4 ._I 1 1 1 1 1 11 1 A 1 1 .
_
'
|^- -
s,sa a a a
_a
m m m1.o
mms.m . ar
m m3 Gmtsa. -
_a1 saa a t a 0-Y
. m L G G .G, G( h 9 wGa A a p- adl rr N a
l
ta$ a s la S- Gna )g ^A p ,, p p e- pe re s 9, e
r s at so o, o, ot 1 3 ot la
, t
arP m 3 m 3 me 3 3 3 memhr t
o 4 t tm - 1 1 r r oe- -r r r
. s P H P H PE H 1 1 P E O. G S NBi
- -
s"y
lanAd e en
talu o
t
a a _Y e lu r
- E lp mi
t ni_
g * C e # c cm N it
3ip
t
e d , r rU P P - t, W m wS g a O a oa4 ._
m Q -_a P P M .
t
W la a te t a
E a S e e sL EB - S
kR n t
s
Gs s -A e F a e eT P o d ol olt
T s c c pp pplb 3
ea hd
ra
i
mm .mmt
W c rh a oa oa o
.
as E E C P CS .CS Nu %o |ies
.aeGlp c
eiv
- mY' a
c G C S blet
p+a I N b m
N ao. LE a G a
r w
d PU P r P SMQ G baR e b 's 's 's 's 'sAE k g a u u u u u3 R n r r o o o o oF a u e G u u u u uT Pl p * m m m m m
h h t t t t t=c cm m
e n n n nb o o o oa aaE ES M , C C C CO
t ;
-tn n h 9
V n g h n id st-
e e s t
anE .
P k i d o e Bsa e- n e a* B" n.
Get sm l Pn n s V VSY eUT aT d o t t
m o% c t to nn x '" n g c '" slOE Ge e s uu old e aES m' ta mr oePCV A Y' CB D V' WV
aSA ega a e l
ie .
tAE s r g tns. b c d e_ f
t tnGL ao rou ey a . . .
tE WS CP VSR1. '2 3
.
{:3 F COzaOEzO 7 DCmZG N-
i i4|1 iI < ;j i i:!| ji! | i 4 d , * ~ < 1 i 4
-, _- . . _ - . . - . . - .- - - -- -- .~ .-_ _. _
Duquesne Light Company1991 Annual Radiological Environmental Report
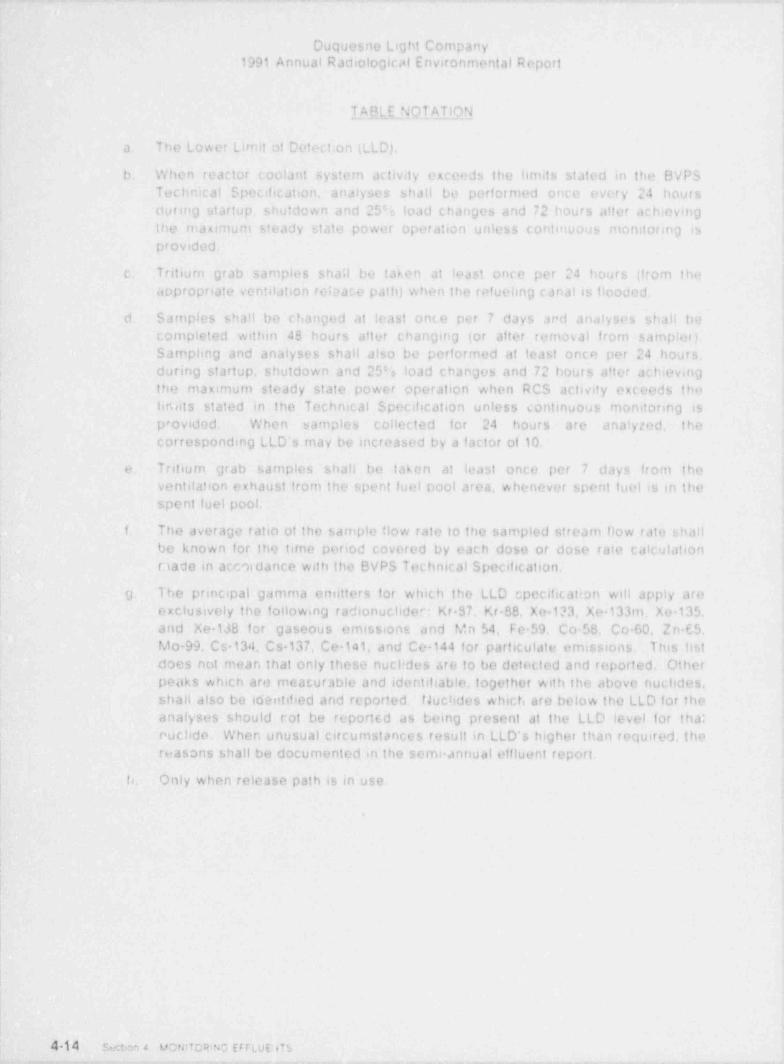
T_AILLE NOT ATION
a. The Lower Limit of Detect;on |LLD),
b. When reactor coolant system activity exceeds the hmits stated in the BVPSTechnical Specification, analyses shall be performed once every 24 hours
,
during startup. shutdown and 25'e load changes and 72 hours after achievingthe maximum steady state power operation unless continuous momtormg is
Iprovided.
c. Tritiurn grab samples shall be taken at least once per 24 hours (from theappropriate ventilabon release path) when the refuehng canal is flooded.
d. Samples shall be changed at least once per 7 days ar'd analyses shall becompleted within 48 hours af ter changing tor af ter removal from samples).Sampling and analyses shall also be performed at least once per 24 hours,during startup, shutdown and 25% load changes and 72 hours after achievingthe maximum steady state power operation when RCS activity exceeds thehnlits stated in the Technical Specification unless continuous monitoring is,
' provided. When samples collected for 24 hours are analyzed, thecorresponding LLD's may be increased by a f actor of 10.
e. Tritium grab samples shall be taken at least once per 7 days from theventilation exhaust from the spent fuel oool area, whenever spent fuel is m thespent fuel pool,
f. The average ratio of the sample flow rate to the sampled stream flow rate shallbe known for the tirne period covered by each dose or dose rate calculationriade in acreardance with the BVPS Technical Specification.
|- g. The principal gamma emitters for which the LLD cpecification will apply are| exclusively the following radionuclider: Kr 87, Kr-88, Xe-123, Xe 133mc Xe 135,
and Xe 138 for gaseous emissions and Mn $4, Fe 59, Co 58, Co 60, 2n-65.Mo-99, Cs 134 Cs 137, Ce 141, and Ce 144 tor particulate emissions. This listdoes not mean that only these nuchdes are to be detected and reported Other t
peaks which are meacurable and identitiable, together with the above nuchdes,'
shall also be identified and reported. Nuttides which are below the LLD for theanalyses should rot be reported as being present at the LLD level for thateuchde. - When unusual circumstances result in LLD's higher than required thereasons shall be documented in the semi-annual effluent report.
h. Only when release path is in use.
,
t
,
'
,
! 444 - Secdon d VONIToR:No EFFLUENTS_ _ _ - . _ . _ - . . . - _ . _ - _ . _ ___ __ __ _. . _ . _ . ,_-

_ _ _ _ - - _ _ _ _ _ _ - _ - _ _ _ _ - _ - - _ _ _ _ - - _ _ _ _ . _ _ _ _ _ _
Duquesna Light Company1991 Annual Radbo0ical Environmental Report
3.. Results
|Beaver Valley Power Station
|
Gaseous effluents from the Beaver Valley Power Station were released in |':accordance with conditions noted in Section 3/4112 of the Technical
Specifications. No limits were exceeded. These values have been reported in |the Beaver Valley Power Stahon Semi Annual Radioactive Effluent Release !Reports for 1991. t
C. Solid Waste Disposal at the Beaver Valley Power Station
.
During Beaver Valley Power Station normal operations and periodic maintenance. ;
small quantities of sohd radioactive waste materials were generated such as'contaminated rags, paper, plastics, litters, spent non-exchange resms, and
misce!!aneous tools and equipment. These were disposed of as sohd radioactivewaste.
-The services of offsite vendors were used Ic se0regate. incinerate, andsuper compact the waste. . At the Beaver Valley Power Station, the compactabln i
wastes are segregated and the capabihty exists to cornpress the waste m SS gallondrums to minimize disposal volumes. The waste is sinpped for disposal at a
,
commercial radioactive material burial site licensed by the Nuclear Regulatory |'Cormnission (NRC) or a state under agreement with the NRC. No radioactive waste
rnaierial is buried at the Beaver Valley Power Station site. *
t
All containers used for packaging, transport, and disposal of radioactive materials -
met the reqmrements of the United States Department of Transportation (DOT) andthe Nuclear Regulatory Commission (NRC). Shipments offsite were made m
accordance with DOT and NRC reculations. Figure 4-8 depicts solid waste handling >
at the site.
'
At Beaver Valley Power Station approximately 6,155 cubic feet of radioactive solidwaste was' buried offsite in 1991. The forty-sin (46) shipments contained a totalactivity of 1080 curies.
,
' Industrial solid wastes were collected in portable bins, and removed in an approvedoffsite burial ground. No burning or burial of wastes was conducted at the BeaverValley Power Station site,
;,
.
E
5. con 4. NoNITorvWo UFLUENis : 4 15 -_ - _ _. _ . . _ . _ _ _ _ - _ _ _ ,_ _ _ _ _ _ ~ _ . _ . . ~ _ - , . , , _ .

.. . - . _ . .-. - - . _ - _ .-
)i
Duquesne L%et Company |
1991 Annual Radiological Environmental Report
Figure 43 Solid Wwe Disposal Osagram i
!
!
!
,
;
!,
N A010ACT Ivr stRID wa sTit U 1S I'05 A L,
i .in 5 /
Misc. Radioactive Compactor and 1 -:, |_, .
Solid k*astes Druccing Station y i,o .,- + =
*' 53'On 0030' .g.itadioactive Waste Sludge Solidify- _, 5 'a.Simee 1 Evarcrator ine Station .2 j_
w- sSpent Radioactive Special Shipping n
Resin Casks & Containers_ _
cg -){ '
& ,;;
O O " nef0'O' 3:3 1,
4"
. FIGURE 4-8 - SOLID ,lASTE DISPOSAL DIAGRAM
:
o
e
I
e
4 16 seeon 4.' uoNitoRiNo EFFLutNis
x , -- + , . . , , -,-~..,,,y .m_~._ v,-, __,.r,mv .-. y... . . - - , _ r ,

Duquesne Light Company1991 Annual Radiological Environmental Report
Section 5. ENVIRONMENTAL MONITORING PROGRAM
A. Environmental Radioactivity Monitoring Program
1. Program Description
1 he program consists of monitoring water. air, soil, river bottoms, vegetation andfoodcrops, cows milk, ambient radiation levels in areas surrounding the site, and'quatic life as summarized in Table 51. Further description of each portion ofthe program (Sampling Methods of Sample Analysis, Discussion and Results)are included in parts 5-8 through 5-1 of this report.
5-8 - Air Monitoring
5 C - Sediments and Soils Monitoring
5-D - Vegetation and Foodcrops
5-E - Cows Milk
5-F - Environmental Radiattor, Monitoring
5-G - Fish
5 H - Surface, Drinking, Well Waters and Precipitation
5-1 - Estimates of Radiation Dose to h 'n
,
sem 5 ENVIRONMENTAL MONITORING PROGR Av 51
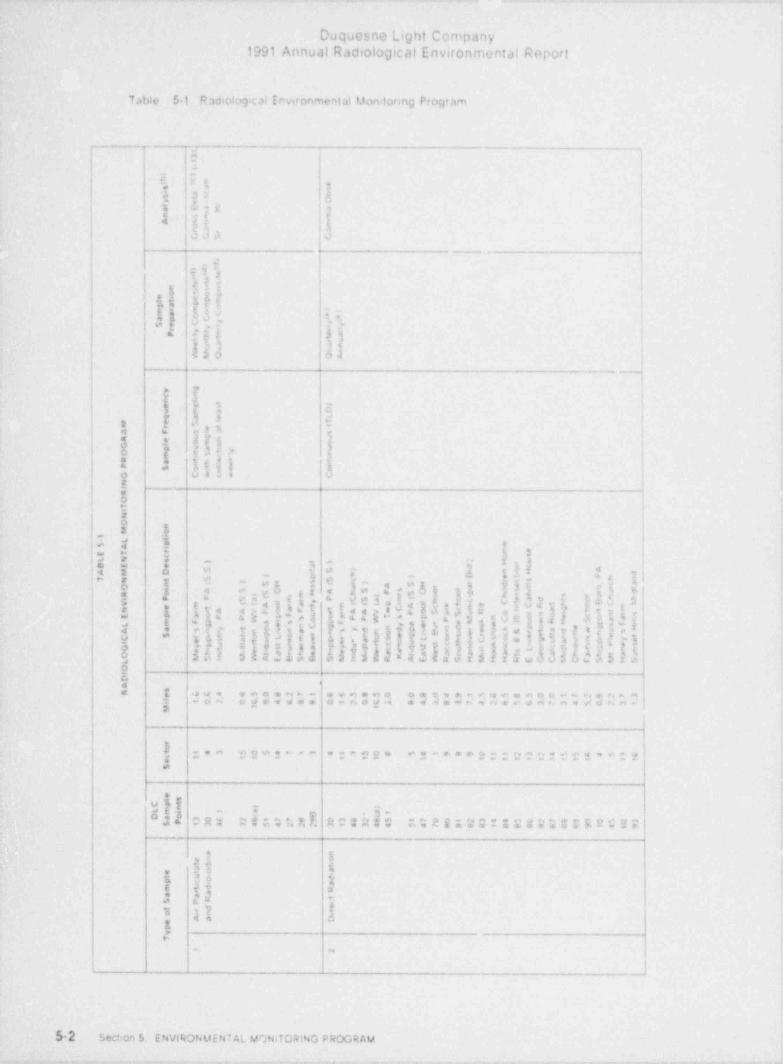
. _ .- _ .- . _ - _ . . _ .- _._ _.- - - . _ _ . _ _ - _ . _ -
:,
t
Duquesne Light Company |1991 Annual Radiological Environmental Report t
i!
. . :Tablo 51. Radiological Environmental Monitoring Program
.
+*
a.
5 I
.. .a !*, 1.
F. % $ ~!t in 8 1
s asy *= .t t4 $i E
03a J '
6 i
4'
6 'f 3i3eg iA7
b Ea('E5 [Nv ::,
ag uty 1- 3L it4 i}
$h 3 j- i
F.>
I 53 E o t 16
i- t 'a = ,
5 't. SE6' {(35o [
$ i f .? '$e
I E Io vs.4 v
.E !=
1 -
O-
3. $ '?
I :( l' r )t h
,w ~ .E; .5 : - x *- U 2,5) 2
2 -
4 s o *e a jg C - 1 7 a -
(. y-g C g. , , pg;
! { f,
li4E3Iji }llj"e - 6182 f }55[$537 [[g1
p . es;l D Itth si
iQ i y I h H )5I tih, 3113'j!! $31:s i
su s!!u!! mm)4[32:'
i 3iii ia n s n aa nia l n:l Hlif e s ,{1g t as
oOat
~
'588 E se e, g, e e e, e, q *d e=a. ww e at o .eeeeme e to e e e o o e *= e4 e c4 x M
agese o' - c ogd e 4 A e n d n a d o e n u m w d e'esn ~~ -ong
I'" 0 2 ". 3 ** * " '!*O?" "3*****S;;UOUTTOT**OTe :
9
. k k, h"Ed ORT EI;4hMb RCTRfC G 4 A S & 0 2 :' % 'd 3 R % 2 0 R 2 0 S E'
,
i
5as 5 t..a C4 .%e r2-E EE j
ll. 5*
xC
- .
..5-2 - section si ENVIRONMENTAL M7NITOatNG PROGRAM
. _ . . . , . . _ - - . _ . .- .____.2.u . . . _,. . . _ - _ . _ . _ _ _ _ . . . _ , _ . _ _ _ . - _ . _ - , . - _ =

_ _ _ _ _ _ _ _ _ _
Duquesne Light Company1991 Annual Radiological Environmental Report
- n - . . - , - - - . - . .
$'
r-
:5
,F
m
* s 4 ., 4
I . { .s'L i $*
{ Y "' > fs ]I O j 13e ? 10 4 4 s 1 4 e# ?t
| >4 3 . ,I(} - 0wA i d4 t . Cg 2
i et o
,- --~k+'
l_ . . _ . ,
i3 .,
" 3 ] . *
J. ,,C ja *o je
g $ - **, ,a, ,
n, " a t" :. T :f
.
( 4,' 7+ (t 5%.
; e ig t4 - 1,
/y , v'* / ? U 4 Le e,
y|5 j. ) s . j ' '*,
if I, } I 'i k [I ia< va o a : v: 3
- t. .
~,* * L *. a e $ ,.
' b Iq *e
f. C' * * +? ~ $ #y3 *- e o 9. n
ar e ?7 ,
.3
# }-4 w * *
0 E 5 hC2 O V '. -
p'sc r F* . ,3 *o1 - ,, o
?m .O t 4f3 , * ' 8{ ,9 -E
t .iA e 5 4t1 I- -4 -~}a ,
s 81 9 2
o u 1 & vev cut o _v >R- 4 W- + e
Ot#0$ b
{ .* LL J k.
- = , 7* 5 ?D 4 . T# . ~
*. '
pw b
z. %*
f_ %'
4
.E e,-
g h 'w' q - Z,,e o - _ . ,g g - # og q
U .7 5,b ' , ,2 .?, , , .to . ,b }s l u. 5 ), T. +1 w
.. m s,
> t t a- ;
se. r. a F n- g 2e o- +4 . I c., , s og a sz .. v g .
v . m, , xj-.D ? c l- ? e o.A
*4p 6.- g, e -. e n$@ 3.iP o\ ,3. *. .
b t . , ,4 9 g4 t 7*a= * t v
* t t An ; ! sen <g
Y.: e.i ? $ (4 g; {."
B ' 7. 4 S} era.+ t r6 Ea rv t. r , 1-
3 '
1-
* 5* *> t1. I $s %6. t 6 ".s[ 4
w, 2 do /r + su-v,,7 4oo .&s&6 v :t 0 t u d u_ J - 4 .a 463. us
ob<8ed [ g e- w N * ae-m Nwm-6 . o e ew e4 e 4 wmo e e cn . e m . N e. e. m .i ~ .e. .- a a m <; o .: +a. - ..,a
- .- a'=2
_ (B- o-nmn..e .~~ ~ . e c, . . .m7 ;. . p - ., . ..,
.M
4s. -
uay 3 ..~
* * *E R E I,' C*EPRERERT e. 7 e. 0 A c O*TO.
e9 g
_
.* g ta
b 37 s i
.! ' ,( $ $e . - f
h-6 o a ag
=>
t's M g vn
Se@on 5 ENVCwWEN f AL MONO CiONG PF<OM Av 53_ ___ ._ ___ _

__ _ _ _ . . . _ _ . _ . _ . . _ _ _ . - . _ . . . _ _ _ . _ . - _ _ -
Duquesno Light Company1991 Annual Radiological Environmental Report
-
!..*
!-
$* 3.,I ( I$ .
*5 % % %+ +~r % % i.1 % %' Ag'
-i !$Uz !a3 (E $ 't. 10,
Sa! ?* *
%
;1 li{ j55 !* !!ijsi sBj it 5 Ii ojs! - 3+!5 P .s .s o> ow0 sae - we- -,
ee s -
g ? P2 4 4 i ( * 3
$h,
,fIt *p g 12$.r a ! *01 " *
ti 3 Ott i D 1r nlef:i"I s -%i" ; {{ (
-
get1.f e l
t d.igi E-( 1 ) m a> s i ts ! - s r S t.
* s 5iem v. u 30s- ,3ori
__
, s -
)5 .*
a+1, 1 1 : *r .,4 : 4 g3
as; t -; w e
s. t 34- . ,- s I .
8 5 > g. it e t, .e 4* *
I.I .i $d' ,I l {, fi (;.f .}i.<, 4 .
E ' ?o Le 15n 5 t,
? L ?$ $' $ %
*
{$ $ -
.dg *, t 1
f I 2 Et a 6 6*: - 3 -
** r 7 3 E * t 4' *I+O & s /% %{ 6. O> s <4 beA*%I 4,
! N f.l n$ - d If4 i I f8I
$}fn[g$a,a' a q&ui$- Dstie ; wi t; 5e ;93-
5o 4 Tit g {31 3 51 2g nlassi t. u A IAll?tsm)#1 3 .s ]
sk
+.
3232 J Cat 3s. v
e c -
O t
i 20' 0 ;;0 !. 0 - 02ng ; 5:n:;;200; ;;;"
3,
i 1p .. - -
'j j -ree e :- ~ r e m o--:ee e- : e e-- -
,
,u q---.
~ E & 5 E"$d "4 * ' IA % f.* f A. D 203) N O R T A l ~n % D. f4 f' R4T4
"O R 0 '
,
f$:: s-, p..
h "w,! II! Jf op; 11 $
i, ,y u,. .s _13_1f n 3 *, . .
/" *@ e ? : $*
.
5 d Se: bon 5; ENVIRONMENTAL MONITORING PROGRAM
_1 _ _- _ n - - . _ _ _ _ _ . _ . . _ . . _ _ . _ . _ . _ _ . _ . , _ . _ _ . ~ , _ _ _ . _ _ , _ -

- .. ~ n.. . - . - .- - . . - . . . ~ . . ~ .- . - . - , , .-.
- D@uesn'e' Light Company ~ -~ ~
1991"Annue. Aadiological Environmental Report
, . p
TABLE 5-1
' RADIOLOGICAL ENVIRONMENTAL MONITORING PROGR AM (continued)
Notes- 1
|
(a) Control sample station: These are locations which are presumed to be outside- Ie
the influence of plant effluents.
'(b) Typical LLD's for Gamtra Spectrometry are shown in Table- 5-4.1
(c) Particulate samples are not counted for 2: 4 hours after filter change. Perform- -|
gamma isotopic analyais on each sample when gross-beta is > 10 times the |yearly mean of control samples. !
],(d) ' Analysis composites are well mixed actual samples prepared of equal portions
'
from each shorter term samples from each location.
(e) Composite samples are collected at intervals not exceeding 2 hours.;
(f) Weekly milk carspie from Searight's Dairy is analyzed for I 131 only. 1
(g) Milk samples are collected b;-weekly when animals are in pasture and monthly |'
at other times, [ Assume Ap el October for grazing season (pesture); 1
--(h) ' The milk samples from Brunton's and Nicol's are collected once per month. j'
!
(i). The fish samples will~contain whatever species are available. If :the available-sample size permits; then the sample will be separated according so. species . i
and compositing -will provide one sample of each species, if the available sizeis too small to make separation by species practical, then edible parts of all-,
fish in the sample will be mixed to give one sample.
(j) Composite ~ samples' .are collected at - intervals not exceeding 2 hours at. locations 49.1 and 2,1. Weekly grab samples are.obtained at locations 49 and- 2 A,- ' A weekly grab ~- sample'is also obtained from daily composited grab !
: samples obtamed by the water treatment plant operator at location 5,.
(k) Two '(2) TLDs. are collected' quarterly and annually from each monitoringlocation;
. _
? Additional Notes:.
Sample points correspond to site numbers shown on maps.- . .
.
All: 1 131 analyses are performed within ' 40 hours of ' sample- collection if--
possible.-
- : All Air samples'are decayed for 72 hours before analyzing for Gross Beta.
J
#
- !
- Secben 5- EhV!RoNuENTAL MotCTORING PROGRAM 5-5-- ~ - . - , . _ . - . . - - . _ . --___-_....m . - . - _ . - .m.

., + - . . - - , , - . - - - . - . - - _ - . - - - . . - ~ . . ~ . - . . . . . - - . _
,
Duquesno Light Company1991: Annual Radiological Environmental Report-
2. - Sun 3 mary of _Results 'i
' All results of this monitoring program are summarized-in Table 5-2. This tableis prepared . in the_ formal specified by: NRC Regulatory Guide 4.8 and in
__
accordance with Beaver Valley Power Station Operating License, (Appendix A,Technical Specifications). Summaries of results of analysis of each media arediscussed in Sections 5-8 through 5-H and an assessment of radiation doces arefound in Section 5-l. Table 5-3' summarizes Beaver Valley Power Station
: preoperational ranges for the various sampling media during the years 1974 and1975. -Comparisons- of preoperational data with operational data indicate the !
| ranges.of values are generally in good _ agreement for both pericds of time.1
Activity detected was attributed to _ naturally occurrir'0 radionuclides. - BVPSeffluents, medical procedures, previous nuclear weapons tests or to the normal
- statistical fluctuatior, for activities near the lower limit of detection (LLD).
- The conclusion from all program-data is that the operation of the Beaver ValleyPower Station has resulted in insignificant changes to the environment.
| 3. : Quahty Control Program '
L The Quality Control Program implemented by Duquesne Light Company to ,
i; _ assure reliable performance by the DLC contractor and the supporting QC data| are prcsented and discussed m- Section 3 of this report. The lower timits of :
detection for.various analysis for each media monitored by this program by-the !
L DLC Contractor Laboratory are provided in Table 5-2 and in '.'able 5 4.3
L
\:I
L
i
!F|
!|'!=|
l!
4
!
i
,
4
l';
L ; S-6 secnon s ENVIRoNUENTAt. MONITORING PROGRAM .
_ _ . _ . . . . - . . . _ - _ . . - - , ,

:s z~ _. .
.
ENVlfF'*M.tiTAL RADIOLOGICAL MONMUltlNG PROGRAM StJMMARY +
Narne of FaclA' er Vallev Power Station Urdt I aral 2 Dor _ket No. 50 331/50/312
Imcation eacility lleaver. IVnrisvivanta Heguirting l'eriod Annual 19'31-4(County. State)'e.&
.
Analysts and Lower Limit .>. Niemiser ut hMeditun o' Pathway Total Nuspiser of . All Indicatcr locattuna Location with fliciest Asuwa_1.hinul GtutP3.L*>3tlein NontoutineSampled of Analysis Detection " Mean (Q Name "Mean 10 "Mr.an (0 Repos tret
ma(Unit of Measurement) Performed (LLD) - "Hange Destance and Directhun " Range "Ita nge Measur en.cus s*** -
$Wetstosi. WV h 4ts 3
3Air l' articulate Cross (S20) 2.5 161520/520) 32 Mkitarat. PA . 17152/52) '15. 7 < 28) E. 3,
_.
16(52/521 0 3 wand Radionodine Beta 15.0 29)' 0.8 mt NW . (G 6-79)i
(Xto 3 pC1/Cu.M.) Sr-89 (40) 5 UD 7 . . > >6 a'a a~- CSr 90 (40) 0.2 IJD |E O
-
E D51 131(520) 40 IJD y gca 53Gamma (120) o y-:s .3 c
Be4 40 105(120/1206 28, Sherman's U.asry 110(12/12) 101(12/123 0 7 261-(59-151) 8.7 me N 165 151) 159 129) E {2;;T 3 o-o' K-40 '20 20113/110) 27. lirunioers Dairy 7t#( l /121 2til3/123 0 ; $0$ (8.2.4 4 ) 6 2 ml SE (iI 446 8 O2"g- 3 ";- av
* Others Table V.A. 11D -
o4m# B.,S r_nO J3z m-h D +Oz-+ '2r-
COZ
d9:O
[3 Noensnal imer Limit <J Detec-suwi (LtJ>l*
{; Mean and range taawd upon desertable sneasuersucnts swity. ba4 thni e4.k sex talJr nwasusenweiss .st sr4 tti..t i.. s e. is is 6:iitwatres les g..u. ,,ilww s p)**
.
* * u.,n_iin, mr,nea ,,,,aso,en.,nis an. aa...d .., m mi...y c . , o ii . ....... i mi a. m. m ..-, vam y _ , s an. s, . .,. . .s>C
w
. - _ . . _ . . . . _ _ . a--__._______- ._ - - - - -

,-
oCDEm5 Cc2{oa4$<.
-
aj' y3@e #ma o5o&o, T5 3m3% xoVOn.
-.
__
-a E* tn. J -
t_
_
*
"stne
i. r n u
o tol nt
cie s
s ew
r
ur s 0 0 0 o O e -wit e
tar os hn p a. t. sn oe eu
_
tNHM m. i.n.-
tP
.s.p.4
m . ni.
o i t
h) Nne t-
) eH lp i. =
ts 1 e1
V 4 n&ngW3l 11 iaNn
/ 0. // r - .a.lan (
k h i4
l ea n. 645I
Sl 0 u9=
6 a 0 pt2 uMHtn O( 0 Ol ist
e1o. -
0 . nw a1. 1
1 f
M""t > S1 i
e . es!.
5.C W ww
0-rY / 1 ) i. %R t 9 u )1
e 4 2 1 .tA 3 9 a1 I
y. eM 3 y /0 /1
H 4rl
417 IaliM 0 n(
uWa l5 u a a 9 (U t
S . n v nH 1 1 1 s,
t e V'.
2 e erao n a 0O1a 0 pvM N Af. M
sanlA et i
l" t
to aIR e mk <
ot sc0 o e h r
ty danl
tG c r e a i
D P n o s
l' gng a ue H
rf eI
mlD om ed eeI a
n I
Co2 i h v a r mG l
N n o i r kl o o u)t u l! r t
rRE s5
m 'n SI r p w a a7sW genR a
l e9e n e e yN m1O R cI r eoT n ar i inot r- ei e
N f
a a mt .hi mpdm l eI t t ili - -i
a Lbr .l 4 mO U t c sn o ai 4h5 u71 t
_M a LND 8C8 9a3
r s en e
eMc t_ L io i
v n dIIA t s r
C a n t_ I St n
to dse
t
_ G e a n4)
P )c r 4r n eD_ 4 nde ()f 7e_
w .i
l A ii)I a 1) 2) <
G o e r ne /1 41= us t
)4ot)
D ;i
S o ag 42 /2 /0 280I P v 2 rG) e
f
A y e yt en. a 7 0 20 4 - 13 /2 r
1 ) y
le t ti
Mac 1 - 4 - 13 /-H l i lykn H (1 (2 43 23d * * 6 6 5 143 -1 naa uL V y n** 11
i . 0 10 D 0 0 57 (4 D ol1
o1 0 0 uA
ic(t
T r tC!
0( 01 1 ' 01 0 9 J tsgL 1 2( I ete (N v A- ntIa eE a F mnM e t
f i e iDN o m rdn ueO ty .a
m L o 3 sn5 5R h 0 aiu it1M efc sf rI 0 0 0 0 3 5 A mdV
it
I eeL 0 0 0 0 0 0 Va a .
s. o teN F c )L ee)e Jl rE o D( e Ibaf l Ior y lb La)
( t se e rl a ctT n. e nn i )mb 4e 2 kt e
)
a amkd 4 r l):r )t ea 2 sdm1
N us a ue ( ) ( re es 1 4 t nriNlym au ag ( ( as ar mq mr 0 m s eou
1 r Dpslyl onfatAr m4 n a 3 9 m 7 0 e uaa
1 r a e -
h 4 ernof e a7 a2 - 4 ed m1
t
tATOP G( C (4 - S C D K Osma e
esdI
)t sbtn L wee r g ;xya m n ene
w e o w arnr i e a erh u a g tt nt
tada d r l aus i a nit
)u_
P e. Ma
e a o t am
oop R F h ntf
mrf aa u ig tman)v. ll y ueoeao r)
iuS nd agw NMN_
t r/ / .
teR dl y * * *d i n x eCr * *eM { E (m F (p dU e *
(
___
V' c S o m $ Oz 5 z >" go3 o2 6 m3 8 y co
__
_
_

ENVIRONMENTAL RADIOLOC1 CAL MONITOFJNG PINXiRAM SUMMARY
Name of Fictitty Beaver Vallev Power Statioinfrut I and 2 Dwket No. 50 311/50/412 _,t.,
location of Fart:1ty Beaver. Penn$ vivant.t . Hegwasting Ihkal Arinual liFJ1 E-(County. State, ,
YO
r\)
Analysts azul Lower Limit N uu.iscs ofMesisum of Pathway Total Number of All Indicator locations Ix(ation with flichest Autmalhbm Control Lt.a3 hnh Noen oe stinet
Sampled of Analyons Detection " Mean if) Name *?Mean (0 **Mean to Hepors ed(Unit of Measurement) Performed (LLD) "Ha nge - . Distance asal Directiom**Ranrr ** Ha nne Mr.n us eme n t s * **,
Montgomery Daen No. 49 oo
Fish Gamma (9)"
I(pCl/g) K 40 0.05 3.0(9/9) 2A. IIVPS Descharge 3.0(5/ 5) 3 0(4/4) oiwet weight) (2.3 3.7) 0.2 ma W (2.3 3.7) ('t.3 3 36 3C*_o
Otheis Table V.A. IlD - ME'e c.9GO w-3o mto6CE S-m~
g 3 Og 5O
36- O --2 3Cv, 3 L
- -
m @Qz US
E~$z ?e mm Vz O> ~
i
r- ,
COE
OPzOn13OO
Mentrwal lamer Limes of Detevikm (LLD) ,v *
E Mean arut range bawd ugon detertable measurements only Free thwi ed st. see tat,1c en casierement< at sg , til..I l. .it. .s as tout' ted tn gene rithes. s 10**
~
* * * Nonrteottne regwerted measuremertts are deftswd in itegulatory (.uhle 4 M (t he ue twr 19751 arut abc lica et V tle y INw. r St swwe Sp eitu inee,s .
Yw
__ _ _ _ _ _ _ _ _ _ _ _ _ _ _ _ _ _ _ .

- _ _ _ _ . _ _ _ - _ _ _ - _ . ,.
. s.
...
-
C
ENVIRONMENTAL RAD 1QLOGICAL MONTTORING PROGRAM $UMMARY
$' Name of Facality Beaver Vallev Ibwer Station Untt 1 and 2 Docket NoE11/50/1123 -4locanon of Factitty Deaver. Pennsvivanta Heporting Perkxl Annual 11731 1,
(County. Statel - E,.m-o
5 vi
o" sbAna is armt Lcwer IJmit Nimitser ut$ Meditim of Pathway Tota Number cf All Iriditator Imattern laatton with Ifichest AIrtisal Med.n CuntidliL!?hnt) None outinc* Sampled ofAnalysts Detection " Mean (f) Name "Mean (1) "Mean (Il Hep. e teelp (Unit of Measurement) Perfarened (LLD) ** H a nge Distance a<wt Dirert>>ns "Hanne "Ra nge Me.assie rn.rn t ."*r-
. Weirton. WV No. 4H ,L Food arwi Garden I-131 (4) 0.006 IJD to '
9 Crops (pCl/g). 3'
g (wet weight)) Gamsca (4) ym 33 K-40 0.5 . 2.014 /4) 10. Shippingport Horo 2.6(1/11 1.6t l /11 o gc (I.4-2.61 0 8 mi ENE
o, Om -*D5$ g.Others Table V.A. 11D
E Es.3*aceo.7m~3 O5,e-0 33 V3Ne ,23C.
DcU
. .
Nominal Lamer 1.tm:t of Deteruon (UD)*
Mean and range t>ased upore detectable measurements only. Frat than of detc< talJe mear*>rrenents at spre tiled lim athan is La.!!< aeed en pare endae ws til**
* * * Nonroutine reported measurements are deftswd in llegulatory Cusde 4 8 (IWemt.es 19751 and etw iteavrr Valley timer Statuwe Sgwe sia twwi,
.

3-
~
-
O5.5ug CM"m~ DkO332_r xDt?-n O 3"D
3 3 5 M * a. o5oF-
x .
.
-
_ w3'
i
_._
t t
.
.-.
_
__
~ w
bC V' rv4
+
--
"*
- tsneefmi ohde )
1
rt e(
t swit l i 0 0 0ot t -
tmngms mra huoe e
NNRM 7 i sn2 eer r
. atn o patNM) y 90 inik))tl1 r
2 /5s sta1
rg l) 1 1
H -191
teee 9)i
r n A s1 a$Lan (s /210
h rle a t t awMR o 9 6 0 uhI-
!" "t
- ( r4 9 2 Dn t l
20 an u2 2 5tl Uj u r 11 1 S1i
i C i slb 1)rn e
o w0 60ta%
) 1t
r5 l )If / rI 6 3)
a1
/71 9 a 1
e 61 6B 1 1 )
9 e1 -
1 h yng /4A 3M 3 M an 5 6 1 0 /
lmale1
l
I 8 Ieall 1
M o a ( (aMR 2 7 fVu 2.1 2 Odnu tU 4 -
ee1 rrn ""sn 3( 9R g n
1 ( pv
Rf A Ai * an ct
t t i * * * nA aIl e d s h * * *i k a e t * * * tses r hC w r h e * * * ntO h v c ir ei y y y mdt L i l D} r r r nP g . I
'G In h d a ai el i aa r2 t - n D D D u)
t 1 s5N d r
n o y.a y y y a7
R a p n'ce r r r e9j
m1r r re - e e e eO R l n F F F *rIl eT a e
N tp la Xai 2 2 2.l1,amtt . . hI l s am0 0 0 t
O U n L' N D - - er- 1 1 1
M n a screv n d (D
eo ---
L u wt
dti i woA a t <fC nt
; ) r'
) i4.a1 S n 4 wX r Y e oi 3) he) )
t
4 dl4
e I ta f 1 0 tri3 auw r r ne /3 )
o o .S. o ag /8 47 Ft
1) 4e rGDi
P v . t en 31 3a 6 1 y
v a y cM a 2 - 1 - /lna
7 .rA le e tn. 0 yoR (
i 12 4 1 tB t" D DR la n * 1u 13 6 1
i(l
1 J 10 3 0 D ole * 8 . 8o uL V ty l
C 1
9 1
AtsgA
e lil
1 .I 1( 1 ( 1 crI niE
lc evF a a mnt
M k F i e am rdL f n ueN o vi
y L o snO i n i). ef
t aitD 2 AR l o r c emdef
VIt i
wotLt eL 0 2 I 0 5 V. )eea ta
N F c o e( 0 ) l rU. b aD leE o 1l
f b i alo r ( f sa)ee ds 4 T nat) ) nm amtsd 6 4) 4 3 ios ei i
r edme 6 3 3 1ta (us 1 1 1 sN s eNlym 'a eir( ( (t t w7 s es us ar 9 0 m 3 rlyl Dpsnfo 1 oa Ar 3 8 9 m 1 e uaa
t - h f ei t -
r a - s t odm1of e rr
ATOP -
.S S C K C Oima e
e1 t
sd)
tn L ribte eoy
a m rgpenr v
w e wao rrh u or eI
dnatada ntt tls
Peel
a au il no pM in ntf
mf ma w i.em oe o nao n N MNGiuS t /kid in * ** *lice * *M U *
Mac **(
*
g8 w m5 mOim2 >r COE oEzO Ehn( T' e-m
! r ;

,
.Y.s'PJ ..
*
| .h ENVIItONMEMI AL ItADIOLOGICAL MONf f OltlNG IHOGl{AM SUMMAltYy.
t o
$Name d Fadlity Beaver Vallev Ibwer Sratlan Unn I and 2 Dot het No. 50 331/501412 6
I
U_Olaratkm of Fac1111y litarer I'rnnsvivania Reporting Ivetal Armual 19'31m
g ICamney. Statel' t.=i
toa
humler ..I@ Analysts arut tower Limit
c Medium of I*athway Total Number of All f aultrator IA.athms LLaLaMon wfitt litchest Annual.Fbs.f3 Dall!!'l imiift12 Naur**"s t w
Sampled of Analysis Dettetton ** Mean If) Name **Mean II) - "Mean til ifeg*w1edm
(Unit of Measurement) Performed (LLDI ** Ha nge IMstanre avul lMrettsoen * * ld a r$ge ** Mang ' Mc a w es t ene- eit s*"w
[Monagennery Dam N , 49
49 |
o Sediment Cross (6) 0.3 21(6/6| 50. Upstream 2 712 /2) 20(2/2) o tor~
| E (pCI/g) Alpha (14 37) New Cumbertarvl Dam (46 37) 114 - 2'*)8 2 mt W g
' 8 g ..3- (dry weight)2 Crnas W 0I .3916/61 2A. ItVis IMw harge 4 |12 /23 3 412 /23 o c
lieta (33 45) 0.2 ml. W (31 45) 133-358 E r)( Cmg Sr Ef9 (6) 0.2 IlD -- e p.-m
?om
-
0 038(2/63 49. Upstream 0 050(I/2) Same as e o to> Sr-90 16) 0 04C (0.025 0 050) - Managwnery Dam high im atum oj~
to4.7 sra NE 8C ICamma 16}fle 7 02 1,5!2 /63 2A. IIVIS DIsrharge 1 9(l / 23 ljD o E 8Q l
E(1.0 1.9) 0 2 mt. W ^ m
3 OK-40 0.5 1316/6) 50. Upstream 14(2/2) 12(2/21 o 5o
{j3 141 New Cumberl.stul Dam (13 5-13 71 (11-83) ,y3ft 2 mi W =U
3iMn-54 0 05 0 083(1/63 2A. IIVis Otw harge 0 o**311 / 23 IJD u oy
3. 0 2 ml. W
NCo 58 0.2 0 6 912 / 61 2A. IlVis Discharge o 69(2/2) IJn u
,e"10.64-0 74) 02mtW to 64 0 741
Co CD 02. 15(2/6) 2A. IIVl3 Otw harge 15(2/2) ljD o O |-
(0672.41 0.2 ml W to 67-2 48
Co337 0 02 0 2 716 / 61 49. Upstream O 3 012 /23 Nenn as nha:filia ath.n(O88036) Montgos sery Dam (024036) s
4.7 mi NE
Ha 226 0.1 2.2(6 / 61 50. Upstream 23(2/2! 22(2/2) o
(18251 New Cumtmiasui Dam 12025' 12 2 2.21ft.2 mt W
T4228 0 02 1 216/6) 2A. ItVis tNw herge 8.312 / 21 I It2/2) o
(1. 1 -8. 51 02mlW |1.1 I Si 11.1-3.2)
Others Table V A. IJDi'
Normn.el 14swer IJmte of Detet16cn (1J Dj*
Mean asw! range based upon detestable nwasurem*nts oudy. Frai slon of detes t Able MCa%nfemenIS JI % ft S $th el Is 3 alhaf M 9% $1MIh .tle el en gusf e64t|W?.8 % |I)**
* * * Nonremtine reported measurements are defined in Hegulatury Guide 4 ts (Des emtwa 1975) armi the fle.ever Valtry 1%e r Mathes Sg .sth ad.n,
.
_ _ _ _ _ _ . _ _ _ .
-_
--- - ^d
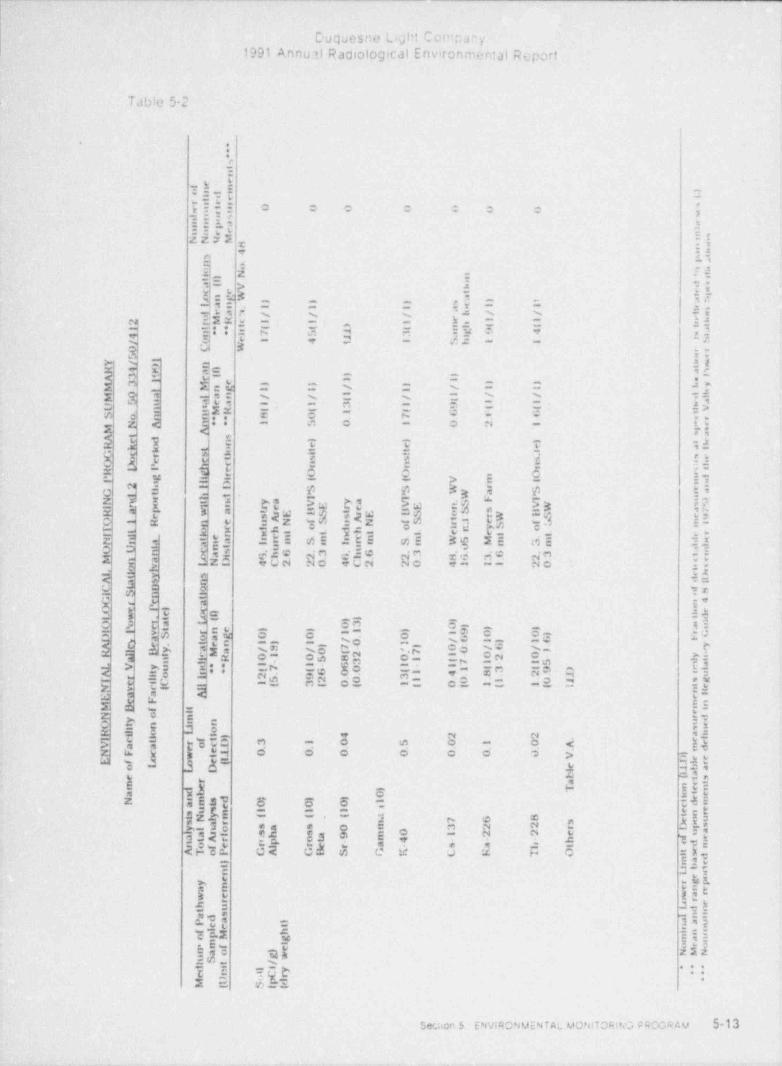
.
n z..
gd' 5 < [ Cc ~n 2 5 r.am_ o3 paaCa]sa o6O Rc f"."kS a.m3.D N c],~s u . a ,
'-
4 r c6 mb7. e
*
"stnee
f nl ino I.
r t6 e r (
ree nt s e,bns eO o o 0 o O 0
n on ,mr pn uuacmNN4M t n. nt
Seo
gmi4 w
n . ss
t0 meneN il
c es
t ses. ( V e
n n *;W u.e
e i
I an I. 1 a. St
. .[ea -i.I 1 I w c. 1) 1) )
.ua
/ / / .I / / t s
c r s.9MH c 1 1 1 iI I e
t2
m 31nli 1 ( t it
Dt1 i"" u 7 5
( ( ae. ig 9 4 a34 J Sc 1 4 t Sh1 I 1/
0 G W er5 e-
Y / l
H) nwmW GII l a. l'e
R 1
3 e 1) Il l
le
A 3I
M Mng l I 11 / I I. y) l / -
M 0l
lan / / 1
1 9 -1 l
a / t/ / I. l
1 l l
5 u eei 1 l wa3i rtVU
.
njM.s 1 lnn" H
(
ol 1 ( 6S o 8 . 7 i t s r" +1 S Oi O 2N A 1 eI
M A aas g v
t sA 1 ) ) ee n e tel
l
hG nti i t e. salR k o t
sct
O ur s s s e ee e n n n niL P h c t
P g .iga O( l V m I mt
R o O era
2 n i DG 1 u S S W W ar S r nl
aah 1 I' -
ya V E nSP
re. F P
VW mMrN y o tir n ya VE rcI
a p w a t sE iS oS s a7I l
I S e *>S tR sE eWI r Ie sAu N fS sA fS tO yS fL m4I R n .e u N r.
h i o . ih o . ir oi > c f'
t re ei v rfi
k n mrm Sm.l w t l .seNl
t
mt .u .u e Sm W5 Mm 3m t.rnra ir r .2 . a I 0 l..dO U t c sn ai 6h 6 23 ih 6 23 86 36 2t3 t n
oM n a f e elND 4C2 20 4C2 20 41 11 2O, o v <e
tekl ul
n dly
A a s i
rn 2 d *$C t
I S n l <lG e m4u0 e kO. n P ) a c
G o r teI w .
a I1
03) I9 0 lo) rG
A 1 1ti
1
e 01 eauI P )v t r ne )
D a.
.o ag 0 0) 1S1
0 /6 6 t/0A ln e en 1) 1 1) l2
R lBy tgM a /S /0) 7 - /7 gO 0 /E /)
I12a n i H 01 05 8 01 - 0 0- yelt
3 l7 2 15 lmla1
t-
t" " (71 1 - 6L V tyu 1 Ix
e 16 00t 25 9 3 4 . 8,1 2, 9 D1 13 1
s u(iA i o t.
1 (0r
E a al
( 3 (2 0 (0 0 (O J sgI
lr (C l1 1 1(
T eN v ( I t entA e I
e F mnM D f t e eN o im n u arty
O i n J o s wt
o Ii )R l
u au4 2 2 . efIi
ftc r ocD 3 1 0 5_ 0 1 0 A. mdeV a a e
o w e L. 0 0 0 O 0 0 0 V liceN F c )
t )
E f e1 s ro l o D( e lt aL li ae b(trtsr a
m ea mb ) T n eni tos e0 eN mtsd ted m
r ) ) )1a e 0 0- 0 4us e e1 1 1
tetNlym 7 6 8 mrs t.( ( . ( us ns ar sa s 0 m 3 2 2 Dgsyl no sh s a 9 m4 -2 2 e uar
0lat Ara 1
- e
f
e ot --
e h 4 crp rc t a s a l
O itC R Tt 4dnnof eATOP GA G1 S G 'vl
1
lesdma c) e
tn L sJl 1
eoe r gpya m enew e warh' nr wr
u itt autsada l. r sn auPee )
n otl h n rfo pM
ig tm a m.mf oc -egw NMNn ao )
lustl y/ * * *d in lCr * *e ioU pl *
M ( SI <(
s8 I <a m{30zgrj >r ro5 0?b Tm8 "1-Nn 38
'

*' - ^ - ^ ; -
t, e, , u, ,,-v..- ,~, .
,d.,-
_
,
- -
7 4
..a- - ,3-
. . . . . .~
c*- ENVIRONMENTAL HADIOLOGICAL MONITOHING PROGRAM SUMMARY'.
8-k' - Name of Facthty Braver Vallev Power Station Unit I and 2 ' Docket No. 50 33 gjg/412 -
*'4'-
v. wLocauon of Factiety Beaver. IVnnsvivania Heporting Italad Annual 1991 1E-
'
mICounty. State) - *z.
<;, 9
.,
s.n''N'O
z.C
, . Analysts and Lower Limit ' Nemaleer of 5
.7 ! Medium of I%thway ' Total Nureher of All Indicator locahons Isation with flaaliest AnnUNU Control foratims Nouroutine .*
'
-
_y Sampled ..'ofAna W Detection ~ Mean to . Name-. "Mean (0 - **Mean 10 Repor te.1,
r . . .
(Unit'of Measurement) Pesformed (LLD) "Hange D6 stance and Directions "Hange "Ra nge : Mc.asurements"* - =,I' w-g O eoz
.
I-131 (157)' 0.5 . O.48(47/157) 04. Midland. PA . 0.5012fi/52) . O, y-*
..
Drtnidng.g t
m Water . 10.1 6-1.01- 1.3 mi WNW 10.20 1.0) 3-. -
2 IpC1/11 ' 'i;
(. Groes (36) 0.6 llD - -- y73Alphaz> c
- 8 .. .
. . e, D "y
] m Cross 136) 1 4.9(36/36) 04. Midland. PA 5.3(12/121 -- o a 5i ' i$ Beta ' 12.0 9. 4 1.3 mi WNW (2.0 9.61 o, in
Oo.'
- Gamma (157) Table V.A. IlD - - '
r- 4
Sr-89 (121 1.5 11D - -ta c '
a. rn ~Sr-90 (12) . 0.5 11.D - k3,
.
a. -8Co 60 (12) (a) i 11D _ -, ;Of 'I
. g c, .oQ11-3 (1 2) 100 133(3/12)- 05. E. It~rpool. Oli 140( t / 4) o4
(130 140) 4.8 mt WNW - ?.,
y- t
. 3- tD-y.'O'2
&
b.
~!
|
(a) Co 60 analyzed Isy high sensittvity medmd.
Nominal foiwer |_imit of Detettson (U.D)*
Mean and range based upon detestatale meneurements only Fras thm d detes talJe measuremerts at $$"'lfh *I l'a *thwn* Is 8s'dw ated ses parreetiscws (f)**
*' Nonruutine reported measurements are deftswd in f{cgulatory Cuhie 4 ft ilks emter 1975) asul ti.e lleaver Valiry Ibwer Statkun spe,sticath.ew , .;.
*
1
m * 4 % b ald1 e- 'v-'. w
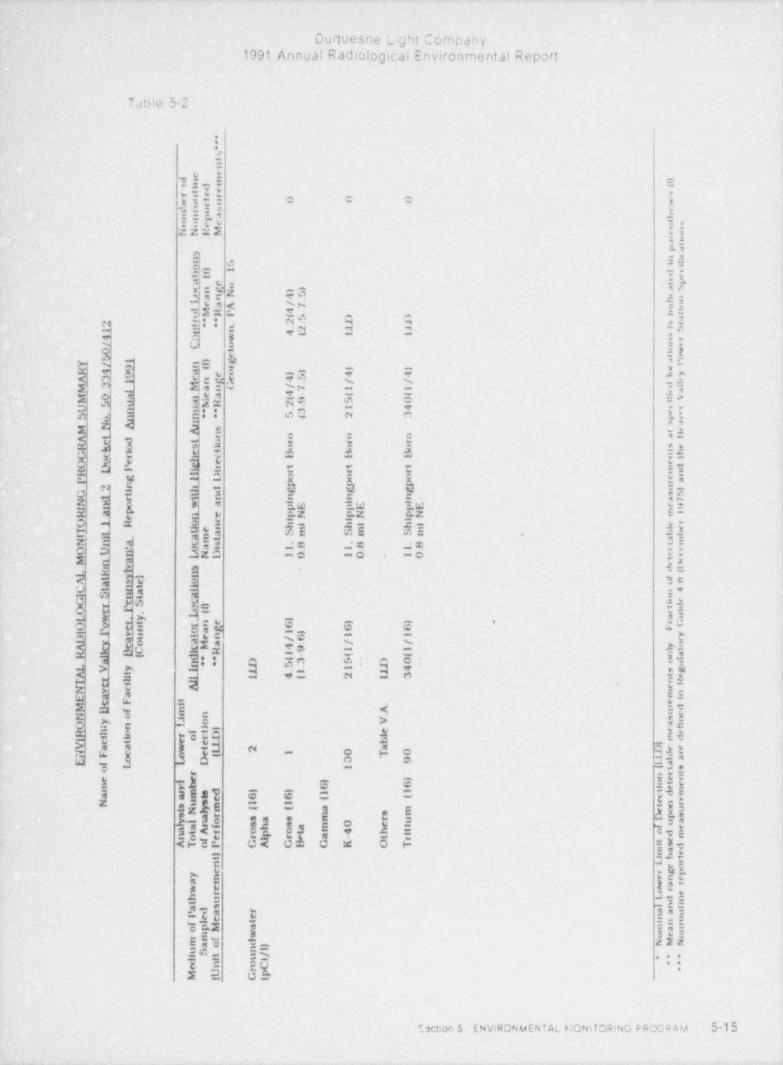
2 a 5'm m r- e2~no3t54- .
G3 >a@ ho oyu m358a3c" E yOVk*-
yhEo ubs
e
*
"stn
e e
o inl m ff }
(e e
r tus o o 0er s
Sor wc uc.mngms t
ra
t se iuoc! c eNNIM e we >s,.
tp a.st t
e
ol6i, il 5 s
s1
t.eb I e o.
cp-
a. n ngN )51 i. S-
e an 4 n usea A /7 i.l
tn"" . 25 D Dt ktt 4i
MI P191
1
- o
s.st2 n 4 (2 I J iS1 I L
4 o w se r/ C o we
m0 t he5 t. *tY / n0 g1 .f3 e
11
4 Iy4
1 w* a 1 e o 15R 1
. -A 3 e e 4 / / l lng .1
M 0t . M an G /7
(
0 . i VM 3 1 1 a l
a. e i. (9 5 tka4 - (
5 ul
TMH 2-a
U. n 1 4 i r
* 3 r
n".m * 5( 2 3 pwS o n- s s.
M N A A .s kl ni o o o taiA t
te x s h n n n Wetk k e - te E i i
i k k k hG ntr r h c eO o e c i
nP g - l
tt t t t
R D P i
D o o e rr r mu
f x a2 n ; p p r
g g g u1G
i h t
s5t t m n nnl r i a7N xI r o w a ipE ipE ipE eR a p
e n e ipN ipN ipN m1c rO I H o n hi hs ht e
Ti e Sm Sm Sm l, w
O U ttt
mtt a * ttI aNi
c s tamn 8 8 8a6 1
oND 0 teu1 I sn 0 I01 I
M n a -
l
kkiv s. k, l n <l
I
w)e o foMtAC ta tn i
i4taS n a wI t
L wl
S c lh cG
O e'e ir
. o ti <k. l
t auO o e
ty )r e 6 6) 6 FrG)r sn pag
I P v 1 1
y e o a /6 yu l en r1 1
D a / /
H l D( icMa 49 1 1 lyoA e C R 1 - ( ( natd 13 5 D 0 oll
a n " " D 51-- - uL V ty 1 4 sgI
A i l
1 1T r
li l1 4( 2 1 3 tnle
N y c A ele
E a a mnM h im A..
e iF t
rdf u el nN oO i n L o I V sni
ty aii f
f t le eR l o eocD mdM
i i rtc t e eL - t
L 2 a )sa a w eet
e 1 0 T 0 ll rT F co o D( iba0 9 LaE f Il t eo 1 (
r nstene em rb 6 6) ut ei )
uedmamiesdr ) ) 11a 6 6 n e((usN tNlym1 1 nrs
s s m ieou( ( ayl ur sa s m Dpsr u uao
o ota m 0 e i f earf sh slat Arl rk a -
h i odm4 trpnof e t r eATOP GA GI G K O T imuet
sdi
it 1t
L rn eie rgwy -
marg
a- m enew e rr a eh u
laaslt nui
tadas r trPel e m ne
nmtfo pM a mamf w' oeorn ao ml) f MNt %r
luS u/tl * * *
la i o * *n rC *M U G (p(
sNaa.nn 3 , 9s oz$z$r 50? O2:O Ebgg-

.
.
Ocfaga ,6,~go3u$:-..$ 3sS* yo9o,aje_$53a3v2h nDtS.
. . *
t (
hZ]h4 .-
*
".-
tne
wf
m 0otlie 1
i e .r tut 0 o o er )
w os utnt o.e e
np. hni or r t
nNNHMs
n.sv
t ann 4 p..s o
tt N t h h 6nast0 ig ig ig t e
o1 V i h hrerpe hngW tas>ao . a
s s n sn nso o a wil a o s oeb n ei ei :cti
t.:
l
vMI ot" " i ma mat r a )
.
t h t.tr c ac e e J
4 f WI h M.n te! Ll Sl Nh2 o o J
1 i n,w
h%8/0
ta5 n1 e y
IY / =a )f 1
A 3 IWt
t( 0 ))l 1
a. 045
lr
)i e 1) 02 l
7 /3 ln l..hng /6M 3la dea - s- I 21 0 t
1
La n 03 /1 iV/ l
M 015 m uMH ( 5 - rU
. u . m " "s(5 t6 3 6 e e54 5 4 2 pvS o r s
n1 81 8 3( s s.I
M N A A -
e
o taflA t l ti Ae sa e t P swR k c t
ntetG x h e ,
wlr
c rv i i V V V) t
M D.I l D a nwmI t -
W W W W W We n
P g a2 n t.l rg
. . .g u)
Gi
i u nS nS nS nE s5tt i r
a7w a oS oS oS ipN c. 9i rN v or t t
t im le hi c s
tt r s i
c m ipE n1G a p n el m iel e o n eO H- u e ie1
T a W5 W5 W5 Sm hbi a mt .0 0 0 amNl
A'I c sai 86 86 86 06n t
o elND 41 41 41 30 e.O U o -
a f er e rM n d (Dsvo i-
nL u v o otf s
A it
I S.tt
i
m4aC t an c ke)
G e e o 8 tr s kPO e a .lt (
t ? ) )) 'mCu
L w .
S o a n 7 7|.r r ne 20OI P v . t
)o e I7en 2) 22 5 v1
2y a /6 /7 /3 yoD atn .i
Ma 73 81 2 -lml
ry c /c H -
1 .1
tAl
i le
2 0 a(t u < "" 15 (8 3 Ul l l
n1 - ) ) D 5 8 ua o -
8 11 1L V I 1 J 2 tsgtyC 2 26( 8 3( rIA( e
l ( l( I 1 I
il
A .nHrT eicP v . .m n
E a ai
V u we F A. e it
m .rdM B f nN o i s
t
ty L o e ai
I l o r cD)l
s
O i n i
b 5 mdt efe
aVI
i i ef eL 1 0 0 T 2 0 0c t wotL )) eea a o e( 4 0 0 Jl rN F a lbaL D la
1 1
E f I sl
t tno re mtee l )ub 7 ul e
m e nmts *r ) ) ) t
e 7 2 2 2 tz dra a. ( eus 2 1 1 )
teoue
a ( ( 2 nrNlymN ts (s 1s ar s m~ Dpsr 9 0yl (onf s a m 7 0 e ua
latAr otnof e re a e -
h -
9 f ea 8- 3- 4
t t r - odmwdATOP GD G B K O S S
6ma e1 41
.)abt
tn L re>e rgxya m enegw e war
or wrh u tdrt
s l ntada n a autPeei
imanl o n unrfo pM t
m a oeomf NMNtao i)
iuS r plei/t
l i t cI * **s n aeC * *e
U WPIrp *M (
Y' n {8: ^# mj 0z52>{O3I3m y =m8gc.c 2 c

"
.
.
[ oi"* Co ~ Oo, fwdn r
m < 3' > s g c>. - 9o~oo6m m31.O p53 $ .. oV$-o .,
cEt vE.
i4 ut
*"s
s.tn 9ee 4 )'4n m ,
sl
e Ide or tut N o 0 0 0 0 0 we r
w nr lb
u eostmu pa rsa
m i.suae e
NNRM em e.r he ath p s.s
n tinhfie 3
e 21
O lpta( C mn /01 dnt) 1
epte R ao 2 7 aSx ng A si 1 - h nan t
D 1324 D D D tms
l
l ea e a oc> n t J l. t tnMH m o lI 4( L aol I 1
sti" " a iSn e2
1 i tr sa rt
4 CnWwem )
/ ; 00 U 10 aa )
l1
2 2 2 /8 lwI5 t) ) 2 11 1
40) )
Y / y
m o1 e 1 cR 1i
/6 31 i1Mng / / /t 3 ar 21 7( -
dtA 3I
Lea ( (2 7 f V'
0 reaI
N 1 . 11(a 3M 0
l
uMH 6 4 7 0 twral 15 u 7 6 7( ; wU n"" I I 1(n t saS /
n ta1o a r
M N A A_i Os 6
nA L l i e e e e
ts c.iig g g gr a s . k CiO a e a a e
l
R e .sr H r r r r
di rtr h e ti
v c vA'X hi t
D. h h h h m m( c c c t eR L i i m. lo s
i
D D s5
as s rl si ig o u)l' n h i a i
p D DE rW2 i t m e a7G t i r
slN eN S $ s S e9d rN r n w a t P
W VW VW VW VW m1v P i iI r e paE s.R a e
i
ci rr r 1 co Ut I I I lR t e . mm Em . m .m .m .m tAetn .l Di I i I t I
ii
U It aamt A A A A amT It
INi L c s . en L e ai 9h 0 5.8 2 2 22 2 2 22 ts c
e00 lehO U n LND 4C5 04 00 0O 00 - --
M L a dl2 i
) s it v
L h v te n 4t f1oA s a i n4aC t n t t nel S n S a
itdrr iu
i e . e0 '
))
X 0 ar l' y 1 )e _t l 2) 60 rGl3 w n n )
r ne 51 8 0 F) ) ) 1
O o e u o ag /7 8 4) 8 8 /8 y
a Ct en 80 4 /6 4 4 41 yov o .r
I
P_ a ty c c - / 81 / / - (. lnaD
M lsi
(i
Ma 1
1 5R (2 0. ol
I 4 - 1( DD D D 4d"." I ( 1
I ll
n 41 6, 62 4 -- u(- 4 7 3 3 l sga a6 U U J 1JL V ty i 0 5( t r6(L 0( 1 I I h n411
A u t eN e mnrT te rN v a m
ieE a F
im'o
t rde y ueM } f snn tl o i
N v aii
O ty L i e fi ) e
R lin r'o c D 5 5
is )f t t mdoe1 0 2 1 0 5 2 0 2 0'e
I c ii n Dett0,
V a a w l rt 0 .
1e Lbao e1( 1 A.
co L' D sN F
V ) h(Lat sE f l ct
e 6ig nenao r ) tot el
) le (
e ub ) )h sdme, 8 b ) ) ) 1
m a :m i esd 4)
2 8 8 ) a 6 6 6 rs ( y e e(s 5 4 4 a T b t mr1 1 1*
e umym ( ( (N htNl ( ( ( a ( ws ss dsa s m 8
g9 0 0 u e uas r Iyl uo n
azf 3 sh s a m0 5 e 8 9 6 l z1 f e
ATo1- GA Gi G K C O S S C T
ly odmlut At rpto ot 4 h t
t r r o1 a - o eo f *c l rk a
t sdarn ima eI
) a ibtt L wn 8 gine 5 seneya m o marrw e C a e
nr lth u mitl
ls r utada e z a
n. a uPee a unrt
l a 0 nanfo pM W' 6 meon NMNmif e) oao rliuS a/ C ***t
!. ft **d ruC ae r ) *f
M ( S (pt t
y 't ,. $ 25$ . _ h . o( $ b,hus< Nh,
*

,. - .-= _ _ _ . . . . _ . _ _ ____ ._ _. . _ _
._
Duquesne Light Company1991 Annual Radiological Environmental Report
- Table 5-3 Pre-operational Environmental Radiological Monitonng Program Summary- .
TABLE 5 3
' PNE OPERATIONAL ENVIRONMEt TAL RADIOLOGICAL MONITORING PROGRAM SUMMARY ,
Name of Facility Beaver Valley Power Station Docket No. 50-334 -
Location of Facihty Beaver; Pennsylvania Reporting Level CY 1974 - 1975(County. State)
,
PRE OPERATION L PROGRAM SUMMARY (COMBINED 1974 1975)
Medium or Pathway Analysis and Total Number Lower Limit AllIndicator Locations' " I * '* ' '# " * * " ' *"9'(Unit of a u ement)
_
Sediments Grors A!pna (0) - -
pCi'g (dry) Gross Beta (33)_ 1 18 33/33 5 30Sr-90 (0) - -
U-234,235 238 (0) - -
Gamma (33) - 13 33'33 2 - 30K 40 15 13 33/33 2 - 30Cs-137 0.1 04 21/33 0.1 - 0 6 e
3 ZrNb-95 0 05 0.8 12'33 0.2-32Ce 144 03 05 3/33 04-07Ru-106 m . - 0.3 1.5' 3t33 1.3-18Others- - < LLD
Y:
- Foodstuff Gamma (8) -- -
pCi'g (dry) K-40 1 33 848 10 53- - C s-137 01 02 1/8 -
ZrNb-95 0 05 02 1/8 -
4 - Ru-1064 - 0.3 08 1/8 -
- Others < LLD-
Feedstuff Cross Beta (80) 0.05 19 80180 8 50'
pCUg (dry) . Sr 89 -(81) 0 025 0.2 33/81 004-093-Sr 90 ~(81) 0 005 04 78/81 002 081Gamma .(81) . - -
K 40 1 19 75/81 5 46Cs 137 01 0.5 - 6t81 02-16-Cc-144 03 1,5 5181 0.9 - 2 6ZrNb-95 _ 0 05 08 13/81 0.21.8-Ru 106:e> 03 14 12/81 'O.6-23Others - < LLD
Soilf Gross Alpha (0) - -
pCilg (dry) ~ Gross Beta (64) 1 22 64/64 14 - 32(Template Samples) _ St 89 (64) 0 25 04 1/64 -
.
Sr-90 (64) 0.05 0.3 48/64 0.1 - 1.3 -U-234, 235, 238 _ (0) - - |
- Gamma (64) - --
K 40 1.5 13 63/64 - 5 24Cs-137 - 0.1 1.5 56/64 0.1-68Ce-144 03 1.1 7/64 0.2 - 3ZrNb 95 0 05 03 13/64 0.1 2
Ru 106'b> 03 1.1 3/64 0.5-2Others - < LLD
,
5-18 Section S. ENVIRONMENTAL MONITORING PROGRAM. . . - - _ . . _ _ _ _ -

- .- . - - .- -
~
Duquesne Light Company1991 Annual Radiological Environmental Repor!.
TABLE 5 3 I
PRE OPERATIONAL ENVIRONMENTAL RADIOLOGICAL MONITORING PROGRAM SUMMARY
Name of Facility Bewer Va' ley Power Station Docket No. 50 334
' Location of Facility Beaver Pennsylvania Reporting Level CY 1974 -197_5iCounty. Statei
PRE OPERATIONAL PROGRAM SUMM ARY (COMBINED 1574 1975)
Medium or _Dathway - Analysis and Total Number Lower Limit AllIndicator Locations
- (Unit of a u ement)' "'#* " #"' #"9"
. Scil Grons Alpha (0) - --.
pCilg tdry) Gross Beta (8) 1 21 8<8 ~16 28.
(Cos e Samples) Sr-89 (8) 0 25 < LLDSr-90 (8)- 0 05 -02 58 008-05Gamma (8) -- --
K 40 15 13 8'8 7 - 20Cs 137 - 01 12 7/8 02 24.
Co-60 - 01 02 1/8 --
Others -- < LLD [--1
Surf ace Water ; Gross Alpha- (40) 03 0 75 5 40 0 6 - 1.1pO!! . Gross Beta (120) 06 .44 120'120 25 114
Gamma (1)- 10 60 < LLDTritium (121) 100 300 120/121 180 - 800-Sr 89 (0) - -
~ Sr-90 (0) - -.
C-14 (0) -- .
Drinking Water -I131 (0) -*
pOil : Gross Alpha - (50)' 03 06 4 50 04 OdGross Beta (208) 06 38 208'208 23-64Gamma (0) -- - |
. Tritium (211) 100 310 ?11/211 130 1000,
C-14 (0) -- -
' Sr-89 (0) - -
Sr-90 (0) -- -.
Ground Water Gross Alpha (19) 03 < LLD .jpCill Gross Beta' (76) 06 2.9 73!75f a) - 13'-80 e-
fTritium (81) 100 440 77/81 80 - 800Gamma (1) - 10 60 < LLD j
Air Particulates Gross Alph.t --(188) 0.001 0.003 35/188 0 002 0 004=and Gaseous Gross Beta (927) 0.006 0 07 927/927 0 02 - 0 32
pCi/m3 St 89 (0) - --
Sr-90 (0) - --
l131 (816) 0 04 0 08 2/816 .007 008,
Gamma (197) - -
*
ZrNb-95 0 005 0 04 122/197 0 01 0 16Ru-106 0 010 0 04 ~ $0/197 002 009Ce-141 0.010 0 02 3/197 001 004
'
Ce-144 0 010 0 02 44/197 0.01 - 0 04-Others < LLD
Milk l-131 (91) 0 25 06 4/91 0,3-08pCill Sr89 (134) 5 7 4/134 6-11 j
Sr 90 (134) 1 53 132/134 1.5 - 12 8 jGamma (134) - -- jCs-137 10 13 19/134 11 - 16
#
Others { < LLD
o
Section 5. ENVIRONVENTAL MONITORING PROGRAM 5-19_ _ . , . _ , .

. . - -
,<
Duquesne Light Company -- 1991' Annual Radiological Environmental Report
_
TABLE 5 3
PRE OPERATIONAL ENVIRONMENTAL R ADIOLOGICAL MONITORING PROGRAM SUMM ARY
- Name of Tacihty Beaver Vanev Power Station Docket No. 50-334-
' Location of Facility Beaver Pennsylvania Reporting Level CY 197.1.- 1975(County. State)
PRE OPERATIONAL PR0 CRAM SUMM ARY (COMBINED 1974 1975)
Medium or Pathway Analysis and Total Number Lower Limit All Indicator Locations' "*'Y** ' #**
(Unit of a u ement) -
' ' ' ' " * * " * ""9'
External Radiation y - Monthly (599) 0 5 mR' O 20 599/599 008 051-'
mR! day y - Quarterly (195) 0 $ mR* O 20 _195'195 011 0 3B ,'y - Annual (48) 0 5 mR* O 19 48448 011 030
Fish Cross Beta (17) 0 01 19 15/17 1.0 32pCvg (wet) ' Sr.90 (17) 0 005 0 14 17/17 002 050
Gamma- (17) 0.5K-40 24 17/17 10-37.-
Otaers .. . < LLD
LLD in units of MR --Lower end of useful integrated exposure detectabihty range for a passive radiation*
detector (TLD)
-(a) _ One outlier not included in mean (Water taken from dried up spring with high sediment and potassiumcontent. Not considered typical groundwater sample)
(til. . may include Ru;106, Ru 103. Be-7J
.
Y
e
5-20 Section 5 ENVIRONMENTAL MONITORING PROGRAM- - - .

X
Duquesne Light Company.1991 Annual Radiological Environmental Report
< Table 5-t Typ cal LLDs For Gamma Spectrometry
".
TABLE 5-4
TYPICAL LLDs * FOR GAMMA SPECTROSCOPY
^ ' ' "' ' "'# * #9#' "Nuclide a er & So I(10 3 pCi/m)) (pCilkg dry) (pCilg wet)-(pCilliter) (pCilg dry)
..
Be-7 30 20 50 0.03 0.05K-40- 60 20 "- " "
Cr-51 40 10 100 0.05 0.1fo,-54 3 0.5 30 0,02 0.03Co-58 3 0.6 30 0.02- 0,03Fe-59 6 1 60 0.03 0.06
. Co-60 3 0.6 30 0.02 0.03Zn 65 8 -1 70 0.04 0.07
Zr/Nb-95 5 2 50 0.03 0.05Ru 103 '3 2 40 0.03 0.04Ru-106 30 5 30 0.02 0.03
Ag 110M 5 3 90 0.02 0.03 *
l-131 4 2 30 .0.02 0.03'
Te-132 4 2 -20 0.01 0.021133 4- 2- 20 0.01 0.02
Cs-134 4 0.6 30 0.02 - 0.03Cs 136- 6 0.6 50 0.03 0.05
- Cs-137 4 0.6 20 0.02 0.03Ba-La 140 10 6- 40 0.02 0.N- Cc-141 6 2- 60 -0.03 0 06Ce-144 30 5 -200 0.1 0.2Ra-226 60 6 600- 0.3 ' O.6 '
,
| ,
Th-228 - 10 1 60 0.03 j. 0.06
At time of analysis (DLC Contractor Lab).*
-
,
** Activity detected in all samples.
NOTE: Lower Level of Detection is defined in Beaver Valley Power Station Technical. Specifications.
,
seenor 5. ENVIRONVENTAL McNfTORING PROGR Au 5-21. _ _

. . _ - ._ -_- - - _ _ - _ . _- _-_. - ,
,
. Duquesne Light Company~
.
.
1991 Annual Radiciogical Environmental Report
B Air Monitoringy>
-1, Charatterization of Air and Meteorology
The air in the vicinity.of the site contains pollutants typical for an industrial area.Air flow is generally from the Southwest m scmmer and from the Northwest inthe winter., ,
. 2. - . Air Samplin0 Program and Analytical Techniques
a; Program
The air is sampled for gaseous radiciodine and radioactive particulates ateach of ten (1) offsite air sampling stations. The locations of these stationsare listed in Table 5-1 and shown on a map in Figure 5-1.
Samples are collected at each of these s,tations by continuously drawingone cubic foot per minute of atmosphere air through a glass fiber filter and
? through a charcoal cartridge. The former collects airborne particulates;the latter is for > adiciodine sampling. Samples are collected for analysis-on a weekly basis.
The charcoal is used in the weekly analysis of airborne I-131. The filtersare analyzed each week for gross beta, then composited by station formonthly analysis by gamma spectrometry. They are further composited ina quarterly sample from each station for Sr-89 and Sr-90 analysis. In orderto reduce interference frorn natural radon and thoron radioactivities, allfilters are allowed to decay for a few days after collection prior to countingfor beta in a low background counting system.
~ b, Procedures
Gross Beta analysis is performed. by placing the filter papar from ?theweekly air sample in a 2" x - 1/4" planchet and counting it in a lowbackground, gas flow proportional counter,
, .
Gamma emitters are determined by stacking all the filter papers from eachmonitoring station collected during the month and scanning this compositeon a high resolution germanium gamma spectrometer.
Radiciodine (1-131) analysis is performed by a gamma scan of the charcoalin a weekly charcoal , cartridge. The activity is referenced to the
mid-collection time.1
_5-22 sect,on 5 ENVIRONMiNTAL MONITORING PROGRAM2
i
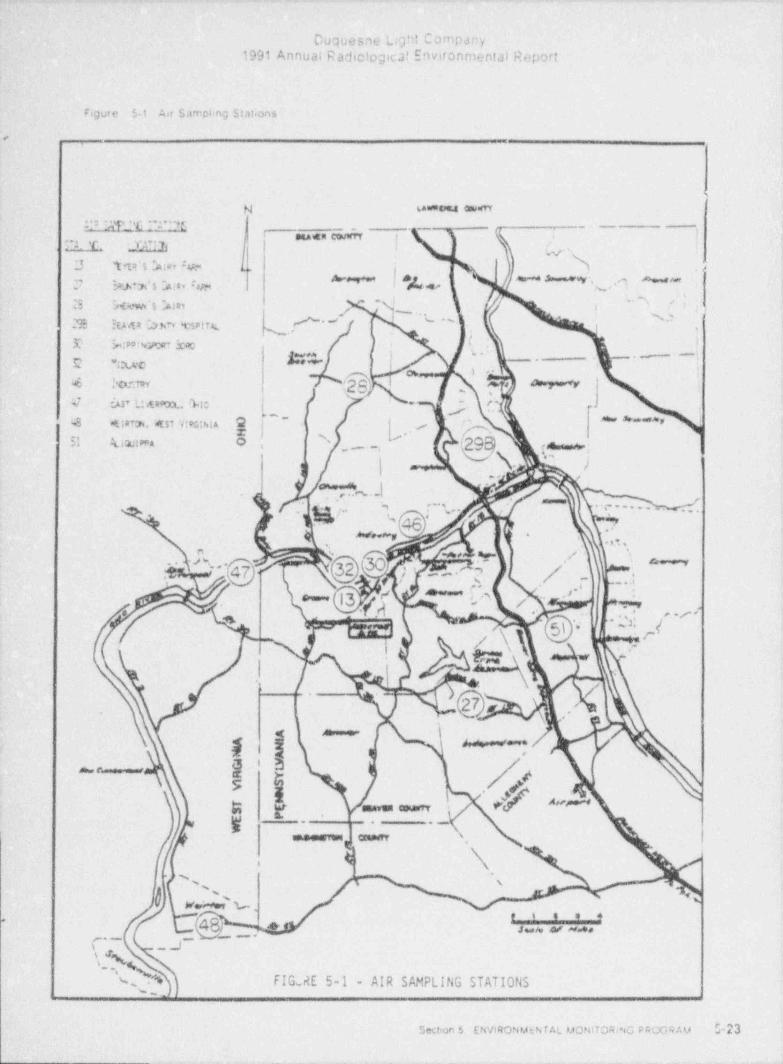
, - . _. .. . . - - - .
lDuquesne Light Company |
1991 Annuai Radictogica! Environmental Report '
Figure 51 Air Samphng Stat.ons
( ,
!.I
H v*ous mm'
ro e c-r'n- .
_ 1 I ii mac ewwrr ,
ill m | ' : ig. ..
j# h .k-3 'te's Ney Fe.
l 4 ,/ " "v's , 'S"" " " ~? u r>>s N ., rw,
I / "N /I,23 5,< v e 's N ey *,' ''
I '':9s su c c w v u ,rt . , - ' ;'-
,
E 5,,:nwe.w See (. I*'
i, e ,
-- -j|2;;% 5--
p ,,, _.
!.. W e_* For:w fag; 7
f 3 (,
4 Usruven %: * -
4 ner:r.. <st V:ec:m Q J * " - " * * I~ ~ ' ~,
51 - w :*4 5 N ~~
gwi , , , _ , _ _ ,
y i s ,;,,
1 C^ l"
'
., , ,- ..y... .,. ...,.' '
1 u s,46' - I?'
.
i .t,,
o r w w t / .\
,[ * |n. |'. t /' f'
'',
''
|3 g N ~ L. ^ 4/ ,
, .i.4 ,.-( . . . ,j* - -.~_
,
A = \,,,
i - 3'
@ ,
\ p-.
1 ^****
h1 ~ - - ~ ~ , .' ,/,_
q
$' - k law
[ k /_ '
: ~~''
L g' '
. , ._
' mm s.
k ki i /- HL\ ,
A 'sV wn' u. <*' .
.
& 2sen neeo, . - -
I
t[%\.4'% % FIG rlE 5-1 - AIR SAMPLING STATIONS
|w__
Section 5 ENVIRONMENTAL MONITOR.NG pr,0GRAu G-23
. _- - - . . -

_
i
P
Duquesne Light Company1991 Annual Radiol _ogical Erivironmental Report
| Strontium-89 andi Stry.ctium-90 activities are determined in quarterly .,
_com_ posited air particulo s filters. Stable strontium carrier is added to thesample and it is leached in nitric acid to bring' deposits into sobtion. The-
- mixture is then filtered. Half of the filtrate is taken for strontium analysisund is reduced in volume by evsporation. Strl , tium is precipitated as
' Sr(NO )3 . using fummg (90%) nitric acid, An iron (ferric - hyoroxide)3
scaven0e is performed, followed by addition of stable yttriurn carrier and a5 to 7 day period for . yttrium in0rowth. Yttrium is then precipitated ashydroxide, is dissolved and re-precipitated as oxalate. The yttrium oxalate
-is mounted on a nylon planchet and is counted m a low level beta counterto infer. -Sr-90 activity. St-89 activity is determined by precioitating SrCO,
3
from the sample after yttrium separation. This precipitate is mounted on anylon planchet and is covered wi'h 80 mg/cm? aluminum absorber for levelbeta counting. '
. 3. Results and Conclusions
A summary of data is presented in Table 5-2. ;
a. Airborne Radioactive Particulates,
, A total of five hundred t'venty (520) weekly samples from ten (10) locationswere analyzed for gross beta. Results were comparable to previous years.Figure 5-2 illustrates the average concentration of gross beta in air ;
- particulates.
The- weekly. air particulate samples were composited to one hundredtwenty (120) monthly samples which were analyzed by Gamma i
: spectrometry. Naturally occurring- Be-7 was present in every sample..
Occasional traces above detection' levels of other naturally occurringnuclides such as K-40 were present. These are listed in the summary
Tabte ' 5-2.'..1,
A total of forty (40) quarterly samples were Mach analyzed for Sr-S9 and~
St-90. No Sr 39 or Sr-90 was detected.''Based on the_ analytical results, the operation of Beaver Valley Power
Station did not contribute to_ any increase in air- particulate radioactivity- during CY 1991,
b. Radiciodine -' '
A total of five hundred twenty (520) weekly charcoal filter samples were<
analyzed -for 1-131. No--detectable concentrations were found at any,
locations. -
Based on analytical results, the operation of Beaver Valley Power Station-did not contribute to any increase in airborne radiciodine during CY 1991.
.
,
5-24 Shu.on 5 EW!RoNMENTAL MONToRING PROGRAM'
_- -- _ . . . . - . _ - . ,

. , _ _ . , ..
- _
,,_ .,,,; -''t 7#.'
:
cr,
..so.
s.'
AVERAGE CONCENTRATION OF GROSS BETA IN AIR PARTICULATES - 199: '*:
v. ~
> j. . _ . . . _. _ .,...-w
%....e. e... ..m . . ~ . . , . , . ...._.y.,. ,, .g
.v.3a u. . . .
_ . . . . , ._ ._... _...
<-_. _.. . . _ . . . _
_ . . _ , . _ . . . , . ~ . . . _ . . - . -. . - . . . . . . _ . c_. . . . . - . _ . . ,. . . . g.
~ _ . , . - . . . _ ..m...a+.,y.. . ~ . . . . .o- .. . + . . , ,. . ,,. ~. , ,, Qc
. - _ . ~ . . . . _ . . . . _ . . _ . . ~ . _ . _ . , . .._ ,.. .
j..w. .. ~.4.o<
, .. .. - _ . ~ . . _ - _ . . . ~ , - . ~ . _ _ . . . . . . ._.
'o' p>n_ . . . . . m.,,.-_
_ _ . _ .;_ ,- . . . . ._~a . . _ ~ . . . - . . . . . _ . . . 3 .a' , e
, o_ . . . _ . . . . . . . ~ . . . _ . _ . _ . _ . . . . _ . . . -.- _ *
.
g"i, 2 >>
O_3
' -3
O.1 . . _ _ . _ _ . _ . . . _ _ . _ , _ , . _ . _ ._ . . _ _ . . . . _ ._
. , . .
C) C
a '_ E a -. _ _ . . .,_m. - . _ . . - . . . :.,..... ,. . _ g
, ., m_ .~.~...m. . . - ..--...m.~ . ,_ . . . -
~. . . . , . .. m_ yg~ . . ~ . _ . ,
. .
p
~ . _. g> -
. . . . ~ . . . . e g4|E
.._.... ._;_ ..~ _ . - . . . - . . . . . . . . _ _ .. _ n, o v2 -. o
2 o e3. _ . _ _ _ _ . . . . . _ _ . . . _ . _ . . - . _ - _ . . . . _ - _ ..
-
! ?g~=y - . . - - . - . . - _ . . - . _ . - _ . . . . . - . . . _ - . . _ ..-. - - . - - . -. g3.
Q _. _ . _ . . _ . . _ . . . . __ . = . _ . . . _ . _ . . g _._
0.01- '
.am . . . . _ . . _ . . __ .__ . - _ . . . . ~ . - . _
, ,#2 w. . n, . . _ +. . , , . . . > . - . , . . . - . > . .n.- c.._.- .49 _$ . - . . ~ , . . - , _ .- . _ - , . . . , , - , ..+- . - . . . . - - . - -, m. ..-i.
-~
b_nO ~ ~ ' * ^ ~ ~ ~
' ' ~ ' ' ~ ~ " * . _" ~ ~ ' ~ ' " ' ^ ' ~ ~ ~ ' ''' " " ~ ~ ^ ~ ' ^ ^
~.' x' ~ ~ ' " "
2,,._.- _
, . . . Cm u2.4
_. _~.- _ . . . - _ . . . . . . . . .. . - . ~ - . o=.,> *=e
r*. , , . , . ,.,..a,. ... ~ - - . - . . . .
o2a
@ 0.001=
2 Jan Feb Mar Apr May Jun Jul Aug Sep Oct Nov Decn .
OOa>C
(n.
NUt
. ._ _ _ _ _ _ . _ _ _ _ _ _ _ - - - - - - = - - - . - - - - - - -

,
<1
Io Duquesne Light Company -1991 Annual Radiological Environmental Reportm
[ a-
C. Monitoring _of _ Sediments and Soils (Soil Monitoring is required every 3 years and was,
R required in 1991)'
E
L ti Characterization of Stream Sediments and Soitsl.
|. The stream sediments consist largely of sand and silt. Soil samples may vary| from sand and sitt to a heav/ clay with variable amounts of organic material.i
i 2. _ Sampling Program and Analytical Techniques
a. Program -
River bottom sediments were collected semi-annually above theMontgomery Dam in the vicinities of the Beaver Valley discharge and
| above the New Cumberland Dam. A Ponar_ or Eckman dredge is used toL collect the sample. The sampling locations are also listed in Table 5-1
and are_shown in Figure 5-3.
| Soil samples were collected at each of ten (10) locations during 1991. At-1, each location 12 core samples (3~ diameter by 2~ deep) are gathered at
prescribed points on a 10 foot radius circle. Each location is permanentlymarked with reference pins. Each set of samples is systematically
, . selected by moving along the radius in such a manner as to ast,ure!- representative undisturbed samples. Sampling locations are listed in; Table 5-1 and are shown in Figure 5-3.
Bottam sediments and soils are analyzed for gross alpha and beta activity.strontium, and the gamma-emitting radionuclides.
b. Analytical Procedures
Gross beta - sediments and soils are analyzed for gross beta by mounting(. a 1= gram portion- of dried sediment in a 2" planchet. The sample is| counted in a low background, gas flow proportional counter. Self
- absorption corrections are made on the basis of sample weight.
Gross alnha activity of sediment or soil is analyzed in thp same manner asgross beta except that the counter is set up to count only alpha.
!
Gamma analysis of sediment or soil is performed in a 300 mi plastic bottlewhich is counted by a gamma spectrometer,
s
.
!
i
,
5-26 Seaon 5. ENVIRONMENTAL MONITORING PROGRAM

._. . _ . _. . . . ._. __ -_ _ _.
IDuquesne Light Company1991 Annual Radiological Environmental Report
Figure-53 Enytronmental Momforing Locations - Shorehne Sediments and Soil
. , , . .
N N8"-
5.;s t:sg it :wts'$ _ 7 >,
sem en otuwTV | ;
h. .,iMGL( f
*0f9" ".Sta''Og
2a Oc ast*eam titi ht'all MP %, "8"""*'''*F'- , .q ;M'a4
4 .:st*eam si:e af .
.'' ) 's|'.,
/K Q~ g,,, {! N "w '
ortgorers :4mw
50 ;: stream itae of hw
[ jCece*1aad am ,,
121.L f A
~ ~t- 24 L g ,,: -
3,, g80!ht L$catt;m j -- g
_
*-
1) m yer's Fam s.e22 Soutn of SvP$ Site ". r'
$0 .g *~d " % .-a .. e pI
O N ,/' 'J- . 30 .Socatagocet. Parh;'
32 utstand. PA i . -- i46 Industry,-Pa - b. )a7 t. Liverooot, os
| | | e---as .eirtoa, ..va.
. 51 att u u., Pa ,, ji . . # ', %, , g.
/ -c~~ ..,,
,
m6 I. '
,
A.,h j f / ', %.-..
d /,,
1 -J,
o '' = ~ ~ [c - .r' ;
--' '
= = - . .\i <3 *v=,l.2 ,
.s ./-..
i.
% 51 'n 4~
I \ !'
/ . . . .\'
*
a
momea,
!. h -- ^/-
4*
g | . J. - I d - -3 .
. .
**seum, teuer .
N \[i . e'
,
1. '
f % *v ' wm' L.,
,ie e +8 s~~*
-_.
C. _. J FIGURE 5-3 - ENVIRONMENTAL MONITORING LOCATIONSg
' SH0 RELINE SEDIMENTS A L 50ll- . ,s ., .
%. I
section 5. ENVIRONMENTAL MONITORING DROGRAv 5 27
. _ _ _ _ - . _- ._ .

.
. - - . - . . - - ,- ,. -. .~. ..- -. . .
T
Duquesne Light Company-1991 Annual Radiological Environmental Report
,
-|
- Strontium 89 and 90 are determined by radiochemistry A wei hed sample0' of sediment or boil is leached with Nitric' Acid'HNOp A~ stable carrier is
added for determination of - recovery. Strontium. concentration andpurification is ultimately realized by precipitations of strontium nitrate in- !
. fuming nitric acid. Additional hydroxide precipitations and - bariumchromate separations are also used. The purified strontium is convertedto a carbonate for weighing and counting. Samples are counted soon after j
separation (5 - 7 days is allowed for yttrium ingrowth). Activities are ;
calculated on the bass of appropriate Sr-89 decay and Y-90. Separate I
mounts covered with a 80 mg/cm2 aluminum absorber are used forcounting in a low background beta counter.
3. Results and Conclusions 1
A summary of sediment and soil analysis is presented in Table 5-2..
a. Sediment
A total of six (6)-samples were analyzed for gross alpha and gross beta.Results were comparable to previous years.
. A total of six (6) samples were analyzed for Sr 89 and St 90. No Sr-89 or -Sr+90 was detected.
A total of six (6) sample were analyzed by gamma spectrometry. Naturallyoccurring K-40.- Ra-226, and Th-228 was found in every sample ano. Be-7was found in two samples. Small- amounts of Cs-137 from previousnuclear weapons test,were found in all river sediment samples ' including
. upstream above Montgomery Dam, which are unaffected by plant effluents.- Small amounts of Mn-54, Co-58, Co-60 and Cs 137 were detected in the
~
Beaver Valley Power Station discharge area and are attributable to station- releases. The-activity found in the station discharge area is consistent'
j with station data of authorized radioactive discharges. which were withinlimits permitted by the NRC license.
The analyses demonstrate that the Beaver Valley Power Station did notcontribute = a significant - increase - of radioactivity in the Ohio Riversediment. The positive results detected are attributable to authorized
; releases from the Beaver Valley-Power Station and-are characteristic ofthe effluent. These results confirm that the station assessments, prior to
'
authorizing radioactive discharges, are adequate -and' that theenvironmental monitoring program is sufficiently sensitive.
.
b. Soili
Results of soil analysis are comparable to preoperational data.
,
a
; 5-28 sectm 5 ENV1RoNMENTAl. McNtTORING PROGRAM
-. - . _ . _ _ - - -. - - - , _

Duquesne Light Company1991 Annual Radiological Environmental Report
D. Monitorir.g of Feederops and Foodcrops
1. Characle'rization of Vegetation and Foodcrops
According to the 1990-1991 statistical summary of the Pennsylvania Departmentof Agriculture, there were approximately 570 farms in Beaver County. The totalvalue of farm crops and livestock was $17.093,000. The principal source ofrevenue was in dairy products which were estimated at 57.386.000. Revenuesfrom other farm products were estimated as follows:
Field Crops | 51,478.000
Fruits $222.000.
Horticulture and Mushrooms S3.533.000
Meat and Animal Products 53.384.000
Vegetables and Potatoes $592.000
Poultry Products S132.000;
The total land in Beaver County is 279.020 acres. Approximately 147,900 acresare forested land an 59,063 acres are pasture and crop land.
2. Sampling Program and Analytical Techniques,
a. Program
Representative samples of cattle feed are collected monthly from thenearest dairy (Searight). See Figure 5 4. Each sample is analyzed bygamma spectrometry. The monthly samples 'are composited into aquarterly sample which is analyzed for Sr-90.
A land use census was performed. August,1991 to locate the nearestresidence and nearest garden of greater than 500 square feet producingfresh leafy vegetables within a five (5) mile radius of the site _ SeeTable 5-5 for results.
Foodcrops (vegetables) were collected at garden locations during thesummer of 1991, Leafy vegetables, i.e., cabbage were obtained fromSt.ippingport. Georgetown, industry, PA and Weirton. WV. Atl sampleswere analyzed for gamma emitters (including 1-131 by gammaspectroscopy).
Section 5 ENVIRONMENTAL MoNITokiNG PROGRAM 5-29
-

.,;,>- ' ,t ,
_.
__.
.
m_. of* . r* -@-
_
-.
_
$ p,cE Eb.*g%m$ 35x ~~
.
-
2 ,L [o5ai , $ e ,j5 hf 3 sE " u 5=
.-w
,_
g -g
s ,7N\,> M,k
AT '. R ,_-
n cR.D $ aO ', G
Oa R _
P t ' P6 o GY nV
&*y 'G S-
on N NR' B. p
I O/R =
R Ic p _ O T_
oG pr- J 2u T A
f, g & I C
'-c N O _
g, f. Q c-Ae O Lq , Mg
Er P_r
n ., O RS f A Rt L O e
o T C
Mc,
\ \ N DE OM ON FOR DI NV A
, NE P
O' Y
- RC-
|I |- 4 D
u g - E
_l | ',% 5 EF
E
_ RU
- m - GI
TA- t
n *- i
.M
-
+(4 W o,Nl
m.- %,. Y'
-
M r.
%wl
ON
'
|
% \'_ kRwE o
rV e gI gmR n g r
o ac F
O Q y n y
g e rg,# d i, g
mr a-
a 3c 'sn e '4 e
a d,l t pb h oa grL e
Cst i ce rdg a ee cev OF_
*W:* o. - -
.
uu
O , ,T V u hh- !.*
LN: I - S
ENM e3
O bm WV-
- Y' 8 - f $2c x? ekyzo ;!E
, '

. _ _ . . - - .. . _ - _ - _ _ . - _ _ _ - . _ - _ - - - _ . _ _ _ _ _ _ _ _ - - _ - _ _ _ _ _ _ _ _ _ _ _ _ _ -_
Duquesne Light Company.1991 Annual. Radiological Environniental Report
_.
. Table 5-5.. Closest Residence and Garden in Each Sector
e
- TABLE S-5.
Clo est Residence and Garden in Each Sector,
--S ector Closest Residence * - Closest Garden *
1 1I55 mi N 2.01 mi N .
'2 1.59 mi NNE 1.61 mi NNE.
3 __ 0.42 mi NE 0.53 mi NE .j
4. 0.38 mi ENE 0.93 mi ENE ;
5 0.42 mi E 1.93 mi E
6 0.87 mi ESE 1.00 mi ESE
7 1.10 mi SE 1.78 mi SE
8 1.10 mi SSE 2.84 mi SSE |
3-- 1.40 mi S . 2,16 mi S 1
10- 0.80 mi SSW- 1.55 mi SSWt
__
11 1,46 mi SW-- -1.67 mi SW
12 '1.46 mi WSW 1.46 mi WSW_
13 2.27 mi W - 2.27 mi W
14- 2.77 mi WNW 2.96 mi WNW
15 -' O.91 mi NW - 0.92 mi NW.
16- - 0.91 mi NMW 1.29 mi NNW '
< * Direction and Distance from Midpoint between Reactors-'
.c [ [ =
Section 5. ENVIRONMENTAL MONITORING PROGRAM 5 31-- . . - . _ ._ .. . , _ . ._ __ _ _ _ _ _____ ._ _ ___ _ _ ___ _ ____ _ _

.
l'
Duquesne Light Company1991 Annual Radiological Environmental Report
,
!
| b. .' Procedures
L Gamrpa emitters, including 1131, are determitied by scanning a dried,i homogenized sample with the gamma spectroscopy system. A high
resolution german'Jm detector is utilized with this system.
Strontium 90 analysis for feedstuff is performed by a procedure similar tothat described in 5-C.2.
L
L Radiciodine (1-13] is determined by radiochemistry. Stable iodide carrier! is first added -to a chopped sample which is then leached with sodium! hydroxide solution, evaporated to dryness and fused in a muffle furnace.
The melt is dissolved in water. filtered and treated with sodium
p hypochlorite. The iodate is then reduced to iodine with hydroxylamine| hydrochloride and is extracted into chloroform. It is then back-extracted
as iodide into sodium bisulfite solution and is precipitated as palladium|- iodide. The precipitate is weighed for chemical yield and is mounted on a
nylon planchet for low level beta counting.,
I
| 3. Results and ConclusionsnI
i
A summary of data is presented in Table 5-2.
a. Feed!
A total twelve (12) samples were analyzed for 1-131. No detectable.
concentrations were found.
! A taal of four (4) samples were analyzed for Sr-00. Small amounts ofSr-90 from previous nuclear weapons tests were found in all samples.
A total of twelve (12) samples were analyzed by gamma spectroscopy.Naturally occurring K-40 was found in all semples and Be-7 was detectedin four (4) samples.
b, Food
A total of four (4) samples were analyzed for 1-131. No detectable| -- concentrations were found.|;
j_ A total of four (4) samples were analyzed by gamma spectrometry.j Naturally occurring K-40 was found in all samples.|
c. The data from food and feed analyses were consistent with (or lower than)those obtained in the preoperational program. These data confirm that theBeaver Valley Power St$ tion did not contribute to radioactivity in foods andfeeds in the vicinity of the site.
|
|
i:|
!
5-32' sw ,n 5. ENW4oNMENTAL MONITORING PROGRAM

~_.. . -. - . . _ _ - . . - _ . . - . .. - . _ __ - _ -_ ..
Duquesne Light Company I
1991 Annual Radiological Environmental Report |
E. Monitoring of Local Cows Milk
'
1. Description - Milch Animal Locations-
1
g During the seasons that animals producing milk (tmich arumats) for human I
consumption are on pasture, samples of fresh mil are obtained train these ,
ammals at locations and frequencies noted in Table 5-1 This nulk is analyzedfor its radiosodiae tentent calculated as lodine-131. The ana!yres are prforrnedwithin e'ght (3) dayF of sampling
Detailed ficid surveys are performed during the grating season to locate and'
'
enurnerate nutch animals Within a five (S) nulo radius of the site. Goat herdlocations out to !!!!een (15) miles are identified. Survey data for the most recentsurvey conducted in August,1991 is shown in Figuro 5 5.
< ,
-2. Sampling Program and Analytical Techniques..
a. Program.
Milk was collected from these (3) reference dairy farms (Searight's,Brunton's and Nicol's) within a 10 mile radius of the site and frorn one (1)control location (Windsheimer's) outsido of the 10. mite radius. Additionaldatries, which represent the highest potential rmik pathway for radiotodmebased on milch atumal surveys and meteorological data were selected andsampled. These dairies are subject to change based upon availabihty ofmilk or when more recent data (milch animal census) Indicate otherlocations are more appropriate. The location of each is shown inFigure 5-6 and described below.
, - -. -. - .. . . _ . . _ ,
"Direction and Dislam from CollettsonMadpomt between 4 < ,tters Period
-- --4?f, Searight 43 Cows 2.2 moes Stu Jan Dec
' 2T Brurton 03 Cows 7.3 moes SE Jan t.
20A Ncoi 70 Cows - 8.0 m ies NE J.m Dec j-- .-
90 Wmet he nier $3 Cows 10.3 moes SSW Jai oet.
301 " Teres: 1 Goat' 2.6 Wes E May sept.
tc?' F erry 4 Goats' 3.3 maes sE F en * Oct-
^131 Vosen iCow 0.98 moes ESE
1DM* fordyce 2 Goats' 2,50 mues NNW
_
.. 10$" Ambrose 38 cows 3.86 mees wbW Nov
1s/106 " 1 Conrta 33 Cows 3J5 moes wSW gg j.
m .- .
f 108 poyd. 2 Goats 4.28 moes Nw" *
,
'
''' M4 Osage + Nome Oniy.
** Negr+est po'ertal namway da4 ries
Section 5 i NVIRONMENT A'. MONITORING PROGRAM ' . *
, . . _ _ _ _ . - _ . _ _ _ ._ . _ . . _ . . _ _ , _ . . . . _ .__ _ _ _ _ , , . _ . - . . . _ . . . . _ _ . .

. -.
Duquesne Light Company1991 Annual Radiological Environmental Report
figure 5,5 Bem er Vaney ro.er si.. tion Milc h Animal (engyg
# s
I BE AV E R VA L LE Y P OW E RS TAT I O N" * ''''
MILCH ANIMAL CENSUS--q >a
w>
/m. .. - -. ..
Y.Y 1
' f.
../e i V./.
.-
fs ~., , ,,
[ /j ~ Q , g N ,,/ -
..
(<YW '
\'
a5 ~ ~' ..
/ , N '& ;~
d 4
/ .Y/ ..
( $$~. !'- ; ,.
' ~ ''$)| - --
t e q
.- ?% }( . :- q, (. - 4's y-&j i . f ,
-- \. ~
's ~>s
A,..
9 y,e .~.A ' t 'S "y
, . }Q}3ff'0 . %
9
\ f'
':
w %-
\ .ig .g -~ ~
.4 ..
'
L. , '' ^
Q' / ,. . . se
. ; , t ,r - .d-
1 . . .
d d.
v|c % )
1.ma m A 'v;/y# '
ea #
i - /q% L. 3,,,
K p .
\' - _
~
' ' i-,
. ~ ~ /, . . , , ~g W e 4 %.D.,
t * s s 4** * s-~--.
-;____.
r % '7-_
\_ a G O AT S-
's - eCOWS SU MME R 19 91 .
. ~~.
|| s.u s-, , ~ eo,ms m o0~,m.sc ,,m ,,o
| li -1
,

. _ _ . _ _ _ _ _ _ - - - _ - . -_ - - - _
Duquesne Light Company1991 Annu al Radiological Environmental Report
Fig ur e- 5-6 Environmental Monitoring Locapons . uitk
a
._
n v.*vu wan'
l ([*~~ ' _,~~,ue <w.in '
|>
, , . . ,
MILK 3f ag,, '~-
,
-%. ., - |%SAMPLE "'
.s . V . .rN ' - t. . .
. '" \ .'' ' !SITE LOCAT!ON I
\,
i ,25 Searignt i 1; i
'27 Brunton j,;'a j f, --.
29A Nicol a ) 4 1
96 Windsheimer WF I101 Teles: }N
'
,]i -
$, ' ' "102 Ferry g a- m u .,
103 Mosien g 3 g-'
I
104 Fordyce g ( w';i . , - . . ,
105 ArnbroseN | ).
106 Conkle --
108 Lloyd ' Mn...l '-
4 ,.; s vay. ,- ..-..... a-
.
108 's ,;< a.,
w<*~r - i , " , , ,*
" '/' . . , we mee. ! .
4, ^. . ~ y' m7 ,g ,- ,,,.; ^ =~=-s,, u / V. . . . , ,-
.'.>e- .-
, g* 1 f Q,^c,- . ,,,,
*1 *V**s - .. .
! k,
12 7'~
.-3
g'4 i Ah***=e''w.
\ * I
@' ( ia r-
$ [email protected]|. .
i ~bs
*
gy . _ _
',- .
( \< ,
! I s ,, 'sf ' We& %.,
.,r
<~t t e e **
JseAn W ***6e,.. - --
_
%
FIGURE 5-6 - ENVIRONMENTAL MONITORING LOCATIONS' -,
b, MILK'-
sec: ion s ENVIRONMENTAL MONITORING PROGRAM 5-35
. . . - _ _ _ _ . _ . . - . . -

.Duquesne Light Company1991 Annual Radiological Environmenta' Report
The sample from Searight Dairy was collected and analytod weekly forradiciodine using a procedure with a high rensitivity. Samples from eachof the other selected dairies were collected monthly when cows areindoors, and bi woekly when cows aro grazing. This monthly or bi weeklysample is analyzed for St 89, Sr 90, gamma emitters including Cs-137 (byhigh resolution germanium gamma spectroscopy) and 1-131 (lughsensitivity analysis),
.b. Procedure
,-
Radiciodine ' (1131) analyshi in milk was normally performed usmgchemically prepared samples and analyzed with a low-level beta countingsystem.
Qam,ma emitters are determined by gainma spectroscopy of a one literMarinelli container of milk.
Strontium analysis of milk is similar to that of other foods (refer to 5-C 2)except that rnilk samples are prepared by addition of Trichloracetic Acid(TCA) to produce a curd which is removed by filtration and discarded. Anoxalate precipitale is ashed for counting.
3. Results and Cone!usions
A summary of data is presented in Table S-2.
A total of one hundred sixty-six (166) samples were analyzed for I 131 during1991. All 1131 activities in milk were below the minimum detectable level.
A total of one hundred thirty four (134) samples were analyzed for St-89 andSr-90, - No St 89 was detected. Sr 90 levels attributable to previous nuclearweapons tests were detected in all samples and were within the normallyexpected range.
A total of one hundred thirty-four (134) samples were analyzed by gammaspectroscopy. The predominate isotope detected was naturally occurring K 40and was found in all samples. Cs 137 was detected in one (1) sample.
It was r'oted that the dalries with the highest annual mean activities were goaldairies, which are known to concentrate activities over a factor of two comparedto a cow dairy,,
All results were consistent with (or lower than) those obtained in - thepreoperational program.- These data confirm that the Beaver Valley PowerStation did not contribute to ra'dioactivity in mi!k in the vicimty of the site.
5 36 ; Senon 5. ENv1RONMENTAL MoNiTo4ING PROGRAM

._____ _ __ _ _ _ _ _ _ _ _ _ _ _ _ _ _ _ _ _ - _ _ _ _ - _ _ _ . _ . _ _ _ _ _ _ _ _ _ _ _ _ _ _ _ _
Duquesne Light Company1991 Annual Radiological Environmental Report
F. Environmental Radir.tlon Monitoring
1. DescriplIon of Regional Background Radiation and Sources
The tetrain in the vicmity of the Beaver Valley Power Stahon generally consistsof rough fulls with altitude varbrtions of 300 400 feet. Most of the land is woodnt
,
|
The princ$al geotogic features of the region are nearly flat faying sedimentary ;
t>eds of the Penrsylvania Age, Beds of nmestone alternate with sandstone ar'dshale with-abundant interbedded coa! layer s. Pleistocene glacial depositspartially cover the older sedimentary deposets in the northwest. Most of theregion is underlain by shate, sandstone, and r.ome coal beds of the Conemaugh
i
Formation. Outcrops of sandstone. shale, and li;nestone of the Allegheny |
Formation exist withm the Ohio River Valley and along major tributary streams. )Based on surveys. reported in previous annual reports, exposure rates ranged-from G-12 pR/hr Results for 1991 inuicated that background radwfinn contmuedin this range
2. . Locations and Analytical Procedures j
Ambient enternal radiation levels around the site were measured using ,
'thermoluminescent dosimeters (TLDs).i
In 1991 there were a total of forty-four (44) off site environmental TLD locations, j'
The locations of the TLDs are shown in Figure 5 7 through Figure 510. Thirteen(13) locations also have QC Laboratory TLDs. Both laboratories use calciumsulfato dysprosium. (CaSOgDy) in Teflon matrix.
The catc;Jm sulfate (CaSOjDy) TLDs were annealed shortly belore placing the .
TLDS in their field locations. The radiat'on dose accumulated in transit betweenthe field IMation and the laboratory was corrected by annealing control ,
dosimeters shortly before the field dosimeters were removed from the fieldlocation, when shipping the freshly _ annealed control dosimeters with theexposed field dosimeters to the laboratory 'nr readout at the same time. Alldosimeters were exposed in the field in a special environmental holder. .Thedosimetry system was calibrated by reading calcium sulfate dosimeters whichhave been exposed in an accurately known gamma radiation field,
in addition to' TLDs. Pressurized lon Chambers (PIC) provide continuous'
integrating monitoring. Sixteen PICS (Sites' 116) are part of the Sentri 1011Radiation Monitoring System which is a microcomputer based data acquisition !
system. Data from the stat ons are'sent at regular intervals to the CentralProcessing Unit were integrated doses are calculated. In addition there are four. ;
PICS .which are AC. Radiation Monitors. These are inspected weekly for i
integrator readings. The locations of the PICS are shown in Figure 511. ,
,
t
Sectmo $ ENVIRONMENTAL MONITORING * : 54 Av 5 37
, _ _ _ _ _ . - _ _ _ _ _ . - _ - . . . , _ . . _ , - . _ . _ _ _ _ . _ . , , . - - - . . - _ ..-

_ . - _ _ . . _ _ . _ __.. _ _ .___ _ _-- _ . _ . _ . . - _ _. . _ . - _ . - _ _ . _ . _ _
Duquesne Light Company1991 Annual Radiolo0ical Environmental Report
i
3. Results and Conclusions
Data obtair ed with the contractor TLD (CaSO :Dy in Teflon) during 1991 are i4
summarized in lable 5-2, and the quahty control TLD results are listed in
Table 31. Results for the PICS are hsted m Tablo 5 6.
The annual exposure rate of all off site TLDs averaged 0.16 rnR/ day in 1991. Asin previous years, there was some variation among locations and seasons aswould be expected Two TLDs were lost in the field during the year.
In 1991, loniting radiation dose determinations from TLDs averaged !approximately 58 mR for the year. This is comparable to prev >ous years. There I
was no evidence of anomalies that could be attributed to the operation of the |
Beaver Valley Power Station. The TLDs confarrn that changes from natural '
~
radiation invels. il any, are negligible. i
I
ii
,
I
i
1
i-
i.
!.
.
!
)
,
.
.
*
L
.
k
l
S-38 -. _ secten s tuviRoNUENTAi, MONirORING PROGRAM
---. - . _ . _ _ . _ . . _ _ _ . _ _ , . . _ _ . . , _ _ , - - . , , . _ _ - . . . . _ _ _ . _ . . . _ _ _ _ _ . _ , . _ , , _ . _ . , , , . - , , . . - - _ - , .

Duquesne Light Company,
1991 Annual Radiological Environrt1 ental Report '
|,
!
Figure S7 TLD Locations Northment Quastant Be,iver V,elic_. p .0 *,;ationp
*.
!,
iFISlJRE 5-7 TLD LOCATIONS i
NORTHWEST QUADRANT u s< ---
''- - - - - -
" ' " ~ ~
BEAVER VALLEY POWER STATION --
'/ e~M* M1 Md.!ts . .,.i N s3"U.,*,M / ,-I! !! )!!!S.[ 5 /
" s(n,,'" - n.= yI! N UUUj !.!.... N
..........'\............. ..
..|.i g n -.-- j )P!! ii
'
- '
. . . . . ,. . . ;.s . i =4 A
s x w \(-
fs s p,
.-;. ,as , . . . . . . . - . . . . -
.%|-
/ t9. _ ,
| ,
's .,, ,
.'
4 s .
*. /
| \ 90 , y ;-- -
.'J .
{''
;,.,, .. .
.
ts,,,,, s
, Q' /p ~-x. .: .
sJ.~'. y y
.-
p - ]a * '; ;~: ,.
--
| | ./ .'b < .
x /...(.a r.(A ; __%)' '
' '
(....y\ ,, ji s ,b,
,,
. . . . . . . . . . . , . y. ,.,w ,,, ;.
. ,
......... _g, f , , ''z\ , .,i.:
~ '
''+.,,- .., . . , ,
x /. ., ,/vi - ., \s
/(~, .~ , .
| _ ,,-
I.
I W s'':.,.' W* T,, _
f Ab
i
, ..g;1%, j " '
&_ y== ~jJ; \" \ g ".x ,
! '
\> g , byy%.
.
x.e
y'~~.
' -s.. - N / s l' N
s
t
'g! -(x , . -,
b *.\\ ',, r2 - -x n . ,.-
Section 5. ENVIRONMENTAL MONITORING PROGRAu 5 39
. . .._. . _ - . ..- _ . _ . - , __- __-

Duquesne Lrght Company1991 Annual Radiological Environmental Report
r,gwe f.s TLD Locatont Nmtbeav' Ou;drani beaver vailey Power statiae,
5
.--_w
FIGURE 5-8 - Tl.0 LOCAT10h5NORTHEAST QUADRANT.a
BEAVER VALLEY POWER STATION= - - - - . ~ m... a.p -- ,
' ''x - - .n4 e* e e
|N..,_
'
2 ' ~ ,. 6- --
Q $'uQN f n : . .-' -
. ..
u . . , e . .. >>n. -.,
/,.
js a :, ewmu -'
Y -~~< = s+ . , ,
| ' *| . ,
P :, (j ., (, ' L f Q (/hs\;\ mq q .. .v*( <
, s. .w- ,~ ,O/ q' x N
.
% x6 x- -
t '
-
s > .
hw? '. *
.s %.
, .
5
h% y''
;,, p
, , - cp,9/~. : .x ''- vg~ , .
h;,,
.._., . -
/-. g ... -
,/-
-- @ s'
~ v / ,
A( K [,.
k' ' ~ ~.{'" \ .-r x,,
,.. ,
.h jW %. sp
D bg "/s ") \l 7,~~ "\
%* ' 3,,
. p y- b. . A "-
-.
.
^J * ,,/ . ,
I* ?., \ St j '
# ~f - ,* 9 g. ,
',
i 2 -u . Itce-N. c~,7< ; . .
| .'
f. ,,m.. I ,
'
' 'In .." ~~-n\ . + ,
,
, ,
l, , . ... .
2 . r .. ,, t -\ N 3- s .-s ,
. , \i / 3- ( '0 '\ l_.3 w~~
*'
sn
. ''[ \, ,/ ,o ,
,'' ~r. - j ' $ / f%
5-40 sect,on 5 ENvinosutNTAL WONITORING PROGRA*Jj

, . _ m. _ __ _ . . - - _ . _ _ _ _ _ . . _ m.. _
Duques te Light Company1991 Annual Radiologrcd Environmental Report
Figwei $.9 TLD 1.outions Aoutheast Ova. iant Beam Valley Powot Statiori.
I
\,.
..
i
n n r ' /n. x . .s . . . . m < .. c.s .
'f "s ?"% ,'
Q. \ - w%M p"hh- 4.[.7 .,.' OC \_k. '
h ( } ! .- .|'/''
. (/'M .. . '
iM-- <%# ! X
.
T. s ..- @ - . > e~ . > ,; m, . < , , ..,
) " ' ') , ,,/ )"$. 4 #
; , ' r' ' to , .. ~ ) 1s rfj,*8 -
-j-f [^, _ -f'R ia ,4 e s <. n_
, (,w .-,
.
,,)*, ~ - , .. -
;~ ,,p.i.@
n, .- g . -
a . ,.
~s ,
/ r, x ,. .sei
k
.e y4 an$
.
. . _
..,. W s , 9 $ 1, ( q |, s. c
'
*
y ,j , e. . . . , . . .
',; . -
'
a ) ' p9 5<
Mg \' "t < F,,
'\ .
-
3 %g g 'x !4 .
N. O 'p Q .
''
'' 6s.
, ,
@g y,-.+.. .......:. . . . .
j q . . . . . .s . . .N., ,q,y, ./' f
/ ,
,. .
T's\,
; -
s, ie ac-- - ,s.
..
_
j1 , ,
s\ 3 ?.. .
. . .p.{~_c,
/ ;.
( _ , - ..-,
0{ \'t i N'-
.
'" \ 'sfp,i@|yr& n ,~7_u ~j . ) V
f~"' ' v
(/.. .A-w v rm,
f . _ _. ,
\lI k ,'.... L. '1' s , --- ! 'l 0 " ,7;;*... 3....
. , .... ... n .e (j g > g.g;: 4 ,.,y ,.
\ : a : = : ~;.: r - -~
.L ! '! "!!' ##. m
- -
. : ::..
,.: c_,::=\ - .,-
, . . , . . . ,
e'/\
d i FIGURE S-9 - TLD LOCATIONS'
. _ _ _ _ _ _ .~
SOUTHEASE QUADRANT_
- - -
' " ' ' ' ' ~ " *BEAVER VALLEY POWER STATION,
section s ENvinoNu(NTAL MONITORING PROGRAM 5-41
- . .-. - . _ - - . - _ . _- .. -, . _ , . . -

.- _ _ .- . . _ - - _ . -
Duquesne Light Company1991 Annual Radiological Environmental Renert
Figure 510 TLO torat.ons South *e4 C iadrant Oeaver Valley Io*e* Station
i,
'' '' '' 3' #43 / X ,, j .,,
';y x. w_sm,,g_.
, s'
174.~ r /%n . p ,',i .. ~(- ( !m e.........
e/ ,/,
~. ,s
N m .@ . . ' *'m , / s x......... .,
K 9q. V.y ~q > < . . // ~. N/x T 7 , . .q ....,
( .. c4 <g.y y.c a -m , s ,
7aA-<
t-
-%'- -r -c - .x._
h; , ..D " _ ,) '
- msh" ^'
.,
. '\, y, s*
1 s
j' g Ap,
'\[~
% . %,'~
,. s\p|> \
~
\ _ })' ' /{*
) - r N - es s ..
'N hvN* /\
f s ._ x _ _ ,. s3 _ . _ _
s w - _ _ _ _ , _ _ _ _ _ _ - . - --... . ._ _ _
) \ h. /[|_ j l c E (*
,~~ ~
,-
i /\ n- ,
|.
4- i
}<8 / - //.......
>j/.| f.
' s %i s
3 3 s....
,/ f*
' = ~ . ~ ..
/b . g 3,,s ,
ks.,
\si3 [ /g'1'
|'
r n
\ . u_.- . < 'W%.Y. .'11. 4.'.;. ,. || ' . . .
'
rp . . . . ....... .. . .....
ad[#'w'T,.,, K . -), d !! : = ' : = t ,' # HJ - - '
h'N- !!
,'" !!J ;':J:" N4 i'
/u =tJJ'a' '
"
li . :: = ::J"i:::^ - /d :- ' .;.h.t.a..;*T::.! "
' '-
o .. a /,
FIGURE 5-10 - TLD: LOCATIONS -
SOUTHWEST QUADMNT* ' *_ L, ,
'
"* "BEAVER VALLEY POWER STATION
'S-42 section s- ENVIRONMENT L MONITORING PROGRAM- - -. -- .. , --. . - - - - .

cua m n ,t,gn,c ,ny,,n,3 93, 3nnual RdQ'Ological Envolcamon,a; q,, 0rf
|%,. s . , , r ,, _m u.m. . , . . m.,, - m, c m , +.. .
-.
I. < --. % ._
v*g t y , /.
... ,
k@$ ' ' .
/ ,e[ t ,wQhk \ \.
. , , e ' _io % a .sh
~ni'k \ -
N j k( e ';;- \ j|saa gi\
*f bi.1
, '
# s / jeso r \, ,
Ch k 's O~
' s.g\- /y. \., N
,'.s
i na=g g !,
gh ( 's '~ , ,
8g - Tass '\ ,A
; .s 1,
S 'e C':.
1r: s y\
.
-j u._s
x |s
\ h 8 .. (inN
'
'
\
( /,, ,()NV ...ai ~ ,' ' * * * * " * " ' ,
. @9I|/
,
I II ./m
h f s,/s
,l,%)YY-/
> s \s- /d ' ~\ .
,../-p,.d ,s: , ., 4,
3
y(-
*
: ,
\'-
9}o
v s ; \M| ) f3 _
11./'' mc ,
N ./ |/,? k.)- y @a|. _/|
'*
I'
N.||,'
g' -w x.
J ,/ (a '
.
>
j~.' //*
5 $.. Q / , / 5' \,
. ...,.... /t.,,,/
-
{if ig/ ,/. ' s~. ', /
,
h28 , <
y }L-
r '-
~3@5* ,
, N,..
'suten 5 ENVIRONMENT AL MONITOR'NG raccq49 g,43
... .- .- - - - . . . . .. - - .

.. - _ _ _ _ _ . _ _ _ _ _ _ _ _-- _ ___ - _ _. _ --_ _ ___ _ --. _ _ _ _ _ - _ _ _ _ _ _ _ _ _ _ _ _ _ _ _ _ _ _ _ _ _ _
Duquesne Light Company1991 Annual Radiological Environmental Repcrt
T$e 5 6 Pressuri;cd lon Cha abets .1941 Results imR' day)
*.
TABLE 5-6
Pressurized toLGhambers 1991 Results (mR/ dam,
Distanceand Direction AverageSite Location from Midpoint (mR/ day) ;
Between Reactors
1 industry Hill 0.5 mi N . 0.188
2 Industry Rt. 68 0.9 mi NNE 0200 '
_
3 Industry 2.25 mi NE 0.104
4 Cooks Ferry 0.5 mi ENE 0,199
-5 Shipoingport Bridge South 0.45 mi E 0.221
6 BVPS Entrance 0.4 ml ESE 0.216
7 Unit 2 Laydown 0.3 mi SE 0.210
.8 Birdhill Road 0.9 mi SSE 0.222
9 Past DLCO Microwave 0.35 m. S 0.209
10 OLCO Microwave 0.35 mi SSW 0.206-
11 .Meyer's Furm 1.45 mi SW 0.228
12 J&L Steel Tie 0.75 mi WSW 0.216
13 F. P. Microwave 1.5 mi W 0.182
14 Midland Substation South . 0.6 mi WNW 0.212 ;
15 Midland Substation North 0.75 mi NW 0228- ,
16 Sunrise Hills 1.1 mi NNW 0.202-t
AC-201 Raccoon Municipal Building - 2.4 mi S E O252
AC-202 Kennedy's Corners 2.0 mi NE O240
Z 054- Hookstown Substation 2.9 mi WSW 0.254
Y-028 J&L- 1.3 mi NW 0.166
i
5-44 Section $ Et4VIRONMENTAL 40NITORING _PROGR Au.- _ ._ _ .._ . _ - _

. .. . . . . . _ _ .- - . _ _ _ . _ _. . . _ . __ _ . . _ . . _ _ . __ _.,
)
Duquesne Li0ht Company1991 Annual Radiological Environmertal Report ;,
G. Monitoring of Fist. |'
1. Description ;
;
!
During 1991. fish collected for the radio:ogical monitoring program included |bass. carp. catfish. sheephead and shad. ;
2. Sampling Pro 0 ram and Analytical Techniques
a. Program
Fish samples are collected semi _-annually in the New Cumberlar'd pool ofthe Ohio River at the Beaver Valley effluent discharge point and upstreamof the ' Montgomery Dam. The edible portion of each diffrront species .|caught is analyzed by 9 mma spectroscopy. Fish sampling locations areshown in Figure 512.
b. Procedure,
t
A sample is prepared in a standard ta'ud 300 ml clastic bottle and scannedfor gamma emitting nuclidas with gamma spectrometry system whichutilizes a high resolution germanium detector.
3. Results and Conclusions
.
A sumtnary of the results of the fish monitoring data is provided in Table 5-2. )
A total of nine (9) samples were analyzed by garnma spectroscopy. Naturally ;'
occurring K 40 was found in all samples.
Tho' analyses demonstrate that the Beaver Valley Power Station did notcontribute a significant increase of radioactivity in the Ohio River fish population
.
E
4 4
1
4
i
sea:on 5 tavlRONMEN1 AL MONITCRING PROGRAv 5 45
. . . - - - . . . _ . - , - - . . . ...- . . - . - , . . , . - . . . . . - - - . - . . . - _ _ - . , . _ - , - ,

- . - .. . _ _ , . .. . - . . . -. . - = . - . . . . -. . _ - - .
Duquestie Light Lornparty1991 Annual Radiological Environmental Report i
Figure 5 12 Environmentai Mon tonng Program . Fisn Sampling Locatic,ns
ss. ,
\, , f **' * % * # {a
n d., N
x 7 s. .. . =t N 5 5 0
.
f( hbI e4| *
6 5 j jBs
e o p tse .2
' '
hos, Ig q ,' ei g|g$Y /
i s td'i. d: E
. .
"e . a =
E $r .
/ u-
-- -
o / @ 2,_.._ J ,
i - / m~| \/ E9 2 '
| 4 .
w
j S 1ssf-- p?eg .
9.
| / 0
L $_
2 x-,
', t
- ,
tt 2 2 1I =to to e
=%, 2 :? [$3 || % S$ I
*
c s t.: 2-
> := .
$$g. E ut $
efc433 E
i** *
a g..
M h\ b e; %5 i e\e m -- 's _ .
O 'G i
5-46 Sect on 5 ENV!RONMENTAL MONITORING PROGRAM
.
g- t , n,- ---- ,wg~,r ,-m, gn ..,,y,..4-w+.--. --w,- ---p.m--.w., v a m-- - , , . , - . , ,

_
Duquesne Light ( ompan,-1991 Annual Radiological Enveronmental Report
1
|
H. Monitoring of Surface, Drinking, Well Waters and Precipitation ),
i
1. Description of Water Sources
The Ohio River is the main body of water in the area. It is used by the BeaverValley Power Station for plant make up for the cooling tower and for receivingplant liquid effluents. i
Ohio River water is a source of water for some towns both upstream and
downstream of the Beaver Valley Power Station site. It is used by severalmunicipahties and industries downstream of the site. The nearest user of theOhio River as a potable water source is Midland Borough Mumcipal WaterAuthority. The intake of the treatment plant is approximately 1.5 rulles
downstream and on the opposite side of the river. The next downstream user isEast Liverpool, Ohio which is approximately 6 miles downstream. The heavyindustries in Midland, as well as others downstream use river water for coolingpurposes. Some of these plants also have private treatment facilities for plant
- sanitary water.
Ground water occurs in large volumes in the gravel terraces which lie alon0 theriver, and diminishes considerably in the bedrock underlying the site. Norrialwell yields in the bedrock are less than 10 gallons per minute (gpm) withoccasional wells yielding up to 60 gpm.
In General, the BVPS site experiences cool winters and moderately warmsummers with ample annual precipitation evenly distributed throughout the year.The record mean annual precipitation for the area is 36.40 inches based on 1972to 1990 data collected at the Pittsburgh international Airport,
t
e
Lect on 5 ENVIRONVENTAL MONITORING PROGR AU 5-47-m, _ . - . - .-

_.__ __.m . . _ _ _ - _ . _ . _ _ _ _ . _ _
Duquesne Light Company1991 Annual Radiclogical Environmental Report
2. Sampling and Analytical Techniques
'
a. Surface (Raw River) Water
The sampling program of river water includes five (5) sampling pointsalong the Ohio River. Raw water samples are normally collected at theEast Liverpool (Ohio) Water Treatment Plant [ River Mile 412] daily andcomposited into a monthly sample. Weekly grab samples are taken fromthe Ohio River at the followmg locations: upstream of Montgomery Dam[ River Mile 31.8); and near the discharge from the Beaver Valley Power *
Station [ River Mile 35 0]. Two automatic river water samplers are at the |'following locations: Upstream of Mont0cmery Dam ',; River Mile 29.6); andat J&L Steel's river water intake [ River Mile 36.2]. The automatic sampiertakes a 20-40 mi sample every 15 minutes and is collet.ted on a weeklybasis.. The weekly grab samples and automatic water samples are
i
composited into monthly samples from c1ch location. In addition, o
quarterly composite sample is prepared for each sample point.
Tne weekly composites from the automatic river watbr sampler upstream i
at Montgomery Dam are analyzed for 1131. +
The monthly composites are analytod for gross alpha, gross beta, andgamma emitters. The quarterly composites are analited for H 3. Sr 89. )
Sr 90, and Co-60 (high sensitivity). )Locations of each sample point are shown in Figure 5-13
b. Drinking Water (Public Supplies) '
Drinking (treated) water is collected at bnth Midland (PA) and East,
Liverpool (OH) Water Treating Plants, An automatic sampler at each'
location collects 20-40 ml every 20 minutes. These intermittent samples i
are then composited into a weekly sample. A weekiy grab sample is alsotaken at the DLC Training Building in Shippingport, PA. The weeklysample from'each location is analyzed by gamma spectroscopy. Theweekly samples are also analyzed for 1131.
Monthly composites of the weekly samples are analyzed for gross alpha.gro.3 beta, and by gamma spectrometr/. Quarterly ccmposites areanalyzed for H 3, St 89, Sr 90 and Co 60 (high sensitivity). Locations ofeach sample point are shown in Figure 513.
t
p
;
. 5-4 8 ' Secon 5. ENVIRONMENTAL MONI10R4NG PROGRAM
-. .. . . - - - _ - - . . - . - - - , - .. _.- . - . . - . - - . - . - - . - . . . - - _ - _ - . -

. . _ . . _ - _ . . _ _ _ _ . _ _ _ . _ _ _ . _ . - . ..-..._..__._.7_.--_._-__._...g.
Duquesne Light Cornpany |10')1 Annual Radiologicat F,nvironmental Report [
!
c, Ground Water
Grqb samples ' ware collected each quarter from each of four (4) well-
locations (see Figure 513) within four (4) miles of the site. Theso ;
iutations are: ;
I000 (1) well at Shippingport, PA' |,
tOne (1) well at Meyer s Farm (Hookstown, PA)
,
f
One (1) well in Hookstown, PA [i
Or o (1) well in Georgetown, PA >
;'
Each ground water m.mple is analyzed for Dross alpha, gross beta, tritium,and by gamma spectroscopy. !
d. Precipitation,
?recipitition is collected at Shippingport, PA. East Liverpoot OH_ and [''Weirton, WV. Precipitation when available is collected each week and then
cornpesited into monthly and quarterly sarnples, The monthly samples are,
analyzed for gross bola and gamma emitters and the quarterly composites^
are anal zed for H 3, St-89 and St 90. Locations of each sample point are/
chown in Figure 513, i
r
'!
$s,
!i
t
'
t
9,
I
r
i
r
P
$
9
%
secton s ENVIRONuENTAL MONITORING PROGRAM - .5-49,
. .- - . . - _ , - . , . . . . . - . . . - - - . . - . . .. . - . . , - - . . . - . . - - . - , - - . - - - , - _ . -.

_ _ ,
,
F
Y'u,o
T09 e
3 k *
5 W e
o. e- - y). Mc.vrsancar Dm/-"n
s, , . .
- - -
3. i.
O -* ;z
L.- - _ _ __ lO
b ' ' a
f,h $*5 0:10 . I
j| s 1* *
M e tssen , u.-
f-"' t~
} Ehs- 0 | |
&v, "Cycongcycwdt d' liceo ce \ E ?m 5 ,
d'E njs coe L! J''** **'^'GPCL~ \~ o o*o t- ck, N ,, i ' r '. o i.i e ',
(88) E% r
+ 4 =j8 / . <O ~~> x. o
/ 3 ugy g- '! 5es r r
I MWGAggd.'/M G/H/A @ /}
'
t-
Qw\ r./r , r, L - c
| \g. Reseiroe ". * ~- >
.. >n, s. . . n, . . , -
vm e. . ., ew . i rti.. g x 3,,c : y ip. g 3yw. e 2. a v.r.s - nr> %M ( p 52g ) 1..rt. 1.i ,r.. .,.. .. .
-$ t.$T S t.t.Pih4, ts.it . P1Ah! y - m:
M_ 'I.....n.,% . -4* ea a.YTAm*.T to.se i tetste6.** $
b..., vest., . . m m ., ... .t g x
. i =. . .u4. .n. , a j _
o G-n. s ..s,.....n.. m n , ,,,nr y gm, ,_,,,,y LEGEO ~ o 26 te r me. T. 4.te .re g s g eam.
-
e ,m - ;.. .. , _ . . _ , _
~ ^ " " '' O,'"J2".. O su::r^u. u^ 5 ": '* i x is % :'^ ' ": m " n " " "'''*-ti Leo.4.t D* Wee. re - .ggm3 .. , 54 313. It 'X. 3
m. n - . wire . .r. .. I__ e
FIGURE 5-13 - ENVIRONMENTAL MONITORING STATIONS -:..n.. u ..,,..n.n..... . . . . . . LOCATIONS ,
c <
g WELLS, SURFACE WATER, DRINKIT6 WATER, yT AND PRECIPITATION 6
,
v. -C
_

__ . . . . - _ . _ . _ .m _ _ . _ _ . _ - . . _ _ - _ . _ --
Duquesne Light Company 'j1991 Annual Radiolo0 cal Environmental Reporti
e. Procedures ||
iGross afgha and cross _twta activities are determined first by evaporatingone liter of the sample on a hotplate. The residue is mounted and driedon a 2 inch stainless steel planchet. The sample is counted in a lowbackground, gas f!ow proportional counter. Self absorption corrections aremade on the basis Of sample weight.
Qamma anaty.Rs is performed on water sample by loading one hter of ;
sample into a one liter Marinelli container and countmg a GetLi) gamma '
spectrometry system. '
'Strontium-80 and 9Q are determmed on water samples by a procedure
- simitar ' to that described m 5-C.2 except that the leaching step iseliminated. '
i
_C_gpalt 60 is determined with a sensitivity of 1 pCuhter by evaporatmg 2 .
hters.of sample on a hutplate and transferrmg the residue to a 2-mch '
planchet. The planchet is counted on a high resolution germaniur" Damma :
spectrometry syaterm i
Tritium is determined in water sampkts by converting 2 ml of the sampleto hydrogen and counting the activity in a 1 liter low level gas counterwhich is operated in the proportional range in anti-coincidence rnode.
Radicioding (1131) analysis in water was normally perfmmed usingchemically prepared samples and analyzed with a low-level beta countmgsystem.
'3. Results and Conclusions i
iA summary of results of all analyses of water samples (surf ace, drinking, groundand precipitation) are provided by sample type and analysis in Table 5 2. Theseare discussed below.
a. Surface Water ;
A total of forty eight (48) samples were analyzed for gross alpha and gross*
beta. Alpha activity was detected in one of the samples at a levelcomparable ' to preoperational values. Positivo beta results above ,
preoperational levels were detected in the OVPS discharge area and areattributable to station releases.- The beta activity found in the station ;
discharge area is consistent with station data of authorized radioactivedischarges and were ,within limits permitted by the NRC license.
.
A total of sixteen (16) samples were analyzed for H 3, Sr 89 and Sr-90 as Iwell as a high sensitivity analysis for Co-58 and Co 60. Positive Co-58 and- -'
tritium results were detected in the BVPS discharge area and are
attributable to station releases, All other samples taken-upstream anddownstream were within 'preoperational levels. The activity found in thestation discharge area is consistent with station data of authorizedradioactive ' discharges and were within limits permitted by the NRClicense, e
L
se: bons ENVIRONMENTAL McNif0 RING PROGR Au 5-51
. . . ~ . ~ . ~ - . - m.- _ -. _ _ -_ . - . - - _ - _ . , ,_~.,-_.~.-m- _ _ - , -

. - . _ . - __ _ - . _ _ - _ . _ . _ _ . - _ . - _ . _ _ _ - _ _ . _ _ . ..
i
Duquesne 1.ight Company I
1991 Annual Radiological Environmental Report )
A total of forty eight (48) samples were analyzed by gamma spectrometry.Positive Co 58 results were detected m the BVPS discharge area and are ,
attribstable to station releases. The Co 5B activity found i, the station !'
discharge area is consistent with station data c' authurized radioactive
discharges and were within limits perrnitted by the NRC license. No othergamma emitting radionuclides were detected.
A tota, of fifty two (52) samples were analyzed for | 131 using a highlysensitive technique. Trace levels of I 131 were rueasured in eighteen (18)of the weekly samples. Th9 results were slightly above the minimumdetectable activity. The positive results were detected at a contre' locationabove the BVPS discharge and could not be attributed to plant releases. ;
The results may be attributed to medical procedures and the exported ivariabihty in the analyses results of very low levels of activity.
b. Drinking Water
A total of thirty six (36) samples were analyzed for gross alpha and gross.
beta. All results were within a normal range,
A total of twelve (12) samples were analyzed for H 3, St 89 and St 90 as~ well as a high sensitivity analysis for Co-60. No Sr 89. Sr-90, or Co-60were detected. The H 3 data were withm the preoperational rangeindicative of normal environmental levels.
A total of another one hundred hfty-seven (157) samples were analyzeo bygamrna spectrometry. No gamma emitting radionuclides were detected.
A total of one hundred fifty-seven (157) samples were analyzed for 1131using a highly sensitive technique. Trace levels cf I 131 were measured inforty seven (47) of the weekly samples. The results were slightly above
- the minimum detectable activity. The positive results were detected at ;
Midland and East Liverpool and could not be attributed to plant releases. :
As noted under Surface Water above,1131 has been observed upstrean' ofthe site, The results may be attributed to medical procedures and theexpected variability in the analyses results of very' low levels of activity,
c. Ground Water
A total of sixteen (16) samples were each analyzed for gross alpha, grossbeta, H 3 and by gamma spectrometry. No alpha activity was detected in
,
any of the sampics. The gross beta and H 3 results are comparable topreoperational ranges. K 40 was the only gamma emitting radionuclidedetected.
*Id. Precipitation !
A total of twenty seven (27) samples were analyzed for gross beta. Allresults were within a normal range.
,
; A total of twelve (12) samples were analyzed for H 3, St-89 and Sr-90. Two ;
|- (2) positive tritium results detected were within normal levels. No St-89 orSr 90 was detected,
lA to1al of twenty seven (27) samples were analyzed by gamma i
l- spectrometry. Naturally occurring Be-7 was detected in eighteen (18) |. samples. |
! l
;5-52 setion 5. ENVIRONMENTAL MONITORING PROGRAM
. , _ . ____ a -. 2. _. . . _ _ _ _ _ _ . _ _ ._ _ _ _ _ _. J
. - - . _ . . ~ _ _ _ _ . . - - - - - . _ . . - - - - -
Duquesne Light Company1931 Annual Radiological Environmental Report
,
;e. Summary
" The data from water analyses demonstrates that the Beaver Valley PowerSta'tlon did not contribute a si nificant increast of radioactivity in iocal*
0river, drinking, well waters or precipitation. The few positive results whichcould be attributable to authorized releases from the Beaver Valley Power I
;
Station are characteristic of the effluent. These results contrm that thestation assessments, prior to authorizing radioactive dischar0HS. areadequate and that the environmental monitoring program is sutficiently ;
'
j sensitive. !
Further, the actual detected concentration (averaged over the total batch j
discharge period during the year) attributable to Beaver Valley Power |
: Station. was only 0.360*o of the Maximurn Permissible Concentration 1
allowed by the Federal Regulations for water discharged to the Ohio River. [The Ohio River further reduced this concentration by a factor of ~ 600,
*
prior to its potentjal use by members of the public.i.
,
1
I1
!
!!
,
,
i'
<
f
f,
t
F
1'
i,
i[
| t"
4
-
;
t i1 |,
i
4
4 ,
.
1-,
P
:I
| 1
,. ,
r
A
| 5
I'
!
Section 5. _ ENVIRoNuENTAL uoNIToRfhG PrioGRAv S 53

. - - - . . . - . . .. - - - -- -- . - - . .- - . -
Duquesne Light Company ,
1991 Annual Radiological Ensironmental Report
t.
l. listimates of Radiation Dose to Man [
t, Pathways to Man Calculational Models
i
The radiation doses to man as a result of Beaver Valley operations werecalculated for both gaseous and liquid effluent pathways using NRC computer !
codes XOODOQ2 GASPAR, and LADTAP. Dose factors listed in the ODCM wereused to calculate doses to maximum individuals from radioactive noble gases indischarge plumes. Beaver Valley effluent data, based on sample analysis inaccordance with the schedule set forth in Appendix A ot the BVPS license. wereused as the idionuclide activity input.
Each radionuclide contained in the Semi-Annual Radioactive Effluent ReleaseReport (noble gases, particulates, radiciodines and tritium) were included assource terms when they were detected above the LLD values. All LLD values
reported by Beaver Valley Power Station are equal to or lower than thoserequired by the Technical Specifications.
All gaseous effluent r > leases, including Auxiliary Building Ventilation, wereLincluded in dose assessments. The release activities are based on laboratory
,
analysis. When the activity of noble gas was below detection sencitivity, eitherthe inventory based on its MDL or an appropriate but conservative ratio to eitherrneasured activity of Kr-85 or Xe 133 was used. Meteorological data collected by '
the Beaver Valley Power Station Meteorolo0y System was used as input toXOOOOQ2 which in turn provided input for GASPAR. Except when more recent '
or specific data was available, all inputs were the same as used in tae BeaverVsliey Power Station Environmental Statements or in Regulatory Guide 1.109.Tb3 airborne pathways evaluated were beta and gamma doses from noble gasplumes inhalation, the " cow-milk child", and other ingestion pathways,
All potentially radioactive liquid effluents, including steam generator blowdown,are released by batch rnode after analysis by gamma spectrometry usingIntrinsic Germanium detectors. Each batch is diluted by cooling tower blowdown -
water prior to discharge into the Ohio River at the Beaver Valley Power Wionouttall (River Mile 35.0), The actual data from these analyses are tabulated andused as the radionuclide activity input term in LADTAP. A hypothetical realindividual for liquid pathways is located at Midland. Except when more recent or ,
specille data for the period is available, all other input to LADTAP are obtainedfrom the Beaver Valley Power Station Environmental Statement or RegulatoryGuide 1109. Pathways, which were evaluated, are drinking water, fishconsernpuon, shoreline recreation, swimming, and boating.
|
.
5-54' . section 5. ENVIRONMENTAL MONITORING PROGR AM
. . . . . , ._ . . _ . _ _ . . ~ _ , __ _ _ . _ _ , . . _ -

. . . . . . ._ _ - - - - - - - - - - . _ - . . -- - - - - - . _ - - - - - - - - ~ . . _ . - - - - - - - - - - - - - - - - - - - - . _ .
I! wuquesne Light Company -3 1991 Annual Wadiological Environmental Report i
2. Results of Calculated Radiation Dor.e to t,iar. Liquid Releases,
- ,
|
i |'
a. Individual Dose |i
;
The doses which are calculated by the model described above are to a j-
i hypef.<ctical real individual located at Midland since this is the nearest jlocation where significant exposure of a member of- the pubhc could j
,
j potentially occur; therefore, this location is use to calculate the maximumi exposure. A breakdown of doses by pathway and organ is'provided in |j
.-
| Table 5-7 for the maximum individual. Included in this table is aI breakdown of a typical dose to individuals from natural radiation exposure.
The results of calculated radiation dose to the hypothetical real individual j-
h are compared to BVPS annual limits m Table 5 8. !t
| b. Upon implementation of the Unit 2 Technjcal Specifications and inception !
of the liquid discharge procedures at 'Jnit 2 on July 24.1987, the discharge ;
j- hmits -were clarified to be reactor specific; i.e., Unit 1 and Unit 2 have |
reactor specific dose limits that are equal to the limits in 10 CFR Part 50. .
I . Appendix .l. . Therefore, the annual site limits listed in Table 5 9 are !
specific to this report only, and were derived by multiplying the individual ,
Technical Specification reactor limits by a factor of two (2). :'
j
t,
i. ;
rr
i'
i
|
i- .y
+
'
.e
'
.
|
fi :
i.
|'
3- ;
i >>
e,,
|L !
!
I
, i
J
|'
1 i
: ,
. >
Section 5. FNV!RONVENTAL VONITORING PROGR AV 3 55.
)< '
_ . ~ ~ . . . . - _ . . . _ _ . - _ . _ , _ . . . . , , . _ . .__..._,.-,,_,m4,E,_,.,,,,,,w.._,....~. .w.m,-

_O2Cmwg rg._ ~ go3aUDd
- .
* C* " >g C : o~o9Q- < cma5as DOuO20 . -
-
2.
- ,
gr T 1.,a&7o3 o0eo o D" g3 ay&y- } s 3 2 . E a . C E a 2C_@ ac
.
c-
- .
6-
12 )t9 2 i
1 8 * e cat 2 >
Mf ._Xt 0 r n
O. 0 t. U0 0 U O '_
,--
51 5 2 )
E 3 2 5t 3
0Wf* 7 1 91
3 0 D-
90 0 1B 0 X. 0. A .t (
t0 0 0 rop
-e- R
n ,i
c EE B
O 2 R
Q 4 6 6t U "n.l $
S o0 7 7 raR 0 2 2 f. O n-
Y 0 0 0 r F aH 0 0 0. p * tT 0 O. 0 E r
e N Ayt O 9Ws I rt -
t e T ae s Arw
m%8
oDr f -Ae1 )gtR N I 8 )y 3 r
.
of
8 t. AA*iad G
6
2 v 2 an L su r t u A7 -
It * nL reR X. (L J. e( vcie l R
-wb O C O U ed T L
-
A 9 0 t 4 6n+ ,7 i) 5 4 < 9 9 w5 mo N 1 2 o -
.LE ut uaL mt o oB r S t
a 6 8 R3 3i eA ar
NI A A 1 1e n F -- * rT v u0 3 e
7 S.w K N N 0 ( e ts/
oo S ot F 0 0. T A pey 0 0{ U =s D t Eov r .
Da M to. 1 o .f
nV D a. y 2 sM
t
ter fd d d o .
r
a a o n sa w O R B a t
@a g r T a n t ta -
a e g e uR B 6 i v E m s pi
s t, h t
C. S m e u m t. o .
n P0 7 O a c o e1i v u i6.1
2 D G tc a m d o* r, 5
L t u F a sn n LA e o ta n mtC b e b o A e b e ,c
t c T *P m a ao a O a mt t
Y A R G B T ct o E -
T o c eL r
(he e TuA e * .
n n uuU ta s -t t
lu a e EuO w m *e .
xMd f e R i g o c, A M T uAD mf nr eeuN m e,i
cI ,
e a SD fs oo e ,n s yia s
* eeo nes v r an e o c
Y' o a r Ate
t,
t r m tA pte
e d a latW m a c e h nf u A oD W ta ts tas e cA n g n o o ,o L T NP. C m h Lek r A
h n o Ts i
h Oi rF O S T a e C ,
t
vu>m ? yr3w m& zgm2,>r. COzaQ f yn >C-
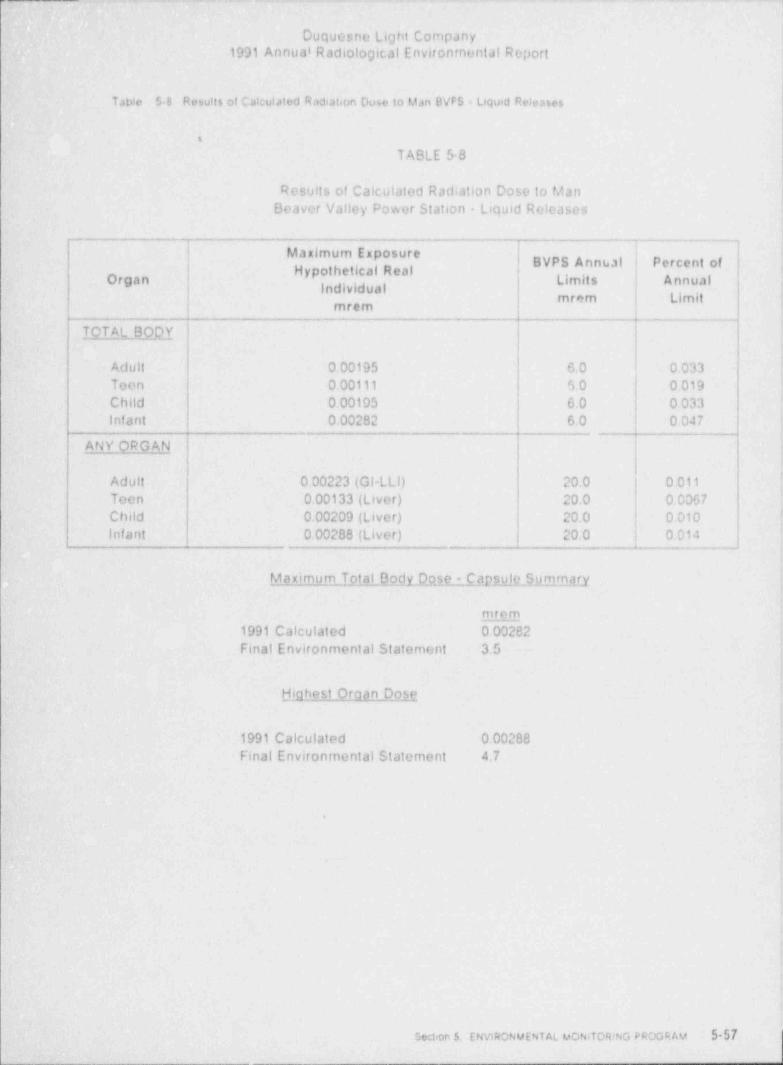
, _ . ._7- _ - -.. . . ~ . . . - . ~ . . ~ . --- -- -.- --
6-
, Duquesne Light Company| 1991 Annual Radiological Environmental ReportL
Table 5 8 Results of Calcutated Radiation Dose to Man BVPS Liquid Releases
i-
TABLE 5-8
Results of Calculated Radiation Dose to Man !Beaver Valley Power Station Liquid Releases j
|'
BVPS Annual Percent oft il R I
Organ mi s Annual jIndividualmrem Limit
t
TOTAL-B_OQY ''
- Adult - 0.00195 6.0 0.033 jTeen 0.00111 S.O _ 0.019 {
'Child 0.00105 0.0 0.033' infant 0.00282 6.0 0.047= {
*
- ANY ORGAN|
Adult - 0.00223 (GI LLI) 20.0 0.011 i*
Toen 0,00133 (Liver) 20.0 0.0067Child 0.00200 (Liver) 20.0 0.010 |Infant 0.00288 (Liver) 20.0 0.014 '
t
.
.
Maximum Total Body Dose Capsule Summaryr
mrom1991 Calculated 0.00282 :
Final Environmental Statement 3.5 - I
r
li!ghest Ornan Dose
r'
1991 Calculated .0.00288 -
Final Environmental _ Statement 4,7 ;
.
s
.3
- .
.
Y
9
9
b
t
i
Section 5, ENVIRONMENTAL MONITORING PROGRAu _5 57_

. - . . - - . . . _ _ , . . . - --
!
. Duquesne Light Company1991 Annual Radiological Environmental Report
1
c. Population Dose
The 1991 calculated dose to the entire population of almost 4 million ipeople within 50 miles of the plant was:
,
"'U' ' E'Organ "f.:.o MilliremsContributors
TOTAL BODY 96.7 H3 94.5 mrem !
Fe-55 1.0 mrom
THYRO!D- 94.6 H-3 94.5 mrem '
,
3. Results of Calculated Radiation Dose to Man - Atmospheric Releases,
The results of calculated radiation dose to the maximum exposed individuals forBVPS airborne radioactive effluents during 1991 are provided in Table 5-9. Thedoses include the contribution of all pathways. A 50 mile population dose is alsocalculated and provided in Table 5 9. H-3 is the primary radionuclide *
contributions to these doses.
The results are compared to the BVPS annual limits in Table 5-9. As in the i
ilquid discharge limits, the gaseous effluent limits are reactor specific; i.e.. Unit 1 -
and Unit 2 have reactor specific dose limits that are equal to the limits in 10 CFR,
Part 50, Appendix 1. Therefore, the annual limits listed in Table 5 9 are specificto this report only, and were derived by multiplying the individual Technical !
- Specification reactor limits by a factor of two (2). The results show comphancewith the BVPS annual limits. i
!
,
?
I,
e
. E
t
5 58 Swon 5. ENVIRONMENTAL MONITORING PROGRAM .
. - -- , , , , - - - . - - - . . - . - . - . - . - . - - - - . . - .-

. _ - . . _ . . _ - - _.m._.._.____....-._ - - - - - . _ - _ _ . _ . _ _ . _ _ _ _ _ _ _ _ , _ . _
Duquesno tight Codipany1991 Annual Radiolo0lcal Environmental Repor(4
4. Conclnsions . (Beaver Valley Power Station)
Based upon the estimated dose to individuals from the natural backgroundradiation exposure m Table $ 7, the incremental increase in total body dose tothe 50amle population (4 million people), from tho operation of Beaver ValleyPower Station Umt 1 and 2, is less than 0.0001'. of the annual background.
The calculat(. . doses to the pt.blic from the operation of Beaver Valley PowerStation iUnit 1 and 2, are below BVPS annual hmits and resulted in only a smallincremental dobe to that which area residents already received as a result ofnatural backgrouni The doses constituted no rneaningful risk to the pubbc. {
.
?
.hk
e
r
_ _
' -
O
h
t
seci,cn 5. ENVIRONMENT AL MONITORING FROGRAM -- 5 59
. . _ . - _ _ . . . _ _ _ . . . . ~ . . . _ . _ _ _ _ _ . . . . . . . . _ _ _ . _ . _ . . _ _ _ - . - , . ~ . _ , , , _ . . ~ _ , , . . . . _ _ , . - .. ,

r"
Duquesno Light Company091- Annual Radiological Environmental Report
Table 5 9 Resutes of Cateviated Rat tion Dese to Man (1991 ?VPS Atmosv.ene Releases
i
TABLE 5-9
Results of Calculated Radiation Dose to Man (1991)Beaver Variey hwer Station - Atmospheric Releases
MAXIMUM 50 MILEgyggN A lONORGAN ANNUAL LIMIT
INDIVIDUAL ANNUAL LIMIT DOSE-mrem man rem
TOTAL BODY 0.0971 30 0.32 1.24
SKIN 0.106 30 0.35 1.55
LUNG 0.0973 30 0.32 1.26
THYROID 0.171 30 0.57 1.82_
.
6
(
_ 5-60 Section 5. ENVIRONMENTAL MONITORING PROGRAM-
.
.
- - . - -. . _ . - .

. .- -. .- - .
APPENDIX |
1|
.
Contractor Laboratory
1 ;
EPA Interlaboratory ]1
-Comparison Program ;
.,
!
!
I
|
|
Al-1'
_ - _ - - - - - _ _ _ _ _ _ - _ _ - - _ _ _ _ _ _ _ _ _ _ _ -

; .4 - 4 - ' , -- m.
-' -
,-
k DUQUESNE LIGHT COMPANY 1991' ~
*
s'u" - US fiPA IffilD *.*a'itATORY COMPARISON PitOGRAM 'lWI -
.m..-c I of 3)
_ . . . . .
EPA. Dese TI MeHed - - ; Deee EPA ' EPA Tl ' Norm llev. **Wareleg ;- ' Preperstlee Results lessed Results Media j Nesult:(a) Nesults(h) (Knowe) * * * A c a les
*w
. C1/1181 03M781- -04/1581 ' Waser " Sr89 501- 50 5 ou i 0 00 0 oo'
Sr-90 5.0 t .. 50 : 5.00 1 0 00 0007
01/25St 02/2181 03/1881 Weser < Gross Alpha -50i. . 5.0 9 00 i L 1.00 : 139Gross Beta 5.0 e '5.0 7.00 1 0 00 0 69
02J08SI 03/22/91 04/19/91 Waser . Ca60 4001 5.0 39.33 1 - 3 06. -4)23Zn45' 149 0 i 15 0 147.00 1 1.00 0 24-Ru-106 186 0 i 19 0 176 67 i 17.56 - -0 85Cs.134 80i ' 5.0 7.33 1 0.58- -0.23Cs-137 801 5.0 7.67 i ' 3.21 -0 12Be 133 75.0 i 8.0 .. 75.67 i 5.51 0.14
02/15/91 03/1SSI 0543/91 Weser I 131 75.0 i 80 80 00 i 5.29 I Os-
.
02/22/91 03/22 S 1 04/1581 ' Weser 11-3 4418.0 i . 442.0 4500 i o I73.21 0 32
0328/91 0546/91 05/3181 Weser Ra-226' 3181 4.8 28.33 1 4.73 1.25Ra-228 21.1 1 5.3 16.67 1 2.03 -1.45
03/29/91 0646/91 0742S! As fileer Grus Alphs 2501 60 42.67 1 0.55 5 10 -"n)Gross Beta 124.0 1 6.0 12667 :a 5 77 0.77Sr-90 40.0 1 50 37.00 i 1.00 .s 04CaI37 4001 5.0 43001 5.29 I 04' '
,
04/16/91 07/2581 Waser Cnoss Alpha 5401 14 0 59 67 i 4 04 0 70Ra-226 8.0 i . l.2 7331 0 81 -0 w,
Ra-228 15.21 38 10001 0 00 -2 47 * %1)Gross Beta ' 115 0 t 17.0 110 00 1 0 00 0 51Sr-89 2801 50 31 00 i 1 00 1.04Sr-90 26 0.1 5.0 21.00 1 0 00 -1.71 'Cs-134 2401 50' 25001 1 00 0 35Cs 137 2501 5.0 24 00 i 1.73 .-0 35 -
04/26/91 06."28 S 1 07/3181 Mak Sr 89 3201 50 24001 3 00 2 77 " (cI-
' Sr.90 3201 5.0 26311 2.08 . l .9e.1 131 6001 6.0 53.33 1 231 1.92
'.
Cs.137 49.0 1 50 52 67 i . I.53 1.27K '1650 0 1 83.0 1590 00 1 81.85 -I 25
|,
.
Nsswiscs are Immic41 sa crxl of taNc.*
!
. . _ _ _ _ _ _ _ _ _ _ . . . . . . . , . .

= . , , . -
.,- , ,
DUQUESNE LIGHT, COMPANY. - 1991
US EPA lifiutLABG'2NIICY COMPARISON PROGRAM 1991',
(Page 2 of 3)
.
EPA Date Tl Malled ' Date EFA EPA. ~ TI- Noren De * * War eleg' PreparatM Resulte leseed Reseks - Media NucIlde Resulte(e) Nesules(h) ( K now n) ' * * * A c t io n
- 05/10/9i1 05#36/91 05/1991 Wakr - Sr-89 . 3901 - 5.0 38671. 4.51 -012' ~
- Sr-90 24.0 1 5.0 22 00 i 1.73 -Ofn'
05/17NI ' 06/13/91 07A18/91 Wake : Onuss Alges 2401 60 24.33 1 ' 2.52' O.10Cnoss Beta - 4601 5.0 50331 1.53 1.50
06417M1 07/1881 08/12 S 1 Wassr ' Co-60 1001 5.0 10.33 1 0 58 0 12* 7s 65 108.0 i ' . I 1.0 106 00 1 2.65 -o 31.
Ru-106 149.0 1 15.0 136 67 i - 3 79 -I42'Cs-134 15.0 1 50 13 67 i 1.53 4)46Cs-137 14.0 1 5.0 13671 1.53 -0.12Be-133 - 62.0 1 60 56331 1.53 -1.64
.
06/21 S 1 07/18/91, 08/12/91 Weser . II-3 ' 124801 1248.0 12833.33 1 115.50 049
07/12N1 100R/91. 09A)6/91. Weser Re-226 1591 2.4 15.0 i 1.0e -0 65Ra-228 16.7 i 4.2 14.33 1- 2.31 -0.98
08AN/91 1308/91 09/04/91 W eser 1-131 20 0 i ' 60 19.33 i C.58 -0 19-
Oc.10/91 '10/25/91 12AN/91 Air fileer On-Alpha 2501 60 27.00 1 2.00 0 58Cn Beta 92.0 i 10 0 100 00 1 0 00 I.39St-90 3001 5.0 .27.67 1 2.89 -0 s1Cs-I37 30.0 1 5.0 33.3) i 3.21 1.151
09/13/91 10/25/91' 12/12/91 Wseer Sr-89 4901 5.0 .50671' 2.89 0.58Sr-90 25.0 1 5.0 26 00 i 1.00 0.35
09/2091 10/17BI I1A)4/91 Waser Gr-Alpha ~ 1001. 50 1: 67 i' O.58 ' 03MGr-Beta 2001 5.0 21.00.1. 0 00 0.35 j
09/27 MI 12536/91 12/23/91 MA Sr-89 2501 5.0 21001 2 65 -1.39Sr90 2501 5.0 19.00 1 0 00 -2 08 * *( c )1-131 108 0 i- li 0 113 33 1 5 77 o 84 ,
Cs-137 30.0 1 50 29001 3 61 -0 35 !K 1740.0 1 87.0 1503.33 i . 75 06 -4.71 ~ (f) ,
r
liars >tes are locaicd an end of tabic,*
'
3a
- _

>.-.
b ' s
UUQUESNE LIUllT COMPANY - 1991IIS ITA INT 11RI ADC?.ATORY COMPARISON IROGRAM 1991
(Page 3 of 3)
EPA Date TI Mailed Date EPA EPA TI . Norm Dev. " WarningPremration Results issued Results Media Nuclide Result:(a) Results(h) (Known! "* A c tion
IMH/91 11/15N1 12/12SI Wascr Co60 29.0 1 5.0 30.33 1 2 0x 0 462n 65 7301 70 72.67 1 7.09 0 08Ro-106 IW 01 20 0 197.67 1 7 51 -0.12Cs-134 10.0 t 50 10.33 1 0 58 0 12Cs-137 1001 50 Il.331 0 58 046Da-I33 98.0 1 10 0 97.00 i N.72 -0 17
IWI8SI I1/15/91 12D4/91 Waar II-3 24540 1 353 0 2333 33 1 57.74 4 59
10/22N1 OIA)2N2 Ol/21N2 Wara Onuss Aloha 8201 21.0 55001 4 36 -2 23 ~ (giRa-226 2201 3.3 21001 2.65 -0 52Ra-228 22.2 1 5.6 18001 1.00 -13)
- Gruss Beta 65 0 i 10 0 56 00 i 1.00 -I 56St-89 to 01 50 10.67 1 2 08 0 23Sr-90 10 0 i 50 9331 0 58 -0 23C#60 2001 50 19671 0 58 -0.12Cs-134 1001 50 10331 2 08 0 12Cs-137 11.0 1 50 13.67 1 0.58 0.92
II A)a>91 OIK12N2 Ol/21N2 Waser Ra-226 6.5 i 1.0 5 37 t 0 32 I%Ra-228 8.1 1 2.0 7.90 i 1.20 -0 17
.
(2) Average i czpmmental sigma.(b) Expected laboranary precisim (I sigma. I desciminatum).(d) ne lowest three results out d nine analyses were ehcaen. Other results in the group were close to the given value. He posess fiw acceptwg data is currenely ualer review(2) Tbc cause far the deviation is lelieved to be errincously high strtetium yacids, probably caused by inavnplaic separazion ef calcium 'Ihe lat=wakwy has invesargaaed carner
concentrations sod pipeting acchnigees, and have found them to te corrett Further aspects of analysts' techniques are being sessed 'Ibe tal=sas.ey has ret esved a new stneriumextractim material devek at Arganne Naexmal I Axwaiory. Expenmects with this meth=1 ao actueve bener separatam ci aaburn were awnpleted and pnsedure IHO O 42 lmwas impicmented un 2/f- .
(f) here is no apparent cause ka the km K-40 resuits. Two other isotspes spaed in the sample ere in g<xai agreement with I PA values 11nd umverwms were resiewed anJ! found to be cswrectly .W Ibssible background errtws in ge4:netry were anwesus sicJ and found to have an trisignifs arit c f fett
(g) ISteable failure to transfer all sample residue to the counting plaru.het. Analysts are being tested using in imuse and other ITA spacs
.

. . ,
=US EPA CROSS: CHECK | PROGRAM.
GROSS BETAIN AIR PARTICUIATES
160
,
140 -
', ,120 -
100 - DUa <,
~
eg so - T->-
, ,60 - ,
|' ! h< ,,, i, ,
b f-| - .i.
I '
40 _ ,[ , ,
1 all i ,
, o, ,
'20
O . , , , . _
'
1981 1982 1983 1984 1985 1986 1981' 1988 1969 1990 3991 1992
* OS/25/m3 EPA test invalki- Il i 3 Segma
EPA i 3 Segmao
i
?
!
I> -i
en
- - _ _ _ _ _ _ _ _ _ _ _ _ _ _ _ _

' - =., '7.
,
_ a,
US' EPA CROSS ' CHECK PROGRAM
CESIUM-137 IN AIR PARTICULATES
so
80 -
it
"
.] |;,
_19U I
< >
r_ , ,
$ i , i '.s 20 -n <
{"f<
i| '-, ,
t , '
l (' "
>f[ [[ g - ,< ., < ,
, ,,,
dD
0-1
2o . . .. ..
. ..
. . . .-
.-
1981 -1982 1983 1984. 1985 1986 1987 1988 1989 1990 1991 1992
*O Ili3sgmao. EPA i 3 segma
.
_,_ay, .= - - - =-- _ - =.- r - - - - - w - - - - - - - - --_n

. ._ _
.US EPA CROSS ' CHECK PROGRAM ~
=-
GROSS ALPHA IN AIR PARTICUIATES --
so
60 -
.
40 - -gc.
i ', , g.>- ih i' It -'., r
aP<
i,
54g'
. <,, , ,
[ F g,I
< "
"L0-
-20 . . . . . . . . -
. .
1981 1982 1983 1984 1985 1986 1987 1988 1989 1990 1921 1992.
TI i 3 Sigma !O
EPA i 3 Sgmao
DL

~ -
.
3'E
.
US" EPA CROSS ' CHECK' PROGRAM..
STRONTIUM-90 IN AIR PARTICUIATES
Bo --
70 -
.
60 -
.
50 -_
S .
eg 40 - <>
.
30 - <>
to.
4
3- j e{*f' D'
120 -
} i}4
r,1 fi ' ', ,.
. . . .
. ,
10 - H 4 t3 - '
.0 -. . . .
. ... .-
.- . . . .-
1981 1992 1983 -1984 1985 1986 1987 1988 1989 1990 1991 1992
'
, s
I.,
I,
o ili3segma
| e EPA i 3 segme
|1 - . - . .-.

_ *:'yh.w2-.
*
US : EPA-CROSS CHECK PROGRAM.-
,-.
j
,
' STRONTIUM-89 IN MILK
100 .
~ 80 -
i . ,
I -
s i
m. .
E T_a v. - {
alnu .
Y I
|,,40 - , 7 T '0 , , " '}p "
oDI Lt i y0 '', ,, ,5 . i , < >-
''' o20 - g ,
'
d ' g- ()
1!. 1,i '
I k
| ' il--
0- o *
-20 . - . - - - ' '' ' '
' '' ' '
'
1981 1982 1983 1984 1985 1986 1987 1988 1989 1990 1991 1992
0 1113sgmaEPA 13 sigmao
Di
. - .

A
2991
'a
,. am.
mggs1
9 s3i 9 1,
31 A1P
o"l
iE.
- 0 oo9
: 91
k
i
M > 9
A <
" 8' ,
9
R > 1
-
GO 8KRL 8,
9
P 1I *
M 1KN ,
I 7C 80 9,
E 9 1
H M ]-
.
C UI 6
S T 8,
9N 1S ,
OOR 3.
RT 5SC 8,,
9f 1
A I .
PE
, 9
48
,
S , 1
U { .
l 38l , 91
.
|,
28,
9
} 1
|
1
, 8- - -
"- 9
0 o 0 0 0 010 s 8 4 2_1
n
3.O

LUS EPA CROSS -CHECK PROGRAMPOTASSIUM-40 IN MILK .
-
2800
,
2200 - "
i
..
3 '
iSoo _ T-- 1 o.
; .4 ,.
' '
I ar I ti
i | 1 i , i oa..e,
je > i , , "i
,-, i , n.,, ,
'
J '
O.,,
i i > d ', q ,
,,
' ' ' '
{I1400 -
,
,
!
1000 -
soo . , ..
..
. . . . . . . . .. .
1981 1982 1983 1984 .1985 1986 -1987 1998 1989 1990 1991 1992
.
TI i 3 sigmao
EPA 13 sigma*
2"
b.~

- - - _ - . - - - _ _ . - _ . - .. _ ,
.
' i.
T*g;
..
.US~ EPA CROSSLCHECK PROGRAMCESIUM-137 IN MILK :
.
100
:T,
80 -4
i
1
80 -~ 1'*
= -
g:: i -
o ,,U,,n. -, ' ' ''
<i>
> | !
40 - 1e >
l i
I I ' 'i l i l, , ,
,
, , ' > g a>
>
''Opo _
'
,
i'3
$
a. 1 >
0 -. - i - > - a, -
= * * ' ' ''
'' '
1981 1982 1983 1984 1985 1986 1987 1988 1989' 1990 1991 1992
_._.
Tli 3 sigmao
EPA 3 sigmaa
__ .__ _ . - __ __ . _ _ . _ . . _._ . _ __ ___ _ _ . . _ _ - - _ - - _ _ - - _ _ . _ _ _ _ - - -- -

.u- g --
.US ' EPA ' CROSS CHECK PROGRAM~
IODINE-131 IN MILK --
140
120 -
it
in
100- Usi
15
'' o
u 80 -?= -
2o ie t- 60 - .) >
,,
J ' T T) . ,
' ' ' ' ' 'g. r s j p i t ,.,,
t ,
I< ,
f 's? J,
M- |e
pf'
d,a . at
$ E *
y DD0- - 0
1 I
20 .. . . .
. . . . . . . . .. .
. .
1981 1982 1983 1984 1986 1986 1987 1988 1989 1990 1991 1992
o il t 3 sigmaEPA 13 segmao
,
,
b. _ _ - _ _ _ _ _ _ .

_ _ _ . __ _ _ - _ -
,
'
;... ..' ' "
4 ... .,
'O,. .
.US EPA CROSS CHECK PROGRAM .-
' GROSS ALPHA IN WATER ~~
u --= _-
'
:n220
190 -
1 i
140 -6
0=20 .
'
a. 100 -s i
,aP.,,
(II
II A,
i'i '
) ",7 ) ;, 1 . <4 4 y
, . ,
<-
. , ,.. , , ,.
i
*2O . g - g - -
1981 1982 1983 1904
o ' Ti t 3 sgmaEPA 13 sigmao
_
9
m - - - . * _-n -

'
Th
US' EPA CROSSLCHECK FROGRAMGROSS ALPHA IN WATER
12o
100 -
.
< >
80 -ti
.e.C 60 - ,>
2 . I te
o I , ,
, ,
s p
7'840 - . i
. I I, ,
JI
Jf' '
20 - . -
g
q f., , , ,,
y p o!, ,.
,
, "t.'
4 ,,. " a6
- .o ,, s" < . . g , , . , f .,s, 7. g' <,
-
, ,- . ,,, I , , ,,
0- a
-20 .. . , . , . , , , , ,
, ,
1984 1985 1986 1987 1988 1989 1990 1991 .992
4
0 Tl 13 SegmaEPA i 3 Sigma*
.
$;
- _ _ _ _

_ _ .._._._ . _ - _ _ . _ _ _ _ _ _ - _
>
US EPA CROSS CHECK PROGRAMGROSS BETA IN WA'IER ..
220
200 - -
180 -
El *
160-
Is'
'140 - *
e
E 120 - '',,'
-s i
U on. 100 -
80 -
< B
E<g. , ill
b 5 k' '
. i f<>
, , < <g
f,--
, ...
.
0-
-20 - - s - -
=
1981 1982 .1983 1984
0 Ilt3sgmaEPA i 3 sigma. o
_
S
__________________m_ - _ _ _ _ - m..-- -_ _ w m

- - - . _ _ . - _ _ _ _ _ _ _ _ - _ _ _ - _ . . ._. -,
_
.
.-
_
US EPA CROSS CHECK PROGRAMGROSS BETA IN WATER
180
|'
160 -
<i
140 -
120 -
100 - I*
-.o.
oa 80 -
o
'60 -
40 -le
@' D~
f,
20 - < <
I b''Ig E
'P
' "g- 'p 4ii
) b
,
' "-. .<
0-
-20 . , , . . ,
1984 1985 1986 1987
.
O Tl i 3 sgmaEPA i 3 sgmao
3b
. - - . . _ _ _ __

, ~
$q
US EPA CROSS . CHECK PROGRAM.
' GROSS BETA IN WATER Icono
140
120 -<,
".
100 -
.
h M-= -
'
U**
,> <\il+ li f) 4
< ,
40 -<
a
20 - <i "
5' k '|O i | E ,5, ,y if' '
, < <' a ,o e"< ,=. ,
< , , <.
o- o,
20 - - - -= - -
'.
1987 1988 1989 1990 1991 1992
Tl 13 sigmao
EPA 13 sigma*
, . . . . - .
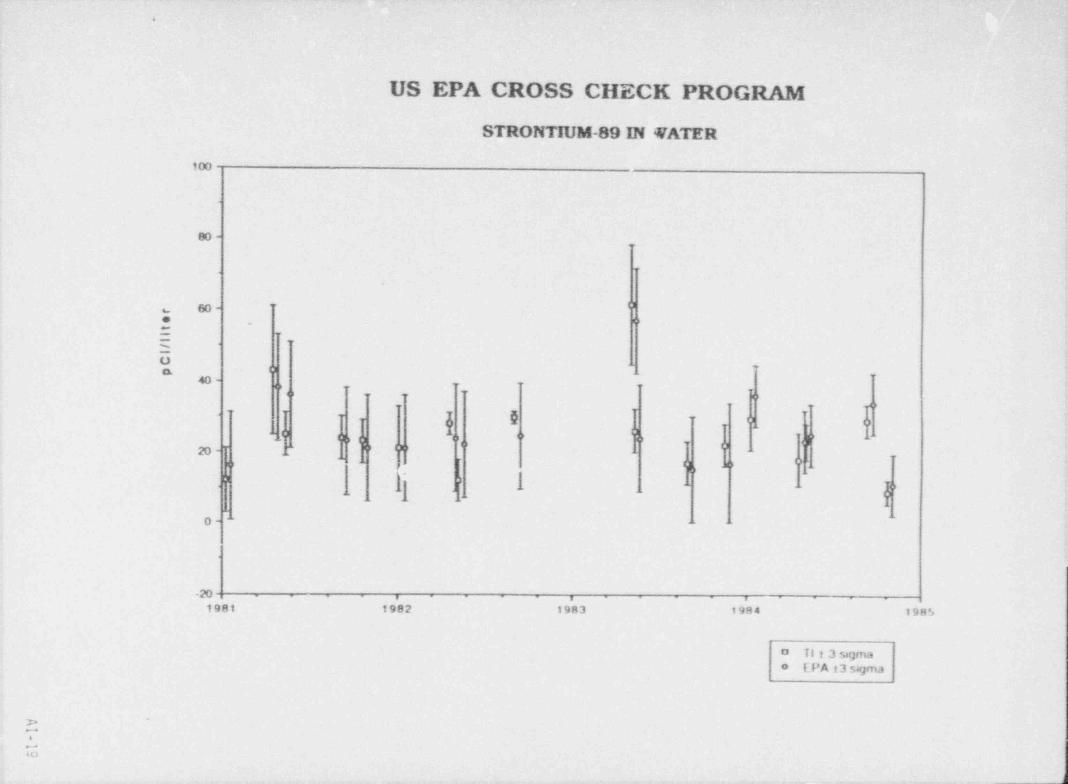
. ,,
US EPA CROSS. CHECK PROGRAM
STRONTIUM-89 IN WATER
100
80 -
m. ',
e .. ''
-
-
20
#~>
, ,,
'N "itei, s li, <
i-,
20 -' ' '
v i.in ,6
[ -'
H '
0-
.po . , .
.- - -
i
jgg1 1982 1983 1984 1985
o Ti t 3 sgmaEPA 13 sigmao
3$;
. - - . '.

A-,
E. .. -;.1'
El
US EPA' CROSS CHECK- PROGRAM
: STRONTIUM-89 IN WATER sr. .i i
100
00 -
60 -*
* "< >
=
h ' 40 --
~
1 >< >
g,EL
-
. f:i s iI g .
.g> '
,
20 - >el
'g i
j ' 8'E ji
i- "
a . : <-
,,, , . .,
0-
-20 -
. .. .- . . .
1985 1986 1987 1988 989 1990 1991 -1992
o TIi3S* EPA t 3 S,
|
|
_-.
_ _ _ - - _ _ . _ _ _ _ - _ _ _ - _ _ _ _ _ _ _ _ _ _ .- , ._ - _

-. ._
# a
US EPA CROSS' CHECK PROGRAM
STRONTIUM-90 IN WATER -
so,
t
60 -
g' ' 40' ., ,
5 ~ ]',
1= .. ,
h,
'[4O i 1 ] In, . ,.
fl, yI 5 Y ', <, ,
; 20 - I| -{ *
J r. . '' i
[[ P b,;, f,,~.
{("[... - ;
p a . -
y9.
,aja, ,
0- '
-20 , , . - , , - , 4 , - , - ,
1981 1982 -1983 1984 1985 1986 1987' 1988 1989 1990 1991 1992
O Il t 3 sagmaEPA 13 segmao
.
b_. - _ _ . __ - _- A
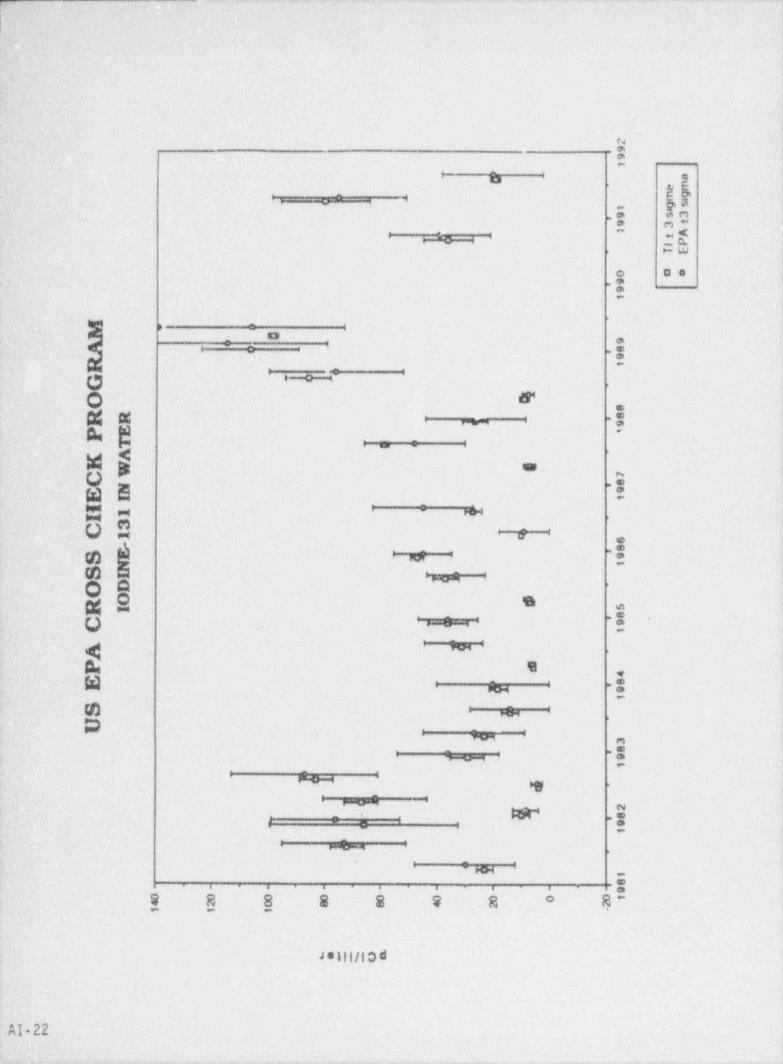
{ o
.!
's>
*
b a
. 2Lp-. en. n- ;
,< o_ -
m ._ c.-w
o 00*-
,. :
_a .
' .- =$-
g e--o-.
0 *..
Wm - -:AN '
:_
wg .,Q .=
W E. *
m.m ; 4"-.O n .
m a ..=
CD 4 *
CD uQQ '
N2 *Q
. .: .
~ *
4^
_
A B ,
W io -:CD - .
D -
- n. ..
e -
,
. - .
-
.W .e-
*
4^
m*. . . . . . .
S R 8 8 8 % R R"- - - -
J ellillo d
.AI 22

-v :-
.s
US EPA CROSS CHECK: PROGRAM-
.
TRITIUM IN WATER
5000
'I-
4000 - .
. Og
,(l <#* . 3000 - . <>
= p yn I2 ih 'n
i i "O eio
",,, o
. 4V 4>
"
2000 - *<;,4Iq . . -
1 --
e,
'1000 -
1.
0 - - -=
,g82 1983 1984 198b
o 1113symaEPA 13sgmao
Db
- . . . _

,.
.
2v 9
^ 91
,
,
4 S1
9 S 3- 9 3 i
' 1 iAl PTE
i'
- o*M 6
A -
0
R'
1
91 O . 9
G tin
oO c(R i. -
P RK E . 9
T 8.9C A 1
E W '
H N . aI
C MS U g
I> .
S T. 8
8I . 9
O R 1,
R T.
C ' 4[
AP . 7
8.E 91,
.
SU ,'
-
" 6.
8.91
}.
h1 58- - - - - - - 9
0 0 0 0 0
-0 0 010 0 0 0 0 0 C0 0 0 0 0 0 08 4 2 0 8 4 2
.1 1 1 1
.
.- .
_._
_-
-
g=5{__
_
.
_
_
E,%

US EPA CROSS CHECK PROGRAM
TRITIUM IN WATER ' (conu
16000
,
14000 -
< >
12000 -
10000 -
,e .
~_ E
6 8000 -" T
T6000 ,
*<i
g,
h'
<>d
4000 - p,
d'D' ' og< . u
I E i' ''
f g< i'2000 - <
.
0 . , , ' ' ' ~
1985 1986 1997 1988 1989 3990 399, 3997
I
-t
U Tl i 3 S* EPA f 3 S-
?g.
. .
*--- . _ - _ - - - - - - _ - - -

.- . --.. - . - - - .
!
.
APPENDIX ||
QC Laboratory
r
EPA Interlaboratory
-Comparison Program
.
AII-1
. .. . - - . . . .

J.
.,-
i
APPENDIX A
INTERLABORATORY COMPARISON PROGRAM RESULTS
.
NOTE: TIML participates in intercomparison studies administered by U.S. EPA Environmen,_
Monitoring Systems Laboratory,.Las Vegas, Nevada. The results are reported in AppendixiAlso reported are results of in-house spikes and blanks. Appendix A is updated twice a year; ;complete Appendix is . included in January and July monthly reports only. Please refer to Janu;and July reports for information. -
,
.
, January,1992
:AII-2- '

Appendix A
Interlaboratory Comparison Procram Results
Teledyne Isotopes Midwest Laboratory (formerly Hazleton Environmental Sciences) has participated ininterlabordory comperison (crosscheck) programs since the formulation of its quality control program inDecember 1971, These programs are operated by agencies which supply environmental type samples (e.g.,milk or water) containing concentrations of radionuclides known to the issuing agency but not toparticipant laboratories, The purpose of such a program is to provide an independent check on thelaboratory's analytical procedures and to alert it to any possible problems.
Participant laboratories' measure the concentration of specified radion alldes and report them to theissuing agency. Several months later, the agency reports the known values to the participant laboratoriesand specifies control limits. Results consistently higher or lower than the known values or outside thecontrol limits indicate a need to check the instruments or procedures used.
The results in Table A-1 were obtained through participation in the environmental wmple crosscheckprogram for milk, water, air filters, and food samples during the period January 1988 through November1991. This program has been conducted by the U.S. Environmental Protection Agency Intercomparisonand Calibration Section, Quality Assurance Branch, Environmental Monitoring and Support Laboratory,Las Vegas, Nevada.
The results in Table A-2 were obtained for thermoluminescent dosimeters (TLDs) during the period 1976,1977,1979,1980,1984, and 1985-86 through participation in the Second, Third, Fourth, Fifth, Seventh, andEighth International Intercomparison of Environmental Dosimeters under the sponsorships listed inTable A-2. Also Teledyne testing results are listed.
Table A-3 lists results of the analyses on in house spiked samples.
Table A-4 lists results of the analyses on in-house " blank" samples.
Attachment B lists acceptance criteria for " spiked" samples.
'
Addendum to Appendix A provides explanation for out of-limit results.
AII-3

Table A 1. U.S. Environmental Protection Agency's crmscheck program, comparison of EPA and Telt - 'Isotopes Midwest Laboratory results for mil, water, air filters, cnd focd samples,1988 throuIW1.a
-
Concentration inaf[L(bEPA Resultd
Lab Fample Ebte TIML Result ControlCcdc Type Collected Analysis 12aC is, N= 1 Limits
3TW 521 Water Jan 1988 Sr-89 27.315.0 30.015.0 21.3-38.7Sr 90 15.311.2 15.011.5 12.4 17.6
STW 523 Water Jan 1988 Cr. alpha 2311.2 4.015.0 0.0-12.7Cr. beta 7.711.2 8.015.0 0.0 16.7
STW 524 Food Jan 1988 Gr 89 44.014.0 46.015.0 373-54.7Sr 90 53.0t2.0 55.012.8 50.2 59.81131 102.314.2 102.0110.2 M 3 119.;Cs-137 95.716.4 91.015.0 82.3-99.7
~
K 10111158 1230162 1124 1336s
STW 525 Water Feb l988 Co-60 69.3 :2.3 69.015.0 60 3-77.7Zn-65 99.013.4 94.019.4 77.7 110.1Ru 106 92.7114.4 105.0110.5 86.8-123.:Cs-134 61.713.0 64.015.0 55.3-72.7Cs 137 99.713.0 94.015.0 85 3-102.7
STW 526 Water 't b l988 H3 34531103 33271362 2700-3954e
STW 527 Water Feb 1968 Uranium 3.010.0 3.016.0 0.0 13.4
STW 528 Milk Feb 1988 1 131 4.711.2 4.010.4 33-4.7
STVJ 529 Water mar 1988 Ra 226 7.110.6 '' 611.1 5,6-9.6.
Ra 228 nae 7.711.2 5.79.7
STW 530 Water Mar 1988 Cr. alpha 4311.2 6.015.0 0.0 14.7Cr. beta 13 ''.13 13.015.0 43 21.7
STAF-531 Air Filter Mar 1988 Cr. alpha 21.012.0 20.015.0 11.3-28.7' Gr. beta 48.010.0 50.015.0 413 58''
Sr 90 16.711.2 17.011.5 14.4-19.6Cs 137 18.7113 16 Di5.0 7.3-24.7
STW 532 Water Apr 1988 I-131 9 012.0 7.5f0.8 62-88_
All-4'_ _________

. _ _ _ _ . _ _ _ _ _ _ _
Table A 1. (continued)
~
Concentration in t<i/LbETA Resultd ,,,
Lab Sample Date TIML Result . Control"Code Type Collected Analysis t2ac 1s, N=1 Limits
STW 533 Water Apr 1988SM (Blind)
Sample A Cr. alpha NDI 46.0111.0 27.0-65.0Ra 226 ND 6.411.0 4.78.1Ra 228 ND 5.610.8 4.27.0Uranium 6.016.0 6.016.0 0.0-16.4
Sample B Gr. beta ND 57.015.0 48.3-65.7Sr89 3311.2 5.015.0 0.0 13.7Sr 90 5.311.2 5.011.5 2.47.6Co60 63.3113 50.015.0 41.3-58.7Cs 134 7.7tl.2 7.015.0 0.0-15.7Cs 137 8311.2 7.015.0 0.0-15 7
STU 415 Urine Apr 1988 H3 64831155 62021620 5128-7276
STW 536 Water Apr 1988 Sr 89 14.711 3 20.015.0 11.3 28.7Sr 90 20.0+ 2.0 20.011.5 17.4-22.6
STW 538 Water Jun 1988 Cr 51 331.7113.0 302.0130.0 250.0 354.0'
Co40 16.012.0 15.015.0 63 23.7Zn 65 107.7111.4 101.0110.0 83.7 1183Ru 106 191.3111.0 195.0120.0 160.4-229.6CS-134 18314.6 20.015.0 11.3-28.7Cs-137 26311.2 25.015.0 16.3-33.7 :
STW 539 Water Jun 1988 H3 5586192 55651557 4600-6530
STW-541 Milk Jun 1988 Sr 89 33.7111.4 40.015.0 31.3-48.7Sr 90 55315.8 60.013.0 54.8-65.21131 103.713.1 94.019.0 78.4 109.6Cs 137 52.713.1 51.015.0 42.3 59.7K 1587123 1600180 1461 1739
STW 542 Water Jul1988 Cr, alpha 8.7i4.2 15.015.0 6.3 23.7Gr. beta 5311.2 4.015.0 0.0 12.7
STF 543 Food Jul 1988 St 89 NDI 33.0i5.0 24.3-41.7Sr 90 ND 30.012.0 30.5-37.5I131 115.0153 1c"' 0111.0 88.0 126.0Cs-137 52.716.4 49.015.0 40.2.-57.7,
K 1190166 1240162 1133-1347
All-5

,.-. - .
.
'! ,
I'
Table A 1. (continued)
Concentration in r<i/LbFPA Resultd
lab Sample Date TIML Result ControlCode Type Collected Analysis 12csc Is. N=1 Limits
ETW 544 Water Aug 1958 I131 80.010.0 76.018.0 62.1 89.9
STW 545 Water Aug 1988 Pu 239 11.010.! 10.211.0 8.511.9 j
STW 346 Water Aug 1988 Uranium 6.010 0 6.016.0 0.0-16.4
STAF 547 Air Filter Aug 1988 Gr. alpha 8.010.0 8.0:.3.0 0.0-16.7 |Gr. beta 26.311.2 29.015.0 20.3-37.7 iSt-90 8.012.0 8.011.5 5.4-10 6Cs-137 13.012.0 12.015.0 3.3207-
STW 548 Water Sep 1988 Ra 226 9.310.5 8.412.6 6.0 10.6Ra 228 5.810.4 3.411.6 4.06.8
STW 549 Water Sep 5988 Gr. alpha 7.012.0 8.015.0 0.0-16.7iCr. beta 11.311.2 10.0i5.0 1.3-18.7:
STW 550 Water Oct 1988 Cr 51 252.0114.0 251.0A25.0 207.7 294.3Co-60 26.012.0 25.015.0 16.3 33.7Zn-65 158.3110.2 151.0115.0 125.0 177.0Ru 106 153.019.2 152.0115.0 126.0 178.0Cs u4 28.715.0 .25.015.0 16.3-33.7C5137 16.311.2 15.015.0 6.3-23.7 ,
|STW 551 Water Oct 1988 H.3 2333i127 23161350 1710-2927
STW 552 . Water Oct 1988553 (Blind)
Sample A' Cr. alpha 38.318.0 41.0110.0 23.7 58.3:Ra 226 4.510.5 5.0i0.8 3.6-6.4Ra 228 4.410.6 5.210.8 3.6-6.4Urantum 4.7tl.2 5.016.0 0.0 15.4
Sample B Gr. beta 51.313.0 54.0iS:0 45.3-62.7!* Sr-89 3.711.2 11.015.0 2.3 19.7'
Sr 90 10.711.2 10.011.5 7.4-12.6C5134 15.312.3 15.0t5.0 6.3-23.7iC5137 16.711.2 15.015.0 6.3-23.7!
.
-A11-6:
.

__ - _ . _ _ . _ _ - _ _ _ - . _ _ _ _ _ _ _ - _ __
Table A 1.- (continued)
Concentration in nCi/Lb~
dFPA Resull _lab Sample Date TIML Result ControlCode' Type Collected Analysis 12cc is, N=1 Limits
STM 554 Milk Oct 1988 Sr89 40.317.0 40.015.0 31.3 48.7Sr 90 51.012.0 60.013.0 54.8 65.21131 94.0 3.4 91.019.0 75.4-106.6C3-137 45.014.0 50.015.0 41.5 4 7K 1500145 1600180 q.,i 1739
STU 555 Urine Nov 1988 H3 30301209 30251359 2403 3647
STW 556- Water Nov 088 Gr. alpha 9.013.5 9.015.0 0 3-17.7Cr. beta 9.711.2 9.015.0 0 3-17.7
STW 557 Water Dec 1988 1131 108.713.0 115.0112.0 94.2 135.8
STW 559 Water Jan '.989 Sr-89 40.018.7 40.015.0 31.3 48.7Sr 90 24.313.1 25.011.5 22.4-27.6
STW 560 Water Jan 1989 Pu 239 5.811.1 4.210.4 3.5-4.9
STW 561 Water fan 1989 Gr. alpha 7.311.2 8.015.0 0.0 16.7Gr. beta 5.311.2 4.015.0 0.0-12.7
STW 562 Water ' mb 1989 Cr 51 245146 235124 193.4-276.6Co 60 10.912.0 10.015.0 1 3-18.7
'
Zn-65 170110 159116 139.2 186.7Ru 106 18117.6 178118 146.8-2W.2 -
Cs-134 9.713.0 10.015.0 1.3 18.7Cs 137 11.711.2 10 015.0 1,3 18.7
STW 563 Water Feb l989 I131 109.014.0 106.0111.0 86.9 125.1
STW 564 Water Feb 1989 H3 2820i20 27541356 2137 3371 -
STW 565 Water Mar 1989 Ra 226 4.210 3 4.9 0.7 3.7-6.1Ra 223 1.911.0 1.710 3 1.22.2 <
STW 566 Water Mar 1989 ,U 5.010.0 5.016.0 0.0 15.4
STAF 567 Air Filter Mar 1989 Gr. alpha 21.711.2 21.015.0 12.3 29,7Cr. beta 68314.2 62.015.0 53.3 70.7Sr 90 20.012.0 20.011.5 17.4 22.6Cs-137 21.311.2 20.0i5.0 1?3-28.7
AII-7
.. _ _ _ . . _ _ - . . _ _ - _ . _ . , - . . . _ . _ ._ _

-
Table A 1. (continued)
Concentration in r$Ci/LbE'' 'Aghd
12b Sample Date TIML Result ControlCcde - Type Collected Analysis 12aC is. N=1 Limits
STW 568 Water Apr 1989569 (B!ind)
Sample A Cr. alpha 22.712.3 29.017.0 16.9-41.2Ra 226 3.610.6 3.510.5 2.6-4.4Ra 228 2.611.0 3.610.5 2.7-45U 3.010.0 3.016.0 0.0 13.4
Sample B Gr beta 52.316.1 57.015.0 433-651Sr 89 9.315.4 8 015.0 0.0 161St 90 7.010.0 8.011.5 5.4 10.6C3134 21.015.2 20.015.0 11.3-28JCs 137 3.012.0 20.0.15.0 11.3-28J
STM 570 Milk Apr 1989 St-89 26.0110.0 39.015.0 30.3-47.7Sr-90 45.714.2 55.013.0 49.S 60.2Cs 137 54.016.9 50 HA0 41.3-58JK-40 15211208 1600130 1461 173s
STW-5718 Water May 1989 Sr-89 <0.7 6.015.0 0.0 143Sr 90 5.011.0 6.011.5 34-8.6
STW 572 Water May 1989 Cr. alpha 24.012.0 30.018.0 16.1 43.9Gr. beta 49.3115.6 50.015.0 41.3 583
STW-573 Water Jun 1989 Ba 133 50.711.2 49.015.0 40.3-57;Co-60 31.312.3 31.015.0 22.3-39.5Zn 65 167i10 165117 135.6-194Ru 106 12319.2 123113 105.5-150Cs-134 40.311.2 3915 30.3-47.'Cs-137 22.3.t) .2 20i5 11.328.:
STW 574 Water Jun 1989 H3 45131136 45031450 3724-52S
STW 575 Water Jul1989 Ra-226 16.8i3.1 17.712.7 13.0 22.sRa-228 13.813.7 18.312.7 13.6 231
,
STW-576 Water Jul 1989 U 40.311.2 41.016.0 30.6151
STW V7 Water Aug 1989 I131 S4.715.8 83.0 8.0 69.1 96.*y
STAF 579 A.ir Filter Aug 1989 Gr. alpha 6.0i0.0 6.015.0 0.0-14.:Cs-137 10.312.3 10.015.0 1.3-18.:
A11-8
|_ _ _ - _

. _ _ _ _ _ _ _ _ _ - _ _ - _ _ -_
| Table A 1. (continued)i
Concentration in rCi/1.bFPA Resultd
le Sample Date TIML Result ControlCode Type Collected Analysis 12 oC is, N=1 Limits
STW 5S0 Watei Sep 1989 Sr 89 14.711.2 14 01.5.0 5322.7St 90 9.711.2 10.011.5 7.4-12.6
STW 581 Water Sep 1989 Gr. alpha 5 010.0 4.015 0 0.0 12.7Gr. beta 8.712.3 6.015.0 0.0-14.7
STW 583 Water Oct 1989 Ba 133 (0.3110.0 59.016.0 48.6-69.4Co 60 29.014.0 30.015 0 21.1 38.7Zn 65 132.316.0 129.0113.0 106.5 151.5Ru 1" 155.316.1 161.0116.0 133.3 188.7G :.h 6.'.' +6.1 29.015.0 20.3-37.7Cs .37 -11 59.015.0 50.3 67.7
STW 584 Water Oct 1989 H3 uJ71r30 3496t.364 286614126
STW 585 Water Oct 1989586 (Blind)
Sample A Gr. alpha 41.719.4 49.0112.0 28.2-69,8Ra 226 7.910.4 8.411.3 6.2-10.6Ra 228 4.41 0.8 4.110.6 3.15.1U 12.010.0 12.016.0 1.6 22.4
Sample B Gr. beta 31.712.3 32.015.0 23.3-40.7Sr 89 13.314.2 15.0 5.0 6.3-23.7St 90 7.012.0 7.013.0 4.4-9.6Cs 134 5.0.to.0 5.015.0 0.0-13.7Cs-13'' 7.0io.0 5.015.0 0.0-13.7
STW-587 Water Nov 1989 R 226 7.910.4 8.711.3 6.4 11.0Ra 228 b.9il.2 9.311.2 6.9 11.7
STW 588 Water Nov 1989 U 15.0do.08 15.016.0 4.6-25.4
STW 589 Water Jan 1990 Sr 89 22.715.0 25.015.0 16.3 33.7' Sr 90 17.311.2 20.011.5 17.4-22.6
STW 591 Water Jan 1990 Gr. alpha 10.313.0 12.015.0 3.3-20.7Gr. beta 12.311.2 12.015.0 3.3-20.7
i
.
Al1-9
_ __ ._ _ _ _ _- _ _ _ _ _ _ _ _ _ _ _ - _ - - -_ -_

I
Table A 1. (continued)
)Qncentration in t<i/Lb ]
FPA Resultd ]Lib Sample Date TIML Result Control lCcde Type Collected Analysis 12aC 1s, N=1 Limits
STW 592 Water Jan 1990 CcHO 14.712.3 1515.0 6323.7Zn-65 135.016.9 139.0114.0 114.8 163 2'Ru 106 133.3 13.4 139.0114.0 114.8 163.2Cs-1M 17.311.2 18 015.0 9.3 26.7Cs 137 19.311.2 18.015.0 9.3 26.7 :Ba 133 78.010 0 74 017.0 61.9-S6.1
STW-593 Water Feb l990 H3 4827183 49761498 4113-5839
STW 594 Water Abr 1990 Ra-226 5.010.2 4.910.7 4.157Ra-228 13.510.7 12.711.9 9.4 16.0
STW-595 Water Mar 1990 U 400.0 4.016.0 0.0-14.4
STAF 596 Air Filter Mar 1990 Gr. alpha 7.311.2 5.015.0 0.0-13.7Cr. beta 34 010.0 31.015.0 22.3-39.7$r 90 10.010.0 10.011.5 7.4 12.6CS-137 9.311.2 10.015.0 1.3-18.7
STW-597 Water Apr 1990598 (Blind)
Sample A Cr. alpha 81.013.5 90.0123.0 50.1 129.7Ra 226 4.910.4 5.010.8 3.6-6.4Ra-228 10.610.3 10.211.5 7.6-12.8U 18.713.0 20.016.0 9.6-30.4
Sampie B Gr. beta 51.0110.1 52.01.5.0 43.3 60.7Sr-89 9.311.2 10.015.0 1.3-18.7Sr 90 10.313.1 10.011.5 8.3-11.7Cs-134 16.010.0 15.015.0 6.3-23.7C3-137 19.012.0 15.015.0 6.3 23.7
STM-599 Milk Apr 1990 Sr 89 21.713.1 23.015.0 14.3-31.7br 90 21.017.0 23.015.0 14.3 31.7
.1-131 98.711.2 99.0110.0 81.7 1163CS 137 26.016.0 24.015.0 15.3-32.7K 1300.0169.2 1550.0178.0 1414.7 16S5
STW-600 Water May 1990 Sr 89 6.012 0 7.015.0 0.0-15.7Sr 90 6.711.2 7.015.0 0.0-15.7
STW-601 Waier May 1990 Gr. alpha 11.012.0 22.016.0 11.6-32.4Cr. beta 12.311 2 15 0150 63-237
AII-10

. ..
. - - _ - - _ - _ -
Table A 1. (continued
Concentration in nCi/LbFPA Resultd
Lab Sample Date TIML Result '''o n t rolCode Type Collected Analysis 12oC 1s, N=1 Lirnits
STW 602 Water Jun 1990 Co-60 253123 24.015.0 153 32.7Zn 65 155.0110.6 148.0 15.0 130.6-165.4Ru 106 202.7117.2 210.0121.0 173.6-246.4C3-134 23.711.2 24.015.0 18.2-29.8Cs-137 27.7t3.1 25 015.0 163 33.7Ba 133 100.718.1 990 10.0 8171163
STW 603 Water Jun 1990 H3 29271306 29331358 2312 3554
STW 604 Water Jul1990 Ra 226 11.810.9 12.111.8 9.0 15.2Ra 228 4.111.4 5.111.3 2.S7.4
STW 605 Water Jul '990 U 20.311.7 20.813.0 15.6 26.0
STW 606 Water Aug 1990 1131 43.011.2 39.016.0 28.6149.4
STW 607 Water Aug 1990 Pu 239 10.011.7 9.110.9 7.5-10.7
STAF 608 Air Filter Aug 1990 Cr. alpha 14.010.0 10.015.0 13-18.7Cr. beta 65.311.2 62.015.0 533-70.7Sr 90 19.0i6.9 20.0 5.0 11 3-28.7Cs-137 19.012.0 20.015.0 11.3 28.7
STW 609 Water Sep 1990 Sr 89 9.012.0 10.015.0 1 3-18.7,
Sr 90 9.012.0 9.015.0 03 17.7
STW 610 Water Sap 1990 Cr. alpha 8311.2 10.015.0 1.3-18.7Cr beta 10.311.2 10.015.0 13-18.7
STM 611 Milk Sep 1990 Sr 89 11.713.1 16.015.0 73 24.7Sr-90 ;5.010.0 20.0 5.0 11 3-28.71131 63.016.0 58.016.0 47.6-68.4Cs-137 20.012.0 20.015.0 11.3-28.7K 1673.3170.2 1700.0185 0 1552.5-1847.5
STW-612 Water Oct 1990 Co-60 20313.1 20.015.0 11 3-28.7* Zn-65 1153112.2 115.0112.0 94.2 135.8
Ru 106 152.013.0 151.0115.0 125.0-177.0Cs 134 11.010.0 12.015.0 3 3-20.7Cs-137 14.012.0 12.015.0 3 3-20.7Ba 133 116.719.9 110.0111.0 90.9 129.
STW 613 Water Oct 1990 H3 7167i330 72031720 5954-8452
A!!-11
- - _ _ - - _ _ - - _ _ _ - - _ _ - - - _ - - - - - - - - - - - - - - - - - - - - - - - - - - - -

_. . .. _ _ _ __ . ._ _ _ _ ._ . . . _ . . _-
Tabl2 A 1, (continued)
Concentration in pCl/LbEPA Resultd
'
Lab Sample Date TIML Result Control -'
Code Type Collected Analysis 12ac is, N=1 Limits
STW 614 Water Oct 1990 !
615 '
Sample A Gr. alpha 68.717.2 62.0116.0 34.2 89.8 |,
Ra 226 12.910 3 13.612.0 10.1 17.1 !
Ra 228 4.210.6 5.011.3 2.7 73 .U 10.410.6- 10.213.0 5.0 15.4 ;
"Sample B - Cr beta 55.018.7 53.015.0 44.3-61.7 -
Sr 89 15.712.9 20.01.5.0 113 28.7,St 90 12.012.0 15.015.0- 63 23.7Cs 134 9.011.7 7.015.0 0.0 15.7 iCs 137 - 7.711.2 5.015.0 0.0 13.7 '
- STW 616 Water Nov 1990 Ra 226 6.811.0 7.411.1 5.593Ra 228 5.311.7 7.711.9 4,4-11.0 :
. STW 6178 Water Nov 1990 U 35.0f0.4 35.513.6 29.3141.7!
STW 618 Water - Jan 1991 Sr 89 4311.2 5.015.0 0.0 13.7 'Sr 90 4.711.2 5.015.0 0.0 13.7 i,
STW-619 Water Jan 1991 I % 239 3.620.2 3310.3 2.83.8
STW 620 - Water . Jan 1991 Cr. alpha 6.713.0 5.015.0 0.0 U.7-Cr. beta 6311.2 5.015.0 0.0 13.7
STW-621 Water Feb l991 Co 60 41318.4 40.015.0 31 3-48.7Zn 65 166.7119.7- 149.0il5.0 123.0-175.0-Ru-106 209.7118.6 186.0i19.0 153.0 219.0;Cs-134 9.012.0 8.015.0' O.046.7 JCsr137 9.711.2 8.015.0 0.0-16.7-Ba-133 85.7d9.2 75.0i8.0 61.1 88.9
STW 622 Water Feb 1991 1131 - 813k6.1 75.018.0 61.1 88.9
STW-623 Water Feb 1991 H3 4 10.01144.2 4418,01442.0 3651.2 5184)
STW 624 ' Water Mar 1991 Ra-226 31.4i3.2 31.814.8 23.5-40.1Ra-228 NDh 21.115.3 11.9 30.3
STW 625. Water Mar 1991 U 6.710.4 7.613.0 2.4-12.8:. .
' f
i
;AII-12$
1 - 'r tw. -m- -,r-reve.-.~ , s- ~ v , ,~,,,e-N,--ve,,ve -o- s- -e,----- .e.,m---edw, -w---ee~v-a,c----e ,w, -- r+-,- -wvme-

_-- _ _ - - _ _ _ _ _ _ .
| Table A 1. (continued)|
Concentration in rCi/LbEPA R6ultd
lab Sample Ebte TIML Result ControlCade Type Collected Analysis 12ac is, N=1 Limits
STAF-626 Filter Mar 1991 Gr. alpha 38.711.2 25.016.0 146-354Gr. beta 130.014.0 124.016.0 113.6 134 4Sr 90 35.711.2 40.015.0 31.3-487,
Cs-137 33714.2 40.015.0 31.3-487
STW 627 Water Apr 1991628
Sample A Gr. alpha 51.016.0 54 0114.0 297 78.3Ra 226 7.00.8 8.011.2 5.9 10.1Ra 228 9.711.9 15.213.8 8.6 21.5U 27.712.4 29.813.0 24.6 35.0
Sample B Gr. beta 93.316.4 115.0117.0 85.5-144.5Sr 89 21.013.5 28.015.0 19336.7Sr 90 23.010.0 26.015.0 173 347Cs 134 27.311.2 24.015.0 15.3 32.7C3137 29.012.0 25.015.0 16333.7
STM 629 Milk Apr 195il St 89 24.018.7 32.015.0 23.3 407St 90 28.012.0 32.015.0 23.3 40.71131 65.3114.7 60.016.0 49.6 70.4Cs 137 54 1111.0 49.0.t3.0 40.3-57.7K 1591.71180.1 1650.0183.0 1506.0 1794.0
. 5TW-630 Water May 1991 Sr-89 40.712.3 39.015 0 30.3-47.7Sr-90 23.711.2 24.015.0 15.3 32.7
STW 631 Water May 1991 Gr. alpha 27.715.8 24.016.0 134 34.4Gr. beta 46.0d0.0 46.015.0 37.3 54.7,
STW-632 Water Jun 1991 Co60 11.311.2 10.015.0 1.3-18 7Zn 65 119,3116.3 108.0111.0 88.9 127.1Ru 106 162.3119.0 149.0115.0 123.0 175.0Cs 134 15.311.2 15.015.0 6.3-23.7Cs-137 16.311.2 14.015.0 5.3-227Ba 133 74.016.9 62.016.0 51 6-72.4
.
STW-633 Water Jun 1991 H3 13470.01385.8 12480.011248.0 10314.8-14645.2
STW 634 . Water Jul 1991 Ra 226 14.910.4 15.912.4 11.7 20.1Ra-228 17.611.8 16.714.2 9.4 24.0
|
A!!-13
_ _ _ _ _ - _ _ _ _ _ _ - _ _ _ _ _ - - - _ - _ _ - - _ _ - - - - - _ - _ - _ _ - - _ - - - - - - - - - - - - - -

._ _ _ _ _ _ _
( Table A 1 (continued)_
Concentration in t'Cl/lbFPA Reiultd
lab Sarnple Date TIML Result lontrolCcde Type Collected Analysis 12cc 15, N=1 Limits
STW 635 Water Jul 1991 U 12.810.1 14.213.0 9.0 19.4
STW 636 Water Aug 1991 1 111 19.311.2 20.016.0 9.6304
STW-637 Water Aug 1991 Pu 239 21.410.5 19.4i1.9 16.1 22.7
STW-638 Filter Aug 1991 Gr. alpha 33.012.0 25.016.0 14.6-35.4Gr. beta 88.71).2 92.0110.0 80.4-103.tiSr 90 27.0i4.0 30.015 0 21 3-38.7Cs-137 26311.2 30.015.0 21 3-38.7
STW-639 Water Sep 1991 Sr 89 47.0110.4 49.015.0 403 57.7Sr 90 24.012.0 25.015.0 163-33.7
STW 640 Water Sep 1991 Gr. alpha 12.014.0 10.015.0 1 3-18.7Cr. beta 20.311.2 20.015.0 11 3-28.7
STM 641 Milk Sep 1991 St-89 20315.0 25.015.0 163-33.7Sr 90 19.713.1 25.015.0 163 33.7I131 130.7116.8 108.0111.0 88.9 127.1C3-137 33.713.2 30.015.0 21 3-38.7K 1743.31340.8 1740.0187.0 1589.1 1890
STW 642 Water Oct 1991 CcH50 29.711.2 29.015.0 203 37.7Zn-65 75.713 3 73.017.0 60.9 85.1Ru 106 1 %.3115.1 199.0120.0 164 3-233.:CS 134 9.711.2 10.015.0 1 3-18.7C3-137 11.012.0 10.01S.0 13 18.7Ba 133 94.713.1 98.0110.0 80.7 115.2,
STW-643 Water Oct 1991 H3 2640.01156.2 2454.01352.0 1843 3 3061
STW 644 Water Oct 1991645 Sample A Gr. alpha 73.0113.1 82.0121.0 45.6 118..I
Ra-226 20.912.0 22.013 3 163-27.7Ra 228 19.6123 22.215.6 12.5 31.9'U 13.510.6 13.513.0 8 3-18.7
Sample B Gr. beta 55.313.1 65.0110.0 47.7 823St 89 9.713.1 10.0i5.0 13 18.7Sr 90 8.711.2 10.015.0 1 3-18.7Co40 20.3i1.2 20.015.0 11.3-28.7Cs 134 9.015 3 10.015.0 1 3-18.7Cs-137 14.715.0 11.015.0 2 3-19.7
1i
Al1-14
_ _ _ _ _ - _ _ _ _ _ _ _ - - - _ _ _ _ _ _ _ _ _ _ _ _ _ ___-__ _ - __ _

Table A 1, (continued)
| C.grgnJ. ration in rCl/LbFPA Resultd
lab Sample Ebte TIML Result ControlCcde Type Collected Analysis 12 00 1s, N=1 Limits,
STW 646 Water Nov 1991 Ra 226 5.611.2 6.511.0 4.88.2Ra 228 9.60.5 8.112.0 4.6 11.6
STW.647 Water Nov 1991 U 24.712.3 24.9 3.0 19.740.1.
a Results obtained by Teledyne Isotopes Midwest Laboratory as a participant in the environmental samplecrosscheck program operated by the Intercomparison and Calibration Section, Quality Assurance Branch,Environmental Monitoring and Support laboratory, U.S. Environmental Protection Agency (EPA), Las -
Vegas, Nevada,b All results are in pCi/1, except for elemental potassium (K) data in milk, which are in mg/1; air filter
samples, which are in pCl/ filter; and food, which is in mg/kg.c Unless otherwise indicatal, the TIML results are given as the mean i 2 standard deviations for three
determinations,d USEPA results are presented as the known values and expected laboratory precision (1s,1 determinationi
and control limits as defined by EPA.e NA = Not analyzed.I ND = No data; not analyzed due to relocation of lab.5 Sample was analyzed but the results not submitted to EPA because deadline was missed (all data on file).h ND = No data; sample lost during analyses.
.
AII-IS
_ _ _ _ _ - - _ ___- ___ - _ _ _ _ _ - _ _ - _ - _ _ _ _ - _ - - - - _ _ - - - - - - - - - - - - - - - - - - - - - - - -_ _
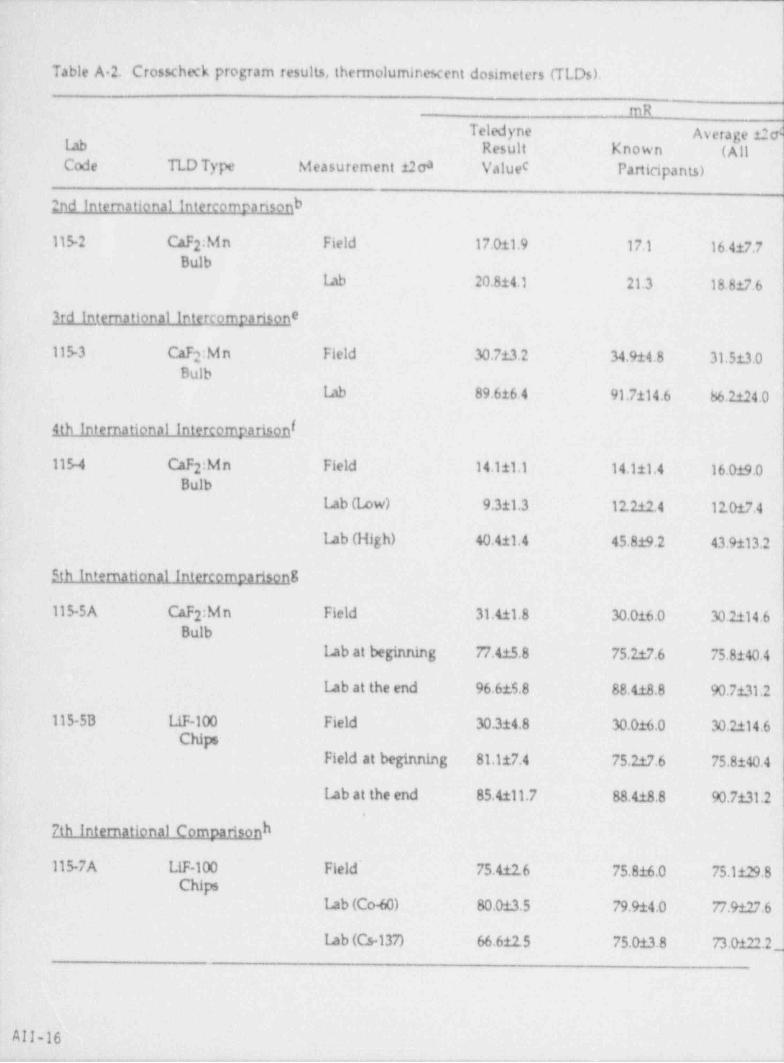
Table A 2. Crosscheck program results, thermoluminescent dosimeters (TLDs).
mRTeledyne Average 12e
lab Result Known (AllCode TLD Type Measurement 12ca Valuec Participants)
2nd International Intercomparisonb
115-2 CaF :Mn Field 17.011.9 17.1 16.417.72Bulb
lab 20.814.1 21.3 18.817.6
3rd International Intercomparisone
115-3 CaF :Mn Field 30.713.2 34.914.8 31.513.02Bulb
lab 89.616 4 91.7114.6 66.2124.0
4th International Intercompmitonf
115-4 CaF :Mn Field 14.111.1 14.111.4 16.0 9.02Bulb
Lab (low) 9.311.3 12.212.4 12.017.4
12b (High) 40.411.4 45.819.2 43.9113.2
Sh International Intercomparison8
115-5A CaF :Mn Field 31.411.8 30.016.0 30.2114.62Bulb
lab at beginning 77.415.8 75.217.6 75.8140.4
Lab at the end 96.615.8 88.418.8 90.7131.2
115-5B LiF-100 Field 30314.8 30.016.0 30.2114.6Chips
Field at beginning 81.117.4 75.217.6 75.8140.4
Lab at the end 85.4111.7 88.413.8 90.7131.2E
7th International Comnarisonh
115-7A LIF-100 Field 75.412.6 75.816.0 75.li29.8Chips
Lab (Co40) 80.013.5 79.914.0 77.9127.6
Lab (C3137) 66.612.5 75.013.8
73.0122.2 )
All-16.

_ _ _ - ___ __________ ___- _-_-_ -__ ___ _ -___ ___________ ___ _____-__- ___--___ _ _ _ ___ ____
Table A 3. Cross. check program results, thermolumir c.= cent dosimeters (TLDs).
mRTeledyne . Average 12cd
Lb Result Know (All l,
Code TLDType Measurement 1203 Valuec Participants)'
115 7B CaF :Mn Field 71.512.6 75.816.0 75.1129.82Bulbs
bb (Co-60) M.816.4 79.914.0 77.9127.6
bb (Cs-137) 78.811.6 75.013.8 73.0+ M 2
115 7C CaSO :Dy Field 76.8 2.7 75.816.0 75.1129.84
CardsLb (Co40) 82.513.7 79.9i4.0 77.9127.6
Lab (C5137) 79.013.2 75.013.8 73.0122.2L
8th Interrational intercomparisoni
115-8A LIF-100 Field Site 1 29.511.4 29.711.5 28.9112.4Chips
Field Site 2 11.310.8 10.410.5 10.1 9.06
bb(Cs 137) 13.710.9 17.210.9 16.216.8
115-8B CaF :Mn Field Site 1 32.311.2 29,711.5 28.9112.42Bulbs
Field Site 2 9.011.0 10.410.5 10.119.0
Lab (Cs 137) 15.8 0.9 17.210.9 16.216.8
115-8C CaSO :Dy Field Site 1 32.210.7 29.711.5 28.9112.44
CardsField Site 2 10.610.6 10.410.5 10.li9.0
bb (Cs-137) 18.110.8 17.210.9 16.216.8
Teledyne TestlD&I
89 1 LIF-100 bb- 21.010.4 22.4 -
Chips
89-2 Teledyne bb 20.911.0 20.3 -
CaSO :Dy4
Canis
,
All-17
. . - . _ _ _ _

Table A 2. (continued)
mRTeledyne Avera ge .t2 c'
lab Result Known (AllCode TLD Type Measurement A2ca Valuec Participants)
Teledyne Testingi
90 ik Teledyne lab 20.611.4 19.6 -
Ca50 44
Cards
90-11 Teledyne lab 100.814.3 100.0 -
CaSO Dy4
Canis
91 im Teledyne lab 33.412.0 32.0 -
CaSO Dy 55.214.7 58.84 -
Cards 87.816.2 85.5 -
a Lab result given is the mean i2 standard deviations of three determinations.b Second International Intercomparison of Environmental Dosimeters conducted in April of 1976 by tl
Health and Safety laboratory (HASL), New York, New York, and the School of Public Health of t}'University of Texas, Houston, Texas.
c Value determined by sponsor of the intercomparison using continuously operated pressurized icchamber,
d Mean 12 standard deviations of results obtained by all laboratories participating in the program.e Third International Intercompadson of Environmental Dosimeters conducted in summer of 19771:
Oak Ridge National laboratory and the School of Public Health of the Unircrsity of Texas, HoustoTexas.
I Fourth International Intercomparison of Environmental Dosimeters conducted in summer of 19791:the School of Public Health of the University of Texas Houston, Texas.
5 Fifth International Intercomparison of Environmental Dosimeters conducted in fall of 1980 at Idal-Falls, Idaho and sponsored by the School of Public Health of the University of Texas, Houston, Texn arEnvironmental Measurements l2boratory, New York, New York, US. Department of Energy.
h Seventh International Intercomparison of Environmental Dosimeters conducted in the spring arsummer of 1984 at I.as Vegas, Nevada, and sponsored by the U.S. Department of Energy, The U.;Nuclear Regulator */ Comrnission, and the US. Environmental Protection Agency. I
I Elgiith Internat;onal Intercomparison cf Environmental Dosimeters conducted in the fall and winte: )1985-1986 at New York, New York, and sponsored by the U.S. Department of Energy.
} Chips were submitted in Sepiember 1989 and cards were submitted in November 1989 to Teledy]<Isotopes, Inc., Westwood, NJ for irradiation. '
k Cards were irradiated by Teledyne Isotopes, Inc., Westwood, NJ on June 19,1990.1 Cards were irradiated by Dosimetry Ass <>ciates, Inc., Northville, MI on Octcber 30,1993.m Irradiated cards were provided by Teledyne Isotopes, INC., Westwood, NJ. Irradiated on October 8,1991;
, AII-18
-

Table A 3. In house spiked sarnples.
Concentration in pCl/LLab Sample Date TIML ExpectedCode Type Collected Analysis Result Known Precision
n=1 Activity 1s,n=13
QC MI 16 M11k Feb 1988 St 89 31.814.7 31,716.0 8.7Sr 90 25.512.7 27.813.5 5.21131 26.410.5 23.2 5.0 10.4C3-134 23.812.3 24.216.0 8.7C3137 26.510.8 25.116.0 8.7,
QC MI 17 Milk Feb 1988 l131 10.611.2 14.311.6 10.4 !!
QC W 35 Water Feb 1988 l131 9.711.1 11.611.1 10.4
QC-W 36 . Wa ter Mar 1988 1131 10.511.3 11.611.0 10.4
QC W 37 Waier Mar 1988 Sr 89 17.112.0 19.818.0 8.7St 90 18.710.9 17.315.0 5.2
QC-MI 18 Milk Mar 1988 I131 33.212.3 26.715.0 10.4Cs-134 31.3i2.1 30.215.0 8.7Cs 137 29.911.4 26.215.0 8.7
QC-W 38 Water - Apr 1988 1131 17.111.1 14.215.0 10,4,
QC W 39 Water Apr 1988 H3 4439131 41761500 724
QC W-40 Water Apr 1988 Co-60 23.710.5 26.114.0 8.7Cs-134 25.4i2.6 29.214.5 8.7C3137 26.612.3 26.214.0 8.7
QC-W-41 Water Jun 1988 Gr. alpha 12.310.4 13.115.0 8.7Gr. beta 22.611.0 20.115.0 8.7
QC-MI 19 Milk Jul 1988 89 15.111.6 16.415.0 8.7r
Sr-90 18.0 0.6 18.315.0 5.2I131 88.414.9 86.618.0 10.4Cs-137 22.710.8 20.816.0 8.7
.
QC-W-42 - Wa ter Sep 1988 Sr 89 48.513.3 50.818.0 8.7Sr-90 10.911.0 11.413.5 5.2
OC-W-43 Water Oct 1988 Co60 20.913.2 21.413.5 8.7Cs-134 38.711.6 38.016.0 8.7Cs-137 19.012.4 21.013.5 8.7
- QC-W-44 Water Oct 1988 I-131 22.210.6 23.313.5 10.4
AII-19 ,
- - - . . .- .-

Table A 3. In-house spiked sarnples(continued)
Cencentratiqn in tsCi/LIab Sample Date TBil ExpectedCode Type Collected Analysis Result Known Precision
n=1 Activity 13, n=l a
QC-W-45 Water Oct 1988 H-3 4109143 41531500 724
QC MI-20 Milk Oct 1988 1-131 59.810.9 60 619.0 10 4C3-134 49.611.8 48.617.5 8.7Cs-137 25.814.6 24.714.0 8.7
QC W-16 Water Dec 1988 Cr alpha 11.512.3 15.215.0 8.7Cr. beta 26.512.0 25 715.0 8.7
QC M1-21 Milk Jan 1989 Sr-89 25.5110.3 34 0110.0 8.7Sr 90 28.313.2 27.1 3.0 5.21131 540113 550120 10.4Cs-134 24.512.6 22.615.5 8.7Cs-137 24.010.6 20.515.0 8.7
QC W-47 Water Mar 1989 St-89 15.213.8 16.115.0 8.7Sr-90 16.411.7 16.9 3.0 5.2
QC-MI 22 M11k Apr 1989 l131 36.311.1 37.215.0 10.4Cs-134 20.812.8 20.718.0 8.7Cs-137 22.212.4 20.418.0 8.7
'
QC W-48 Water Apr 1989 Co-60 23.512.0 25.118.0 8.7Cs-134 24.211.1 25.918.0 8.7Cs-137 23.611.2 23.018.0 8.7
QC-W-49 Water Apr 1989 I131 37.2i3.7 37.215.0 10.4
QC-W-50 Water Apr 1989 H-3 3011159 30891500 724
QC-W-51 Water Jun 1989 Gr. alpha 13.011.8 15.015.0 8.7Gr. beta 26.0 1.2 25.518.0 8.7
<
QC MI 23 Mlik Jul1989 St-89 19.416.5 22.0110.0 8.7Sr 90 27.613.5 28.613.0 5.21-131 46.813.2 43.415.0 10.4Cs-134 27.411.8 28.316.0 8.7Cs-137 24.111.8 20.816.0 8.7
QC-MI-24 M11k Aug 1989 Sr-39 25.412.7 27.2110.0 8.7 |
Sr-90 46.011.1 47.819.6 8.3
| QC W-52 Water Sep 1989 l-131 9.610.3 9.711.9 10.4 l1
1
All-20

Table A 3. In house spiked samples (continued),
Concentration in rC1/LLab Sample Date TIML
~
F.spectedCode Type Collected Analysis Result Known Precision
"*I Activity 15, n= 3 a
QC W 53 Water Sep 1989 1131 19.010.2 20.914 2 10.4
QC W 54 Water Sep 1989 St 89 25 814 6 24.714.0 8.7Sr 90 26.515.3 29.715.0 5.2
QC MI 25 Milk Oct 1989 I-131 70.013.3 73.5 20.0 10.4Cs 134 22.112.6 22.618.0 8.7Cs-137 29.411.5 27.518.0 8.7
QC-W 55 Water Oct 1989 l131 33.311.3 35.3110.0 10.4
QC W 56 Water Oct 1989 Co-60 15.210.9 17.415.0 0.7Cs 134 22.114.4 18.913.0 8.7Cs-137 27.211.2 22.933.0 8.7
QC W 57 Water Oct 1989 H3 3334122 33791500 724
QC W 58 Water Nov 1989 St 89 10.911.4d 11.111.0d 8.7Sr-90 10.411.0d t o,31),od 5.2
QC W 59 Water Nov 1989 Sr 89 101.016 Cd 104.1110.5d 17.5Sr 90 98.013.0d 95.0110.0d 17.0
QC W-60 Water Dec 1989 Gr. alpha 10.811.1 10.614.0 8.7Cr, beta 11.610.5 11.414.0 8.7
QC MI 26 Milk Jan 1990 CF134 19.311.0 20.818.0 8.7'
C3-137 25.211.2 22.818.0 8.7
QC MI 27 Milk Feb 1990 Sr 90 18.011.6 18.815.0 5.2
QC hD 28 Milk Mar 1990 I131 63.812.2 62.616.0 6.3
QC hu-61 Water Apr 1990 Sr-89 17.92.5.5 23.118.7 8.7. St 90 19.412.5 23.515.2 5.2
_ QC hu 29 M11k Apr1990 1131 90.719.2 82.518.5 10.4~
Cs-134 18.311.0 19.715.0 8.7Ce137 20.311.0 18.2t3.0 8.7
QC-W-62 Water Apr 1990 Co-60 8.710.4 9.415.0 8.7Cs-134 20.010.2 19.715.0 8.7Cs 137 28.711.4 22.715 0 8.7
All-21
.- .- .- - ,

_ - _ _ _ _ _ _ _ _ _ _ _ _ _ _ _ _ _ _ _ -
Table A 3. In house spiked samples (continued)
Concentration in to/Llab Sample !>te TIML ExpectedCcde Type Collected Analysis Result Known Precision
""I<Activity 1s,n=la
QC W43 W ater Apr 1990 1131 63.518.0 66.016.7 6.6
QC W.44 Water Apr 1990 H3 19411130 1826.01350.0 724
QC W45 Water Jun 1990 Ra 226 6.410.2 6.911.0 1.0
QC W-66 Water Jun 1990 U 6.210.2 6.016.0 6.0
QC hu 30 M11k Jul 1990 Sr-89 12.810.4 18.4110.0 8.7Sr 90 18.211.4 18.716.0 5.2Cs 134 46.011.3 49.0 5.0 8.7Cs-137 27.611.3 25.315.0 8.7
QC W-68 Water Jun 1990 Cr. alpha 9.810.3 10.616.0 8.7Gr. beta 11.4 0.6 11.317.0 8.7
QC hu 31 Mlik Aug 1990 1-131 68.811.6 61.4112.3 10.4
QC W-69 Water Sep 1990 Sr 89 17.711.6 19.2110.0 8.7Sr-90 13.911.6 17 4110.0 5.2
'
QC AU-32 Milk Oct 1990 1-131 34.810.2 32.416.5 8.7Cs 134 25.811.2 - 273 110.0 8.7Cs-137 25312.0 22.4110.0 8.7
QC W 70 Water Oct 1990 H3 2355159 22761455 605
QC W 71 Water Oct 1990 1-131 55.9i0.9 51.8110.4 10.4
QC-W 73 Water Oct 1990 Co-60 18312.7 16.815.0 8.7Cs 134 283123 27.0t5.0 8.7Cs-137 22.7tl.3 22.415.0 8.7
QC W-74 Water Dec 1990 Cr. alpha 21.411.0 26.116.5 11 3Gr. beta 25.911.0 22.315.6 9.7
QC hu 33 Milk Jan 1991 ' Sr-89 20.713.3 21.613.0 5.0 -
Sr 90 19.0il.4 23.013.0 3.0Cs 134 22.211.7 19.615.0 5.0Cs-137 26.1il.6 22.315.0 5.0
QC-hE-34 Milk Feb 1991 1-131 40.7tl.8 40.116.0 6.0.
QC W 75 Water Mar 1991 Sr-89 18.811.5 23.315.0 5.0Sr-90 16.010.8 17.213.0 3.0
i
AII-22
_

_ _ _ _ _ _ _ _ - _ _ _ _ _ _ _ _ _ _ _
Table A 3. In house spiked samples (continued){
Concentration in rCi/Llab Sample Date TIML ExpectedCode Type CouectM Analysis Result Known Precision
n=1 Activity is,n=la. . .
-
QC W 76 Water Apr 1991 1-131 56.511.7 59.015.9 5.9
QC W 77 Water Apr 1991 Co-(0 16.412.2 15115.0 50Cs-1M 23 812.5 22.615.0 5.0Cs 137 25.012.4 21.1 5.0 5.0
QC W 78 Water Apr 1991 H3 40271188 40801408 408
QC hU-35 Milk Apr 1991 1131 48.010.8 49.216.0 60C51M 19.212.0 22.615.0 50Cs-137 22.812.2 22.115.0 5.0
QC W 79 Water Jun 1991 Cr. alpha 7.410.7 7.815.0 5.0Cr. beta 11.010.7 11.0 5.0 5.0
QC M136 Milk Jul 1991 Sr 89 28.112.1 34.0110.0 10.0Sr-90 11.6tJ.7 11.5 3.0 3.01131 14.411.9 18.315.0 5.0Cs 137 34.313.0 35.!i5.0 50
QC W-80 Water Oct 1991 Sr 89 27.416.9 24 A15.0 50Sr 90 11.711.4 14.115.0 5.0
QC W 81 Water Oct 1991 1 131 19.1t0.7 20.614.2 4.2
QC W 82 Water Oct 1991 Co40 22.612.7 22.115.0 5.0Cs-134 15.511.8 17.6. 5.0 5.0Cs-137 17.512.1 17.615.0 5.0
QC W-83 Water Oct 1991 H3 46391137 43821438 4M
QC MI-37 M11k Oct 1991 1 131 23.613.2 25.815.0 5.0Cs-134 22.712.8 22.115.0 5.0C3-137 38.313.0 35.115.0 5.0
QC-W-84 Wa te. Dec 1991 ' Gr. alpha 6.210.6 7.815.0 5.0Cr. beta 11.010.7 11.015.0 5.0
a n=3 unless noted otherwise.-_
b n=2 unless noted otherwise.c n=1 unless noted otherwise,d Concentration in pCi/ml.
Ii
All-23
_ - - - - - - _ _ _ _ _ - _ - - - - - _ - - - - - - - - - - - - - - - -

Table A 4 In houw '%nk" samples.._ .
Concentration (t{t/ u_
Acceptance13 Sample Date Results CnteriaCode Type ( Iected Analysis (4.66 c) (4 66 c)
SPS-5386 Milk Jan 1988 1131 < 0.1 <1
SPW 5448 " Dead" Water Jan 1988 H3 <177 <300
SPS-5615 Milk Mar 1968 Cs 134 < 2. 4 <10C3-137 < 2. 5 (101131 <0.3 <1Sr 89 <0. 4 c5St-90 2.410.5 a <3
SPS 5650 D.I. Water Mar 1988 Th 228 < 0. 3 <1Th 230 <0.04 <1Th 232 <0.05 <1U 234 (0.03 <1U 235 <0.03 <1U 238 <0.03 <1Am 241 <0.06 <1Cm 241 <0.01 <1Pu-238 (0.08 <1Pu-240 <0.02 <1
STS4090 Milk Jul 1988 Sr-89 < 0. 5 <1Sr 90 1.810.5 <11 131 <0. 4 <1Cs-137 < 0. 4 <10
SPW 6209 Water Jul 1988 Fe 55 < 0. 8 <1
SPW-6292 Water Sep 1988 Sr-89 <0.7 <1Sr-90 <0.7 <1
SPS-6477 Milk Oct 1988 1131 <0.2 <1C3-134 < 6.1 <10Cs-137 <5.9 <10
SPW-6478 Water Oct 1980 1131 <0.2 <1
SPW-6479 Water Oct 1988 Co-60 <5.7 <10C3-134 <3.7 <10Cs-137 <4.3 <10
SPW-6480 Water Oct 1988 H-3 <170 <300
All-24

;.>
iTable A 4. In hoase " blank" samples (continued) j
1
Concentration (pCl/l.) |Acceptance ilab , Sample Date Results Criteria ;
Code Type Collected Analysis (4.66 o) (4.66 o) t
iSPW 6625 - Water Dec 1988 Gr. alpha - <0.7 <1 !
Cr. beta < 1.9 <4 j
SPS-6723 Milk Jan 1989 Sr 89 <0. 6 <5 iSt 90 1.910.3a <j [1131 <0.2 <1 :Cs 134 <4.3 <10Cs-137 <4.4 <10 . !
SPW 6877 Water Mar 1989 Sr 89 <0.4 <5 - !
St 90 <0.6 <1
I- SPS4963 - Milk Apr 1989 l131 <0.3 <1Cs-134 <5.9 (10
'
Cs-137 <6.2 <10 -
SPW 7561. Water Apr 1989 H3 <)50 <300, :
..SPW 7207: Water Jun 1989 Ra 226 <0.2 <1:
Ra 228 <0.6 <1*
.
SPS 7308 ' Milk' Jun 1989 Sr-89 <0.6 <5 i.
Sr 90 2.110.5a <31131 <0.3 <1Cs 134 < 6.4 <10Cs 137 - <7.2 <10 ,
~
SPW-7588 Water . Jun 1989 Gr. alpha <0.2 <1--
~ Gr. beta ' <1.0 <4
~ SPS 7322 Milk Aug 1989. Sr 89 <1.4 <5:
Sr-90 4.811.0a <11131 - <0.2 <1Cs-134 < 6.9 <10 - ;
Cs-137 <8.2 <10,
' SPW 7559 - -. Water Sep 1989 Sr 89 ' <2.0 <5 i
Sr-90 <0.7 <1-
SPW 7560 Water Oct 1989 l131 <0.1 <1 -
^ SPW-7562 . - Water Oct 1989 H3 <140 <300
.
-AII-25 '
.--
_.
se w e k -er - %.,--- , - , , .e+---ee,-,,re,4-w .-m,,. --y- ,w--,- -y,wv,.-,,-,.,., w,wy-v-,-.-w.---,----,-,,4,-i ,,,,w,.9 y , y n ,q .r- wm a--- - , = - , - . * . , y w w.-

-- - ________ ________
Table A 4. in house " blank" samples (continued)
Concentration (r'Ci/t)Acceptance
Lab Sa,mple Date Results CnteriaCode Type Collected Analysis (4.66 c) (4.66 o)
SPS 7605 Milk Nov 1989 l-131 < 0. 2 <1Cs-1M < 8. 6 <10Cs 137 <10 <10
SPW 7971 Water Dec 1989 Cr. alpha < 0. 4 <1Gr. beta <0.8 <4
SPW 8039 Water Jan 1990 Ra 226 < 0.2 <1
SPS-8040 Milk Jan 1990 Sr 89 <0. 8 <5Sr 90 < 1.0 <1
SPS-8208 Milk Jan 1990 Sr 89 <0. 8 <5Sr 90 1.610.5a <g
Cs-134 <3. 6 <10Cs-137 <4.7 <10
SPS-8312 Milk Feb 1990 Sr-89 <0.3 <5Sr 90 1.210.3a <j
SPW 8312A Water Feb 1990 Sr 89 <0.6 <5Sr 90 <0.7 <5
SPS-8314 Milk Mar 1990 1 131 <0.3 <1
SPS-8510 Milk May 1990 1-131 <0.2 <1C31M <4.6 <10Cs-137 <4.8 <10
SPW 8511 A Water May 1990 H3 <200 <300
SPS-8600 Milk Jul 1990 Sr 89 <0. 8 <5Sr 90 1.7i0.6a <31131 <0.3 <1Cs 134 <5.0 <10
'
Cs-137 < 7,0 <10
SPM-8877 Milk Aug 1990 I131 <0.2 <1
SPW 8925 Water Aug 1990 H3 <200 <300
AlI-26.__ _ _ - _ _ _ - _ - _ _ - _ - _ _ .-
. . .

Table A-4. In house " blank" samples (continued)|
Concentration (rCi/D'
Acceptance14 - Sample Date Results CriteriaCode Type Collected Analysis (4.66 c) (4.66 c)
SPW 8926 Water Aug 1990 Cr. alpha < 0.3 <1Cr. beta <0.7 <4
SPW-8927 Water Aug 1990 U 234 <0.01 <1U-235 <0.02 <1U 238 <0.01 <1
SPW-8928 Water Aug 1990 Mn 54 <4.0 <5Co 58 < 4.1 <5Co 60 < 2.4 <5Cs-134 <3.3 <5-Cs-137 <3.7 <5
SPW-8929 Water Aug 1990 Sr 89 <1.4 <5Sr 90 < 0.6 <1
SPW 69 Water Sep 1990 Sr 89 < 1.8 <5Sr 90 <0.8 <1
SPW-106 Water Oct 1990 H-3 <180 <300I131 <0.3 <1
SPM 107 Milk Oct 1990 1131 <0.4 <1Cs-134 <3.3 <5Cs 137 <4.3 <5
SPW 370 Water Oct 199t- Mn 54 < 1.7 <5Co.58 <2. 6 <5Co-60 <1.6 <5Cs-134 < 1.7 <5Cs-137 < 1.8 <5
. SPW 372 Water Dec 1990 Gr. alpha <0.3 <1Gr. beta <0.8 <4
SPS-406 Milk Jan 1991' Sr89 <0.4 <5Sr 90 1.810.48 <1Cs-134 <3.7 <5Cs-137 <5.2 <5
SPS-421 Milk Feb l991 I131 <0.3 <1
SPW 451' Water Feb 1991 Ra 226 <0.1 <1Ra-228 <0.9 <1
AII .27
. . _ . . - _.

Table A-4. In-house " blank" samples (continued)
*Concentration (rCi/ U
Acceptancelab Sample Date Results CritenaCcde Type Collected Analysis (4.66 o) (4 M a)
-SPW 514 Water Mar 1991 St 89 <1.1 <5
Sr-90 < 0.9 c1
SPW 586 Water Apr 1991 1 131 <0.2 <1Co-60 < 2. 5 <5C5-134 < 2. 4 <5Cs 137 < 2. 2 <5
SPS-587 Milk Apr 1991 1131 < 0. 2 <1CS-134 < 1.7 (5Cs-137 < 1. 9 c.5
'
SPW-837 Water Jun 1991 Cr. alpha < 0. 6 <1Gr. beta <1.1 <4
SPM 053 Milk Jul1991 Sr 89 < 0.7 <5Sr-90 0 410.3a <11-131 <0.2 <1
iCs-137 < 4.9 <5
SPM-1236 Milk Oct 1991 1-131 <0. 2 <1Cs-134 <3.7 <5CS-137 <4.6 (5
SPW-1254 Water Oct 1991 Sr-89 <2. 8 <5Sr-90 <0.7 <1
SPW 1256 Water Oct 1991 1-131 <0. 4 <1Co60 <3.6 <5Cs-134 <4.0 <5Cs-137 <3.6 di
SPW-1259 Water Oct 1991 H-3 <160 <300
SPW 1444 Water Dec 1991- Gr. alpha <0. 4 <1Gr. heta <0. 8 <4
a Low level of Sr-90 concentration in milk (1 - 5 Ki/L) is not unuseal
AII-28

. . ._ . _ . - _ _ _. _ - -_ .- . . - . _ _
TIML BLIND-01 Revision 0,12 2946
ATTACHMENT B
ACCEPTAN?E CRITERIA FOR " SPIKED" SAMPLES
LABORATORY PRECISION: ONE STANDARD DEVIATION VALUES FOR \ neuOUS ANALYSES 3
One Standard DeviationAnalysis Level for Single Determination
.
Camma Emitters 5 to 100 pCi/ liter or kg 5 pCi/ liter>100 pCi/ liter or kg 5% of known value
Strontium.' 90 5 to 50 pCl/ liter or Lg S pCi/ litero
>50 pCl/ liter or kg 10% of known value
Strontium 90b 2 to 30 pCi/ liter or kg 3.0 pCi/ liter ->30 pCl/ liter or kg 10% of known value
Pottssium >0.1 g/ liter or kg 5% of known value
Cross alpha <20 pC1/ Uter 5 pCi/ liter>20 pCi/ liter 25% of known value
.
Cross beta <100 pCi/ liter 5 pCi/ liter>100 pCi/ liter 5% of knowm value
. Tritium <4,000 pC1/ liter is = (pCi/ liter) =169.85 x anown).0933
>4,000 pCi/ liter 10% of known value
Radium 226, .228 <0.1 pCl/ liter 15% of knowm value.
Plutonium 0.1 pCi/ liter, gram, or sample 10% of known value
. Iodine 131, <55 pCi/ liter 6 pCi/ literIodine-129b >55 pCi/ liter 10% of known value
Uranium 238, <35 pCi/ liter 6 pCi/ literbNickel-64 , >35 pC1/ liter 15% of known value
Technetium.99b
Iron 55b 50 to 100 pCl/ liter 10 pCi/ liter>100 pCi/ liter 10% of known value
.a From EPA publication, " Environmental Radioactivity Laboratory Interenmparison Studies Program,Fiscal Year,1981-1982, EPA-600/4-814K)4.
b TIML limit.
All-29
. -. . - . - -, _-. ._ -.-

-
ALDDINDUM IOREh'QLLA
The following is an explanation of the reasons why certain samples were outside the controllimit specifi,by the Environmental Protection Agency for the Interlaboratory Comparions Program starting Janua19M.
EPATLML ControlResult Limit
Lab Code Analysis (pCi/L)a (pCi/L)a Bxplenation
STF 524 K 1010.71158.5b M 23.5-1336.5b Error in transference of data. Correct dawas 1105133 mg/kg. Results in the pchave been within the limits and Tikwill monitor the situation in the future.
STW-532 1-131 9.012.0 6.28.8 Samp:e recounted after 12 days. Tlaverage result was 8.Sil.7 pCi/L (with|EPA control limits). The sample w.recounted in order to check the deccResults in the past have been within tllimits and TIML will continue to monit.the situation in the future.
STW 534 CM4 63.311.3 41.2 58.7 High level of Co-60 was oue icontamination of beaker. Deaker w.discarded upon discovery e
contamination and sample wass recounteRecount results were 53.213.6 and 50.912pCi/L
STM-554 Sr 90 51.012.0 54.8-65.2 The cause of low result was due to veihigh fat content of milk. It should 1noted that 63% of all participants faihthis test. Also, the average for cparticipants was 54.6 pCi/L before ttCrubb and 55.8 pCi/L after the Grubb.
STW-560 Pu-239 5.811.1 3.5-4.9 The cause of high results is not knowthough it is suspected that the standarwas not properly calibrated by suppiand is under investigation. New Pu-2,standard was obtained and will be used 9the next test.
STW-568 Ra-228 2.611.0 2.7-4.5 The cause of low results is not knowNext EPA cross check results were withthe control imits. No furthcr actionplanned.
<
l
All-30

ADDFNDUM TO APPENDIX A (continued)
SPATIML ComrolResult Limit
lab Code Analysis (pCi/L)a (pCi/L)a Explanation
- STM 570 Sr 89 26.0110.0 30.3-47.7 The cause of low results was falsely highSr 90 45.714.2 49.8-60.2 recovery due to suspected incomplete
calcium removal. Since EPA sample wasused up, internal spike was prepared andanalyzed. The results were within controllimits (See table A 3, sample QC MI.24).No further action is planned.
STW-589 Sr 90 17.311.2 17.4-22.6 Sample was reanalyzed in triplicate:results of reanalyses were 18.81LS pCi/LNo further action is planned.
STM-599 K 1300.0i69.2c 1414.7-1685.3C Sample was reanalyzed in triplicate.Results of reanalyses were 1421.7195.3mg/L. The cause of low results isunknown.
STW-601 Gr. alpha 11.012.0 11.6-32.4 Sample was reanalyzed in triplicate.Results of reanalyses were 13.411.0 pCi/L
STAF 626 Gr. alpha 38.711.2 14.6 35.4' The cause of high results is the differencein geometery between standard used inthe TIML lab and EPA filter.
STW 632 Ba 133 74.016.9 51.6 72.4 wmple was reanalyzed. Results of thereanalyses were 63.816.9 pCi/L withinEPA limit.
STW-641 1-131 130.7116.8 88.9 127.1 The cause of high result is unknown. In-house spike sample was prepared with .activity of I 131 68.316.8 pCi/L. Result of
*
the analysis was 69.119.7 pCi/L
a Reported in pCi/L unless otherwise noted,b Concentrations are reported in mg/kg.c Concentrations are reported in mg/L.
Al!-31
. .- - -