Early clinical and radiological pulmonary complications following breast cancer radiation therapy:...
9
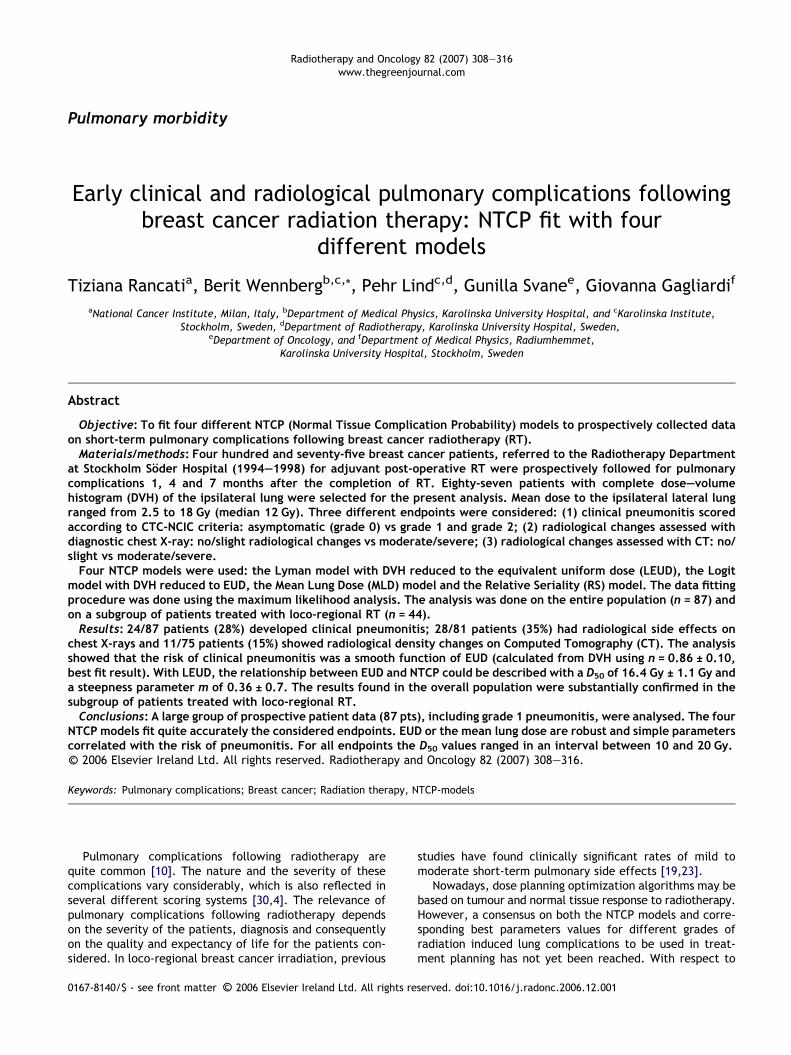
Pulmonary morbidity Early clinical and radiological pulmonary complications following breast cancer radiation therapy: NTCP fit with four different models Tiziana Rancati a , Berit Wennberg b,c, * , Pehr Lind c,d , Gunilla Svane e , Giovanna Gagliardi f a National Cancer Institute, Milan, Italy, b Department of Medical Physics, Karolinska University Hospital, and c Karolinska Institute, Stockholm, Sweden, d Department of Radiotherapy, Karolinska University Hospital, Sweden, e Department of Oncology, and f Department of Medical Physics, Radiumhemmet, Karolinska University Hospital, Stockholm, Sweden Abstract Objective: To fit four different NTCP (Normal Tissue Complication Probability) models to prospectively collected data on short-term pulmonary complications following breast cancer radiotherapy (RT). Materials/methods: Four hundred and seventy-five breast cancer patients, referred to the Radiotherapy Department at Stockholm So ¨der Hospital (1994–1998) for adjuvant post-operative RT were prospectively followed for pulmonary complications 1, 4 and 7 months after the completion of RT. Eighty-seven patients with complete dose–volume histogram (DVH) of the ipsilateral lung were selected for the present analysis. Mean dose to the ipsilateral lateral lung ranged from 2.5 to 18 Gy (median 12 Gy). Three different endpoints were considered: (1) clinical pneumonitis scored according to CTC-NCIC criteria: asymptomatic (grade 0) vs grade 1 and grade 2; (2) radiological changes assessed with diagnostic chest X-ray: no/slight radiological changes vs moderate/severe; (3) radiological changes assessed with CT: no/ slight vs moderate/severe. Four NTCP models were used: the Lyman model with DVH reduced to the equivalent uniform dose (LEUD), the Logit model with DVH reduced to EUD, the Mean Lung Dose (MLD) model and the Relative Seriality (RS) model. The data fitting procedure was done using the maximum likelihood analysis. The analysis was done on the entire population (n = 87) and on a subgroup of patients treated with loco-regional RT (n = 44). Results: 24/87 patients (28%) developed clinical pneumonitis; 28/81 patients (35%) had radiological side effects on chest X-rays and 11/75 patients (15%) showed radiological density changes on Computed Tomography (CT). The analysis showed that the risk of clinical pneumonitis was a smooth function of EUD (calculated from DVH using n = 0.86 ± 0.10, best fit result). With LEUD, the relationship between EUD and NTCP could be described with a D 50 of 16.4 Gy ± 1.1 Gy and a steepness parameter m of 0.36 ± 0.7. The results found in the overall population were substantially confirmed in the subgroup of patients treated with loco-regional RT. Conclusions: A large group of prospective patient data (87 pts), including grade 1 pneumonitis, were analysed. The four NTCP models fit quite accurately the considered endpoints. EUD or the mean lung dose are robust and simple parameters correlated with the risk of pneumonitis. For all endpoints the D 50 values ranged in an interval between 10 and 20 Gy. c 2006 Elsevier Ireland Ltd. All rights reserved. Radiotherapy and Oncology 82 (2007) 308–316. Keywords: Pulmonary complications; Breast cancer; Radiation therapy, NTCP-models Pulmonary complications following radiotherapy are quite common [10]. The nature and the severity of these complications vary considerably, which is also reflected in several different scoring systems [30,4]. The relevance of pulmonary complications following radiotherapy depends on the severity of the patients, diagnosis and consequently on the quality and expectancy of life for the patients con- sidered. In loco-regional breast cancer irradiation, previous studies have found clinically significant rates of mild to moderate short-term pulmonary side effects [19,23]. Nowadays, dose planning optimization algorithms may be based on tumour and normal tissue response to radiotherapy. However, a consensus on both the NTCP models and corre- sponding best parameters values for different grades of radiation induced lung complications to be used in treat- ment planning has not yet been reached. With respect to Radiotherapy and Oncology 82 (2007) 308–316 www.thegreenjournal.com 0167-8140/$ - see front matter c 2006 Elsevier Ireland Ltd. All rights reserved. doi:10.1016/j.radonc.2006.12.001
-
Upload
independent -
Category
Documents
-
view
1 -
download
0
Transcript of Early clinical and radiological pulmonary complications following breast cancer radiation therapy:...
Radiotherapy and Oncology 82 (2007) 308–316www.thegreenjournal.com
Pulmonary morbidity
Early clinical and radiological pulmonary complications followingbreast cancer radiation therapy: NTCP fit with four
different models
Tiziana Rancatia, Berit Wennbergb,c,*, Pehr Lindc,d, Gunilla Svanee, Giovanna Gagliardif
aNational Cancer Institute, Milan, Italy, bDepartment of Medical Physics, Karolinska University Hospital, and cKarolinska Institute,Stockholm, Sweden, dDepartment of Radiotherapy, Karolinska University Hospital, Sweden,
eDepartment of Oncology, and fDepartment of Medical Physics, Radiumhemmet,Karolinska University Hospital, Stockholm, Sweden
Abstract
Objective: To fit four different NTCP (Normal Tissue Complication Probability) models to prospectively collected dataon short-term pulmonary complications following breast cancer radiotherapy (RT).Materials/methods: Four hundred and seventy-five breast cancer patients, referred to the Radiotherapy Department
at Stockholm Soder Hospital (1994–1998) for adjuvant post-operative RT were prospectively followed for pulmonarycomplications 1, 4 and 7 months after the completion of RT. Eighty-seven patients with complete dose–volumehistogram (DVH) of the ipsilateral lung were selected for the present analysis. Mean dose to the ipsilateral lateral lungranged from 2.5 to 18 Gy (median 12 Gy). Three different endpoints were considered: (1) clinical pneumonitis scoredaccording to CTC-NCIC criteria: asymptomatic (grade 0) vs grade 1 and grade 2; (2) radiological changes assessed withdiagnostic chest X-ray: no/slight radiological changes vs moderate/severe; (3) radiological changes assessed with CT: no/slight vs moderate/severe.Four NTCP models were used: the Lyman model with DVH reduced to the equivalent uniform dose (LEUD), the Logit
model with DVH reduced to EUD, the Mean Lung Dose (MLD) model and the Relative Seriality (RS) model. The data fittingprocedure was done using the maximum likelihood analysis. The analysis was done on the entire population (n = 87) andon a subgroup of patients treated with loco-regional RT (n = 44).Results: 24/87 patients (28%) developed clinical pneumonitis; 28/81 patients (35%) had radiological side effects on
chest X-rays and 11/75 patients (15%) showed radiological density changes on Computed Tomography (CT). The analysisshowed that the risk of clinical pneumonitis was a smooth function of EUD (calculated from DVH using n = 0.86 ± 0.10,best fit result). With LEUD, the relationship between EUD and NTCP could be described with a D50 of 16.4 Gy ± 1.1 Gy anda steepness parameter m of 0.36 ± 0.7. The results found in the overall population were substantially confirmed in thesubgroup of patients treated with loco-regional RT.Conclusions: A large group of prospective patient data (87 pts), including grade 1 pneumonitis, were analysed. The four
NTCP models fit quite accurately the considered endpoints. EUD or the mean lung dose are robust and simple parameterscorrelated with the risk of pneumonitis. For all endpoints the D50 values ranged in an interval between 10 and 20 Gy.
�c 2006 Elsevier Ireland Ltd. All rights reserved. Radiotherapy and Oncology 82 (2007) 308–316.
Keywords: Pulmonary complications; Breast cancer; Radiation therapy, NTCP-models
Pulmonary complications following radiotherapy arequite common [10]. The nature and the severity of thesecomplications vary considerably, which is also reflected inseveral different scoring systems [30,4]. The relevance ofpulmonary complications following radiotherapy dependson the severity of the patients, diagnosis and consequentlyon the quality and expectancy of life for the patients con-sidered. In loco-regional breast cancer irradiation, previous
0167-8140/$ - see front matter �c 2006 Elsevier Ireland Ltd. All rights re
studies have found clinically significant rates of mild tomoderate short-term pulmonary side effects [19,23].
Nowadays, dose planning optimization algorithms may bebased on tumour and normal tissue response to radiotherapy.However, a consensus on both the NTCP models and corre-sponding best parameters values for different grades ofradiation induced lung complications to be used in treat-ment planning has not yet been reached. With respect to
served. doi:10.1016/j.radonc.2006.12.001
T. Rancati et al. / Radiotherapy and Oncology 82 (2007) 308–316 309
radiation induced lung complications, several NTCP analyseshave been performed [16,8,31,32]. These analyses havesome features in common, but the methodological differ-ences in the clinical and dosimetric data (e.g., endpointscoring and organ definition) do not permit a straightfor-ward comparison among them. Previous NTCP modellingstudies for the lung have been applied to grade 2–3 radia-tion pneumonitis [8,31,32].
The present paper provides the results of the fits toseveral NTCP models of a data set of prospectively followedmild-moderate lung complications after breast cancerradiotherapy. The patient group consisted of 87 women.The endpoints selected to score radiation pneumonitis wereboth clinical (symptomatic radiation pneumonitis) andradiological (X-ray and CT assessed changes in lung density).The NTCP models used for the fit were the Lyman EUD model[25,6,27,28], the Logit EUD model [6,27,28], the Mean LungDose model [16] and the Relative Seriality model [18].
Patients and methodsThis study was approved by the local Ethics Committee.
All participating patients gave informed consent beforeentering this study.
Patient populationAll patients who were referred to the Radiotherapy
Department at Stockholm Soder Hospital during November1994–May 1998 for adjuvant RT following surgery for StageI and Stage II node-positive breast cancer were asked to par-ticipate in this study. 475 patients (>90%) were included intothe study and the final 87 patients (i.e., those with com-plete dosimetric data) were selected for the present analy-ses. 3D planning was not mandatory during the first part ofthe study.
Data on patient characteristics were collected before thebeginning of RT: that is self-estimation of pre-RT functional
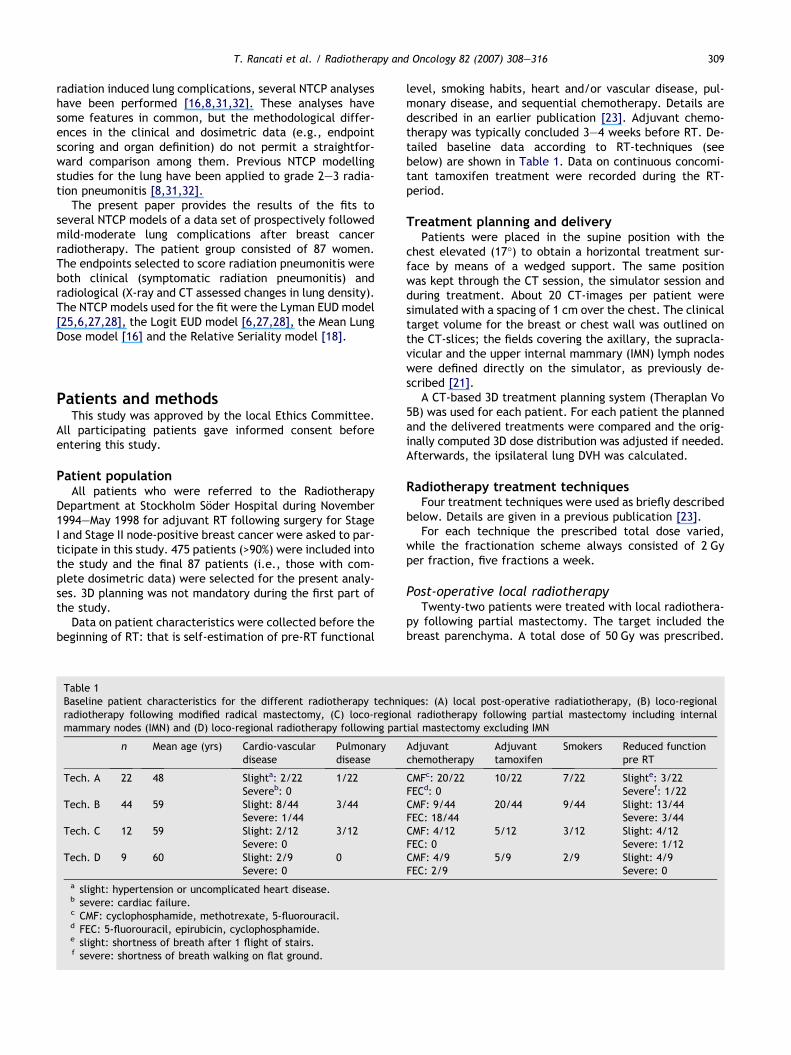
Table 1Baseline patient characteristics for the different radiotherapy techniradiotherapy following modified radical mastectomy, (C) loco-regionamammary nodes (IMN) and (D) loco-regional radiotherapy following par
n Mean age (yrs) Cardio-vasculardisease
Pulmonarydisease
Tech. A 22 48 Slighta: 2/22 1/22Severeb: 0
Tech. B 44 59 Slight: 8/44 3/44Severe: 1/44
Tech. C 12 59 Slight: 2/12 3/12Severe: 0
Tech. D 9 60 Slight: 2/9 0Severe: 0
a slight: hypertension or uncomplicated heart disease.b severe: cardiac failure.c CMF: cyclophosphamide, methotrexate, 5-fluorouracil.d FEC: 5-fluorouracil, epirubicin, cyclophosphamide.e slight: shortness of breath after 1 flight of stairs.f severe: shortness of breath walking on flat ground.
level, smoking habits, heart and/or vascular disease, pul-monary disease, and sequential chemotherapy. Details aredescribed in an earlier publication [23]. Adjuvant chemo-therapy was typically concluded 3–4 weeks before RT. De-tailed baseline data according to RT-techniques (seebelow) are shown in Table 1. Data on continuous concomi-tant tamoxifen treatment were recorded during the RT-period.
Treatment planning and deliveryPatients were placed in the supine position with the
chest elevated (17�) to obtain a horizontal treatment sur-face by means of a wedged support. The same positionwas kept through the CT session, the simulator session andduring treatment. About 20 CT-images per patient weresimulated with a spacing of 1 cm over the chest. The clinicaltarget volume for the breast or chest wall was outlined onthe CT-slices; the fields covering the axillary, the supracla-vicular and the upper internal mammary (IMN) lymph nodeswere defined directly on the simulator, as previously de-scribed [21].
A CT-based 3D treatment planning system (Theraplan Vo5B) was used for each patient. For each patient the plannedand the delivered treatments were compared and the orig-inally computed 3D dose distribution was adjusted if needed.Afterwards, the ipsilateral lung DVH was calculated.
Radiotherapy treatment techniquesFour treatment techniques were used as briefly described
below. Details are given in a previous publication [23].For each technique the prescribed total dose varied,
while the fractionation scheme always consisted of 2 Gyper fraction, five fractions a week.
Post-operative local radiotherapyTwenty-two patients were treated with local radiothera-
py following partial mastectomy. The target included thebreast parenchyma. A total dose of 50 Gy was prescribed.
ques: (A) local post-operative radiatiotherapy, (B) loco-regionall radiotherapy following partial mastectomy including internal
tial mastectomy excluding IMN
Adjuvantchemotherapy
Adjuvanttamoxifen
Smokers Reduced functionpre RT
CMFc: 20/22 10/22 7/22 Slighte: 3/22FECd: 0 Severef: 1/22CMF: 9/44 20/44 9/44 Slight: 13/44FEC: 18/44 Severe: 3/44CMF: 4/12 5/12 3/12 Slight: 4/12FEC: 0 Severe: 1/12CMF: 4/9 5/9 2/9 Slight: 4/9FEC: 2/9 Severe: 0

0
10
20
30
40
50
60
70
80
90
100
0 10 20 30 40 50 60
DOSE (Gy)
% L
UN
G V
OLU
ME
Local postoperative RT
Loco-regional RT following radical mastectomy
Loco-regional RT following partial mastectomy including IMN
Loco-regional RT following partial mastectomy excluding IMN
Fig. 1. Mean values of the cumulative DVH for the ipsilateral lung forthe different RT techniques. Values and standard deviations for V20and V30 for the different RT techniques are: local post-operativeRT: V20 = 14.9% ± 3.7%, V30 = 13.1% ± 3.5%; loco-regional RT fol-lowing radical mastectomy: V20 = 29.7% ± 9.8%, V30 = 19.9% ± 7.0%;loco-regional RT following partial mastectomy including IMN:V20 = 17.4% ± 6.8%, V30 = 13.9% ± 7.2% and loco-regional RT follow-ing partial mastectomy excluding IMN: V20 = 23.8% ± 12.9%,V30 = 18.8% ± 10.7%.
310 NTCP-fit of lung complication data after breast cancer irradiation
The treatment technique consisted of two tangential pho-ton beams, with an energy ranging from 4 to 8 MV.
Loco-regional radiotherapy following modifiedradical mastectomy
Forty-four patients were treated in this group. The targetwas defined as the chest wall, the upper IMN, axillary andsupraclavicular lymph nodes. The upper IMN, axillary andsupraclavicular lymph nodes, as well as the most lateral partof the chest wall, were treated with an anterior 8 MV photonbeam. A small posterior 8 MV photon beam was added to theaxilla, and the dose was prescribed at the centre of it. Oneanterior electron beam (range 6–16 MeV) was used to treatthe chest wall and the lower IMN in most cases. In somecases separate anterior electron beams were used to im-prove the coverage of the lower IMN and of the chest wall.
Loco-regional radiotherapy following partialmastectomy including IMN
Twelve patients belonged to this group. The target wasdefined as the breast parenchyma and the loco-regionallymph nodes as described above. The regional lymph nodeswere treated to 46 Gy and the breast to 50 Gy. The breastwas treated with two tangential photon beams (8 MV) andthe upper IMN, axillary and supraclavicular lymph nodeswere treated with an anterior photon beam. A small poster-ior photon beam (8 MV) was added to the axilla. The lowerIMN were treated with a separate oblique electron beam(12–14 MeV).
Loco-regional radiotherapy following partialmastectomy excluding IMN
Nine patients were treated with this technique. The tar-get was defined as the breast parenchyma and the loco-re-gional lymph nodes excluding the IMN. The regional lymphnodes were treated to 46 Gy and the breast to 50 Gy. Thebreast was treated with two tangential photon beams(4–8 MV). The upper IMN, axillary and supraclavicular lymphnodes were treated with an anterior photon beam (4–8 MV).A small posterior photon beam (4–8 MV) was added to theaxilla.
The mean DVHs for the ipsilateral lung for the differentRT techniques are depicted in Fig. 1.
Definition of endpointsRadiation induced pulmonary complications were evalu-
ated with three diagnostic criteria:
1. Symptomatic radiation pneumonitis.2. X-ray assessed lung density changes.3. CT assessed lung density changes.
Assessment of clinical pneumonitis was done 1, 4 and 7months after the completion of RT by interviews. Clinicalpneumonitis was defined according to modified CTC-NCICcriteria 0–2 [4]:
• Grade 0 – No pneumonitis: no registered respiratorysymptoms or respiratory problems independent of RT asjudged by the clinician.
• Grade 1 – Mild pneumonitis: respiratory symptoms(cough and /or dyspnoea with or without fever) judgedby the clinician to be RT induced but not treated withcorticosteroids.
• Grade 2 – Moderate complications: as grade 1 but withimpaired daily function and requiring corticosteroidstreatment (prednisolone 60 mg/day orally).
Cases of grade-1 or -2 pneumonitis were grouped togetherin the analysis and compared with asymptomatic patients.The grading system and its correlation with reduction in pul-monary function have been described in a previous publica-tion [20].
Density changes on chest X-ray were scored according toa system originally suggested by Arriagada and co-workers[1] which divides the lung field into three regions: the api-cal-lateral, central-parahilar, and basal-lateral. The high-est-density grades in each region were added together toform scores ranging from 0 to 9. Total scores of 1–3 wereconsidered to represent slight radiological pneumonitisand scores of 4–9 moderate to severe. The technique andits reproducibility have been described in a previous publi-cation [22]. In the present analysis cases of no/slight radio-logical pneumonitis were grouped together and compared tomoderate and severe cases.
Density changes on chest CT were evaluated using twoscan sets of the thorax: the first one was taken prior to RTfor treatment planning purposes and the second 4 monthsafter the completion of radiotherapy. The lung was divided
T. Rancati et al. / Radiotherapy and Oncology 82 (2007) 308–316 311
into three regions and density changes were scored andgrouped together in the same way as described above forthe evaluation of chest X-ray changes. CT-slices on threelevels were considered: the central CT-slice, the slice justabove the heart contour, and an apical slice at thelevel of the clavicle [19]. Also in this analysis no/slightradiological pneumonitis were compared to moderate/severe events. This technique and its correlation withreduction in pulmonary function have been described indetail earlier [21].
NTCP models: determination of parameters anduncertainties
The following NTCP models have been used – see Appen-dix A. The Lyman + EUD model, LEUD, (probit equation[25] + EUD DVH reduction method [6,27,28]), coupling theclassical Lyman formula with the generalised EUD concept.The LEUD model is equivalent to the classical Lyman–Kut-cher–Burman model, LKB, (probit equation [6] + KB DVHreduction method [15])
1. The Logit + EUD model, LOGEUD, (logistic equation + EUDDVH reduction method [6,27,28]), investigated because ofits simplicity in calculations.
2. The Mean Lung Dose model, MLD, (a special case of theLogit + EUD model, where the volume effect parametern becomes equal to one) [17].
3. The relative seriality model, RS [18].
The determination of the best estimate of the modelparameters was done by fitting NTCP models to the individ-ual clinical and dosimetric data. For the fitting of theparameters the Maximum Likelihood method was used[12]; details are given in Appendix B. The search for theparameter values was performed by means of the softwareminimization package MINUIT [13].
An evaluation of the uncertainties in the parameter val-ues was done by calculating the 68% confidence interval(CI). This was obtained, in a first approximation, by consid-ering the mono-dimensional likelihood profiles, varying oneparameter and keeping the others constant at their opti-mum values. Then the two-dimensional 68% joint confi-dence space of the parameters was analysed (keeping oneparameter constant and varying the others): non-linearitiesand correlations between parameters, resulting in non-sym-metric confidence intervals, can be taken into account. Inthis work we chose to keep the volume parameter n or sfixed at its optimum value.
The goodness of the fit was estimated [12] following theprocedure described in Appendix B. As an independent
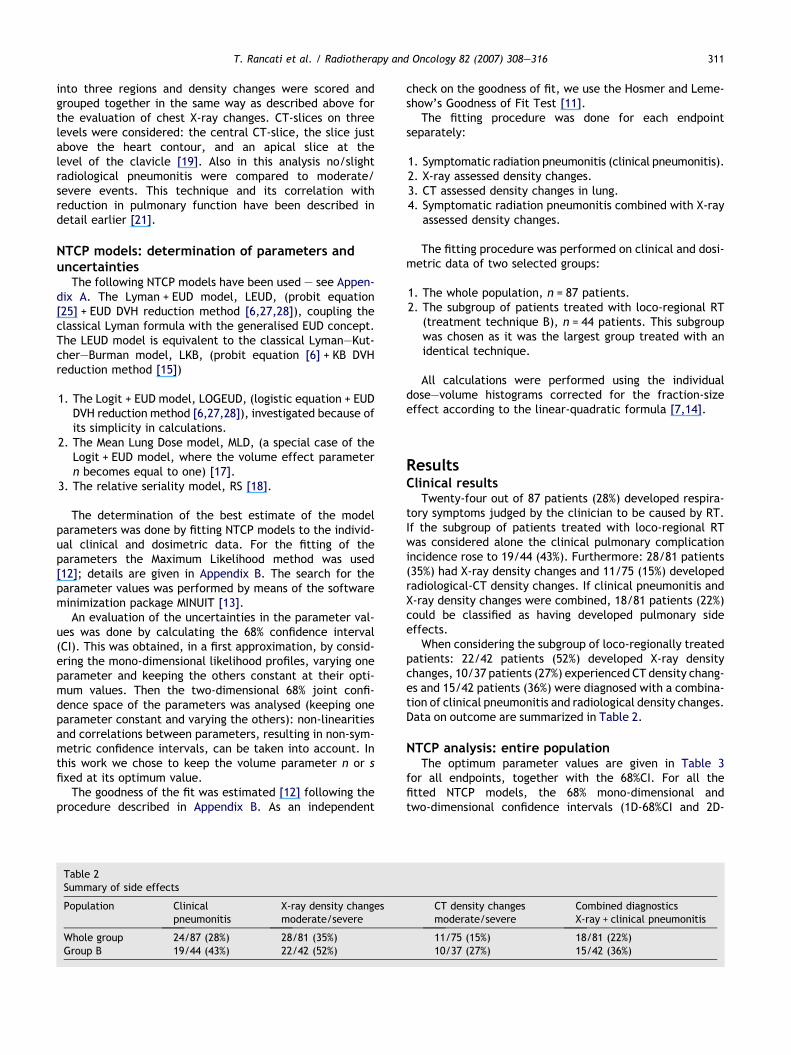
Table 2Summary of side effects
Population Clinicalpneumonitis
X-ray density changesmoderate/severe
Whole group 24/87 (28%) 28/81 (35%)Group B 19/44 (43%) 22/42 (52%)
check on the goodness of fit, we use the Hosmer and Leme-show’s Goodness of Fit Test [11].
The fitting procedure was done for each endpointseparately:
1. Symptomatic radiation pneumonitis (clinical pneumonitis).2. X-ray assessed density changes.3. CT assessed density changes in lung.4. Symptomatic radiation pneumonitis combined with X-ray
assessed density changes.
The fitting procedure was performed on clinical and dosi-metric data of two selected groups:
1. The whole population, n = 87 patients.2. The subgroup of patients treated with loco-regional RT
(treatment technique B), n = 44 patients. This subgroupwas chosen as it was the largest group treated with anidentical technique.
All calculations were performed using the individualdose–volume histograms corrected for the fraction-sizeeffect according to the linear-quadratic formula [7,14].
ResultsClinical results
Twenty-four out of 87 patients (28%) developed respira-tory symptoms judged by the clinician to be caused by RT.If the subgroup of patients treated with loco-regional RTwas considered alone the clinical pulmonary complicationincidence rose to 19/44 (43%). Furthermore: 28/81 patients(35%) had X-ray density changes and 11/75 (15%) developedradiological-CT density changes. If clinical pneumonitis andX-ray density changes were combined, 18/81 patients (22%)could be classified as having developed pulmonary sideeffects.
When considering the subgroup of loco-regionally treatedpatients: 22/42 patients (52%) developed X-ray densitychanges, 10/37 patients (27%) experienced CT density chang-es and 15/42 patients (36%) were diagnosed with a combina-tion of clinical pneumonitis and radiological density changes.Data on outcome are summarized in Table 2.
NTCP analysis: entire populationThe optimum parameter values are given in Table 3
for all endpoints, together with the 68%CI. For all thefitted NTCP models, the 68% mono-dimensional andtwo-dimensional confidence intervals (1D-68%CI and 2D-
CT density changesmoderate/severe
Combined diagnosticsX-ray + clinical pneumonitis
11/75 (15%) 18/81 (22%)10/37 (27%) 15/42 (36%)
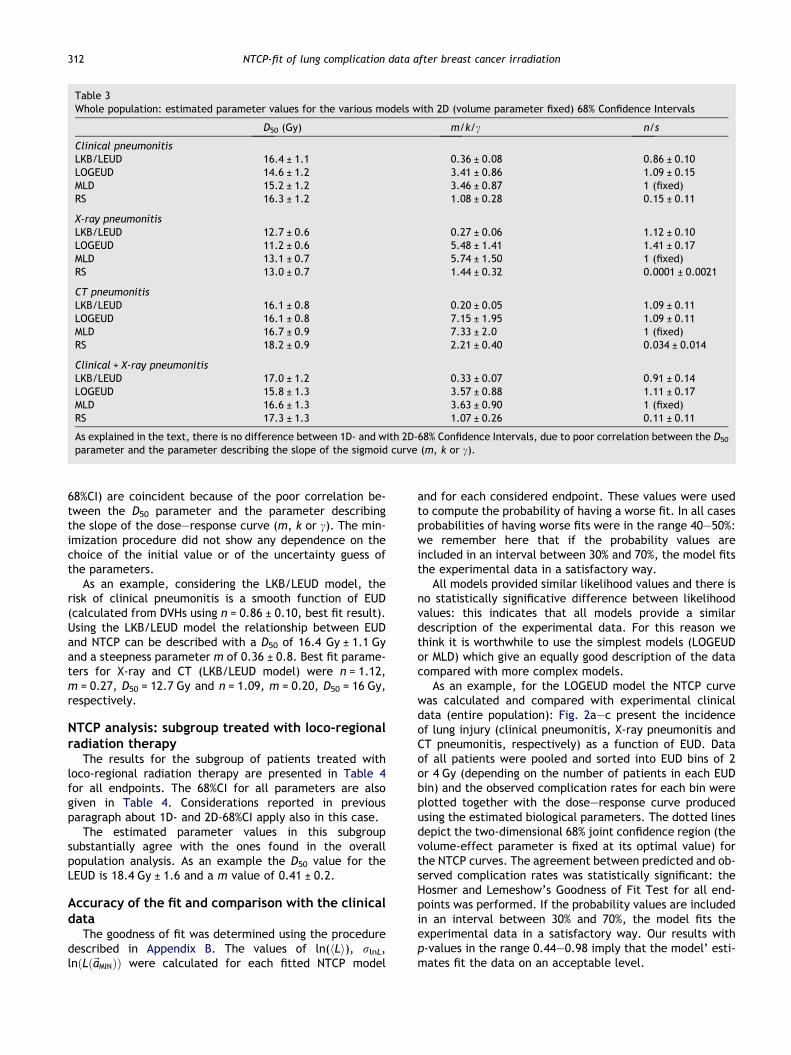
Table 3Whole population: estimated parameter values for the various models with 2D (volume parameter fixed) 68% Confidence Intervals
D50 (Gy) m/k/c n/s
Clinical pneumonitisLKB/LEUD 16.4 ± 1.1 0.36 ± 0.08 0.86 ± 0.10LOGEUD 14.6 ± 1.2 3.41 ± 0.86 1.09 ± 0.15MLD 15.2 ± 1.2 3.46 ± 0.87 1 (fixed)RS 16.3 ± 1.2 1.08 ± 0.28 0.15 ± 0.11
X-ray pneumonitisLKB/LEUD 12.7 ± 0.6 0.27 ± 0.06 1.12 ± 0.10LOGEUD 11.2 ± 0.6 5.48 ± 1.41 1.41 ± 0.17MLD 13.1 ± 0.7 5.74 ± 1.50 1 (fixed)RS 13.0 ± 0.7 1.44 ± 0.32 0.0001 ± 0.0021
CT pneumonitisLKB/LEUD 16.1 ± 0.8 0.20 ± 0.05 1.09 ± 0.11LOGEUD 16.1 ± 0.8 7.15 ± 1.95 1.09 ± 0.11MLD 16.7 ± 0.9 7.33 ± 2.0 1 (fixed)RS 18.2 ± 0.9 2.21 ± 0.40 0.034 ± 0.014
Clinical + X-ray pneumonitisLKB/LEUD 17.0 ± 1.2 0.33 ± 0.07 0.91 ± 0.14LOGEUD 15.8 ± 1.3 3.57 ± 0.88 1.11 ± 0.17MLD 16.6 ± 1.3 3.63 ± 0.90 1 (fixed)RS 17.3 ± 1.3 1.07 ± 0.26 0.11 ± 0.11
As explained in the text, there is no difference between 1D- and with 2D-68% Confidence Intervals, due to poor correlation between the D50
parameter and the parameter describing the slope of the sigmoid curve (m, k or c).
312 NTCP-fit of lung complication data after breast cancer irradiation
68%CI) are coincident because of the poor correlation be-tween the D50 parameter and the parameter describingthe slope of the dose–response curve (m, k or c). The min-imization procedure did not show any dependence on thechoice of the initial value or of the uncertainty guess ofthe parameters.
As an example, considering the LKB/LEUD model, therisk of clinical pneumonitis is a smooth function of EUD(calculated from DVHs using n = 0.86 ± 0.10, best fit result).Using the LKB/LEUD model the relationship between EUDand NTCP can be described with a D50 of 16.4 Gy ± 1.1 Gyand a steepness parameter m of 0.36 ± 0.8. Best fit parame-ters for X-ray and CT (LKB/LEUD model) were n = 1.12,m = 0.27, D50 = 12.7 Gy and n = 1.09, m = 0.20, D50 = 16 Gy,respectively.
NTCP analysis: subgroup treated with loco-regionalradiation therapy
The results for the subgroup of patients treated withloco-regional radiation therapy are presented in Table 4for all endpoints. The 68%CI for all parameters are alsogiven in Table 4. Considerations reported in previousparagraph about 1D- and 2D-68%CI apply also in this case.
The estimated parameter values in this subgroupsubstantially agree with the ones found in the overallpopulation analysis. As an example the D50 value for theLEUD is 18.4 Gy ± 1.6 and a m value of 0.41 ± 0.2.
Accuracy of the fit and comparison with the clinicaldata
The goodness of fit was determined using the proceduredescribed in Appendix B. The values of ln(hLi), rlnL,lnðLð~aMINÞÞ were calculated for each fitted NTCP model
and for each considered endpoint. These values were usedto compute the probability of having a worse fit. In all casesprobabilities of having worse fits were in the range 40–50%:we remember here that if the probability values areincluded in an interval between 30% and 70%, the model fitsthe experimental data in a satisfactory way.
All models provided similar likelihood values and there isno statistically significative difference between likelihoodvalues: this indicates that all models provide a similardescription of the experimental data. For this reason wethink it is worthwhile to use the simplest models (LOGEUDor MLD) which give an equally good description of the datacompared with more complex models.
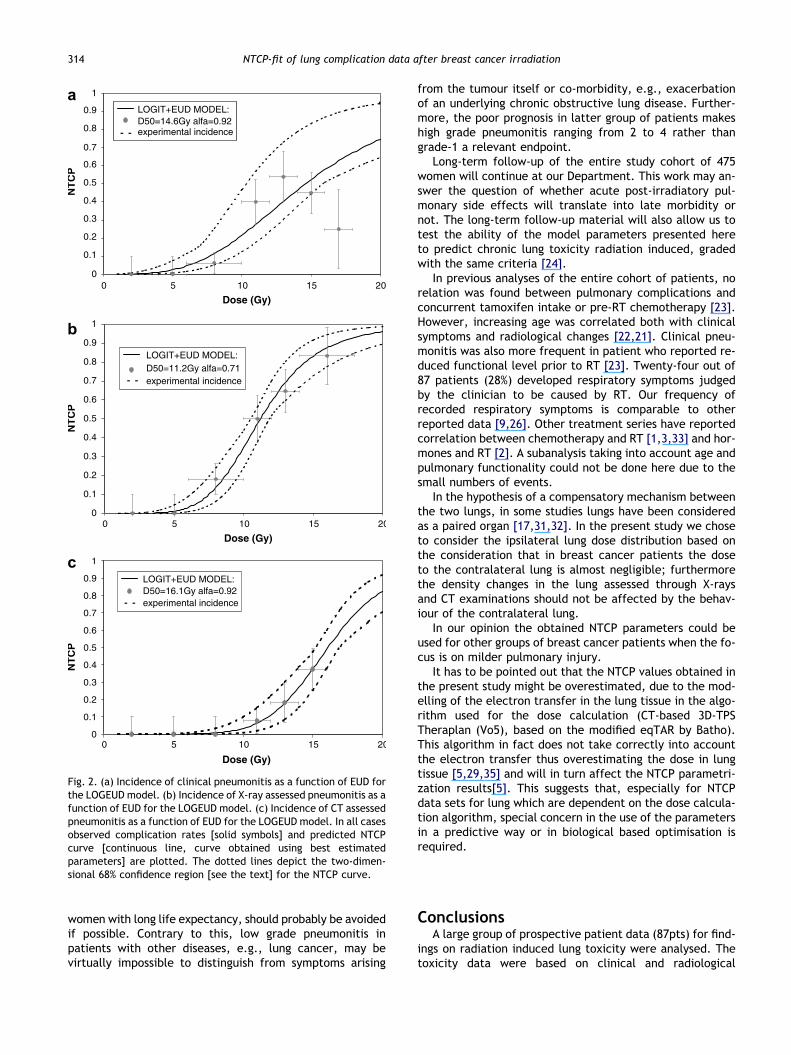
As an example, for the LOGEUD model the NTCP curvewas calculated and compared with experimental clinicaldata (entire population): Fig. 2a–c present the incidenceof lung injury (clinical pneumonitis, X-ray pneumonitis andCT pneumonitis, respectively) as a function of EUD. Dataof all patients were pooled and sorted into EUD bins of 2or 4 Gy (depending on the number of patients in each EUDbin) and the observed complication rates for each bin wereplotted together with the dose–response curve producedusing the estimated biological parameters. The dotted linesdepict the two-dimensional 68% joint confidence region (thevolume-effect parameter is fixed at its optimal value) forthe NTCP curves. The agreement between predicted and ob-served complication rates was statistically significant: theHosmer and Lemeshow’s Goodness of Fit Test for all end-points was performed. If the probability values are includedin an interval between 30% and 70%, the model fits theexperimental data in a satisfactory way. Our results withp-values in the range 0.44–0.98 imply that the model’ esti-mates fit the data on an acceptable level.

Table 4Group of patient treated with locoregional RT: estimated parameter values for the various models with 2D (volume parameter fixed) 68%Confidence Intervals
D50 (Gy) m/k/c n/s
Clinical pneumonitisLKB/LEUD 18.4 ± 1.6 0.41 ± 0.21 0.64 ± 0.12LOGEUD 14.4 ± 1.5 3.15 ± 1.66 1.04 ± 0.20MLD 14.6 ± 1.5 3.18 ± 1.67 1 (fixed)RS 15.9 ± 1.5 1.0 ± 0.52 0.17 ± 0.17
X-ray pneumonitisLKB/LEUD 16.4 ± 0.9 0.26 ± 0.10 1.5 ± 0.15LOGEUD 14.1 ± 0.9 5.60 ± 2.26 0.86 ± 0.10MLD 13.1 ± 0.9 5.35 ± 2.14 1 (fixed)RS 13.1 ± 0.8 1.46 ± 0.001 0.00001 ± 0.0003
CT pneumonitisLKB/LEUD 14.1 ± 0.9 0.24 ± 0.07 1.47 ± 0.20LOGEUD 14.5 ± 0.9 6.24 ± 2.20 1.33 ± 0.18MLD 16.3 ± 1.0 6.71 ± 2.38 1 (fixed)RS 14.1 ± 1.0 1.61 ± 0.44 0.00001 ± 0.0003
Clinical + X-ray pneumonitisLKB/LEUD 21.2 ± 1.5 0.30 ± 0.13 0.53 ± 0.11LOGEUD 19.1 ± 1.5 4.26 ± 1.92 0.67 ± 0.10MLD 15.9 ± 1.5 3.69 ± 1.62 1 (fixed)RS 18.3 ± 1.5 1.26 ± 0.51 0.22 ± 0.11
As explained in the text, there is no difference between 1D- and with 2D- 68% Confidence Intervals, due to poor correlation between the D50
parameter and the parameter describing the slope of the sigmoid curve (m, k or c).
T. Rancati et al. / Radiotherapy and Oncology 82 (2007) 308–316 313
DiscussionThe main features of this study are the prospective reg-
istration of the clinical data, the use of several endpointsdescribing pulmonary complications, the relative large num-ber of patients, and the fit to different NTCP models.
As pointed out above all NTCP models provide a similardescription of the data. Given this fact and the phenomeno-logical nature of the models it could be suggested to selectthe simplest model from the computational point of view,i.e., the LOGEUD or the MLD.
The results presented in the previous section show thatthe clinical data could be fitted to all NTCP models withD50 values varying in a range between 10 and 20 Gy. Accord-ing to the analysis the lung shows a parallel behaviour, asindicated by the tissue architecture parameters (s = 0 inthe RS model and n = 1 in the LEUD model).
Regarding the use of the prospective clinical scoringmethod through interviews: it is clinically relevant and itssensitivity is probably high in this group of patients as nei-ther severe lung morbidity nor any underlying malignant dis-eases may cloud the interpretation of the signs of radiationpneumonitis. The diagnostic evaluation methods quantifyingand grading X-ray density changes and CT density changesare relatively sensitive. Their main limitations are the intra-and inter-observer variability: however in our study thechest X-ray evaluations were validated by a second observer[21]. The D50 value obtained with the X-ray scoring method,ca. 12 Gy, is lower than the one obtained with the CT scor-ing, ca.17 Gy. This is probably due to the fact that onlythree slices were used for the evaluation of density changeson chest CT, thus making it likely that some CT complica-tions could be missed. In general the D50 values obtained
in this study are lower than the ones obtained in other stud-ies, as summarized elsewhere [32].
The comparatively low D50 values in our report may bedue to the prospective design of the trial and to the chosenendpoints, i.e., low grade clinical pneumonitis. Most NTCPmodelling studies for the lung have been generally appliedto grade 2–3 radiation pneumonitis.
Concerning the NTCP analysis on the endpoint defined bycombined clinical scoring and X-ray diagnosis: a previousNTCP analysis [8] on an apparently similar endpoint withthe RS model provided a higher D50 value, i.e., 30 Gy vs17 Gy found in the present study. The predictivity of theparameters from the previous study has been recentlytested [34]; the incidence of radiation pneumonitis waspredicted with acceptable accuracy. However there aremajor differences in the study design and in the endpointdefinitions: in the older study [8] the collection of theclinical data was retrospective, and probably only the mostsevere symptoms were reported. Furthermore, the retro-spective X-ray chest was evaluated only qualitatively, whilein the present study the assessment was prospective andsemi-quantitative.
Looking at the endpoints which are the object of thisstudy a question may arise: is it clinically meaningful totry to avoid grade-1 clinical pneumonitis? In our experiencebreast cancer patients who develop grade-2 pneumonitisare generally concerned by symptoms which restrict theiractivity of daily living. Furthermore, little is known aboutthe long-term consequences of moderate pneumonitis inthis patient group. There is an increased concern andawareness of the risks of radiation exposures; for this reasonalso grade-1 pneumonitis, in otherwise healthy and young
0
0.1
0.2
0.3
0.4
0.5
0.6
0.7
0.8
0.9
1
0 5 10 15 20
Dose (Gy)
NT
CP
0
0.1
0.2
0.3
0.4
0.5
0.6
0.7
0.8
0.9
1
0 5 10 15 20
Dose (Gy)
NT
CP
0
0.1
0.2
0.3
0.4
0.5
0.6
0.7
0.8
0.9
1
0 5 10 15 20
Dose (Gy)
NT
CP
LOGIT+EUD MODEL:D50=16.1Gy alfa=0.92experimental incidence
LOGIT+EUD MODEL:D50=11.2Gy alfa=0.71experimental incidence
LOGIT+EUD MODEL:D50=14.6Gy alfa=0.92experimental incidence
a
b
c
Fig. 2. (a) Incidence of clinical pneumonitis as a function of EUD forthe LOGEUD model. (b) Incidence of X-ray assessed pneumonitis as afunction of EUD for the LOGEUD model. (c) Incidence of CT assessedpneumonitis as a function of EUD for the LOGEUD model. In all casesobserved complication rates [solid symbols] and predicted NTCPcurve [continuous line, curve obtained using best estimatedparameters] are plotted. The dotted lines depict the two-dimen-sional 68% confidence region [see the text] for the NTCP curve.
314 NTCP-fit of lung complication data after breast cancer irradiation
women with long life expectancy, should probably be avoidedif possible. Contrary to this, low grade pneumonitis inpatients with other diseases, e.g., lung cancer, may bevirtually impossible to distinguish from symptoms arising
from the tumour itself or co-morbidity, e.g., exacerbationof an underlying chronic obstructive lung disease. Further-more, the poor prognosis in latter group of patients makeshigh grade pneumonitis ranging from 2 to 4 rather thangrade-1 a relevant endpoint.
Long-term follow-up of the entire study cohort of 475women will continue at our Department. This work may an-swer the question of whether acute post-irradiatory pul-monary side effects will translate into late morbidity ornot. The long-term follow-up material will also allow us totest the ability of the model parameters presented hereto predict chronic lung toxicity radiation induced, gradedwith the same criteria [24].
In previous analyses of the entire cohort of patients, norelation was found between pulmonary complications andconcurrent tamoxifen intake or pre-RT chemotherapy [23].However, increasing age was correlated both with clinicalsymptoms and radiological changes [22,21]. Clinical pneu-monitis was also more frequent in patient who reported re-duced functional level prior to RT [23]. Twenty-four out of87 patients (28%) developed respiratory symptoms judgedby the clinician to be caused by RT. Our frequency ofrecorded respiratory symptoms is comparable to otherreported data [9,26]. Other treatment series have reportedcorrelation between chemotherapy and RT [1,3,33] and hor-mones and RT [2]. A subanalysis taking into account age andpulmonary functionality could not be done here due to thesmall numbers of events.
In the hypothesis of a compensatory mechanism betweenthe two lungs, in some studies lungs have been consideredas a paired organ [17,31,32]. In the present study we choseto consider the ipsilateral lung dose distribution based onthe consideration that in breast cancer patients the doseto the contralateral lung is almost negligible; furthermorethe density changes in the lung assessed through X-raysand CT examinations should not be affected by the behav-iour of the contralateral lung.
In our opinion the obtained NTCP parameters could beused for other groups of breast cancer patients when the fo-cus is on milder pulmonary injury.
It has to be pointed out that the NTCP values obtained inthe present study might be overestimated, due to the mod-elling of the electron transfer in the lung tissue in the algo-rithm used for the dose calculation (CT-based 3D-TPSTheraplan (Vo5), based on the modified eqTAR by Batho).This algorithm in fact does not take correctly into accountthe electron transfer thus overestimating the dose in lungtissue [5,29,35] and will in turn affect the NTCP parametri-zation results[5]. This suggests that, especially for NTCPdata sets for lung which are dependent on the dose calcula-tion algorithm, special concern in the use of the parametersin a predictive way or in biological based optimisation isrequired.
ConclusionsA large group of prospective patient data (87pts) for find-
ings on radiation induced lung toxicity were analysed. Thetoxicity data were based on clinical and radiological

T. Rancati et al. / Radiotherapy and Oncology 82 (2007) 308–316 315
(X-ray, CT) findings and included data on no reported toxic-ity or reported lung toxicity including grade-1 pneumonitis.The data could be fitted by the four NTCP models.
The analysis showed that the risk of clinical pneumonitiswas a smooth function of EUD. The results found in the over-all population were substantially confirmed in the subgroupof patients treated with loco-regional RT. The EUD andMean Lung Dose models could probably be used in clinicalpractice due a simpler mathematic formalism. For all end-points the D50 values ranged in an interval between 10 and20 Gy; this is consistent with the low grade of pneumonitisand with the prospective design of the study.
The predictive ability on chronic side effects of theparameters-set will to be tested in a follow-up study whichis in progress at our centre [24].
AcknowledgementDr Mauro Cattaneo, San Raffaele Hospital, Milan and prof. Alan
Nahum, Clatterbridge Center for Oncology are gratefully acknowl-edged for helpful advice and discussions.
Appendices A and B. Supplementary data
Supplementary data associated with this article canbe found, in the online version, at doi:10.1016/j.radonc.2006.12.001.
* Corresponding author. Berit Wennberg, Department of MedicalPhysics, Soder Hospital, Karolinska University Hospital, Solna 171 76Stockholm, Sweden. E-mail address: [email protected]
Received 17 May 2006; received in revised form 4 December 2006;accepted 8 December 2006; Available online 16 January 2007
References[1] Arriagada R, Laudron de Guevara JC, Mouriesse H, et al.
Limited small cell lung cancer treated by combined radiother-apy and chemotherapy: evaluation of a grading system of lungfibrosis. Radiother Oncol 1989;14:1–8.
[2] Bentzen SM, Skoczylas JZ, Overgaard M, Overgaard J. Radio-therapy-related lung fibrosis enhanced by tamoxifen. J NatlCancer Inst 1996;88:918–22.
[3] Cox DR, Snell EJ. Analysis of binary data. 2nd ed. Lon-don: Chapman and Hall; 1989, p. 179–183.
[4] Cancer Therapy Evaluation Program. Common Toxicity Crite-ria, Version 2.0, DCTD, NCI, DHHS, 1998.
[5] De Jaeger K, Hoogeman MS, Engelsman M, Seppenwoolde Y,Damen EM, Mijnheer BJ, et al. Incorporating an improveddose-calculation algorithm in conformal radiotherapy of lungcancer: re-evaluation of dose in normal lung tissue. RadiotherOncol 2003;69:1–10.
[6] Deasy J, Niemierko A, Herbert D, et al. Methodological issuesin radiation dose–volume outcome analyses: Summary of ajoint AAPM/NIH workshop. Med Phys 2002;29:2109–27.
[7] Fowler JF. Brief summary of radiobiological principles infractionated radiotherapy. Semin Radiat Oncol 1992;2:16–21.
[8] Gagliardi G, Bjohle J, Lax I, et al. Radiation pneumonitis afterbreast cancer irradiation: analysis of the complication prob-ability using the relative seriality model. Int J Radiat OncolBiol Phys 2000;46:373–81.
[9] Hardman PDJ, Tweeddale PM, Kerr GR, Andersson EDC,Rodger A. The effect of pulmonary function of local andloco-regional irradiation for breast cancer. Radiother Oncol1994;30:33–42.
[10] Hernando ML, Marks LB, Bentel GC, Zhou S, Hollis D, Das SK,et al. Radiation-induced pulmonary toxicity: a dose–volumehistograms analysis in 201 patients with lung cancer. Int JRadiat Oncol Biol Phys 2001;51:650–9.
[11] Hosmer DW, Hosmer T, Cessie S, Lemeshow S. A comparison ofgoodness-of-fit tests for the logistic regression model. StatMed 1997;16:965–80.
[12] Jackson A, Ten Haken RK, Robertson JM, et al. Analysis ofclinical complication data for radiation hepatitis using aparallel architecture model. Int J Radiat Oncol Biol Phys1995;31:883–91.
[13] James F. Ross M MINUIT – a system for function minimisationand error analysis of the parameter errors and correlations.Comp Phys Comm 1975;10:343–67.
[14] Kutcher GJ, Burman C, Brewster L, et al. Histogram reductionmethod for calculating complication probabilities for three-dimensional treatment planning evaluations. Int J RadiatOncol Biol Phys 1991;21:137–46.
[15] Kutcher GJ, Burman C. Calculation of complication probabilityfactors for non-uniform normal tissue irradiation. Int J RadiatOncol Biol Phys 1989;16:1623–30.
[16] Kwa SL, Theuws JC, Wagenaar A, et al. Evaluation of twodose–volume histogram reduction models for the prediction ofradiation pneumonitis. Radiother Oncol 1998;48:61–9.
[17] Kwa SLK, Lebesque JV, Theuws JCM, Marks LB, Munley MT,Bentel G, et al. Radiation pneumonitis as a function of meanlung dose: an analysis of pooled data of 540 PTs. Int J RadiatOncol Biol Phys 1998;28:575–81.
[18] Kallman P, Agren A, Brahme A. Tumor and normal tissueresponses to fractionated non-uniform dose delivery. Int JRadiat Biol 1992;62:249–62.
[19] Lind PA, Gagliardi G, Wennberg B, Fornander T. A descriptivestudy of pulmonary complications after postoperative radia-tion therapy in node-positive stage II breast cancer. Acta Oncol1997;36:509–15.
[20] Lind PA, Rosfors S, Wennberg B, et al. Pulmonary functionfollowing adjuvant chemotherapy and radiotherapy for breastcancer, and the issue of three-dimensional treatment plan-ning. Radiother Oncol 1998;49:245–54.
[21] Lind PA, Svane G, Gagliardi G, Svensson C. Abnormalities bypulmonary regions studied with computer tomography follow-ing local or local-regional radiotherapy for breast cancer. Int JRadiat Oncol Biol Phys 1999;43:489–96.
[22] Lind PA, Bylund H, Wennberg B, Svensson C, Svane G.Abnormalities on chest radiographs following radiation therapyfor breast cancer. Eur Radiol 2000;10:484–9.
[23] Lind PA, Wennberg B, Gagliardi G, Fornander T. Pulmonarycomplications following different radiotherapy techniques forbreast cancer, and the association to irradiated lung volumeand dose. Breast Cancer Res Treat 2001;68:199–210.
[24] Lind PA, Wennberg B, Gagliardi G, et al. ROC curves andevaluation of radiation-induced pulmonary toxicity in breastcancer. Int J Radiat Oncol Biol Phys 2006;64:765–77.
[25] Lyman JT. Complication probability as assessed from dose–volume histograms. Radiat Res 1985;104:S13–9.
[26] Mah K, Van Dyk J, Keane T, Peter P. Acute radiation-inducedpulmonary damage: a clinical study on the response tofractionated radiation therapy. Int J Radat Oncol Biol Phys1987;13:179–88.

316 NTCP-fit of lung complication data after breast cancer irradiation
[27] Mohan R, Mageras GS, Baldwin B, et al. Clinically relevantoptimization of 3-D conformal treatments. Med Phys1997;24:103–10.
[28] Niemierko A. A generalized concept of equivalent uniformdose [EUD]. Med Phys 1999;26:1100.
[29] Nisbet A, Beange I, Vollmar HS, Irvine C, Morgan A, ThwaitesDI. Dosimetric verification of a commercial collapsed conealgorithm in simulated clinical situations. Radiother Oncol2004;73:79–88.
[30] Pavy JJ, Denekamp J, Letschert J, et al. EORTC Late EffectsWorking Group. Late effects toxicity scoring: the SOMA scale.Radiother Oncol 1995;35:11–5.
[31] Seppenwoolde Y, Lebesque JV. Partial irradiation of the lung.Sem Rad Oncol 2001;11:247–58.
[32] Seppenwoolde Y, Lebesque JV, de Jaeger K, et al. Compar-ing different NTCP models that predict the incidence of
radiation pneumonitis. Int J Radiat Oncol Biol Phys2003;55:724–35.
[33] Taghian AG, Assaad SI, Niemierko A, Kuter I, Younger J,Schoentaler R, et al. Risk of pneumonitis in breast cancerpatients treated with radiation therapy and combinationchemotherapy with paclitaxel. J Natl Cancer Inst2001;93:1806–11.
[34] Tsougos I, Mavroidis P, Rajala J, et al. Evaluation of dose–response models and parameters predicting radiation inducedpneumonitis using clinical data from breast cancer radiother-apy. Phys Med Biol 2005;50:3535–54.
[35] Vanselaar J, Welleweerd H. Application of a testpackage in an intercomparision of the photon dosecalculation performance of treatment planning systemsused in a clinical setting. Radiother Oncol 2001;60:203–213.