
Hydrogen production using alkaline electrolyzer and photovoltaic (PV) module
8
Hydrogen production using alkaline electrolyzer and photovoltaic (PV) module Ankica Ðuki c*, Mihajlo Firak University of Zagreb, Faculty of Mechanical Engineering and Naval Architecture, I. Lu ci ca 5, 10000 Zagreb, Croatia article info Article history: Received 18 March 2010 Received in revised form 3 December 2010 Accepted 31 January 2011 Available online 4 March 2011 Keywords: Alkaline electrolyzer Ni metal foam Photovoltaic module abstract In this paper it is presented hydrogen production using alkaline water electrolysis where a 30 W photovoltaic (PV) module was involved as a source of electric energy. Therefore, the process is without emitting CO 2 . There is constructed and tested an alkaline electrolyzer with 50 50 2 mm Ni metal foam electrodes, 50 50 0.4 mm Zirphon Ò membrane and 25% alkaline (KOH) solution electrolyte. Electrolyzer UI characteristics for natural and forced flow of electrolyte with PV module UI characteristics are presented. The results are in favor of forced flow circulation, and these are better if the flow velocities are higher. Calculated Energy efficiency (based on hydrogen high heating value) for both types of circulation is above 55%. There are much evidence for further improvement of the system components and consequently electrolyzer and system efficiency. Copyright ª 2011, Hydrogen Energy Publications, LLC. Published by Elsevier Ltd. All rights reserved. 1. Introduction In this paper there is presented hydrogen and oxygen production using photovoltaic (PV) module coupled with an alkaline water electrolyzer. This is the only existing commer- cial technology of hydrogen production without CO 2 emission [1e4]. The industrial standard of purity of hydrogen produced using alkaline electrolyzer is 99.3e99.8%. Electrolyzer effi- ciency expressed as a quotient of amount of hydrogen high heating value and electric energy needed to produce it can be about 0.6 [5]. The aim of this work is to research the potenti- alities for further improving and simplifying of this technology by using newest materials and design concepts. In this research 3D porous Ni metal foam [6,7] for electrode material was used with porosity of 95e97% and nominal pore diameters of 600 mm. The liquid 25% potassium hydroxide (KOH) solution electrolyte was forced to flow through the electrode’s pores by two centrifugal pumps. PV module was designed to cover electricity for the electrolyzer and for pumps simultaneously. There was no electronic equipment between PV module and the rest of the system aimed for PV module Maximum Power Point (MPP) tracking or pump’s speed control. In this work, hydrodynamic microscopic level of hydrogen and oxygen bubbles growth, detachment, coalescence and flow with liquid electrolyte phase through the electrodes was not studied. There are presented the macroscopic level of the electrolyzer functioning through the electrolyzer UI characteristics, hydrogen production and efficiency. Also, the majority of the experiments were carried out indoor using laboratory DC power supply, but there is also shown an example of the outdoor functioning under real solar irradiance. As the whole system was built mainly of transparent Plexiglas, it was possible to study visually the gas bubbles separation from liquid electrolyte in the hydrogen and oxygen separators and concentration of the gas micro bubbles in electrolyte circula- tion loops. Further research of the mentioned phenomenon will consequently lead to the enhancement of the system and system components. * Corresponding author. Tel.: þ385 1 6168 218; fax: þ385 1 6156 940. E-mail address: [email protected] (A. Ðuki c). Available at www.sciencedirect.com journal homepage: www.elsevier.com/locate/he international journal of hydrogen energy 36 (2011) 7799 e7806 0360-3199/$ e see front matter Copyright ª 2011, Hydrogen Energy Publications, LLC. Published by Elsevier Ltd. All rights reserved. doi:10.1016/j.ijhydene.2011.01.180
Transcript of Hydrogen production using alkaline electrolyzer and photovoltaic (PV) module

i n t e r n a t i o n a l j o u r n a l o f h y d r o g e n en e r g y 3 6 ( 2 0 1 1 ) 7 7 9 9e7 8 0 6
Avai lab le a t www.sc iencedi rec t .com
journa l homepage : www.e lsev ier . com/ loca te /he
Hydrogen production using alkaline electrolyzer andphotovoltaic (PV) module
Ankica Ðuki�c*, Mihajlo Firak
University of Zagreb, Faculty of Mechanical Engineering and Naval Architecture, I. Lu�ci�ca 5, 10000 Zagreb, Croatia
a r t i c l e i n f o
Article history:
Received 18 March 2010
Received in revised form
3 December 2010
Accepted 31 January 2011
Available online 4 March 2011
Keywords:
Alkaline electrolyzer
Ni metal foam
Photovoltaic module
* Corresponding author. Tel.: þ385 1 6168 21E-mail address: [email protected] (A.
0360-3199/$ e see front matter Copyright ªdoi:10.1016/j.ijhydene.2011.01.180
a b s t r a c t
In this paper it is presented hydrogen production using alkaline water electrolysis where
a 30 W photovoltaic (PV) module was involved as a source of electric energy. Therefore, the
process is without emitting CO2. There is constructed and tested an alkaline electrolyzer
with 50� 50� 2 mm Ni metal foam electrodes, 50� 50� 0.4 mm Zirphon� membrane and
25% alkaline (KOH) solution electrolyte. Electrolyzer UI characteristics for natural and
forced flow of electrolyte with PV module UI characteristics are presented. The results are
in favor of forced flow circulation, and these are better if the flow velocities are higher.
Calculated Energy efficiency (based on hydrogen high heating value) for both types of
circulation is above 55%. There are much evidence for further improvement of the system
components and consequently electrolyzer and system efficiency.
Copyright ª 2011, Hydrogen Energy Publications, LLC. Published by Elsevier Ltd. All rights
reserved.
1. Introduction There was no electronic equipment between PV module and
In this paper there is presented hydrogen and oxygen
production using photovoltaic (PV) module coupled with an
alkaline water electrolyzer. This is the only existing commer-
cial technology of hydrogen production without CO2 emission
[1e4]. The industrial standard of purity of hydrogen produced
using alkaline electrolyzer is 99.3e99.8%. Electrolyzer effi-
ciency expressed as a quotient of amount of hydrogen high
heating value and electric energy needed to produce it can be
about 0.6 [5]. The aim of this work is to research the potenti-
alities for further improving and simplifying of this technology
by using newest materials and design concepts. In this
research 3D porous Ni metal foam [6,7] for electrode material
was usedwith porosity of 95e97%andnominal pore diameters
of 600 mm. The liquid 25% potassiumhydroxide (KOH) solution
electrolyte was forced to flow through the electrode’s pores by
two centrifugal pumps. PV module was designed to cover
electricity for the electrolyzer and for pumps simultaneously.
8; fax: þ385 1 6156 940.Ðuki�c).2011, Hydrogen Energy P
the rest of the system aimed for PV module Maximum Power
Point (MPP) tracking or pump’s speed control. In this work,
hydrodynamic microscopic level of hydrogen and oxygen
bubbles growth, detachment, coalescence and flowwith liquid
electrolyte phase through the electrodes was not studied.
There are presented the macroscopic level of the electrolyzer
functioning through the electrolyzer UI characteristics,
hydrogen production and efficiency. Also, the majority of the
experiments were carried out indoor using laboratory DC
power supply, but there is also shown an example of the
outdoor functioning under real solar irradiance. As the whole
system was built mainly of transparent Plexiglas, it was
possible to study visually the gas bubbles separation from
liquid electrolyte in the hydrogen and oxygen separators and
concentration of the gas micro bubbles in electrolyte circula-
tion loops. Further research of the mentioned phenomenon
will consequently lead to the enhancement of the system and
system components.
ublications, LLC. Published by Elsevier Ltd. All rights reserved.

Nomenclature
A electrodes area, 0.0025 m2
a parameter related to ohmic resistance of
electrolyte, Um2
b coefficient for overvoltage on electrodes, V
c coefficient for overvoltage on electrodes, A�1m2
c1 parameter for temperature dependence,
3e�3 m2 V�1
c2 parameter for temperature dependence,
0.1e�6 m2 (V�1 K�1)
CT thermal capacitance of PV module, J K�1m�2
e elementary charge, 1.60219e�19 C
E global solar irradiance, Wm�2
HH hydrogen high heating value, 12.745e6 Jm�3
I electrolyzer operating current, A
Iph photo current, A
IPV PV module operating current, V
Is saturation dark current, A
Isc short circuit current, A
k Boltzmann’s constant, 1.3806e�23 J K�1
m non ideality factor
np number of parallel strings
ns number of series-connected PV cells
PV photovoltaic
q fluid flow, kg s�1
qL overall heat loss coefficient, Jm�2
RPM revolutions per minute, min�1
Rp parallel resistance, U
Rs series resistance, U
t time, s
Ta atmospheric temperature, K
Tc solar cell temperature, K
U electrolyzer operating voltage, V
Uoc measured PV module open circuit voltage, V
UPV PV module operating voltage, V
Urev reversible voltage, 1.23 V
UT thermal voltage, V
UI voltageeelectric current
VH2 hydrogen produced volume, m3
DP pump head pressure, Nm�2
hc PV cell efficiency
hE electrolyzer energy efficiency, %
sa transmittanceeabsorptance product of PV cells
i n t e rn a t i o n a l j o u r n a l o f h y d r o g e n en e r g y 3 6 ( 2 0 1 1 ) 7 7 9 9e7 8 0 67800
2. Effects of the different electrodesdistances on the electrolyzer UI characteristics
The first part of this work covers experimental researches of
electrodes distance effects during the alkaline electrolysis
process [8]. There are performed the experiments with elec-
trode distances from 5, 10, 15, 20, 30, 40, 50 mm and Zirphon�
[9] membrane thickness of 0.4 mm. In these experiments
electric current, voltage and temperature of electrolyte are
Fig. 1 e Measurement scheme for U
measured. Fig. 1 shows experimental setup which includes
pool electrolyzerwithelectrolyteof25%KOHaqueoussolution.
In the first step, 3D electrodes of Ni metal foam are
included in the experiments with mentioned different elec-
trode distances and results for 0.01, 0.03 and 0.05 mmdistance
are given in Fig. 2a.
From these experimental results it is obvious a large effect
of electrode distance during the electrolysis, firstly in the
electric current valuewhich gives high or lowUI characteristic
slope. In this context, the thickness of the Zirphon� material
I characteristics determination.

0 1 2 3 40
5
10
15
20
25
Voltage, U [V]
]A[I,tnerruc
cirtcelE
d = 0.01 md = 0.03 md = 0.05 m
Urev= 1.23
0 1 2 3 40
5
10
15
20
25
Voltage, U [V]
]A[I,tnerruc
cirtcelE
3D Ni metal foam& Zirphon®Ni coated carbon steel plate& Zirphon®
Urev= 1.23
a
b
Fig. 2 e (a) Electrolyzer UI characteristics with different
electrodes distances. (b) Electrolyzer UI characteristics
comparison with different electrodes material.
i n t e r n a t i o n a l j o u r n a l o f h y d r o g e n en e r g y 3 6 ( 2 0 1 1 ) 7 7 9 9e7 8 0 6 7801
membrane is proved to be an electrode distance with highest
slope. According to this conclusion, there is performed an
experimentwith an electrode of Ni plated carbon steel plate as
a referent electrode and Zirphon� material membrane. These
experimental results are given in Fig. 2bwhere it is shown that
3D electrodes of Ni metal foam are manifested as better in
comparisonwithNi plated carbon steel plate for the process of
electrolysis with membrane of Zirphon� material with thick-
ness of 0.4 mm.
The electrolyte reservoir was made of transparent glass.
This allowed the gas bubbles convective flow to be photo-
graphed using high speed video camera. There were observed
generally two types of bubbles: the first and the bigger onewas
able to pass through the border of liquid electrolyte in the
reservoir to the open atmosphere, and the second and the very
small one (micro bubbles, hardly visible by human eye) which
cannot penetrate through the liquid level and slow circulate in
the electrolyte making it as nontransparent white fluid. These
facts, together with inherent porosity of the Ni metal foam
and noticed electrode distance influence the electrolyzer UI
characteristics and good mechanical characteristics of the
membrane material, suggested that forced flow convection of
the electrolyte through the pores might show better results in
terms of UI characteristic slope. To test this idea, there was
constructed and tested one electrode pair electrolyzer with
forced electrolyte circulation driven by two independent
centrifugal pumps in two independent loops. The whole
system includes two gas separators and two gas storages.
3. System of electrolyzer and photovoltaic(PV) module
3.1. The system and the components description
There are performed several experiments with laboratory DC
power supply and PV module as sources of electric energy
with 3D Ni metal foam electrodes. Electrolyzer is designed as
device of 60W maximum power with single pair of
50� 50� 2 mm electrodes and membrane of thickness of
0.4 mm and 490 mm. Housing of electrolyzer is designed as
complex of four parts: two 120� 120� 5 mm internal parts
and two 120� 120� 8 mm external parts. PV module is
designed as 30 Wdevice consisted of 125� 65 mm18 PV-m-Si-
cells connected in two parallel strings of 9 solar cells. The aim
of these experiments is to research phenomenon of the
process of electrolysis with and without circulated electrolyte
and to design an electrolyzer and other components with
better understanding in further researches. The measure-
ments scheme is shown in Fig. 3 (switch can be set to DC
power supply or to PVmodule). From the given characteristics
of the system components it is obvious that electrolyzer
maximum power of 60 W is double in comparison with PV
module of 30 W. This is because the goal of this work was not
operation of the system at maximum power of electrolyzer,
but testing of coupled system in natural and forced flow of
electrolyte at the level of thermal hydraulic problems.
3.1.1. ElectrolyzerFor the purpose of research in this paper, there is designed
a small alkaline electrolyzer with alkaline (KOH) 25% solution
as an electrolyte, and maximum power of 60 W. The electro-
lyzer housing is made of Plexiglas with one electrode pair.
Two types of electrodes important for this work can be used
alternatively: one pair of electrodes of Ni plated carbon steel
plate (thickness of 1 mm) and one pair of electrodes of Ni
metal foam as 3D electrodes (thickness of 2 mm). The
dimensions of electrodes in both cases are 50� 50 mm and
Zirphon� material membrane, 490 mm, and thickness of
0.4 mm. The electrolyte circulate through the porous Ni metal
foam by natural convection because of hydrogen and oxygen
bubbles generation or by forced convection driven by two
small centrifugal pumps. The electrolyzer design ensures
electrolyte/bubbles convection from inlet to outlet through
the porous electrode uniform cross-section of 50� 2 mm
(Fig. 4).
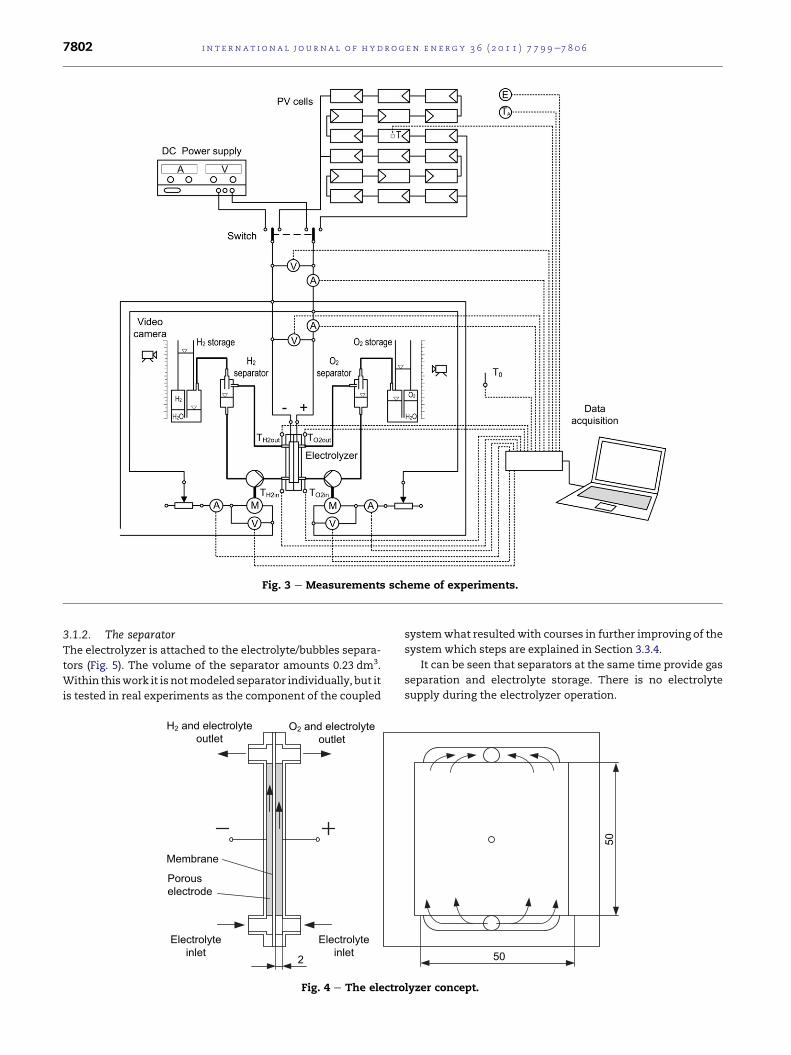
Fig. 3 e Measurements scheme of experiments.
i n t e rn a t i o n a l j o u r n a l o f h y d r o g e n en e r g y 3 6 ( 2 0 1 1 ) 7 7 9 9e7 8 0 67802
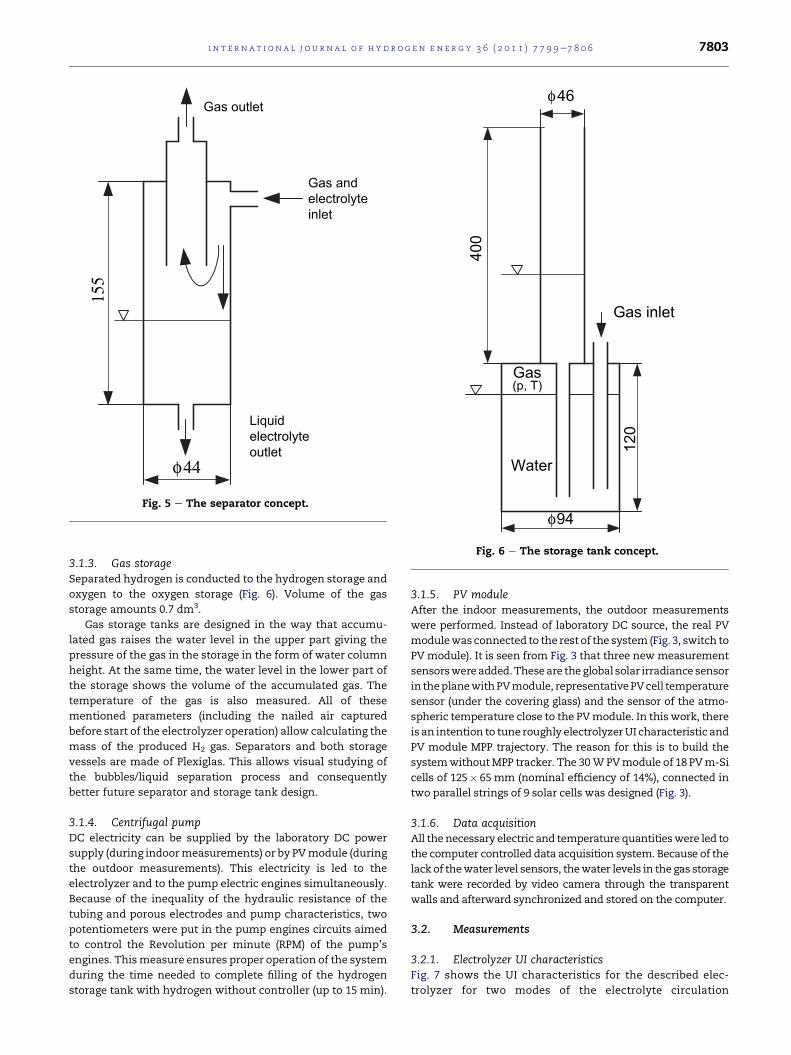
3.1.2. The separatorThe electrolyzer is attached to the electrolyte/bubbles separa-
tors (Fig. 5). The volume of the separator amounts 0.23 dm3.
Within thiswork it is notmodeled separator individually, but it
is tested in real experiments as the component of the coupled
O2 and electrolyteoutlet
Electrolyteinlet
Electrolyteinlet
H2 and electrolyteoutlet
2
Membrane
Porouselectrode
Fig. 4 e The electro
systemwhat resultedwith courses in further improving of the
system which steps are explained in Section 3.3.4.
It can be seen that separators at the same time provide gas
separation and electrolyte storage. There is no electrolyte
supply during the electrolyzer operation.
50
50
lyzer concept.
Gas inlet
Gas
Water
(p, T)
400
φ94
120
φ46
Fig. 6 e The storage tank concept.
Gas andelectrolyteinlet
Gas outlet
Liquidelectrolyteoutlet
φ44
155
Fig. 5 e The separator concept.
i n t e r n a t i o n a l j o u r n a l o f h y d r o g e n en e r g y 3 6 ( 2 0 1 1 ) 7 7 9 9e7 8 0 6 7803
3.1.3. Gas storageSeparated hydrogen is conducted to the hydrogen storage and
oxygen to the oxygen storage (Fig. 6). Volume of the gas
storage amounts 0.7 dm3.
Gas storage tanks are designed in the way that accumu-
lated gas raises the water level in the upper part giving the
pressure of the gas in the storage in the form of water column
height. At the same time, the water level in the lower part of
the storage shows the volume of the accumulated gas. The
temperature of the gas is also measured. All of these
mentioned parameters (including the nailed air captured
before start of the electrolyzer operation) allow calculating the
mass of the produced H2 gas. Separators and both storage
vessels are made of Plexiglas. This allows visual studying of
the bubbles/liquid separation process and consequently
better future separator and storage tank design.
3.1.4. Centrifugal pumpDC electricity can be supplied by the laboratory DC power
supply (during indoormeasurements) or by PVmodule (during
the outdoor measurements). This electricity is led to the
electrolyzer and to the pump electric engines simultaneously.
Because of the inequality of the hydraulic resistance of the
tubing and porous electrodes and pump characteristics, two
potentiometers were put in the pump engines circuits aimed
to control the Revolution per minute (RPM) of the pump’s
engines. Thismeasure ensures proper operation of the system
during the time needed to complete filling of the hydrogen
storage tank with hydrogen without controller (up to 15 min).
3.1.5. PV moduleAfter the indoor measurements, the outdoor measurements
were performed. Instead of laboratory DC source, the real PV
modulewas connected to the rest of the system (Fig. 3, switch to
PV module). It is seen from Fig. 3 that three new measurement
sensorswereadded.Theseare theglobal solar irradiance sensor
in theplanewithPVmodule, representativePVcell temperature
sensor (under the covering glass) and the sensor of the atmo-
spheric temperature close to the PVmodule. In this work, there
is an intention to tune roughly electrolyzerUI characteristic and
PV module MPP trajectory. The reason for this is to build the
systemwithoutMPP tracker. The 30WPVmodule of 18 PVm-Si
cells of 125� 65 mm (nominal efficiency of 14%), connected in
two parallel strings of 9 solar cells was designed (Fig. 3).
3.1.6. Data acquisitionAll thenecessary electric and temperature quantitieswere led to
the computer controlled data acquisition system. Because of the
lack of thewater level sensors, thewater levels in the gas storage
tank were recorded by video camera through the transparent
walls and afterward synchronized and stored on the computer.
3.2. Measurements
3.2.1. Electrolyzer UI characteristicsFig. 7 shows the UI characteristics for the described elec-
trolyzer for two modes of the electrolyte circulation

0 1 2 3 4 50
5
10
15
20
25
Elec
tric
curre
nt,I
/A
Natural convectionForced convection
Voltage, U / VUrev =1.23
Fig. 7 e UI characteristics with natural and forced
convections.x PV module experimental data
PV module simulation
Experimental MPP trajectorySimulation MPP trajectory
0 1 2 3 4 50
1
2
3
4
5
6
7
Voltage, U / V
Elec
tric
curre
nt,I
/A
E=1000 Wm-2 Tc=47.8 °C
E=900, Tc=48.6
E=800, Tc=44.5
E=700, Tc=41.0
E=600, Tc=38.5
E=500, Tc=35.8
E=380, Tc=33.1
E=260, Tc=30.9
E=160, Tc=29.7
Fig. 8 e PV module UI characteristics [7].
i n t e rn a t i o n a l j o u r n a l o f h y d r o g e n en e r g y 3 6 ( 2 0 1 1 ) 7 7 9 9e7 8 0 67804
through the porous electrodes. Both were obtained during
the indoor experiments by random change of the voltage as
the output variable from the laboratory DC power supply. It
is seen that the current limit was reached at 18 A. A forced
convection of the electrolyte (circle indication) gives more
stable and steeper characteristic. UI points obtained during
natural convection of the electrolyte (no pumps operation)
were right-dispersed because sensitivity of the electrolyte/
bubbles flow regime depends on the direction of the supply
voltage slope, temperature, electrolyzer and housing
design.
3.2.2. PV module UI characteristicsPV module was examined in detail by authors of this paper in
[10]. PVmodule UI characteristics for different solar irradiance
and cell temperatures were measured and the mathematical
model of the one-diode type was derived and compared with
the measurements. Also the real and the simulated MPP
trajectory were plotted. Fig. 8 shows results.
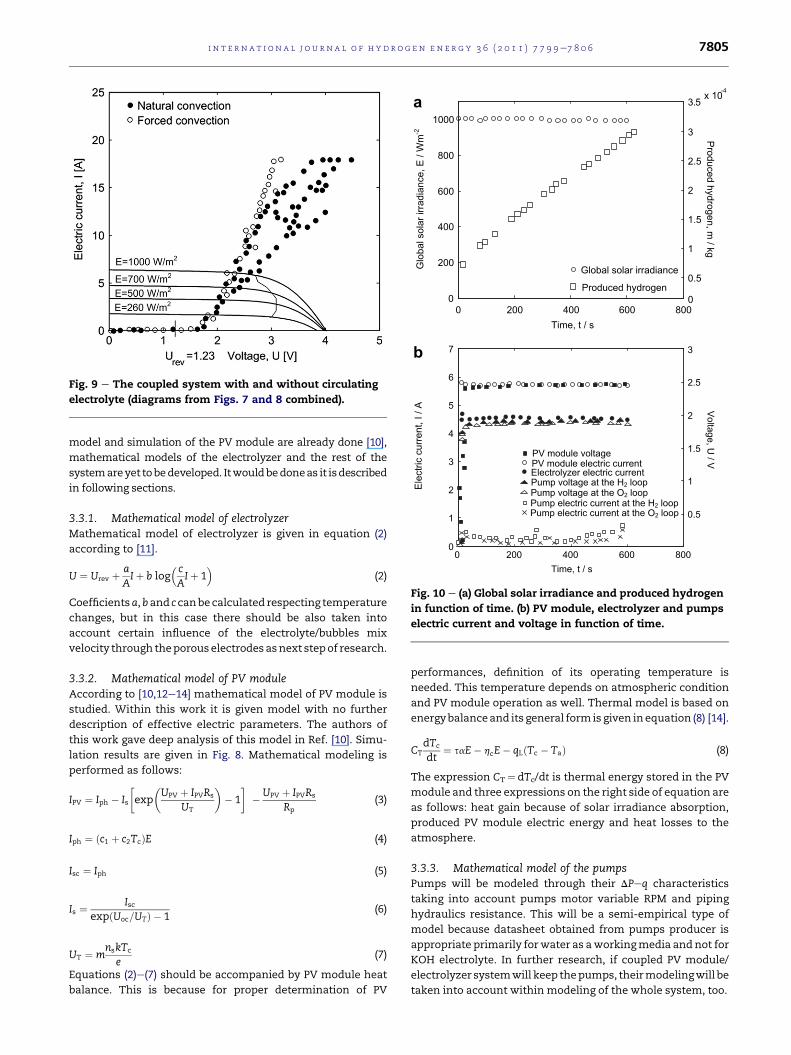
3.2.3. Comparison between PV module and electrolyzer UIcharacteristicsFrom Fig. 3 it is seen that PV module supplies DC electricity to
theelectrolyzer andpumpssimultaneously. If pumpswouldbe
switched off, the trajectory of the working point of PV module
andelectrolyzer couldbe found in the intersectionof the twoUI
characteristics. For the purpose of assessment these two
characteristics are both presented in Fig. 9 e including PV
module MPP trajectory. It is clear that PV module should be
designed to cover pumps energy consumption using these UI
characteristics. Even without the pump characteristics it is
clear that when PV module would have more parallel con-
nected cells, the positive effect of the electrolyte forced flow to
the hydrogen production would be much stronger.
3.2.4. Measuring of hydrogen production and energyefficiency calculationUI characteristicwas obtained by using up and down changing
supply voltage. For the purpose of the measuring gas produc-
tion, voltage has been hold nearly constant during indoor and
outdoor tests. During the outdoor tests, solar irradiance was
almost constant and amounts about 1000Wm�2. The
temporal lengthof the recordedfiles equals 600 s. For example,
in Fig. 10a and b there are presented changes of the solar irra-
diance, electrical currents, voltages and accumulated
hydrogen.Using thisquantitiesand temperatures, it ispossible
to calculate energyefficiencyof the electrolyzer or of thewhole
system according to equation (1):
hE ¼ VH2HHZt2
t1
VðtÞIðtÞ dt(1)
The values of the electrolyzer energy efficiency calculated
according to different test conditions (natural or forced flow,
indoor or outdoor tests) were up to 55%. During the tests,
several design ideas were identified as a space for system
improving as there are gasket leakages between hydrogen and
oxygen circulation loop, poor gas separation in the separators
and cable heating. By the system improving with design
changes, it could be obtained higher efficiency.
3.3. Mathematical models
The author’s intention is on further improving of described
system. This would be supported using appropriate mathemat-
ical models and computer simulations. While mathematical
0 200 400 600 8000
200
400
600
800
1000
Time, t / s
Glo
bals
olar
irrad
ianc
e,E
/Wm
-2
0
0.5
1
1.5
2
2.5
3
3.5x 10⁻⁴
Producedhydrogen,m
/kg
Global solar irradiance
Produced hydrogen
0 200 400 600 8000
1
2
3
4
5
6
7
Time, t / s
Elec
tric
curre
nt,I
/A
0.5
1
1.5
2
2.5
3
Voltage,U/VPV module voltage
Pump electric current at the O2 loopPump electric current at the H2 loopPump voltage at the O2 loopPump voltage at the H2 loop
PV module electric currentElectrolyzer electric current
a
b
Fig. 10 e (a) Global solar irradiance and produced hydrogen
in function of time. (b) PV module, electrolyzer and pumps
electric current and voltage in function of time.
Fig. 9 e The coupled system with and without circulating
electrolyte (diagrams from Figs. 7 and 8 combined).
i n t e r n a t i o n a l j o u r n a l o f h y d r o g e n en e r g y 3 6 ( 2 0 1 1 ) 7 7 9 9e7 8 0 6 7805
model and simulation of the PV module are already done [10],
mathematical models of the electrolyzer and the rest of the
systemareyet tobedeveloped. Itwouldbedoneas it isdescribed
in following sections.
3.3.1. Mathematical model of electrolyzerMathematical model of electrolyzer is given in equation (2)
according to [11].
U ¼ Urev þ aAIþ b log
� cAIþ 1
�(2)
Coefficientsa,band c canbecalculated respecting temperature
changes, but in this case there should be also taken into
account certain influence of the electrolyte/bubbles mix
velocity through theporous electrodesasnext stepof research.
3.3.2. Mathematical model of PV moduleAccording to [10,12e14] mathematical model of PV module is
studied. Within this work it is given model with no further
description of effective electric parameters. The authors of
this work gave deep analysis of this model in Ref. [10]. Simu-
lation results are given in Fig. 8. Mathematical modeling is
performed as follows:
IPV ¼ Iph � Is
�exp
�UPV þ IPVRs
UT
�� 1
�� UPV þ IPVRs
Rp(3)
Iph ¼ ðc1 þ c2TcÞE (4)
Isc ¼ Iph (5)
Is ¼ IscexpðUoc=UTÞ � 1
(6)
UT ¼ mnskTc
e(7)
Equations (2)e(7) should be accompanied by PV module heat
balance. This is because for proper determination of PV
performances, definition of its operating temperature is
needed. This temperature depends on atmospheric condition
and PV module operation as well. Thermal model is based on
energybalanceand its general form is given inequation (8) [14].
CTdTc
dt¼ saE� hcE� qLðTc � TaÞ (8)
The expression CT¼ dTc/dt is thermal energy stored in the PV
module and three expressions on the right side of equation are
as follows: heat gain because of solar irradiance absorption,
produced PV module electric energy and heat losses to the
atmosphere.
3.3.3. Mathematical model of the pumpsPumps will be modeled through their DPeq characteristics
taking into account pumps motor variable RPM and piping
hydraulics resistance. This will be a semi-empirical type of
model because datasheet obtained from pumps producer is
appropriate primarily forwater as aworkingmedia andnot for
KOH electrolyte. In further research, if coupled PV module/
electrolyzer systemwill keep thepumps, theirmodelingwill be
taken into account within modeling of the whole system, too.

i n t e rn a t i o n a l j o u r n a l o f h y d r o g e n en e r g y 3 6 ( 2 0 1 1 ) 7 7 9 9e7 8 0 67806
3.3.4. Mathematical model of the gas separatorsThis model depends a lot on certain assumption and negli-
gence of the two-phase flow in it. Separator is at the same time
electrolyte storage and it will be based on themass balance for
the volume occupied by the gas and liquid. Mathematical
model of the gas separators within this work is not simulated,
but further research will include this. New design of gas
separators is in the process. Comparison of these two types of
separators is expected to give a course in solving problems of
bubbles: new design of separators is expected to allow bubble
unilateral transfer.
3.3.5. Mathematical model of the gas storagesGas storages mathematical models will be based on the gas
and liquidmass balances and gas equation of state. These will
be presented in near future of research.
3.3.6. Mathematical models of the heat flow lossesAbout 45% of the expensive PV module DC current is lost in
this system in the form of heat and low percentage of it on
pump operation. From this fact it is clear that the PV module
and electrolyzer heat losses should be carefully managed. At
the working temperature range of both, PV module and elec-
trolyzer, higher temperature means lower PV module effi-
ciency and higher electrolyte temperature means higher
electrolyzer efficiency. Obviously, some kind of managing the
heat would give some benefits to the system. Mathematical
modeling will be an important research tool.
4. Conclusion and further work
The original system consisting of an alkaline electrolyzer
(60 W), photovoltaic module (30 W), two centrifugal pumps,
two gas/electrolyte separators, two gas storage vessels and
silicon tubing of inner diameter equal to 8 mmis designed. The
systemwas testedat indoor andoutdoorconditions. For indoor
tests, insteadof thePVmodule, the laboratoryDCpowersupply
(20 A, 30 V) was applied. Original features of this system are Ni
metal foam electrodes with porosity of 95e97%, nominal pore
diameters of 600 mm throughwhich two phasesmixture of the
electrolyte and gas bubbles can flow by natural or forced flow
convection. Moreover, both pumps which ensure the forced
flow are powered by the energy from the same PV module as
the electrolyzer. It means that at a higher solar irradiance and
applyingabiggeramountof electricity to theelectrolyzer,more
bubbles will be produced, but at the same time the pumps will
circulate the mixture flow faster and more bubbles will be
carried away. This fact has a positive effect on the electrolyzer
UI characteristic in comparison with UI characteristic with
natural convection of the mixture in the porous electrodes
(Fig. 7). It is also experimentally shown that this positive effect
rises with the electric current through the electrolyzer. Two
main deficiencies of the systemwere observed: The first one is
the higher pressure on the hydrogen sidewhich stimulates the
electrolyte/hydrogen mixture to flow to the oxygen side. The
second one is the separator design and construction. Very
small bubbles (having diameters below 0.5 mm) can hardly be
separated from the liquid electrolyte and forced again to flow
through the pump and electrolyzer electrodes what causes
reduced pump and electrolyzer efficiency. Because of these,
the next step will be redesigned of the separators and gasket
system in the electrolyzer. The fact that the pumps have
a positive effect on the UI characteristic of electrolyzer above
the UI characteristic of the PV module used (Fig. 9), suggests
also redesign of the PV module.
r e f e r e n c e s
[1] Clarke RE, et al. Direct coupling of an electrolyser to a solarPV system for generating hydrogen. International Journal ofHydrogen Energy 2009;34:2531e42.
[2] Bilgen E. Solar hydrogen from photovoltaiceelectrolyzersystems. Energy Conversion and Management 2001;42(9):1004e57.
[3] Biddyut P, Andrews J. Optimal coupling of PV arrays to PEMelectrolysers in solar-hydrogen systems for remote areapower supply. International Journal of Hydrogen Energy2008;33:490e8.
[4] Gibson TL, Kelly NA. Optimization of solar poweredhydrogen production using photovoltaic electrolysis devices.International Journal of Hydrogen Energy 2008;33:5931e40.
[5] H2 Logic. http://www.h2logic.com.[6] MitsubishiMaterials. http://www.mmc.com.[7] Bidault F, et al. A new application for nickel foam in alkaline
fuel cells. International Journal of Hydrogen Energy 2009;34:6799e808.
[8] Nagai N, et al. Existence of optimum space betweenelectrodes on hydrogen production by water electrolysis.International Journal of Hydrogen Energy 2003;28:35e41.
[9] VITO. http://wwwa.vito.be.[10] Firak M, Ðuki�c A. An investigation into the effect of
photovoltaic module electric properties on maximum powerpoint trajectory with the aim of its alignment withelectrolyzer U-I characteristic. Thermal Science 2010;14:729e38.
[11] Ulleberg Q. Modeling of advanced electrolyzers: a systemsimulation approach. International Journal of HydrogenEnergy 2003;28:21e33.
[12] Quaschning V. Understanding renewable energy systems.London, UK: Bath Press; 2005.
[13] Chenni R, et al. A detailed modeling method for photovoltaiccells. Energy 2007;32:1724e30.
[14] Ulleberg Q. Stand-alone power systems for the future:optimal design, operation & control of solar-hydrogen energysystems. PhD thesis, Norwegian University of Science andTechnology, Trondheim; 1998.