Hydrogen bonding is the prime determinant of carboxyl pKa values at the N-termini of α-helices
15
Hydrogen Bonding is the Prime Determinant of Carboxyl pK a Values at the N-Termini of -Helices Melissa A. Porter, 1 Jordan R. Hall, 1 James C. Locke, 1 Jan H. Jensen, 2 and Pablo A. Molina 1 * 1 Department of Chemistry, Murray State University, Murray, Kentucky 4 2071 2 Department of Chemistry, University of Iowa, Iowa City, Iowa ABSTRACT Experimentally determined mean pK a values of carboxyl residues located at the N- termini of -helices are lower than their overall mean values. Here, we perform three types of analy- ses to account for this phenomenon. We estimate the magnitude of the helix macrodipole to determine its potential role in lowering carboxyl pK a values at the N-termini. No correlation between the magnitude of the macrodipole and the pK a values is observed. Using the pK a program propKa we compare the molecular surroundings of 18 N-termini carboxyl residues versus 233 protein carboxyl groups from a previously studied database. Although pK a lowering interactions at the N-termini are similar in nature to those encountered in other protein regions, pK a lowering backbone and side-chain hydrogen bonds appear in greater number at the N-termini. For both Asp and Glu, there are about 0.5 more hydrogen bonds per residue at the N-termini than in other protein regions, which can be used to explain their lower than average pK a values. Using a QM-based pK a prediction model, we investigate the chemical environment of the two lowest Asp and the two lowest Glu pK a values at the N-termini so as to quantify the effect of various pK a determinants. We show that local interactions suffice to account for the acidity of carboxyl residues at the N-termini. The effect of the helix dipole on carboxyl pK a values, if any, is marginal. Backbone amide hydrogen bonds constitute the single biggest contributor to the low- est carboxyl pK a values at the N-termini. Their estimated pK a lowering effects range from about 1.0 to 1.9 pK a units. Proteins 2006;63:621– 635. © 2006 Wiley-Liss, Inc. Key words: hydrogen bonding; N-termini; -helices; carboxyl pK a INTRODUCTION The pK a values of ionizable residues play fundamental roles in the function and structure of proteins. An under- standing of the acid-base properties of these residues is essential to rationalize enzyme catalytic mechanisms and protein conformation. 1 Typically, pK a values are obtained for each individual ionizable residue, by measuring some spectroscopic property of the residue as a function of pH, NMR being the most commonly used method. In recent years, the number of proteins for which many experimen- tal pK a values are known has considerably expanded. This large volume of data permits both experimentalists and theoreticians to explore empirical relationships between protein structure and pK a values. Generally, four main determinants of pK a values are cited in the literature. 1,2 In terms of chemical interactions with the basic (unprotonated) form of carboxylic acids these effects are: (1) charge– charge interactions, whereby, for example, a positively charged Lys residue lowers the pK a of an Asp residue by preferentially stabilizing its basic (negatively charged) form. 2–5 (2) Hydrogen bonding (HB), whereby, for example, hydrogen bonding to a Ser residue lowers the pK a of an Asp residue by preferential stabiliza- tion of the basic form. Obviously, an HB partner can also be a positively charged residue (e.g., Lys, His or Arg). 6 The role of HBs in regulating pK a values was first argued by Warshel and coworkers 7,8 as a component of their concept of localized polar effects. (3) Desolvation effects, whereby, for example, a hydrophobic contact raises the pK a of an Asp residue by a net preferential stabilization of the acidic (protonated) form (because solvation preferentially stabi- lizes the unprotonated form). 9 –11 It is interesting to note that the aliphatic portion of a Lys side chain can also increase the pK a of a neighboring carboxyl group. 6 (4) Helix dipole interactions, whereby, for example, the posi- tive end of an -helix lowers the pK a of an Asp group by preferentially stabilizing the basic (negatively charged) form. 12–16 The concept of a helix dipole was first introduced by Wada and Hol. 17–19 Each peptide bond of the protein backbone contains a dipole moment of about 3.5 D; in an -helix, the alignment of several dipole units nearly paral- lel to the helical axis generates an electrostatic potential at the helix termini that influences the chemical behavior of neighboring groups. As a structural phenomenon, the concept of the helix dipole appears frequently in the educational literature in the form of a picture that shows Grant sponsor: the National Science Foundation; Grant number: MCB 0209941 (to J.H.J.); Grant sponsor: the Committee on Institu- tional Studies and Research at MSU; Grant sponsor: NSF EPSCoR (to P.A.M.). *Correspondence to: Pablo Molina, Department of Chemistry, Mur- ray State University, Murray, KY 42071. E-mail: [email protected] Received 2 June 2005; Revised 25 July 2005; Accepted 31 October 2005 Published online 30 January 2006 in Wiley InterScience (www.interscience.wiley.com). DOI: 10.1002/prot.20879 PROTEINS: Structure, Function, and Bioinformatics 63:621– 635 (2006) © 2006 WILEY-LISS, INC.
-
Upload
independent -
Category
Documents
-
view
2 -
download
0
Transcript of Hydrogen bonding is the prime determinant of carboxyl pKa values at the N-termini of α-helices
Hydrogen Bonding is the Prime Determinant of CarboxylpKa Values at the N-Termini of �-HelicesMelissa A. Porter,1 Jordan R. Hall,1 James C. Locke,1 Jan H. Jensen,2 and Pablo A. Molina1*1Department of Chemistry, Murray State University, Murray, Kentucky 4 20712Department of Chemistry, University of Iowa, Iowa City, Iowa
ABSTRACT Experimentally determined meanpKa values of carboxyl residues located at the N-termini of �-helices are lower than their overallmean values. Here, we perform three types of analy-ses to account for this phenomenon. We estimate themagnitude of the helix macrodipole to determine itspotential role in lowering carboxyl pKa values at theN-termini. No correlation between the magnitude ofthe macrodipole and the pKa values is observed.Using the pKa program propKa we compare themolecular surroundings of 18 N-termini carboxylresidues versus 233 protein carboxyl groups from apreviously studied database. Although pKa loweringinteractions at the N-termini are similar in natureto those encountered in other protein regions, pKa
lowering backbone and side-chain hydrogen bondsappear in greater number at the N-termini. For bothAsp and Glu, there are about 0.5 more hydrogenbonds per residue at the N-termini than in otherprotein regions, which can be used to explain theirlower than average pKa values. Using a QM-basedpKa prediction model, we investigate the chemicalenvironment of the two lowest Asp and the twolowest Glu pKa values at the N-termini so as toquantify the effect of various pKa determinants. Weshow that local interactions suffice to account forthe acidity of carboxyl residues at the N-termini.The effect of the helix dipole on carboxyl pKa values,if any, is marginal. Backbone amide hydrogen bondsconstitute the single biggest contributor to the low-est carboxyl pKa values at the N-termini. Theirestimated pKa lowering effects range from about 1.0to 1.9 pKa units. Proteins 2006;63:621–635.© 2006 Wiley-Liss, Inc.
Key words: hydrogen bonding; N-termini; �-helices;carboxyl pKa
INTRODUCTION
The pKa values of ionizable residues play fundamentalroles in the function and structure of proteins. An under-standing of the acid-base properties of these residues isessential to rationalize enzyme catalytic mechanisms andprotein conformation.1 Typically, pKa values are obtainedfor each individual ionizable residue, by measuring somespectroscopic property of the residue as a function of pH,NMR being the most commonly used method. In recentyears, the number of proteins for which many experimen-
tal pKa values are known has considerably expanded. Thislarge volume of data permits both experimentalists andtheoreticians to explore empirical relationships betweenprotein structure and pKa values.
Generally, four main determinants of pKa values arecited in the literature.1,2 In terms of chemical interactionswith the basic (unprotonated) form of carboxylic acidsthese effects are: (1) charge–charge interactions, whereby,for example, a positively charged Lys residue lowers thepKa of an Asp residue by preferentially stabilizing its basic(negatively charged) form.2–5 (2) Hydrogen bonding (HB),whereby, for example, hydrogen bonding to a Ser residuelowers the pKa of an Asp residue by preferential stabiliza-tion of the basic form. Obviously, an HB partner can alsobe a positively charged residue (e.g., Lys, His or Arg).6 Therole of HBs in regulating pKa values was first argued byWarshel and coworkers7,8 as a component of their conceptof localized polar effects. (3) Desolvation effects, whereby,for example, a hydrophobic contact raises the pKa of anAsp residue by a net preferential stabilization of the acidic(protonated) form (because solvation preferentially stabi-lizes the unprotonated form).9–11 It is interesting to notethat the aliphatic portion of a Lys side chain can alsoincrease the pKa of a neighboring carboxyl group.6 (4)Helix dipole interactions, whereby, for example, the posi-tive end of an �-helix lowers the pKa of an Asp group bypreferentially stabilizing the basic (negatively charged)form.12–16
The concept of a helix dipole was first introduced byWada and Hol.17–19 Each peptide bond of the proteinbackbone contains a dipole moment of about 3.5 D; in an�-helix, the alignment of several dipole units nearly paral-lel to the helical axis generates an electrostatic potential atthe helix termini that influences the chemical behavior ofneighboring groups. As a structural phenomenon, theconcept of the helix dipole appears frequently in theeducational literature in the form of a picture that shows
Grant sponsor: the National Science Foundation; Grant number:MCB 0209941 (to J.H.J.); Grant sponsor: the Committee on Institu-tional Studies and Research at MSU; Grant sponsor: NSF EPSCoR (toP.A.M.).
*Correspondence to: Pablo Molina, Department of Chemistry, Mur-ray State University, Murray, KY 42071.E-mail: [email protected]
Received 2 June 2005; Revised 25 July 2005; Accepted 31 October2005
Published online 30 January 2006 in Wiley InterScience(www.interscience.wiley.com). DOI: 10.1002/prot.20879
PROTEINS: Structure, Function, and Bioinformatics 63:621–635 (2006)
© 2006 WILEY-LISS, INC.
the net dipole moment caused by carbonyl–amide interac-tions along the �-helix.20–22 Hol originally proposed thesefunctions for the helix dipole: (1) binding of chargedsubstrates or coenzymes whereby, for example, negativelycharged groups bound at the N-terminus of the helix—thepositive end of the dipole—interact favorably with thehelix field; (2) long range interactions in which, for in-stance, several helices run parallel with their N-terminiorientated so as to attract charged molecules; and (3) apossible increase in catalytic efficiency.18 Indeed, evidencehas been gathered to substantiate that the helix dipoleparticipates in protein stability, binding of small mol-ecules and as a stabilizing factor in ion-channels (althoughthis view has been recently challenged, see ref. 31).23–31
Through the years, two ways to interpret interactionsbetween the �-helix and surrounding groups emerged.1,12
Some researchers have attributed the stabilizing effect tothe helix macrodipole (HMD), while others have ascribed itto a few localized dipoles—“microdipoles” (mds)—confinedmostly to the first turn of the helix. The main features ofthe two stances are:
1. HMD: according to this view—found in Wada’s andHol’s original proposal—the aligned helical dipole unitsproduce a cumulative dipole effect.17–19,32 Thus, thehelix dipole is regarded as arising from two charges ofopposite sign separated by the length of the helix. TheHMD is a purely electrostatic effect in which thepositive and negative ends of the dipole generate a fieldcapable of perturbing neighboring groups. Hol esti-mated that the HMD field increases up to a helix lengthof about 10 Å and then levels off.18 Yet, it is difficult togive a quantitative measurement of the effect because itoccurs in a complicated and inhomogenous environ-ment.33
2. mds: this interpretation originated from a theoreticalstudy of Warshel and coworkers.34 Using the PDLDmodel they calculated the electrostatic stabilizationenergy as a function of helical length in two differentsystems (one C-terminus, one N-terminus) and showedthat the first turn at each terminus accounted for mostof the effect. Thus, from the “mds” viewpoint, the helixdipole effect is length-independent, and due to small,fixed, and well-positioned dipole units at the termini ofthe helix that participate in hydrogen bonding withinteracting groups.14,34,35 As indicated by its so fre-quent citation in the literature, “mds” have become themost accepted view of the helix effect.
Both HMD and mds have been invoked to account for theeffects of the �-helix on pKa values of His,12,15,36 Cys,13,14,37
and carboxyl residues.16,38 We describe here four of thesestudies.
(a) Sali, Bycroft, and Fersht examined the effect of thehelix on His18 of the protein barnase.15 This His residue,located at the C-terminus of an �-helix, has a pKa value of7.9 (1.6 units above the value in model peptides). Theauthors concluded that a favorable interaction betweenthe negatively charged end of the �-helix and the proton-
ated form of His causes the pKa to rise. The stabilizingeffect of the HMD should be about 2.1 kcal/mol.
(b) Lodi and Knowles studied the perturbed pKa valuesof two helical His residues in triosephosphate isomerase.12
His95 and His103 are located in the same �-helix andoccupy the N-terminus and C-terminus, respectively. ThepKa of His95 is lowered by at least 2 units and the pKa ofHis103 is raised by about 0.6 units in the folded state.According to the authors, the first perturbed pKa is due tomds and the second to HMD.12
(c) Raines et al. studied Cys32 situated at a helicalN-terminus in Thioredoxin.13 Cys32 has a pKa of 7.5 (1.2units below the value in model peptides). The authorsattributed the stabilization of the thyolate form “to itsproximity to the N-terminus of an HMD.”
(d) Creighton and coworkers studied the two-cysteinesactive site of protein disulfide isomerase.14 The pKa valueof Cys1 is 4.5, significantly lower from a normal value of8.7. This implies that the thiolate is stabilized by about 5.7kcal/mol. The authors concluded that the major contribu-tors to the stabilization energy are the peptide dipoles(mds) at the N-terminus of an �-helix pointing towards theactive site.14
All these studies provide supporting evidence for theability of the helix dipole to perturb pKa values. Still,dealing with only a few individual residues, they do notlend themselves to generalizations. Moreover, other recentstudies have suggested that amide interactions ratherthan the helix dipole are responsible for the low pKa valuesof Cys residues situated at the N-termini.39,40
The strongest, most systematic, evidence to date for theeffect of helix dipoles on pKa values comes from a thoroughsurvey of over 200 carboxyl pKa values in proteins thatRobertson and coworkers16 conducted in 2002 The studyyielded mean pKa values of �3.4 (�1.0) and 4.1 (�0.8) forAsp and Glu, respectively. Distribution of pKa values forboth residues exhibited a wide variability. In trying toidentify simple empirical relationships between proteinstructure and pKa values Robertson found some interest-ing but not precise trends. The only patent and unambigu-ous relationship between pKas and protein structure isthat N-termini carboxyl residues (NTCR) exhibit lowerpKa values. Asp and Glu mean pKa values at the N-terminiof �-helices are about 0.6 units less than the overall meanvalues. Robertson attributed the low pKa values to “thegreater than average potentials at the N-termini of heli-ces, hydrogen bonding between the carboxyl groups andpeptide amide protons at the ends of helices, or somecombination of these two phenomena.”16 In that line ofthought, the goal of this article is to rationalize the low pKa
values of NTCR by examining the structural features of allrelated helical N-termini, studying the local environmentof the carboxyl residues and identifying the prime pKa
determinants of the lowest pKa values in the N-terminidataset.
The article is organized as follows: we start by summariz-ing in two tables the structural features of �-helices thatcould favor the low pKa values of NTCR. The tables give aqualitative description of hydrogen bonding motifs at
PROTEINS: Structure, Function, and Bioinformatics DOI 10.1002/prot
622 M.A. PORTER ET AL.
NTCR. Then we perform three types of analyses. (1) Weexamine the relationship between carboxyl pKa values atthe N-termini and the magnitude of the HMD. (2) Wecompare the type, number, and effect on carboxyl pKa
values of various pKa determinants at the N-terminiversus a much larger dataset of 233 carboxyl groups.41
This statistical study is done using the pKa predictorpropKa. (3) We use a QM-based methodology to perform adetailed analysis of the chemical environment of the twoAsp and the two Glu residues in our 18 NTCR dataset thathave the lowest pKa values. In previous studies, we haveemployed this pKa methodology to investigate the effects ofcharge–charge interactions, hydrogen bonds, and hydro-phobic contacts on carboxyl pKa values.6 We concludedthat the chief determinants of the Asp and Glu pKa valueswere local interactions within ca. 4–5 Å of the ionizableresidue. Thus, in this study we put this conclusion to thetest because, as discussed above, the long-range electro-static effect of the helix macrodipole interactions is sup-posed to influence the pKa values. We finish by discussingthe implications of our work.
MATERIALS AND METHODSHelix Macrodipole
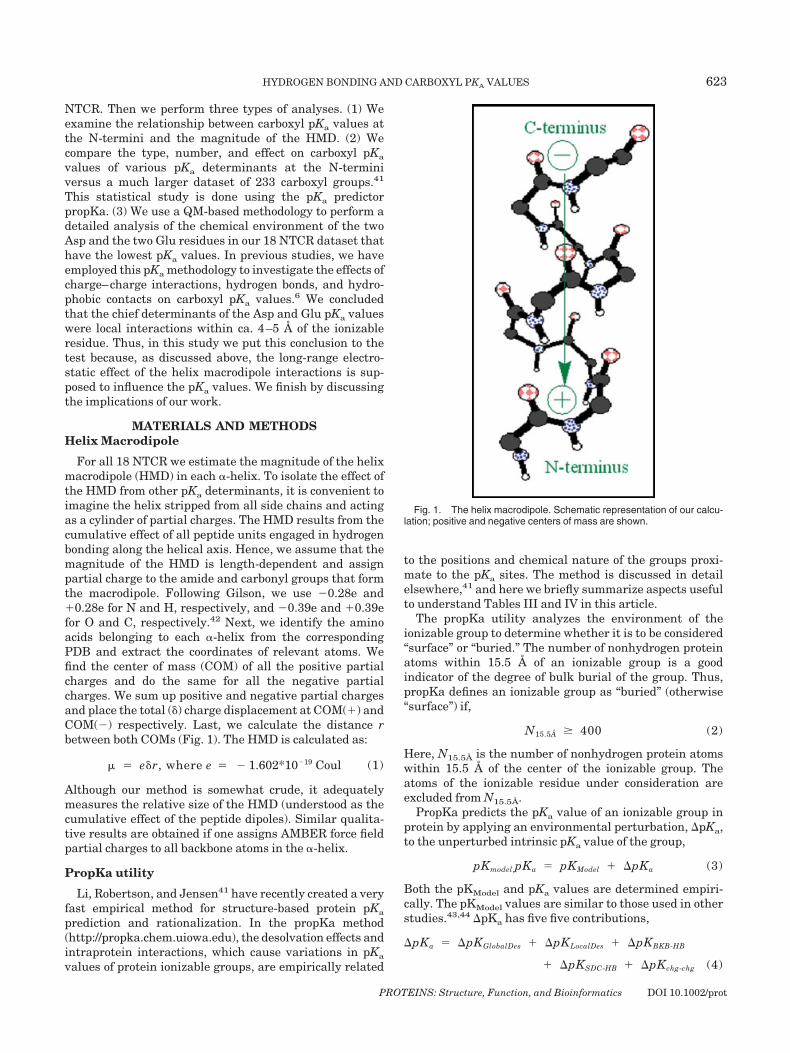
For all 18 NTCR we estimate the magnitude of the helixmacrodipole (HMD) in each �-helix. To isolate the effect ofthe HMD from other pKa determinants, it is convenient toimagine the helix stripped from all side chains and actingas a cylinder of partial charges. The HMD results from thecumulative effect of all peptide units engaged in hydrogenbonding along the helical axis. Hence, we assume that themagnitude of the HMD is length-dependent and assignpartial charge to the amide and carbonyl groups that formthe macrodipole. Following Gilson, we use �0.28e and�0.28e for N and H, respectively, and �0.39e and �0.39efor O and C, respectively.42 Next, we identify the aminoacids belonging to each �-helix from the correspondingPDB and extract the coordinates of relevant atoms. Wefind the center of mass (COM) of all the positive partialcharges and do the same for all the negative partialcharges. We sum up positive and negative partial chargesand place the total (�) charge displacement at COM(�) andCOM(�) respectively. Last, we calculate the distance rbetween both COMs (Fig. 1). The HMD is calculated as:
� � e�r, where e � � 1.602*10�19 Coul (1)
Although our method is somewhat crude, it adequatelymeasures the relative size of the HMD (understood as thecumulative effect of the peptide dipoles). Similar qualita-tive results are obtained if one assigns AMBER force fieldpartial charges to all backbone atoms in the �-helix.
PropKa utility
Li, Robertson, and Jensen41 have recently created a veryfast empirical method for structure-based protein pKa
prediction and rationalization. In the propKa method(http://propka.chem.uiowa.edu), the desolvation effects andintraprotein interactions, which cause variations in pKa
values of protein ionizable groups, are empirically related
to the positions and chemical nature of the groups proxi-mate to the pKa sites. The method is discussed in detailelsewhere,41 and here we briefly summarize aspects usefulto understand Tables III and IV in this article.
The propKa utility analyzes the environment of theionizable group to determine whether it is to be considered“surface” or “buried.” The number of nonhydrogen proteinatoms within 15.5 Å of an ionizable group is a goodindicator of the degree of bulk burial of the group. Thus,propKa defines an ionizable group as “buried” (otherwise“surface”) if,
N15.5Å � 400 (2)
Here, N15.5Å is the number of nonhydrogen protein atomswithin 15.5 Å of the center of the ionizable group. Theatoms of the ionizable residue under consideration areexcluded from N15.5Å.
PropKa predicts the pKa value of an ionizable group inprotein by applying an environmental perturbation, �pKa,to the unperturbed intrinsic pKa value of the group,
pKmodel,pKa � pKModel � �pKa (3)
Both the pKModel and pKa values are determined empiri-cally. The pKModel values are similar to those used in otherstudies.43,44 �pKa has five five contributions,
�pKa � �pKGlobalDes � �pKLocalDes � �pKBKB-HB
� �pKSDC-HB � �pKchg-chg (4)
Fig. 1. The helix macrodipole. Schematic representation of our calcu-lation; positive and negative centers of mass are shown.
PROTEINS: Structure, Function, and Bioinformatics DOI 10.1002/prot
HYDROGEN BONDING AND CARBOXYL PKA VALUES 623
In Equation (4), the first term refers to global and thesecond to local desolvation effects. The third and fourthterms take into account interactions via backbone andside-chain hydrogen bonds, respectively. The fifth termconsiders coulomb interactions (only for buried residues)between charged groups.
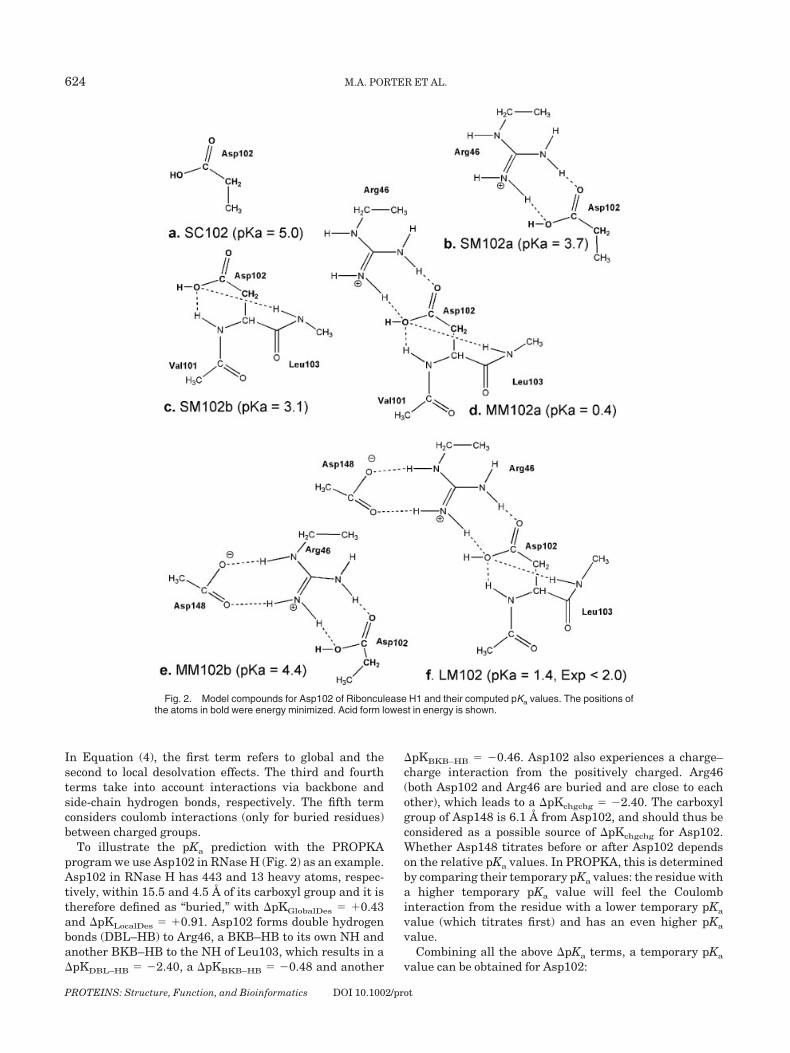
To illustrate the pKa prediction with the PROPKAprogram we use Asp102 in RNase H (Fig. 2) as an example.Asp102 in RNase H has 443 and 13 heavy atoms, respec-tively, within 15.5 and 4.5 Å of its carboxyl group and it istherefore defined as “buried,” with �pKGlobalDes � �0.43and �pKLocalDes � �0.91. Asp102 forms double hydrogenbonds (DBL–HB) to Arg46, a BKB–HB to its own NH andanother BKB–HB to the NH of Leu103, which results in a�pKDBL–HB � �2.40, a �pKBKB–HB � �0.48 and another
�pKBKB–HB � �0.46. Asp102 also experiences a charge–charge interaction from the positively charged. Arg46(both Asp102 and Arg46 are buried and are close to eachother), which leads to a �pKchgchg � �2.40. The carboxylgroup of Asp148 is 6.1 Å from Asp102, and should thus beconsidered as a possible source of �pKchgchg for Asp102.Whether Asp148 titrates before or after Asp102 dependson the relative pKa values. In PROPKA, this is determinedby comparing their temporary pKa values: the residue witha higher temporary pKa value will feel the Coulombinteraction from the residue with a lower temporary pKa
value (which titrates first) and has an even higher pKa
value.Combining all the above �pKa terms, a temporary pKa
value can be obtained for Asp102:
Fig. 2. Model compounds for Asp102 of Ribonculease H1 and their computed pKa values. The positions ofthe atoms in bold were energy minimized. Acid form lowest in energy is shown.
PROTEINS: Structure, Function, and Bioinformatics DOI 10.1002/prot
624 M.A. PORTER ET AL.
pKTempAsp102 � pKModel � �pKDes � �pKHB
� �pKchgchg � pKModel � �pKGlobalDes � �pKLocalDes
� �pKSDC-HB � �pKBKB-HB � �pKchgchg � 3.80
� 0.43 � 0.91 � 2.40 � 0.48 � 0.46
� 2.40 � � 0.60 (5)
Similar to that of Asp102, the pKTemp value of Asp148 inRNase H is computed as �0.79. For simplicity, only thetwo integer-charge states are considered for an ionizablegroup. Thus when Asp102 titrates, Asp148 is assumed tobe fully ionized thus resulting in a �pKchgchg � �0.73 forAsp102. Finally, the pKa of Asp102 is determined as�0.13, while the pKa of Asp148 is �0.79. The experimentalvalues were reported as �2.0 for both Asp102 andAsp148.16
pKa Prediction Model
In our approach, the pKa of HA, the carboxyl residuebeing studied, is related to the standard free energychange, �G, of the following reaction,6,45
HA � C2H5COO� 3 A� � C2H5COOH (6)
by the equation
pKa � 4.87 � �Grxn/1.36 (7)
where
�Grxn � � GA� � GHA� � GC2H5COO�
� GC2H5COOH�� (8)
Here, 4.87 is the experimentally determined pKa of pro-panoic acid at 298 K and 1.36 is RTln10 for T � 298 K inkcal/mol. G(X) is the total free energy (in kcal/mol) ofmodel X, which is the sum of the ground state electronicenergy (Eele) and solvation energy (Gsol),
G � Eele � Gsol (9)
Eele is computed at the MP2/6-31�G(2d,p) level of theoryand it comprises the potential energy of the electrons andnuclei as well as the kinetic energy of the electrons.Calculations are performed by standard quantum chemi-cal techniques (described in detail in previous papers)6,45
using the GAMESS and PQS programs.46,47 Gsol is calcu-lated by the polarizable continuum model (PCM) as imple-mented in GAMESS, which represents the solvent as adielectric continuum surrounding the solute.
Protein Model Construction
For each Asp and Glu system that we study, we con-struct model compounds that include the carboxyl residuesand their immediate chemical environments. We firstbuild a model including chemical interactions that appearwithin roughly a 5 Å sphere of the carboxyl residue ofinterest. In particular, we include: (1) the side chain of the
Asp or Glu residue, (2) the two amide groups next to the C�
of the Asp or Glu side chain, (3) all groups that formhydrogen bonds with the carboxyl group of interest, (4)charged residues in the immediate vicinity, and (5) resi-dues making direct hydrophobic contacts with the carboxy-lates of our acids.
The coordinates of the atoms in each model are takenfrom the protein data bank. The PDB codes used are: 2rn2for Asp102, 2ci2 for Glu34, and 1lys for Asp87 and Glu7.Hydrogen atoms are added to the PDB structure with theWHAT IF program at pH � 7.48 Several new protons areadded manually to satisfy the unfilled valences whereatoms were removed in constructing the models. All of thecarboxyl side chains are originally in the unprotonatedform. The acid forms are obtained by adding the acidicprotons to the carboxylate groups. Two or three protona-tion sites (i.e., conformers of the COOH group) are consid-ered for each acid form, while only one base form isconsidered. The total free energy of the acid form is takento be the “conformational average” of the free energies ofeach conformer (Gi),
49
G � � RTln �i
conformers
exp � Gi/RT � G0
� RTln�1 � �i�0
conformers
exp � �Gi/RT� (10)
where G0 is the lowest energy conformer and �Gi � Gi �G0. From the latter form of Equation (10) it can be seenthat only low energy conformers (�Gi � 2RT � 1 kcal/molat 25°C) contribute significantly to the free energy. Ifsignificant, this contribution will lower the free energy ofthe acid, thereby increasing the pKa. Physically, this pKa
increase is entropic in nature, because several accessibleprotonation states increase the protonation probability. Inour experience this contribution is always less than ca. 0.2pH units.
Because we seek the simplest possible computationalmodel that consistently reproduces the experimentalpKa values, we optimize only a few structural parame-ters. The positions of the atoms in the carboxyl group(CH2COO� or CH2COOH) are optimized by energyminimization at the RHF/6-31G(d) level of theory, ex-cept that the Cartesian coordinates of one of the oxygensare kept fixed (except for Asp102 where we relax bothcarboxyl oxygens). This allows for the carboxyl bondlengths and angles to adjust to the change in protona-tion state without greatly altering the overall structure.Additionally for Asp87 and Glu34, the positions of theneighboring OH protons of Thr89, and Ser31, respec-tively, are also optimized because their positions arepredicted to depend significantly on the protonationstate of the carboxyl group.
To analyze the interactions further we construct severalsmaller models (labeled “medium model” or MM and“small model” or SM) in which key hydrogen bonds areremoved. We also build a side chain (SC) model, in which
PROTEINS: Structure, Function, and Bioinformatics DOI 10.1002/prot
HYDROGEN BONDING AND CARBOXYL PKA VALUES 625
the peptide backbone atoms are replaced by a methylgroup, to determine the effect of the peptide groups on thepKa.
Isoelectric Point
Isoelectric points were calculated using “pI wrapper” athttp://www.embl-heidelberg.de/cgi/pi-wrapper.pl. The sameutility was used in Robertson’s survey of carboxyl resi-dues.16
RESULTS AND DISCUSSIONHelix Macrodipole
If the helix macrodipole (HMD) contributes signifi-cantly to the pKa values of residues at the N-terminithen the pKa shift should be correlated to the magnitude
of the helix dipole, and in this section we demonstratethe lack of such correlation. In the NTCR dataset pKa
values range from �2 to 3.2 for Asp and from 2.8 to 4.3for Glu (Tables I and II). This quite large and broaddataset of 18 NTCR carboxyl pKa values makes itpossible to quantify the effect of the HMD on the pKas. Ifthe HMD is a determinant of pKa lowering at theN-termini, what is the extent of the effect? In theory, onewould expect to find some correlation between largemacrodipoles values and low pKa values. To test thishypothesis we estimated the macrodipoles of each �-he-lix and put them side by side with the respectivecarboxyl pKa values. Results for Asp and Glu are shownin the last columns of Table I and Table II, respectively.No correlation is found between increasing magnitude ofthe dipole and decreasing pKa values. Indeed, the correla-
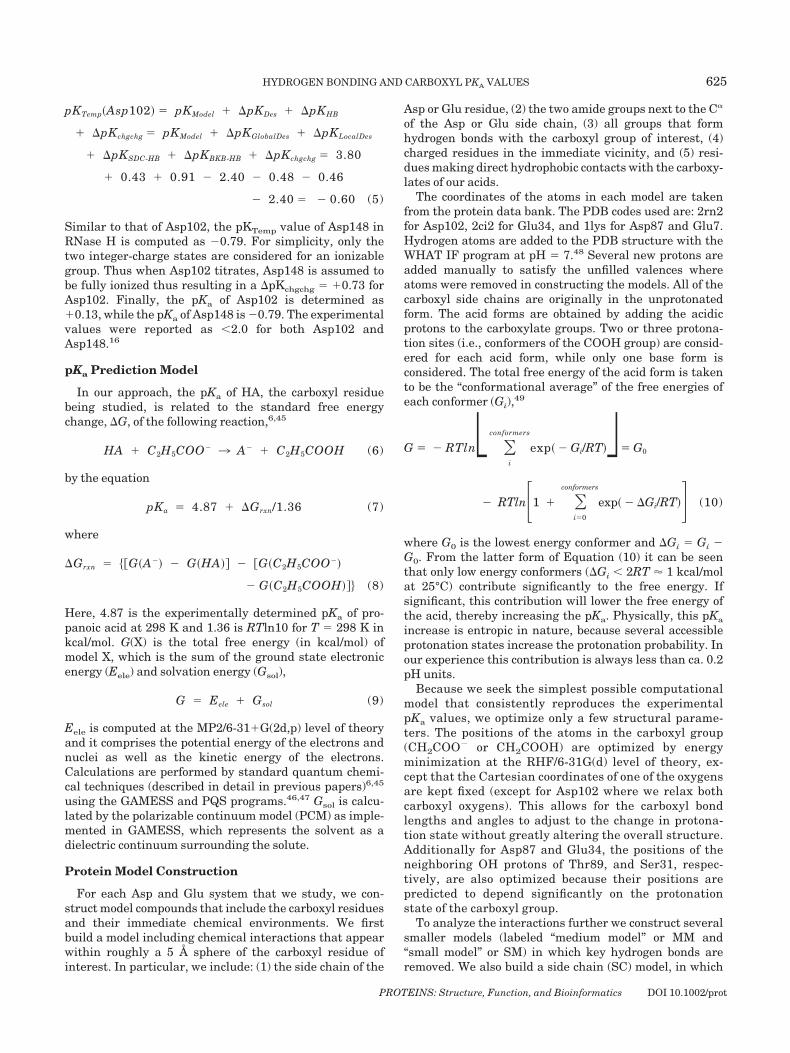
Fig. 3. Three acid conformers of Asp87.
Fig. 4. Model compounds for Asp87 of Hen Lysozyme and their computed pKa values. The positions of theatoms in bold were energy minimized. Acid form lowest in energy is shown.
PROTEINS: Structure, Function, and Bioinformatics DOI 10.1002/prot
626 M.A. PORTER ET AL.
tion coefficients for Asp and Glu pKa are �0.26 and 0.14,respectively. This finding suggests that if any pKa lower-ing effect can be attributed to the �-helix, the effect isunrelated to the magnitude of the macrodipole and helixlength. Using more stringent calculations, Warshel andcoworkers had previously reached the same conclusions.34
Via a sequential shortening of the helix they showedthat the pKa lowering of the C-terminus His18 in Barnasewas due mostly to localized dipoles in the last turn of thehelix. In the next section of this article we present ourinterpretation of the stabilizing effect of NH-microdipoles(mds) in the first turn of the helix on the basic form ofNTCR.14,34
PropKa Comparison
In this section we demonstrate (1) that the experimen-tally observed pKa lowering of NTCR can be quantitativelymodeled by a pKa prediction model that does not includeHMD effects (see earlier) and (2) that the pKa lowering isdue to a larger than average number of hydrogen bonds tothe NTCRs. Using the propKa program, we perform acomparative study of the pKa determinants of our 18NTCR dataset versus a large database41 of 233 carboxylresidues (referred as the “general distribution”). Note thatthe 18 NTCR are actually a subset of the general distribu-tion and thus makes a slight contribution to the statisticalbehavior of the latter.41 Although relatively small, the
Fig. 5. Model compounds for Glu7 of Hen Lysozyme and their computed pKa values. The positions of theatoms in bold were energy minimized. Acid form lowest in energy is shown.
PROTEINS: Structure, Function, and Bioinformatics DOI 10.1002/prot
HYDROGEN BONDING AND CARBOXYL PKA VALUES 627
NTCR dataset provides us with a unique opportunity toidentify distinctive features of the NTCR’s local environ-ment (versus the general distribution) and explain theirlower than average pKa values based on this comparison.The propKa program identifies the contributions of neigh-boring groups around the carboxyl residue of interest and
thus offers a convenient way to compare the chemicalenvironments of NTCR versus carboxyl residues in otherprotein regions. Table I (Asp) and Table II (Glu) list— asestablished by propKa—all hydrogen bonding pKa determi-nants of the NTCR dataset. The pKa values are given inorder of decreasing acidity. The statistics of each pKa
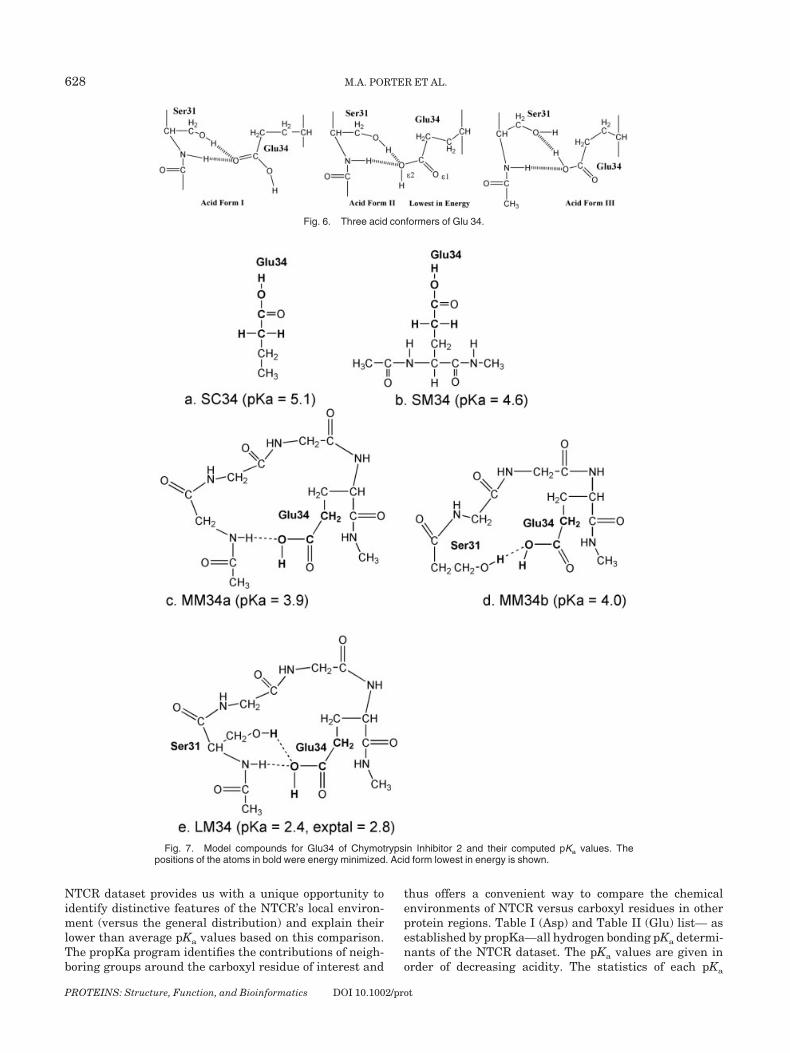
Fig. 6. Three acid conformers of Glu 34.
Fig. 7. Model compounds for Glu34 of Chymotrypsin Inhibitor 2 and their computed pKa values. Thepositions of the atoms in bold were energy minimized. Acid form lowest in energy is shown.
PROTEINS: Structure, Function, and Bioinformatics DOI 10.1002/prot
628 M.A. PORTER ET AL.
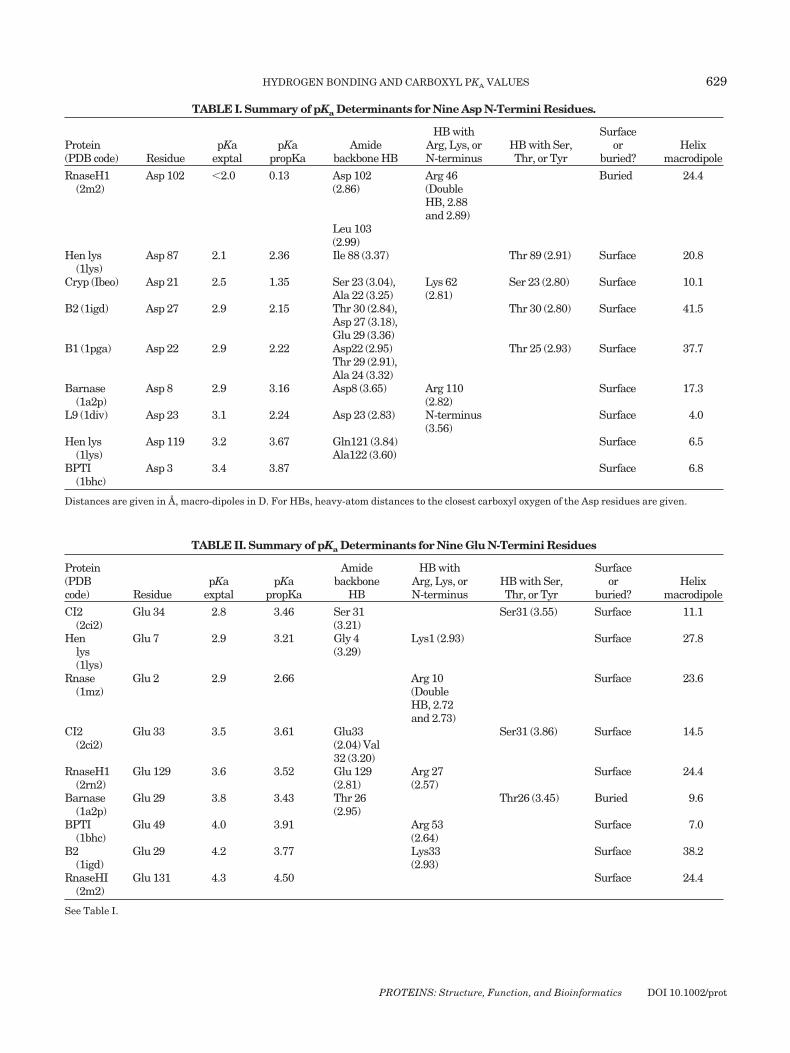
TABLE I. Summary of pKa Determinants for Nine Asp N-Termini Residues.
Protein(PDB code) Residue
pKaexptal
pKapropKa
Amidebackbone HB
HB withArg, Lys, orN-terminus
HB with Ser,Thr, or Tyr
Surfaceor
buried?Helix
macrodipole
RnaseH1(2m2)
Asp 102 �2.0 0.13 Asp 102(2.86)
Arg 46(DoubleHB, 2.88and 2.89)
Buried 24.4
Leu 103(2.99)
Hen lys(1lys)
Asp 87 2.1 2.36 Ile 88 (3.37) Thr 89 (2.91) Surface 20.8
Cryp (Ibeo) Asp 21 2.5 1.35 Ser 23 (3.04),Ala 22 (3.25)
Lys 62(2.81)
Ser 23 (2.80) Surface 10.1
B2 (1igd) Asp 27 2.9 2.15 Thr 30 (2.84),Asp 27 (3.18),Glu 29 (3.36)
Thr 30 (2.80) Surface 41.5
B1 (1pga) Asp 22 2.9 2.22 Asp22 (2.95)Thr 29 (2.91),Ala 24 (3.32)
Thr 25 (2.93) Surface 37.7
Barnase(1a2p)
Asp 8 2.9 3.16 Asp8 (3.65) Arg 110(2.82)
Surface 17.3
L9 (1div) Asp 23 3.1 2.24 Asp 23 (2.83) N-terminus(3.56)
Surface 4.0
Hen lys(1lys)
Asp 119 3.2 3.67 Gln121 (3.84)Ala122 (3.60)
Surface 6.5
BPTI(1bhc)
Asp 3 3.4 3.87 Surface 6.8
Distances are given in A, macro-dipoles in D. For HBs, heavy-atom distances to the closest carboxyl oxygen of the Asp residues are given.
TABLE II. Summary of pKa Determinants for Nine Glu N-Termini Residues
Protein(PDBcode) Residue
pKaexptal
pKapropKa
Amidebackbone
HB
HB withArg, Lys, orN-terminus
HB with Ser,Thr, or Tyr
Surfaceor
buried?Helix
macrodipole
CI2(2ci2)
Glu 34 2.8 3.46 Ser 31(3.21)
Ser31 (3.55) Surface 11.1
Henlys(1lys)
Glu 7 2.9 3.21 Gly 4(3.29)
Lys1 (2.93) Surface 27.8
Rnase(1mz)
Glu 2 2.9 2.66 Arg 10(DoubleHB, 2.72and 2.73)
Surface 23.6
CI2(2ci2)
Glu 33 3.5 3.61 Glu33(2.04) Val32 (3.20)
Ser31 (3.86) Surface 14.5
RnaseH1(2rn2)
Glu 129 3.6 3.52 Glu 129(2.81)
Arg 27(2.57)
Surface 24.4
Barnase(1a2p)
Glu 29 3.8 3.43 Thr 26(2.95)
Thr26 (3.45) Buried 9.6
BPTI(1bhc)
Glu 49 4.0 3.91 Arg 53(2.64)
Surface 7.0
B2(1igd)
Glu 29 4.2 3.77 Lys33(2.93)
Surface 38.2
RnaseHI(2m2)
Glu 131 4.3 4.50 Surface 24.4
See Table I.
PROTEINS: Structure, Function, and Bioinformatics DOI 10.1002/prot
HYDROGEN BONDING AND CARBOXYL PKA VALUES 629
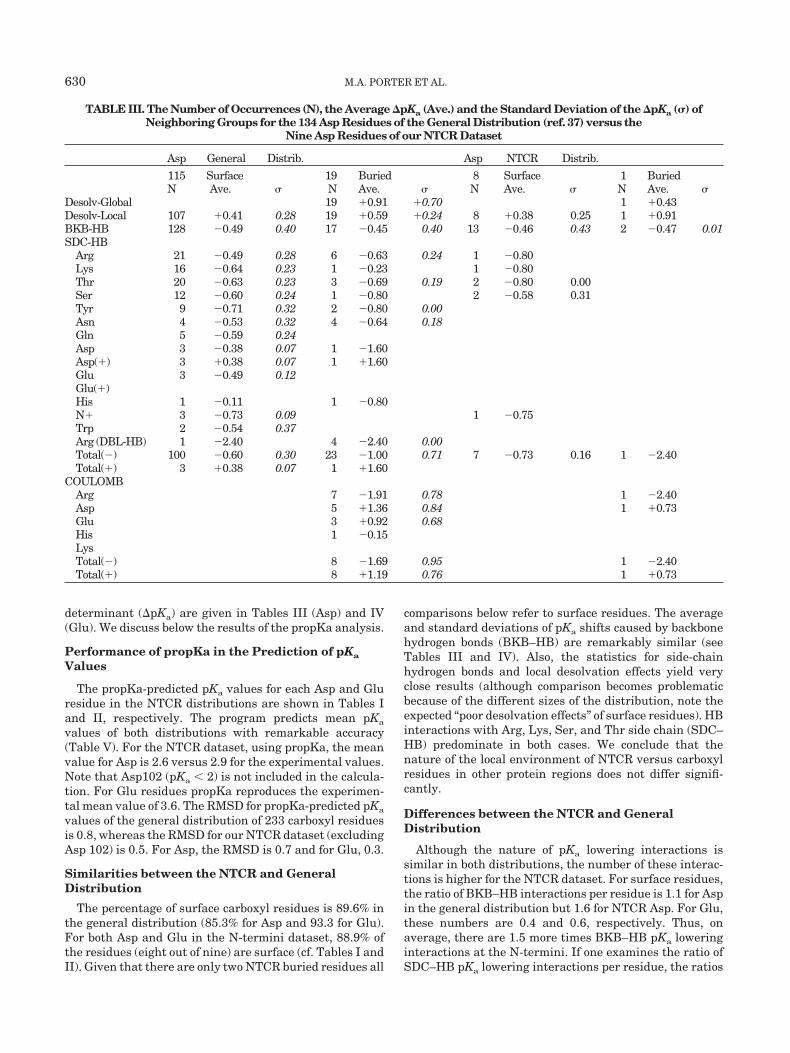
determinant (�pKa) are given in Tables III (Asp) and IV(Glu). We discuss below the results of the propKa analysis.
Performance of propKa in the Prediction of pKa
Values
The propKa-predicted pKa values for each Asp and Gluresidue in the NTCR distributions are shown in Tables Iand II, respectively. The program predicts mean pKa
values of both distributions with remarkable accuracy(Table V). For the NTCR dataset, using propKa, the meanvalue for Asp is 2.6 versus 2.9 for the experimental values.Note that Asp102 (pKa � 2) is not included in the calcula-tion. For Glu residues propKa reproduces the experimen-tal mean value of 3.6. The RMSD for propKa-predicted pKa
values of the general distribution of 233 carboxyl residuesis 0.8, whereas the RMSD for our NTCR dataset (excludingAsp 102) is 0.5. For Asp, the RMSD is 0.7 and for Glu, 0.3.
Similarities between the NTCR and GeneralDistribution
The percentage of surface carboxyl residues is 89.6% inthe general distribution (85.3% for Asp and 93.3 for Glu).For both Asp and Glu in the N-termini dataset, 88.9% ofthe residues (eight out of nine) are surface (cf. Tables I andII). Given that there are only two NTCR buried residues all
comparisons below refer to surface residues. The averageand standard deviations of pKa shifts caused by backbonehydrogen bonds (BKB–HB) are remarkably similar (seeTables III and IV). Also, the statistics for side-chainhydrogen bonds and local desolvation effects yield veryclose results (although comparison becomes problematicbecause of the different sizes of the distribution, note theexpected “poor desolvation effects” of surface residues). HBinteractions with Arg, Lys, Ser, and Thr side chain (SDC–HB) predominate in both cases. We conclude that thenature of the local environment of NTCR versus carboxylresidues in other protein regions does not differ signifi-cantly.
Differences between the NTCR and GeneralDistribution
Although the nature of pKa lowering interactions issimilar in both distributions, the number of these interac-tions is higher for the NTCR dataset. For surface residues,the ratio of BKB–HB interactions per residue is 1.1 for Aspin the general distribution but 1.6 for NTCR Asp. For Glu,these numbers are 0.4 and 0.6, respectively. Thus, onaverage, there are 1.5 more times BKB–HB pKa loweringinteractions at the N-termini. If one examines the ratio ofSDC–HB pKa lowering interactions per residue, the ratios
TABLE III. The Number of Occurrences (N), the Average �pKa (Ave.) and the Standard Deviation of the �pKa (�) ofNeighboring Groups for the 134 Asp Residues of the General Distribution (ref. 37) versus the
Nine Asp Residues of our NTCR Dataset
Asp General Distrib. Asp NTCR Distrib.
115 Surface 19 Buried 8 Surface 1 BuriedN Ave. � N Ave. � N Ave. � N Ave. �
Desolv-Global 19 �0.91 �0.70 1 �0.43Desolv-Local 107 �0.41 0.28 19 �0.59 �0.24 8 �0.38 0.25 1 �0.91BKB-HB 128 �0.49 0.40 17 �0.45 0.40 13 �0.46 0.43 2 �0.47 0.01SDC-HB
Arg 21 �0.49 0.28 6 �0.63 0.24 1 �0.80Lys 16 �0.64 0.23 1 �0.23 1 �0.80Thr 20 �0.63 0.23 3 �0.69 0.19 2 �0.80 0.00Ser 12 �0.60 0.24 1 �0.80 2 �0.58 0.31Tyr 9 �0.71 0.32 2 �0.80 0.00Asn 4 �0.53 0.32 4 �0.64 0.18Gln 5 �0.59 0.24Asp 3 �0.38 0.07 1 �1.60Asp(�) 3 �0.38 0.07 1 �1.60Glu 3 �0.49 0.12Glu(�)His 1 �0.11 1 �0.80N� 3 �0.73 0.09 1 �0.75Trp 2 �0.54 0.37Arg (DBL-HB) 1 �2.40 4 �2.40 0.00Total(�) 100 �0.60 0.30 23 �1.00 0.71 7 �0.73 0.16 1 �2.40Total(�) 3 �0.38 0.07 1 �1.60
COULOMBArg 7 �1.91 0.78 1 �2.40Asp 5 �1.36 0.84 1 �0.73Glu 3 �0.92 0.68His 1 �0.15LysTotal(�) 8 �1.69 0.95 1 �2.40Total(�) 8 �1.19 0.76 1 �0.73
630 M.A. PORTER ET AL.
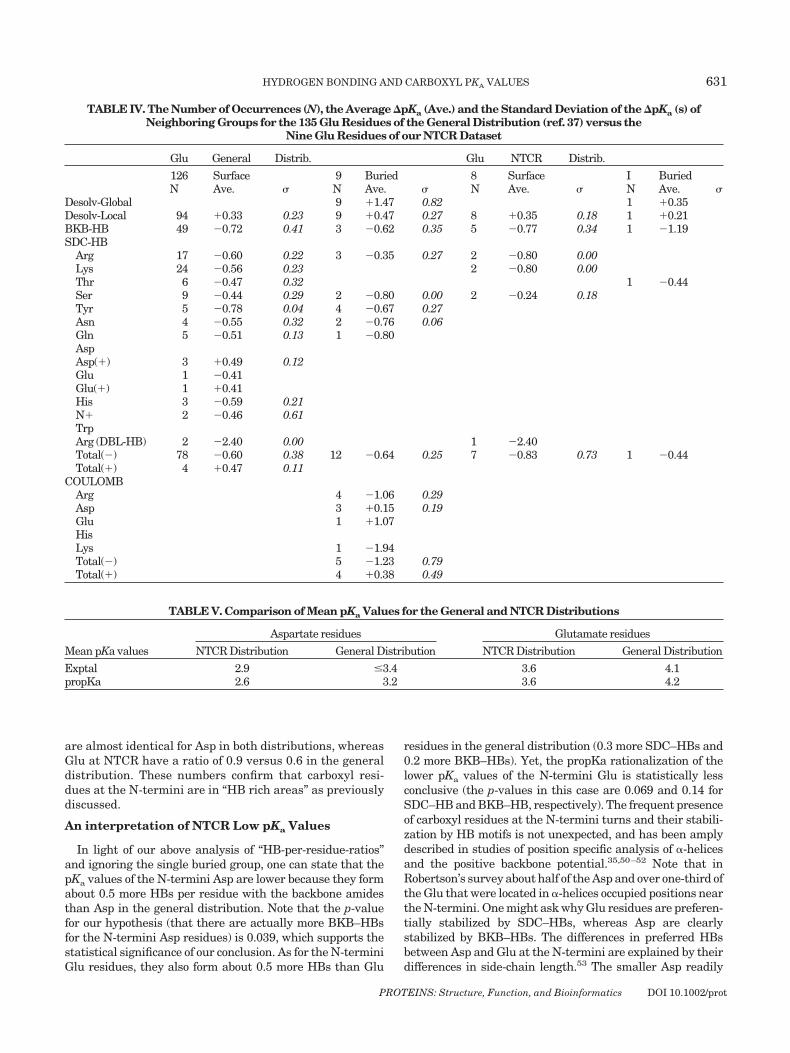
are almost identical for Asp in both distributions, whereasGlu at NTCR have a ratio of 0.9 versus 0.6 in the generaldistribution. These numbers confirm that carboxyl resi-dues at the N-termini are in “HB rich areas” as previouslydiscussed.
An interpretation of NTCR Low pKa Values
In light of our above analysis of “HB-per-residue-ratios”and ignoring the single buried group, one can state that thepKa values of the N-termini Asp are lower because they formabout 0.5 more HBs per residue with the backbone amidesthan Asp in the general distribution. Note that the p-valuefor our hypothesis (that there are actually more BKB–HBsfor the N-termini Asp residues) is 0.039, which supports thestatistical significance of our conclusion. As for the N-terminiGlu residues, they also form about 0.5 more HBs than Glu
residues in the general distribution (0.3 more SDC–HBs and0.2 more BKB–HBs). Yet, the propKa rationalization of thelower pKa values of the N-termini Glu is statistically lessconclusive (the p-values in this case are 0.069 and 0.14 forSDC–HB and BKB–HB, respectively). The frequent presenceof carboxyl residues at the N-termini turns and their stabili-zation by HB motifs is not unexpected, and has been amplydescribed in studies of position specific analysis of �-helicesand the positive backbone potential.35,50–52 Note that inRobertson’s survey about half of the Asp and over one-third ofthe Glu that were located in �-helices occupied positions nearthe N-termini. One might ask why Glu residues are preferen-tially stabilized by SDC–HBs, whereas Asp are clearlystabilized by BKB–HBs. The differences in preferred HBsbetween Asp and Glu at the N-termini are explained by theirdifferences in side-chain length.53 The smaller Asp readily
TABLE IV. The Number of Occurrences (N), the Average �pKa (Ave.) and the Standard Deviation of the �pKa (s) ofNeighboring Groups for the 135 Glu Residues of the General Distribution (ref. 37) versus the
Nine Glu Residues of our NTCR Dataset
Glu General Distrib. Glu NTCR Distrib.
126 Surface 9 Buried 8 Surface I BuriedN Ave. � N Ave. � N Ave. � N Ave. �
Desolv-Global 9 �1.47 0.82 1 �0.35Desolv-Local 94 �0.33 0.23 9 �0.47 0.27 8 �0.35 0.18 1 �0.21BKB-HB 49 �0.72 0.41 3 �0.62 0.35 5 �0.77 0.34 1 �1.19SDC-HB
Arg 17 �0.60 0.22 3 �0.35 0.27 2 �0.80 0.00Lys 24 �0.56 0.23 2 �0.80 0.00Thr 6 �0.47 0.32 1 �0.44Ser 9 �0.44 0.29 2 �0.80 0.00 2 �0.24 0.18Tyr 5 �0.78 0.04 4 �0.67 0.27Asn 4 �0.55 0.32 2 �0.76 0.06Gln 5 �0.51 0.13 1 �0.80AspAsp(�) 3 �0.49 0.12Glu 1 �0.41Glu(�) 1 �0.41His 3 �0.59 0.21N� 2 �0.46 0.61TrpArg (DBL-HB) 2 �2.40 0.00 1 �2.40Total(�) 78 �0.60 0.38 12 �0.64 0.25 7 �0.83 0.73 1 �0.44Total(�) 4 �0.47 0.11
COULOMBArg 4 �1.06 0.29Asp 3 �0.15 0.19Glu 1 �1.07HisLys 1 �1.94Total(�) 5 �1.23 0.79Total(�) 4 �0.38 0.49
TABLE V. Comparison of Mean pKa Values for the General and NTCR Distributions
Mean pKa values
Aspartate residues Glutamate residues
NTCR Distribution General Distribution NTCR Distribution General Distribution
Exptal 2.9 �3.4 3.6 4.1propKa 2.6 3.2 3.6 4.2
PROTEINS: Structure, Function, and Bioinformatics DOI 10.1002/prot
HYDROGEN BONDING AND CARBOXYL PKA VALUES 631
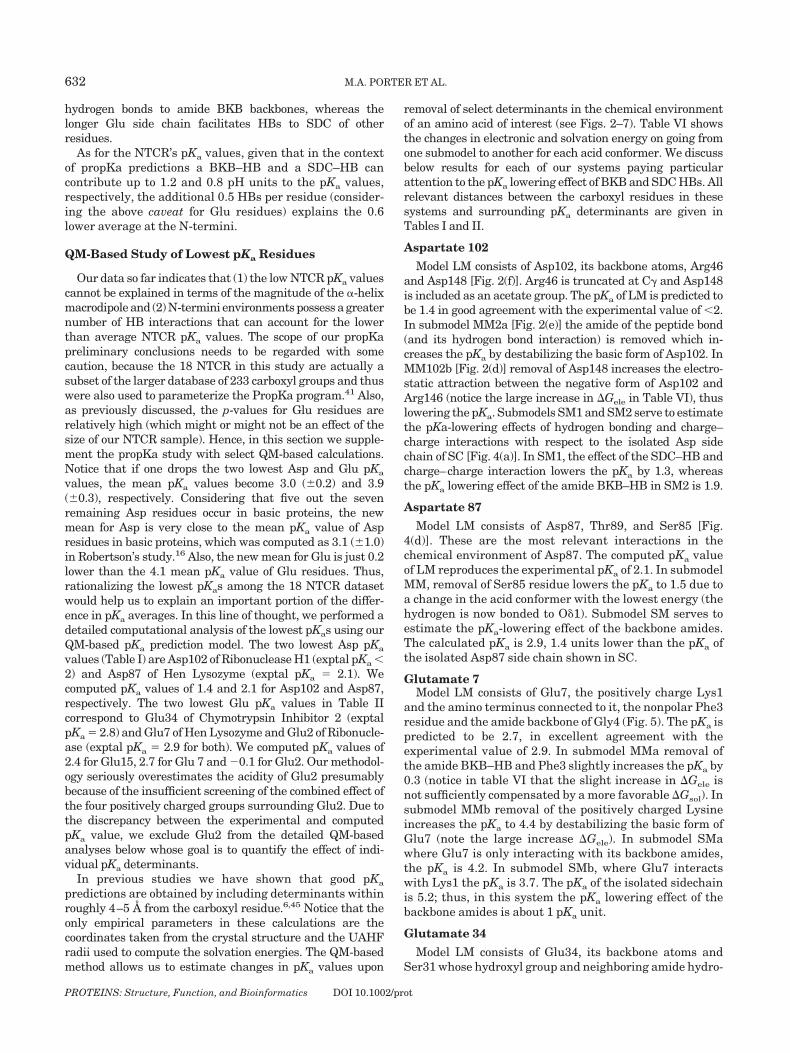
hydrogen bonds to amide BKB backbones, whereas thelonger Glu side chain facilitates HBs to SDC of otherresidues.
As for the NTCR’s pKa values, given that in the contextof propKa predictions a BKB–HB and a SDC–HB cancontribute up to 1.2 and 0.8 pH units to the pKa values,respectively, the additional 0.5 HBs per residue (consider-ing the above caveat for Glu residues) explains the 0.6lower average at the N-termini.
QM-Based Study of Lowest pKa Residues
Our data so far indicates that (1) the low NTCR pKa valuescannot be explained in terms of the magnitude of the �-helixmacrodipole and (2) N-termini environments possess a greaternumber of HB interactions that can account for the lowerthan average NTCR pKa values. The scope of our propKapreliminary conclusions needs to be regarded with somecaution, because the 18 NTCR in this study are actually asubset of the larger database of 233 carboxyl groups and thuswere also used to parameterize the PropKa program.41 Also,as previously discussed, the p-values for Glu residues arerelatively high (which might or might not be an effect of thesize of our NTCR sample). Hence, in this section we supple-ment the propKa study with select QM-based calculations.Notice that if one drops the two lowest Asp and Glu pKa
values, the mean pKa values become 3.0 (�0.2) and 3.9(�0.3), respectively. Considering that five out the sevenremaining Asp residues occur in basic proteins, the newmean for Asp is very close to the mean pKa value of Aspresidues in basic proteins, which was computed as 3.1 (�1.0)in Robertson’s study.16 Also, the new mean for Glu is just 0.2lower than the 4.1 mean pKa value of Glu residues. Thus,rationalizing the lowest pKas among the 18 NTCR datasetwould help us to explain an important portion of the differ-ence in pKa averages. In this line of thought, we performed adetailed computational analysis of the lowest pKas using ourQM-based pKa prediction model. The two lowest Asp pKa
values (Table I) are Asp102 of Ribonuclease H1 (exptal pKa �2) and Asp87 of Hen Lysozyme (exptal pKa � 2.1). Wecomputed pKa values of 1.4 and 2.1 for Asp102 and Asp87,respectively. The two lowest Glu pKa values in Table IIcorrespond to Glu34 of Chymotrypsin Inhibitor 2 (exptalpKa � 2.8) and Glu7 of Hen Lysozyme and Glu2 of Ribonucle-ase (exptal pKa � 2.9 for both). We computed pKa values of2.4 for Glu15, 2.7 for Glu 7 and �0.1 for Glu2. Our methodol-ogy seriously overestimates the acidity of Glu2 presumablybecause of the insufficient screening of the combined effect ofthe four positively charged groups surrounding Glu2. Due tothe discrepancy between the experimental and computedpKa value, we exclude Glu2 from the detailed QM-basedanalyses below whose goal is to quantify the effect of indi-vidual pKa determinants.
In previous studies we have shown that good pKa
predictions are obtained by including determinants withinroughly 4–5 Å from the carboxyl residue.6,45 Notice that theonly empirical parameters in these calculations are thecoordinates taken from the crystal structure and the UAHFradii used to compute the solvation energies. The QM-basedmethod allows us to estimate changes in pKa values upon
removal of select determinants in the chemical environmentof an amino acid of interest (see Figs. 2–7). Table VI showsthe changes in electronic and solvation energy on going fromone submodel to another for each acid conformer. We discussbelow results for each of our systems paying particularattention to the pKa lowering effect of BKB and SDC HBs. Allrelevant distances between the carboxyl residues in thesesystems and surrounding pKa determinants are given inTables I and II.
Aspartate 102
Model LM consists of Asp102, its backbone atoms, Arg46and Asp148 [Fig. 2(f)]. Arg46 is truncated at C� and Asp148is included as an acetate group. The pKa of LM is predicted tobe 1.4 in good agreement with the experimental value of �2.In submodel MM2a [Fig. 2(e)] the amide of the peptide bond(and its hydrogen bond interaction) is removed which in-creases the pKa by destabilizing the basic form of Asp102. InMM102b [Fig. 2(d)] removal of Asp148 increases the electro-static attraction between the negative form of Asp102 andArg146 (notice the large increase in �Gele in Table VI), thuslowering the pKa. Submodels SM1 and SM2 serve to estimatethe pKa-lowering effects of hydrogen bonding and charge–charge interactions with respect to the isolated Asp sidechain of SC [Fig. 4(a)]. In SM1, the effect of the SDC–HB andcharge–charge interaction lowers the pKa by 1.3, whereasthe pKa lowering effect of the amide BKB–HB in SM2 is 1.9.
Aspartate 87
Model LM consists of Asp87, Thr89, and Ser85 [Fig.4(d)]. These are the most relevant interactions in thechemical environment of Asp87. The computed pKa valueof LM reproduces the experimental pKa of 2.1. In submodelMM, removal of Ser85 residue lowers the pKa to 1.5 due toa change in the acid conformer with the lowest energy (thehydrogen is now bonded to O�1). Submodel SM serves toestimate the pKa-lowering effect of the backbone amides.The calculated pKa is 2.9, 1.4 units lower than the pKa ofthe isolated Asp87 side chain shown in SC.
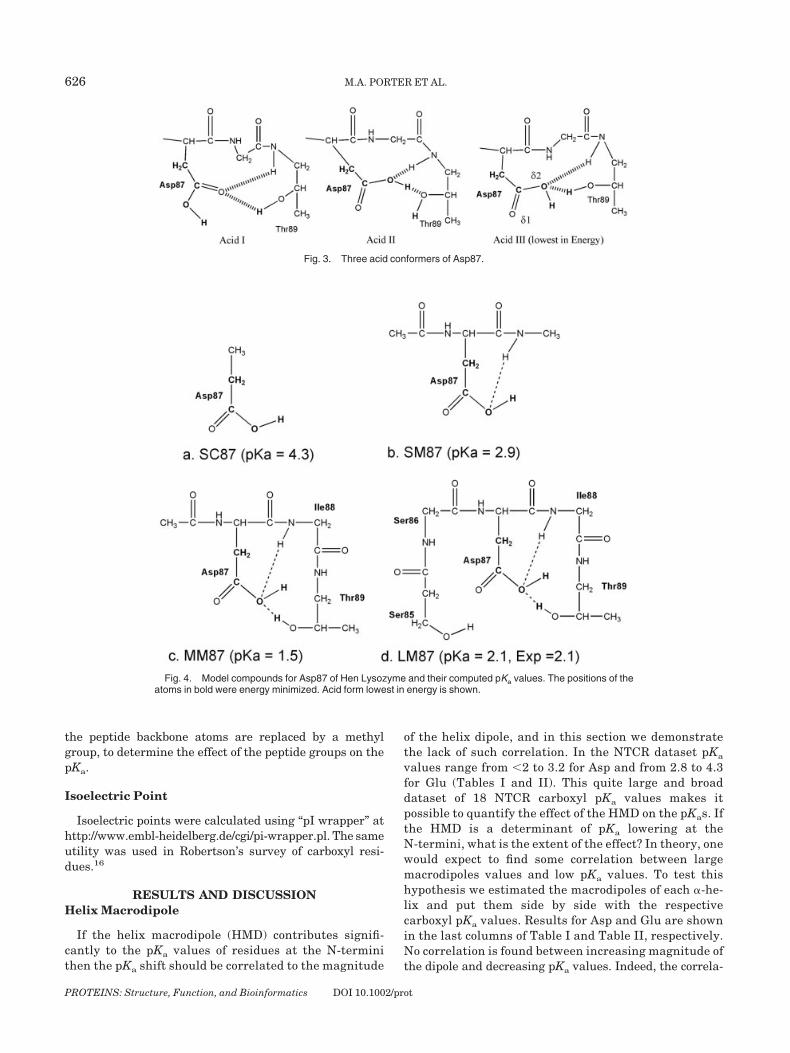
Glutamate 7Model LM consists of Glu7, the positively charge Lys1
and the amino terminus connected to it, the nonpolar Phe3residue and the amide backbone of Gly4 (Fig. 5). The pKa ispredicted to be 2.7, in excellent agreement with theexperimental value of 2.9. In submodel MMa removal ofthe amide BKB–HB and Phe3 slightly increases the pKa by0.3 (notice in table VI that the slight increase in �Gele isnot sufficiently compensated by a more favorable �Gsol). Insubmodel MMb removal of the positively charged Lysineincreases the pKa to 4.4 by destabilizing the basic form ofGlu7 (note the large increase �Gele). In submodel SMawhere Glu7 is only interacting with its backbone amides,the pKa is 4.2. In submodel SMb, where Glu7 interactswith Lys1 the pKa is 3.7. The pKa of the isolated sidechainis 5.2; thus, in this system the pKa lowering effect of thebackbone amides is about 1 pKa unit.
Glutamate 34
Model LM consists of Glu34, its backbone atoms andSer31 whose hydroxyl group and neighboring amide hydro-
PROTEINS: Structure, Function, and Bioinformatics DOI 10.1002/prot
632 M.A. PORTER ET AL.
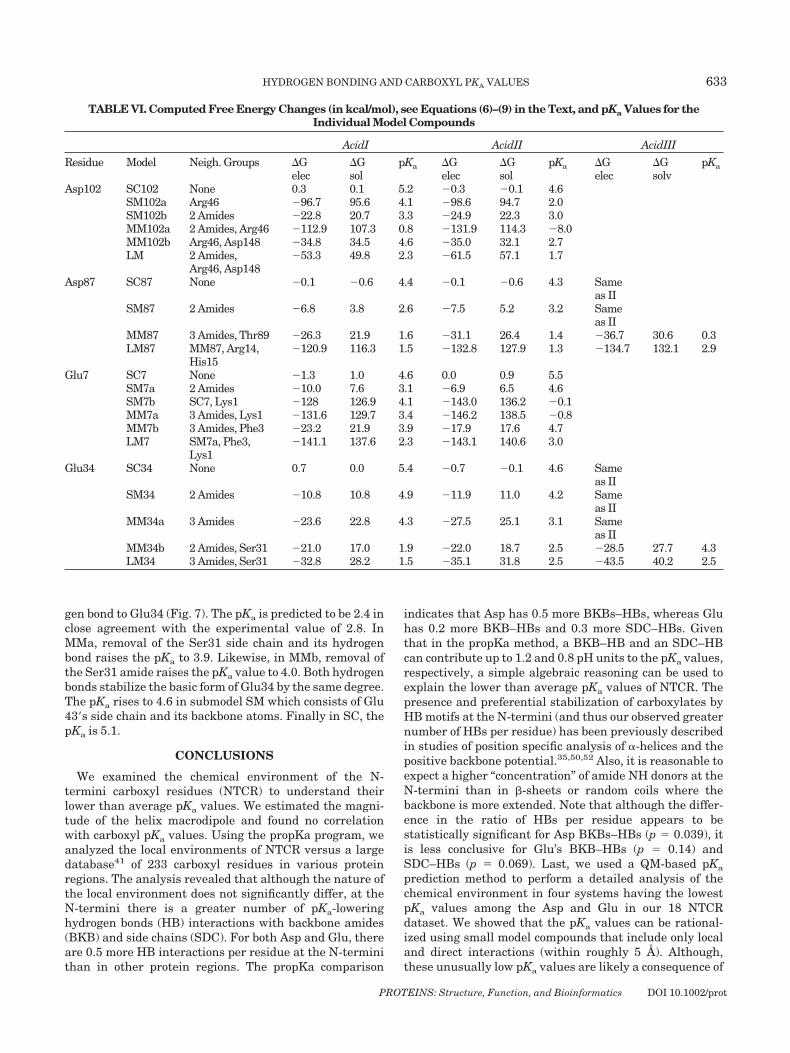
gen bond to Glu34 (Fig. 7). The pKa is predicted to be 2.4 inclose agreement with the experimental value of 2.8. InMMa, removal of the Ser31 side chain and its hydrogenbond raises the pKa to 3.9. Likewise, in MMb, removal ofthe Ser31 amide raises the pKa value to 4.0. Both hydrogenbonds stabilize the basic form of Glu34 by the same degree.The pKa rises to 4.6 in submodel SM which consists of Glu43�s side chain and its backbone atoms. Finally in SC, thepKa is 5.1.
CONCLUSIONS
We examined the chemical environment of the N-termini carboxyl residues (NTCR) to understand theirlower than average pKa values. We estimated the magni-tude of the helix macrodipole and found no correlationwith carboxyl pKa values. Using the propKa program, weanalyzed the local environments of NTCR versus a largedatabase41 of 233 carboxyl residues in various proteinregions. The analysis revealed that although the nature ofthe local environment does not significantly differ, at theN-termini there is a greater number of pKa-loweringhydrogen bonds (HB) interactions with backbone amides(BKB) and side chains (SDC). For both Asp and Glu, thereare 0.5 more HB interactions per residue at the N-terminithan in other protein regions. The propKa comparison
indicates that Asp has 0.5 more BKBs–HBs, whereas Gluhas 0.2 more BKB–HBs and 0.3 more SDC–HBs. Giventhat in the propKa method, a BKB–HB and an SDC–HBcan contribute up to 1.2 and 0.8 pH units to the pKa values,respectively, a simple algebraic reasoning can be used toexplain the lower than average pKa values of NTCR. Thepresence and preferential stabilization of carboxylates byHB motifs at the N-termini (and thus our observed greaternumber of HBs per residue) has been previously describedin studies of position specific analysis of �-helices and thepositive backbone potential.35,50,52 Also, it is reasonable toexpect a higher “concentration” of amide NH donors at theN-termini than in �-sheets or random coils where thebackbone is more extended. Note that although the differ-ence in the ratio of HBs per residue appears to bestatistically significant for Asp BKBs–HBs (p � 0.039), itis less conclusive for Glu’s BKB–HBs (p � 0.14) andSDC–HBs (p � 0.069). Last, we used a QM-based pKa
prediction method to perform a detailed analysis of thechemical environment in four systems having the lowestpKa values among the Asp and Glu in our 18 NTCRdataset. We showed that the pKa values can be rational-ized using small model compounds that include only localand direct interactions (within roughly 5 Å). Although,these unusually low pKa values are likely a consequence of
TABLE VI. Computed Free Energy Changes (in kcal/mol), see Equations (6)–(9) in the Text, and pKa Values for theIndividual Model Compounds
AcidI AcidII AcidIII
Residue Model Neigh. Groups �Gelec
�Gsol
pKa �Gelec
�Gsol
pKa �Gelec
�Gsolv
pKa
Asp102 SC102 None 0.3 0.1 5.2 �0.3 �0.1 4.6SM102a Arg46 �96.7 95.6 4.1 �98.6 94.7 2.0SM102b 2 Amides �22.8 20.7 3.3 �24.9 22.3 3.0MM102a 2 Amides, Arg46 �112.9 107.3 0.8 �131.9 114.3 �8.0MM102b Arg46, Asp148 �34.8 34.5 4.6 �35.0 32.1 2.7LM 2 Amides,
Arg46, Asp148�53.3 49.8 2.3 �61.5 57.1 1.7
Asp87 SC87 None �0.1 �0.6 4.4 �0.1 �0.6 4.3 Sameas II
SM87 2 Amides �6.8 3.8 2.6 �7.5 5.2 3.2 Sameas II
MM87 3 Amides, Thr89 �26.3 21.9 1.6 �31.1 26.4 1.4 �36.7 30.6 0.3LM87 MM87, Arg14,
His15�120.9 116.3 1.5 �132.8 127.9 1.3 �134.7 132.1 2.9
Glu7 SC7 None �1.3 1.0 4.6 0.0 0.9 5.5SM7a 2 Amides �10.0 7.6 3.1 �6.9 6.5 4.6SM7b SC7, Lys1 �128 126.9 4.1 �143.0 136.2 �0.1MM7a 3 Amides, Lys1 �131.6 129.7 3.4 �146.2 138.5 �0.8MM7b 3 Amides, Phe3 �23.2 21.9 3.9 �17.9 17.6 4.7LM7 SM7a, Phe3,
Lys1�141.1 137.6 2.3 �143.1 140.6 3.0
Glu34 SC34 None 0.7 0.0 5.4 �0.7 �0.1 4.6 Sameas II
SM34 2 Amides �10.8 10.8 4.9 �11.9 11.0 4.2 Sameas II
MM34a 3 Amides �23.6 22.8 4.3 �27.5 25.1 3.1 Sameas II
MM34b 2 Amides, Ser31 �21.0 17.0 1.9 �22.0 18.7 2.5 �28.5 27.7 4.3LM34 3 Amides, Ser31 �32.8 28.2 1.5 �35.1 31.8 2.5 �43.5 40.2 2.5
PROTEINS: Structure, Function, and Bioinformatics DOI 10.1002/prot
HYDROGEN BONDING AND CARBOXYL PKA VALUES 633
the combined effect of several environmental determi-nants, the stabilization of carboxylates by backbone amidesconstitutes by far the most significant pKa lowering effect.In the systems studied, it ranges from about 1.0 to 1.9 pKa
units. These amide hydrogen bonds were previously re-ferred to as “NH microdipoles” and interpreted as theshort-range effects of the �-helix.14,34 Our QM-based studyof the lowest NTCR pKa values indicates that microdipoles(mds) are just regular amide hydrogen bonds and not anindependent pKa determinant. Since its inception, thehelix dipole concept has been interpreted not only as theshort-range mds but also as a long-range electrostaticeffect caused by a helix macrodipole (HMD). In particular,the HMD has been invoked to rationalize the perturbedpKa values of His18 in barnase, His103 in triosephosphateisomerase, and Cys32 in Thioredoxin.12,13,15 Because ofthe multifaceted nature of perturbed pKa values, it wouldbe unwise to completely dismiss the effect of HMD inlowering carboxyl pKas. However, our study shows that (1)the effect does not depend on the magnitude of themacrodipole, (2) the HMD can be neglected from pKa
predictive models and more importantly, (3) the HMD’spKa lowering effects—if any—have likely been overesti-mated in the past. In the best case scenario, if one were toassign the QM-unaccounted difference in the N-terminipKa averages to the HMD, its effect should be marginaland responsible for at most a pKa lowering of about 0.2 pKa
units, providing less than 0.3 kcal/mol of stabilizationenergy.
ACKNOWLEDGMENTS
The calculations were performed: (1) on IBM RS/6000workstations and an eight-node Quantum Station, locatedat the University of Iowa, obtained through NSF GrantsCHE 9974502 and MCB 0209941, respectively; (2) oncomputers located at the Advanced Biomedical ComputingCenter at the National Cancer Institute at Frederick; and(3) on an eight-node PQS Quantum Station at MurrayState University purchased with financial support fromNSF as part of PAM’s start-up fund.
REFERENCES
1. Harris TK, Turner GJ. Structural basis of perturbed pKa values ofcatalytic groups in enzyme active sites. IUBMB Life 2002;53:85–98.
2. Nielsen JE, Borchert TV, Vriend G. The determinants of alpha-amylase pH-activity profiles. Protein Eng 2001;14:505–512.
3. Russell AJ, Thomas PG, Fersht AR. Electrostatic effects onmodification of charged groups in the active site cleft of subtilisinby protein engineering. J Mol Biol 1987;193:803–813.
4. Laurents DV, Huyghues-Despointes BM, Bruix M, Thurlkill RL,Schell D, Newsom S, Grimsley GR, Shaw KL, Trevino S, Rico M,Briggs JM, Antosiewicz JM, Scholtz JM, Pace CN. Charge–chargeinteractions are key determinants of the pK values of ionizablegroups in ribonuclease Sa (pI � 3.5) and a basic variant (pI �10.2). J Mol Biol 2003;325:1077–1092.
5. Pace CN, Huyghues-Despointes BM, Briggs JM, Grimsley GR,Scholtz JM. Charge–charge interactions are the primary determi-nants of the pK values of the ionizable groups in Ribonuclease T1.Biophys Chem 2002;101–102:211–219.
6. Li H, Robertson AD, Jensen JH. The determinants of carboxyl pKavalues in turkey ovomucoid third domain. Proteins 2004;55:689–704.
7. Warshel A, Levitt M. Theoretical studies of enzymic reactions:
dielectric, electrostatic and steric stabilization of the carboniumion in the reaction of lysozyme. J Mol Biol 1976;103:227–249.
8. Warshel A. Calculations of enzymatic reactions: calculations ofpKa, proton transfer reactions, and general acid catalysis reac-tions in enzymes. Biochemistry 1981;20:3167–3177.
9. Mehler EL, Fuxreiter M, Simon I, Garcia-Moreno EB. The role ofhydrophobic microenvironments in modulating pKa shifts in pro-teins. Proteins 2002;48:283–292.
10. Lambeir AM, Backmann J, Ruiz-Sanz J, Filimonov V, Nielsen JE,Kursula I, Norledge BV, Wierenga RK. The ionization of a buriedglutamic acid is thermodynamically linked to the stability ofLeishmania mexicana triose phosphate isomerase. Eur J Biochem2000;267:2516–2524.
11. Dwyer JJ, Gittis AG, Karp DA, Lattman EE, Spencer DS, StitesWE, Garcia-Moreno EB. High apparent dielectric constants in theinterior of a protein reflect water penetration. Biophys J 2000;79:1610–1620.
12. Lodi PJ, Knowles JR. Direct evidence for the exploitation of analpha-helix in the catalytic mechanism of triosephosphate isomer-ase. Biochemistry 1993;32:4338–4343.
13. Chivers PT, Prehoda KE, Volkman BF, Kim BM, Markley JL,Raines RT. Microscopic pKa values of Escherichia coli thioredoxin.Biochemistry 1997;36:14985–14991.
14. Kortemme T, Darby NJ, Creighton TE. Electrostatic interactionsin the active site of the N-terminal thioredoxin-like domain ofprotein disulfide isomerase. Biochemistry 1996;35:14503–14511.
15. Sali D, Bycroft M, Fersht AR. Stabilization of protein structure byinteraction of alpha-helix dipole with a charged side chain. Nature1988;335:740–743.
16. Forsyth WR, Antosiewicz JM, Robertson AD. Empirical relation-ships between protein structure and carboxyl pKa values inproteins. Proteins 2002;48:388–403.
17. Wada A. The alpha-helix as an electric macro-dipole. Adv Biophys1976;9:1–63.
18. Hol WG, van Duijnen PT, Berendsen HJ. The alpha-helix dipoleand the properties of proteins. Nature 1978;273:443–446.
19. Hol WG, Halie LM, Sander C. Dipoles of the alpha-helix andbeta-sheet: their role in protein folding. Nature 1981;294:532–536.
20. Garrett RH, Grisham CM. Biochemistry. Thomson Learning, Inc.;2005.
21. Fersht AR. Structure and mechanism in protein science. NewYork: W.H. Freeman and Company; 1998.
22. Nelson DL, Cox MM. Lehninger Principles of biochemistry. NewYork: W.H. Freeman; 2004.
23. Shoemaker KR, Kim PS, York EJ, Stewart JM, Baldwin RL. Testsof the helix dipole model for stabilization of alpha-helices. Nature1987;326:563–567.
24. Serrano L, Fersht AR. Capping and alpha-helix stability. Nature1989;342:296–299.
25. Nicholson H, Becktel WJ, Matthews BW. Enhanced proteinthermostability from designed mutations that interact with alpha-helix dipoles. Nature 1988;336:651–656.
26. Nicholson H, Anderson DE, Dao-Pin S, Matthews BW. Analysis ofthe interaction between charged side chains and the alpha-helixdipole using designed thermostable mutants of phage T4 ly-sozyme. Biochemistry 1991;30:9816–9828.
27. Lodi PJ, Knowles JR. Neutral imidazole is the electrophile in thereaction catalyzed by triosephosphate isomerase: structural ori-gins and catalytic implications. Biochemistry 1991;30:6948–6956.
28. Pflugrath JW, Quiocho FA. The 2 A resolution structure of thesulfate-binding protein involved in active transport in Salmonellatyphimurium. J Mol Biol 1988;200:163–180.
29. Jacobson BL, Quiocho FA. Sulfate-binding protein dislikes proton-ated oxyacids. A molecular explanation. J Mol Biol 1988;204:783–787.
30. Roux B, MacKinnon R. The cavity and pore helices in the KcsA K�channel: electrostatic stabilization of monovalent cations. Science1999;285:100–102.
31. Braun-Sand S, Warshel A. Electrostatics of proteins: principles,models and applications. In: Buchner J, Kiefhaber T, editors.Protein folding handbook part 1. New York: Wiley; 2005. p 163.
32. Hol WG. The role of the alpha-helix dipole in protein function andstructure. Prog Biophys Mol Biol 1985;45:149–195.
33. Lockhart DJ, Kim PS. Internal stark effect measurement of theelectric field at the amino terminus of an alpha helix. Science1992;257:947–951.
PROTEINS: Structure, Function, and Bioinformatics DOI 10.1002/prot
634 M.A. PORTER ET AL.
34. Aqvist J, Luecke H, Quiocho FA, Warshel A. Dipoles localized athelix termini of proteins stabilize charges. Proc Natl Acad Sci USA1991;88:2026–2030.
35. Gunner MR, Saleh MA, Cross E, ud-Doula A, Wise M. Backbonedipoles generate positive potentials in all proteins: origins andimplications of the effect. Biophys J 2000;78:1126–1144.
36. Takahashi T, Nakamura H, Wada A. Electrostatic forces in twolysozymes: calculations and measurements of histidine pKa val-ues. Biopolymers 1992;32:897–909.
37. Witkowski A, Joshi AK, Smith S. Mechanism of the beta-ketoacylsynthase reaction catalyzed by the animal fatty acid synthase.Biochemistry 2002;41:10877–10887.
38. Abe Y, Ueda T, Iwashita H, Hashimoto Y, Motoshima H, TanakaY, Imoto T. Effect of salt concentration on the pKa of acidicresidues in lysozyme. J Biochem (Tokyo) 1995;118:946–952.
39. Foloppe N, Sagemark J, Nordstrand K, Berndt KD, Nilsson L.Structure, dynamics and electrostatics of the active site of glutare-doxin 3 from Escherichia coli: comparison with functionallyrelated proteins. J Mol Biol 2001;310:449–470.
40. Miranda JJ. Position-dependent interactions between cysteineresidues and the helix dipole. Protein Sci 2003;12:73–81.
41. Li H, Robertson AD, Jensen JH. Very fast empirical predictionand rationalization of pKa values. Proteins Struct Funct Bioinfor-mat 2005;61:704–721.
42. Gilson MK. Introduction to continuum electrostatics, with molecu-lar applications. Biophysics Textbook; Online 2000.
43. Mehler EL, Guarnieri F. A self-consistent, microenvironmentmodulated screened coulomb potential approximation to calculate
pH-dependent electrostatic effects in proteins. Biophys J 1999;77:3–22.
44. Nielsen JE, Vriend G. Optimizing the hydrogen-bond network inPoisson-Boltzmann equation-based pK(a) calculations. Proteins2001;43:403–412.
45. Jensen JH, Li H, Robertson A, Molina PA. Prediction and rational-ization of protein pKa values using QM and QM/MM methods. JPhys Chem A 2005;109:6634–6643.
46. Schmidt MW, Baldridge KK, Boatz JA, Elbert ST, Gordon MS,Jensen JH, Koseki S, Matsunaga N, Nguyen KA, Su SJ, WindusTL, Dupuis M, Montgomery JA. General atomic and molecularelectronic structure system. J Comput Chem 1993;14:1347–1363.
47. PQS version 2.4 PQS, Fayetteville, AR.48. http://www.cmbi.kun.nl/gv/servers/WIWWWI/.49. McQuarrie D. Statistical thermodynamics. Mill Valley, CA: Uni-
versity Science Books; 1973.50. Kumar S, Bansal M. Dissection alpha-helices: position-specific
analysis of alpha-helices in globular proteins. Proteins 1998;31:460–476.
51. Engel DE, DeGrado WF. Amino acid propensities are position-dependent throughout the length of alpha-helices. J Mol Biol2004;337:1195–1205.
52. Richardson JS, Richardson DC. Amino acid preferences for spe-cific locations at the ends of alpha helices. Science 1988;240:1648–1652.
53. Spassov VZ, Ladenstein R, Karshikoff AD. Optimization of theelectrostatic interactions between ionized groups and peptidedipoles in proteins. Protein Sci 1997;6:1190–1196.
PROTEINS: Structure, Function, and Bioinformatics DOI 10.1002/prot
HYDROGEN BONDING AND CARBOXYL PKA VALUES 635