Human Intestinal Microbiota Gene Risk Factors for Antibiotic-Associated Diarrhea: Perspectives for...
21
1 Human intestinal microbiota gene risk factors for antibiotic-associated diarrhea: 1 perspectives for prevention 2 Marie-France de La Cochetière¹*, Emmanuel Montassier 4 , Jean-Benoit Hardouin 5 , Thomas 3 Carton 4 , Françoise Le Vacon 3 , Tony Durand 4 , Valerie Lalande 2 , Jean Claude Petit 2 , Gilles 4 Potel 4 , Laurent Beaugerie 2 . 5 6 1 INSERM, Université de Nantes, UFR Médecine, Thérapeutiques Cliniques et 7 Expérimentales des Infections, EA 3826, rue G. Veil, Nantes, F-44000 France. 8 2 Service de Gastro-entérologie et Nutrition, Hôpital Saint-Antoine, 184 rue du faubourg 9 Saint-Antoine, 75012 Paris Cedex, France. 10 3 Atlangene ® -Silliker, Bio Ouest, Ile de Nantes, 21 rue La Noue Bras de Fer, 44200 Nantes, 11 France 12 4 Université de Nantes, UFR Médecine, Thérapeutiques Cliniques et Expérimentales des 13 Infections, EA 3826, rue G. Veil, Nantes, F-44000 France. 14 5 Université de Nantes, UFR Médecine et Pharmacie, Biostatistics Clinical Research and 15 Subjective Measures in Health Sciences , EA 4275, rue G. Veil, Nantes, F-44000 France. 16 17 Running title: Diarrhea risk prediction from microbiota genes 18 19 *Corresponding author Dr. MF de La Cochetière Mailing address: UPRES EA 3826, UFR 20 de Médecine, 1 rue Gaston Veil, 44035 Nantes, cedex 01, France. Phone 33 (0)240412840, 21 Fax 33(0)240412854. E-mail [email protected] 22 23 Financial support: Biocodex Inc 24 25 26 inserm-00462416, version 1 - 9 Mar 2010 Author manuscript, published in "Microbial Ecology 2010;59(4):830-7" DOI : 10.1007/s00248-010-9637-2
Transcript of Human Intestinal Microbiota Gene Risk Factors for Antibiotic-Associated Diarrhea: Perspectives for...

1
Human intestinal microbiota gene risk factors for antibiotic-associated diarrhea: 1
perspectives for prevention 2
Marie-France de La Cochetière¹*, Emmanuel Montassier4, Jean-Benoit Hardouin
5, Thomas 3
Carton4, Françoise Le Vacon
3, Tony Durand
4, Valerie Lalande
2, Jean Claude Petit
2, Gilles 4
Potel4, Laurent Beaugerie
2. 5
6
1INSERM, Université de Nantes, UFR Médecine, Thérapeutiques Cliniques et 7
Expérimentales des Infections, EA 3826, rue G. Veil, Nantes, F-44000 France. 8
2Service de Gastro-entérologie et Nutrition, Hôpital Saint-Antoine, 184 rue du faubourg 9
Saint-Antoine, 75012 Paris Cedex, France. 10
3Atlangene
®-Silliker, Bio Ouest, Ile de Nantes, 21 rue La Noue Bras de Fer, 44200 Nantes, 11
France 12
4Université de Nantes, UFR Médecine, Thérapeutiques Cliniques et Expérimentales des 13
Infections, EA 3826, rue G. Veil, Nantes, F-44000 France. 14
5 Université de Nantes, UFR Médecine et Pharmacie, Biostatistics Clinical Research and 15
Subjective Measures in Health Sciences , EA 4275, rue G. Veil, Nantes, F-44000 France. 16
17
Running title: Diarrhea risk prediction from microbiota genes 18
19
*Corresponding author Dr. MF de La Cochetière Mailing address: UPRES EA 3826, UFR 20
de Médecine, 1 rue Gaston Veil, 44035 Nantes, cedex 01, France. Phone 33 (0)240412840, 21
Fax 33(0)240412854. E-mail [email protected] 22
23
Financial support: Biocodex Inc 24
25
26
inse
rm-0
0462
416,
ver
sion
1 -
9 M
ar 2
010
Author manuscript, published in "Microbial Ecology 2010;59(4):830-7" DOI : 10.1007/s00248-010-9637-2

2
27
Abstract 28
Antibiotic-associated diarrhea (AAD) is associated with altered intestinal microflora and other 29
symptoms that may lead to possibly death. In critically ill patients, diarrhea increases rates of 30
morbimortality. Assessing diarrhea risks is thus important for clinicians. For this reason, we 31
conducted a hypothesis-generating study focused on antibiotic-associated diarrhea (AAD) to 32
provide insight into methods of prevention. We evaluated the hypothesis of predisposing 33
factors within the resident intestinal microbiota in a cohort of outpatients receiving 34
antibiotherapy. Among the pool of tested variables, only those related to bacterial 16S rRNA 35
genes were found to be relevant. Complex statistical analyses provided further information: 36
amid the bacteria 16S rRNA genes, eight were determined to be essential for diarrhea 37
predisposition and characterized from the most important to the least. Using these markers, 38
AAD risk could be estimated with an error of 2%. This molecular analysis offers new 39
perspectives for clinical applications at the level of prevention. 40
41
Key words: Data-Mining/Diarrhea/Microbiota genes/Prevention/Risk factors 42
43
44
45 46
47
48
49
50
51
52
53
54
55
56
57
58
59
60
61
62
inse
rm-0
0462
416,
ver
sion
1 -
9 M
ar 2
010

3
Introduction 63
The collective effects of the intestinal microbiota are dictated by a complex network of 64
interactions that span the cellular, immunological, and environmental levels. A primary 65
question is whether a simple system can be applied to predict and control the effects of this 66
heterogeneous population composed of different subgroups. One approach in addressing this 67
question is to study representative genes that correlate with the health consequences of the 68
bacteria mixture comprising the microbiota. The present study concerns specific bacterial 69
populations associated with antibiotic-associated diarrhea (AAD). This hypothesis-generating 70
experiment was conducted to discern whether an analysis of bacterial 16S rRNA genes from 71
pre-antibiotic resident faecal microbiota using with complex statistics could predict the 72
collective effects of the intestinal microbiota, thereby identifying individual risk factors for 73
diarrhea associated with antibiotic treatment. These specific gene sequences have been chosen 74
because they have been the far most common genetic marker used (16). 75
Antibiotic-associated diarrhea (AAD) is associated with altered intestinal microflora, 76
mucosal integrity, vitamin, mineral metabolism and crampy abdominal pain. If severe, AAD 77
may lead to electrolyte disturbances, dehydration, premature discontinuation of antibiotic 78
therapy, pseudomembranous colitis, toxic megacolon and possibly death. Reports in the 79
general population indicate that the incidence of AAD ranges from 25 to 62%, occurring at 80
any point from the initiation of therapy to two months after the end of treatment (2, 17). In 81
critically ill patients, diarrhea increases morbimortabilty. AAD leads also to longer hospital 82
stays and higher medical costs (1, 26, 27). The pathogenesis of AAD may be mediated 83
through the disruption of the normal microbiota and overgrowth of pathogens, or through 84
metabolic imbalances (3, 31). The individual risk for AAD varies greatly, influenced by host 85
factors (age or diet), and type, dose, and duration of antibiotherapy (15, 22). Assessment of 86
inse
rm-0
0462
416,
ver
sion
1 -
9 M
ar 2
010
4
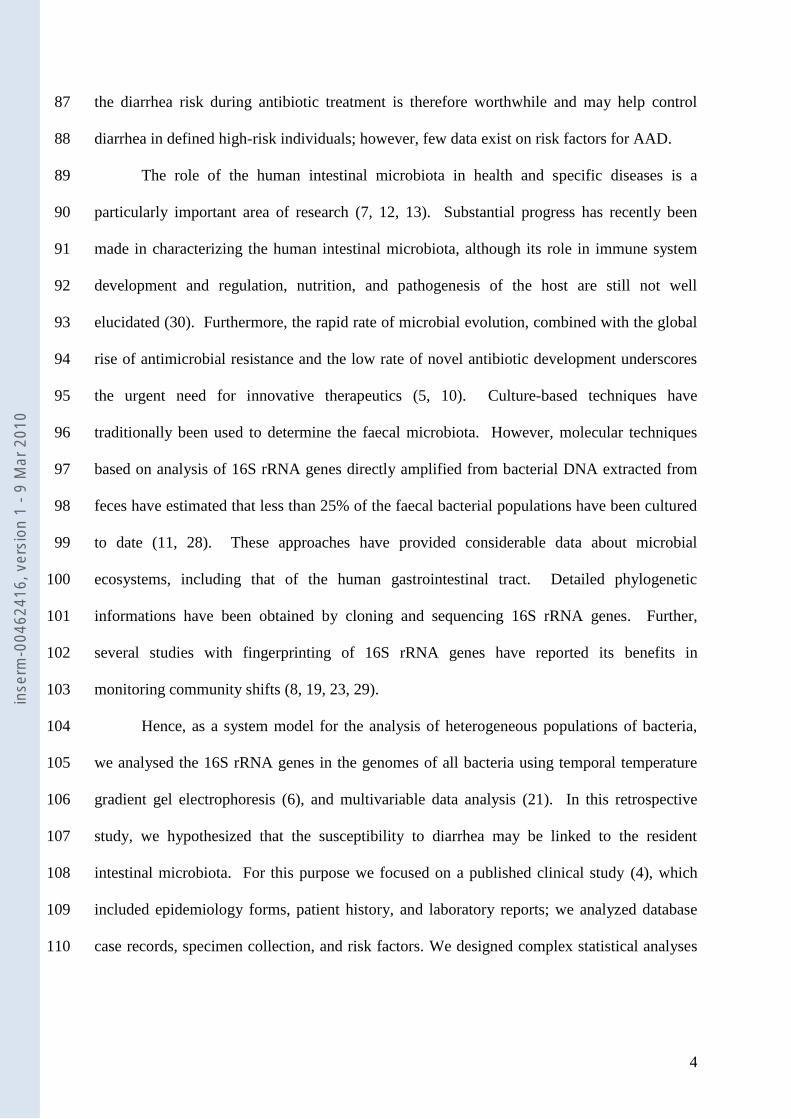
the diarrhea risk during antibiotic treatment is therefore worthwhile and may help control 87
diarrhea in defined high-risk individuals; however, few data exist on risk factors for AAD. 88
The role of the human intestinal microbiota in health and specific diseases is a 89
particularly important area of research (7, 12, 13). Substantial progress has recently been 90
made in characterizing the human intestinal microbiota, although its role in immune system 91
development and regulation, nutrition, and pathogenesis of the host are still not well 92
elucidated (30). Furthermore, the rapid rate of microbial evolution, combined with the global 93
rise of antimicrobial resistance and the low rate of novel antibiotic development underscores 94
the urgent need for innovative therapeutics (5, 10). Culture-based techniques have 95
traditionally been used to determine the faecal microbiota. However, molecular techniques 96
based on analysis of 16S rRNA genes directly amplified from bacterial DNA extracted from 97
feces have estimated that less than 25% of the faecal bacterial populations have been cultured 98
to date (11, 28). These approaches have provided considerable data about microbial 99
ecosystems, including that of the human gastrointestinal tract. Detailed phylogenetic 100
informations have been obtained by cloning and sequencing 16S rRNA genes. Further, 101
several studies with fingerprinting of 16S rRNA genes have reported its benefits in 102
monitoring community shifts (8, 19, 23, 29). 103
Hence, as a system model for the analysis of heterogeneous populations of bacteria, 104
we analysed the 16S rRNA genes in the genomes of all bacteria using temporal temperature 105
gradient gel electrophoresis (6), and multivariable data analysis (21). In this retrospective 106
study, we hypothesized that the susceptibility to diarrhea may be linked to the resident 107
intestinal microbiota. For this purpose we focused on a published clinical study (4), which 108
included epidemiology forms, patient history, and laboratory reports; we analyzed database 109
case records, specimen collection, and risk factors. We designed complex statistical analyses 110
inse
rm-0
0462
416,
ver
sion
1 -
9 M
ar 2
010

5
to determine the optimal procedures for providing the maximum relevant information with 111
fingerprint data, and obtaining knowledge about the 16S rRNA gene system. 112
113
Methods 114
Patients. Subjects enrolled in this study were adults (age range, 20-60 years) living in 115
the Paris area. Subjects were prescribed a course of antimicrobial therapy for an ear, nose, or 116
throat infection. Criteria for enrollment included prescription by a general practitioner for a 117
5-to 10-day course of antibiotics and age of 18 years or older. Potential candidates were 118
excluded if they were institutionalized, had received antibiotic treatment during the previous 2 119
months, had been admitted to a hospital during the previous 6 months, had a known human 120
immunodeficiency virus infection, had any allergy, or had experienced a bout of diarrhea (>2 121
loose stools/day) the day before enrollment. All patients provided informed written consent. 122
Prescribed antibiotics were classified into one of the following groups: amoxicillin/clavulanic 123
acid, other beta-lactam agents, or non-beta-lactam agents. Diarrhea was defined as the 124
passage of at least three loose stools a day, AAD was defined as diarrhea associated with the 125
administration of antibiotics (in the absence of any other obvious reason) during the 14-day 126
study period. Each patient was asked to store the last stool before the beginning of the 127
antibiotherapy (D0) in a double-thickness container. The dominant microbiota profile at D0 128
was considered to be patient’s profile at equilibrium (i.e., the resident microbiota). In 129
addition to the molecular study, bacteriological investigations were performed according to 130
standardized procedures. 131
DNA isolation and 16S rRNA gene amplification. Immediately after faecal sample 132
collection, total DNA was extracted from a 125-mg aliquot and purified as previously 133
described (9). DNA (0.23 ± 0.1 µg/µl) was obtained from all samples. The DNA integrity 134
and concentration (size, >21kb) were determined by 1.5% agarose gel electrophoresis with 135
inse
rm-0
0462
416,
ver
sion
1 -
9 M
ar 2
010

6
ethidium bromide. Isolated DNA was subsequently used as a template to amplify the V6 to 136
V8 regions of the bacterial 16S rRNA gene with primers U968-GC and L1401 (32). 137
Contamination and amplification controls were performed at each steps as previously 138
described (9). 139
TTGE analysis of PCR amplicons. The Dcode universal mutation detection system 140
(Bio-Rad, Paris, France) was used for sequence-specific separation of PCR products as 141
previously described. After electrophoresis, the gel was stained and analyzed using Quantity 142
One software of the Gel Doc 2000 gel documentation system (Bio-Rad, Paris, France). 143
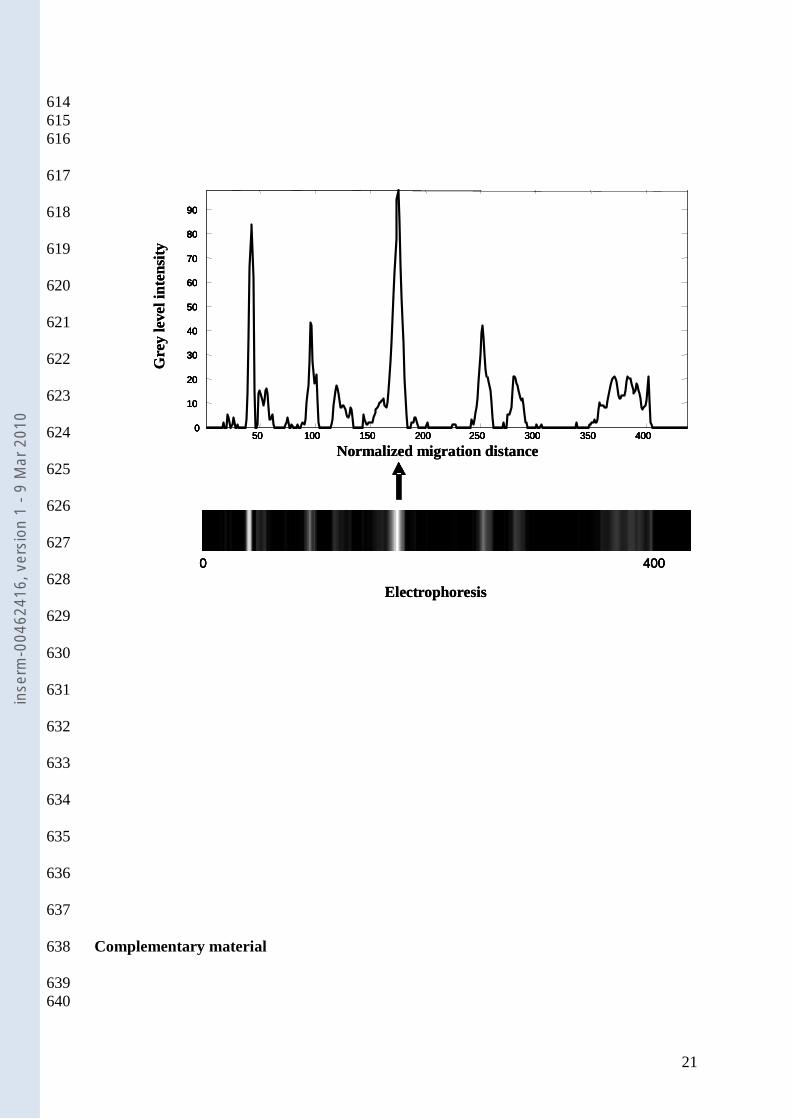
TTGE gel analysis. Each grey band of the TTGE gels was considered an amplicon of 144
the 16S rRNA gene. To simplify analysis, we used zones of the electrophoretic gels to 145
describe the migration distances representing individual 16S rRNA genes. TTGE profiles 146
were compared by using Gel Compare II software (Applied-Maths, Sint-Martens–Latem, 147
Belgium). The analysis took into account the number of bands, their positions on the gel, and 148
their intensities. Gray intensities were then recorded along a densitogram, with each band 149
given rise to a distinct peak. Thus each electrophoresis pattern was represented by a curve 150
defined as grey intensity = function (normalized migration distance). A marker consisting of a 151
mixture of PCR amplicons (seven cloned 16S rRNA genes from different bacterial species) 152
was used to normalize the profiles as previously described (9). Similarity coefficients 153
(Pearson correlation method) were calculated for each profile, yielding a similarity matrix. A 154
dendrogram was constructed from this matrix using the UPGMA algorithm (unweighted pair 155
group method using arithmetic averages). 156
Data collection. The acquired data from all D0 electrophoresis gels were collected as 157
147 retention times that resulted from digitizing each electrophoresis at equal distance 158
intervals. Each patient was also characterized by qualitative features related to age, sex, 159
inse
rm-0
0462
416,
ver
sion
1 -
9 M
ar 2
010

7
therapy and the eventual presence of AAD. The ages were recoded into seven classes (from 160
ages 20-29 to 80-89). AAD was represented by two groups (absence or presence). 161
162
Multivariable data-analysis 163
Two analyses of the data has been carried out in order to detect retentions times predictive of 164
the AAD: ANOVA which compare the mean values at each retention times between the two 165
groups, and discriminant analysis which allows to detect the more important retention times to 166
predict AAD. 167
Analysis of variances. Each of the 147 retention times was explained by a four-way 168
analysis of variance (ANOVA) including age, sex, therapy and AAD as independent 169
variables. The aim of these analysis was to detect the retention times where there was 170
significant differences between the two groups of patients (absence or presence of AAD), by 171
adjusting the analysis on clinical variables (age, sex and therapy). 172
In order to take into account the multiplicity of the tests, the F statistics associated to 173
absence/presence of AAD of the ANOVA were compared to the value obtained with the 174
following process: 10000 simulated datasets were generated by using the observed retention 175
times and by simulating the factors age, sex, therapy and presence/absence of AAD with the 176
same distributions than these ones observed in the sample independently of the retention 177
times. The retained threshold for the F statistics (referenced as threshold F value) was the 178
value of the F where 5% of the simulated datasets were above. This threshold corresponds to 179
the 5% significant level obtained by chance. Only the retention times where the corresponding 180
F values are above this threshold are retained as significantly predictive of the AAD. 181
Discriminant analysis. A discriminant analysis was carried out in order to detect 182
retention times which allow predicting the AAD for the patients. Forward selection of the 183
retention times was realized: At each step, the retention time which allows improving the 184
inse
rm-0
0462
416,
ver
sion
1 -
9 M
ar 2
010

8
more the clustering of the patients in the two groups (correct clustering between 185
absence/presence of AAD) is introduced in the analysis, until there is no more possible 186
improvement of the clustering. 187
188
189
Results 190
Among the 156 patients included in the study, 44 developed an AAD. None of the 44 191
patients with diarrhea had stool culture positive for the tested intestinal pathogens Salmonella 192
spp., Shigella spp., Campylobacter spp. and Yersinia spp.); however, six patients acquired 193
Clostridium difficile. 194
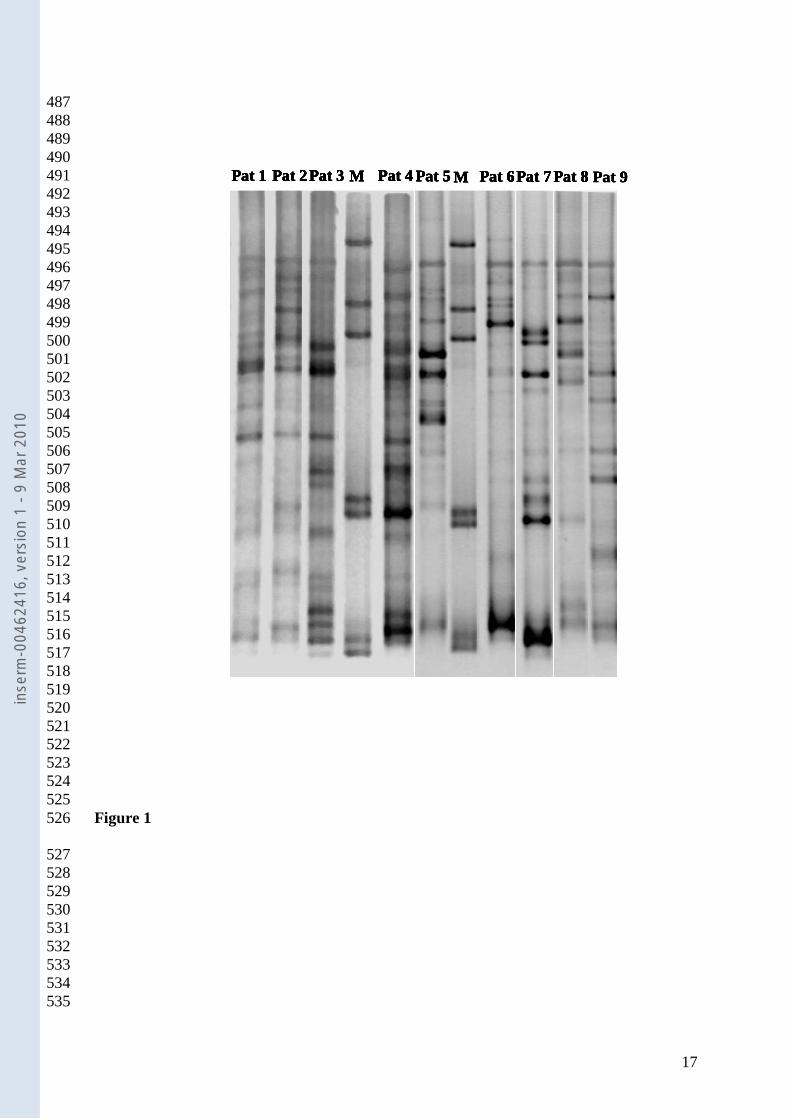
TTGE gel analysis. From DNA extracted from D0 stool samples (before 195
antibiotherapy) 156 TTGE profiles were analyzed. The banding pattern was complex in all 196
cases (Figure 1), the number of bands ranged from 10 to 20. The dendrogram analysis 197
(unweighted pair group method with arithmetic mean (UPGMA) dendrogram not presented 198
here) showed that the TTGE profiles did not cluster according to the onset of AAD. These 199
results corroborate that, for each individual, microbial diversity and composition are specific 200
traits (20). Thus, the need for extra complex analyses is pointed out in order to find any 201
grouping within the microbiota profiles, before treatment. 202
Multivariable data-analysis: Using multivariate data analysis techniques to determine 203
potential causal factors for AAD, we found that only D0 microbiota profiles were strongly 204
correlated with AAD. In this study, other factors (age, sex, and class of antibiotic) were not 205
relevant, thus we focused on the intestinal bacterial 16S rRNA genes: each TTGE profile was 206
converted into a curve, then digitized and further analysed to convert 16S rRNA genes to 207
numerical data (see complementary material). We applied advanced multivariate analysis to 208
confirm any predictive signature of the intestinal microbiota. 209
inse
rm-0
0462
416,
ver
sion
1 -
9 M
ar 2
010

9
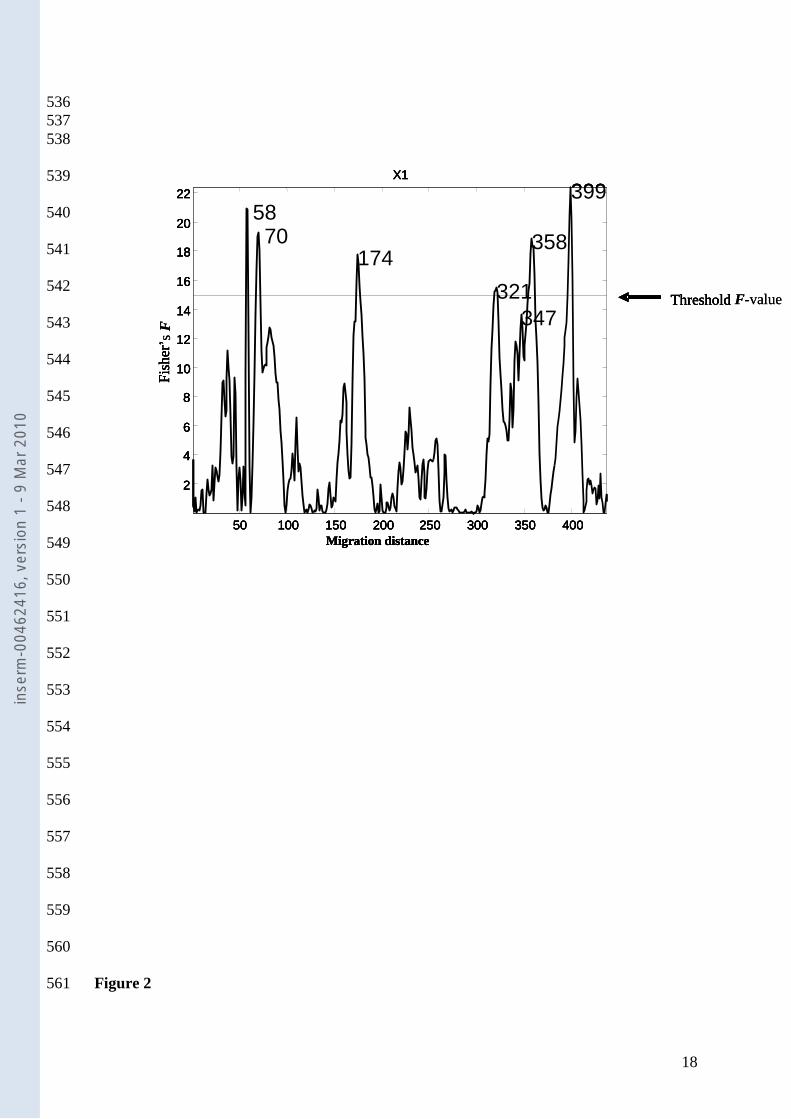
Variance analysis. Figure 2 shows the F- value of ANOVA carried out independently at each 210
data point of each electrophoresis at D0. The studied factor was the presence/absence of AAD 211
after antibiotherapy. Six electrophoresis migration distance values were found exceed the 212
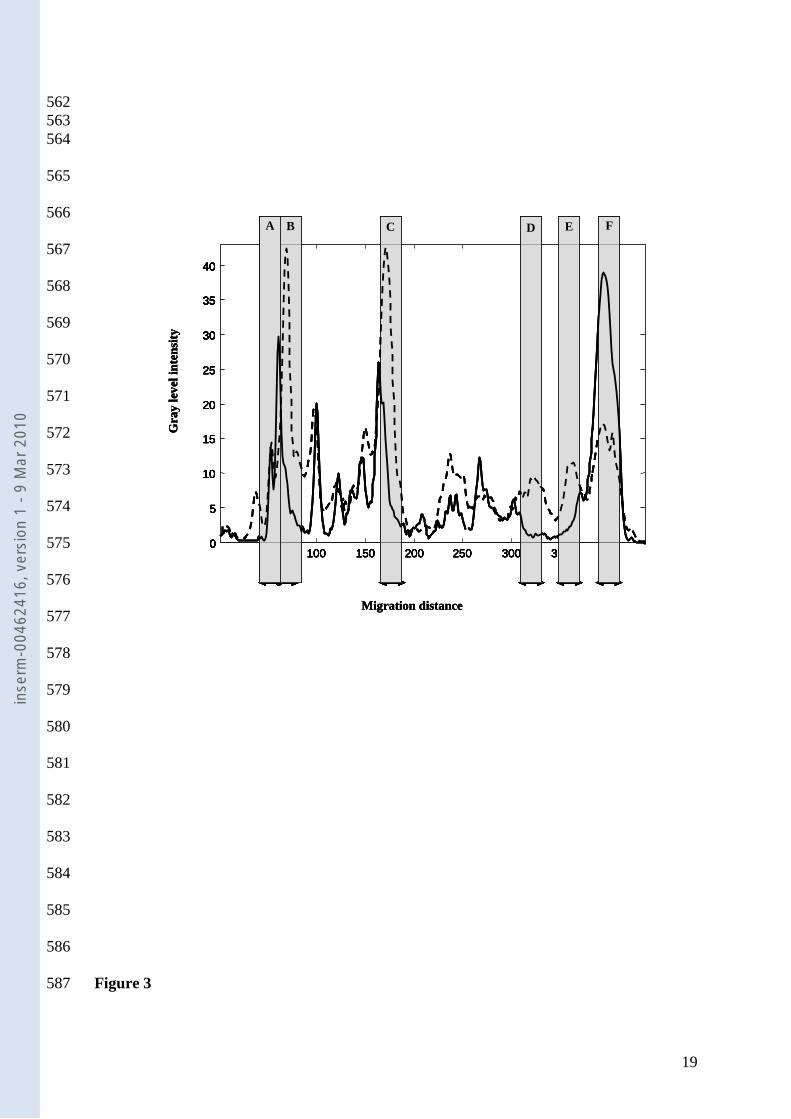
threshold F-value: (A) 58, (B) 70, (C) 174, (D) 321, (E) 358 and (F) 399. Figure 3 shows the 213
mean electrophoresis migration patterns associated with the absence and presence of AAD: 214
significant regions are emphasized using a grey color. Zones A and F are correlated to the 215
microbiota of patients with AAD, and zones B, C, D, and E are correlated to the microbiota of 216
patients without AAD. 217
Discriminant analysis. Six retention times explaining the absence/presence of AAD have 218
been selected by the forward selection of the variables for the discriminant analysis (FLDA). 219
These 6 variables allow clustering 142 among the 156 patients (91%) in the correct group. 220
221
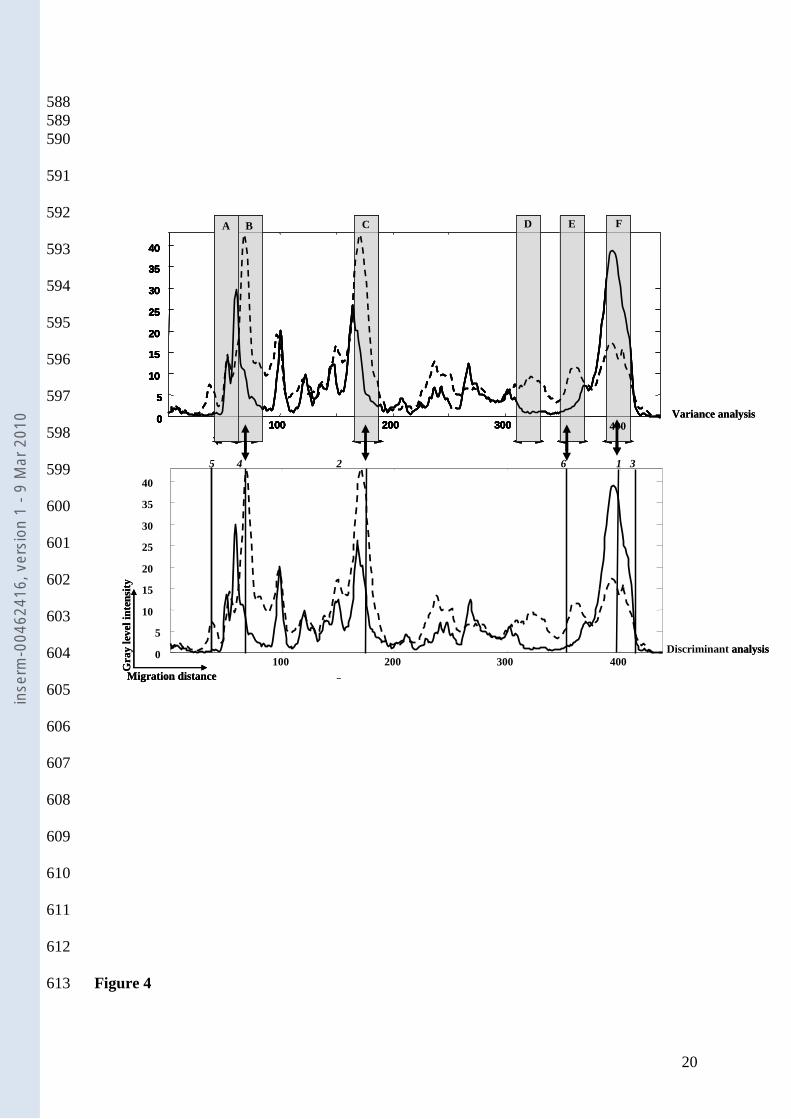
Individual risk prediction of AAD from resident intestinal microbiota. Figure 4 222
demonstrates the degree of agreement between ANOVA and FLDA. Four of the first six 223
variables selected by the discriminant analysis were also identified by ANOVA, producing 224
distinct profiles for AAD and no AAD. The risk prediction for any new case of AAD could 225
be calculated from its intestinal microbiota gene fingerprinting with an error of 2% in the case 226
of AAD (1/44) and 11% (12/112) in the case of no AAD. 227
228
Discussion 229
Predicting and controlling the effects of a heterogeneous bacteria population is a 230
highly challenging task with many biological and clinical applications. To study this 231
question, we evaluated relationships between intestinal bacterial 16S rRNA genes and AAD, 232
which is a growing health concern. Why some patients develop AAD while others do not is a 233
recurrent and unresolved question. This paper describes for the first time a computational 234
inse
rm-0
0462
416,
ver
sion
1 -
9 M
ar 2
010
10
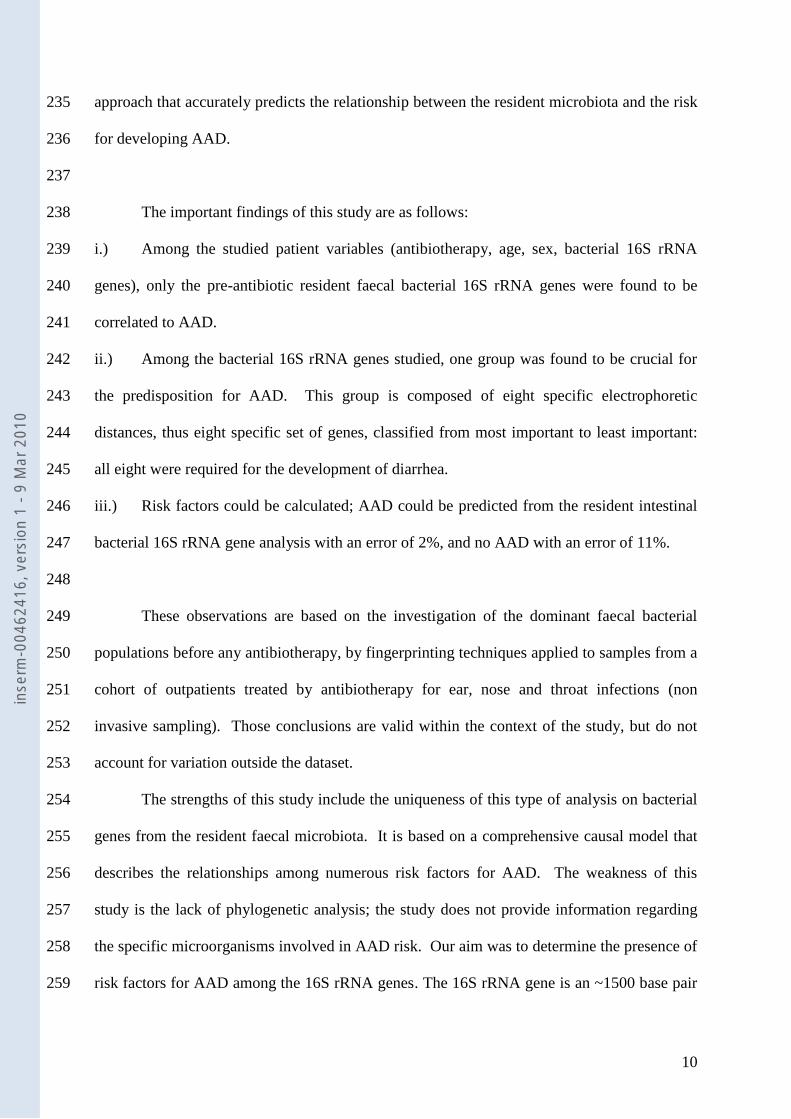
approach that accurately predicts the relationship between the resident microbiota and the risk 235
for developing AAD. 236
237
The important findings of this study are as follows: 238
i.) Among the studied patient variables (antibiotherapy, age, sex, bacterial 16S rRNA 239
genes), only the pre-antibiotic resident faecal bacterial 16S rRNA genes were found to be 240
correlated to AAD. 241
ii.) Among the bacterial 16S rRNA genes studied, one group was found to be crucial for 242
the predisposition for AAD. This group is composed of eight specific electrophoretic 243
distances, thus eight specific set of genes, classified from most important to least important: 244
all eight were required for the development of diarrhea. 245
iii.) Risk factors could be calculated; AAD could be predicted from the resident intestinal 246
bacterial 16S rRNA gene analysis with an error of 2%, and no AAD with an error of 11%. 247
248
These observations are based on the investigation of the dominant faecal bacterial 249
populations before any antibiotherapy, by fingerprinting techniques applied to samples from a 250
cohort of outpatients treated by antibiotherapy for ear, nose and throat infections (non 251
invasive sampling). Those conclusions are valid within the context of the study, but do not 252
account for variation outside the dataset. 253
The strengths of this study include the uniqueness of this type of analysis on bacterial 254
genes from the resident faecal microbiota. It is based on a comprehensive causal model that 255
describes the relationships among numerous risk factors for AAD. The weakness of this 256
study is the lack of phylogenetic analysis; the study does not provide information regarding 257
the specific microorganisms involved in AAD risk. Our aim was to determine the presence of 258
risk factors for AAD among the 16S rRNA genes. The 16S rRNA gene is an ~1500 base pair 259
inse
rm-0
0462
416,
ver
sion
1 -
9 M
ar 2
010
11
gene that codes for a portion of the 30S ribosome. Partial (500-base pair) 16S rRNA gene 260
sequencing has emerged as an accurate method to identify a wide variety of bacteria and has 261
been successfully implemented in clinical laboratories (24, 25). A major limitation of the 16S 262
rRNA gene sequencing, though, is its inability to discriminate among all bacterial taxa. In that 263
case alternative gene targets can provide better separation of closely related species (e.g. rpoB 264
gene) (18) . However, in this work, the aim was not to identify bacteria, although it looks 265
rather frustrating not to. Ultimately, the goal is to associate differences in communities with 266
differences in metabolic function and/or disease (AAD). Thus these work and the results 267
explain here, stand as one first step toward it. Therefore, the findings of this study are being 268
used for further work on the impact of the resident microbiota. Then, in-depth phylogenetic 269
analysis of the microbiota will be needed and preventing strategies developed. 270
We started with the assumption of a predictive signature of the microbiota. The 271
statistical analysis shows significant differences in the migration patterns between the two 272
groups (absence/presence of AAD). Moreover, this analysis shows that the AAD can be 273
correctly predicted with data based exclusively on migration distances. As a consequence, it 274
can be conclude that the nature of the microbiota before antibiotherapy may play a role in 275
AAD. 276
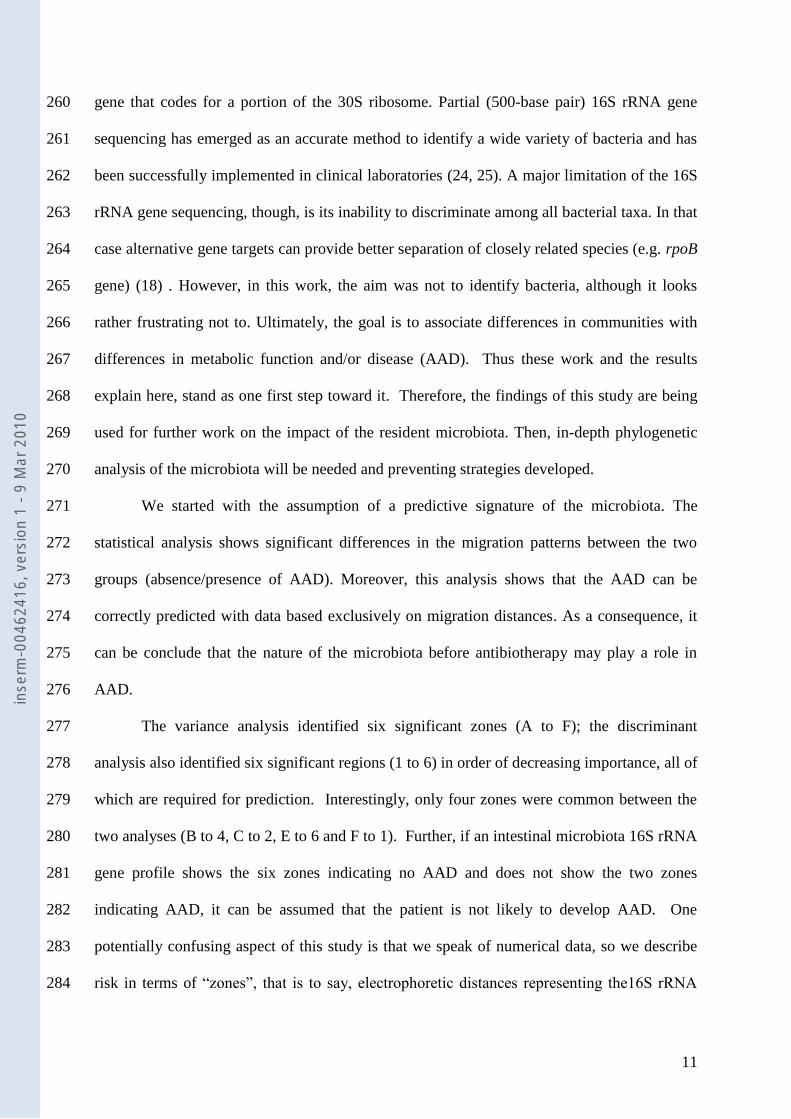
The variance analysis identified six significant zones (A to F); the discriminant 277
analysis also identified six significant regions (1 to 6) in order of decreasing importance, all of 278
which are required for prediction. Interestingly, only four zones were common between the 279
two analyses (B to 4, C to 2, E to 6 and F to 1). Further, if an intestinal microbiota 16S rRNA 280
gene profile shows the six zones indicating no AAD and does not show the two zones 281
indicating AAD, it can be assumed that the patient is not likely to develop AAD. One 282
potentially confusing aspect of this study is that we speak of numerical data, so we describe 283
risk in terms of “zones”, that is to say, electrophoretic distances representing the16S rRNA 284
inse
rm-0
0462
416,
ver
sion
1 -
9 M
ar 2
010
12
genes. The next area of study will be to determine to which extend they are associated to 285
phylogenetic species. 286
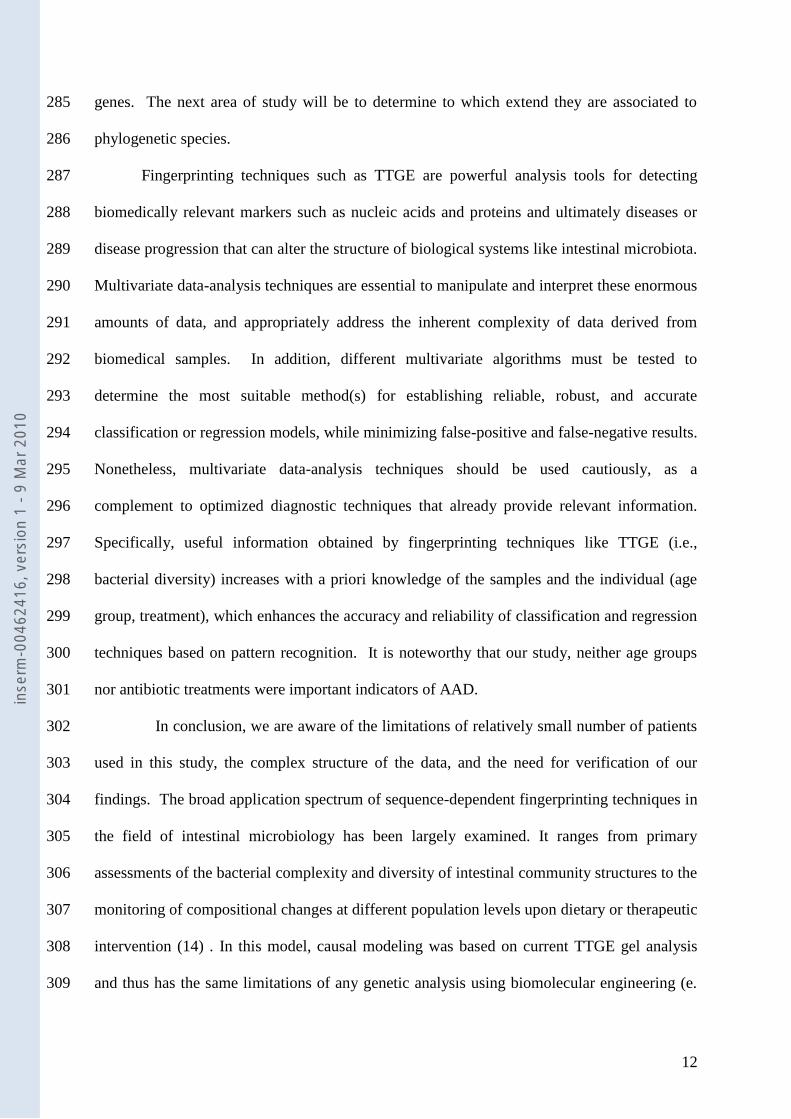
Fingerprinting techniques such as TTGE are powerful analysis tools for detecting 287
biomedically relevant markers such as nucleic acids and proteins and ultimately diseases or 288
disease progression that can alter the structure of biological systems like intestinal microbiota. 289
Multivariate data-analysis techniques are essential to manipulate and interpret these enormous 290
amounts of data, and appropriately address the inherent complexity of data derived from 291
biomedical samples. In addition, different multivariate algorithms must be tested to 292
determine the most suitable method(s) for establishing reliable, robust, and accurate 293
classification or regression models, while minimizing false-positive and false-negative results. 294
Nonetheless, multivariate data-analysis techniques should be used cautiously, as a 295
complement to optimized diagnostic techniques that already provide relevant information. 296
Specifically, useful information obtained by fingerprinting techniques like TTGE (i.e., 297
bacterial diversity) increases with a priori knowledge of the samples and the individual (age 298
group, treatment), which enhances the accuracy and reliability of classification and regression 299
techniques based on pattern recognition. It is noteworthy that our study, neither age groups 300
nor antibiotic treatments were important indicators of AAD. 301
In conclusion, we are aware of the limitations of relatively small number of patients 302
used in this study, the complex structure of the data, and the need for verification of our 303
findings. The broad application spectrum of sequence-dependent fingerprinting techniques in 304
the field of intestinal microbiology has been largely examined. It ranges from primary 305
assessments of the bacterial complexity and diversity of intestinal community structures to the 306
monitoring of compositional changes at different population levels upon dietary or therapeutic 307
intervention (14) . In this model, causal modeling was based on current TTGE gel analysis 308
and thus has the same limitations of any genetic analysis using biomolecular engineering (e. 309
inse
rm-0
0462
416,
ver
sion
1 -
9 M
ar 2
010

13
g. DNA extraction, amplification). Therefore, it is possible that not all possible confounders 310
are represented in the models, and some factors that are designated as no confounders might 311
actually be so. Additional population-based studies with multivariable analyses structured on 312
causal models are required to confirm the findings of this study. In addition, this study was 313
primarily a hypothesis-generating study of resident microbiota genes, which utilized ever-314
improving molecular techniques and analyses, and demonstrates that important part of risk 315
factors for AAD can be found within the individual microbiome. As such, it offers new 316
perspectives for clinical applications at the level of prevention. 317
318
319
320
321
322
323
Acknowledgments: 324
We thank Dr Bertrand D. from INRA, Unité de Sensometrie-Chimiometrie (Nantes, France) 325
for his assistance in this investigation. 326
Financial support: Biocodex, Inc. 327
Potential conflicts of interest: The authors declare no conflict of interest 328
329
330
331
332
333
334
inse
rm-0
0462
416,
ver
sion
1 -
9 M
ar 2
010

14
References 335
1. Arbuckle, R. B., S. L. Huber, and C. Zacker. 2000. The consequences 336 of diarrhea occurring during chemotherapy for colorectal cancer: a 337 retrospective study. Oncologist 5:250-9. 338
2. Bartlett, J. G. 2002. Clinical practice. Antibiotic-associated 339 diarrhea. N Engl J Med 346:334-9. 340
3. Bartlett, J. G. 2002. Clostridium difficile-associated Enteric 341 Disease. Curr Infect Dis Rep 4:477-483. 342
4. Beaugerie, L., A. Flahault, F. Barbut, P. Atlan, V. Lalande, P. 343 Cousin, M. Cadilhac, and J. C. Petit. 2003. Antibiotic-associated 344 diarrhoea and Clostridium difficile in the community. Aliment 345 Pharmacol Ther 17:905-12. 346
5. Blakelock, R. T., and S. W. Beasley. 2003. Infection and the gut. 347 Semin Pediatr Surg 12:265-74. 348
6. Bosshard, P. P., S. Abels, R. Zbinden, E. C. Bottger, and M. Altwegg. 349 2003. Ribosomal DNA sequencing for identification of aerobic gram-350 positive rods in the clinical laboratory (an 18-month evaluation). J 351 Clin Microbiol 41:4134-40. 352
7. Collier, C. T., C. L. Hofacre, A. M. Payne, D. B. Anderson, P. 353 Kaiser, R. I. Mackie, and H. R. Gaskins. 2008. Coccidia-induced 354 mucogenesis promotes the onset of necrotic enteritis by supporting 355 Clostridium perfringens growth. Vet Immunol Immunopathol 122:104-15. 356
8. De La Cochetiere, M. F., T. Durand, V. Lalande, J. C. Petit, G. 357 Potel, and L. Beaugerie. 2008. Effect of Antibiotic Therapy on Human 358 Fecal Microbiota and the Relation to the Development of Clostridium 359 difficile. Microb Ecol. 360
9. De La Cochetiere, M. F., H. Piloquet, C. des Robert, D. Darmaun, J. 361 P. Galmiche, and J. C. Roze. 2004. Early intestinal bacterial 362 colonization and necrotizing enterocolitis in premature infants: the 363 putative role of Clostridium. Pediatr Res 56:366-70. 364
10. Dethlefsen, L., S. Huse, M. L. Sogin, and D. A. Relman. 2008. The 365 pervasive effects of an antibiotic on the human gut microbiota, as 366 revealed by deep 16S rRNA sequencing. PLoS Biol 6:e280. 367
11. Eckburg, P. B., E. M. Bik, C. N. Bernstein, E. Purdom, L. Dethlefsen, 368 M. Sargent, S. R. Gill, K. E. Nelson, and D. A. Relman. 2005. 369 Diversity of the human intestinal microbial flora. Science 308:1635-370 8. 371
12. Hooper, L. V., M. H. Wong, A. Thelin, L. Hansson, P. G. Falk, and J. 372 I. Gordon. 2001. Molecular analysis of commensal host-microbial 373 relationships in the intestine. Science 291:881-4. 374
13. Hrncir, T., R. Stepankova, H. Kozakova, T. Hudcovic, and H. 375 Tlaskalova-Hogenova. 2008. Gut microbiota and lipopolysaccharide 376 content of the diet influence development of regulatory T cells: 377 studies in germ-free mice. BMC Immunol 9:65. 378
14. Huys, G., T. Vanhoutte, and P. Vandamme. 2008. Application of 379 sequence-dependent electrophoresis fingerprinting in exploring 380 biodiversity and population dynamics of human intestinal microbiota: 381 what can be revealed? Interdiscip Perspect Infect Dis 2008:597603. 382
15. Iapichino, G., M. L. Callegari, S. Marzorati, M. Cigada, D. Corbella, 383 S. Ferrari, and L. Morelli. 2008. Impact of antibiotics on the gut 384 microbiota of critically ill patients. J Med Microbiol 57:1007-14. 385
16. Janda, J. M., and S. L. Abbott. 2007. 16S rRNA gene sequencing for 386 bacterial identification in the diagnostic laboratory: pluses, 387 perils, and pitfalls. J Clin Microbiol 45:2761-4. 388
17. Johnston, B. C., A. L. Supina, M. Ospina, and S. Vohra. 2007. 389 Probiotics for the prevention of pediatric antibiotic-associated 390 diarrhea. Cochrane Database Syst Rev:CD004827. 391
18. La Scola, B., V. A. Gundi, A. Khamis, and D. Raoult. 2006. Sequencing 392 of the rpoB gene and flanking spacers for molecular identification of 393 Acinetobacter species. J Clin Microbiol 44:827-32. 394
inse
rm-0
0462
416,
ver
sion
1 -
9 M
ar 2
010

15
19. Lepage, P., P. Seksik, M. Sutren, M. F. de la Cochetiere, R. Jian, P. 395 Marteau, and J. Dore. 2005. Biodiversity of the mucosa-associated 396 microbiota is stable along the distal digestive tract in healthy 397 individuals and patients with IBD. Inflamm Bowel Dis 11:473-80. 398
20. Manichanh, C., E. Varela, C. Martinez, M. Antolin, M. Llopis, J. 399 Dore, J. Giralt, F. Guarner, and J. R. Malagelada. 2008. The gut 400 microbiota predispose to the pathophysiology of acute 401 postradiotherapy diarrhea. Am J Gastroenterol 103:1754-61. 402
21. Martens, H., S. R. Veflingstad, E. Plahte, M. Martens, D. Bertrand, 403 and S. W. Omholt. 2009. The genotype-phenotype relationship in 404 multicellular pattern-generating models - the neglected role of 405 pattern descriptors. BMC Syst Biol 3:87. 406
22. McFarland, L. V. 2008. Antibiotic-associated diarrhea: epidemiology, 407 trends and treatment. Future Microbiol 3:563-78. 408
23. Seksik, P., P. Lepage, M. F. de la Cochetiere, A. Bourreille, M. 409 Sutren, J. P. Galmiche, J. Dore, and P. Marteau. 2005. Search for 410 localized dysbiosis in Crohn's disease ulcerations by temporal 411 temperature gradient gel electrophoresis of 16S rRNA. J Clin 412 Microbiol 43:4654-8. 413
24. Simmon, K. E., A. C. Croft, and C. A. Petti. 2006. Application of 414 SmartGene IDNS software to partial 16S rRNA gene sequences for a 415 diverse group of bacteria in a clinical laboratory. J Clin Microbiol 416 44:4400-6. 417
25. Simmon, K. E., S. Mirrett, L. B. Reller, and C. A. Petti. 2008. 418 Genotypic diversity of anaerobic isolates from bloodstream 419 infections. J Clin Microbiol 46:1596-601. 420
26. Stringer, A. M., R. J. Gibson, J. M. Bowen, D. M. Keefe, R. M. Logan, 421 A. S. Yeoh, and J. Hamilton. 2009. Chemotherapy-induced modifications 422 to gastrointestinal microflora: evidence and implications of change 423
Gastrointestinal microflora and mucins may play a critical role in the 424 development of 5-Fluorouracil-induced gastrointestinal mucositis. 425 Curr Drug Metab 10:79-83. 426
27. Stringer, A. M., R. J. Gibson, J. M. Bowen, R. M. Logan, A. S. Yeoh, 427 and D. M. Keefe. 2007. Chemotherapy-induced mucositis: the role of 428 gastrointestinal microflora and mucins in the luminal environment. J 429 Support Oncol 5:259-67. 430
28. Suau, A., R. Bonnet, M. Sutren, J. J. Godon, G. R. Gibson, M. D. 431 Collins, and J. Dore. 1999. Direct analysis of genes encoding 16S 432 rRNA from complex communities reveals many novel molecular species 433 within the human gut. Appl Environ Microbiol 65:4799-807. 434
29. Tannock, G. W. 2001. Molecular assessment of intestinal microflora. 435 Am J Clin Nutr 73:410S-414S. 436
30. Tannock, G. W. 2007. What immunologists should know about bacterial 437 communities of the human bowel. Semin Immunol 19:94-105. 438
31. Wistrom, J., S. R. Norrby, E. B. Myhre, S. Eriksson, G. Granstrom, L. 439 Lagergren, G. Englund, C. E. Nord, and B. Svenungsson. 2001. 440 Frequency of antibiotic-associated diarrhoea in 2462 antibiotic-441 treated hospitalized patients: a prospective study. J Antimicrob 442 Chemother 47:43-50. 443
32. Zoetendal, E. G., A. D. Akkermans, and W. M. De Vos. 1998. 444 Temperature gradient gel electrophoresis analysis of 16S rRNA from 445 human fecal samples reveals stable and host-specific communities of 446 active bacteria. Appl Environ Microbiol 64:3854-9. 447
448 449
450
451
inse
rm-0
0462
416,
ver
sion
1 -
9 M
ar 2
010

16
Figure legends 452
Figure.1. Representative TTGE gel image of faecal microbiota DNA before antibiotic 453
treatment. M control marker DNA. 454
Figure.2. Analysis of Variance (ANOVA). Fisher F-values (AAD) are plotted against the 455
migration distance. The Fisher F limit (threshold value) was obtained using randomisation 456
procedures (see Methods). Six electrophoresis distances were found to exceed this threshold, 457
and were thus considered significant. 458
Figure.3. Mean TTGE electrophoresis at D0. The grey bars emphasize the regions detected 459
by ANOVA tests. Solid line, pattern from patients with AAD; Dotted line, pattern from 460
patients without ADD. 461
Figure.4. Comparison of ANOVA and discriminant analysis. Top : regions detected by 462
ANOVA (grey bars) Bottom: first six variables introduced in forward discriminant analysis 463
(vertical lines). Vertical lines are numbered in order of introduction of the corresponding 464
variable. Solid line, pattern from patients with AAD; Dotted line, pattern from patients 465
without AAD. 466
467
468
469
470
471
472
473
474
475
476
477
478
479
480
481
482
483
484
485
486
inse
rm-0
0462
416,
ver
sion
1 -
9 M
ar 2
010
17
487
488
489
490
491
492
493
494
495
496
497
498
499
500
501
502
503
504
505
506
507
508
509
510
511
512
513
514
515
516
517
518
519
520
521
522
523
524
525
Figure 1 526
527
528
529
530
531
532
533
534
535
Pat 1 Pat 2Pat 3 M Pat 4 Pat 5 M Pat 6Pat 7 Pat 8 Pat 9
Figure 1 Do
Pat 1 Pat 2Pat 3 M Pat 4 Pat 5 M Pat 6Pat 7 Pat 8 Pat 9
Figure 1 Do
Pat 1 Pat 2Pat 3 M Pat 4 Pat 5 M Pat 6Pat 7 Pat 8 Pat 9Pat 1Pat 1 Pat 2Pat 2Pat 3Pat 3 M Pat 4M Pat 4 Pat 5Pat 5 MM Pat 6Pat 6Pat 7Pat 7 Pat 8Pat 8 Pat 9
Figure 1 Do
inse
rm-0
0462
416,
ver
sion
1 -
9 M
ar 2
010
18
536
537
538
539
540
541
542
543
544
545
546
547
548
549
550
551
552
553
554
555
556
557
558
559
560
Figure 2 561
Threshold
50 100 150 200 250 300 350 400
2
4
6
8
10
12
14
16
18
20
22
X1
5870
174
321
347
358
399
Migration distance
Fis
her
’
Threshold F-value
50 100 150 200 250 300 350 400
2
4
6
8
10
12
14
16
18
20
22
X1
5870
174
321
347
358
399
Migration distance
Fis
her
’ s F
Threshold
50 100 150 200 250 300 350 400
2
4
6
8
10
12
14
16
18
20
22
X1
5870
174
321
347
358
399
Migration distance
Fis
her
’
Threshold F-value
50 100 150 200 250 300 350 400
2
4
6
8
10
12
14
16
18
20
22
X1
5870
174
321
347
358
399
Migration distance
Fis
her
’ s F
inse
rm-0
0462
416,
ver
sion
1 -
9 M
ar 2
010
19
562
563
564
565
566
567
568
569
570
571
572
573
574
575
576
577
578
579
580
581
582
583
584
585
586
Figure 3 587
0
5
10
15
20
25
30
35
40
50 100 150 200 250 300 350 4000
5
10
15
20
25
30
35
40
50 100 150 200 250 300 350 400
Migration distance
Gra
y l
evel
in
ten
sity
A B C D E F
0
5
10
15
20
25
30
35
40
50 100 150 200 250 300 350 4000
5
10
15
20
25
30
35
40
50 100 150 200 250 300 350 400
Migration distance
Gra
y l
evel
in
ten
sity
0
5
10
15
20
25
30
35
40
50 100 150 200 250 300 350 4000
5
10
15
20
25
30
35
40
50 100 150 200 250 300 350 400
Migration distance
Gra
y l
evel
in
ten
sity
A B C D E F
inse
rm-0
0462
416,
ver
sion
1 -
9 M
ar 2
010
20
588
589
590
591
592
593
594
595
596
597
598
599
600
601
602
603
604
605
606
607
608
609
610
611
612
Figure 4 613
0
5
10
15
20
25
30
35
40
50 100 200 300 4000
5
10
15
20
25
30
35
40
50 100 200 300 400400
5 4 2 6 1 3
100 200 300 4000
5
10
15
20
25
30
35
40
Migration distance
Gra
y l
evel
in
ten
sity
100 200 300 4000
5
10
15
20
25
30
35
40
5 4 2 6 1 3
Variance analysis
Discriminant analysis
Migration distance
Gra
y l
evel
in
ten
sity
A B C D E F
0
5
10
15
20
25
30
35
40
50 100 200 300 4000
5
10
15
20
25
30
35
40
50 100 200 300 4004000
5
10
15
20
25
30
35
40
50 100 200 300 4000
5
10
15
20
25
30
35
40
50 100 200 300 4000
5
10
15
20
25
30
35
40
50 100 200 300 4000
5
10
15
20
25
30
35
40
50 100 200 300 400400
5 4 2 6 1 3
100 200 300 4000
5
10
15
20
25
30
35
40
Migration distance
Gra
y l
evel
in
ten
sity
100 200 300 4000
5
10
15
20
25
30
35
40
5 4 2 6 1 3
Variance analysis
Discriminant analysis
Migration distance
Gra
y l
evel
in
ten
sity
Migration distance
Gra
y l
evel
in
ten
sity
A B C D E F
inse
rm-0
0462
416,
ver
sion
1 -
9 M
ar 2
010
21
614
615
616
617
618
619
620
621
622
623
624
625
626
627
628
629
630
631
632
633
634
635
636
637
Complementary material 638
639
640
50 100 150 200 250 300 350 4000
10
20
30
40
50
60
70
80
90
0 400
50 100 150 200 250 300 350 4000
10
20
30
40
50
60
70
80
90
Normalized migration distance
0 400
Gre
y l
evel
in
ten
sity
Electrophoresis
50 100 150 200 250 300 350 4000
10
20
30
40
50
60
70
80
90
50 100 150 200 250 300 350 4000
10
20
30
40
50
60
70
80
90
0 400
50 100 150 200 250 300 350 4000
10
20
30
40
50
60
70
80
90
Normalized migration distance
0 400
Gre
y l
evel
in
ten
sity
Electrophoresis
inse
rm-0
0462
416,
ver
sion
1 -
9 M
ar 2
010