Multipotent stem cells from trabecular meshwork become phagocytic TM cells
Fax +41 61 306 12 34E-Mail [email protected]
Original Article
Cytogenet Genome Res 118:42–54 (2007) DOI: 10.1159/000106440
Human chromosome 1 satellite 3 DNA is
decondensed, demethylated and transcribed
in senescent cells and in A431 epithelial
carcinoma cells
N.I. Enukashvily a R. Donev b I.S.-R. Waisertreiger a O.I. Podgornaya a a Institute of Cytology, RAS, St. Petersburg (Russia) b Department of Medical Biochemistry and Immunology, School of Medicine, Cardiff University, Cardiff (UK)
like spaghetti on a plate suggested more than 30 years ago and the model of discrete territorial organisation favoured recently (for review see Cremer and Cremer, 2001; Mahy et al., 2002). Many genomic regions are positioned outside of chromosome territories (CTs) and should be thus ‘invisible’ by chromosome painting. It was demonstrated, however, that although the borders between CTs are well-defined, fibre-like structures that belong to one chromosome could be found embedded in territories of other chromosomes (Visser and Aten, 1999). The DNA content of such fibres has been probed by FISH. In all cases reported, their DNA content belonged to actively transcribed or gene-dense chromosome regions (Volpi et al., 2000; Mahy et al., 2002).
Abstract. Constitutive heterochromatin mainly consists of different classes of satellite DNAs and is defined as a tran-scriptionally inactive chromatin that remains compact throughout the cell cycle. The aim of this work was to in-vestigate the level of condensation, methylation and tran-scriptional status of centromeric (alphoid DNA) and peri-centromeric satellites (human satellite 3, HS3) in tissues (lymphocytes, placenta cells) and in cultured primary (MRC5, VH-10, AT2Sp) and malignant (A431) cells. We found that alphoid DNA remained condensed and heavily methylated in all the cell types. The HS3 of chromosome 1 (HS3-1) but not of chromosome 9 (HS3-9) was strongly de-condensed and demethylated in A431 cells. The same obser-vation was made for aged embryonic lung (MRC5) and ju-venile foreskin (VH-10) fibroblasts obtained at late passages
Request reprints from Dr. Natella EnukashvilyInstitute of Cytology, RASTikhoretsky av. 4, St.Petersburg, 194064 (Russia)telephone: +7 812 2977450, +7 812 2970055; fax +7 812 2970341e-mail: [email protected]
© 2007 S. Karger AG, Basel1424–8581/07/1181–0042$23.50/0
Accessible online at:www.karger.com/cgr
(32 nd and 23 rd , respectively). Decondensation was also found in ataxia telangiectasia AT2Sp fibroblasts at the 16 th pas-sage. One of the manifestations of the disease is premature aging. The level of HS3-1 decondensation was higher in aged primary fibroblasts as compared to A431. The HS3-1 extended into the territory of neighbouring chromosomes. An RT-PCR product was detected in A431 and senescent MRC5 fibroblasts using primers specific for HS3-1. The RNA was polyadenylated and transcribed from the reverse chain. Our results demonstrate the involvement of satellite DNA in associations between human chromosomes and in-termingling of chromosome territories. The invading satel-lite DNA can undergo decondensation to a certain level. This process is accompanied by demethylation and tran-scription. Copyright © 2007 S. Karger AG, Basel
Recent data suggest that the organisation of chromo-somes within the nucleus is probably somewhere in be-tween the complete decondensation of chromatin fibres
The work was supported by grants from Russian Foundation of Basic Research (#04-04-48734), Royal Society, and Human DOE USA. N.I.E. was sup-ported by grants from the Grants’ Council of the President of RF (MK-2497.2005.4) and St. Petersburg centre for natural sciences (PD06-1.4-130). The work was supported partially by a Joint research center ‘Material Sci-ence and characterisation in high technology’.
Manuscript received 16 October 2006; accepted in revised form for publication by M. Schmid, 16 March 2007.
Cytogenet Genome Res 118:42–54 (2007) 43
Recent data regarding the position of the centromeres on the surface of CTs (Everett et al., 1999; Chevret et al., 2000) are in accordance with previous results demonstrating the existence of large heterochromatic blocks, chromocenters, formed by the constitutive heterochromatin from several chromosomes (Manuelidis, 1990; Cerda et al., 1999; Garag-na et al., 2002; Prusov et al., 2002). Chromocenters are easy to visualise both by light and fluorescence microscopy be-cause of their highly condensed state and bright staining with 4 � ,6-diamidino-2-phenylindole (DAPI). The number of chromocenters per cell is always less than the number of constitutive heterochromatin regions in the karyotype. Thus, in somatic cells, heterochromatic regions are clus-tered and assembled in chromocenters in a non-random, cell type-specific manner (Hsu, 1975). The overlapping of CTs within chromocenters should be expected as chromo-centers were described as a place of chromosome associa-tion. The DNA of heterochromatic pericentromeric chro-mosome regions is a good candidate to be the structural foundation for assembling chromocenters (Garagna et al., 2002). In mouse, DNA of well distinguishable chromocen-ters belongs mainly to pericentromeric regions: major satel-lite DNA and mouse satellite 4 (Garagna et al., 2002; Kuznetsova et al., 2005, 2006). However, it is not an easy task to prove the association of mouse satellite DNAs (satDNA) of different chromosomes within chromocenters as mouse satellite DNA families are species- but not chromosome-specific (Vissel and Choo, 1989). In human, the satDNA families of centromeric and pericentromeric heterochro-matin are often chromosome-specific (Willard and Waye, 1987). It makes them more convenient for chromosome as-sociation studies. The centromeric region consists of al-phoid DNA arrays that are surrounded by long pericentro-meric arrays of ‘classical’ or ‘simple sequence’ satellites that include the human satDNA 3 (HS3) (Lee et al., 1997). HS3 was found in pericentromeric regions of all chromosomes but 2, 6, 8, 11, 12, 18, 19, and X (Gosden et al., 1975; Higgins et al., 1985; Frommer et al., 1988; Shiels et al., 1997; Therkelsen et al., 1997). Chromosome-specific subfamilies of HS3 have been determined (Cooke and Hindley, 1979; Higgins et al., 1985; Moyzis et al., 1987; Choo et al., 1992) and those belonging to chromosome 1 (HS3-1) and 9 (HS3-9) are two of them. The HS3 arrays they form on the corre-sponding chromosomes are the biggest in the human ge-nome (Therkelsen et al., 1997). Therefore probes based on HS3 sequences from these two chromosomes could be use-ful tools to trace heterologous chromosome associations and to monitor the level of HS3 condensation.
The aim of our work was to test whether satellite DNAs can be involved in CTs interaction. We studied the localisa-tion, level of condensation, methylation and transcriptional status of centromeric (alphoid DNA) and pericentromeric (HS3) sequences throughout the cell cycle in different cell types. Our data confirmed the involvement of HS3-1 in het-erologous chromosome association and demonstrated for the first time the presence of the satellite in fibres extending from CTs. HS3-1 was expressed in malignant and senescent cells.
Materials and methods
Cells and slide preparation Human embryonic MRC5 primary diploid fibroblasts originating
from lung tissue were taken from a 14-week male foetus. They were grown on coverslips in Eagle medium supplemented with 10% foetal calf serum (20% for senescent culture) at 37 ° C in a 5% CO 2 atmosphere. Young MRC5 cells were obtained from intensively growing low passage (9–11) cultures. Senescent MRC5 were obtained from very slowly grow-ing cultures at the 32 nd passage. For FISH studies, 60–70% confluent cells were fixed with 2% paraformaldehyde (PFMA) in KCM buffer (135 mM KCl, 20 mM NaCl, 0.5 mM EDTA, 0.1% Triton X-100, 10 mM Tris-HCl pH 8.0) at room temperature for 30 min.
Human VH-10 foreskin fibroblasts obtained from an 11-year-old boy (Nygren et al., 1994) were kindly given by Dr. N. Smirnova (Insti-tute of Cytology, Russia). The cells were grown in Iscove’s medium (IMDM) supplemented with 10% foetal calf serum (20% for senescent culture) in the conditions described above. The early- and late-passage cells were obtained at the 16 th and 23 rd passage, respectively, and fixed as above.
Human AT2Sp ataxia telangiectasia skin fibroblasts were a kind gift of Prof. V.M. Mikhelson and Dr. N. Smirnova (Institute of Cytol-ogy, Russia). They were obtained from a 4-year-old boy diagnosed with ataxia telangiectasia. Cells were grown and fixed under the same con-ditions as for the VH-10.
A431 (human epidermoid vulvar carcinoma) and HeLa (cervical carcinoma) were grown on chamber slides or coverslips in RPMI me-dium supplemented with 10% foetal calf serum at 37 ° C in a 5% CO 2 atmosphere. For FISH studies, cells were processed when reaching 60–70% confluence as described above.
The lymphocytes were obtained from human peripheral blood of healthy volunteer donors according to standard protocols (Boyum, 1968). The purified lymphocytes were then dropped onto wet cover-slips, dried briefly and fixed as described above for other cell types.
To prepare nuclei from human placenta obtained after normal birth on term, the placenta was homogenised in STM buffer (0.32 M sucrose, 5 mM MgCl 2 , 0.1 mM EDTA, 50 mM Tris-HCl pH 7.4, 0.01% PMSF). A homogeniser with two Teflon pestles was used. A large clearance pestle was used for initial processing and a small clearance pestle to complete homogenisation. At this stage the cytoplasm was completely destroyed mechanically while the morphology of nuclei remained in-tact. To purify the nuclei, the homogenate was loaded on a 2.1 M su-crose cushion and centrifuged for 1 h at 0 ° C (80,000 ! g ). The pellet was washed three times in STM buffer and resuspended in the same buffer. The quality of the nuclei was monitored using light microscopy. The nuclei were immobilised on polylysine-coated slides.
For metaphase chromosome spreads, MRC5 and HeLa cells were arrested in metaphase by a 3-hour treatment with 0.5 � g/ml colchicine, were hypotonically treated with 0.075 M KCl, fixed three times in methanol:acetic acid (3: 1), spread onto glass slides and air-dried.
DNA probes The original Eco RI fragment (1.77 kb) of an HS3 array isolated from
1q12 region of chromosome 1 (Cooke and Hindley, 1979) was a kind gift from Dr. H. Cooke (MRC, Edinburgh, UK). It was digested with Sau 3A and a subfragment of 336 bp (GenBank acc. no. X60726) was cloned into the Bam HI site of pUC19 (Podgornaya et al., 2000). This subfragment (HS3-1) was used as a probe specific for the pericentro-meric region of chromosome 1. The pTRS plasmid containing a 1300-bp fragment (HS3-9) from the HS3 array isolated from 9q12 of chromo-some 9 was a kind gift from Dr. M. Rocchi (DAPEG Sezione di Genet-ica, Bari, Italy). The nucleotide sequence of the HS3-9 was not defined previously. It was therefore sequenced (GenBank acc. no. DQ980028) by ABI PRISM 377 automatic sequencer using Big Dye Terminator Kit v.2.0 (Perkin Elmer). HS3-1 and HS3-9 were labelled with either biotin-16-dUTP or digoxigenin-11-dUTP (Roche) by PCR with M13 forward and reverse primers that flank the polylinker regions of the vectors. Biotin-labelled or fluorochrome-labelled commercial chromosome painting probes for chromosome 1 and 9 (Appligene Oncor) were used to delineate the chromosome territories 1 and 9. Commercial f luoro-
Cytogenet Genome Res 118:42–54 (2007)44
chrome-conjugated cocktail probe hybridizing with all human centro-meres (All-CEN cocktail, Appligene Oncor) was used for detection of the centromeric alphoid DNA.
Southern blot analysis Human genomic DNAs from unstimulated peripheral lympho-
cytes, placenta cells, MRC5 fibroblasts and A431 cells were prepared according to standard protocols (Herrington and McGee, 1992). They were digested with Bsp 119I, which does not recognise methylated sites. Digested samples were resolved by electrophoresis in 1% agarose gel and transferred onto a nylon membrane (Sambrook et al., 1989). South-ern blot hybridization was performed under highly stringent condi-tions using digoxigenin-11-dUTP (DIG) labelled HS3-1 as a probe. An antibody (AB) against DIG conjugated with alkaline phosphatase (AP) was used for detection. The relative methylation of the repeated DNA in each sample was assessed by calculating the ratio between the inten-sity of the AP staining above a threshold length and the total AP stain-ing (M-ratio). The set up threshold length for HS3-1 was 2 kb as previ-ously established (Vilain et al., 2000). The intensity of AP staining was quantified by digital densitometry.
Reverse transcriptase PCR (RT-PCR) Total RNAs from lymphocytes, placenta, A431 and senescent
MRC5 were purified using the guanidinium isothiocyanate method and treated with DNAse I (RNAse free) (Fermentas). For RT-PCR, total RNA (2 � g) was used as a template for cDNA synthesis. For this pro-cedure, an antisense (AS) primer (5 � -TCCATTCCATTCCTGTACTC-GG-3 � ) and a sense (S) primer (5 � -AATCAACCCGAGTGCAATC-GAATGGAATCG-3 � ) described by Metz et al. (2004) were used to test the forward and reverse strains respectively for the transcription of HS3-9. For HS3-1, we applied an antisense (AS1) primer (5 � -AATCAT-CATCCAACGGAAGCTAATG-3 � ) to detect transcription from the forward strain while for the reverse one we used a sense (S1) primer (5 � -AGTCCATTCAATGATTCCATTCCAGT-3 � ). The testing of the primers is described in Results. The cDNAs were synthesized by Re-vertAid TM M-MuLV Reverse Transcriptase (Fermentas) according to the manufacturer’s protocol. The products of cDNA synthesis were am-plified by PCR. The PCR mix contained 15 pmol of each of the forward (S for HS3-9, S1 for HS3-1) and the reverse (AS for HS3-9, AS1 for HS3-1) primers, 1 U of Taq polymerase (Sileks, Russia) and 1 � l of RT reac-tion mix diluted 1: 10. PCR cycles included 25 rounds of sequential in-cubations at 94 ° C for 30 s, 52 ° C for 45 s, and 72 ° C for 1 min, followed by a 2 min extension at 72 ° C. RT-PCR products were analysed by elec-trophoresis in 1% agarose gel. The DNA yield was estimated densito-metrically.
PolydT RT-PCR Total RNAs from MRC5 at passage 32 (M32) and A431 were used
to test whether the transcripts are protected by a polyA tail and if so to sequence them from the 3 � end. The RNAs were obtained as described above. For RT-PCR, total RNA (2 � g) was used as a template for cDNA synthesis and the primer CAGGAAACAGCTATGACTTTTTTT-TTTTTN (M13 reverse primer followed by 12 thymidine residues and any nucleotide at the end, M13RpolyT) was used as a primer for cDNAs synthesis. N was added to the end of the primer to make the annealing easier. It also allows to anneal polydT exactly at the border between polyA and the rest of RNA. The products of cDNA synthesis were am-plified by PCR. The PCR mix contained 15 pmol of each of the S1 (or AS1 as a control) and M13 reverse primers, 1 U of Taq polymerase (Sileks, Russia), and 1 � l of RT reaction mix diluted 1: 10. PCR cycles included 30 rounds of sequential incubations at 94 ° C for 30 s, 65 ° C for 45 s, and 72 ° C for 1 min, followed by a 2-min extension at 72 ° C.RT-PCR products were analysed by electrophoresis in 1% agarose gel. The DNA yield was estimated densitometrically.
FISH, immunostaining and chromosome painting Slides with fixed cells were incubated in 2 ! SSC at 37 ° C for 30 min
and denatured in 70% formamide, 2 ! SSC at 74 ° C for 7 min. The hy-bridisation mix (2 � g/ml of labelled HS3-1 or HS3-9, 2 ! SSC, 50% deionised formamide, 10% dextrane sulphate, 20 � g/ml E. coli DNA,
20 � g/ml salmon sperm DNA), denatured and preannealed, was ap-plied to the coverslips. For double FISH studies, the same incubation mix was used with 4 � g/ml of HS3-1 and 4 � g/ml of HS3-9 added. Hy-bridisation was performed at 41 ° C overnight. Slides were then washed in 50% formamide, 2 ! SSC at 43 ° C for 15 min and in 2 ! SSC at 37 ° C for 8 min, transferred in PBS and washed twice at room temperature. To prevent non-specific binding in the subsequent AB detection, slides were blocked in PBS containing 5% BSA and 0.05% Triton X-100 (de-tection buffer). DIG-labelled probes were detected by an anti-digoxi-genin AB (Roche) conjugated with FITC or Texas Red fluorochrome at 1: 200 in detection buffer. Biotin-labelled probes were revealed with avidin-FITC or Cy3-conjugated (VectorLab) at 1: 100 dilution in detec-tion buffer. Finally, the cells were counterstained with DAPI and mounted in antifade medium.
To combine single locus FISH with chromosome painting, the probe and the paint were denatured separately because of the necessity to preanneal the paint and mixed prior to the application. The paint was depleted from repetitive sequences using human Cot1. Equal vol-umes, 5 � l each, of chromosome 1 paint (a kind gift from Prof. M. Fer-guson-Smith, University of Cambridge) and of HS3-containing hy-bridisation mix were applied to the slides. In triple stainings, 5 � l of biotin-labelled chromosome 1 paint was combined with 5 � l of FITC-labelled chromosome 9 paint (Cambio) after separate preannealing and 2 � g/ml Texas Red-labelled HS3 probe was added to the mix. Hy-bridisation was performed at 37 ° C overnight. After washing, the chro-mosome 1 paint was visualised with Cy5-conjugated avidin.
Methylation of CpG islands was studied with a mouse monoclonal AB against methylated CpG (anti-CpG AB) (Upstate, USA). Texas Red conjugated anti-mouse immunoglobulins were used as secondary AB.
Microscopy and image analysis After the FISH procedures, cells were examined on Zeiss Axioscope
or Zeiss Axiophot microscopes. Greyscale images were recorded sepa-rately with a CCD device (Sony or Photometrics). They were then pseu-docoloured and merged using CorelPhotopaint software.
For the three-dimensional analyses, formaldehyde-fixed cells were examined by Zeiss LSM510 or LSM5 confocal microscopes. Fluores-cein, rhodamine (or Texas Red) or Cy5 dyes were excited by laser light at 488, 543, or 633 nm wavelength, respectively. To avoid the bleed-through effect in double- or triple-staining experiments, each dye was scanned separately using the multitracking function of the LSM5 or LSM510 unit. Optical sections were collected at 0.3- � m steps in Z-di-rection. For 3-D reconstruction, galleries of confocal images were as-sembled using built-in functions of LSM510 software. For statistical calculations, each section was analysed separately.
Morphometry analysis and statistical calculations Recorded images (50 nuclei for each group) were used for mor-
phometry analyses: size of nuclei, size, shape and number of HS3 hy-bridisation signals were measured using the built-in functions of the LSM5 or LSM510 software. The position of signals in nuclei was also analysed. We classified the signals into three groups: those adjacent to the nuclear envelope, those localised within a distance of 1 � m from the nuclear membrane and those found in the inner part of the nu-clei.
To estimate the level of HS3 decondensation we assumed that com-pact HS3 produced a relatively small bright spot while the signal ob-tained from diffuse unfolded HS3 region should appear as a greater number of pixels of different brightness occupying larger areas in total. After calculation of the background, the total number of FISH pixels from the HS3-1, irrespective of their brightness, in each confocal sec-tion was counted and the ratio number of HS3-1 pixels to nuclear vol-ume or to the volume of chromosome 1 was calculated. The built-in script editor of Corel PhotoPaint TM software or UTHSCSA ImageTool was used for the calculations. These values were processed further us-ing Microcal TM Origin � . The statistical significance of the differences between data sets was evaluated using Student’s t test. The accepted level of significance was set at P ! 0.05.
Cytogenet Genome Res 118:42–54 (2007) 45
Results
Chromosome specificity of HS3-1 and HS3-9 To clarify the specificity of the HS3-9 probe, whose se-
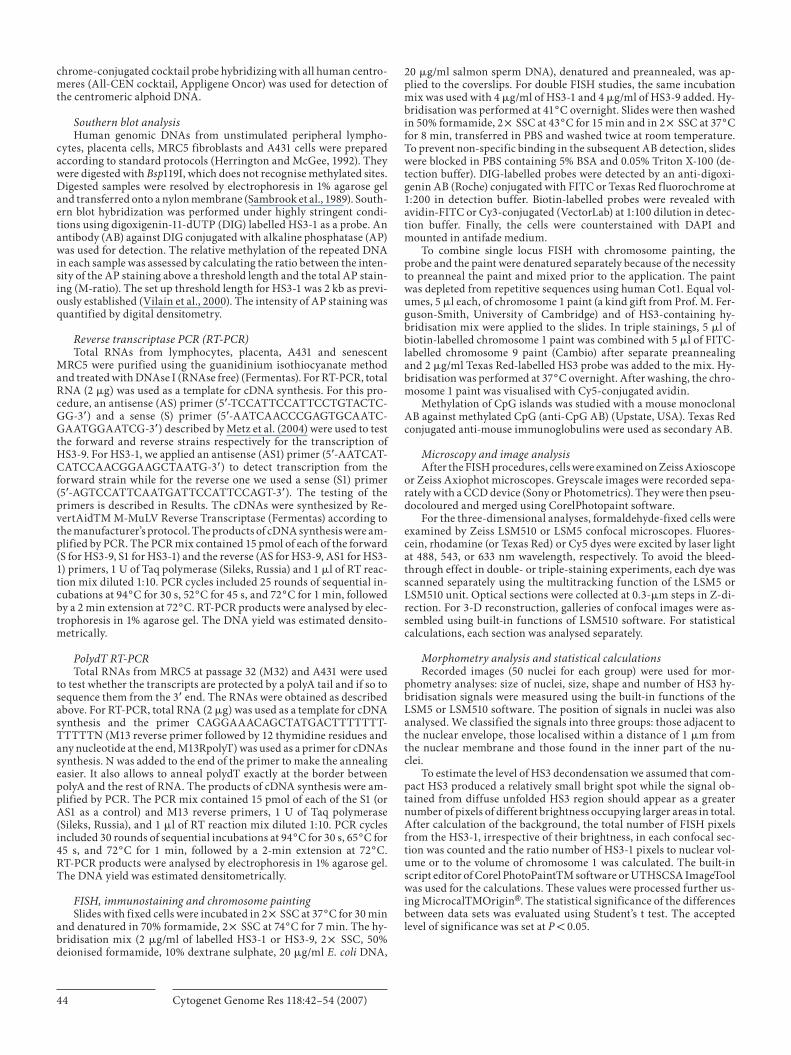
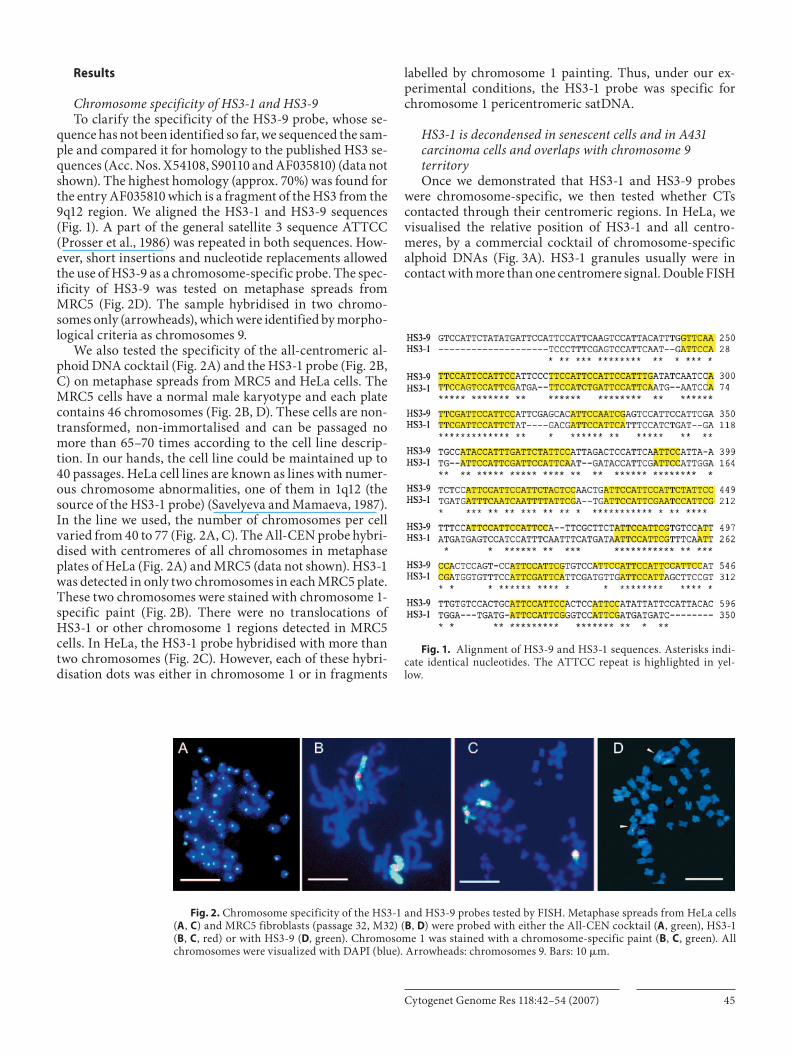
quence has not been identified so far, we sequenced the sam-ple and compared it for homology to the published HS3 se-quences (Acc. Nos. X54108, S90110 and AF035810) (data not shown). The highest homology (approx. 70%) was found for the entry AF035810 which is a fragment of the HS3 from the 9q12 region. We aligned the HS3-1 and HS3-9 sequences ( Fig. 1 ). A part of the general satellite 3 sequence ATTCC (Prosser et al., 1986) was repeated in both sequences. How-ever, short insertions and nucleotide replacements allowed the use of HS3-9 as a chromosome-specific probe. The spec-ificity of HS3-9 was tested on metaphase spreads from MRC5 ( Fig. 2 D). The sample hybridised in two chromo-somes only (arrowheads), which were identified by morpho-logical criteria as chromosomes 9.
We also tested the specificity of the all-centromeric al-phoid DNA cocktail ( Fig. 2 A) and the HS3-1 probe ( Fig. 2 B, C) on metaphase spreads from MRC5 and HeLa cells. The MRC5 cells have a normal male karyotype and each plate contains 46 chromosomes ( Fig. 2 B, D). These cells are non-transformed, non-immortalised and can be passaged no more than 65–70 times according to the cell line descrip-tion. In our hands, the cell line could be maintained up to 40 passages. HeLa cell lines are known as lines with numer-ous chromosome abnormalities, one of them in 1q12 (the source of the HS3-1 probe) (Savelyeva and Mamaeva, 1987). In the line we used, the number of chromosomes per cell varied from 40 to 77 ( Fig. 2 A, C). The All-CEN probe hybri-dised with centromeres of all chromosomes in metaphase plates of HeLa ( Fig. 2 A) and MRC5 (data not shown). HS3-1 was detected in only two chromosomes in each MRC5 plate. These two chromosomes were stained with chromosome 1-specific paint ( Fig. 2 B). There were no translocations of HS3-1 or other chromosome 1 regions detected in MRC5 cells. In HeLa, the HS3-1 probe hybridised with more than two chromosomes ( Fig. 2 C). However, each of these hybri-disation dots was either in chromosome 1 or in fragments
labelled by chromosome 1 painting. Thus, under our ex-perimental conditions, the HS3-1 probe was specific for chromosome 1 pericentromeric satDNA.
HS3-1 is decondensed in senescent cells and in A431 carcinoma cells and overlaps with chromosome 9 territory Once we demonstrated that HS3-1 and HS3-9 probes
were chromosome-specific, we then tested whether CTs contacted through their centromeric regions. In HeLa, we visualised the relative position of HS3-1 and all centro-meres, by a commercial cocktail of chromosome-specific alphoid DNAs ( Fig. 3 A). HS3-1 granules usually were in contact with more than one centromere signal. Double FISH
Fig. 1. Alignment of HS3-9 and HS3-1 sequences. Asterisks indi-cate identical nucleotides. The ATTCC repeat is highlighted in yel-low.
Fig. 2. Chromosome specificity of the HS3-1 and HS3-9 probes tested by FISH. Metaphase spreads from HeLa cells ( A , C ) and MRC5 fibroblasts (passage 32, M32) ( B , D ) were probed with either the All-CEN cocktail ( A , green), HS3-1 ( B , C , red) or with HS3-9 ( D , green). Chromosome 1 was stained with a chromosome-specific paint ( B , C , green). All chromosomes were visualized with DAPI (blue). Arrowheads: chromosomes 9. Bars: 10 � m.
Cytogenet Genome Res 118:42–54 (2007)46
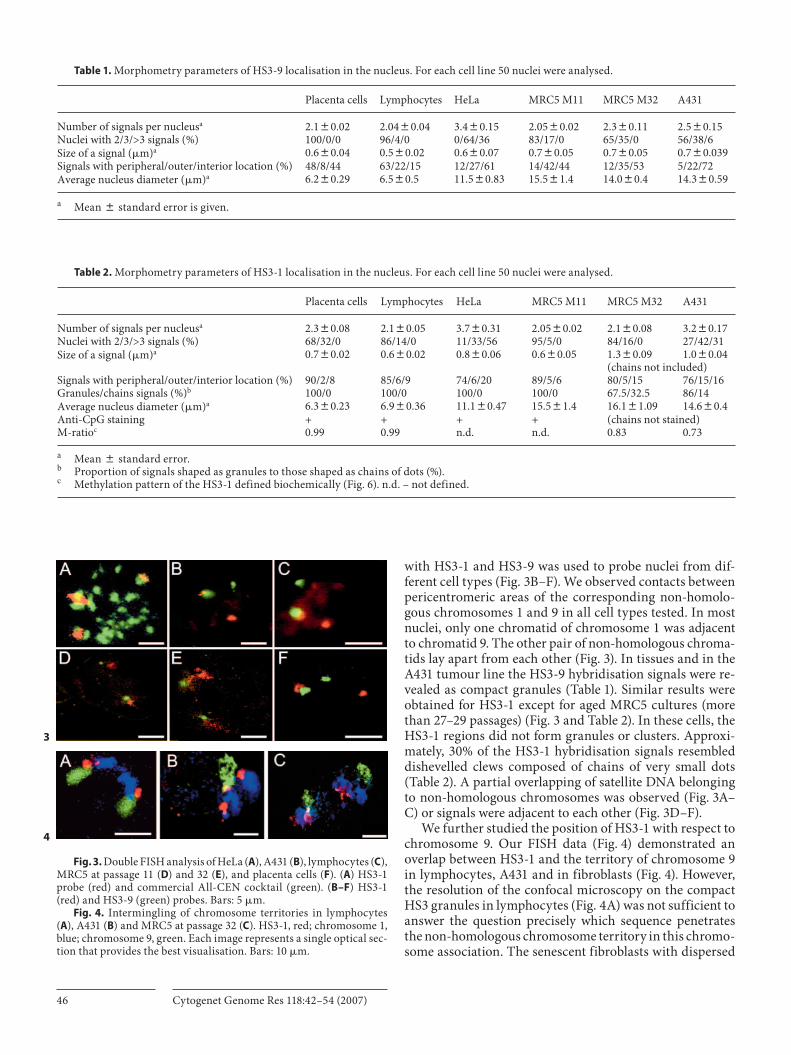
with HS3-1 and HS3-9 was used to probe nuclei from dif-ferent cell types ( Fig. 3 B–F). We observed contacts between pericentromeric areas of the corresponding non-homolo-gous chromosomes 1 and 9 in all cell types tested. In most nuclei, only one chromatid of chromosome 1 was adjacent to chromatid 9. The other pair of non-homologous chroma-tids lay apart from each other ( Fig. 3 ). In tissues and in the A431 tumour line the HS3-9 hybridisation signals were re-vealed as compact granules ( Table 1 ). Similar results were obtained for HS3-1 except for aged MRC5 cultures (more than 27–29 passages) ( Fig. 3 and Table 2 ). In these cells, the HS3-1 regions did not form granules or clusters. Approxi-mately, 30% of the HS3-1 hybridisation signals resembled dishevelled clews composed of chains of very small dots ( Table 2 ). A partial overlapping of satellite DNA belonging to non-homologous chromosomes was observed ( Fig. 3 A–C) or signals were adjacent to each other ( Fig. 3 D–F).
We further studied the position of HS3-1 with respect to chromosome 9. Our FISH data ( Fig. 4 ) demonstrated an overlap between HS3-1 and the territory of chromosome 9 in lymphocytes, A431 and in fibroblasts ( Fig. 4 ). However, the resolution of the confocal microscopy on the compact HS3 granules in lymphocytes ( Fig. 4 A) was not sufficient to answer the question precisely which sequence penetrates the non-homologous chromosome territory in this chromo-some association. The senescent fibroblasts with dispersed
Table 1. Morphometry parameters of HS3-9 localisation in the nucleus. For each cell line 50 nuclei were analysed.
Placenta cells Lymphocytes HeLa MRC5 M11 MRC5 M32 A431
Number of signals per nucleusa 2.180.02 2.0480.04 3.480.15 2.0580.02 2.380.11 2.580.15Nuclei with 2/3/>3 signals (%) 100/0/0 96/4/0 0/64/36 83/17/0 65/35/0 56/38/6Size of a signal (�m)a 0.680.04 0.580.02 0.680.07 0.780.05 0.780.05 0.780.039Signals with peripheral/outer/interior location (%) 48/8/44 63/22/15 12/27/61 14/42/44 12/35/53 5/22/72Average nucleus diameter (�m)a 6.280.29 6.580.5 11.580.83 15.581.4 14.080.4 14.380.59
a Mean 8 standard error is given.
Table 2. Morphometry parameters of HS3-1 localisation in the nucleus. For each cell line 50 nuclei were analysed.
Placenta cells Lymphocytes HeLa MRC5 M11 MRC5 M32 A431
Number of signals per nucleusa 2.380.08 2.180.05 3.780.31 2.0580.02 2.180.08 3.280.17Nuclei with 2/3/>3 signals (%) 68/32/0 86/14/0 11/33/56 95/5/0 84/16/0 27/42/31Size of a signal (�m)a 0.780.02 0.680.02 0.880.06 0.680.05 1.380.09 1.080.04
(chains not included)Signals with peripheral/outer/interior location (%) 90/2/8 85/6/9 74/6/20 89/5/6 80/5/15 76/15/16Granules/chains signals (%)b 100/0 100/0 100/0 100/0 67.5/32.5 86/14Average nucleus diameter (�m)a 6.380.23 6.980.36 11.180.47 15.581.4 16.181.09 14.680.4Anti-CpG staining + + + + (chains not stained)M-ratioc 0.99 0.99 n.d. n.d. 0.83 0.73
a Mean 8 standard error.b Proportion of signals shaped as granules to those shaped as chains of dots (%).c Methylation pattern of the HS3-1 defined biochemically (Fig. 6). n.d. – not defined.
Fig. 3. Double FISH analysis of HeLa ( A ), A431 ( B ), lymphocytes ( C ), MRC5 at passage 11 ( D ) and 32 ( E ), and placenta cells ( F ). ( A ) HS3-1 probe (red) and commercial All-CEN cocktail (green). ( B–F ) HS3-1 (red) and HS3-9 (green) probes. Bars: 5 � m.
Fig. 4. Intermingling of chromosome territories in lymphocytes ( A ), A431 ( B ) and MRC5 at passage 32 ( C ). HS3-1, red; chromosome 1, blue; chromosome 9, green. Each image represents a single optical sec-tion that provides the best visualisation. Bars: 10 � m.
3
4
Cytogenet Genome Res 118:42–54 (2007) 47
HS3-1 were used for analysis of the triple FISH ( Fig. 4 C) as-suming that with HS3-1 unfolded the overlapping could be detected easier. In 56% of the nuclei, contacts between single chromatids from chromosomes 1 and 9 were observed. In 43% of the nuclei with contacts, one of the HS3-1 signals was of bright yellow colour, indicating that the red HS3-1 signal overlapped the chromosome 9 outlined with green chromo-some paint. The chromatids in the second pair were also often adjacent to each other, but there was no HS3-1 signal within chromatid 9 territory ( Fig. 4 ).
In the experiments described above, we observed a de-condensation of HS3-1 but not of HS3-9 in senescent MRC5 cells ( Fig. 3 ). We addressed further the issue of HS3-1 posi-tion and level of condensation in nuclei from different cell types to answer the question to what extent this phenome-non is unique. The HS3-9 probe was used to test whether satellites other than HS3-1 underwent similar unfolding. In all cell types analysed, HS3-9 hybridised in small compact
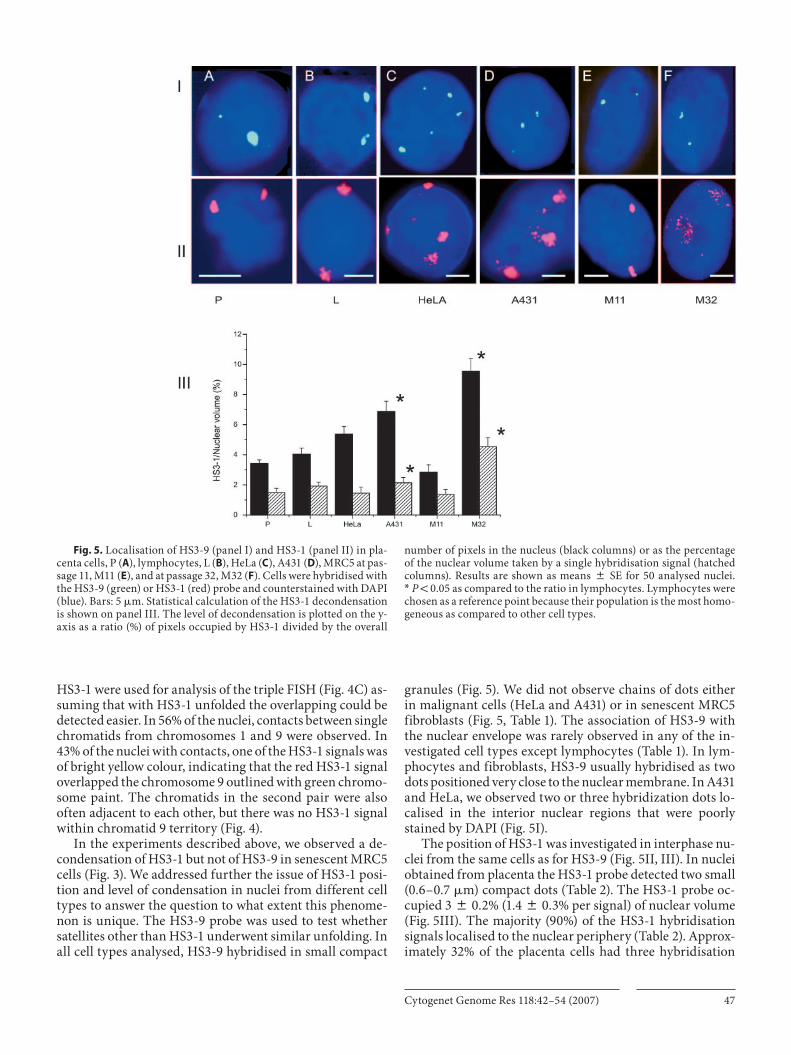
granules ( Fig. 5 ). We did not observe chains of dots either in malignant cells (HeLa and A431) or in senescent MRC5 fibroblasts ( Fig. 5 , Table 1 ). The association of HS3-9 with the nuclear envelope was rarely observed in any of the in-vestigated cell types except lymphocytes ( Table 1 ). In lym-phocytes and fibroblasts, HS3-9 usually hybridised as two dots positioned very close to the nuclear membrane. In A431 and HeLa, we observed two or three hybridization dots lo-calised in the interior nuclear regions that were poorly stained by DAPI ( Fig. 5 I).
The position of HS3-1 was investigated in interphase nu-clei from the same cells as for HS3-9 ( Fig. 5 II, III). In nuclei obtained from placenta the HS3-1 probe detected two small (0.6–0.7 � m) compact dots ( Table 2 ). The HS3-1 probe oc-cupied 3 8 0.2% (1.4 8 0.3% per signal) of nuclear volume ( Fig. 5 III). The majority (90%) of the HS3-1 hybridisation signals localised to the nuclear periphery ( Table 2 ). Approx-imately 32% of the placenta cells had three hybridisation
Fig. 5. Localisation of HS3-9 (panel I) and HS3-1 (panel II) in pla-centa cells, P ( A ), lymphocytes, L ( B ), HeLa ( C ), A431 ( D ), MRC5 at pas-sage 11, M11 ( E ), and at passage 32, M32 ( F ). Cells were hybridised with the HS3-9 (green) or HS3-1 (red) probe and counterstained with DAPI (blue). Bars: 5 � m. Statistical calculation of the HS3-1 decondensation is shown on panel III. The level of decondensation is plotted on the y-axis as a ratio (%) of pixels occupied by HS3-1 divided by the overall
number of pixels in the nucleus (black columns) or as the percentage of the nuclear volume taken by a single hybridisation signal (hatched columns). Results are shown as means 8 SE for 50 analysed nuclei. * P ! 0.05 as compared to the ratio in lymphocytes. Lymphocytes were chosen as a reference point because their population is the most homo-geneous as compared to other cell types.
Cytogenet Genome Res 118:42–54 (2007)48
signals detected by HS3-1. Cells with less than two signals were observed extremely rarely (less than 1%).
In lymphocytes, the HS3-1 probe detected two spots of the average size of 0.6 � m ( Fig. 5 II, Table 2 ). About 85% of signals were adjacent to the nuclear membrane ( Table 2 ). Compact HS3-1 dots occupied 4 8 0.4% (1.9 8 0.25% per signal) of the nuclear volume ( Fig. 5 III).
In HeLa cells, chromosome regions occupied by HS3-1 were also compact – about 0.8 � m ( Fig. 5 II, Table 2 ). But most HeLa cells contained more than two signals per nucle-us ( Table 2 ) though all of them belonged to chromosome 1 fragments ( Fig. 2 C). In about 83% of the cells, two signals tended to localize close to the nuclear periphery while a small number of granules were detected either in the outer or the inner areas of the nucleus ( Table 2 , Fig. 5 II). HS3-1 occupied 5 8 0.5% (1.5 8 0.4% per hybridisation signal) of the nuclear interior ( Fig. 5 III).
In A431 cells, the size of areas covered with the HS3-1 probe was about 1 � m per hybridisation signal ( Table 2 ). The chromosome regions detected by FISH occupied 6.8 8 0.7% (2.1 8 0.35% per signal) of the nucleus ( Fig. 5 III). Most nuclei (74%) contained more than two granules ( Table 2 ). Only two of the HS3-1 granules remained attached to the nuclear membrane or were positioned close to it. The other granules were detected in either the outer or inner areas of the nucleus ( Fig. 5 II). In 14% of A431 cells, the FISH probe revealed chains of small dots. The decondensation of HS3-1 in A431 was 1.6-fold higher compared to lymphocytes. This is much less than the decondensation in MRC5 cells, where the number of pixels occupied by HS3-1 was 2.4 times high-er than in lymphocytes ( Fig. 5 III). This might explain why we failed to observe the unfolding of HS3-1 in experiments shown in Fig. 5 III. The diameter of a dot in a chain was less than 0.3 � m. The chains were emanating from the large granules ( Fig. 5 II and Table 2 ). The lengths of the chains and the number of granules in chains were variable.
In young (up to passage 20–25) MRC5 fibroblasts, the results from FISH were similar to those obtained in cells
from tissues. The probe revealed two granules (0.5–0.7 � m) occupying 3 8 0.5% (1.4 8 0.3% per signal) of the nuclear volume that were adjacent to the nuclear envelope ( Fig. 5 II). The situation markedly changed in old (more than 27–29 passages) MRC5 cultures. In these cells, approximately 30% of the HS3-1 hybridisation signals resembled dishevelled clews composed of chains of very small dots ( Fig. 5 II, and Table 2 ). The clews occupied rather large areas in the nucle-us: 9.5 8 0.8% (4.5 8 0.6% per hybridisation signal) of the nuclear interior ( Fig. 5 III). This is an area occupied by the dots of chains only. The space between the dots and chains was not counted (see Materials and methods). Thus, decon-densation of the HS3-1 in senescent MRC5 cells was around 3.2-fold higher than in young cells.
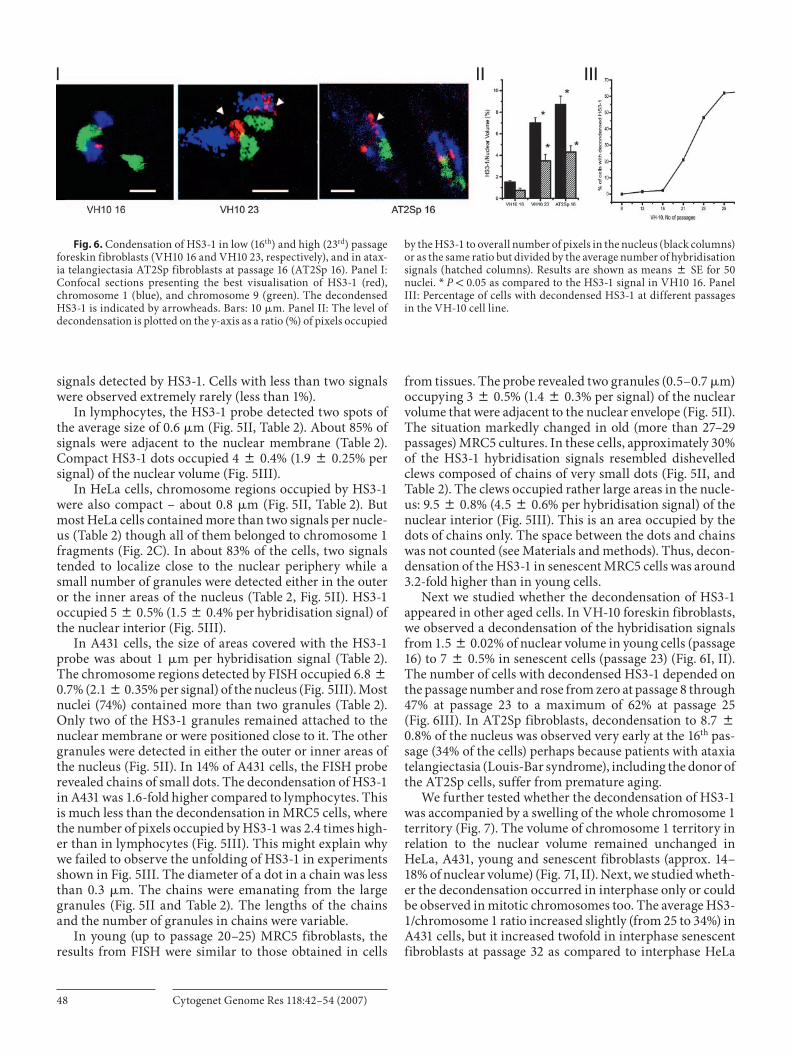
Next we studied whether the decondensation of HS3-1 appeared in other aged cells. In VH-10 foreskin fibroblasts, we observed a decondensation of the hybridisation signals from 1.5 8 0.02% of nuclear volume in young cells (passage 16) to 7 8 0.5% in senescent cells (passage 23) ( Fig. 6 I, II). The number of cells with decondensed HS3-1 depended on the passage number and rose from zero at passage 8 through 47% at passage 23 to a maximum of 62% at passage 25 ( Fig. 6 III). In AT2Sp fibroblasts, decondensation to 8.7 8 0.8% of the nucleus was observed very early at the 16 th pas-sage (34% of the cells) perhaps because patients with ataxia telangiectasia (Louis-Bar syndrome), including the donor of the AT2Sp cells, suffer from premature aging.
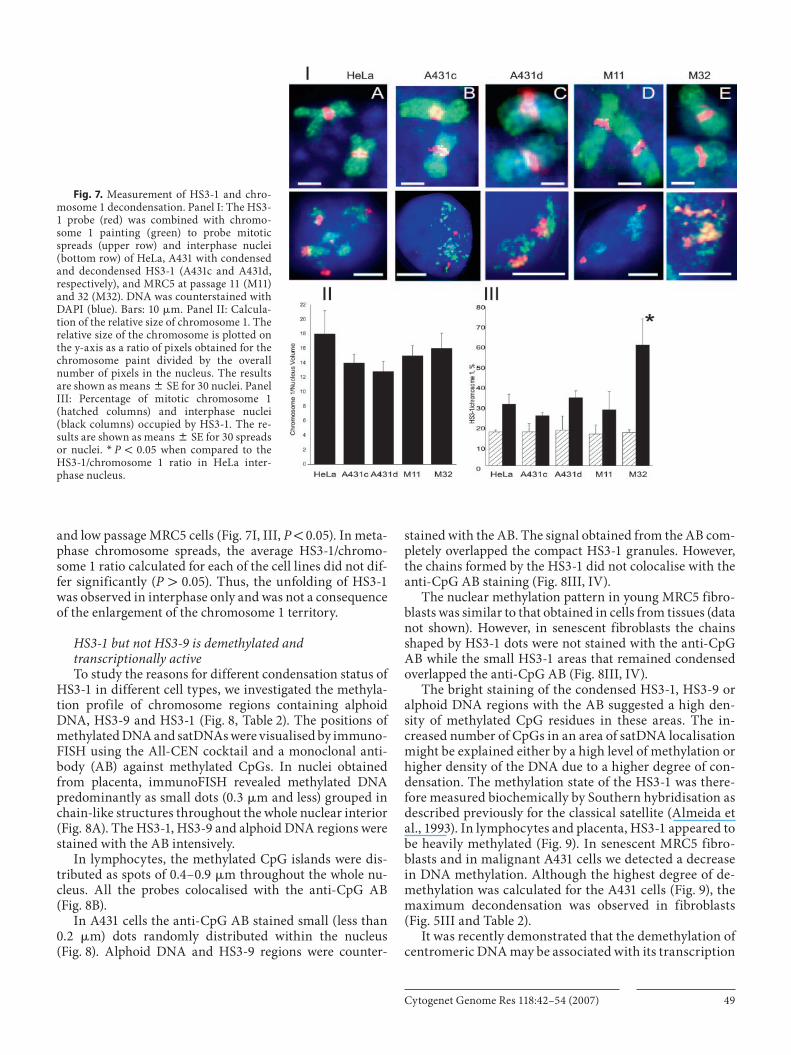
We further tested whether the decondensation of HS3-1 was accompanied by a swelling of the whole chromosome 1 territory ( Fig. 7 ). The volume of chromosome 1 territory in relation to the nuclear volume remained unchanged in HeLa, A431, young and senescent fibroblasts (approx. 14–18% of nuclear volume) ( Fig. 7 I, II). Next, we studied wheth-er the decondensation occurred in interphase only or could be observed in mitotic chromosomes too. The average HS3-1/chromosome 1 ratio increased slightly (from 25 to 34%) in A431 cells, but it increased twofold in interphase senescent fibroblasts at passage 32 as compared to interphase HeLa
Fig. 6. Condensation of HS3-1 in low (16 th ) and high (23 rd ) passage foreskin fibroblasts (VH10 16 and VH10 23, respectively), and in atax-ia telangiectasia AT2Sp fibroblasts at passage 16 (AT2Sp 16). Panel I: Confocal sections presenting the best visualisation of HS3-1 (red), chromosome 1 (blue), and chromosome 9 (green). The decondensed HS3-1 is indicated by arrowheads. Bars: 10 � m. Panel II: The level of decondensation is plotted on the y-axis as a ratio (%) of pixels occupied
by the HS3-1 to overall number of pixels in the nucleus (black columns) or as the same ratio but divided by the average number of hybridisation signals (hatched columns). Results are shown as means 8 SE for 50 nuclei. * P ! 0.05 as compared to the HS3-1 signal in VH10 16. Panel III: Percentage of cells with decondensed HS3-1 at different passages in the VH-10 cell line.
Cytogenet Genome Res 118:42–54 (2007) 49
and low passage MRC5 cells ( Fig. 7 I, III, P ! 0.05). In meta-phase chromosome spreads, the average HS3-1/chromo-some 1 ratio calculated for each of the cell lines did not dif-fer significantly ( P 1 0.05). Thus, the unfolding of HS3-1 was observed in interphase only and was not a consequence of the enlargement of the chromosome 1 territory.
HS3-1 but not HS3-9 is demethylated and transcriptionally active To study the reasons for different condensation status of
HS3-1 in different cell types, we investigated the methyla-tion profile of chromosome regions containing alphoid DNA, HS3-9 and HS3-1 ( Fig. 8 , Table 2 ). The positions of methylated DNA and satDNAs were visualised by immuno-FISH using the All-CEN cocktail and a monoclonal anti-body (AB) against methylated CpGs. In nuclei obtained from placenta, immunoFISH revealed methylated DNA predominantly as small dots (0.3 � m and less) grouped in chain-like structures throughout the whole nuclear interior ( Fig. 8 A). The HS3-1, HS3-9 and alphoid DNA regions were stained with the AB intensively.
In lymphocytes, the methylated CpG islands were dis-tributed as spots of 0.4–0.9 � m throughout the whole nu-cleus. All the probes colocalised with the anti-CpG AB ( Fig. 8 B).
In A431 cells the anti-CpG AB stained small (less than 0.2 � m) dots randomly distributed within the nucleus ( Fig. 8 ). Alphoid DNA and HS3-9 regions were counter-
stained with the AB. The signal obtained from the AB com-pletely overlapped the compact HS3-1 granules. However, the chains formed by the HS3-1 did not colocalise with the anti-CpG AB staining ( Fig. 8 III, IV).
The nuclear methylation pattern in young MRC5 fibro-blasts was similar to that obtained in cells from tissues (data not shown). However, in senescent fibroblasts the chains shaped by HS3-1 dots were not stained with the anti-CpG AB while the small HS3-1 areas that remained condensed overlapped the anti-CpG AB ( Fig. 8 III, IV).
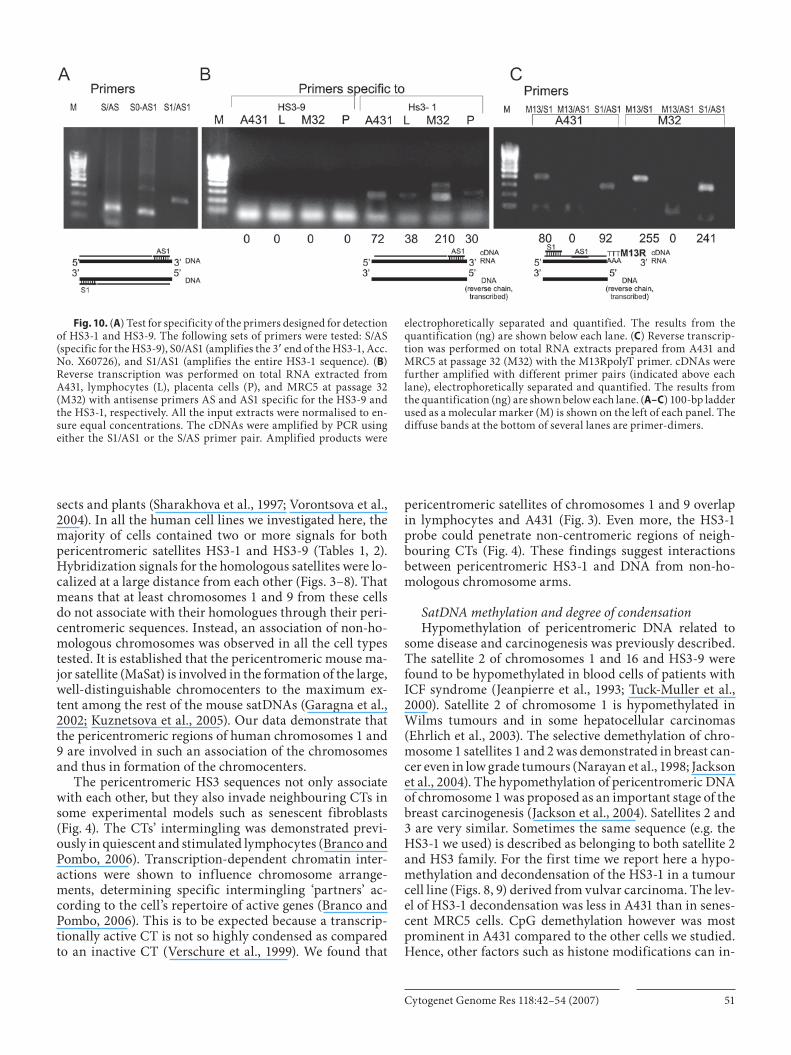
The bright staining of the condensed HS3-1, HS3-9 or alphoid DNA regions with the AB suggested a high den-sity of methylated CpG residues in these areas. The in-creased number of CpGs in an area of satDNA localisation might be explained either by a high level of methylation or higher density of the DNA due to a higher degree of con-densation. The methylation state of the HS3-1 was there-fore measured biochemically by Southern hybridisation as described previously for the classical satellite (Almeida et al., 1993). In lymphocytes and placenta, HS3-1 appeared to be heavily methylated ( Fig. 9 ). In senescent MRC5 fibro-blasts and in malignant A431 cells we detected a decrease in DNA methylation. Although the highest degree of de-methylation was calculated for the A431 cells ( Fig. 9 ), the maximum decondensation was observed in fibroblasts ( Fig. 5 III and Table 2 ).
It was recently demonstrated that the demethylation of centromeric DNA may be associated with its transcription
Fig. 7. Measurement of HS3-1 and chro-mosome 1 decondensation. Panel I: The HS3-1 probe (red) was combined with chromo-some 1 painting (green) to probe mitotic spreads (upper row) and interphase nuclei (bottom row) of HeLa, A431 with condensed and decondensed HS3-1 (A431c and A431d, respectively), and MRC5 at passage 11 (M11) and 32 (M32). DNA was counterstained with DAPI (blue). Bars: 10 � m. Panel II: Calcula-tion of the relative size of chromosome 1. The relative size of the chromosome is plotted on the y-axis as a ratio of pixels obtained for the chromosome paint divided by the overall number of pixels in the nucleus. The results are shown as means 8 SE for 30 nuclei. Panel III: Percentage of mitotic chromosome 1 (hatched columns) and interphase nuclei (black columns) occupied by HS3-1. The re-sults are shown as means 8 SE for 30 spreads or nuclei. * P ! 0.05 when compared to the HS3-1/chromosome 1 ratio in HeLa inter-phase nucleus.
Cytogenet Genome Res 118:42–54 (2007)50
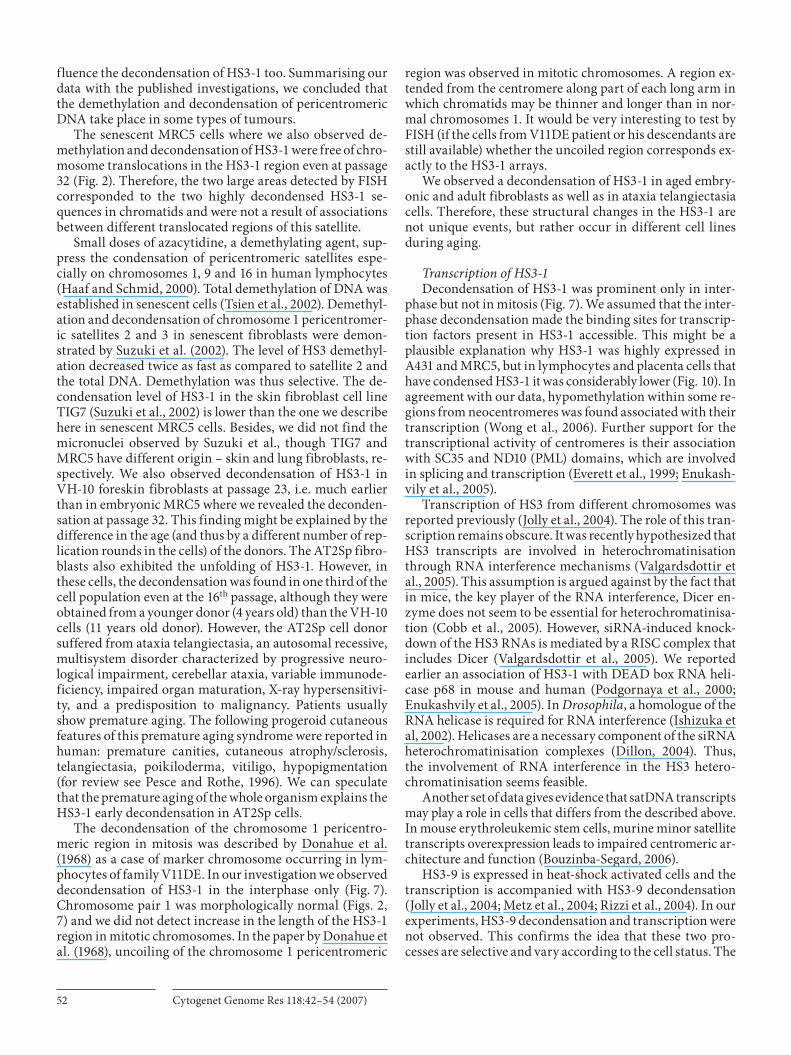
(Wong et al., 2006). Therefore we investigated whether transcripts from HS3-1 were detectable in RNA samples purified from different cell types. First, we tested the de-signed primer pairs for specificity to the HS3-1 sequence ( Fig. 10 A). We chose to use the S1/AS1 pair in our experi-ments because it amplified a single band of 336 bp HS3-1 DNA, confirmed by sequencing. The other primer pair we tested, S0/AS1, amplified several bands. Despite the fact that each of the S1 and AS1 primers has multiple comple-mentary regions in the BAC clone RP11-327C24 (GenBank Acc. No. AC079934.3) that includes the HS3-1, the combi-nation of the two primers led to amplification of a single PCR product. Another set of primers designed by Metz et al. (2004) and specific to HS3-9 was used to test the selec-tivity of transcription. It has been demonstrated that HS3-9 is transcribed specifically in heat-shock activated cells (Metz et al., 2004). Our PCR results were negative in all the cell lines when HS3-9 and HS3-1 sense (S and S1) prim-ers were used for cDNA synthesis (data not shown). We did not detect HS3-9 transcripts from the reverse (Crick) strand either ( Fig. 10 B). But the HS3-1 sequence was tran-scribed from the reverse strand in all the cell types stud-ied. When the AS1 primer was used for cDNA synthesis a PCR product of 300 bp was detected in all the samples. But in MRC5 and A431 the transcripts were much more abun-dant than in lymphocytes and placenta cells. In MRC5, the amount of the transcripts was 3-fold higher as compared to A431. We also amplified the HS3-1 transcripts by using the M13RpolyT primer in the reverse transcriptase reac-tion ( Fig. 10 C). This suggested that the transcripts were polyadenylated. The cDNA could be amplified only when the S1 primer but not the AS1 was added to the PCR mix together with the M13RpolyT primer. This confirmed the origin of the transcripts from the reverse chain. The prod-uct of amplification appeared as a single band of � 420 bp. The sequencing, however, demonstrated the presence of different transcripts of 420 bp in the band. All of them contained the full length of the HS3-1 (336 bp) but the first 90 bp 3 � from the polyA tail varied in their sequence. The cDNAs obtained from both A431 and MRC5 contained the HS3-1, but the diversity of these 90 bp made compari-son of the cDNAs from these cell lines difficult. Similarly to the RT-PCR data obtained with the AS1 primer, the amount of transcripts in MRC5 was 3-fold higher as com-pared to A431. When the HS3-1 RNA sequence common between A431 and MRC5 was translated in all six frames (three in the direction of transcription and three in the opposite one), no proteins with significant homology to the theoretically predicted ones were found in the data-bases.
Discussion
Chromosome territories and chromocenters It is assumed that chromosomes associate with each oth-
er in the interphase nucleus. The association of homologous or non-homologous chromosomes was demonstrated in in-
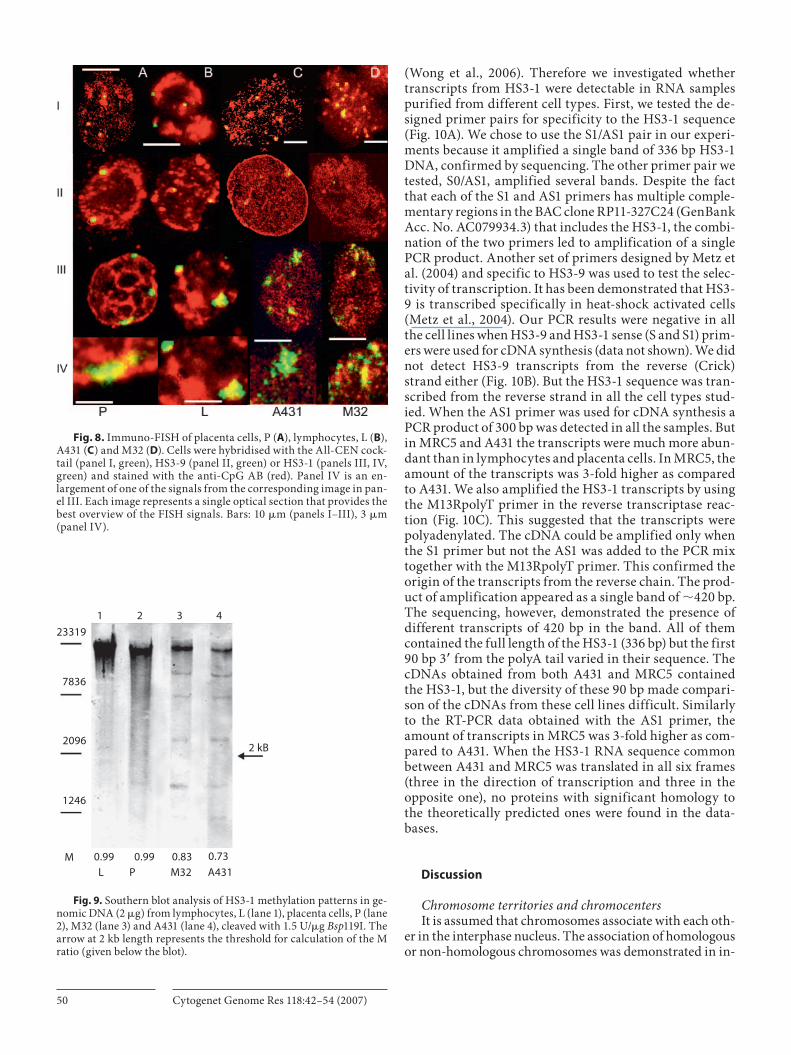
Fig. 8. Immuno-FISH of placenta cells, P ( A ), lymphocytes, L ( B ), A431 ( C ) and M32 ( D ). Cells were hybridised with the All-CEN cock-tail (panel I, green), HS3-9 (panel II, green) or HS3-1 (panels III, IV, green) and stained with the anti-CpG AB (red). Panel IV is an en-largement of one of the signals from the corresponding image in pan-el III. Each image represents a single optical section that provides the best overview of the FISH signals. Bars: 10 � m (panels I–III), 3 � m (panel IV).
1 2 3 4
23319
7836
2096
1246
2 kB
M 0.99 0.99 0.83 0.73L P M32 A431
Fig. 9. Southern blot analysis of HS3-1 methylation patterns in ge-nomic DNA (2 � g) from lymphocytes, L (lane 1), placenta cells, P (lane 2), M32 (lane 3) and A431 (lane 4), cleaved with 1.5 U/ � g Bsp 119I. The arrow at 2 kb length represents the threshold for calculation of the M ratio (given below the blot).
Cytogenet Genome Res 118:42–54 (2007) 51
sects and plants (Sharakhova et al., 1997; Vorontsova et al., 2004). In all the human cell lines we investigated here, the majority of cells contained two or more signals for both pericentromeric satellites HS3-1 and HS3-9 ( Tables 1 , 2). Hybridization signals for the homologous satellites were lo-calized at a large distance from each other ( Figs. 3–8 ). That means that at least chromosomes 1 and 9 from these cells do not associate with their homologues through their peri-centromeric sequences. Instead, an association of non-ho-mologous chromosomes was observed in all the cell types tested. It is established that the pericentromeric mouse ma-jor satellite (MaSat) is involved in the formation of the large, well-distinguishable chromocenters to the maximum ex-tent among the rest of the mouse satDNAs (Garagna et al., 2002; Kuznetsova et al., 2005). Our data demonstrate that the pericentromeric regions of human chromosomes 1 and 9 are involved in such an association of the chromosomes and thus in formation of the chromocenters.
The pericentromeric HS3 sequences not only associate with each other, but they also invade neighbouring CTs in some experimental models such as senescent fibroblasts ( Fig. 4 ). The CTs’ intermingling was demonstrated previ-ously in quiescent and stimulated lymphocytes (Branco and Pombo, 2006). Transcription-dependent chromatin inter-actions were shown to influence chromosome arrange-ments, determining specific intermingling ‘partners’ ac-cording to the cell’s repertoire of active genes (Branco and Pombo, 2006). This is to be expected because a transcrip-tionally active CT is not so highly condensed as compared to an inactive CT (Verschure et al., 1999). We found that
pericentromeric satellites of chromosomes 1 and 9 overlap in lymphocytes and A431 ( Fig. 3 ). Even more, the HS3-1 probe could penetrate non-centromeric regions of neigh-bouring CTs ( Fig. 4 ). These findings suggest interactions between pericentromeric HS3-1 and DNA from non-ho-mologous chromosome arms.
SatDNA methylation and degree of condensation Hypomethylation of pericentromeric DNA related to
some disease and carcinogenesis was previously described. The satellite 2 of chromosomes 1 and 16 and HS3-9 were found to be hypomethylated in blood cells of patients with ICF syndrome (Jeanpierre et al., 1993; Tuck-Muller et al., 2000). Satellite 2 of chromosome 1 is hypomethylated in Wilms tumours and in some hepatocellular carcinomas (Ehrlich et al., 2003). The selective demethylation of chro-mosome 1 satellites 1 and 2 was demonstrated in breast can-cer even in low grade tumours (Narayan et al., 1998; Jackson et al., 2004). The hypomethylation of pericentromeric DNA of chromosome 1 was proposed as an important stage of the breast carcinogenesis (Jackson et al., 2004). Satellites 2 and 3 are very similar. Sometimes the same sequence (e.g. the HS3-1 we used) is described as belonging to both satellite 2 and HS3 family. For the first time we report here a hypo-methylation and decondensation of the HS3-1 in a tumour cell line ( Figs. 8, 9 ) derived from vulvar carcinoma. The lev-el of HS3-1 decondensation was less in A431 than in senes-cent MRC5 cells. CpG demethylation however was most prominent in A431 compared to the other cells we studied. Hence, other factors such as histone modifications can in-
Fig. 10. ( A ) Test for specificity of the primers designed for detection of HS3-1 and HS3-9. The following sets of primers were tested: S/AS (specific for the HS3-9), S0/AS1 (amplifies the 3 � end of the HS3-1, Acc. No. X60726), and S1/AS1 (amplifies the entire HS3-1 sequence). ( B ) Reverse transcription was performed on total RNA extracted from A431, lymphocytes (L), placenta cells (P), and MRC5 at passage 32 (M32) with antisense primers AS and AS1 specific for the HS3-9 and the HS3-1, respectively. All the input extracts were normalised to en-sure equal concentrations. The cDNAs were amplified by PCR using either the S1/AS1 or the S/AS primer pair. Amplified products were
electrophoretically separated and quantified. The results from the quantification (ng) are shown below each lane. ( C ) Reverse transcrip-tion was performed on total RNA extracts prepared from A431 and MRC5 at passage 32 (M32) with the M13RpolyT primer. cDNAs were further amplified with different primer pairs (indicated above each lane), electrophoretically separated and quantified. The results from the quantification (ng) are shown below each lane. ( A–C ) 100-bp ladder used as a molecular marker (M) is shown on the left of each panel. The diffuse bands at the bottom of several lanes are primer-dimers.
Cytogenet Genome Res 118:42–54 (2007)52
fluence the decondensation of HS3-1 too. Summarising our data with the published investigations, we concluded that the demethylation and decondensation of pericentromeric DNA take place in some types of tumours.
The senescent MRC5 cells where we also observed de-methylation and decondensation of HS3-1 were free of chro-mosome translocations in the HS3-1 region even at passage 32 ( Fig. 2 ). Therefore, the two large areas detected by FISH corresponded to the two highly decondensed HS3-1 se-quences in chromatids and were not a result of associations between different translocated regions of this satellite.
Small doses of azacytidine, a demethylating agent, sup-press the condensation of pericentromeric satellites espe-cially on chromosomes 1, 9 and 16 in human lymphocytes (Haaf and Schmid, 2000). Total demethylation of DNA was established in senescent cells (Tsien et al., 2002). Demethyl-ation and decondensation of chromosome 1 pericentromer-ic satellites 2 and 3 in senescent fibroblasts were demon-strated by Suzuki et al. (2002). The level of HS3 demethyl-ation decreased twice as fast as compared to satellite 2 and the total DNA. Demethylation was thus selective. The de-condensation level of HS3-1 in the skin fibroblast cell line TIG7 (Suzuki et al., 2002) is lower than the one we describe here in senescent MRC5 cells. Besides, we did not find the micronuclei observed by Suzuki et al., though TIG7 and MRC5 have different origin – skin and lung fibroblasts, re-spectively. We also observed decondensation of HS3-1 in VH-10 foreskin fibroblasts at passage 23, i.e. much earlier than in embryonic MRC5 where we revealed the deconden-sation at passage 32. This finding might be explained by the difference in the age (and thus by a different number of rep-lication rounds in the cells) of the donors. The AT2Sp fibro-blasts also exhibited the unfolding of HS3-1. However, in these cells, the decondensation was found in one third of the cell population even at the 16 th passage, although they were obtained from a younger donor (4 years old) than the VH-10 cells (11 years old donor). However, the AT2Sp cell donor suffered from ataxia telangiectasia, an autosomal recessive, multisystem disorder characterized by progressive neuro-logical impairment, cerebellar ataxia, variable immunode-ficiency, impaired organ maturation, X-ray hypersensitivi-ty, and a predisposition to malignancy. Patients usually show premature aging. The following progeroid cutaneous features of this premature aging syndrome were reported in human: premature canities, cutaneous atrophy/sclerosis, telangiectasia, poikiloderma, vitiligo, hypopigmentation (for review see Pesce and Rothe, 1996). We can speculate that the premature aging of the whole organism explains the HS3-1 early decondensation in AT2Sp cells.
The decondensation of the chromosome 1 pericentro-meric region in mitosis was described by Donahue et al. (1968) as a case of marker chromosome occurring in lym-phocytes of family V11DE. In our investigation we observed decondensation of HS3-1 in the interphase only ( Fig. 7 ). Chromosome pair 1 was morphologically normal ( Figs. 2, 7 ) and we did not detect increase in the length of the HS3-1 region in mitotic chromosomes. In the paper by Donahue et al. (1968), uncoiling of the chromosome 1 pericentromeric
region was observed in mitotic chromosomes. A region ex-tended from the centromere along part of each long arm in which chromatids may be thinner and longer than in nor-mal chromosomes 1. It would be very interesting to test by FISH (if the cells from V11DE patient or his descendants are still available) whether the uncoiled region corresponds ex-actly to the HS3-1 arrays.
We observed a decondensation of HS3-1 in aged embry-onic and adult fibroblasts as well as in ataxia telangiectasia cells. Therefore, these structural changes in the HS3-1 are not unique events, but rather occur in different cell lines during aging.
Transcription of HS3-1 Decondensation of HS3-1 was prominent only in inter-
phase but not in mitosis ( Fig. 7 ). We assumed that the inter-phase decondensation made the binding sites for transcrip-tion factors present in HS3-1 accessible. This might be a plausible explanation why HS3-1 was highly expressed in A431 and MRC5, but in lymphocytes and placenta cells that have condensed HS3-1 it was considerably lower ( Fig. 10 ). In agreement with our data, hypomethylation within some re-gions from neocentromeres was found associated with their transcription (Wong et al., 2006). Further support for the transcriptional activity of centromeres is their association with SC35 and ND10 (PML) domains, which are involved in splicing and transcription (Everett et al., 1999; Enukash-vily et al., 2005).
Transcription of HS3 from different chromosomes was reported previously (Jolly et al., 2004). The role of this tran-scription remains obscure. It was recently hypothesized that HS3 transcripts are involved in heterochromatinisation through RNA interference mechanisms (Valgardsdottir et al., 2005). This assumption is argued against by the fact that in mice, the key player of the RNA interference, Dicer en-zyme does not seem to be essential for heterochromatinisa-tion (Cobb et al., 2005). However, siRNA-induced knock-down of the HS3 RNAs is mediated by a RISC complex that includes Dicer (Valgardsdottir et al., 2005). We reported earlier an association of HS3-1 with DEAD box RNA heli-case p68 in mouse and human (Podgornaya et al., 2000; Enukashvily et al., 2005). In Drosophila , a homologue of the RNA helicase is required for RNA interference (Ishizuka et al, 2002). Helicases are a necessary component of the siRNA heterochromatinisation complexes (Dillon, 2004). Thus, the involvement of RNA interference in the HS3 hetero-chromatinisation seems feasible.
Another set of data gives evidence that satDNA transcripts may play a role in cells that differs from the described above. In mouse erythroleukemic stem cells, murine minor satellite transcripts overexpression leads to impaired centromeric ar-chitecture and function (Bouzinba-Segard, 2006).
HS3-9 is expressed in heat-shock activated cells and the transcription is accompanied with HS3-9 decondensation (Jolly et al., 2004; Metz et al., 2004; Rizzi et al., 2004). In our experiments, HS3-9 decondensation and transcription were not observed. This confirms the idea that these two pro-cesses are selective and vary according to the cell status. The
Cytogenet Genome Res 118:42–54 (2007) 53
References
Almeida A, Kokalj-Vokac N, Lefrancois D, Viegas-Pequignot E, Jeanpierre M, et al: Hypomethyl-ation of classical satellite DNA and chromo-some instability in lymphoblastoid cell lines. Hum Genet 91: 538–546 (1993).
Barki-Celli L, Lefebvre C, Le Baccon P, Nadeau G, Bonnefoix T, et al: Differences in nuclear posi-tioning of 1q12 pericentric heterochromatin in normal and tumor B lymphocytes with 1q rear-rangements. Genes Chromosomes Cancer 43: 339–349 (2005).
Bouzinba-Segard H, Guais A, Francastel C: Accu-mulation of small murine minor satellite tran-scripts leads to impaired centromeric architec-ture and function. Proc Natl Acad Sci USA 103: 8709–8714 (2006).
Boyum A: Separation of leukocytes from blood and bone marrow. Introduction. Scand J Clin Lab Invest Suppl 97: 7 (1968).
Branco MR, Pombo A: Intermingling of chromo-some territories in interphase suggests role in translocations and transcription-dependent associations. PLoS Biol 4:e138 (2006).
Cerda MC, Berrios S, Fernandez-Donozo R, Garag-na S, Redi C: Organization of complex nuclear domains in somatic mouse cells. Biol Cell 91: 55–65 (1999).
Chevret E, Volpi E, Sheer D: Mini review: Form and function in the human interphase chromo-somes. Cytogenet Cell Genet 90: 13–21 (2000).
Choo KHA, Earle E, Vissel B, Kalitsis P: A chromo-some 14-specific human satellite III DNA sub-family that shows variable presence on different chromosomes 14. Am J Hum Genet 50: 706–716 (1992).
Cobb BS, Nesterova TB, Thompson E, Hertweck A, O’Connor E, et al: T cell lineage choice and dif-ferentiation in the absence of the RNase III en-zyme Dicer. J Exp Med 201: 1367–1373 (2005).
Cooke HJ, Hindley J: Cloning of human satellite III DNA: different components are on different chromosomes. Nucleic Acids Res 6: 3177–3197 (1979).
Cremer T, Cremer C: Chromosome territories, nu-clear architecture and gene regulation in mam-malian cells. Nat Rev Genet 2: 292–301 (2001).
Dillon N: Heterochromatin structure and function. Biol Cell 96: 631–637 (2004).
Donahue RP, Bias W, Renwick J, McKusik V: Prob-able assignment of the Duffy blood group locus to chromosome 1 in man. Proc Natl Acad Sci USA 61: 949–955 (1968).
Ehrlich M, Hopkins NE, Jiang G, Dome JS, Yu MC, et al: Satellite DNA hypomethylation in karyo-typed Wilms tumors. Cancer Genet Cytogenet 141: 97–105 (2003).
Enukashvily NI, Donev RM, Sheer D, Podgornaya OI: Satellite DNA binding and cellular localisa-tion of RNA helicase P68. J Cell Sci 118: 611–622 (2005).
Everett RD, Earnshaw WC, Pluta AF, Sternsdorf T, Ainsztein AM, et al: A dynamic connection be-tween centromeres and ND10 proteins. J Cell Sci 112: 3443–3454 (1999).
Frommer M, Paul C, Vincent PC: Localisation of satellite DNA sequences on human metaphase chromosomes using bromodeoxyuridine-la-belled probes. Chromosoma 97: 11–18 (1988).
question whether there is a difference in satDNA transcrip-tion between differentiating, somatic, malignant and senes-cent cells remains to be elucidated. The existence of such a difference would explain why satDNA transcription occurs during processes that are so different from each other (such as malignisation and senescence).
SatDNA localisation HS3-1 tends to localise at the nuclear periphery in all
cells we analysed here ( Table 2 ). HS3-9 did not have such a strong tendency for peripheral localization ( Table 1 ), though their nucleotide sequences share homology ( Fig. 1 ). Barki-Celli et al. (2005) reported that the 1q12 heterochromatic domain dynamically localizes to the nuclear periphery in response to B-cell receptor engagement in activated normal and tumour B-lymphocytes. Here we observed a localisa-tion of HS3-1 in the nuclear periphery of human quiescent peripheral blood lymphocytes. The same localisation was observed in fibroblasts, both young and senescent. In ma-lignant A431 and HeLa cell lines where most of the cells showed more than two HS3-1 hybridisation signals, only two of the satellites were localised in the nuclear periphery. Mechanisms of the HS3-1 disposition to the nuclear enve-lope remain to be elucidated. One possibility is the binding of this satellite DNA to SAF-A in a SAF-A/Lamin B complex (Lobov et al., 2001). Our data on tumour cells suggest that the HS3-1 nucleotide sequence itself is not sufficient to de-termine a perimembrane positioning of the corresponding chromosome regions. A plausible explanation for the intra-nuclear localisation of HS3-1 is that this satellite may con-tain very short insertions/deletions particularly in aberrant chromosomes recognised by the chromosome 1 paint. Such mutations would not be distinguished by the HS3-1 probe, but may affect the SAF-A binding.
Solovei et al. (2004) performed a very thorough investi-gation on the centromere distribution at different stages of the cell cycle in quiescent and stimulated lymphocytes, syn-
chronised fibroblasts, and in SH-EP N14 tumour cells. In our experiments we did not synchronise the cells. However, the quiescent (i.e. non-dividing) lymphocytes we used were all in the G0. The aged fibroblasts M32 were mostly in G0/G1 as the aged cells stop in G0. Most of the young asynchro-nous MRC5 cells, HeLa and A431 were in G0/G1 too. There-fore, we assume that our data on the peripheral localisation of the HS3-1 are generally in accordance with the data of Solovei et al. (2004). The percentage of internally located centromere signals counted by Solovei et al. was approxi-mately 20% even in synchronised fibroblasts and tumour cells in S/G2. Taking into account the small percentage of cells in S/G2 in unsynchronised culture, we thus believe that this would not significantly change our calculations. We also observed an association between HS3-1 and HS3-9 that takes place in the clusterisation process in G1 described by Solovei et al. However, in our experiments HS3-9 was lo-cated mostly internally in HeLa, M32 and A431 cells. So-lovei et al. (2004) did not use chromosome-specific centro-mere probes. However, in all stages (except S) they estimat-ed that approximately 30% of centromeres were internally localised. We suppose that the centromere of chromosome 9 might be included in this number.
Taken together our data demonstrate that in senescent fibroblasts and some malignant cells, HS3-1 is demethyl-ated and decondensed. That results in the expansion of HS3-1 into chromosome 9 territory. These structural chang-es make the satellite readily accessible for transcription fac-tors resulting in increased expression of HS3-1 RNA.
Acknowledgements
We are very grateful to Prof. M. Ferguson-Smith for the chromo-some 1 paint, to Prof. V.M. Mikhelson and Dr. N. Smirnova for the AT2Sp and VH-10 cells. B.A. Dianova helped us greatly in the prepara-tion of the manuscript.
Cytogenet Genome Res 118:42–54 (2007)54
Garagna S, Zuccotti M, Capanna E, Redi CA: High-resolution organization of mouse telomeric and pericentromeric DNA. Cytogenet Genome Res 96: 125–129 (2002).
Gosden JR, Mitchell AR, Buckland RA, Clayton RP, Evans HJ: The location of four human satellite DNAs on human chromosomes. Exp Cell Res 92: 148–158 (1975).
Haaf T, Schmid M: Experimental condensation in-hibition in constitutive and facultative hetero-chromatin of mammalian chromosomes. Cyto-genet Cell Genet 91: 113–123 (2000).
Herrington CS, McGee JO’D (eds): Diagnostic Mo-lecular Pathology: A Practical Approach (IRL Press, Oxford 1992; Russian ed. 1999).
Higgins MJ, Wang H, Shtromas I, Haliotis T, Roder JC, et al: Organization of a repetitive human 1.8 kb Kpn I sequence localized in the heterochro-matin of chromosome 15. Chromosoma 93: 77–86 (1985).
Hsu TS: A possible function of constitutive hetero-chromatin: the bodyguard hypothesis. Genet-ics 79 (suppl 2):137–150 (1975).
Ishizuka A, Siomi MC, Siomi H: A Drosophila frag-ile X protein interacts with components of RNAi and ribosomal proteins. Genes Dev 16: 2497–2508 (2002).
Jackson K, Yu MC, Arakawa K, Fiala E, Youn B, et al: DNA hypomethylation is prevalent even in low-grade breast cancers. Cancer Biol Ther 3: 1225–1231 (2004).
Jeanpierre M, Turleau C, Aurias A, Prieur M, Le-deist F, et al: An embryonic-like methylation pattern of classical satellite DNA is observed in ICF syndrome. Hum Mol Genet 2: 731–735 (1993).
Jolly C, Metz A, Govin J, Vigneron M, Turner BM, et al: Stress-induced transcription of satellite III repeats. J Cell Biol 164: 25–33 (2004).
Kuznetsova IS, Prusov AN, Enukashvily NI, Pod-gornaya OI: New types of mouse centromeric satellite DNAs. Chromosome Res 13: 9–25 (2005).
Kuznetsova IS, Podgornaya OI, Ferguson-Smith M: High-resolution organization of mouse centro-meric and pericentromeric DNA. Cytogenet Genome Res 112: 248–255 (2006).
Lee C, Wevrick R, Fisher RB, Ferguson-Smith MA, Lin CC: Human centromeric DNAs. Hum Ge-net 100: 291–304 (1997).
Lobov IB, Tsutsui K, Mitchell AR, Podgornaya OI: SAF-A and lamin B binding specificity in vitro correlates with the satellite DNA bending state. J Cell Biochem 83: 218–229 (2001).
Mahy N, Perry P, Bickmore W: Gene density and transcription influence the localisation of chromatin outside of chromosome territories detectable by FISH. J Cell Biol 159: 753–763 (2002).
Manuelidis L: A view of interphase chromosomes. Science 250: 1533–1540 (1990).
Metz A, Soret J, Vourc’h C, Tazi J, Jolly C: A key role for stress-induced satellite III transcripts in the relocalization of splicing factors into nuclear stress granules. J Cell Sci 117: 4551–4558 (2004).
Moyzis RK, Albright KL, Bartholdi MF, Cram LS, Deaven LL, et al: Human chromosome specific repetitive DNA sequences: novel markers for genetic analysis. Chromosoma 95: 375–386 (1987).
Narayan A, Ji W, Zhang XY, Marrogi A, Graff JR, et al: Hypomethylation of pericentromeric DNA in breast adenocarcinomas. Int J Cancer 77: 833–838 (1998).
Nygren J, Cedervall B, Eriksson S, Dusinska M, Kolman A: Induction of DNA strand breaks by ethylene oxide in human diploid fibroblasts. Environ Mol Mutagen 24: 161–167 (1994).
Pesce K, Rothe M: The premature aging syndromes. Clin Dermatol 14: 161–170 (1996).
Podgornaya O, Dey R, Lobov I, Enukashvily N: Hu-man satellite 3 binding protein from the nucle-ar matrix: isolation and binding properties. Biochim Biophys Acta 1497: 204–214 (2000).
Prosser J, Frommer M, Paul C, Vincent PC: Se-quence relationships of three human satellite DNAs. J Mol Biol 187: 145–155 (1986).
Prusov AN, Zatsepina OV: Isolation of the chromo-center fraction from mouse liver nuclei. Bio-chemistry (Moscow) 67: 423–431 (2002).
Rizzi N, Denegri M, Chiodi I, Corioni M, Valgards-dottir R, et al: Transcriptional activation of a constitutive heterochromatic domain of the human genome in response to heat shock. Mol Biol Cell 15: 543–551 (2004).
Sambrook J, Maniatis T, Fritsch EF: Molecular Cloning: A Laboratory Manual (Cold Spring Harbor Laboratory Press, Cold Spring Harbor, NY 1989).
Savelyeva L, Mamaeva S: Heterogeneity and bal-ance of chromosomes in human cell line M-HeLa-76: analysis of 100 karyotypes. Cancer Genet Cytogenet 28: 311–325 (1987).
Sharakhova MV, Sharakhov IV, Stegnii VN: Chro-mocenter organization in salivary glands of the malaria mosquito Anopheles messeae Fall. Ge-netika 33: 196–201 (1997).
Shiels C, Coutelle C, Huxley C: Contiguous arrays of satellites 1, 3, and b form a 1.5-Mb domain on chromosome 22p. Genomics 44: 35–44 (1997).
Solovei I, Schermelleh L, During K, Engelhardt A, Stein S, et al: Differences in centromere posi-tioning of cycling and postmitotic human cell types. Chromosoma 112: 410–423 (2004).
Suzuki T, Fujii M, Ayusawa D: Demethylation of classical satellite 2 and 3 DNA with chromo-somal instability in senescent human fibro-blasts. Exp Gerontol 37: 1005–1014 (2002).
Therkelsen AJ, Nielsen A, Kølvraa S: Localisation of the classical DNA satellites on human chromo-somes as determined by primed in situ labelling (PRINS). Hum Genet 100: 322–326 (1997).
Tsien F, Fiala ES, Youn B, Long TI, Laird PW, et al: Prolonged culture of normal chorionic villus cells yields ICF syndrome-like chromatin de-condensation and rearrangements. Cytogenet Genome Res 98: 13–21 (2002).
Tuck-Muller CM, Narayan A, Tsien F, Smeets DF, Sawyer J, et al: DNA hypomethylation and un-usual chromosome instability in cell lines from ICF syndrome patients. Cytogenet Cell Genet 89: 121–128 (2000).
Valgardsdottir R, Chiodi I, Giordano M, Cobianchi F, Riva S, Biamonti G: Structural and function-al characterization of noncoding repetitive RNAs transcribed in stressed human cells. Mol Biol Cell 16: 2597–2604 (2005).
Verschure PJ, van Der Kraan I, Manders EM, van Driel R: Spatial relationship between transcrip-tion sites and chromosome territories. J Cell Biol 147: 13–24 (1999).
Vilain A, Bernardino J, Gerbault-Seureau M, Vogt N, Niveleau A, et al: DNA methylation and chromosome instability in lymphoblastoid cell lines. Cytogenet Cell Genet 90: 93–101 (2000).
Vissel B, Choo K: Mouse major (gamma) satellite DNA is highly conserved and organized into extremely long tandem arrays: implications for recombination between nonhomologous chro-mosomes. Genomics 5: 407–414 (1989).
Visser A, Aten J: Chromosomes as well as chromo-somal subdomains constitute distinct units in interphase nuclei. J Cell Sci 112: 3353–3360 (1999).
Volpi EV, Chevret E, Jones T, Vatcheva R, William-son J, et al: Large-scale chromatin organization of the major histocompatibility complex and other regions of human chromosome 6 and its response to interferon in interphase nuclei. J Cell Sci 113: 1565–1576 (2000).
Vorontsova M, Shaw P, Reader S, Moore G: Effect of 5-azacytidine and trichostatin A on somatic centromere association in wheat. Genome 47: 399–403 (2004).
Willard HF, Waye JS: Chromosome-specific sub-sets of human alpha satellite DNA: analysis of sequence divergence within and between chro-mosomal subsets and evidence for an ancestral pentameric repeat. J Mol Evol 25: 207–217 (1987).
Wong NC, Wong LH, Quach JM, Canham P, Craig JM, et al: Permissive transcriptional activity at the centromere through pockets of DNA hypo-methylation. PLoS Genet 2: 17 (2006).
Copyright © 2022 FDOKUMEN