home economics - Te Kura
92
te mĀtauranga ohaoha kĀinga home economics 2013/1 HE3001 INFORMATION DOWNLOAD NCEA LEVEL 3
-
Upload
khangminh22 -
Category
Documents
-
view
4 -
download
0
Transcript of home economics - Te Kura

te mĀtauranga ohaoha kĀinga
home economics
2013/1
HE3001INFORMATION DOWNLOAD
NCEA LEVEL 3

© te aho o te kura pounamu
home economicsncea level 3
Expected time to complete workThis work will take you about 25 hours to complete.
You will work towards the following standard: Achievement Standard 91466 (Version 1) Home Economics 3.1 Investigate a nutritional issue affecting the well-being of New Zealand society Level 3, Internal 5 credits
In this booklet you will focus on these learning outcomes: • identifying qualitative and quantitative data to critically analyse a current nutritional issue of
significance to New Zealand
• examining the interconnections between determinants of health and wellbeing
• assessing how attitudes and values affect our food choices
• interpreting food labels and nutritional information.
You will continue to work towards this standard in booklet HE3002.
Copyright © 2013 Board of Trustees of Te Aho o Te Kura Pounamu, Private Bag 39992, Wellington Mail Centre, Lower Hutt 5045,
New Zealand. All rights reserved. No part of this publication may be reproduced or transmitted in any form or by any means with-
out the written permission of Te Aho o Te Kura Pounamu.

1HE3001© te aho o te kura pounamu
contents
1 Introducing the topic
2 Finding information
3 Determinants of health
4 Stakeholders
5 Attitudes and values
6 Food labels
7 What do labels say?
8 Food for health
9 Lifestyle diseases
10 Answer guide

2 HE3001 © te aho o te kura pounamu
how to do the work
When you see:
1A Complete the activity.
Check your answers.
Your teacher will assess this work.
Contact your teacher.
Check the website.
You will need:
• access to the internet for research
• the Summary of resources insert (HE3001A)
• The Determinants of health A3 diagram (HE3001B).
Resource overviewIn this booklet you will:
• learn how to complete an investigation and begin to study a nutritional issue
• begin your own research.
Write your self-marked activities in the spaces provided. At the end of each lesson, mark your practice work from the Answer guide. The answers give you essential feedback. Use them to help you learn.
Phone or email your teacher if you would like to discuss your work.
When you have completed the work, send this booklet back to your teacher for assessment.

3HE3001© te aho o te kura pounamu
In this lesson you will learn to:
• analyse written material about a nutritional issue.
introductionThe nutritional issue we will study for this achievement standard is:
Overconsumption of sugary and caffeinated drinks
We will investigate this issue by:
• defining the nutritional issue
• selecting sufficient qualitative and quantitative information to enable trends or patterns, and their causes to be described
• examining interconnections between the issue and contributing factors for example: determinants, attitudes, values, key stakeholders
• analysing the implications of the issue for the wellbeing of New Zealand society.
Read these extracts from articles posted on www.stuff.co.nz
introducing the topic1
The sister of a woman whose partner claimed she died because she drank too much Coca-Cola says she does not hold the company responsible.
However, the woman’s partner and mother-in-law say warning labels should be put on the drink.
An inquest for mother-of-eight, Natasha Harris, was held in Invercargill yesterday. Ms Harris died on February 25, 2010.
Otago-Southland coroner David Crerar did not make any preliminary findings after yesterday’s inquest, however pathologist Dan Mornin said he believed Ms Harris died of cardiac arrhythmia and it was likely she was
suffering from hypokalaemia (low potassium) along with caffeine toxicity, which could have contributed to her death.
When asked by Mr Crerar whether it was probable her consumption of Coca-Cola had caused the hypokalaemia and arrhythmia, Dr Mornin said yes, along with poor nutrition and caffeine.
At the inquest, Ms Harris’ partner, Chris Hodgkinson, said his partner consumed between 4.5 and 8 litres of
Coke a day for several years before her death, and he believed this had contributed to her death.
COCA-COLA NOT TO BLAME FOR DEATH – SISTERNicci McDougall and Alana Dixon
isto
ck

4 © te aho o te kura pounamuHE3001
introducing the topic
His mother, Vivien Hodgkinson said after the inquest that warning labels should be put on Coke products.
However, Ms Harris’ sister Raelene Finlayson yesterday said no-one had forced her sister to drink the Coke, and she did not hold Coca-Cola responsible for her death. ‘Nobody forced Tasha to drink all that … it’s like anything, we all know anything in moderation is okay,’ she said.
The last time she saw her sister, about a week before her death, she had looked unwell, Ms Finlayson said. She told her she should see a doctor, but her sister put her children before herself.
In a statement issued after the inquest, Coca-Cola Oceania public affairs and communication manager Karen Thompson, who also attended the inquest yesterday,
said the safety of the company’s products was paramount.
‘We concur with the information shared by the coroner’s office that the grossly excessive ingestion of any food product, including water, over a short period of time with the inadequate consumption of essential nutrients, and the failure to seek appropriate medical intervention when needed, can be dramatically symptomatic …
‘We believe that all foods and beverages can have a place in a balanced and sensible diet combined with an active lifestyle,’ the statement says.
The company’s thoughts were with the Hodgkinson family, but as the coroner had not yet issued findings into Ms Harris’ death, it was not appropriate for Coca-Cola to comment further, it says.
ww
w.s
tuff
.co.
nz,
20
febr
uary
201
2, f
airf
ax n
z n
ews;
isto
ck
TOO MUCH OF ANY LIQUID CAN BE DEADLYDrinking up to 8 litres of any liquid a day can kill you, regardless of how much sugar or caffeine it contains, a Wellington dietician says.
Foodsavvy’s Sarah Elliot said that when ‘extreme’ amounts of fluid were consumed regularly, the body’s cells could rupture.
‘Ten litres of fluid a day could kill you, no matter what it is.’
Specialists recommend that humans do not drink more than four litres a day. Natasha Harris’ daily intake of Coca-Cola would have given her up to a ‘shocking’ 3424 calories and 864 grams (or 3 ½ cups) of sugar, Mrs Elliott said.
Also, the combination of caffeine and sugar encouraged addiction, and soft drinks were shown to make bones thinner and cause osteoporosis. Mrs Elliott had one client whose five-litre-a-day Coke addiction had led to sweating and problems with his weight, skin and teeth.
…
Addictions are serious and she (Mrs Harris) would have needed therapy to get through that, and would not have been able to just stop.
ww
w.s
tuff
.co.
nz,
20
febr
uary
201
2, f
airf
ax n
z n
ews;
isto
ck

5© te aho o te kura pounamu HE3001
introducing the topic
WOMAN ADDICTED TO COKE ‘ALWAYS FELT ILL’Michelle Cooke
Mother of eight Natasha Harris always said she wouldn’t live to an old age.
In fact, one year before her death she told her sister-in-law that she thought she was going to die soon. She always felt ill.
Doctors had discovered a cyst on the Southland woman’s ovaries and nurses were calling her to come in and get it checked, but she never returned their calls, her half-sister Raelene Finlayson says.
She urged her to go to the doctor, but her younger sister ‘Tasha’ was the type of person ‘that when you tell her to do something she would do the complete opposite.’
An autopsy determined it wasn’t cancerous, but Ms Finlayson is left wondering ‘what if?’
‘If she had gone in for that then who knows? They might have picked up in her blood work that she was so unwell.’
Ms Harris was dead one week later. It was February 2010, but news of her death gained media attention only recently, making international headlines.
Her story went viral after her partner of 15 years Chris Hodgkinson told an Invercargill coroner’s inquest he believed Coca-Cola had caused her death.
He said she drank up to eight litres a day. Her mother, and half-brothers and sister dispute that, but agree she was addicted to the sugary soft drink.
Ms Harris lived such a ‘tragic, sad life’ she drowned her sorrows in the drink, they say.
She wanted to leave her partner, who was the only man she had ever been in a relationship with, but felt ‘trapped’, fearing she couldn’t
look after all of their children on her own.
Their story is in stark contrast to the picture Mr Hodgkinson’s mother Vivien paints.
Ms Hodgkinson says the couple were planning their wedding, and her distraught son slipped a ring onto her finger when she was lying in the coffin on the living room floor.
What is undisputed is how much Ms Harris liked Coke. It would be a very rare occasion to see her without a can or a bottle. One of the bouquets at her funeral was even made from Coke cans.
Ms Finlayson wanted to share her sister’s story because she’s not alive to defend herself from comments that she must have been stupid for drinking so much soft drink.
‘People need to have walked in her shoes’ to understand why she did it, Ms Finlayson said.
‘As people use marijuana or alcohol, she used Coke as a comfort and obviously got addicted.
‘She wasn’t stupid. She lived a tragic sad life and the Coke was her comfort. She had very little other than her kids.’
The first thing she would do in the morning was have a glass of Coke, and then she’d finish her day the same way. Mr Hodgkinson told the inquest, ‘I didn’t think a soft drink was going to kill her.’
The inquest was also told her teeth had all rotted and she smoked between 25 and 30 cigarettes a day.

6 © te aho o te kura pounamuHE3001
introducing the topic
Pathologist Dan Mornin said he believed Ms Harris died of cardiac arrhythmia. It was likely she was suffering from hypokalaemia, a condition in which potassium levels in the blood are low. That, along with caffeine toxicity, could have attributed to her death, the inquest was told.
Just drinking up to eight litres of liquid a day could kill someone, a Wellington dietician said.
The coroner’s findings due soon may provide more insight into what happened to Brett Duffy’s youngest sister.
‘The sister I buried was very gaunt and very sad,’ he says. Mr Duffy believes the Hodgkinson’s are purposefully pushing the argument that drinking too much Coca-Cola caused her death. ‘This is not a family vendetta,’ Mr Duffy says.
‘But I don’t want her remembered as a freak who died from drinking too much Coca-Cola.’
Coca-Cola’s ingredients make it addictive, National Addiction Centre director Doug Seeman says, and addicts crave something which gives them pleasure, time and time again.
That’s exactly what Ms Harris got out of a glass of Coca-Cola, her family says.
She was an exhausted, stressed mother, who sought comfort, a moment’s pleasure, in a glass of Coke. It became a habit, and then she got hooked.
She would have turned 33 next month, her whole life spent in Invercargill, never venturing further than Blenheim, where her brother Brett lives.
She was the youngest of a large family, with both parents already having children from previous marriages.
When she was three her father was killed in a car crash, which left her mother in hospital for months. Ms Finlayson had to quit her job to care for her sister, who was fifteen years younger.
Ms Harris lived a modest life and didn’t have much, but she loved her kids and always put them first. If they wanted a second serving of dinner and there wasn’t enough, she would go without.
She would start planning birthday parties weeks in advance and would be organising next Christmas as soon as one had passed.
She got together with Mr Hodgkinson when she was 15, and spent the rest of her life with him.
They had eight children in eight years. They are now aged between five and 13.
‘She was one of the best mothers you could get and one of the best friends,’ Ms Hodgkinson says about her son’s partner.
Birthday parties were a whole family affair, at least 50 or 60 people. ‘And she would cook all the food herself.’
Ms Hodgkinson moved into her son’s house the day Ms Harris was found dead.
But she says her son couldn’t stand being inside the house after she died and is haunted by images of her lying dead on the floor.
‘He lost his whole life with Natasha. He lost his children, his money and he absolutely lost his mind,’’ she says.
All of the children are now in the care of Child, Youth and Family Services, with provisions to see each other and extended family.
isto
ck
ww
w.s
tuff
.co.
nz,
4 m
ay 2
012,
fai
rfax
nz
new
s; is
tock
7© te aho o te kura pounamu HE3001
introducing the topic
cause of deathUse the extracts above to answer the following questions.
1. What did the pathologist say Ms Harris died of?
2. How much sugar was Ms Harris consuming per day?
3. What health issues did Ms Harris suffer that contributed to her always feeling ill?
key stakeholder comments4. What did the representative from Coca-Cola Oceania say after the inquest to justify their
product?
1A

8 © te aho o te kura pounamuHE3001
introducing the topic
5. Find a comment on Ms Harris’ death from each of the stakeholders listed below.
A family member:
Dietician:
National Addiction Centre:
Pathologist:
determinants of health6. What were Ms Harris’ attitudes and values to life?

9© te aho o te kura pounamu HE3001
introducing the topic
7. What positive feelings did Ms Harris get from drinking Coke?
8. What do you think the economic situation of the family was? What may have contributed to this?
type of evidence9. Identify two factual statements from the extracts.
•
•
10. Identify two statements that are based on opinion from the extracts.
•
•
10 © te aho o te kura pounamuHE3001
introducing the topic
critical thinking skills11. Do you think the Coca-Cola Company can be held responsible for Ms Harris’ death? Give
reasons and supporting evidence from the extracts.
Your teacher will be interested in reading your answer.

11© te aho o te kura pounamu HE3001
introducing the topic
The story of Ms Harris’ death highlights how:
Overconsumption of sugary and caffeinated drinks is a nutritional issue affecting the wellbeing of New Zealand society.
To understand this issue we need to investigate the factors that contribute to it and their interconnections.
In the following lessons you will examine these factors in more detail. This will help you become familiar with the terminology used in the diagram above. These terms will come up again in other topics in this Level 3 Home Economics course.
Interconnections of factors that contribute to
the issue
NZ Food & Nutrition Guidelines
Food choice and availability.Food labelling.
Determinants of health and wellbeing
Hauora
Critical thinking
Evaluate credible quantitative and qualitative evidence.
Key stakeholders
For example, multinational companies
Attitudes and values
Around the issue.

12 HE3001 © te aho o te kura pounamu
finding information2
learning intentionIn this lesson you will learn:
• how to locate and record references for research.
introductionWhen writing a report about an issue you will have to include references for your supporting details. Choosing the references you will use is a matter of examining them closely to weed out unreliable sources. Choose only professional, credible sources for your report if you want your references to adequately support the points you make.
instructions for finding credible sources1. Find primary sources. Primary sources are ones that document first-hand research and
information. They might include articles and notes about research a person has conducted.
2. Find secondary sources. Secondary sources analyze existing research and information; they include articles by authors discussing someone else’s research or thesis.
3. Find quantitative data. Quantitative data is any data that is in numerical form such as statistics, percentages, and so on. This means that the quantitative researcher asks a specific, narrow question and collects numerical data from participants to answer the question. The researcher analyses the data with the help of statistics. The researcher is hoping the numbers will yield an unbiased result that can be generalised to some larger population. Quantitative research is generally made using scientific methods.
4. Find qualitative data. Qualitative research asks broad questions and collects word data from participants. The researcher looks for themes and describes the information in themes and patterns exclusive to that set of participants. Qualitative research is more subjective. It assumes that the researcher must interact with the subjects of the study. It is less formal, and can be expressed as words, pictures and objects. An example of qualitative research is conducting a case study.
5. Use print resources that have been published within the last five years, whenever possible. These sources include encyclopaedias, anthologies and journal articles. If you search for journal articles, find them in professional or academic journals rather than popular magazines.
6. Use internet sources carefully. Websites owned by professional or academic institutions are acceptable; these might include university websites or foundation websites. You can also usually trust sites owned by hospitals or medical research facilities, established scholars and government agencies.
7. Avoid personal websites, blogs, and all written material meant to sell something.
isto
ck

13© te aho o te kura pounamu HE3001
finding information
tips & warnings • Strive to include both primary and secondary sources in your reference list.
• Try to limit your search to journals that are peer-reviewed, which means that the information in the journals has been verified by credible sources.
• If a source has a credible author, such as an authority figure in that subject area, it is probably a credible source. Avoid any source that does not have an identifiable author.
Regardless of what type of sources you use, they must be credible. In other words, your sources must be reliable, accurate, and trustworthy.
Some credible reference material could be found on the following websites:
isto
ck
The Ministry of Health www.health.govt.nz/
The NZ Medical Journal www.journal.nzma.org.nz/journal/
Otago University www.otago.ac.nz/
Healthy Food Magazine www.healthyfood.co.nz/
The New Scientist www.newscientist.com/
Good Food News www.sanitarium.co.nz/health-and-wellbeing/good-food-news
14 © te aho o te kura pounamuHE3001
finding information
using research and evidence
how do i know if a source is credible?You can ask the following questions to determine if a source is credible:
Who is the author?Credible sources are written by authors respected in their fields of study. Responsible, credible authors will cite their sources so you can check the accuracy of what they have written. (This is also a good way to find more sources for your own research.)
How recent is the source?The choice to seek recent sources depends on your topic. While sources on the American Civil War may be decades old and still contain accurate information, sources on information technologies, or other areas that are experiencing rapid changes, need to be much more current.
What is the author’s purpose?When deciding which sources to use, you should take the purpose or point of view of the author into consideration. Is the author presenting a neutral, objective view of a topic? Or is the author advocating one specific view of a topic? Who is funding the research or writing of this source? A source written from a particular point of view may be credible; however, you need to be careful that your sources don’t limit your coverage of a topic to one side of a debate.
Consider your audienceYou will be writing an academic paper. Sources of credible evidence may be found in peer-reviewed journals, magazines such as The Listener or the NZ Healthy Food magazine, reputable newspaper articles (e.g. the Times or Herald).
Be especially careful when evaluating internet sources!Never use websites where an author cannot be determined, unless the site is associated with a reputable institution such as a respected university, a credible media outlet, government programme or department, or well-known non-governmental organisations. Beware of using sites like Wikipedia, which are collaboratively developed by users. Because anyone can add or change content, the validity of information on such sites may not meet the standards for academic research.
bigs
tock
15© te aho o te kura pounamu HE3001
finding information
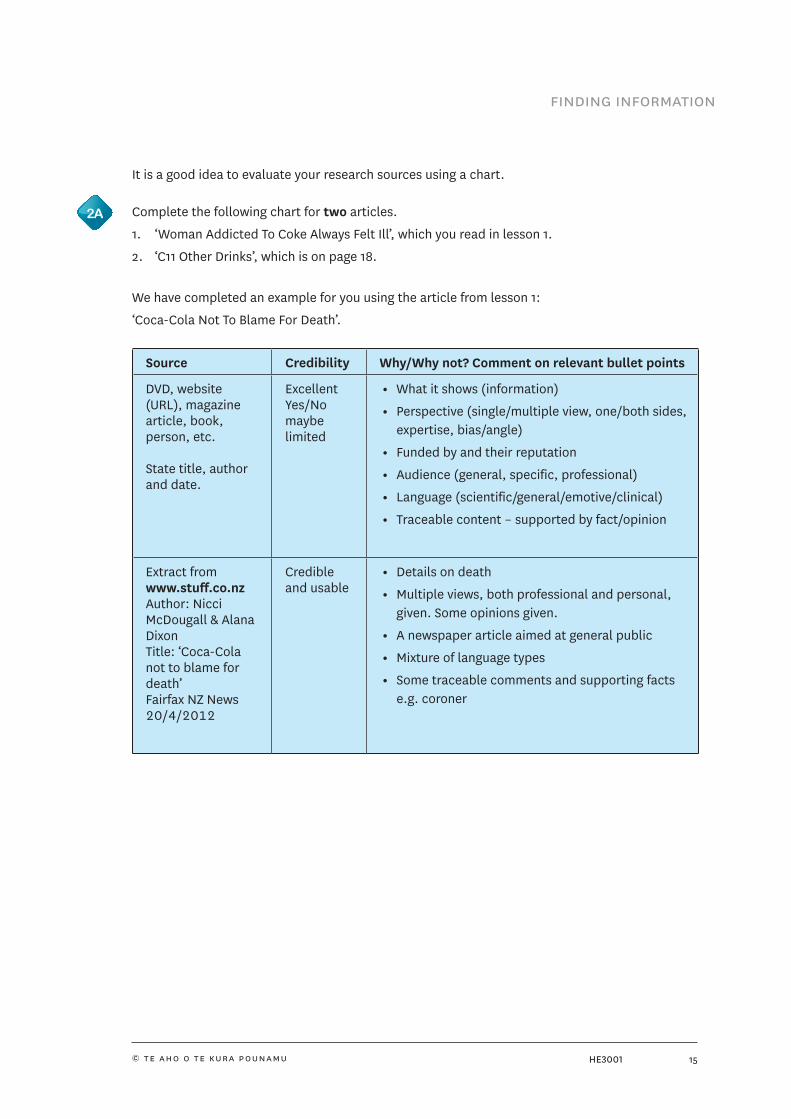
It is a good idea to evaluate your research sources using a chart.
Complete the following chart for two articles.
1. ‘Woman Addicted To Coke Always Felt Ill’, which you read in lesson 1.
2. ‘C11 Other Drinks’, which is on page 18.
We have completed an example for you using the article from lesson 1:
‘Coca-Cola Not To Blame For Death’.
Source Credibility Why/Why not? Comment on relevant bullet points
DVD, website (URL), magazine article, book, person, etc.
State title, author and date.
ExcellentYes/Nomaybelimited
• What it shows (information)
• Perspective (single/multiple view, one/both sides, expertise, bias/angle)
• Funded by and their reputation
• Audience (general, specific, professional)
• Language (scientific/general/emotive/clinical)
• Traceable content – supported by fact/opinion
Extract from www.stuff.co.nz Author: Nicci McDougall & Alana Dixon Title: ‘Coca-Cola not to blame for death’ Fairfax NZ News 20/4/2012
Credible and usable
• Details on death
• Multiple views, both professional and personal, given. Some opinions given.
• A newspaper article aimed at general public
• Mixture of language types
• Some traceable comments and supporting facts e.g. coroner
2A
16 © te aho o te kura pounamuHE3001
finding information
Source Credibility Why/why not? Comment
1. ‘Woman Addicted to Coke Always Felt Ill’
(page 5)

17© te aho o te kura pounamu HE3001
finding information
Source Credibility Why/why not? Comment
2. ‘C11 and Other Drinks’
(page 18)
Read the collected food and nutrient information for 3275 school children aged 5–14 years from February 2001–December 2002. The extract on the next page is from the 2002 National Children’s Nutritional Survey.

18 © te aho o te kura pounamuHE3001
finding information
c11 other drinks
New Zealand ChildrenChildren consumed carbonated drinks weekly in the following proportions: Soft drinks 45 percent, Coca-Cola or other cola drinks 43 percent, and Mountain Dew 9 percent. Powdered fruit drink and Fruit drink from concentrate or cordial were drunk weekly by 54 percent and 32 percent of children respectively.
A higher proportion of New Zealand children drank Tea weekly (21 percent) than Coffee (6 percent).
Sports drinks were consumed weekly by 8 percent of New Zealand children and ‘New Age’ drinks by 6 percent. 43 percent of New Zealand children reported that they consumed Juice weekly.
There were no differences between males and females in the proportions consuming these types of drinks weekly. However, the proportions of children 11–14 years who drank Coca-Cola or other cola drinks, Tea, Sports drinks, ‘New Age’ drinks and Coffee weekly were higher compared with those 5–6 years.
NZDep01Weekly consumption of most drinks was higher by NZDep01-V children than NZDEP01-I, but particularly for Powdered fruit drink (Figure C-21), Coca-Cola or other cola drinks, Mountain Dew, Tea and Coffee.
EthnicHigher proportions of Pacific and Māori children than NZEO children consumed the following drinks weekly: Powdered fruit drink, Coca-Cola or other cola drinks, Mountain Dew, ‘New Age’ drinks, Tea and Coffee (Figure C-22).
Figure C–21 Figure C–22
70% Males
Females
60%
50%
40%
30%
0%
60%
50%
50%
30%
20%
10%
0%I II III IV V Maori Pacific NZEO
Proportion Proportion
Ethnic groupNZdep01 quintile
POWDERED FRUIT DRINK CONSUMED ≥ ONCE/WEEK TEA CONSUMED ≥ ONCE/WEEK
Males
Females
nz
food
nz
chil
dren
key
res
ults
of
the
2002
nat
ion
al c
hild
ren
’s n
utri
tion
sur
vey,
min
istr
y of
hea
lth

19© te aho o te kura pounamu HE3001
finding information
summary of resources (bibliography)You will need to complete the ‘Evaluating a Source’ chart (in HE3001A) for each source of information you read or use for this achievement standard.
The chart is enclosed with this booklet. Use your own paper if you need more room. Rule a line under each separate source you find.
Start to gather resources now by finding an article on sugar or caffeine consumption in New Zealand.
Evaluate its credibility by using the chart (in HE3001A).
This is your first source of information!
Your teacher will be interested in reading your answer.
In a Google search we found quotes about sugar consumption from the world’s top natural health/natural living authors.
There’s no doubt that excessive sugar consumption has contributed to the obesity explosion. But even more significantly, the calories in refined sugar are ‘empty calories’. Sugary drinks and snacks don’t provide any of the nutrients and dietary fibre children gain from eating healthy snacks like fruit, vegetables, nuts, dairy produce and grain. This means children with a sugar habit are likely to end up deficient in minerals and vitamins found in a balanced diet.
Sue Palmer, Toxic Childhood: How the Modern World is Damaging Our Children and What We Can Do About It
Society’s increase in sugar consumption is matched by an increase in many diseases such as diabetes, hypoglycaemia, and obesity. Even though these diseases are clearly due to excess sugar intake, sugar continues to be added to almost every processed food on market shelves. Many soft drinks contain eight tablespoons of sugar plus phosphoric acid! Researcher Nancy Appleton reported that 69 illnesses and diseases are caused by the consumption of refined sugar. She concluded that sugar excesses ruin our health.
Ron Garner, Conscious Health: A Complete Guide to Wellness Through Natural Means
2B

20 HE3001 © te aho o te kura pounamu
determinants of health3
learning intentionIn this lesson you will learn to:
• identify determinants of health and explain how they impact on an individual’s wellbeing.
introductionTo decide if an issue has an impact on the wellbeing of society, we need to understand what wellbeing (hauora) means and what it encompasses.
A useful way of looking at wellbeing is the whare tapu model.
The whare tapu model shows how four dimensions of wellbeing work together and determine your total wellbeing. Each is equally important.
whare tapu model
Hauora or wellbeing includes:
• physical wellbeing
• intellectual (mental) and emotional wellbeing
• social wellbeing
• spiritual wellbeing.
These aspects work together to keep you healthy. The following diagram explains each dimension in more detail.
Taha hinengaro Mental and emotional wellbeing
Taha tinana Physical wellbeing Taha wairua
Spiritual wellbeing
Taha whānau Social wellbeing

21© te aho o te kura pounamu HE3001
determinants of health
hauora
Intellectual (mental) and emotional wellbeing is about liking yourself.
When you like yourself you:
• feel positive
• have the courage to try new things
• respect other people’s differences
• treat others with respect, trust and kindness so that they feel good too.
Social wellbeing is about relating and communicating in positive ways with others:
• giving and receiving love and compliments
• forming close friendships
• being assertive, not aggressive
• respecting differences in other people
• feeling valued as part of a group
• acting responsibly towards other people
• being trustworthy and trusting other people
• cooperating with other people.
Physical wellbeing is helped by:
• exercising often
• eating a wide variety of food
• avoiding harmful substances
• protecting yourself from disease
• protecting yourself from injury
• keeping clean.
Spiritual wellbeing is the process of learning about yourself.
It is about:
• personal beliefs
• values (what is important to you)
• finding meaning in your life.
Spirituality is very personal. Some people:
• meditate
• sit on a beach
• go to church
• watch a sunset
• tramp in a beautiful place.
Spiritual wellbeing does not necessarily mean being religious, though religion may be part of your belief system.
isto
ck
22 © te aho o te kura pounamuHE3001
determinants of health
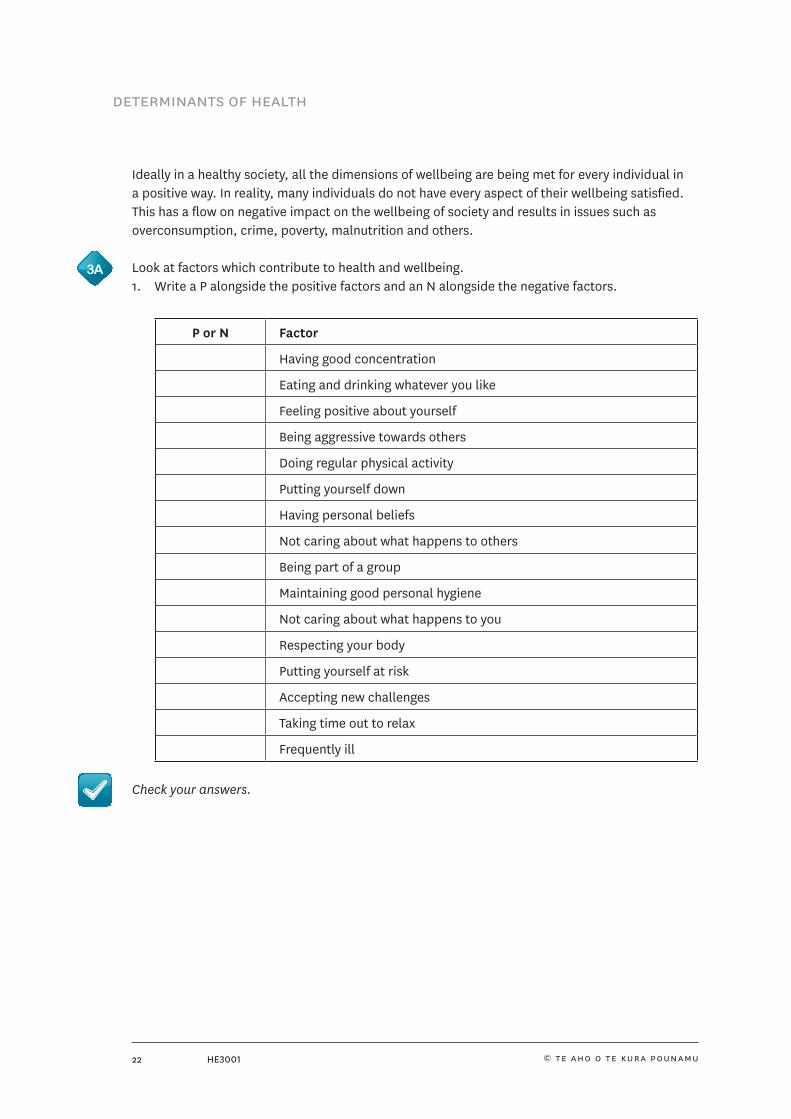
Ideally in a healthy society, all the dimensions of wellbeing are being met for every individual in a positive way. In reality, many individuals do not have every aspect of their wellbeing satisfied. This has a flow on negative impact on the wellbeing of society and results in issues such as overconsumption, crime, poverty, malnutrition and others.
Look at factors which contribute to health and wellbeing.1. Write a P alongside the positive factors and an N alongside the negative factors.
P or N Factor
Having good concentration
Eating and drinking whatever you like
Feeling positive about yourself
Being aggressive towards others
Doing regular physical activity
Putting yourself down
Having personal beliefs
Not caring about what happens to others
Being part of a group
Maintaining good personal hygiene
Not caring about what happens to you
Respecting your body
Putting yourself at risk
Accepting new challenges
Taking time out to relax
Frequently ill
Check your answers.
3A

23© te aho o te kura pounamu HE3001
determinants of health
2. Select two factors from the chart on page 22. For each factor, state what dimension(s) of wellbeing is affected and explain why.
Factor Dimension of wellbeing affected – explanation
Your teacher will be interested in reading your answer.
determinants of healthSeveral factors impact on an individual’s wellbeing during their life.These factors are called determinants of health.
The determinants of health interconnect.
• They add to or work against each other.
• They have either a positive or negative effect on our wellbeing.
• They are not static, as new ones emerge and others disappear.
Economic
Social
Political
Cultural
Sustainability
Environmental
Personal lifestyleThese determinants of health all interconnect
Historical

24 © te aho o te kura pounamuHE3001
determinants of health
Let’s look at these in more detail.
The A3 diagram (HE3001B) shows some factors that can be considered under each determinant of health.
The diagram shows how the determinants of health interrelate.
Here are two examples.
1. The social determinants are the societal influences on people’s wellbeing. A social determinant, employment, can be linked to economic decisions of the government. Making apprenticeships, or youth employment schemes, more available or less available are examples of social determinants being linked to political determinants.
2. The legal age of drinking alcohol is determined by Government laws (a political determinant). When New Zealand lowered the drinking age to 18, more young people suffered drink-related problems and turned up at hospital emergency departments. This resulted in the government looking at the legal drinking age again. Lowering the drinking age has had a negative impact on the wellbeing of New Zealand society. Lowering the drinking age is a political determinant of health. This also has an impact on the social and economic determinants of health for society.
Explain how the legal drinking age in New Zealand has had an economic impact on society.3B

25© te aho o te kura pounamu HE3001
determinants of health
Describe how having a well-paid job contributes to an individual’s wellbeing. Make links to at least three different determinants of health.
Your teacher will be interested in your answer.
3C

26 HE3001 © te aho o te kura pounamu
stakeholders4
learning intentionIn this lesson you will learn to:
• identify stakeholders.
introductionStakeholders are any individuals or groups who have a vested interest in an issue.
Key stakeholders are those people who are directly influential or will be directly impacted on by the issue itself and/or its resulting outcomes.
They can be identified by brainstorming a list of individuals or groups that contribute to an issue. For example, a school has several key stakeholders – students, parents, teachers, support staff, community, local businesses, local council and the Government.
Brainstorm a list of stakeholders that contribute to the issue: young New Zealanders are making poor breakfast choices before school.
Check your answers.
Some of the key stakeholders in the overconsumption of sugary drinks are the producers of the products and their affiliated associations.
The following article, from UNESDA (Union of European Soft Drinks Association), is written in response to several European countries taxing soft drinks (as New Zealand does on cigarettes and alcohol).
isto
ck
4A
27© te aho o te kura pounamu HE3001
stakeholders
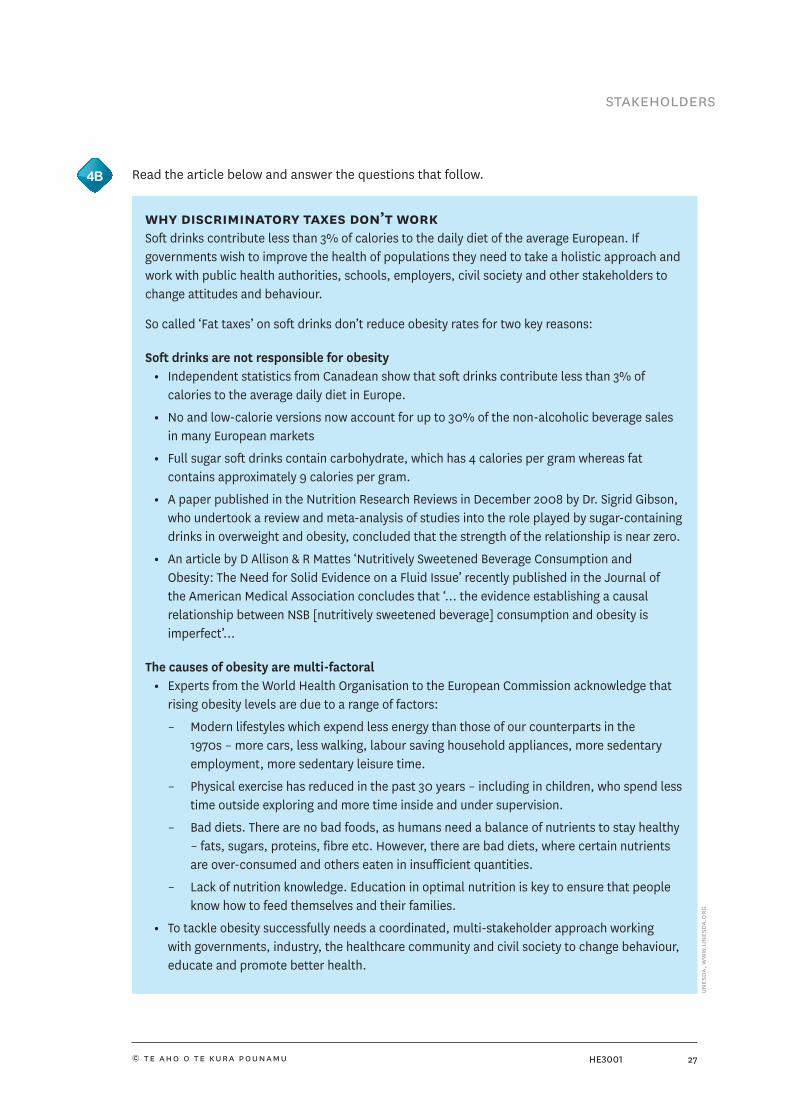
Read the article below and answer the questions that follow.
why discriminatory taxes don’t workSoft drinks contribute less than 3% of calories to the daily diet of the average European. If governments wish to improve the health of populations they need to take a holistic approach and work with public health authorities, schools, employers, civil society and other stakeholders to change attitudes and behaviour.
So called ‘Fat taxes’ on soft drinks don’t reduce obesity rates for two key reasons:
Soft drinks are not responsible for obesity • Independent statistics from Canadean show that soft drinks contribute less than 3% of
calories to the average daily diet in Europe.
• No and low-calorie versions now account for up to 30% of the non-alcoholic beverage sales in many European markets
• Full sugar soft drinks contain carbohydrate, which has 4 calories per gram whereas fat contains approximately 9 calories per gram.
• A paper published in the Nutrition Research Reviews in December 2008 by Dr. Sigrid Gibson, who undertook a review and meta-analysis of studies into the role played by sugar-containing drinks in overweight and obesity, concluded that the strength of the relationship is near zero.
• An article by D Allison & R Mattes ‘Nutritively Sweetened Beverage Consumption and Obesity: The Need for Solid Evidence on a Fluid Issue’ recently published in the Journal of the American Medical Association concludes that ‘... the evidence establishing a causal relationship between NSB [nutritively sweetened beverage] consumption and obesity is imperfect’...
The causes of obesity are multi-factoral • Experts from the World Health Organisation to the European Commission acknowledge that
rising obesity levels are due to a range of factors:
– Modern lifestyles which expend less energy than those of our counterparts in the 1970s – more cars, less walking, labour saving household appliances, more sedentary employment, more sedentary leisure time.
– Physical exercise has reduced in the past 30 years – including in children, who spend less time outside exploring and more time inside and under supervision.
– Bad diets. There are no bad foods, as humans need a balance of nutrients to stay healthy – fats, sugars, proteins, fibre etc. However, there are bad diets, where certain nutrients are over-consumed and others eaten in insufficient quantities.
– Lack of nutrition knowledge. Education in optimal nutrition is key to ensure that people know how to feed themselves and their families.
• To tackle obesity successfully needs a coordinated, multi-stakeholder approach working with governments, industry, the healthcare community and civil society to change behaviour, educate and promote better health.
4B
unes
da, w
ww
.un
esda
.org

28 © te aho o te kura pounamuHE3001
stakeholders
• There is a solid body of evidence proving that fat taxes do not have any impact on reducing rates of overweight or obesity.
Where taxes have been imposed there has been no impact on obesity • Imposition of fat taxes in markets to date has not made a difference (The Canadian obesity
epidemic, 1985–1998 – Peter T Katzmarzyk)
• Studies demonstrate that tax would have no impact on obesity related diseases. Could targeted food taxes improve health? Oliver Mytton, Alastair Gray, Mike Rayner, Harry Rutter – J Epidemiol. Community Health 2007; 61 (669–89) The study finds that taxation would lower fruit and vegetable consumption, increase average food expenses for all citizens, and lead to an average increase in cholesterol rates. It concludes that food ‘reformulation’ would be more efficient.
• Taxing soft drinks is a regressive tax. Raising taxes on food and drink places a disproportionate burden on the less well-off members of society as food and drink represents a greater percentage of their monthly outgoings.
Taxation – a health measure or a revenue raiser? • Governments need to be open as to why they are taxing soft drinks. If they need to raise more
revenue, as has been the case in some instances and product taxation is inevitable, then why should they do so by singling out individual products when a flat tax across the whole of the food and drink industry would be less discriminatory?
• The European non-alcoholic drinks industry has a turnover of $150 billion, employs over 100,000 people and operates over 1000 production plants. Governments need to evaluate the wider potential impact on jobs, the economy and communities when considering discriminatory taxation.
The soft drinks industry in Europe has taken significant action to ensure that it behaves responsibly.
• The European soft drinks industry has taken action in four key areas, mirroring WHO strategy:
– product innovation and reformulation to offer a wide variety and choice of no-and low-calorie drinks – these now account for some 30% of carbonates across Europe
– no advertising to children under 12 on TV, in print or online
– no sales in primary schools across Europe, and sales in secondary schools to offer a full range of drinks options in unbranded machines
– Guideline Daily Amount labelling across branded products so that customers can make informed choices about the products they buy for themselves and their families.
UNESDA, representing the European Soft Drinks Industry, is one of just four organisations to be named and praised by the EU Commissioner for Health for its actions to address obesity and healthy lifestyles.
unes
da, w
ww
.un
esda
.org

29© te aho o te kura pounamu HE3001
stakeholders
1. Who is the author of this article?
2. Why are they a stakeholder and who are they supporting?
3. Using the UNESDA article above, find one source of evidence that is credible and one that is not credible, and explain why.
Credible evidence
Not credible evidence
4B
isto
ck

30 © te aho o te kura pounamuHE3001
stakeholders
4. What attitudes and values does the author have towards drinking soft drinks?
5. What power and influence does this stakeholder have?
Check your answers.
HINTS3 Individual health3 Profit
3 Employment3 Political power (lobby groups)
bigs
tock

31HE3001© te aho o te kura pounamu
attitudes and values5
learning intentionIn this lesson you will learn to:
• understand attitudes and values.
introductionAn attitude can be defined as a mode of thinking usually based on life experiences. How we behave is determined by our values. A value is something that is important to us.
Our attitudes and values are shaped by our life experiences (family, friends, school, environment, etc.). They are interrelated and can change as we grow older and experience more. Our attitudes and values impact on our wellbeing. For example, if you value being thin and do not consider your nutritional needs, you will become ill.
Highlight those words below that reflect your own attitudes and values.
Values (guidelines to actions and behaviours)
Attitudes (your thoughts, opinions, judgements)
honestyloyaltyrespectinclusiveness – acknowledgement of diverse viewpoints; accepting of a range of abilitiesperseverancecooperation/awhinaarohamanaakitangasense of responsibilityintegrity – your behaviours and actions are consistent with your beliefsprinciplesfairnesshumility
truthful, trustingfaithfulcaring/concerned for others, self and the environmenttolerantempathetic – sensitive to how others feel and their situationcommittedhelpfulaffectionate, compassionatekindreliable, accountableconsistenttreat everyone equally, non-judgementalsportsmanshipeveryone is as good as me
Your teacher will be interested in reading your answer.
Your attitudes and values will influence your understanding of nutritional issues.
Let’s look at two nutritional issues.
The attitudes and values associated with them may have caused or contributed to the issue.
5A

32 © te aho o te kura pounamuHE3001
attitudes and values
AAttitudes and values related to the issue of over-consumption of sugary and caffeinated drinks may include, but are not limited to, the following:
• Energy drinks are good for you.
• Energy drinks stop me eating too much.
• People on a low income waste money on fizzy/energy drinks.
• Drinking soft drinks is my only vice.
• Drinking milk is only for children.
• Energy/soft drinks taste great and make me feel awake.
BAttitudes and values related to the issue of young New Zealanders making poor breakfast choices before school may include, but are not limited to, the following:
• Hunger is a problem for families in New Zealand.
• Healthy food is cheap in New Zealand.
• People on a low income waste money on junk food.
• Many parents are too lazy to get out of bed and feed their kids.
• Kids don’t know how to make their own breakfast.
• Skipping breakfast is a good way to lose weight.
• You get cool prizes and free gifts from buying breakfast cereals.
• This cereal is promoted by well-known sportspeople so if I eat it, I will be as good as they are.
• Any breakfast choice is better than none.
isto
ck
‘Energy drinks make a great breakfast’ – so I have one instead of food. This wakes me up
and gives me a boost but I feel tired and hungry by morning tea. I assume the drink will last
me to lunchtime, like eggs on toast, but maybe it doesn’t?

33© te aho o te kura pounamu HE3001
attitudes and values
Refer to Issue A (on the previous page) and answer the following questions using the attitudes and values given.
1. Which attitude/value most reflects how you feel about this issue?
2. Is this attitude/value based on fact? What assumptions are you making?
3. How does this attitude/value contribute to the issue?
Your teacher will be interested in reading your answer.
5B

34 HE3001 © te aho o te kura pounamu
food labels6
learning intentionIn this lesson you will learn to:
• interpret the information on food labels.
introductionFood labels tell you what ingredients the food contains so you can choose what to include in your diet. A food label contains information that is required by law. All food sold in this country must comply with the Australia New Zealand Food Standards Code for labelling. Ministry of Agriculture and Fisheries (MAF) Verifications Services administer the Code, which covers labelling, among other things, so that there is information available regarding the safety and suitability of the food you are about to eat. Labels may also indicate any precautions you need to take. For example, whether you need to store or cook the food in any special way, or when it needs to be used by (date marks). It also indicates whether it contains allergens. Other items that may appear on a food label are a country of origin statement, advertising and nutrition claims.
what must be on a food label?Nearly every food product requires a label, with varying degrees of detail. In NZ, a food label must be in English (other languages can be used in addition to English, as long as they do not contradict the information).
NO PRESERVATIVESNO ARTIFICIAL COLOURS
NO ARTIFICIAL SWEETENERS
Refrigerate after opening and consume within 3 days
Lemon Flavoured Ice Tea DrinkIngredients: water, sugar, tea extract (4.5%), food acids (330, 331), lemon juice, flavours (contain wheat derivative) antioxidant (300)Contains wheat products
NUTRITION INFORMATION
Servings per package: 5 Serving size: 250 ml
Average quantity per 250 ml
% Daily intake per 100 ml
Energy 283 kJProtein <0.1 gFat – Total <0.1 g– saturated <0.1 gCarbohydrates 16.3 g– sugars 16.3 gSodium < 5 mg
3 113 kJ0.2 <0.1 g0.1 <0.1 g0.4 <0.1 g5 6.5 g18 6.5 g0.2 <5 mg
Percentage Daily Intakes are based on an average adult diet of 8700 kJ. Your daily intake may be higher or lower depending on your energy needs
Made in Australia from imported and Australian ingredients, (Batch 2489A)Authorised distributor, Unilever, New Zealand, 486 Jackson Street, Petone 5012, New Zealand
1.25 L
BEST BEFORE 16.08.13
7
3
2
8
9
6
10
1
5
4

35© te aho o te kura pounamu HE3001
food labels
Write each number from the ‘Lemon Ice Tea’ food label beside the correct statement.
Number Statement
The name of the product.
The lot identification. This identifies where the food was packaged and/or prepared and the batch it came from, to assist should there be a food recall (this may also be the date mark).
The name and address of the supplier and business in New Zealand or Australia who can be contacted if more information about the product is needed.
Mandatory warning statements, advisory statements and declarations to identify certain ingredients/substances that may trigger allergies or be of concern.
Ingredient list in descending order of in-going weight including any food additives, such as preservatives, flavours and colours, which are identified by their function and name or code number (e.g. ‘Thickener (pectin)’ or ‘Thickener (440)’).
Date marking is needed for most packaged food with a shelf life of less than two years, most commonly these are ‘Use By’ and ‘Best Before’ dates.
Directions for use and storage (where needed) to ensure the food will keep for the period indicated by the date mark, and/or how you should store the food to stop it spoiling or reduce the growth of pathogens that may cause illness.
Nutrition Information Panel (NIP) to allow you to compare the quantities of seven key nutrients per serving and per 100 g or 100 ml of liquid.
Percentage labelling of characterising ingredient.
Net weight or volume.
Check your answers.
6A

36 © te aho o te kura pounamuHE3001
food labels
which foods don’t require a full food label?Certain foods are exempt from these labelling requirements, which means some or all of the label components can be left out. However, specific health and safety information must be displayed nearby or be available if you ask for it. For example, if a food contains caffeine or substances that can trigger allergic reactions, this information must be clearly available.
Foods that are exempt from certain requirements on their labels include:
• small food packets such as chewing gum
• foods for catering
• alcoholic beverages.
Foods that don’t require any label at all include:
• unpackaged food
• food made and packaged where it is sold, or food packaged in front of you
• ready-to-eat food delivered to order (e.g. pizza)
• whole or cut fresh fruit and vegetables in transparent packages
• food sold at a fundraising event
• food in an inner package not designed for sale without the outer package (e.g. snack packs of crisps)
Alcoholic beverages and food containing alcohol have the same labelling requirements as regular food. However, beer,
wine and spirits, including liqueurs, don’t require an ingredient list, nutrition information panel, or percentage labelling.
However, the number of standard drinks a beverage contains, or the amount of alcohol content by volume must be
shown on the label.

37© te aho o te kura pounamu HE3001
food labels
ingredient listThe ingredient list shows any ingredient in the food, including added water, food additives and compound ingredients (those ingredients that are themselves made up of two or more ingredients e.g. chocolate chips or icing).
A 750 millilitres sports drink contains 44 grams of sugar.
How many teaspoons of sugar is this?
Find a sports drink label and attach it here.
• Highlight the sugar content.
• Circle the caffeine content.
• Underline the fat content.
List the ingredients.
Your teacher will be interested in reading your answer.
HOW MUCH SUGAR IS THAT?A flat teaspoon of sugar weighs 4 grams. So if a label says 20 grams of sugar, visualise it as 5 teaspoons of sugar.
watch out for
No added sugar means just that – they didn't add any. Don't assume that means there is no sugar. The product could still contain lots of natural sugar, as in dried fruit, honey or fruit juices, so check the Nutrition Information Panel (NIP).
Ingredients on a label must be listed in order of weight. If sugar is the first ingredient, it’s the one there’s the most of in the product.
Lemon Flavoured Ice Tea DrinkIngredients: water, sugar, tea extract (4.5%), food acids (330, 331), lemon juice, flavours (contain wheat derivative) antioxidant (300)Contains wheat products
isto
ck
6B

38 © te aho o te kura pounamuHE3001
food labels
code numbers of food additivesThe three-digit codes in the ingredient list are unique international identification numbers for food additives. Food additives are natural or synthetic chemicals added during manufacture to extend the product’s shelf life, or make the product more appealing. The code numbers save space and avoid confusion over similar names.
Additives are listed according to their function and name or code, e.g. Thickener (pectin) or Thickener (440). A free booklet called Identifying Food Additives, available on the Ministry for Primary Industries Food Safety website (www.foodsmart.govt.nz), will help you interpret which additives are used in the foods you most commonly buy.
If you need to know more about a specific additive (e.g. whether it’s derived from plant or animal origin), the manufacturer’s contact details are on the label.
These are some common food additives with their code numbers:
• 102 tartrazine (colour)
• 251 sodium nitrate (preservative)
• 330 citric acid (acidity regulator)
• 300 ascorbic acid or vitamin C (antioxidant)
• 322 lecithin (emulsifier)
• 410 locust bean gum (thickener)
• 440 pectin (gelling agent)
• 500 sodium carbonate or sodium bicarbonate (raising agents)
• 621 monosodium L-glutamate (flavour enhancer)
• 951 aspartame (non-nutritive sweetener)
• 170 calcium carbonate (anti-caking agent)
• 422 glycerin or glycerol (humectant).
High levels of additives and preservatives can be toxic in the body. Information on individual additives can be found by researching these online. Manufacturers have limits on amounts of additives that can be added to a product.
isto
ck

39© te aho o te kura pounamu HE3001
food labels
Write the correct code number beside the description of each additive in the chart below.
Number Additives (serve different functions in food)
Antioxidants: help stop oils and fats deteriorating and developing rancid flavours.
Flavour enhancers: improve the flavour and/or smell of food.
Anti-caking agents: reduce the tendency of particles to stick together so that they flow freely e.g. in salt.
Preservatives: are important for food safety as they can stop or slow the growth of mould, bacteria and yeast that cause food to deteriorate.
Thickeners: thicken food to a desired consistency.
Humectants: stop food from drying out.
Colours: enhance the appearance of foods.
Sweeteners: replace the sweetness normally provided by sugar. Some are intense sweeteners with very little energy (kilojoules).
Acidity regulators: adjust the acidity level in food. This can affect taste by maintaining a sour or sharp taste, and can also slow the growth of micro-organisms.
Emulsifiers: are used to ensure that mixtures of oil and water based ingredients stay mixed together.
Gelling agents: modify food texture through the formation of a gel. This helps food to set. Often added in jam making and jellies.
Raising agents: are used in bakery products to increase volume i.e. to make them rise.
Other classes of additives: include foaming agents, glazing agents, firming agents, stabilisers, propellants, bulking agents, enzymes and antifoaming agents.
Check your answers.
6C

40 © te aho o te kura pounamuHE3001
food labels
What about if you can see fat, or sugar, or sodium, on one part of the label (like the Nutrition Information Panel) but not in the ingredients list? Check these out:
• Other names for fat: butter; margarine; animal fat; vegetable oil/fat; shortening; dripping; ghee; lard; palm oil; tallow; suet; copha; coconut; coconut oil; coconut cream; butterfat; milk solids; chocolate; monoglycerides; diglycerides; triglycerides.
• Other names for sugar: sucrose; fructose; maltose; glucose; dextrose; lactose; honey; golden syrup; treacle; corn syrup; fruit juice concentrate; malt; malt extract; molasses; palm sugar.
• Other names for salt: baking soda; baking powder; sodium; sodium bicarbonate; monosodium glutamate; rock salt; vegetable salt; soy sauce.
date marks and storage instructionsA date mark indicates the end of a food product’s shelf life, or when it may start to deteriorate. Most packaged foods with a shelf life of up to two years require a date mark, except for individual portions of ice cream, or for food products in small packages (such as chewing gum) where there is no food safety concern.
what the different date marks meanThe ‘Use By’ date indicates how long your food should keep safely if the storage instructions are followed. You should not buy or consume food when the ‘Use By’ date has expired and it is illegal to sell food with an expired ‘Use By’ date.
The ‘Best Before’ date indicates when the quality of the product may begin to change. It is not a safety issue. Food can be stored beyond its ‘Best Before’ date provided it is still fit for consumption.
The ‘Baked On/Baked For’ dates are used on bread products with a shelf life of less than seven days.
Safety-related storage instructions are required on certain food products in conjunction with date marks to guide your handling of the food so that its safety or quality isn’t jeopardised before the date mark expires. Pathogens such as Salmonella, Campylobacter and Listeria can grow to levels that may cause illness if your food is not stored correctly. These instructions may also indicate how to store the food once the package is opened (e.g. ‘Refrigerate after opening’).
isto
ck
LABEL DETECTIVE:
Other names for common ingredients

41© te aho o te kura pounamu HE3001
food labels
allergies and warning statementsBecause allergies to certain food proteins (allergens) can be life threatening, the eight most common food allergens must be declared on a food label, or information about them should be available at the point of sale. Labelling allows you to avoid those foods that may be of concern. Allergens must be declared if they are added as an ingredient, part of a compound ingredient, an additive, a processing aid or a component of these.
A food allergy is an adverse immune response to a food protein. The person develops antibodies that cause an allergic reaction if they are exposed to the food, eaten, touched or even inhaled. Often allergic reactions are fairly mild: the person might develop hives or a rash, some swelling, or have stomach pains and vomiting. But people can have a severe allergic reaction called anaphylaxis. This is a life-threatening emergency; it can come on very quickly and people at risk usually carry a life-saving adrenaline auto-injector with them at all times.
The nine most common allergens that must be shown on a label are:
• cereals containing gluten and their products (e.g. wheat, rye, barley, oats and spelt)
• crustacea (e.g. crayfish, crabs, prawns) and their products
• egg and egg products
• fish and fish products
• milk and milk products
• tree nuts and sesame seeds and their products
• peanuts and soybeans, and their products
• added sulphites in concentrations of 10 milligrams per kilogram or more
• yeast products including bread products and marmite.
A warning statement is also required for products that contain royal jelly, because an allergic reaction to this can be so severe. (Royal jelly is from bees, and may cause allergic reactions in people allergic to certain types of pollen.)
Advisory statements are required on some foods that contain less well-known allergens; or may be a health risk to particular population groups; or contain substances that don’t need to be listed in the ingredients but can pose a risk to some sensitive individuals. Advisory statements are required on:
• foods that contain bee pollen, aspartame, quinine, guarana, phytosterols, phytosterol esters and propolis
• low-fat milks (including soy and rice milk), cola beverages containing caffeine, unpasteurised milk and milk products.
Though a complete label may not be required (e.g. on takeaway food), if the food contains common allergens or substances that require an advisory/warning statement, the information must be displayed alongside the food, or be available if you ask for it.

42 © te aho o te kura pounamuHE3001
food labels
The statement ‘May contain traces of xxx’ is not required by law, but is often used by manufacturers for foods that may unintentionally contain traces of allergens from cross-contamination. It is up to you to decide whether this statement has any merit.
If you are allergic to gluten, look out for these ingredients:
• semolina, kamut, spelt, couscous, bulgar, barley, oat, farina, polenta, durum wheat, flour, triticale.
If you are allergic to soy, look out for these ingredients:
• bean curd, hydrolised vegetable protein, textured vegetable protein (TVP), edamame, lecithin, soya bean paste, miso, tempeh, soy flour, tamari, shoyu, soya protein, natto, tofu, vegetable gum, soy lecithin (emulsifier 322).
If you are allergic to milk, look out for these ingredients:
• butter, buttermilk, casein, caseinate cheese, cheese, cream, crème fraiche, cows’ or goats milk, ghee, milk powder, whey (some margarine).
Milk products may turn up in unexpected places. Bakery foods are sometimes glazed with egg or milk and casein can be used as a binder in meat products, ‘restructured’ salmon and seafood (like surimi).
isto
ck

43© te aho o te kura pounamu HE3001
food labels
Tick what you think is true.
Tick Statement
Most people who get unpleasant symptoms after eating food are not allergic to the food.
Foods that most commonly cause food allergies are cow’s milk, wheat, eggs, fish, shellfish, soybeans and peanuts.
Food allergies tend to run in families.
Some people can be allergic to a food if they eat it raw, like peaches, apples, kiwifruit, carrots and celery, but can eat the same food cooked without harm.
Children who are allergic to food often grow out of the allergy in their teens, while fish and peanut allergies usually remain for life.
Breastfeeding and the careful introduction of solid food to babies can reduce the risk of them developing an allergy.
The best treatment for an allergy is to avoid eating the food.
Some common reactions for food that aren’t allergies are headaches, caused by caffeine, chocolate, cheese or red wine; stomach pain caused by hot spicy food and flushing and wheezing after eating some Chinese foods.
Food intolerances such as celiac disease and lactose intolerance are usually inherited.
If you suspect you have an allergy, you should visit your doctor.
Check your answers.
nutrition information panels – why have them?The seven key nutrient components of food are listed in the Nutrition Information Panel (NIP). This helps you compare products for the overall energy (kilojoules or calories), and the level of saturated fat, sugar and sodium, among others. These quantities are shown per serving (with an indication of what this might be e.g. two crackers), and per 100 grams (g) or millilitres (mL). The quantities must be expressed as an average, maximum or minimum.
6D

44 © te aho o te kura pounamuHE3001
food labels
a typical nutrition information panel (nip)
ICED COFFEE MOCHA (Coffee & Chocolate)
NUTRITION INFORMATION
MOCHA FLAVOURED REDUCED FAT MILK Servings per package 3.75/ Serving Size 200 ml
AVERAGE QUANTITY
Per serving
Per 100 ml
Energy 560 kj 280 kj
Protein 6.6 g 3.3 g
Fat, total 3.0 g 1.5 g
Fat, saturated 2.0 g 1.0 g
Carbohydrate, total
19.0 g 9.5 g
Carbohydrate, sugars
18.4 g 9.2 g
Sodium 80 mg 40 mg
Calcium 230 mg 115 mg
Vitamin A 110 pg 55 pg
Vitamin D 1 pg 0.5 pg
INGREDIENTS Reduced fat milk, sugar, cocoa (1%), flavor, coffee powder (0.2%), 410 thickener (40%), Vitamins A & D.
Labels must tell the truth. Food labelling in New Zealand is regulated by the MAF New Zealand Food Safety Authority (NZFSA). See www.foodsafety.govt.nz for more information.
Being able to read and interpret food labels is an important step towards making healthier food choices.
Some labels will carry extra information other than the Nutrition Information Panel (NIP), such as % DI information, and glycaemic index (GI) ratings.
The NIP must have a table listing energy and these nutrients per serve and per 100 g (or 100 mL): protein; fat, total and
saturated; carbohydrate and sugars; sodium.
If the pack makes any claim about another
nutrient e.g. ‘good source of calcium’, then that nutrient must also be
listed in the NIP.
Use the per 100 g (mL) column to compare like products. This also gives
you the percentage e.g. 2.3 g fat per 100 g
equals 2.3% fat.
Ingredients are listed in order of in-going
weight. Milk is the major ingredient followed by sugar. Additive numbers are also
stated here.
Because it is called Mocha Iced Coffee you must be
told how much coffee and cocoa is in it.
There are a number of common allergens that
must be highlighted.

45© te aho o te kura pounamu HE3001
food labels
%di informationPercent Daily Intake Labelling (% DI) shows you how much one serve of the food will contribute to your daily requirements of each nutrient listed. These are based on an average daily adult energy requirement of 8700 kJ. You can use this to see if the food fits into your daily diet based on other food choices you have made in the day. For example, one serve of Uncle Toby’s Rolled Oats provides 640 kJ which is 7% of an average adult’s energy needs for the day, and 13% of fibre. It is low in sugar and sodium, making it a good food choice.
Can you pick the healthier choice? Look at the % labelling on the lasagne meals above – which would be the healthier option? Why?
Check your answers.
% DAILY INTAKE (%DI) per 400g serve
Italiano Beef Lasagna
% DAILY INTAKE (%DI) per 400g serve
Mama’s Kitchen Beef Lasagna
27.9%
ENERGY
3430 kJ 25.5 g 27.1 g 12.9 g 55.2 g 9.1 g 4.8 g 1190 mg
PROTEIN FAT SATURATEDFAT
CARBO-HYDRATES
TOTALSUGARS
FIBRE SODIUM
51% 38.7% 53.3% 17.8% 10.1% 16% 51.7%
24.1%
ENERGY
2094 kJ 26 g 10.4 g 4.4 g 70.0 g 16.0 g 9.6 g 900 mg
PROTEIN FAT SATURATEDFAT
CARBO-HYDRATES
TOTALSUGARS
FIBRE SODIUM
52% 14.9% 18.3% 22.6% 17.8% 32% 39.1%
6E

46 © te aho o te kura pounamuHE3001
food labels
Low and high GI ratingsThe glycaemic index (GI) is a measure for foods of the rate at which glucose is absorbed into the bloodstream after eating. It is determined by comparing the blood glucose response from a particular food to a reference food (usually glucose, which is given a value of 100). Food with a high GI are rapidly digested and absorbed in the body resulting in marked fluctuations in blood sugar levels. Low GI foods, by virtue of their slow digestion and absorption, produce gradual rises in blood sugar and keep you feeling full longer.
• Low GI = 55 or less
• Medium GI = 56 to 69
• High GI = 70 or more
Think of the GI as a useful tool, but not the only criteria for choosing the right foods to eat. High-fat foods can be low GI as the fat slows digestion.
Do your own research. List examples of food labels or products you have found that carry % DI or GI information. Beside each, explain what the labelling means.
DI What does this mean?
Example:Powerade, 11%
Provides 11% of the daily energy requirement.
GI
If possible, attach the labels you have researched here.
Your teacher will be interested in reading your answer.
6F

47HE3001© te aho o te kura pounamu
what do labels say?7
learning intentionIn this lesson you will:
• identify language features used on labels.
introductionAdvertising or marketing material on food packages must comply with the Fair Trading Act (1986) and the Food Act (1981), and not mislead consumers about the product. The Fair Trading Act prohibits misleading and deceptive conduct, false representations and unfair practices. This Act covers all advertising and selling of goods and services (except private sales) and is administered by the Ministry of Consumer Affairs and enforced by the Commerce Commission.
advertising on food packagesMost of the space on a food label is likely to be used for branding, advertising or marketing purposes. It is up to you to determine the significance of advertising/brand names.
In general, advertising on food packages should not:
• make claims that the food is for slimming or has intrinsic weight-reducing properties
• make claims that the food has therapeutic or prophylactic capabilities
• include the word ‘health’, or any words of similar meaning in the name (but this doesn’t include brand names or trademarks)
• use information, either direct or implied, that could be interpreted as medical advice
• use the name of, or a reference to, any disease or physiological condition.
labelling language: what the health claims really mean
'good source of energy'This means it’s high in kilojoules (calories), not that it has special properties that will invigorate you.
'85% less saturated fat'This probably means the manufacturer has reformulated the product to use mono-unsaturated or poly-unsaturated fats instead of saturated fats. That’s good, but don’t think it means low fat.low fat
Foods with 3% fat or less can make this claim.
isto
ck

48 © te aho o te kura pounamuHE3001
what do labels say?
‘reduced fat’Means this product has less fat than the regular variety. It does not mean low fat. For example, standard cheddar cheese has 35% fat and 24% reduced fat cheddar. Not low fat – lower fat. The label must also show a comparison with the regular product.
‘light/lite’This could mean one of many things, so don’t be fooled! It might mean the product has less energy (kJ) or fat than the original formula. But it could also mean it is light in colour or flavour, as in ‘light’ olive oil, or it could even mean that it’s light (thin) cut, as in potato chips. Read the nutrition panel to see what is really going on.
‘96% fat-free’Means 4% fat. Good to know this quickly without having to look at the nutrition information, but remember that it doesn’t mean that other similar products won’t be lower in fat. And of course, if it says ‘93% fat-free’ you know it has 7% fat, which may be too high for what you want.
watch out for! – ‘flavoured’ A ‘raspberry flavoured’ food won’t contain any raspberries, it will just have raspberry flavouring. That’s fine, but often, while the front panel has the name of the food on it in large type, the word ‘flavoured’ is in much smaller type.
‘diet’A food or drink labelled as ‘diet’ will have less energy (kJ) than the regular product, and it usually contains artificial sweeteners rather than sugars.
isto
ckis
tock

49© te aho o te kura pounamu HE3001
what do labels say?
language features in advertisingAdvertisements persuade an audience to buy a product. They use:
a. persuasive languageThese are words or phrases that trigger an emotional response. Their purpose is to change the attitudes of the audience. In advertisements, to sell products, persuasive language is used to incite a positive response to show the audience how the product will benefit them. This persuades them to buy it. The following techniques are each examples of persuasive language.
• A brand name is a specific name for a product or service. It should describe or define the product or service. For example: Weet-Bix, Jim’s Mowing, Coca-Cola.
• A slogan or catch phrase is another important aspect of advertising e.g. ‘The Warehouse, where everyone gets a bargain’.
• Language features such as alliteration, rhyme, similes, for example, ‘Pick the tick’ (Heart Foundation).
b. hidden persuadersMany advertisements also use some of the following to convince an audience to buy a product.
• Bandwagon: join the crowd. Everyone is buying it/using it/doing it.
• Testimonial: a famous person or authority claims the product is good.
• Image advertising: a product is associated with certain people, places, activities.
• Repetition: saying it again and again.
• Scale: making it bigger or smaller.
• Association: promising adventure, attractiveness, quality.
• Name-calling: making the product seem better by using unpopular terms about the competition.
Remember, all manufacturers are stakeholders. They will use
all sorts of language features and techniques to persuade people to
buy their products.
isto
ck

50 © te aho o te kura pounamuHE3001
what do labels say?
Use the label below to identify the following language features. Use arrows to identify each feature.
Brand name Scale
Slogans Image advertising
Repetition Misleading information
Association
Your teacher will be interested in reading your answer.
1. Why do you think the Nutrition Information Panel (NIP) and ingredient list is hard to read?
7A
500 ml
The ONLY thing you need to get you up in the morning!
Blast your way into the future - anything you want and need just go harder and blast out all those A+ exam results, fastest marathons ... life really is a Blast!
Average quantity per 500 ml
Energy 975 kJ (233 cal)Protein 0 gFat – Total 0 g– saturated 0 gCarbohydrates 52 g– sugars 52 gSodium 260 mgCaffeine 200 mg (Guarana extract)Niacin (B3) 6.0 mgPantothenic Acid (B5) 4.3 mgVitamin B6 1.0 mgVitamin B12 0.5 µgTaurine 3000 mgGlucuronolactone 500 mgInositol 50 mg... just one Blast to fire up
KICK-START!
7B

51© te aho o te kura pounamu HE3001
what do labels say?
2. What social group (age and gender) do you think this label is aimed at?
Give reasons:
Your teacher will be interested in reading your answers.
isto
ck

52 © te aho o te kura pounamuHE3001
what do labels say?
other labels on food packages
country of origin labellingCountry of origin labelling is voluntary in New Zealand and suppliers (usually manufacturers, transporters or sellers) may choose not to display these details. But they must have contact details for distributors or manufacturers in New Zealand, so you can ask about the food.
Knowing the country of origin does not convey whether the food is safe or suitable. This is established by pre-market assessments of the product and compliance with New Zealand’s strict food safety laws, which apply equally to local and imported food.
what’s the problem with that? • Not knowing where our food comes from makes it hard to make an informed choice.
Those of us who are keen to support local producers may have no way of knowing whether or not our favourite products are actually made from local ingredients.
• Other countries have different growing practices, regulations and safety standards. For example, in New Zealand pork growers have a voluntary policy not to use growth hormones, but these are used in some of Australia’s pork production, and with no labelling on imported pork we have no way of knowing if we are buying Aussie pork or not (except to look for a ‘100% NZ’ pork label).
genetically modified (gm) foodsAt a glance, you can see whether a food product contains any GM-derived ingredients because they must be stated in the ingredient list. This includes any food additive, processing aid or flavouring that contains modified DNA or protein, or any food having altered characteristics as a result of GM (e.g. soybeans with high oleic acid content).
For example, a label for bread containing a GM ingredient could read:
Ingredients: wheat flour, yeast, soy flour (genetically modified), water, vegetable oil, sugar, salt, emulsifiers (471, 472E), preservative (282), enzyme (amylase).
Foods served in a restaurant or café, or from a takeaway are exempt from these labelling requirements – if you need to know more, ask the staff.
Products that unintentionally contain GM material at less than 1% don’t have to have a GM label, although food businesses are required to take all reasonable steps to avoid this happening. Flavourings that make up less than 0.1% of a food are also exempt.

53© te aho o te kura pounamu HE3001
what do labels say?
Do some research. What are your feelings on the use of GM ingredients in processed foods? Give reasons for your answers.
Your teacher will be interested in reading your answer.
other labels you may find on food packages include
fair tradeIn New Zealand, Fairtrade products are identified by the Fairtrade Mark. Items that carry this label must meet independently monitored international Fairtrade standards.
The Fairtrade guarantee to consumers is backed by a certification and trade audit system that applies to every link in the supply chain. This chain includes producers, importers and businesses who are licensed to apply the Fairtrade Mark to packaged products and sell them into the market. Currently 53 New Zealand companies are licensed to carry the Fairtrade Mark (2012).
the heart tick – what does it mean?The Tick is a programme run by the National Heart Foundation of NZ. Manufacturers who want to feature the Tick on their products must formulate (or re-formulate) products to fit the Tick criteria for that particular product category. Tick products often have lower levels of energy, fat, saturated and trans-fats, sugar and salt than other products in the same category, and they’re often higher in calcium and fibre. So, it can be a useful way to quickly choose products with a healthier profile. If your favourite product doesn’t have a Tick, compare the nutrition label to one that does; because there’s a cost to manufacturers for the Tick programme, not all choose to take part. Just because something doesn’t have a Tick doesn’t necessarily mean it is not a good option. It’s also important to remember that a Tick doesn’t mean you can eat unlimited amounts. Some categories that include Tick products will always be occasional foods.
7D
fair
tra
de, n
zn
atio
nal
hea
rt f
oun
dati
on

54 © te aho o te kura pounamuHE3001
what do labels say?
irradiated foodFood treated with ionising radiation to kill unwanted pests and micro-organisms is known as irradiated food. Some tropical fruits imported from Queensland may be irradiated, as are some imported herbs and spices and herbal infusions (excluding tea). Fruits that may be irradiated include mango, rambutan, lychee, papaya, custard apple, breadfruit and carambola. These must be labelled as irradiated. When a full label is not required, this information must be displayed nearby or be available on request.
organic badgesBioGroThis label means BioGro has certified this product as fully organic. BioGro New Zealand is a non-profit organisation formed in 1983. It certifies over 900 producers in NZ. The BioGro NZ Organic Standards are internationally recognised by the International Federation of Organic Agriculture Movements (IFOAM), which means products carrying this mark adhere to international standards for organic products. BioGro producers and growers must comply with a strict set of standards, which are then independently audited.
AsureQualityThis label means the product has been certified organic by AsureQuality, a State-Owned Enterprise that offers organic certification to the MPI (NZ’s Ministry for Primary Industries) Official Organic Assurance Programme, USDA (United States Department of Agriculture) National Organic Program, Japanese Agricultural Standard, EU (European Union) Programme and Canada Organic Regime. AsureQuality’s Organic Standard is also IFOAM accredited. Every AsureQuality producer who is certified has a unique customer number, which can also be found on the label.
DemeterThis label means the producer adheres to biodynamic farming practices. This is a method of organic farming which takes into account the influences of the sun, moon, planets and stars. Demeter is a worldwide certification system, used to verify to consumers in over 50 countries that food has been produced by biodynamic methods.
Imported productsIt can be hard to tell what Organic labels mean on imported products. Look for the International Federation of Organic Agriculture Movements logo which most producers will include as well as their local certification mark. Go online and search ‘IFOAM’ to see what this logo looks like.
isto
ckbi
ogro
, new
zea
lan
das
ureq
uali
tybi
odyn
amic
far
min
g as
soc.

55© te aho o te kura pounamu HE3001
what do labels say?
For more information go to: www.foodsmart.govt.nz and search for food labels.
We will explore these issues further in future topics in this course.
isto
ck

56 HE3001 © te aho o te kura pounamu
food for health8
learning intentionIn this lesson you will:
• investigate healthy eating.
introductionTo be the best that you can be, and to achieve all you want in life, it is essential to be able to think and function at your best. Your body is basically a machine which helps you work through the physical, mental and emotional challenges of life, and you need to look after it. Eating a balanced diet that provides all the nutrients you need is vital to good health. The right diet is essential if you want to get the most out of life.
the right dietUse the space below to describe what healthy eating and drinking looks like. You may choose to use words or collect pictures to help you describe your ideas.
Your teacher will be interested in reading your answer.
8A

57© te aho o te kura pounamu HE3001
food for health
nz food and nutrition guidelines for healthy children & young people (aged 2–18 years)As our diet is fundamental to our wellbeing, The New Zealand Food and Nutrition Guidelines (NNGs) have been developed to help you make wise choices about the food you eat.
nz food & nutrition guideline statements (nngs) (including physical activity)1. Eat a variety of foods from each of the four major food groups each day:
• vegetables and fruit, including different colours and textures
• breads and cereals, increasing wholegrain products as children increase in age
• milk and milk products or suitable alternatives, preferably reduced or low-fat options
• lean meat, poultry, fish, shellfish, eggs, legumes, nuts and seeds.
2. Eat enough for activity, growth and to maintain a healthy body size.
• Eat regularly over the day, that is, have breakfast, lunch and dinner, and include in-between snacks for young children or if hungry.
3. Prepare foods or choose pre-prepared foods, drinks and snacks that are:
• low in fat, especially saturated fat
• low in sugar, especially added sugar
• low in salt (if using salt, choose iodised salt).
4. Drink plenty of water during the day. Include reduced or low-fat milk every day.
• Limit drinks such as fruit juice, cordial, fruit drink, fizzy drinks (including diet drinks), sports drinks and sports water.
• Energy drinks or energy shots are not recommended for children or young people.
• Do not give children less than 13 years of age coffee or tea. If young people (13 years or older) choose to drink coffee or tea, limit to one or two cups per day.
5. Alcohol is not recommended for children or young people.
6. Eat meals with family or whānau as often as possible.
7. Encourage children and young people to be involved in shopping, growing and cooking family meals.
8. Purchase, prepare, cook and store food to ensure food safety.
9. Be physically active.
• Take part in regular physical activity, aiming for 60 minutes or more of moderate to vigorous activity each day.
• Spend less than two hours a day (out of school time) in front of television, computers and gaming consoles.
• Be active in as many ways as possible, for example, through play, cultural activities, dance, sport and recreation, jobs and going from place to place.
• Be active with friends and whānau, at home, school, and in your community.
min
istr
y of
hea
lth

58 © te aho o te kura pounamuHE3001
food for health
The New Zealand Food and Nutrition Guidelines statements for healthy children and young people are the key recommendations to ensure optimal growth and prevent nutritional deficiencies, obesity and diet-related chronic diseases. They help you to select from the wide choice of foods available in New Zealand and eat the foods you enjoy and need for good health.
Which NNGs does the overconsumption of sugary and caffeinated drinks affect?Justify your answer.
Your teacher will be interested in reading your answer.
You need to eat a variety of foods from the four food groups every day to maintain your health. Several food classification models have been designed to support people to make healthy food choices.
8B
isto
ck

59© te aho o te kura pounamu HE3001
food for health
food classification modelsThe Māori Food Basket and the Healthy Food Pyramid are both simple ways of showing how foods are grouped and how much of each group it is recommended you eat.
māori food basket
© t
e ku
ra
eat less
eat moderately
eat most
Foods in the top basket are high in fat, salt and sugar.
This basket includes the food groups: milk products and meat and alternatives.
This basket includes the food groups: fruit and vegetables, breads and cereals.

60 © te aho o te kura pounamuHE3001
food for health
1. On the Healthy Food Pyramid below name five foods that belong at each level and state the recommended number of serves for each food group for a teenager.
If you need help check the link below:
www.healthed.govt.nz/resource/eating-healthy-teenagers
healthy food pyramid
2. Where do sugary and caffeinated drinks sit on the pyramid? Why?
Check your answers.
8C
eat less
Milk productsServings
Lean meat & alternativesServings
Fruit servings Vegetable servings
Bread and cereals servings
eat moderately
eat most

61© te aho o te kura pounamu HE3001
food for health
serving sizesThe NZ Food and Nutrition Guidelines recommend eating a wide variety of nutritious foods from each of the four major food groups each day.
The general recommendations are:
Food group Number of servings
Food group Number of servings
Fruit and vegetables
3+ vegetables
2 fruit
Milk and milk products
3
Bread and cereals 6 Lean meat and alternatives
3
Size really does matter and a number of studies have found that we tend to eat more when served larger portions.
We see a lot of information about servings in nutrition advice and on food packaging. A serving is about the amount of food you can fit in the palm of your hand.
isto
ck
isto
ck

62 © te aho o te kura pounamuHE3001
food for health
Here are some examples of serving sizes.
Breads and cereals Vegetables and fruit
1 slice bread (26 g)
½ cup muesli (55 g)
2 Weet-Bix (60 g)
1 apple (130 g) 1 potato (135 g)
½ cup stewed fruit 2 plums (100 g)
½ cup cooked vegetables (50–80 g)
Milk and milk products Meats and alternatives
1 glass milk (250 ml)
2 slices cheese (40 g)
1 pottle yoghurt (150 g)
1 egg (50 g) 2 lean slices meat (100 g)
1 chicken leg (110 g)
¾ cup dried lentils, beans (135 g)
sxc.
hu, t
e ku
ra

63© te aho o te kura pounamu HE3001
food for health
so how can you tell if a meal is healthy?There are three main characteristics to look for:
• the inclusion of healthy ingredients
• the exclusion of unhealthy ingredients
• the cooking method.
Start with healthy ingredients. The best ingredients are whole fresh or frozen fruits and vegetables, and healthy oils like olive, walnut, grape seed, and rice bran oils. Fish, shellfish, nuts, legumes and soy are good protein sources that are low in fat. Breads and cereals should include mostly wholegrain ingredients. Meat and poultry recipes should call for lean cuts whenever possible. Use low-fat dairy products. Aim to choose meals that include several healthy ingredients, rather than just one or two good ingredients mixed with lots of sugar, salt, or saturated fats.
Leave out stuff that’s bad for you. Unhealthy ingredients generally include sugar, processed foods, saturated and trans-fats, white refined flour, and products made with refined white flour. Evaluating a meal for unhealthy ingredients is usually easy. For example, a meal that contains a lot of processed foods like luncheon meats, processed cheese products or large amounts of high-fat products like mayonnaise isn’t healthy.
However, sometimes evaluating a meal is more difficult. Spaghetti and meatballs seems like a healthy meal, but a large portion of the meal is pasta made from refined white flour and the meatballs may have a lot of saturated fat in them. The spaghetti sauce may be very healthy if it is made from fresh ingredients like tomatoes (that give us vitamins), garlic, peppers, herbs seasonings and mushrooms – but processed tomato sauces can contain a lot of sugar.
Check out the cooking methods. Deep-frying is probably the least healthy of the cooking methods, especially if the oil is used more than once. Pan frying might be a little better, but is still not so good if you use a lot of oil, and batters that absorb a lot of oil. Sautéing in a bit of olive oil or canola oil is better, and roasting in an oven is better yet. Boiling vegetables will not add any extra calories, but you will lose some of the valuable nutrients when you drain off the cooking water. Microwaving is a great way to cook vegetables because it is quick, so not as many nutrients are lost.
isto
ck

64 © te aho o te kura pounamuHE3001
food for health
Evaluate the pictured meal using the guidelines from pages 57–63.
Deep fried battered fish and chips with tartare sauce and a fresh salad, 1 glass soft drink.
Healthy ingredients:
Unhealthy ingredients:
Cooking methods:
Your conclusion: How healthy is this meal?
How could you adapt the meal to make it a healthier choice?
Your teacher will be interested in reading your answer.
8D
isto
ck
isto
ck

65© te aho o te kura pounamu HE3001
food for health
the food nutrientsThe food you eat affects:
• how you grow
• how much energy you have
• how well your body fights disease
• how you look and feel.
Food is made up of chemical substances called nutrients. Nutrients work together to keep your body healthy.
Look at the main nutrient groups on the diagram below. They all work together.
main nutrients
The four food groups are:
Carbohydrates
Vitamins
Eat a variety of foods from the four food groups every day to get all the nutrients you need.
Minerals
Water
Proteins
Lipids
Bread and cereals
Milk and milk products
isto
ck, s
tock
expe
rt
Vegetables and fruit
Lean meat and meat alternatives

66 © te aho o te kura pounamuHE3001
food for health
what nutrients do
Proteins: the body builders
Sources of proteinMilk, cheese, meat, fish, eggs, lentils, soya beans, baked beans, nuts.
Protein foods can be animal or vegetable.
Function – what protein does in the body
Proteins help:
• grow new body cells and tissues
• repair body cells
• make enzymes and hormones for body functions
• your (immune) system fight disease (important for the body’s defence)
Growing children and teenagers need more protein.
Lipids (fats and oils): heat, energy and protection
Sources of lipidsButter, margarine, oil, cream, fried food, meat, pastry (pies), pizzas, cheese, fried chicken.
Fats can be animal or vegetable.
Function – what lipids do in the body
Lipids:
• supply large amounts of energy
• satisfy hunger
• help keep you warm
• provide a protective padding around organs such as the heart and liver
• carry fat-soluble vitamins A and D
• make cell membranes and hormones
• provide stored energy as fat cells.
Obesity is too many stored fat cells.
sxc.
husx
c.hu

67© te aho o te kura pounamu HE3001
food for health
Carbohydrates: the energy providers
Starches, sugars and fibre are all carbohydrates.
Sources of carbohydrates What carbohydrate does in the body
Complex carbohydrate (starch)Cereals – wheat, corn, barley, rye and cereal products.Breads and crackersPastaRoot vegetables (potato, taro, kumara)Pumpkins
Satisfies hunger.Provides the main source of energy.Provides lasting energy.Keeps you feeling full longer.Carbohydrate foods also provide many vitamins and minerals.
Active people need more carbohydrate.
Complex carbohydrate (fibre) for healthy bowelsPeasPeanutsBranCelerySkins on fruit and vegetablesSkins on nuts and seeds
Prevents constipation.Decreases the risk of bowel and heart diseases.Helps you feel fuller.
Small children only need a little fibre.
Simple carbohydrateSugars are simple carbohydratesSugar in sweets, cakes and biscuitsProcessed sweetened foodsRipe fruitFruit juiceFizzy drinksHoney
Quickly digested in the body.Provide instant, short term energy.Can leave you feeling tired later.Obesity if excess is consumed.
sxc.
hu
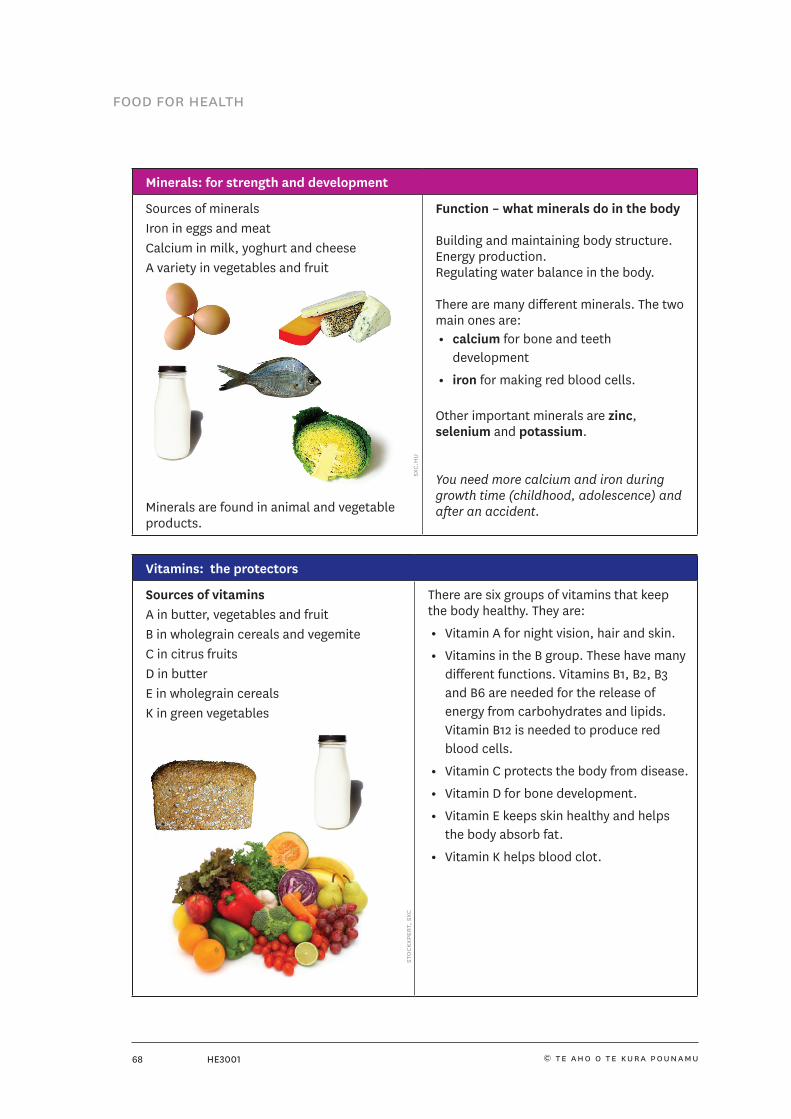
68 © te aho o te kura pounamuHE3001
food for health
Minerals: for strength and development
Sources of mineralsIron in eggs and meatCalcium in milk, yoghurt and cheeseA variety in vegetables and fruit
Minerals are found in animal and vegetable products.
Function – what minerals do in the body
Building and maintaining body structure.Energy production.Regulating water balance in the body.
There are many different minerals. The two main ones are:
• calcium for bone and teeth development
• iron for making red blood cells.
Other important minerals are zinc, selenium and potassium.
You need more calcium and iron during growth time (childhood, adolescence) and after an accident.
Vitamins: the protectors
Sources of vitaminsA in butter, vegetables and fruitB in wholegrain cereals and vegemiteC in citrus fruitsD in butterE in wholegrain cerealsK in green vegetables
There are six groups of vitamins that keep the body healthy. They are:
• Vitamin A for night vision, hair and skin.
• Vitamins in the B group. These have many different functions. Vitamins B1, B2, B3 and B6 are needed for the release of energy from carbohydrates and lipids. Vitamin B12 is needed to produce red blood cells.
• Vitamin C protects the body from disease.
• Vitamin D for bone development.
• Vitamin E keeps skin healthy and helps the body absorb fat.
• Vitamin K helps blood clot.
sxc.
hust
ockx
pert
, sxc

69© te aho o te kura pounamu HE3001
food for health
Water: the life force Without water we would all die. Our bodies are 60% water.
Sources of waterDrinking water Fruit juices, tea, coffee, milk, soups, vegetables and fruit.
Function – what water does in the body
Water is necessary for life because it:
• is required for all body fluids (like blood, sweat and mucus)
• carries nutrients in the blood
• controls the body’s temperature through sweating
• gets rid of waste through the kidneys in urine
• is involved in the exchange of gases in the lungs.
Make water available for children at all times and offer drinks with snacks.
sxc.
hu
Write the correct nutrient in List A to match its function in List B: protein, carbohydrate, vitamin C, iron, calcium.
In the ‘Rich source’ column, name a good food source for the nutrient.
List A nutrient List B functions Rich source
To form red blood cells; especially important for menstruating girls and women.
Protects the body from disease. Helps absorption of iron.
For development of strong bones and teeth; important for growth.
For growth and repair of tissues.
Most important source of lasting energy. Satisfies hunger. Prevents constipation.
Check your answers.
8E

70 © te aho o te kura pounamuHE3001
food for health
Healthy eating is not just about what’s in the food but also how much of it we eat. How much you should eat depends on gender (male or female), age, height, weight and activity levels.
The more activity you do, the more energy you need from food.What nutrients will give your body the most lasting energy? Fill in the gaps.
and will give your body
the most lasting energy.
Check your answers.
1. On the chart below, record the food and drinks you consumed yesterday.
Meals Food eaten
Breakfast
Lunch
Dinner
Snacks
8F
8G

71© te aho o te kura pounamu HE3001
food for health
2. Calculate the number of servings you consumed over 24 hours in each food group and compare it with the recommended guidelines.
Food group Your servings Recommended servings
Bread and cereals 6 (mainly wholegrain)
Fruit and vegetables 5+
Milk products 3 (low-fat varieties)
Meat and alternatives 3
Drinks 6 glasses (mostly water)
3. In the diagram below, make suggestions for ways you could improve your nutritional intake.
Your teacher will be interested in reading your answer.
isto
ck

72 HE3001 © te aho o te kura pounamu
lifestyle diseases9
learning intentionIn this lesson you will:
• consider how the foods and drinks you consume will affect your long-term health and wellbeing.
introduction: you are what you eatWhat you eat has a direct effect on your health and wellbeing. Diseases that people suffer from as a direct result of their lifestyle (e.g. what they eat and drink) are called lifestyle diseases. By using the NNGs and understanding the risks associated with developing lifestyle diseases you can choose a healthier, longer life.
you are what you eatWhat you eat has a direct effect on your health and well-being. By using the NNGs and understanding the risks associated with developing lifestyle diseases you can choose a healthier, longer life.
Lifestyle disease
What is it? Risk factors Actions for prevention of the disease
Heart disease including high blood pressure
Abnormalities of the heart muscle or blood vessels. This can lead to heart failure and heart attacks.
• High-fat diet especially animal fats
• Being overweight
• Lack of physical activity
• Poor diet, especially low in fruit and vegetables
• Smoking
• Too much salt
• Type 2 diabetes
• Excess alcohol
• Eat food from the four food groups every day
• Follow the NNGs
• Do 30 minutes of physical activity every day
• Choose fruit and vegetables, wholegrain breads/cereals as snacks
• Don’t smoke
Osteoporosis This is a condition resulting from calcium loss from bones. It causes the bones to become fragile and break easily. The spine becomes rounded.
• Lack of calcium and vitamin D in the diet
• Lack of physical activity
• Not enough calcium at peak time of bone growth (10–17 years)
• Women after menopause
• Smoking
• Drinking too much tea and coffee
• Eat three servings of milk/milk products every day
• Get some sunshine (vitamin D)
• Don’t smoke
• Limit tea and coffee
• Be active every day

73© te aho o te kura pounamu HE3001
lifestyle diseases
Lifestyle Disease
What is it? Risk Factors Actions for Prevention of the disease
Type 2 Diabetes
A disease where the body cannot process sugars in the body properly. It makes you feel very sick – thirsty, headaches, cramps, tiredness, frequent urination.
• High-sugar diet
• Overweight
• Lack of fruit and vegetables in diet
• Lack of physical activity
• High blood pressure
• Avoid high sugar foods and drinks, for example, energy drinks, cakes/biscuits
• Be active
• Follow NNGs
• Watch your BALANCE (food intake and energy output)
Obesity A condition resulting from excessive fat stores in the body.
• Too much food
• Too much fat, sugar, alcohol in the diet
• Lack of physical activity
• Obesity leads to other lifestyle diseases
• Eat less
• Eat three regular meals a day and snack on fruit and vegetables
• Be active – walk/ride/play sport every day
• Avoid all high fat, high sugar foods and alcohol
Anaemia Anaemia is the result of reduced haemoglobin in the body. This is an iron compound found in red blood cells which carries oxygen to all the cells in the body. Anaemia slows down the body and the brain functions.
• Not enough iron in the diet
• Drinking too much coffee, tea, alcohol per day
Most at risk are: • Vegetarians
• Children and adolescents during growth times
• Athletes
• Menstruating women
• Pregnant and lactating women
• Eat one serving a day of iron rich foods (for example, red meat, lentils, wholegrain cereals) with vitamin C rich food
• If an athlete or pregnant you will need your iron levels checked

74 © te aho o te kura pounamuHE3001
lifestyle diseases
Lifestyle Disease
What is it? Risk Factors Actions for Prevention of the disease
Cancer Cancer is an uncontrolled abnormal growth of cells in the body. There are many kinds and causes of cancer.
• High-fat, high-sugar diet
• Being overweight
• Lack of physical activity
• Poor diet, especially low in fruit and vegetables
• Too many processed foods (for example, processed meats)
• Excess alcohol
• Smoking
• Unsafe/unhygienic food handling
• Follow the NNGs
• Be active
• Avoid highly processed foods – especially foods with lots of additives (colourings, preservatives, flavourings)
• Handle food safely and hygienically
Constipation A difficulty or straining with bowel movements.
• Low intake of fibre and drinks in diet
• Lack of physical activity
• Lack of wholegrain cereals, fruit and vegetables in the diet
• Eat a high fibre diet – lots of fruit, vegetables, wholegrain cereals, nuts and seeds
• Keep active
Goitre A swelling in the thyroid gland in the neck. The thyroid controls body heat, appetite, energy levels and body weight.
• A lack of iodine in the diet. Iodine is especially low in New Zealand soils
• Buy iodised salt or kelp salt
• Use seaweed products in meals/drinks

75© te aho o te kura pounamu HE3001
lifestyle diseases
The overconsumption of sugary drinks would increase the likelihood of a person developing lifestyle diseases.
Write several paragraphs giving your opinion on this statement. Give reasons for your opinions.
Your teacher will be interested in reading your answer.
what to do now • Fill in the self-assessment rubric at the back of the book and send this book into your teacher.
• Keep researching relevant articles focusing on the nutritional issue – ‘the over-consumption of sugary and caffeinated drinks in New Zealand’. Add these references and your comments to HE3001A.
When you receive this book back, keep it with your HE3000 resources as you will be asked to refer to it throughout the year.
9A

76 HE3001 © te aho o te kura pounamu
answer guide10
3. determinants of health
P or N Factor
P Having good concentration
N Eating and drinking whatever you like
P Feeling positive about yourself
N Being aggressive towards others
P Doing regular physical activity
N Putting yourself down
P Having personal beliefs
N Not caring about what happens to others
P Being part of a group
P Maintaining good personal hygiene
N Not caring about what happens to you
P Respecting your body
N Putting yourself at risk
P Accepting new challenges
P Taking time out to relax
N Frequently ill
4. stakeholdersStakeholders related to this nutritional issue may include, but are not limited to:
• young people and their families, caregivers, whānau, classmates, teachers, principals, and school boards
• community groups, iwi, hapu, and non-government organisations (Red Cross, Child Poverty Action Group, KidsCan, KickStart, The Salvation Army, other food bank providers, etc.)
• government (Ministries of Health, Social Development, Education, etc.)
• nutritionists and the medical community
• supermarkets and companies that grow, make, import, and market breakfast food
• media and the general public.
3A
4A

77HE3001© te aho o te kura pounamu
answer guide
1. This article is written by a representative of the Union of European Soft Drinks Association (UNESDA).
2. The Union is a stakeholder as they represent soft drink manufacturers and want to keep them in business.
3. One student wrote those below – you may have found something else.
Credible evidence:
I believe the comment about the imposition of taxes taken from a report by Peter T Katzmarzyk is credible. I was able to confirm (online) that Peter T Katzmarzyk is a Canadian professor who researches the impact of obesity and physical inactivity. He is a member of the Canadian Obesity Network.
Not credible evidence:
‘Independent statistics from Canadean show that soft drinks contribute less than 3% of calories to average daily diet in Europe.’ The Canadean Congress aims to help companies improve their marketing and innovation strategies to help increase profits. They may have used statistics out of context to support the manufacture/selling of soft drinks.
4. The author values profits and has a stakeholding in maintaining employment in the soft drink manufacturing business. His/her attitude does not seem to be very caring of the health of individuals.
5. The UNESDA is a big organisation which would have the power to lobby/pressure politically against the introduction of taxes.
4B

78 HE3001 © te aho o te kura pounamu
answer guide
6. food labels
Number Statement
7 The name of the product.
9 The lot identification. This identifies where the food was packaged and/or prepared and the batch it came from, to assist should there be a food recall (this may also be the date mark).
6 The name and address of the supplier and business in New Zealand or Australia who can be contacted if more information about the product is needed.
10 Mandatory warning statements, advisory statements and declarations to identify certain ingredients/substances that may trigger allergies or be of concern.
1 Ingredient list in descending order of in-going weight including any food additives, such as preservatives, flavours and colours, which are identified by their function and name or code number (e.g. ‘Thickener (pectin)’ or ‘Thickener (440)’).
5 Date marking is needed for most packaged food with a shelf life of less than two years, most commonly these are ‘Use By’ and ‘Best Before’ dates.
2 Directions for use and storage (where needed) to ensure the food will keep for the period indicated by the date mark, and/or how you should store the food to stop it spoiling or reduce the growth of pathogens that may cause illness.
4 Nutrition Information Panel to allow you to compare the quantities of seven key nutrients per serving and per 100 g or 100 ml of liquid.
8 Percentage labelling of characterising ingredient.
3 Net weight or volume.
6A

79HE3001© te aho o te kura pounamu
answer guide
Number Additives (serve different functions in food)
300 Antioxidants: help stop oils and fats deteriorating and developing rancid flavours.
621 Flavour enhancers: improve the flavour and/or smell of food.
170 Anti-caking agents: reduce the tendency of particles to stick together so that they flow freely e.g. in salt
251 Preservatives: are important for food safety as they can stop or slow the growth of mould, bacteria and yeast that cause food to deteriorate.
410 Thickeners: thicken food to a desired consistency.
422 Humectants: stop food from drying out.
102 Colours: enhance the appearance of foods.
951 Sweeteners: replace the sweetness normally provided by sugar. Some are intense sweeteners with very little energy (kilojoules).
330 Acidity regulators: adjust the acidity level in food. This can affect taste by maintaining a sour or sharp taste, and can also slow the growth of micro-organisms.
322 Emulsifiers: are used to ensure that mixtures of oil and water-based ingredients stay mixed together.
440 Gelling agents: modify food texture through the formation of a gel. This helps food to set. Often added in jam making and jellies.
500 Raising agents: are used in bakery products to increase volume i.e. to make them rise.
Other classes of additives: include foaming agents, glazing agents, firming agents, stabilisers, propellants, bulking agents, enzymes and antifoaming agents.
All the statements are true.
Mama’s Kitchen Beef Lasagna is the healthier option as it contains less saturated fat, more fibre and less salt.
6C
6D
6E

80 HE3001 © te aho o te kura pounamu
answer guide
8. food for health
Sugary and caffeinated drinks sit in the EAT LESS section of the pyramid as they are high in sugar and caffeine.
eat lessSugary, salty, fatty foods,
alcohol
Lean meat, chicken, seafood,
eggs, dried peas, beans and lentils,
nuts
Vegetables and fruit
Milk and milk
products
Bread and cereals
Servings Servings
Servings
Servings
Servings
Vegetables
Fruit
eat moderately
eat most 63
3 at least 3
0
2
8C
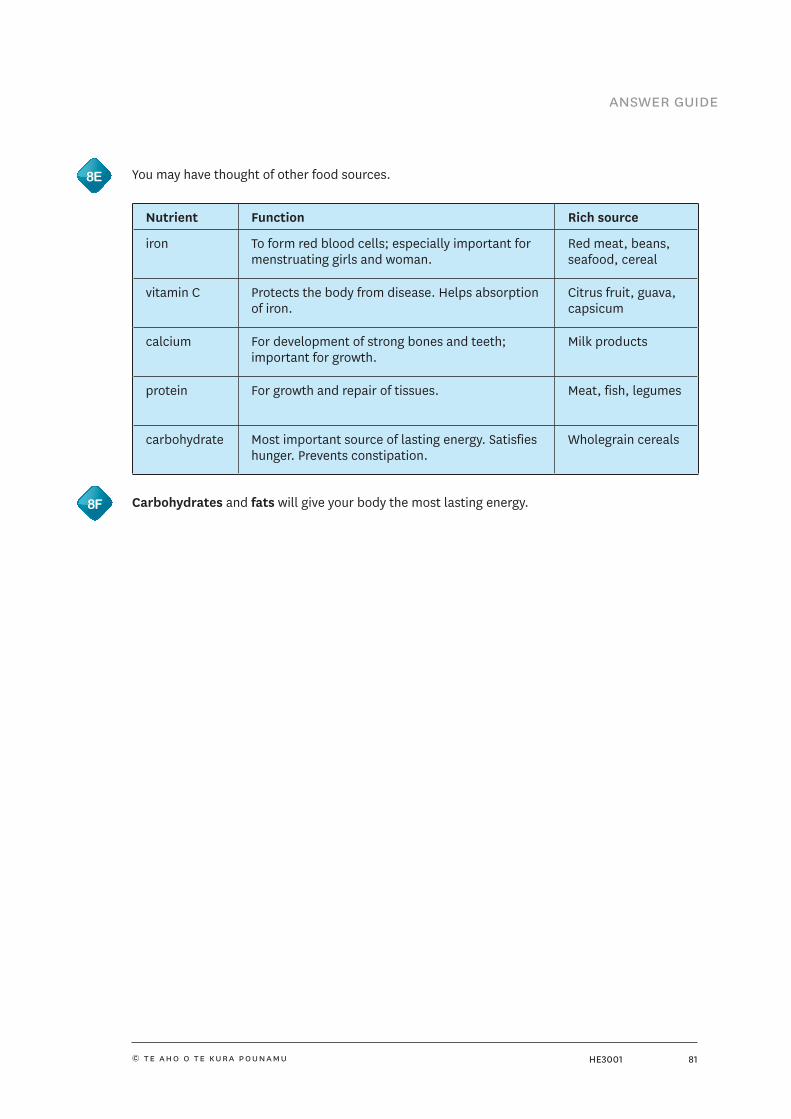
81HE3001© te aho o te kura pounamu
answer guide
You may have thought of other food sources.
Nutrient Function Rich source
iron To form red blood cells; especially important for menstruating girls and woman.
Red meat, beans, seafood, cereal
vitamin C Protects the body from disease. Helps absorption of iron.
Citrus fruit, guava, capsicum
calcium For development of strong bones and teeth; important for growth.
Milk products
protein For growth and repair of tissues. Meat, fish, legumes
carbohydrate Most important source of lasting energy. Satisfies hunger. Prevents constipation.
Wholegrain cereals
Carbohydrates and fats will give your body the most lasting energy.8F
8E

82 HE3001 © te aho o te kura pounamu
acknowledgements
Every effort has been made to acknowledge and contact copyright holders. Te Aho o Te Kura Pounamu apologises for any
omissions and welcomes more accurate information.
Extracts
‘C11 Other drinks’, NZ Food, NZ Children Key Results of the 2002 National Children’s Nutrition Survey, Ministry of Health, Manatū
Haora, www.health.govt.nz/publication/nz-food-nz-children, accessed September 2012. Extract only.
Food and Nutrition Guidelines for Healthy Children and Young People (Aged 2–18 years) (adapted), from www.health.govt.nz/
publication/food-and-nutrition-guidelines-healthy-children-and-young-people-aged-2-18-years-background-paper, accessed
September 2012. Extract only.
‘Why discriminatory taxes don’t work’, UNESDA, www.unesda.org/why-discrimatory-taxes-don-t-work, accessed September 2012.
Extract only.
Articles
‘Woman Addicted to Coke Always Felt Ill’, © Fairfax NZ, www.stuff.co.nz/national/6857516/Woman-addicted-to-Coke-always-felt-ill,
accessed September 2011.
‘Coca-Cola Not To Blame For Death – Sister’, © Fairfax NZ, www.stuff.co.nz/national/health/6776670/Coca-Cola-not-to-blame-for-
death-sister, accessed September 2011.
Logos
Heart Foundation Tick – Dual, © Heart Foundation, 2012. Used by permission
Demeter, © Bio Dynamic Farming and Gardening Association in NZ, 2012. Used by permission
BioGro Certified Organic label, © BioGro New Zealand, 2012. Used by permission
AsureQuality Organic Certification Mark, © AsureQuality, 2012. Used by permission
Fairtrade, © Fairtrade Australia and New Zealand, 2012. Used by permission
Photos
Stock.XCHNG
Milk bottle, 635911
Three eggs, 919967
Raw whole chicken, 108792
Almond seeds, 1310210
Fish, 539373
Cheese varieties, 675875
Margarine, 494304
Pie, 556342
Oil, 795179
Bowl of crisps, 1154344
Loaf of bread, 1104497
Raw spaghetti, 102431
Three potatoes, 826999

83© te aho o te kura pounamu HE3001
Cupcake, 1155519
Sweets and biscuits, 1069935
Cereal in plastic container, 619971
Milk bottle, 635911
Stockexpert
Vegetable assortment, 107513
Water bottle, 733906
Tomato, 1292607
Chocolate milkshake, 87844
Hot chocolate, 507780
Soup, 1184163
Fried rice, 426027
Glass of water, 964550
Pears, apple and mandarin, 1009191
Vegetable medley, 352375
Photo Montage: Kai Baskets. Samdog Design. © 2009 Samdog Design. Images from www.sxc.hu. (#154318, #60998, #60999,
#106538, #110371, #476179, #494304, #510937, #547019, #587255, #606263, #700099, #712549, #783575,
#885830, #968311, #971008, #971009, #1112146, #1139333, #189279, #308342, #354856, #433527, #442997,
#442997, #675872, #731630, #852551, #863848, #863848, #863851, #863982, #915095, #977192, #978519,
#1024418, #1097284, #1119036, #1119038, #1119039, #1119725, #1138742, #1145070, #1154164, #494063,
#827427, #857982, #965456, #872695, #874089, #965677, #971409, #1008193, #1057963, #1057964, #1104497,
#1116469, #1119989, #1149133, #1150431, #1151359, #1152163, #1152764, #1152598, #1152633, #1152659,
#1153142, #1153143, #1153733, #1143821, #1153841, #1156833, #1158702, #1160938, #1163143, #1170296).
istockphoto
Information on a tin can, 7824246
Fit man and sports drink, 4187479
Torn white paper, 19396955
Coke, 15767576. Editorial use only
Old paper, 9129767
Coca-cola cans, 21116429. Editorial use only
Students at the library, 20789462
Woman holding blank smart phone, 20830441
Group of people standing together, 21436438
Coca-cola, 16364952. Editorial use only
Girl drinking sports drink, 9954719
acknowledgements

84 © te aho o te kura pounamuHE3001
acknowledgements
Index cards, 3619362
Coca-cola calories, 21092152. Editorial use only
Magnifying glass, 18312568
Stock photo of milk carton, 3931123
Starkist tuna, 16962794. Editorial use only
Publix brand one gallon of milk, 17398790. Editorial use only
Single can of diet coke, 16586026. Editorial use only
Target your customers, 17224054
Energy drink, 19895195
Mango with slices, 18764589
Fruit and vegetables, 19675973
Broiled salmon, 2664912
Spaghetti with meatballs, 16831625
Fish and chips, 6681390
Cola, 13790495
Food high in carbohydrate, 19290880
Dairy products, 15788563
Meat group, 5999536
Apple orange banana smile, 4089489
Explosion (superhires), 1135336

© te aho o te kura pounamu

© te aho o te kura pounamu

© te aho o te kura pounamu

self-assessment he3001
Fill in the rubric by ticking the boxes you think apply for your work. This is an opportunity for you to reflect on your achievement in this topic and think about what you need to do next. It will also help your teacher. Write a comment if you want to give your teacher more feedback about your work or to ask any questions.
Fill in your name and ID number. Student name: Student ID:
Not yet attempted
Didn't understand
Understood some
Understood most
Very confident in my
understanding
Identify qualitative and quantitative data to critically analyse a current nutritional issue of significance to New Zealand.
Examine the interconnections between determinants of health and wellbeing.
Assess how attitudes and values affect our food choices.
Interpret food labels and nutritional information.
Please place your comments in the relevant boxes below.
Student comment
Identify qualitative and quantitative data to critically analyse a current nutritional issue of significance to New Zealand.
Examine the interconnections between determinants of health and wellbeing.
Assess how attitudes and values affect our food choices.
Interpret food labels and nutritional information.
Any further student comments.
© te aho o te kura pounamu

Contact your teacher if you want to talk about any of this work. Freephone 0800 65 99 88
teacher use only
Teacher comment
Please find attached letter
© te aho o te kura pounamu

authentication statement I certify that the assessment work is the original work of the student named above.
for school use only
assessment
www.tekura.school.nz
cover sheet – he3001
students – place student address label below or write in your details.
Full Name
ID No.
Address (If changed)
Signed(Student)
Signed(Supervisor)