Historical Temperature Variability Affects Coral Response to Heat Stress
9
Historical Temperature Variability Affects Coral Response to Heat Stress Jessica Carilli 1 *, Simon D. Donner 2 , Aaron C. Hartmann 3 1 Institute for Environmental Research, Australian Nuclear Science and Technology Organization, Lucas Heights, New South Wales, Australia, 2 Department of Geography, University of British Columbia, Vancouver, British Columbia, Canada, 3 Scripps Institution of Oceanography, University of California San Diego, La Jolla, California, United States of America Abstract Coral bleaching is the breakdown of symbiosis between coral animal hosts and their dinoflagellate algae symbionts in response to environmental stress. On large spatial scales, heat stress is the most common factor causing bleaching, which is predicted to increase in frequency and severity as the climate warms. There is evidence that the temperature threshold at which bleaching occurs varies with local environmental conditions and background climate conditions. We investigated the influence of past temperature variability on coral susceptibility to bleaching, using the natural gradient in peak temperature variability in the Gilbert Islands, Republic of Kiribati. The spatial pattern in skeletal growth rates and partial mortality scars found in massive Porites sp. across the central and northern islands suggests that corals subject to larger year-to-year fluctuations in maximum ocean temperature were more resistant to a 2004 warm-water event. In addition, a subsequent 2009 warm event had a disproportionately larger impact on those corals from the island with lower historical heat stress, as indicated by lower concentrations of triacylglycerol, a lipid utilized for energy, as well as thinner tissue in those corals. This study indicates that coral reefs in locations with more frequent warm events may be more resilient to future warming, and protection measures may be more effective in these regions. Citation: Carilli J, Donner SD, Hartmann AC (2012) Historical Temperature Variability Affects Coral Response to Heat Stress. PLoS ONE 7(3): e34418. doi:10.1371/ journal.pone.0034418 Editor: Christian R. Voolstra, King Abdullah University of Science and Technology, Saudi Arabia Received September 20, 2011; Accepted February 28, 2012; Published March 30, 2012 Copyright: ß 2012 Carilli et al. This is an open-access article distributed under the terms of the Creative Commons Attribution License, which permits unrestricted use, distribution, and reproduction in any medium, provided the original author and source are credited. Funding: This work was supported by a Natural Sciences and Engineering Research Council of Canada Discovery Grant (SDD; www.nserc-crsng.gc.ca), an Australian Nuclear Science and Technology Organization Postdoctoral Fellowship (JC; ansto.gov.au), and a United States National Science Foundation Graduate Research Fellowship (ACH; www.nsf.gov). The funders had no role in study design, data collection and analysis, decision to publish, or preparation of the manuscript. Competing Interests: The authors have declared that no competing interests exist. * E-mail: [email protected] Introduction Coral bleaching is a stress response in which corals lose their symbiotic dinoflagellate algae [1]. On large spatial scales, bleaching usually occurs when heat stress causes a breakdown in symbiont photosynthesis that leads to the production of oxygen radicals [2,3]. Early work suggested that coral bleaching may occur when water temperatures exceed the maximum normally experienced in the average year by 1uC for a month or more [4]. The accumulation of temperature stress in excess of coral bleaching thresholds, often expressed as the accumulation of degree-heating-months (DHM) or degree-heating-weeks (DHW), is commonly used to predict mass bleaching events [5,6]. Observations indicating that mass bleaching events have recently become more common [7–12], combined with projected increases in heat stress, have prompted dire predictions for the future of coral reefs under unabated greenhouse gas emissions scenarios [13,14]. Understanding of the factors that affect coral bleaching thresholds is useful to improve both predictions of bleaching severity due to a given amount of heat stress [15,16], as well as to investigate whether local short-term mitigation of other stressors or protection of more resistant reefs can delay or avoid degradation of coral reefs over the next several decades [11,17,18]. Recent work has shown that bleaching thresholds in individual corals are not simply related to a certain threshold DHW, nor are the bleaching thresholds necessarily static over time. For example, bleaching susceptibility varies between taxa [19–21], as well as within coral taxa containing different symbiont types [22,23]. Other sources of stress such as nutrient runoff, sedimentation, overfishing, and ocean acidification appear to interact with heat stress to change the bleaching threshold [11,18,24,25]. In addition, there is evidence that corals may adapt to better withstand heat stress via a number of mechanisms. Corals might acquire more thermally-resistant symbionts [26,27], or might increase their own physiological mechanisms to reduce bleaching susceptibility by producing oxidative enzymes [28] or photoprotective compounds [29]. On a reef-wide scale, more resistant taxa may increase in dominance after bleaching [30,31]. There is also evidence that the susceptibility of a given coral or reef to bleaching depends on the thermal history [15,16,32]. Several experimental studies have investigated the influence of prior exposure on the ability of corals to withstand heat stress. One study found that coral nubbins collected from the same colonies on the Great Barrier Reef (GBR) and pre-exposed to slightly elevated temperatures subsequently experienced less zooxanthellae loss than controls when experimentally bleached [33]. Similarly, two studies that collected samples from coral colonies inhabiting environments with different temperature ranges found that corals from more variable environments were less affected by heat stress PLoS ONE | www.plosone.org 1 March 2012 | Volume 7 | Issue 3 | e34418
-
Upload
independent -
Category
Documents
-
view
2 -
download
0
Transcript of Historical Temperature Variability Affects Coral Response to Heat Stress
Historical Temperature Variability Affects Coral Responseto Heat StressJessica Carilli1*, Simon D. Donner2, Aaron C. Hartmann3
1 Institute for Environmental Research, Australian Nuclear Science and Technology Organization, Lucas Heights, New South Wales, Australia, 2 Department of Geography,
University of British Columbia, Vancouver, British Columbia, Canada, 3 Scripps Institution of Oceanography, University of California San Diego, La Jolla, California, United
States of America
Abstract
Coral bleaching is the breakdown of symbiosis between coral animal hosts and their dinoflagellate algae symbionts inresponse to environmental stress. On large spatial scales, heat stress is the most common factor causing bleaching, which ispredicted to increase in frequency and severity as the climate warms. There is evidence that the temperature threshold atwhich bleaching occurs varies with local environmental conditions and background climate conditions. We investigated theinfluence of past temperature variability on coral susceptibility to bleaching, using the natural gradient in peak temperaturevariability in the Gilbert Islands, Republic of Kiribati. The spatial pattern in skeletal growth rates and partial mortality scarsfound in massive Porites sp. across the central and northern islands suggests that corals subject to larger year-to-yearfluctuations in maximum ocean temperature were more resistant to a 2004 warm-water event. In addition, a subsequent2009 warm event had a disproportionately larger impact on those corals from the island with lower historical heat stress, asindicated by lower concentrations of triacylglycerol, a lipid utilized for energy, as well as thinner tissue in those corals. Thisstudy indicates that coral reefs in locations with more frequent warm events may be more resilient to future warming, andprotection measures may be more effective in these regions.
Citation: Carilli J, Donner SD, Hartmann AC (2012) Historical Temperature Variability Affects Coral Response to Heat Stress. PLoS ONE 7(3): e34418. doi:10.1371/journal.pone.0034418
Editor: Christian R. Voolstra, King Abdullah University of Science and Technology, Saudi Arabia
Received September 20, 2011; Accepted February 28, 2012; Published March 30, 2012
Copyright: � 2012 Carilli et al. This is an open-access article distributed under the terms of the Creative Commons Attribution License, which permitsunrestricted use, distribution, and reproduction in any medium, provided the original author and source are credited.
Funding: This work was supported by a Natural Sciences and Engineering Research Council of Canada Discovery Grant (SDD; www.nserc-crsng.gc.ca), anAustralian Nuclear Science and Technology Organization Postdoctoral Fellowship (JC; ansto.gov.au), and a United States National Science Foundation GraduateResearch Fellowship (ACH; www.nsf.gov). The funders had no role in study design, data collection and analysis, decision to publish, or preparation of themanuscript.
Competing Interests: The authors have declared that no competing interests exist.
* E-mail: [email protected]
Introduction
Coral bleaching is a stress response in which corals lose their
symbiotic dinoflagellate algae [1]. On large spatial scales,
bleaching usually occurs when heat stress causes a breakdown in
symbiont photosynthesis that leads to the production of oxygen
radicals [2,3]. Early work suggested that coral bleaching may
occur when water temperatures exceed the maximum normally
experienced in the average year by 1uC for a month or more [4].
The accumulation of temperature stress in excess of coral
bleaching thresholds, often expressed as the accumulation of
degree-heating-months (DHM) or degree-heating-weeks (DHW),
is commonly used to predict mass bleaching events [5,6].
Observations indicating that mass bleaching events have recently
become more common [7–12], combined with projected increases
in heat stress, have prompted dire predictions for the future of
coral reefs under unabated greenhouse gas emissions scenarios
[13,14].
Understanding of the factors that affect coral bleaching
thresholds is useful to improve both predictions of bleaching
severity due to a given amount of heat stress [15,16], as well as to
investigate whether local short-term mitigation of other stressors or
protection of more resistant reefs can delay or avoid degradation
of coral reefs over the next several decades [11,17,18]. Recent
work has shown that bleaching thresholds in individual corals are
not simply related to a certain threshold DHW, nor are the
bleaching thresholds necessarily static over time. For example,
bleaching susceptibility varies between taxa [19–21], as well as
within coral taxa containing different symbiont types [22,23].
Other sources of stress such as nutrient runoff, sedimentation,
overfishing, and ocean acidification appear to interact with heat
stress to change the bleaching threshold [11,18,24,25]. In addition,
there is evidence that corals may adapt to better withstand heat
stress via a number of mechanisms. Corals might acquire more
thermally-resistant symbionts [26,27], or might increase their own
physiological mechanisms to reduce bleaching susceptibility by
producing oxidative enzymes [28] or photoprotective compounds
[29]. On a reef-wide scale, more resistant taxa may increase in
dominance after bleaching [30,31].
There is also evidence that the susceptibility of a given coral or
reef to bleaching depends on the thermal history [15,16,32].
Several experimental studies have investigated the influence of
prior exposure on the ability of corals to withstand heat stress. One
study found that coral nubbins collected from the same colonies on
the Great Barrier Reef (GBR) and pre-exposed to slightly elevated
temperatures subsequently experienced less zooxanthellae loss
than controls when experimentally bleached [33]. Similarly, two
studies that collected samples from coral colonies inhabiting
environments with different temperature ranges found that corals
from more variable environments were less affected by heat stress
PLoS ONE | www.plosone.org 1 March 2012 | Volume 7 | Issue 3 | e34418

in the laboratory [34,35]. Other studies have found that prior
thermal stress reduced the impact of subsequent heat stress events
on coral communities on Palmyra Atoll in the central Pacific [36],
several different reefs on the GBR [37], and worldwide using
globally-gridded sea surface temperature (SST) products [15].
However, to date, no field studies have specifically investigated
how thermal history affects bleaching susceptibility in individual
corals during real-world heat stress events.
In this study, we collected cores from massive Porites sp. corals in
the Gilbert Islands of Kiribati to investigate how corals along a
natural gradient in temperature variability responded to recent
heat stress events. The Gilbert Islands are a group of 15 atolls and
reef islands that span the equator from about 3.5uN to 2.5uS in the
central Pacific (Figure 1). Unlike much of the tropics, the Gilbert
Islands experience high inter-annual variability in peak temper-
atures due to the effect of the El Nino-Southern Oscillation
(ENSO), but low average seasonality in temperatures due to their
near-equatorial position [16]. The magnitude of variability in
maximum annual temperature, and the frequency and intensity of
thermal stress, decreases from the equatorial Tarawa Atoll (1uN) to
the more northerly Butaritari Atoll, which is less influenced by the
shifts in trade winds and surface currents that occur during ENSO
events (3.5uN) [16]. This ENSO-driven latitudinal gradient
provides an ideal laboratory for evaluating the influence of past
temperature variability on coral susceptibility to bleaching due to
heat stress.
We examined changes in coral skeletal growth rates and partial
mortality scars [11] to investigate the impact of the bleaching
event in 2004 [16] on corals from different temperature variability
regimes. Skeletal extension rate reductions have been noted in
corals due to bleaching in several regions [10,38,39]. However,
apparently only the more severe bleaching events cause a
reduction in skeletal growth rates; for instance, one study found
growth anomalies in 95% of corals from the Mesoamerican Reef
related to severe bleaching in 1998, though only a single core (of
92 collected) showed an anomaly due to a less severe event in 1995
[11]. We also investigated differences in lipid class composition,
namely the concentration of triacylglycerol and wax esters, the
primary energetic lipids utilized by corals [40], to investigate the
impact of a second heat stress event in 2009. We found that corals
historically exposed to lower thermal variability were more
severely affected by thermal stress in both 2004 and 2009,
indicating that reefs experiencing more naturally variable
temperature regimes may be more resistant to future warming.
Methods
We collected coral cores and tissue samples from several
locations around three atolls in the central and northern Gilbert
Islands: Tarawa, Abaiang, and Butaritari, with permission and
assistance from the Republic of Kiribati’s Ministry of Fisheries and
Marine Resource Development (Figure 1).
Coral core collectionA total of 28 cores were collected during May, 2010. The cores
were all collected at approximately 5 m depth on the fore-reef
(except for the core in the Tarawa lagoon, which was ,1 m deep
at low tide). We used a hand-held reversible air drill driven by a
gasoline-powered air compressor. A custom-built stainless steel
core barrel 6 cm in diameter and 50 cm long fitted with a brass
drill head containing carbide teeth was used, fashioned after a
design developed by the Australian Institute for Marine Science.
After core removal, pre-cast concrete plugs were inserted to
prevent colonization of the inside of the coral by boring organisms
and allow coral overgrowth. At each site, we collected cores from
the largest heads within reach of a 30-m-long air hose. Cores were
drilled vertically to obtain the clearest growth banding pattern
along the maximum growth axis. After collection, cores were
rinsed in fresh water and air-dried. Cores were imported to
Australia under CITES permit #2010-AU-594729.
Coral tissue sample collectionSmall ,1 cm cubes of coral tissue and skeletal material for lipid
analysis were collected from 3–5 coral heads at a site using a
hammer and chisel or a metal punch with permission and
assistance from the Republic of Kiribati’s Ministry of Fisheries and
Marine Resource Development. Not all sites where cores were
collected were sampled for coral lipids due to logistical constraints.
Samples were collected at 5 m depth; at one site on Abaiang,
samples were also collected at 10 m depth. Samples were wrapped
in aluminum foil and either frozen in a household freezer (Tarawa
and Butaritari) or kept on ice before freezing (Abaiang; 2 days on
ice) and were subsequently transported on ice to ANSTO, where
they were stored in a 220uC lab freezer until processing. Samples
were imported to Australia under CITES permit #2010-AU-
594729.
Measurement of coral growth rates and tissue thicknessCores were scanned whole using computerized tomography
(CT) at the Royal North Shore Hospital in Sydney, Australia with
a Siemens Biograph mCT [41]. Images were taken in 0.6 mm
axial slice increments using a 100 mm field of view, 140 kV and
300 mAs. Images were reconstructed at the hospital using a
‘‘bone’’ window and ultra-sharp reconstruction and exported as
DICOM files for processing in the laboratory.
Figure 1. Map of sites studied. The box in the inset of the largerPacific Ocean shows the location of the site map.doi:10.1371/journal.pone.0034418.g001
Temperature History Affects Coral Bleaching
PLoS ONE | www.plosone.org 2 March 2012 | Volume 7 | Issue 3 | e34418

We used the open-source program Osirix (version 3.8.1 with 64-
bit extension) to reconstruct 3-d images of core density from CT
scan data using the maximum intensity projection mode. We then
selected the maximum growth axis and took a virtual 3.4-mm thick
slice through the core along this axis, revealing the annual density
banding in each core. We used the ‘‘length’’ tool in Osirix to select
and extract density data in Hounsfield units on transects
perpendicular to the clearest growth banding. Hounsfield units
were converted to density using CT scans of aluminum wedges
originally designed for calibrating x-ray density (see supplemental
material in [11]). Annual bands were then identified manually
between density minima, and the annual extension (cm/year),
density (g/cm3/year), and calcification (extension * density; g/
cm2/year) rates were calculated for the core. This was done twice
along the length of each core in different locations, averaging the
two series to construct the final growth record for each core, and
finally standardizing to an average extension rate of 1 cm/year by
dividing by the mean for each series (Figure 2). See Table S1 for
average data before standardization from each site. Extension
rates are presented here (Figure 2), as changes in calcification rates
are mainly driven by extension due to minimal density fluctuations
in these cores (Figure S1, S2); this has been found in other studies
as well [11,42]. Partial mortality scars were recognized by
comparing anomalous features such as truncated density bands
and very dense material in the CT scans with the original cores
[43]. Tissue thickness was measured as the depth in the skeleton
occupied by tissue, recognized visually, using calipers on the
original cores [44].
Coral total lipid extractionsCoral lipids were extracted using a modified Folch procedure
[45]. Coral samples were first ground in a mortar and pestle, then
lipids were allowed to extract in the dark for one hour in a 2:1 (v/
v) chloroform:methanol solution. Samples were then filtered and
separated from remaining non-lipid material in a separatory
funnel by sequential addition of 0.88% KCl and 100%
chloroform. Finally, samples were dried under nitrogen and
weighed to determine the dry lipid mass. Filters were dried,
weighed, combusted at 450uC for 6 hours, and reweighed to
determine ash-free dry weight of non-lipid fraction. Total lipid
ratios were calculated as the mass of dry lipids/biomass of the
coral (which consisted of the lipid mass plus the ash-free dry
weight).
After drying, each sample was re-suspended in 750 ml of
chloroform, from which 1 ml was spotted at the origin of each of
three quartz Chromarods (S-III, Iatron Laboratories, Inc.). Lipid
classes were separated chromatographically by developing the rods
in a sequential two solvent system: 1) hexane:ethyl ether:acetic acid
(99:1:0.05) (v:v:v) for 25 minutes; 2) hexane:ethyl ether:acetic acid
(80:20:0.1) (v:v:v) for 25 minutes, a modification to the methods in
[40]. Chromatograms were then generated via flame ionization
detection (FID) of the full length of each rod using an Iatroscan
TLC-FID MK-5 (Iatron Laboratories, Inc.) and LabView software
(National Instruments). The triplicate analyses made for each
crude lipid sample were averaged. Lipid class concentrations were
calculated by comparing sample peak areas and retention times
against previously generated calibration curves and retention times
of known standards. The standard compounds used were: 5-a-
cholestane for hydrocarbons, palmitic acid palmityl ester for wax
esters, tripalmitin for triacylglycerol, stearic acid for free fatty
acids, stigmastanol for sterols and L-a-phophatidylcholine for
phospholipids.
Thermal variability and stressWeekly sea surface temperature (SST) data at 4-km resolution
were obtained from the AVHRR Pathfinder satellite retrospective
dataset (1985–2009) made available by the NOAA Coral Reef
Watch Program (http://coralreefwatch.noaa.gov; Figure 3). We
calculated three metrics of thermal history: (1) the mean of the
annual maximum DHW from 1985–2003 (2) the proportion of
years from 1985 to 2003 in which the maximum DHW exceeded
4uC?week, and (3) a year-to-year temperature variability metric
from [16,46], which is the standard deviation of the maximum
monthly SST from 1985–2000 scaled such that the mean for the
world’s coral reefs is 1uC. We also calculated heat stress in 2004 as
the maximum DHW at each site.
Statistical analysesWe measured the severity of bleaching in 2004 as (1) the
percentage that extension rates were reduced in 2004 from the
long-term average for the length of each coral core up to 2003 and
(2) the proportion of cores that showed a partial mortality scar in
2004. We used lipid/biomass ratios and tissue thickness as
measures of coral health at the time of collection [25,44]. Because
of the similar thermal history and close proximity of Abaiang and
North Tarawa, we grouped sites from those islands together to
compare against sites at Butaritari. Data from the site adjacent to
heavily populated South Tarawa (TRW3) were compared
separately to investigate differences that may be associated with
the extreme local human impacts at South Tarawa. We tested for
normality of the data using the Shapiro-Wilkes test in R (version
1.13). We used t-tests when data were normal and permutation
tests when data were not normal to test for differences in bleaching
severity, tissue thickness, lipid measures, and skeletal growth rates
between corals from the island groups. We also tested for
significant differences in thermal variability measures as well as
heat stress in 2004 and 2009 between these island groups.
Results
Background thermal variability from 1985–2003 was lower at
Butaritari than at Abaiang and North Tarawa as well as at South
Tarawa (Table 1). Using permutation tests between temperature
metrics at Butaritari versus Abaiang and North Tarawa, we found
significant differences in the mean of the maximum annual DHW
(mean 2.3uC?week versus 3.9uC?week, p,0.01) and the scaled
year-to-year temperature variability metrics (mean 1.3uC?week
versus 1.5uC?week, p,0.01). The mean maximum DHW in 2004
was higher at Abaiang and North Tarawa (mean of all sites
14.6uC?week) than at Butaritari (mean 10.4uC?week). Likewise,
though less warming occurred overall in 2009 compared to 2004,
the mean maximum DHW in 2009 was significantly higher at
Abaiang and North Tarawa (mean of all sites 13.8uC?week) than
at Butaritari (mean 7.1uC?week) (p,0.01, t-test). In both 2004 and
2009, South Tarawa experienced the highest heat stress, with
maximum DHW of 24.2uC?week and 19.1uC?week, respectively
(Table 1).
Corals from Butaritari were more severely affected by bleaching
in 2004 (Figure 2); on average corals from Butaritari had a 45%
reduction in skeletal extension rates in 2004 compared with a 22%
reduction at Abaiang and North Tarawa (p = 0.055, permutation
test between sites, Figure 4). Density changes were small and
inconsistent (for example, density in 2004 increased compared to
previous years by 2% on average at site BUT3, but decreased by
3% on average at BUT9). Calcification (extension * density)
changes were therefore almost identical to extension. At Butaritari,
all corals had reduced extension in 2004 compared to all previous
Temperature History Affects Coral Bleaching
PLoS ONE | www.plosone.org 3 March 2012 | Volume 7 | Issue 3 | e34418

years for each individual coral, ranging from 22–78%. At Abaiang
and North Tarawa, five corals actually had higher extension in
2004 (maximum 15% increase compared to previous years), while
the largest reduction was 67% in one core. In addition, 31% of
corals from Butaritari (N = 13) had partial mortality scars
associated with the 2004 bleaching event, while none from
Abaiang and North Tarawa showed such scars (N = 12); this
difference was marginally significant (p = 0.10, permutation test).
There were no significant differences in the magnitude of
extension rate reduction or partial mortality between Abaiang
and North Tarawa versus South Tarawa.
Skeletal extension rates recovered within two years of the
bleaching event at both island groups (Figure 2). We did not find
any evidence for prior bleaching events in our cores; there were
neither partial mortality scars prior to 2004 nor any significant
reductions in growth rates in multiple cores in any single prior
year. The majority of cores were not long (,30 years, Figure 2)
and therefore prior events may have occurred but were not
recorded in the few longer cores we collected.
Measures of coral health at the time of sample collection were
also significantly different between island groups (Figure 5). Corals
from Abaiang and North Tarawa had significantly thicker tissue
(mean 4.1 mm) than Butaritari (mean 3.6 mm) (p = 0.04, t-test), as
well as significantly higher triacylglycerol concentrations (mean
23.4 versus 13.3 mg) (p = 0.03, permutation test) and sterol
concentrations (mean 4.7 versus 2.4 mg) (p,0.01, t-test). There
were no significant differences in wax esters, free fatty acids,
phospholipids or total lipid concentrations between Abaiang and
North Tarawa versus Butaritari. There were also no significant
differences in lipid measures or tissue thickness between South
Tarawa versus Abaiang and North Tarawa.
Figure 2. Annual coral extension rates. Extension rates for individual coral cores standardized such that the long-term average for each record isequal to 1 cm/year.doi:10.1371/journal.pone.0034418.g002
Temperature History Affects Coral Bleaching
PLoS ONE | www.plosone.org 4 March 2012 | Volume 7 | Issue 3 | e34418

Discussion
Butaritari experiences lower year-to-year variability in SST
than Abaiang and Tarawa, which are more directly influenced by
current and wind reversals during ENSO events [16,47]. Although
heat stress in 2004 was lower at Butaritari than at Abaiang and
North Tarawa, massive Porites sp. corals at Butaritari experienced
more severe bleaching as indicated by skeletal extension rate
reductions and the occurrence of partial mortality scars. This
evidence of reduced resistance to bleaching in 2004 in corals at
Butaritari supports previous short-term manipulative experiments
and long-term observational studies which found that higher
background temperature variability or previous exposure to heat
stress conferred bleaching resistance [15,33–37]. Within individual
colonies, we found that corals pre-exposed to higher thermal
variability were better able to resist bleaching during a natural
high temperature stress event. Our findings are also consistent
with a study that tracked individual colonies and found prior
exposure to high light reduced bleaching during a subsequent heat
stress event [32].
The skeletal extension rate and partial mortality scar data for all
three atolls suggest that massive Porites sp. corals in the Gilbert
Islands could be, in general, more resistant to bleaching than
corals in much of the tropics. Even in Butaritari, the decrease in
extension rates and fraction of corals with partial mortality scars in
2004 was low despite levels of heat stress (mean maximum DHW
of 10.4uC?week) which have caused and are predicted to cause
severe bleaching and coral mortality in other regions of the world
Figure 3. Weekly sea surface temperature (6C; black) and degree heating weeks (6C?week; gray) from 1985 through 2009. Plots showthe average of the values from the 4 km2 AVHRR grid cells that include field sites in (A) Butaritari, (B) Abaiang and North Tarawa, and (C) SouthTarawa.doi:10.1371/journal.pone.0034418.g003
Temperature History Affects Coral Bleaching
PLoS ONE | www.plosone.org 5 March 2012 | Volume 7 | Issue 3 | e34418
[43,48,49]. Coral reefs in the Gilbert Islands and other regions of
the central equatorial Pacific experience higher year-to-year SST
variability than most coral reefs in the tropics due to temperature
fluctuations caused by ENSO. For example, the variability metric
based on the standard deviation of the maximum monthly SST for
the sites in South Tarawa, Abaiang and North Tarawa, and
Butaritari is 69, 50, and 29% greater, respectively, than the
median value for the world’s coral reefs [16]. As such, the standard
bleaching thresholds (e.g. DHW .4uC?week) may not accurately
describe the likelihood of bleaching in locations with high inter-
annual temperature variability like the Gilbert Islands; a method
using the past inter-annual temperature variability to estimate the
bleaching threshold may be more appropriate in these locations
[16]. The evidence that bleaching resistance depends on thermal
history, from the coral cores and from coral community surveys
[47], suggests that the climatic variability of the Gilbert Islands,
particularly those atolls closest to the equator (Abaiang and
Tarawa), may have caused the corals to acclimatize to the
observed level of heat stress.
The mechanisms by which such acclimatization could occur
include (1) differences in symbiont type, (2) increased production of
photoprotective compounds, or (3) increased production of
antioxidants and heat-shock proteins. Different symbiont types
can confer differential thermal tolerance [22,23], and the types of
symbionts harbored may change due to heat stress exposure,
leading to increased bleaching resistance during later events [31].
Photoprotective compounds such as fluorescent proteins may
increase bleaching resistance [29]; therefore, pre-exposure to a
variable thermal environment might lead to increased production
of photoprotective compounds, helping the corals cope with heat
stress [33]. One study found higher antioxidant enzymes and heat-
shock proteins in coral samples pre-exposed to light stress, which
subsequently were less likely to bleach during heat stress [50].
These molecules can help prevent damage to coral tissue during
oxidative stress [2], and likely reduce the occurrence of bleaching
in response to oxidative stress [50]. It is possible that one or a
combination of these and/or as-yet-unidentified factors caused the
observed differences in bleaching resistance in the Gilbert Islands
corals studied here.
In 2009–10, another ENSO-driven heat stress event occurred in
the Gilbert Islands, with heat stress peaking in December. We
found no significant effects from this heat stress event in skeletal
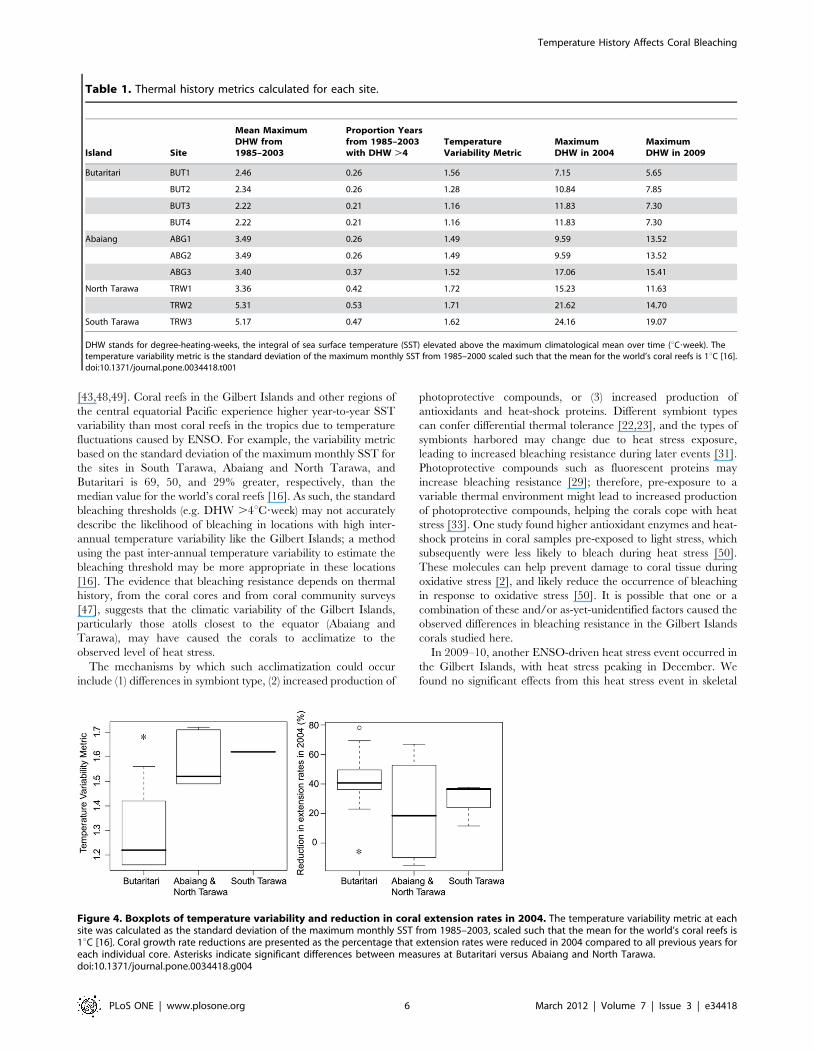
Table 1. Thermal history metrics calculated for each site.
Island Site
Mean MaximumDHW from1985–2003
Proportion Yearsfrom 1985–2003with DHW .4
TemperatureVariability Metric
MaximumDHW in 2004
MaximumDHW in 2009
Butaritari BUT1 2.46 0.26 1.56 7.15 5.65
BUT2 2.34 0.26 1.28 10.84 7.85
BUT3 2.22 0.21 1.16 11.83 7.30
BUT4 2.22 0.21 1.16 11.83 7.30
Abaiang ABG1 3.49 0.26 1.49 9.59 13.52
ABG2 3.49 0.26 1.49 9.59 13.52
ABG3 3.40 0.37 1.52 17.06 15.41
North Tarawa TRW1 3.36 0.42 1.72 15.23 11.63
TRW2 5.31 0.53 1.71 21.62 14.70
South Tarawa TRW3 5.17 0.47 1.62 24.16 19.07
DHW stands for degree-heating-weeks, the integral of sea surface temperature (SST) elevated above the maximum climatological mean over time (uC?week). Thetemperature variability metric is the standard deviation of the maximum monthly SST from 1985–2000 scaled such that the mean for the world’s coral reefs is 1uC [16].doi:10.1371/journal.pone.0034418.t001
Figure 4. Boxplots of temperature variability and reduction in coral extension rates in 2004. The temperature variability metric at eachsite was calculated as the standard deviation of the maximum monthly SST from 1985–2003, scaled such that the mean for the world’s coral reefs is1uC [16]. Coral growth rate reductions are presented as the percentage that extension rates were reduced in 2004 compared to all previous years foreach individual core. Asterisks indicate significant differences between measures at Butaritari versus Abaiang and North Tarawa.doi:10.1371/journal.pone.0034418.g004
Temperature History Affects Coral Bleaching
PLoS ONE | www.plosone.org 6 March 2012 | Volume 7 | Issue 3 | e34418

extension rates in our coral cores, indicating that it did not cause
as severe a bleaching event as in 2004. Because there was no
apparent reduction in skeletal growth rates due to the milder 2009
heat stress event in our cores, we instead utilized the content of
energetic lipids in coral tissue from each island as a more subtle
measure of coral health after this event.
We found that triacylglycerol was significantly reduced in corals
at Butaritari sampled in May of 2010 as compared to corals at
Abaiang and North Tarawa. Of the two primary lipid energy
sources in corals, triacylglycerol is more easily metabolized than
wax esters and thus is commonly exhausted more rapidly by
marine organisms during times of stress, such as starvation [51]. In
Porites compressa nubbins that were experimentally bleached using
heat stress, a reduction in triacylglycerol concentrations was
observed 0, 1.5 and 8 months after bleaching [40]. While no
reductions in extension rates were observed in cores taken seven
months after the start of the 2009 heat stress event, reduced
triacylglycerol concentrations at Butaritari are consistent with the
conclusions drawn from extension rate reductions in 2004 that
suggest corals there have a reduced capacity to cope with heat
stress relative to Abaiang and Tarawa.
In contrast to the triacylglycerol concentrations, there was no
significant difference in wax esters between the island groups. One
study found that the response of wax esters to heat stress was
delayed after bleaching, as that lipid class was not depleted at 0,
1.5, or 4 months after bleaching but was depleted 8 months after
the bleaching occurred [40]. This is consistent with the role of wax
esters class lipids as a long-term (i.e., slowly metabolized) energy
source [51]. Our samples were collected approximately 5 months
after the peak heat stress, and this delayed response may explain
the lack of difference between island groups studied here.
However, more studies investigating changes in lipid class
concentrations at different times after bleaching are needed.
Corals in South Tarawa experience similar year-to-year
temperature variability to those at Abaiang and North Tarawa,
but are subject to greater local human-induced stress due to the
proximity to the population and administrative centre of Kiribati
[47]. Previous studies have found that local stress reduces
bleaching resistance with a given amount of heat stress [11,18].
The corals in South Tarawa did experience a greater reduction
(29%) in extension rates in 2004 than the corals in North Tarawa
and Abaiang (22%). However, the difference was not statistically
significant, and the corals in South Tarawa were exposed to higher
heat stress in 2004 than those in North Tarawa and Abaiang. In
addition, after the 2009 heat stress event, there were no significant
differences between coral tissue and lipids measures between
South Tarawa versus Abaiang and North Tarawa (Figure 5).
The seeming resistance of corals in South Tarawa to bleaching
may be due to the interaction of the local stressors with the effects
of thermal history on the physiology of the corals. The lack of
significant differences in tissue thickness or lipids measures
between South Tarawa versus Abaiang and North Tarawa,
despite higher heat stress in 2009 at South Tarawa, suggests that
the sampled corals may benefit energetically due to increased food
availability from surface runoff, appearing healthier several
months after the heat stress event. For instance, one study found
that corals in turbid, inshore environments actually had higher
lipid stores than corals of the same species further offshore,
probably due to higher rates of particle feeding [52]. The coral
community on the outer reef in South Tarawa is different from
Figure 5. Boxplots of tissue thickness and lipid class concentrations for each island. Lipid concentrations are reported as mg lipid per mgtotal tissue. Asterisks indicate significant differences between Butaritari and other islands.doi:10.1371/journal.pone.0034418.g005
Temperature History Affects Coral Bleaching
PLoS ONE | www.plosone.org 7 March 2012 | Volume 7 | Issue 3 | e34418

that at the other outer reef sites studied; South Tarawa is
dominated by the weedy encrusting species Porites rus, while at the
other sites the coral community is dominated by massive Porites
spp., Heliopora spp., Montipora spp. and Favia spp. [47]. The cover of
P. rus in South Tarawa expanded after the 2004 bleaching event
[47]; by 2010, P. rus comprised 66% and 80% of the coral cover at
5 m depth and 10 m depth, respectively, at our site TRW3
(unpublished survey data collected by SD in May 2010). One
possibility is that the remaining massive Porites sp. corals we
sampled at South Tarawa are highly resistant remnant colonies,
and more susceptible massive Porites sp. colonies have already died
off. The results from South Tarawa underscore the need to
compare corals from similar environments to isolate the effects of a
certain stressor.
These results suggest that the background temperature regime
may affect coral resilience to bleaching, although the relationship
may also depend on direct human stress on the coastal
environment. This finding could eventually be useful in refining
methods of bleaching prediction [16] and developing methods for
identifying coral reefs or habitats that are more resilient to future
warming. For example, locations subject to high historical
temperature variability are likely to be less affected by future heat
stress, and may be considered priorities for protection. Further
data collection in the Gilbert Islands and other regions subject to
ENSO-driven variability in temperature could help identify the
effect of frequent heat stress events on the susceptibility of different
taxa and different coral communities to bleaching and bleaching-
related mortality.
Supporting Information
Figure S1 Annual coral calcification rates. Calcification
rates for individual coral cores standardized such that the long-
term average for each record is equal to 1 g/cm2/year.
(TIF)
Figure S2 Annual average coral density. Annual average
skeletal density for individual coral cores standardized such that
the long-term average for each record is equal to 1 g/cm3/year.
(TIF)
Table S1 Average coral extension rate (cm/year),density (g/cm3/year), and calcification rates (extension* density; g/cm2/year) from individual sites, and fromisland groups used in study.(DOC)
Acknowledgments
We thank Aranteiti Tekiau, Toaea Beiateuea, Iobi Arabua, the late
Iranimwemwe Teingiia, the late Moiwa Erutarem, and Adam Young for
help in the field. Thanks go to Dale Bailey and the Royal North Shore
Hospital for CT scanning, Mark Ohman for laboratory space and use of
the Iatroscan MK-5, and Scott Heron of NOAA Coral Reef Watch for
providing the satellite-derived SST data.
Author Contributions
Conceived and designed the experiments: JC SDD. Performed the
experiments: JC SDD ACH. Analyzed the data: JC SDD ACH.
Contributed reagents/materials/analysis tools: JC SDD ACH. Wrote the
paper: JC SDD ACH.
References
1. Brown B (1997) Coral bleaching: causes and consequences. Coral Reefs 16,
Suppl: S129–S138.
2. Lesser M (1997) Oxidative stress causes coral bleaching during exposure to
elevated temperatures. Coral Reefs 16: 187–192.
3. Downs C, Fauth JE, Halas JC, Dustan P, Bemiss J, et al. (2002) Oxidative stress
and seasonal coral bleaching. Free Radic Biol Med 33(4): 533–543.
4. Goreau TJ, Hayes RL (1994) Coral bleaching and ocean ‘‘hot spots’’. Ambio 23:
176–180.
5. Fitt W, Brown BE, Warner ME, Dunne RP (2001) Coral bleaching:
interpretation of thermal tolerance limits and thermal threshold in tropical
corals. Coral Reefs 20: 51–65.
6. Strong A, Barrientos CS, Duda C, Sapper J (1997) Improved satellite techniques
for monitoring coral reef bleaching. Proc 8th Intl Coral Reef Symp 2:
1495–1498.
7. Harvell C, Kim K, Burkholder JM, Colwell RR, Epstein PR, et al. (1999)
Emerging marine diseases–Climate links and anthropogenic factors. Science
285: 1505–1510.
8. Lough J (2000) 1997–98: Unprecedented thermal stress to coral reefs? Geophys
Res Lett 27(23): 3901–3904.
9. McWilliams J, Cote IM, Gill JA, Sutherland WJ, Watkinson AR (2005)
Accelerating impacts of temperature-induced coral bleaching in the Caribbean.
Ecology 86(8): 2055–2060.
10. Halley R, Hudson JH (2007) Fidelity of annual growth in Montastraea faveolata and
the recentness of coral bleaching in Florida. In: Aronson R, ed. Geological
Approaches to Coral Reef Ecology. New York: Springer.
11. Carilli J, Norris RD, Black B, Walsh SW, McField M (2010) Century-scale
records of coral growth rates indicate that local stressors reduce coral thermal
tolerance threshold. Global Change Biol 16(4): 1247–1257.
12. Carilli JE, Godfrey J, Norris RD, Sandin SA, Smith JE (2010) Periodic
endolithic algal blooms in Montastraea faveolata corals may represent periods of
low-level stress. Bull Mar Sci 86(3): 709–718.
13. Hoegh-Guldberg O (1999) Climate change, coral bleaching, and the future of
the world’s coral reefs. Mar Freshw Res 50: 839–866.
14. Donner SD, Skirving WJ, Little CM, Oppenheimer M, Hoegh-Guldberg O
(2005) Global assessment of coral bleaching and required rates of adaptation
under climate change. Global Change Biol 11(12): 2251–2265.
15. Thompson DM, Van Woesik R (2009) Corals escape bleaching in regions that
recently and historically experienced frequent thermal stress. Proc R Soc B: Biol
Sci 276(1669): 2893.
16. Donner SD (2011) An evaluation of the effect of recent temperature variability
on the prediction of coral bleaching events. Ecol Appl 21(5): 1718–1730.
17. Baskett ML, Gaines SD, Nisbet RM (2009) Symbiont diversity may help coral
reefs survive moderate climate change. Ecol Appl 19(1): 3–17.
18. Wooldridge S (2009) Water quality and coral bleaching thresholds: Formalising
the linkage for the inshore reefs of the Great Barrier Reef, Australia. Mar Poll
Bull 58: 745–751.
19. Berkelmans R, Willis BL (1999) Seasonal and local spatial patterns in the upper
thermal limits of corals on the inshore Central Great Barrier Reef. Coral Reefs
18(3): 219–228.
20. Marshall PA, Baird AH (2000) Bleaching of corals on the Great Barrier Reef:
differential susceptibilities among taxa. Coral Reefs 19(2): 155–163.
21. Yee SH, Santavy DL, Barron MG (2008) Comparing environmental influences
on coral bleaching across and within species using clustered binomial regression.
Ecol Model 218(1–2): 162–174.
22. Berkelmans R, van Oppen MJH (2006) The role of zooxanthellae in the thermal
tolerance of corals: a ‘nugget of hope’ for coral reefs in an era of climate change.
Proc R Soc B: Biol Sci 273(1599): 2305.
23. Sampayo EM, Ridgway T, Bongaerts P, Hoegh-Guldberg O (2008) Bleaching
susceptibility and mortality of corals are determined by fine-scale differences in
symbiont type. Proc Natl Acad Sci 105(30): 10444.
24. Anthony KRN, Kline DI, Diaz-Pulido G, Dove S, Hoegh-Guldberg O (2008)
Ocean acidification causes bleaching and productivity loss in coral reef builders.
Proc Natl Acad Sci 105(45): 17442–17446.
25. Anthony KRN, Connolly SR, Hoegh-Guldberg O (2007) Bleaching, energetics,
and coral mortality risk: Effects of temperature, light, and sediment regime.
Limnol Oceanog 52(2): 716–726.
26. Buddemeier RW, Fautin DG (1993) Coral bleaching as an adaptive mechanism.
BioScience 43(5): 320–326.
27. Rowan R (2004) Coral bleaching: Thermal adaptation in reef coral symbionts.
Nature 430(7001): 742.
28. Coles SL, Brown BE (2003) Coral bleaching – capacity for acclimatization and
adaptation. In: Adv Mar Biol 46: 183–223.
29. Salih A, Larkum A, Cox G, Kuhl M, Hoegh-Guldberg O (2000) Fluorescent
pigments in corals are photoprotective. Nature 408(6814): 850–853.
30. Loya Y, Sakai K, Yamazato K, Nakano Y, Sambali H, et al. (2001) Coral
bleaching: the winners and the losers. Ecol Lett 4(2): 122–131.
31. Jones AM, Berkelmans R, van Oppen MJH, Mieog JC, Sinclair W (2008) A
community change in the algal endosymbionts of a scleractinian coral following
a natural bleaching event: field evidence of acclimatization. Proc R Soc B: Biol
Sci 275(1641): 1359.
32. Brown N, Dunne R, Goodson M, Douglas A (2002a) Experience shapes the
susceptibility of a reef coral to bleaching. Coral Reefs 21(2): 119–126.
Temperature History Affects Coral Bleaching
PLoS ONE | www.plosone.org 8 March 2012 | Volume 7 | Issue 3 | e34418

33. Middlebrook R, Hoegh-Guldberg O, Leggat W (2008) The effect of thermal
history on the susceptibility of reef-building corals to thermal stress. J Exp Biol211: 1050–1056.
34. Castillo K, Helmuth BST (2005) Influence of thermal history on the response of
Montastrea annularis to short-term temperature exposure. Mar Biol 148: 261–270.35. Oliver TA, Palumbi SR (2011) Do fluctuating temperature environments elevate
coral thermal tolerance? Coral Reefs 30(2): 429–440.36. Williams G, Knapp IS, Maragos JE, Davy SK (2010) Modeling patterns of coral
bleaching at a remote central Pacific atoll. Mar Poll Bull 60: 1467–1476.
37. Maynard J, Anthony K, Marshall P, Masiri I (2008) Major bleaching events canlead to increased thermal tolerance in corals. Mar Biol 155: 173–182.
38. Leder J, Szmant AM, Swart PK (1991) The effect of prolonged ‘‘bleaching’’ onskeletal banding and stable isotopic composition in Montastrea annularis. Coral
Reefs 10: 19–27.39. Suzuki A, Gagan MK, Fabricius K, Isdale PJ, Yukino I, et al. (2003) Skeletal
isotope microprofiles of growth perturbations in Porites corals during the 1997–
1998 mass bleaching event. Coral Reefs 22: 357–369.40. Rodrigues LJ, Grottoli AG, Pease TK (2008) Lipid class composition of bleached
and recovering Porites compressa Dana, 1846 and Montipora capitata Dana, 1846corals from Hawaii. J Exp Mar Biol Ecol 358(2): 136–143.
41. Cantin NE, Cohen AL, Karnauskas KB, Tarrant AM, McCorkle DC (2010)
Ocean warming slows coral growth in the central Red Sea. Science 329(5989):322–325.
42. Lough J, Barnes DJ (2000) Environmental controls on growth of the massivecoral Porites. Jour Exp Mar Biol Ecol 245: 225–243.
43. Carilli J, Norris RD, Black BA, Walsh SM, McField M (2009) Local stressors
reduce coral resilience to bleaching. PLoS ONE 4(7): e6324.
44. Barnes D, Lough JM (1992) Systematic variations in the depth of skeleton
occupied by coral tissue in massive colonies of Porites from the Great Barrier
Reef. Jour Exp Mar Biol Ecol 159: 113–128.
45. Rodrigues L (2005) Physiology and biogeochemistry of bleached and recovering
corals from Hawaii. Dissertation: University of Pennsylvania.
46. Donner SD (2009) Coping with commitment: projected thermal stress on coral
reefs under different future scenarios. PLoS ONE 4: e5712.
47. Donner SD, Kirata T, Vieux C (2010) Recovery from the 2004 coral bleaching
event in the Gilbert Islands, Kiribati. Atoll Res Bull 587.
48. Strong A, Liu G, Meyer J, Hendee JC, Sasko D (2004) Coral Reef Watch 2002.
Bull Mar Sci 75(2): 259–268.
49. Eakin C, Morgan JA, Heron SF, Smith TB, Liu G, et al. (2010) Caribbean
corals in crisis: Record thermal stress, bleaching, and mortality in 2005. PLoS
One 5(11): e13969.
50. Brown BE, Downs CA, Dunne RP, Gibb SW (2002b) Exploring the basis of
thermotolerance in the reef coral Goniastrea aspera. Mar Ecol Prog Ser 242:
119–129.
51. Benson AA, Lee RF, Nevenzel JC (1972) Wax esters: Major marine metabolic
energy sources. Proc Biochem Soc 128: 1–10.
52. Anthony KRN (2006) Enhanced energy status of corals on coastal, high-
turbidity reefs. Mar Ecol Prog Ser 319: 111–116.
Temperature History Affects Coral Bleaching
PLoS ONE | www.plosone.org 9 March 2012 | Volume 7 | Issue 3 | e34418