Highly predictive survival nomogram after upper urinary tract urothelial carcinoma
11
Highly Predictive Survival Nomogram After Upper Urinary Tract Urothelial Carcinoma Claudio Jeldres, MD 1,2 ; Maxine Sun 1 ; Giovanni Lughezzani 1,3 ; Hendrik Isbarn 1,4 ; Shahrokh F. Shariat 5 ; Hugues Widmer 1 ; Markus Graefen 4 ; Francesco Montorsi 3 ; Paul Perrotte 2 ; and Pierre I. Karakiewicz 1,2 BACKGROUND: Nephroureterectomy is the surgical standard of care for patients with upper urinary-tract urothelial carcinoma. The objectives of the current study were to identify the most informative predictors of cancer-specific mortality after nephroureterectomy, to devise an algorithm capable of predicting the individual probability of cancer- specific mortality, and to compare its prognostic accuracy to that of the International Union Against Cancer (UICC) staging system. METHODS: Within the Surveillance, Epidemiology, and End Results database, the authors identified 5918 patients who had been treated with nephroureterectomy. Within the development cohort (n ¼ 2959), multivari- ate Cox regression models predicting cancer-specific mortality were fitted by using age, stage, nodal status, sex, grade, race, type of surgery (nephroureterectomy with or without bladder-cuff removal), and tumor location (renal pelvis vs ureter). Backward variable elimination according to the Akaike information criterion identified the most accurate and parsimonious model. Model validation and calibration were performed within the external validation cohort (n ¼ 2959). External validation was also applied to the UICC staging system. RESULTS: The 5-year freedom from cancer-specific mortality rates in both the development and external validation cohorts was 77.3%. The most in- formative and parsimonious nomogram for cancer-specific-mortality–free survival relied on age, pT and pN stages, and tumor grade. In external validation, nomogram prediction of 5-year cancer-specific-mortality–free rate was 75.4% accurate and was significantly better (P < .001) than the UICC staging system (64.8%). CONCLUSIONS: The current nomogram is capable of predicting the prognosis in patients with upper urinary-tract urothelial carcinoma treated by nephroureterectomy with better accuracy than the UICC staging system. The authors recommend the application of this nomogram to routine clinical practice when counseling or making clinical decisions. Cancer 2010;116:3774–84. V C 2010 American Cancer Society . KEYWORDS: nephroureterectomy, upper urinary-tract urothelial carcinoma, nomogram, survival. Nephroureterectomy is the surgical standard of care for patients with invasive, nonmetastatic, upper urinary- tract, urothelial carcinoma. 1-5 The pathological T and N categories and pathologically defined tumor grade are powerful indicators of prognosis. 6-11 However, to date, the ability of the combined input from pathological stage, grade, and other tumor and patient characteristics has never been examined with respect to prediction of cancer-specific mortality after nephroureterectomy. In the current study, we hypothesized that, like in other malignancies, pT and pN stages combined with tumor grade and patient characteristics, such as age and sex, could highly accurately predict the probability of cancer- specific mortality. 6,12-16 To test this hypothesis, we developed a multivariate model and tested its accuracy and calibration within a large, independent, validation cohort. For comparison, we relied on the International Union Against Cancer (UICC) staging system. MATERIALS AND METHODS Study Population Patients diagnosed with upper urinary-tract (renal pelvis or ureteral) urothelial carcinoma (codes ICD-O-2 C65.9 and ICD-O-2 C66.9) who underwent either a nephroureterectomy with or without a bladder-cuff removal between 1988 and DOI: 10.1002/cncr.25122, Received: July 18, 2009; Revised: October 15, 2009; Accepted: October 20, 2009, Published online May 13, 2010 in Wiley InterScience (www.interscience.wiley.com) Corresponding author: Pierre I. Karakiewicz, MD, FRCSC, Cancer Prognostics and Health Outcomes Unit, University of Montreal Health Center (CHUM), 1058, rue St-Denis, Montre ´al, Que ´bec, Canada, H2X 3J4; Fax: (514) 412-7363; [email protected] 1 Cancer Prognostics and Health Outcomes Unit, University of Montreal Health Center, Montreal, Quebec, Canada; 2 Department of Urology, University of Montreal, Montreal, Quebec, Canada; 3 Department of Urology, Vita-Salute San Raffaele, Milan, Italy; 4 Martini-Clinic, Prostate Cancer Center Hamburg-Eppendorf, Hamburg, Germany; 5 Department of Urology, Weill Cornell Medical Center, New York, New York The first 2 authors contributed equally to this article. 3774 Cancer August 15, 2010 Original Article
-
Upload
independent -
Category
Documents
-
view
3 -
download
0
Transcript of Highly predictive survival nomogram after upper urinary tract urothelial carcinoma

Highly Predictive Survival Nomogram AfterUpper Urinary Tract Urothelial CarcinomaClaudio Jeldres, MD1,2; Maxine Sun1; Giovanni Lughezzani1,3; Hendrik Isbarn1,4; Shahrokh F. Shariat5; Hugues Widmer1;
Markus Graefen4; Francesco Montorsi3; Paul Perrotte2; and Pierre I. Karakiewicz1,2
BACKGROUND: Nephroureterectomy is the surgical standard of care for patients with upper urinary-tract urothelial
carcinoma. The objectives of the current study were to identify the most informative predictors of cancer-specific
mortality after nephroureterectomy, to devise an algorithm capable of predicting the individual probability of cancer-
specific mortality, and to compare its prognostic accuracy to that of the International Union Against Cancer (UICC)
staging system. METHODS: Within the Surveillance, Epidemiology, and End Results database, the authors identified
5918 patients who had been treated with nephroureterectomy. Within the development cohort (n¼2959), multivari-
ate Cox regression models predicting cancer-specific mortality were fitted by using age, stage, nodal status, sex,
grade, race, type of surgery (nephroureterectomy with or without bladder-cuff removal), and tumor location (renal
pelvis vs ureter). Backward variable elimination according to the Akaike information criterion identified the most
accurate and parsimonious model. Model validation and calibration were performed within the external validation
cohort (n¼2959). External validation was also applied to the UICC staging system. RESULTS: The 5-year freedom
from cancer-specific mortality rates in both the development and external validation cohorts was 77.3%. The most in-
formative and parsimonious nomogram for cancer-specific-mortality–free survival relied on age, pT and pN stages,
and tumor grade. In external validation, nomogram prediction of 5-year cancer-specific-mortality–free rate was 75.4%
accurate and was significantly better (P < .001) than the UICC staging system (64.8%). CONCLUSIONS: The current
nomogram is capable of predicting the prognosis in patients with upper urinary-tract urothelial carcinoma treated by
nephroureterectomy with better accuracy than the UICC staging system. The authors recommend the application
of this nomogram to routine clinical practice when counseling or making clinical decisions. Cancer 2010;116:3774–84.
VC 2010 American Cancer Society.
KEYWORDS: nephroureterectomy, upper urinary-tract urothelial carcinoma, nomogram, survival.
Nephroureterectomy is the surgical standard of care for patients with invasive, nonmetastatic, upper urinary-tract, urothelial carcinoma.1-5 The pathological T and N categories and pathologically defined tumor grade are powerfulindicators of prognosis.6-11 However, to date, the ability of the combined input from pathological stage, grade, and othertumor and patient characteristics has never been examined with respect to prediction of cancer-specific mortality afternephroureterectomy. In the current study, we hypothesized that, like in other malignancies, pT and pN stages combinedwith tumor grade and patient characteristics, such as age and sex, could highly accurately predict the probability of cancer-specific mortality.6,12-16 To test this hypothesis, we developed a multivariate model and tested its accuracy and calibrationwithin a large, independent, validation cohort. For comparison, we relied on the International Union Against Cancer(UICC) staging system.
MATERIALS AND METHODS
Study Population
Patients diagnosed with upper urinary-tract (renal pelvis or ureteral) urothelial carcinoma (codes ICD-O-2 C65.9 andICD-O-2 C66.9) who underwent either a nephroureterectomy with or without a bladder-cuff removal between 1988 and
DOI: 10.1002/cncr.25122, Received: July 18, 2009; Revised: October 15, 2009; Accepted: October 20, 2009, Published online May 13, 2010 in Wiley InterScience
(www.interscience.wiley.com)
Corresponding author: Pierre I. Karakiewicz, MD, FRCSC, Cancer Prognostics and Health Outcomes Unit, University of Montreal Health Center (CHUM), 1058, rue
St-Denis, Montreal, Quebec, Canada, H2X 3J4; Fax: (514) 412-7363; [email protected]
1Cancer Prognostics and Health Outcomes Unit, University of Montreal Health Center, Montreal, Quebec, Canada; 2Department of Urology, University of Montreal,
Montreal, Quebec, Canada; 3Department of Urology, Vita-Salute San Raffaele, Milan, Italy; 4Martini-Clinic, Prostate Cancer Center Hamburg-Eppendorf, Hamburg,
Germany; 5Department of Urology, Weill Cornell Medical Center, New York, New York
The first 2 authors contributed equally to this article.
3774 Cancer August 15, 2010
Original Article

2006 were identified within 17 National Cancer InstituteSurveillance, Epidemiology, and End Results (NCI-SEER) cancer registries.17 Those include the Atlanta,Detroit, San Francisco-Oakland, Seattle (Puget Sound),San Jose-Monterey, Los Angeles, greater California(excluding San Francisco, Los Angeles, and San Jose), andrural Georgia metropolitan areas, as well as the states ofConnecticut, Hawaii, Iowa, New Mexico, Alaska, Ken-tucky, Louisiana, New Jersey, and Utah.
The Surveillance, Epidemiology, and End Results(SEER) program of the National Cancer Institute (NCI)collects cancer survival and incidence information frompopulation-based cancer registries, encompassing 26% ofthe US population.17 The cause of death was definedaccording to NCI-SEER specific cause of death recode(code 29,020 and 29,030). For the purpose of this analy-sis, deaths from upper urinary-tract urothelial carcinomawere coded as cancer-specific events. All other deaths wereconsidered as other-cause mortality. Only individualswith known pathological T and N categories, as well asavailable tumor grade information, were included.Patients with distant metastatic upper urinary-tract uro-thelial carcinoma were excluded.
Statistical analysis
For purpose of statistical analyses, the cohort (N¼ 5918)was divided into 2 groups according to the NCI-SEERregistries. The development cohort was the first groupand comprised 9 registries (n¼ 2959). The second groupcomprised 8 registries and will, henceforth, be referred toas the external validation cohort (n¼ 2959). In bothcohorts, the overall cancer-specific mortality rate, as wellas pT stage, pN stage, tumor grade, and tumor location-specific mortality rates, and cancer-specific mortality rateswere depicted graphically by using the Kaplan-Meiermethod.
The development cohort was used to fit univariateand multivariate Cox regression models, addressing therisk of cancer-specific mortality after nephroureterectomywith or nephroureterectomy without bladder-cuff re-moval. Within the models, we tested 8 predictors: patientage at surgery, pathological T and N categories, sex, tu-mor grade, race, type of surgery (nephroureterectomywith vs nephroureterectomy without bladder-cuff re-moval), and tumor location (renal pelvis vs ureter).
The multivariate models were subjected to backwardvariable elimination according to the Akaike informationcriterion18 to generate the most informative and parsimo-nious set of cancer-specific mortality predictors. Propor-
tional hazards assumptions were systematically verified forall proposed models by using the Grambsch-Therneauresidual-based test.19 Multivariate regression coefficientsof the predictor variables were then used to develop anomogram predicting the individual probability ofcancer-specific mortality at 5 years after nephroureterec-tomy with or after nephroureterectomy without bladder-cuff removal.
Thus developed nomogram was then applied to theexternal validation cohort. The Harrell concordanceindex20 was used to test the ability of the nomogram topredict the individual probability of cancer-specific-mor-tality–free survival at 5 years after nephroureterectomywith or nephroureterectomy without bladder-cuff re-moval. This index is a modification of the area under thereceiver operating characteristics curve and is applicable toa continuous response variable that can be censored.20
This is a probability that within 2 randomly selected indi-viduals at a given time, the patient who dies first has ahigher probability of dying. If 2 patients have the samelength of follow-up time regardless of the event, or if 1 hasfailed and the follow-up time of the other is less than thefailure time of the first individual, the probability wouldnot apply to this particular pair of individuals.20,21 Avalue of 1.0 indicates perfect predictions, whereas 0.5 isequivalent to a toss of a coin. The concordance index isunaffected by the amount of censoring.20,22 In the secondstep of the validation process, calibration plots were gener-ated using the val.survmethod from the R-statistical pack-age (Statistics Department, University of Auckland, NewZealand), where nomogram predictions are comparedwith observed 5-year cancer-specific-mortality–free rates.
Subsequently, the validation steps (accuracy and cal-ibration) were applied to the UICC staging system.Finally, the statistical significance of the difference inaccuracy estimates was compared by using the DeLongmethod for related areas under the curves.23
All statistical tests were performed with the use ofS-PLUS Professional, version 1.0 (MathSoft, Seattle,Wash). All tests were 2-tailed with a significance level at0.05.
RESULTSA total of 5918 patients qualified for study inclusion andwere randomly divided into identically sized developmentand validation cohorts, according to the NCI-SEER regis-tries. The descriptive characteristics of the development(n¼ 2959) and validation (n¼ 2959) cohorts are shown
Cancer-Specific Mortality Nomogram/Jeldres et al
Cancer August 15, 2010 3775

in Table 1. The development cohort originated from SanFrancisco-Oakland, Detroit, rural Georgia, Los AngelesMetropolitan areas, as well as the New Mexico, Utah,Kentucky, Louisiana, and New Jersey states’ registries. Incontrast, the states of Connecticut, Hawaii, Iowa, Alaska,as well as the Seattle (Puget Sound), San Jose-Monterey,greater California (excluding San Francisco, Los Angeles,San Jose), and Metropolitan Atlanta registries were usedfor the external validation. The average ages at nephroure-terectomy with or nephroureterectomy without bladder-cuff removal were 70.8 years and 71.6 years in the 2cohorts. Most patients were Caucasian (88.6% and90.1%) and male (59.4 and 59.1%). Renal-pelvic originaccounted for 69.8% and 67.9% of all tumors, respec-tively, in the development and external validation cohorts.The majority of tumors in these same cohorts were classi-fied pT1 (31.8% and 31.6%) and pT3 (38.1% and38.5%). Most patients in both cohorts had no evidence ofnodal metastases (77.8% and 73.0%, respectively). GradeIII tumors predominated (42.2% and 41.4%).
At 5 years after nephroureterectomy with or neph-roureterectomy without bladder-cuff removal, 783 and808 individuals were at risk of cancer-specific mortality inthe development and external validation cohorts, respec-tively (Fig. 1A, B). Within the development and externalvalidation cohorts, the majority of recorded deaths (86%and 87%, respectively) occurred within 3 years of neph-roureterectomy with or nephroureterectomy withoutbladder-cuff removal. In both cohorts, virtually all deathsoccurred within 5 years (94% to 96%; Fig. 1A, B). Theoverall 5-year cancer-specific-mortality–free rate afternephroureterectomy with or nephroureterectomy withoutbladder-cuff removal was 77.3% (95% confidence inter-vals [CI], 76% to 79%) in both cohorts (Fig. 1A-B).Kaplan-Meier plots depicting stratified cancer-specific-mortality–free probabilities in the development as well asin the validation cohort (according to pathological T andN categories, tumor grade, and location) are shown inFigures 2A-H. Figures 2A and 2B indicate that pT catego-ries can discriminate between cancer-specific-mortality–free proportions. Interestingly, the cancer-specific-mortal-ity–free rate of patients with pT3 tumors relative to pT4was statistically significantly different in the developmentcohort (P < .001) but did not differ in the validationcohort (P¼ .06). In both cohorts, patients with pNxtumors had similar cancer-specific-mortality–free rates totheir counterparts with pN0 tumors (P¼ .09 and .08,respectively; Fig. 2C, D). Within both the developmentand external validation cohorts, the presence of grade IV
Table 1. Descriptive Characteristics of the NomogramDevelopment (n¼2959) and External Validation (n¼2959)Cohortsa
DevelopmentCohort
ExternalValidationCohort
No. (%) No. (%)
Age, yMean [median] 70.8 [72.0] 71.6 [73.0]
Range 25-97 (—) 22-99 (—)
SexMen 1757 (59.4) 1748 (59.1)
SEER registrySan-Francisco-Oakland 420 (14.2) —
Metropolitan Detroit 603 (20.4) —
New Mexico 139 (4.7) —
Utah 137 (4.6) —
Los Angeles 767 (25.9) —
Rural Georgia 8 (0.3) —
Kentucky 278 (9.4) —
Louisiana 164 (5.5) —
New Jersey 443 (15.0) —
Connecticut — 479 (16.2)
Hawaii — 185 (6.3)
Iowa — 501 (16.9)
Seattle (Puget Sound) — 572 (19.3)
Metropolitan Atlanta — 211 (7.1)
Alaska — 3 (0.1)
San Jose-Monterey — 163 (5.5)
Greater Californiab — 845 (28.6)
RaceCaucasian 2622 (88.6) 2665 (90.1)
Other 337 (11.4) 294 (9.9)
Surgery typeNU 1020 (34.5) 929 (31.4)
NUC 1939 (65.5) 2030 (68.6)
Primary tumor siteRenal pelvis 2065 (69.8) 2009 (67.9)
Ureteral 894 (30.2) 950 (32.1)
Pathological T categorypT1 942 (31.8) 936 (31.6)
pT2 535 (18.1) 536 (18.1)
pT3 1128 (38.1) 1138 (38.5)
pT4 354 (12.0) 349 (11.8)
Pathological N categorypN0 2302 (77.8) 2160 (73.0)
pN1-3 262 (8.9) 232 (7.8)
pNx 395 (13.3) 567 (19.2)
Tumor gradeI 166 (5.6) 135 (4.6)
II 933 (31.5) 858 (29.0)
III 1248 (42.2) 1225 (41.4)
IV 612 (20.7) 741 (25.0)
a Percentages for some categories do not total 100 because of rounding.b Excludes San Francisco, Los Angeles, and San Jose.
SEER indicates Surveillance, Epidemiology, and End Results; NU, nephrour-
eterectomy without a bladder cuff removal; NUC, nephroureterectomy with
a bladder cuff removal.
Original Article
3776 Cancer August 15, 2010

upper urinary-tract urothelial carcinoma did not have amore detrimental effect on cancer-specific-mortality–freesurvival than the presence of grade III upper urinary-tracturothelial carcinoma (P¼ .8 and .3, respectively) (Fig.2E, F). Finally, within both cohorts, patients with ureteraltumors had more favorable cancer-specific-mortality–freerates (P < .05) than their counterparts with renal-pelvistumors (Fig. 2G, H).
In patients with organ-confined (pT1-pT2), non-metastatic (pN0), upper urinary-tract urothelial tumors,the 5-year cancer-specific-mortality–free rates after neph-roureterectomy with or nephroureterectomy withoutbladder-cuff removal were 89.8% (95% CI, 88-92) and89.7% (95% CI, 88-92), respectively, in the developmentand validation cohorts. Conversely, in patients with non-organ-confined (pT3-pT4) pN0 tumors, the 5-year can-cer-specific-mortality–free rates after nephroureterectomywith or nephroureterectomy without bladder-cuff re-moval were respectively 70.1% (95% CI, 67-74) and
69.4% (95% CI, 66-73) in the same 2 cohorts. Finally,the 5-year cancer-specific-mortality–free rates were36.3% (95% CI, 28-46) and 41.0% (95% CI, 32-52) af-ter nephroureterectomy with or nephroureterectomywithout bladder-cuff removal for patients who had patho-logically confirmed nodal metastases (N1 to N3), regard-less of pathological T categories (pT1 to pT4). Forpatients with tumor grades 1 to 2, and with pT1N0 topT2N0 categories, the 5-year cancer-specific-mortality–free survival rates were 93.3% (95% CI, 91-96) and95.1% (95% CI, 93-97), in respectively the developmentand validation cohorts. Conversely, for grades 3 to 4,T1N0 to T2N0 patients, the 5-year cancer-specific-mor-tality–free rates were 85.6% (95% CI, 82-89) and 84.2%(95%CI, 81-88), respectively, in both cohorts.
Of 262 patients with nodal metastases in the devel-opment cohort, 16.4% had organ-confined (pT1 to pT2)disease and 83.6% had nonorgan-confined (pT3 to pT4)disease versus 12.5% and 87.5% in the external validationcohort (n¼ 232). The 5-year cancer-specific-mortality–free rate of patients with nonorgan-confined (pT3 topT4), lymph node-positive stage (pN1 to pN3) was35.2% and 35.6%, respectively, in both cohorts. Becauseof an insufficient number of events in both cohorts(n¼ 2-5), the 5-year cancer-specific-mortality–free rate ofpatients with organ-confined (pT1 to pT2) lymph node-positive (N1 to N3) upper urinary-tract urothelial carci-noma could not be validly determined for this subgroup.
Table 2 shows the univariate and multivariate Coxregression models predicting cancer-specific mortalityafter nephroureterectomy with or nephroureterectomywithout bladder-cuff removal that were fitted within thedevelopment cohort. In univariate models, all tested pre-dictors except for race (P¼ .9), were found to be statisti-cally significantly associated with cancer-specificmortality (all P� .01).
Two multivariate models were fitted (Table 2). Thefull model included all variables. The reduced modelrelied on the Akaike information criterion for backwardvariable elimination with the intent of increasing parsi-mony, while maintaining maximum model accuracy. Inthe full multivariate model, age (P < .001), pT (P <
.001), pN (P< .001) categories, tumor grade (P< .001),and surgery type (P¼ .03) achieved independent predic-tor status. After backward variable elimination, 4 variablesremained in the model: age, pathological T and N catego-ries, and tumor grade (all P < .001) and resulted in thereduced model (Table 2). This model’s regression coeffi-cients were then used to generate a prognostic nomogram
Figure 1. Kaplan-Meier plots depict (A) the overall cancer-specific-mortality–free rates of the development cohort(n¼2959) and (B) the overall cancer-specific-mortality–freerates of the external validation cohort (n¼2959). CSM indi-cates cancer-specific mortality; CI, confidence interval.
Cancer-Specific Mortality Nomogram/Jeldres et al
Cancer August 15, 2010 3777

Figure 2. Kaplan-Meier plots depict cancer-specific-mortality–free proportions of the development cohort (left column) and ofthe external validation cohort (right column) stratified according to (A, B) pathological T categories, (C, D) pathological N cate-gories, (E, F) tumor grade, (G, H) and location of tumor, with respective log-rank P-values.

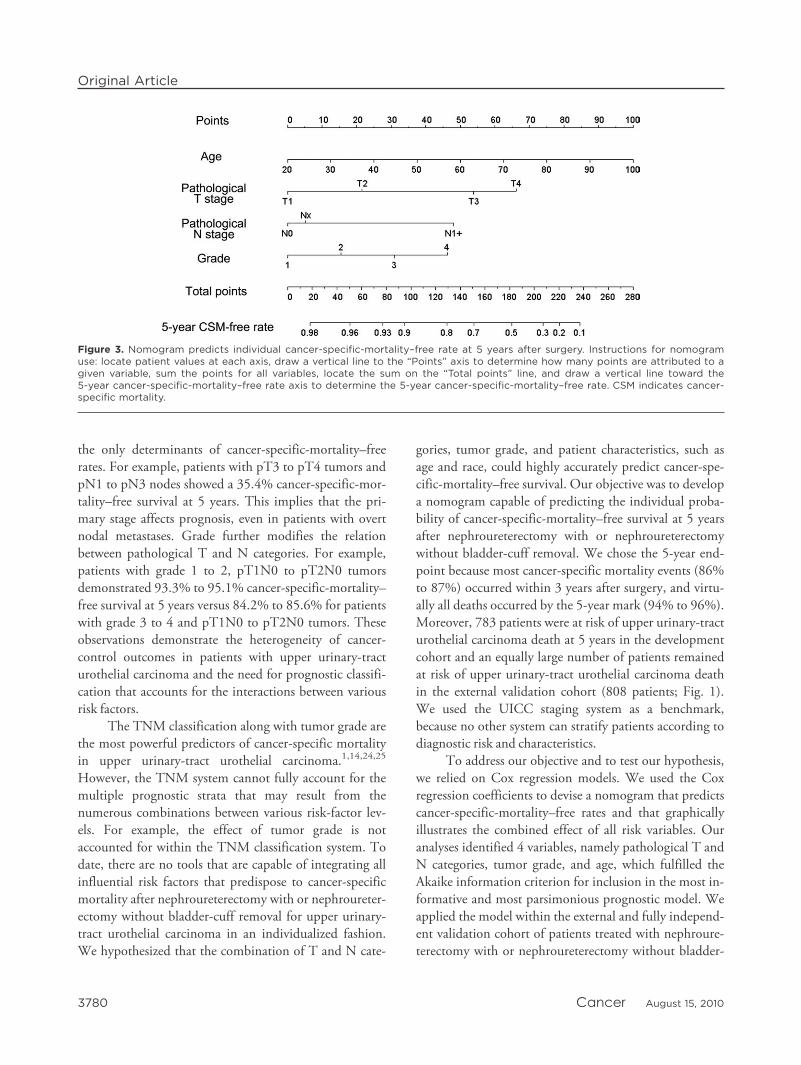
predicting the individual probability of cancer-specific-mortality–free survival after nephroureterectomy withor nephroureterectomy without bladder-cuff removal(Fig. 3).
Within the nomogram (Fig. 3) of tumor characteris-tics, pathological categories T3 and T4 exerted the mostdetrimental effect on cancer-specific-mortality–freesurvival and were followed by the presence of nodal me-tastases (N1 to N3) and tumor grade 4. Patient age wasvirtually linearly related to cancer-specific-mortality–freerates. The application of the nomogram indicated that apatient aged 55 years with pT2, grade 3, pN0 upper uri-nary-tract urothelial carcinoma has an 89% probability of5-year cancer-specific-mortality–free survival versus 59%for a patient aged 55 years with pT3, grade 3, pN1 topN3 tumor.
The nomogram was then applied within the externalvalidation cohort. The Harrell concordance index fornomogram predictions at 5 years after nephroureterec-tomy with or nephroureterectomy without bladder-cuffremoval was 75.4%. This was statistically significantlybetter (P < .001) than the UICC staging system (64.8%accurate). The calibration between the nomogram-pre-
dicted and observed rate of cancer-specific-mortality–freesurvival is shown in Figure 4. The 45� dashed line indi-cates perfect predictions. The solid line represents theactual nomogram performance that compares predictedand observed cancer-specific-mortality–free rates. Thedotted lines represent 5% error margins. The nomogramdoes not exceed the 5% error margin, except when pre-dicted rates exceed 75% (error margin,�12.0%).
DISCUSSIONNephroureterectomy is the surgical standard of care forpatients with upper urinary-tract urothelial carcinomaand provides durable cancer-control rates in patients withorgan-confined (pT1 to pT2) and even nonorgan-con-fined upper urinary-tract urothelial carcinoma.4 In thecurrent study, the 5-year cancer-specific-mortality–freerate of patients with pT1N0 to pT2N0 upper urinary-tract urothelial carcinoma was between 89.7% and 89.8%versus 69.4% and 70.1% for pT3N0 to pT4N0 patientsversus between 36.3% and 41.0% for patients with pN1to pN3 stages regardless of their T stage. Interestingly,organ confinement and lymph-node metastases were not
Table 2. Univariate and Multivariate Cox Regression Models Predicting Cancer-Specific Mortality After NU or NUC
Variables UnivariateAnalyses
Multivariate Analyses
Full Model Reduced ModelHR P HR P HR P
Age 1.03 <.001 1.03 <.001 1.03 <.001
Pathological T category — <.001 — <.001 — <.001
pT2 vs pT1 1.85 .001 1.61 <.008 1.59 .009
pT3 vs pT1 4.28 <.001 3.18 <.001 3.21 <.001
pT4 vs pT1 6.18 <.001 4.17 <.001 4.19 <.001
Tumor grade — .001 — <.001 — <.001
2 vs 1 2.43 .02 1.86 .1 1.85 .1
3 vs 1 6.99 <.001 3.60 .001 3.61 .001
4 vs 1 7.25 <.001 3.58 .001 3.61 .001
Pathological N category — <.001 — <.001 — <.001
pN1-3 vs pN0 4.50 <.001 2.81 <.001 2.83 <.001
pNx vs pN0 1.24 .09 1.12 .38 1.12 .34
SexMen vs women 0.79 .008 0.92 .33 — —
RaceOther vs Caucasian 0.97 .85 0.92 .56 — —
Surgery typeNUC vs NU 0.61 <.001 0.81 .03 — —
Primary tumor siteUreteral vs renal pelvis 0.77 .01 0.99 .58 — —
HR indicates hazard ratio; NU, nephroureterectomy without a bladder cuff removal; NUC, nephroureterectomy with a bladder cuff removal.
Cancer-Specific Mortality Nomogram/Jeldres et al
Cancer August 15, 2010 3779
the only determinants of cancer-specific-mortality–freerates. For example, patients with pT3 to pT4 tumors andpN1 to pN3 nodes showed a 35.4% cancer-specific-mor-tality–free survival at 5 years. This implies that the pri-mary stage affects prognosis, even in patients with overtnodal metastases. Grade further modifies the relationbetween pathological T and N categories. For example,patients with grade 1 to 2, pT1N0 to pT2N0 tumorsdemonstrated 93.3% to 95.1% cancer-specific-mortality–free survival at 5 years versus 84.2% to 85.6% for patientswith grade 3 to 4 and pT1N0 to pT2N0 tumors. Theseobservations demonstrate the heterogeneity of cancer-control outcomes in patients with upper urinary-tracturothelial carcinoma and the need for prognostic classifi-cation that accounts for the interactions between variousrisk factors.
The TNM classification along with tumor grade arethe most powerful predictors of cancer-specific mortalityin upper urinary-tract urothelial carcinoma.1,14,24,25
However, the TNM system cannot fully account for themultiple prognostic strata that may result from thenumerous combinations between various risk-factor lev-els. For example, the effect of tumor grade is notaccounted for within the TNM classification system. Todate, there are no tools that are capable of integrating allinfluential risk factors that predispose to cancer-specificmortality after nephroureterectomy with or nephroureter-ectomy without bladder-cuff removal for upper urinary-tract urothelial carcinoma in an individualized fashion.We hypothesized that the combination of T and N cate-
gories, tumor grade, and patient characteristics, such asage and race, could highly accurately predict cancer-spe-cific-mortality–free survival. Our objective was to developa nomogram capable of predicting the individual proba-bility of cancer-specific-mortality–free survival at 5 yearsafter nephroureterectomy with or nephroureterectomywithout bladder-cuff removal. We chose the 5-year end-point because most cancer-specific mortality events (86%to 87%) occurred within 3 years after surgery, and virtu-ally all deaths occurred by the 5-year mark (94% to 96%).Moreover, 783 patients were at risk of upper urinary-tracturothelial carcinoma death at 5 years in the developmentcohort and an equally large number of patients remainedat risk of upper urinary-tract urothelial carcinoma deathin the external validation cohort (808 patients; Fig. 1).We used the UICC staging system as a benchmark,because no other system can stratify patients according todiagnostic risk and characteristics.
To address our objective and to test our hypothesis,we relied on Cox regression models. We used the Coxregression coefficients to devise a nomogram that predictscancer-specific-mortality–free rates and that graphicallyillustrates the combined effect of all risk variables. Ouranalyses identified 4 variables, namely pathological T andN categories, tumor grade, and age, which fulfilled theAkaike information criterion for inclusion in the most in-formative and most parsimonious prognostic model. Weapplied the model within the external and fully independ-ent validation cohort of patients treated with nephroure-terectomy with or nephroureterectomy without bladder-
Figure 3. Nomogram predicts individual cancer-specific-mortality–free rate at 5 years after surgery. Instructions for nomogramuse: locate patient values at each axis, draw a vertical line to the ‘‘Points’’ axis to determine how many points are attributed to agiven variable, sum the points for all variables, locate the sum on the ‘‘Total points’’ line, and draw a vertical line toward the5-year cancer-specific-mortality–free rate axis to determine the 5-year cancer-specific-mortality–free rate. CSM indicates cancer-specific mortality.
Original Article
3780 Cancer August 15, 2010

cuff removal within 8 separate NCI-SEER registries. De-spite population differences between the developmentand external validation cohorts with respect to the effectof pT category and tumor grade on cancer-specific-mor-tality–free survival (Fig. 2), the nomogram predictedcancer-specific mortality at 5 years with excellent accuracywithin this independent patient group, as evinced by aconcordance index of 75.4%. Moreover, the nomogramtesting within the external validation cohort revealed thatits predictions are very well calibrated with the observedcancer-specific-mortality–free rates (Fig. 4). This wasevinced by minimal departures from ideal predictions andmaximal error rates that remained within the 5% errormargin for virtually all predicted values, except forpatients whose predicted risk exceeded 75%, where themodel overestimated the cancer-specific-mortality–freeprobability up to 12%.
When the same validation criteria were applied to theUICC staging system, accuracy of only 64.8% wasrecorded. The differences in accuracy (75.4% vs 64.8%)were tested by using the DeLong method for related areasunder the receiving operating characteristics curve betweenthe nomogram and UICC staging system.23 The DeLongmethod is 1 of the most stringent approaches for compari-son between 2 related areas under the curves.22 Unlike
other less stringent methods, it relies on sample size as wellas variance and covariance characteristics. Therefore, an im-portant difference between 2 related areas under the curvesmay not be qualified as statistically significant by thismethod when the sample used for the comparison is notlarge enough.22 Comparisons of areas under the curve(75.4% vs 64.8%) showed a highly statistically significantdifference (P< .001). This implies that in a cohort of 1000patients, the use of the UICC staging system instead of thenomogram would result in misclassification of the cancer-specific mortality rate in approximately 106 patients(10.6% higher accuracy with the nomogram than with theUICC staging system). Such a misclassification rate has im-portant implications on an individual and a group basis. Itmay be devastating to provide incorrect prognoses to indi-viduals. Similarly, the use of inaccurate staging systems forrandomization purposes in prospective trials may severelyconfound results. Finally, inaccurate staging systems mayundermine follow-up regimens with regard to their fre-quency and detail.
Our nomogram is similar to other studies, where pre-dictive or prognostic models were developed. For example,Karakiewicz et al26 devised a highly accurate nomogram forprediction of cancer-specific-mortality–free survival afternephrectomy for various stages of renal cell carcinoma.This model was between 86.7% and 89.2% accurate. Simi-larly, Shariat et al27 devised a prognostic nomogram forcancer-specific-mortality–free survival prediction inpatients with urothelial carcinoma of the urinary bladder.Their model achieved 79.1% accuracy. Finally, Zini et al28
devised a nomogram for prediction of cancer-specific mor-tality in patients with penile cancer and reported 73.8% ac-curacy. Therefore, our model, like all other models, is not100% accurate. Its accuracy is intermediate when it is com-pared with other tools.26-28 Nonetheless, many previouslyreported models have shown an accuracy of < 70%.29-33
Finally, no other models are capable of predicting cancer-specific-mortality–free rates after nephroureterectomy withor nephroureterectomy without bladder-cuff removal.Interestingly, the UICC staging system was only 64.8%accurate when it was used to predict cancer-specific-mortal-ity–free rates, which justifies the use of our model (75.4%accuracy) in routine clinical practice.
Based on its accuracy (75.4%) and on its well-cali-brated prediction characteristics, our nomogram clearly is avaluable prognostic algorithm for patients who have beentreated with nephroureterectomy with or nephroureterec-tomy without bladder-cuff removal. To date, no other toolcan assist the clinician with individual risk estimation in
Figure 4. Calibration plot demonstrates the relation betweennomogram predicted and observed cancer-specific-mortal-ity–free rates at 5 years after nephroureterectomy with ornephroureterectomy without bladder-cuff removal. The solidline represents the actual nomogram performance that com-pares predicted and observed cancer-specific-mortality–freerates. The dotted lines represent 5% error margins.
Cancer-Specific Mortality Nomogram/Jeldres et al
Cancer August 15, 2010 3781

patients with upper urinary-tract urothelial carcinoma. Theapplication of the current nomogram could guide the typeand the frequency of follow-up.Moreover, it could providepatients with the most bias-free estimate of the risk of can-cer-specific mortality, which otherwise may be difficult toquantify. Finally, the nomogram could guide clinicianswith respect to the need for adjuvant therapy.34-37
Several limitations apply to our study. For example,it is retrospective in nature. Moreover, our model is not100% accurate. These limitations are shared with allstudies that have resulted in the development and valida-tion of predictive or other prognostic and predictivemodels.7-11,24,26-28,38-42 Possibly, the use of biomarkerscould improve its accuracy. The ability of biomarker datahas been confirmed to improve nomogram predictions.43
Lack of central pathology is another limitation that alsoaffected all upper urinary-tract urothelial carcinoma stud-ies.26-28,40-42 The population-based nature of the databaseresults in lack of standardized stage and grade interpreta-tion. In addition, it is worrisome that between 31% and35% of patients did not undergo a bladder-cuff excision.The latter represents a standard of care in patients treatedwith a nephroureterectomy. Lack of removal of the distalureter and ureteral orifice (within the bladder-cuff speci-men) may predispose a patient to local recurrences andmay render follow up difficult. It is noteworthy that theproportion of patients who were subjected to a bladder-cuff excision in the SEER database was lower than thatrecently reported in a tertiary-care series (58.8%).44 Lackof removal of bladder cuff predisposes a patient to a higherrate of mortality. Taken together, these observationsemphasize the need for continuing efforts aimed at edu-cating the community and tertiary-care urologists in theneed for bladder-cuff excision at nephroureterectomy.
Lack of lymph-node dissection standardization repre-sents another concern. First, between 13% and 19% ofpatients in the development and validation cohorts, respec-tively, were not staged with a lymph-node dissection. Sec-ond, the extent of lymph-node dissection is notstandardized in upper urinary-tract urothelial carcinoma.Therefore, at some nephroureterectomies, extensive lymph-node dissections may be performed. Conversely, at others,only a few lymph nodes may be excised. The extent oflymph-node excision is not available for the great majorityof patients. Moreover, the origin of lymph nodes is notknown at nephroureterectomy, as there are no standardizedtemplates for lymph-node dissections in this setting. It isnoteworthy that as many as 57.6% of patients did notundergo a lymph-node dissection at nephroureterectomy
performed at tertiary-care centers.44 Therefore, it is impor-tant to emphasize the need for lymph-node dissection andfor a standardization of its indications and extent.
Cause of death within the SEER database may beanother limitation. Penson et al examined the rate ofagreement between death certificates and the SEER causeof death, which is assigned with a standardized decisionalgorithm that uses the ICD-9 revision codes to assignboth the immediate and underlying cause of death.45 Intheir study, they revealed a 97% concordance betweenprostate-cancer recorded on the death certificate and a cli-nician-assigned cause of death. For upper urinary-tracturothelial carcinoma, additional considerations may beoperational and may decrease the accuracy of cause-of-death assignment. For example, a patient who harbors apT3N3M0 bladder cancer with a synchronous pT1N0upper urinary-tract urothelial carcinoma and who dies ofbladder cancer is considered as other-cause mortality inthe upper urinary-tract urothelial carcinoma SEER data-set. This type of potential misclassification may under-mine the accuracy of prognostic tools.
In addition, lack of information on the use of adju-vant or neoadjuvant chemotherapy is another limitationof the SEER database. However, recent data derived fromtertiary-care centers address the effect of adjuvant chemo-therapy in patients with upper urinary-tract urothelial car-cinoma and show that adjuvant chemotherapy isinfrequently used and does not confer a survival benefit.46
Nonetheless, more detailed information on the use ofchemotherapy would be an important improvement ofthe current version of the SEER database. Despite theseconsiderations, the nomogram performs very accuratelyand can be generalized to North American patients whoare similar to those in the NCI-SEER database treatedwith nephroureterectomy with or nephroureterectomywithout bladder-cuff removal for upper urinary-tract uro-thelial carcinoma.
In summary, the model that we developed and exter-nally validated in the current report is a highly accurateprognostic tool for patients with upper urinary-tract uro-thelial carcinoma treated with nephroureterectomy withor nephroureterectomy without bladder-cuff removal.The model can serve as a guide for the type and frequencyof follow up after nephroureterectomy and can provide anaccurate estimate of the individual risk of cancer-specificmortality. In addition, our data suggest that a bladder-cuff excision exerts a protective effect on cancer-specificmortality and should be a standard of care at nephroure-terectomy. In summary, the nomogram (75.4%) is more
Original Article
3782 Cancer August 15, 2010

accurate than that of its only substitute, the UICC stagingsystem (64.8%).
CONFLICT OF INTEREST DISCLOSURESPierre I. Karakiewicz is partly supported by the University ofMontreal Health Center Urology Specialists, Fonds de la Re-cherche en Sante du Quebec, the University of MontrealDepartment of Surgery, and the University of Montreal HealthCenter (CHUM) Foundation.
REFERENCES1. Oosterlinck W, Solsona E, van der Meijden AP, et al. EAU
guidelines on diagnosis and treatment of upper urinary tracttransitional cell carcinoma. Eur Urol. 2004;46:147-154.
2. Raman JD, Scherr DS. Management of patients with upperurinary tract transitional cell carcinoma. Nat Clin PractUrol. 2007;4:432-443.
3. Koukourakis G, Zacharias G, Koukourakis M, et al. Com-prehensive management of upper tract urothelial carcinoma.Adv Urol. 2009;656521.
4. Taweemonkongsap T, Nualyong C, Amornvesukit T, et al.Outcomes of surgical treatment for upper urinary tract transi-tional cell carcinoma: comparison of retroperitoneoscopic andopen nephroureterectomy. World J Surg Oncol. 2008;6:3.
5. Yuasa T, Tsuchiya N, Narita S, et al. Radical nephroureter-ectomy as initial treatment for carcinoma in situ of upperurinary tract. Urology. 2006;68:972-975.
6. Hall MC, Womack S, Sagalowsky AI, Carmody T, Erick-stad MD, Roehrborn CG. Prognostic factors, recurrence,and survival in transitional cell carcinoma of the upper uri-nary tract: a 30-year experience in 252 patients. Urology.1998;52:594-601.
7. Novara G, De Marco V, Gottardo F, et al. Independentpredictors of cancer-specific survival in transitional cell carci-noma of the upper urinary tract: multi-institutional datasetfrom 3 European centers. Cancer. 2007;110:1715-1722.
8. Ozsahin M, Zouhair A, Villa S, et al. Prognostic factors inurothelial renal pelvis and ureter tumours: a multicentre RareCancer Network study. Eur J Cancer. 1999;35:738-743.
9. Mullerad M, Russo P, Golijanin D, et al. Bladder cancer asa prognostic factor for upper tract transitional cell carci-noma. J Urol. 2004;172:2177-2181.
10. Brown GA, Matin SF, Busby JE, et al. Ability of clinicalgrade to predict final pathologic stage in upper urinary tracttransitional cell carcinoma: implications for therapy. Urology.2007;70:252-256.
11. Kikuchi E, Margulis V, Karakiewicz PI, et al. Lymphovascu-lar invasion predicts clinical outcomes in patients withnode-negative upper tract urothelial carcinoma. J ClinOncol. 2009;27:612-618.
12. Oosterlinck W. Ureteral tumour: a specific upper urinary tracttransitional cell carcinoma. Eur Urol. 2007;51:1164-1165.
13. Lee SH, Lin JS, Tzai TS, et al. Prognostic factors of pri-mary transitional cell carcinoma of the upper urinary tract.Eur Urol. 1996;29:266-270, discussion 271.
14. Bolenz C, Shariat S, Fernandez MI, et al. Risk stratificationof patients with nodal involvement in upper tract urothelialcarcinoma: value of lymph-node density. BJU Int. 2008;103:302-306.
15. Park S, Hong B, Kim CS, Ahn H. The impact of tumorlocation on prognosis of transitional cell carcinoma of theupper urinary tract. J Urol. 2004;171:621-625.
16. Remzi M, Haitel A, Margulis V, et al. Tumour architectureis an independent predictor of outcomes after nephroureter-ectomy: a multi-institutional analysis of 1363 patients. BJUInt. 2009;103:307-311.
17. Ries LAG, Melbert D, Krapcho M, et al, eds. SEER CancerStatistics Review, 1975-2004. Bethesda, MD: National Can-cer Institute; 2007. http://seer.cancer.gov/csr/1975_2004/,based on November 2006 SEER data submission, posted tothe SEER web site, 2007. Accessed January 2009.
18. Atkinson AC. A note on the generalized information crite-rion for choice of a model. Biometrika. 1980;67:413-418.
19. Grambsch PM, Therneau TM. Proportional hazards testsand diagnostics based on weighted residuals. Biometrika.1994;81:515-526.
20. Harrell FE Jr, Lee KL, Mark DB. Multivariable prognosticmodels: issues in developing models, evaluating assumptionsand adequacy, and measuring and reducing errors. Stat Med.1996;15:361-387.
21. Stephenson AJ, Scardino PT, Eastham AJ, et al. Preopera-tive nomogram predicting the 10-year probability of pros-tate cancer recurrence after radical prostatectomy. J NatlCancer Inst. 2006;98:715-717.
22. Hanley JA, Hajian-Tilaki KO. Sampling variability of non-parametic estimates of the areas under receiver operatingcharacteristic curves: an update. Acad Radiol. 1997;4:49-58.
23. DeLong ER, DeLong DM, Clarke-Pearson DL. Comparingthe areas under 2 or more correlated receiver operating char-acteristic curves: a nonparametric approach. Biometrics.1988;44:837-845.
24. Huben RP, Mounzer AM, Murphy GP. Tumor grade andstage as prognostic variables in upper tract urothelialtumors. Cancer. 1988;62:2016-2020.
25. Kirkali Z, Tuzel E. Transitional cell carcinoma of the ureterand renal pelvis. Crit Rev Oncol Hematol. 2003;47:155-169.
26. Karakiewicz PI, Briganti A, Chun FK, et al. Multi-institu-tional validation of a new renal cancer-specific survival nom-ogram. J Clin Oncol. 2007;25:1316-1322.
27. Shariat SF, Karakiewicz PI, Palapattu GS, et al. Nomogramsprovide improved accuracy for predicting survival after radi-cal cystectomy. Clin Cancer Res. 2006;12:6663-6676.
28. Zini L, Cloutier V, Isbarn H, et al. A simple and accuratemodel for prediction of cancer-specific mortality in patientstreated with surgery for primary penile squamous cell carci-noma. Clin Cancer Res. 2009;15:1013-1018.
29. Slovin SF, Wilton AS, Heller G, Scher HI. Time to detecta-ble metastatic disease in patients with rising prostate-specificantigen values following surgery or radiation therapy. ClinCancer Res. 2005;11:8669-8673.
30. Smaletz O, Scher HI, Small EJ, Verbel DA, McMillan A,Regan K, et al. Nomogram for overall survival of patientswith progressive metastatic prostate cancer after castration. JClin Oncol. 2002;20:3972-3982.
31. Halabi S, Small EJ, Kantoff PW, et al. Prognostic modelfor predicting survival in men with hormone-refractory met-astatic prostate cancer. J Clin Oncol. 2003;21:1232-1237.
32. Wong SL, Kattan MW, McMasters KM, Coit DG. A nom-ogram that predicts the presence of sentinel node metastasisin melanoma with better discrimination than the AmericanJoint Committee on Cancer Staging System. Ann SurgOncol. 2005;12:282-288.
Cancer-Specific Mortality Nomogram/Jeldres et al
Cancer August 15, 2010 3783

33. Hiroyoshi S, Akira K, Naoto K, et al. Development of anomogram to predict probability of positive initial prostatebiopsy among Japanese patients. Urology. 2006;67:131-136.
34. O’Donnell P, Stadler W. The role of chemotherapy inupper tract urothelial carcinoma. Adv Urol. 2009;419028.
35. Latchamsetty KC, Porter CR. Treatment of upper tract uro-thelial carcinoma: a review of surgical and adjuvant therapy.Rev Urol. 2006;8:61-70.
36. Soga N, Arima K, Sugimura Y. Adjuvant methotrexate, vin-blastine, Adriamycin, and cisplatin chemotherapy has poten-tial to prevent recurrence of bladder tumors after surgicalremoval of upper urinary tract transitional cell carcinoma.Int J Urol. 2008;15:800-803.
37. Kikuchi E, Margulis V, Karakiewicz P, et al. Lymphovascu-lar invasion predicts clinical outcomes in patients withnode-negative upper tract urothelial carcinoma. J ClinOncol. 2008;27:612-618.
38. Margulis V, Shariat SF, Matin SF, et al. Outcomes ofradical nephroureterectomy: a series from the Upper TractUrothelial Carcinoma Collaboration. Cancer. 2009;115:1224-1233.
39. Karakiewicz PI, Suardi N, Capitanio U, et al. A preopera-tive prognostic model for patients treated with nephrectomyfor renal cell carcinoma. Eur Urol. 2008;55:287-295.
40. Margulis V, Lotan Y, Montorsi F, Shariat SF. Predictingsurvival after radical cystectomy for bladder cancer. BJU Int.2008;102:15-22.
41. Karakiewicz PI, Shariat SF, Palapattu GS, et al. Nomogramfor predicting disease recurrence after radical cystectomy fortransitional cell carcinoma of the bladder. J Urol. 2006;176:1354-1361, discussion 61-62.
42. Consortium IBCN, Bochner BH, Kattan MW, Vora KC.Postoperative nomogram predicting risk of recurrence afterradical cystectomy for bladder cancer. J Clin Oncol. 2006;24:3967-3972.
43. Shariat S, Walz J, Roehrborn C, et al. External validation ofa biomarker-based preoperative nomogram predicts bio-chemical recurrence after radical prostatectomy. J ClinOncol. 2008;26:1526-1531.
44. Capitanio U, Shariat SF, Isbarn H, et al. Comparison of onco-logic outcomes for open and laparoscopic nephroureterectomy: amulti-institutional analysis of 1249 cases. Eur Urol. 2009;56:1-9.
45. Penson DF, Albertsen PC, Nelson CJ, Barry M, StanfordJL. Determining cause of death in prostate cancer: are deathcertificates valid? J Natl Cancer Inst. 2001;93:1822-1823.
46. Hellenthal NJ, Shariat SF, Margulis V, et al. Adjuvantchemotherapy for high risk upper tract urothelial carcinoma:results from Upper Tract Urothelial Carcinoma Collabora-tion. J Urol. 2009;182:900-906.
Original Article
3784 Cancer August 15, 2010