AMP-activated protein kinase signaling is upregulated in papillary thyroid cancer
Upload
independentCategory
view
1download
0
1
VEGF receptors and neuropilins are expressed in the urothelial and neuronal cells in normal mouse urinary bladder and are up-regulated in inflammation.
Marcia R. Saban1, Joseph M. Backer2, Marina V. Backer2, Julie Maier3, Ben
Fowler3, Carole A. Davis1, Cindy Simpson1, Xue-Ru Wu5, Lori Birder4,Michael R. Freeman6, Shay Soker7, Robert E. Hurst8, and Ricardo Saban1*
1Department of Physiology, The University of Oklahoma Health Sciences Center,
Oklahoma City, OK 73104, USA
2SibTech, Inc., 115A Commerce Drive, Brookfield, Connecticut 06804, USA.
3Oklahoma Medical Research Foundation (OMRF), Imaging Core Facility, Oklahoma City, Oklahoma 73104, USA
4Department of Medicine, University of Pittsburgh School of Medicine,
Pittsburgh, PA 15213, USA
5Department of Urology, New York University Medical School, New York, NY 10016, USA
6Depts. of Urology, Surgery, and Biological Chemistry and Molecular
Pharmacology, Children's Hospital Boston, Harvard Medical School, Boston, MA 02115
7Wake Forest Institute for Regenerative Medicine,
Wake Forest University School of Medicine, Winston-Salem, NC 27157, USA
8Departments of Urology, Biochemistry, and Molecular Biology, The University Oklahoma Health Sciences Center, Oklahoma City, OK 73104,
USA *Corresponding author Ricardo Saban, DVM, PhD Professor of Physiology, College of Medicine University of Oklahoma Health Sciences Center (OUHSC) Urinary Tract Physiological Genomics Laboratory 800 Research Parkway, Room 410. Oklahoma City, OK 73104 Phone 405/271-3700 xt. 2, FAX:405/271-5440 Email: [email protected]
Page 1 of 45Articles in PresS. Am J Physiol Renal Physiol (May 7, 2008). doi:10.1152/ajprenal.00618.2007
Copyright © 2008 by the American Physiological Society.

2
Abstract
Recent evidence supports a role for vascular endothelium growth factor
(VEGF) signaling in bladder inflammation. However, it is not clear what
bladder cells are targeted by VEGF. Therefore, we determined the nature of
cells responding to VEGF in normal and inflamed bladders by tagging such
cells in vivo with a targeted fluorescent tracer, scVEGF/Cy, an engineered
single-chain VEGF labeled with Cy5.5 dye, which identifies cells with
accessible and functionally active VEGF receptors. Inflammation was
induced by intravesical instillation of PAR-activating peptides or BCG. In vivo
NIRF imaging with intravenously injected scVEGF/Cy revealed accumulation
of the tracer in the control mouse bladder and established that inflammation
increased the steady-state levels of tracer uptake. Ex vivo co-localization of
Cy5.5 dye revealed that in normal and at a higher level in inflamed bladder,
accumulation of scVEGF/Cy occurs in both urothelial and ganglial cells,
expressing VEGF receptors VEGFR-1 and VEGFR-2, as well as VEGF co-
receptors neuropilins (NRP) NRP1 and NRP2. PCR results indicate that the
messages for VEGF-Rs and NRPs are present in the bladder mucosa and
ChIP/QPCR analysis indicated that inflammation induced up-regulation of
genes encoding VEGFRs and NRPs. Our results strongly suggest new and
blossoming VEGF-driven processes in bladder urothelial cells and ganglia in
the course of inflammation. We expect that molecular imaging of the VEGF
pathway in the urinary tract by receptor-mediated cell tagging in vivo will be
useful for clinical diagnosis and therapeutic monitoring, and will help to
accelerate the development of bladder-targeting drugs and treatments.
Key words: bladder inflammation, VEGF receptors, VEGF co-receptors, interstitial cystitis, VEGF receptor-imaging, human urothelium, targeted imaging, scVEGF/Cy fluorescent tracer, Cy5.5.List of abbreviations: NIRF= near infrared fluorescence; PAR1-AP = protease-activated receptor 1-activating peptide; PAR2-AP = protease-activated receptor 2 -activating peptide
Page 2 of 45

3
Background
Recent evidence places VEGF signaling in the center of molecular pathways
underlying urinary tract inflammation. In normal bladder this signaling is a
key mechanism downstream of protease-activated receptor (PARs)
activation in response to pro-inflammatory stimuli (36, 40), while in bladder
with the superficial cancer it is part of the response to intravesical therapy
with Bacillus Calmette-Guerin (BCG) (34). This new appreciation of VEGF’s
signaling role in bladder inflammation is supported by emerging evidence
that levels of various VEGF proteins are, in general, increased at the site of
inflammation (20, 26, 27, 35, 49) and that infiltrating lymphocytes and
other inflammatory cells represent an additional source of VEGF (24, 27).
However, it is not clear what bladder cells are targeted by VEGF and which
VEGF’s functions are important in the rather harsh bladder environment.
Although the “traditional” VEGF targets are endothelial cells in vascular and
lymphatic systems, recent evidence indicate more diverse targets/functions
for this growth factor.
As VEGF and its receptors participate in the responses of the bladder to
inflammation, we wished to establish the nature of cells expressing VEGF
receptors and co-receptors in normal and inflamed bladders and to develop a
methodology for assessing VEGF signaling in vivo. Although the “usual
suspects” vascular and lymphatic endothelial cells are the target of VEGF
signaling in many normal and diseased tissues, expression of VEGF receptors
by bladder cancer cells (15, 33) suggested that the situation might be
different or, at least, more complex, in this organ. To answer this question
experimentally, we chose to use two different stimuli that have been proven
to induce significant and reproducible bladder inflammation and alter VEGF
signaling upon intravesical instillation, namely protease-activated receptors-
Page 3 of 45

4
activating peptides (PAR-APs) (39, 41) and Bacillus Calmette-Guerin (BCG)
(37).
To identify cells with accessible and functionally active VEGF receptors, we
tagged such cells in vivo with a new, internalizable fluorescent tracer,
scVEGF/Cy (11) and then used immunohistochemical markers to
characterize the lineage of tagged cells. The tracer is based on a single-
chain (sc) VEGF that was constructed by fusing two fragments (amino acids
3–112) of VEGF121 lacking pro-angiogenic C-terminal domain, and
expressed with the N-terminal cysteine-containing tag (Cys-tag) for site-
specific conjugation of therapeutic and diagnostic payloads (8, 9, 11).
scVEGF/Cy is prepared by site-specific conjugation of the near-infrared
fluorescent dye, Cy5.5 to Cys-tag in scVEGF, and functional activity of the
tracer is comparable to that of parental VEGF in tissue culture assays, such
as induction of VEGFR-2 tyrosine auto-phosphorylation, competition with a
VEGF-toxin for binding to cellular VEGFR-2, and VEGFR-mediated
internalization (9). In several mouse tumor models, VEGF receptor mediated
internalization of intravenously injected scVEGF/Cy but not a control inactive
tracer (inVEGF/Cy) resulted in selective long-term accumulation of Cy5.5 in
the tumor, particularly at the tumor periphery and contiguous host
vasculature, as established by non-invasive near-infrared fluorescent
imaging of whole animals and fluorescent microscopy of histological sections
(11). Importantly, unlike immunohistochemical analysis that shows all cells
expressing VEGF receptors, receptor-mediated tagging with scVEGF/Cy
tracer identifies only cells with accessible and functionally active VEGF
receptors (8, 9, 11).
We report here that urothelial and ganglial cells in the mouse urinary
bladder express VEGFRs and NRPs that are primarily responsible for uptake
Page 4 of 45

5
of scVEGF/Cy tracer. Finally, in experimental bladder inflammation, there is
an enhanced accumulation of scVEGF/Cy in the same cells suggesting that
they are important targets for VEGF signaling.
Page 5 of 45

6
Material and Methods
Experimental Bladder Inflammation. All animal experimentation
described here was performed in conformity with the APS’s Guiding
Principles in the Care and Use of Animals (4) (OUHSC Animal Care & Use
Committee protocol #05-088I). Ten to twelve week-old C57BL/6 female and
male mice (The Jackson Laboratory; Bar Harbor, ME) were used in this
research. Female mice were anesthetized, transurethrally catheterized as
previously described (37), and instilled on days 1, 7, 14, and 21 with 200 µl
of one of the following substances: pyrogen-free saline (n=20), BCG
(TheraCys®-Aventis-Pasteur; total dose of 1.35 mg (37)), control inactive
peptide (10 µM; LRGILS (32)), PAR1-AP (10 µM; SFFLRN (32)), and PAR2-AP
(10 µM ; SLIGRL (32)). The efficacy of PAR-APs at a concentration of 10 µM
(39) and BCG (37) at a concentration of 1.35 mg to induce bladder
inflammation was determined previously. Mice were studied 24 hours after
a single instillation (saline and BCG acute) or 7 days after 4 weekly
instillations (saline chronic, control peptide chronic, PAR1-AP chronic, PAR2-
AP chronic, and BCG chronic).
Near-infrared Fluorescent Imaging (NIRF). Mice were fed a low-
chlorophyll diet for 2 weeks to reduce auto-fluorescence in the intestinal
region (48) and the abdominal hair was removed. Mice were anesthetized
with isoflurane and intravenously injected via the tail vein with 100 µl of
~0.5 nmol of the following substances: a) active tracer (scVEGF/Cy); or b)
inactive tracer (inVEGF/Cy) prepared by biotinylation of 6-8 amino groups in
scVEGF/Cy to prevent binding to VEGF receptors (11) . Anesthetized mice
were immediately placed on a heating pad inside a FluorChem HD2 cabinet
(Alpha Innotech, San Leandro, CA) equipped with a Chromalight® multi-
wavelength illuminator with a Cy5 excitation filter (620 ±60nm) and images
were captured with 4- megapixel cooled camera (F2.8 28 – 70 mm zoom
Page 6 of 45
7
lens) with a Qdot 705 emission filter (705nm ±10nm). The FluorChem HD2
was coupled to a dedicated computer and images were first acquired and
stored with AlphaEase FC® 32-bit software (Alpha Innotech, San Leandro,
CA).
The FluorChem cabinet permits continued anesthesia with isoflurane and,
therefore, accumulation of Cy5.5 fluorescent tracer was followed over time.
Between 330 minutes and 1440 minutes (24 hours), mice were returned to
their respective cages. Following NIRF, mice were euthanized with sodium
pentobarbital (100 mg/kg, i.p.) and tissues were removed rapidly and frozen
for immunofluorescence and ChIP-Q-PCR, see below.
NIRF image analysis. NIRF image analysis was performed, as described
recently (38). Briefly, images were first acquired and stored with AlphaEase
FC® 32-bit software (Alpha Innotech, San Leandro, CA) and, subsequently,
application of black-and-white and color gradients were performed in Adobe
Photoshop® CS3 extended (1) that permitted the determination of
integrated density. For this purpose, an elliptical marquee of fixed size (180
X 180 px) was used to determine the region of interest (ROI) around the
luminescence zones corresponding to a bladder area, and the count tool was
used to determine and record each integrated density. The integrated
density corresponded to the sum of the values of the pixels in the ROI,
which were equivalent to the product of the area (in pixels) and mean gray
value.
Human Bladders. The same urothelial specimens that were collected for
our previous study (46) were used in the present work. Samples were
obtained from 5 controls and as previously described; informed consent was
obtained from each patient. Five female patients with an average age of
46.1 years (range 21 to 66), known to be free of bladder mucosal disease
Page 7 of 45
8
and urinary tract infection, were undergoing a bladder suspension procedure
for stress urinary incontinence and underwent bladder biopsy used for
immunohistochemical analysis.
Immunofluorescence of human and mouse tissues. Bladder tissue was
processed for routine immunohistochemistry according to published methods
(21, 41). Frozen sections were post-fixed in 1% formaldehyde and all
reagent incubations and washes were performed at room temperature. 5%
normal donkey blocking serum (Jackson Immunolabs) was placed on all
slides for 45 min and sections were incubated with primary antibody for 1
hour and 45 minutes in a humidified chamber. Slides were washed 3X 5
minutes in PBS and incubated with secondary antibodies. Slides were
washed, counterstained with DAPI (1:20,000 dilutions of 10 mg/ml) for 2
minutes and coverslipped with Shur/Mount (TBS) mounting media and
sealed with nail polish. All tissue sections were visualized using a Zeiss
Axiovert 200M inverted fluorescent microscope and imaged at room
temperature using a Zeiss axiocam HRm high-resolution CCD camera, driven
by Axiovision 4.6 software. Selected sections were visualized and
photographed using a Zeiss LSM510 Laser Scanning Confocal with META
(Thornwood, NY). Controls included omission of the primary antibody.
Antibodies used in this work included uroplakin provided by X-R Wu (50) and
commercially available antibodies are listed on Table 1. All secondary
antibodies were used at a 1:400 dilution included donkey anti-rabbit IgG
AF488 conjugate (Molecular Probes; probes.invitrogen.com), donkey anti-
goat IgG (Alexa Fluor 546, A11056, Invitrogen), and donkey anti-rat IgG
(AlexaFluor 488; used for VEGF-R2).
Image analysis. At least 6 random fields per cross-section were visualized
at 200X magnification (if viewing Cy5.5 fluorescence, 400X magnification
was used) and used for image analysis that was performed with the NIS-
Page 8 of 45

9
Elements Advanced Research 2.3 imaging software (6). This software
identifies signal by thresholding key intensity values. Further, the software
permits imposing restrictions to the measurements by excluding false
positive signals. Briefly, the number of positive cells expressing a particular
antibody was calculated as percent of the region of interest (ROI), as
indicated in the individual figure legend. Co-localization of fluorescence for
one antibody and Cy5.5 or for two antibodies was calculated by converting
the area occupied by cells positive for the first antibody into a ROI. Then the
percent of cells that were positive for the second antibody was calculated
within the ROI. Results are expressed as mean ± SEM. In all cases, a value
of p<0.05 was considered indicative of a significant difference (12).
NRPs and VEGFRs Polymerase chain reaction assay (PCR) in the
mouse bladder.
Immediately after removal from the animal, bladders were placed in
RNAlater™ (Ambion) and visualized under a dissecting microscope (Nikon
SMZ 1500). The urothelium and submucosa layers were separated by blunt
dissection away from the detrusor muscle, as described before (43). Total
RNA was extracted from the urothelium/submucosa in Ultraspec RNA
solution (Biotecx Laboratories Inc., Houston, TX) according to the
manufacturer’s instructions. The amount and quality of the RNA were
verified by measuring the absorbance at 260 and 280 nm, and by
electrophoresing the samples on a formaldehyde/agarose gel. Oligo(dT)-
primed reverse transcription of RNA was performed with the SuperScript
First-Strand Synthesis System for reverse transcriptase-polymerase chain
reaction (RT-PCR) (Invitrogen, Carlsbad, CA), using 5 µg of RNA for each
reaction. Following reverse transcription, PCR amplifications were performed
from 2 µl of each cDNA. Primer pairs were designed using Primer 3 (7). The
designed primers shared 100% homology with the target sequence but no
Page 9 of 45

10
significant homology with other sequences and primer sequences are listed
in Table 2.
The PCR program consisted of one pre-incubation at 95°C for 2 min and 35
cycles at 95°C for 30 s, 55°C for 45 s, 72°C for 90 s and 72°C for 5 min. All
PCR reactions were performed with a Robocycler Gradient 96 with a heated
lid (Stratagene, La Jolla, CA) in 50 µl of 1X PCR buffer, 1.5 mM MgCl2,
forward and reverse primers at 0.2 µM, 200 µM dNTP, and 1 U of Taq DNA
polymerase (Invitrogen). Twelve microliters of the amplification mixtures
were analyzed on a 2% agarose gel. GAPDH was used as positive control.
Images of the PCR products were taken using the FluorChem HD digital
darkroom (Alpha Innotech, San Leandro, CA), and the area under the curve
was quantified using Image J software (5).
Chromatin immunoprecipitation (ChIP) and quantitative real-time
polymerase chain reaction (Q-PCR)-Based Assays of the mouse
urinary bladders.
Additional female C57BL/6J mice (n=20 per group) were anesthetized and
instilled with the same substances described above. Isolated bladders were
frozen, and shipped to Genpathway (2) for querying the chromatin for gene
transcription (Genpathway’s TranscriptionPath Query assay) (31). Tissues
were exposed briefly to formaldehyde for cross-linking of the proteins and
DNA together, followed by sonication to fragment the DNA into pieces of
approximately 300-500 base pairs. An antibody against RNA polymerase II
(Abcam) was then used to precipitate the DNA transcriptome (37). The Ab-
protein-DNA complexes were purified using beads coupled to protein A. The
DNA was isolated from the complexes using a combination of heat to reverse
cross-linking, RNase and proteases, and then purified using phenol
extraction and EtOH precipitation. The final ChIP DNAs were then used as
Page 10 of 45

11
templates in quantitative PCR reactions using primer pairs specific for each
gene of interest and designed using Primer 3 (3). The designed primers
shared 100% homology with the target sequence, but no significant
homology with other sequences and Q-PCR primer sequences for are given
in Table 2. Quantitative PCR was carried out using Taq polymerase (iQ SYBR
Green Supermix, Bio-Rad).
Q-PCRs were run in triplicate and the values were transferred into copy
numbers of DNA using a standard curve of genomic DNA with known copy
numbers. The resulting transcription values for each gene were also
normalized for primer pair amplification efficiency using the Q-PCR values
obtained with Input DNA (unprecipitated genomic DNA). Results are
presented as Transcription Events Detected per 1000 Cells for each gene
tested.
Statistical Analysis of ChIP/Q-PCR data and image analysis. The
difference between two mean values was analyzed with an unpaired
Student’s t-test (GraphPad Prism software version 4.0; GraphPad Software,
Inc. San Diego, CA). A nominal p value less than 0.05 was considered
statistically significant.
Materials: scVEGF/Cy and inactivated scVEGF/Cy (inVEGF/Cy) were
from SibTech, Inc. (Brookfield, CT). PAR1-AP, PAR2-AP, and PAR4-AP were
synthesized at the Molecular Biology Resource Facility, William K. Warren
Medical Research Institute, OUHSC, as carboxyl-terminal amides, purified by
high-pressure liquid chromatography, and characterized by mass
spectroscopy. Peptide solutions were made fresh in PBS from powder.
Page 11 of 45

12
Results
NIRF imaging of urinary bladder with scVEGF/Cy.
In vivo imaging with scVEGF/Cy. We first addressed the question
whether alterations in VEGF receptor activity induced by inflammation can
be detected in live mice in real time. We reasoned that a useful tool for
exploring VEGF receptor activity might be scVEGF/Cy fluorescent tracer
whose binding and internalization is mediated by functionally active VEGF
receptors (11). As a control for non-receptor mediated accumulation of the
tracer we employed, inVEGF/Cy, a fluorescent tracer based on scVEGF/Cy,
but incapable of binding to VEGF receptors (11). Intravenous injection of
inactivated tracer inVEGF/Cy in control mice instilled with saline did not lead
to the appearance of fluorescence in lower abdominal area (Figure 1A, red
circle). In sharp contrast, intravenously administration of scVEGF/C in
control mice led to accumulation of fluorescence in the lower abdominal area
(Figure 1B). The fluorescence was clearly elevated in mice inflamed
chronically with PAR1-AP and injected with scVEGF/Cy (Figure 1C). Figures
1D-I are representative photographs of the observed fluorescence in the
lower abdominal region of a mouse chronically treated with PAR1-AP that
was injected at time zero with scVEGF/Cy in the tail vein. Administration of
scVEGF/Cy led to a time-dependent increase in NIRF in the mouse bladder
(Figure 1D-1I, regions of interest in red circles). In this particular mouse,
the fluorescence was detectable within minutes after scVEGF/Cy
administration (Figure 1D), while the peak fluorescence occurred at 120
minutes (Figure 1E), and remained elevated throughout the study.
Importantly, emptying the residual urinary content of the bladder did not
significantly alter the intensity of fluorescence, indicating that the residual
fluorescence corresponded to Cy5.5, which still remained within the bladder
parenchyma (Figure 1I). To establish that other abdominal organs do not
Page 12 of 45

13
contribute to observed fluorescence, additional mice have their abdomen
opened and the gastrointestinal tract removed, to permit a better imaging of
the pelvic area. Figure 1J is representative of the control group instilled
with saline, Figure 1K is a representative of mice that received acute
instillation with BCG, Figure 1L was obtained from the group that received
chronic BCG treatment, Figure 1M represents chronic PAR1-AP, and Figure
1N represents PAR-2AP chronic treatment group. Outside the urinary
bladders (green arrows), fluorescence was observed at its highest
concentration in the kidneys (red arrows), lymph sacs draining the lower
abdomen (white arrows), and uterus (blue arrow). However, uptake in these
organs was not detectable in intact mice, because of their location deeper in
the abdominal cavity.
After establishing that fluorescence observed in the lower abdominal part of
mice injected with scVEGF/Cy is due to uptake in the urinary bladder, we
tested if imaging in intact animals in real time can be used for analysis of
inflammation. In these experiments we compared the time course of
scVEGF/Cy uptake in mice treated with pro-inflammatory PAR1-AP, PAR2-AP,
and BCG vs. control mice instilled with saline. We found similar kinetics and
levels of tracer uptake in control and treated mice up to ~2 hour post-
injection (Figure 2A). In contrast, mice treated intravesically with saline
and injected with inVEGF/Cy presented only background fluorescence.
However, the observed scVEGF/Cy fluorescence rapidly declined in control
animals after a peak at 2 hours post-injection. In contrast, such a decline
was absent in animals chronically treated with inflammatory stimuli, and
those mice displayed a larger increase and higher steady-state levels of
fluorescence for far longer periods (Figure 2A). Interestingly, a decline of
fluorescence after 2 hours post-injection was observed in mice treated with
acute instillation of BCG (Figure 2B). However, even in those mice the
Page 13 of 45

14
steady state levels of retained fluorescence were significantly higher than in
control mice (Figure 2B).
Ex vivo localization of areas of enhanced scVEGF/Cy uptake. Since
scVEGF/Cy tracer is internalized via receptor-mediated endocytosis and
Cy5.5 is retained in the cells for at least several days, Cy5.5 fluorescence
can be readily detected in tagged cells in harvested tissues (8-11). This
enabled us to address the question of which anatomical structures in the
bladder were involved in scVEGF/Cy uptake. Initial low magnification
fluorescent microscopy of the whole bladders from control mice revealed an
elevated level of fluorescence in the areas of the lumen occupied by the
urothelium (Figure 3A). In addition, the bladder adventitia also presented
some spots with a positive fluorescent signal (Figure 3A green arrows).
Cross-sections of the urinary bladders harvested from mice that received i.v.
administration of inactive tracer (inVEGF/Cy) presented low levels of Cy5.5
fluroescence exclusively in the bladder lumen (white arrow and white dotted
line in Figure 3D indicate the bladder lumen). In contrast, the urinary
bladder harvested from mice that received i.v. administration of scVEGF/Cy
demonstrated a clear accumulation of Cy5.5 in the urothelium (Figure 3C).
In addition to the urothelium, regions of adventitia that resembled ganglia
also displayed the Cy5.5 fluorescence (Figure 3B).
scVEGF/Cy tags urothelial cells in the urinary bladder. Since finding
of scVEGF/Cy uptake in urothelium and ganglia-like structures was rather
unexpected, we undertook a more detailed immunohistochemical analysis of
scVEGF/Cy-tagged cells in bladders harvested from mice injected with this
tracer. In these experiments we were using multi-color fluorescent confocal
microscopy to explore colocalization of Cy5.5 fluorescence and
Page 14 of 45

15
immunofluorescent staining for specific markers, while DAPI was used for
nuclear staining.
First, in order to validate the urothelial origin of scVEGF/Cy-tagged cells in
the bladder lumen, we used a specific marker of urothelial cell
differentiation, uroplakin, a protein component of the asymmetric unit
membrane in urothelial cells (50). Analysis of immunostained sections
indicated that uroplakin-positive cells occupy the lumen of the urinary
bladder and that a significant number of those urothelial cells were tagged
with scVEGF/Cy (Figures 4A and 4B are examples of co-localization of
Cy5.5 and uroplakin-positive urothelial cells, as indicated by white arrows).
In addition, Figures 4C and 4D illustrate that uroplakin-positive urothelial
cells are the ones expressing NRP1 and accumulating Cy5.5.
Since tagging with scVEGF/Cy required the presence of VEGF receptors, we
tested if VEGFR-1 and VEGFR-2 and its co-receptors (NRP1 and NRP2) were
expressed in urothelial cells. Using histological sections stained for several
markers (uroplakin and NRP-1, VEGFR-1 and NRP2, VEGFR-2 and NRP1) we
found that tagged urothelial cells were positive for VEGFR-1 (Figure 4F),
VEGFR-2 (Figure 4J), NRP-1 (Figure 4K), and NRP-2 (Figure 4G). We also
determined co-localization of VEGFR-1 and NRP2 (Figure 4H) and VEGFR-2
and NRP1 (Figure 4L) in bladder urothelial cells.
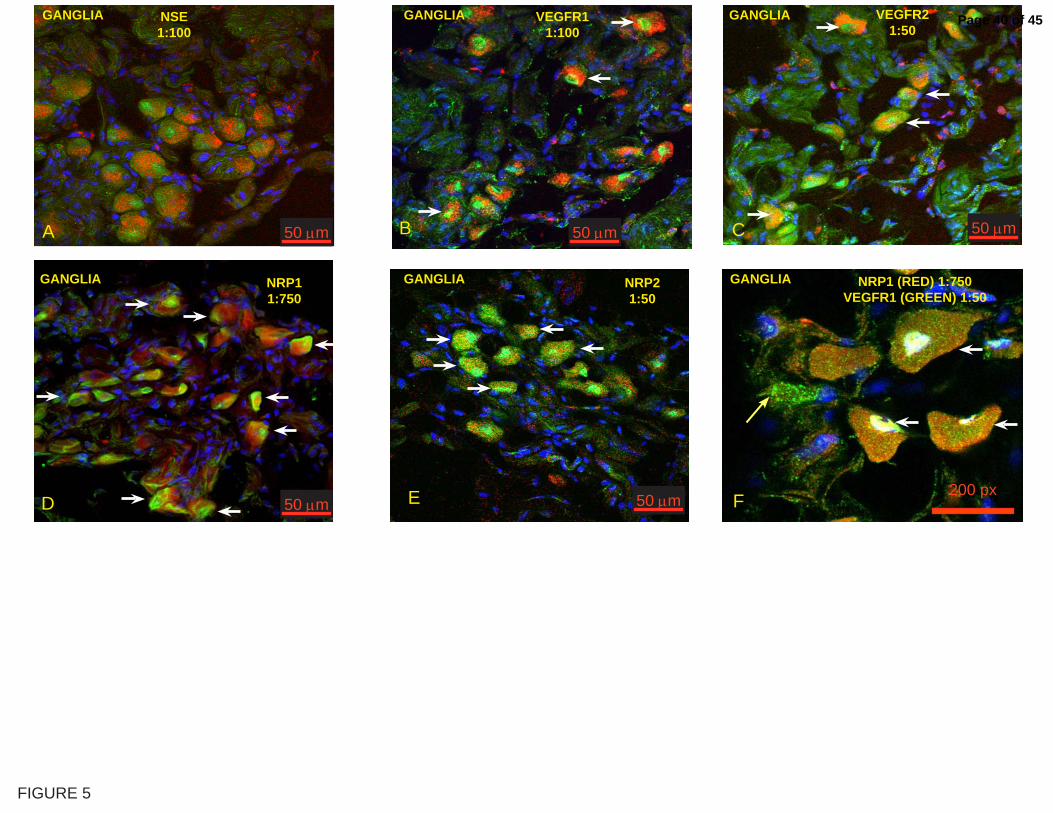
scVEGF/Cy tags ganglia in the urinary bladder. In order to validate the
neuronal origin of tagged cells in ganglia-like structures, we used a specific
marker, neuronal specific enolase (NSE) whereas DAPI was used for nuclear
staining. We found that scVEGF/Cy-tagged cells in bladder ganglia-like
structures were positive for NSE, indicating neuronal origin of those cells
(Figure 5A). Next, we determined which VEGF receptors were expressed in
these cells and found that tagged cells in ganglia-like structures were
Page 15 of 45

16
immunostained for VEGFR-1 (Figure 5B), VEGFR-2 (Figure 5C), NRP1
(Figure 5D), and NRP2 (Figure 5E). We also determined that most of the
ganglial cells express both VEGF-R1 and NRP1, as illustrated in Figure 5F.
scVEGF/Cy poorly tags endothelial cells in the urinary bladder. Since
VEGF receptors are typically expressed on vascular and lymphatic
endothelial cells, we tested if scVEGF/Cy tagged those cells in the bladder
urothelium. Indeed, using immunostaining for pan-endothelial marker CD31,
we found tagged cells among sub-urothelial CD31 positive cells (Figure 6A).
However, overall Cy5.5 fluorescence in such cells was modest when
compared to the urothelial cells (white dotted line). Certain Cy5.5
fluorescence was also detected in cells that were positive for lymphatic
vessel marker LYVE-1 (Figure 6B). Such cells were readily found in bladder
adventitia, rather than in sub-urothelium where lymphatic vessels are rare
(38). However, overall Cy5.5 fluorescence in LYVE-1 positive cells was
modest (white arrows) when compared to Cy5.5 fluorescence in ganglia
(white dotted line in Figure 6B).
Inflammation increases the number of scVEGF/Cy-tagged urothelial
cells. Since inflammation increased the steady-state levels of scVEGF/Cy
uptake (Figure 1) and urothelial cells were primarily responsible for
scVEGF/Cy uptake in the urinary bladder, the next question to be answered
was how inflammation increases the steady-state levels of scVEGF/Cy
uptake. Using immunostained histological sections from control and treated
mice injected with scVEGF/Cy, we determined the fraction of VEGF receptor
positive cells that were tagged with scVEGF. We found that in mice with
bladder inflammation induced by chronic instillation of PAR1-AP and PAR2-
AP, the fraction of either VEGFR-1 or VEGFR-2 positive cells that were
tagged with scVEGF was 2-3 fold higher than in control mice (Figure 7A).
Page 16 of 45

17
Since VEGF receptors and NRPs co-localize in urothelium, it was not
surprising to find that the fraction of scVEGF-tagged NRP1 and NRP2 positive
cells also increased significantly (Figure 7A). In contrast, the effects of
inflammation induced by either chronic or acute BCG instillation were more
selective, enhancing the fraction of scVEGF/Cy-tagged only among VEGFR-1
but not VEGFR-2 and among NRP2 but not NRP1-positive cells (Figure 7B).
Taken together, this analysis indicated that inflammation resulted in the
increase in the fraction of urothelial cells capable of receptor-mediated
uptake of scVEGF/Cy tracer.
Next, we tested if inflammation increased the fraction of scVEGF/Cy-tagged
urothelial cells by recruiting additional cells to express VEGF receptors, or by
enhancing accessibility of cells with pre-existing VEGF receptors. To compare
the fraction of urothelial cells expressing VEGF receptors, we determined the
area occupied by marker-positive cells as a percentage of the total analyzed
area on immunostained histological sections obtained from control and
treated mice. We found that chronic instillation of mice with PAR1-AP and
PAR2-AP did not affect the fraction of VEGFR-1 positive cells, but led to a
small but statistically significant increase in VEGFR-2 positive cells (Figure
7C). Furthermore, only PAR1-AP but not PAR2-AP increased the fraction of
NRP1 positive cells and neither stimulus affected the fraction of NRP2
positive cells (Figure 7C). We also compared the effects of acute and
chronic BCG instillation and found that both treatments induced a small but
statistically significant enhancement in the fraction of VEGFR-1 positive cells
and that the chronic BCG also alters the fraction of VEGFR-2, NRP1, and
NRP2 positive cells (Figure 7D). Nevertheless, for all inflammatory stimuli,
the increase in the fraction of receptor-positive cells was too small to explain
the inflammation-induced 2-3 fold increase in the fraction of scVEGF/Cy
tagged cells among receptor positive cells. We therefore, hypothesized that
Page 17 of 45

18
inflammation increased accessibility of cells with pre-existing VEGF receptors
that led to higher scVEGF/Cy tracer accumulation.
Expression of NRP1 and VEGFR-1 by the mouse bladder mucosa. The
urothelium along with the submucosa was isolated from the detrusor muscle,
the RNA was extract, and PCR results indicate that the bladder
urothelium/submucosa presents the message for NRP1, NRP2, VEGFR-1, and
VEGFR-2 (Figure 8)
ChIP-Q-PCR assessment of VEGF signaling in bladder inflammation.
Inflammation-associated increase in the number of tracer-tagged urothelial
cells might be due either to enhanced receptor expression or to the increase
in the number of accessible cells with pre-existing receptors. To asses
alterations in the receptor expression, we used chromatin
immunoprecipitation (ChIP) combined with quantitative real-time
polymerase chain reaction (Q-PCR), a method that uses the DNA
transcriptome and, therefore, reflects transcription of active genes (37, 40-
42). Although we have detected statistically significant inflammation-
induced increase in the expression of some VEGF receptors and co-
receptors, the changes were too small to be considered consequential
(Figure 9 A-B).
Expression of VEGFRs and NRPs by human urothelium. Since finding
VEGF receptors and co-receptors on urothelial cells was rather unexpected
and might be peculiar to mice, we investigated whether VEGFRs and NRPs
are also present in human bladder urothelium. Using human bladder biopsies
obtained from normal individuals and multi-color confocal fluorescent
microscopy we found intense immunostaining for VEGFR-1 (Figure 10A),
VEGFR-2 (Figure 10D), NRP1 (Figure 10E), and NRP2 (Figure 10B) that
Page 18 of 45

19
was localized to urothelium and was absent in the deeper layers of the
bladder. Finally, merged pictures indicate co-localization of VEGFR1 and
NRP2 (Figure 10C) and VEGFR2 and NRP1 (Figure 10F).
Page 19 of 45

20
Discussion
Here we present direct evidence that the majority of VEGF receptors and
NRPs in normal and inflamed mouse urinary bladder, as well as in human
bladders biopsies, is located on urothelial cells. By using molecular imaging
and in vivo tagging with fluorescent scVEGF/Cy tracer, we established VEGF
receptor-mediated accumulation of the tracer in the mouse urinary bladder
in real time. Within the bladder wall, two main areas accumulated the tracer:
the bladder urothelium and ganglia. As judged by co-localization of Cy5.5
fluorescence with immunofluorescent staining for lineage-specific markers,
VEGF receptors and co-receptors, in both structures the tracer preferentially
tagged urothelial and neuronal cells, but not vascular or lymphatic
endothelial cells. Although there are several reports on immunohistochemical
detection of VEGF receptors in urinary bladder (13, 14, 29), our findings in
vivo, for the first time, identifies these receptors as accessible and
functionally active. Importantly, our findings that in vivo tagged urothelial
cells display both VEGF receptors and NRP co-receptors for VEGF165, suggest
that signal transduction those cells can be induced by both VEGF121 and
VEGF165 isoforms.
We also report here that bladder inflammation induced by various stimuli
result in the enhanced scVEGF/Cy uptake in the bladder area. Analysis of
tagged cells on histological cross-sections indicates that this effect is due
primarily to 2-3 fold increase in the number of urothelial cells capable to
internalizing tracer in inflamed versus normal bladder. Importantly, the
increase in the number of tagged cells was significantly more pronounced
than the enhancement in expression of VEGF receptors, as determined by
immunohistochemistry and ChiP-Q-PCR. Although detailed mechanistic study
will be required to account for the effects of inflammation, enhanced
accessibility of urothelial cells might be explained by vasodilation and edema
Page 20 of 45
21
associated with bladder inflammation. It remains possible that inflammation
could cause an increased non-specific uptake of tracer (control or VEGF),
although this may be unlikely based on previous findings with scVEGF/Cy
(11).
The finding of functionally active VEGF receptors on urothelial and neuronal
cells in the urinary bladder deserves speculations about the potential
physiological functions of VEGF signaling in these cells. As with other non-
endothelial cells (16, 19, 23, 30, 47),it can be suggested that urothelial
VEGF receptors would enable VEGF to act as a survival factor under harsh
conditions. Within this model, enhanced activity of VEGF receptors under
inflammatory conditions would provide additional layer of protection for
urothelium.
Although the main focus of this project is on the role of VEGF receptors in
urinary bladder inflammation, our findings that NRPs are abundantly
expressed in urothelial and neuronal cells in the urinary bladder are very
intriguing. Therefore, we used normal human bladder biopsies to determine
whether the human urothelium also expresses these receptors. Indeed our
results provide evidence of the presence and co-localization of VEGFR-1,
VEGFR-2, NRP1, and NRP2 in the normal human urothelium. To date, there
is a single report indicating a strong NRP2 mRNA expression in bladder
muscle during development (18), and a report that in bladder cancer, NRP2
expression correlates with advanced tumor stage and grade (44).
Interestingly, a substantial fraction of the NRP receptor is a
glycosaminoglycan (GAG) modified with either heparan sulfate or chondroitin
sulfate (45). Evidence was recently presented indicating that GAG
modification of NRPs plays a critical role in modulating VEGF/NRP signaling
(17, 22, 25, 28, 45), providing new insights into the role of neuropilins in
Page 21 of 45

22
the pathophysiology of bladder inflammation. In this respect, our finding of
VEGF receptors and NRPs in the human urothelium raises the intriguing
question of whether disorders that alter urothelium integrity and
permeability such as interstitial cystitis, infection, and cancer can be
diagnosed and/or treated via modulation of and VEGF receptors and NRPs.
It can be argued that, besides scVEGF/Cy, other Cy5.5 containing fragments
can be taken up by the urothelium. Since only functionally active scVEGF/Cy
can get into cells in vivo, only functionally active fragments that retain the
ability to bind to VEGF and NRP receptors were visualized. Since our test is
functional, such fragments will not be distinguishable from intact scVEGf/Cy.
Nevertheless, these fragments should retain the ability to bind to VEGF-Rs
and NRPs as demonstrated in ex vivo experiments. Finally, the use of
targeted tracer for whole animal near-infrared fluorescent imaging followed
by immunohistochemical analysis of cells tagged in vivo appears to be a
promising approach to elucidating the mechanisms of normalcy and disease
in the urinary bladder. Major advantages of this approach are 1)
opportunities to monitor uptake of the tracer in real time, and 2)
opportunities to identify cells with accessible and active receptors that bind
and internalize the tracer in vivo. Since immunohistochemical analysis does
not discriminate between “working” and “idle” receptors, in vivo tagging with
appropriate tracer might significantly enrich our understanding of temporal
and spatial distribution of signal transduction activity. Furthermore, since
Cy5.5 is retained within the cell after targeting protein is degraded, (24),
there are opportunities for longitudinal studies of tagged cells. In view of
these advantages, it would be interesting to use a fluorescent endoscope for
bladder examination with scVEGF/Cy tracer under conditions of inflammation
and cancer.
Page 22 of 45

23
Conclusion: We present evidence that functionally active and accessible
VEGF receptors and NRPs are expressed in urothelium and neuronal cells in
the mouse urinary bladder and that the accessibility of VEGF receptors and
co-receptors is enhanced by inflammation. Our results strongly suggest that
robust VEGF signaling occurs in bladder urothelium under normal and
inflammatory conditions. This data was obtained using molecular imaging
and receptor-mediated cell tagging in vivo with scVEGF/Cy fluorescent tracer
and we expect that this approach will by useful for the study of normal and
diseased bladder physiology. In the long run, we expect that using
scVEGF/Cy will complement the analysis of standard pathophysiological
parameters and, therefore, permit the evaluation of VEGFR and neuropilin-
targeted interventions for the treatment of inflammation.
Page 23 of 45

24
Table 1. Primary antibody characteristics
Antigen Host Species Against Dilution Code Supplier Address
AUM (uroplakin polyclonal) Rabbit
Bovine AUM 1:10,000
Dr. X-R Wu (50, 51)
Neuronal specific enolase (NSE)
Rabbit (P) Human 1:200 ab16873 Abcam www.abcam.com
Neuropilin 1 (NRP1) Goat (P) Mouse 1:750 24-6800 eBioscience www.ebioscience.com Neuropilin 1 (NRP1) [a1 CUB domain) Rabbit Human 1:100 NP2111 ECM Biosciences www.ecmbiosciences.com Neuropilin-1 (a1 CUB Domain) Blocking Peptide Human 10 mg/ml NX2115 ECM Biosciences www.ecmbiosciences.com
Neuropilin-2 (NRP2) Rabbit Human (N-term) 1:100 36-1500
Zymed Laboratories, Inc.
South San Francisco, California 94080
Vascular endothelium growth factor -R1 (VEGF-R1; Flt-1) Rabbit
Human (C-term) 1:50 RB-9049 NeoMarkers www.labvision.com
Vascular endothelium growth factor -R2 (VEGF-R2; Flk-1) Rat Mouse 1:50 550549 BD Pharmingen
CD31 Rat Mouse 1:50 550274 BD Pharmingen
LYVE-1 Rabbit Mouse 1:400 ab14917 Abcam www.abcam.com
Page 24 of 45

25
Table 2 Mouse primers used for PCR and ChiP-Q-PCR
Q-PCR Primers
Gene Alternative name Accession Forward Reverse
NRP1 BC060129 ATGGGAAGCGAATCTGTAGG CCAGGTCAAATGGAAATGAAAG
NRP2 precursor AF022854 tgctatcttttgggggtttg ggaccagttaccgcagagag
VEGFR1 Flt1 NM_010228 gggtcacacctcatctttctc atgcaaaaggaagcccacta
VEGFR2 Flk-1 X70842 ggcagaccaagagcatctgt gtttgggccgtgattctaaa
VEGFR3 Flt4 NM_008029.2 GGTTCATGGGAAAGGACTTG gcaggacgagccattttatc
Untr6 TCAGGCATGAACCACCATAC AACATCCACACGTCCAGTGA
PCR primers
Gene Accession Forward Reverse NRP1
BC060129
TGGGAAGATTGCACCTTCTCCTGT TTGGTTTCCTTGGAAATGGCACCC
NRP2 precursor
AF022854
TGATTGGCAAGTACTGTGGGACGA TTGAACTTGCGTACAAACGCCCTG
VEGFR1
NM_010228
TCTACAGCACCAAGAGCGATGTGT TATCTTCATGGAGGCCTTGGGCTT
VEGFR2
X70842
GCTTGCCTTATGATGCCAGCAAGT AAGAACTCCATGCCCTTAGCCACT
Page 25 of 45

26
Figure Legends
Figure 1. In vivo visualization of scVEGF/Cy by NIRF. Mice were fed a
low-chlorophyll diet for 2 weeks to reduce auto-fluorescence in the intestinal
region and the abdominal hair was removed. Mice were anesthetized with
isofluorane and injected in the tail vein with 100 µl of scVEGF/Cy containing
~0.5 nmol of the tracer Anesthetized mice were immediately placed on a
heating pad inside a FluorChem HD2 (Alpha Innotech, San Leandro, CA)
equipped with a Chromalight® multi-wavelength illuminator with a Cy5
excitation filter (620 ±60nm) and images were captured with 4- megapixel
Cooled camera (F2.8 28 – 70 mm zoom lens) with a Qdot 705 emission filter
(705nm ±10nm). The FluorChem HD2 was coupled to a dedicated computer
and images were first acquired and stored with AlphaEase FC® 32-bit
software (Alpha Innotech, San Leandro, CA). A is a representative
photograph of a group treated intravesically with saline that was injected
intravenously at time zero with inVEGF/Cy in the tail vein and photographed
at time 240 minutes. B is a representative photograph of a group treated
with saline intravesically that was injected intravenously at time zero with
scVEGF/Cy in the tail vein and photographed at time 240 minutes. C is a
representative photograph of the observed fluorescence in the lower
abdominal region of a mouse chronically treated with PAR1-AP that was
injected intravenously at time zero with scVEGF/Cy in the tail vein and
photographed at time 240 minutes. D-I are representative photographs of
the observed fluorescence in the lower abdominal region of a mouse
chronically treated with PAR1-AP that was injected at time zero with
scVEGF/Cy in the tail vein. The numbers in each segment indicate the actual
time lapse (minutes) after i.v. administration of scVEGF/Cy. Additional mice
were euthanized 24 hours after injection with scVEGF/Cy in the tail vein, and
had their abdomen opened and the gastrointestinal tract removed to permit
Page 26 of 45

27
a better visualization of the pelvic area. J= control (instillation of saline);
K= acute instillation with BCG; L= chronic BCG treatment; M=PAR1-AP
chronic treatment group; and N= PAR2-AP chronic treatment group.
Outside the urinary bladders (green arrows), fluorescence was observed at
its highest concentration in the kidneys (red arrows), lymph sacs draining
the lower abdomen (white arrows), and uterus (blue arrow).
Figure 2. Time-dependent variation in Cy5.5 integrated fluorescent
density in regions of interest (ROI) in the urinary bladder. Integrated
fluorescent density (IFD) X107 was obtained in PAR- (A) and BCG-treated (B)
mice. All mice had intact skin during the scanning and the IFD was obtained
in ROI of the bladder region, as illustrated by a red circle in Figures 1A-F.
The IFD corresponds to the sum of the values of the pixels in the ROI, which
were equivalent to the product of the area (in pixels) and mean gray value.
Results are presented as mean and SEM of 6 mice per point. Asterisks
indicate a statistically significant difference (p<0.05) between saline- and
PAR-APs (A) or saline- and BCG-treated (B).
Figure 3. Systemically administered scVEGF/Cy but not inVEGF/Cy
accumulates in the urothelium and ganglia. These are representative
images taken from a control mouse (instilled with saline) 24 hours after
intravenous administration of 100 µl of active tracer [scVEGF/Cy (A, B, C, E-
F)] and inactive tracer [inVEGF/Cy (D)], both at ~0.5 nmol. A represents
the NIRF observed highlighting the urinary bladder 24 hours following i.v.
administration of scVEGF/Cy. B represents the uptake of scVEGF/Cy into
intramural ganglia. C is a representative confocal photomicrograph
illustrating the uptake of the active tracer (scVEGF/Cy) in the bladder
urothelium whereas D illustrates the presence of inactive tracer (inVEGF/Cy)
Page 27 of 45

28
within the bladder lumen but not in urothelial cells (white arrow and dotted
white line delimit the lumen).
Figure 4. scVEGF/Cy accumulation in the urothelium. Representative
confocal photomicrographs of bladder urothelium isolated from mice that
received systemic administration of the active tracer (scVEGF/Cy). A= Co-
localization of Cy5.5 (white) with DAPI (blue). B= Expression of uroplakin
(red), an urothelium-specific marker, by the bladder urothelial cells. C=
Expression of NRP1 in the mouse bladder urothelium. D= Merged pictures
of A, B, and C (DAPI was omitted for clarity) indicating the co-localization of
NRP1 and Cy5.5 in uroplakin-positive urothelial cells. E = Co-localization of
Cy5.5 (white) with DAPI (blue). F = Expression of VEGFR-1 (green) by the
bladder urothelial cells. G = Expression of NRP2 (red) in the mouse bladder
urothelium. H= Merged pictures of E, F, and G (DAPI was omitted for
clarity) indicating the co-localization of VEGFR-1 and NRP2 in urothelial cells
accumulating Cy5.5. I = Co-localization of Cy5.5 (white) with DAPI (blue).
J = Expression of VEGFR-2 (green) by the bladder urothelial cells. K =
Expression of NRP1 (red) in the mouse bladder urothelium. L= Merged
pictures of I, J, and K (DAPI was omitted for clarity) indicating the co-
localization of VEGFR-2 and NRP1 in urothelial cells accumulating Cy5.5.
White arrows indicate cells co-expressing Cy5.5, uroplakin, and NRP1. Yellow
arrows indicate the direction of bladder lumen.
Figure 5. scVEGF/Cy accumulation in the bladder ganglia.
Representative confocal photomicrographs of bladder urothelium isolated
from mice that received systemic administration of scVEGF/Cy. A= Confocal
projection of a representative area containing ganglia-like cells positively
labeled with scVEGF/Cy and anti-NSE; B= co-localization of Cy5.5 and
VEGFR-1; C= co-localization of Cy5.5 and VEGFR-2; D= co-localization of
Page 28 of 45

29
Cy5.5 and NRP1; E= co-localization of Cy5.5 and NRP2; and F= co-
localization of VEGFR1 and NRP1. BLUE = DAPI and RED = CY5.5. White
arrows indicate cells co-expressing both Cy5.5 and the respective receptor
being studied.
Figure 6. scVEGF/Cy accumulates predominantly in urothelium and
ganglia when compared to blood and lymphatic vessels. A= co-
localization of Cy5.5 and CD31-positive blood vessels in the bladder sub-
urothelial layer. Note the intense accumulation of Cy5.5 in the urothelium
(white dotted line) contrasting with scanty accumulation in CD-31 – positive
blood vessels (white arrows). B= co-localization of Cy5.5 and LYVE-1-
positive lymphatic endothelial cells in the bladder adventitia. Note the
intense accumulation of Cy5.5 in LYVE-1 positive ganglial cells contrasting
accumulation in LYVE-1-positive lymphatics (white arrows). BLUE = DAPI
and RED = CY5.5. White arrows indicate cells co-expressing both receptors
being studied.
Figure 7. Image analysis of the bladder urothelium. At least 6 random
fields per cross-section (n=6 per group) were visualized at 20X
magnification and used for image analysis that was performed with the NIS-
Elements Advanced Research 2.3 imaging software (6). The number of
positive cells expressing a particular antibody was calculated as percent of
the total area of the urothelium. Co-localization of one antibody and Cy5.5
was calculated by converting the area occupied by cells positive for the
antibody into a ROI, and then calculating the percent of Cy5.5-positive cells
within the ROI. Results are expressed as mean ± SEM. Asterisks indicate a
statistically significant difference (p<0.05) between saline- and PAR-APs (A
and C) or saline- and BCG-treated (B and D).
Page 29 of 45

30
Figure 8. Polymerase Chain Reaction for detection of NRP1, NRP2,
VEGFR-1, and VEGFR-2 message. Figure 8A is photomicrograph of gels
and Figure 8B represents the area under the curve as quantified using
Image J software (5). Primers used in this experiment are described in Table
2.
Figure 9. Target validation by Q-PCR of Chromatin
Immunoprecipitation (ChIP) - Based Assays.
Mouse bladders were treated with saline, PAR-APs, or BCG (n=20 per
treatment group) and used for extraction of the chromatin (ChIP) and an
antibody against RNA polymerase II (Abcam) was then used to precipitate
the DNA transcriptome (37). Q-PCR was performed in triplicate to confirm
using primer pairs described in Table 2. Results are presented as average
and standard error of Transcription Binding Events Detected Per 1000 Cells.
Asterisks indicate a statistical significantly difference (p<0.05) between a
specific gene between ChIPs isolated from PAR-APs and control-treated
bladders (A) or BCG- and control treated bladders (B). Untr = un-
transcribed region used as control.
Figure 10. Co-localization of VEGFR-1, VEGFR-2, NRP1, and NRP2 in
human urothelium. Representative photomicrographs indicating that
normal human urothelial cells express VEGFR-1 (A), VEGFR-2 (D), NRP2
(B), and NRP1 (E). C illustrates the co-localization of VEGFR1 and NRP2
and F illustrates the co-localization of NRP1 and VEGFR-2 in the human
urothelium. White arrows indicate cells co-expressing both receptors being
studied and yellow arrows points to the bladder lumen.
Page 30 of 45

31
Acknowledgements Supported by National Institutes of Health grants DK 55828–01 and DK
066101-01 (R.S.), and Equipment Grant from Presbyterian Health
Foundation C5033301 (RS).
Disclosures section: J. Backer is a shareholder and an employee in SibTech, Inc. and M. Backer is an employee in SibTech.
Page 31 of 45
32
References
1. Adobe photoshop CS3 extended. http://wwwadobecom/products/photoshop/photoshopextended/.2. Genpathway. http://wwwgenpathwaycom.3. http://frodo.wi.mit.edu/cgi-bin/primer3/primer3_www.cgi.4. http://www.the-aps.org/publications/journals/guide.htm#animals.5. Image J software. http://rsbinfonihgov/ij/.6. NIS-Elements http://wwwnis-elementscom/.7. Primer 3. . http://frodowimitedu/cgi-bin/primer3/primer3_wwwcgi.8. Backer MV and Backer JM. Functionally active VEGF fusion proteins. Protein Expr Purif 23: 1-7, 2001.9. Backer MV, Gaynutdinov TI, Patel V, Bandyopadhyaya AK, Thirumamagal BT, Tjarks W, Barth RF, Claffey K, and Backer JM. Vascular endothelial growth factor selectively targets boronated dendrimers to tumor vasculature. Mol Cancer Ther 4: 1423-1429, 2005.10. Backer MV, Levashova Z, Patel V, Jehning BT, Claffey K, Blankenberg FG, and Backer JM. Molecular imaging of VEGF receptors in angiogenic vasculature with single-chain VEGF-based probes. Nature medicine 13: 504-509, 2007.11. Backer MV, Levashova Z, Patel V, Jehning BT, Claffey K, Blankenberg FG, and Backer JM. Molecular imaging of VEGF receptors in angiogenic vasculature with single-chain VEGF based probes. . Nature Medicine 13: 504-509, 2007.12. Bernard R. Hypothesis testing for correlation coefficients. Boston: PWS Publishers, 1990.13. Burgu B, McCarthy LS, Shah V, Long DA, Wilcox DT, and Woolf AS. Vascular endothelial growth factor stimulates embryonic urinary bladder development in organ culture. BJU Int 98: 217-225, 2006.14. Burgu B, Medina Ortiz WE, Pitera JE, Woolf AS, and Wilcox DT. Vascular endothelial growth factor mediates hypoxic stimulated embryonic bladder growth in organ culture. J Urol 177: 1552-1557, 2007.15. Campbell SC, Volpert OV, Ivanovich M, and Bouck NP. Molecular mediators of angiogenesis in bladder cancer. Cancer Res 58: 1298-1304, 1998.16. Carmeliet P and Storkebaum E. Vascular and neuronal effects of VEGF in the nervous system: implications for neurological disorders. Seminars in cell & developmental biology 13: 39-53, 2002.17. Cebe Suarez S, Pieren M, Cariolato L, Arn S, Hoffmann U, Bogucki A, Manlius C, Wood J, and Ballmer-Hofer K. A VEGF-A splice variant defective for heparan sulfate and neuropilin-1 binding shows attenuated signaling through VEGFR-2. Cell Mol Life Sci 63: 2067-2077, 2006.18. Chen H, Chedotal A, He Z, Goodman CS, and Tessier-Lavigne M. Neuropilin-2, a novel member of the neuropilin family, is a high affinity receptor for the semaphorins Sema E and Sema IV but not Sema III. Neuron 19: 547-559, 1997.19. Chintalgattu V, Nair DM, and Katwa LC. Cardiac myofibroblasts: a novel source of vascular endothelial growth factor (VEGF) and its receptors Flt-1 and KDR. Journal of molecular and cellular cardiology 35: 277-286, 2003.
Page 32 of 45
33
20. Clavel G, Bessis N, Lemeiter D, Fardellone P, Mejjad O, Menard JF, Pouplin S, Boumier P, Vittecoq O, Le Loet X, and Boissier MC. Angiogenesis markers (VEGF, soluble receptor of VEGF and angiopoietin-1) in very early arthritis and their association with inflammation and joint destruction. Clin Immunol 124: 158-164, 2007.21. D'Andrea MR, Saban MR, Nguyen NB, Andrade-Gordon P, and Saban R.Expression of protease-activated receptor-1, -2, -3, and -4 in control and experimentally inflamed mouse bladder. Am J Pathol 162: 907-923, 2003.22. De Wit J, De Winter F, Klooster J, and Verhaagen J. Semaphorin 3A displays a punctate distribution on the surface of neuronal cells and interacts with proteoglycans in the extracellular matrix. Mol Cell Neurosci 29: 40-55, 2005.23. Deckers MM, Karperien M, van der Bent C, Yamashita T, Papapoulos SE, and Lowik CW. Expression of vascular endothelial growth factors and their receptors during osteoblast differentiation. Endocrinology 141: 1667-1674, 2000.24. Freeman MR, Schneck FX, Gagnon ML, Corless C, Soker S, Niknejad K, Peoples GE, and Klagsbrun M. Peripheral blood T lymphocytes and lymphocytes infiltrating human cancers express vascular endothelial growth factor: a potential role for T cells in angiogenesis. Cancer Res 55: 4140-4145, 1995.25. Fuh G, Garcia KC, and de Vos AM. The interaction of neuropilin-1 with vascular endothelial growth factor and its receptor flt-1. J Biol Chem 275: 26690-26695, 2000.26. Futami R, Miyashita M, Nomura T, Makino H, Matsutani T, Sasajima K, and Tajiri T. Increased serum vascular endothelial growth factor following major surgical injury. Journal of Nippon Medical School = Nihon Ika Daigaku zasshi 74: 223-229, 2007.27. Halin C, Tobler NE, Vigl B, Brown LF, and Detmar M. VEGF-A produced by chronically inflamed tissue induces lymphangiogenesis in draining lymph nodes. Blood, 2007.28. Heil M, Mitnacht-Krauss R, Issbrucker K, van den Heuvel J, Dehio C, Schaper W, Clauss M, and Weich HA. An engineered heparin-binding form of VEGF-E (hbVEGF-E). Biological effects in vitro and mobilizatiion of precursor cells. Angiogenesis 6: 201-211, 2003.29. Herrmann E, Eltze E, Bierer S, Kopke T, Gorge T, Neumann J, Hertle L, and Wulfing C. VEGF-C, VEGF-D and Flt-4 in transitional bladder cancer: relationships to clinicopathological parameters and long-term survival. Anticancer Res 27: 3127-3133, 2007.30. Ishida A, Murray J, Saito Y, Kanthou C, Benzakour O, Shibuya M, and Wijelath ES. Expression of vascular endothelial growth factor receptors in smooth muscle cells. J Cell Physiol 188: 359-368, 2001.31. Labhart P, Karmakar S, Salicru EM, Egan BS, Alexiadis V, O'Malley BW, and Smith CL. Identification of target genes in breast cancer cells directly regulated by the SRC-3/AIB1 coactivator. Proc Natl Acad Sci U S A 102: 1339-1344, 2005.32. Macfarlane SR, Seatter MJ, Kanke T, Hunter GD, and Plevin R. Proteinase-activated receptors. Pharmacological reviews 53: 245-282, 2001.33. Mohamedali KA, Kedar D, Sweeney P, Kamat A, Davis DW, Eve BY, Huang S, Thorpe PE, Dinney CP, and Rosenblum MG. The vascular-targeting fusion toxin VEGF121/rGel inhibits the growth of orthotopic human bladder carcinoma tumors. Neoplasia 7: 912-920, 2005.34. Pavlovich CP, Kraling BM, Stewart RJ, Chen X, Bochner BH, Luster AD, Poppas DP, and O'Donnell MA. BCG-induced urinary cytokines inhibit microvascular endothelial cell proliferation. J Urol 163: 2014-2021, 2000.
Page 33 of 45

34
35. Rovina N, Papapetropoulos A, Kollintza A, Michailidou M, Simoes DC, Roussos C, and Gratziou C. Vascular endothelial growth factor: an angiogenic factor reflecting airway inflammation in healthy smokers and in patients with bronchitis type of chronic obstructive pulmonary disease? Respiratory research 8: 53, 2007.36. Saban MR, Hellmich H, Nguyen NB, Winston J, Hammond TG, and Saban R. Time course of LPS-induced gene expression in a mouse model of genitourinary inflammation. Physiological genomics 5: 147-160, 2001.37. Saban MR, Simpson C, Davis CA, Wallis G, Knowlton N, Frank MB, Centola M, Gallucci RM, and Saban R. Discriminators of mouse bladder response to intravesical Bacillus Calmette-Guerin (BCG). Biomed Central Immunology 8: 6. PMID: 17506885 2007.38. Saban MR, Towner R, Smith N, Abbott A, Neeman M, Davis CA, Simpson C, Maier J, Mémet S, Wu X-E, and Saban R. Lymphatic Vessel Density and Function in Experimental Bladder Cancer. BMC Cancer 7: 219. PMID: 18047671, 2007.39. Saban R, D'Andrea MR, Andrade-Gordon P, Derian C, Dozmorov I, Ihnat MA, Hurst RE, Simpson C, and Saban MR. Mandatory Role of Proteinase-Activated Receptor 1 in Experimental Bladder Inflammation. BMC Physiol 7: 4. PMID: 17397548, 2007.40. Saban R, D'Andrea MR, Andrade-Gordon P, Derian C, Dozmorov I, Ihnat MA, Hurst RE, Simpson C, and Saban MR. Regulatory Network of Inflammation Downstream Proteinase-Activated Receptors. BMC Physiol 7: 3. PMID: 17397547, 2007.41. Saban R, Simpson C, Davis CA, Dozmorov I, Maier J, Fowler B, Ihnat MA, Hurst RE, Wershil BK, and Saban MR. Transcription factor network downstream of protease activated receptors (PARs) modulating mouse bladder inflammation. BCM Immunology 8: 17. PMID: 17705868 2007.42. Saban R, Simpson C, Davis CA, Dozmorov I, Maier J, Fowler B, Ihnat MA, Hurst RE, Wershil BK, and Saban MR. Transcription Factor Network Downstream of Protease Activated Receptors (PARs) Modulating Mouse Bladder Inflammation. BMC Biol Manuscript ID 2136840931149323 submitted, 2007.43. Saban R, Simpson C, Vadigepalli R, Memet S, Dozmorov I, and Saban MR. Bladder inflammatory transcriptome in response to tachykinins:Neurokinin 1 receptor-dependent genes and transcription regulatory elements. BMC UrologyID 2759318551253393 In press, 2006.44. Sanchez-Carbayo M, Socci ND, Lozano JJ, Li W, Charytonowicz E, Belbin TJ, Prystowsky MB, Ortiz AR, Childs G, and Cordon-Cardo C. Gene discovery in bladder cancer progression using cDNA microarrays. Am J Pathol 163: 505-516, 2003.45. Shintani Y, Takashima S, Asano Y, Kato H, Liao Y, Yamazaki S, Tsukamoto O, Seguchi O, Yamamoto H, Fukushima T, Sugahara K, Kitakaze M, and Hori M.Glycosaminoglycan modification of neuropilin-1 modulates VEGFR2 signaling. Embo J 25: 3045-3055, 2006.46. Slobodov G, Feloney M, Gran C, Kyker KD, Hurst RE, and Culkin DJ. Abnormal expression of molecular markers for bladder impermeability and differentiation in the urothelium of patients with interstitial cystitis. J Urol 171: 1554-1558, 2004.47. Takahashi N, Seko Y, Noiri E, Tobe K, Kadowaki T, Sabe H, and Yazaki Y.Vascular endothelial growth factor induces activation and subcellular translocation of focal adhesion kinase (p125FAK) in cultured rat cardiac myocytes. Circ Res 84: 1194-1202, 1999.
Page 34 of 45

35
48. Troy T, Jekic-McMullen D, Sambucetti L, and Rice B. Quantitative comparison of the sensitivity of detection of fluorescent and bioluminescent reporters in animal models. Mol Imaging 3: 9-23, 2004.49. Visvanathan S, Wagner CL, Marini JC, van der Heijde D, Baker D, Gathany T, Han J, and Braun J. Inflammatory biomarkers, disease activity, and spinal disease measures in patients with ankylosing spondylitis after treatment with infliximab. Ann Rheum Dis, 2007.50. Wu XR, Lin JH, Walz T, Haner M, Yu J, Aebi U, and Sun TT. Mammalian uroplakins. A group of highly conserved urothelial differentiation-related membrane proteins. J Biol Chem 269: 13716-13724, 1994.51. Wu XR, Manabe M, Yu J, and Sun TT. Large scale purification and immunolocalization of bovine uroplakins I, II, and III. Molecular markers of urothelial differentiation. J Biol Chem 265: 19170-19179, 1990.
Page 35 of 45

10 minutes 120 minutes 240 minutes 330 minutes 1440 minutes 1440 empty
D E F G H I
GA
inVEGF/Cy scVEGF/Cy
SALINE PAR1-AP CHRONIC
FIGURE 1
J
scVEGF/Cy
BCG CHRONICBCG ACUTE PAR1-AP CHRONICPAR2-AP CHRONIC
K L MN
scVEGF/Cy
SALINE
scVEGF/Cy scVEGF/CyscVEGF/Cy
scVEGF/Cy scVEGF/Cy scVEGF/Cy scVEGF/Cy scVEGF/Cy scVEGF/Cy
SALINE
scVEGF/Cy
B CPage 36 of 45

FIGURE 2
A
B
** * *
** * *
0 10 120 240 330 1440 1440 EMPTY0
2
4
6
8
10
12
14
16SALINE scVEGF/CyPAR1-AP CHRONIC scVEGF/CyPAR2-AP CHRONIC scVEGF/CySALINE inVEGF/Cy
MINUTES
INTE
GR
ATE
D D
ENSI
TY X
107
0 60 120 240 330 1440 1440 EMPTY
0 10 120 240 330 1440 1440 EMPTY0
2
4
6
8
10
12
14
16SALINE scVEGF/Cy
BCG CHRONIC scVEGF/CyBCG ACUTE scVEGF/Cy
SALINE inVEGF/Cy
MINUTES
INTE
GR
ATE
D D
ENSI
TY X
107
0 60 120 240 330 1440 1440 EMPTY
Page 37 of 45

A
B
C
FIGURE 3
50 mm
scVEGF/C inVEGF/C
50 mm50 mmD
scVEGF/C
scVEGF/C
Page 38 of 45

VEGFR11:50Cy5.5 NRP2
1:50
NRP11:750VEGFR2
1:50
Cy5.5
Cy5.5
VEGFR21:50
NRP11:750
UROPLAKIN1:10,000 MERGE
MERGE
MERGE
10 mm
10 mm
10 mm
A B C D
E F G H
I J K L
FIGURE 4
10 mm
10 mm
Page 39 of 45
NSE 1:100
VEGFR11:100
VEGFR21:50
NRP11:750
NRP21:50
GANGLIA GANGLIA GANGLIA
GANGLIA GANGLIA
A B C
D E
FIGURE 5
F
NRP1 (RED) 1:750VEGFR1 (GREEN) 1:50
GANGLIA
200 px50 mm50 mm
50 mm 50 mm50 mm
Page 40 of 45

20 mm
Cy5.5 (RED) CD31 (GREEN) 1:50
Cy5.5 (RED) LYVE -1 (GREEN) 1:400
UROTHELIUM
GANGLIA20 mm
A
B
FIGURE 6
Page 41 of 45

FIGURE 7
A B
C DVEGFR1 VEGFR2 NRP1 NRP2
0
5
10
15
20
25
30 SALINE CHRONIC
PAR2-AP CHRONICPAR1-AP CHRONIC
* *
*
% P
OSI
TIVE
CEL
LS/ U
RO
THEL
IUM
VEGFR1 VEGFR2 NRP1 NRP20
4
8
12
16
20
24SALINE
BCG CHRONICBCG ACUTE
* * *
*
*
*
*
% P
OSI
TIVE
CEL
LS/ U
RO
THEL
IUM
VEGFR1 VEGFR2 NRP1 NRP20
10
20
30
40
BCG ACUTEBCG CHRONIC
SALINE CHRONIC
* *
**
CO
-LO
CA
LIZA
TIO
N W
ITH
CY5
.5
VEGFR1 VEGFR2 NRP1 NRP20
10
20
30
40
50
60
70 SALINE CHRONIC
PAR2-AP CHRONICPAR1-AP CHRONIC
**
*
*
**
**
CO
-LO
CA
LIZA
TIO
N W
ITH
CY5
.5
Page 42 of 45

A
B
FIGURE 8
NRP1 NRP2 VEGFR1 VEGFR2 GAPDH
NRP1 NRP2 VEGFR1 VEGFR20
10
20
30
40
50
RECEPTOR
%G
APD
HIn
tegr
ated
Den
sity
Val
ue
Page 43 of 45

A B
FIGURE 9
Untr VEGFR1 VEGFR2 VEGFR3 NRP1 NRP20.0
0.5
1.0
1.5
2.0
SALINEPAR1-AP CHRONIC
**
*
*
*
**
2
3
4
5
PAR2-AP CHRONIC
GENES
TRA
NSC
RIP
TIO
NA
L B
IND
ING
EVE
NTS
/100
0 C
ELLS
Untr VEGFR1 VEGFR2 VEGFR3 NRP1 NRP20.0
0.5
1.0
1.5
SALINE
BCG CHRONICBCG ACUTE
* *
*
*
1.5
2.5
3.5
4.5 *
* *
GENESTR
AN
SCR
IPTI
ON
AL
BIN
DIN
G E
VEN
TS /1
000
CEL
LS
Page 44 of 45

FIGURE 10
VEGFR11:50
NRP21:50
NRP2 (RED)VEGFR1(GREEN)
100 px 100 px100 pxA B C
NRP11:750
VEGFR21:50
NRP1 (RED)VEGFR2 (GREEN)
E FD 100 px100 px100 px
Page 45 of 45
Copyright © 2022 FDOKUMEN