Cancers of the urinary tract among American Indians and Alaska Natives in the United States,...
12
An Update on Cancer in American Indians and Alaska Natives, 1999-2004 Supplement to Cancer Cancers of the Urinary Tract Among American Indians and Alaska Natives in the United States, 1999–2004 Robin Taylor Wilson, PhD 1 Lisa C. Richardson, MD, MPH 2 Janet J. Kelly, MS, MPH 3 Judith Kaur, MD 4 Melissa A. Jim, MPH 2,5 Anne P. Lanier, MD, MPH 3 1 Division of Epidemiology, Department of Public Health Sciences, Pennsylvania State College of Medicine, Hershey, Pennsylvania. 2 Division of Cancer Prevention and Control, Cen- ters for Disease Control and Prevention, Atlanta, Georgia. 3 Alaska Native Tribal Health Consortium, Anchorage, Alaska. 4 Department of Oncology, Mayo Clinic, Rochester, Minnesota. 5 Division of Epidemiology and Disease Prevention, Indian Health Service, Alburquerque, New Mexico. BACKGROUND. Assessment of the kidney parenchyma (‘‘kidney’’) and urinary bladder (‘‘bladder’’) cancer burden among American Indians and Alaska Natives (AI/AN) has been limited. Using a database with improved classification for AI/ AN, the authors described patterns of these 2 cancers among AI/AN and non- Hispanic whites (NHW) in the United States. METHODS. Cases diagnosed during 1999 to 2004 were identified through National Program of Cancer Registries and the Surveillance, Epidemiology and End Results program and linked to the Indian Health Service (IHS) registration records. Age- adjusted incidence rates, rate ratios (RR), annual percent change, and stage at diagnosis were stratified by IHS Contract Health Service Delivery Area (CHSDA) counties to adjust for misclassification. RESULTS. Kidney cancer incidence among AI/AN in CHSDA counties exceeded that among NHW (RR, 1.51; 95% confidence interval [CI], 1.42-1.61), and was highest among AI/AN in the Northern Plains, Southern Plains, Alaska, and South- west. Average annual increases were highest among AI/AN (5.9%) and NHW (5.9%) males aged 20 to 49 years, although statistically significant only among NHW. Conversely, bladder cancer incidence was significantly lower among AI/AN than NHW (RR, 0.40; 95% CI, 0.37-0.44). For both sites, AI/AN were significantly less likely to be diagnosed at an earlier stage than NHW. CONCLUSIONS. AI/AN have about 50% greater risk of kidney cancer and half the risk of bladder cancer than NHW. Although reasons for these enigmatic patterns are not known, sustained primary prevention efforts through tobacco cessation and obesity prevention are warranted. Cancer 2008;113(5 suppl):1213–24. Pub- lished 2008 by the American Cancer Society.* KEYWORDS: cancer, incidence, American Indian, Alaska Native, misclassification, NPCR, SEER, United States, health disparity. C ancers of the kidney and urinary bladder (‘‘bladder’’) are not currently a focus of cancer control and prevention efforts, in part because of the lack of evidence-based screening methods. Previous reports indicate racial/ethnic differences in the incidence of these cancers, including higher incidence and mortality rates of kidney cancer among American Indians and Alaska Natives (AI/AN). 1-3 Analyses of cancer patterns among AI/AN have been limited by considerable race misclassification of AI/AN cases in many central cancer registries. 4-7 The aim of this study is to provide a compre- This supplement was sponsored by Cooperative Agreement Number U50 DP424071-04 from the Centers for Disease Control and Prevention, Divi- sion of Cancer Prevention and Control. The findings and conclusions in this report are those of the authors and do not necessarily represent the official position of the Centers for Disease Control and Prevention. Address for reprints: Robin Taylor Wilson, PhD, Division of Epidemiology, Department of Public Health Sciences, Pennsylvania State College of Medicine, 600 Centerview Drive, Mail Code A210, Hershey, PA 17033; Fax: (717) 531-5779; E-mail: [email protected] *This article is a US Government work and, as such, is in the public domain in the United States of America. Received May 5, 2008; accepted June 3, 2008. Published 2008 by the American Cancer Society* DOI 10.1002/cncr.23733 Published online 20 August 2008 in Wiley InterScience (www.interscience.wiley.com). 1213
-
Upload
independent -
Category
Documents
-
view
4 -
download
0
Transcript of Cancers of the urinary tract among American Indians and Alaska Natives in the United States,...

An Update on Cancer in American Indians and AlaskaNatives, 1999-2004
Supplement to Cancer
Cancers of the Urinary Tract Among American Indiansand Alaska Natives in the United States, 1999–2004
Robin Taylor Wilson, PhD1
Lisa C. Richardson, MD, MPH2
Janet J. Kelly, MS, MPH3
Judith Kaur, MD4
Melissa A. Jim, MPH2,5
Anne P. Lanier, MD, MPH3
1 Division of Epidemiology, Department of PublicHealth Sciences, Pennsylvania State College ofMedicine, Hershey, Pennsylvania.
2 Division of Cancer Prevention and Control, Cen-ters for Disease Control and Prevention, Atlanta,Georgia.
3 Alaska Native Tribal Health Consortium, Anchorage,Alaska.
4 Department of Oncology, Mayo Clinic, Rochester,Minnesota.
5 Division of Epidemiology and Disease Prevention,Indian Health Service, Alburquerque, New Mexico.
BACKGROUND. Assessment of the kidney parenchyma (‘‘kidney’’) and urinary
bladder (‘‘bladder’’) cancer burden among American Indians and Alaska Natives
(AI/AN) has been limited. Using a database with improved classification for AI/
AN, the authors described patterns of these 2 cancers among AI/AN and non-
Hispanic whites (NHW) in the United States.
METHODS. Cases diagnosed during 1999 to 2004 were identified through National
Program of Cancer Registries and the Surveillance, Epidemiology and End Results
program and linked to the Indian Health Service (IHS) registration records. Age-
adjusted incidence rates, rate ratios (RR), annual percent change, and stage at
diagnosis were stratified by IHS Contract Health Service Delivery Area (CHSDA)
counties to adjust for misclassification.
RESULTS. Kidney cancer incidence among AI/AN in CHSDA counties exceeded
that among NHW (RR, 1.51; 95% confidence interval [CI], 1.42-1.61), and was
highest among AI/AN in the Northern Plains, Southern Plains, Alaska, and South-
west. Average annual increases were highest among AI/AN (5.9%) and NHW
(5.9%) males aged 20 to 49 years, although statistically significant only among
NHW. Conversely, bladder cancer incidence was significantly lower among AI/AN
than NHW (RR, 0.40; 95% CI, 0.37-0.44). For both sites, AI/AN were significantly
less likely to be diagnosed at an earlier stage than NHW.
CONCLUSIONS. AI/AN have about 50% greater risk of kidney cancer and half the
risk of bladder cancer than NHW. Although reasons for these enigmatic patterns
are not known, sustained primary prevention efforts through tobacco cessation
and obesity prevention are warranted. Cancer 2008;113(5 suppl):1213–24. Pub-
lished 2008 by the American Cancer Society.*
KEYWORDS: cancer, incidence, American Indian, Alaska Native, misclassification,NPCR, SEER, United States, health disparity.
C ancers of the kidney and urinary bladder (‘‘bladder’’) are not
currently a focus of cancer control and prevention efforts, in
part because of the lack of evidence-based screening methods.
Previous reports indicate racial/ethnic differences in the incidence
of these cancers, including higher incidence and mortality rates
of kidney cancer among American Indians and Alaska Natives
(AI/AN).1-3
Analyses of cancer patterns among AI/AN have been limited by
considerable race misclassification of AI/AN cases in many central
cancer registries.4-7 The aim of this study is to provide a compre-
This supplement was sponsored by CooperativeAgreement Number U50 DP424071-04 from theCenters for Disease Control and Prevention, Divi-sion of Cancer Prevention and Control.
The findings and conclusions in this report arethose of the authors and do not necessarilyrepresent the official position of the Centers forDisease Control and Prevention.
Address for reprints: Robin Taylor Wilson, PhD,Division of Epidemiology, Department of PublicHealth Sciences, Pennsylvania State College ofMedicine, 600 Centerview Drive, Mail CodeA210, Hershey, PA 17033; Fax: (717) 531-5779;E-mail: [email protected]
*This article is a US Government work and, assuch, is in the public domain in the United Statesof America.
Received May 5, 2008; accepted June 3, 2008.
Published 2008 by the American Cancer Society*DOI 10.1002/cncr.23733Published online 20 August 2008 in Wiley InterScience (www.interscience.wiley.com).
1213
hensive description of kidney and bladder cancer in
AI/AN populations using techniques to lessen the
effects of race misclassification. The database used
in this analysis provides the most accurate and com-
plete racial/ethnic classification of AI/AN diagnosed
with cancer in the United States to date.
MATERIALS AND METHODSCancer Case AscertainmentNewly diagnosed cancers of the bladder and kidney
parenchyma (‘‘kidney’’) diagnosed during 1999 to
2004 were identified in US population-based cancer
registries participating in the National Program of
Cancer Registries (NPCR) of the Centers for Disease
Control and Prevention (CDC) and the Surveillance,
Epidemiology, and End Results (SEER) program of
the National Cancer Institute (NCI). More detailed
methodology can be reviewed elsewhere in this Sup-
plement.8
Analysis of cancers of the kidney included all
invasive cancers. Primary site and histology were
coded according to the International Classification of
Diseases for Oncology (ICD-O) edition in use at the
time of diagnosis and converted to the Third Edition
(ICD-O-3).9 Kidney cancer analyses focused on can-
cers of the kidney parenchyma (ICD-O-3 site code
C64.9) and renal cell carcinoma overall, according to
the Mainz classification(ICD-O-3 morphology codes
8310, 8312, 8317, 8318, and 8260).10 Surveillance
reports on kidney and other cancers frequently group
the kidney parenchyma and renal pelvis into a com-
posite rate; to facilitate comparisons with other
reports, data for kidney and renal pelvis combined
(ICD-O-3 site code C65.9) are provided online at
http://www.cdc.gov/npcr.
Analysis of cancers of the urinary bladder (ICD-
O-3 site code C67.9) included patients with both
invasive and in situ cancers.11 We examined data for
all histologic types combined, as well as for transi-
tional cell cancers only (ICD-O-3 morphology codes
8120, 8130, and 8050).
Classification of Race and EthnicityThe database was created by linking cancer registry
data to the Indian Health Service (IHS) patient regis-
tration database. The IHS registration database con-
sists of persons from federally recognized tribes in
the US eligible for IHS services. Individuals whose
race or ethnicity was previously classified in partici-
pating cancer registries as white, other, or unknown,
and then identified as AI/AN by linkage with the IHS
data, were reclassified as AI/AN. Probabilistic data
record linkages were conducted using CDC’s software
LinkPlus. Cases were also classified by Hispanic ori-
gin using the North American Association of Central
Cancer Registries Hispanic Identification Algorithm.12
All AI/AN were included in AI/AN rates irrespective
of Hispanic origin.
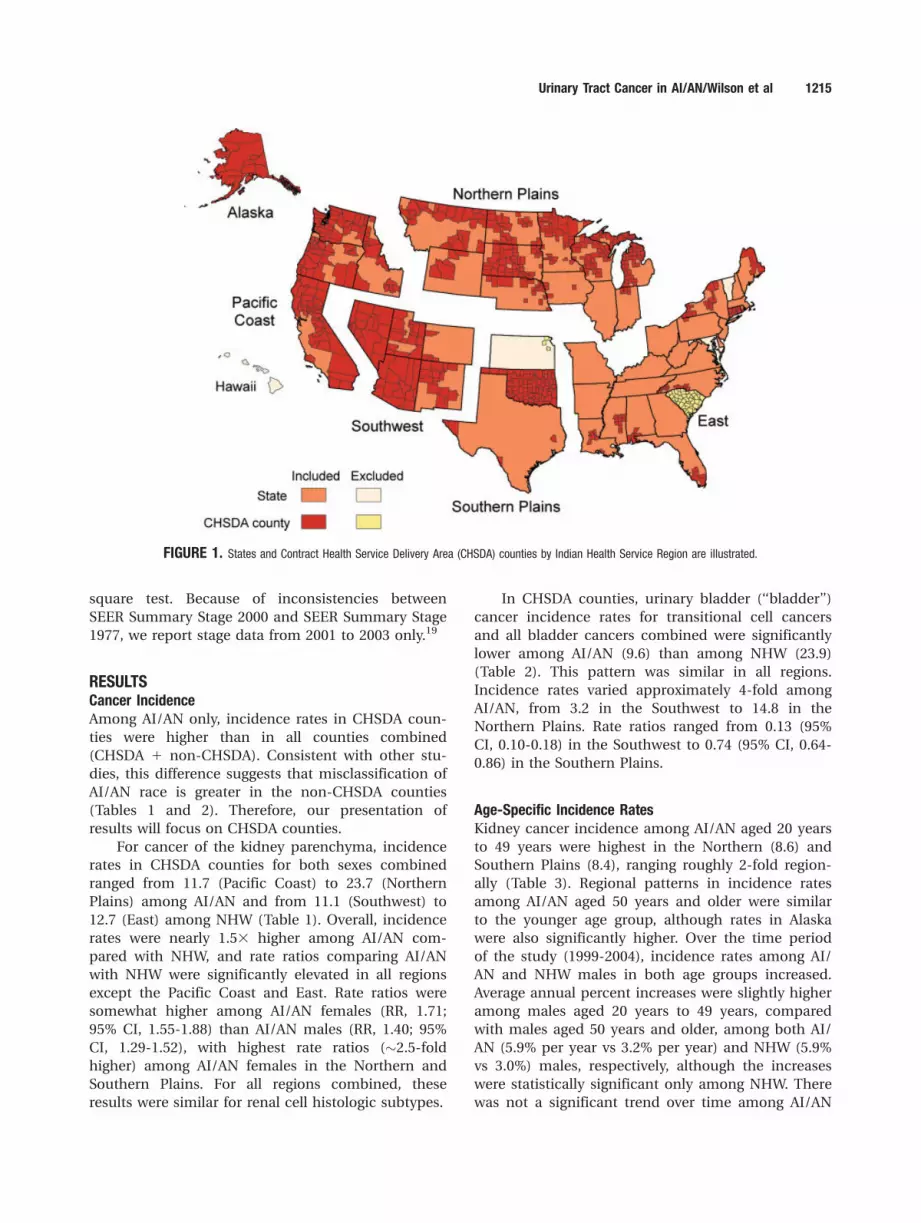
Geographic RegionsGeographic regions used for this study were consist-
ent with those used in previous reports.3,13 Contract
Health Service Delivery Area (CHSDA) counties are
designated by the IHS and consist of 624 counties
that, in general, include or are adjacent to federally
recognized tribal lands,8 and include approximately
56% of the AI/AN population. CHSDA counties have
been used previously2,3 for rate calculations, as there
is evidence that less race misclassification occurs in
these counties.14 In this study, we calculated inci-
dence for CHSDA counties and for all counties com-
bined. IHS regions and CHSDA counties included in
the analysis are shown in Figure 1.
Statistical Analysis
Incidence, annual percent change, and rate ratios. In-
cidence rates were calculated for cancers of the kid-
ney and bladder for 6 geographic regions by sex and
by age group, using NCI’s SEER*Stat software (ver-
sion 6.3.6).15 SEER*Stat uses bridged single-race
population estimates as denominator data, devel-
oped jointly by the US Census Bureau and CDC, and
further modified by NCI.8,16 AI/AN incidence rates
were adjusted for age using the direct method with
the 2000 US standard population.17 Age-adjusted
incidence rates were calculated for 2 age groups: 20
years to 49 years, and 50 years and older. Rate ratios
(RR) were calculated to compare incidence rates
between AI/AN and NHW. Ninety-five percent confi-
dence intervals (CI) were calculated in SEER*Stat
using methods described elsewhere.8 The annual
percent change in incidence rates was calculated
using weighted linear regression techniques and
2-year moving averages.15 Correlations between re-
gional incidence rates in CHSDA counties and self-
reported tobacco use prevalence among AI/AN in
CHSDA counties18 were calculated using the Pearson
correlation coefficient.
Stage at diagnosisSEER Summary Stage 2000, age-adjusted to the 2000
US standard population, was used to describe the
distribution of stage at diagnosis.8 The statistical sig-
nificance of differences between AI/AN and NHW
stage distribution were determined using the chi-
1214 CANCER Supplement September 1, 2008 / Volume 113 / Number 5
square test. Because of inconsistencies between
SEER Summary Stage 2000 and SEER Summary Stage
1977, we report stage data from 2001 to 2003 only.19
RESULTSCancer IncidenceAmong AI/AN only, incidence rates in CHSDA coun-
ties were higher than in all counties combined
(CHSDA 1 non-CHSDA). Consistent with other stu-
dies, this difference suggests that misclassification of
AI/AN race is greater in the non-CHSDA counties
(Tables 1 and 2). Therefore, our presentation of
results will focus on CHSDA counties.
For cancer of the kidney parenchyma, incidence
rates in CHSDA counties for both sexes combined
ranged from 11.7 (Pacific Coast) to 23.7 (Northern
Plains) among AI/AN and from 11.1 (Southwest) to
12.7 (East) among NHW (Table 1). Overall, incidence
rates were nearly 1.53 higher among AI/AN com-
pared with NHW, and rate ratios comparing AI/AN
with NHW were significantly elevated in all regions
except the Pacific Coast and East. Rate ratios were
somewhat higher among AI/AN females (RR, 1.71;
95% CI, 1.55-1.88) than AI/AN males (RR, 1.40; 95%
CI, 1.29-1.52), with highest rate ratios (�2.5-fold
higher) among AI/AN females in the Northern and
Southern Plains. For all regions combined, these
results were similar for renal cell histologic subtypes.
In CHSDA counties, urinary bladder (‘‘bladder’’)
cancer incidence rates for transitional cell cancers
and all bladder cancers combined were significantly
lower among AI/AN (9.6) than among NHW (23.9)
(Table 2). This pattern was similar in all regions.
Incidence rates varied approximately 4-fold among
AI/AN, from 3.2 in the Southwest to 14.8 in the
Northern Plains. Rate ratios ranged from 0.13 (95%
CI, 0.10-0.18) in the Southwest to 0.74 (95% CI, 0.64-
0.86) in the Southern Plains.
Age-Specific Incidence RatesKidney cancer incidence among AI/AN aged 20 years
to 49 years were highest in the Northern (8.6) and
Southern Plains (8.4), ranging roughly 2-fold region-
ally (Table 3). Regional patterns in incidence rates
among AI/AN aged 50 years and older were similar
to the younger age group, although rates in Alaska
were also significantly higher. Over the time period
of the study (1999-2004), incidence rates among AI/
AN and NHW males in both age groups increased.
Average annual percent increases were slightly higher
among males aged 20 years to 49 years, compared
with males aged 50 years and older, among both AI/
AN (5.9% per year vs 3.2% per year) and NHW (5.9%
vs 3.0%) males, respectively, although the increases
were statistically significant only among NHW. There
was not a significant trend over time among AI/AN
FIGURE 1. States and Contract Health Service Delivery Area (CHSDA) counties by Indian Health Service Region are illustrated.
Urinary Tract Cancer in AI/AN/Wilson et al 1215

TABLE
1Kidne
yPa
renc
hymaCan
cerIn
cide
nceby
Indian
Hea
lthSe
rviceReg
ionforAmerican
Indian
s/Alask
aNatives
aan
dNon
-Hispa
nicWhites,
UnitedStates,1
999to
2004
CHSD
ACou
nties
AllC
ount
ies
IHSReg
ion
Sex
AI/A
N
Cou
ntb
AI/A
N
Ratec
95%
CIfor
AI/A
NRate
NHW
Rate
RateRatio
c
(AI/AN
:NHW
)
95%
CIfor
RateRatio
AI/A
N
Cou
ntb
AI/A
N
Ratec
95%
CIfor
AI/A
NRate
NHW
Ratec
RateRatio
c
(AI/AN
:NHW
)
95%
CIfor
RateRatio
NorthernPlains
Both
sexes
203
23.7
20.4-27.5
12.1
1.96
d1.68
-2.28
251
17.0
14.8-19.4
13.0
1.31
d1.14
-1.50
Male
117
28.6
23.3-34.8
16.1
1.77
d1.44
-2.16
145
21.1
17.4-25.3
17.4
1.21
0000
000
1.00
-1.45
Female
8619
.215
.1-23.9
8.6
2.22
d 000
001.75
-2.78
106
13.4
10.8-16.4
9.3
1.44
d1.16
-1.76
Alaska
eBo
thsexes
7819
.615
.3-24.7
12.7
1.54
d1.16
-2.03
7819
.615
.3-24.7
12.7
1.54
d1.16
-2.03
Male
5228
.620
.7-38.3
18.0
1.59
d1.10
-2.25
5228
.620
.7-38.3
18.0
1.59
d1.10
-2.25
Female
2612
.07.7-17
.67.9
1.51
0.92
-2.40
2612
.07.7-17
.67.9
1.51
0.92
-2.40
Southe
rnPlains
Both
sexes
297
21.3
18.9-23.9
12.4
1.72
d1.52
-1.94
324
16.7
14.9-18.7
13.8
1.21
d1.08
-1.36
Male
163
24.7
20.9-28.9
17.1
1.45
d1.22
-1.71
177
19.0
16.2-22.2
18.8
1.01
0.86
-1.18
Female
134
17.9
15.0-21.2
8.6
2.09
d1.73
-2.51
147
14.4
12.1-16.90
09.6
1.50
d1.26
-1.77
Pacific
Coa
stBo
thsexes
169
11.7
9.9-13
.811
.31.04
0.87
-1.22
201
7.7
6.6-8.9
11.1
0.69
d0.59
-0.80
Male
9714
.611
.5-18.2
15.6
0.94
0.74
-1.17
119
9.8
8.0-12
.015
.40.64
d0.52
-0.78
Female
729.4
7.2-11
.97.7
1.22
0.94
-1.56
825.9
4.6-7.4
7.5
0.79
d0.62
-0.99
East
Both
sexes
4612
.99.3-17
.312
.61.02
0.74
-1.37
163
6.3
5.3-7.4
12.9
0.49
d0.41
-0.57
Male
2012
.37.1-19
.617
.60.70
0.41
-1.12
876.8
5.3-8.5
17.7
0.38
d0.30
-0.48
Female
2613
.38.6-19
.68.5
1.56
d1.01
-2.30
765.7
4.4-7.1
9.0
0.63
d0.49
-0.79
Southw
est
Both
sexes
341
17.9
15.9-19.9
11.1
1.60
d1.43
-1.80
352
16.3
14.6-18.2
10.9
1.50
d1.34
-1.67
Male
206
25.0
21.5-28.9
15.0
1.67
d1.43
-1.93
216
23.2
20.0-26.7
14.8
1.57
d1.35
-1.81
Female
135
12.4
10.3-14.7
7.8
1.59
d1.32
-1.91
136
11.1
9.2-13
.27.6
1.45
d1.21
-1.73
Total
Both
sexes
1,13
417
.916
.8-19.0
11.8
1.51
d1.42
-1.61
1,36
912
.311
.6-13.0
12.6
0.98
0.92
-1.03
Male
655
22.7
20.8-24.6
16.2
1.40
d1.29
-1.52
796
15.6
14.4-16.8
17.2
0.91
d0.84
-0.98
Female
479
13.9
12.7-15.2
8.1
1.71
d1.55
-1.88
573
9.6
8.8-10
.48.8
1.09
1.00
-1.19
Totalren
alce
llBo
thsexes
992
15.6
14.6-16.6
10.0
1.56
d1.46
-1.67
1,19
910
.710
.1-11.4
10.6
1.01
0.95
-1.07
Male
574
19.7
18.0-21.5
13.7
1.44
d1.31
-1.57
695
13.5
12.4-14.6
14.6
0.92
0.85
-1.00
Female
418
12.1
11.0-13.4
6.8
1.79
d1.62
-1.98
504
8.4
7.7-9.2
7.3
1.15
d1.04
-1.25
Source
:Can
cerregistrie
sin
theNationa
lProgram
ofCa
ncer
Registrie
s(N
PCR)
oftheCe
ntersforDisea
seCo
ntrola
ndPrev
entio
nan
d/or
theSu
rveilla
nce,
Epidem
iology,a
ndEn
dRe
sults
(SEE
R)prog
ram
oftheNationa
lCan
cerInstitu
te.
CHSD
Aindica
tesCo
ntract
Hea
lthSe
rviceDeliveryAr
eas;
IHS,
Indian
Hea
lthSe
rvice;
AI/A
N,A
merican
Indian
s/Alaska
Natives;N
HW,n
on-H
ispa
nicwhites;
CI,c
onfid
ence
interval.
aAI/A
Nrace
isrepo
rted
byNPC
Ran
dSE
ERregistrie
sor
throug
hlin
kage
with
theIH
Spa
tient
registratio
nda
taba
se.A
I/AN
person
sof
Hispa
nicorigin
areinclud
ed.
bRa
tesarepe
r10
0,00
0pe
rson
san
dareag
e-ad
justed
tothe20
00USstan
dard
popu
latio
n(19ag
egrou
ps,C
ensu
sP2
5-11
30).
cRa
teratio
sareca
lculated
inSE
ER*Statp
riorto
roun
ding
ofratesan
dmay
note
qual
rate
ratio
sca
lculated
from
ratespresen
tedin
thetable.
dRa
teratio
isstatistic
ally
sign
ifica
nt(P
<.05).
eRa
tesan
drate
ratio
sforAlaska
intheCH
SDAco
untie
ssectionarethesameas
thos
ein
theAllC
ountiessectionbe
caus
eallc
ountiesin
Alaska
areCH
SDAco
untie
s.
Yearsof
data
andregistrie
sus
ed:1
999to
2004
(41states
andtheDistrictof
Columbia):A
laska,*Alab
ama,*Ar
kans
as,A
rizon
a,*Ca
lifornia,*Co
lorado
,*Co
nnec
ticut,*
theDistrictof
Columbia,
Delaw
are,
Florida,*Geo
rgia,H
awaii,Iowa,*Idah
o,*Illinois,
Indian
a,*Ke
ntuc
ky,L
ouisi-
ana,*Massach
usetts,*
Maine
,*Michiga
n,*Minne
sota,*
Misso
uri,Mon
tana
,*North
Carolin
a,*Neb
raska,*New
Ham
pshire,N
ewJersey,N
ewMexico,*Nev
ada,*New
York,*
Ohio,
Oklah
oma,*Orego
n,*Pe
nnsylvan
ia,*
Rhod
eIsland
,*Te
xas,*Utah,*Washing
ton,*Wisco
nsin,*
West
Virginia,a
ndWyo
ming*;1
999an
d20
02to
2004
:North
Dak
ota*;2
001to
2004
:Sou
thDak
ota*;2
003to
2004
:Mississippi*an
dVirginia;2
004:
Tenn
essee.
*Stateswith
atleasto
neco
unty
design
ated
asCH
SDA.
Percen
tage
region
alco
verage
ofAI/A
Nin
CHSD
Aco
untie
sco
mpa
redwith
AI/A
Nin
allc
ounties:
Alaska
510
0%;E
ast5
13.1%;N
orthernPlains
559
.0%;S
outhernPlains
564
.1%;P
acificCo
ast5
55.6%;S
outhwest5
87.5%.
1216 CANCER Supplement September 1, 2008 / Volume 113 / Number 5
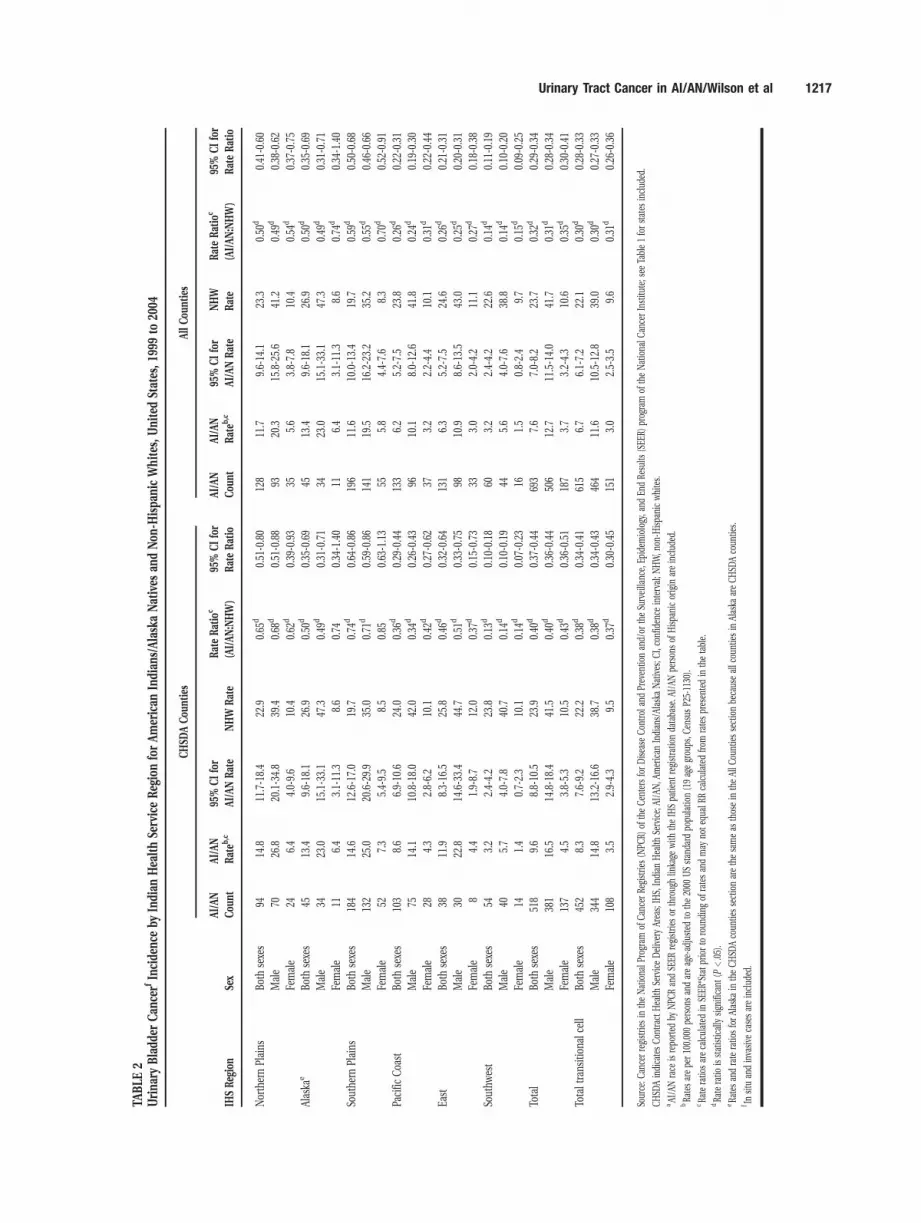
TABLE
2Urina
ryBladd
erCan
cerf
Incide
nceby
Indian
Hea
lthSe
rviceReg
ionforAmerican
Indian
s/Alask
aNatives
andNon
-Hispa
nicWhites,U
nitedStates,1
999to
2004
CHSD
ACou
nties
AllC
ount
ies
IHSReg
ion
Sex
AI/A
N
Cou
nt
AI/A
N
Rateb
,c95
%CIfor
AI/A
NRate
NHW
Rate
RateRatio
c
(AI/AN
:NHW
)
95%
CIfor
RateRatio
AI/A
N
Cou
nt
AI/A
N
Rateb
,c95
%CIfor
AI/A
NRate
NHW
Rate
RateRatio
c
(AI/AN
:NHW
)
95%
CIfor
RateRatio
NorthernPlains
Both
sexes
9414
.811
.7-18.4
22.9
0.65
d0.51
-0.80
128
11.7
9.6-14
.123
.30.50
d0.41
-0.60
Male
7026
.820
.1-34.8
39.4
0.68
d0.51
-0.88
9320
.315
.8-25.6
41.2
0.49
d0.38
-0.62
Female
246.4
4.0-9.6
10.4
0.62
d0.39
-0.93
355.6
3.8-7.8
10.4
0.54
d0.37
-0.75
Alaska
eBo
thsexes
4513
.49.6-18
.126
.90.50
d0.35
-0.69
4513
.49.6-18
.126
.90.50
d0.35
-0.69
Male
3423
.015
.1-33.1
47.3
0.49
d0.31
-0.71
3423
.015
.1-33.1
47.3
0.49
d0.31
-0.71
Female
116.4
3.1-11
.38.6
0.74
0.34
-1.40
116.4
3.1-11
.38.6
0.74
d0.34
-1.40
Southe
rnPlains
Both
sexes
184
14.6
12.6-17.0
19.7
0.74
d0.64
-0.86
196
11.6
10.0-13.4
19.7
0.59
d0.50
-0.68
Male
132
25.0
20.6-29.9
35.0
0.71
d0.59
-0.86
141
19.5
16.2-23.2
35.2
0.55
d0.46
-0.66
Female
527.3
5.4-9.5
8.5
0.85
0.63
-1.13
555.8
4.4-7.6
8.3
0.70
d0.52
-0.91
Pacific
Coa
stBo
thsexes
103
8.6
6.9-10
.624
.00.36
d0.29
-0.44
133
6.2
5.2-7.5
23.8
0.26
d0.22
-0.31
Male
7514
.110
.8-18.0
42.0
0.34
d0.26
-0.43
9610
.18.0-12
.641
.80.24
d0.19
-0.30
Female
284.3
2.8-6.2
10.1
0.42
d0.27
-0.62
373.2
2.2-4.4
10.1
0.31
d0.22
-0.44
East
Both
sexes
3811
.98.3-16
.525
.80.46
d0.32
-0.64
131
6.3
5.2-7.5
24.6
0.26
d0.21
-0.31
Male
3022
.814
.6-33.4
44.7
0.51
d0.33
-0.75
9810
.98.6-13
.543
.00.25
d0.20
-0.31
Female
84.4
1.9-8.7
12.0
0.37
d0.15
-0.73
333.0
2.0-4.2
11.1
0.27
d0.18
-0.38
Southw
est
Both
sexes
543.2
2.4-4.2
23.8
0.13
d0.10
-0.18
603.2
2.4-4.2
22.6
0.14
d0.11
-0.19
Male
405.7
4.0-7.8
40.7
0.14
d0.10
-0.19
445.6
4.0-7.6
38.8
0.14
d0.10
-0.20
Female
141.4
0.7-2.3
10.1
0.14
d0.07
-0.23
161.5
0.8-2.4
9.7
0.15
d0.09
-0.25
Total
Both
sexes
518
9.6
8.8-10
.523
.90.40
d0.37
-0.44
693
7.6
7.0-8.2
23.7
0.32
d0.29
-0.34
Male
381
16.5
14.8-18.4
41.5
0.40
d0.36
-0.44
506
12.7
11.5-14.0
41.7
0.31
d0.28
-0.34
Female
137
4.5
3.8-5.3
10.5
0.43
d0.36
-0.51
187
3.7
3.2-4.3
10.6
0.35
d0.30
-0.41
Totaltrans
ition
alce
llBo
thsexes
452
8.3
7.6-9.2
22.2
0.38
d0.34
-0.41
615
6.7
6.1-7.2
22.1
0.30
d0.28
-0.33
Male
344
14.8
13.2-16.6
38.7
0.38
d0.34
-0.43
464
11.6
10.5-12.8
39.0
0.30
d0.27
-0.33
Female
108
3.5
2.9-4.3
9.5
0.37
d0.30
-0.45
151
3.0
2.5-3.5
9.6
0.31
d0.26
-0.36
Source
:Can
cerregistrie
sin
theNationa
lProgram
ofCa
ncer
Registrie
s(N
PCR)
oftheCe
ntersforDisea
seCo
ntrola
ndPrev
entio
nan
d/or
theSu
rveilla
nce,
Epidem
iology,a
ndEn
dRe
sults
(SEE
R)prog
ram
oftheNationa
lCan
cerInstitu
te;s
eeTa
ble1forstates
includ
ed.
CHSD
Aindica
tesCo
ntract
Hea
lthSe
rviceDeliveryAr
eas;
IHS,
Indian
Hea
lthSe
rvice;
AI/A
N,A
merican
Indian
s/Alaska
Natives;C
I,co
nfiden
ceinterval;N
HW,n
on-H
ispa
nicwhites.
aAI/A
Nrace
isrepo
rted
byNPC
Ran
dSE
ERregistrie
sor
throug
hlin
kage
with
theIH
Spa
tient
registratio
nda
taba
se.A
I/AN
person
sof
Hispa
nicorigin
areinclud
ed.
bRa
tesarepe
r10
0,00
0pe
rson
san
dareag
e-ad
justed
tothe20
00USstan
dard
popu
latio
n(19ag
egrou
ps,C
ensu
sP2
5-11
30).
cRa
teratio
sareca
lculated
inSE
ER*Statp
riorto
roun
ding
ofratesan
dmay
note
qual
RRca
lculated
from
ratespresen
tedin
thetable.
dRa
teratio
isstatistic
ally
sign
ifica
nt(P
<.05).
eRa
tesan
drate
ratio
sforAlaska
intheCH
SDAco
untie
ssectionarethesameas
thos
ein
theAllC
ountiessectionbe
caus
eallc
ountiesin
Alaska
areCH
SDAco
untie
s.f Insitu
andinva
sive
casesareinclud
ed.
Urinary Tract Cancer in AI/AN/Wilson et al 1217

TABLE
3Kidne
yPa
renc
hymaCan
cerIn
cide
nceRates
andRateRatios,
byAge
andIn
dian
Hea
lthSe
rviceReg
ionforAmerican
Indian
s/Alask
aNatives
andNon
-Hispa
nicWhites,
CHSD
ACou
nties,
UnitedStates,1
999to
2004
20-49Ye
ars
501
Years
AI/A
NNHW
AI/A
N:N
HW
AI/A
NNHW
AI/A
N:N
HW
IHSReg
ion
Sex
Cou
ntRatea
95%
CI
Cou
ntRatea
95%
CI
RRb
95%
CI
Cou
ntRatea
95%
CI
Cou
ntRatea
95%
CI
RRb
95%
CI
NorthernPlains
Both
sexes
458.6
6.3-11
.581
44.0
3.7-4.3
2.14
b1.55
-2.88
154
71.6
60.1-84.8
5,22
736
.635
.6-37.6
1.96
b1.64
-2.32
Male
259.9
6.4-14
.651
75.1
4.6-5.5
1.96
b1.26
-2.92
9087
.268
.8-109
.53,18
649
.647
.9-51.3
1.76
b1.38
-2.22
Female
207.3
4.5-11
.329
73.0
2.6-3.3
2.48
b1.49
-3.89
6457
.043
.4-73.7
2,04
125
.724
.6-26.9
2.22
b1.68
-2.88
Alaska
Both
sexes
114.3
2.2-7.7
513.6
2.7-4.8
1.20
0.56
-2.33
6663
.848
.8-82.1
202
39.7
34.0-46.2
1.61
b1.18
-2.17
Male
86.4
2.8-12
.630
4.0
2.7-5.8
1.59
0.63
-3.54
4392
.665
.0-128
.514
457
.947
.3-70.1
1.60
b1.07
-2.36
Female
�2.3
0.5-6.8
213.2
2.0-4.9
0.74
0.14
-2.45
2339
.724
.9-60.3
5823
.417
.5-30.7
1.69
0.98
-2.84
Southe
rnPlains
Both
sexes
618.4
6.4-10
.827
03.8
3.3-4.2
2.23
b1.66
-2.95
234
63.6
55.5-72.5
2,15
138
.236
.6-39.8
1.67
b1.45
-1.91
Male
349.7
6.7-13
.518
35.1
4.4-5.9
1.89
b1.27
-2.74
128
73.8
61.2-88.4
1,33
453
.350
.4-56.2
1.39
b1.14
-1.67
Female
277.2
4.7-10
.487
2.4
1.9-3.0
2.95
b1.84
-4.58
106
53.2
43.5-64.5
817
26.1
24.3-27.9
2.04
b1.65
-2.51
Pacific
Coa
stBo
thsexes
444.7
3.4-6.3
1,35
33.6
3.4-3.8
1.29
0.93
-1.74
119
34.2
27.9-41.4
9,05
034
.433
.7-35.1
0.99
0.81
-1.21
Male
275.8
3.8-8.5
870
4.6
4.3-5.0
1.25
0.82
-1.83
6843
.032
.4-56.0
5,76
848
.347
.0-49.5
0.89
0.67
-1.16
Female
173.6
2.1-5.7
483
2.6
2.4-2.9
1.37
0.79
-2.21
5127
.119
.9-36.1
3,28
222
.922
.1-23.7
1.19
0.87
-1.58
East
Both
sexes
94.2
1.9-8.0
980
4.1
3.9-4.4
1.03
0.47
-1.94
3739
.827
.6-55.7
7,20
438
.537
.6-39.4
1.04
0.72
-1.45
Male
�3.8
1.0-9.5
625
5.3
4.8-5.7
0.72
0.20
-1.82
1638
.620
.9-65.9
4,49
554
.753
.1-56.3
0.71
0.38
-1.21
Female
�4.7
1.5-10
.835
53.0
2.7-3.3
1.55
0.50
-3.63
2140
.925
.1-63.2
2,70
925
.524
.5-26.5
1.60
0.98
-2.48
Southw
est
Both
sexes
675.8
4.5-7.4
533
3.5
3.2-3.9
1.64
b1.25
-2.11
268
55.0
48.4-62.3
4,19
534
.133
.1-35.2
1.61
b1.41
-1.83
Male
386.8
4.8-9.4
323
4.3
3.8-4.7
1.61
b1.11
-2.25
165
79.4
67.2-93.1
2,67
547
.045
.2-48.8
1.69
b1.42
-1.99
Female
294.8
3.2-6.9
210
2.8
2.4-3.2
1.72
b1.12
-2.53
103
36.7
29.8-44.7
1,52
023
.222
.0-24.4
1.58
b1.28
-1.94
Total
Both
sexes
237
6.2
5.4-7.1
4,00
13.8
3.7-3.9
1.63
b1.42
-1.86
878
54.3
50.6-58.1
28,029
36.0
35.6-36.5
1.51
b1.40
-1.61
Male
136
7.4
6.2-8.7
2,54
84.8
4.6-5.0
1.52
b1.27
-1.81
510
69.9
63.5-76.7
17,602
50.2
49.4-50.9
1.39
1.27
-1.53
Female
101
5.1
4.2-6.2
1,45
32.8
2.7-2.9
1.84
b1.49
-2.25
368
41.6
37.4-46.2
10,427
24.4
23.9-24.8
1.71
b1.53
-1.90
TotalK
idne
yRC
CBo
thsexes
218
5.7
5.0-6.5
3,60
83.4
3.3-3.5
1.67
b1.45
-1.91
774
47.3
43.9-50.9
23,748
30.6
30.2-31.0
1.55
b1.43
-1.66
Male
128
6.9
5.8-8.3
2,29
44.4
4.2-4.5
1.60
b1.32
-1.91
446
60.4
54.6-66.7
15,058
42.7
42.0-43.4
1.41
b1.28
-1.56
Female
904.6
3.7-5.6
1,31
42.5
2.4-2.7
1.82
b1.45
-2.25
328
36.7
32.8-41.0
8,69
020
.520
.1-21.0
1.79
b1.59
-2.00
APC
APC
APC
APC
TotalK
idne
yAP
CBo
thsexes
237
3.0
28.0-15
.34,00
15.3c
3.1-7.6
878
3.3
22.4-9.3
28,029
3.2c
1.9-4.5
Male
136
5.9
27.6-21
.32,54
85.9c
2.7-9.2
510
3.2
24.8-11
.917
,602
3.0c
0.8-5.2
Female
101
20.4
214
.3-15.8
1,45
34.4c
0.1-8.9
368
3.1
24.4-11
.210
,427
3.5c
2.2-4.8
Source
:Can
cerregistrie
sin
theNationa
lProgram
ofCa
ncer
Registrie
sof
theCe
ntersforDisea
seCo
ntrola
ndPrev
entio
nan
d/or
theSu
rveilla
nce,
Epidem
iology,a
ndEn
dRe
sults
prog
ram
oftheNationa
lCan
cerInstitu
te;s
eeTa
ble1forstates
includ
ed.
CHSD
Aindica
tesCo
ntract
Hea
lthSe
rviceDeliveryAr
eas;
AI/A
N,A
merican
Indian
s/Alaska
Natives;N
HW,n
on-H
ispa
nicwhites;
IHS,
Indian
Hea
lthSe
rvice;
CI,c
onfid
ence
interval;R
R,rate
ratio
;APC
,ann
ualp
erce
ntag
ech
ange
.aRa
tesarepe
r10
0,00
0pe
rson
san
dareag
e-ad
justed
tothe20
00USstan
dard
popu
latio
n(19ag
egrou
ps,C
ensu
sP2
5-11
30).
bRa
teratio
isstatistic
ally
sign
ifica
nt(P
<.05).
cAP
Cis
statistic
ally
sign
ifica
nt(P
<.05).
~Co
unts
less
than
6aresu
ppressed
.
1218 CANCER Supplement September 1, 2008 / Volume 113 / Number 5

females of either age group. Among NHW females
aged 50 years and older, the increase was statistically
significant (3.5% per year). Among AI/AN aged 20
years to 49 years, bladder cancer incidence rates
were highest in the Northern Plains (3.3), Southern
Plains (2.4), and East (1.8) (Table 4). Among NHW
aged 20 years to 49 years, rates were highest in
Alaska (3.4) and the East (3.4). Among individuals
aged 50 years and older, the highest rates occurred
among NHW in Alaska (91.8). Incidence rates were
highest among AI/AN in the Southern Plains (49.2),
Northern Plains (48.2), and Alaska (46.1). Rate ratios
among individuals aged 50 years and older were all
significantly below 1, indicating significantly lower
incidence rates among AI/AN in all regions.
Regional Correlation of Incidence With Smokingand ObesityThe correlation between self-reported tobacco use
and bladder cancer incidence rates in CHSDA coun-
ties was statistically significant (r 5 0.9, P 5 .02) (Ta-
ble 5). The magnitude of this correlation for kidney
cancer incidence rates was not statistically significant
and less pronounced (r 5 0.5, P 5 .30), appearing
somewhat greater among AI/AN females (r 5 0.7, P
5 .15) than AI/AN males (r 5 0.4, P 5 .49). Correla-
tions between incidence and the prevalence of obe-
sity were not statistically significant (data not
shown).
Stage at DiagnosisAI/AN were significantly less likely to have been
diagnosed with earlier stages of cancer (in situ and
localized stage), including both bladder (76.3% vs
82.8%, P 5 .002) and kidney (51.9% vs 58.7%, P 5.001) cancer (Table 6). In addition, a higher propor-
tion of AI/AN were diagnosed with late-stage kidney
cancer compared with NHW (P 5 .026).
DISCUSSION
SummaryCompared with NHW, this study reports that kidney
parenchyma cancer incidence is approximately 1.5-
fold higher among AI/AN overall, and as great as 2.5-
fold higher among females in some regions. Tempo-
ral increases in kidney cancer incidence rates appear
to be comparable among AI/AN and NHW males,
although statistically significant only among NHW
males. Although bladder cancer incidence is signifi-
cantly lower among AI/AN compared with NHW,
there is substantial regional variation among AI/AN
alone, which correlates crudely with tobacco use. For
both cancer sites, AI/AN are less likely to be diag-
nosed with early-stage disease.
Kidney cancerHistologically, most kidney cancers (>80%) are renal
cell carcinomas (RCC), and therefore it is not surpris-
ing that differences between AI/AN and NHW were
similar for RCC compared with all cancers occurring
in the kidney.1 In most regions of the United States,
kidney cancer incidence rates were significantly
higher among AI/AN compared with NHW, and this
relationship was apparent in both younger and older
adult age groups. Smoking, obesity, and hypertension
together are estimated to account for approximately
50% to 60% of kidney cancers.1,20 Obesity alone is
attributed to approximately 25% of kidney cancers.21
AI/AN are more likely to be overweight and/or obese
than NHW.13,18,22-25 However, body mass index among
AI/AN does not vary as considerably as smoking by
region and did not explain well the regional differ-
ences observed among AI/AN in this study.18 Other
factors may be responsible for the 2-fold regional var-
iation in incidence among AI/AN. There is some evi-
dence that the use of diuretics may increase the risk
of kidney cancer in both hypertensive and normoten-
sive individuals.21,26-28 According to the Strong Heart
Study of American Indians in the United States, the
prevalence of the use of diuretics to treat hyperten-
sion among AI/AN may vary as much as 11% to 30%
by study region.29 However, the extent to which the
use of diuretics may contribute to regional variation
in kidney cancer incidence is not known.
A corollary condition to obesity is diabetes. Type
2 diabetes mellitus (‘‘diabetes’’) has been inconsis-
tently associated with an increased risk of RCC, and it
is possible that diabetes contributes to the etiology of
this cancer through increased risk of kidney failure
among diabetics. Studies among kidney dialysis
patients report an increased risk of kidney cancer.30,31
Kidney failure leading to dialysis is more prevalent
among AI/AN with diabetes and may be an important
kidney cancer risk factor among AI/AN.32,33 In addi-
tion, more recent research has focused on the impor-
tance of in utero exposures that may impact kidney
development and function.34 Two studies report that
children of mothers who were diabetic during preg-
nancy are more likely to have reduced diabetes con-
trol (ie, higher HbA1c) and a higher incidence of
kidney disease.35,36 Further research is needed to elu-
cidate the implications of these early life exposures
on later development of cancer.
Several other risk factors have been proposed,
including infections, diet, occupational exposures,
and family history.1,20,37 Approximately 4% of kidney
Urinary Tract Cancer in AI/AN/Wilson et al 1219

TABLE
4Urina
ryBladd
erCan
cera
Incide
nceRates
andRateRatios,
byAge
andIn
dian
Hea
lthSe
rviceReg
ionforAmerican
Indian
s/Alask
aNatives
andNon
-Hispa
nicWhites,
CHSD
ACou
nties,
UnitedStates,1
999to
2004
20-49Ye
ars
501
Years
AI/A
NNHW
AI/A
N:N
HW
AI/A
NNHW
AI/A
N:N
HW
IHSReg
ion
Cou
ntRateb
95%
CI
Cou
ntRateb
95%
CI
RRc
95%
CI
Cou
ntRateb
95%
CI
Cou
ntRateb
95%
CI
RRc
95%
CI
NorthernPlains
173.3
1.9-5.2
597
2.9
2.7-3.2
1.13
0.65
-1.81
7648
.237
.4-61.1
11,265
78.1
76.7-79.6
0.62
c0.48
-0.78
Alaska
�1.6
0.4-4.1
483.4
2.5-4.5
0.47
0.12
-1.28
4146
.132
.5-63.4
405
91.8
82.5-101
.80.50
c0.35
-0.70
Southe
rnPlains
182.4
1.4-3.8
214
2.9
2.6-3.4
0.82
0.48
-1.33
166
49.2
41.8-57.4
3,77
766
.664
.5-68.8
0.74
c0.63
-0.86
Pacific
Coa
st7
0.8
0.3-1.5
1,08
62.9
2.7-3.1
0.26
c0.10
-0.53
9630
.023
.9-37.2
21,723
82.1
81.0-83.2
0.37
c0.29
-0.45
East
�1.8
0.5-4.7
821
3.4
3.2-3.7
0.54
0.15
-1.37
3440
.227
.3-57.0
16,941
87.7
86.4-89.1
0.46
c0.31
-0.65
Southw
est
�0.2
0.0-0.7
436
2.9
2.6-3.2
0.08
c0.02
-0.24
5111
.28.2-14
.810
,017
81.4
79.8-83.0
0.14
c0.10
-0.18
TotalC
HSD
A53
1.4
1.0-1.8
3,20
23.0
2.9-3.1
0.45
c0.34
-0.60
464
32.6
29.6-35.8
64,128
81.5
80.9-82.1
0.40
c0.36
-0.44
Totalb
ladd
erTC
C44
1.1
0.8-1.5
2,95
72.8
2.7-2.9
0.41
c0.30
-0.55
407
28.3
25.5-31.4
59,531
75.7
75.1-76.3
0.37
c0.34
-0.41
APC
APC
APC
APC
Totalb
ladd
erAP
C53
216
.3d
225
.2-2
6.3
3,20
222.9
26.9-1.2
464
21.4
0.4-2
5.2
64,128
20.7d
20.9-20.4
Source
:Can
cerregistrie
sin
theNationa
lProgram
ofCa
ncer
Registrie
sof
theCe
ntersforDisea
seCo
ntrola
ndPrev
entio
nan
d/or
theSu
rveilla
nce,
Epidem
iology,a
ndEn
dRe
sults
prog
ram
oftheNationa
lCan
cerInstitu
te;s
eeTa
ble1forstates
includ
ed.
CHSD
Aindica
tesCo
ntract
Hea
lthSe
rviceDeliveryAr
eas;
AI/A
N,A
merican
Indian
s/Alaska
Natives;N
HW,n
on-H
ispa
nicwhites;
IHS,
Indian
Hea
lthSe
rvice;
CI,c
onfid
ence
interval;R
R,rate
ratio
;TCC
,trans
ition
alce
llca
rcinom
a;AP
C,an
nual
percen
tage
chan
ge.
aIn
situ
andinva
sive
casesareinclud
ed.
bRa
tesarepe
r10
0,00
0pe
rson
san
dareag
e-ad
justed
tothe20
00USstan
dard
popu
latio
n(19ag
egrou
ps,C
ensu
sP2
5-11
30).
cRa
teratio
isstatistic
ally
sign
ifica
nt(P
<.05).
dAP
Cis
statistic
ally
sign
ifica
nt(P
<.05).
~Co
unts
less
than
6aresu
ppressed
.
1220 CANCER Supplement September 1, 2008 / Volume 113 / Number 5

cancers diagnosed in the US are estimated to be
familial,38 and those diagnosed at earlier ages may be
more likely to have a genetic component,39 although
known familial kidney cancer syndromes have not
been described among AI/AN.38,40 Population-based
case-control studies suggest that multiple genetic and
environmental triggers are likely responsible.1
Recent increases in kidney cancer incidence rates
in the United States and abroad over the past few dec-
ades suggest that nongenetic factors are driving kid-
ney cancer trends.41,42 Among AI/AN, cancer of the
kidney is now the fourth most frequently diagnosed
cancer.1,2 The average annual increases in kidney can-
cer incidence among AI/AN and NHW over age 50
years in this study (3.0% to 3.5%) are comparable to
studies from earlier time periods reporting increases
of 1% to 3% annually.1,41,43 The 5.9% average annual
increase among younger adult NHW and AI/AN males
(aged 20 to 49 years) is of concern because of the
magnitude of the annual increase and the morbidity
of this cancer. However, this study involves a relatively
brief time period (6 years), which may or may not be
indicative of longer-term trends.
Kidney cancer incidence is generally 2-fold
higher among males than females.2 However, we
report that AI/AN females in some regions have inci-
dence rates closer to those of AI/AN males. Certain
exposures, including tobacco use and pregnancy, can
increase oxidative stress on the kidney, which may
be a common pathway increasing cancer risk.44 At
least 2 large cohort studies report an increased risk
of renal cell cancer among females with higher par-
ity, compared with nulliparous females.45,46 This sug-
gests that AI/AN females with higher parity may also
be at increased risk of kidney cancer.
Bladder cancerPrevious studies report lower bladder cancer inci-
dence and mortality among AI/AN than in other
populations.2,3,47 In the US, smoking is the major
risk factor for cancers of the bladder, and it may
account for approximately 70% of new bladder can-
cer cases among males and 20% to 30% among
females.20,48 In our study, among both males and
TABLE 6Urinary Bladdera and Kidney Parenchyma Cancer Incidence Rates and Percentage Distributions by Stageb and Indian Health Service Region forAmerican Indians/Alaska Natives and Non-Hispanic Whites, CHSDA Counties, United States, 2001 to 2003
Regional Distant Unstaged
Localized Race Count Ratec 95% CI
% of
Casesd Count Ratec 95% CI
% of
Casesd Count Ratec95%
CI
% of
Casesd Count Ratec95%
CI
% of
Casesd
Urinary
bladder AI/AN 200 7.1 6.1-8.2 76.3 23 0.8 0.5-1.3 8.6 12 0.4 0.2-0.8 4.3 23 0.9 0.6-1.4 9.7
NHW 27,929 19.7 19.4-19.9 82.8 2,611 1.8 1.8-1.9 7.6 1,063 0.7 0.7-0.8 2.9 2,200 1.5 1.5-1.6 6.3
P .002 .691 .123 .364
Kidney
parenchyma
AI/AN
310 9.4 8.4-10.6 51.9 83 2.5 1.9-3.1 13.8 130 4.0 3.3-4.8 22.1 62 2.1 1.6-2.8 11.6
NHW 9,665 7.1 6.9-7.2 58.7 2,597 1.9 1.8-1.9 15.7 3,015 2.2 2.1-2.2 18.2 1,471 1.0 1.0-1.1 8.3
P .001 .548 .026
Source: Cancer registries in the National Program of Cancer Registries of the Centers for Disease Control and Prevention and/or the Surveillance, Epidemiology, and End Results (SEER) program of the National
Cancer Institute; see Table 1 for states included.
CHSDA indicates Contract Health Service Delivery Areas; CI, confidence interval; AI/AN, American Indians/Alaska Natives; NHW, non-Hispanic whites.a In situ urinary bladder cases were included.b SEER Summary Stage 2000 was used.c Rates are per 100,000 persons and are age-adjusted to the 2000 US standard population (19 age groups, Census P25-1130).d Percentage stage distribution is age-adjusted to the 2000 US standard population; percentageages may not add to 100% due to rounding.
TABLE 5Regional Correlation of Cancer Incidence Rates (1999 to 2004) WithSelf-Reported Tobacco Use (BRFSS 2000 to 2006) Among AmericanIndian and Alaska Natives, CHSDA Counties, United States
Correlation Coefficient
Tobacco Use Urinary Bladdera (P) Kidney Parenchyma (P)
Both sexes .9 (.02) .5 (.30)
Male .9 (.01) .4 (.49)
Female .8 (.07) .7 (.15)
Source: Cancer registries in the National Program of Cancer Registries of the Centers for Disease
Control (CDC) and Prevention and the Surveillance, Epidemiology, and End Results program of the
National Cancer Institute (see Table 1 for states included); CDC’s BRFSS.
BRFSS indicates Behavioral Risk Factor Surveillance System; CHSDA, Contract Health Service Deliv-
ery Areas.a In situ and invasive cases are included.
Urinary Tract Cancer in AI/AN/Wilson et al 1221
females, approximately 90% of the regional variation
in bladder cancer among AI/AN was correlated with
tobacco use. The Behavioral Risk Factor Surveillance
System for years 2000 to 2006 reports higher smoking
prevalence among AI/AN in the Northern Plains
(40.1%), Alaska (39.4%), and the East (36.3%), regions
that also have higher bladder cancer incidence among
AI/AN.18 Consistent with this smoking pattern, Inuit
populations (Alaska, Canada, and Greenland) and
American Indians of the Northern Plains also have a
high incidence of lung cancer that exceeds rates
among NHW by 30% to 60%.3,49,50 Given the higher
incidence of lung cancer and higher prevalence of
smoking among AI/AN, the comparative deficit of
bladder cancer among AI/AN is somewhat enigmatic.
Further complicating this picture are other studies
that suggest that diabetes, again more prevalent
among AI/AN, may increase the risk of bladder can-
cer.51,52 These contrasting patterns suggest the need to
understand intervening factors that may affect the risk
of bladder cancer. Several case-control studies have
identified an elevated risk of bladder cancer among
certain occupations, including those in the rubber,
chemical, leather, metal, printing, painting, textile, and
truck driving industries. Occupational exposures
account for approximately 5% to 25% of bladder can-
cer cases among males and 8% to 11% among
females, although the proportion of AI/AN with expo-
sure to occupational bladder carcinogens is not
known.48
Other possible risks for bladder cancer include
family history, exposure to cyclophosphamide, ioniz-
ing radiation, arsenic, disinfection by-products con-
tained in chlorinated drinking water, and decreased
fluid intake.20 Individuals with a first primary bladder
cancer are at approximately 4-fold increased risk of a
secondary bladder cancer.37 Finally, there may be
molecular studies suggest important genes related to
bladder cancer susceptibility, although the preva-
lence of at-risk or protective genetic polymorphisms
among AI/AN populations is not known.53
Strengths and LimitationsStrengthsThis is the first study to identify broad regional pat-
terns of urologic cancers among the AI/AN population
on a national scale. Misclassification of AI/AN race
and ethnicity was reduced by linkage to the IHS
patient registration records and limiting the analysis
to CHSDA counties. Other statistics, such as survival
and stage at diagnosis, were similar in CHSDA and
non-CHSDA areas (data not presented here), suggest-
ing that the CHSDA areas provide a reasonable repre-
sentation of cancer cases, while at the same time
reducing misclassification of AI/AN race and ethnicity.
LimitationsIt is possible that regions with fewer reservation
land-based tribes, such as the East and Pacific Coast,
may have had greater misclassification of AI/AN race
and ethnicity than when compared with regions such
as the Northern Plains and Southwest, which would
result in lower than actual incidence rates among AI/
AN. For example, we did not observe an excess of
kidney cancer in these regions, whereas we did
observe an excess among AI/AN in all other regions.
Although AI/AN patients must return to a CHSDA to
become eligible for contract care services (eg, for
cancer treatment) through the Indian Health Service,
it is likely that a significant proportion do not. Efforts
to improve the classification of race and ethnicity in
these areas will still be important.
Our study could not account for increased medi-
cal surveillance in detecting cancer that may result
in a higher rate of case identification among some
individuals. For example, the assessment of certain
types of cancer—particularly multiple low-grade
bladder cancers—may be lower among AI/AN popu-
lations that reside in rural regions further from medi-
cal care. In addition, SEER summary staging
combines in situ and local-stage bladder cancer for
the staging systems used during the time period of
this study. It is possible that there are more subtle
differences in in situ versus invasive cancer stages
that could not be analyzed by this study.
ConclusionsOur study highlights major differences in bladder
and kidney cancer incidence rates between AI/AN
and NHW populations in the United States. AI/AN
have significantly higher kidney cancer incidence,
with recent increases evident for both AI/AN and
NHW. Despite the finding that bladder cancer inci-
dence among AI/AN is about half that of NHW, re-
gional incidence rates among AI/AN alone correlate
crudely with tobacco use. These results, combined
with the higher prevalence of late-stage bladder and
kidney cancers among AI/AN, emphasize the need
for sustained efforts to prevent smoking and reduce
obesity.
REFERENCES1. Moore LE, Wilson RT, Campleman SL. Lifestyle factors,
exposures, genetic susceptibility and renal cell cancer risk:
a review. Cancer Invest. 2005;23:240-255.
1222 CANCER Supplement September 1, 2008 / Volume 113 / Number 5

2. Espey DK, Wu XC, Swan J, et al. Annual report to the
nation on the status of cancer, 1975-2004, featuring cancer
in American Indians and Alaska Natives. Cancer. 2007;110:
2119-2152.
3. Espey D, Paisano R, Cobb N. Regional patterns and trends
in cancer mortality among American Indians and Alaska
Natives, 1990-2001. Cancer. 2005;103:1045-1053.
4. Frost F, Taylor V, Fries E. Racial misclassification of Native
Americans in a surveillance, epidemiology, and end results
cancer registry. J Natl Cancer Inst. 1992;84:957-962.
5. Sugarman JR, Holliday M, Ross A, Castorina J, Hui Y.
Improving American Indian Cancer Data in the Washing-
ton State Cancer Registry using linkages with the Indian
Health Service and tribal records. Cancer. 1996;78(7
suppl):1564-1568.
6. Partin MR, Rith-Najarian SJ, Slater JS, Korn JE, Cobb N,
Soler JT. Improving cancer incidence estimates for Ameri-
can Indians in Minnesota. Am J Public Health. 1999;89:
1673-1677.
7. Foote M, Matloub J, Strickland R, Stephenson L, Vaughan-
Batten H. Improving cancer incidence estimates for Ameri-
can Indians in Wisconsin. WMJ. 2007;106:196-204.
8. Espey DK, Wiggins CL, JimMA,Miller BA, Johnson CJ, Becker
TM. Methods for improving cancer surveillance data in
American Indian and Alaska Native Populations. Cancer.
2008;113(5 suppl):1120-1130.
9. Fritz A, Percy C, Jack A. International classification of dis-
eases of oncology. Geneva, Switzerland: World Health Orga-
nization; 2000.
10. Diaz JI, Mora LB, Hakam A. The Mainz classification of re-
nal cell tumors. Cancer Control. 1999;6:571-579.
11. World Health Organization. International classification of
diseases for oncology. 3rd ed. Geneva, Switzerland: WHO;
2000.
12. North American Association of Central Cancer Registries,
Logistics Requirements Working Group. NAACCR guideline
for enhancing Hispanic/Latino identification: Revised
NAACCR Hispanic/Latino identification algorithm [NHIA
v2]. Springfield, IL: North American Association of Central
Cancer Registries; 2005.
13. Denny CH, Holtzman D, Cobb N. Surveillance for health
behaviors of American Indians and Alaska Natives. Find-
ings from the Behavioral Risk Factor Surveillance System,
1997-2000. MMWR Surveill Summ. 2003;52:1-13.
14. Jim MA, Espey DK, Wiggins CL, Cobb N, Wingo PA. Racial
misclassification of American Indians residing near IHS
facilities. Poster P-47, Final Program and Abstracts. Pre-
sented at the North American Association of Central Can-
cer Registries Conference, Regina, Saskatchewan, Canada,
June 10-16, 2006.
15. National Cancer Institute, Surveillance Research Program,
Cancer Statistics Branch. SEER*Stat software. 2007. Avail-
able at: http://www.seer.cancer.gov/seerstat Accessed on
July 12, 2008.
16. Ingram DD, Parker JD, Schenker N, et al. United States
Census 2000 population with bridged race categories. Vital
Health Stat 2. September 2003:1-55.
17. Shryock HS, Siegel JS. The methods and materials of
demography. New York, NY: Academic Press; 1976.
18. Steele CB, Cardinez CJ, Richardson LC, Tom-Orme L, Shaw
K. Surveillance for health behaviors of American Indians
and Alaska Natives—findings from the Behavioral Risk Fac-
tor Surveillance System, 2000-2006. Cancer 2008;113(5
suppl):1131-1141.
19. Phillips JL. Summary stage: data effects of the changes in
2000, vol. Springfield, IL: North American Association of
Central Cancer Registries; 2003. Available at: http://
www.naaccr.org Accessed on July 12, 2008.
20. Scelo G, Brennan P. The epidemiology of bladder and kid-
ney cancer. Nat Clin Pract Urol. 2007;4:205-217.
21. Chow WH, Devesa SS, Moore LE. Epidemiology of renal
cell carcinoma. In: Vogelzang NJ, Scardino PJ, Shipley WU,
F.M.J. D, W.M. L, eds. Comprehensive textbook of genitou-
rinary oncology. 2nd ed. Philadelphia, PA: Lippincott
Williams & Wilkins, 2004:110.
22. Doshi SR, Jiles R. Health behaviors among American
Indian/Alaska Native women, 1998-2000 BRFSS. J Womens
Health (Larchmt). 2006;15:919-927.
23. Xu J, Eilat-Adar S, Loria CM, et al. Macronutrient intake
and glycemic control in a population-based sample of
American Indians with diabetes: the Strong Heart Study.
Am J Clin Nutr. 2007;86:480-487.
24. Quandt SA, Bell RA, Snively BM, et al. Ethnic disparities in
glycemic control among rural older adults with type 2 dia-
betes. Ethn Dis. 2005;15:656-663.
25. Story M, Stevens J, Himes J, et al. Obesity in American-In-
dian children: prevalence, consequences, and prevention.
Prev Med. 2003;37(6 pt 2):S3-S12.
26. Flaherty KT, Fuchs CS, Colditz GA, et al. A prospective
study of body mass index, hypertension, and smoking and
the risk of renal cell carcinoma (United States). Cancer
Causes Control. 2005;16:1099-1106.
27. Setiawan VW, Stram DO, Nomura AM, Kolonel LN, Hender-
son BE. Risk factors for renal cell cancer: the multiethnic
cohort. Am J Epidemiol. 2007;166:932-940.
28. Grossman E, Messerli FH, Goldbourt U. Antihypertensive
therapy and the risk of malignancies. Eur Heart J. 2001;
22:1343-1352.
29. Hayslett JA, Eichner JE, Yeh JL, et al. Hypertension treat-
ment patterns in American Indians: the strong heart study.
Am J Hypertens. 2001;14(9 pt 1):950-956.
30. Stewart JH, Buccianti G, Agodoa L, et al. Cancers of the
kidney and urinary tract in patients on dialysis for end-
stage renal disease: analysis of data from the United States,
Europe, and Australia and New Zealand. J Am Soc Nephrol.
2003;14:197-207.
31. Kalantar-Zadeh K, Kopple JD. Obesity paradox in patients
on maintenance dialysis. Contrib Nephrol. 2006;151:57-69.
32. Narva AS. The spectrum of kidney disease in American
Indians. Kidney Int Suppl. February 2003:S3-S7.
33. Lemley KV. A basis for accelerated progression of diabetic
nephropathy in Pima Indians. Kidney Int Suppl. February
2003:S38-S42.
34. Chugh SS, Wallner EI, Kanwar YS. Renal development in
high-glucose ambience and diabetic embryopathy. Semin
Nephrol. 2003;23:583-592.
35. Nelson RG, Morgenstern H, Bennett PH. Intrauterine dia-
betes exposure and the risk of renal disease in diabetic
Pima Indians. Diabetes. 1998;47:1489-1493.
36. Bunt JC, Tataranni PA, Salbe AD. Intrauterine exposure to
diabetes is a determinant of hemoglobin Ac and systolic
blood pressure in pima Indian children. J Clin Endocrinol
Metab. 2005;90:3225-3229.
37. Wilson RT, Silverman DK, Fraumeni JF, Curtis R. New
malignancies following cancer of the bladder, renal pelvis
and kidney. Multiple primaries in cancer survivors.
National Cancer Institute monograph. Bethesda, MD:
National Cancer Institute; 2007.
Urinary Tract Cancer in AI/AN/Wilson et al 1223

38. Cohen D, Zhou M. Molecular genetics of familial renal cell
carcinoma syndromes. Clin Lab Med. 2005;25:259-277.
39. Pavlovich CP, Schmidt LS, Phillips JL. The genetic basis of re-
nal cell carcinoma.Urol Clin North Am. 2003;30:437-454, vii.
40. Linehan WM, Walther MM, Zbar B. The genetic basis
ofcancer of the kidney. J Urol. 2003;170(6 pt 1):2163-2172.
41. Chow WH, Devesa SS, Warren JL, Fraumeni JF Jr. Rising
incidence of renal cell cancer in the United States. JAMA.
1999;281:1628-1631.
42. Mathew A, Devesa SS, Fraumeni JF Jr, Chow WH. Global
increases in kidney cancer incidence, 1973-1992. Eur J
Cancer Prev. 2002;11:171-178.
43. Hayat MJ, Howlader N, Reichman ME, Edwards BK. Cancer
statistics, trends, and multiple primary cancer analyses
from the Surveillance, Epidemiology, and End Results
(SEER) program. Oncologist. 2007;12:20-37.
44. Gago-Dominguez M, Castelao JE. Lipid peroxidation and
renal cell carcinoma: further supportive evidence and new
mechanistic insights. Free Radic Biol Med. 2006;40:721-733.
45. Kabat GC, Silvera SA, Miller AB, Rohan TE. A cohort study
of reproductive and hormonal factors and renal cell cancer
risk in women. Br J Cancer. 2007;96:845-849.
46. Lambe M, Lindblad P, Wuu J, Remler R, Hsieh CC. Preg-
nancy and risk of renal cell cancer: a population-based
study in Sweden. Br J Cancer. 2002;86:1425-1429.
47. Kelly JJ, Lanier AP, Alberts S, Wiggins CL. Differences in
cancer incidence among Indians in Alaska and New Mex-
ico and U.S. Whites, 1993-2002. Cancer Epidemiol Biomar-
kers Prev. 2006;15:1515-1519.
48. Silverman DT, Devesa SS, Moore LE, Rothman N. Bladder
cancer. In: Schottenfeld D, Fraumeni JF Jr, eds. Cancer epi-
demiology and prevention. 3rd ed. New York, NY: Oxford
University Press; 2006.
49. Lanier AP, Kelly JJ, Maxwell J, McEvoy T, Homan C. Cancer
in Alaska Native people, 1969-2003. Alaska Med. 2006;
48:30-59.
50. Bliss A, Cobb N, Solomon T, Cravatt K, Marshall L, Campbell
J. Lung cancer incidence among American Indians and
Alaska Natives in the United States, 1999-2004. Cancer.
2008;113(5 suppl):1168-1178.
51. Tripathi A, Folsom AR, Anderson KE. Risk factors for uri-
nary bladder carcinoma in postmenopausal women. The
Iowa Women’s Health Study. Cancer. 2002;95:2316-2323.
52. Larsson SC, Orsini N, Brismar K, Wolk A. Diabetes mellitus
and risk of bladder cancer: a meta-analysis. Diabetologia.
2006;49:2819-2823.
53. Garcia-Closas M, Malats N, Silverman D, et al. NAT2 slow
acetylation, GSTM1 null genotype, and risk of bladder can-
cer: results from the Spanish Bladder Cancer Study and
meta-analyses. Lancet. 2005;366:649-659.
1224 CANCER Supplement September 1, 2008 / Volume 113 / Number 5