High-resolution scanning tunneling microscopy investigation of the (12110) and (10000) two-fold...
11
ONG ET AL . VOL. 7 ’ NO. 10 ’ 8529–8539 ’ 2013 www.acsnano.org 8529 September 11, 2013 C 2013 American Chemical Society High-Resolution Scanning Tunneling Microscopy Characterization of Mixed Monolayer Protected Gold Nanoparticles Quy Khac Ong, † Javier Reguera, † Paulo Jacob Silva, † Mauro Moglianetti, † Kellen Harkness, † Maria Longobardi, ‡ Kunal S. Mali, § Christoph Renner, ‡ Steven De Feyter, § and Francesco Stellacci †, * † Institute of Materials, Ecole Politechnique Fédérale de Lausanne, Lausanne, Switzerland, ‡ Department of Condensed Matter Physics, University of Geneva, Geneva, Switzerland, and § Department of Chemistry, Division of Molecular Imaging and Photonics, KU LeuvenUniversity of Leuven, Celestijnenlaan 200F, 3001 Leuven, Belgium M onolayer-protected nanoparticles (NPs) consist of a core protected by a supramolecularly assembled ligand shell of small molecules or macro- molecules. Gold nanoparticles coated with a self-assembled monolayer (SAM) of thiolate molecules have found a large number of potential applications, ranging from drug delivery to catalysis. 1,2 The ligand shell de- termines a large fraction of the particles' properties. Frequently, the ligand shell is composed of multiple types of molecules, each one providing the NPs with a certain set of properties. 3,4 Sometimes properties are not simply additive, and the presence of more than one ligand type in the ligand shell imparts novel properties to the nano- particles. 5,6 This happens because ligand mol- ecules arrange in patches when forming the ligand shell, leading to structure-dependent properties, such as interfacial energy 5 or solubility. 7 Weiss and co-workers used scanning tunneling microscopy (STM) to show that binary mixtures of dissimilar thiol molecules form domains when coassembling onto flat Au surfaces. 8 Some of us used STM to dis- cover the same effect in the ligand shell of Au NPs. 9,10 On a flat surface, these domains tend to have a wide size distribution and varied shapes. 8,1116 Once constrained on NP surfaces, these domains adopt various morphologies based on the identity of the ligands and the NP core size. 17,18 In particu- lar, 2:1 and 1:1 mixtures of dissimilar mol- ecules coassembled on ∼5 nm diameter Au NPs were found to form stripe-like domains with a characteristic width of ∼1 nm. 9,10 The first reports of stripe-like domains on mixed-monolayer-protected Au NPs were * Address correspondence to francesco.stellacci@epfl.ch. Received for review May 13, 2013 and accepted September 11, 2013. Published online 10.1021/nn402414b ABSTRACT Gold nanoparticles protected by a binary mixture of thiolate molecules have a ligand shell that can spontaneously separate into nanoscale domains. Complex morphologies arise in such ligand shells, including striped, patchy, and Janus domains. Characterization of these morphologies remains a challenge. Scanning tunneling microscopy (STM) imaging has been one of the key approaches to determine these structures, yet the imaging of nanoparticles' surfaces faces difficulty stemming from steep surface curvature, complex molecular structures, and the possibility of imaging artifacts in the same size range. Images obtained to date have lacked molecular resolution, and only domains have been resolved. There is a clear need for images that resolve the molecular arrangement that leads to domain formation on the ligand shell of these particles. Herein we report an advance in the STM imaging of gold nanoparticles, revealing some of the molecules that constitute the domains in striped and Janus gold nanoparticles. We analyze the images to determine molecular arrangements on parts of the particles, highlight molecular “defects” present in the ligand shell, show persistence of the features across subsequent images, and observe the transition from quasi- molecular to domain resolution. The ability to resolve single molecules in the ligand shell of nanoparticles could lead to a more comprehensive understanding of the role of the ligand structure in determining the properties of mixed-monolayer-protected gold nanoparticles. KEYWORDS: scanning tunneling microscopy . STM . striped nanoparticles . Janus nanoparticles . self-assembled monolayer . SAM ARTICLE
-
Upload
independent -
Category
Documents
-
view
1 -
download
0
Transcript of High-resolution scanning tunneling microscopy investigation of the (12110) and (10000) two-fold...

ONG ET AL . VOL. 7 ’ NO. 10 ’ 8529–8539 ’ 2013
www.acsnano.org
8529
September 11, 2013
C 2013 American Chemical Society
High-Resolution Scanning TunnelingMicroscopy Characterization of MixedMonolayer Protected GoldNanoparticlesQuy Khac Ong,† Javier Reguera,† Paulo Jacob Silva,† Mauro Moglianetti,† Kellen Harkness,†
Maria Longobardi,‡ Kunal S. Mali,§ Christoph Renner,‡ Steven De Feyter,§ and Francesco Stellacci†,*
†Institute of Materials, �Ecole Politechnique Fédérale de Lausanne, Lausanne, Switzerland, ‡Department of Condensed Matter Physics, University of Geneva, Geneva,Switzerland, and §Department of Chemistry, Division of Molecular Imaging and Photonics, KU Leuven�University of Leuven, Celestijnenlaan 200F, 3001 Leuven, Belgium
Monolayer-protected nanoparticles(NPs) consist of a core protectedby a supramolecularly assembled
ligand shell of small molecules or macro-molecules. Gold nanoparticles coatedwith aself-assembled monolayer (SAM) of thiolatemolecules have found a large number ofpotential applications, ranging from drugdelivery to catalysis.1,2 The ligand shell de-termines a large fraction of the particles'properties. Frequently, the ligand shell iscomposed of multiple types of molecules,each one providing the NPs with a certainset of properties.3,4 Sometimes propertiesare not simply additive, and the presenceof more than one ligand type in the ligandshell imparts novel properties to the nano-particles.5,6 This happens because ligandmol-ecules arrange in patches when forming theligand shell, leading to structure-dependent
properties, such as interfacial energy5 orsolubility.7
Weiss and co-workers used scanningtunneling microscopy (STM) to show thatbinary mixtures of dissimilar thiol moleculesform domains when coassembling onto flatAu surfaces.8 Some of us used STM to dis-cover the same effect in the ligand shell ofAu NPs.9,10 On a flat surface, these domainstend to have a wide size distribution andvaried shapes.8,11�16 Once constrained onNP surfaces, these domains adopt variousmorphologies based on the identity of theligands and the NP core size.17,18 In particu-lar, 2:1 and 1:1 mixtures of dissimilar mol-ecules coassembled on ∼5 nm diameter AuNPs were found to form stripe-like domainswith a characteristic width of ∼1 nm.9,10
The first reports of stripe-like domains onmixed-monolayer-protected Au NPs were
* Address correspondence [email protected].
Received for review May 13, 2013and accepted September 11, 2013.
Published online10.1021/nn402414b
ABSTRACT Gold nanoparticles protected by a binary mixture of thiolate molecules have a ligand
shell that can spontaneously separate into nanoscale domains. Complex morphologies arise in such
ligand shells, including striped, patchy, and Janus domains. Characterization of these morphologies
remains a challenge. Scanning tunneling microscopy (STM) imaging has been one of the key approaches
to determine these structures, yet the imaging of nanoparticles' surfaces faces difficulty stemming from
steep surface curvature, complex molecular structures, and the possibility of imaging artifacts in the
same size range. Images obtained to date have lacked molecular resolution, and only domains have been
resolved. There is a clear need for images that resolve the molecular arrangement that leads to domain
formation on the ligand shell of these particles. Herein we report an advance in the STM imaging of gold
nanoparticles, revealing some of the molecules that constitute the domains in striped and Janus gold
nanoparticles. We analyze the images to determine molecular arrangements on parts of the particles,
highlight molecular “defects” present in the ligand shell, show persistence of the features across subsequent images, and observe the transition from quasi-
molecular to domain resolution. The ability to resolve single molecules in the ligand shell of nanoparticles could lead to a more comprehensive
understanding of the role of the ligand structure in determining the properties of mixed-monolayer-protected gold nanoparticles.
KEYWORDS: scanning tunneling microscopy . STM . striped nanoparticles . Janus nanoparticles . self-assembled monolayer . SAM
ARTIC
LE

ONG ET AL . VOL. 7 ’ NO. 10 ’ 8529–8539 ’ 2013
www.acsnano.org
8530
followed by in-depth STM image analysis10 and statis-tical validation.19 In a separate work, a power spectraldensity method to analyze these images has beendeveloped, and it has established that identical infor-mation can be extracted from images taken in differentlaboratories, further confirming the validity of theseimages.20 The existence of patchy ligand shell morphol-ogy has also been supported by atomic force micro-scopy,5 infrared spectroscopy,21 nuclear magneticresonance spectroscopy,22,23 matrix-assisted laserdesorption/ionization ion mobility mass spectrometry(MALDI-IM-MS),24 and electron spin resonance (ESR)spectroscopy.25,26
Glotzer and co-workers have shown through coarse-grained and molecular dynamics simulations thatthe stripe morphology forms because of an interplaybetween the enthalpy of phase separation anda conformational entropy that arises when longermolecules are at a domain boundary with shorterones.27,28 These conclusions were recently supportedby other simulations performed on cylindrical surfacesby Glotzer29,30 and others.31,32
Nanoparticles coated with striped domains havemany unique structure-dependent properties thatmainly derive from their interfacial interactions5,7,33
or the presence of two polar topological defect pointsthat can be chemically modified.34,35 Some of theseproperties have led to novel applications; for example,some striped particles have been shown to sponta-neously fuse with lipid bilayers36 and penetrate cellmembranes,37�39 leading to unconventional drug de-livery approaches.40 Recently striped nanoparticleshave been used as ultrasensitive and selective methylmercury sensors.41 It is reasonable to predict thatmanyother properties and applications could possibly stemfrom the unique amphiphilic arrangements of ligandmolecules on the surface of nanoparticles, which areprevalently observed in biology.To date, experimental images and spectroscopic
data on patchy particles have elucidated the presenceof domains, but not the ligands arrangement thathas been shown only for homoligand-protected NPs,where it has been found to have a characteristicnearest neighbor spacing of ∼0.5 nm.42 This spacingclosely resembles the spacing known to form onflat gold surfaces for the same molecules43�45 andis consistent with what has been found for small,atomically monodisperse Au102(SC6H4COOH)44 clus-ters using single-crystal X-ray data.46 In particular,structures of self-assembled monolayers on flat goldsurfaces are extensively studied and reported.47,48 It isknown that on Au(111) octanethiols form a few super-lattices (e.g., c(4�2)) stemming from the
√3�√
3 R30�reconstruction.47 This basic reconstruction (with a lat-tice spacing of 0.5 nm) is shared also by many otherthiolatemolecules, such asmercaptopropionic acid andmercaptoundecanol.43,48 Shorter thiolate molecules
tend to show a similar reconstruction but often havealso other distorted lattices with lattice parametersthat can stretch up to slightly more than 0.6 nm.47 Onother Au planes the arrangement of the molecules canchange: for example, octanethiol forms a distortedhexagonal cell with a = 0.6 nm and b = 0.477 nm onAu(100).48 Given that it has been reported that facets onthiolate ligandprotected nanoparticles aremostly (111)and (100), it is reasonable to expect that self-assembledmonolayers have arrangements similar to the onesdescribed above.49 This observation together with anunderstanding that curvature10,30 and line defects4,28
are more prominent on particles than on surfaces leadsto a conclusion that for all of the molecules studiedin this paper it is reasonable to expect a spacing inthe monolayer in a range from 0.4 to 0.7 nm. It shouldbe pointed out that the mechanism of SAM formationon these particles is substantially different than thatof formation on flat surfaces,24,50 with the moleculesassociating first to Au atoms in solution and then tothenanoparticles, thus establishing a complex interplaybetween the SAM structure and the gold's core struc-ture. Here we demonstrate high-resolution imagingof mixed-monolayer-protected gold NPs. We presentthe first quasi-molecular resolution images of stripedparticles together with image analysis detailing robust-ness of the measurements across different laboratoriesand microscopes.
RESULTS AND DISCUSSION
In this paper we imaged three types of Au NPs. Thefirst type was coated with a mixture of 11-mercapto-1-undecanol (C11ol) and 4-mercapto-1-butanol (C4ol),hereafter calledNP1. The second type was coated withamixture of 1-octanethiol (C8) andmercaptopropionicacid (C2COOH), hereafter called NP2. The third type ofparticles was coated onlywith C8, hereafter calledNP3.Figure 1 displays a typical STM image of the NP1
sample, in which multiple particles showing stripe-likepatterns are identifiable. Inset 1c is a digital zoom of astriped particle whose visual illustration is shown in theinset 1b. This striped structure bears features similar tothose previously reported,9,10 specifically an interstripedistance of ∼1.0 nm that does not vary significantlywith scanning speeds (ranging from 0.36 to 0.92 μm/s,as illustrated by the power spectral density (PSD)analysis in Figure S1 in the Supporting Information).Figure 2 shows a high-resolution STM image of NP1
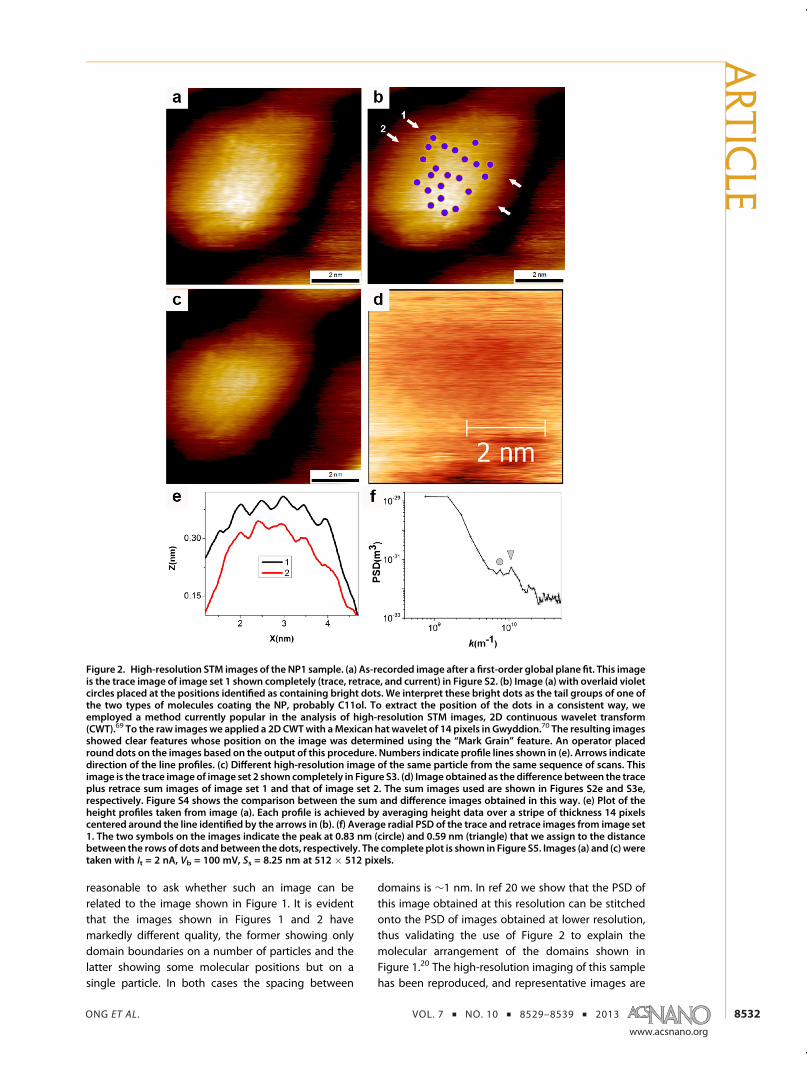
recorded at a bias of þ100 mV and a current set pointof 1.0 nA, with the highest data density available inour Bruker Multimode microscope (512 � 512 pixels).The image was acquired on the same sample usedto record the image shown in Figure 1. The image isshown without processing except for a linear globalplane fit. In Figure 2a the presence of brighter dotsis immediately evident. On the basis of previousliterature on STM of flat SAMs and of homoligand
ARTIC
LE

ONG ET AL . VOL. 7 ’ NO. 10 ’ 8529–8539 ’ 2013
www.acsnano.org
8531
particles,42,43,51,52 we interpret these dots as corre-sponding to the tail groups (�OH) of the ligandspresent on NP1. A visual analysis of the image showsthat these dots are aligned with a characteristiccenter-to-center spacing of ∼0.5 nm along the lineand ∼1.0 nm between two consecutive lines, in goodagreement with what is shown in Figure 1 and withprevious reports.9,10 Figure 2b shows the same imageshown in Figure 2a with circles marking the dot posi-tions. To validate our conclusions on the molecularpositions, we show scan lines taken on the originalimage. The arrows in Figure 2b are visual aids thatmarkthe beginning and the end of the scan lines shown inFigure 2e. A radial PSD analysis of this image (Figure 2f)shows two peaks, one at 0.83 nm and the other at0.59 nm, confirming the visual analysis. The moleculartail groups visible as dots in this image are not the onlyligands present in this sector of the NP. The densityof the brighter ligand (∼2 molecules/nm2) is roughlyhalf of that expected for a thiolate monolayer ona gold nanoparticle and of the one measured forthese particles via thermal gravimetric analysis (TGA,∼4.5 molecules/nm2, see Experimental Section), lead-ing to the conclusion that there are other “hidden”ligands in between the ones that are visible as dots.This is expected from STM images of NPs coated with acombination of ligand molecules with a length differ-ence of 7 methylene units.In the same sequence of scans used to record
Figure 2a, another high-resolution image of NP1 wassuccessfully acquired; it is shown in Figure 2c. Traceand retrace topographies and current images for thesetwo sets of images of this particle can be foundin Figures S2 and S3 in the Supporting Information.
Dots marking the tail group positions for these imagesshow a remarkable persistence of these features.Compared to Figure 2a, a small fraction of the dotshas moved slightly. It is known that thiolate moleculeson gold surfaces have translational mobility53,54 but ona time scale much longer than the acquisition timeof these images; hence we rule out significant changes inmolecular position. Yet STM is sensitive to molecularconformation;55�57 hence the small variations that weobserve in the images are ascribed to changes in localmolecular conformation, which should to be expectedgiven the free volumeavailable to themolecules. Someofthese conformational changesmaybedue to tip�sample(i.e., ligands) interactions. To extract variations in theimages, we employed image difference as a tool todetermine relative variations. In Figure S2dwe show thedifference between the trace image shown in Figure 2aand its retrace. The image is basically featureless. Asimilar conclusion can be reached for the image shownin Figure 2c (difference image shown in Figure S3d).In Figure 2dwe show the difference between the imagesets shown in Figure 2a and c (and Figures S2 and S3).Also in this case the comparison between successiveimages is practically featureless, showing somethingonly in the bottom left part.We interpret the bright dots evident in the images
to correspond to the tail groups of the longer C11olligands. Their movement, which is expected to beperpendicular to the stripe direction (i.e., the directionwith the most free volume), should hinder effectiveimaging of the shorter C4ol.28 This interpretation issupported by the presence of “shadows” perpendicularto the stripes, indicating molecular movement alongthis direction, in good agreement with Glotzer'stheory.28 Yet, were the interpretation to be inverted(the bright dots being C4ol), nothing would change interms of the main conclusion of this paper, which dealswith the formation of separated ligand domains.The nearest-neighbor distance of∼0.5 nm of the tail
groups observed along the stripe direction is commen-surate with values of intermolecular distances mea-sured on homoligand particles10,42 and the distancebetween thiolated molecules on a flat surface.43 Thesuggested geometry of rows of molecules spaced∼0.5 nm along the stripe and ∼1 nm perpendicularconfirms the original rendition (Figure 1b) published todescribe these types of particles, at least in the moreordered, central part of the imaged particle.9 Yet, tobetter illustrate the structure of themolecules on theseparticles, we determined the coordinates of the im-aged tail groups (interpreted as C11ol). We filled the“empty” space with the other molecules (C4ol) andproduced a 3D rendering of the molecular arrange-ment on the particles that is shown in Figure S6. Theimage graphically represents this particle. It also illus-trates that this type of high-resolution image unveilsonly a small part of the surface of the NP. It would be
Figure 1. (a) Large-scale STM image of the NP1 sample. (b)Illustration of NP stripes having a molecular thickness andspacing of 1 nm. (c) Digital zoom-in of a portion of (a). Thearrows are guides to the eye to identify the stripe-likedomains. It = 0.05 nA, Vb = 700 mV, Ss = 60.5 nm at 512 �512 pixels. This image is part of a set of images recentlytaken in four different laboratories ondifferentmicroscopesand by different operators.20 A power spectral densityanalysis of this image is shown in Figure S1.20
ARTIC
LE
ONG ET AL . VOL. 7 ’ NO. 10 ’ 8529–8539 ’ 2013
www.acsnano.org
8532
reasonable to ask whether such an image can berelated to the image shown in Figure 1. It is evidentthat the images shown in Figures 1 and 2 havemarkedly different quality, the former showing onlydomain boundaries on a number of particles and thelatter showing some molecular positions but on asingle particle. In both cases the spacing between
domains is ∼1 nm. In ref 20 we show that the PSD ofthis image obtained at this resolution can be stitchedonto the PSD of images obtained at lower resolution,thus validating the use of Figure 2 to explain themolecular arrangement of the domains shown inFigure 1.20 The high-resolution imaging of this samplehas been reproduced, and representative images are
Figure 2. High-resolution STM images of the NP1 sample. (a) As-recorded image after a first-order global plane fit. This imageis the trace image of image set 1 shown completely (trace, retrace, and current) in Figure S2. (b) Image (a) with overlaid violetcircles placed at the positions identified as containing bright dots. We interpret these bright dots as the tail groups of one ofthe two types of molecules coating the NP, probably C11ol. To extract the position of the dots in a consistent way, weemployed a method currently popular in the analysis of high-resolution STM images, 2D continuous wavelet transform(CWT).69 To the raw imageswe applied a 2D CWTwith aMexican hat wavelet of 14 pixels in Gwyddion.70 The resulting imagesshowed clear features whose position on the image was determined using the “Mark Grain” feature. An operator placedround dots on the images based on the output of this procedure. Numbers indicate profile lines shown in (e). Arrows indicatedirection of the line profiles. (c) Different high-resolution image of the same particle from the same sequence of scans. Thisimage is the trace imageof image set 2 shown completely in Figure S3. (d) Image obtained as the difference between the traceplus retrace sum images of image set 1 and that of image set 2. The sum images used are shown in Figures S2e and S3e,respectively. Figure S4 shows the comparison between the sum and difference images obtained in this way. (e) Plot of theheight profiles taken from image (a). Each profile is achieved by averaging height data over a stripe of thickness 14 pixelscentered around the line identified by the arrows in (b). (f) Average radial PSD of the trace and retrace images from image set1. The two symbols on the images indicate the peak at 0.83 nm (circle) and 0.59 nm (triangle) that we assign to the distancebetween the rows of dots and between the dots, respectively. The complete plot is shown in Figure S5. Images (a) and (c) weretaken with It = 2 nA, Vb = 100 mV, Ss = 8.25 nm at 512 � 512 pixels.
ARTIC
LE

ONG ET AL . VOL. 7 ’ NO. 10 ’ 8529–8539 ’ 2013
www.acsnano.org
8533
shown in Supporting Information Figures S7 and S8.In particular, Figure S7 is an image recorded at 77 Kusing a UHV LT-STM by Omicron. This image showsdots spaced 0.47 nm along the short direction and0.86 nm along the long direction, confirming thespacing and arrangement found in Figure 2a. It is worthnoticing that the image shown in Figure S7 wasrecorded at a much lower tip velocity compared to
the image shown in Figure 2a (0.25 and 0.018 μm/s,respectively).We extended our high-resolution STM imaging to
examine the molecular structure of stripes in anothersample, NP2. Figure 3a is the whole image scan shownafter a first-order global plane fit. Figure 3b highlightsin red continuous regions containing the dots in theimages to demarcate idealized domains formed by the
Figure 3. High-resolution images of the NP2 sample. Trace (a) and retrace (c) as-recorded image (Ss = 11.8 nm) after a first-order global fit. Bright dots are clearly visible. These bright dots are the tail groups of one of the two types of moleculescoating the NP, probably C8. (b) Image (a) with red masks overlaid onto the dots so as to evidence the continuous domainregions that these dots form. The arrows in the image are a guide to the eye indicating three parallel domains. (d) Differenceimage between the images shown in (a) and (c). The whole image set together with the sum image is shown in Figure S9. (e)STM topography trace image of the same particle shown in (a) taken at a lower magnification and at higher tip velocity.Arrows in this image aremeant to indicate the same three stripe-like domains indicated in (b). The complete image set for thisparticle is shown in Figure S11. (f) Comparison between the radial PSD plots of a series of successive images of the particlesshown in this figure. The red plot is the average from three images (trace and retrace) recorded at 11.8 nm scan size and0.72 μm/s tip velocity, and the black is the averageof two images (trace and retrace) recorded at 30 nmand1.83μm/s. The lineindicates a broad peak that extends from 1.5 to 0.7 nm; this is present in both averages. The triangle is at 0.54 nm and ispresent only in the higher magnification images. In Figure S10 the complete plots are presented, together with average scanlines for images (a) and (e). All images were obtained with It = 2 nA, Vb = 80 mV at 512 � 512 pixels.
ARTIC
LE

ONG ET AL . VOL. 7 ’ NO. 10 ’ 8529–8539 ’ 2013
www.acsnano.org
8534
molecules imaged. As for NP1 the density of thesedomains is roughly half the density of the ligandspresent on these particles determined by TGA (∼4.3molecules/nm2). The shape of these “red” domains hasa striking resemblance to the results of simulationspublished in ref 28. Figure 3c shows the retrace imagewhose trace is shown in Figure 3a. As observed forNP1,the difference between these two images (Figure 3d) isalmost featureless but does show some minor rough-ness. The roughness does not directly correlate withthe features in the images; hence we take it as anindication of minor instrumental noise present in theimage that does not affect the major features.The images shown in Figure 3 reveal a higher level of
complexity (i.e., information) than what has been pre-viously seen from large-scale images. When lookingclosely at the dots in Figure 3a and c, it is possible toobserve that stripe domains can have variable thick-ness, as shown in previous simulations,28 and thatmultiple “point defects” are present (the red region inFigure 3b is meant to illustrate this point). In the case ofNP2 we were able to image the particle at multiplelength scales and consequently tip speeds. Figure 3aand e are images of the same particle recorded at0.72 and 1.83 μm/s, respectively. Importantly, thedirect comparison between these two images leadsto an observation of the transition from higher to lowerresolution images of stripe-like domains. As the resolu-tion decreases, the features comprising a stripe mergeinto a single continuous domain that correspondsto the stripe morphology previously observed.9,10 Inthe higher resolution images, arrangements of dots instripes similar to those on NP1 are visible with thenearest-neighbor distance of ∼0.55 nm, and line pro-files perpendicular to stripes indicate a spacing of∼1.2 nm. In Figure 3b, arrows indicate the position ofthese stripes. In the lower resolution images the dotsare lost andmerge into elongated features that are alsoindicated by arrows in Figure 3e. To substantiate theclaims that the domains observed in Figure 3a and eare the same, we show in Figure S10b, line profilestaken averaging over a large fraction of the particlespresent in these images. Both line profiles have thesame shape: roughly a half-circumference with threeprotrusions on it. It is evident that these protrusions(the domain features in the image) align remarkablywell for the scan lines of the two images. In otherwords, these modulations have basically the samerelative position and spacing on both images, eventhough the imaging conditions are significantly differ-ent, and show a spacing of ∼1.2 nm. To quantify thespatial distribution of features on this particle inFigure 3f and S10a, we show average radial PSD plotsfrom two sets of images (high and lowmagnification at0.72 and 1.83 μm/s, respectively). In both plots a broadpeak that extends from 1.5 to 0.7 nm is visible; weassign this peak to the average distance between
stripe-like domains on the particles. Thehigh-resolutionimages also show a peak at 0.54 nm that we assignto the distances between the dots within the samedomain (that we resolve only in these images).There is a significant difference between the sample
used to image NP1 and the one used to image NP2.The former (shown in Figure 1) was composed of adense layer of particles; the latter showed isolatedparticles (evident in Figure 2e). For the latter caseone expects larger distortions at the particle edgesand at the flat parts of the sample close to the particledue to the shape of the tip. In fact, when close to theparticle edges various parts of the tip might interactwith the nanoparticles instead of the flat part of thesample depending on the relative tip/particle position.In any case, we expect that these effects would beminimized when imaging the top of the particle, andthis is the part of the image that we have mostlyanalyzed. The persistence of the features on top ofthe particles acrossmany images and throughdifferentimaging conditions confirms this conclusion. Thesubstrate onto which NP2 was placed contained amonolayer of butanethiol and hexadecanedithiol. It ispossible that parts of this mixed monolayer were alsoimaged, but we do not have enough evidence at themoment to make any conclusion on the images of thispart of the sample.There are a few experiments that we have per-
formed as controls to better substantiate our assign-ment of the features we observe on the nanoparticlesas tail groups of the ligand molecules. We rule out tip-imaging effects in the series of images that show NP1,as the spacing between the dots reproduces acrosslaboratories and matches what was found in ref 20.In the case of NP2 the spacing that we observe is thesame spacing reported for these types of particles inthe past in ref 19. We believe that we image molecularfeatures and not features related to the gold core,as high-resolution transmission electron microscopyimages of these particles do not show any evidenceof protrusions with these spacings (see Figure S12).Additionally, we performed a series of imaging fora nanoparticle sample by changing the set current.We first found imaging conditions that allowed theobservation of clear features on the nanoparticles. Weinterpret these features as due to imaging ofmoleculeson the particles. To prove this point, we changed theimaging set current to force the tip inside the ligandshell. As expected, the features disappeared, smoothnanoparticle surfaces were imaged, and hints of facetscould be seen (see Figure S13 in the SupportingInformation). When the imaging set current was resetto the original value (and consequently the tip waslifted above the ligand shell), the features on thenanoparticles reappeared. This control experimentshows (i) that our images have features that are dueto themolecules in the ligand shell, (ii) that the features
ARTIC
LE

ONG ET AL . VOL. 7 ’ NO. 10 ’ 8529–8539 ’ 2013
www.acsnano.org
8535
imaged are on the nanoparticles and not on the tip,and finally (iii) that the feedback conditions used wereproperly set, with no feedback instability. We are alsoconfident in the ability of discerning different molec-ular arrangements on nanoparticles, as on the sameNP1 sample used to record Figures 1 and 2 we wereable to identify particles composed of two separatedomains (i.e., Janus particle). Indeed, we have recentlydiscovered that certain molecular combinations ofligand molecules lead to a spontaneous formation ofJanus particles.18 ForNP1 particles, the stripemorphol-ogy dominates, but there are also Janus particles.Figure 4a is a large-scale image of the same NP1sample shown in Figures 1 and 2. In this region, NPswith Janus structures are highlighted by dashed circles.Each Janus particle possesses two hemispherical do-mains demarcated by a boundary line. Molecularresolution STM imaging also identifies somemoleculardetails of these particles. A high-resolution image ispresented in Figure 4b, showing a region on the left ofthe particle in which discrete molecular tail groups arevisible. Additional images of Janus particles are shownin Figure S14.While a discussion on Janus NPs and theirimages does not pertain to this paper, the main pointof the images shown in Figure 4 is to show that thesample imaged in Figures 1 and 2 contains particleswith a substantially differentmorphology from the oneshown in those figures.Finally, to further test the correlation between the
features we image in STM and the ligand shell compo-sition, we synthesized homoligand nanoparticles(NP3) and studied them. Figures 5 and S15 show animage of C8-coated NPs. Dots resembling the onespresent on the particle shown in Figure 2a are clearlyevident. In Figure 5b these dots are highlighted bysuperimposed violet circles, placed using the same pro-cedure used to place the same circles in Figure 2b.There are clear qualitative differences between thearrangement of the dots (and consequently the circles)in the images of NP1 (Figure 2) and NP3 (Figure 5).
While for mixed ligand particles alignment is clear witha compact arrangement of these dots along one direc-tion and a looser one along the perpendicular direction,this is not true for homoligand particles, where a moreisotropic distribution of these dots is evident. The radialPSD shown in Figure 5f shows a broad feature from 0.9to 0.63 nmwith two peaks at the extremes correspond-ing to the distribution of distances that we observe inthe image. It is worth noticing that compared to theimages shown in Figures 2 and 3 the contrast of thedots that are in Figure 5 is significantly less. This is ingood agreement with the composition of the NPs, as inthe case of NP3 all ligands have the same length (andvery similar STM contrast), as opposed toNP1 andNP2,where the difference in length (and STM contrast)between the twomolecules creates better STM imagingconditions. Finally we can preliminarily state that onNP3 we observe a disordered arrangement of theligands. This observation is in good agreement withmolecular dynamics calculations;58�60 yet it is evidentfor the images in Figure 5 that probably we do notimage all of the ligands. Hence further work will berequired to better address this point. In the case ofNP3the density of the ligands observed is, at least locally,close to the onemeasured via TGA (∼5molecules/nm2).Despite our efforts, the current understanding of
STM imaging ofmixed-SAM-coated nanoparticles is farfrom complete.42,61 In particular, given that these imagesare of a sample with highly curved surfaces; it is reason-able to askwhether there is a need for a correction of thedistances reported here. This correction could entailthe elimination of drift43 and curvature.62,63 The formershould not be necessary, as this resolution is onlypossible when drift is small. As for the latter, this isa complex matter that requires knowledge of the truetip trajectory. It is known that when imaging in constantheight mode, curved surfaces are projected radially ontothe flat tip path; consequently, distances in STM imagesare larger than the real ones, with the distortions beinglarger at the edges of the curved features.62,63 We obtain
Figure 4. High-resolution STM image of the NP1 sample. (a) Large-scale image (Ss = 32.6 nm, It = 30 pA, Vb =700mV). Dashedwhite circles indicate the presence of Janus particles. A cartoon of the Janus structure is illustrated in the inset. (b) High-resolution image of a Janus particle taken with It = 2 nA, Vb = 500 mV at 512 � 512 pixels.
ARTIC
LE

ONG ET AL . VOL. 7 ’ NO. 10 ’ 8529–8539 ’ 2013
www.acsnano.org
8536
images in a quasi-constant current mode; hence our tippath is curved. However, the same physics applies here,and hence there is a degree of distance stretching to beexpected. The curved tip path is also projected ortho-graphically onto a flat line by the imaging software, thusleading to a shrinking of the distances. These effects areobviously opposed to each other, and they both need tobe mediated by the well-known tip convolution pro-blems. All three effects are larger on steep surfaces (i.e., atthe edges of the particles). The interplay between thesethree effects depends strictly on the trajectory of the tip;
each one can dominate depending on the specific case.Figure S16 is an attempt at a representation of theseeffects for a reasonably drawn trajectory,64 showing thatthe effect leads to spacings that are very close to thereal ones. A deeper attempt to address this issue wasachieved through the generation of a 3D model ofour particles. In Figure S17 we show a 3D rendering ofparticles consistent in shape with the findings in thispaper. This image was then converted into a 3D mapwith the height being a gray scale map. To this latterimage we applied a ball-rolling filter to capture both the
Figure 5. High-resolution STM images of the NP3 sample. (a) As-recorded image after a second-order global plane fit. Thisimage is the retrace image of an image set shown completely (trace, retrace, and current) in Figure S15. (b) Image (a) withoverlaid violet circles placed at the positions identified as containingbright dots in (a). The dot positionswere extracted in thesame way described in the caption of Figure 2, the only difference being that the size of the Mexican hat wavelet was chosento be 12 pixels. (c) Image obtained as the sum between the trace and retrace images of this set. (d) Image obtained as thedifference image between the trace and retrace image. (e) Current image of this set. (f) Radial PSD of the retrace image shownin (a) (full scale of this plot is shown in Figure S15). This set of images was acquired with It = 0.35 nA, Vb = 1000 mV, andSs = 15 nm at 512 � 512 pixels.
ARTIC
LE
ONG ET AL . VOL. 7 ’ NO. 10 ’ 8529–8539 ’ 2013
www.acsnano.org
8537
stretching and the convolution effect discussed above(Figure S17b and c) and then took a line scan of theproduced image to capture the orthographic projectionissue. The result is shown in Figure S17d overlappedwithan experimental line scan taken from Figure 3a. There isa good agreement of the two line scans. In the case ofthe simulated line scan, where the initial distance wasimposed and consequently is known, we can state withcertainty that we find minimal size distortion in the finalprofile.More simplistically, it is evident that the spacings
shown in this paper for close-packed tail groups arevery close to the ones measured in SAMs on flatsurfaces; hence we do not expect large distortions ofthe images. Yet it should be pointed out that thespacing measured on flat gold surfaces is specific toAu(111) facets. On nanoparticles one expects a varietyof faces, with the (111) being prevalent; hence avariation in faceting of the NPs has to be consideredas another possible cause of variation in tail-groupspacing. We have tried to address the issue of facets inthe images of our particles by analyzing in-depth theSTM images presented. We have attempted to deter-mine the gold core shape by digitally removing theligand-related features from the images and thenallowing the STM image analysis software to find themost probable surface “background”. A close inspec-tion of the image in Figure 2 shows a flat central region
with a polygonal shape (see Figure S18). Figure S19shows the most probable crystal structure for theparticles shown in Figures 3 and 5. The latter has acore particle of clear pentatwinned shape. Figure S20overlays themolecular positions illustrated in Figures 2,3, and 5 with the facets that we believe are mostprobable on the gold core. It is immediately evidentthat little correlation can be found between moleculararrangement and core facets. Hence, this preliminaryanalysis seems to rule out a major effect of the crystalstructure of the gold core on the ligand shell arrange-ment. Larger image sets will need to be analyzed inorder to reach final conclusions on this problem.
CONCLUSIONS
In conclusion we have shown here the first imagesof mixed-ligand-protected nanoparticles where mol-ecules forming stripe-like domains are visualized inboth C4ol:C11ol and C8:C2COOH NPs. We believe thatthe approach presented here enables a better char-acterization of the patchiness on nanoparticles andcould in the future allow for the extraction of informa-tion about the local variation of patch spacing aswell as molecular defects present in the ligand shellof nanoparticles. There are a multitude of ligand-shell structures that could be determined experimen-tally with an appropriate high-resolution imagingcapability.65�67
EXPERIMENTAL SECTIONThe NPs used in this paper were synthesized by a modifica-
tion of the method described by Zheng et al.68 and character-ized by transmission electron microscopy (TEM) and 1H NMRbefore and after decomposition with potassium cyanide (seeSupporting Information for details). NPs were thoroughlycleaned using centrifugation as described in Supporting Infor-mation. The resulting NPs were deposited on a gold(111)/micasurface by a Langmuir�Shaefer technique (see SupportingInformation). At the Ecole Polytechnique Fédérale de Lausanne(EPFL), we used a Bruker Multimode Nanoscope IIIA, equippedwith an E-scanner, to image the particle surface structures. At KULeuven, we used a Bruker Multimode Nanoscope IIIA, equippedwith an A-scanner. At the University of Geneva, an OmicronLT-STM at 77 K was used. All images shown in the main text ofthe paper were acquired at EPFL with the exception of theimage shown in Figure 1, which was acquired in Leuven. In theSupporting Information all images shown were recorded atEPFL unless otherwise indicated. Typical range of current setpoints (It) is from 50 to 2000 pA and bias voltage (Vb) from 100 to1000 mV, with precise values including the scan size (Ss) andpixel density provided in each figure caption. Microscopes werecalibrated occasionally with a gold(111) surface and highlyoriented pyrolitic graphite (HOPG).A number of precautions were taken in order to enhance
resolution, accuracy, and reproducibility of the data. To preventSTM tip contamination, the particles were cleaned several timeswith solvents to remove excess ligand molecules, and solution1H NMR was performed to ensure a minimal presence of freeligands. To achieve the high resolution shown here, for theroom-temperature imaging, it was necessary for thermal drift tobe minimized by allowing the STM tip to scan on a small area(∼100 nm2) of the sample for a period of hours. It is noted that
the need for thermal equilibration is more stringent for NPimaging when compared to the imaging of highly crystallinesamples (i.e., HOPG) because they contain only short-rangeorder, and hence drift tends to merge features in a way that isdifficult to predict and interpret. To avoid imaging particlesmodified by the tip, images were subsequently acquired ona different part of the sample. Finally, to minimize the effectsof molecular movements during imaging, images had to beacquired at sufficiently high speed (0.2�0.7 μm/s).
Conflict of Interest: The authors declare no competingfinancial interest.
Supporting Information Available: Synthesis of nanoparti-cles. NMR and TEM characterization. Further STM analysis. Thismaterial is available free of charge via the Internet at http://pubs.acs.org.
Acknowledgment. The authors acknowledge F. Biscarini,C. Alboretti, and P. Samorì for helpful discussions and Yun Tangfor HR-TEM images.
REFERENCES AND NOTES1. Daniel, M. C.; Astruc, D. Gold Nanoparticles: Assembly,
Supramolecular Chemistry, Quantum-Size-Related Pro-perties, and Applications toward Biology, Catalysis, andNanotechnology. Chem. Rev. 2004, 104, 293–346.
2. Pelaz, B.; Jaber, S.; de Aberasturi, D. J.; Wulf, V.; Aida, T.;de la Fuente, J. M.; Feldmann, J.; Gaub, H. E.; Josephson, L.;Kagan, C. R.; et al. The State of Nanoparticle-Based Nano-science and Biotechnology: Progress, Promises, andChallenges. ACS Nano 2012, 6, 8468–8483.
3. Medintz, I. L.; Uyeda, H. T.; Goldman, E. R.; Mattoussi, H.Quantum Dot Bioconjugates For Imaging, Labelling andSensing. Nat. Mater. 2005, 4, 435–446.
ARTIC
LE

ONG ET AL . VOL. 7 ’ NO. 10 ’ 8529–8539 ’ 2013
www.acsnano.org
8538
4. Ingram, R. S.; Hostetler, M. J.; Murray, R. W. Poly-Hetero-ω-Functionalized Alkanethiolate-Stabilized Gold ClusterCompounds. J. Am. Chem. Soc. 1997, 119, 9175–9178.
5. Kuna, J. J.; Voitchovsky, K.; Singh, C.; Jiang, H.; Mwenifumbo,S.; Ghorai, P. K.; Stevens, M. M.; Glotzer, S. C.; Stellacci, F.The Effect of Nanometre-Scale Structure on InterfacialEnergy. Nat. Mater. 2009, 8, 837–842.
6. Milette, J.; Toader, V.; Reven, L.; Lennox, R. B. Tuning theMiscibility of Gold Nanoparticles Dispersed in LiquidCrystals via the Thiol-for-DMAP Reaction. J. Mater. Chem.2011, 21, 9043–9050.
7. Centrone, A.; Penzo, E.; Sharma,M.;Myerson, J.W.; Jackson,A. M.; Marzari, N.; Stellacci, F. The Role of Nanostructurein the Wetting Behavior of Mixed-Monolayer-ProtectedMetal Nanoparticles. Proc. Natl. Acad. Sci. U.S.A. 2008, 105,9886–9891.
8. Stranick, S. J.; Atre, S. V.; Parikh, A. N.; Wood, M. C.; Allara,D. L.; Winograd, N.; Weiss, P. S. Nanometer-Scale PhaseSeparation in Mixed Composition Self-Assembled Mono-layers. Nanotechnology 1996, 7, 438–442.
9. Jackson, A. M.; Myerson, J. W.; Stellacci, F. SpontaneousAssembly of Subnanometre-Ordered Domains in theLigand Shell of Monolayer-Protected Nanoparticles. Nat.Mater. 2004, 3, 330–336.
10. Jackson, A. M.; Hu, Y.; Silva, P. J.; Stellacci, F. FromHomoligand- to Mixed-Ligand-Monolayer-ProtectedMetalNanoparticles: A Scanning Tunneling Microscopy Investi-gation. J. Am. Chem. Soc. 2006, 128, 11135–11149.
11. Stranick, S. J.; Kamna, M. M.; Krom, K. R.; Parikh, A. N.; Allara,D. L.; Weiss, P. S. Scanning Tunneling Microscopy Studiesof Self-Assembled Monolayers of Alkanethiols on Gold.J. Vac. Sci. Technol., B 1994, 12, 2004–2007.
12. Anderson, M. E.; Smith, R. K.; Donhauser, Z. J.; Hatzor, A.;Lewis, P. A.; Tan, L. P.; Tanaka, H.; Horn, M. W.; Weiss, P. S.Exploiting Intermolecular Interactions and Self-Assemblyfor Ultrahigh Resolution Nanolithography. J. Vac. Sci.Technol. B 2002, 20, 2739–2744.
13. Stranick, S. J.; Parikh, A. N.; Tao, Y. T.; Allara, D. L.; Weiss, P. S.Phase Separation of Mixed-Composition Self-AssembledMonolayers into Nanometer Scale Molecular Domains.J. Phys. Chem. 1994, 98, 7636–7646.
14. Atre, S. V.; Liedberg, B.; Allara, D. L. Chain Length Depen-dence of the Structure and Wetting Properties in BinaryComposition Monolayers of OH- and CH3-TerminatedAlkanethiolates on Gold. Langmuir 1995, 11, 3882–3893.
15. Tamada, K.; Hara, M.; Sasabe, H.; Knoll, W. Surface PhaseBehavior of n-Alkanethiol Self-Assembled MonolayersAdsorbed on Au(111): An Atomic Force Microscope Study.Langmuir 1997, 13, 1558–1566.
16. Hayes, W. A.; Kim, H.; Yue, X.; Perry, S. S.; Shannon, C.Nanometer-Scale Patterning of Surfaces Using Self-Assembly Chemistry. 2. Preparation, Characterization, andElectrochemical Behavior of Two-Component OrganothiolMonolayers onGoldSurfaces. Langmuir1997,13, 2511–2518.
17. Carney, R. P.; DeVries, G. A.; Dubois, C.; Kim, H.; Kim, J. Y.;Singh, C.; Ghorai, P. K.; Tracy, J. B.; Stiles, R. L.; Murray, R. W.;et al. Size Limitations for the Formation of Ordered StripedNanoparticles. J. Am. Chem. Soc. 2008, 130, 788–799.
18. Reguera, J.; Ong, Q.; Pons-Sieperman, I. C.; Yu, M.; Glotzer,S. C.; Stellacci, F. Janus Nanoparticles via SpontaneousSeparation inMixed Self-AssembledMonolayers of Alkane-Thiols, submitted.
19. Hu, Y.; Wunsch, B. H.; Sahni, S.; Stellacci, F. StatisticalAnalysis of Scanning Tunneling Microscopy Images of'Striped' Mixed Monolayer Protected Gold Nanoparticles.J. Scanning Probe Microsc. 2009, 4, 24–35.
20. Biscarini, F.; Ong, Q.; Albonetti, C.; Longobardi, M.; Mali,K. S.; Ciesielski, A.; Reguera, J.; Renner, C.; Feyter, S.; Samorì,P.; et al. Quantitative Analysis of Scanning TunnelingMicroscopy Images of Functionalized Nanoparticles,submitted.
21. Centrone, A.; Hu, Y.; Jackson, A. M.; Zerbi, G.; Stellacci, F.Phase Separation on Mixed-Monolayer-Protected MetalNanoparticles: A Study by Infrared Spectroscopy andScanning Tunneling Microscopy. Small 2007, 3, 814–817.
22. Liu, X.; Yu, M.; Kim, H.; Mameli, M.; Stellacci, F. Determina-tion of Monolayer-Protected Gold Nanoparticle Ligand-Shell Morphology UsingNMR.Nat. Commun. 2012, 3, 1182.
23. Guarino, G.; Rastrelli, F.; Scrimin, P.; Mancin, F. Lanthanide-Based NMR: A Tool to Investigate Component DistributioninMixed-Monolayer-Protected Nanoparticles. J. Am. Chem.Soc. 2012, 134, 7200–7203.
24. Harkness, K. M.; Balinski, A.; McLean, J. A.; Cliffel, D. E.Nanoscale Phase Segregation of Mixed Thiolates on GoldNanoparticles. Angew. Chem., Int. Ed. 2011, 50, 10554–10559.
25. Gentilini, C.; Franchi, P.; Mileo, E.; Polizzi, S.; Lucarini, M.;Pasquato, L. Formation of Patches on 3D SAMs Driven byThiols with Immiscible Chains Observed by ESR Spectros-copy. Angew. Chem., Int. Ed. 2009, 48, 3060–3064.
26. Lucarini, M.; Pasquato, L. ESR Spectroscopy as a Tool toInvestigate the Properties of Self-Assembled MonolayersMrotecting Gold Nanoparticles. Nanoscale 2010, 2, 668–676.
27. Glotzer, S. C.; Solomon, M. J. Anisotropy of Building Blocksand Their Assembly Into Complex Structures. Nat. Mater.2007, 6, 557–562.
28. Singh, C.; Ghorai, P. K.; Horsch, M. A.; Jackson, A. M.; Larson,R. G.; Stellacci, F.; Glotzer, S. C. Entropy-Mediated Pattern-ing of Surfactant-CoatedNanoparticles and Surfaces. Phys.Rev. Lett. 2007, 99.
29. Singh, C.; Hu, Y.; Khanal, B. P.; Zubarev, E. R.; Stellacci, F.;Glotzer, S. C. Striped Nanowires and Nanorods fromMixedSAMS. Nanoscale 2011, 3, 3244–3250.
30. Ghorai, P. K.; Glotzer, S. C. Atomistic Simulation Study ofStriped Phase Separation in Mixed-Ligand Self-AssembledMonolayer Coated Nanoparticles. J. Phys. Chem. C 2010,114, 19182–19187.
31. Miller, W. L.; Bozorgui, B.; Klymko, K.; Cacciuto, A. FreeEnergy of Alternating Two-Component Polymer Brusheson Cylindrical Templates. J. Chem. Phys. 2011, 135,244902–5.
32. Egorov, S. A. Microphase Separation of Mixed PolymerBrushes Physisorbed on Cylindrical Surfaces. Soft Matter2012, 8, 3971–3979.
33. Uzun, O.; Hu, Y.; Verma, A.; Chen, S.; Centrone, A.; Stellacci,F. Water-Soluble Amphiphilic Gold Nanoparticles withStructured Ligand Shells. Chem. Commun. 2008, 196–198.
34. DeVries, G. A.; Brunnbauer, M.; Hu, Y.; Jackson, A. M.; Long,B.; Neltner, B. T.; Uzun, O.; Wunsch, B. H.; Stellacci, F.Divalent Metal Nanoparticles. Science 2007, 315, 358–361.
35. Nakata, K.; Hu, Y.; Uzun, O.; Bakr, O.; Stellacci, F. Chains ofSuperparamagnetic Nanoparticles. Adv. Mater. 2008, 20,4294–4299.
36. Carney, R. P.; Astier, Y.; Carney, T. M.; Voïtchovsky, K.; JacobSilva, P. H.; Stellacci, F. Electrical Method to QuantifyNanoparticle Interaction with Lipid Bilayers. ACS Nano2012, 7, 932–942.
37. Verma, A.; Uzun, O.; Hu, Y. H.; Hu, Y.; Han, H. S.; Watson, N.;Chen, S. L.; Irvine, D. J.; Stellacci, F. Surface-Structure-Regulated Cell-Membrane Penetration by Monolayer-Protected Nanoparticles. Nat. Mater. 2008, 7, 588–595.
38. Carney, R.; Carney, T.; Mueller, M.; Stellacci, F. DynamicCellular Uptake of Mixed-Monolayer Protected Nano-particles. Biointerphases 2012, 7, 1–9.
39. Leduc, C.; Jung, J.-M.; Carney, R. R.; Stellacci, F.; Lounis, B.Direct Investigation of Intracellular Presence of GoldNanoparticles via Photothermal Heterodyne Imaging.ACS Nano 2011, 5, 2587–2592.
40. Jewell, C. M.; Jung, J.-M.; Atukorale, P. U.; Carney, R. P.;Stellacci, F.; Irvine, D. J. Oligonucleotide Delivery by Cell-Penetrating “Striped”Nanoparticles. Angew. Chem., Int. Ed.2011, 50, 12312–12315.
41. Cho, E. S.; Kim, J.; Tejerina, B.; Hermans, T. M.; Jiang, H.;Nakanishi, H.; Yu, M.; Patashinski, A. Z.; Glotzer, S. C.; et al.Ultrasensitive Detection of Toxic Cations through Changesin the Tunnelling Current across Films of Striped Nano-particles. Nat. Mater. 2012, 11, 978–985.
42. Yu, M.; Stellacci, F. Response to “Stripy NanoparticlesRevisited”. Small 2012, 8, 3720–3726.
ARTIC
LE

ONG ET AL . VOL. 7 ’ NO. 10 ’ 8529–8539 ’ 2013
www.acsnano.org
8539
43. Dubois, C.; Stellacci, F. Self-assembled Monolayer of ShortCarboxyl-Terminated Molecules Investigated with ex SituScanning Tunneling Microscopy. J. Phys. Chem. C 2008,112, 7431–7435.
44. Ulman, A. Formation and Structure of Self-AssembledMonolayers. Chem. Rev. 1996, 96, 1533–1554.
45. Poirier, G. E. Characterization of Organosulfur MolecularMonolayers on Au(111) Using Scanning Tunneling Micro-scopy. Chem. Rev. 1997, 97, 1117–1128.
46. Jadzinsky, P. D.; Calero, G.; Ackerson, C. J.; Bushnell, D. A.;Kornberg, R. D. Structure of a Thiol Monolayer-ProtectedGold Nanoparticle at 1.1 Å Resolution. Science 2007, 318,430–433.
47. Vericat, C.; Vela, M. E.; Benitez, G.; Carro, P.; Salvarezza, R. C.Self-AssembledMonolayers of Thiols and Dithiols on Gold:New Challenges for a Well-Known System. Chem. Soc. Rev.2010, 39, 1805–1834.
48. Schreiber, F. Structure and Growth of Self-AssemblingMonolayers. Prog. Surf. Sci. 2000, 65, 151–257.
49. Azcárate, J. C.; Corthey, G.; Pensa, E.; Vericat, C.; Fonticelli,M. H.; Salvarezza, R. C.; Carro, P. Understanding the SurfaceChemistry of Thiolate-Protected Metallic Nanoparticles.J. Phys. Chem. Lett. 2013, 3127–3138.
50. Li, Y.; Zaluzhna, O.; Xu, B.; Gao, Y.; Modest, J. M.; Tong, Y. J.Mechanistic Insights into the Brust�Schiffrin Two-PhaseSynthesis of Organo-Chalcogenate-Protected Metal Nano-particles. J. Am. Chem. Soc. 2011, 133, 2092–2095.
51. Han, P.; Kurland, A. R.; Giordano, A. N.; Nanayakkara, S. U.;Blake, M. M.; Pochas, C. M.; Weiss, P. S. Heads and Tails:Simultaneous Exposed and Buried Interface Imaging ofMonolayers. ACS Nano 2009, 3, 3115–3121.
52. Bumm, L. A.; Arnold, J. J.; Charles, L. F.; Dunbar, T. D.;Allara, D. L.; Weiss, P. S. Directed Self-Assembly to CreateMolecular Terraces with Molecularly Sharp Boundaries inOrganic Monolayers. J. Am. Chem. Soc. 1999, 121, 8017–8021.
53. Rapino, S.; Zerbetto, F. Dynamics of Thiolate Chains on aGold Nanoparticle. Small 2007, 3, 386–388.
54. Ionita, P.; Volkov, A.; Jeschke, G.; Chechik, V. Lateral Diffu-sion of Thiol Ligands on the Surface of Au Nanoparticles:An Electron Paramagnetic Resonance Study. Anal. Chem.2007, 80, 95–106.
55. Bucher, J. P.; Santesson, L.; Kern, K. Selective Imaging ofSelf-Assembled Monolayers by Tunneling Microscopy.Appl. Phys. A: Mater. Sci. Process. 1994, 59, 135–138.
56. Azzam, W.; Cyganik, P.; Witte, G.; Buck, M.; Wöll, C. Pro-nounced Odd-Even Changes in the Molecular Arrange-ment and Packing Density of Biphenyl-Based Thiol SAMs:A Combined STM and LEED Study. Langmuir 2003, 19,8262–8270.
57. Poirier, G. E.; Tarlov, M. J.; Rushmeier, H. E. Two-DimensionalLiquid Phase and the p �
√3 Phase of Alkanethiol Self-
Assembled Monolayers on Au(111). Langmuir 1994, 10,3383–3386.
58. Ghorai, P. K.; Glotzer, S. C. Molecular Dynamics Simula-tion Study of Self-Assembled Monolayers of AlkanethiolSurfactants on Spherical GoldNanoparticles. J. Phys. Chem.C 2007, 111, 15857–15862.
59. Luedtke,W.D.; Landman, U. Structure andThermodynamicsof Self-Assembled Monolayers on Gold Nanocrystallites.J. Phys. Chem. B 1998, 102, 6566–6572.
60. Lane, J. M. D.; Grest, G. S. Spontaneous Asymmetry ofCoated Spherical Nanoparticles in Solution and at Liquid-Vapor Interfaces. Phys. Rev. Lett. 2010, 104, 235501.
61. Cesbron, Y.; Shaw, C. P.; Birchall, J. P.; Free, P.; Levy, R. StripyNanoparticles Revisited. Small 2012, 8, 3714–3719.
62. Meunier, V.; Lambin, P. Tight-Binding Computation of theSTM Image of Carbon Nanotubes. Phys. Rev. Lett. 1998, 81,5588–5591.
63. Venema, L.; Meunier, V.; Lambin, P.; Dekker, C. AtomicStructure of Carbon Nanotubes from Scanning TunnelingMicroscopy. Phys. Rev. B 2000, 61, 2991–2996.
64. Klyachko, D.; Chen, D. M. Cluster Shapes in STM Images ofIsolate Clusters and Cluster Materials. Surf. Sci. 2000, 446,98–102.
65. Pons-Siepermann, I. C.; Glotzer, S. C. Design of PatchyParticles Using Quaternary Self-Assembled Monolayers.ACS Nano 2012, 6, 3919–3924.
66. Pons-Siepermann, I. C.; Glotzer, S. C. Design of PatchyParticles Using Ternary Self-Assembled Monolayers. SoftMatter 2012, 8, 6226–6231.
67. Santos, A.; Millan, J. A.; Glotzer, S. C. Facetted PatchyParticles through Entropy-Driven Patterning of MixedLigand SAMS. Nanoscale 2012, 4, 2640–2650.
68. Zheng, N.; Fan, J.; Stucky, G. D. One-Step One-PhaseSynthesis of Monodisperse Noble-Metallic Nanoparticlesand Their Colloidal Crystals. J. Am. Chem. Soc. 2006, 128,6550–6551.
69. Gackenheimer, C.; Cayon, L.; Reifenberger, R. Analysisof Scanning Probe Microscope Images Using Wavelets.Ultramicroscopy 2006, 106, 389–397.
70. Ne�cas, D.; Klapetek, P. Gwyddion: An Open-Source Soft-ware for SPM Data Analysis. Cent. Eur. J. Phys. 2012, 10,181–188.
ARTIC
LE