High resolution magnetic resonance imaging for characterization of the neuroligin-3 knock-in mouse...
11
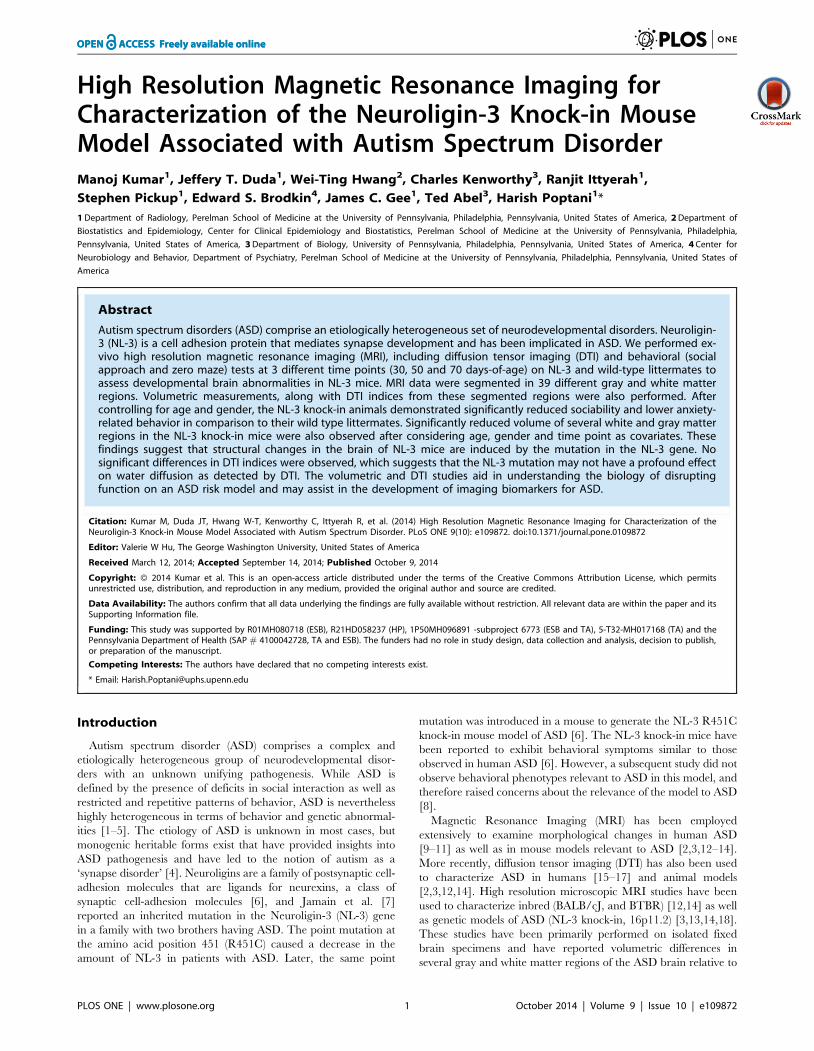
High Resolution Magnetic Resonance Imaging for Characterization of the Neuroligin-3 Knock-in Mouse Model Associated with Autism Spectrum Disorder Manoj Kumar 1 , Jeffery T. Duda 1 , Wei-Ting Hwang 2 , Charles Kenworthy 3 , Ranjit Ittyerah 1 , Stephen Pickup 1 , Edward S. Brodkin 4 , James C. Gee 1 , Ted Abel 3 , Harish Poptani 1 * 1 Department of Radiology, Perelman School of Medicine at the University of Pennsylvania, Philadelphia, Pennsylvania, United States of America, 2 Department of Biostatistics and Epidemiology, Center for Clinical Epidemiology and Biostatistics, Perelman School of Medicine at the University of Pennsylvania, Philadelphia, Pennsylvania, United States of America, 3 Department of Biology, University of Pennsylvania, Philadelphia, Pennsylvania, United States of America, 4 Center for Neurobiology and Behavior, Department of Psychiatry, Perelman School of Medicine at the University of Pennsylvania, Philadelphia, Pennsylvania, United States of America Abstract Autism spectrum disorders (ASD) comprise an etiologically heterogeneous set of neurodevelopmental disorders. Neuroligin- 3 (NL-3) is a cell adhesion protein that mediates synapse development and has been implicated in ASD. We performed ex- vivo high resolution magnetic resonance imaging (MRI), including diffusion tensor imaging (DTI) and behavioral (social approach and zero maze) tests at 3 different time points (30, 50 and 70 days-of-age) on NL-3 and wild-type littermates to assess developmental brain abnormalities in NL-3 mice. MRI data were segmented in 39 different gray and white matter regions. Volumetric measurements, along with DTI indices from these segmented regions were also performed. After controlling for age and gender, the NL-3 knock-in animals demonstrated significantly reduced sociability and lower anxiety- related behavior in comparison to their wild type littermates. Significantly reduced volume of several white and gray matter regions in the NL-3 knock-in mice were also observed after considering age, gender and time point as covariates. These findings suggest that structural changes in the brain of NL-3 mice are induced by the mutation in the NL-3 gene. No significant differences in DTI indices were observed, which suggests that the NL-3 mutation may not have a profound effect on water diffusion as detected by DTI. The volumetric and DTI studies aid in understanding the biology of disrupting function on an ASD risk model and may assist in the development of imaging biomarkers for ASD. Citation: Kumar M, Duda JT, Hwang W-T, Kenworthy C, Ittyerah R, et al. (2014) High Resolution Magnetic Resonance Imaging for Characterization of the Neuroligin-3 Knock-in Mouse Model Associated with Autism Spectrum Disorder. PLoS ONE 9(10): e109872. doi:10.1371/journal.pone.0109872 Editor: Valerie W Hu, The George Washington University, United States of America Received March 12, 2014; Accepted September 14, 2014; Published October 9, 2014 Copyright: ß 2014 Kumar et al. This is an open-access article distributed under the terms of the Creative Commons Attribution License, which permits unrestricted use, distribution, and reproduction in any medium, provided the original author and source are credited. Data Availability: The authors confirm that all data underlying the findings are fully available without restriction. All relevant data are within the paper and its Supporting Information file. Funding: This study was supported by R01MH080718 (ESB), R21HD058237 (HP), 1P50MH096891 -subproject 6773 (ESB and TA), 5-T32-MH017168 (TA) and the Pennsylvania Department of Health (SAP # 4100042728, TA and ESB). The funders had no role in study design, data collection and analysis, decision to publish, or preparation of the manuscript. Competing Interests: The authors have declared that no competing interests exist. * Email: [email protected] Introduction Autism spectrum disorder (ASD) comprises a complex and etiologically heterogeneous group of neurodevelopmental disor- ders with an unknown unifying pathogenesis. While ASD is defined by the presence of deficits in social interaction as well as restricted and repetitive patterns of behavior, ASD is nevertheless highly heterogeneous in terms of behavior and genetic abnormal- ities [1–5]. The etiology of ASD is unknown in most cases, but monogenic heritable forms exist that have provided insights into ASD pathogenesis and have led to the notion of autism as a ‘synapse disorder’ [4]. Neuroligins are a family of postsynaptic cell- adhesion molecules that are ligands for neurexins, a class of synaptic cell-adhesion molecules [6], and Jamain et al. [7] reported an inherited mutation in the Neuroligin-3 (NL-3) gene in a family with two brothers having ASD. The point mutation at the amino acid position 451 (R451C) caused a decrease in the amount of NL-3 in patients with ASD. Later, the same point mutation was introduced in a mouse to generate the NL-3 R451C knock-in mouse model of ASD [6]. The NL-3 knock-in mice have been reported to exhibit behavioral symptoms similar to those observed in human ASD [6]. However, a subsequent study did not observe behavioral phenotypes relevant to ASD in this model, and therefore raised concerns about the relevance of the model to ASD [8]. Magnetic Resonance Imaging (MRI) has been employed extensively to examine morphological changes in human ASD [9–11] as well as in mouse models relevant to ASD [2,3,12–14]. More recently, diffusion tensor imaging (DTI) has also been used to characterize ASD in humans [15–17] and animal models [2,3,12,14]. High resolution microscopic MRI studies have been used to characterize inbred (BALB/cJ, and BTBR) [12,14] as well as genetic models of ASD (NL-3 knock-in, 16p11.2) [3,13,14,18]. These studies have been primarily performed on isolated fixed brain specimens and have reported volumetric differences in several gray and white matter regions of the ASD brain relative to PLOS ONE | www.plosone.org 1 October 2014 | Volume 9 | Issue 10 | e109872
-
Upload
independent -
Category
Documents
-
view
0 -
download
0
Transcript of High resolution magnetic resonance imaging for characterization of the neuroligin-3 knock-in mouse...
High Resolution Magnetic Resonance Imaging forCharacterization of the Neuroligin-3 Knock-in MouseModel Associated with Autism Spectrum DisorderManoj Kumar1, Jeffery T. Duda1, Wei-Ting Hwang2, Charles Kenworthy3, Ranjit Ittyerah1,
Stephen Pickup1, Edward S. Brodkin4, James C. Gee1, Ted Abel3, Harish Poptani1*
1 Department of Radiology, Perelman School of Medicine at the University of Pennsylvania, Philadelphia, Pennsylvania, United States of America, 2 Department of
Biostatistics and Epidemiology, Center for Clinical Epidemiology and Biostatistics, Perelman School of Medicine at the University of Pennsylvania, Philadelphia,
Pennsylvania, United States of America, 3 Department of Biology, University of Pennsylvania, Philadelphia, Pennsylvania, United States of America, 4 Center for
Neurobiology and Behavior, Department of Psychiatry, Perelman School of Medicine at the University of Pennsylvania, Philadelphia, Pennsylvania, United States of
America
Abstract
Autism spectrum disorders (ASD) comprise an etiologically heterogeneous set of neurodevelopmental disorders. Neuroligin-3 (NL-3) is a cell adhesion protein that mediates synapse development and has been implicated in ASD. We performed ex-vivo high resolution magnetic resonance imaging (MRI), including diffusion tensor imaging (DTI) and behavioral (socialapproach and zero maze) tests at 3 different time points (30, 50 and 70 days-of-age) on NL-3 and wild-type littermates toassess developmental brain abnormalities in NL-3 mice. MRI data were segmented in 39 different gray and white matterregions. Volumetric measurements, along with DTI indices from these segmented regions were also performed. Aftercontrolling for age and gender, the NL-3 knock-in animals demonstrated significantly reduced sociability and lower anxiety-related behavior in comparison to their wild type littermates. Significantly reduced volume of several white and gray matterregions in the NL-3 knock-in mice were also observed after considering age, gender and time point as covariates. Thesefindings suggest that structural changes in the brain of NL-3 mice are induced by the mutation in the NL-3 gene. Nosignificant differences in DTI indices were observed, which suggests that the NL-3 mutation may not have a profound effecton water diffusion as detected by DTI. The volumetric and DTI studies aid in understanding the biology of disruptingfunction on an ASD risk model and may assist in the development of imaging biomarkers for ASD.
Citation: Kumar M, Duda JT, Hwang W-T, Kenworthy C, Ittyerah R, et al. (2014) High Resolution Magnetic Resonance Imaging for Characterization of theNeuroligin-3 Knock-in Mouse Model Associated with Autism Spectrum Disorder. PLoS ONE 9(10): e109872. doi:10.1371/journal.pone.0109872
Editor: Valerie W Hu, The George Washington University, United States of America
Received March 12, 2014; Accepted September 14, 2014; Published October 9, 2014
Copyright: � 2014 Kumar et al. This is an open-access article distributed under the terms of the Creative Commons Attribution License, which permitsunrestricted use, distribution, and reproduction in any medium, provided the original author and source are credited.
Data Availability: The authors confirm that all data underlying the findings are fully available without restriction. All relevant data are within the paper and itsSupporting Information file.
Funding: This study was supported by R01MH080718 (ESB), R21HD058237 (HP), 1P50MH096891 -subproject 6773 (ESB and TA), 5-T32-MH017168 (TA) and thePennsylvania Department of Health (SAP # 4100042728, TA and ESB). The funders had no role in study design, data collection and analysis, decision to publish,or preparation of the manuscript.
Competing Interests: The authors have declared that no competing interests exist.
* Email: [email protected]
Introduction
Autism spectrum disorder (ASD) comprises a complex and
etiologically heterogeneous group of neurodevelopmental disor-
ders with an unknown unifying pathogenesis. While ASD is
defined by the presence of deficits in social interaction as well as
restricted and repetitive patterns of behavior, ASD is nevertheless
highly heterogeneous in terms of behavior and genetic abnormal-
ities [1–5]. The etiology of ASD is unknown in most cases, but
monogenic heritable forms exist that have provided insights into
ASD pathogenesis and have led to the notion of autism as a
‘synapse disorder’ [4]. Neuroligins are a family of postsynaptic cell-
adhesion molecules that are ligands for neurexins, a class of
synaptic cell-adhesion molecules [6], and Jamain et al. [7]
reported an inherited mutation in the Neuroligin-3 (NL-3) gene
in a family with two brothers having ASD. The point mutation at
the amino acid position 451 (R451C) caused a decrease in the
amount of NL-3 in patients with ASD. Later, the same point
mutation was introduced in a mouse to generate the NL-3 R451C
knock-in mouse model of ASD [6]. The NL-3 knock-in mice have
been reported to exhibit behavioral symptoms similar to those
observed in human ASD [6]. However, a subsequent study did not
observe behavioral phenotypes relevant to ASD in this model, and
therefore raised concerns about the relevance of the model to ASD
[8].
Magnetic Resonance Imaging (MRI) has been employed
extensively to examine morphological changes in human ASD
[9–11] as well as in mouse models relevant to ASD [2,3,12–14].
More recently, diffusion tensor imaging (DTI) has also been used
to characterize ASD in humans [15–17] and animal models
[2,3,12,14]. High resolution microscopic MRI studies have been
used to characterize inbred (BALB/cJ, and BTBR) [12,14] as well
as genetic models of ASD (NL-3 knock-in, 16p11.2) [3,13,14,18].
These studies have been primarily performed on isolated fixed
brain specimens and have reported volumetric differences in
several gray and white matter regions of the ASD brain relative to
PLOS ONE | www.plosone.org 1 October 2014 | Volume 9 | Issue 10 | e109872
normal controls [3]. Recently a DTI study also reported a
correlation between social abnormalities and fractional anisotropy
(FA) in the pre-pubescent BALB/cJ mouse model [12].
High resolution MRI studies of the adult NL-3 knock-in mouse
brain (108 day-old) indicated reduced volume in several regions of
the brain, compared to wild-type (WT) littermates. Despite,
volumetric differences, no differences were noted in any of the
DTI parameters in this study [3]. Since reduced interest in social
interaction (low sociability) is especially prominent in childhood
ASD and the BALB/cJ mice exhibit low sociability and DTI
abnormalities at a pre-pubescent age [2], we hypothesized that the
lack of differences in DTI in the previous study of NL-3 mice may
have been due to the adult age of the mice, as well as the smaller
sample size used [3]. Thus in the current study behavioral assays
(social approach and elevated zero maze tests) and high resolution
MRI studies were performed on 28–30 (juvenile), 48–50 (peri-
pubescent) and 68–70 (early adult) days old NL-3 knock-in mice in
order to characterize the developmental brain changes in this
model and to also look for correlations between behavior and MRI
findings.
Methods
Animal housing and breedingA breeding pair of NL-3 knock-in mice (JAX strain number
008475) was procured from The Jackson Laboratory (Bar Harbor,
ME), bred in-house at the University of Pennsylvania, and
offsprings were genotyped using protocols from Jackson Labs.
All animal experiments were approved by the Institutional Animal
Care and Use Committee (IACUC). At 2–4 days postnatally,
litters were culled to two males and two females to ensure
adequate nutrition for all pups and a more uniform social
environment during development and to also ensure that litters
were balanced in the numbers of males and females. Mice were
group housed in a light and temperature controlled animal facility
that is accredited by the Association for Assessment and
Accreditation of Laboratory Animal Care. Males were removed
from breeding cages prior to the birth of pups. All efforts were
made to minimize animal pain and discomfort. Water and
standard rodent chow were available ad lib. With the exception of
a weekly cage change, mice were not handled until after the
completion of all behavioral tests. To avoid any confounding
effects, similar conditions for housing, feeding and handling were
used throughout the study. This study was started during the
spring of 2011 (4/2011) and completed by in the fall of 2011 (10/
2011). A few animals were randomly selected after each time point
(30, 50 and 70 day-of-age) for imaging. Details of the animal
distributions including age, gender and strains for behavioral
(social approach and elevated zero maze test) and imaging studies
are summarized in Table S1. Due to the longitudinal nature of the
study, some of the animals underwent behavioral study more than
once but since the behavioral studies were separated by 3-weeks,
any potential effects of repeated behavioral testing were mini-
mized. Seasonal effects and cohort differences were further
minimized by selecting the wild type and mutant animals from
the same litter to randomize these effects between the groups. To
reduce the effect of handling, only one person (R.I.) performed all
behavioral assays throughout the study.
Social approach and anxiety testsSocial Approach Test (also known as the Social Choice Test) was
performed on NL-3 knock-in mice and WT mice at 28 (juvenile), 48
(peri-pubescent) and 68 (early adult) days-of-age using a 3-
chambered Plexiglas apparatus under dim lighting (,2 lux) during
testing in order to minimize the general stress level of the mice, as
described previously [2,12,19,20]. The social approach test was
performed in the morning between 9:00 AM to 12:00 noon and all
procedures were videotaped by using a Sony digital video camera
with Night Shot (infrared) feature for recording in low light. The
amount of time spent sniffing the stimulus mouse was used as the
outcome variable for statistical analysis, with longer sniffing time
indicating higher sociability.
Anxiety-related behavior was also assessed in these animals
using the elevated zero maze test, which was performed a day after
the social approach test (at 29, 49 and 69 days-of-age) at
approximately the same time of the day. A circular variant of
the elevated plus maze, the zero maze apparatus consists of a
raised circular track divided into two open and two closed
quadrants. The track had an internal diameter of 40.5 cm and a
width of 5.1 cm and was elevated off the floor at a height of
40 cm. The closed quadrants had walls that were 11 cm high. The
animal was placed into the center of a closed quadrant and
observed for 5 min. Digitized video of each 5 min trial was scored
manually to determine the total time spent in open and closed
quadrants and the number of transitions between each open and
closed quadrant [21,22]. Longer time spent in the open quadrants
indicates lower anxiety-related behavior.
After completion of the zero maze tests, a subset of NL-3 knock-
in mice [n = 25 (10 at 29 day-old, 10 at 49 day-old and 5 at 69 day-
old)] and WT littermates [n = 24 (7 at 29 day-old, 9 at 49 day-old
and 8 at 69 day-old)] were sacrificed at each time point to perform
high resolution MRI on extracted brain samples. Because we
randomly selected a subset of animals after the zero maze test for
imaging, not all animals had behavioral data at all three time
points. The distribution of age, gender and strain of all animals
used in this study is summarized in Table S1. The animals were
anesthetized with an intraperitoneal injection of ketamine.
Following lack of deep tendon responses, the thoracic cavity was
opened under aseptic conditions and the animals were perfused
through the left ventricle with phosphate saline buffer (PBS),
followed by 4% paraformaldehyde (PFA) solution. After perfusion,
the brain was removed from the skull. The extracted perfused
brains were stored at 4uC in 4% PFA solution for 2 weeks to fix the
brain tissue prior to ex vivo high resolution DTI studies.
Sample preparation for ex vivo high resolution DTIPrior to imaging, brain samples were removed from the fixative
and switched back to PBS solution for 48 hours at 4uC to
rehydrate the tissue. After 48 hours, the sample was removed and
rinsed twice with fresh PBS solution and blotted using a soft tissue
paper to remove any remaining PBS. The brain was then placed in
a plastic tube filled with proton-free susceptibility-matching fluid
(Fomblin, Ausimount, Thorofare; USA).
Ex vivo high resolution DTIHigh resolution DTI was performed on a 9.4T, 8.9 cm vertical
bore magnet equipped with a 55 mm inner-diameter 100 gauss/
cm gradient tube and interfaced to a Direct Drive console (Agilent,
Palo Alto, CA, USA) running the vnmrj 2.3.C software version. All
MRI studies employed a horizontally mounted 2 turn, 11620 mm
(ID x length) solenoid RF coil for transmit and receive. The plastic
tube containing the brain sample was placed inside the coil and the
probe was mounted inside the magnet. Scout images were
acquired in 3 orthogonal planes to localize the position and
orientation of the brain sample. DTI data was then acquired using
a 3D multi-echo pulsed-gradient spin echo sequence [23] with oval
sampling in the two phase encoding directions. Acquisition
parameters were: TR = 800 ms; TE = 29.50 ms; number of
High Resolution Magnetic Resonance Imaging in Mouse Model of Autism
PLOS ONE | www.plosone.org 2 October 2014 | Volume 9 | Issue 10 | e109872
echoes = 6, number of averages = 1, b-value = 902 mm2/s, FOV
(field of view) = 17 mm68.5 mm610 mm; acquisition matrix
size = 136668680, resulting in a 125 mm isotropic resolution. The
diffusion-weighted images were acquired with diffusion weighting
in 6 non-collinear directions with both positive and negative
diffusion gradient amplitudes in addition to 2 reference scans with
minimal diffusion weighting for a total of 14 data sets resulting in a
total acquisition time of 13 hours and 19 minutes per sample.
DTI data processing and quantificationImage processing. Image reconstruction was performed
offline using in-house custom software developed in the IDL
programming environment (ITT Visual Information Solutions,
Boulder, CO, USA). Following application of a Gaussian filter and
3D Fourier transformation, the magnitude images from each echo
train were summed in order to improve SNR. Data sets acquired
with opposite polarity diffusion weighting gradients were then
combined in order to minimize contributions of background
gradients to the diffusion data [24]. The resulting group of images
was saved in DTI studio [25] format for further processing.
The b = 0 images for each mouse were registered to a general
brain template in preparation for automated region based
segmentation such that the same ROI was assessed from each
specimen. The alignment and segmentation routines were
performed using Advanced Normalization Tools (ANTs). The
Camino Toolkit [26] was used to estimate the diffusion tensors via
an unweighted linear least-squares to fit to the log measurements
of the diffusion weighted data [27]. To obtain an anatomical
labeling for each sample, a multi-atlas approach was used along
with a publicly available data set consisting of five manually
labeled mouse brains [27]. Diffeomorphic normalization was
performed using the mutual information metric provided by ANTs
[28] to map each sample’s B0 image to each of the five manually
labeled brains. The resulting transformations were used to warp
the five anatomical label sets into each samples DTI space. Finally,
STAPLE [29] was used to merge the multiple label sets to obtain a
final set of probabilistic anatomical labels for each sample as
shown in Figure 1. Using these methods, each mouse brain was
segmented into 39 regions including the ventricles, gray and white
matter regions (Figure 1). These probabilistic labels were then
used to obtain regional volumes, as well as each region’s averaged
values for fractional anisotropy (FA), mean diffusivity (MD,
61023 mm2/s), and radial diffusivity (RD). The regional brain
volumes were computed and divided by the total brain volume
from each individual sample to account for any differences in
volumetric differences associated with extraction or fixation of the
tissue.
Statistical analysisDescriptive statistics were computed for all study variables.
Because animals were subjected to social approach and elevated
zero maze tests repeatedly over time, a linear mixed effect model
was used to analyze the behavioral data which accounts for
possible correlation in outcomes collected from the same animal
over time. Three factors were considered in this model: group
(WT vs NL-3), gender (male vs female) and age/time points (28–
29, 48–49 and 68–69 day) as covariates. The three-way interaction
effect was first tested using a Wald test followed by testing the two-
way interaction effects using likelihood ratio tests. As there was no
evidence for interaction in the social sniffing time, the results from
the final model that included only the main effects terms are
reported. For the anxiety data, the results from a model that
contains the main effects terms and an interaction term between
group and age are reported.
A linear regression model was used to analyze the cross-
sectional volumetric and DTI data that included: group (NL-3 vs
WT) as design factor and gender (male vs female), and the actual
age (in days), as covariates. The interaction effect was first tested
and each region was analyzed separately. Because multiple tests or
regression analyses were done for each of the 39 regions for the
outcomes of DTI indices and volumes, a false-discovery rate
(FDR) was computed to control the type I error and a cut off value
of 0.05 was used to determine statistical significance. None of the
interaction terms reached statistical significance. Therefore, we
reported the results from the model that only included main effects
for the three factors. The adjusted mean volume in the significant
region was computed from the final model using the predictive
average volume of a 50-day male mouse for NL-3 and wild type
animal respectively.
Using data from 28 animals that had both behavioral and
imaging studies, the correlation between social, anxiety measures
and segmented brain volumes were examined by calculating
partial correlation coefficient through a linear regression model
that have been adjusted for group, gender, and age. A p-value of
,0.05 was considered significant. The correlation analysis was
performed only on the selected brain regions which showed
significant differences in volume between wild type and NL-3
mice. All statistical computations were performed using STATA
12 (StataCorp LP, College Station, Texas, USA) and statistical
package for social sciences (SPSS, version 16.0 SPSS, Inc.,
Chicago, IL, USA).
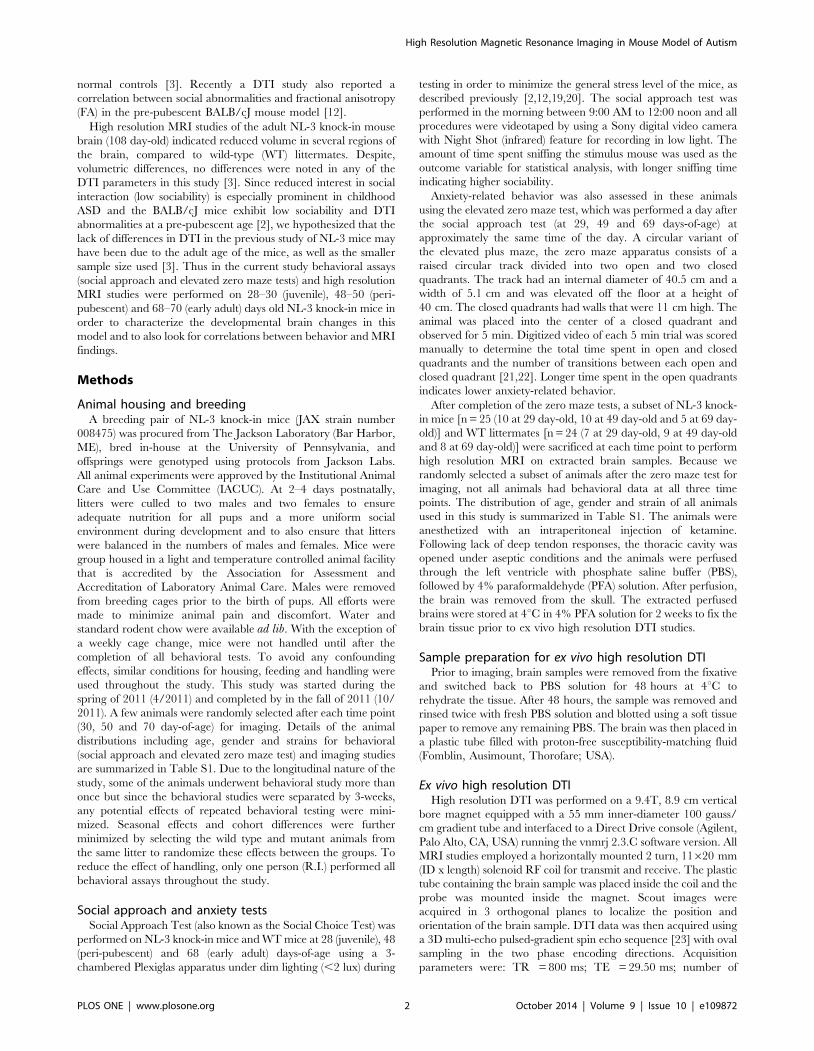
Figure 1. Demonstrating co-registration and segmentation approaches for the analysis of MRI images from the mouse brain. Each ofthe manually labeled brain was co-registered to each sample’s B0 image. The corresponding labels (illustrated as a semi-transparent color overlay)were warped into the sample space and merged via STAPLE. Resulting anatomical labels are illustrated for single wild type and mutant type samples.The olfactory bulb was not included in this analysis due to the variability in extracting the brain tissue leading to incomplete extraction of theolfactory bulbs in some cases. While the resulting labels were probabilistic, the hard segmentations seen here were used for visualization and qualitycontrol, and were created by assigning the label of highest probability at each voxel. The color indicates the different regions of the brain.doi:10.1371/journal.pone.0109872.g001
High Resolution Magnetic Resonance Imaging in Mouse Model of Autism
PLOS ONE | www.plosone.org 3 October 2014 | Volume 9 | Issue 10 | e109872
Results
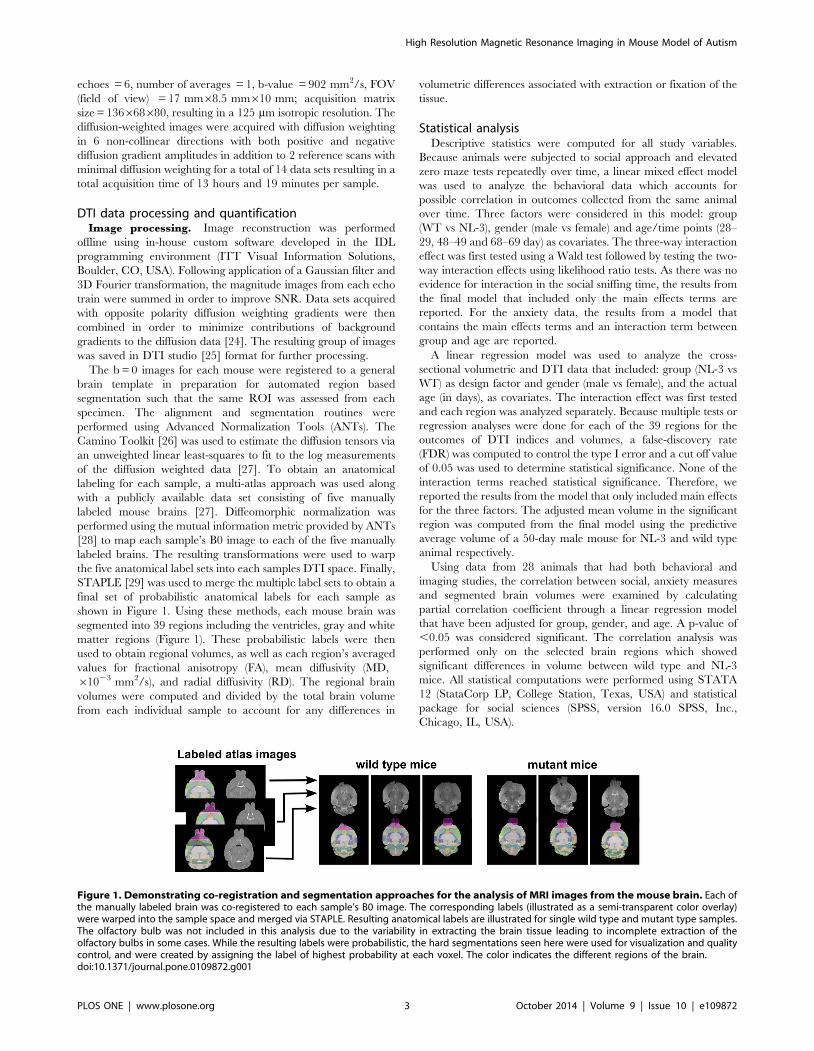
We found no evidence of 3-way and 2-way interaction effects in
social approach behavior (all p-value.0.05). After controlling for
gender and age, the NL-3 knock-in animals exhibited lower social
preference than the WT animals. On an average, the NL-3
animals spent 8.7 seconds (95% CI: 1 to 15 seconds) less time
sniffing the stimulus mouse in comparison to their wild type
littermates (p = 0.019) (Figure 2A). On the test of anxiety, the NL-
3 mice spent significantly longer time in the open quadrant after
controlling for gender and age, indicating lower anxiety
(Figure 2B). There was a significant interaction effect between
group and age (p = 0.006), with a larger difference in anxiety
between NL-3 mice and wild type observed at 49-day time point
Figure 2. Bar graphs from the NL-3 knock-in and wild type littermates showing average social sniffing time (time spent by the testanimal sniffing the stimulus mouse) at 3 different ages (A). Social sniffing test demonstrated significant differences at each time pointsbetween wild type and NL-3 mice (p = 0.019) based on a linear mixed effects model adjusting for gender and age and with no significant groupinteraction. Bar graph showing the average time spent by the animals in the open quadrant of the zero maze test in wild type littermates and NL-3knock-in mice (B). Longer time spent in the open quadrants is thought to reflect lower anxiety-related behavior. Significant differences in anxietyscores were observed between wild type and NL-3 mice at each time point after adjusting for gender and age using a linear mixed effect model. Asignificant group interaction was also observed in anxiety score (p,0.05) based on a liner mixed effects model adjusting for gender and age. Thenumbers inside each bar show the number of animals while the error bars represent SEM.doi:10.1371/journal.pone.0109872.g002
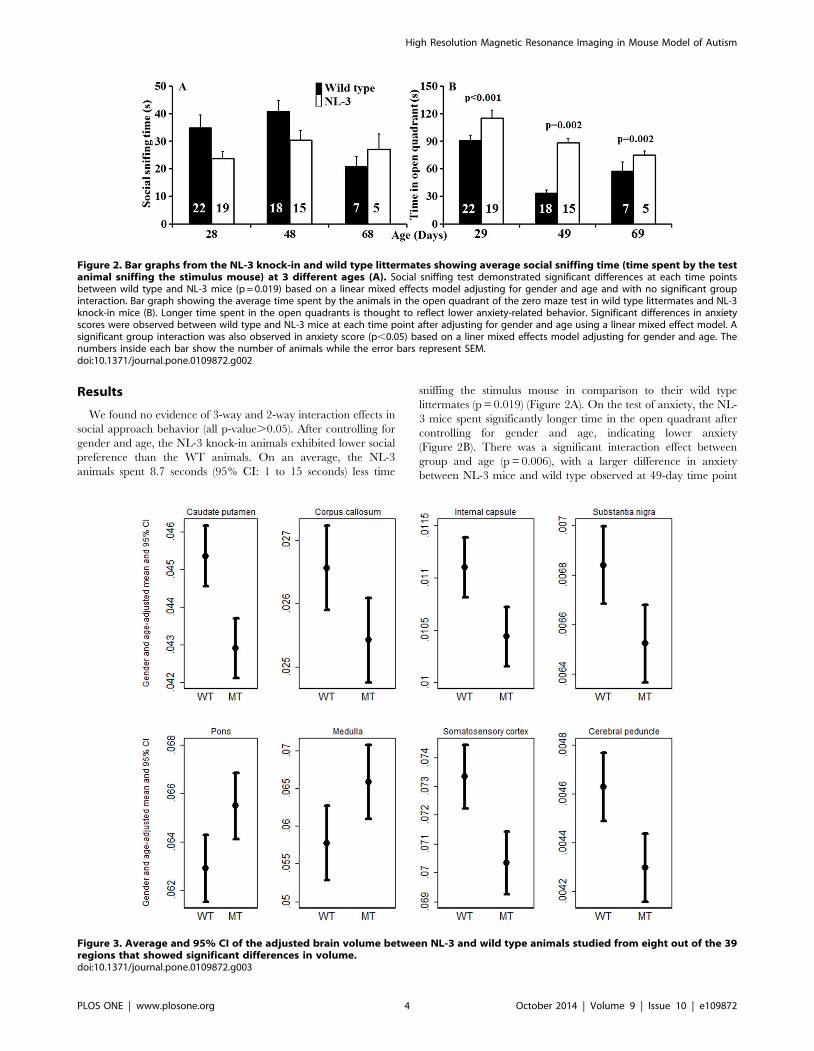
Figure 3. Average and 95% CI of the adjusted brain volume between NL-3 and wild type animals studied from eight out of the 39regions that showed significant differences in volume.doi:10.1371/journal.pone.0109872.g003
High Resolution Magnetic Resonance Imaging in Mouse Model of Autism
PLOS ONE | www.plosone.org 4 October 2014 | Volume 9 | Issue 10 | e109872
Ta
ble
1.
Ave
rag
e6
SDva
lue
sfr
om
DT
Iin
dic
es
(FA
,M
D,
and
RD
)an
dn
orm
aliz
ed
volu
me
fro
mg
ray
and
wh
ite
mat
ter
reg
ion
so
fth
eb
rain
be
twe
en
wild
typ
e(n
=7
)an
dN
L-3
(n=
10
)m
ice
at3
0d
ays
of
age
.
#R
eg
ion
sF
AM
D6
10
23
RD
No
rma
liz
eb
rain
vo
lum
e
WT
NL
-3W
TN
L-3
WT
NL
-3W
TN
L-3
1La
tve
ntr
icle
0.3
66
0.0
30
.326
0.0
30
.256
0.0
20
.266
0.0
30
.216
0.0
20
.236
0.0
30
.206
0.0
20
.196
0.0
2
2H
ipp
oC
A3
0.2
66
0.0
10
.266
0.0
10
.256
0.0
20
.256
0.0
20
.236
0.0
20
.236
0.0
20
.206
0.0
20
.206
0.0
1
3H
ipp
oC
A1
0.2
96
0.0
20
.296
0.0
20
.266
0.0
10
.266
0.0
10
.236
0.0
10
.236
0.0
10
.176
0.0
10
.196
0.0
9
4H
ipp
od
en
tg
yr0
.266
0.0
20
.256
0.0
10
.266
0.0
20
.276
0.0
10
.246
0.0
20
.256
0.0
10
.186
0.0
20
.196
0.0
1
5H
ipp
og
en
0.3
06
0.0
10
.306
0.0
10
.256
0.0
20
.256
0.0
20
.226
0.0
20
.236
0.0
20
.186
0.0
10
.186
0.0
1
6O
lfac
tsy
ste
m0
.256
0.0
30
.266
0.0
30
.266
0.0
20
.256
0.0
20
.256
0.0
20
.236
0.0
20
.836
0.0
20
.916
0.0
1
7Fr
on
tal
cort
ex
0.2
46
0.0
20
.236
0.0
20
.266
0.0
30
.256
0.0
30
.246
0.0
20
.236
0.0
20
.446
0.0
10
.446
0.0
3
8P
eri
rhco
rte
x0
.286
0.0
30
.266
0.0
30
.266
0.0
20
.246
0.0
20
.256
0.0
20
.236
0.0
20
.106
0.0
10
.106
0.0
1
9En
torh
ico
rte
x0
.226
0.0
20
.206
0.0
20
.276
0.0
10
.266
0.0
10
.256
0.0
10
.246
0.0
10
.276
0.0
10
.276
0.0
2
10
Co
rte
xg
en
era
l0
.266
0.0
30
.256
0.0
30
.266
0.0
20
.256
0.0
20
.246
0.0
20
.236
0.0
10
.816
0.0
20
.786
0.0
4
11
Cau
dp
uta
me
n0
.226
0.0
10
.216
0.0
20
.256
0.0
20
.246
0.0
20
.246
0.0
20
.236
0.0
20
.466
0.0
20
.436
0.0
2
12
Bg
ang
ge
ne
ral
0.2
66
0.0
20
.256
0.0
20
.236
0.0
20
.236
0.0
20
.216
0.0
20
.226
0.0
20
.266
0.0
10
.256
0.0
1
13
Co
rpu
sca
llosu
m0
.516
0.0
30
.506
0.0
30
.206
0.0
30
.196
0.0
30
.166
0.0
20
.156
0.0
20
.276
0.0
10
.256
0.0
2
14
An
tco
mm
issu
re0
506
0.0
30
.486
0.0
40
.226
0.0
30
.216
0.0
30
.166
0.0
20
.166
0.0
20
.046
0.0
30
.046
0.0
2
15
Lat
olf
act
trac
t0
.296
0.0
40
.316
0.0
30
.266
0.0
30
.256
0.0
20
.246
0.0
20
.226
0.0
20
.056
0.0
60
.056
0.0
3
16
Inte
rnal
cap
sule
0.5
36
0.0
10
.516
0.0
20
.216
0.0
30
.206
0.0
30
.166
0.0
20
.166
0.0
20
.116
0.0
10
.106
0.0
1
17
Am
ygd
ala
0.2
26
0.0
20
.216
0.0
20
.256
0.0
20
.266
0.0
20
.246
0.0
20
.246
0.0
20
.326
0.0
10
.316
0.0
2
18
Th
ird
ven
tric
le0
.256
0.0
30
.246
0.0
30
.266
0.0
20
.276
0.0
30
.246
0.0
10
.256
0.0
30
.096
0.0
10
.096
0.0
1
19
Th
alam
us
0.3
36
0.0
20
.326
0.0
20
.236
0.0
30
.226
0.0
30
.216
0.0
30
.216
0.0
30
.446
0.0
20
.446
0.0
2
20
Hyp
oth
alam
us
0.2
66
0.0
20
.256
0.0
40
.236
0.0
30
.216
0.0
20
.216
0.0
30
.206
0.0
20
.206
0.0
10
.206
0.0
1
21
Ce
reb
aqu
ed
uct
0.2
46
0.0
50
.256
0.0
40
.336
0.1
00
.266
0.0
50
.316
0.1
00
.266
0.0
50
.296
0.0
20
.316
0.0
1
22
Sub
stan
tia
nig
ra0
.386
0.0
30
.366
0.0
20
.226
0.0
30
.226
0.0
20
.196
0.0
20
.196
0.0
20
.076
0.0
10
.076
0.0
1
23
Sup
+In
fco
lli0
.256
0.0
20
.256
0.0
10
.246
0.0
20
.236
0.0
20
.236
0.0
20
.226
0.0
20
.366
0.0
10
.366
0.0
2
24
Pe
riaq
ue
dG
ray
0.2
56
0.0
30
.256
0.0
20
.236
0.0
40
.226
0.0
30
.216
0.0
30
.216
0.0
30
.126
0.0
10
.136
0.0
1
25
Mid
bra
ing
en
era
l0
.326
0.0
20
.316
0.0
20
.236
0.0
30
.226
0.0
20
.216
0.0
20
.206
0.0
20
.386
0.0
10
.386
0.0
1
26
Ce
reb
ge
ne
ral
0.3
26
0.0
30
.316
0.0
20
.226
0.0
20
.216
0.0
20
.206
0.0
30
.196
0.0
20
.576
0.0
20
.586
0.0
3
27
Fou
rth
ven
tric
le0
.266
0.0
30
.256
0.0
30
.376
0.0
50
.366
0.0
70
.356
0.0
50
.346
0.0
80
.116
0.0
10
.116
0.0
1
28
Po
ns
0.3
56
0.0
30
.346
0.0
20
.276
0.0
20
.256
0.0
20
.246
0.0
20
.226
0.0
20
.626
0.0
20
.666
0.0
3
29
Me
du
lla0
.306
0.0
20
.306
0.0
20
.266
0.0
30
.256
0.0
20
.246
0.0
20
.236
0.0
20
.606
0.0
90
.656
0.0
9
30
Op
tic
ne
rve
0.4
56
0.0
60
.436
0.0
50
.276
0.0
20
.256
0.0
20
.216
0.0
20
.216
0.0
20
.576
0.0
30
.566
0.0
5
31
Forn
ixsy
ste
m0
.496
0.0
50
.496
0.0
30
.226
0.0
30
.226
0.0
20
.176
0.0
30
.166
0.0
20
.126
0.0
10
.126
0.0
1
32
Pit
uit
ary
0.3
46
0.0
90
.326
0.0
70
.416
0.0
70
.356
0.0
90
.376
0.0
80
.336
0.1
00
.036
0.0
10
.036
0.0
1
33
Sep
tum
0.2
96
0.0
30
.266
0.0
30
.236
0.0
30
.236
0.0
30
.216
0.0
20
.216
0.0
20
.086
0.0
10
.086
0.0
1
High Resolution Magnetic Resonance Imaging in Mouse Model of Autism
PLOS ONE | www.plosone.org 5 October 2014 | Volume 9 | Issue 10 | e109872
(83 seconds, 95% CI: 49 to 116 seconds, p = 0.002) and a smaller
difference at day 28 (52 seconds, 95% CI: 34 to 70 seconds, p,
0.001) and day 69 (56 seconds, 95% CI: 21 to 90 seconds,
p = 0.002).
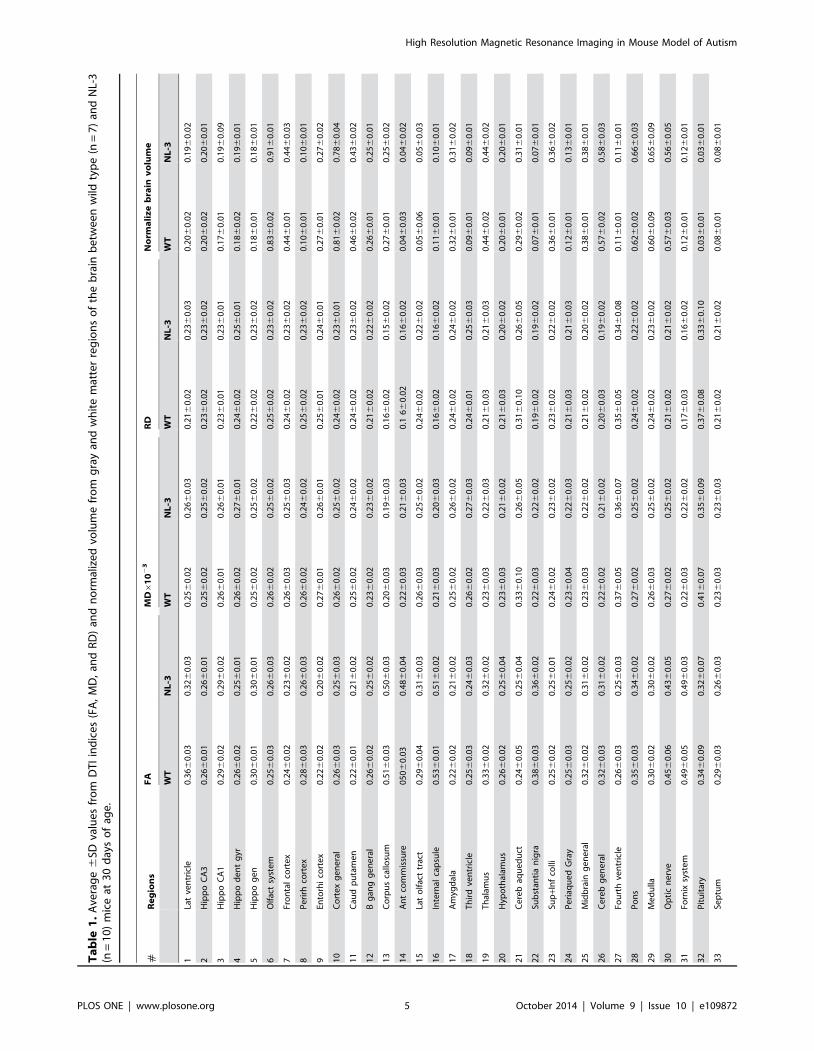
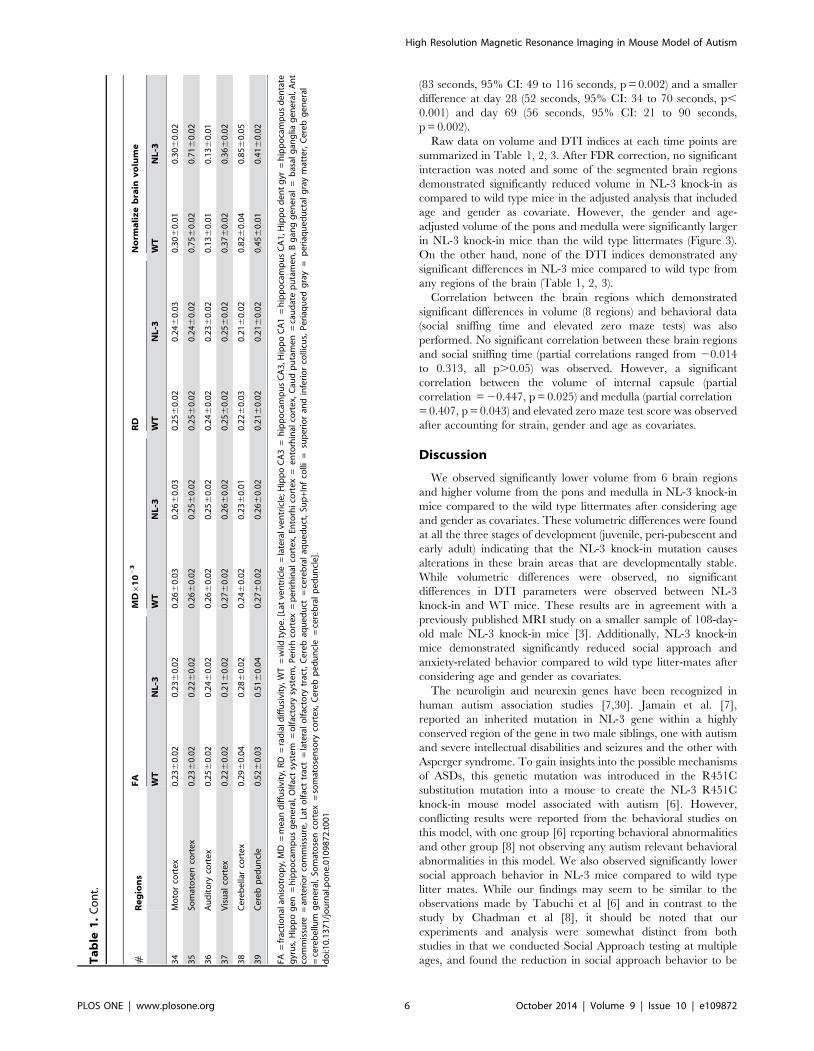
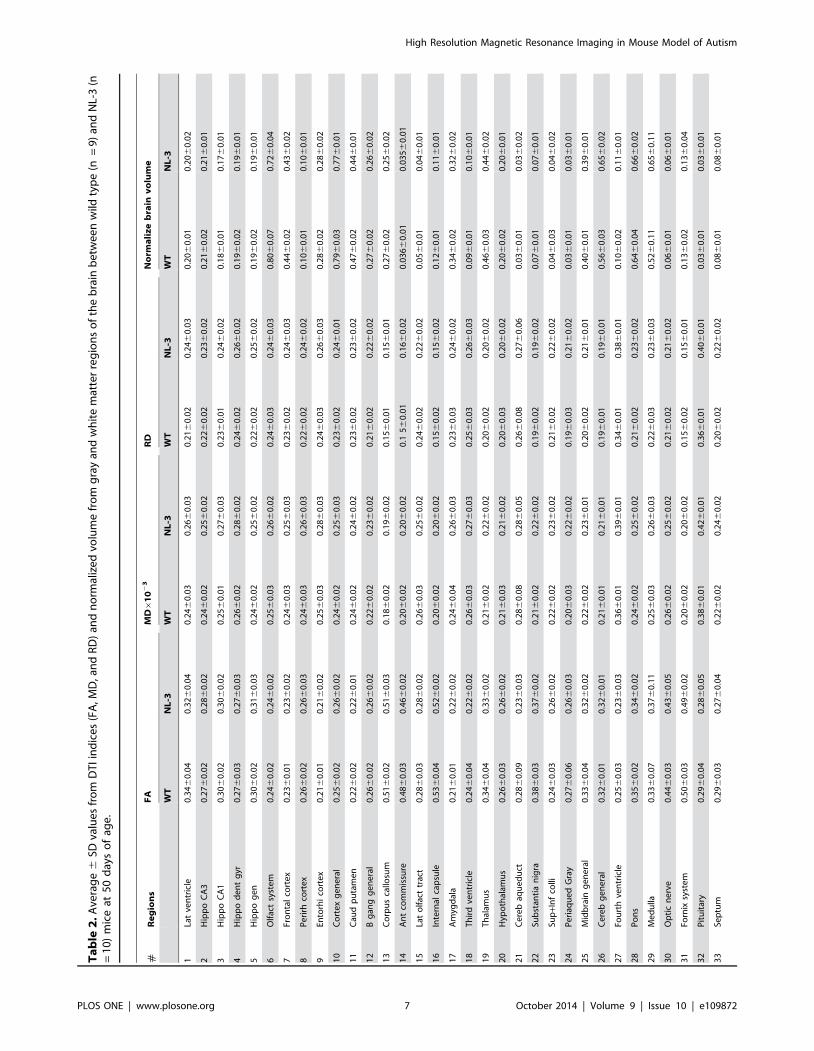
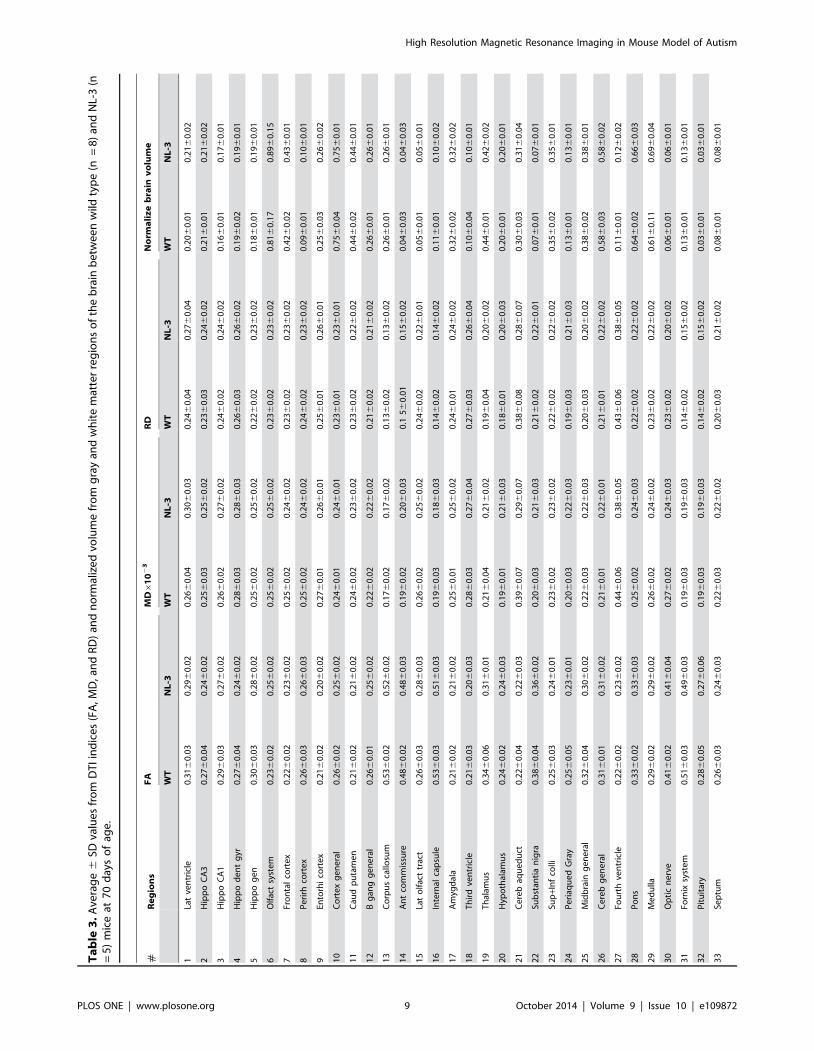
Raw data on volume and DTI indices at each time points are
summarized in Table 1, 2, 3. After FDR correction, no significant
interaction was noted and some of the segmented brain regions
demonstrated significantly reduced volume in NL-3 knock-in as
compared to wild type mice in the adjusted analysis that included
age and gender as covariate. However, the gender and age-
adjusted volume of the pons and medulla were significantly larger
in NL-3 knock-in mice than the wild type littermates (Figure 3).
On the other hand, none of the DTI indices demonstrated any
significant differences in NL-3 mice compared to wild type from
any regions of the brain (Table 1, 2, 3).
Correlation between the brain regions which demonstrated
significant differences in volume (8 regions) and behavioral data
(social sniffing time and elevated zero maze tests) was also
performed. No significant correlation between these brain regions
and social sniffing time (partial correlations ranged from 20.014
to 0.313, all p.0.05) was observed. However, a significant
correlation between the volume of internal capsule (partial
correlation = 20.447, p = 0.025) and medulla (partial correlation
= 0.407, p = 0.043) and elevated zero maze test score was observed
after accounting for strain, gender and age as covariates.
Discussion
We observed significantly lower volume from 6 brain regions
and higher volume from the pons and medulla in NL-3 knock-in
mice compared to the wild type littermates after considering age
and gender as covariates. These volumetric differences were found
at all the three stages of development (juvenile, peri-pubescent and
early adult) indicating that the NL-3 knock-in mutation causes
alterations in these brain areas that are developmentally stable.
While volumetric differences were observed, no significant
differences in DTI parameters were observed between NL-3
knock-in and WT mice. These results are in agreement with a
previously published MRI study on a smaller sample of 108-day-
old male NL-3 knock-in mice [3]. Additionally, NL-3 knock-in
mice demonstrated significantly reduced social approach and
anxiety-related behavior compared to wild type litter-mates after
considering age and gender as covariates.
The neuroligin and neurexin genes have been recognized in
human autism association studies [7,30]. Jamain et al. [7],
reported an inherited mutation in NL-3 gene within a highly
conserved region of the gene in two male siblings, one with autism
and severe intellectual disabilities and seizures and the other with
Asperger syndrome. To gain insights into the possible mechanisms
of ASDs, this genetic mutation was introduced in the R451C
substitution mutation into a mouse to create the NL-3 R451C
knock-in mouse model associated with autism [6]. However,
conflicting results were reported from the behavioral studies on
this model, with one group [6] reporting behavioral abnormalities
and other group [8] not observing any autism relevant behavioral
abnormalities in this model. We also observed significantly lower
social approach behavior in NL-3 mice compared to wild type
litter mates. While our findings may seem to be similar to the
observations made by Tabuchi et al [6] and in contrast to the
study by Chadman et al [8], it should be noted that our
experiments and analysis were somewhat distinct from both
studies in that we conducted Social Approach testing at multiple
ages, and found the reduction in social approach behavior to beTa
ble
1.
Co
nt.
#R
eg
ion
sF
AM
D6
10
23
RD
No
rma
liz
eb
rain
vo
lum
e
WT
NL
-3W
TN
L-3
WT
NL
-3W
TN
L-3
34
Mo
tor
cort
ex
0.2
36
0.0
20
.236
0.0
20
.266
0.0
30
.266
0.0
30
.256
0.0
20
.246
0.0
30
.306
0.0
10
.306
0.0
2
35
Som
ato
sen
cort
ex
0.2
36
0.0
20
.226
0.0
20
.266
0.0
20
.256
0.0
20
.256
0.0
20
.246
0.0
20
.756
0.0
20
.716
0.0
2
36
Au
dit
ory
cort
ex
0.2
56
0.0
20
.246
0.0
20
.266
0.0
20
.256
0.0
20
.246
0.0
20
.236
0.0
20
.136
0.0
10
.136
0.0
1
37
Vis
ual
cort
ex
0.2
26
0.0
20
.216
0.0
20
.276
0.0
20
.266
0.0
20
.256
0.0
20
.256
0.0
20
.376
0.0
20
.366
0.0
2
38
Ce
reb
ella
rco
rte
x0
.296
0.0
40
.286
0.0
20
.246
0.0
20
.236
0.0
10
.226
0.0
30
.216
0.0
20
.826
0.0
40
.856
0.0
5
39
Ce
reb
pe
du
ncl
e0
.526
0.0
30
.516
0.0
40
.276
0.0
20
.266
0.0
20
.216
0.0
20
.216
0.0
20
.456
0.0
10
.416
0.0
2
FA=
frac
tio
nal
anis
otr
op
y,M
D=
me
and
iffu
sivi
ty,R
D=
rad
iald
iffu
sivi
ty,W
T=
wild
typ
e.[
Lat
ven
tric
le=
late
ralv
en
tric
le;H
ipp
oC
A3
=h
ipp
oca
mp
us
CA
3,H
ipp
oC
A1
=h
ipp
oca
mp
us
CA
1,H
ipp
od
en
tg
yr=
hip
po
cam
pu
sd
en
tate
gyr
us,
Hip
po
ge
n=
hip
po
cam
pu
sg
en
era
l,O
lfac
tsy
ste
m=
olf
acto
rysy
ste
m,
Pe
rirh
cort
ex
=p
eri
rhin
alco
rte
x,En
torh
ico
rte
x=
en
torh
inal
cort
ex,
Cau
dp
uta
me
n=
cau
dat
ep
uta
me
n,
Bg
ang
ge
ne
ral
=b
asal
gan
glia
ge
ne
ral,
An
tco
mm
issu
re=
ante
rio
rco
mm
issu
re,
Lat
olf
act
trac
t=
late
ral
olf
acto
rytr
act,
Ce
reb
aqu
ed
uct
=ce
reb
ral
aqu
ed
uct
,Su
p+I
nf
colli
=su
pe
rio
ran
din
feri
or
colli
cus,
Pe
riaq
ue
dg
ray
=p
eri
aqu
ed
uct
alg
ray
mat
ter,
Ce
reb
ge
ne
ral
=ce
reb
ellu
mg
en
era
l,So
mat
ose
nco
rte
x=
som
ato
sen
sory
cort
ex,
Ce
reb
pe
du
ncl
e=
cere
bra
lp
ed
un
cle
].d
oi:1
0.1
37
1/j
ou
rnal
.po
ne
.01
09
87
2.t
00
1
High Resolution Magnetic Resonance Imaging in Mouse Model of Autism
PLOS ONE | www.plosone.org 6 October 2014 | Volume 9 | Issue 10 | e109872
Ta
ble
2.
Ave
rag
e6
SDva
lue
sfr
om
DT
Iin
dic
es
(FA
,MD
,an
dR
D)
and
no
rmal
ize
dvo
lum
efr
om
gra
yan
dw
hit
em
atte
rre
gio
ns
of
the
bra
inb
etw
ee
nw
ildty
pe
(n=
9)
and
NL-
3(n
=1
0)
mic
eat
50
day
so
fag
e.
#R
eg
ion
sF
AM
D6
10
23
RD
No
rma
liz
eb
rain
vo
lum
e
WT
NL
-3W
TN
L-3
WT
NL
-3W
TN
L-3
1La
tve
ntr
icle
0.3
46
0.0
40
.326
0.0
40
.246
0.0
30
.266
0.0
30
.216
0.0
20
.246
0.0
30
.206
0.0
10
.206
0.0
2
2H
ipp
oC
A3
0.2
76
0.0
20
.286
0.0
20
.246
0.0
20
.256
0.0
20
.226
0.0
20
.236
0.0
20
.216
0.0
20
.216
0.0
1
3H
ipp
oC
A1
0.3
06
0.0
20
.306
0.0
20
.256
0.0
10
.276
0.0
30
.236
0.0
10
.246
0.0
20
.186
0.0
10
.176
0.0
1
4H
ipp
od
en
tg
yr0
.276
0.0
30
.276
0.0
30
.266
0.0
20
.286
0.0
20
.246
0.0
20
.266
0.0
20
.196
0.0
20
.196
0.0
1
5H
ipp
og
en
0.3
06
0.0
20
.316
0.0
30
.246
0.0
20
.256
0.0
20
.226
0.0
20
.256
0.0
20
.196
0.0
20
.196
0.0
1
6O
lfac
tsy
ste
m0
.246
0.0
20
.246
0.0
20
.256
0.0
30
.266
0.0
20
.246
0.0
30
.246
0.0
30
.806
0.0
70
.726
0.0
4
7Fr
on
tal
cort
ex
0.2
36
0.0
10
.236
0.0
20
.246
0.0
30
.256
0.0
30
.236
0.0
20
.246
0.0
30
.446
0.0
20
.436
0.0
2
8P
eri
rhco
rte
x0
.266
0.0
20
.266
0.0
30
.246
0.0
30
.266
0.0
30
.226
0.0
20
.246
0.0
20
.106
0.0
10
.106
0.0
1
9En
torh
ico
rte
x0
.216
0.0
10
.216
0.0
20
.256
0.0
30
.286
0.0
30
.246
0.0
30
.266
0.0
30
.286
0.0
20
.286
0.0
2
10
Co
rte
xg
en
era
l0
.256
0.0
20
.266
0.0
20
.246
0.0
20
.256
0.0
30
.236
0.0
20
.246
0.0
10
.796
0.0
30
.776
0.0
1
11
Cau
dp
uta
me
n0
.226
0.0
20
.226
0.0
10
.246
0.0
20
.246
0.0
20
.236
0.0
20
.236
0.0
20
.476
0.0
20
.446
0.0
1
12
Bg
ang
ge
ne
ral
0.2
66
0.0
20
.266
0.0
20
.226
0.0
20
.236
0.0
20
.216
0.0
20
.226
0.0
20
.276
0.0
20
.266
0.0
2
13
Co
rpu
sca
llosu
m0
.516
0.0
20
.516
0.0
30
.186
0.0
20
.196
0.0
20
.156
0.0
10
.156
0.0
10
.276
0.0
20
.256
0.0
2
14
An
tco
mm
issu
re0
.486
0.0
30
.466
0.0
20
.206
0.0
20
.206
0.0
20
.156
0.0
10
.166
0.0
20
.03
66
0.0
10
.03
56
0.0
1
15
Lat
olf
act
trac
t0
.286
0.0
30
.286
0.0
20
.266
0.0
30
.256
0.0
20
.246
0.0
20
.226
0.0
20
.056
0.0
10
.046
0.0
1
16
Inte
rnal
cap
sule
0.5
36
0.0
40
.526
0.0
20
.206
0.0
20
.206
0.0
20
.156
0.0
20
.156
0.0
20
.126
0.0
10
.116
0.0
1
17
Am
ygd
ala
0.2
16
0.0
10
.226
0.0
20
.246
0.0
40
.266
0.0
30
.236
0.0
30
.246
0.0
20
.346
0.0
20
.326
0.0
2
18
Th
ird
ven
tric
le0
.246
0.0
40
.226
0.0
20
.266
0.0
30
.276
0.0
30
.256
0.0
30
.266
0.0
30
.096
0.0
10
.106
0.0
1
19
Th
alam
us
0.3
46
0.0
40
.336
0.0
20
.216
0.0
20
.226
0.0
20
.206
0.0
20
.206
0.0
20
.466
0.0
30
.446
0.0
2
20
Hyp
oth
alam
us
0.2
66
0.0
30
.266
0.0
20
.216
0.0
30
.216
0.0
20
.206
0.0
30
.206
0.0
20
.206
0.0
20
.206
0.0
1
21
Ce
reb
aqu
ed
uct
0.2
86
0.0
90
.236
0.0
30
.286
0.0
80
.286
0.0
50
.266
0.0
80
.276
0.0
60
.036
0.0
10
.036
0.0
2
22
Sub
stan
tia
nig
ra0
.386
0.0
30
.376
0.0
20
.216
0.0
20
.226
0.0
20
.196
0.0
20
.196
0.0
20
.076
0.0
10
.076
0.0
1
23
Sup
+In
fco
lli0
.246
0.0
30
.266
0.0
20
.226
0.0
20
.236
0.0
20
.216
0.0
20
.226
0.0
20
.046
0.0
30
.046
0.0
2
24
Pe
riaq
ue
dG
ray
0.2
76
0.0
60
.266
0.0
30
.206
0.0
30
.226
0.0
20
.196
0.0
30
.216
0.0
20
.036
0.0
10
.036
0.0
1
25
Mid
bra
ing
en
era
l0
.336
0.0
40
.326
0.0
20
.226
0.0
20
.236
0.0
10
.206
0.0
20
.216
0.0
10
.406
0.0
10
.396
0.0
1
26
Ce
reb
ge
ne
ral
0.3
26
0.0
10
.326
0.0
10
.216
0.0
10
.216
0.0
10
.196
0.0
10
.196
0.0
10
.566
0.0
30
.656
0.0
2
27
Fou
rth
ven
tric
le0
.256
0.0
30
.236
0.0
30
.366
0.0
10
.396
0.0
10
.346
0.0
10
.386
0.0
10
.106
0.0
20
.116
0.0
1
28
Po
ns
0.3
56
0.0
20
.346
0.0
20
.246
0.0
20
.256
0.0
20
.216
0.0
20
.236
0.0
20
.646
0.0
40
.666
0.0
2
29
Me
du
lla0
.336
0.0
70
.376
0.1
10
.256
0.0
30
.266
0.0
30
.226
0.0
30
.236
0.0
30
.526
0.1
10
.656
0.1
1
30
Op
tic
ne
rve
0.4
46
0.0
30
.436
0.0
50
.266
0.0
20
.256
0.0
20
.216
0.0
20
.216
0.0
20
.066
0.0
10
.066
0.0
1
31
Forn
ixsy
ste
m0
.506
0.0
30
.496
0.0
20
.206
0.0
20
.206
0.0
20
.156
0.0
20
.156
0.0
10
.136
0.0
20
.136
0.0
4
32
Pit
uit
ary
0.2
96
0.0
40
.286
0.0
50
.386
0.0
10
.426
0.0
10
.366
0.0
10
.406
0.0
10
.036
0.0
10
.036
0.0
1
33
Sep
tum
0.2
96
0.0
30
.276
0.0
40
.226
0.0
20
.246
0.0
20
.206
0.0
20
.226
0.0
20
.086
0.0
10
.086
0.0
1
High Resolution Magnetic Resonance Imaging in Mouse Model of Autism
PLOS ONE | www.plosone.org 7 October 2014 | Volume 9 | Issue 10 | e109872
more striking at earlier ages whereas the other studies conducted
Social Approach Testing only in adult mice.
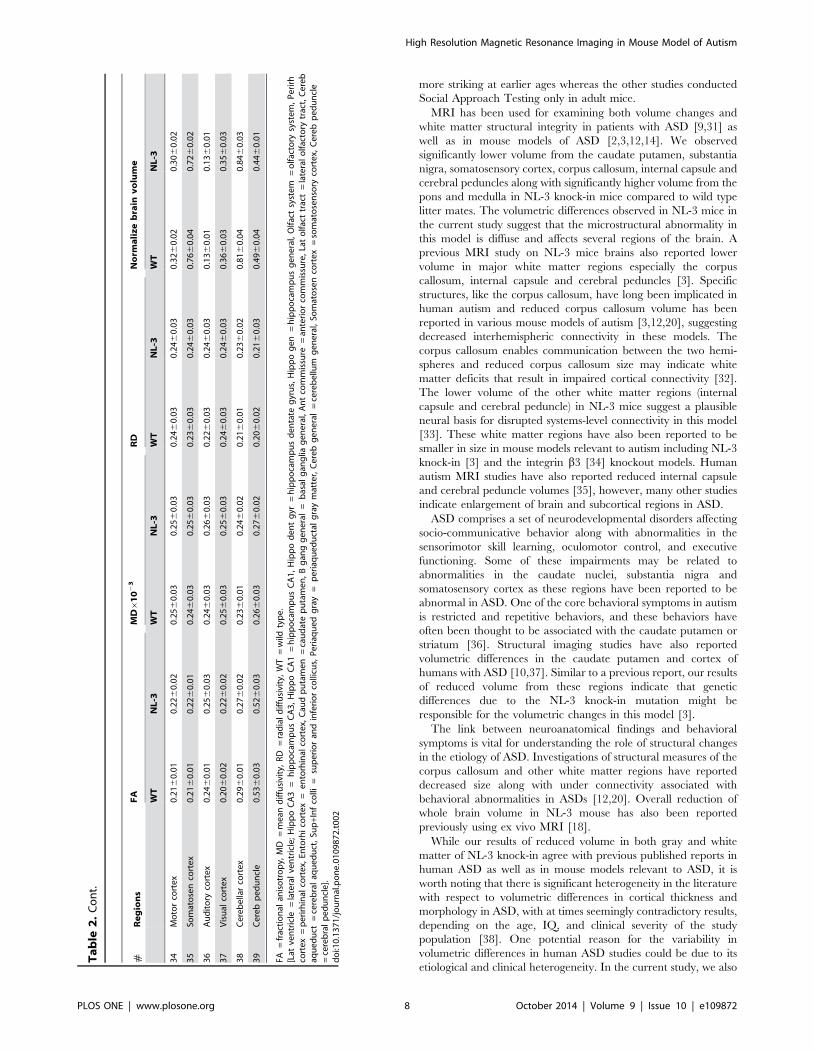
MRI has been used for examining both volume changes and
white matter structural integrity in patients with ASD [9,31] as
well as in mouse models of ASD [2,3,12,14]. We observed
significantly lower volume from the caudate putamen, substantia
nigra, somatosensory cortex, corpus callosum, internal capsule and
cerebral peduncles along with significantly higher volume from the
pons and medulla in NL-3 knock-in mice compared to wild type
litter mates. The volumetric differences observed in NL-3 mice in
the current study suggest that the microstructural abnormality in
this model is diffuse and affects several regions of the brain. A
previous MRI study on NL-3 mice brains also reported lower
volume in major white matter regions especially the corpus
callosum, internal capsule and cerebral peduncles [3]. Specific
structures, like the corpus callosum, have long been implicated in
human autism and reduced corpus callosum volume has been
reported in various mouse models of autism [3,12,20], suggesting
decreased interhemispheric connectivity in these models. The
corpus callosum enables communication between the two hemi-
spheres and reduced corpus callosum size may indicate white
matter deficits that result in impaired cortical connectivity [32].
The lower volume of the other white matter regions (internal
capsule and cerebral peduncle) in NL-3 mice suggest a plausible
neural basis for disrupted systems-level connectivity in this model
[33]. These white matter regions have also been reported to be
smaller in size in mouse models relevant to autism including NL-3
knock-in [3] and the integrin b3 [34] knockout models. Human
autism MRI studies have also reported reduced internal capsule
and cerebral peduncle volumes [35], however, many other studies
indicate enlargement of brain and subcortical regions in ASD.
ASD comprises a set of neurodevelopmental disorders affecting
socio-communicative behavior along with abnormalities in the
sensorimotor skill learning, oculomotor control, and executive
functioning. Some of these impairments may be related to
abnormalities in the caudate nuclei, substantia nigra and
somatosensory cortex as these regions have been reported to be
abnormal in ASD. One of the core behavioral symptoms in autism
is restricted and repetitive behaviors, and these behaviors have
often been thought to be associated with the caudate putamen or
striatum [36]. Structural imaging studies have also reported
volumetric differences in the caudate putamen and cortex of
humans with ASD [10,37]. Similar to a previous report, our results
of reduced volume from these regions indicate that genetic
differences due to the NL-3 knock-in mutation might be
responsible for the volumetric changes in this model [3].
The link between neuroanatomical findings and behavioral
symptoms is vital for understanding the role of structural changes
in the etiology of ASD. Investigations of structural measures of the
corpus callosum and other white matter regions have reported
decreased size along with under connectivity associated with
behavioral abnormalities in ASDs [12,20]. Overall reduction of
whole brain volume in NL-3 mouse has also been reported
previously using ex vivo MRI [18].
While our results of reduced volume in both gray and white
matter of NL-3 knock-in agree with previous published reports in
human ASD as well as in mouse models relevant to ASD, it is
worth noting that there is significant heterogeneity in the literature
with respect to volumetric differences in cortical thickness and
morphology in ASD, with at times seemingly contradictory results,
depending on the age, IQ, and clinical severity of the study
population [38]. One potential reason for the variability in
volumetric differences in human ASD studies could be due to its
etiological and clinical heterogeneity. In the current study, we also
Ta
ble
2.
Co
nt.
#R
eg
ion
sF
AM
D6
10
23
RD
No
rma
liz
eb
rain
vo
lum
e
WT
NL
-3W
TN
L-3
WT
NL
-3W
TN
L-3
34
Mo
tor
cort
ex
0.2
16
0.0
10
.226
0.0
20
.256
0.0
30
.256
0.0
30
.246
0.0
30
.246
0.0
30
.326
0.0
20
.306
0.0
2
35
Som
ato
sen
cort
ex
0.2
16
0.0
10
.226
0.0
10
.246
0.0
30
.256
0.0
30
.236
0.0
30
.246
0.0
30
.766
0.0
40
.726
0.0
2
36
Au
dit
ory
cort
ex
0.2
46
0.0
10
.256
0.0
30
.246
0.0
30
.266
0.0
30
.226
0.0
30
.246
0.0
30
.136
0.0
10
.136
0.0
1
37
Vis
ual
cort
ex
0.2
06
0.0
20
.226
0.0
20
.256
0.0
30
.256
0.0
30
.246
0.0
30
.246
0.0
30
.366
0.0
30
.356
0.0
3
38
Ce
reb
ella
rco
rte
x0
.296
0.0
10
.276
0.0
20
.236
0.0
10
.246
0.0
20
.216
0.0
10
.236
0.0
20
.816
0.0
40
.846
0.0
3
39
Ce
reb
pe
du
ncl
e0
.536
0.0
30
.526
0.0
30
.266
0.0
30
.276
0.0
20
.206
0.0
20
.216
0.0
30
.496
0.0
40
.446
0.0
1
FA=
frac
tio
nal
anis
otr
op
y,M
D=
me
and
iffu
sivi
ty,
RD
=ra
dia
ld
iffu
sivi
ty,
WT
=w
ildty
pe
.[L
atve
ntr
icle
=la
tera
lve
ntr
icle
;H
ipp
oC
A3
=h
ipp
oca
mp
us
CA
3,
Hip
po
CA
1=
hip
po
cam
pu
sC
A1
,H
ipp
od
en
tg
yr=
hip
po
cam
pu
sd
en
tate
gyr
us,
Hip
po
ge
n=
hip
po
cam
pu
sg
en
era
l,O
lfac
tsy
ste
m=
olf
acto
rysy
ste
m,
Pe
rirh
cort
ex
=p
eri
rhin
alco
rte
x,En
torh
ico
rte
x=
en
torh
inal
cort
ex,
Cau
dp
uta
me
n=
cau
dat
ep
uta
me
n,
Bg
ang
ge
ne
ral
=b
asal
gan
glia
ge
ne
ral,
An
tco
mm
issu
re=
ante
rio
rco
mm
issu
re,
Lat
olf
act
trac
t=
late
ral
olf
acto
rytr
act,
Ce
reb
aqu
ed
uct
=ce
reb
ral
aqu
ed
uct
,Su
p+I
nf
colli
=su
pe
rio
ran
din
feri
or
colli
cus,
Pe
riaq
ue
dg
ray
=p
eri
aqu
ed
uct
alg
ray
mat
ter,
Ce
reb
ge
ne
ral
=ce
reb
ellu
mg
en
era
l,So
mat
ose
nco
rte
x=
som
ato
sen
sory
cort
ex,
Ce
reb
pe
du
ncl
e=
cere
bra
lp
ed
un
cle
].d
oi:1
0.1
37
1/j
ou
rnal
.po
ne
.01
09
87
2.t
00
2
High Resolution Magnetic Resonance Imaging in Mouse Model of Autism
PLOS ONE | www.plosone.org 8 October 2014 | Volume 9 | Issue 10 | e109872
Ta
ble
3.
Ave
rag
e6
SDva
lue
sfr
om
DT
Iin
dic
es
(FA
,MD
,an
dR
D)
and
no
rmal
ize
dvo
lum
efr
om
gra
yan
dw
hit
em
atte
rre
gio
ns
of
the
bra
inb
etw
ee
nw
ildty
pe
(n=
8)
and
NL-
3(n
=5
)m
ice
at7
0d
ays
of
age
.
#R
eg
ion
sF
AM
D6
10
23
RD
No
rma
liz
eb
rain
vo
lum
e
WT
NL
-3W
TN
L-3
WT
NL
-3W
TN
L-3
1La
tve
ntr
icle
0.3
16
0.0
30
.296
0.0
20
.266
0.0
40
.306
0.0
30
.246
0.0
40
.276
0.0
40
.206
0.0
10
.216
0.0
2
2H
ipp
oC
A3
0.2
76
0.0
40
.246
0.0
20
.256
0.0
30
.256
0.0
20
.236
0.0
30
.246
0.0
20
.216
0.0
10
.216
0.0
2
3H
ipp
oC
A1
0.2
96
0.0
30
.276
0.0
20
.266
0.0
20
.276
0.0
20
.246
0.0
20
.246
0.0
20
.166
0.0
10
.176
0.0
1
4H
ipp
od
en
tg
yr0
.276
0.0
40
.246
0.0
20
.286
0.0
30
.286
0.0
30
.266
0.0
30
.266
0.0
20
.196
0.0
20
.196
0.0
1
5H
ipp
og
en
0.3
06
0.0
30
.286
0.0
20
.256
0.0
20
.256
0.0
20
.226
0.0
20
.236
0.0
20
.186
0.0
10
.196
0.0
1
6O
lfac
tsy
ste
m0
.236
0.0
20
.256
0.0
20
.256
0.0
20
.256
0.0
20
.236
0.0
20
.236
0.0
20
.816
0.1
70
.896
0.1
5
7Fr
on
tal
cort
ex
0.2
26
0.0
20
.236
0.0
20
.256
0.0
20
.246
0.0
20
.236
0.0
20
.236
0.0
20
.426
0.0
20
.436
0.0
1
8P
eri
rhco
rte
x0
.266
0.0
30
.266
0.0
30
.256
0.0
20
.246
0.0
20
.246
0.0
20
.236
0.0
20
.096
0.0
10
.106
0.0
1
9En
torh
ico
rte
x0
.216
0.0
20
.206
0.0
20
.276
0.0
10
.266
0.0
10
.256
0.0
10
.266
0.0
10
.256
0.0
30
.266
0.0
2
10
Co
rte
xg
en
era
l0
.266
0.0
20
.256
0.0
20
.246
0.0
10
.246
0.0
10
.236
0.0
10
.236
0.0
10
.756
0.0
40
.756
0.0
1
11
Cau
dp
uta
me
n0
.216
0.0
20
.216
0.0
20
.246
0.0
20
.236
0.0
20
.236
0.0
20
.226
0.0
20
.446
0.0
20
.446
0.0
1
12
Bg
ang
ge
ne
ral
0.2
66
0.0
10
.256
0.0
20
.226
0.0
20
.226
0.0
20
.216
0.0
20
.216
0.0
20
.266
0.0
10
.266
0.0
1
13
Co
rpu
sca
llosu
m0
.536
0.0
20
.526
0.0
20
.176
0.0
20
.176
0.0
20
.136
0.0
20
.136
0.0
20
.266
0.0
10
.266
0.0
1
14
An
tco
mm
issu
re0
.486
0.0
20
.486
0.0
30
.196
0.0
20
.206
0.0
30
.156
0.0
10
.156
0.0
20
.046
0.0
30
.046
0.0
3
15
Lat
olf
act
trac
t0
.266
0.0
30
.286
0.0
30
.266
0.0
20
.256
0.0
20
.246
0.0
20
.226
0.0
10
.056
0.0
10
.056
0.0
1
16
Inte
rnal
cap
sule
0.5
36
0.0
30
.516
0.0
30
.196
0.0
30
.186
0.0
30
.146
0.0
20
.146
0.0
20
.116
0.0
10
.106
0.0
2
17
Am
ygd
ala
0.2
16
0.0
20
.216
0.0
20
.256
0.0
10
.256
0.0
20
.246
0.0
10
.246
0.0
20
.326
0.0
20
.326
0.0
2
18
Th
ird
ven
tric
le0
.216
0.0
30
.206
0.0
30
.286
0.0
30
.276
0.0
40
.276
0.0
30
.266
0.0
40
.106
0.0
40
.106
0.0
1
19
Th
alam
us
0.3
46
0.0
60
.316
0.0
10
.216
0.0
40
.216
0.0
20
.196
0.0
40
.206
0.0
20
.446
0.0
10
.426
0.0
2
20
Hyp
oth
alam
us
0.2
46
0.0
20
.246
0.0
30
.196
0.0
10
.216
0.0
30
.186
0.0
10
.206
0.0
30
.206
0.0
10
.206
0.0
1
21
Ce
reb
aqu
ed
uct
0.2
26
0.0
40
.226
0.0
30
.396
0.0
70
.296
0.0
70
.386
0.0
80
.286
0.0
70
.306
0.0
30
.316
0.0
4
22
Sub
stan
tia
nig
ra0
.386
0.0
40
.366
0.0
20
.206
0.0
30
.216
0.0
30
.216
0.0
20
.226
0.0
10
.076
0.0
10
.076
0.0
1
23
Sup
+In
fco
lli0
.256
0.0
30
.246
0.0
10
.236
0.0
20
.236
0.0
20
.226
0.0
20
.226
0.0
20
.356
0.0
20
.356
0.0
1
24
Pe
riaq
ue
dG
ray
0.2
56
0.0
50
.236
0.0
10
.206
0.0
30
.226
0.0
30
.196
0.0
30
.216
0.0
30
.136
0.0
10
.136
0.0
1
25
Mid
bra
ing
en
era
l0
.326
0.0
40
.306
0.0
20
.226
0.0
30
.226
0.0
30
.206
0.0
30
.206
0.0
20
.386
0.0
20
.386
0.0
1
26
Ce
reb
ge
ne
ral
0.3
16
0.0
10
.316
0.0
20
.216
0.0
10
.226
0.0
10
.216
0.0
10
.226
0.0
20
.586
0.0
30
.586
0.0
2
27
Fou
rth
ven
tric
le0
.226
0.0
20
.236
0.0
20
.446
0.0
60
.386
0.0
50
.436
0.0
60
.386
0.0
50
.116
0.0
10
.126
0.0
2
28
Po
ns
0.3
36
0.0
20
.336
0.0
30
.256
0.0
20
.246
0.0
30
.226
0.0
20
.226
0.0
20
.646
0.0
20
.666
0.0
3
29
Me
du
lla0
.296
0.0
20
.296
0.0
20
.266
0.0
20
.246
0.0
20
.236
0.0
20
.226
0.0
20
.616
0.1
10
.696
0.0
4
30
Op
tic
ne
rve
0.4
16
0.0
20
.416
0.0
40
.276
0.0
20
.246
0.0
30
.236
0.0
20
.206
0.0
20
.066
0.0
10
.066
0.0
1
31
Forn
ixsy
ste
m0
.516
0.0
30
.496
0.0
30
.196
0.0
30
.196
0.0
30
.146
0.0
20
.156
0.0
20
.136
0.0
10
.136
0.0
1
32
Pit
uit
ary
0.2
86
0.0
50
.276
0.0
60
.196
0.0
30
.196
0.0
30
.146
0.0
20
.156
0.0
20
.036
0.0
10
.036
0.0
1
33
Sep
tum
0.2
66
0.0
30
.246
0.0
30
.226
0.0
30
.226
0.0
20
.206
0.0
30
.216
0.0
20
.086
0.0
10
.086
0.0
1
High Resolution Magnetic Resonance Imaging in Mouse Model of Autism
PLOS ONE | www.plosone.org 9 October 2014 | Volume 9 | Issue 10 | e109872
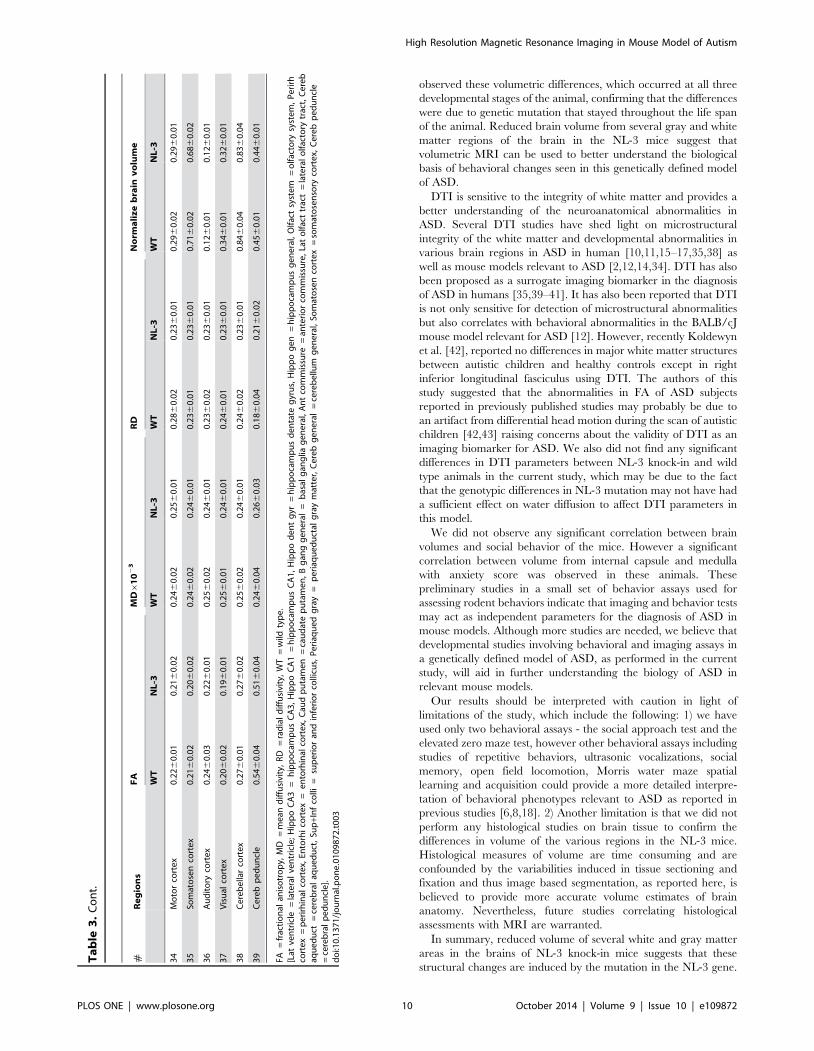
observed these volumetric differences, which occurred at all three
developmental stages of the animal, confirming that the differences
were due to genetic mutation that stayed throughout the life span
of the animal. Reduced brain volume from several gray and white
matter regions of the brain in the NL-3 mice suggest that
volumetric MRI can be used to better understand the biological
basis of behavioral changes seen in this genetically defined model
of ASD.
DTI is sensitive to the integrity of white matter and provides a
better understanding of the neuroanatomical abnormalities in
ASD. Several DTI studies have shed light on microstructural
integrity of the white matter and developmental abnormalities in
various brain regions in ASD in human [10,11,15–17,35,38] as
well as mouse models relevant to ASD [2,12,14,34]. DTI has also
been proposed as a surrogate imaging biomarker in the diagnosis
of ASD in humans [35,39–41]. It has also been reported that DTI
is not only sensitive for detection of microstructural abnormalities
but also correlates with behavioral abnormalities in the BALB/cJ
mouse model relevant for ASD [12]. However, recently Koldewyn
et al. [42], reported no differences in major white matter structures
between autistic children and healthy controls except in right
inferior longitudinal fasciculus using DTI. The authors of this
study suggested that the abnormalities in FA of ASD subjects
reported in previously published studies may probably be due to
an artifact from differential head motion during the scan of autistic
children [42,43] raising concerns about the validity of DTI as an
imaging biomarker for ASD. We also did not find any significant
differences in DTI parameters between NL-3 knock-in and wild
type animals in the current study, which may be due to the fact
that the genotypic differences in NL-3 mutation may not have had
a sufficient effect on water diffusion to affect DTI parameters in
this model.
We did not observe any significant correlation between brain
volumes and social behavior of the mice. However a significant
correlation between volume from internal capsule and medulla
with anxiety score was observed in these animals. These
preliminary studies in a small set of behavior assays used for
assessing rodent behaviors indicate that imaging and behavior tests
may act as independent parameters for the diagnosis of ASD in
mouse models. Although more studies are needed, we believe that
developmental studies involving behavioral and imaging assays in
a genetically defined model of ASD, as performed in the current
study, will aid in further understanding the biology of ASD in
relevant mouse models.
Our results should be interpreted with caution in light of
limitations of the study, which include the following: 1) we have
used only two behavioral assays - the social approach test and the
elevated zero maze test, however other behavioral assays including
studies of repetitive behaviors, ultrasonic vocalizations, social
memory, open field locomotion, Morris water maze spatial
learning and acquisition could provide a more detailed interpre-
tation of behavioral phenotypes relevant to ASD as reported in
previous studies [6,8,18]. 2) Another limitation is that we did not
perform any histological studies on brain tissue to confirm the
differences in volume of the various regions in the NL-3 mice.
Histological measures of volume are time consuming and are
confounded by the variabilities induced in tissue sectioning and
fixation and thus image based segmentation, as reported here, is
believed to provide more accurate volume estimates of brain
anatomy. Nevertheless, future studies correlating histological
assessments with MRI are warranted.
In summary, reduced volume of several white and gray matter
areas in the brains of NL-3 knock-in mice suggests that these
structural changes are induced by the mutation in the NL-3 gene.
Ta
ble
3.
Co
nt.
#R
eg
ion
sF
AM
D6
10
23
RD
No
rma
liz
eb
rain
vo
lum
e
WT
NL
-3W
TN
L-3
WT
NL
-3W
TN
L-3
34
Mo
tor
cort
ex
0.2
26
0.0
10
.216
0.0
20
.246
0.0
20
.256
0.0
10
.286
0.0
20
.236
0.0
10
.296
0.0
20
.296
0.0
1
35
Som
ato
sen
cort
ex
0.2
16
0.0
20
.206
0.0
20
.246
0.0
20
.246
0.0
10
.236
0.0
10
.236
0.0
10
.716
0.0
20
.686
0.0
2
36
Au
dit
ory
cort
ex
0.2
46
0.0
30
.226
0.0
10
.256
0.0
20
.246
0.0
10
.236
0.0
20
.236
0.0
10
.126
0.0
10
.126
0.0
1
37
Vis
ual
cort
ex
0.2
06
0.0
20
.196
0.0
10
.256
0.0
10
.246
0.0
10
.246
0.0
10
.236
0.0
10
.346
0.0
10
.326
0.0
1
38
Ce
reb
ella
rco
rte
x0
.276
0.0
10
.276
0.0
20
.256
0.0
20
.246
0.0
10
.246
0.0
20
.236
0.0
10
.846
0.0
40
.836
0.0
4
39
Ce
reb
pe
du
ncl
e0
.546
0.0
40
.516
0.0
40
.246
0.0
40
.266
0.0
30
.186
0.0
40
.216
0.0
20
.456
0.0
10
.446
0.0
1
FA=
frac
tio
nal
anis
otr
op
y,M
D=
me
and
iffu
sivi
ty,
RD
=ra
dia
ld
iffu
sivi
ty,
WT
=w
ildty
pe
.[L
atve
ntr
icle
=la
tera
lve
ntr
icle
;H
ipp
oC
A3
=h
ipp
oca
mp
us
CA
3,
Hip
po
CA
1=
hip
po
cam
pu
sC
A1
,H
ipp
od
en
tg
yr=
hip
po
cam
pu
sd
en
tate
gyr
us,
Hip
po
ge
n=
hip
po
cam
pu
sg
en
era
l,O
lfac
tsy
ste
m=
olf
acto
rysy
ste
m,
Pe
rirh
cort
ex
=p
eri
rhin
alco
rte
x,En
torh
ico
rte
x=
en
torh
inal
cort
ex,
Cau
dp
uta
me
n=
cau
dat
ep
uta
me
n,
Bg
ang
ge
ne
ral
=b
asal
gan
glia
ge
ne
ral,
An
tco
mm
issu
re=
ante
rio
rco
mm
issu
re,
Lat
olf
act
trac
t=
late
ral
olf
acto
rytr
act,
Ce
reb
aqu
ed
uct
=ce
reb
ral
aqu
ed
uct
,Su
p+I
nf
colli
=su
pe
rio
ran
din
feri
or
colli
cus,
Pe
riaq
ue
dg
ray
=p
eri
aqu
ed
uct
alg
ray
mat
ter,
Ce
reb
ge
ne
ral
=ce
reb
ellu
mg
en
era
l,So
mat
ose
nco
rte
x=
som
ato
sen
sory
cort
ex,
Ce
reb
pe
du
ncl
e=
cere
bra
lp
ed
un
cle
].d
oi:1
0.1
37
1/j
ou
rnal
.po
ne
.01
09
87
2.t
00
3
High Resolution Magnetic Resonance Imaging in Mouse Model of Autism
PLOS ONE | www.plosone.org 10 October 2014 | Volume 9 | Issue 10 | e109872
Future imaging and behavior studies on NL-4 knock-in and
knockout models, which have been suggested to be more relevant to
ASD [44], may help in establishing the role of neuroligins in ASD.
Supporting Information
Table S1 Distribution of animals used in the study.
(DOCX)
Author Contributions
Conceived and designed the experiments: MK HP TA ESB. Performed the
experiments: MK RI SP. Analyzed the data: MK WH JTD. Contributed
reagents/materials/analysis tools: JCG CK JTD. Wrote the paper: MK
HP.
References
1. Geschwind DH (2008) Autism: many genes, common pathways? Cell 135: 391–
395.2. Kumar M, Kim S, Pickup S, Chen R, Fairless AH, et al. (2012) Longitudinal in-
vivo diffusion tensor imaging for assessing brain developmental changes in
BALB/cJ mice, a model of reduced sociability relevant to autism. Brain Res1455: 56–67.
3. Ellegood J, Lerch JP, Henkelman RM (2011) Brain abnormalities in aNeuroligin3 R451C knockin mouse model associated with autism. Autism Res
4: 368–376.4. El-Kordi A, Winkler D, Hammerschmidt K, Kastner A, Krueger D, et al. (2013)
Development of an autism severity score for mice using Nlgn4 null mutants as a
construct-valid model of heritable monogenic autism. Behav Brain Res 251: 41–49.
5. Li X, Zou H, Brown WT (2012) Genes associated with autism spectrumdisorder. Brain Res Bull 88: 543–552.
6. Tabuchi K, Blundell J, Etherton MR, Hammer RE, Liu X, et al. (2007) A
neuroligin-3 mutation implicated in autism increases inhibitory synaptictransmission in mice. Science 318: 71–76.
7. Jamain S, Quach H, Betancur C, Rastam M, Colineaux C, et al. (2003)Mutations of the X-linked genes encoding neuroligins NLGN3 and NLGN4 are
associated with autism. Nat Genet 34: 27–29.8. Chadman KK, Gong S, Scattoni ML, Boltuck SE, Gandhy SU, et al. (2008)
Minimal aberrant behavioral phenotypes of neuroligin-3 R451C knockin mice.
Autism Res 1: 147–158.9. Verhoeven JS, De Cock P, Lagae L, Sunaert S (2010) Neuroimaging of autism.
Neuroradiology 52: 3–14.10. Stigler KA, McDonald BC, Anand A, Saykin AJ, McDougle CJ (2011)
Structural and functional magnetic resonance imaging of autism spectrum
disorders. Brain Res 1380: 146–161.11. Scheel C, Rotarska-Jagiela A, Schilbach L, Lehnhardt FG, Krug B, et al. (2011)
Imaging derived cortical thickness reduction in high-functioning autism: keyregions and temporal slope. Neuroimage 58: 391–400.
12. Kim S, Pickup S, Fairless AH, Ittyerah R, Dow HC, et al. (2012) Association
between sociability and diffusion tensor imaging in BALB/cJ mice. NMRBiomed 25: 104–112.
13. Horev G, Ellegood J, Lerch JP, Son YE, Muthuswamy L, et al. (2011) Dosage-dependent phenotypes in models of 16p11.2 lesions found in autism. Proc Natl
Acad Sci U S A 108: 17076–17081.14. Ellegood J, Babineau BA, Henkelman RM, Lerch JP, Crawley JN (2013)
Neuroanatomical analysis of the BTBR mouse model of autism using magnetic
resonance imaging and diffusion tensor imaging. Neuroimage 70: 288–300.15. Kleinhans NM, Pauley G, Richards T, Neuhaus E, Martin N, et al. (2012) Age-
related abnormalities in white matter microstructure in autism spectrumdisorders. Brain Res 1479: 1–16.
16. Walker L, Gozzi M, Lenroot R, Thurm A, Behseta B, et al. (2012) Diffusion
tensor imaging in young children with autism: biological effects and potentialconfounds. Biol Psychiatry 72: 1043–1051.
17. Billeci L, Calderoni S, Tosetti M, Catani M, Muratori F (2012) White matterconnectivity in children with autism spectrum disorders: a tract-based spatial
statistics study. BMC Neurol 12: 148.18. Radyushkin K, Hammerschmidt K, Boretius S, Varoqueaux F, El-Kordi A, et
al. (2009) Neuroligin-3-deficient mice: model of a monogenic heritable form of
autism with an olfactory deficit. Genes Brain Behav 8: 416–425.19. Sankoorikal GM, Kaercher KA, Boon CJ, Lee JK, Brodkin ES (2006) A mouse
model system for genetic analysis of sociability: C57BL/6J versus BALB/cJinbred mouse strains. Biol Psychiatry 59: 415–423.
20. Fairless AH, Dow HC, Kreibich AS, Torre M, Kuruvilla M, et al. (2012)
Sociability and brain development in BALB/cJ and C57BL/6J mice. BehavBrain Res 228: 299–310.
21. Ecker DJ, Stein P, Xu Z, Williams CJ, Kopf GS, et al. (2004) Long-term effectsof culture of preimplantation mouse embryos on behavior. Proc Natl Acad
Sci U S A 101: 1595–1600.22. Stein JM, Bergman W, Fang Y, Davison L, Brensinger C, et al. (2006)
Behavioral and neurochemical alterations in mice lacking the RNA-binding
protein translin. J Neurosci 26: 2184–2196.23. Mori S, van Zijl PC (1998) A motion correction scheme by twin-echo navigation
for diffusion-weighted magnetic resonance imaging with multiple RF echoacquisition. Magn Reson Med 40: 511–516.
24. Neeman M, Freyer JP, Sillerud LO (1991) A simple method for obtaining cross-
term-free images for diffusion anisotropy studies in NMR microimaging. Magn
Reson Med 21: 138–143.
25. Jiang H, van Zijl PC, Kim J, Pearlson GD, Mori S (2006) DtiStudio: resource
program for diffusion tensor computation and fiber bundle tracking. Comput
Methods Programs Biomed 81: 106–116.
26. Cook PA, Bai Y, Nedjati-Gilani S, Seunarine KK, Hall MG, et al. (2006)
Camino: Open-Source Diffusion-MRI Reconstruction and Processing. Interna-
tional Society for Magentic Resonance in Medicine. Seattle, WA, USA:
International Society for Magentic Resonance in Medicine. pp. P2759.
27. Bai J, Trinh TL, Chuang KH, Qiu A (2012) Atlas-based automatic mouse brain
image segmentation revisited: model complexity vs. image registration. Magn
Reson Imaging 30: 789–798.
28. Avants BB, Yushkevich P, Pluta J, Minkoff D, Korczykowski M, et al. (2010) The
optimal template effect in hippocampus studies of diseased populations.
Neuroimage 49: 2457–2466.
29. Warfield SK, Zou KH, Wells WM (2004) Simultaneous truth and performance
level estimation (STAPLE): an algorithm for the validation of image
segmentation. IEEE Trans Med Imaging 23: 903–921.
30. Laumonnier F, Bonnet-Brilhault F, Gomot M, Blanc R, David A, et al. (2004)
X-linked mental retardation and autism are associated with a mutation in the
NLGN4 gene, a member of the neuroligin family. Am J Hum Genet 74: 552–
557.
31. Beacher FD, Minati L, Baron-Cohen S, Lombardo MV, Lai MC, et al. (2012)
Autism attenuates sex differences in brain structure: a combined voxel-based
morphometry and diffusion tensor imaging study. AJNR Am J Neuroradiol 33:
83–89.
32. Just MA, Keller TA, Malave VL, Kana RK, Varma S (2012) Autism as a neural
systems disorder: a theory of frontal-posterior underconnectivity. Neurosci
Biobehav Rev 36: 1292–1313.
33. Ringo JL (1991) Neuronal interconnection as a function of brain size. Brain
Behav Evol 38: 1–6.
34. Ellegood J, Henkelman RM, Lerch JP (2012) Neuroanatomical Assessment of
the Integrin beta3 Mouse Model Related to Autism and the Serotonin System
Using High Resolution MRI. Front Psychiatry 3: 37.
35. Travers BG, Adluru N, Ennis C, Tromp do PM, Destiche D, et al. (2012)
Diffusion tensor imaging in autism spectrum disorder: a review. Autism Res 5:
289–313.
36. Sears LL, Vest C, Mohamed S, Bailey J, Ranson BJ, et al. (1999) An MRI study
of the basal ganglia in autism. Prog Neuropsychopharmacol Biol Psychiatry 23:
613–624.
37. Amaral DG, Schumann CM, Nordahl CW (2008) Neuroanatomy of autism.
Trends Neurosci 31: 137–145.
38. Baribeau DA, Anagnostou E (2013) A Comparison of Neuroimaging Findings in
Childhood Onset Schizophrenia and Autism Spectrum Disorder: A Review of
the Literature. Front Psychiatry 4: 175.
39. Alexander AL, Lee JE, Lazar M, Boudos R, DuBray MB, et al. (2007) Diffusion
tensor imaging of the corpus callosum in Autism. Neuroimage 34: 61–73.
40. Barnea-Goraly N, Kwon H, Menon V, Eliez S, Lotspeich L, et al. (2004) White
matter structure in autism: preliminary evidence from diffusion tensor imaging.
Biol Psychiatry 55: 323–326.
41. Travers BG, Bigler ED, Tromp do PM, Adluru N, Froehlich AL, et al. (2014)
Longitudinal processing speed impairments in males with autism and the effects
of white matter microstructure. Neuropsychologia 53: 137–145.
42. Koldewyn K, Yendiki A, Weigelt S, Gweon H, Julian J, et al. (2014) Differences
in the right inferior longitudinal fasciculus but no general disruption of white
matter tracts in children with autism spectrum disorder. Proc Natl Acad
Sci U S A 111: 1981–1986.
43. Yendiki A, Koldewyn K, Kakunoori S, Kanwisher N, Fischl B (2013) Spurious
group differences due to head motion in a diffusion MRI study. Neuroimage
88C: 79–90.
44. Jamain S, Radyushkin K, Hammerschmidt K, Granon S, Boretius S, et al.
(2008) Reduced social interaction and ultrasonic communication in a mouse
model of monogenic heritable autism. Proc Natl Acad Sci U S A 105: 1710–
1715.
High Resolution Magnetic Resonance Imaging in Mouse Model of Autism
PLOS ONE | www.plosone.org 11 October 2014 | Volume 9 | Issue 10 | e109872