The contribution of de novo coding mutations to autism spectrum disorder
17
ARTICLE doi:10.1038/nature13908 The contribution of de novo coding mutations to autism spectrum disorder Ivan Iossifov 1 *, Brian J. O’Roak 2,3 *, Stephan J. Sanders 4,5 *, Michael Ronemus 1 *, Niklas Krumm 2 , Dan Levy 1 , Holly A. Stessman 2 , Kali T. Witherspoon 2 , Laura Vives 2 , Karynne E. Patterson 2 , Joshua D. Smith 2 , Bryan Paeper 2 , Deborah A. Nickerson 2 , Jeanselle Dea 4 , Shan Dong 5,6 , Luis E. Gonzalez 7 , Jeffrey D. Mandell 4 , Shrikant M. Mane 8 , Michael T. Murtha 7 , Catherine A. Sullivan 7 , Michael F. Walker 4 , Zainulabedin Waqar 7 , Liping Wei 6,9 , A. Jeremy Willsey 4,5 , Boris Yamrom 1 , Yoon-ha Lee 1 , Ewa Grabowska 1,10 , Ertugrul Dalkic 1,11 , Zihua Wang 1 , Steven Marks 1 , Peter Andrews 1 , Anthony Leotta 1 , Jude Kendall 1 , Inessa Hakker 1 , Julie Rosenbaum 1 , Beicong Ma 1 , Linda Rodgers 1 , Jennifer Troge 1 , Giuseppe Narzisi 1,10 , Seungtai Yoon 1 , Michael C. Schatz 1 , Kenny Ye 12 , W. Richard McCombie 1 , Jay Shendure 2 , Evan E. Eichler 2,13 , Matthew W. State 4,5,7,14 & Michael Wigler 1 Whole exome sequencing has proven to be a powerful tool for understanding the genetic architecture of human disease. Here we apply it to more than 2,500 simplex families, each having a child with an autistic spectrum disorder. By com- paring affected to unaffected siblings, we show that 13% of de novo missense mutations and 43% of de novo likely gene- disrupting (LGD) mutations contribute to 12% and 9% of diagnoses, respectively. Including copy number variants, coding de novo mutations contribute to about 30% of all simplex and 45% of female diagnoses. Almost all LGD mutations occur opposite wild-type alleles. LGD targets in affected females significantly overlap the targets in males of lower intelligence quotient (IQ), but neither overlaps significantly with targets in males of higher IQ. We estimate that LGD mutation in about 400 genes can contribute to the joint class of affected females and males of lower IQ, with an overlapping and similar number of genes vulnerable to contributory missense mutation. LGD targets in the joint class overlap with published targets for intellectual disability and schizophrenia, and are enriched for chromatin modifiers, FMRP-associated genes and embryonically expressed genes. Most of the significance for the latter comes from affected females. Autism spectrum disorder (ASD) is characterized by impaired social interaction and communication, repetitive behaviour and restricted inter- ests. It has a strong male bias, especially in high-functioning affected individuals. The contribution from transmission has long been suspected from increased sibling risk 1 , but more recently the role of germline de novo (DN) mutation has been established, first from large-scale copy number variation in simplex families 2–5 , and subsequently from exome sequencing. The smaller DN variants observed by DNA sequencing pin- point candidate gene targets 6–8 . These developments have promoted a new model for causation, and re-evaluation of sibling risk 9,10 . Here we report whole exome sequencing of the Simons Simplex Col- lection (SSC) 11 and an extensive list of DN mutated targets, including 27 recurrent LGD (nonsense, frameshift and splice site) targets. The size and uniformity of this study allow an unprecedented evaluation of gen- etic vulnerability to ASD. We subdivide target sets by mutation type (missense and LGD) and affected child status (gender and non-verbal IQ, to which we refer throughout as ‘IQ’), and explore the overlap be- tween target sets and their enrichment for certain gene categories. We make estimates of the number of genes vulnerable to a given mutation type and the proportion of simplex autism resulting from DN mutation for each affected subpopulation. SSC sequencing and validation We report on 2,517 of ,2,800 SSC families including ,800 that were previously published 6–8 . We sequenced 2,508 affected children, 1,911 unaffected siblings and the parents of each family. Within the SSC, the overall gender bias in affected individuals, 7 males to 1 female, is nearly twice that typically reported. Exomes were analysed at Cold Spring Har- bor Laboratory (CSHL), Yale School of Medicine, and University of Washington (Extended Data Figs 1 and 2 and Supplementary Table 1). Pipelines were blind with respect to affected status. For uniformity, all data were reanalysed with the CSHL pipeline, allowing comparison of analysis tools. All calls were validated or strongly supported, as listed (Supplementary Table 2) and described (Methods). Rates and targets of DN mutation For greatest precision we measured DN rates in quad families (one affec- ted and one unaffected child) over genomic positions at which all family members had $403 sequence coverage (Methods and Supplementary Table 3). This ‘joint 403 region’ in the SSC was 32 gigabases (Gb) in total, or 48% of the targeted exome, from 1,867 quads. DN events were shared by siblings 1% of the time (Supplementary Table 2); and 1% of mutations had nearby nucleotide positions altered, presumably by single mutagenic events 12–14 (Supplementary Table 4). The overall rate of base substitu- tion is 1.8 3 10 28 (610 29 ) per base pair (Supplementary Table 5). Rates of DN synonymous mutation in affected (0.34 per child) and unaffected (0.33 per child) siblings do not differ significantly (Fig. 1). By contrast, LGD mutations occur at significantly higher rates in affec- ted versus unaffected siblings (Fig. 1 and Extended Data Fig. 3). The rate of LGD mutations is 0.12 in unaffected siblings and 0.21 in affected *These authors contributed equally to this work. 1 Cold Spring Harbor Laboratory, Cold Spring Harbor, New York 11724, USA. 2 Department of Genome Sciences, University of Washington School of Medicine, Seattle, Washington 98195, USA. 3 Molecular & Medical Genetics, Oregon Health & Science University, Portland, Oregon 97208, USA. 4 Department of Psychiatry, University of California, San Francisco, San Francisco, California 94158, USA. 5 Department of Genetics, Yale University School of Medicine, New Haven, Connecticut 06520, USA. 6 Center for Bioinformatics, State Key Laboratory of Protein and Plant Gene Research, School of Life Sciences, Peking University, Beijing 100871, China. 7 Child Study Center, Yale University School of Medicine, New Haven, Connecticut 06520, USA. 8 Yale Center for Genomic Analysis, Yale University School of Medicine, New Haven, Connecticut 06520, USA. 9 National Institute of Biological Sciences, Beijing 102206, China. 10 New York Genome Center, New York, New York 10013, USA. 11 Department of Medical Biology, Bulent Ecevit University School of Medicine, 67600 Zonguldak, Turkey. 12 Department of Epidemiology and Population Health, Albert Einstein College of Medicine, Bronx, New York 10461, USA. 13 Howard Hughes Medical Institute, Seattle, Washington 98195, USA. 14 Department of Psychiatry, Yale University School of Medicine, New Haven, Connecticut 06520, USA. 216 | NATURE | VOL 515 | 13 NOVEMBER 2014 Macmillan Publishers Limited. All rights reserved ©2014
-
Upload
independent -
Category
Documents
-
view
3 -
download
0
Transcript of The contribution of de novo coding mutations to autism spectrum disorder

ARTICLEdoi:10.1038/nature13908
The contribution of de novo codingmutations to autism spectrum disorderIvan Iossifov1*, Brian J. O’Roak2,3*, Stephan J. Sanders4,5*, Michael Ronemus1*, Niklas Krumm2, Dan Levy1, Holly A. Stessman2,Kali T. Witherspoon2, Laura Vives2, Karynne E. Patterson2, Joshua D. Smith2, Bryan Paeper2, Deborah A. Nickerson2,Jeanselle Dea4, Shan Dong5,6, Luis E. Gonzalez7, Jeffrey D. Mandell4, Shrikant M. Mane8, Michael T. Murtha7,Catherine A. Sullivan7, Michael F. Walker4, Zainulabedin Waqar7, Liping Wei6,9, A. Jeremy Willsey4,5, Boris Yamrom1,Yoon-ha Lee1, Ewa Grabowska1,10, Ertugrul Dalkic1,11, Zihua Wang1, Steven Marks1, Peter Andrews1, Anthony Leotta1,Jude Kendall1, Inessa Hakker1, Julie Rosenbaum1, Beicong Ma1, Linda Rodgers1, Jennifer Troge1, Giuseppe Narzisi1,10,Seungtai Yoon1, Michael C. Schatz1, Kenny Ye12, W. Richard McCombie1, Jay Shendure2, Evan E. Eichler2,13,Matthew W. State4,5,7,14 & Michael Wigler1
Whole exome sequencing has proven to be a powerful tool for understanding the genetic architecture of human disease.Here we apply it to more than 2,500 simplex families, each having a child with an autistic spectrum disorder. By com-paring affected to unaffected siblings, we show that 13% of de novo missense mutations and 43% of de novo likely gene-disrupting (LGD) mutations contribute to 12% and 9% of diagnoses, respectively. Including copy number variants, codingde novo mutations contribute to about 30% of all simplex and 45% of female diagnoses. Almost all LGD mutations occuropposite wild-type alleles. LGD targets in affected females significantly overlap the targets in males of lower intelligencequotient (IQ), but neither overlaps significantly with targets in males of higher IQ. We estimate that LGD mutation in about400 genes can contribute to the joint class of affected females and males of lower IQ, with an overlapping and similarnumber of genes vulnerable to contributory missense mutation. LGD targets in the joint class overlap with publishedtargets for intellectual disability and schizophrenia, and are enriched for chromatin modifiers, FMRP-associated genesand embryonically expressed genes. Most of the significance for the latter comes from affected females.
Autism spectrum disorder (ASD) is characterized by impaired socialinteraction and communication, repetitive behaviour and restricted inter-ests. It has a strong male bias, especially in high-functioning affectedindividuals. The contribution from transmission has long been suspectedfrom increased sibling risk1, but more recently the role of germline denovo (DN) mutation has been established, first from large-scale copynumber variation in simplex families2–5, and subsequently from exomesequencing. The smaller DN variants observed by DNA sequencing pin-point candidate gene targets6–8. These developments have promoted anew model for causation, and re-evaluation of sibling risk9,10.
Here we report whole exome sequencing of the Simons Simplex Col-lection (SSC)11 and an extensive list of DN mutated targets, including27 recurrent LGD (nonsense, frameshift and splice site) targets. The sizeand uniformity of this study allow an unprecedented evaluation of gen-etic vulnerability to ASD. We subdivide target sets by mutation type(missense and LGD) and affected child status (gender and non-verbalIQ, to which we refer throughout as ‘IQ’), and explore the overlap be-tween target sets and their enrichment for certain gene categories. Wemake estimates of the number of genes vulnerable to a given mutationtype and the proportion of simplex autism resulting from DN mutationfor each affected subpopulation.
SSC sequencing and validationWe report on 2,517 of ,2,800 SSC families including ,800 that werepreviously published6–8. We sequenced 2,508 affected children, 1,911
unaffected siblings and the parents of each family. Within the SSC, theoverall gender bias in affected individuals, 7 males to 1 female, is nearlytwice that typically reported. Exomes were analysed at Cold Spring Har-bor Laboratory (CSHL), Yale School of Medicine, and University ofWashington (Extended Data Figs 1 and 2 and Supplementary Table 1).Pipelines were blind with respect to affected status. For uniformity, alldata were reanalysed with the CSHL pipeline, allowing comparison ofanalysis tools. All calls were validated or strongly supported, as listed(Supplementary Table 2) and described (Methods).
Rates and targets of DN mutationFor greatest precision we measured DN rates in quad families (one affec-ted and one unaffected child) over genomic positions at which all familymembers had $403 sequence coverage (Methods and SupplementaryTable 3). This ‘joint 403 region’ in the SSC was 32 gigabases (Gb) in total,or 48% of the targeted exome, from 1,867 quads. DN events were sharedby siblings 1% of the time (Supplementary Table 2); and 1% of mutationshad nearby nucleotide positions altered, presumably by single mutagenicevents12–14 (Supplementary Table 4). The overall rate of base substitu-tion is 1.8 3 1028 (61029) per base pair (Supplementary Table 5).
Rates of DN synonymous mutation in affected (0.34 per child) andunaffected (0.33 per child) siblings do not differ significantly (Fig. 1).By contrast, LGD mutations occur at significantly higher rates in affec-ted versus unaffected siblings (Fig. 1 and Extended Data Fig. 3). Therate of LGD mutations is 0.12 in unaffected siblings and 0.21 in affected
*These authors contributed equally to this work.
1Cold Spring Harbor Laboratory, Cold Spring Harbor, New York 11724, USA. 2Departmentof Genome Sciences, University of Washington School of Medicine, Seattle, Washington 98195, USA. 3Molecular &Medical Genetics, Oregon Health & Science University, Portland, Oregon 97208, USA. 4Department of Psychiatry, University of California, San Francisco, San Francisco, California 94158, USA. 5Departmentof Genetics, Yale University School of Medicine, New Haven, Connecticut 06520, USA. 6Center for Bioinformatics, State Key Laboratory of Protein and Plant Gene Research, School of Life Sciences, PekingUniversity, Beijing 100871, China. 7Child Study Center, Yale University School of Medicine, New Haven, Connecticut 06520, USA. 8Yale Center for Genomic Analysis, Yale University School of Medicine, NewHaven, Connecticut 06520, USA. 9National Institute of Biological Sciences, Beijing 102206, China. 10New York Genome Center, New York, New York 10013, USA. 11Department of Medical Biology, BulentEcevit University School of Medicine, 67600 Zonguldak, Turkey. 12Department of Epidemiology and Population Health, Albert Einstein College of Medicine, Bronx, New York 10461, USA. 13Howard HughesMedical Institute, Seattle, Washington 98195, USA. 14Department of Psychiatry, Yale University School of Medicine, New Haven, Connecticut 06520, USA.
2 1 6 | N A T U R E | V O L 5 1 5 | 1 3 N O V E M B E R 2 0 1 4
Macmillan Publishers Limited. All rights reserved©2014

probands, an ‘ascertainment differential’ of 0.21 2 0.12 5 0.09 (P 5
2 3 1025). Thus, we estimate ,43% (0.09 out of 0.21) of LGD eventsin probands contribute to ASD diagnoses. For DN missense, the rate is0.82 for unaffected siblings and 0.94 for affected probands, an ascer-tainment differential of 0.12 (P 5 0.01). We estimate only ,13% (0.12out of 0.94) of DN missense events in probands contribute to ASDdiagnoses. There is a wide confidence interval for the missense ascer-tainment differential (Supplementary Table 6); for this reason, we con-sider primarily the LGD events for our analysis and look on missensedata as supporting.
To identify gene targets for DN mutation, we examined all familydata including trios. We provide a complete list of all mutations (Sup-plementary Table 2) along with the number of mutations of each typein each gene (Supplementary Table 7). A total of 391 DN LGD muta-tions in 353 target genes were identified and validated in autism pro-bands. Of these, 27 target genes were recurrent (Fig. 2). Among 1,500missense targets in probands, 145 were recurrent.
We examined all alleles transmitted opposite a DN LGD target. Wesaw no instance in 391 observations in which the allele opposite anLGD target carried a rare transmitted LGD variant (in ,1% of parentalexomes), and only four in which such an allele carried a rare missensevariant. Thus, the DN mutations do not generally cause homozygousloss-of-function of their target (Supplementary Table 8).
Confirming previous results7,8,15, observed DN mutations arise threetimes as often in the paternal background, and mutation rates rise withage of either parent (Extended Data Fig. 4 and Methods). The latter mayprovide a partial explanation for increased autism rates in children bornof older parents.
Functional clustering in target genesPrevious studies presented evidence of functional clustering in targetsof DN LGD mutation in affected individuals6–8,16. Our larger data setwas examined with an improved null ‘length model’ for mutation inwhich the probability of DN mutation in a gene is proportional to itslength (Methods and Extended Data Fig. 5). We tested for enrichmentwithin DN LGD and missense targets in probands and siblings for thefollowing six classes: (1) FMRP target genes, with transcripts bound bythe fragile X mental retardation protein8,17; (2) genes encoding chromatinmodifiers; (3) genes expressed preferentially in embryos18,19; (4) genesencoding postsynaptic density proteins20; (5) essential genes21; and (6)genes identified as Mendelian disease genes22 (Table 1, SupplementaryTable 6 and Methods). These data provide the strongest evidence yet for
overlap of DN LGD targets in affected probands with FMRP targets (55observed versus 34.1 expected; P 5 4 3 1024) and chromatin modifiers(26 observed versus 11.8 expected; P 5 3 3 1024). We also observed sig-nal from mutation in genes expressed in embryonic development23 (65observed versus 45.0 expected; P 5 2 3 1023). The latter signal comesmainly from the small number of female affected individuals (23 ob-served versus 8.5 expected from 67 LGD targets; P 5 5 3 1026). The 27genes with recurrent LGDs show strong enrichment for FMRP targets(14 observed versus 2.6 expected; P 5 4 3 1028) and chromatin modi-fiers (6 observed versus 0.9 expected; P 5 2 3 1024). By contrast, nosignificant enrichment for these gene sets is seen for the DN LGD tar-gets in unaffected siblings.
The 1,500 DN missense targets in probands are also enriched forFMRP targets and embryonically expressed genes. We observe 171FMRP targets (144.8 expected; P 5 0.03), and 220 embryonically ex-pressed genes (191.4 expected; P 5 0.03). As before, the signal for em-bryonically expressed genes comes almost entirely from the small numberof female affected individuals (48 observed, 31.1 expected from 244 tar-gets; P 5 0.002). With the exception of chromatin modifiers, contrib-utory DN missense and LGD mutations tend to strike similar functionalclasses of genes.
De novo mutation and IQHigher IQ probands are heavily skewed towards males24. For furtheranalyses, we chose to divide the affected male population roughly inhalf into higher and lower IQ sets. We investigated whether higher IQ(.90) males comprise a population with a distinguishable genetic sig-nature. There is a decreased ascertainment differential for DN LGDmutations in male children with higher IQ relative to other affectedindividuals (Extended Data Fig. 3 and Supplementary Table 6). This isnot statistically significant over the joint 403 region. However, overthe entire data set, the drop in IQ is 5 points for males with DN LGDmutation compared to those without mutation (P 5 0.01; Fig. 2). Themean IQ of affected males with recurrent DN LGDs drops 20 points(P 5 0.00001, Fig. 2). Significance is also evident as we examine targetsby functional class. Males with LGD mutations in FMRP targets havean average 14-point drop (P 5 0.001). This trend continues with LGDtargets in the other functional classes—chromatin modifiers and embry-onically expressed genes—but with reduced significance. We observelittle signal from DN missense mutation, even in recurrent targets, eitherbecause these events are less likely to contribute or because they are lesssevere. Female probands show the same trends as males, but as theycomprise a smaller population, the significance is weak (Fig. 2).
Further evidence for a distinguishable signature among the higherIQ comes from the functional enrichment within DN target gene sets.LGD targets in females are enriched for all three functional gene classes.LGD targets in lower IQ affected males are significantly enriched forthe FMRP-associated and chromatin-modifier gene classes (Supplemen-tary Table 6). However, for LGD targets in higher IQ males we see nostatistically significant enrichment for any of the gene categories.
Target overlaps in children and mutation-type groupsWe partitioned children into four primary groups: unaffected siblings,affected females, affected males with higher IQ, and affected maleswith lower IQ. We analysed these and various combinations for threetypes of DN mutations: LGDs, missense and synonymous (Supplemen-tary Table 6). Targets of synonymous mutations in all children andtargets of LGD and missense mutations in unaffected siblings have nosignificant overlap with targets from any other group. We see no signi-ficant overlap between targets in higher IQ males with targets from othergroups. In strong contrast, the 67 LGD targets from affected femalesoverlap significantly with the 166 LGD targets from lower IQ affectedmales (10 observed, 1.3 expected, P 5 7 3 1027). We therefore refer tothe group of lower IQ males and affected females as a ‘joint’ class. In thisclass, the 874 missense and 223 LGD targets also overlap significantly (39observed, 22.1 expected, P 5 0.0008). Thus, not only do missense and
Substitutions
P = 1 × 10⁻³
Synonymous
P = 0.56
Splice site
P = 0.03
Nonsense
P = 9 × 10⁻³
Missense
P = 0.01
0.0
0.5
1.0
1.5
0.00
0.10
0.05
Even
ts p
er
ch
ildE
ven
ts p
er
ch
ild
0.0
0.1
0.2 0.3
0.0
0.1
0.2ASD
Sib
Indels
P = 0.03
Frameshift
P = 7 × 10⁻³
No frameshift
P = 0.47
LGDs
P = 2 × 10⁻⁵
Figure 1 | Rates of de novo events by mutational type in the SSC. Ratesper child are estimated from the 403 joint coverage target region, thenextrapolated for the entire exome. Mutation types are displayed by class,and the combined rate for all LGDs is shown at the bottom right. For each eventtype, the significance between probands and unaffected siblings is given.Sib, unaffected siblings. The errors bar represent 95% confidence interval forthe mean rates.
ARTICLE RESEARCH
1 3 N O V E M B E R 2 0 1 4 | V O L 5 1 5 | N A T U R E | 2 1 7
Macmillan Publishers Limited. All rights reserved©2014

LGD mutation target genes with shared functionality, the same genesare sometimes targeted.
Number of vulnerable genesOur analysis of functional clustering and overlaps within target classessuggests that the mutations ascertained in probands target restricted
sets of vulnerable genes. We next sought evidence for excess recurrenceof targets. We first examined synonymous mutations and mutations inunaffected children. Among the 647 synonymous events in probands,there are 25 gene targets found in more than one child, close to the nullexpectation of 19.9 (P 5 0.13). Recurrent LGD (n 5 3 out of 179 events)or missense targets (70 out of 1,143 events) in unaffected siblings are
Table 1 | Enrichment of DN mutations in six gene classesrDN LGD (ASD) DN LGD (ASD) DN miss (ASD) DN LGD (sib) DN miss (sib)
No. of genes Overlap (27) Overlap (353) Overlap (1,513) Overlap (176) Overlap (1,066)
Gene class Obs Exp P Obs Exp P Obs Exp P Obs Exp P Obs Exp P
FMRP 842 14 2.6 4 3 1028 55 34.1 4 3 1024 171 144.8 0.03 14 17.0 0.52 117 102.9 0.15Chromatin 428 6 0.9 2 3 1024 26 11.8 3 3 1024 57 50.0 0.31 5 5.9 1.00 37 35.6 0.80Embryonic 1,912 6 3.4 0.15 65 45.0 2 3 1023 220 191.4 0.03 20 22.5 0.65 142 136.0 0.58PSD 1,445 4 2.5 0.31 34 32.5 0.78 159 138.1 0.07 22 16.2 0.15 113 98.1 0.12Essential 1,750 7 3.2 0.04 50 42.4 0.22 201 180.3 0.10 20 21.2 0.91 127 128.1 0.96Mendelian 256 0 0.6 1.00 3 8.0 0.07 31 34.0 0.66 5 4.0 0.61 20 24.1 0.47DN LGD (Scz) 93 2 0.3 0.03 9 3.7 0.01 16 15.7 0.90 2 1.8 0.71 8 11.2 0.45DN LGD (ID) 30 3 0.1 1 3 1024 8 1.2 3 3 1025 10 4.9 0.04 0 0.6 1.00 5 3.5 0.41
We tested eight classes (Methods) for enrichment against five lists of targets of DN mutations. These include genes with (1) recurrent DN LGD mutations in probands (rDN LGD (ASD)); (2) DN LGD mutations inprobands (DN LGD (ASD)); (3) DN missense mutations in probands (DN miss (ASD)); (4) DN LGDs in siblings (DN LGD (sib)); and (5) DN missense mutations in siblings (DN miss (sib)). Observed (obs) andexpected (exp) numbers are shown with P values obtained from two-sided binomial tests. Expected numbers and P values are based on a length model in which DN mutations occur randomly in all genes,proportional to length.
2
FrameshiftNonsenseSplice site
MaleFemale
20 90 100 160
FMRP targetsChromatin modifiersEmbryonically expressedPostsynaptic density proteins
Gene
Proband
F
FFF
FFFFFFFFFF
C 74
P 3 1P 3 1
3 1
CHD2 C 3ARID1B C 2 1KDM6B C 2
2EE
E
EE
P
P
ADNPMED13L 2
2222222222222
222
CC
22
2 2
1
1
1
11
4
NCKAP1ANKRD11DIP2ASCN2ATNRC6BWDFY3PHF2WACKDM5BPOGZRIMS1FOXP1GIGYF1KATNAL2KMT2ETBR1TCF7L2
80
70
60
50
40
No
n-v
erb
al IQ 0.01
0.5
0.00001
0.001
Male with de novo type
Male without de novo type
Female with de novo type
Female without de novo type
FCEP
Non-verbal IQ Categories LGD MS
Unaffected
LGD MS
CHD8DYRK1A EANK2GRIN2BDSCAM
100
90
0.06
0.4
0.2
0.10
0.01
0.5
1.0
0.9
0.2
0.9
0.4
0.4
LGDs
all
LGDs
recurrent
LGDs
in FXG
LGDs
in CHM
LGDs
in EMB
Missense
all
Missense
recurrent
Synonymous
all
Figure 2 | Recurrently hit genes and non-verbal IQ. Affected femalesaccount for 13.5% of the SSC with a mean IQ of 78, whereas affected males havea mean IQ of 86 (top, P 5 1027 by Student’s t-test). Vertical dashed lineindicates an IQ of 90. Middle (left) shows IQ for affected children with LGDmutations in genes hit recurrently (right). Recurrently mutated genes areclustered into four categories as shown. The last four columns give overallnumbers of DN LGD and missense (MS) mutations. Bottom, eight classes of
DN mutations are considered: all LGDs, recurrent LGDs, LGDs in FMRPtargets (FXG), LGDs in chromatin modifiers (CHM), LGDs in embryonicallyexpressed genes (EMB), all missense mutations, recurrent missense mutationsand synonymous mutations. Probands are divided by the presence of DNmutations and gender. Means, 95% confidence intervals and P values(Student’s t-test) are shown.
RESEARCH ARTICLE
2 1 8 | N A T U R E | V O L 5 1 5 | 1 3 N O V E M B E R 2 0 1 4
Macmillan Publishers Limited. All rights reserved©2014

also close to null expectations (P 5 0.2 and 0.04, respectively). In affectedmales with higher IQ there are no excess recurrent targets among 137LGDs mutations (2 observed, 1.0 expected, P 5 0.3) or among 728missense mutations (26 observed, 24.7 expected, P 5 0.4). By contrast,among probands the number of recurrent LGD (n 5 27 out of 391events) and missense targets (145 out of 1,675 events) are not compat-ible with the null expectation of 7.6 (P , 0.0001) and 115.0 (P 5 0.001),respectively. Given these findings, as well as the lack of overlap betweentargets of higher and lower IQ males, we focused on the joint class offemale probands and affected males of lower IQ. For the joint class, therewere 22 recurrent LGD targets among 254 events with 3.3 expected(P , 0.0001). For the 944 missense events, 60 recurrent targets are observedwith 40.2 expected (P 5 0.0005).
We next used recurrence analysis and the length model to estimatethe number of vulnerable genes (Fig. 3) and the probability that a recur-rent mutation of a given type is contributory (Methods). The most likelynumber of genes vulnerable to DN mutations in the joint class is esti-mated to be 387 for LGD targets with a 95% confidence interval of 149–915, and 404 for DN missense targets (confidence interval 71–3,050).From the length model and our estimate that 43% of LGD mutations arecontributory, we have 90% confidence that a given LGD mutation contri-butes to autism in a gene recurrently hit by an LGD mutation (Methods).By the same methods, we compute 35% confidence in contribution frommissense mutations in recurrent targets. Using existing models for pri-oritizing targets7, we list all targets of recurrent DN coding mutationaccording to their rank (Supplementary Table 9).
DiscussionThe SSC was assembled with the explicit hypothesis that finding targetsof DN mutation would be a path to gene discovery. We now have 353candidate LGD gene targets, 27 genes recurrently hit by LGD events,and 145 recurrent missense targets, each with about 40%, 90% and 35%chance of being contributory, respectively.
We use the ascertainment differential as an estimate of contribution.The sum of the ascertainment differentials for missense, nonsense, con-sensus splice site disruption and frameshift DN mutations is 0.21 peraffected child. Adding 0.06, the ascertainment differential from largeDN copy number variants2,3, brings the total to 0.27 (Fig. 4). Excludinghigher IQ males, the value is 0.33. In affected females it is 0.45. This is aconservative estimate for the role of DN mutation in the SSC familiesbecause we have not yet ascertained intermediate-size DN copy numbervariants (CNVs), copy-neutral rearrangements, regulatory mutationsor mutations of non-coding genes.
Although the SSC is a simplex collection, it is probably only mar-ginally depleted for high-risk families because small brood size pre-vents the birth of several affected children, especially if the unaffectedsibling is female. We estimate10 and confirm9 by gender bias in unaffectedsiblings (1,400 females and 1,264 males, P 5 0.0089) that ,40% of theSSC families are high-risk. In a simple genetic model, DN mutation hasno role in high-risk families but is obligatory for low-risk families10, soDN mutation would contribute to ,60% of the SSC. The sum of theascertainment differential for all observable DN types in all the pro-bands is about 30%, about half of that. If the number of unobserved andconsequential DN mutations is similar to the number of observed andconsequential DN exome mutations, the actual contribution is not farfrom that predicted by this simple model.
Targets and cognitive defectsWe examined the incidence and targets of DN LGD mutations forchildren with lower and higher IQs. Affected children with higher IQshave a greater incidence of LGD mutations than unaffected siblings,but a lower incidence than affected females or males with lower IQ.Moreover, there are few recurrently hit genes among the DN LGDtargets of affected males with higher IQ, and little overlap with the DNLGD targets of affected males with lower IQ or females. LGD targets inhigher IQ males are not enriched for the FMRP-associated genes. These
Number of vulnerable genes
Class vulnerability
Pro
bab
ility
density
Pro
bab
ility
density
LGD in all probands
LGD in female and low-nvIQ male probands
Missense in female and low-nvIQ male probands
LGD in affected females
LGD in affected males with low nvIQMissense in affected males with low nvIQ
0 500 1,000 1,500 2,000 2,500 3,000 3,500 4,000
0.0 0.2 0.4 0.6 0.8 1.0
Figure 3 | Number of vulnerable genes and class vulnerability. We assumethe property of being vulnerable is independent of gene length, but theprobability of being hit by mutation is proportional to gene length. We use theobserved rates of mutation of a given type in specified populations and numberof recurrent mutations to estimate the number of genes vulnerable to thosemutations (top). The degrees of vulnerability in those classes are thedistributions shown in the bottom panel (Methods). nvIQ, non-verbal IQ.
Observed
Model
80
60
70
50
40
30
20
10
0
Co
ntr
ibutio
n
CNVs
all
LGDs
all
Missense
all
Total
all
Total
female
Total
male
Total
low-IQ
male
Total
high-IQ
male
Model
Figure 4 | Estimated contributions of CNVs, LGDs and missense DNmutations to simplex ASD. Ascertainment differentials for three types of DNmutation (CNVs, LGDs and missense) are interpreted as a measure of‘contribution,’ the percentage of probands in whom the mutation contributedto diagnosis. We combine the three mutation types in ‘total’ on the assumptionof additivity. We present this measure for ‘all’ probands and selectedsubpopulations as indicated. We also show the expected contribution of all DNmutation in a simplex collection computed from a simple genetic model9
(‘model’). Error bars represent 95% confidence intervals.
ARTICLE RESEARCH
1 3 N O V E M B E R 2 0 1 4 | V O L 5 1 5 | N A T U R E | 2 1 9
Macmillan Publishers Limited. All rights reserved©2014

observations suggest a different distribution of genetic mechanismsunderlying ASD in higher IQ males.
We can examine overlap between LGD targets for autism, with pub-lished targets for intellectual disability and schizophrenia25–29. We appliedour length model for mutation incidence and found significant overlapof intellectual disability and schizophrenia targets with ASD targets(Table 1), but only in the joint class of affected males with lower IQ andfemales (Supplementary Table 6). The overlap can have many explana-tions: diagnostic conflation; pleiotropy for the same mutation; differ-ent consequences for different mutations in the same gene; and varyinggenetic or environmental background. The DN targets of affectedmales with higher IQ do not overlap these sets, again suggesting dis-tinct mechanisms.
Properties of target classesThis study is sufficiently large and uniform to enable inferences abouttargets, distinguished by mutation types, properties of affected childrenand target functions. We observe a significant contribution from mis-sense mutations, with an overall magnitude comparable to that from LGDmutations. Both LGD and missense mutation targets are enriched inthe same functional gene sets, especially among lower IQ males (Sup-plementary Table 6). Excluding higher IQ males, we estimate the mostlikely number of genes vulnerable to LGDs is about 400, with a similarnumber of genes vulnerable to missense. The two sets overlap substantially.
Targets in autism are enriched in certain functional categories, pro-viding deeper support for previously published observations6–8. FMRP-associated genes and chromatin modifiers are prominent targets in allgroups except higher IQ males. The former are thought to function inneuroplasticity. Embryonically expressed genes are significantly enrichedas LGD or missense targets, but only in females. Enrichment in thesegenes may reflect that these contributory mutations cause alterationsbefore a female protective effect takes place.
Recurrent LGD targets encode receptors, ion channels and synapticproteins likely to function directly in neuro-circuitry (for example, SCN2A,GRIN2B and RIMS1), but also proteins functioning in cytoskeletal remod-elling (for example, ANK2 and MED13L) and transcriptional regulation.Chromodomain helicase gene family members carry many recurrentLGDs. The most frequently hit gene is CHD8 (ref. 30), followed by CHD2(three LGDs) and four other members (one LGD each) of that family.CHD8 is a transcriptional regulator thought to be important for sup-pression of the Wnt–b-catenin signalling pathway through histone H1recruitment31. Another intriguing target is the protein kinase DYRK1A,hit four times and located in the Down’s syndrome critical region7.
Gene vulnerability and molecular mechanismsWe cannot determine the penetrance of specific mutations observedhere, as we do not see them often enough in an unselected population.Nevertheless, we introduce the term ‘gene vulnerability’ as the probabil-ity that a given type of mutation in a given gene contributes to a givencondition. Genes with non-zero vulnerability define the vulnerable class.We can extend this concept to ‘class vulnerability’, defined as the meangene vulnerability over a class of genes. Mathematically, class vulner-ability, V, is computed by solving the following equation for V: F 3 A5 P 3 H 3 V, in which F is the prevalence of the condition, A is theascertainment differential for DN mutations of a given type in the geneclass, P is the expected proportion of the population with DN muta-tions of that given type, and H is the probability that such mutations hitthe gene class.
We can compute a distribution of class vulnerability for all vulner-able genes targeted by a given mutational type (Methods) because F, Aand P have empirically sampled distributions and H has a distributioninferred from the total length of the gene class. The distribution of classvulnerability for DN LGDs in males with lower IQ has a mode around0.4 (Fig. 3). In other words, ,40% of DN LGDs in vulnerable genes ina male contribute to diagnoses of lower IQ ASD. Similarly, ,10% ofmissense mutations in vulnerable genes contribute to diagnoses of lower
IQ autism (Fig. 3). The mode for LGD vulnerability in females is four-fold lower than for lower IQ males, mainly because the prevalence isfourfold lower. Reduced penetrance in females is not well understood,but may be consequent to sexually dimorphic development. Support forthis is seen in the relative enrichment of embryonically expressed genesas targets in females.
Partial gene vulnerability can be explained in several ways: someLGD mutations result in autism, some have little effect, and some pro-duce other diagnoses or even lethality. Regardless, many LGD muta-tions will strongly predispose to ASD. We expect this to be reflected indecreased functional variation in the human gene pool, as we havepreviously shown for FMRP-associated genes8.
Given our analysis of gene vulnerability and the lack of evidence forcompound heterozygosity, damage to a single allele will often havesevere consequences for development. What underlies the vulnerabil-ity to haploinsufficiency is unclear. Half the normal gene dosage canresult in half the level of gene products, and there are many examplesin which physiology requires proper dosage32–37. Also, having two copiesof a gene will reduce variability of expression38. With only one functionalallele, there could be increased variation in levels of expression, includ-ing dangerously low levels at crucial moments in lineage development,altering the composition of tissues. Monoallelic expression also needsto be considered39. Finally, some truncation events might lead to dom-inant negative alleles.
Present and future implicationsFrom the clinical perspective, early diagnosis and family counselling arecomplicated if there are hundreds of genetic targets, especially if few areknown with certainty. Sequencing of more cohorts is thus clearly war-ranted. From the therapeutic perspective, the good news is that in almostall cases DN mutations occur in probands in whom a normal allele is alsopresent. It is theoretically possible that enhancing activity of the remain-ing alleles might alleviate symptoms. So in our view, the long-termprognosis for treating ASD is positive. Moreover, ASD targets overlapwith targets for intellectual disability and schizophrenia, so mechanism-based treatments might work for different diagnostic categories. In theintermediate term, functional clustering suggests that treatments mightbe tailored to a smaller number of convergent pathways.
Online Content Methods, along with any additional Extended Data display itemsandSourceData, are available in the online version of the paper; references uniqueto these sections appear only in the online paper.
Received 4 July; accepted 3 October 2014.
Published online 29 October 2014.
1. Jeste, S. S.& Geschwind, D. H.Disentangling theheterogeneity of autism spectrumdisorder through genetic findings. Nature Rev. Neurol. 10, 74–81 (2014).
2. Sanders, S. J. et al. Multiple recurrent de novo CNVs, including duplications of the7q11.23 Williams syndrome region, are strongly associated with autism. Neuron70, 863–885 (2011).
3. Levy, D. et al. Rare de novo and transmitted copy-number variation in autisticspectrum disorders. Neuron 70, 886–897 (2011).
4. Marshall, C. R. et al. Structural variation of chromosomes in autism spectrumdisorder. Am. J. Hum. Genet. 82, 477–488 (2008).
5. Sebat, J. et al. Strong association of de novo copy number mutations with autism.Science 316, 445–449 (2007).
6. Sanders, S. J. et al. De novo mutations revealed by whole-exome sequencing arestrongly associated with autism. Nature 485, 237–241 (2012).
7. O’Roak, B. J. et al. Sporadic autism exomes reveal a highly interconnected proteinnetwork of de novo mutations. Nature 485, 246–250 (2012).
8. Iossifov, I. et al. De novo gene disruptions in children on the autistic spectrum.Neuron 74, 285–299 (2012).
9. Ronemus, M., Iossifov, I., Levy, D. & Wigler, M. The role of de novo mutations in thegenetics of autism spectrum disorders. Nature Rev. Genet. 15, 133–141 (2014).
10. Zhao, X. et al. A unified genetic theory for sporadic and inherited autism. Proc. NatlAcad. Sci. USA 104, 12831–12836 (2007).
11. Fischbach, G. D. & Lord, C. The Simons Simplex Collection: a resource foridentification of autism genetic risk factors. Neuron 68, 192–195 (2010).
12. Campbell, C. D. et al. Estimating the human mutation rate using autozygosity in afounder population. Nature Genet. 44, 1277–1281 (2012).
13. Michaelson, J. J. et al. Whole-genome sequencing in autism identifies hot spots forde novo germline mutation. Cell 151, 1431–1442 (2012).
RESEARCH ARTICLE
2 2 0 | N A T U R E | V O L 5 1 5 | 1 3 N O V E M B E R 2 0 1 4
Macmillan Publishers Limited. All rights reserved©2014

14. Schrider, D. R., Hourmozdi, J. N. & Hahn, M. W. Pervasive multinucleotidemutational events in eukaryotes. Curr. Biol. 21, 1051–1054 (2011).
15. Kong, A. et al. Rate of de novo mutations and the importance of father’s age todisease risk. Nature 488, 471–475 (2012).
16. Neale, B. M. et al. Patterns and rates of exonic de novo mutations in autismspectrum disorders. Nature 485, 242–245 (2012).
17. Darnell, J. C. et al. FMRP stalls ribosomal translocation on mRNAs linked tosynaptic function and autism. Cell 146, 247–261 (2011).
18. Kang, H. J. et al. Spatio-temporal transcriptome of the human brain. Nature 478,483–489 (2011).
19. Voineagu, I. et al. Transcriptomic analysis of autistic brain reveals convergentmolecular pathology. Nature 474, 380–384 (2011).
20. Bayes, A. et al. Characterization of the proteome, diseases and evolution of thehuman postsynaptic density. Nature Neurosci. 14, 19–21 (2011).
21. Blake, J. A., Bult, C. J., Kadin, J. A., Richardson, J. E. & Eppig, J. T. The MouseGenomeDatabase (MGD): premier model organism resource for mammalian genomicsand genetics. Nucleic Acids Res. 39, D842–D848 (2011).
22. Feldman, I., Rzhetsky, A. & Vitkup, D. Network properties of genes harboringinherited disease mutations. Proc. Natl Acad. Sci. USA 105, 4323–4328 (2008).
23. Willsey, A. J. et al. Coexpression networks implicate human midfetal deep corticalprojection neurons in the pathogenesis of autism. Cell 155, 997–1007 (2013).
24. Newschaffer, C. J.et al.The epidemiology of autism spectrum disorders. Annu. Rev.Public Health 28, 235–258 (2007).
25. de Ligt, J. et al. Diagnostic exome sequencing in persons with severe intellectualdisability. N. Engl. J. Med. 367, 1921–1929 (2012).
26. Fromer, M. et al. De novo mutations in schizophrenia implicate synaptic networks.Nature 506, 179–184 (2014).
27. Lee, S. H. et al. Genetic relationship between five psychiatric disorders estimatedfrom genome-wide SNPs. Nature Genet. 45, 984–994 (2013).
28. McCarthy, S. E. et al. De novo mutations in schizophrenia implicate chromatinremodeling and support a genetic overlap with autism and intellectual disability.Mol. Psychiatry 19, 652–658 (2014).
29. Rauch, A. et al. Range of genetic mutations associated with severe non-syndromicsporadic intellectual disability: an exome sequencing study. Lancet 380,1674–1682 (2012).
30. O’Roak, B. J. et al. Multiplex targeted sequencing identifies recurrently mutatedgenes in autism spectrum disorders. Science 338, 1619–1622 (2012).
31. Nishiyama,M., Skoultchi, A. I. &Nakayama,K. I.HistoneH1recruitment byCHD8 isessential for suppression of the Wnt-b-catenin signaling pathway. Mol. Cell. Biol.32, 501–512 (2012).
32. Birchler, J. A. & Veitia, R. A. Gene balance hypothesis: connecting issues of dosagesensitivity across biological disciplines. Proc. Natl Acad. Sci. USA 109,14746–14753 (2012).
33. Cooper, D. N., Krawczak, M., Polychronakos, C., Tyler-Smith, C. & Kehrer-Sawatzki,H. Where genotype is not predictive of phenotype: towards an understanding ofthe molecular basis of reduced penetrance in human inherited disease. Hum.Genet. 132, 1077–1130 (2013).
34. Darnell, J. C. Defects in translational regulation contributing to human cognitiveand behavioral disease. Curr. Opin. Genet. Dev. 21, 465–473 (2011).
35. Veitia, R. A., Bottani, S. & Birchler, J. A. Gene dosage effects: nonlinearities, geneticinteractions, and dosage compensation. Trends Genet. 29, 385–393 (2013).
36. Weischenfeldt, J., Symmons, O., Spitz, F. & Korbel, J. O. Phenotypic impact ofgenomic structural variation: insights from and for human disease. Nature Rev.Genet. 14, 125–138 (2013).
37. Zhang, F., Gu, W., Hurles, M. E. & Lupski, J. R. Copy number variation in humanhealth, disease, and evolution. Annu. Rev. Genomics Hum. Genet. 10, 451–481(2009).
38. Eckersley-Maslin, M. A. & Spector, D. L. Random monoallelic expression:regulating gene expression one allele at a time. Trends Genet. 30, 237–244(2014).
39. Jeffries, A.R.et al.Randomor stochastic monoallelic expressedgenesare enrichedfor neurodevelopmental disorder candidate genes. PLoS ONE 8, e85093 (2013).
Supplementary Information is available in the online version of the paper.
Acknowledgements Simons Foundation Autism Research Initiative grants to E.E.E.(SF191889), M.W.S. (M144095 R11154) and M.W. (SF235988) supported this work.Additional support was provided by the Howard Hughes Medical Institute(International Student Research Fellowship to S.J.S.) and the Canadian Institutes ofHealth Research (Doctoral Foreign StudyAward to A.J.W.). E.E.E. is an Investigator of theHoward Hughes Medical Institute. We thank all the families at the participating SSCsites, as well as the principal investigators (A. L. Beaudet, R. Bernier, J. Constantino,E. H. Cook Jr, E. Fombonne, D. Geschwind, D. E. Grice, A. Klin, D. H. Ledbetter, C. Lord,C. L. Martin, D. M. Martin, R. Maxim, J. Miles, O. Ousley,B. Peterson, J. Piggot, C. Saulnier,M. W. State, W. Stone, J. S. Sutcliffe, C. A. Walsh and E. Wijsman) and the coordinatorsand staff at the SSC sites for the recruitment and comprehensive assessment ofsimplex families; the SFARI staff for facilitating access to the SSC; and the RutgersUniversity Cell andDNA Repository (RUCDR) for accessingbiomaterials. We would alsolike to thank the CSHL Woodbury Sequencing Center, the Genome Institute at theWashington University School of Medicine, and Yale Center for Genomic Analysis (inparticular J. Overton) for generating sequencing data; E. Antoniou and E. Ghiban fortheir assistance in data production at CSHL; and T. Brooks-Boone, N. Wright-Davis andM. Wojciechowski for their help in administering the project at Yale. The NHLBI GOExome Sequencing Project and its ongoing studies produced and provided exomevariant calls for comparison: the Lung GO Sequencing Project (HL-102923), the WHISequencing Project (HL-102924), the Broad GO Sequencing Project (HL-102925), theSeattle GO Sequencing Project (HL-102926) and the Heart GO Sequencing Project(HL-103010).
Author Contributions CSHL: I.I., M.R. and M.W. designed the study; I.I., D.L., B.Y., Y.L.,E.G., E.D., P.A., A.L., J.K., G.N., S.Y., M.C.S., K.Y. and M.W. analysed the data; M.R., I.H., J.R.,B.M., L.R., J.T. and W.R.M. generated the exome data at Cold Spring Harbor Laboratory;I.I., Z.W., S.M. and J.T. confirmed the variants; I.I., M.R. and M.W. wrote the paper. UCSF/Yale: S.J.S. and M.W.S. designed the study; S.J.S., S.D., L.W. and A.J.W. analysed thedata; S.J.S., J.D., L.E.G., J.D.M., C.A.S., M.F.W. and Z.W. confirmed the variants;S.M.M. andM.T.M. generated the exome data at Yale Medical Center. UW: B.J.O., J.S. and E.E.E.designed the study; B.J.O. and N.K. analysed the data; B.J.O., H.A.S., K.T.W. and L.V.confirmed the variants; E.E.E. and J.S. revised the manuscript; K.E.P, J.D.S., B.P. andD.A.N. generated the exome data at the University of Washington.
Author Information Sequence data used in these work are available from the NationalDatabase for Autism Research (http://ndar.nih.gov/), under study DOI:10.15154/1149697. Reprints and permissions information is available at www.nature.com/reprints. The authors declare competing financial interests: details are availablein the online version of the paper. Readers are welcome to comment on the onlineversion of the paper. Correspondence and requests for materials should beaddressed to J.S. ([email protected]), E.E.E. ([email protected]),M.W.S. ([email protected]), or M.W ([email protected]).
ARTICLE RESEARCH
1 3 N O V E M B E R 2 0 1 4 | V O L 5 1 5 | N A T U R E | 2 2 1
Macmillan Publishers Limited. All rights reserved©2014

METHODSSample collection. Most families (2,517) came from current or former membersof the SSC. The SSC was assembled at 13 clinical centres, accompanied by detailedand standardized phenotypic analysis as reported previously11. Several IQ mea-sures (verbal, non-verbal and full spectrum) were recorded; in this work, we strati-fied probands by non-verbal IQ, which we refer to as simply ‘IQ’ throughout thetext. Families with single probands and unaffected siblings were preferentiallyrecruited, whereas families with two probands were specifically excluded11. Familiesfrom two associated collections were also sequenced: the Simons Ancillary Collec-tion (SAC, n 5 123), and the Simons Twin Collection (STC, n 5 13). The SAC includesfamilies that failed inclusion criteria for the SSC, typically because a parent, siblingor second- or third-degree relative of the affected participant has been diagnosedwith ASD, or for cases in which the proband’s ASD diagnosis was questionable.The STC consists of families of monozygotic twins in which at least one co-twin isaffected by ASD. The institutional review boards of Cold Spring Harbor Laboratory,Yale Medical Center and University of Washington, Seattle approved this study.Written informed consent from all subjects was obtained by SFARI. Blood sampleswere drawn from parents and children (affected and unaffected) and sent to theRutgers University Cell and DNA Repository (RUCDR) for DNA preparation. DNAsfrom 2,517 families (of ,2,800 total in the SSC) were used in this study. Resultsfrom 774 of the SSC families included here were published in earlier work6–8. Thesamples were split across the three centres: Cold Spring Harbor Laboratory (CSHL),the Department of Genetics at the Yale School of Medicine (YALE), and Departmentof Genome Sciences at the University of Washington (UW). The split was notuniform with respect to number of families or the proportions of female probandsand probands with lower IQ (Extended Data Fig. 2 and Supplementary Table 1).Several families were sequenced at multiple centres, with 24 families sequenced inall three centres (Extended Data Fig. 1 and Supplementary Table 1).Exome capture, sequencing and validation. The three centres differed in theprecise exome capture platform, read length and validation protocols.CSHL. The protocols described previously8 were applied to the families newly sequencedat CSHL. In brief, SeqCap EZ Human Exome Library v2.0 (Roche NimbleGen)reagents were used with a custom barcoding protocol that enabled simultaneousexome enrichment of #4 genomes and the sequencing of #8 individuals per IlluminaHiSeq 2000 lane. All exome sequencing was performed using paired-end 100-basepair (bp) reads. All strong and weak LGD candidate variants as well as additionalvariants from families sequenced at CSHL were subjected to experimental valid-ation. Gene-specific primers were designed for PCR amplification of candidate singlenucleotide variables (SNVs) and indels, and amplicons were pooled and sequencedon an Illumina MiSeq. Approximately 100 variants were validated per lane with paired-end 150-bp reads. Where possible, the parental origin was determined by phasingof linked transmitted SNVs.UW. Samples were captured and sequenced by one of three methods. In the pilotset (19 quads), samples were captured using SeqCap EZ Human Exome Libraryv1.0 (Roche NimbleGen) reagents (UW-M1)7,40. The remaining samples were cap-tured using SeqCap EZ Human Exome Library v2.0 (Roche NimbleGen) reagents7.Newly sequenced samples were either processed as described previously7 (UW-M2)or with a modified (UW-M3) protocol (Supplementary Table 10). For UW-M2,single-plex captures and single-plex sequencing runs (non-pooled) were performedas described previously7. For UW-M3, single-plex capture was performed as inUW-M2; however, in the post-capture PCR, an 8-bp index barcode was added.Post-PCR libraries were quantified and pooled in sets of ,96. These pools werethen sequenced on the Illumina MiSeq platform to evaluate library complexity andsample distribution. Pools were rebalanced on the basis of performance, then se-quenced across multiple HiSeq 2000 lanes using paired-end 50-bp reads. Additionallanes were added until samples reached target coverage (203: ,80%; 83: ,90%).If additional coverage was required for some samples, subpools were also gener-ated. For samples processed with UW-M1 and UW-M2, predicted de novo calls werevalidated using standard PCR and Sanger sequencing7. For UW-M3 processedsamples, custom Molecular Inversion Probe (MIP) capture probes were designedwith targeting arms flanking regions of interest. Probes were designed without orwith degenerate tags, and pools of ,50–100 probes were generated30,41. As describedearlier41, sets of families (,96 samples) were captured using these pools with 50–100 ng of genomic DNA as template. Capture products were then pooled and se-quenced on an Illumina MiSeq. Candidate sites failing MIP QC or capture, orshowing evidence of significant shifts in allele balance, were validated using thestandard PCR/Sanger method. If sites repeatedly failed the assay, they were dis-carded. Novel sites called by the CSHL pipeline were validated using the samemethods as UW-M3.YALE. Whole blood-derived genomic DNA was enriched for exonic sequencesusing SeqCap EZ Human Exome Library v2.0 (Roche NimbleGen) reagents. Allfamily members were barcoded and each pool of four samples was sequenced using75-bp paired-end reads on single lanes of the Illumina HiSeq 2000 instrument.
Where possible, all four family members were sequenced on the same lane tominimize batch effects. All strong and weak LGD candidate variants from the CSHLpipeline, along with an additional set of LGD candidates from the Yale pipeline,were subjected to experimental validation as follows: variant-specific primers weredesigned for PCR amplification of candidate SNVs and indels from all familymembers, and amplicons were sent for Sanger sequencing.Sequence analysis pipelines. Sequence data were interpreted as family genotypesusing pipeline tools at each respective data centre. Almost all of the data werereanalysed with the CSHL pipeline. We show the coverage (Extended Data Fig. 6)and yields (Extended Data Fig. 7) for de novo calls from each centre. The 24 fam-ilies sequenced at all three centres demonstrated good agreement between pipe-lines and platforms (Supplementary Tables 11 and 12).
The analysis pipelines generated candidate de novo events, defined as variantspresent in the child and absent in both parents. We filtered out variants seenfrequently in the parents of the collection (allele frequency .0.3%), reasoningthat most of these would be false positives owing to uneven coverage in a parent.Candidates generated by local pipelines or by the common CSHL pipeline werevalidated at the respective centres with re-sequencing and 2,504 were verified. Inour final call set, we include all verified calls from each centre, and omit any callthat was rejected. In addition, because almost all (1,640 of 1,644) strong pointmutations generated by the common CSHL pipeline were verified when success-fully tested (Supplementary Table 11), such strong candidates are included in ourcall set even if the validation test failed or if the candidate event was not tested. Allframeshift mutations were validated, and we exclude all that were rejected. All denovo calls used in the subsequent analysis, along with their validation status, arelisted in Supplementary Table 2. Pipelines for analysis and validation were blindwith respect to affected and unaffected status.CSHL (uniform) pipeline. Sequence data from the three centres were analysedwith the computational pipeline described previously8. In brief, the Illumina anal-ysis pipeline (CASAVA 1.8) was used for base calls, and custom software was usedto de-multiplex reads and trim barcodes from CSHL derived data. Data from Yaleand UW were de-multiplexed at the respective centres before analysis through theCSHL pipeline. BWA42 was used to align sequence reads to the hg19 reference genome,and both Picard (http://broadinstitute.github.io/picard/) and GATK43 were usedfor marking PCR duplicates, family-based sequence realignment and quality scorerecalibration. As described previously, a multinomial model-based family genotyperwas used to generate candidate SNV and indel ‘Mendel violators,’ each annotatedwith: (1) a confidence score (denovoScr) that reflects the posterior probability ofMendel violation at the locus; (2) a goodness-of-fit score (chi2Score) showing thedegree to which the assumptions of the multinomial model are applicable to theobserved data; (3) counts of reads per allele and per family member; and (4) allelefrequency and noise rates for the candidate position based on the whole collection.Candidates SNVs with denovoScr $60 and chi2Score .0.0001 were labelled ‘strong’provided that the position was not polymorphic or noisy in the population, and thatthe parents were homozygous for the reference allele.
For SNVs, a cut-off denovoScr value of 60 was dictated by the desire to keepfalse positives to a minimum, and was chosen after computing the proportion ofde novo candidates that appear at polymorphic loci (a surrogate for false positives)as a function of the score (see the Supplement of ref. 8). The low false positive rate(,5%) was also confirmed through experimental validation (Supplementary Table 11).In addition, we observe that only 1% of DN mutations are shared between twosiblings (Supplementary Table 2), putting a 3% cap on false positives owing tofailure to observe parents correctly. At stringent thresholds the false negative rate isgenerally high, but through simulations we determined that, even with stringentthresholds, regions with deep coverage (403 or higher joint coverage) had low falsenegative rates (,5%).
Indels were treated differently than SNVs. The multinomial model assumes asmall allele bias, appropriate when calling SNVs, but not for de novo indels—particularly for long events (.10 bp). To address this, cut-offs for ‘strong’ indelswere lowered (denovoScr .30 and chi2Score .1029). To reduce noise, we addedrequirements for ‘clean’ read counts: parents were not allowed to have any readscontaining the candidate indel, and were required to have at least 15 reads sup-porting the reference allele. At least one of the children had to have $6 reads withthe candidate variant, and those reads had to comprise $5% of reads. Experimentalvalidation demonstrated that the false positive rate in the strong indels is ,10%,and simulations for indels without extreme allele bias (most of those ,10 bp)reveal that the false negative rate in well-covered regions (403) is ,5%.
All ‘strong’ SNVs and indels are reported here unless rejected by validation. Toaddress the high false negative rates, we defined a class of ‘weak’ SNV and indelsdrawn from thresholds lower than strong candidates. All weak LGD candidateswere subjected to validation, and only those successfully validated are reported. Inaddition, during method development (for example, through manual inspectionor see ref. 44), we validated a large number of candidates that did not meet even
RESEARCH ARTICLE
Macmillan Publishers Limited. All rights reserved©2014
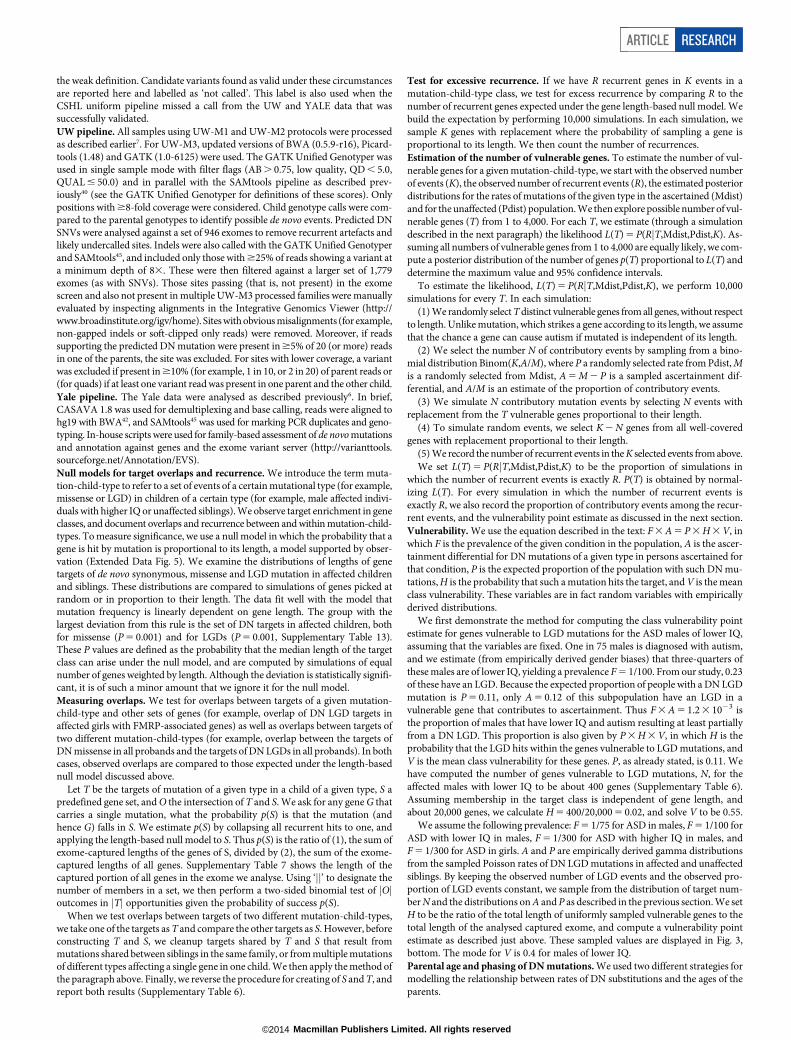
the weak definition. Candidate variants found as valid under these circumstancesare reported here and labelled as ‘not called’. This label is also used when theCSHL uniform pipeline missed a call from the UW and YALE data that wassuccessfully validated.UW pipeline. All samples using UW-M1 and UW-M2 protocols were processedas described earlier7. For UW-M3, updated versions of BWA (0.5.9-r16), Picard-tools (1.48) and GATK (1.0-6125) were used. The GATK Unified Genotyper wasused in single sample mode with filter flags (AB . 0.75, low quality, QD , 5.0,QUAL # 50.0) and in parallel with the SAMtools pipeline as described prev-iously40 (see the GATK Unified Genotyper for definitions of these scores). Onlypositions with $8-fold coverage were considered. Child genotype calls were com-pared to the parental genotypes to identify possible de novo events. Predicted DNSNVs were analysed against a set of 946 exomes to remove recurrent artefacts andlikely undercalled sites. Indels were also called with the GATK Unified Genotyperand SAMtools45, and included only those with $25% of reads showing a variant ata minimum depth of 83. These were then filtered against a larger set of 1,779exomes (as with SNVs). Those sites passing (that is, not present) in the exomescreen and also not present in multiple UW-M3 processed families were manuallyevaluated by inspecting alignments in the Integrative Genomics Viewer (http://www.broadinstitute.org/igv/home). Sites with obvious misalignments (for example,non-gapped indels or soft-clipped only reads) were removed. Moreover, if readssupporting the predicted DN mutation were present in $5% of 20 (or more) readsin one of the parents, the site was excluded. For sites with lower coverage, a variantwas excluded if present in $10% (for example, 1 in 10, or 2 in 20) of parent reads or(for quads) if at least one variant read was present in one parent and the other child.Yale pipeline. The Yale data were analysed as described previously6. In brief,CASAVA 1.8 was used for demultiplexing and base calling, reads were aligned tohg19 with BWA42, and SAMtools45 was used for marking PCR duplicates and geno-typing. In-house scripts were used for family-based assessment of de novo mutationsand annotation against genes and the exome variant server (http://varianttools.sourceforge.net/Annotation/EVS).Null models for target overlaps and recurrence. We introduce the term muta-tion-child-type to refer to a set of events of a certain mutational type (for example,missense or LGD) in children of a certain type (for example, male affected indivi-duals with higher IQ or unaffected siblings). We observe target enrichment in geneclasses, and document overlaps and recurrence between and within mutation-child-types. To measure significance, we use a null model in which the probability that agene is hit by mutation is proportional to its length, a model supported by obser-vation (Extended Data Fig. 5). We examine the distributions of lengths of genetargets of de novo synonymous, missense and LGD mutation in affected childrenand siblings. These distributions are compared to simulations of genes picked atrandom or in proportion to their length. The data fit well with the model thatmutation frequency is linearly dependent on gene length. The group with thelargest deviation from this rule is the set of DN targets in affected children, bothfor missense (P 5 0.001) and for LGDs (P 5 0.001, Supplementary Table 13).These P values are defined as the probability that the median length of the targetclass can arise under the null model, and are computed by simulations of equalnumber of genes weighted by length. Although the deviation is statistically signifi-cant, it is of such a minor amount that we ignore it for the null model.Measuring overlaps. We test for overlaps between targets of a given mutation-child-type and other sets of genes (for example, overlap of DN LGD targets inaffected girls with FMRP-associated genes) as well as overlaps between targets oftwo different mutation-child-types (for example, overlap between the targets ofDN missense in all probands and the targets of DN LGDs in all probands). In bothcases, observed overlaps are compared to those expected under the length-basednull model discussed above.
Let T be the targets of mutation of a given type in a child of a given type, S apredefined gene set, and O the intersection of T and S. We ask for any gene G thatcarries a single mutation, what the probability p(S) is that the mutation (andhence G) falls in S. We estimate p(S) by collapsing all recurrent hits to one, andapplying the length-based null model to S. Thus p(S) is the ratio of (1), the sum ofexome-captured lengths of the genes of S, divided by (2), the sum of the exome-captured lengths of all genes. Supplementary Table 7 shows the length of thecaptured portion of all genes in the exome we analyse. Using ‘jj’ to designate thenumber of members in a set, we then perform a two-sided binomial test of jOjoutcomes in jTj opportunities given the probability of success p(S).
When we test overlaps between targets of two different mutation-child-types,we take one of the targets as T and compare the other targets as S. However, beforeconstructing T and S, we cleanup targets shared by T and S that result frommutations shared between siblings in the same family, or from multiple mutationsof different types affecting a single gene in one child. We then apply the method ofthe paragraph above. Finally, we reverse the procedure for creating of S and T, andreport both results (Supplementary Table 6).
Test for excessive recurrence. If we have R recurrent genes in K events in amutation-child-type class, we test for excess recurrence by comparing R to thenumber of recurrent genes expected under the gene length-based null model. Webuild the expectation by performing 10,000 simulations. In each simulation, wesample K genes with replacement where the probability of sampling a gene isproportional to its length. We then count the number of recurrences.Estimation of the number of vulnerable genes. To estimate the number of vul-nerable genes for a given mutation-child-type, we start with the observed numberof events (K), the observed number of recurrent events (R), the estimated posteriordistributions for the rates of mutations of the given type in the ascertained (Mdist)and for the unaffected (Pdist) population. We then explore possible number of vul-nerable genes (T) from 1 to 4,000. For each T, we estimate (through a simulationdescribed in the next paragraph) the likelihood L(T) 5 P(RjT,Mdist,Pdist,K). As-suming all numbers of vulnerable genes from 1 to 4,000 are equally likely, we com-pute a posterior distribution of the number of genes p(T) proportional to L(T) anddetermine the maximum value and 95% confidence intervals.
To estimate the likelihood, L(T) 5 P(RjT,Mdist,Pdist,K), we perform 10,000simulations for every T. In each simulation:
(1) We randomly select T distinct vulnerable genes from all genes, without respectto length. Unlike mutation, which strikes a gene according to its length, we assumethat the chance a gene can cause autism if mutated is independent of its length.
(2) We select the number N of contributory events by sampling from a bino-mial distribution Binom(K,A/M), where P a randomly selected rate from Pdist, Mis a randomly selected from Mdist, A 5 M 2 P is a sampled ascertainment dif-ferential, and A/M is an estimate of the proportion of contributory events.
(3) We simulate N contributory mutation events by selecting N events withreplacement from the T vulnerable genes proportional to their length.
(4) To simulate random events, we select K 2 N genes from all well-coveredgenes with replacement proportional to their length.
(5) We record the number of recurrent events in the K selected events from above.We set L(T) 5 P(RjT,Mdist,Pdist,K) to be the proportion of simulations in
which the number of recurrent events is exactly R. P(T) is obtained by normal-izing L(T). For every simulation in which the number of recurrent events isexactly R, we also record the proportion of contributory events among the recur-rent events, and the vulnerability point estimate as discussed in the next section.Vulnerability. We use the equation described in the text: F 3 A 5 P 3 H 3 V, inwhich F is the prevalence of the given condition in the population, A is the ascer-tainment differential for DN mutations of a given type in persons ascertained forthat condition, P is the expected proportion of the population with such DN mu-tations, H is the probability that such a mutation hits the target, and V is the meanclass vulnerability. These variables are in fact random variables with empiricallyderived distributions.
We first demonstrate the method for computing the class vulnerability pointestimate for genes vulnerable to LGD mutations for the ASD males of lower IQ,assuming that the variables are fixed. One in 75 males is diagnosed with autism,and we estimate (from empirically derived gender biases) that three-quarters ofthese males are of lower IQ, yielding a prevalence F 5 1/100. From our study, 0.23of these have an LGD. Because the expected proportion of people with a DN LGDmutation is P 5 0.11, only A 5 0.12 of this subpopulation have an LGD in avulnerable gene that contributes to ascertainment. Thus F 3 A 5 1.2 3 1023 isthe proportion of males that have lower IQ and autism resulting at least partiallyfrom a DN LGD. This proportion is also given by P 3 H 3 V, in which H is theprobability that the LGD hits within the genes vulnerable to LGD mutations, andV is the mean class vulnerability for these genes. P, as already stated, is 0.11. Wehave computed the number of genes vulnerable to LGD mutations, N, for theaffected males with lower IQ to be about 400 genes (Supplementary Table 6).Assuming membership in the target class is independent of gene length, andabout 20,000 genes, we calculate H 5 400/20,000 5 0.02, and solve V to be 0.55.
We assume the following prevalence: F 5 1/75 for ASD in males, F 5 1/100 forASD with lower IQ in males, F 5 1/300 for ASD with higher IQ in males, andF 5 1/300 for ASD in girls. A and P are empirically derived gamma distributionsfrom the sampled Poisson rates of DN LGD mutations in affected and unaffectedsiblings. By keeping the observed number of LGD events and the observed pro-portion of LGD events constant, we sample from the distribution of target num-ber N and the distributions on A and P as described in the previous section. We setH to be the ratio of the total length of uniformly sampled vulnerable genes to thetotal length of the analysed captured exome, and compute a vulnerability pointestimate as described just above. These sampled values are displayed in Fig. 3,bottom. The mode for V is 0.4 for males of lower IQ.Parental age and phasing of DN mutations. We used two different strategies formodelling the relationship between rates of DN substitutions and the ages of theparents.
ARTICLE RESEARCH
Macmillan Publishers Limited. All rights reserved©2014

The first strategy does not depend on knowledge of the parent of origin for DNsubstitutions, which we do not know for the vast majority of DN substitutions.Because the ages of the mother and the father are strongly correlated, we caneffectively use this strategy only to explore the relationship between the father’sage and the rates of DN substitutions. Over probands and siblings in the 403
-joint family target, we model the number of mutations per child as sampled froma Poisson distribution with rate Rc 5 Tc 3 (A 3 Fc 1 B), in which Rc is the rate ofDN substitutions per child, Fc is the age of the father at the birth of the child, Tc isthe ratio of the length of the 403-target in that child to the total exome length, andA and B are whole population parameters, estimated by maximizing the like-lihood over all children.
The second strategy is applicable only to DN mutations for which we havesuccessfully ‘phased’ the parent of origin by proximity to a linked polymorphism.For each parental gender, we separately perform a two-sided one-sample t-test tocompare the parental ages of each phased DN mutation to the mean of parentalages in our population.
DN substitutions increase ,0.4 per paternal decade (Extended Data Fig. 4),consistent with previous studies15 and the increase in autism as a function ofpaternal age46,47. Where we could determine parental phase, DN substitutions arosemore frequently in the paternal (287) than in the maternal (80) background. Amongphased DN events, the mean age at birth was 34.6 for the father and 32.0 years forthe mother, whereas the respective mean ages were 33.2 and 31.1 years for fathersand mothers in the whole population (P 5 0.0001 and 0.047, respectively, that thesedifferences arise by chance).Gene class definition. For determining overlap with de novo mutations, func-tional gene classes were defined as follows. ‘FMRP’ are genes encoding transcriptsthat bind to FMRP17. ‘Chromatin’ indicates chromatin modifiers as defined byGene Ontology (GO; http://www.geneontology.org/). ‘PSD’ is a set of genes encod-ing proteins that have been identified in postsynaptic densities20. ‘Mendelian’represent positionally identified human disease genes22, and ‘essential’ genes arehuman orthologues of mouse genes associated with lethality in the Mouse GenomeDatabase21. ‘dn LGD (Scz)’ are de novo LGDs in schizophrenia26,48,49 and ‘dn LGD(ID)’ are de novo LGDs in intellectual disability25,29.
‘Embryonic’ genes are those expressed in post-mortem human embryonic brains19,derived from downloaded expression data18 (http://www.brainspan.org/static/
download.html). This data set provides normalized expression levels for ,17,000genes across brain regions from 36 individuals, 18 of which were from embryos.Each brain was further subdivided into 14 anatomical regions for a total of 508regions. We computed correlation values for the 17,000 genes, and generated agraph by connecting genes that had correlations .0.85, then identified connectedcomponents and averaged the expression of genes within these components as afunction of the annotated age of the brain and by region. Each region is sorted firstby age, then by type (Extended Data Fig. 8). The averaged normalized expression ofthe 1,912 genes in the first component decreases after birth, and hence we call thisset embryonic.
Supplementary Table 7 shows the genes in the eight functional classes that arewithin the captured exome regions and were used in all analyses.
40. O’Roak, B. J. et al. Exome sequencing in sporadic autism spectrumdisorders identifies severe de novo mutations. Nature Genet. 43, 585–589(2011).
41. Boyle, E. A., O’Roak, B. J., Martin, B. K., Kumar, A. & Shendure, J. MIPgen: optimizedmodeling and design of molecular inversion probes for targeted resequencing.Bioinformatics 30, 2670–2672 (2014).
42. Li, H. & Durbin, R. Fast and accurate short read alignment with Burrows–Wheelertransform. Bioinformatics 25, 1754–1760 (2009).
43. McKenna, A. et al. The Genome Analysis Toolkit: a MapReduce framework foranalyzing next-generation DNA sequencing data. Genome Res. 20, 1297–1303(2010).
44. Narzisi, G. et al. Accurate de novo and transmitted indel detection inexome-capture data using microassembly. Nature Methods 11, 1033–1036(2014).
45. Li, H. et al. The Sequence Alignment/Map format and SAMtools. Bioinformatics 25,2078–2079 (2009).
46. Reichenberg, A. et al. Advancing paternal age and autism. Arch. Gen. Psychiatry 63,1026–1032 (2006).
47. Croen, L. A., Najjar, D. V., Fireman, B. & Grether, J. K. Maternal and paternal age andrisk of autism spectrum disorders. Arch. Pediatr. Adolesc. Med. 161, 334–340(2007).
48. Gulsuner, S. et al. Spatial and temporal mapping of de novo mutations inschizophrenia to a fetal prefrontal cortical network. Cell 154, 518–529(2013).
49. Xu, B. et al. Exome sequencing supports a de novo mutational paradigm forschizophrenia. Nature Genet. 43, 864–868 (2011).
RESEARCH ARTICLE
Macmillan Publishers Limited. All rights reserved©2014

Extended Data Figure 1 | Number of families sequenced by centre. Thenumbers of families sequenced at the three centres are plotted as a Venndiagram. Families sequenced at more than one centre are indicated by theoverlapping regions between circles. CSHL, Cold Spring Harbor Laboratory;UW, University of Washington, Seattle; YALE, Yale Medical Center.
ARTICLE RESEARCH
Macmillan Publishers Limited. All rights reserved©2014

Extended Data Figure 2 | SSC sequencing by pedigree type and non-verbalIQ. A summary of all SSC families sequenced is indicated across the ‘all’ row.Numbers of SSC families with complete exome sequencing data are displayedby centre in the following rows (see Extended Data Fig. 1 legend for centredesignations). The top number in entries under the ‘families’ column indicatesthe total number of families sequenced, and the number in parentheses below
indicates the total number of individuals. Family pedigree structures are shownacross the top row with gender indicated by shape (square for male, circlefor female) and affected status indicated by colour (white for unaffected, greyfor affected). Distributions of non-verbal IQ within each cohort are shown formale probands (blue) and female probands (red).
RESEARCH ARTICLE
Macmillan Publishers Limited. All rights reserved©2014

Extended Data Figure 3 | Rates of de novo LGD and missense mutations inthe SSC by child status. On the left we show the LGD rate per child in six typesof children, labelled on the x axis, defined by their affected status, gender,and non-verbal IQ. We test for equal rates for every pair of child types andwe show the ones with P . 0.05 with thin lines on the top of the figure.
Although not significant, the rates in affected females and in affected males oflower non-verbal IQ are larger than the rate in males of higher non-verbal IQ.On the right, we show the missense rates per child for the same six groupsof children.
ARTICLE RESEARCH
Macmillan Publishers Limited. All rights reserved©2014

Extended Data Figure 4 | Paternal age and DN mutation rate at child birth.Distribution of paternal age at birth of children (top) and rates of DN mutationin offspring as a function of paternal age are shown (bottom). Children wereordered by paternal age at birth and split into 20 groups of similar size, asshown in the bottom panel. The red curve shows the mean observed rates ofde novo exomic substitutions in each of the 20 groups, with the x coordinate
equal to the mean each of the fathers’ ages within each group. The blue lineshows a linear fit to the observed rates. The dotted green line represents DNmutation rates from whole genome sequencing data15 scaled to rates perexome based on representation in the SeqCap EZ Human Exome Library v2.0(Roche NimbleGen).
RESEARCH ARTICLE
Macmillan Publishers Limited. All rights reserved©2014

Extended Data Figure 5 | Coding region size distribution for query sets ofgenes. Probability density function (PDF) and cumulative distributionfunctions (CDF) (right bottom) of the distributions of the coding region lengthin base pairs of five sets of genes: a set of 1,200 genes picked uniformly from theset of exome-targeted genes (blue); a separate set of 1,200 genes picked withprobabilities proportional to length of the coding region (green); the set of genetargets of neutral mutations, including synonymous mutations in probands and
siblings, and missense mutation in siblings (red); genes with de novo missensemutations in probands (cyan); and genes with de novo LGDs in probands(magenta). Black within the histograms shows the distribution of lengths of therecurrently hit genes from each class. Coding region length distribution under auniform model does not fit the lengths of the genes with observed mutations,and genes with LGD mutations are longer than predicted by a simplelength-based model (bottom right).
ARTICLE RESEARCH
Macmillan Publishers Limited. All rights reserved©2014

Extended Data Figure 6 | Distributions of sequencing depth. Distributions of sequencing depth (number of sequence reads covering a given genomic position)per person per position for the three sequencing centres are plotted. Centre designations are as in Extended Data Fig. 1.
RESEARCH ARTICLE
Macmillan Publishers Limited. All rights reserved©2014

Extended Data Figure 7 | Yield of DN LGD and missense mutations. Weplot the yield of DN LGD and missense mutations per sequencing centre(designations as in Extended Data Fig. 1). In each case we show the number ofmutations we expect to see based on the estimated rates per child, indicated bythe numbers above the bars. We also show what percentage of the expected
number we have observed. Black refers to strong calls in the 403 target, greyrefers to strong calls outside of 403 target, and magenta refers to weak (butvalid) calls. The white region represents the difference between the expectedand observed numbers of variants.
ARTICLE RESEARCH
Macmillan Publishers Limited. All rights reserved©2014

Extended Data Figure 8 | Categorization of embryonically expressed genes.We downloaded expression data18 from http://www.brainspan.org/static/download.html. The data set provides normalized expression levels for,17,000 genes across brain regions from 36 individuals, 18 of which were fromembryos. Each brain was further subdivided into 14 anatomical regions for atotal of 508 regions. We computed correlation values for the 17,000 genes, andgenerated a graph by connecting genes that had correlations .0.85. We then
identified connected components and averaged the expression of genes withinthese components as a function of the annotated age of the brain and by region.Each region is sorted first by age, then by type. The averaged normalizedexpression of the 1,912 genes in the first component decreases after birth, andhence we call this set embryonic. See Supplementary Table 7 for the list ofembryonic genes.
RESEARCH ARTICLE
Macmillan Publishers Limited. All rights reserved©2014