Operation and Control of Wind Farms in Non-Interconnected Power Systems

LETTERdoi:10.1038/nature10989
Sporadic autism exomes reveal a highlyinterconnected protein network of de novo mutationsBrian J. O’Roak1, Laura Vives1, Santhosh Girirajan1, Emre Karakoc1, Niklas Krumm1, Bradley P. Coe1, Roie Levy1, Arthur Ko1, Choli Lee1,Joshua D. Smith1, Emily H. Turner1, Ian B. Stanaway1, Benjamin Vernot1, Maika Malig1, Carl Baker1, Beau Reilly2, Joshua M. Akey1,Elhanan Borenstein1,3,4, Mark J. Rieder1, Deborah A. Nickerson1, Raphael Bernier2, Jay Shendure1 & Evan E. Eichler1,5
It is well established that autism spectrum disorders (ASD) have astrong genetic component; however, for at least 70% of cases, theunderlying genetic cause is unknown1. Under the hypothesis thatde novo mutations underlie a substantial fraction of the risk fordeveloping ASD in families with no previous history of ASD orrelated phenotypes—so-called sporadic or simplex families2,3—wesequenced all coding regions of the genome (the exome) forparent–child trios exhibiting sporadic ASD, including 189 newtrios and 20 that were previously reported4. Additionally, we alsosequenced the exomes of 50 unaffected siblings corresponding tothese new (n 5 31) and previously reported trios (n 5 19)4, for atotal of 677 individual exomes from 209 families. Here we showthat de novo point mutations are overwhelmingly paternal inorigin (4:1 bias) and positively correlated with paternal age, con-sistent with the modest increased risk for children of older fathersto develop ASD5. Moreover, 39% (49 of 126) of the most severe ordisruptive de novo mutations map to a highly interconnectedb-catenin/chromatin remodelling protein network ranked signifi-cantly for autism candidate genes. In proband exomes, recurrentprotein-altering mutations were observed in two genes: CHD8 andNTNG1. Mutation screening of six candidate genes in 1,703 ASDprobands identified additional de novo, protein-altering muta-tions in GRIN2B, LAMC3 and SCN1A. Combined with copynumber variant (CNV) data, these results indicate extreme locusheterogeneity but also provide a target for future discovery,diagnostics and therapeutics.
We selected 189 autism trios from the Simons Simplex Collection(SSC)6, which included males significantly impaired with autism andintellectual disability (n 5 47), a female sample set (n 5 56) of which26 were cognitively impaired, and samples chosen at random from theremaining males in the collection (n 5 86) (Supplementary Table 1and Supplementary Fig. 1). In general, we excluded samples known tocarry large de novo CNVs2. Exome sequencing was performed asdescribed previously4, but with an expanded target definition (seeMethods). We achieved sufficient coverage for both parents and childto call genotypes for, on average, 29.5 megabases (Mb) of haploidexome coding sequence (Supplementary Table 1). In addition, weperformed copy number analysis on 122 of these families, using acombination of the exome data, array comparative genomic hybrid-ization (CGH), and genotyping arrays, thereby providing a more com-prehensive view of rare variation.
In the 189 new probands, we validated 248 de novo events, 225 singlenucleotide variants (SNVs), 17 small insertions/deletions (indels), andsix CNVs (Supplementary Table 2). These included 181 non-synonymous changes, of which 120 were classified as severe basedon sequence conservation and/or biochemical properties (Methodsand Supplementary Table 3). The observed point mutation rate incoding sequence was ,1.3 events per trio or 2.17 3 1028 per base
per generation, in close agreement with our previous observations4,yet in general, higher than previous studies, indicating increasedsensitivity (Supplementary Table 2 and Supplementary Table 4)7.We also observed complex classes of de novo mutation including: fivecases of multiple mutations in close proximity; two events consistentwith paternal germline mosaicism (that is, where both siblings con-tained a de novo event observed in neither parent); and nine eventsshowing a weak minor allele profile consistent with somatic mosaicism(Supplementary Table 3 and Supplementary Figs 2 and 3).
Of the severe de novo events, 28% (33 of 120) are predicted totruncate the protein. The distribution of synonymous, missense andnonsense changes corresponds well with a random mutation model7
(Supplementary Fig. 4 and Supplementary Table 2). However, thedifference in nonsense rates between de novo and rare singleton events(not present in 1,779 other exomes) is striking (4:1) and suggestsstrong selection against new nonsense events (Fisher’s exact test,P , 0.0001). In contrast with a recent report8, we find no significantdifference in mutation rate between affected and unaffected indivi-duals; however, we do observe a trend towards increased non-synonymous rates in probands, consistent with the findings of ref. 9(Supplementary Tables 1 and 2).
Given the association of ASD with increased paternal age5 and ourprevious observations4, we used molecular cloning, read-pair informa-tion, and obligate carrier status to identify informative markers linkedto 51 de novo events and observed a marked paternal bias (41:10;binomial P , 1.4 3 1025; Fig. 1a and Supplementary Tables 3 and 5).This provides strong direct evidence that the germline mutation rate inprotein-coding regions is, on average, substantially higher in males. Asimilar finding was recently reported for de novo CNVs10. In addition,we observe that the number of de novo events is positively correlatedwith increasing paternal age (Spearman’s rank correlation 5 0.19;P , 0.008; Fig. 1b). Together, these observations are consistent withthe hypothesis that the modest increased risk for children of olderfathers to develop ASD5 is the result of an increased mutation rate.
Using sequence read-depth methods in 122 of the 189 families, wescanned ASD probands for either de novo CNVs or rare (,1% ofcontrols), inherited CNVs. Individual events were validated by eitherarray CGH or genotyping array (see Methods). We identified 76 eventsin 53 individuals, including six de novo (median size 467 kilobases(kb)) and 70 inherited (median size 155 kb) CNVs (SupplementaryTable 6). These include disruptions of EHMT1 (Kleefstra’s syndrome,Online Mendelian Inheritance in Man (OMIM) accession 610253),CNTNAP4 (reported in children with developmental delay and aut-ism11) and the 16p11.2 duplication (OMIM 611913) associated withdevelopmental delay, bipolar disorder and schizophrenia.
We performed a multivariate analysis on non-verbal IQ (NVIQ),verbal IQ (VIQ) and the load of ‘extreme’ de novo mutations—whereextreme is defined as point mutations that truncate proteins, intersect
1Department of Genome Sciences, University of Washington School of Medicine, Seattle, Washington 98195, USA. 2Department of Psychiatry and Behavioral Sciences, University of Washington, Seattle,Washington 98195, USA. 3Department of Computer Science and Engineering, University of Washington, Seattle, Washington 98195, USA. 4Santa Fe Institute, Santa Fe, New Mexico 87501, USA. 5HowardHughes Medical Institute, Seattle, Washington 98195, USA.
0 0 M O N T H 2 0 1 2 | V O L 0 0 0 | N A T U R E | 1
Macmillan Publishers Limited. All rights reserved©2012

Mendelian or ASD loci (n 5 57), or de novo CNVs that intersect genes(n 5 5) (Fig. 1c and Supplementary Discussion). NVIQ, but not VIQ,decreased significantly (P , 0.01) with increased number of events.Covariant analysis of the samples with CNV data showed that thisfinding was strengthened, but not exclusively driven, by the presenceof either de novo or rare CNVs (Supplementary Fig. 5).
Among the de novo events, we identified 62 top ASD risk con-tributing mutations based on the deleteriousness of the mutations,functional evidence, or previous studies (Table 1). Probands with thesemutations spanned the range of IQ scores, with only a modest non-significant trend towards individual’s co-morbid with intellectualdisability (Supplementary Figs 1 and 6). We observed recurrent,protein-disruptive mutations in two genes: NTNG1 (netrin G1) andCHD8 (chromodomain helicase DNA binding protein 8). Given theirlocus-specific mutation rates, the probability of identifying two inde-pendent mutations in our sample set is low (uncorrected, NTNG1:P , 1.2 3 1026; CHD8: P , 6.9 3 1025) (Supplementary Fig. 7,Supplementary Table 8 and Methods). NTNG1 is a strong biologicalcandidate given its role in laminar organization of dendrites and axonalguidance12 and was also reported as being disrupted by a de novo trans-location in a child with Rett’s syndrome, without MECP2 mutation13.Both de novo mutations identified here are missense (p.Tyr23Cys andp.Thr135Ile) at highly conserved positions predicted to disrupt proteinfunction, although there is evidence of mosaicism for the former muta-tion (Supplementary Table 3).
CHD8 has not previously been associated with ASD and codes foran ATP-dependent chromatin-remodelling factor that has a signifi-cant role in the regulation of both b-catenin and p53 signalling14,15. Wealso identified de novo missense variants in CHD3 as well as CHD7(CHARGE syndrome, OMIM 214800), a known binding partner ofCHD8 (ref. 16). ASD has been found in as many as two-thirds ofchildren with CHARGE, indicating that CHD7 may contribute to anASD syndromic subtype17.
We identified 30 protein-altering de novo events intersecting withMendelian disease loci (Supplementary Table 3) as well as inheritedhemizygous mutations of clinical significance (Supplementary Table 9).
The de novo mutations included truncating events in syndromicintellectual disability genes (MBD5 (mental retardation, autosomaldominant 1, OMIM 156200), RPS6KA3 (Coffin–Lowry syndrome,OMIM 303600) and DYRK1A (the Down’s syndrome candidategene, OMIM 600855)), and missense variants in loci associated withsyndromic ASD, including CHD7, PTEN (macrocephaly/autismsyndrome, OMIM 605309) and TSC2 (tuberous sclerosis complex,OMIM 613254). Notably, DYRK1A is a highly conserved genemapping to the Down’s syndrome critical region (SupplementaryFig. 8). The proband here (13890) is severely cognitively impairedand microcephalic, consistent with previous studies of DYRK1Ahaploinsufficiency in both patients and mouse models18.
Twenty-one of the non-synonymous de novo mutations map toCNV regions recurrently identified in children with developmentaldelay and ASD (Supplementary Table 10), such as MBD5 (2q23.1 dele-tion syndrome), SYNRG (17q12 deletion syndrome) and POLRMT(19p13.3 deletion)19. There is also considerable overlap with genes dis-rupted by single de novo CNVs in children with ASD (for example,NLGN1 and ARID1B; Supplementary Table 11). Given the priorprobability that these loci underlie genomic disorders, the disruptivede novo SNVs and small indels may be pinpointing the possible majoreffect locus for ASD-related features. For example, we identified a com-plex de novo mutation resulting in truncation of SETBP1 (SET bindingprotein 1), one of five genes in the critical region for del(18)(q12.2q21.1)syndrome (Fig. 1d), which is characterized by hypotonia, expressivelanguage delay, short stature and behavioural problems20. Recurrentde novo missense mutations at SETBP1 were recently reported to becausative for a distinct phenotype, Schinzel–Giedion syndrome,probably through a gain-of-function mechanism21, indicating diversephenotypic outcomes at this locus depending on mutation mechanism.
Several of the mutated genes encode proteins that directly interact,suggesting a common biological pathway. From our full list of genescarrying truncating or severe missense mutations (126 events from all209 families), we generated a protein–protein interaction (PPI) net-work based on a database of physical interactions (SupplementaryTable 12)22. We found 39% (49 of 126) of the genes mapped to a highly
0 1 2+
20
40
60
80
10
01
20
14
0
ba
d Chr18: 40000000 40500000 41000000 41500000
18q12.3
SETBP1 SLC14A2SLC14A1
SIGLEC15
EPG5
Cases
Controls
c
Pate
rnal ag
e (m
on
ths)
Number of de novo coding mutations
0 1 2 3+
25
03
50
45
05
50
Number of extreme de novo mutations
No
n-v
erb
al IQ
41paternalevents
10maternalevents
AAT
TTT
T
AA
GG
Figure 1 | De novo mutation events in autism spectrum disorder.a, Haplotype phasing using informative markers shows a strong parent-of-origin bias with 41 of 51 de novo events occurring on the paternally inheritedhaplotype. Arrows represent sequence reads from paternal (blue) or maternal(red) haplotypes. b, c, Box and whisker plots for 189 SSC probands. b, Thepaternal estimated age at conception versus the number of observed de novopoint mutations (0, n 5 53; 1, n 5 65; 2, n 5 44; 31, n 5 27). c, Decreased non-verbal IQ is significantly associated with an increasing number of extreme
mutation events (0, n 5 138; 1, n 5 41; 21, n 5 10), both with and withoutCNVs (Supplementary Discussion). d, Browser images showing CNVsidentified in the del(18)(q12.2q21.1) syndrome region. The truncating pointmutation in SETBP1 occurs within the critical region, identifying the likelycausative locus. Each red (deletion) and green (duplication) line represents anidentified CNV in cases (solid lines) versus controls (dashed lines), witharrowheads showing point mutation.
RESEARCH LETTER
2 | N A T U R E | V O L 0 0 0 | 0 0 M O N T H 2 0 1 2
Macmillan Publishers Limited. All rights reserved©2012

interconnected network wherein 92% of gene pairs in the connectedcomponent are linked by paths of three or fewer edges (Fig. 2a). Wetested this degree of interconnectivity by simulation (n 5 10,000 repli-cates; Methods and Supplementary Fig. 9) and found that our experi-mental network had significantly more edges (P , 0.0001) and agreater clustering coefficient (P , 0.0001) than expected by chance.
To investigate the relevance of this network to autism further, weapplied degree-aware disease gene prioritization (DADA)23, based onthe same PPI database to rank all genes based on their relatedness to a
set of 103 previously identified ASD genes17. We found that the geneswith severe mutations ranked significantly higher than all other genes(Mann–Whitney U-test, P , 4.0 3 1024), suggesting enrichment ofASD candidates. Furthermore, the 49 members of the connected com-ponent overwhelmingly drove this difference (Mann–Whitney U-test,P , 1.6 3 1028), as the unconnected members were not significant ontheir own (Mann–Whitney U-test, P , 0.28), increasing our confid-ence that these connected gene products are probably related to ASD(Supplementary Fig. 10). Consistent with this finding, the rankings ofunaffected sibling events are highly similar to the unconnected com-ponent, strengthening our confidence in the enrichment of the con-nected component of proband events for ASD-relevant genes.
Members of this network have known functions in b-catenin andp53 signalling, chromatin remodelling, ubiquitination and neuronaldevelopment (Fig. 2a). A fundamental developmental regulatorobserved in the network is CTNNB1 (catenin (cadherin-associatedprotein), b1, 88 kDa), also known as b-catenin. Interestingly, a parallelanalysis using ingenuity pathway analysis (IPA) shows an enrichmentof upstream interacting genes of the b-catenin pathway (8 of 358,P 5 0.0030; see Methods, Supplementary Table 13 and Supplemen-tary Fig. 11). A role for Wnt/b-catenin signalling in ASD was previ-ously proposed24, largely on the basis of the association of commonvariants in EN2 and WNT2, and the high rate of children withmacrocephaly. It is striking that both individuals with CHD8 muta-tions in this study have multiple de novo disruptive missense muta-tions in this pathway or closely related pathways (Fig. 2b, c andSupplementary Fig. 12) and both have macrocephaly.
In addition, the pathway analysis shows several other disrupted genesnot identified in the PPI that are involved in common pathways, whichin some cases are linked to b-catenin (Supplementary Discussion andSupplementary Fig. 11). TBR1, for example, is a transcription factor thathas a critical role in the development of the cerebral cortex25. TBR1binds with CASK and regulates several candidate genes for ASD andintellectual disability including GRIN2B, AUTS2 and RELN—genes ofrecurrent ASD mutation, some of which are described here and inother studies4,9,11,17.
Our exome analysis of de novo coding mutations in 209 autism triosidentified only two recurrently altered genes, consistent with extremelocus heterogeneity underlying ASD. This extreme heterogeneitynecessitates the analysis of very large cohorts for validation. We imple-mented a cost-effective approach based on molecular inversion probe(MIP) technology26 for the targeted resequencing of six candidategenes in ,2,500 individuals, including 1,703 simplex ASD probandsand 744 controls. Four of these candidates (FOXP1, GRIN2B, LAMC3and SCN1A) were identified previously4, whereas two (FOXP2, OMIM602081 and GRIN2A, OMIM 613971) are related genes implicated inother neurodevelopmental phenotypes. We identified all previouslyobserved de novo events (that is, in the same individuals), as well asadditional de novo events in GRIN2B (two protein-truncating events),SCN1A (a missense) and LAMC3 (a missense) (Supplementary Table 8).The observed number of de novo events was compared with expecta-tions based on the mutation rates estimated for each gene (Methodsand Supplementary Table 8), with GRIN2B showing the highest sig-nificance (uncorrected P value ,0.0002). Notably, the three de novoevents observed in GRIN2B are all predicted to be protein truncating,whereas no events truncating GRIN2B were found in more than 3,000controls (Methods).
Our analysis predicts extreme locus heterogeneity underlying thegenetic aetiology of autism. Under a strict sporadic disorder–de novomutation model, if 20–30% of our de novo point mutations are con-sidered to be pathogenic, we can estimate between 384 and 821 loci(Methods and Supplementary Fig. 13). We reach a similar estimate ifwe consider recurrences from ref. 9. It is clear from phenotype andgenotype data that there are many ‘autisms’ represented under thecurrent umbrella of ASD and other genetic models are more likelyin different contexts (for example, families with multiple affected
Table 1 | Top de novo ASD risk contributing mutationsProband NVIQ Candidate gene Amino acid change
12225.p1 89 ABCA2 p.Val1845Met11653.p1 44 ADCY5 p.Arg603Cys12130.p1 55 ADNP Frameshift indel11224.p1 112 AP3B2 p.Arg435His13447.p1 51 ARID1B Frameshift indel13415.p1 48 BRSK2 3n indel14292.p1 49 BRWD1 Frameshift indel11872.p1 65 CACNA1D p.Ala769Gly11773.p1 50 CACNA1E p.Gly1209Ser13606.p1 60 CDC42BPB p.Arg764TERM12086.p1 108 CDH5 p.Arg545Trp12630.p1 115 CHD3 p.Arg1818Trp13733.p1 68 CHD7 p.Gly996Ser13844.p1 34 CHD8 p.Gln959TERM12752.p1 93 CHD8 Frameshift indel13415.p1 48 CNOT4 p.Asp48Asn12703.p1 58 CTNNB1 p.Thr551Met11452.p1 80 CUL3 p.Glu246TERM11571.p1 94 CUL5 p.Val355Ile13890.p1 42 DYRK1A Splice site12741.p1 87 EHD2 p.Arg167Cys11629.p1 67 FBXO10 p.Glu54Lys13629.p1 63 GPS1 p.Arg492Gln13757.p1 91 GRINL1A 3n indel11184.p1 94 HDGFRP2 p.Glu83Lys11610.p1 138 HDLBP p.Ala639Ser11872.p1 65 KATNAL2 Splice site12346.p1 77 MBD5 Frameshift indel11947.p1 33 MDM2 p.Glu433Lys/p.Trp160TERM11148.p1 82 MLL3 p.Tyr4691TERM12157.p1 91 NLGN1 p.His795Tyr11193.p1 138 NOTCH3 p.Gly1134Arg11172.p1 60 NR4A2 p.Tyr275His11660.p1 60 NTNG1 p.Thr135Ile12532.p1 110 NTNG1 p.Tyr23Cys11093.p1 91 OPRL1 p.Arg157Cys13793.p1 56 PCDHB4 p.Asp555His11707.p1 23 PDCD1 Frameshift indel12304.p1 83 PSEN1 p.Thr421Ile11390.p1 77 PTEN p.Thr167Asn13629.p1 63 PTPRK p.Arg784His13333.p1 69 RGMA p.Val379Ile13222.p1 86 RPS6KA3 p.Ser369TERM11257.p1 128 RUVBL1 p.Leu365Gln11843.p1 113 SESN2 p.Ala46Thr12933.p1 41 SETBP1 Frameshift indel12565.p1 79 SETD2 Frameshift indel12335.p1 47 TBL1XR1 p.Leu282Pro11480.p1 41 TBR1 Frameshift indel11569.p1 67 TNKS p.Arg568Thr12621.p1 120 TSC2 p.Arg1580Trp11291.p1 83 TSPAN17 p.Ser75TERM11006.p1 125 UBE3C p.Ser845Phe12161.p1 95 UBR3 Frameshift indel12521.p1 78 USP15 Frameshift indel11526.p1 92 ZBTB41 p.Tyr886His13335.p1 25 ZNF420 p.Leu76Pro
CNVProband NVIQ Candidate gene Type
11928.p1 66 CHRNA7 Duplication13815.p1 56 CNTNAP4 Deletion13726.p1 59 CTNND1 Deletion12581.p1 34 EHMT1 Deletion13335.p1 25 TBX6 Duplication
Top candidate mutations based on severity and/or supporting evidence from the literature.
LETTER RESEARCH
0 0 M O N T H 2 0 1 2 | V O L 0 0 0 | N A T U R E | 3
Macmillan Publishers Limited. All rights reserved©2012
individuals). There is marked convergence on genes previously impli-cated in intellectual disability and developmental delay. As has beennoted for CNVs, this indicates that nosological divisions may notreadily translate into differences at the molecular level. We believe thatthere is value in comparing mutation patterns in children withdevelopmental delay (without features of autism) to those in childrenwith ASD.
Although there is no one major genetic lesion responsible for ASD,it is still largely unknown whether there are subsets of individuals witha common or strongly related molecular aetiology and how large thesesubsets are likely to be. Using gene expression, protein–protein inter-actions, and CNV pathway analysis, recent reports have highlightedthe role of synapse formation and maintenance27–29. We find itintriguing that 49 proteins found to be mutated here have critical rolesin fundamental developmental pathways, including b-catenin and p53signalling, and that patients have been identified with multipledisruptive de novo mutations in interconnected pathways. The latterobservations are consistent with an oligogenic model of autism whereboth de novo and extremely rare inherited SNV and CNV mutationscontribute in conjunction to the overall genetic risk. Recent work hassupported a role for these interconnected pathways in neuronal stem-cell fate-determination, differentiation and synaptic formation inhumans and animal models24,30,31. Given that fundamental develop-mental processes have previously been found to underlie syndromicforms of autism, a wider role of these pathways in idiopathic ASDwould not be entirely surprising and would help explain the extremegenetic heterogeneity observed in this study.
METHODS SUMMARYExome capture, alignments and base-calling. Genomic DNA was deriveddirectly from whole blood. Exomes were considered to be completed when,90% of the capture target exceeded 8-fold coverage and ,80% exceeded 20-foldcoverage. Exomes for the 189 trios (and 31 unaffected siblings) were captured withNimbleGen EZ Exome V2.0. Reads were mapped as in ref. 4 to a custom referencegenome assembly (GRC build37). Genotypes were generated with GATK unifiedgenotyper and parallel SAMtools pipeline4. Exomes for the unaffected siblingsmatching the pilot trios were captured and analysed as in ref. 4. Predicted de novoevents were called as in ref. 4 and confirmed by capillary sequencing in all familymembers (for 176 of the 189 trios, this also included one unaffected sibling).Mutations were considered severe if they were truncating, missense withGrantham score $50 and GERP score $3 or only Grantham score $85, or deleteda highly conserved amino acid.Exome read-depth CNV analysis. Reads were mapped using mrsFAST andnormalized reads per kilobase of exon per million mapped reads (RPKM) values
calculated by exon. Population normalization was performed using a set of 366non-ASD exomes. Calls were made if three or more exons passed a threshold valueand cross-validated calls using two orthogonal platforms, custom array CGH andIllumina 1M array data2. CNVs were filtered to identify de novo and rare inheritedevents by comparison with 2,090 controls and 1,651 parent profiles.Network reconstruction and null model estimation. PPI networks were generatedusing physical interaction data from GeneMANIA22. Null models were estimatedusing gene-specific mutation rate estimates based on human–chimp divergence. Torank candidate genes we obtained the seed ASD list from ref. 17 and severe dis-ruptive de novo events from all families (n 5 209). Given the PPI network and seedgene product list, we used DADA23 for ranking each gene.Human subjects. All samples and phenotypic data were collected under thedirection of the Simons Simplex Collection by its 12 research clinic sites (http://sfari.org/sfari-initiatives/simons-simplex-collection). Parents consented and childrenassented as required by each local institutional review board. Participantswere de-identified before distribution. Research was approved by the Universityof Washington Human Subject Division under non-identifiable biologicalspecimens/data.
Full Methods and any associated references are available in the online version ofthe paper at www.nature.com/nature.
Received 8 September 2011; accepted 23 February 2012.
Published online 4 April 2012.
1. Schaaf, C. P. & Zoghbi, H. Y. Solving the autism puzzle a few pieces at a time.Neuron 70, 806–808 (2011).
2. Sanders, S. J. et al. Multiple recurrent de novo CNVs, including duplications of the7q11.23 Williams syndrome region, are strongly associated with autism. Neuron70, 863–885 (2011).
3. Levy, D. et al. Rare de novo and transmitted copy-number variation in autisticspectrum disorders. Neuron 70, 886–897 (2011).
4. O’Roak, B. J. et al. Exome sequencing in sporadic autism spectrum disordersidentifies severe de novo mutations. Nature Genet. 43, 585–589 (2011).
5. Hultman, C. M., Sandin, S., Levine, S. Z., Lichtenstein, P. & Reichenberg, A.Advancing paternal age and risk of autism:new evidence froma population-basedstudy and a meta-analysis of epidemiological studies. Mol. Psychiatry 16,1203–1212 (2010).
6. Fischbach, G. D. & Lord, C. The Simons Simplex Collection: a resource foridentification of autism genetic risk factors. Neuron 68, 192–195 (2010).
7. Lynch, M. Rate, molecular spectrum, and consequences of human mutation. Proc.Natl Acad. Sci. USA 107, 961–968 (2010).
8. Xu, B. et al. Exome sequencing supports a de novo mutational paradigm forschizophrenia. Nature Genet. 43, 864–868 (2011).
9. Sanders, S. J. et al. De novo mutations revealed by whole-exome sequencing arestrongly associated with autism. Nature http://dx.doi.org/10.1038/nature10945(this issue).
10. Hehir-Kwa, J. Y. et al. De novo copy number variants associated with intellectualdisability have a paternal origin and age bias. J. Med. Genet. 48, 776–778 (2011).
11. O’Roak, B. J. & State, M. W. Autism genetics: strategies, challenges, andopportunities. Autism Res. 1, 4–17 (2008).
SYNE1 UBE3C
DDX20 MYBBP1A
BRSK2
POLRMT
INCENP
RUVBL1IQGAP2
CUL3
MAP4HNRNPF
NACA HDLBPKRT80
HDGFRP2
BRWD1
FBXW9
PDIA6
H2AFV
ADCY5
NR4A2CHD7
TSR2
SFPQRPS6KA3
ARID1B
CHD8
PBRM1TBL1XR1
CDC42BPBCNOT3
CNOT1
EIF4G1
MKI67
KATNAL2UBR3
SRBD1
MYH10
SCN1A
CTNNB1
PSEN1NOTCH3CDH5
ADNP
YTHDC2CHD3
DEPDC7DYRK1A 2x
13844.p1
TOP3B
TLE1
ALB
PPP3CA
APOA1
PRKACB
SCGB1A1
HNF4A
PID1LGALS3
CTCF
CTNNB1
GIF
ZNF143
GC
LGMN
LRP2
AMN
CHD8
CUBN
RCAN1
Nonsense Splice Frameshift Deletion of amino acidMissense
De novo truncating SNV CHD8
Deletion PITRM1
5 gene disruptions
De novo truncating SNV CUBN
Deletion SPNS3Deletion RCAN1
a b
c
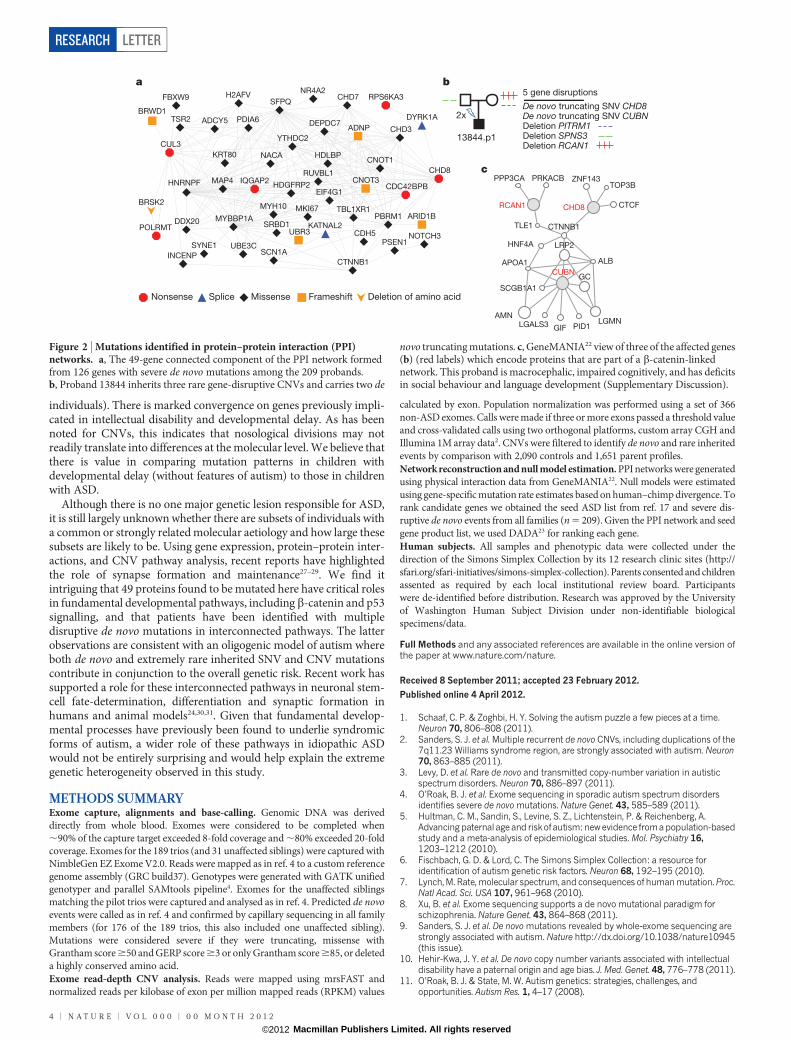
Figure 2 | Mutations identified in protein–protein interaction (PPI)networks. a, The 49-gene connected component of the PPI network formedfrom 126 genes with severe de novo mutations among the 209 probands.b, Proband 13844 inherits three rare gene-disruptive CNVs and carries two de
novo truncating mutations. c, GeneMANIA22 view of three of the affected genes(b) (red labels) which encode proteins that are part of a b-catenin-linkednetwork. This proband is macrocephalic, impaired cognitively, and has deficitsin social behaviour and language development (Supplementary Discussion).
RESEARCH LETTER
4 | N A T U R E | V O L 0 0 0 | 0 0 M O N T H 2 0 1 2
Macmillan Publishers Limited. All rights reserved©2012

12. Nishimura-Akiyoshi, S., Niimi, K., Nakashiba, T. & Itohara, S. Axonal netrin-Gstransneuronally determine lamina-specific subdendritic segments. Proc. NatlAcad. Sci. USA 104, 14801–14806 (2007).
13. Borg, I. et al. Disruption of Netrin G1 by a balanced chromosome translocation in agirl with Rett syndrome. Eur. J. Hum. Genet. 13, 921–927 (2005).
14. Nishiyama, M. et al. CHD8 suppresses p53-mediated apoptosis through histoneH1recruitmentduringearly embryogenesis.NatureCell Biol. 11, 172–182 (2009).
15. Thompson, B. A., Tremblay, V., Lin, G. & Bochar, D. A. CHD8 is an ATP-dependentchromatin remodeling factor that regulates b-catenin target genes. Mol. Cell. Biol.28, 3894–3904 (2008).
16. Batsukh, T. et al.CHD8 interacts withCHD7, a proteinwhich ismutated inCHARGEsyndrome. Hum. Mol. Genet. 19, 2858–2866 (2010).
17. Betancur, C. Etiological heterogeneity in autism spectrum disorders: more than100 genetic and genomic disorders and still counting. Brain Res. 1380, 42–77(2011).
18. Moller, R. S. et al.Truncation of the Downsyndrome candidate gene DYRK1A in twounrelated patients with microcephaly. Am. J. Hum. Genet. 82, 1165–1170 (2008).
19. Cooper, G. M. et al. A copy number variation morbidity map of developmentaldelay. Nature Genet. 43, 838–846 (2011).
20. Buysse, K. et al. Delineation of a critical region on chromosome 18 for thedel(18)(q12.2q21.1) syndrome. Am. J. Med. Genet. A. 146A, 1330–1334 (2008).
21. Hoischen, A. et al. De novo mutations of SETBP1 cause Schinzel-Giedionsyndrome. Nature Genet. 42, 483–485 (2010).
22. Warde-Farley, D. et al. The GeneMANIA prediction server: biological networkintegration for gene prioritization and predicting gene function. Nucleic Acids Res.38, W214–W220 (2010).
23. Erten, S., Bebek, G., Ewing, R. & Koyuturk, M. DADA: Degree-aware algorithms fornetwork-based disease gene prioritization. BioData Mining 4, 19 (2011).
24. De Ferrari, G. V. & Moon, R. T. The ups and downs of Wnt signaling in prevalentneurological disorders. Oncogene 25, 7545–7553 (2006).
25. Bedogni, F.et al.Tbr1 regulates regional and laminar identity ofpostmitoticneuronsin developing neocortex. Proc. Natl Acad. Sci. USA 107, 13129–13134 (2010).
26. Turner, E. H., Lee, C., Ng, S. B., Nickerson, D. A. & Shendure, J. Massively parallelexon capture and library-free resequencing across 16 genomes. Nature Methods6, 315–316 (2009).
27. Voineagu, I. et al. Transcriptomic analysis of autistic brain reveals convergentmolecular pathology. Nature 474, 380–384 (2011).
28. Sakai, Y. et al. Protein interactome reveals converging molecular pathways amongautism disorders. Sci. Transl. Med. 3, 86ra49 (2011).
29. Gilman, S. R. et al. Rare de novo variants associated with autism implicate a largefunctional network of genes involved in formation and function of synapses.Neuron 70, 898–907 (2011).
30. Ille, F. & Sommer, L. Wnt signaling: multiple functions in neural development. Cell.Mol. Life Sci. 62, 1100–1108 (2005).
31. Tedeschi, A. & Di Giovanni, S. The non-apoptotic role of p53 in neuronal biology:enlightening the dark side of the moon. EMBO Rep. 10, 576–583 (2009).
Supplementary Information is linked to the online version of the paper atwww.nature.com/nature.
Acknowledgements We would like to thank and recognize the following ongoingstudies that produced and provided exome variant calls for comparison: NHLBI LungCohort Sequencing Project (HL 1029230), NHLBI WHI Sequencing Project (HL102924), NIEHS SNPs (HHSN273200800010C), NHLBI/NHGRI SeattleSeq (HL094976), and theNorthwestGenomicsCenter (HL102926).Wearegrateful toall of thefamilies at the participating Simons Simplex Collection (SSC) sites, as well as theprincipal investigators (A. Beaudet, R. Bernier, J. Constantino, E. Cook, E. Fombonne,D. Geschwind, E. Hanson, D. Grice, A. Klin, R. Kochel, D. Ledbetter, C. Lord, C. Martin,D. Martin, R. Maxim, J. Miles, O. Ousley, K. Pelphrey, B. Peterson, J. Piggot, C. Saulnier,M. State, W. Stone, J. Sutcliffe, C. Walsh, Z. Warren and E. Wijsman). We alsoacknowledge M. State and the Simons Simplex Collection Genetics Consortium forproviding Illumina genotyping data, T. Lehner and the Autism Sequencing Consortiumfor providing an opportunity for pre-publication data exchange among theparticipating groups. We appreciate obtaining access to phenotypic data on SFARIBase. This work was supported by the Simons Foundation Autism Research Initiative(SFARI 137578 and 191889; E.E.E., J.S. and R.B.) and NIH HD065285 (E.E.E. and J.S.).E.B. is anAlfredP. Sloan Research Fellow. E.E.E. is an Investigator of theHowardHughesMedical Institute.
Author Contributions E.E.E., J.S. and B.J.O. designed the study and drafted themanuscript. E.E.E. and J.S. supervised the study. R.B., B.R. and B.J.O. analysed theclinical information. R.B., L.V., S.G., E.K., N.K. and B.P.C. contributed to the manuscript.S.G., N.K., B.P.C., A.K., C.B., M.M. and L.V. generated and analysed CNV data. B.J.O. andL.V. performed MIP resequencing and mutation validations. I.B.S., E.H.T., B.J.O. and J.S.developed MIP protocol and analysis. B.V. and J.M.A. generated loci-specific mutationrate estimates. R.L. and E.B. performed PPI network analysis and simulations. E.K.performed DADA analysis. C.L. performed Illumina sequencing. J.D.S., I.B.S., E.H.T. andC.L. analysed sequence data. B.P.C. performed IPA analysis. B.J.O., E.K. and N.K.developed the de novo analysis pipelines and analysed sequence data. D.A.N., M.J.R.,J.D.S. and E.H.T. supervised exome sequencing and primary analysis.
Author Information Access to the raw sequence reads can be found at the NCBIdatabase of Genotypes and Phenotypes (dbGaP) and National Database for AutismResearch under accession numbers phs000482.v1.p1 and NDARCOL0001878,respectively. Reprints and permissions information is available at www.nature.com/reprints. The authors declare competing financial interests: details accompany thefull-text HTML version of thepaper atwww.nature.com/nature. Readers are welcome tocomment on the online version of this article at www.nature.com/nature.Correspondence and requests for materials should be addressed to E.E.E.([email protected]) or J.S. ([email protected]).
LETTER RESEARCH
0 0 M O N T H 2 0 1 2 | V O L 0 0 0 | N A T U R E | 5
Macmillan Publishers Limited. All rights reserved©2012

METHODSExome capture, alignments and base-calling. Exomes for the 189 trios (and 31unaffected siblings) were captured with NimbleGen EZ Exome V2.0. Finallibraries were then sequenced on either an Illumina GAIIx (paired- or single-end 76-bp reads) or HiSeq2000 (paired- or single-end 50-bp reads). Reads weremapped to a custom GRCh37/hg19 build using BWA 0.5.6 (ref. 32). Read qualitieswere recalibrated using GATK Table Recalibration 1.0.2905 (ref. 33). Picard-tools1.14 was used to flag duplicate reads (http://picard.sourceforge.net/). GATKIndelRealigner 1.0.2905 was used to realign reads around insertion/deletion(indel) sites. Genotypes were generated with GATK Unified Genotyper33 withFILTER 5 ‘‘QUAL # 50.0 jj AB $ 0.75 jjHRun . 3 jjQD , 5.0’’ and in parallelwith the SAMtools pipeline as described previously4. Only positions with at leasteightfold coverage were considered. All pilot sibling exomes were captured andanalysed as described previously4. Predicted de novo events were called and com-pared against a set of 946 other exomes to remove recurrent artefacts and likelyundercalled sites. Indels were also called with the GATK Unified Genotyper andSAMtools and filtered to those with at least 25% of reads showing a variant at aminimum depth of 83. Mutations were phased using molecular cloning of PCRfragments, read-pair information, linked informative SNPs, and obligate carrierstatus. To identify rare private variants (singleton), the full variant list was com-pared against a larger set of 1,779 other exomes. Predicted de novo indels were alsofiltered against this larger set.Sanger validations. All reported de novo events (exome or MIP capture) werevalidated by designing primers with BatchPrimer3 followed by PCR amplificationand Sanger sequencing. We performed PCR reactions using 10 ng of DNA fromfather, mother, unaffected sibling (when available), and proband and performedSanger capillary sequencing of the PCR product using forward and reverse primers.In some cases, one direction could not be assessed due to the presence of repeatelements or indels in close proximity to the mutation event.Mutation candidate gene analysis. We examined whether each non-synonymousor CNV de novo event may be contributing to the aetiology of ASD by evaluatingthe likelihood deleteriousness of the change (GERP, Grantham score) andintersecting with known syndromic and non-syndromic candidate genes, CNVmorbidity maps, and information in OMIM and PubMed. Mutations were con-sidered severe if they were truncating, missense with Grantham score $50 andGERP score $3 or only Grantham score $85, or deleted a highly conserved aminoacid. For genes that had not previously been implicated in ASD, we gave priority tothose with structural similarities to known candidate or strong evidence of neuralfunction or development.Exome read-depth CNV discovery. To find CNVs using exome read-depth data,we first mapped sequenced reads to the hg19 exome using the mrsFAST aligner34.Next, we applied a novel method (N.K. et al., manuscript in preparation), whichuses normalized RPKM values35 of the ,194,000 captured exons/sequences,subsequent population normalization using 366 exomes from the ExomeSequencing Project and singular value decomposition to remove systematic biaspresent within exome capture reactions. Rare CNVs were detected using athreshold cutoff of the normalized RPKM values, and we required at least threeexons above our threshold in order to make a call. We made a total of 1,077deletion or duplication calls in 366 individuals (range 0–14, median 5 3,mean 5 2.94).CNV detection using array CGH. A custom-targeted 2 3 400K Agilent chip withmedian probe spacing of 500 bp in the genomic hotspots flanked by segmentalduplications or Alu repeats and probe spacing of 14 kb in the genomic backbonewas designed. All experiments were performed according to the manufacturer’sinstructions using NA12878 as the female reference and NA18507 as the malereference (Coriell). Data analysis was performed following feature extraction usingDNA analytics with ADM-2 setting. All CNV calls were visually inspected in theUCSC Genome Browser. CNV calls from probands were then intersected withthose from parents and also with 377 controls recruited through NIMH GeneticsInitiative36,37 and ClinSeq cohort38 analysed on the same microarray platform. TheNIMH set of controls were ascertained by the NIMH Genetics Initiative36 throughan online self-report based on the Composite International Diagnostic InstrumentShort-Form (CIDI-SF)37. Those who did not meet DSM-IV criteria for majordepression, denied a history of bipolar disorder or psychosis, and reported exclu-sively European origins were included39,40. Samples from the ClinSeq cohort wereselected from a population representing a spectrum of atherosclerotic heartdisease38. De novo and inherited potential pathogenic CNVs were selected onlyif they intersected with RefSeq coding sequence and allowing for a frequency of,1% in the controls and ,50% segmental duplication content.Illumina array CNV calling. CNV calling was performed in hg18 as describedpreviously41, using an HMM that incorporates both allele frequencies (BAF) andtotal intensity values (logR). In total, we generated CNV calls for 841 probands,1,651 parents and 793 siblings including the samples reported recently2. Of the 122
families selected for CNV comparisons in this study, calls were generated for 107probands. Of these, both parents were profiled for 101 families and one parent wasprofiled for the remaining six families. In addition, at least one sibling was profiledfor 99 of these families.
Independent of array CGH detection, to identify putatively pathogenic CNVs,we first compared our data to 2,090 control samples derived from the WellcomeTrust Case Control Consortium (WTCCC) National Blood Services Cohort19,42
and filtered all CNVs present in 1% (20) of WTCCC2 controls or 1% (16) ofparents by 50% reciprocal overlap with matching copy number status. In addition,similar to the filtering criteria used for array CGH detection, we selected onlyCNVs that contained less than 50% segmental duplication and intersected withRefSeq coding sequence. To select putative de novo CNVs, we further required theCNV not to be present in family-matched parents and siblings. Additionally, wefiltered CNVs present in .0.1% (2) of the full 1,651 parent set. To select potential,rare inherited events, we required the CNV be detected in a matched parent orsibling. Finally, we filtered the genes inside each CNV under the same criteria (toaccount for smaller or larger CNPs) and removed CNVs with no remaining genes.CNV cross validation. High-confidence, cross-validated de novo and inheritedCNVs were selected by identifying events detected by at least two of threemethodologies. To account for the variable breakpoint definitions in arrayCGH, SNP arrays, and exome copy number profiles, we aligned the CNVs by atleast one overlapping gene ID and reported each CNV region by its maximal outerboundaries. This identified six de novo and 70 rare inherited events for furtherstudy (Supplementary Table 6).Ingenuity pathway analysis. Ingenuity pathway analysis (IPA) was performed toidentify potential functional enrichments within both our PPI (49 genes) andoverall set of 126 genes. RefSeq reference gene list was used as a background listfor all analysis. To confirm our results pertaining to CTNNB1 upstream enrich-ment, we simulated 10,000 random populations of 209 individuals using Poissonpriors for each gene based on their estimated mutation rates (see below), with aglobal correction factor resulting in selecting a mean of 126 genes per population.We then used this simulation data to calculate the probability of observing eightdirect upstream interactors of CTNNB1 and determined that our data set isenriched for these genes with P 5 0.0030.Estimating locus-specific mutation rates. Human–chimpanzee alignments weredownloaded from the UCSC Genome Browser (reference versions GRCb37 andpanTro2, http://hgdownload.cse.ucsc.edu/goldenPath/hg19/vsPanTro2/syntenicNet/).The more conservative syntenicNet alignments were used (details in http://hgdownload.cse.ucsc.edu/goldenPath/hg19/vsPanTro2/README.txt). Gene defi-nitions were downloaded from the UCSC Table Browser, from the RefSeq Genestrack, and the refFlat table. Exons were extended by 2 bp, and overlapping exonswere merged using BEDTools. Non-exonic sequence was not considered. For eachgene, we extracted: (1) d 5 the number of differences between chimpanzee andhuman; and (2) n 5 the number of bases aligned. We assumed a divergence timebetween human and chimpanzee of 12 million years (Myr) and an average genera-tion time of 25 years. We then calculated gene-specific mutation rates per site pergeneration: r 5 (d/n)/(12 Myr/25 years/generation). We calculated the probabilityof observing X1 events using the Poisson distribution defined by the number ofchromosomes screened and the size of the coding region, including actual splicebases.Network simulation and null model estimation. To generate a null distributionof gene mutations, de novo mutation rates were estimated from human–chimpmutation rates. A pseudocount of 2.083331026 (the smallest calculated in thegene set) was applied to any exon with a mutation rate of zero. To create null genesets, genes were drawn uniformly from this background distribution. Humanprotein–protein interaction data were collected from GeneMANIA22 on 29August 2011. Only direct physical interactions from the Homo sapiens databasewere considered. The list comprises approximately 1.5 million physical interac-tions, gathered from 150 studies. A protein interaction network was created fromeach experimental and null gene set by drawing edges between genes with physicalinteractions reported in the GeneMANIA database. Qualitatively similar resultswere achieved by including only interactions supported by multiple independentdata sources. For each network, clustering coefficient, centralization, average shortestpath length, density, and heterogeneity were determined using Cytoscape43 andNetwork Analyzer44. Duplicate- and self-interactions were not considered in cal-culating network statistics.Disease gene prioritization based on PPI networks. We applied degree-awarealgorithms to rank a set of candidate genes with respect to a set of products of genesassociated with ASD using human PPI networks. We used the integrated humanPPI network data collected from GeneMANIA22 on 29 August 2011. The PPInetwork contains 12,007 proteins with ,1.5 million direct physical interactionsassociated with a reliability score. We obtain the seed proteins for the ASD fromthe list of ref. 17. For the candidate set we used 126 gene products from the severe
RESEARCH LETTER
Macmillan Publishers Limited. All rights reserved©2012

disruptive de novo events from the pilot autism project4 and the current study.Given the GeneMANIA PPI network and Betancur seed gene product list, we usedDADA23 for ranking the candidate genes. We emphasize that this ranking is notimplying causality but rather relatedness to genes previously and independentlyassociated with ASD. For testing the significance of this ranking, we rank all thegene products except the seed set using the same algorithm. On the basis of theranking result, we applied a Mann–Whitney U rank sum test (one-tailed) on thecandidate set compared to all the other genes.MIP protocol. Each of 1,703 autism probands from the SSC collection and 744controls from the NIMH collection was subjected to MIP-based multiplex captureof the six genes: SCN1A, GRIN2B, GRIN2A, LAMC3, FOXP1 and FOXP2. For eachlibrary, 50 ng of DNA was used. Individually synthesized 70 mer MIPs (n 5 355)were pooled and 59 phosphorylated with T4 PNK (NEB). Hybridization with MIPs,gap filling and ligation were performed in one step for 45–48 h at 60 uC, followed byan exonuclease treatment of 30 min at 37 uC, similar to ref. 45, with modifications forreduced MIP number (B.J.O. et al., manuscript in preparation). Amplification of thelibrary was performed by PCR using different barcoded primers for each library.Then barcoded libraries were pooled, purified using Agencourt AMPure XP andone lane of 101-bp paired-end reads was generated for each mega-pool (,384) onan Illumina HiSeq 2000 according to manufacturer’s instructions. Raw reads weremapped to the genome as in ref. 4. MIP targeting arms were then removed andvariants called using SAMtools4. A 25-fold coverage, with AB allele ration ,0.7,and quality 30 threshold was used for high-confident variant calling. Private(possible de novo) variants were identified by filtering against 1,779 other exomes.The parents of children with disruptive rare variants were then captured. Variantsnot seen or with low coverage in the parents were validated by Sanger capillary-based fluorescent sequencing. No truncating variants of GRIN2B were observed inthe MIP sequenced controls or the Exome Variant Server ESP2500 release (NHLBIExome Sequencing Project (ESP), Seattle, Washington, http://evs.gs.washington.edu/EVS/).Estimating the number of autism loci. The gene-level specificity of exomesequencing enables the estimation of the number of recurrently mutated genesimplicated in the genetic aetiology of sporadic ASD. This question can bereformulated as the ‘unseen species problem’ (see ref. 46 for review and ref. 2for application to de novo CNVs discovered in autism), where genes with severe denovo events in probands are considered ‘observed species’, and binned by theirfrequency of appearance (that is, singletons, doubletons, etc.). We estimated thetotal number of genes implicated in autism (the total number of species) usingseveral different estimators (implemented in the R package SPECIES, http://www.jstatsoft.org/), as well as the formula provided in ref. 2. This estimate dependson the number of singletons and twin pairs of genes observed in probands, as wellas the fraction of de novo events believed to be pathogenic for autism, that is, single,disruptive events that can cause autism on their own. We assumed that both of our
recurrent severe de novo events (affecting CHD8 and NTNG1) were pathogenic;these compose the entire set of twin pairs. The number of singletons is based on theestimated a priori fraction of the observed events that are pathogenic for autism.Across this sliding scale, the estimated number of loci is plotted in SupplementaryFig. 13. For example, using the estimator from ref. 47, if 20–50% of our de novosevere events are considered pathogenic, exome sequencing of a large number ofadditional samples would reveal between 182 and 992 pathogenic genes harbour-ing coding de novo point mutations (Supplementary Fig. 13); if all the observedsevere de novo events in our experiment are included as pathogenic singletons, thenumber of implicated loci increases to more than 3,000.
32. Li, H. & Durbin, R. Fast and accurate short read alignment with Burrows-Wheelertransform. Bioinformatics 25, 1754–1760 (2009).
33. DePristo, M. A. et al. A framework for variation discovery and genotyping usingnext-generation DNA sequencing data. Nature Genet. 43 (2011).
34. Hach, F. et al. mrsFAST: a cache-oblivious algorithm for short-read mapping.Nature Methods 7, 576–577 (2010).
35. Mortazavi, A., Williams, B. A., McCue, K., Schaeffer, L. & Wold, B. Mapping andquantifying mammalian transcriptomes by RNA-Seq. Nature Methods 5, 621–628(2008).
36. Moldin, S. O. NIMH Human Genetics Initiative: 2003 update. Am. J. Psychiatry 160,621–622 (2003).
37. Kessler, R. C. & Ustun, T. B. The World Mental Health (WMH) survey initiativeversion of the World Health Organization (WHO) Composite InternationalDiagnostic Interview (CIDI). Int. J. Methods Psychiatr. Res. 13, 93–121 (2004).
38. Biesecker, L. G. et al. The ClinSeq Project: piloting large-scale genome sequencingfor research in genomic medicine. Genome Res. 19, 1665–1674 (2009).
39. Talati, A., Fyer, A. J. & Weissman, M. M. A comparison between screened NIMH andclinically interviewed control samples on neuroticism and extraversion. Mol.Psychiatry 13, 122–130 (2008).
40. Baum,A. E.et al.Agenome-wideassociation study implicatesdiacylglycerol kinaseeta (DGKH) and several other genes in the etiology of bipolar disorder. Mol.Psychiatry 13, 197–207 (2008).
41. Itsara, A. et al. Population analysis of large copy number variants and hotspots ofhuman genetic disease. Am. J. Hum. Genet. 84, 148–161 (2009).
42. Craddock, N. et al. Genome-wide association study of CNVs in 16,000 cases ofeight common diseases and 3,000 shared controls. Nature 464, 713–720 (2010).
43. Smoot, M. E., Ono, K., Ruscheinski, J., Wang, P. L. & Ideker, T. Cytoscape 2.8: newfeatures for data integration and network visualization. Bioinformatics 27,431–432 (2011).
44. Assenov, Y., Ramirez, F., Schelhorn, S. E., Lengauer, T. & Albrecht, M. Computingtopological parametersofbiological networks. Bioinformatics 24,282–284 (2008).
45. Mamanova, L. et al. Target-enrichment strategies for next-generation sequencing.Nature Methods 7, 111–118 (2010).
46. Bunge, J. & Fitzpatrick, M. Estimating the number of species - a Review. J. Am. Stat.Assoc. 88, 364–373 (1993).
47. Chao, A. & Lee, S. M. Estimating the number of classes via sample coverage. J. Am.Stat. Assoc. 87, 210–217 (1992).
LETTER RESEARCH
Macmillan Publishers Limited. All rights reserved©2012

W W W. N A T U R E . C O M / N A T U R E | 1
SUPPLEMENTARY INFORMATIONdoi:10.1038/nature10989
! "!
Sporadic autism exomes reveal a highly interconnected protein network of de novo mutations Brian J. O’Roak, Laura Vives, Santhosh Girirajan, Emre Karakoc, Nik Krumm, Bradley P. Coe, Roie Levy, Arthur Ko, Choli Lee, Joshua D. Smith, Emily H. Turner, Ian B. Stanaway, Benjamin Vernot, Maika Malig, Carl Baker, Beau Reilly, Joshua M. Akey, Elhanan Borenstein, Mark J. Rieder, Deborah A. Nickerson, Raphael Bernier, Jay Shendure, and Evan E. Eichler
Supplementary Table of Contents
Supplementary Discussion ........................................................................................................... 3
Supplementary Figure 1. Distribution of nonverbal intelligence quotient (NVIQ) of the SSC189 sample based on different mutation groupings. ......................................................... 13
Supplementary Figure 2. Brower views showing complex de novo mutation events. ........... 14 Supplementary Figure 3. Confirmed event showing weak allele signature. ......................... 15
Supplementary Figure 4. Observed number of mutation events fits the expected Poisson distribution. ................................................................................................................................. 16
Supplementary Figure 5. Multivariate analysis to examine effect of number of “extreme” de novo coding mutations and the presence of a CNV. ............................................................ 17
Supplementary Figure 6. Ratio of samples with various mutation types binned by NVIQ. 18 Supplementary Figure 7. Distribution of locus specific mutation rates bases on human-chimp comparisons. .................................................................................................................... 19 Supplementary Figure 8. DYRK1A falls in a Down Syndrome critical region disrupted by CNVs. ........................................................................................................................................... 20 Supplementary Figure 9. Histograms of Network statistics for 10,000 simulated null networks. ...................................................................................................................................... 21 Supplementary Figure 10. Protein-protein interaction network based prioritization of 126 gene products with severe mutations. ....................................................................................... 22 Supplementary Figure 11. Top interaction network from IPA analysis of 126 genes with severe mutations. ......................................................................................................................... 23
Supplementary Figure 12. De novo mutations in 12752.p1. .................................................... 24 Supplementary Figure 13. Estimating the number of genes contributing to sporadic autism pathogenicity via recurrent de novo mutation. ......................................................................... 25 Supplementary Table 1. Summary of sequenced families, including sex, parental age, NVIQ, CNV pre-screening, trio bases screened, and point mutations. ................................. 26 Supplementary Table 2. Summary of Exome Sequencing Results from 209 ASD Families 27
Supplementary Table 3. All 242 de novo point mutations found in 189 trios. ...................... 28 Supplementary Table 4. Comparison of mutation rates between O’Roak et al. and Sanders et al. .............................................................................................................................................. 29

SUPPLEMENTARY INFORMATION
2 | W W W. N A T U R E . C O M / N A T U R E
RESEARCH
! #!
Supplementary Table 5. De novo events identified in 50 unaffected siblings and 20 pilot probands. ..................................................................................................................................... 30
Supplementary Table 6. 70 rare inherited and 6 de novo CNVs identified in 122 trios. ...... 31 Supplementary Table 7. Expanded top de novo ASD risk contributing mutations* ............ 39
Supplementary Table 8. Mutation rates and probability of recurrence for genes with >1 mutation. ...................................................................................................................................... 42
Supplementary Table 9. Selected inherited hemizygous and compound heterozygous sites........................................................................................................................................................ 43
Supplementary Table 10. List of the 21 severe de novo mutations that map to regions of recurrent CNV associated with Developmental Delay and ASD. ........................................... 44
Supplementary Table 11. Other mutations intersecting previous CNV loci and animal models for ASD. .......................................................................................................................... 45
Supplementary Table 12. List of the 126 genes/proteins with severe mutations used for the PPI, along w/ summary stats. ..................................................................................................... 46
Supplementary Table 13. Top IPA function for the PPI connected component. .................. 48 Supplementary References ......................................................................................................... 57

W W W. N A T U R E . C O M / N A T U R E | 3
SUPPLEMENTARY INFORMATION RESEARCH
! $!
Supplementary Discussion
Sample Overlap
Three of the previously reported families (12325, 12680, and 12647) are the only samples known
to overlap with other studies (Sanders et al. 2012).
Rate of De Novo CNVs
We expected the de novo CNV rate for this cohort would be less than for other ASD cohorts as
77% (94/122) had previously been screened negative for large, disruptive de novo events.
Nonetheless, our observed rate of de novo CNVs (6/122, ~5%) is in line with other recent
estimates for ASD1,2 owing possibly to the increased resolution of detecting gene disruptions
with exome sequencing.
Effect of Multiple Genetic Lesions on Intellectual Functioning
We performed a multivariate analysis to examine effect of number of “extreme” de novo coding
mutations (0, 1 or 2 or more) and the presence of either de novo or rare inherited copy number
variation (122/189 probands) on nonverbal IQ (NVIQ) and verbal IQ (VIQ) (Supplementary
Fig. 5). Extreme mutations (n = 62) were defined as de novo protein truncating, intersections
with known OMIM and ASD candidate genes, and CNVs predicted to be gene breaking and
pathogenic. In the sample of 122 individuals for whom CNV analysis had been completed, we
observed a significant decrease in NVIQ with increased numbers of events (F(2,116) = 5.45,
p<.01, partial !2 = 0.09), but not in VIQ (F(2,116) = 1.13, p = ns, partial !2 = 0.02). This result
in NVIQ was strengthened, but not exclusively driven, by the presence of CNVs (F(2,116) =
0.97, p = ns, partial !2 = 0.02); there was no main effect of strictly having a CNV on cognitive
ability (F(2,116) = 0.71, p = ns, partial !2 = 0.006). Post hoc analyses indicated individuals with

SUPPLEMENTARY INFORMATION
4 | W W W. N A T U R E . C O M / N A T U R E
RESEARCH
! %!
one and two or more events scored significantly lower in NVIQ than individuals with no events
(mean difference = 18.0 points, p < 0.05, Cohen’s d = 0.63; 38.5 points, p < 0.01, d = 1.69;
respectively). The significant difference in NVIQ between individuals with no de novo coding
mutations and those individuals with two or more mutations was also observed with the complete
sample of 189 individuals (F(2,186) = 6.129, p<.01, partial !2 = 0.06) (Fig. 1c).
IPA Analysis
Within our 49 PPI network members, IPA detected the most significant functional enrichment in
Gene Expression (B-H p-value 9.45E-03-8.57E-02), Behavior (B-H p-value 9.45E-03-8.57E-02),
Organismal Development (B-H p-value 9.45E-03-7.74E-02), Embryonic Development (B-H p-
value 9.45E-03-8.01E-02), and Nervous System Development and Function (B-H p-value 9.45E-
03-8.91E-02) (Supplementary Table 13).
We then performed an additional IPA analysis on the 126 genes identified in 209 samples.
The top interconnected network consists of 22 genes (15 of which are PPI members), of which
CTNNB1 is a central node (Supplementary Fig. 11). To further investigate the potential role of
CTNNB1 interactors in autism, we selected all direct upstream interacting genes from beta-
Catenin in IPA and noted that 8/358 (p = 0.0030) were present in our mutation list. Furthermore,
we note that CTNNB1 is directly linked to multiple highly interconnected genes in the PPI
network (MYBBP1A, PBRM1, RUVBL1, TBL1XR1, and CHD8), suggesting that additional
mutated genes involved in CTNNB1 function are represented in autism. This enrichment for
CTNNB1 interactors further supports the hypothesis that the WNT/beta-catenin pathway may
play a role in the etiology of autism3.

W W W. N A T U R E . C O M / N A T U R E | 5
SUPPLEMENTARY INFORMATION RESEARCH
! &!
Phenotyping Summaries for Selected Families
Family 13844. Proband is second of three children with an older sister (13844.s1) and younger
brother (13844.s2).
Patient ID: 13844.fa
Summary: Father is an adult non-Hispanic white male. Age at conception of proband is 40.
Normative range of social responsiveness, but elevated score for rigidity on broader autism
phenotype. Some signs of alcoholism (use, attempting to cut down, annoyed by criticism about
drinking, feeling bad about drinking, eye opening experience). No medication use endorsed for
current or past. Some college education. Annual household income = $101–130K. Father has
head circumference of 58.5 cm (z = 1.57) and normative BMI. No comorbid diagnoses endorsed.
Patient ID: 13844.mo
Summary: Mother is an adult non-Hispanic white female. Age at conception of proband is 35.
Normative range of social responsiveness. No evidence of broader autism phenotype. Antibiotics
taken during second trimester of pregnancy with proband. Currently taking thyroid medication
and antidepressant (not taken during pregnancy). Endorsement of current tobacco use and past
marijuana use. Some college education. Annual household income = $101–130K. Mother has
head circumference of 54 cm (z = -.41) and normative BMI. No comorbid diagnoses endorsed.
Patient ID: 13844.s1
Summary: Sibling is a non-Hispanic white 10-year-old female. Normative adaptive scores and
social responsiveness from parent and teacher noted. Behavioral elevations for somatic problems
and complaints. Mother was prescribed an unspecified hormone treatment to aid with growth in
past (not currently taking). No other endorsement of medication use. Head circumference of 54
cm (z = 0.96) and normative BMI. No comorbid diagnoses endorsed. Cognitive decline
following Ebstein-Barr virus reported by parents.

SUPPLEMENTARY INFORMATION
6 | W W W. N A T U R E . C O M / N A T U R E
RESEARCH
! '!
Patient ID: 13844.s2
Summary: Sibling is a non-Hispanic white 5-year-old male. Adaptive scores not available.
Normative social responsiveness from parent and teacher. No behavioral elevations across any
domain. No endorsement of medication use. Head circumference of 52 cm (z = 0.15) and BMI
suggestive of being underweight. No comorbid diagnoses endorsed.
Patient ID: 13844.p1
Event: de novo CHD8 truncating, de novo CUBN truncating, 2X inherited CNV
Summary: Patient is a 99-month-old non-Hispanic white male diagnosed with autism. Extremely
low VIQ (20), NVIQ (34), and adaptive (59) scores. Clinical range deficits in social
responsiveness (120). Possible loss of language skills during development and elevated social
withdrawal behaviors with no comorbid diagnoses. Large head (z = 2.62) and normal BMI. Food
allergies (gluten and casein). Gastrointestinal constipation diagnosis with bloating and abdominal
pain. Roseola diagnosed at 2.5 years and Epstein bar virus contracted at 8 years. Respiratory
problems diagnosed at 11 months and kidney problems diagnosed at 9 months. No diagnosis of
cardiac or metabolic syndromes noted. No report of congenital anomalies. Family history of
Down syndrome (maternal cousin). NICU admission shortly after birth with oxygen treatment.
Meconium aspiration at birth. Family history among several members for migraines. Currently
on GFCF diet. Took asthma medication in the past but not currently.
Family 12752. Proband is an only child.
Patient ID: 12752.fa
Summary: Patient is an adult non-Hispanic white male. Age at conception of proband is 38.
Normative range social responsiveness. Elevated score for aloofness and pragmatic social skills.

W W W. N A T U R E . C O M / N A T U R E | 7
SUPPLEMENTARY INFORMATION RESEARCH
! (!
Diagnosis of diabetes. Current tobacco and alcohol use endorsed. Current and past use of
antihypertensive meds and medication for high cholesterol. Past use of sedatives and pain killers.
Some college education. Annual household income = $36–50K. Father has a head circumference
of 59.5 cm (z = 1.56). BMI information unavailable.
Patient ID: 12752.ma
Summary: Patient is an adult non-Hispanic white female. Age at conception of proband is 36.
Normative range of social responsiveness. No presence of broader autism phenotype. No
endorsement of medications currently or during pregnancy with proband. Current tobacco and
alcohol use endorsed. Some college education. Annual household income = $36–50K. Mother
has head circumference of 54 cm (z = -.41). BMI information unavailable. Mother has been
diagnosed with heart disease.
Patient ID: 12752.p1
Event: de novo CHD8 truncating, de novo ETFB truncating, de novo IQGAP2 truncating
Summary: Patient is a 55-month-old non-Hispanic white female diagnosed with autism.
Normative range VIQ (90) and NVIQ (93) with low adaptive behavior skills (59). Clinical range
deficits in social responsiveness (90). Clinical elevations in attention problems, internalizing
problems, and affective problems with no comorbid diagnoses. Large head (z = 2.40) and BMI
indications of being underweight. No loss or regression of language skills. Diagnosis of chronic
constipation, ongoing from 3.5 months with intermittent episodes of abnormal stool.
Coordination problems noted since 3.5 months. No cardiac or metabolic syndromes noted. No
report of congenital anomalies. Hyperbilirubinema diagnosis with phototherapy shortly after
birth, no complications after treatment.

SUPPLEMENTARY INFORMATION
8 | W W W. N A T U R E . C O M / N A T U R E
RESEARCH
! )!
Patient ID: 11660.p1
Event: de novo NTNG1 missense, inherited CNV
Summary: Patient is a 60-month-old non-Hispanic white female diagnosed with autism. Low
range VIQ (63) and NVIQ (60) with low adaptive skills (65). Clinical range deficits in social
responsiveness (90). No language loss or regression noted. Clinical elevations in withdrawn
behaviors, attention difficulties, and affective problems with no comorbid diagnoses. Large head
(z = 2.5) with BMI indications of being underweight. Improvement in repetitive behaviors during
fever symptoms noted by parents. No cardiac, metabolic, or autoimmune syndromes noted.
Dysmorphology assessment indicating nondysmorphic features. No noted congenital anomalies.
Patient ID: 12532.p1
Event: de novo NTNG1 missense, de novo NAA40 missense
Summary: Patient is a 141-month-old non-Hispanic white male diagnosed with autism. Very
high VIQ (135) and normative range NVIQ (110) with low adaptive behavior composite scores
(71). Clinical range elevations in social responsiveness (74) with word loss regression occurring
early in development. Borderline and clinical range problems with attention, internalizing, and
affective problem behaviors with no comorbid diagnoses. Normal head circumference with BMI
suggesting underweight. Penicillin allergy noted beginning at 5 years of age. Diagnosis of
chronic otitis media at approximately age 6. No cardiac, metabolic, or autoimmune syndromes
noted. No report of congenital anomalies.

W W W. N A T U R E . C O M / N A T U R E | 9
SUPPLEMENTARY INFORMATION RESEARCH
! *!
Patient ID: 13733.p1
Event: de novo CHD7 missense, inherited CNV
Summary: Patient is a 160-month-old non-Hispanic white female diagnosed with autism.
Normative VIQ scores (90) with very low NVIQ scores (68) and adaptive scores (69). No
regression or loss of language. Borderline range anxiety scores and with no comorbid mental
health diagnoses. Normal head circumference and BMI. Vision problems with correction. No
hearing deficits. Diagnosis of Tourette’s Syndrome at six years. Myringotomy procedure for
recurrent problems with otitis media. Diagnosis of respiratory problems but no diagnosis of
cardiac or metabolic syndromes. No report of congenital anomalies.
Patient ID: 11390.p1
Event: de novo PTEN missense
Summary: Patient is a 99-month-old non-Hispanic white female diagnosed with autism. Very
low VIQ (57) and low NVIQ (77) with low average adaptive behavior skill scores (79). Clinical
range elevations in social responsiveness (90). Language regression and word loss noted in early
development as well as occurrence of nonfebrile seizures. Borderline and clinical range problems
with social withdrawal, attention, and affective problematic behaviors with no comorbid
diagnoses. Large head (z = 2.84) with normal range BMI scores. Chronic unusual stools noted
from 6 months of age. Chronic otitis media diagnoses at 2.5 years of age with noted
improvements in repetitive behaviors during periods of fever. No cardiac, metabolic, or
autoimmune syndromes noted. Dysmorphology assessment indicating nondysmorphic features.
No report of congenital anomalies. Sleep difficulties noted for falling asleep with night time
incontinence. Normal menstrual cycle and pubertal changes taking place. Mood stabilizer
medication used in the past but not current. Special education services in school 100% of time

SUPPLEMENTARY INFORMATION
1 0 | W W W. N A T U R E . C O M / N A T U R E
RESEARCH
! "+!
since age 3 and continuing to current. Occupational therapy services 1 hour per week year round
beginning at age 3 continuing to current.
Patient ID: 12346.p1
Event: de novo MBD5 truncating, de novo MYBBP1A missense, de novo PBRM1 missense
Summary: Patient is a 833-month-old non-Hispanic white male diagnosed with autism.
Normative VIQ (106) with low NVIQ (77) and adaptive behavior skills (64). Clinical range
elevations in social responsiveness (90). No language loss or regression noted in early
development. Clinical elevations in withdrawn behaviors and no comorbid diagnoses. Normative
head circumference and BMI. Chronic constipation diagnosed by PCP at 3 years of age.
Coordination problems diagnosed by PCP at 16 months. Suspected cerebral palsy (unsure) noted
at 1 year of age by orthopedist. Grand mal seizure occurrences beginning at 1 month and
occurring approximately once per month in frequency. Chicken pox contraction at four years.
Chronic Otitis Media and intermittent strep throat occurrences. No report of congenital
anomalies.
Patient ID: 13890.p1
Event: de novo DYRK1A truncating
Summary: Patient is a 164-month-old non-Hispanic white female diagnosed with autism. Very
low VIQ (26) and NVIQ (42) and adaptive behavior skills (41). Clinical range elevations in
social responsiveness (82). No language loss or regression noted in development. No clinical
elevations in behavior ratings from parents or teacher and no comorbid diagnoses. Small head (z
= -1.64) and BMI suggestive of being overweight. Vision difficulties with correction. Pollen
allergies. Intermittent constipation (undiagnosed). Chronic otitis media diagnosed by PCP at age

W W W. N A T U R E . C O M / N A T U R E | 1 1
SUPPLEMENTARY INFORMATION RESEARCH
! ""!
5. Surgery on release tendons and ligaments in right foot. Dysmorphology assessment indicates
nonspecific dysmorphic features with microcephaly but no evidence of known syndrome.
Abnormal hair growth, ear structure, nose size, face size, philtrum, mouth, lips, fingers,
fingernails, and feet noted upon exam.
Patient ID: 12933.p1
Event: de novo SETBP1 truncating, de novo MYO7B missense, de novo OR10Z1 missense
Summary: Patient is a 120-month-old non-Hispanic white male diagnosed with autism. Very low
VIQ (44) and NVIQ (41) and low adaptive behavior skills (68). Clinical range elevations in
social responsiveness (85). No language loss or regression noted in development. Borderline and
clinical elevations in anxious/depressed, attention deficit, aggression, internalizing, affective
problems, oppositional problems, and externalizing behavior with no comorbid diagnoses.
Normative head circumference and BMI suggestive of being underweight. Vision difficulties
with correction. Food allergies diagnosed by PCP at 4 months. Intermittent problems with
vomiting diagnosed at 5 years old. Chronic acid reflux diagnosed at 7 years of age. Excessive
clumsiness and coordination problems suspected beginning at age 5. Surgery at 1.1 years for
undescended testicle. Adenoids removed at 7 years. Dysmorphology assessment indicates
nonspecific dysmorphic features without microcephaly. Abnormal ear structure, nose size, face
size, teeth, hands, fingers, thumbs, and fingernails noted upon exam.
Patient ID: 11834.p1
Event: inherited 16p12 duplication
Summary: Patient is a 126-month-old non-Hispanic white male diagnosed with autism. Very low
VIQ (43) and normative NVIQ (93) with very low adaptive behavior skills (57). Elevations in

SUPPLEMENTARY INFORMATION
1 2 | W W W. N A T U R E . C O M / N A T U R E
RESEARCH
! "#!
social responsiveness (75) with no word loss or regression in early development. Borderline
elevations in anxiety problems with no comorbid diagnoses. Large head (z = 2.29) and normative
BMI scores. Diagnosed with Tourette/tics at age 7. Diagnosed with roseola at age 1. No report of
congenital anomalies.

W W W. N A T U R E . C O M / N A T U R E | 1 3
SUPPLEMENTARY INFORMATION RESEARCH
! "$!
NVIQ Samples w/ "top candidate mut"
NVIQ
Frequency
20 40 60 80 100 120 140
05
1015
2025
NVIQ Samples w/ "extreme mut"
NVIQ
Frequency
20 40 60 80 100 120 140
05
1015
2025
NVIQ SSC189
NVIQ
Frequency
20 40 60 80 100 120 140
05
1015
2025
NVIQ Samples w/ any non-syn
NVIQ
Frequency
20 40 60 80 100 120 140
05
1015
2025
NVIQ Samples w/ severe non-syn
NVIQ
Frequency
20 40 60 80 100 120 140
05
1015
2025
NVIQ Samples w/ truncating
NVIQ
Frequency
20 40 60 80 100 120 140
05
1015
2025
NVIQ Samples w/ "top candidate mut"
NVIQ
Frequency
20 40 60 80 100 120 140
05
1015
2025
NVIQ Samples w/ "extreme mut"
NVIQ
Frequency
20 40 60 80 100 120 140
05
1015
2025
!"#$%!&'(!)*%!!"+,#-$!!!!"+-$!./,!)*%!!!!"-0%!!!!1.%22!!!34%22!!!4.%22!!!56%31!!!65%22!!&.4%22!!
NVIQ SSC189
NVIQ
Frequency
20 40 60 80 100 120 140
05
1015
2025
NVIQ Samples w/ any non-syn
NVIQFrequency
20 40 60 80 100 120 140
05
1015
2025
NVIQ Samples w/ severe non-syn
NVIQ
Frequency
20 40 60 80 100 120 140
05
1015
2025
NVIQ Samples w/ truncating
NVIQ
Frequency
20 40 60 80 100 120 140
05
1015
2025
!"#$%!&'(!)*%!!"+,#-$!!!!"+-$!./,!)*%!!!!"-0%!!!!1.%22!!!3&%22!!!56%22!!!57%18!!!68%53!!&.4%22!
!"#$%!&'(!)*%!!"+,#-$!!!!"+-$!./,!)*%!!!!"-0%!!!!1.%22!!!33%13!!!55%32!!!57%.6!!!61%53!!&.4%22!!
!"#$%!&'(!)*%!!"+,#-$!!!!"+-$!./,!)*%!!!!"-0%!!!!1.%22!!!86%22!!!55%32!!!58%88!!!68%22!!&.4%22!!
!"#$%!&'(!)*%!!"+,#-$!!!!"+-$!./,!)*%!!!!"-0%!!!!1.%22!!!86%32!!!53%32!!!52%35!!!43%13!!&.4%22!!
!"#$%!&'(!)*%!!"+,#-$!!!!"+-$!./,!)*%!!!!"-0%!!!!1.%22!!!3&%22!!!58%22!!!52%67!!!47%22!!&.4%22!! !
Supplementary Figure 1. Distribution of nonverbal intelligence quotient (NVIQ) of the
SSC189 sample based on different mutation groupings.
Histograms in each panel show the distribution of samples based on those having one or more
event fitting each mutational category. Initial distribution was approximately bimodal. Summary
statistics for each distribution are listed below. Red line indicates NVIQ of 70, the general
threshold of intellectual disability.
SUPPLEMENTARY INFORMATION
1 4 | W W W. N A T U R E . C O M / N A T U R E
RESEARCH
! "%!
!"
#"
!
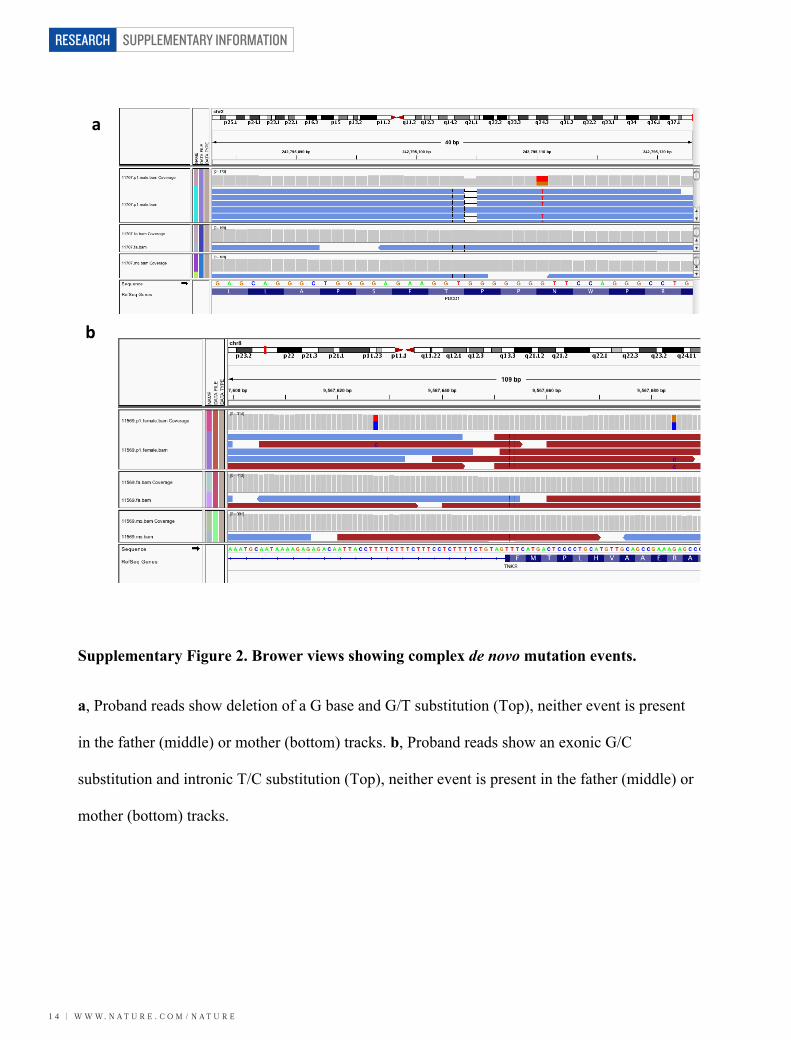
Supplementary Figure 2. Brower views showing complex de novo mutation events.
a, Proband reads show deletion of a G base and G/T substitution (Top), neither event is present
in the father (middle) or mother (bottom) tracks. b, Proband reads show an exonic G/C
substitution and intronic T/C substitution (Top), neither event is present in the father (middle) or
mother (bottom) tracks.

W W W. N A T U R E . C O M / N A T U R E | 1 5
SUPPLEMENTARY INFORMATION RESEARCH
! "&!
!" #" Fa-For Fa-Rev Mo-For Mo-Rev P1-For P1-Rev
Supplementary Figure 3. Confirmed event showing weak allele signature.
a, Proband reads show G/A substitution at 24% frequency (Top), event is present in the father
(middle) or mother (bottom) tracks. b, Sanger traces in both forward (For) and reverse (Rev)
confirm event and show reduced signal suggesting somatic mosaicism.

SUPPLEMENTARY INFORMATION
1 6 | W W W. N A T U R E . C O M / N A T U R E
RESEARCH
! "'!
!"
#!"
$!"
%!"
&!"
'!"
(!"
)!"
*!"
!" #" $" %" &" '"
+,-
./0"1
2"301.4
567"
+,-./0"12"8,94:15";</597"
==>#*?"301.467"
31@7715"
Supplementary Figure 4. Observed number of mutation events fits the expected Poisson
distribution.
We calculated the expected counts of mutations per person from the Poisson distribution based
on the observed trio mutation rate of 1.28. The observed number of counts per probands matches
closely to this distribution.

W W W. N A T U R E . C O M / N A T U R E | 1 7
SUPPLEMENTARY INFORMATION RESEARCH
! "(!
Supplementary Figure 5. Multivariate analysis to examine effect of number of “extreme”
de novo coding mutations and the presence of a CNV.
Extreme mutations (n = 62) were defined as de novo protein-truncating intersections with known
OMIM and ASD candidate genes and CNVs predicted to be gene breaking and pathogenic.
Boxplots show the samples with and without a CNV, either de novo or rare inherited
(Supplementary Discussion). We observed a significant decrease in NVIQ with increased
numbers of events (F(2,116) = 5.45, p<.01, partial !2 = 0.09), but not in VIQ (F(2,116) = 1.13, p
= ns, partial !2 = 0.02). This result in NVIQ was strengthened, but not exclusively driven, by the
presence of CNVs (F(2,116) = 0.97, p = ns, partial !2 = 0.02); there was no main effect of
strictly having a CNV on cognitive ability (F(2,116) = 0.71, p = ns, partial !2 = 0.006).

SUPPLEMENTARY INFORMATION
1 8 | W W W. N A T U R E . C O M / N A T U R E
RESEARCH
! ")!
!"#$%$&%'"()*+,%
!"
!#$"
!#%"
!#&"
!#'"
("
)*+"," -."," ./0/1/"," 234","
567!"879:"
;7!"8((&:"
<"
="
!"
!#$"
!#%"
!#&"
!#'"
("
)*+"," -."," ./0/1/"," 234","
56%!"8(&:"
%(>??"8$':"
?&>7!"8$@:"
7(>'?"8$7:"
'&>(!!"8%7:"
(!(>((?"8$&:"
;6((&"8(&:"
!Supplementary Figure 6. Ratio of samples with various mutation types binned by NVIQ.
The proportion of individuals within various NVIQ bins with 1+ event across “disruptive”
classification schemes: any event, any nonsynonymous event, any severe nonsynonymous event,
and our “top candidate” list (Table 1). a Grouped by IQ standard deviations. We observed a
nonsignificant trend by Fisher’s exact test (lower IQ higher probability of 1+ de novo event)
for any event (p = 0.096), any nonsynonymous event (p = 0.064), and any severe
nonsynonymous event (p = 0.052), but conflicting results for top candidates (p = 0.19). b
Grouped by high (>70) and low (<=70) to increase power. Strongest p-value 0.032, severe
nonsynonymous, again suggesting a nonsignificant trend. Error bars are 95% confidence
intervals.

W W W. N A T U R E . C O M / N A T U R E | 1 9
SUPPLEMENTARY INFORMATION RESEARCH
! "*!
Supplementary Figure 7. Distribution of locus specific mutation rates bases on human-
chimp comparisons.
Red triangles represent CHD8: 3.95E-09, NTNG1: 2.34E-09, LAMC3: 1.73E-08, SCN1A: 8.83E-
09, GRIN2B: 6.94E-09, FOXP2: 7.01E-09, FOXP1: 5.51E-09, and GRIN2A: 9.38E-09.

SUPPLEMENTARY INFORMATION
2 0 | W W W. N A T U R E . C O M / N A T U R E
RESEARCH
! #+!
chr21 37650000 37700000 37750000 37800000 37850000 37900000
21q22.13DYRK1A
Cases
Controls
Supplementary Figure 8. DYRK1A falls in a Down Syndrome critical region disrupted by
CNVs.
Each red (deletion) and green (duplication) line represents an identified CNV in cases (solid
lines) versus controls (dashed lines), with arrowheads showing point mutations.

W W W. N A T U R E . C O M / N A T U R E | 2 1
SUPPLEMENTARY INFORMATION RESEARCH
! #"!
Supplementary Figure 9. Histograms of Network statistics for 10,000 simulated null
networks.
Left: Number of edges in the network. Right: Clustering coefficient of the network. Red dotted
line indicates the corresponding value in the experimentally determined network.
0 50 100 150 200 2500
0.5
1
1.5
2
2.5
3
3.5
4Pe
rcen
t of N
ull N
etw
orks
Number of Edges0 0.05 0.1 0.15 0.2 0.25
0
0.5
1
1.5
2
2.5
3
3.5
4
Clustering Coefficient

SUPPLEMENTARY INFORMATION
2 2 | W W W. N A T U R E . C O M / N A T U R E
RESEARCH
! ##!
0 2000 4000 6000 8000 10000 12000
Ranking of Gene Products!
Proband Unconnected! Proband Connected! Sibling Events! !Supplementary Figure 10. Protein-protein interaction network based prioritization of 126
gene products with severe mutations.
X-axis represents the ranking of gene products from GeneMANIA PPI database using ASD
associated gene products from Betancaur et al. as a seed. The red lines represents the gene
products (49) that are in the largest connected component of the PPI network generated using the
proband severe disruptive de novo events, gray lines represents the gene products not in the
connected component, and the blue lines represent the gene products with severe de novo
mutations in the unaffected siblings. The gene products of the connected component ranks
significantly higher compared to all other gene products (Mann-Whitney U one-sided, p < 1.6E-
08) whereas the unconnected gene products do not (Mann-Whitney U, one-sided p < 0.28).
Similarly, the siblings events compared to all other gene products do not show significant
rankings (Mann-Whitney U, one-sided p < 0.26).

W W W. N A T U R E . C O M / N A T U R E | 2 3
SUPPLEMENTARY INFORMATION RESEARCH
! #$!
Supplementary Figure 11. Top interaction network from IPA analysis of 126 genes with
severe mutations.
Displayed is the highest scoring network from IPA analysis. Solid lines represent direct
interactions while dashed lines indicated indirect connections. Genes not found in the PPI
connected component are marked in yellow, while those in the PPI connected component are
marked in blue.

SUPPLEMENTARY INFORMATION
2 4 | W W W. N A T U R E . C O M / N A T U R E
RESEARCH
! #%!
./0!1
!"#$%
2.)%
2.)1
)."2
.)37%
&3#-(
+'9(5(
2!34
)&)'
)&++(%
*+'%,-
)0),1
$&'.
)!08
564.#1
$&'(
3 x
! "#$%&'()%*!+,-./!CHD8! "#$%&'()%*!0,1!IQGAP2! "#$%&'()%*!0,1!ETFB
12752.p1
3 de novo Gene Disruptions
b
!
Supplementary Figure 12. De novo mutations in 12752.p1.
GeneMANIA4 view of three de novo truncating mutations (red labels) which encode proteins
that are part of a beta-catenin linked network. The proband is macrocephalic (z = 2.4) with
normal cognitive ability (VIQ = 90, NVIQ = 93) but has adaptive behavior deficits (Vineland
Standard Score = 59) with significant social impairments. (Supplementary Discussion).

W W W. N A T U R E . C O M / N A T U R E | 2 5
SUPPLEMENTARY INFORMATION RESEARCH
! #&!
!
Supplementary Figure 13. Estimating the number of genes contributing to sporadic autism
pathogenicity via recurrent de novo mutation.
Left: Estimate based on 120 de novo mutations especially likely to be pathogenic (including both
observed doubletons) based on GERP and Grantham score. Right: Estimate based on all de novo
nonsynonymous events. Two different estimators for the “unseen species problem” were used.
01000
2000
3000
4000
5000
Number of genes implicated in autism 120 de novo SNPs; 2 doublets observed
Fraction of de novo SNPs considered pathogenic
Est
imat
ed n
umbe
r of a
utis
m g
enes
0 0.1 0.2 0.3 0.4 0.5 0.6 0.7 0.8 0.9 1
01000
2000
3000
4000
5000
Number of genes implicated in autism 181 de novo SNPs; 2 doublets observed
Fraction of de novo SNPs considered pathogenic
Est
imat
ed n
umbe
r of a
utis
m g
enes
0 0.1 0.2 0.3 0.4 0.5 0.6 0.7 0.8 0.9 1
992 genes
182 genes
Sanders (2010) Chao and Lee (1992)
Estimator Used

SUPPLEMENTARY INFORMATION
2 6 | W W W. N A T U R E . C O M / N A T U R E
RESEARCH
! #'!
Supplementary Table 1. Summary of sequenced families, including sex, parental age,
NVIQ, CNV pre-screening, trio bases screened, and point mutations.
See attached Excel document

W W W. N A T U R E . C O M / N A T U R E | 2 7
SUPPLEMENTARY INFORMATION RESEARCH
! #(!
Supplementary Table 2. Summary of Exome Sequencing Results from 209 ASD Families
SNV Type Total Average Silent Missense Nonsense or Read-Through
Splice Ti/Tv
% CpG
Ti SSC189
Pro all 3,513,050 18,588 1,859,735 1,631,320 16,449 5,546 3.27 20.9
rare 32,028 169 10,682 20,515 581 250 2.87 31.1
DN 225 1.19 61 145 16 3 2.69 36.0 SSC189
Sib (31)& DN 29 0.94 9 19 1 0 3.14 41.4
Pilot Pro (20) DN 17 0.85 7 9 0 1 7.50 41.1
Pilot Sib (19) DN 21 1.11 7 12 2 0 1.63 38.1
Indels Type Total Average 3n Indels Truncating Indels Splice
SSC189 Pro all 42,929 227 18,817 23,270 842
rare 806 4.26 222 561 23
DN 17 0.09 2 15 0 SSC189 Sib (31) DN 0 0 0 0 0
Pilot Pro (20) DN 1 0.05 0 1 0
Pilot Sib (19) DN 0 0 0 0 0
Estimated Mutation
Rates
All Events
Screened Bases* All Rate Sub Rate !
SSC189 Pro 242 11,144,644,963 2.17
(1.90-2.46) 1.94
(1.68-2.21) SSC189 Sib (31) 29 1,838,730,129 1.57
(1.05-2.26) 1.52
(1.01-2.20)
Pilot Pro (20) 18 937,498,416 1.92
(1.14-3.04) 1.81
(1.05-2.90) Pilot Sib
(19) 21 891,825,463 2.35 (1.45-3.59)
2.24 (1.36-3.46)
&Number of children. *Count of all bases screened in child (minimum 8X), i.e. concordant in each member of the trio. !Mutations/base/generation x10^-8 with 95% Confidence intervals. ! Substitutions only, excludes indels and possible somatic mosaics. Pro = proband, Sib = unaffected sibling, DN = de novo, SSC = Simons Simplex Collection

SUPPLEMENTARY INFORMATION
2 8 | W W W. N A T U R E . C O M / N A T U R E
RESEARCH
! #)!
Supplementary Table 3. All 242 de novo point mutations found in 189 trios.
See attached Excel document

W W W. N A T U R E . C O M / N A T U R E | 2 9
SUPPLEMENTARY INFORMATION RESEARCH
! #*!
Supplementary Table 4. Comparison of mutation rates between O’Roak et al. and Sanders
et al.
Site/Type # of Trios
Bases Screened
Total De novo Substitutions Indels Mosaic
events
Combined Rate and 95% CI (x10-8)
Strict Substitution Rate and
95% CI (x10-8)
UW-189 Probands 189 11,144,644,963 242 216 17 9 2.17
(1.90-2.46) 1.94
(1.68-2.21) UW-31
Matched Probands
31 1,830,218,983 42 39 1 2 2.29 (1.65-3.10)
2.13 (1.51-2.91)
UW-31 Matched Siblings
31 1,838,730,129 29 28 0 1 1.57 (1.05-2.26)
1.52 (1.01-2.20)
UW-Pilot Probands 20 937,498,416 18 17 1 0 1.92
(1.14-3.04) 1.81
(1.05-2.90) UW-Pilot Matched Probands
19 890,665,738 18 17 1 0 2.02 (1.20-3.19)
1.91 (1.11-3.05)
UW-Pilot Matched
Sibs 19 891,825,463 21 20 0 1 2.35
(1.45-3.59) 2.24
(1.36-3.46)
UW-All Probands 209 12,082,143,379 260 233 18 9 2.15
(1.90-2.43) 1.93
(1.69-2.19)
Yale-
Quartet Probands
200 9,718,659,190 156 153 3 0 1.61 (1.34-1.87)
1.57 (1.31-1.84)
Yale-Quartet Siblings
200 9,718,659,190 124 124 0 0 1.28 (1.05-1.50)
1.28 (1.05-1.50)
Yale-Trio Probands 24 1,082,156,674 15 15 0 0 1.39
(0.67-2.10) 1.39
(0.67-2.10) Yale-All
Probands 225 10,800,815,864 171 168 3 0 1.58 (1.33-1.83)
1.56 (1.31-1.80)
UW: Variant calling threshold was a minimum of 8x in each member of a trio. Bases screened were calculated based on trio concordant positions at 8x (n) and converting to diploid bases (2n), adjusting for sex chromosomes. Probands and siblings were calculated separately as trio units. Observed mutation rate was calculated by dividing the total number of events by total number of bases. The exact 95% Poisson confidence intervals were generated from the observed counts and then dividend by the total number of bases to get the rate confidence intervals.
Yale: The variant calling threshold was a minimum of 20x unique reads in each member of the quartet and a minimum of 8x unique non-reference reads in the child. Bases screened were estimated by assessing the number of nucleotides in each family with a minimum of 20x unique reads in each member of the quartet and converting to diploid bases (2n). Observed mutation rates were calculated by dividing the total events per sample by the number of nucleotides analyzed per sample and averaging across individuals. The 95% confidence intervals were calculated from the variance of this measure.

SUPPLEMENTARY INFORMATION
3 0 | W W W. N A T U R E . C O M / N A T U R E
RESEARCH
! $+!
Supplementary Table 5. De novo events identified in 50 unaffected siblings and 20 pilot
probands.
See attached Excel document

W W W. N A T U R E . C O M / N A T U R E | 3 1
SUPPLEMENTARY INFORMATION RESEARCH
! $"!
Supplementary Table 6. 70 rare inherited and 6 de novo CNVs identified in 122 trios.
Chr (hg18) Start End Family ID CNV Type Inheritance Genes
chr20 6706891 8271234 11013.p1 Gain Inherited Mother BMP2 (Gene Broken), HAO1, TMX4, PLCB1 (Gene Broken)
chr2 197997071 198254315 11023.p1 Gain Inherited Mother SF3B1 (Gene Broken), COQ10B, HSPD1, HSPE1, MOBKL3, RFTN2
chr2 208742960 208763173 11023.p1 Loss Inherited Mother C2orf80 (Gene Broken)
chr2 33593707 36437270 11064.p1 Gain Inherited Mother RASGRP3 (Gene Broken), FAM98A, MYADML, CRIM1 (Gene Broken)
chr13 49022622 49083205 11083.p1 Gain Inherited Father RCBTB1 (Gene Broken)
chr4 47538 117452 11093.p1 Gain Inherited Mother ZNF595 (Gene Broken), ZNF718 (Gene Larger Than CNV)
chr8 13295432 15139503 11141.p1 Gain Inherited Mother DLC1 (Gene Broken), C8orf48, SGCZ (Gene Broken), MIR383
chr19 48612452 48651954 11141.p1 Loss Inherited Mother TEX101 (Gene Broken)
chr16 79736150 79748195 11184.p1 Loss Inherited Father PKD1L2 (Gene Larger Than CNV)
chr4 108066404 109130669 11190.p1 Gain Inherited Father DKK2 (Gene Broken), PAPSS1, SGMS2, CYP2U1, HADH (Gene Broken)
chr4 5781934 5823956 11224.p1 Gain Inherited Father EVC (Gene Larger Than CNV)
chr7 33097353 33153804 11346.p1 Gain Inherited Mother RP9, BBS9 (Gene Broken)
chr5 157006525 157051157 11375.p1 Loss Inherited Father SOX30 (Gene Broken), C5orf52
chr7 11117201 12440046 11398.p1 Gain Inherited Father PHF14 (Gene Broken), THSD7A, TMEM106B, VWDE

SUPPLEMENTARY INFORMATION
3 2 | W W W. N A T U R E . C O M / N A T U R E
RESEARCH
! $#!
Chr (hg18) Start End Family ID CNV Type Inheritance Genes
chr12 43879949 43967314 11452.p1 Loss Inherited Mother PLEKHA9 (Gene Broken), ANO6 (Gene Broken)
chr6 88374109 88424279 11459.p1 Loss Inherited Father ORC3L (Gene Larger Than CNV)
chr1 173697478 174026214 11469.p1 Gain Inherited Father TNR (Gene Broken)
chr5 112931249 113726857 11469.p1 Gain Inherited Father YTHDC2 (Gene Broken), KCNN2 (Gene Broken)
chr6 26077937 26393662 11480.p1 Gain Inherited Father TRIM38 (Gene Broken), HIST1H1A, HIST1H3A, HIST1H4A, HIST1H4B, HIST1H3B, HIST1H2AB, HIST1H2BB, HIST1H3C, HIST1H1C, HFE, HIST1H4C, HIST1H1T, HIST1H2BC, HIST1H2AC, HIST1H1E, HIST1H2BD, HIST1H2BE, HIST1H4D, HIST1H3D, HIST1H2AD, HIST1H2BF, HIST1H4E, HIST1H2BG, HIST1H2AE, HIST1H3E, HIST1H1D, HIST1H4F, HIST1H4G, HIST1H3F, HIST1H2BH, HIST1H3G, HIST1H2BI, HIST1H4H (Gene Broken)
chr8 15992606 16066256 11556.p1 Loss Inherited Father MSR1 (Gene Broken)
chr3 147531173 147649939 11653.p1 Gain Inherited Father PLSCR2 (Gene Broken)
chr2 110167952 110510396 11660.p1 Loss Inherited Mother MIR4267, MALL, NPHP1, NCRNA00116
chr7 16805611 17800441 11696.p1 Gain Inherited Father AGR2 (Gene Broken), AGR3, AHR, SNX13 (Gene Broken)

W W W. N A T U R E . C O M / N A T U R E | 3 3
SUPPLEMENTARY INFORMATION RESEARCH
! $$!
Chr (hg18) Start End Family ID CNV Type Inheritance Genes
chr3 37265222 37416340 11696.p1 Loss de novo NA GOLGA4, C3orf35 (Gene Broken)
chr1 205383785 205599637 11707.p1 Gain Inherited Father C4BPA (Gene Broken), CD55 (Gene Broken)
chr9 28181261 28338013 11707.p1 Loss Inherited Mother LINGO2 (Gene Larger Than CNV)
chr17 3946651 4368839 11707.p1 Gain Inherited Father ZZEF1 (Gene Broken), CYB5D2, ANKFY1, UBE2G1, SPNS3, SPNS2 (Gene Broken)
chr2 160248507 160313660 11711.p1 Gain Inherited Mother MARCH7 (Gene Broken)
chr10 67942427 68177427 11711.p1 Loss Inherited Father CTNNA3 (Gene Larger Than CNV)
chr4 135140571 135406410 11715.p1 Loss Inherited Mother PABPC4L chr7 48259354 48398102 11722.p1 Loss Inherited Mother ABCA13
(Gene Larger Than CNV)
chr8 30067949 30170383 11722.p1 Gain Inherited Father LEPROTL1, MBOAT4, DCTN6
chr19 62680865 62710992 11753.p1 Gain Inherited Father ZNF419, ZNF773 (Gene Broken)
chr16 21675903 22357384 11834.p1 Gain Inherited Father OTOA (Gene Broken), RRN3P1, LOC100190986, UQCRC2, PDZD9, C16orf52, VWA3A, EEF2K, POLR3E, CDR2, RRN3P3, LOC641298 (Gene Broken)
chr7 153588034 154254473 11843.p1 Loss Inherited Mother DPP6 (Gene Larger Than CNV)
chr12 7882951 8015652 11843.p1 Loss Inherited Father SLC2A14 (Gene Broken), SLC2A3
chr2 86145907 86418710 11895.p1 Gain Inherited Father POLR1A (Gene Broken), PTCD3, SNORD94, IMMT, MRPL35, REEP1 (Gene Broken)
chr15 28712984 30303265 11928.p1 Gain de novo NA ARHGAP11B (Gene Broken), FAN1,

SUPPLEMENTARY INFORMATION
3 4 | W W W. N A T U R E . C O M / N A T U R E
RESEARCH
! $%!
Chr (hg18) Start End Family ID CNV Type Inheritance Genes
MTMR10, TRPM1, MIR211, KLF13, LOC283711, OTUD7A, CHRNA7
chr6 162692702 162951722 11947.p1 Gain Inherited Father PARK2 (Gene Larger Than CNV)
chr22 39048803 39223310 11947.p1 Gain Inherited Father TNRC6B (Gene Broken), ADSL, SGSM3, MKL1 (Gene Broken)
chr11 14831730 14864039 11964.p1 Gain Inherited Father PDE3B (Gene Broken), CYP2R1 (Gene Broken)
chr16 82990535 83030397 11964.p1 Loss Inherited Mother ATP2C2 (Gene Larger Than CNV)
chr10 133426828 134361413 12118.p1 Gain Inherited Father PPP2R2D, BNIP3, JAKMIP3, DPYSL4, STK32C, LRRC27, PWWP2B, C10orf91, INPP5A (Gene Broken)
chr5 112941833 112974949 12130.p1 Gain Inherited Mother YTHDC2 (Gene Broken)
chr8 15992606 16066256 12130.p1 Loss Inherited Mother MSR1 (Gene Broken)
chr6 107599923 107887182 12212.p1 Loss Inherited Father PDSS2 (Gene Larger Than CNV)
chr11 31133684 31384778 12430.p1 Loss Inherited Mother DCDC1, DNAJC24 (Gene Broken)
chr12 110659017 110799706 12581.p1 Gain Inherited Mother ACAD10 (Gene Broken), ALDH2, C12orf47, MAPKAPK5 (Gene Broken)
chr9 139800210 140131086 12581.p1 Loss de novo NA EHMT1 (Gene Broken), MIR602, CACNA1B
chr1 183364423 183402407 12667.p1 Gain Inherited Mother C1orf25 (Gene Broken), C1orf26 (Gene Broken)
chr18 37874638 37962267 12667.p1 Gain Inherited Mother PIK3C3 (Gene Broken)
chr11 50035201 50669978 12810.p1 Gain Inherited Father LOC441601, LOC646813
chr22 30835976 31086819 12810.p1 Gain Inherited Father SLC5A1 (Gene

W W W. N A T U R E . C O M / N A T U R E | 3 5
SUPPLEMENTARY INFORMATION RESEARCH
! $&!
Chr (hg18) Start End Family ID CNV Type Inheritance Genes
Broken), C22orf42, RFPL2, SLC5A4, RFPL3 (Gene Broken), RFPL3S (Gene Broken)
chr3 28443079 28490738 13008.p1 Loss Inherited Father ZCWPW2 (Gene Larger Than CNV)
chr12 180014 645460 13008.p1 Gain Inherited Mother SLC6A12 (Gene Broken), SLC6A13, KDM5A, CCDC77, B4GALNT3, NINJ2
chr3 143305311 143566711 13335.p1 Gain Inherited Father TFDP2 (Gene Broken), GK5, XRN1 (Gene Broken)
chr17 613719 644926 13335.p1 Loss Inherited Father GLOD4 (Gene Broken), RNMTL1
chr16 29502984 30107398 13335.p1 Gain de novo NA SLC7A5P1, SPN, QPRT, C16orf54, MAZ, PRRT2, C16orf53, MVP, CDIPT, LOC440356, SEZ6L2, ASPHD1, KCTD13, TMEM219, TAOK2, HIRIP3, INO80E, DOC2A, C16orf92, FAM57B, ALDOA, PPP4C, TBX6, YPEL3, GDPD3, MAPK3, LOC100271831, CORO1A (Gene Broken)
chr17 69851956 70220158 13409.p1 Gain Inherited Father KIF19 (Gene Broken), BTBD17, GPR142, GPRC5C, CD300A, CD300LB, CD300C, CD300LD, C17orf77, CD300E, RAB37 (Gene

SUPPLEMENTARY INFORMATION
3 6 | W W W. N A T U R E . C O M / N A T U R E
RESEARCH
! $'!
Chr (hg18) Start End Family ID CNV Type Inheritance Genes
Broken), CD300LF (Gene Broken)
chr6 57019780 57062509 13415.p1 Loss Inherited Father KIAA1586 (Gene Broken)
chr15 55430140 55596476 13415.p1 Gain Inherited Mother CGNL1 (Gene Broken)
chr10 67981151 68085796 13494.p1 Loss Inherited Mother CTNNA3 (Gene Larger Than CNV)
chr18 75004789 75209184 13494.p1 Loss Inherited Father ATP9B (Gene Larger Than CNV)
chr14 67088466 67343145 13530.p1 Gain Inherited Father PLEKHH1 (Gene Broken), PIGH, ARG2, VTI1B, RDH11, RDH12, ZFYVE26 (Gene Broken)
chr4 91076267 91171447 13533.p1 Loss Inherited Father MMRN1 (Gene Broken)
chr14 73586157 73611473 13533.p1 Loss Inherited Father C14orf45 (Gene Broken), ALDH6A1 (Gene Broken)
chr10 67724488 67879503 13557.p1 Loss Inherited Mother CTNNA3 (Gene Larger Than CNV)
chr11 56599848 59990367 13726.p1 Loss de novo NA LRRC55, APLNR, TNKS1BP1, SSRP1, P2RX3, PRG3, PRG2, SLC43A3, RTN4RL2, SLC43A1, TIMM10, SMTNL1, UBE2L6, SERPING1, MIR130A, YPEL4, CLP1, ZDHHC5, MED19, TMX2, C11orf31, BTBD18, CTNND1, OR9Q1, OR6Q1, OR9I1, OR9Q2, OR1S2, OR1S1, OR10Q1, OR10W1, OR5B17, OR5B3, OR5B2,

W W W. N A T U R E . C O M / N A T U R E | 3 7
SUPPLEMENTARY INFORMATION RESEARCH
! $(!
Chr (hg18) Start End Family ID CNV Type Inheritance Genes
OR5B12, OR5B21, LPXN, ZFP91, ZFP91-CNTF, CNTF, GLYAT, GLYATL2, LOC283194, GLYATL1, FAM111B, FAM111A, DTX4, MPEG1, OR5AN1, OR5A2, OR5A1, OR4D6, OR4D10, OR4D11, OR4D9, OSBP, MIR3162, PATL1, OR10V1, STX3, MRPL16, GIF, TCN1, PLAC1L, MS4A3, MS4A2, MS4A6A, MS4A4A, MS4A6E, MS4A7, MS4A14, MS4A5, MS4A1 (Gene Broken)
chr17 10287416 10297580 13733.p1 Loss Inherited Mother MYH4 (Gene Larger Than CNV)
chr8 102800655 103493638 13741.p1 Gain Inherited Father NCALD (Gene Broken), RRM2B, UBR5 (Gene Broken)
chr12 19361460 19461747 13793.p1 Gain Inherited Mother PLEKHA5 (Gene Broken)
chr15 55423402 55596476 13812.p1 Gain Inherited Father CGNL1 (Gene Broken)
chr19 62524033 62624661 13815.p1 Loss Inherited Mother ZNF543 (Gene Broken), ZNF304, TRAPPC2P1, ZNF547, ZNF548, ZNF17 (Gene Broken)
chr16 74808505 75067064 13815.p1 Loss de novo NA TERF2IP (Gene Broken), CNTNAP4 (Gene Broken)

SUPPLEMENTARY INFORMATION
3 8 | W W W. N A T U R E . C O M / N A T U R E
RESEARCH
! $)!
Chr (hg18) Start End Family ID CNV Type Inheritance Genes
chr10 3113861 3204971 13844.p1 Loss Inherited Mother PFKP (Gene Broken), PITRM1 (Gene Broken)
chr21 34648298 34909180 13844.p1 Gain Inherited Mother KCNE2, FAM165B, KCNE1, RCAN1 (Gene Broken)

W W W. N A T U R E . C O M / N A T U R E | 3 9
SUPPLEMENTARY INFORMATION RESEARCH
! $*!
Supplementary Table 7. Expanded top de novo ASD risk contributing mutations*
Proband NVIQ Candidate Gene AA change GERP Gran-
tham Location
(hg19) Chrom Position Ref Alt
12225.p1 89 ABCA2 p.VAL1845MET 3.4 21 9q34 9 139906388 C T
11653.p1 44 ADCY5 p.ARG603CYS 3.74 180 3q13.2-q21 3 123046605 G A
12130.p1 55 ADNP frameshift indel
20q13.13 20 49510027 * -TT
11224.p1 112 AP3B2 p.ARG435HIS 4.81 29 15q 15 83346497 C T
13447.p1 51 ARID1B frameshift indel
6q25.3 6 157527664 * -TGTT
13415.p1 48 BRSK2 3n indel
11p15.5 11 1466811 * -AGA
14292.p1 49 BRWD1 frameshift indel
21q22.2 21 40568453 * -T
11872.p1 65 CACNA1D p.ALA769GLY 4.91 60 3p14.3 3 53764493 C G
11773.p1 50 CACNA1E p.GLY1209SER 4.96 56 1q25-q31 1 181708295 G A
13606.p1 60 CDC42BPB p.ARG764TERM 3.19
14q32.32 14 103434646 G A
12086.p1 108 CDH5 p.ARG545TRP 4.9 101 16q22.1 16 66434715 C T
12630.p1 115 CHD3 p.ARG1818TRP 2.97 101 17p13 17 7812028 C T
13733.p1 68 CHD7 p.GLY996SER 5.48 56 8q12.2 8 61735090 G A
13844.p1 34 CHD8 p.GLN959TERM 4.98
14q11.2 14 21871178 G A
12752.p1 93 CHD8 frameshift indel
14q11.2 14 21861376 * -CT
13415.p1 48 CNOT4 p.ASP48ASN 5.52 23 7q22-qter 7 135122938 C T
12703.p1 58 CTNNB1 p.THR551MET 5.43 81 3p21 3 41275757 C T
11452.p1 80 CUL3 p.GLU246TERM 5.51
2q36.2 2 225376218 C A
11571.p1 94 CUL5 p.VAL355ILE NA 29 11q22.3 11 107944174 G A
13890.p1 42 DYRK1A splice site 5.63
21q22.13 21 38865466 G A
12741.p1 87 EHD2 p.ARG167CYS 2.55 180 19q13.3 19 48221860 C T
11629.p1 67 FBXO10 p.GLU54LYS 4.25 56 9p13.1 9 37541606 C T
13629.p1 63 GPS1 p.ARG492GLN 3.66 43 17q25.3 17 80014816 G A
13757.p1 91 GRINL1A 3n indel
15q22.1 15 58001002 * -AGA
11184.p1 94 HDGFRP2 p.GLU83LYS 4.77 56 19p13.3 19 4475539 G A
11610.p1 138 HDLBP p.ALA639SER 5.81 99 2q37.3 2 242186202 C A
11872.p1 65 KATNAL2 splice site 5.48
18q21.1 18 44603833 G C

SUPPLEMENTARY INFORMATION
4 0 | W W W. N A T U R E . C O M / N A T U R E
RESEARCH
! %+!
12346.p1 77 MBD5 frameshift indel
2q23.2 2 149225965 * -TC
11947.p1 33 MDM2 p.GLU433LYS/
p.TRP160TERM 3.59 56 12q13-q14 12 69233432 G A
11148.p1 82 MLL3 p.TYR4691TERM -6.76
7q36 7 151842339 G T
12157.p1 91 NLGN1 p.HIS795TYR 5.55 83 3q26.32 3 173999004 C T
11193.p1 138 NOTCH3 p.GLY1134ARG 3.63 125 19p13.2-p13.1 19 15290235 C G
11172.p1 60 NR4A2 p.TYR275HIS 4.53 83 2q22-q23 2 157185876 A G
11660.p1 60 NTNG1 p.THR135ILE 5.36 89 1p13.2-p13.1 1 107867061 C T
12532.p1 110 NTNG1 p.TYR23CYS 3.97 194 1p13.2-p13.1 1 107691283 A G
11093.p1 91 OPRL1 p.ARG157CYS 3.42 180 20q13.33 20 62729390 C T
13793.p1 56 PCDHB4 p.ASP555HIS 3.76 81 5q31 5 140503243 G C
11707.p1 23 PDCD1 frameshift indel
2q37.3 2 242795103 * -G & K
12304.p1 83 PSEN1 p.THR421ILE 5.61 89 14q24.3 14 73685855 C T
11390.p1 77 PTEN p.THR167ASN 5.39 65 10q23 10 89711882 C A
13629.p1 63 PTPRK p.ARG784HIS 5.52 29 6q22.2-q22.3 6 128326372 C T
13333.p1 69 RGMA p.VAL379ILE 3.41 29 15q26.1 15 93588446 C T
13222.p1 86 RPS6KA3 p.SER369TERM 4.32
Xp22.2-p22.1 X 20193403 G C
11257.p1 128 RUVBL1 p.LEU365GLN 4.62 113 3q21 3 127806574 A T
11843.p1 113 SESN2 p.ALA46THR 4.88 58 1p35.2 1 28595739 G A
12933.p1 41 SETBP1 frameshift indel
18q21.1 18 42532021 * +GG, -C
12565.p1 79 SETD2 frameshift indel
3p21.31 3 47098932 * -T
12335.p1 47 TBL1XR1 p.LEU282PRO 5.43 98 3q26.33 3 176765107 A G
11480.p1 41 TBR1 frameshift indel
2q24.2 2 162273322 * -C
11569.p1 67 TNKS p.ARG568THR 4.94 71 8p23.1 8 9567684 G C
12621.p1 120 TSC2 p.ARG1580TRP 2.06 101 16p13.3 16 2136269 C T
11291.p1 83 TSPAN17 p.SER75TERM 1.09
5q35.3 5 176078840 C A
11006.p1 125 UBE3C p.SER845PHE 5.39 155 7q36.3 7 157041114 C T
12161.p1 95 UBR3 frameshift indel
2q31.1 2 170732427 * -AAA, +C

W W W. N A T U R E . C O M / N A T U R E | 4 1
SUPPLEMENTARY INFORMATION RESEARCH
! %"!
12521.p1 78 USP15 frameshift indel
12q14 12 62775296 * -TGAG
11526.p1 92 ZBTB41 p.TYR886HIS 5.28 83 1q31.3 1 197128563 A G
13335.p1 25 ZNF420 p.LEU76PRO 2.54 98 19q13.12 19 37618120 T C
CNV
Proband Candidate Gene Type Location Chrom Start Stop
11928.p1 66 CHRNA7 DUPLICATION
15q13.3 15 30925692 32515973
13815.p1 56 CNTNAP4 DELETION
16q23.1 16 75690104 76523780
13726.p1 59 CTNND1 DELETION
11q12.1 11 56843272 60233791
12581.p1 34 EHMT1 DELETION
9 9 140680073 141023914
13335.p1 25 TBX6 DUPLICATION
16p11.2 16 29595483 30199897
*Top candidate de novo mutations based on severity and/or supporting evidence from the literature.

SUPPLEMENTARY INFORMATION
4 2 | W W W. N A T U R E . C O M / N A T U R E
RESEARCH
! %#!
Supplementary Table 8. Mutation rates and probability of recurrence for genes with >1
mutation.
Gene GRIN2B LAMC3 SCN1A NTNG1 CHD8 chimp diffs 15 40 26 2 15 length mapped to chimp
4503 4815 6134 1782 7904
total length of sequence
4503 4840 6134 1782 7904
mut rate per site (diffs / mapped seq)
3.33E-03 8.31E-03
4.24E-03 1.12E-03 1.90E-03
Mutation rate/base/generation
6.94E-09 1.73E-08 8.83E-09 2.34E-09 3.95E-09
People_Screened 1703 1703 1703 189 189 Size of Coding and Splice
4499 4836 6130 1778 7900
# of bases screened 15323594 16471416 20878780 672084 2986200 Avg# DN events 1.06E-01 2.85E-01 1.84E-01 1.57E-03 1.18E-02
#of De Novo 3 2 2 2 2
P(X+) 1.85E-04 3.37E-02 1.50E-02 1.23E-06 6.92E-05
De Novo Events Proband Type Chrom Pos (hg19) Genotype MIP GRIN2B 12681 splice 12 13722953 Y GRIN2B 12547 nonsense 12 13764762 Y GRIN2B 11691 frameshift indel 12 14019043 +G/* LAMC3 11666 missense 9 133914290 R LAMC3 11704 missense 9 133952690 R SCN1A 12499 missense 2 166848071 R SCN1A 12340 missense 2 166848006 Y Exome NTNG1 11660 missense 1 107867061 Y NTNG1 12532 missense 1 107691283 R CHD8 12752 frameshift indel 14 21861376 -CT CHD8 13844 nonsense 14 21871178 R

W W W. N A T U R E . C O M / N A T U R E | 4 3
SUPPLEMENTARY INFORMATION RESEARCH
! %$!
Supplementary Table 9. Selected inherited hemizygous and compound heterozygous sites.
Hemizygous rare singletons
Gene Proband Type Chrom Pos (hg19) Geno Type
AFF2 11056 missense X 147743569 G xmr
ATP7A 11388 missense X 77245127 A xmr
ATRX 11096 missense X 76938115 G xmr
ATRX 11504 missense X 76939319 G xmr
ATRX 11827 missense X 76938353 C xmr
AWAT1 12238 nonsense X 69455937 A x_truncating
CASK 11291 missense X 41469222 C xmr
CNGA2 13793 nonsense X 150912962 T x_truncating
DMD 12157 missense X 31284928 T xmr
FMR1 12390 splice X 147019617 A xmr
FRMPD4 12036 missense X 12712524 C xasd
FTSJ1 11425 missense X 48340830 C xmr
GPR119 11172 nonsense X 129518668 A x_truncating
IQSEC2 11526 missense X 53265000 A xmr
NHS 11989 missense X 17745600 T xmr
OCRL 11388 missense X 128674731 C xmr
PRKY 13822 splice Y 7224175 T y_truncating
PTCHD1 11083 missense X 23397843 T xmr
PTCHD1 11638 missense X 23411984 C xmr
RPGR 12157 splice X 38178241 T x_truncating
RPGR 11218 missense X 38145259 A x_truncating
ZNF185 12373 splice X 152101415 C x_truncating
NLGN4Y 12373 nonsense Y 16734300 T yasd_truncating
Compound Het rare singletons
Gene Proband Type Chrom Pos (hg19) Geno Type
CNTNAP4 11009 missense 16 76482674 M asd_rc
CNTNAP4 11009 missense 16 76482817 R asd_rc
VPS13B 11659 missense 8 100568761 R asd_rc
VPS13B 11659 missense 8 100729575 M asd_rc
MYH7B 11390 frameshift indel 20 33574698 -TCTG rc
MYH7B 11390 missense 20 33574761 Y rc
ITGAM 11863 missense 16 31308874 R rc
ITGAM 11863 splice 16 31340548 R rc
MATN2 11947 frameshift indel 8 99045849 -C rc
MATN2 11947 missense 8 99045883 S rc
QRFPR 12667 nonsense 4 122254158 Y rc
QRFPR 12667 missense 4 122301478 Y rc
SCN5A 13169 missense 3 38622556 Y rc
SCN5A 13169 nonsense 3 38648178 Y rc_truncating_ms xmr = X-linked mental retardation loci, asd = ASD candidate loci, rc = possible recessive loci

SUPPLEMENTARY INFORMATION
4 4 | W W W. N A T U R E . C O M / N A T U R E
RESEARCH
! %%!
Supplementary Table 10. List of the 21 severe de novo mutations that map to regions of
recurrent CNV associated with Developmental Delay and ASD. G
ene
Typ
e of
mut
atio
n
Gen
omic
di
sord
er
Prob
and
Gai
ns a
ll ca
ses
Gai
ns C
T
Gai
ns A
SD
Sig
ASD
ga
ins*
Sig
all g
ains
#
Los
s all
case
s
Los
s CT
Los
s ASD
Sig
ASD
lo
ss*
Sig
all l
oss#
MBD5 fs 2q23.1 del 12346 0 0 0 ~ ~ 11 1 2 5.48E-02 4.52E-02
HDLBP ms 2q37 del 11610 1 0 0 ~ 6.54E-01 24 3 1 4.58E-01 5.77E-03
PDCD1 ms 2q37 del 11707 3 0 0 ~ 2.80E-01 25 1 1 2.64E-01 2.38E-04
UIMC1 ms 5q35.2 del 12285 0 0 0 ~ ~ 9 0 0 ~ 2.20E-02
PSMG4 ms 6p25.3 del 11064 2 0 0 ~ 4.28E-01 8 0 0 ~ 3.36E-02
GPR146 ms 7p22.1 del/dup 11518 13 1 2 5.48E-02 2.21E-02 8 3 0 ~ 4.38E-01
TSNARE1 ms 8q24.3 del 13557 3 0 2 2.02E-02 2.80E-01 14 10 2 5.25E-01 ~
PTGES ms 9q34 del 13822 2 0 0 ~ 4.28E-01 10 0 2 2.02E-02 1.44E-02
PAEP ms 9q34 del 11109 4 2 0 ~ 6.56E-01 56 0 3 2.86E-03 4.68E-11
ABCA2 ms 9q34 del 12225 5 0 0 ~ 1.20E-01 67 4 4 1.76E-02 6.82E-09
PNPLA7 ms 9q34 del 12249 14 0 1 1.42E-01 2.60E-03 64 3 4 9.92E-03 3.39E-09
SLC6A13 ms 12p13.3 del/dup 11388 14 1 0 ~ 1.54E-02 6 2 1 3.69E-01 4.38E-01
TSC2 ms 16p13.3 del/dup 12621 16 0 3 2.86E-03 1.10E-03 48 4 1 5.35E-01 6.42E-06
KIAA0182 ms 16p13.3 del/dup 11711 5 0 0 ~ 1.20E-01 14 0 1 1.42E-01 2.63E-03
SYNRG ms 17q12 del/dup 11599 18 3 0 ~ 3.61E-02 15 2 1 3.69E-01 3.54E-02
DNAH17 ms 17q25 del 11587 3 2 0 ~ ~ 42 1 4 1.80E-03 2.80E-07
GPS1 ms 17q25 del 13629 1 1 0 ~ ~ 45 4 4 1.76E-02 1.82E-05
DUS1L ms 17q25 del 13274 1 1 0 ~ ~ 45 3 4 9.92E-03 4.10E-06
POLRMT ns 19p13.3 del/dup 13333 28 1 3 1.02E-02 7.00E-05 14 1 1 2.64E-01 1.54E-02
HDGFRP2 ms 19p13.3 del/dup 11184 31 1 3 1.02E-02 2.00E-05 7 0 1 1.42E-01 5.13E-02
SBF1 ms 22q13 del/dup 13793 9 0 0 ~ 2.20E-02 53 0 3 2.86E-03 1.68E-10
ms = missense, ns = nonsense, fs = frameshifting indel, All Signature Cases (n = 15,767), ASD (n = 1,379), Controls (n = 8,329) *Fisher exact p-values ASD cases versus controls, #all cases versus controls5.

W W W. N A T U R E . C O M / N A T U R E | 4 5
SUPPLEMENTARY INFORMATION RESEARCH
! %&!
Supplementary Table 11. Other mutations intersecting previous CNV loci and animal
models for ASD.
Gene Type Region Proband Notes ADNP fs 20q13.13 12130 Animal Model
MYH10 ms 17p13 13742 Animal Model CACNA1D ms 3p14.3 11872 Animal Model CACNA1E ms 1q25-q31 11773 Animal Model
AP3B2 ms 15q 11224 CNV Region ARID1B fs 6q25.3 13447 CNV Region BRSK2 del_aa 11p15.5 13415 CNV Region
DYRK1A sp 21q22.13 13890 CNV Region NLGN1 ms 3q26.32 12157 CNV Region SETBP1 fs 18q21.1 12933 CNV Region
TNKS ms 8p23.1 11569 CNV Region TSPAN17 ns 5q35.3 11291 CNV Region
ms = missense, ns = nonsense, fs = frameshifting indel, del_aa = deletion of conserved amino acid

SUPPLEMENTARY INFORMATION
4 6 | W W W. N A T U R E . C O M / N A T U R E
RESEARCH
! %'!
Supplementary Table 12. List of the 126 genes/proteins with severe mutations used for the
PPI, along w/ summary stats.
Protein Degree Clustering Coefficient
Connected component?
ADCY5 2 1 Yes
ADNP 15 0.949 Yes
ARID1B 2 1 Yes
BRSK2 2 1 Yes
BRWD1 1 0 Yes
CDC42BPB 15 0.94285714 Yes
CDH5 1 0 Yes
CHD3 13 1 Yes
CHD7 13 1 Yes
CHD8 18 0.68 Yes
CNOT1 16 0.858 Yes
CNOT3 12 0.894 Yes
CTNNB1 10 0.333 Yes
CUL3 16 0.292 Yes
DDX20 9 0.694 Yes
DEPDC7 15 0.943 Yes
DYRK1A 2 0 Yes
EIF4G1 6 0.867 Yes
FBXW9 1 0 Yes
H2AFV 7 1 Yes
HDGFRP2 4 0.833 Yes
HDLBP 16 0.842 Yes
HNRNPF 30 0.37 Yes
INCENP 2 0 Yes
IQGAP2 8 0.857 Yes
KATNAL2 4 1 Yes
KRT80 6 1 Yes
MAP4 6 1 Yes
MKI67 6 0.667 Yes
MYBBP1A 29 0.34 Yes
MYH10 6 0.467 Yes
NACA 6 1 Yes
NOTCH3 1 0 Yes
NR4A2 1 0 Yes
PBRM1 18 0.647 Yes
PDIA6 13 0.628 Yes
POLRMT 2 1 Yes
PSEN1 2 0 Yes
Protein Degree Clustering Coefficient
Connected component?
RPS6KA3 1 0 Yes
RUVBL1 24 0.489 Yes
SCN1A 5 0.7 Yes
SFPQ 29 0.374 Yes
SRBD1 1 0 Yes
SYNE1 2 1 Yes
TBL1XR1 16 0.858 Yes
TSR2 8 0.929 Yes
UBE3C 5 1 Yes
UBR3 2 1 Yes
YTHDC2 19 0.661 Yes
AMY2B 0 0 No
APAF1 0 0 No
ASAH2 0 0 No
ASAH2C 0 0 No
BMP1 0 0 No
CACNA1D 0 0 No
CACNA1E 0 0 No
COL25A1 0 0 No
CUBN 0 0 No
DDR2 0 0 No
DNAH17 0 0 No
DNAH5 0 0 No
DNAJB9 0 0 No
DUS1L 0 0 No
EFCAB8 0 0 No
EHD2 0 0 No
ETFB 0 0 No
FAM45A 0 0 No
FBXO10 0 0 No
FOXP1 0 0 No
GPR146 0 0 No
GRIN2B 0 0 No
KIAA0100 0 0 No
KIAA0182 0 0 No
KRBA1 0 0 No
L1TD1 0 0 No
LAMC3 0 0 No
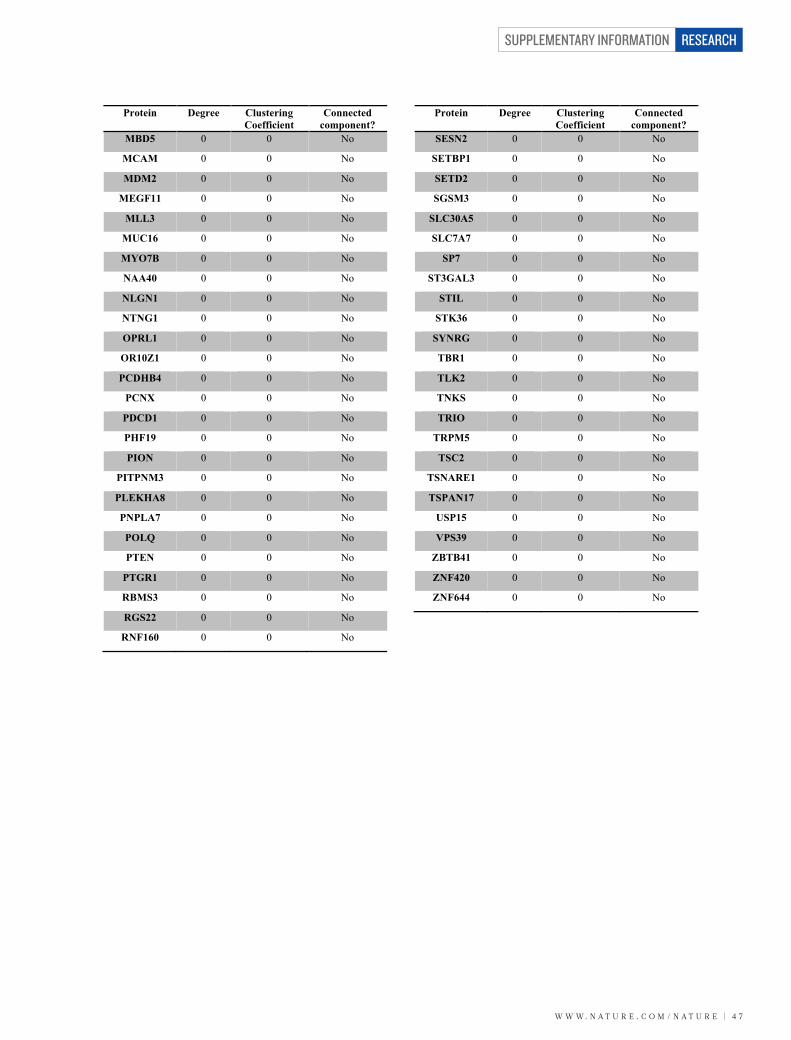
W W W. N A T U R E . C O M / N A T U R E | 4 7
SUPPLEMENTARY INFORMATION RESEARCH
! %(!
Protein Degree Clustering Coefficient
Connected component?
MBD5 0 0 No
MCAM 0 0 No
MDM2 0 0 No
MEGF11 0 0 No
MLL3 0 0 No
MUC16 0 0 No
MYO7B 0 0 No
NAA40 0 0 No
NLGN1 0 0 No
NTNG1 0 0 No
OPRL1 0 0 No
OR10Z1 0 0 No
PCDHB4 0 0 No
PCNX 0 0 No
PDCD1 0 0 No
PHF19 0 0 No
PION 0 0 No
PITPNM3 0 0 No
PLEKHA8 0 0 No
PNPLA7 0 0 No
POLQ 0 0 No
PTEN 0 0 No
PTGR1 0 0 No
RBMS3 0 0 No
RGS22 0 0 No
RNF160 0 0 No
Protein Degree Clustering Coefficient
Connected component?
SESN2 0 0 No
SETBP1 0 0 No
SETD2 0 0 No
SGSM3 0 0 No
SLC30A5 0 0 No
SLC7A7 0 0 No
SP7 0 0 No
ST3GAL3 0 0 No
STIL 0 0 No
STK36 0 0 No
SYNRG 0 0 No
TBR1 0 0 No
TLK2 0 0 No
TNKS 0 0 No
TRIO 0 0 No
TRPM5 0 0 No
TSC2 0 0 No
TSNARE1 0 0 No
TSPAN17 0 0 No
USP15 0 0 No
VPS39 0 0 No
ZBTB41 0 0 No
ZNF420 0 0 No
ZNF644 0 0 No

SUPPLEMENTARY INFORMATION
4 8 | W W W. N A T U R E . C O M / N A T U R E
RESEARCH
! %)!
Supplementary Table 13. Top IPA function for the PPI connected component.
Category Function Function Annotation B-H p-value Molecules #
Gene Expression transcription transcription 9.45E-03
ARID1B, BRWD1, CHD3, CHD8, CTNNB1, DDX20, DYRK1A, MYBBP1A, NOTCH3, NR4A2, POLRMT, PSEN1, RUVBL1, SFPQ, TBL1XR1 15
Gene Expression transcription transcription of DNA endogenous promoter 3.06E-02
BRWD1, CHD3, CHD8, CTNNB1, DDX20, NR4A2, RUVBL1, TBL1XR1 8
Gene Expression transcription transcription of AP1/CRE element 3.42E-02 CTNNB1 1
Gene Expression transcription transcription of simian virus 40 3.42E-02 CHD3 1
Gene Expression transcription transcription of LEF1 binding site 4.32E-02 CTNNB1 1
Gene Expression transcription transcription of DNA 4.57E-02 ARID1B, CTNNB1, MYBBP1A, NOTCH3, NR4A2, TBL1XR1 6
Gene Expression transcription transcription of Ets1 binding site 4.90E-02 CTNNB1 1
Gene Expression transcription transcription of mitochondrial DNA 5.42E-02 POLRMT 1
Gene Expression transcription
transcription of T-cell factor recognition sequence 6.82E-02 CTNNB1 1
Gene Expression transcription transcription of TCF binding site 6.82E-02 CTNNB1 1
Gene Expression transcription transcription of Ets element 7.06E-02 CTNNB1 1
Gene Expression transcription transcription of TATA box 8.01E-02 CTNNB1 1
Gene Expression activation activation of promoter fragment 3.06E-02 CTNNB1, RPS6KA3 2
Gene Expression activation activation of LEF1 binding site 3.06E-02 CTNNB1, PSEN1 2
Gene Expression activation activation of Tbe3 response element 4.10E-02 CTNNB1 1
Gene Expression activation activation of Tcf-4 response element 4.10E-02 CTNNB1 1

W W W. N A T U R E . C O M / N A T U R E | 4 9
SUPPLEMENTARY INFORMATION RESEARCH
! %*!
Gene Expression activation activation of T-cell factor responsive element 5.42E-02 CTNNB1 1
Gene Expression activation activation of Smad3-Smad4 binding element 8.25E-02 CTNNB1 1
Gene Expression activation activation of T-cell factor recognition sequence 8.25E-02 CTNNB1 1
Gene Expression transactivation transactivation of LEF1 binding site 4.10E-02 CTNNB1 1
Gene Expression transactivation transactivation of TCF binding site 4.10E-02 CTNNB1 1
Gene Expression transactivation transactivation of Tcf4 binding site 4.10E-02 CTNNB1 1
Gene Expression transactivation transactivation of RBP-J/CBF binding site 4.57E-02 NOTCH3 1
Gene Expression transactivation
transactivation of androgen receptor binding site 4.57E-02 CTNNB1 1
Gene Expression transactivation transactivation of thyroid hormone response element 5.42E-02 TBL1XR1 1
Gene Expression transactivation transactivation 7.00E-02 CTNNB1, DDX20, NOTCH3, NR4A2, TBL1XR1 5
Gene Expression transactivation transactivation of DNA endogenous promoter 8.57E-02 NOTCH3 1
Gene Expression binding binding of progesterone response element 4.57E-02 SFPQ 1
Gene Expression binding binding of gene 5.42E-02 PSEN1 1
Gene Expression binding binding of TPA response element 6.21E-02 PSEN1 1
Gene Expression expression expression of Nfat binding site 4.57E-02 DYRK1A 1
Gene Expression expression expression of synthetic promoter 6.82E-02
CTNNB1, DYRK1A, NOTCH3, PSEN1 4
Gene Expression repression repression of p53 consensus binding site 4.57E-02 CUL3 1
Gene Expression translation translation of reporter mRNA 7.74E-02 EIF4G1 1
Behavior freezing behavior freezing behavior of mice 9.45E-03 DYRK1A, PSEN1 2
Behavior locomotion locomotion 3.06E-02 ADCY5, CHD7, NR4A2, PSEN1, SCN1A 5

SUPPLEMENTARY INFORMATION
5 0 | W W W. N A T U R E . C O M / N A T U R E
RESEARCH
! &+!
Behavior behavior behavior 3.42E-02 ADCY5, DYRK1A, NR4A2, PSEN1, SCN1A, UBR3 6
Behavior behavior behavior of mice 7.11E-02 DYRK1A, PSEN1, SCN1A 3
Behavior walking walking 3.42E-02 CHD7, SCN1A 2
Behavior psychological process psychological process of mice 4.35E-02 ADCY5, DYRK1A, PSEN1, SCN1A 4
Behavior learning learning by mice 4.57E-02 ADCY5, PSEN1 2
Behavior cognition cognition 4.58E-02 ADCY5, CHD7, PSEN1 3
Behavior motor learning motor learning by mice 4.90E-02 ADCY5 1
Behavior long-term memory long-term memory of mice 6.82E-02 PSEN1 1
Behavior startle response startle response of mice 7.06E-02 DYRK1A 1
Behavior mating behavior mating behavior of mice 8.25E-02 SCN1A 1
Organismal Development development development of organism 9.45E-03
ADNP, CDH5, CHD7, CHD8, CTNNB1, CUL3, DYRK1A, MYH10, PSEN1, RUVBL1, UBR3 11
Organismal Development development development of animal 9.45E-03
CDH5, CHD7, CHD8, CTNNB1, CUL3, DYRK1A, MYH10, PSEN1, UBR3 9
Organismal Development development development of embryo 9.45E-03
CHD7, CHD8, CTNNB1, CUL3, MYH10, PSEN1, UBR3 7
Organismal Development development development of mice 3.06E-02
CDH5, CTNNB1, DYRK1A, MYH10, PSEN1 5
Organismal Development development
development of capillary plexus 4.10E-02 CDH5 1
Organismal Development development
development of blood vessel 4.55E-02
CDH5, CHD7, CTNNB1, MYH10, PSEN1 5
Organismal Development development development of head 6.21E-02 CTNNB1 1
Organismal Development development
delay in development of mice 6.82E-02 DYRK1A 1
Organismal Development developmental process
developmental process of animal 9.45E-03
ADNP, CDH5, CHD7, CHD8, CTNNB1, CUL3, DYRK1A, MYH10, PSEN1, UBR3 10
Organismal Development developmental process
developmental process of mice 3.06E-02
ADNP, CDH5, CTNNB1, DYRK1A, MYH10, PSEN1 6
Organismal Development formation formation of body axis 3.06E-02 CHD8, CTNNB1 2
Organismal Development formation
formation of dorsal-ventral axis 3.42E-02 CTNNB1 1
Organismal Development morphology morphology of aortic root 3.06E-02 MYH10 1

W W W. N A T U R E . C O M / N A T U R E | 5 1
SUPPLEMENTARY INFORMATION RESEARCH
! &"!
Organismal Development neovascularization
neovascularization of corpus luteum 3.06E-02 CDH5 1
Organismal Development patterning
patterning of umbilical vessels 3.06E-02 CTNNB1 1
Organismal Development patterning patterning of embryo 4.54E-02 CTNNB1, PSEN1 2 Organismal Development patterning patterning of vasculature 7.06E-02 CTNNB1 1 Organismal Development morphogenesis morphogenesis of limb 3.28E-02 CHD7, CTNNB1, PSEN1 3
Organismal Development morphogenesis
morphogenesis of hindlimb 3.32E-02 CHD7, CTNNB1 2
Organismal Development morphogenesis morphogenesis of arm 4.57E-02 CTNNB1 1 Organismal Development duplication duplication of body axis 4.32E-02 CHD8 1 Organismal Development angiogenesis angiogenesis of mice 4.90E-02 CDH5, MYH10 2 Organismal Development segmentation segmentation of somites 4.90E-02 PSEN1 1 Organismal Development segmentation segmentation of embryo 5.77E-02 PSEN1 1 Organismal Development growth growth of mice 5.19E-02 ADNP, CTNNB1, DYRK1A 3 Organismal Development growth delay in growth of mice 7.74E-02 DYRK1A 1
Embryonic Development development development of embryo 9.45E-03
CHD7, CHD8, CTNNB1, CUL3, MYH10, PSEN1, UBR3 7
Embryonic Development development
development of trophoblast 4.32E-02 PBRM1 1
Embryonic Development development
development of second branchial arch 6.82E-02 PSEN1 1
Embryonic Development patterning
patterning of embryonic tissue 3.06E-02 CTNNB1, PSEN1 2
Embryonic Development patterning
patterning of vitelline vessel 3.06E-02 CTNNB1 1
Embryonic Development patterning patterning of embryo 4.54E-02 CTNNB1, PSEN1 2
Embryonic Development maintenance
maintenance of apical ectodermal ridge 3.06E-02 CTNNB1 1
Embryonic Development regression
onset of regression of apical ectodermal ridge 3.06E-02 CTNNB1 1
Embryonic Development size size of ventricular zone 3.06E-02 CTNNB1 1 Embryonic Development morphogenesis morphogenesis of limb 3.28E-02 CHD7, CTNNB1, PSEN1 3
Embryonic Development morphogenesis
morphogenesis of hindlimb 3.32E-02 CHD7, CTNNB1 2
Embryonic Development morphogenesis morphogenesis of arm 4.57E-02 CTNNB1 1
Embryonic Development morphogenesis
morphogenesis of metanephros 4.57E-02 CTNNB1 1

SUPPLEMENTARY INFORMATION
5 2 | W W W. N A T U R E . C O M / N A T U R E
RESEARCH
! &#!
Embryonic Development morphogenesis morphogenesis of foregut 6.82E-02 CTNNB1 1 Embryonic Development adhesion adhesion of blastomeres 3.42E-02 CTNNB1 1
Embryonic Development formation formation of renal vesicle 3.42E-02 CTNNB1 1
Embryonic Development formation
formation of apical ectodermal ridge 4.32E-02 CTNNB1 1
Embryonic Development formation
formation of visceral endoderm 4.57E-02 MYH10 1
Embryonic Development formation formation of endoderm 5.77E-02 CTNNB1 1
Embryonic Development maturation
maturation of embryonic cell lines 3.42E-02 NR4A2 1
Embryonic Development thickness
thickness of ventricular zone 3.42E-02 PSEN1 1
Embryonic Development morphology
morphology of outflow tract 4.10E-02 MYH10 1
Embryonic Development quantity quantity of somites 4.32E-02 ADNP 1
Embryonic Development quantity
quantity of mesenchymal cells 4.57E-02 PSEN1 1
Embryonic Development quantity
quantity of embryonic cell lines 8.01E-02 ADNP 1
Embryonic Development apoptosis
apoptosis of neural crest cells 4.90E-02 CTNNB1 1
Embryonic Development segmentation segmentation of somites 4.90E-02 PSEN1 1 Embryonic Development segmentation segmentation of embryo 5.77E-02 PSEN1 1
Embryonic Development specification
specification of dorsal-ventral axis 6.62E-02 CTNNB1 1
Embryonic Development developmental process
developmental process of embryonic cell lines 7.25E-02 DYRK1A, NR4A2 2
Nervous System Development and Function development
development of nervous system 9.45E-03
CHD7, CTNNB1, DYRK1A, MYH10, NOTCH3, NR4A2, PSEN1, RPS6KA3 8
Nervous System Development and Function development
development of central nervous system 1.65E-02
CHD7, CTNNB1, MYH10, NOTCH3, PSEN1, RPS6KA3 6
Nervous System Development and Function development development of forebrain 3.06E-02 CTNNB1, NOTCH3, PSEN1 3
Nervous System Development and Function development
development of fourth cerebral ventricle 3.06E-02 MYH10 1

W W W. N A T U R E . C O M / N A T U R E | 5 3
SUPPLEMENTARY INFORMATION RESEARCH
! &$!
Nervous System Development and Function development
development of third cerebral ventricle 3.06E-02 MYH10 1
Nervous System Development and Function development development of brain 3.06E-02 CTNNB1, MYH10, NOTCH3, PSEN1 4
Nervous System Development and Function development
development of lateral cerebral ventricle 4.32E-02 MYH10 1
Nervous System Development and Function development
development of dopaminergic neurons 5.42E-02 NR4A2 1
Nervous System Development and Function size size of brain 3.06E-02 CTNNB1, DYRK1A 2
Nervous System Development and Function size size of superior colliculus 3.06E-02 DYRK1A 1
Nervous System Development and Function neurological process
neurological process of brain cells 3.06E-02 ADCY5, ADNP, PSEN1 3
Nervous System Development and Function neurological process
neurological process of neurons 3.42E-02
ADCY5, ADNP, CTNNB1, PSEN1, SCN1A 5
Nervous System Development and Function neurological process
neurological process of corticostriatal neurons 4.32E-02 ADCY5 1
Nervous System Development and Function neurological process
neurological process of cerebral cortex cells 4.42E-02 ADNP, PSEN1 2
Nervous System Development and Function neurological process
neurological process of mice 4.57E-02 ADCY5, DYRK1A, NR4A2, PSEN1 4
Nervous System Development and Function differentiation
differentiation of neuronal progenitor cells 3.06E-02 NOTCH3, PSEN1 2
Nervous System Development and Function differentiation differentiation of neurons 4.32E-02 BRSK2, NOTCH3, NR4A2, PSEN1 4
Nervous System Development and Function differentiation
differentiation of amacrine cells 4.90E-02 NR4A2 1

SUPPLEMENTARY INFORMATION
5 4 | W W W. N A T U R E . C O M / N A T U R E
RESEARCH
! &%!
Nervous System Development and Function differentiation
differentiation of neuroepithelial cells 7.74E-02 PSEN1 1
Nervous System Development and Function differentiation
differentiation of dopaminergic neurons 8.25E-02 NR4A2 1
Nervous System Development and Function differentiation differentiation of neuroglia 8.25E-02 CTNNB1, NOTCH3 2
Nervous System Development and Function cell cycle progression
re-entry into cell cycle progression of neuroepithelial cells 3.06E-02 CTNNB1 1
Nervous System Development and Function cytostasis cytostasis of neurites 3.06E-02 MYH10 1
Nervous System Development and Function recovery recovery of brain tissue 3.06E-02 ADNP 1
Nervous System Development and Function surface area
surface area of cerebral cortex 3.06E-02 CTNNB1 1
Nervous System Development and Function cell-cell contact
cell-cell contact of nervous tissue cell lines 3.42E-02 CDH5 1
Nervous System Development and Function shrinkage
shrinkage of cerebral cortex 3.42E-02 PSEN1 1
Nervous System Development and Function maturation
maturation of dopaminergic neurons 4.10E-02 NR4A2 1
Nervous System Development and Function morphology
morphology of cerebral cortex 4.10E-02 CTNNB1 1
Nervous System Development and Function neurogenesis neurogenesis of brain 4.10E-02 PSEN1 1
Nervous System Development and Function neurogenesis neurogenesis 8.02E-02 NOTCH3, PSEN1, SYNE1 3
Nervous System Development and Function retraction retraction of neurites 4.20E-02 MYH10, PSEN1 2

W W W. N A T U R E . C O M / N A T U R E | 5 5
SUPPLEMENTARY INFORMATION RESEARCH
! &&!
Nervous System Development and Function retraction retraction of dendrites 6.21E-02 PSEN1 1
Nervous System Development and Function neurotransmission neurotransmission 4.32E-02 ADNP, CTNNB1, PSEN1, SCN1A 4
Nervous System Development and Function neuroprotection
neuroprotection of cortical neurons 4.32E-02 ADNP 1
Nervous System Development and Function tubulation
tubulation of nervous tissue cell lines 4.32E-02 CDH5 1
Nervous System Development and Function migration migration of neurons 4.55E-02 MYH10, NR4A2, PSEN1 3
Nervous System Development and Function quantity quantity of neurons 4.55E-02 DYRK1A, NR4A2, PSEN1 3
Nervous System Development and Function quantity
quantity of Cajal-Retzius neurons 4.57E-02 PSEN1 1
Nervous System Development and Function quantity quantity of amacrine cells 5.77E-02 NR4A2 1
Nervous System Development and Function quantity
quantity of neuroepithelial cells 6.21E-02 CTNNB1 1
Nervous System Development and Function quantity
quantity of dopaminergic neurons 8.57E-02 NR4A2 1
Nervous System Development and Function learning learning by mice 4.57E-02 ADCY5, PSEN1 2
Nervous System Development and Function motor learning motor learning by mice 4.90E-02 ADCY5 1
Nervous System Development and Function morphogenesis morphogenesis of brain 5.77E-02 PSEN1 1
Nervous System Development and Function morphogenesis morphogenesis of neurites 8.65E-02 MYH10, SYNE1 2

SUPPLEMENTARY INFORMATION
5 6 | W W W. N A T U R E . C O M / N A T U R E
RESEARCH
! &'!
Nervous System Development and Function survival survival of nervous tissue 5.77E-02 ADNP 1
Nervous System Development and Function synaptic transmission
synaptic transmission of neurons 5.77E-02 ADNP, CTNNB1, PSEN1 3
Nervous System Development and Function synaptic transmission
synaptic transmission of hippocampal neurons 6.82E-02 PSEN1 1
Nervous System Development and Function long-term memory long-term memory of mice 6.82E-02 PSEN1 1
Nervous System Development and Function long-term potentiation
long-term potentiation of hippocampal neurons 6.82E-02 PSEN1 1
Nervous System Development and Function proliferation
proliferation of cerebral cortex cells 7.06E-02 DYRK1A 1
Nervous System Development and Function proliferation
proliferation of neural precursor cells 8.01E-02 DYRK1A 1
Nervous System Development and Function startle response startle response of mice 7.06E-02 DYRK1A 1
Nervous System Development and Function extension extension of neurites 8.01E-02 ADNP, MYH10 2
Nervous System Development and Function axonogenesis axonogenesis of axons 8.57E-02 PSEN1 1
Nervous System Development and Function long term depression
long term depression of brain cells 8.57E-02 ADCY5 1
Nervous System Development and Function long term depression
long term depression of neurons 8.91E-02 ADCY5 1

W W W. N A T U R E . C O M / N A T U R E | 5 7
SUPPLEMENTARY INFORMATION RESEARCH
! &(!
Supplementary References
1 Sanders, S. J. et al. Multiple recurrent de novo CNVs, including duplications of
the 7q11.23 Williams syndrome region, are strongly associated with autism.
Neuron 70, 863-885, doi:10.1016/j.neuron.2011.05.002 (2011).
2 Levy, D. et al. Rare de novo and transmitted copy-number variation in autistic
spectrum disorders. Neuron 70, 886-897, doi:10.1016/j.neuron.2011.05.015
(2011).
3 De Ferrari, G. V. & Moon, R. T. The ups and downs of Wnt signaling in prevalent
neurological disorders. Oncogene 25, 7545-7553 (2006).
4 Warde-Farley, D. et al. The GeneMANIA prediction server: biological network
integration for gene prioritization and predicting gene function. Nucleic acids
research 38, W214-220, doi:10.1093/nar/gkq537 (2010).
5 Cooper, G. M. et al. A copy number variation morbidity map of developmental
delay. Nature Genetics 43, 838-846, doi:10.1038/ng.909 (2011).
Copyright © 2022 FDOKUMEN