Secure Precise Clock Synchronization for Interconnected Body Area Networks
Upload
khangminh22Category
view
0download
0
FREQUENCY RESPONSE CHARACTER-ISTICS OF AN INTERCONNECTED POWER SYSTEM - A CASE STUDY OF REGIONAL GRIDS IN INDIA S.K. SOONEE AND S.C. SAXENA Power Grid Corporation of India Ltd. India
Abstract control area’s contribution to the frequency response comprises of two components, namely, load response and governor response of generators. Load response (rejection) is the reduction in the power consumption of motors in response to a decline in the frequency and occurs directly (or with a minimal time lag) as the frequency changes. Generator governor (primary) response occurs in the 3-10 second time frame. It is the natural frequency response of a control area, which provides the self-healing immediately after a loss of generation. The frequency response characteristic of any system varies depending upon various factors such as the time of day, season of the year and size of the interconnection. The paper studies the types of generation and the loads (agricultural, industrial, and domestic) in the country and discusses the 'frequency response characterstics' for the Regional Grids in India. Specific incidences of sudden loss of large generation and large loads are studied and the frequency response is calculated state-wise and for the entire region. Incidents of such loss of generation or loads in the Northern Region after synchronization with the Central Grid (Western, Eastern and North-Eastern Grids) have also been studied and presented. Keywords Frequency response, primary response, stiffness constant, power number.
1. INTRODUCTION
Frequency response is defined as the automatic, sustained change in the power consumption by load or output of generators that occurs immediately after a change in the control area’s load-generation balance and which is in a direction to oppose a change in the Interconnection’s frequency. It is also known as the power number of the system, stiffness constant, system inertia and system resilience and is denoted by the constant ‘k’ in the Area Control Error (ACE) equation (ACE = ∆P + k ∆f). During a contingency, such as the tripping of a generator or a loss of load block, the frequency changes due to the mismatch in load and generation. The level to which the frequency drops depends on the starting point as well as the system inertia. It is the system inertia, which provides the initial ability of the power system to oppose change in the frequency. Physically, it may loosely be defined by the mass
6th International R & D Conference on Sustainable Development of Water and Energy Resources – Needs and Challenges - 13-16 February 2007, Lucknow, Uttar Pradesh, India

FREQUENCY RESPONSE CHARACTERISTICS OF AN INTERCONNECTED POWER SYSTEM 221
of all the synchronous rotating generators and the motors connected to the system. If the system inertia is high, then the frequency will fall slowly and vice versa, during any system contingency. System inertia is not frequency control per se, but it does influence the time taken for frequency to change after a loss of generation or load. Higher system inertia provides more time to the generator governors to respond to a change in frequency and hence is desirable. The various resources that contribute to the response of a control area are shown in the resources pyramid (Fig. 1). It is the natural frequency response of a control area, which provides the self-healing immediately after occurrence of a contingency. The control area’s contribution to the frequency response thus comprises of two components namely load response and governor response of generators. Primary response is the generator governor response, which occurs in the 3-10 second time frame. The changes in the generator output (MW) are in response to the change in frequency and are independent of any commands. Primary response is responsible for the initial arrest of frequency variations, but does not restore the frequency or the tie-line flows to schedules. Under frequency and df/dt relay operation occurs in the millisecond time frame, even before the primary response comes into the play. Secondary response is slower and is activated by the control commands such as those issued by the AGC systems and tie line flow control systems. Tertiary response comprises all subsequent actions taken such as bringing in non-spinning reserves, manual load shedding, etc. Load response (rejection) is the reduction in the power consumption of motors in response to a decline in the frequency and occurs directly (or with a minimal time lag) as the frequency changes. Frequency response is actually a negative value i.e., the generator output should increase as frequency drops. The frequency response assumes greater significance in times of system restoration after a disturbance, islanding or black out since frequency control during restoration is extremely important.
F R
Regulation (Secs to mins)
Operating Reserves (10-15 minutes)
Load Following (30 minutes)
Market (Hourly)
Time
FR: Frequency Response Fig. 1

S.K. SOONEE ET AL. 222
2. THE INDIAN SCENARIO
India is divided into five regional grids namely the Northern, Southern, Eastern, Western and the Northeastern grids with a total All-India installed capacity of 127,673 MW. The fuel based breakup of the generation for the entire country is Hydro – 26.32%, Thermal – 65.78% (Coal – 54.20 %, Gas – 10.64%, Diesel – 0.94%), Nuclear – 3.05% and Renewable – 4.85% (as on 30-Nov-2006). Because of the uneven distribution of the fuel resources, the coal based thermal generation is mainly located in the Eastern part with Hydro generation concentrated in the North and the Northeast and some reservoir based hydro in the South. The load centers are mainly located in the North, West and South parts of the country with low load areas in the East and Northeast part. The North, West, East and the Northeast grids are operating synchronously and all the four regions are interconnected with AC as well as HVDC links. The Southern Region is connected to the East and West by HVDC links. Each regional grid is further divided into state grids, which form the respective control areas. Within a region, the various control areas are interconnected by AC links and it is these individual control areas and the regional boundaries that have been considered for calculating the frequency response. From the frequency response perspective, the types of loads and their geographical distribution are important. Broadly speaking the loads can be classified as Industrial, Agricultural, Domestic and Commercial. At the end of 2004-2005 (Fig. 2), the industrial load constitutes about 44.5% of the total connected load, agriculture 19.8% and domestic and commercial together about 28.4%. The country’s load has evolved over a period of time and as can be clearly seen from Fig. 2, there is a decline in the industrial load and a steady growth in the agriculture, domestic and commercial loads. Industrial loads comprise the high inertia heavy rotating loads which provide a good frequency response whereas; domestic and commercial loads use more efficient electronic load control devices, which, in general, reduce the frequency response.
Fig. 2
0
10
20
30
40
50
60
70
80
1950
-51+
1970
-71
1977
-78
1979
-80
1981
-82
1983
-84
1985
-86
1987
-88
1989
-90
1991
-92
1993
-94
1995
-96
1997
-98
1999
-00
2001
-02
2003
-04*
Per
cent
age
of e
lect
ric
cons
umpt
ion
Industrial
Domestic+ Commercial
Agriculture

FREQUENCY RESPONSE CHARACTERISTICS OF AN INTERCONNECTED POWER SYSTEM 223
3. CALCULATION OF FREQUENCY RESPONSE
3.1 Theoretical Background
The inertia constant ‘H’ for rotating machines is denoted by14,
H = (J ω0m2)/2VAbase
where, J = combined inertia of the generator and turbine
ω0m = rated angular velocity in mechanical radians per second
The reduction in load following a decline in frequency is characterized by the load reduction factor “d”, which is defined as the percentage change in load for a percentage reduction in frequency1,6. The general rule of the thumb is that a 1% change in frequency causes a 2% change in the load. The simplest way to calculate the frequency response of a control area is to use the “1% of load” approach. However, this does not give very good results. A statistically rigorous approach is required to give better results. 3.2 NERC Methodology
The method used to calculate the frequency response in the Indian context has been adopted from the methodology suggested by the North American Electric Reliability Council (NERC)6. Each control area has been considered to have its own internal generation and interconnections with the neighboring control areas. Any contingency, which occurs (a loss of generator or a load block), will manifest itself as a change in frequency and a change in the control area’s tie-line exchanges with its neighbors. The frequency response of the control area is calculated using the following.
Actual net interchange immediately before the disturbance = PA Actual net interchange immediately after the disturbance = PB Change in net interchange = PB - PA Load (+) or generator (-) loss causing the disturbance = PL Control area response (∆p) = (PB - PA) - PL Change in frequency (∆f) = fB – fA Frequency response characteristic = ∆p / ∆f The data for the above calculations is taken from the real time telemetered data recorded by the SCADA systems installed at the Regional Load Dispatch Centers. Statistically speaking, about 30 observations are required to give a large enough sample to have confidence in the results. Both average and the median can be used to arrive at the frequency response, though the median is a better measure of the central tendency while analyzing a highly variable population like the frequency response events. The total frequency response of a region is the sum of all the control areas within the region.

S.K. SOONEE ET AL. 224
4. CASE STUDY – FREQUENCY RESPONSNE CHARACTERSTICS OF INDIAN GRIDS
System contingencies such as tripping of a large generating unit, tripping of HVDC back-to-back stations (or inter-regional HVDC links) and loss of a large block of load (tripping of ICTs) have been recorded and analyzed to arrive at the frequency response characterstics of the concerned region. Such incidents have been recorded both for Northern Regional Grid and the Southern Regional Grid over a period of time (December 2004 to September 2006 for Northern Region and March 2003 to May 2004 for Southern Region).
4.1 Northern Grid
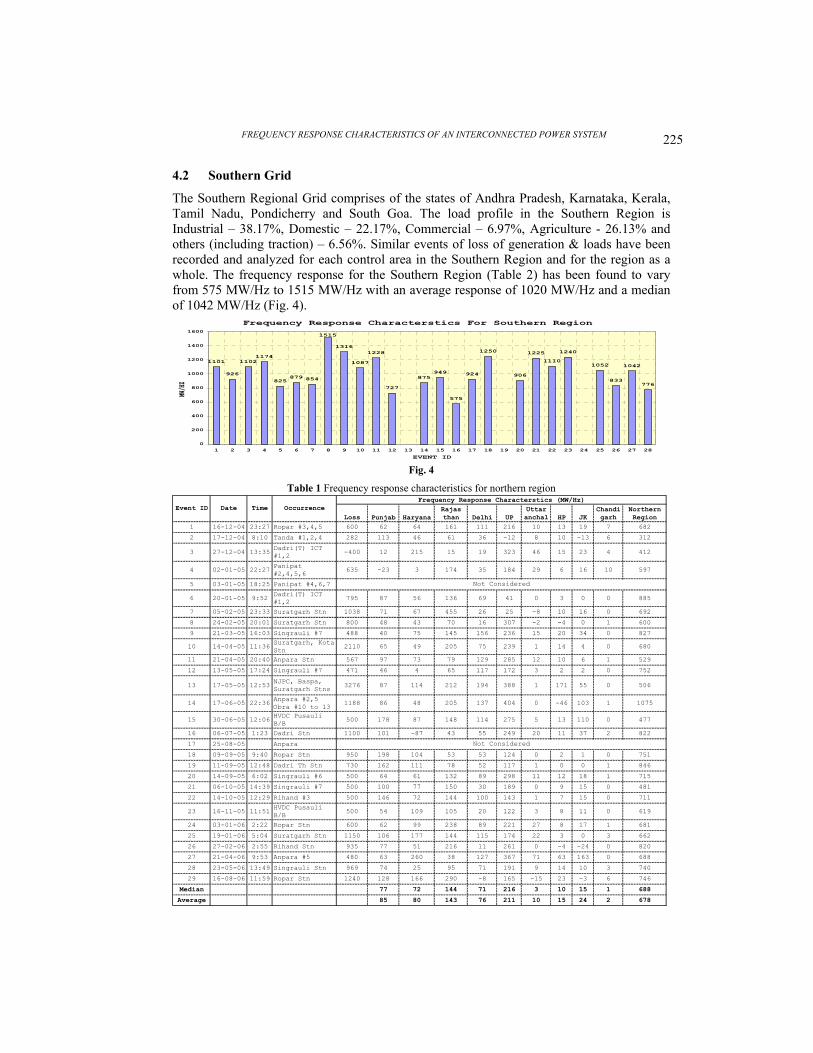
The Northern Region comprises the states of Punjab, Haryana, Rajasthan, Delhi, Uttar Pradesh, Uttaranchal, UT Chandigarh, Himachal Pradesh and Jammu & Kashmir. Each state forms a control area. The load profile in the Northern Region is Industrial – 36.28%, Domestic – 26.70%, Commercial – 8.71%, Agriculture - 19.50% and others (including traction) – 8.81%. Contingencies resulting in a loss of generation varying from 500 MW to nearly 3300 MW and loss of load blocks from 400 MW to 600 MW have been recorded, data captured and analyzed to arrive at the frequency response characterstics of each control area and the region as a whole (Fig. 3). Twenty-seven events have been captured (two not considered for analysis) and it is found that the frequency response characteristic of the Northern Region varies between 312 MW/Hz to 1075 MW/Hz. The average response is 678 MW/Hz and the median is 688 MW/Hz.
Frequency Response Characterstics For Northern Region
682
312
412
597
885
692
600
827
680
529
752
506
1075
477
822751
846
715
481
711
619681 662
820
688740 746
0
200
400
600
800
1000
1200
1 2 3 4 5 6 7 8 9 10 11 12 13 14 15 16 17 18 19 20 21 22 23 24 25 26 27 28 29EVENT ID
MW/HZ
Fig. 3 A state like Delhi has a typically urban load, which is predominantly domestic and commercial (Domestic – 49.04%, Commercial – 27.88%, Industrial – 15.17%, Agriculture – 0.56% and others including traction – 7.35%). The frequency response characteristic for Delhi is found to vary from 16 MW/Hz to 328 MW/Hz. The average response is 96 MW/Hz and the median 82 MW/Hz (Table 1). For a state like Punjab, which has predominantly industrial and agricultural load (Domestic – 21.86%, Commercial – 5.58%, Industrial – 40.39%, Agriculture – 27.92% and others including traction – 4.24%). The average frequency response is 100 MW/Hz and the median is 87 MW/Hz.
FREQUENCY RESPONSE CHARACTERISTICS OF AN INTERCONNECTED POWER SYSTEM 225
4.2 Southern Grid
The Southern Regional Grid comprises of the states of Andhra Pradesh, Karnataka, Kerala, Tamil Nadu, Pondicherry and South Goa. The load profile in the Southern Region is Industrial – 38.17%, Domestic – 22.17%, Commercial – 6.97%, Agriculture - 26.13% and others (including traction) – 6.56%. Similar events of loss of generation & loads have been recorded and analyzed for each control area in the Southern Region and for the region as a whole. The frequency response for the Southern Region (Table 2) has been found to vary from 575 MW/Hz to 1515 MW/Hz with an average response of 1020 MW/Hz and a median of 1042 MW/Hz (Fig. 4).
Frequency Response Characterstics For Southern Region
1101
926
11021174
825879 854
1316
1087
1228
727
875949
575
924
1250
906
1225
1110
1240
1052
833
1042
776
1515
0
200
400
600
800
1000
1200
1400
1600
1 2 3 4 5 6 7 8 9 10 11 12 13 14 15 16 17 18 19 20 21 22 23 24 25 26 27 28
EVENT ID
MW/H
Z
Fig. 4
Table 1 Frequency response characteristics for northern region
Loss Punjab HaryanaRajas than Delhi UP
Uttar anchal HP JK
Chandi garh
Northern Region
1 16-12-04 23:27 Ropar #3,4,5 600 62 64 161 111 216 10 13 19 7 682
2 17-12-04 8:10 Tanda #1,2,4 282 113 46 61 36 -12 8 10 -13 6 312
3 27-12-04 13:35Dadri(T) ICT #1,2 -400 12 215 15 19 323 46 15 23 4 412
4 02-01-05 22:27 Panipat #2,4,5,6
635 -23 3 174 35 184 29 6 16 10 597
5 03-01-05 18:25 Panipat #4,6,7
6 20-01-05 9:52Dadri(T) ICT #1,2 795 87 56 136 69 41 0 3 0 0 885
7 05-02-05 23:33 Suratgarh Stn 1038 71 67 455 26 25 -8 10 16 0 692
8 24-02-05 20:01 Suratgarh Stn 800 48 43 70 16 307 -2 -4 0 1 600
9 21-03-05 16:03 Singrauli #7 488 40 75 145 156 236 15 20 34 0 827
10 14-04-05 11:36 Suratgarh, Kota Stn
2110 65 49 205 75 239 1 14 4 0 680
11 21-04-05 20:40 Anpara Stn 567 97 73 79 129 285 12 10 6 1 529
12 13-05-05 17:24 Singrauli #7 471 46 4 65 117 172 3 2 2 0 752
13 17-05-05 12:53 NJPC, Baspa, Suratgarh Stns
3276 87 114 212 194 388 1 171 55 0 506
14 17-06-05 22:36 Anpara #2,5 Obra #10 to 13
1188 86 48 205 137 404 0 -46 103 1 1075
15 30-06-05 12:06HVDC Pusauli B/B 500 178 87 148 114 275 5 13 110 0 477
16 06-07-05 1:23 Dadri Stn 1100 101 -87 43 55 249 20 11 37 2 822
17 25-08-05 Anpara
18 09-09-05 9:40 Ropar Stn 950 198 104 53 53 124 0 2 1 0 751
19 11-09-05 12:48 Dadri Th Stn 730 162 111 78 52 117 1 0 0 1 846
20 14-09-05 6:02 Singrauli #6 500 64 61 132 89 298 11 12 18 1 715
21 06-10-05 14:39 Singrauli #7 500 100 77 150 30 189 0 9 15 0 481
22 14-10-05 12:29 Rihand #3 500 146 72 144 100 143 1 7 15 0 711
23 16-11-05 11:51 HVDC Pusauli B/B
500 54 109 105 20 122 3 8 11 0 619
24 03-01-06 2:22 Ropar Stn 600 62 99 238 89 221 27 8 17 1 681
25 19-01-06 5:04 Suratgarh Stn 1150 106 177 144 115 174 22 3 0 3 662
26 27-02-06 2:55 Rihand Stn 935 77 51 216 11 261 0 -4 -24 0 820
27 21-04-06 9:53 Anpara #5 480 63 260 38 127 367 71 63 163 0 688
28 23-05-06 13:49 Singrauli Stn 969 74 25 95 71 191 9 14 10 3 740
29 16-08-06 11:59 Ropar Stn 1240 128 166 290 -8 165 -15 23 -3 6 746
Median 77 72 144 71 216 3 10 15 1 688
Average 85 80 143 76 211 10 15 24 2 678
Not Considered
Not Considered
Event ID Date Time OccurrenceFrequency Response Characterstics (MW/Hz)

S.K. SOONEE ET AL. 226
Table 2 Frequency response characteristics for southern region
ANDHRA PRADESH KARNATAKA KERALA TAMILNADU PONDY
SOUTHERN REGION
1 04-03-03 13:54VTS 2,3,6 TRIP 630 292 416 114 260 6 1101
2 06-03-03 18:40 SIMH U2 TRIP 500 319 169 228 257 9 926
3 16-03-03 13:34 KOLAR TRIP 672 187 300 133 484 8 1102
4 28-03-03 16:31 KOLAR TRIP 775 314 286 109 320 0 1174
5 12-04-03 15:38 KOLAR TRIP 850 236 157 119 309 1 825
6 20-04-03 16:38 KOLAR TRIP 620 218 161 127 342 3 879
7 21-04-03 9:35 KOLAR TRIP 555 222 212 129 245 3 854
8 03-05-03 17:08SIMH UNIT TRIP 500 455 579 158 306 12 1515
9 05-05-03 14:43SIMH UNIT TRIP 500 345 450 205 295 11 1316
10 06-05-03 9:36SIMH UNIT TRIP 500 222 426 91 298 7 1087
11 10-05-03 3:42SIMH UNIT TRIP 1000 300 628 200 211 0 1228
12 18-05-03 22:45KTPS UNITS TRIP 550 235 255 149 190 5 727
13 19-05-03 12:00
VTPS6 UNITS+SIMH1 UNIT + GAS UNITS 1100
14 20-06-03 1:50 KOLAR TRIP 490 179 270 152 370 0 875
15 28-06-03 12:49 KOLAR TRIP 750 200 278 57 437 1 949
16 29-06-03 13:00 KOLAR TRIP 630 203 93 120 195 0 575
17 01-08-03 12:27 KOLAR TRIP 427 314 180 143 307 6 924
18 05-09-03 11:35RTPS UNITS TRIPPED 1000 383 658 58 202 8 1250
19 29-09-03 14:20 KOLAR TRIP 75020 08-10-03 13:10 KOLAR TRIP 1060 220 280 111 294 2 906
21 17-11-03 22:46SIMH UNIT TRIP 1000 167 245 171 187 0 1225
22 21-12-03 14:10MTPS UNIT TRIP 855 209 488 75 323 0 1110
23 15-01-04 4:33TTPS UNIT TRIP 682 380 318 53 480 0 1240
24 04-02-04 15:51 KOLAR TRIP 142825 05-03-04 14:45 KOLAR TRIP 1188 335 380 172 176 6 105226 13-05-04 4:21 VTPS TRIP 1000 192 266 47 278 9 833
27 15-05-04 17:30KTPS UNITS TRIP 750 385 301 75 132 3 1042
28 21-05-04 13:30SIMH+GAZK TRIP 776 322 166 79 167 0 776
273 318 123 283 4 1020236 280 120 294 3 1042
AverageMedian
NOT CONSIDERED
NOT CONSIDERED
NOT CONSIDERED
LOSS Frequency Response Characteristic MW/HZ
TIMEEVENT NO
DATE OCCURRENCE
4.3 Combined Northern Grid and Central Grid
On 26th August 2006, the Northern Grid was synchronized with the Central Grid (Western, Eastern and North Eastern Grids). Post synchronization, three events occurred which have been captured to calculate the frequency response characterstics of the combined grid. The
FREQUENCY RESPONSE CHARACTERISTICS OF AN INTERCONNECTED POWER SYSTEM 227
frequency response has been found to vary from 1550 MW/Hz to 1664 MW/Hz with an average of 1611 MW/Hz and a median value of 1620 MW/Hz. The number of events captured so far is not adequate to give a figure with higher confidence level and more events need to be captured. Theoretical simulation studies carried out prior to the synchronization of the two large grids (North and Central) suggest that the frequency response of the combined system should be of the order of 1800 MW/Hz. 5. DISCUSSION
From the results obtained, it is evident that the frequency response characteristic of a control area is a highly variable parameter and it is difficult to accurately quantify the system’s natural response. The factors affecting the FRC are the system size, frequency at the start of the incident, generator loading, losses, distance of generators from the point of loss, load composition, number of generators in service at the time of the incident, type of generation, governor action, time of day, season and interconnections with the neighbors. For instance in summers, systems tend to have a larger proportion of motor load. An area serving heavy industrial load or agricultural pumping load would have a better frequency response than an area serving predominantly domestic and commercial load. There is an increasing trend in the all silicon load (electronic devices) component not only in the domestic and commercial segments but also in the industry. These electronic loads do not provide the desired frequency response. The industry also uses variable speed drives/solid state drives, which do not provide the traditional response to frequency variations. During periods of high loads, the frequency response is available mainly from the load since the generating units are operating near their full capacities. During light load periods, units are operating at less than their full capacities and governor response is available. No spinning reserves are available in the Indian system. The type of generation too has an important role to play in the frequency response. Combined Cycle Gas based generation exhibits a positive frequency response, which means that the generation actually reduces with a decline in the frequency. This is because of the slow down of the auxiliaries. In India, the nuclear generation is totally inflexible as governors are blocked for various reasons. Most of the governors on the hydro and thermal generating units are blocked or have a delay configured thereby inhibiting the response. In the prevailing shortage scenario in the country, the generating units are almost always operated near the full capacity and even if governors are free, these units are not capable of picking up further generation. Moreover, no attempt is made to utilize the short-term overload capability of the machines. In the past, free governor mode of operation was used as suggested by JG Siroux1. The report also suggested maintenance of reserves equal to the single largest generating unit in each region. However, because of a huge demand – supply gap, these could not be maintained. 5.1 Under-Frequency and df/dt Relays
Under frequency relays (UFR) and df/dt relays are installed in all the regions to arrest a fast fall in frequency and below a per-designated level (e.g., 48.80 Hz in Northern Region). The UFRs and df/dt relays act in the millisecond timeframe and are the first to provide relief by way of load shedding. A unique use of the under frequency relays has been made by the state
S.K. SOONEE ET AL. 228
of Tamil Nadu at Aliyar HPS where the machines are running in the synchronous condenser mode and generation is picked up by the units using a signal from the UFR. 5.2 Limiting Factors
The factors affecting the accuracy of the calculation of the FRC are:
(a) A large number of events must be captured and subjected to statistical treatment before a reasonably accurate figure can be obtained. This is also necessary to rule out the impact of high variability of the load.
(b) Small excursions, which are significantly smaller than the maximum governor deadband, should not be included.
(c) Both load and generation are continuously changing naturally.
(d) Identification of the exact point of disturbance and interpretation of the time window to be measured. “Immediately before” and “immediately after” are subject to interpretation.
(e) Limitation of the sampling rate of the data recorded by the SCADA system (normally 10 second samples are available in the SCADA). At times, there is also a loss in part of the telemetered data due to various reasons and this causes inaccuracies.
5.3 Interdependencies of P, Q, V & f
In the study undertaken, it is assumed that active power-frequency (P-f) and reactive power-voltage (Q-V) dependencies are decoupled. With the reduction in frequency the active power drawn by the motor load reduces. However, as the motor load is primarily inductive, the reactive power drawn increases (negative correlation). This leads to a reduction in the voltage, which in turn further decreases the active power5. Thus, in addition to the P-f and Q-V relation, the P-V and Q-f relations cannot be ignored. This becomes all the more important in systems where frequency and voltage vary widely. The Transmission Planning Criterion of CEA adopts the following load model7:
P = P0 (f/f0) …(1)
Q = Q0 (V/V0)2 …(2)
This model considers the reactive demand of load to be frequency independent. For composite load model as per the IEEE Committee Report [17], the following must be considered:
P (v,f) = (a1vn1fm1 + a2vn2fm2 + a3vn3fm3)P0 …(3)
Q (v,f) = (a4vn4fm4 + a5vn5fm5 + a6vn6fm6)Q0 …(4)
The coefficients a1 to a6 are normally associated with load categories such as general residential load, industrial load and agricultural load. However, the coefficients are fractions with sum to unity i.e.,
a1 + a2 + a3 = 1.0 …(5)

FREQUENCY RESPONSE CHARACTERISTICS OF AN INTERCONNECTED POWER SYSTEM 229
a4 + a5 + a6 = 1.0 …(6)
In the Northern Region, studies carried out revealed that there is a change of 2% in the voltage with a change of 1% in the frequency. 5.4 Introduction of Competition in the Electricity Sector in India
Power utilities are being unbundled to bring in competition in India. Availability based tariff and open access in transmission at the inter-state level have been implemented successfully. Market mechanisms are being developed further and establishment of a Power Exchange is envisaged in the year 2007. The balancing market is provided by the UI mechanism. Implementation of intra-state ABT is being taken up. These factors are responsible for an ever-increasing pressure to bring about economy and efficiency. Market mechanisms have stressed the existing transmission systems more than ever before. All these have a direct bearing on the security of the grids and good frequency response of the system is necessary. 6. TRENDS WORLDWIDE
Extensive work has been done by the NERC in the USA on the frequency response. Frequency response is one of the important services that the utilities have to provide. NERC has also proposed a Frequency Response Standard. It is mandatory to calculate and report the frequency response characterstics for each control area using the methodology provided by NERC. Calculations of the frequency response characterstics by the Eastern Interconnection and the Western Interconnection in the USA show that there is a declining trend in the frequency response obtained. The period considered is ten years (1993 to 2003) for the Eastern Interconnection and five years (1998 to 2002 both inclusive) for the Western Interconnection4. Theoretically speaking, there should be an increase in the frequency response since load levels are increasing and new generation is added. Evidence, however, suggests otherwise. Many reasons are contributing to this decline in the frequency response in the United States: (a) Steam turbine generators operating on “sliding pressure” or “boiler follower” control
and/or with “valves wide open operation”. (b) Blocked governors on nuclear units. (c) Less heavy manufacturing in the North America. (d) Variable speed drives that do not provide the traditional load rejection. (e) Increasing percentage of combined cycle gas based generation, which actually gives a
positive frequency response. This phenomenon reportedly contributed to a blackout in Malaysia in 1996.
(f) Deregulation and market pressures have resulted in a reduction in the reserves maintained by the utilities. There is an increase in the number of reserve sharing groups as compared to the past when utilities maintained full reserves for their individual largest contingency.
(g) New generator designs having less inertia i.e., less mass per MW of output.

S.K. SOONEE ET AL. 230
NERC suggests that though some decline in the frequency response is not a problem for large interconnections, it is difficult to arrive at the cut off point below which it could become a serious issue. Primary frequency response becomes a major consideration in islanding/disturbance situations. Initiating black start in an area with poor frequency control is not desirable. There is also an ongoing debate as to whether frequency response capability should be a mandatory requirement of all generators or it could be a commercial product (ancillary service). As a matter of fact, in the prevailing deregulated environment with ever-increasing pressures for economy and efficiency, it is a costly proposition to maintain a part of generation as idle capacity just to provide support during contingent situations. Some suggest that all generators should have operating governors, respond to frequency deviations equitably and this should be a mandatory requirement for connection to the grid. Others argue that the market can better determine the best use of resources. 7. CONCLUSION
There is an increase in the sizes of the generating units, the present maximum size is 500 MW and very soon there would be units of 1000 MW size. The tripping of a single generating unit of such a large size would create a far more severe contingency and tripping of the entire station is another credible contingency. There is also an increasing trend in the share of combined cycle gas and nuclear-based generation. Load profiles are changing and there is a reduction in the percentage of the load providing the self-healing in case of contingencies. Power systems will be faced with increasingly silicon-intensive loads. As a result, the mechanical inertia of the system will be less than with today’s motor-intensive loads. Because such inertia helps the system “ride through” momentary disruptions, the coming of predominantly silicon-based loads could contribute to dynamic instability15. In these circumstances, there is a need for having a good frequency response characteristic for each control area. Free governor mode of operation and provision of reserves by each utility is required. Though the Indian Electricity Grid Code (IEGC)16 has mandated these, much needs to be done on the implementation front. Ancillary services are absent in the Indian Electricity Market and there is a need to develop these. ACKNOWLEDGEMENT
Authors are grateful to the power system fraternity and the POWERGRID management for the encouragement. The views expressed in this paper are those of the authors and not necessarily of the organization they belong to. REFERENCES
1. HE Lokay & V Burtnyk, Application of Under Frequency Relays for Automatic Load Shedding, IEEE Trans. on PAS, March 1968.
2. RM Maliszewski, RK Dunlop, GL Wilson, Frequency Actuated Load Shedding and Restoration, Part I – Philosophy, IEEE Trans. on PAS, July/Aug 1971.
3. SH Horowitz, A Politis, AF Grbrielle, Frequency Actuated Load Shedding and Restoration, Part II – Implementation, IEEE Trans. on PAS, July/Aug 1971.

FREQUENCY RESPONSE CHARACTERISTICS OF AN INTERCONNECTED POWER SYSTEM 231
4. JG Siroux, EDF, France, Report on Development of Permanent Parallel Operation of Indian Power Systems (1974).
5. Charles Concordia & S. Ihara, Load Representation in Power System Stability Studies, IEEE Trans. on Power Apparatus and Systems, Vol. PAS-101, No. 4, April 1982.
6. AR Dwarkanath, Under Frequency Trend Relay as Power System Saviour, International Seminar on Grid Stability and Load Management, GRIDSAFE-95,IE(I), 12-14 Jan 1996.
7. SC Misra, SK Banerjee, SK Soonee, SS Barpanda, System Frequency and Its Impact on Network Voltage, National Symposium on Power System Instrumentation and Control, CPRI, Bangalore 26-27 Dec ' 96.
8. Jim Ingelson & Makarand Nagle, Decline In Eastern Interconnection Frequency Response, Fault and Disturbance Conference at Georgia Tech, May 3-4 1999.
9. NERC – Frequency Response Standard White paper – April 6, 2004 10. WECC White Paper – Frequency Response Standard, Reserve Issues Task Force – November 2005 11. NERC Training Document – Understand and Calculate Frequency Response 12. NERC Frequency Response Characteristic Survey Training Document 13. CEA General Review 2006 14. Prabha Kundur, Power System Stability and Control, The EPRI Power System Engineering Series, McGraw
Hill Inc. 15. Maintaining Reliability in a Competitive US Electricity Industry, Final Report of the Task Force on Electric
System Reliability, US Department of Energy, September 29, 1998. 16. Indian Electricity Grid Code, IEGC, December 2005. 17. Procedures for Exchange of Power Plant and Load Data For Synchronous Stability Studies, IEEE Trans. on
PAS, Vol PAS-100, No. 7,July 1981. BIOGRAPHICAL DETAILS OF THE AUTHORS
Sushil Kumar Soonee graduated in Electrical Engineering from the Indian Institute of Technology (IIT), Kharagpur in 1977. He has been actively involved in the evolution and development of regional power grids and entire gamut of integrated system operation in the country. He has been responsible for the successful implementation of ABT mechanism, Short Term Open Access at the inter-state level. He has worked in ERLDC, SRLDC and is presently Executive Director (System Operation & NRLDC).
Samir Chandra Saxena graduated in Electrical Engineering from the Aligarh Muslim University in 1992. He joined Power Grid Corporation of India Ltd as an Engineering Executive Trainee in 1994. From January 1996, he has been working with the Northern Regional Load Dispatch Center (NRLDC), New Delhi. He has been associated with the real time operation of the Northern Regional Grid and SCADA-IT Group at NRLDC.
Copyright © 2022 FDOKUMEN