Revisiting Mu Suppression in Autism Spectrum Disorder
40
Revisiting suppression in Autism Spectrum Disorder 1 Revisiting mu suppression in Autism Spectrum Disorder Guillaume Dumas 1,2,3,4,* , Robert Soussignan 5 , Laurent Hugueville 1,2,3,4 , Jacques Martinerie 1,2,3,4 , Jacqueline Nadel 1,3,4* Affiliations: 1 Université Pierre et Marie Curie-Paris 6, Centre de Recherche de l'Institut du Cerveau et de la Moelle épinière, UMR-S975, Hôpital de La Salpêtrière, Paris, France; 2 INSERM, U975, Paris, France; 3 CNRS, UMR 7225, Paris, France; 4 ICM, Paris, France; 5 Centre des Sciences du Goût et de l'Alimentation, CNRS, UMR 6265, Université de Bourgogne-Inra, Dijon, France; Corresponding authors: Guillaume Dumas, Human Genetics and Cognitive Functions, Institut Pasteur, 75015 Paris, France. Tel.: +33 1 40 61 34 20; Fax: +33 1 40 61 34 21. E-mail address: [email protected] Jacqueline Nadel, E-mail address: [email protected]
Transcript of Revisiting Mu Suppression in Autism Spectrum Disorder
Revisiting ! suppression in Autism Spectrum Disorder
1
Revisiting mu suppression in Autism Spectrum Disorder
Guillaume Dumas1,2,3,4,*, Robert Soussignan5, Laurent Hugueville1,2,3,4, Jacques
Martinerie1,2,3,4, Jacqueline Nadel1,3,4*
Affiliations: 1 Université Pierre et Marie Curie-Paris 6, Centre de Recherche de l'Institut du
Cerveau et de la Moelle épinière, UMR-S975, Hôpital de La Salpêtrière, Paris, France; 2
INSERM, U975, Paris, France; 3 CNRS, UMR 7225, Paris, France; 4 ICM, Paris, France; 5
Centre des Sciences du Goût et de l'Alimentation, CNRS, UMR 6265, Université de
Bourgogne-Inra, Dijon, France;
Corresponding authors:
! Guillaume Dumas, Human Genetics and Cognitive Functions, Institut Pasteur, 75015
Paris, France. Tel.: +33 1 40 61 34 20; Fax: +33 1 40 61 34 21. E-mail address:
! Jacqueline Nadel, E-mail address: [email protected]

Revisiting ! suppression in Autism Spectrum Disorder
2
Abstract
Two aspects of the EEG literature lead us to revisit mu suppression in Autism Spectrum
Disorder (ASD). First and despite the fact that the mu rhythm can be functionally segregated
in two discrete sub-bands, 8-10Hz and 10-12/13Hz, mu-suppression in ASD has been
analyzed as a homogeneous phenomenon covering the 8-13Hz frequency. Second and
although alpha-like activity is usually found across the entire scalp, ASD studies of action
observation have focused on the central electrodes (C3/C4). The present study was aimed at
testing on the whole brain the hypothesis of a functional dissociation of mu and alpha
responses to the observation of human actions in ASD according to bandwidths.
Electroencephalographic (EEG) mu and alpha responses to execution and observation of
hand gestures were recorded on the whole scalp in high functioning subjects with ASD and
typical subjects. When two bandwidths of the alpha-mu 8-13 Hz were distinguished, a
different mu response to observation appeared for subjects with ASD in the upper sub-band
over the sensorimotor cortex, whilst the lower sub-band responded similarly in the two
groups. Source reconstructions demonstrated that this effect was related to a joint mu-
suppression deficit over the occipito-parietal regions and an increase over the frontal regions.
These findings suggest peculiarities in top-down response modulation! in ASD and question
the claim of a global dysfunction of the MNS in autism. This research also advocates for the
use of finer grained analyses at both spatial and spectral levels for future directions in
neurophysiological accounts of autism.
Highlights
A fine-grained spectral and whole brain analysis is proposed. Segregating the alpha-mu rhythm in two sub-bands brings a new piece of evidence. Normal suppression for action observation is evidenced in the lower mu of ASD. Lack of occipito-parietal suppression was found in the upper alpha of ASD. Increase of frontal upper alpha suggests an abnormal top-down response in ASD.
Revisiting ! suppression in Autism Spectrum Disorder
3
Keywords
Mu-suppression, EEG, Autism spectrum disorder, Action observation, Top-down inhibitory
control
Introduction
Social impairments ranging from the simplest form of non-verbal interaction to sophisticated
social cognition are decisive elements for the diagnosis of Autism Spectrum Disorder
(American Psychiatric Association, 2013). The source of poor communication has been
previously searched in psychological deficits of theory of mind (Baron-Cohen et al., 1985),
imitation (Rogers and Pennington, 1991) or emotion sharing (Hobson, 1986). In the last
decade, discovering which brain dysfunctions may account for such impairments has become
a challenging topic for social neuroscience. The first studies used MEG
(MagnetoEencephaloGraphy) to explore the activity of the MNS in Autism Spectrum
Disorder (Avikainen et al., 1999; Nishitani et al., 2004). Then followed EEG and fMRI
studies. A busy field of research explores the hypothesis that mirror neurons are ‘broken” in
persons with Autism Spectrum Disorder (ASD) Within this framework, fMRI studies started
to compare the activation of the frontoparietal circuit during observation and action: should
the mirror neurons be broken, action observation would then not cause the same firing effects
as action execution (Gallese et al., 2009; Iacoboni and Dapretto, 2006; Rizzolatti et al., 2009;
Williams et al., 2006).. This would impede self-other mapping and understanding of others’
action goals thus leading to imitation and interaction deficits (Gallese, Rochat, & Berchio,
2012; Dapretto & Iacobini, 2006; Oberman and Ramachandran, 2007; Williams et al., 2001).
Revisiting ! suppression in Autism Spectrum Disorder
4
Hamilton’s (2013) meta-analysis demonstrates, however, that neuroimaging studies are far
from providing clear support to this hypothesis. For instance, while several fMRI studies
have reported weaker responses of the mirror neuron system (MNS) in ASD persons
compared with typical controls during action observation and gestural imitation (Williams et
al, 2006) or facial imitation (Dapretto et al., 2005), they are challenged by more recent
studies that did not find such differences in emotional tasks (Bastiaansen et al., 2011; Grèzes
et al., 2009; Schulte-Rütter et al., 2011) or imitation tasks (Dinstein et al. 2010; Marsh and
Hamilton, 2011). It is worth stressing that the fMRI studies use heterogeneous methodology
(see Rizzolatti and Sinigaglia, 2010, for a discussion of the methodology used) and
procedures that are not supposed to tap only on MNS regions: for instance observing facial
expressions would involve amygdala response while observing hand gestures would not.
EEG studies examine the same hypothesis with a focus on rolandic rhythm also called mu
rhythm. Indeed mu rhythm, recorded over the sensorimotor cortex at a frequency range
varying from 7-11 Hz for some authors (Willemse, 2010; Lachat et al., 2012) to 8-13 Hz for
others (Pineda, 2005), is suppressed during both execution and observation of action. It has
been suggested that mu suppression is an index of MNS recruitment and reflects
downstream modulation of motor cortex by prefrontal mirror neurons (Cochin et al., 2001;
Muthukumaraswamy et al., 2004; Oberman et al., 2005; Pineda, 2005). However, Arnstein
and colleagues have provided a more restricted picture of the links between EEG and fMRI–
BOLD signals. By recording simultaneously the two neuroimaging signals during action
execution and observation, they have shown that inferior parietal, dorsal premotor and
primary somatosensory cortices are directly involved in mu suppression while Brodmann
(BA) 44 area is only indirectly correlated with mu modulation (Arnstein et al., 2011). In this
line, a study of the effects of brain damage on action execution and observation has revealed
that the magnitude of mu suppression correlated significantly with lesion extent in right

Revisiting ! suppression in Autism Spectrum Disorder
5
parietal regions but not in the inferior frontal gyrus (IFG) (Frenkel-Toledo et al., 2014). The
results of these two studies suggest that mirror neurons in BA44 are not the prime source of
mu suppression; however, transcranial magnetic stimulation (TMS) studies found the IFG
involved in perception-action coupling during the perception of biological and non biological
actions (Newman-Norlund et al., 2010; Keuken et al., 2011). Therefore, further research is
needed to clarify conflicting results in studies testing the broken mirror hypothesis with
different techniques. Moreover, from seven EEG studies using Oberman design of execution
and observation of hand movements, four reported an absence of mu suppression (Bernier et
al., 2007; Oberman et al., 2005; Oberman et al., 2007; Oberman et al., 2008 though limited to
gestures of unfamiliar persons), while three others found no significant differences between
action execution and observation (Bernier et al., 2013 for hand movements but not facial
movements (Fan et al., 2010; Raymaekers et al., 2009). Studies of children with ASD show
the same inconsistencies (Martineau et al., 2008 find no mu suppression during action
observation while Ruysschaert et al., 2014 find similar central mu suppression in ASD and
typical children). !
Such conflicting EEG and fMRI evidence of a dysfunctioning MNS in autism lead several
social neuroscientists to move beyond mirror neurons in our understanding of the social brain
and to explore the hypothesis of a complementary role of the Mentalizing System (or TOM
system). For example, Uddin and colleagues (2007) have suggested that the MST would
enable physical simulation of actions and action goals, while the mentalizing system
(including Cortical Midline Structures and Temporo-Parietal Junction) would allow
simulation of mental states or evaluative simulation. Our Psycho Physiological Interaction
(PPI) analysis has revealed a significant functional coupling of the MNS with the mentalizing
system during imitative interaction (Sperduti, Guionnet, Fossati & Nadel, 2014). As regards
EEG studies, Pineda and Hecht (2009) have looked at mu suppression during two kinds of
Revisiting ! suppression in Autism Spectrum Disorder
6
ToM tasks and found mu insensitive to incorrect social cognitive inferences; they concluded
that additional mechanisms are needed to make mental attributions of intentions. A way to
take into account this conclusion is to change a focus limited until now to central electrodes
and to look at different functions of the alpha-mu rhythm according to distinct bandwidths.
In favor of a change in focus, it is worth considering that EEG studies have restricted their
exploration of the 8-13 Hz rhythm modulation to the sensorimotor regions (i.e., mu rhythms),
whereas research in neurotypical subjects has shown that observational tasks produce
changes in 8-13 Hz oscillations over scalp regions other than the central regions (i.e., alpha
rhythms). In particular, alpha suppression to visual stimuli may reflect cortical activation
whereas alpha power increase may reflect inhibitory and top-down regulatory processes (e.g.,
Bazanova and Vernon, 2014; Cooper et al., 2003; Klimesch et al., 2007; Klimesh, 2012;
Perry et al., 2011). Based on these studies and recent reviews (Bazanova and Vernon, 2014;
Hamilton, 2013), we argue that a EEG whole-brain approach focusing on both alpha and mu
rhythms may be relevant to explore whether MNS functioning and top-down response
modulation during action observation is impaired in ASD. A whole-brain approach would
allow us to move beyond MNS in our understanding of the social brain. Indeed, neuroscience
research has provided strong evidence of poorer performance in attention and inhibition tasks
in ASD persons underlain by a frontoparietal network dysfunction (Chan et al., 2011;
Murphy et al., 2014; Vara et al., 2014).
A second change in focus would follow the recent emphasis on the distinction between
discrete frequency ranges (8–10 Hz or 10–12 Hz) to account for functional dissociations
within mu and alpha bands (Bazanova and Vernon, 2013; Fink et al., 2005; Frenkel-Toledo et
al., 2013, 2014; Pfurtscheller et al., 2000). Bazanova and Vernon (2013) concluded their
review on EEG alpha activity by indicating that the human alpha rhythm represents at least
two simultaneously occurring though functionally different processes: a lower alpha (or alpha
Revisiting ! suppression in Autism Spectrum Disorder
7
1, 8-10 Hz) and an upper alpha bandwidth (or alpha 2, 10-12/13 Hz). On the one hand, there
is evidence that action observation elicited greater mu suppression in the lower band (8-10
Hz) compared to the higher mu range (10–12Hz) (Frenkel-Toledo et al., 2013), and that
focal brain damages in areas of the human MNS (the right inferior parietal cortex) reduced
the magnitude of suppression of the lower (8-10 Hz) but not the upper (10-12 Hz) mu range
(Frenkel-Toledo et al., 2014). On the other hand, EEG-fMRI studies confirmed this
segregation, demonstrating a correlation between BOLD signal and alpha activity (Knyazev
et al., 2011; Laufs et al., 2003), especially in the upper alpha band (Laufs et al., 2006). The
correlated brain regions engaged the frontoparietal network (Sadaghiani et al. 2012),
associated with many cognitive processes (Molnar-Szakacs and Uddin, 2013). For instance,
EEG alpha power in the upper band (10–12 Hz) was more sensitive than the lower band (8–
10 Hz) in the frontal cortex to cognitive interventions (Fink et al., 2011; Klimesch, 1999) and
to neurofeedback training (Zoefel et al., 2011). Interestingly, Pineda et al. (2008) reported in
a seminal neurofeedback study with ASD children that training focusing on the upper mu
band (C3/C4, 10–13 Hz) gave better outcome compared with the lower mu band (8–10Hz) or
large mu band (8–13Hz). The upper alpha frequency band was also sensitive to self-
monitoring during social interaction (Naeem et al., 2012; Tognoli et al., 2007), and top-down
inhibitory control (Klimesch, 2012). In particular, an increase in upper alpha activity is
thought to represent inhibition of non-relevant information (Bailey et al., 2014; Klimesh et
al., 2007; Klimesch, 2012).
We synthesized the above-reported series of results and hypothesized that ASD response to
observation may differ from that of typical individuals for the upper alpha/mu band only, as
this bandwidth is related to sociocognitive processes. More precisely, we hypothesized that
typical (TYP) and ASD participants would show mu suppression in the sensorimotor areas
(C3/C4 scalp positions) for the lower sub-band during both execution and observation of
Revisiting ! suppression in Autism Spectrum Disorder
8
hand movement, whereas ASD would show a lack of suppression in the upper sub-band.
Adopting a full-scalp EEG analysis, we tested whether alpha/mu activity in the fronto-
parietal regions would differentiate ASD from TYP participants. Indeed alpha/mu modulation
in the fronto-parietal regions is seen as indexing self-monitoring and top-down inhibitory
control, considered as impaired in ASD.
To explore this hypothesis, the current study aimed at disentangling the functional role of the
two alpha and mu sub-bands and to investigate whether these sub-bands discriminate ASD
responses from neurotypical ones for distinct scalp regions. EEG recordings were compared
in ASD and neurotypical groups across rest, passive observation of action, and execution of
action. A full scalp analysis of the alpha-mu activity was carried, including the large band of
8-13Hz as the two sub-bands related to lower (8-10Hz) and upper (11-13Hz) alpha/mu.
Cortical sources were provided for more precise interpretation of the recordings at the scalp
level.
In our view the hypothesis of a functional dissociation of bandwidths may account for
conflicting results concerning mu responses in ASD. Because it has been hypothesized that
the activity of the presumed human MNS seems more evident in the lower mu range
(Frenkel-Toledo et al., 2013; 2014), we tested whether typical (TYP) and ASD participants
showed distinct mu suppression in the sensorimotor areas (C3/C4 scalp positions) for the
lower sub-band during both execution and observation of hand movement. Further, by
adopting a full-scalp EEG analysis, we also tested whether alpha activity in the occipital and
frontoparietal regions would differentiate ASD from TYP participants since alpha modulation
in these regions may index self-monitoring and top-down inhibitory control, two capacities
considered as impaired in ASD.
2. Results
Revisiting ! suppression in Autism Spectrum Disorder
9
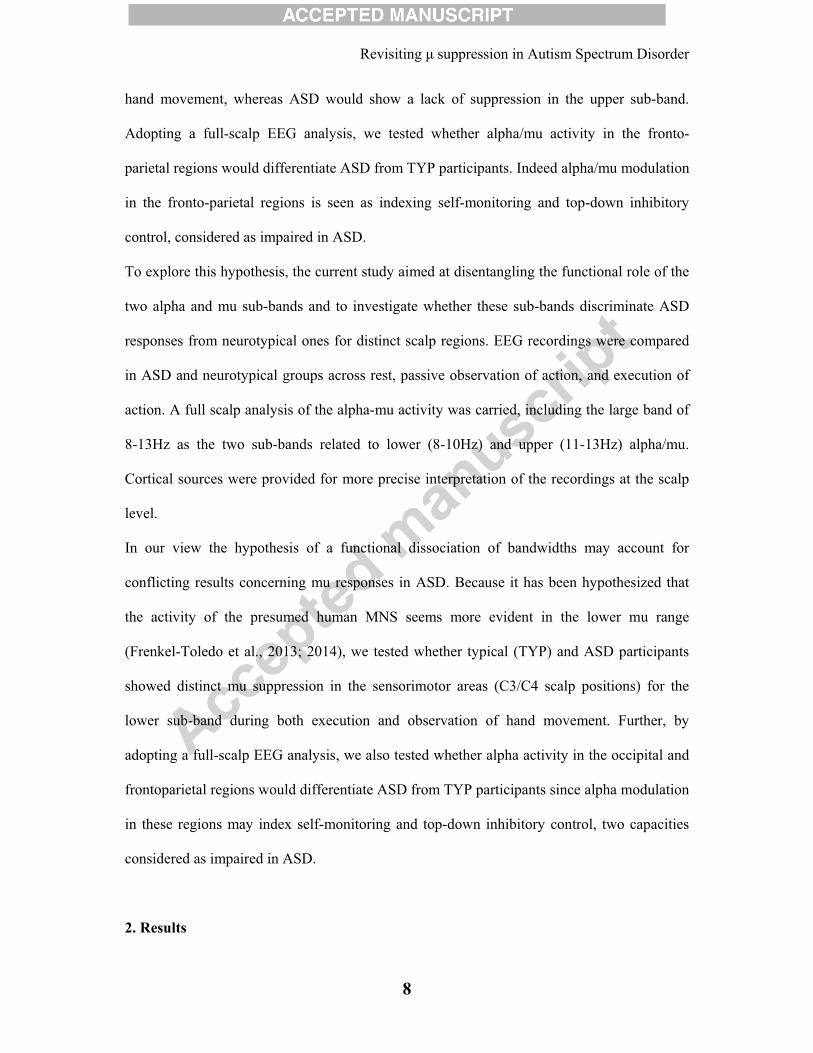
2.1. Mu power suppression over central electrodes
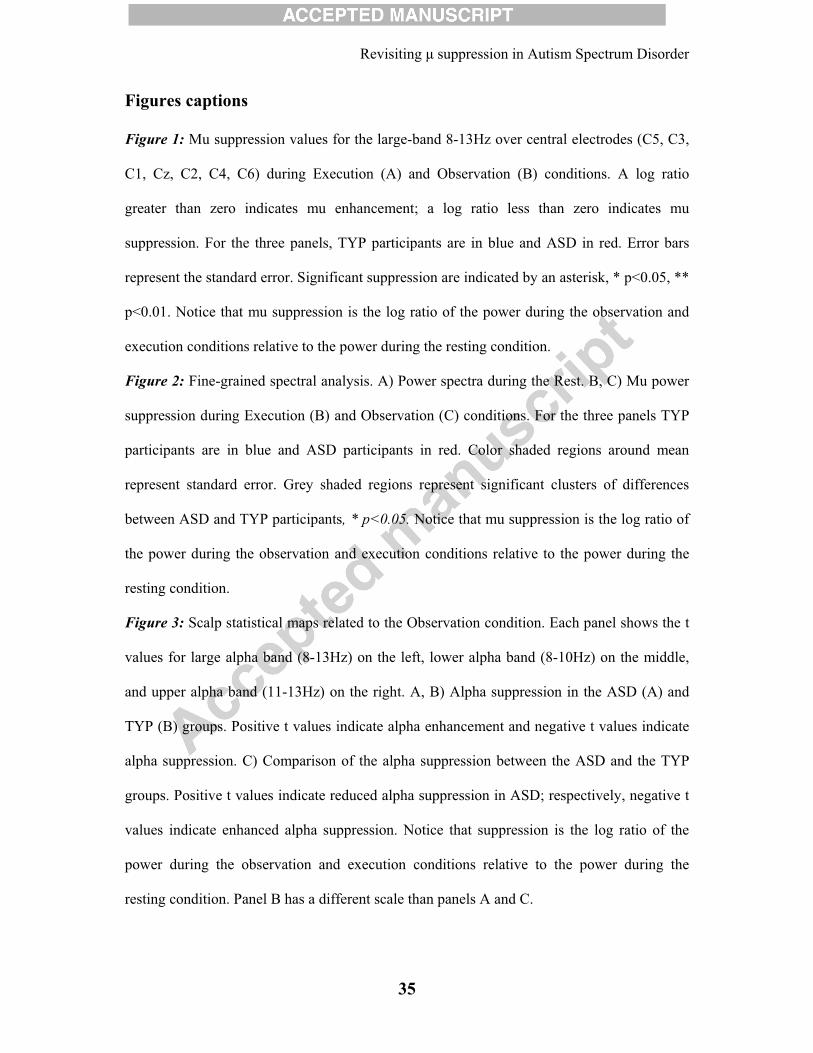
The analysis of the large mu band (8-13Hz) for the central electrodes revealed that both TYP
and ASD participants exhibited statistically significant mu suppression over all electrodes
during action execution (p<0.01; see Fig. 1, panel A). By contrast, only the TYP group
exhibited a statistically significant mu suppression over the C5, C3, C4, C6 (p<0.01) and C1,
C2 (p<0.05) electrodes during the observation of hand gestures, (See Fig. 1, panel B).
Because of age differences between the ASD and TYP groups, we verified whether mu
suppression was related to age of participants. We did not find any significant correlation of
mu-suppression magnitude with age in both ASD and TYP groups (all ps > .05).
[Insert Figure 1 here]
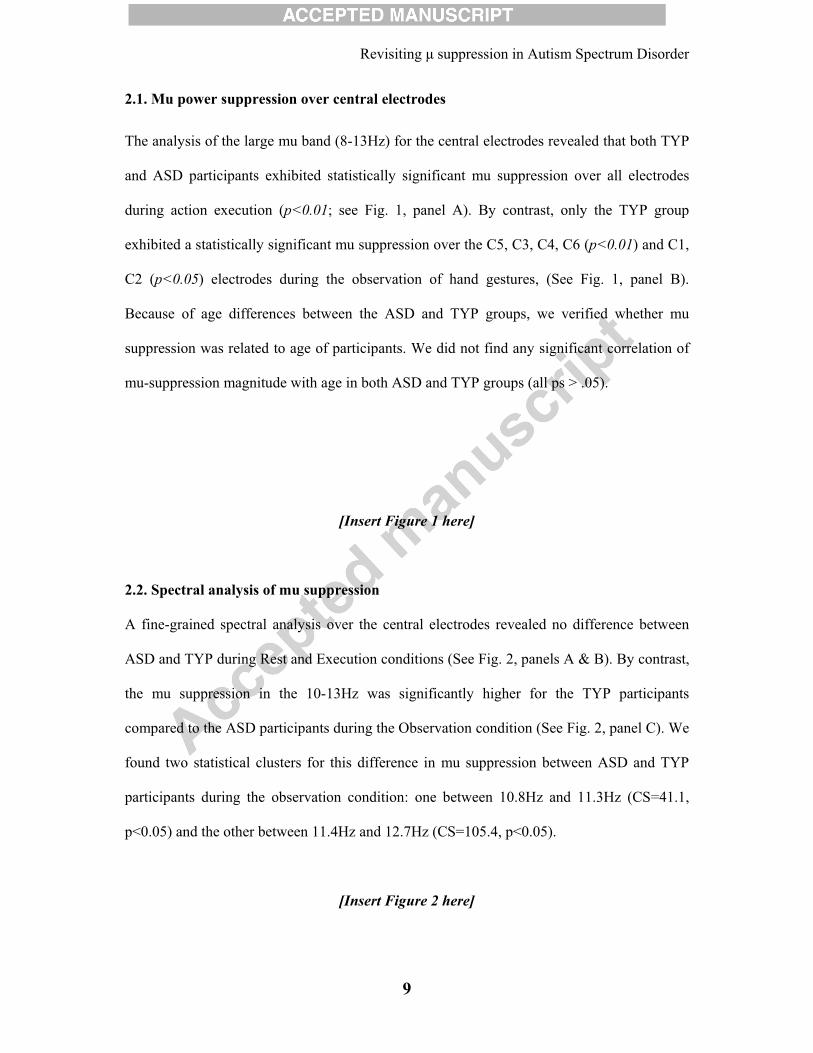
2.2. Spectral analysis of mu suppression
A fine-grained spectral analysis over the central electrodes revealed no difference between
ASD and TYP during Rest and Execution conditions (See Fig. 2, panels A & B). By contrast,
the mu suppression in the 10-13Hz was significantly higher for the TYP participants
compared to the ASD participants during the Observation condition (See Fig. 2, panel C). We
found two statistical clusters for this difference in mu suppression between ASD and TYP
participants during the observation condition: one between 10.8Hz and 11.3Hz (CS=41.1,
p<0.05) and the other between 11.4Hz and 12.7Hz (CS=105.4, p<0.05).
[Insert Figure 2 here]
Revisiting ! suppression in Autism Spectrum Disorder
10
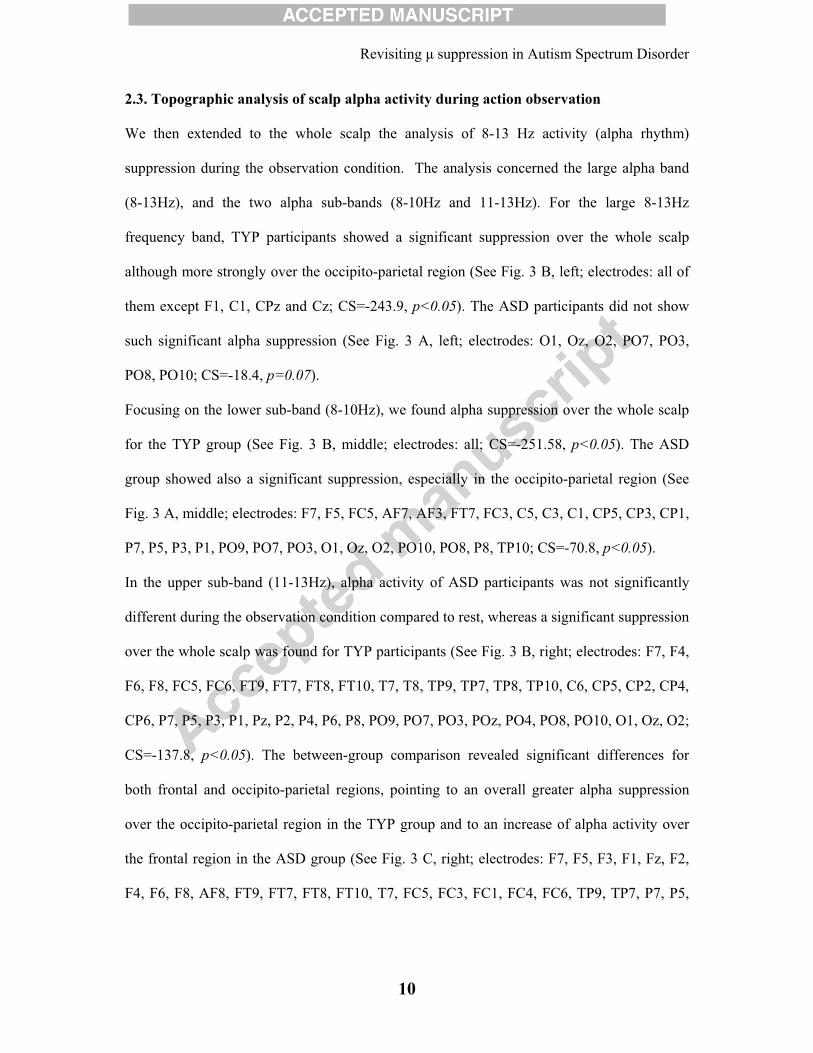
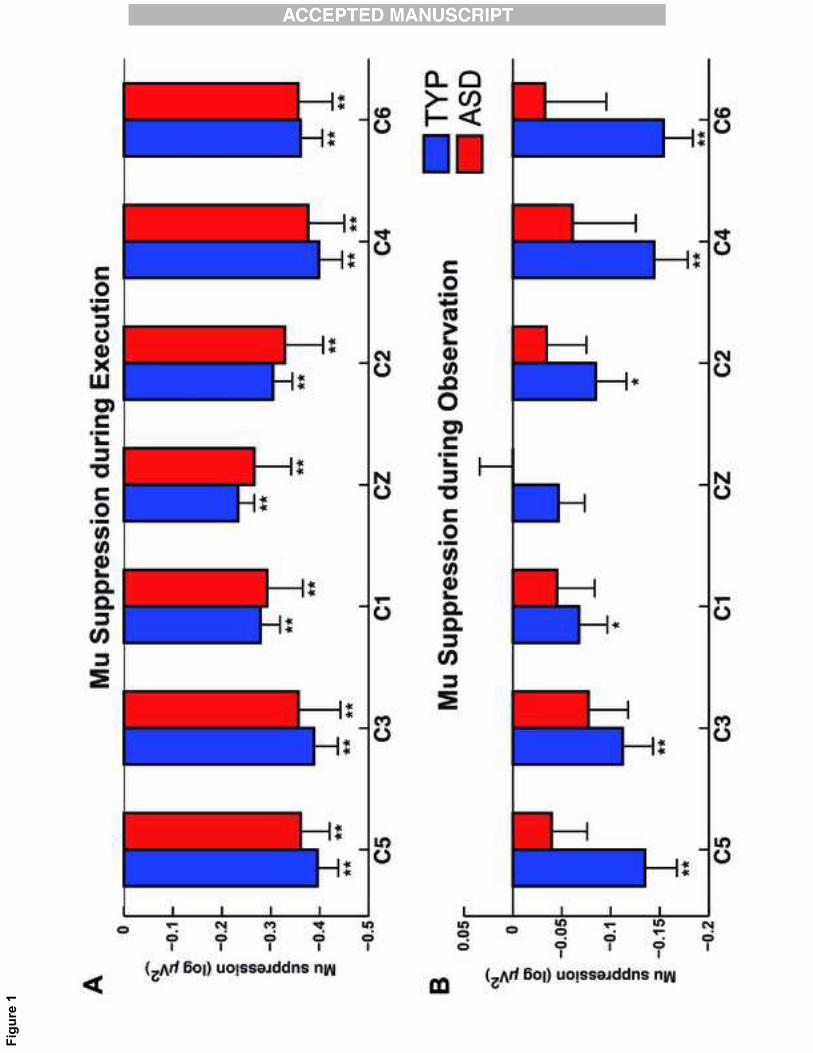
2.3. Topographic analysis of scalp alpha activity during action observation
We then extended to the whole scalp the analysis of 8-13 Hz activity (alpha rhythm)
suppression during the observation condition. The analysis concerned the large alpha band
(8-13Hz), and the two alpha sub-bands (8-10Hz and 11-13Hz). For the large 8-13Hz
frequency band, TYP participants showed a significant suppression over the whole scalp
although more strongly over the occipito-parietal region (See Fig. 3 B, left; electrodes: all of
them except F1, C1, CPz and Cz; CS=-243.9, p<0.05). The ASD participants did not show
such significant alpha suppression (See Fig. 3 A, left; electrodes: O1, Oz, O2, PO7, PO3,
PO8, PO10; CS=-18.4, p=0.07).
Focusing on the lower sub-band (8-10Hz), we found alpha suppression over the whole scalp
for the TYP group (See Fig. 3 B, middle; electrodes: all; CS=-251.58, p<0.05). The ASD
group showed also a significant suppression, especially in the occipito-parietal region (See
Fig. 3 A, middle; electrodes: F7, F5, FC5, AF7, AF3, FT7, FC3, C5, C3, C1, CP5, CP3, CP1,
P7, P5, P3, P1, PO9, PO7, PO3, O1, Oz, O2, PO10, PO8, P8, TP10; CS=-70.8, p<0.05).
In the upper sub-band (11-13Hz), alpha activity of ASD participants was not significantly
different during the observation condition compared to rest, whereas a significant suppression
over the whole scalp was found for TYP participants (See Fig. 3 B, right; electrodes: F7, F4,
F6, F8, FC5, FC6, FT9, FT7, FT8, FT10, T7, T8, TP9, TP7, TP8, TP10, C6, CP5, CP2, CP4,
CP6, P7, P5, P3, P1, Pz, P2, P4, P6, P8, PO9, PO7, PO3, POz, PO4, PO8, PO10, O1, Oz, O2;
CS=-137.8, p<0.05). The between-group comparison revealed significant differences for
both frontal and occipito-parietal regions, pointing to an overall greater alpha suppression
over the occipito-parietal region in the TYP group and to an increase of alpha activity over
the frontal region in the ASD group (See Fig. 3 C, right; electrodes: F7, F5, F3, F1, Fz, F2,
F4, F6, F8, AF8, FT9, FT7, FT8, FT10, T7, FC5, FC3, FC1, FC4, FC6, TP9, TP7, P7, P5,
Revisiting ! suppression in Autism Spectrum Disorder
11
FC2, C5, C2, C4, CPz, CP2, CP4, P1, Pz, P2, P4, P6, P8, PO9, PO7, PO3, POz, PO4, PO8,
PO10; CS=118.3, p<0.05).
[Insert Figure 3 here]
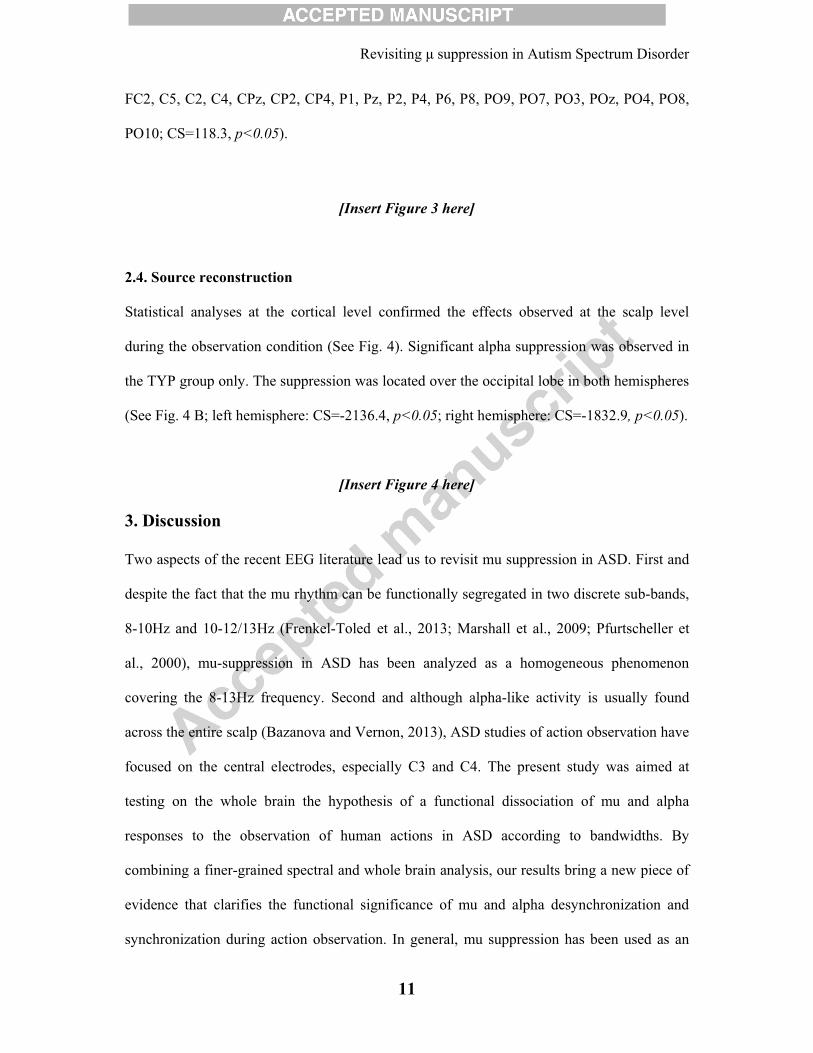
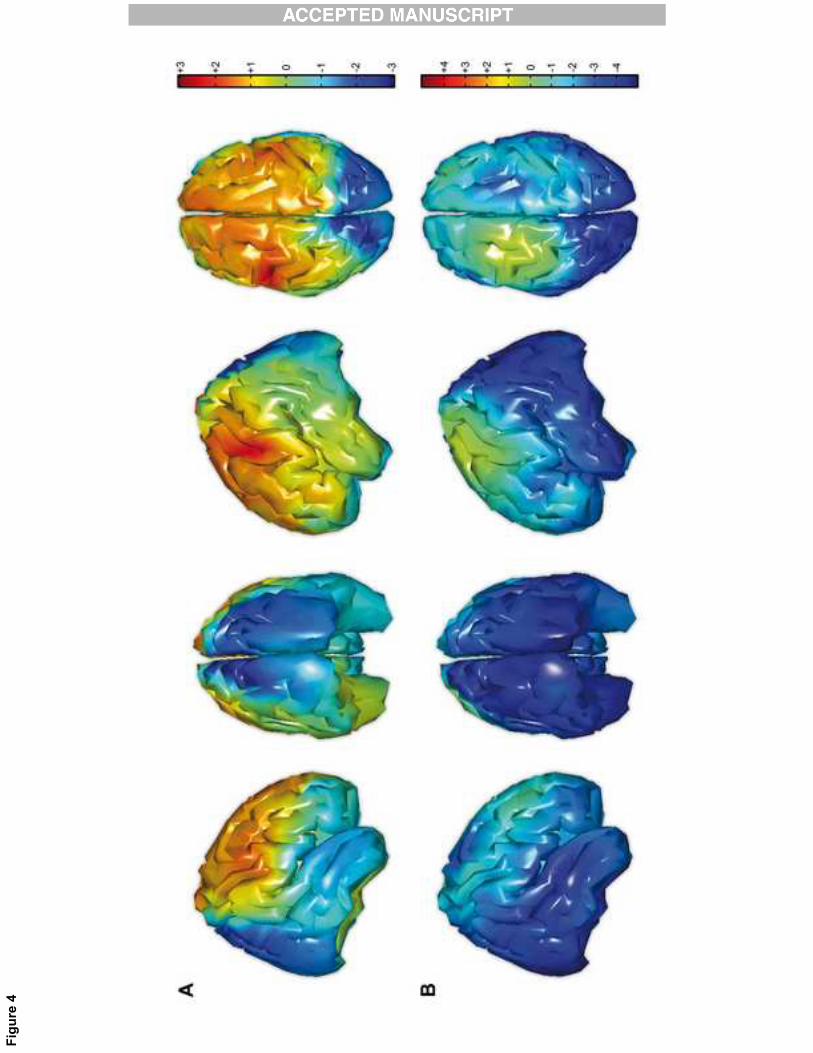
2.4. Source reconstruction
Statistical analyses at the cortical level confirmed the effects observed at the scalp level
during the observation condition (See Fig. 4). Significant alpha suppression was observed in
the TYP group only. The suppression was located over the occipital lobe in both hemispheres
(See Fig. 4 B; left hemisphere: CS=-2136.4, p<0.05; right hemisphere: CS=-1832.9, p<0.05).
[Insert Figure 4 here]
3. Discussion
Two aspects of the recent EEG literature lead us to revisit mu suppression in ASD. First and
despite the fact that the mu rhythm can be functionally segregated in two discrete sub-bands,
8-10Hz and 10-12/13Hz (Frenkel-Toled et al., 2013; Marshall et al., 2009; Pfurtscheller et
al., 2000), mu-suppression in ASD has been analyzed as a homogeneous phenomenon
covering the 8-13Hz frequency. Second and although alpha-like activity is usually found
across the entire scalp (Bazanova and Vernon, 2013), ASD studies of action observation have
focused on the central electrodes, especially C3 and C4. The present study was aimed at
testing on the whole brain the hypothesis of a functional dissociation of mu and alpha
responses to the observation of human actions in ASD according to bandwidths. By
combining a finer-grained spectral and whole brain analysis, our results bring a new piece of
evidence that clarifies the functional significance of mu and alpha desynchronization and
synchronization during action observation. In general, mu suppression has been used as an

Revisiting ! suppression in Autism Spectrum Disorder
12
index of perception–action coupling involving the MNS (Hari, 2006; Muthukumaraswamy et
al., 2004; Pineda, 2005). The lack of mu modulation during action observation in individuals
with ASD has been typically interpreted as indexing a dysfunction of simulation networks
such as the MNS (Bernier et al., 2007; Oberman et al., 2005; Oberman and Ramachandran,
2007), thus corroborating the ‘broken mirror’ theory supported by prior fMRI results
(Dapretto et al; 2005; Williams et al., 2001; Williams et al., 2006). Other EEG studies did not
find such mu dysfunction (Raymaekers et al., 2009; Fan et al., 2010). Our own analyses
suggest a more complex picture. When the large 8-13 Hz frequency band was concerned and
the analysis was limited to C3/C4 electrodes, our results replicated an altered mu modulation
during action observation in ASD participants. However, the segregation of the mu band into
two sub-bands revealed a normal response of the lower mu sub-band, in contrast with an
abnormal response of the mu sub-band. Whole-brain and source level analyses showed that
this altered mu modulation was related to a joint implication of an alpha suppression deficit
over the occipito-parietal regions and an abnormal increase of alpha activity over the frontal
regions in ASD individuals. How should this complex result be interpreted?
Studies have shown that action observation elicited greater mu suppression in the lower (8–
10Hz) compared to the higher range (10–12Hz) in healthy subjects (Frenkel-Toledo et al.
2013), and that focal lesions in the right inferior parietal lobule (a MNS area) reduced the
magnitude of mu suppression in the lower range but not the upper range (Frenkel-Toledo et
al., 2014). Thus, mu suppression in the low frequency range could be a more reliable
electrophysiological marker of human MNS than the whole frequency range. In this
perspective our data showing similar mu suppression in the lower subband in ASD and TYP
participants might reflect the fact that the MNS was functionally preserved in our ASD
participants. Although further studies are required with larger samples of ASD participants,
our data are consistent with findings showing no difference in mu suppression between ASD
Revisiting ! suppression in Autism Spectrum Disorder
13
and TYP groups (Bernier et al., 2013; Fan et al., 2010; Raymaekers et al., 2009). The
discrepancy between other studies might reflect symptom heterogeneity of ASD and
methodological differences (e.g., familiarity and complexity of actions) (Fan et al., 2010;
Obermann et al., 2008) and the use of a large mu range that likely obscures important neural
differences between the lower and higher parts of this range (see Frenkel-Toledo et al., 2013).
Second, an increase in the upper alpha amplitude (synchronization) has been associated with
executive control (e.g., inhibitory process) and self-monitoring (Bazanova and Vernon, 2013;
Jann et al., 2009; Klimesch et al., 2007; Laufs et al., 2003). According to the neural
efficiency hypothesis, a greater level of upper alpha amplitude over sensorimotor regions and
frontal areas in attentional tasks may reflect a top-down inhibition of task-irrelevant cortical
areas or of potential interfering processes (Bazanova and Vernon, 2013; Cooper et al., 2003;
Klimesch et al., 2007; 2012). For instance, a significant increase of 11-13 Hz oscillatory
activity over sensorimotor areas was evidenced when subjects withhold the execution of a
response (Hummel et al., 2002; Klimesch et al., 2007). In the same line, an fMRI study has
demonstrated an enhanced frontal activation in subjects with ASD during motor inhibition
and tasks requiring the inhibition of a cognitive interference (Schmitz et al., 2006). This
finding suggests an increased effort to inhibit motor responses and an abnormal functioning
of some brain regions involved in executive functions in ASD.
In addition to an increase of the upper alpha/mu in the frontal regions, our group of adults
with ASD showed an absence of alpha suppression in the occipito-parietal regions. How
should this phenomenon be explained? Human EEG studies and multiunit activity recorded
in macaque monkeys have provided evidence that alpha activity decreases in occipito-parietal
regions during tasks requiring attention focused on external stimuli (Bollimunta et al., 2011;
Konvalinka at al., 2014; Lachat et al., 2012; Palva & Palva, 2007). This alpha suppression
has been interpreted as a functional correlate of cortical activation and active information

Revisiting ! suppression in Autism Spectrum Disorder
14
processing (Klimesch et al., 2007; Rajagovindan and Ding, 2010; Romei et al., 2008). Given
that action observation involves simultaneously an activation of relevant cortical regions and
an active inhibition of task-irrelevant cortical regions, the lack of alpha suppression over the
occipito-parietal regions and the increase of alpha activity over the frontal regions during
action observation in ASD individuals might account for an inappropriate top-down response
modulation. Our results among others cited above support a model in which visuomotor
mapping is not just a direct matching but is subject to a top-down control and a selection of
actions based on an evaluation of the current context (Hamilton, 2013; Sperduti et al., 2014;
Wang and Hamilton, 2012). The fact that neurofeedback training can help normalize mu
modulation in the upper mu band (Pineda et al., 2008) brings an interesting support to this
top-down model at a functional level.
To conclude, we have shown that a whole brain analysis combined with a segregation of the
8-13 Hz alpha/mu band into two sub-bands reveal mixed results of normal (in the lower mu
frequency band) and abnormal increase in the higher alpha frequency band during action
observation in adults with ASD, in contrast with normal responses to action execution. Our
findings suggest that the MNS might be functionally preserved in our sample of ASD, but
that brain anomalies in top-down modulatory responses might be present during action
observation. Further research is needed to analyze in more details how visual attention and
motor inhibition are coordinated in ASD. Abnormal connectivity has been observed in ASD
at the functional level (Coben et al., 2008; Khan et al. 2013; Murias et al., 2007) and at the
structural level (McAlonan et al., 2005; Ecker et al., 2010; Hyde et al., 2010). For instance,
Just and colleagues posit that under-connectivity between prefrontal and posterior areas may
be a valid explanation of autism (Just et al. 2012), due to a lower frontal-posterior
communication bandwidth, which reduces top-down influences. In line with this model, the
peculiarities in ASD top-down modulation of action observation suggested by our study pave
Revisiting ! suppression in Autism Spectrum Disorder
15
the way for further research concerning neurophysiological accounts of executive functions
during attentional tasks in Autism Spectrum Disorder.
Revisiting ! suppression in Autism Spectrum Disorder
16
4. Method
4.1. Participants
Ten high-functioning adults with Autism Spectrum Disorder (7 males, 3 females; M"age ±
SD =33.9±6.2 years; range=21-41 years) and thirty typical adults (14 males, 16 females; M
age ± SD =28.7±5.2 years; range=20-39 years) participated in the study. All subjects had
normal or corrected-to-normal vision. They were right-handed (except one individual in the
ASD group). All were volunteers and had given their written informed consent according to
the Declaration of Helsinki. The institutional ethical review board for Biomedical Research
of the Hospital approved the experimental protocol (agreement #104-10).
The diagnosis of high functioning ASD was established by psychiatrists and neuro-
psychologists with the DSM-IV-R (American Psychiatric Association, 2002), the Autism
Diagnostic Interview-Revised (ADI-R; Lord et al., 1994), the Autism Diagnostic Observation
Schedule-Generic (ADOS-G; Lord et al., 2000) module 4 (mean Social-communication score
=10.8, SD=5.77), and expert clinical evaluation. None of the ASD participants had associated
neuropsychiatric or neurological disorder. None was under any drug or /and intervention
program or participating to another experiment during the study. They were 4 students with at
least 3 years of university training, and 6 accomplished professionals with high-level
specialty as graphic teacher, archivist, librarian, psychotherapist, engineer and computer
programmer. None of the neurotypical participants reported a history of psychiatric or
neurological disease. The control group was composed of students with at least 3 years of
university training. The two groups were therefore comparable as far as academic
achievement is concerned.
This paper presents the intra-individual results of a broader study using a dual EEG
hyperscanning platform to acquire inter-individual data from 10 mixed dyads composed of an
adult with ASD and a typical adult, and 10 dyads of typical adults.
Revisiting ! suppression in Autism Spectrum Disorder
17
We briefly summarize the design, which is fully described in previous papers with typical
individuals (Dumas et al., 2010; Dumas et al., 2012a).
4.2. Dual-Video acquisition
The experiment was conducted in three connected laboratory rooms, one for each
participant and the third one for the computerized monitoring of the experiment. The
participants were comfortably seated, their forearms resting on a small table in order to
prevent arms and neck movements. They faced a 21-in. TV screen. Two synchronized digital
video cameras filmed the hand gestures. A LED light controlled manually, via a switch, by
an experimenter located in the recording room, signaled the session start. The output of the
video records was transmitted to two TV monitors installed in the recording room allowing
the experimenter to control that participants followed the requested instructions.
4.3. EEG acquisition
The neural activities of participants were recorded with a Brain Products (Germany) EEG
recording system. It was composed of an Acticap helmet with 64 active electrodes arranged
according to the international 10/20 system. The helmet was aligned to nasion, inion and left
and right pre-auricular points. A 3-dimensional Polhemus digitizer was used to record the
position of all electrodes and fiducial landmarks (nasion and pre-auricular points). The
ground electrode was placed on the right shoulder of the subjects and the reference was fixed
on the nasion. The impedances were maintained below 10 k". Data acquisition was
performed using two 64-channels Brainamp MR amplifiers from the Brain Products
Company (Germany). Signals were analog filtered between 0.16 Hz and 250 Hz, amplified
and digitalized at 500 Hz with a 16-bit vertical resolution in the range of ±3.2 mV.
4.4. Procedure
The experimental protocol was divided into three blocks separated by a 10 min rest. Each
block comprised three runs of 2 min. A run was composed of three conditions: an observation
Revisiting ! suppression in Autism Spectrum Disorder
18
of a prerecorded library of 20 meaningless hand gestures (Observation phase, total duration:
6 min), a spontaneous imitation episode where the subjects were told that they could at will
either produce hand gestures of their own or imitate the other’s hand gestures (Spontaneous
Imitation), and an episode where the subjects were asked to imitate a prerecorded video
(Video Imitation). Each run started by a 30 sec period with no view no-movement (Resting
State, total duration: 4.30 min). Before each imitation condition, the subjects were asked to
produce a 30 sec of meaningless hand gestures (Execution phase, total duration: 3 min).
At the end, a short block of calibration comprised periods of blinks, jaws contraction, and
head movements of 30 sec each. All conditions were presented in a fixed order for group
comparison.
4.5. Data analyses
4.5.1. EEG Artifacts
Blink, muscles and head movements artifacts were filtered by optimal projection (FOP)
methodology (Boudet et al., 2007). EEG signals were then controlled visually another time.
The few remaining artifacts (<0.1% of the data, no difference between the two groups) were
excluded from the analysis and we smoothed the joints by a convolution with a half-Hanning
window of 400 ms in order to avoid border artifacts induced by the suppression.
4.5.2. Electroencephalography
Instead of using selected large frequency bands, we have covered the whole spectrum (0-
48Hz) with 1Hz frequency bins, which accounts at best for the variability in frequency
distributions across subjects. Following corrections, EEG data were re-referenced to a
common average reference (CAR). Then a Fast Fourier Transform (FFT) was applied on 2s
sliding windows, smoothed by Hanning weighting function half-overlapping across the whole
trials to control for artifacts resulting from data splicing.
Revisiting ! suppression in Autism Spectrum Disorder
19
Instead of restricting our analysis of the mu rhythm over C3 and C4 electrodes (Oberman et
al., 2005; Pineda, 2005), we first analyzed it over a larger area of the primary sensorimotor
cortex covering the left central (C5, C3, C1) and right central (C2, C4, C6) positions from the
vertex point (Cz) (Kaiser et al., 2003; McFarland et al., 2000). The mu rhythm was defined as
the frequency band ranging from 8–13 Hz topographically centered over the electrodes
located at these locations. We split this large frequency band into two sub-bands: the lower
and the upper alpha-mu, respectively defined between 8-10Hz and 11-13Hz frequency
ranges.
Mu suppression was calculated taking the ratio of the power during the observation and
execution conditions relative to the power during the resting condition. This was done for all
frequency bins separately in the case of the analyses along the spectral dimension. This ratio
is used to control for variability in absolute mu power as a result of individual differences
such as scalp thickness and electrode impedance. Since ratio data are inherently non-normal
as a result of lower bounding, a log transform was used for analysis (Leocani et al., 1997;
Pfurtscheller and Berghold, 1989). A log ratio of less than zero indicates suppression whereas
a value of zero indicates no suppression and values greater than zero indicate enhancement.
Then, we conducted a spectral analysis, which consists in a fine-grained comparison of power
and power-suppression across each frequency bin, without averaging over a large band.
Finally, a third analysis focused on the spatial structure of power suppression at the scalp
level for the three frequency bands: 8-13Hz, 8-10Hz and 11-13Hz. This analysis covered the
whole scalp, thus integrating also the electrodes over the occipital, temporal, parietal and
frontal regions.
4.5.3. Source reconstruction
Source reconstruction was performed with the free open-source application Brainstorm
(http://neuroimage.usc.edu/brainstorm; Tadel et al. 2011). Sensors were registered for each
Revisiting ! suppression in Autism Spectrum Disorder
20
subject using the fiducial landmark and projection on the scalp surface of the standard
Montreal Neurological Institute (MNI) template space (Colin27) (Holmes et al., 1998). The
lead field was then computed using the overlapping spheres algorithm (Huang et al., 1999)
with a cortical surface tessellated with 4000 vertices. We took the identity matrix for noise
covariance since later analyses integrate the resting state condition. The inverse solution was
calculated for each individual using Tikhonov-regularized minimum-norm estimates (Baillet
et al., 2001). We calculated source activity in each frequency bin and condition, and then
derived the log-ratio for mu-suppression.
4.5.4. Statistics
To correct for multiple comparisons, significant differences were established for all contrasts
using a non-parametric cluster randomization test across spatial and spectral domains (Maris
and Oostenveld, 2007; Maris et al., 2007; Nichols and Holmes, 2002). This test effectively
controls the false discovery rate in situations involving multiple comparisons by clustering
neighboring quantities that exhibit the same effect. The neighborhood was unvaried across
space (adjacent electrode over the scalp) or frequencies (side-by-side frequency bins). The
permutation method provides values whose t statistics exceed a given critical value when
comparing two conditions value by value. In order to correct for multiple comparisons,
neighbor values exceeding the critical value were considered as a member of the same
cluster. The cluster-statistic (CS) was taken as the sum of t values in a given cluster.
Evaluating the CS distribution through 1000 permutations controlled the false discovery rate
(Pantazis et al., 2005). Each permutation represented a randomization of the data between the
two conditions and across multiple subjects. For each permutation the CSs were computed by
taking the cluster with the maximum sum of t statistics. The threshold controlling the family
wise error rate (FWER) was determined according to the proportion of the randomization null
distribution exceeding the observed maximum CS (Monte Carlo test). Clusters containing
Revisiting ! suppression in Autism Spectrum Disorder
21
less than three different electrodes or three different frequency bins were excluded. We used
a threshold critical value of |2#|.
Acknowledgments
We thank Florence Bouchet for her generous assistance in the EEG preparation, Mario
Chavez for helpful comments in EEG analysis, and Lionel Thivard for his medical assistance.
The work of Guillaume Dumas was supported by a postdoctoral grant of the Orange
Foundation for Autism Spectrum Disorder.
References
American Psychiatric Association (2002). Diagnostic and Statistical Manual of Mental
Disorders (4th ed .revised). Washington, DC: Author.
Arnstein, D., Cui, F., Keysers, C., Maurits, N. M., & Gazzola, V. (2011). !-suppression
during action observation and execution correlates with BOLD in dorsal premotor,
inferior parietal, and SI cortices. The Journal of Neuroscience, 31(40), 14243-14249.
Avikainen, S., Kulomäki, T., & Hari, R. (1999). Normal movement reading in Asperger
subjects. Neuroreport, 10(17), 3467-3470.
Baron-Cohen, S., Leslie, A. M., & Frith, U. (1985). Does the autistic child have a “theory of
mind”? Cognition, 21(1), 37-46.
Bailey, N.W., Segrave, R.A., Hoy, K.E., Maller, J.J., & Fitzgerald, P.B. (2014). Impaired
upper alpha synchronisation during working memory retention in depression and
depression following traumatic brain injury. Biological Psychology, 2014 99:115-24.
Baillet, S., Mosher, J.C., & Leahy, R.M. (2001) Electromagnetic brain mapping. IEEE Signal
Processing Magazine, 18(6), 14-30.
Bastiaansen, J. A., Thioux, M., Nanetti, L., van der Gaag, C., Ketelaars, C., Minderaa, R., &
Keysers, C. (2011). Age-related increase in inferior frontal gyrus activity and social
functioning in autism spectrum disorder. Biological psychiatry, 69(9), 832-838.
Revisiting ! suppression in Autism Spectrum Disorder
22
Bazanova, O. M., & Vernon, D. (2013). Interpreting EEG alpha activity. Neuroscience &
Biobehavioral Reviews. doi:10.1016/j.neubiorev.2013.05.007
Belmonte, M. K., Allen, G., Beckel-Mitchener, A., Boulanger, L. M., Carper, R. A., & Webb,
S. J. (2004). Autism and abnormal development of brain connectivity. The Journal of
Neuroscience, 24(42), 9228-9231.
Bernier, R., Dawson, G., Webb, S., & Murias, M. (2007). EEG mu rhythm and imitation
impairments in individuals with autism spectrum disorder. Brain and
Cognition, 64(3), 228-237.
Bernier, R., Aaronson, B., & McPartland, J. (2013). The role of imitation in the observed
heterogeneity in EEG mu rhythm in autism and typical development. Brain and
Cognition, 82(1), 69-75.
Bollimunta A, Mo J, Schroeder CE, Ding M. (2011). Neuronal mechanisms and attentional
modulation of corticothalamic $ oscillations. Journal of Neuroscience, 30, 4935-43.
Bosl, W., Tierney, A., Tager-Flusberg, H., & Nelson, C. (2011). EEG complexity as a
biomarker for autism spectrum disorder risk. BMC medicine, 9(1), 18.
Boudet, S., Peyrodie, L., Gallois, P., & Vasseur, C. (2007). Filtering by optimal projection
and application to automatic artifact removal from EEG. Signal Processing, 87(8),
1978–1992. doi:10.1016/j.sigpro.2007.01.026
Castelli F, Frith C, Happé F, Frith U. (2002). Autism, Asperger syndrome and brain
mechanisms for the attribution of mental states to animated shapes. Brain, 125:1839-
49.
Chan, A.S., Han, Y.M.Y., Win-Man Leung, W., Leung, C., Wong. V.C.N., & Cheung, M.
(2011). Abnormalities in the anterior cingulate cortex associated with attentional and
inhibitory control deficits: A neurophysiological study on children with autism
spectrum disorders. Research in Autism Spectrum Disorders, 5, 254–266.
Revisiting ! suppression in Autism Spectrum Disorder
23
Coben, R., Clarke, A. R., Hudspeth, W., & Barry, R. J. (2008). EEG power and coherence in
autistic spectrum disorder. Clinical Neurophysiology, 119(5), 1002-1009.
Cochin, S., Barthelemy, C., Roux, S., & Martineau, J. (2001). Electroencephalographic
activity during perception of motion in childhood. European Journal of
Neuroscience, 13(9), 1791-1796.
Cooper, N.R., Croft, R.J., Dominey, S.J., Burgess, A.P., & Gruzelier, J.H. (2003). Paradox
lost? Exploring the role of alpha oscillations during externally vs. internally directed
attention and the implications for idling and inhibition hypotheses. International
Journal of Psychophysiology, 47, 65-74.
Courchesne, E., & Pierce, K. (2005). Why the frontal cortex in autism might be talking only
to itself: local over-connectivity but long-distance disconnection. Current Opinion in
Neurobiology, 15(2), 225-230.
Dapretto, M., Davies, M. S., Pfeifer, J. H., Scott, A. A., Sigman, M., Bookheimer, S. Y., &
Iacoboni, M. (2005). Understanding emotions in others: mirror neuron dysfunction in
children with autism spectrum disorders. Nature Neuroscience, 9(1), 28-30.
Dapretto, M., & Iacoboni, M., (2006). The mirror neuron system and the consequences of its
dysfunction. Nature Reviews Neuroscience, 7(12), 942–951.
Dinstein, I., Thomas, C., Humphreys, K., Minshew, N., Behrmann, M., & Heeger, D. J.
(2010). Normal movement selectivity in autism. Neuron, 66(3), 461–469.
doi:10.1016/j.neuron.2010.03.034
Dumas, G., Nadel, J., Soussignan, R., Martinerie, J., & Garnero, L. (2010). Inter-brain
synchronization during social interaction. PloS one, 5(8), e12166.
Dumas, G., Martinerie, J., Soussignan, R., & Nadel, J. (2012a). Does the brain know who is
at the origin of what in an imitative interaction? Frontiers in Human Neuroscience, 6,
128. doi:10.3389/fnhum.2012.00128
Revisiting ! suppression in Autism Spectrum Disorder
24
Dumas, G., Chavez, M., Nadel, J., & Martinerie, J. (2012b). Anatomical connectivity
influences both intra-and inter-brain synchronizations. PloS one, 7(5), e36414.
Ecker, C., Rocha-Rego, V., Johnston, P., Mourao-Miranda, J., Marquand, A., Daly, E. M., ...
& Murphy, D. G. (2010). Investigating the predictive value of whole-brain structural
MR scans in autism: a pattern classification approach. NeuroImage, 49(1), 44-56.
Fan, Y. T., Decety, J., Yang, C. Y., Liu, J. L., & Cheng, Y. (2010). Unbroken mirror neurons
in autism spectrum disorders. Journal of Child Psychology and Psychiatry, 51(9),
981-988.
Fink, A., Grabner, R. H., Neuper, C., & Neubauer, A. C. (2005). EEG alpha band
dissociation with increasing task demands. Cognitive Brain Research, 24(2), 252-259.
Fink, A., Schwab, D., & Papousek, I. (2011). Sensitivity of EEG upper alpha activity to
cognitive and affective creativity interventions. International Journal of
Psychophysiology, 82(3), 233-239.
Frenkel-Toledo, S., Bentin, S., Perry, A., Liebermann, D. G., & Soroker, N. (2014). Mirror-
neuron system recruitment by action observation: Effects of focal brain damage on
mu suppression. NeuroImage, 87, 127-137.
Gallese, V., Rochat, M. J., & Berchio, C. (2012). The mirror mechanism and its potential role
in autism spectrum disorder. Developmental Medicine & Child Neurology, 55(1):15-
22.
Grèzes, J., Wicker, B., Berthoz, S., & De Gelder, B. (2009). A failure to grasp the affective
meaning of actions in autism spectrum disorder subjects. Neuropsychologia, 47(8),
1816-1825.
Hamilton, A. F. D. C. (2013). Reflecting on the mirror neuron system in autism: a systematic
review of current theories. Developmental Cognitive Neuroscience, 3, 91-105.
Hari, R. (2006). Action–perception connection and the cortical mu rhythm. Progress in Brain
Research, 159, 253-260.
Revisiting ! suppression in Autism Spectrum Disorder
25
Hobson, R.P. (1986). The autistic child's appraisal of expressions of emotion. Journal of
Child Psychology and Psychiatry, 2, 321-342.
Holmes, C.J., Hoge, R., Collins, L., Woods, R., Toga, A.W., & Evans, A.C. (1998).
Enhancement of MR images using registration for signal averaging. Journal of
Computer Assisted Tomography, 22, 324–333.
Horwitz B, Hwang C, Alstott J. (2013). Interpreting the effects of altered brain anatomical
connectivity on fMRI functional connectivity: a role for computational neural
modeling. Frontiers in Human Neuroscience, 11, 7:649.
doi:10.3389/fnhum.2013.00649
Huang, M.X., Mosher, J.C., & Leahy, R.M. (1999). A sensor-weighted overlapping-sphere
head model and exhaustive head model comparison for MEG". Physics in Medicine
and Biology, 44(2), 423-440.
Hummel, F., Andres, F., Altenmüller, E., Dichgans, J., & Gerloff, C. (2002). Inhibitory
control of acquired motor programs in the human brain. Brain, 125, 404–420.
Hyde, K. L., Samson, F., Evans, A. C., & Mottron, L. (2010). Neuroanatomical differences in
brain areas implicated in perceptual and other core features of autism revealed by
cortical thickness analysis and voxel!based morphometry. Human Brain Mapping,
31(4), 556-566.
Iacoboni, M., & Dapretto, M. (2006). The mirror neuron system and the consequences of its
dysfunction. Nature Review Neuroscience, 7, 942–951.
Jann, K., Dierks, T., Boesch, C., Kottlow, M., Strik, W., & Koenig, T. (2009). BOLD
correlates of EEG alpha phase-locking and the fMRI default mode network.
NeuroImage, 45(3), 903-916.
Just, M. A., Cherkassky, V. L., Keller, T. A., & Minshew, N. J. (2004). Cortical activation
and synchronization during sentence comprehension in high-functioning autism:
Revisiting ! suppression in Autism Spectrum Disorder
26
evidence of underconnectivity. Brain, 127(8), 1811–1821. doi:10.1093/brain/awh199
Just, M. A., Cherkassky, V. L., Keller, T. A., Kana, R. K., & Minshew, N. J. (2007).
Functional and anatomical cortical underconnectivity in autism: evidence from an
FMRI study of an executive function task and corpus callosum morphometry.
Cerebral Cortex, 17(4), 951–961. doi:10.1093/cercor/bhl006
Just, M. A., Keller, T. A., Malave, V. L., Kana, R. K., & Varma, S. (2012). Autism as a
neural systems disorder: a theory of frontal-posterior underconnectivity. Neuroscience
& Biobehavioral Reviews, 36(4), 1292-1313.
Kaiser, J., Ulrich, R., & Lutzenberger, W. (2003). Dynamics of sensorimotor cortex
activation to spatial sounds precueing ipsi-versus contralateral manual
responses. Cognitive Brain Research, 17(3), 573-583.
Keuken, M. C., Hardie, A., Dorn, B. T., Dev, S., Paulus, M. P., Jonas, K. J., Van Den
Wildenberg, W. P. M., & Pineda, J. A. (2011). The role of the left inferior frontal
gyrus in social perception: an rTMS study. Brain research, 1383, 196-205.
Keysers, C., & Gazzola, V. (2007). Integrating simulation and theory of mind: from self to
social cognition. Trends in Cognitive Sciences, 11(5), 194–196.
doi:10.1016/j.tics.2007.02.002
Khan, S., Gramfort, A., Shetty, N. R., Kitzbichler, M. G., Ganesan, S., Moran, J. M., ... &
Kenet, T. (2013). Local and long-range functional connectivity is reduced in concert
in autism spectrum disorders. Proceedings of the National Academy of Sciences,
110(8), 3107-3112.
Klimesch, W. (1999). EEG alpha and theta oscillations reflect cognitive and memory
performance: a review and analysis. Brain research. Brain Research Reviews, 29(2-
3), 169–195.
Klimesch W, Sauseng P, Hanslmayr S. (2007). EEG alpha oscillations: the inhibition-timing
Revisiting ! suppression in Autism Spectrum Disorder
27
hypothesis. Brain Research Reviews. 53:63-88.
Klimesch, W. (2012). Alpha-band oscillations, attention, and controlled access to stored
information. Trends in Cognitive Sciences, 16(12), 606-617.
Knyazev, G. G., Slobodskoj-Plusnin, J. Y., Bocharov, A. V., & Pylkova, L. V. (2011). The
default mode network and EEG alpha oscillations: An independent component
analysis. Brain Research, 1402 (C), 67–79. doi:10.1016/j.brainres.2011.05.052.
Konvalinka, I., Bauer, M., Stahlhut, C., Hansen, L. K., Roepstorff, A., & Frith, C. D. (2014).
Frontal alpha oscillations distinguish leaders from followers: Multivariate decoding of
mutually interacting brains. NeuroImage. Advance online publication,
http://dx.doi.org/10.1016/j.neuroimage.2014.03.003
Lachat, F., Hugueville, L., Lemaréchal, J. D., Conty, L., & George, N. (2012). Oscillatory
brain correlates of live joint attention: a dual-EEG study. Frontiers in Human
Neuroscience, 6, 156. doi:10.3389/fnhum.2012.00156
Laufs, H., Kleinschmidt, A., Beyerle, A., Eger, E., Salek-Haddadi, A., Preibisch, C., &
Krakow, K. (2003). EEG-correlated fMRI of human alpha activity. NeuroImage,
19(4), 1463–1476. doi:10.1016/S1053-8119(03)00286-6
Laufs, H., Holt, J. L., Elfont, R., Krams, M., Paul, J. S., Krakow, K., & Kleinschmidt, A.
(2006). Where the BOLD signal goes when alpha EEG leaves. NeuroImage, 31(4),
1408–1418. doi:10.1016/j.neuroimage.2006.02.002
Leocani, L., Toro, C., Manganotti, P., Zhuang, P., & Hallett, M. (1997). Event-related
coherence and event-related desynchronization/synchronization in the 10 Hz and 20
Hz EEG during self-paced movements. Electroencephalography and Clinical
Neurophysiology, 82 (3), 199-206.

Revisiting ! suppression in Autism Spectrum Disorder
28
Lewis, J. D., & Elman, J. L. (2008). Growth-related neural reorganization and the autism
phenotype: a test of the hypothesis that altered brain growth leads to altered
connectivity. Developmental Science, 11(1), 135-155.
Lord, C., Rutter, M., & Le Couteur, A. (1994). Autism Diagnostic Interview-Revised: a
revised version of a diagnostic interview for caregivers of individuals with possible
pervasive developmental disorders. Journal of Autism and Developmental
Disorders, 24(5), 659-685.
Lord, C., Risi, S., Lambrecht, L., Cook Jr, E. H., Leventhal, B. L., DiLavore, P. C., ... &
Rutter, M. (2000). The Autism Diagnostic Observation Schedule—Generic: A
standard measure of social and communication deficits associated with the spectrum
of autism. Journal of Autism and Developmental Disorders, 82 (3), 205-223.
Maris, E., & Oostenveld, R. (2007). Nonparametric statistical testing of EEG- and MEG-data.
Journal of Neuroscience Methods, 164(1), 177–190.
doi:10.1016/j.jneumeth.2007.03.024
Maris, E., Schoffelen, J.-M., & Fries, P. (2007). Nonparametric statistical testing of
coherence differences. Journal of Neuroscience Methods, 163(1), 161–175.
doi:10.1016/j.jneumeth.2007.02.011
Marsh, L. E., & Hamilton, A. F. D. C. (2011). Dissociation of mirroring and mentalising
systems in autism. NeuroImage, 56(3), 1511-1519.
Marshall, P.J., Bouquet, C.A., Shipley, T.F., & Young, T. (2009). Effects of brief imitative
experience on EEG desynchronization during action observation. Neuropsychologia,
47, 2100-2106.
Martineau, J., Cochin, S., Magne, R., & Barthelemy, C. (2008). Impaired cortical activation
in autistic children: is the mirror neuron system involved?. International journal of psychophysiology, 68(1), 35-40.
McAlonan, G. M., Cheung, V., Cheung, C., Suckling, J., Lam, G. Y., Tai, K. S., et al. (2005).
Mapping the brain in autism. A voxel-based MRI study of volumetric differences and
Revisiting ! suppression in Autism Spectrum Disorder
29
intercorrelations in autism. Brain, 128(2), 268–276. doi:10.1093/brain/awh332
McFarland, D. J., Miner, L. A., Vaughan, T. M., & Wolpaw, J. R. (2000). Mu and beta
rhythm topographies during motor imagery and actual movements. Brain
Topography, 12(3), 177-186.
Molnar-Szakacs, I., & Uddin, L. Q. (2013). Self-processing and the default mode network:
interactions with the mirror neuron system, Frontiers in Human Neuroscience, 7, 571.
doi:10.3389/fnhum.2013.00571
Murphy, J.W., Foxe, J.J., Peters, J.B., & Molholm, S. (2014). Susceptibility to distraction in
autism spectrum disorder: probing the integrity of oscillatory alpha-band suppression
mechanisms. Autism Research, doi:10.1002/aur.1374.
Murias, M., Webb, S. J., Greenson, J., & Dawson, G. (2007). Resting state cortical
connectivity reflected in EEG coherence in individuals with autism. Biological
Psychiatry, 62(3), 270-273. doi:10.1016/j.biopsych.2006.11.012
Muthukumaraswamy, S. D., Johnson, B. W., & McNair, N. A. (2004). Mu rhythm
modulation during observation of an object-directed grasp. Cognitive Brain
Research, 19(2), 195-201.
Naeem, M., Prasad, G., Watson, D. R., & Kelso, J. A. (2012). Electrophysiological signatures
of intentional social coordination in the 10–12Hz range. NeuroImage, 59(2), 1795-
1803.
Newman-Norlund, R., van Schie, H. T., van Hoek, M. E., Cuijpers, R. H., & Bekkering, H.
(2010). The role of inferior frontal and parietal areas in differentiating meaningful and
meaningless object-directed actions. Brain research, 1315, 63-74.
Nichols, T. E., & Holmes, A. P. (2002). Nonparametric permutation tests for functional
neuroimaging. Human Brain Mapping, 15(1), 1–25.
Nishitani, N., Avikainen, S., & Hari, R. (2004). Abnormal imitation related cortical
Revisiting ! suppression in Autism Spectrum Disorder
30
activation sequences in Asperger's syndrome. Annals of neurology, 55(4), 558-562.
Oberman, L. M., Hubbard, E. M., McCleery, J. P., Altschuler, E. L., Ramachandran, V. S., &
Pineda, J. A. (2005). EEG evidence for mirror neuron dysfunction in autism spectrum
disorders. Cognitive Brain Research, 24(2), 190–198.
doi:10.1016/j.cogbrainres.2005.01.014
Oberman, L. M., Pineda, J. A., & Ramachandran, V. S. (2007). The human mirror neuron
system: A link between action observation and social skills. Social Cognitive and
Affective Neuroscience, 2(1), 62-66.
Oberman, L.M., & Ramachandran, V.S. (2007). The simulating social mind: The role of the
mirror neuron system and simulation in the social and communicative deficits of
autism spectrum disorders. Psychological Bulletin, 133 (2), 301-327.
Oberman, L. M., Ramachandran, V. S., & Pineda, J. A. (2008). Modulation of mu
suppression in children with autism spectrum disorders in response to familiar or
unfamiliar stimuli: the mirror neuron hypothesis. Neuropsychologia, 46(5), 1558–
1565. doi:10.1016/j.neuropsychologia.2008.01.010
Palva, S., and J. Matias Palva, J.M. (2007). New vistas for $-frequency band oscillations.
Trends in Neurosciences. 30, 4, 150-158.
Pantazis, D., Nichols, T., Baillet, S., & Leahy, R. (2005). A comparison of random field
theory and permutation methods for the statistical analysis of MEG data. NeuroImage,
25(2), 383–394.
Perry, A., Stein, L., & Bentin, S. (2011). Motor and attentional mechanisms involved in
social interaction-evidence from mu and alpha EEG suppression. NeuroImage. 58,
895-904.
Revisiting ! suppression in Autism Spectrum Disorder
31
Pfurtscheller, G., & Berghold, A. (1989). Patterns of cortical activation during planning of
voluntary movement. Electroencephalography and Clinical Neurophysiology, 72(3),
250-258.
Pfurtscheller, G. Neuper, C. Krausz, G. (2000). Functional dissociation of lower and upper
frequency mu rhythms in relation to voluntary limb movement. Clinical
Neurophysiology, 111, 1873-1879.
Pineda, J. A. (2005). The functional significance of mu rhythms: translating “seeing” and
“hearing” into “doing”. Brain Research Reviews, 82 (1), 57-68.
Pineda, J.A., Brang, D., Hecht, E., Edwards, l., Carey, S., Bacon, M., Futagaki, C., Suk, D.,
Tom, J., Birnbaum, C., & Rork, A. (2008). Positive behavioral and
electrophysiological changes following neurofeedback training in children with
autism. Research in Autism Spectrum Disorders, 2(3), 557-581.
Pineda, J. A., & Hecht, E. (2009). Mirroring and mu rhythm involvement in social cognition:
are there dissociable subcomponents of theory of mind? Biological Psychology, 80(3),
306-314.
Rajagovindan R, Ding M. (2011). From prestimulus alpha oscillation to visual-evoked
response: an inverted-U function and its attentional modulation. Journal of Cognitive
Neuroscience, 23, 1379-94.
Raymaekers, R., Wiersema, J. R., & Roeyers, H. (2009). EEG study of the mirror neuron
system in children with high functioning autism. Brain Research, 1304, 113-121.
Rizzolatti, G., Fabbri-Destro, M., & Cattaneo, L. (2009). Mirror neurons and their clinical
relevance. Nature Clinical Practice Neurology, 5(1), 24-34.
Rizzolatti, G., & Sinigaglia, C. (2010). The functional role of the parieto-frontal mirror
circuit: interpretations and misinterpretations. Nature Reviews Neuroscience, 82 (4),
264-274.
Revisiting ! suppression in Autism Spectrum Disorder
32
Rogers, S. J., & Pennington, B. F. (1991). A theoretical approach to the deficits in infantile
autism. Development and Psychopathology, 3(2), 137-162.
Romei V, Rihs T, Brodbeck V, Thut G. (2008). Resting electroencephalogram alpha-power
over posterior sites indexes baseline visual cortex excitability. Neuroreport, 19, 203-
208.
Ruysschaert, L., Warreyn, P., Wiersema, J. R., Oostra, A., & Roeyers, H. (2014). Exploring
the role of neural mirroring in children with autism spectrum disorder. Autism
Research, 7(2), 197-206.
Sadaghiani, S., Scheeringa, R., Lehongre, K., Morillon, B., Giraud, A.-L., D'Esposito, M., &
Kleinschmidt, A. (2012). Alpha-band phase synchrony is related to activity in the
fronto-parietal adaptive control network. Journal of Neuroscience, 32(41), 14305–
14310. doi:10.1523/JNEUROSCI.1358-12.2012
Schmitz, N., Rubia, K., Daly, E., Smith, A., Williams, S., & Murphy, D. G. M. (2006).
Neural correlates of executive function in autistic spectrum disorders. Biological
Psychiatry, 59(1), 7–16. doi:10.1016/j.biopsych.2005.06.007
Schulte-Rüther, M., Greimel, E., Markowitsch, H. J., Kamp-Becker, I., Remschmidt, H.,
Fink, G. R., & Piefke, M. (2011). Dysfunctions in brain networks supporting
empathy: an fMRI study in adults with autism spectrum disorders. Social
Neuroscience, 6(1), 1-21.
Sperduti, M., Guionnet, S., Fossati, P., & Nadel, J. (2014). Mirror neuron system and
mentalizing system connect during online social interaction. Cognitive Processing, 1-
10.
Tadel, F., Baillet, S., Mosher, J.C., Pantazis, D, & Leahy, R.M. (2011) Brainstorm: A User-
Friendly Application for MEG/EEG Analysis, Computational Intelligence and
Neuroscience, 13 doi:10.1155/2011/879716 Article ID 879716.
Revisiting ! suppression in Autism Spectrum Disorder
33
Tognoli, E., Lagarde, J., DeGuzman, G. C., & Kelso, J. S. (2007). The phi complex as a
neuromarker of human social coordination. Proceedings of the National Academy of
Sciences, 104(19), 8190-8195.
Uddin, L. Q., Iacoboni, M., Lange, C., & Keenan, J. P. (2007). The self and social cognition:
the role of cortical midline structures and mirror neurons. Trends in Cognitive
Sciences, 11(4), 153-157.
Uhlhaas, P. J., & Singer, W. (2006). Neural synchrony in brain disorders: relevance for
cognitive dysfunctions and pathophysiology. Neuron, 52(1), 155-168.
Vara, A.S, Pang, E.W., Doyle-Thomas, K.A.R, Vidal, J., Taylor, M.J., & Evdokia
Anagnostou E. (2014). Is inhibitory control a ‘no-go’ in adolescents with autism
spectrum disorder. Molecular Autism, 5, 6. doi:10.1186/2040-2392-5-6
Wang, J., Barstein, J., Ethridge, L. E., Mosconi, M. W., Takarae, Y., & Sweeney, J. A.
(2013). Resting state EEG abnormalities in autism spectrum disorders. Journal of
Neurodevelopmental Disorders, 5(1), 1–1. doi:10.1186/1866-1955-5-24
Wang, Y., & Hamilton, A. F. D. C. (2012). Social top-down response modulation (STORM):
a model of the control of mimicry in social interaction. Frontiers in Human
Neuroscience, 6, 153. doi:10.3389/fnhum.2012.00153
Willemse, R. B., De Munck, J. C., Verbunt, J. P., van’t Ent, D., Ris, P., Baayen, J. C., ... &
Vandertop, W. P. (2010). Topographical organization of mu and Beta band activity
associated with hand and foot movements in patients with perirolandic lesions. The
Open Neuroimaging Journal, 4, 93-99.
Williams, J. H., Whiten, A., Suddendorf, T., & Perrett, D. I. (2001). Imitation, mirror neurons
and autism. Neuroscience & Biobehavioral Reviews, 25(4), 287-295.
Revisiting ! suppression in Autism Spectrum Disorder
34
Williams, J. H., Waiter, G. D., Gilchrist, A., Perrett, D. I., Murray, A. D., & Whiten, A.
(2006). Neural mechanisms of imitation and ‘mirror neuron’functioning in autistic
spectrum disorder. Neuropsychologia, 44(4), 610-621.
Yasuhara, A. (2010). Correlation between EEG abnormalities and symptoms of autism
spectrum disorder (ASD). Brain and Development, 32(10), 791-798.
Zoefel, B., Huster, R.J., & Herrmann, C.S. (2011). Neurofeedback training of the upper alpha
frequency band in EEG improves cognitive performance. NeuroImage, 54, 1427-31.
Revisiting ! suppression in Autism Spectrum Disorder
35
Figures captions
Figure 1: Mu suppression values for the large-band 8-13Hz over central electrodes (C5, C3,
C1, Cz, C2, C4, C6) during Execution (A) and Observation (B) conditions. A log ratio
greater than zero indicates mu enhancement; a log ratio less than zero indicates mu
suppression. For the three panels, TYP participants are in blue and ASD in red. Error bars
represent the standard error. Significant suppression are indicated by an asterisk, * p<0.05, **
p<0.01. Notice that mu suppression is the log ratio of the power during the observation and
execution conditions relative to the power during the resting condition.
Figure 2: Fine-grained spectral analysis. A) Power spectra during the Rest. B, C) Mu power
suppression during Execution (B) and Observation (C) conditions. For the three panels TYP
participants are in blue and ASD participants in red. Color shaded regions around mean
represent standard error. Grey shaded regions represent significant clusters of differences
between ASD and TYP participants, * p<0.05. Notice that mu suppression is the log ratio of
the power during the observation and execution conditions relative to the power during the
resting condition.
Figure 3: Scalp statistical maps related to the Observation condition. Each panel shows the t
values for large alpha band (8-13Hz) on the left, lower alpha band (8-10Hz) on the middle,
and upper alpha band (11-13Hz) on the right. A, B) Alpha suppression in the ASD (A) and
TYP (B) groups. Positive t values indicate alpha enhancement and negative t values indicate
alpha suppression. C) Comparison of the alpha suppression between the ASD and the TYP
groups. Positive t values indicate reduced alpha suppression in ASD; respectively, negative t
values indicate enhanced alpha suppression. Notice that suppression is the log ratio of the
power during the observation and execution conditions relative to the power during the
resting condition. Panel B has a different scale than panels A and C.
Revisiting ! suppression in Autism Spectrum Disorder
36
Figure 4: Statistical maps of the difference in alpha suppression at the cortical level between
ASD and TYP participants for action execution in low-alpha frequency range (A) and action
observation in high-alpha frequency range (B). Positive t values indicate reduced alpha
suppression in the ASD group compared to the TYP group; respectively, negative t values
indicate enhanced alpha suppression in ASD group compared to the TYP group. Notice that
suppression is the log ratio of the power during the observation and execution conditions
relative to the power during the resting condition. Panel B has a different scale than panel A.
Figu
re 1

Figure 2
Figu
re 3
Figu
re 4