Measurements of the reactions 12C(numu,mu-)12Ng.s. and 12C(numu,mu-)X
51
arXiv:nucl-ex/9705002v1 23 May 1997 Measurements of the reactions 12 C(ν μ , μ - ) 12 N g.s. and 12 C(ν μ , μ - ) X C. Athanassopoulos 12 , L. B. Auerbach 12 , R. L. Burman 7 , D. O. Caldwell 3 , E. Church 1 , I. Cohen 6 , B. D. Dieterle 10 , J. B. Donahue 7 , A. M. Eisner 4 , A. Fazely 11 , F. J. Federspiel 7 , G. T. Garvey 7 , M. Gray 3 , R. M. Gunasingha 1 , R. Imlay 8 , K. Johnston 9 , H. J. Kim 8 , W. C. Louis 7 , R. Majkic 12 , K. McIlhany 1 , W. Metcalf 8 , G. B. Mills 7 , R. A. Reeder 10 , V. Sandberg 7 , D. Smith 5 , I. Stancu 1 , W. Strossman 1 , R. Tayloe 7 , G. J. VanDalen 1 , W. Vernon 2,4 , N. Wadia 8 , J. Waltz 5 , Y-X. Wang 4 , D. H. White 7 , D. Works 12 , Y. Xiao 12 , S. Yellin 3 LSND Collaboration 1 University of California, Riverside, CA 92521 2 University of California, San Diego, CA 92093 3 University of California, Santa Barbara, CA 93106 4 University of California Intercampus Institute for Research at Particle Accelerators, Stanford, CA 94309 5 Embry Riddle Aeronautical University, Prescott, AZ 86301 6 Linfield College, McMinnville, OR 97128 7 Los Alamos National Laboratory, Los Alamos, NM 87545 8 Louisiana State University, Baton Rouge, LA 70803 9 Louisiana Tech University, Ruston, LA 71272 10 University of New Mexico, Albuquerque, NM 87131 11 Southern University, Baton Rouge, LA 70813 12 Temple University, Philadelphia, PA 19122 (February 8, 2008) Abstract 1
-
Upload
independent -
Category
Documents
-
view
1 -
download
0
Transcript of Measurements of the reactions 12C(numu,mu-)12Ng.s. and 12C(numu,mu-)X

arX
iv:n
ucl-
ex/9
7050
02v1
23
May
199
7
Measurements of the reactions 12C(νµ, µ−) 12Ng.s. and
12C(νµ, µ−) X
C. Athanassopoulos12, L. B. Auerbach12, R. L. Burman7, D. O. Caldwell3,
E. Church1, I. Cohen6, B. D. Dieterle10, J. B. Donahue7, A. M. Eisner4,
A. Fazely11, F. J. Federspiel7, G. T. Garvey7, M. Gray3, R. M. Gunasingha1,
R. Imlay8, K. Johnston9, H. J. Kim8, W. C. Louis7, R. Majkic12,
K. McIlhany1, W. Metcalf8, G. B. Mills7, R. A. Reeder10, V. Sandberg7, D. Smith5,
I. Stancu1, W. Strossman1, R. Tayloe7, G. J. VanDalen1, W. Vernon2,4, N. Wadia8,
J. Waltz5, Y-X. Wang4, D. H. White7, D. Works12, Y. Xiao12, S. Yellin3
LSND Collaboration
1University of California, Riverside, CA 92521
2University of California, San Diego, CA 92093
3University of California, Santa Barbara, CA 93106
4University of California Intercampus Institute for Research at Particle Accelerators, Stanford,
CA 94309
5Embry Riddle Aeronautical University, Prescott, AZ 86301
6Linfield College, McMinnville, OR 97128
7Los Alamos National Laboratory, Los Alamos, NM 87545
8Louisiana State University, Baton Rouge, LA 70803
9Louisiana Tech University, Ruston, LA 71272
10University of New Mexico, Albuquerque, NM 87131
11Southern University, Baton Rouge, LA 70813
12Temple University, Philadelphia, PA 19122
(February 8, 2008)
Abstract
1

Charged current scattering of νµ on 12C has been studied using a π+ decay-
in-flight νµ beam at the Los Alamos Meson Physics Facility. A sample of 56.8
± 9.6 events satisfying criteria for the exclusive reaction 12C(νµ, µ−)12Ng.s.
was obtained using the large Liquid Scintillator Neutrino Detector (LSND).
The observed flux-averaged cross section, (6.6± 1.0± 1.0)× 10−41cm2, agrees
well with reliable theoretical expectations. A measurement was also obtained
for the inclusive cross section to all accessible 12N states, 12C(νµ, µ−)X. This
flux-averaged cross section is (11.2± 0.3± 1.8)× 10−40 cm2, which is approxi-
mately half of that given by a recent Continuum Random Phase Approxima-
tion (CRPA) calculation.
14.60.Lm, 13.15.+g
Typeset using REVTEX
2

I. INTRODUCTION
Low energy neutrino-nucleus cross sections are of interest because of their application
to nuclear structure studies and their importance as a base of information for low energy
neutrino detectors. The cross sections contain contributions from both axial vector and
polar vector nuclear currents and thus provide complementary information to that provided
by electron-nucleus scattering, which is sensitive only to the nuclear polar vector currents.
Thus far, data exist only for neutrino scattering on carbon. Three experiments, E225 at
LAMPF [1],the KARMEN experiment at the ISIS facility of the Rutherford Laboratory [2]
and LSND [3], have measured both the exclusive reaction 12C(νe, e−)12Ng.s. and the inclusive
cross section 12C(νe, e−)12N∗ to all the accessible excited states of 12N. In these measurements
the νe flux arises from µ+ decay at rest with Eν < 52.8 MeV. As a result of the low neutrino
energy, transitions occur almost entirely to a few low lying states of 12N, and 60 % of the total
cross section is to the 12N ground state. The cross section for producing the 12N ground state
can be predicted with an accuracy of ≈ 2% by using model independent form factors that
can be reliably extracted from other measurements [4]. All three experimental measurements
of the 12C(νe, e−)12Ng.s. cross section agree well with the expected value. Calculation of the
inclusive cross section to the excited states of 12N is model dependent and is a less certain
procedure. The Fermi Gas Model (FGM) is not reliable in this instance because the low
neutrino energy leads to momentum transfers (q<100 MeV/c) much smaller than the Fermi
momentum (200 MeV/c) in carbon. Thus extensive modeling of the nuclear dynamics is
necessary. A recent calculation [5] that includes the particle-hole correlations in a continuum
random phase approximation (CRPA) agrees well with the 12C(νe, e−)12N∗ cross sections
reported by the three experiments.
This paper expands on our earlier preliminary [6,7] results on the charged current νµ
scattering from carbon at somewhat higher neutrino energies using the flux of νµ created by
π+ decay in flight. The inclusive cross section is strongly energy and momentum transfer
dependent. Thus the flux-averaged cross section for the reaction 12C(νµ, µ−)12N∗ is approx-
3

imately 200 times larger than the lower energy cross section for 12C(νe, e−)12N∗. In this
case, a CRPA calculation yields a cross section approximately twice the observed value [8].
This apparent discrepancy, between the good agreement of the CRPA calculation and mea-
surements for the decay-at-rest result and the factor of two discrepancy between a similar
calculation and this measurement for the decay-in-flight cross section, has generated con-
siderable theoretical interest [8]. A large-basis shell-model calculation, however, obtains a
result that is lower than the CRPA calculation for this reaction due to nuclear structure
effects and may be consistent within errors with the observed value [9]. The only experi-
ment previous to LSND had limited data and reported a cross section substantially above
expectations and a muon energy spectrum much softer than expected [10]. These results
are inconsistent with the LSND results [6,7].
This paper presents a detailed study of νµ carbon scattering based on data obtained
in 1994 and 1995. Both the exclusive reaction 12C(νµ,µ−)12Ng.s. and the inclusive reaction
12C(νµ,µ−)12N are measured. The calculated νµ energy spectrum arising from π+ decay-
in-flight is shown in Fig. 1. Also shown is the energy spectrum of the much smaller ν̄µ
flux arising from π− decay-in-flight. Neutrinos with energies between muon production
threshold (123.1 MeV) and approximately 280 MeV contribute to the cross section; therefore
much higher nuclear excitation energies are possible for νµC scattering than for the νeC
measurement discussed above. The measurement of the exclusive reaction, 12C(νµ,µ−)12Ng.s.,
provides a valuable check on the overall analysis procedure because the cross section for this
process can be reliably calculated in a mostly model independent fashion.
The analysis presented in this paper for events arising from decay-in-flight neutrinos
is also important because of its relevance to the two searches for neutrino oscillations by
LSND. Evidence has been presented [11] for ν̄µ → ν̄e oscillations using ν̄µ from µ+ decay
at rest. The backgrounds to this measurement from decay-in-flight neutrinos are expected
to be small, but it is nevertheless important to measure these processes. LSND is also
searching for νµ → νe oscillations using the decay-in-flight νµ beam by detecting electrons
from the process 12C(νe,e−)12N. For this search quantitative knowledge is required both of
4

the decay-in-flight neutrino beam and of neutrino-carbon cross sections.
II. THE NEUTRINO SOURCE
The data reported here were obtained in 1994 and 1995 at the Los Alamos Meson Physics
Facility (LAMPF) primarily using neutrinos produced at the A6 proton beam stop. As
discussed below some neutrinos are also produced at upstream targets A1 and A2. The
neutrino source is described in detail elsewhere [12]. This facility is now referred to as the
Los Alamos Neutron Science Center (LANSCE). The beam stop consists of a 30-cm water
target and a 50-cm pion decay region surrounded by steel shielding and followed by a copper
beam dump. The high-intensity 800 MeV proton beam from the linear accelerator generates
a large pion flux from the water target. The fluxes of νµ and ν̄µ used for the measurements
reported here arise from the decay in flight (DIF) of π+ and π−. For the LAMPF proton
beam and beam stop configuration π+ production exceeds π− production by a factor of
approximately eight and even more for high energy pions. Approximately 3.4% of the π+
and 5% of the π− decay in flight. The LAMPF proton beam typically had a current of 800
µA and an energy of approximately 770 MeV at the A6 beam stop. The integrated beam
current was 5904 C in 1994 and 7081 C in 1995. Upstream targets contributed 6% to the
DIF neutrino flux. For the 1995 run, the water target was removed for 32% of the 7081
C of beam. For this portion of the run the DIF νµ flux was reduced approximately 50%.
The νµ flux above muon production threshold (123.1 MeV) and averaged over the LSND
detector was then 6.75 × 1011 cm−2 for 1994 and 6.50 × 1011 cm−2 for 1995. The ν̄µ flux
above threshold (113.1 MeV) for the process ν̄µ+ p → µ++ n was 6.79× 1010 cm−2 for 1994
and 6.69 × 1010 cm−2 for 1995.
A detailed beam simulation program has been developed over the last decade to describe
the LAMPF beam dump which has been used as the neutrino source for previous experiments
E31 [13], E225 [1] and E645 [14]. A calibration experiment, E866 [15], measured the rate of
stopped µ+ from a low-intensity proton beam incident on an instrumented beam stop. The
5
rate of stopped µ+ per incident proton was measured as a function of several variables and
used to fine tune the beam dump simulation program [16]. This simulation program can
then be used to calculate the flux for any particular beam dump configuration.
The calibration experiment determined the decay-at-rest flux to ± 7% uncertainty for
the proton energies and beam stop configurations used at LAMPF. There are greater uncer-
tainties in the DIF fluxes. Uncertainties in the energy spectra of the π± which decay in flight
lead to uncertainties in both the magnitudes and shapes of the νµ and ν̄µ energy spectra.
The resulting uncertainty in the DIF flux for neutrinos above muon production threshold is
estimated to produce an uncertainty in the measured cross section of 15%.
We have performed a significant test of the beam simulation by comparing data taken
with two distinct beam dump configurations. As discussed above, the water target was
removed for 32% of the 1995 data. Per Coulomb of proton beam the beam simulation
program predicts a νµ flux above muon production threshold only 48% as large with the
water target out as with the water target in. The predicted νµ energy spectrum is, however,
harder with the water target out, so that the predicted rate for 12C(νµ, µ−) X events is 61 ±
4% as large and the mean detected energy of these events is 15 ± 4% larger. The systematic
errors shown include a conservative estimate of the effect of the uncertainty in the energy
dependence of the cross section. For comparison, the measured event rate with the water
target out is 57 ± 5% of the rate with the water target in. The mean event energy is 13
± 4% larger with the water target out. The good agreement with expectations for both
the event rate and mean detected energy provides a valuable check of the beam simulation
program.
III. THE LSND DETECTOR
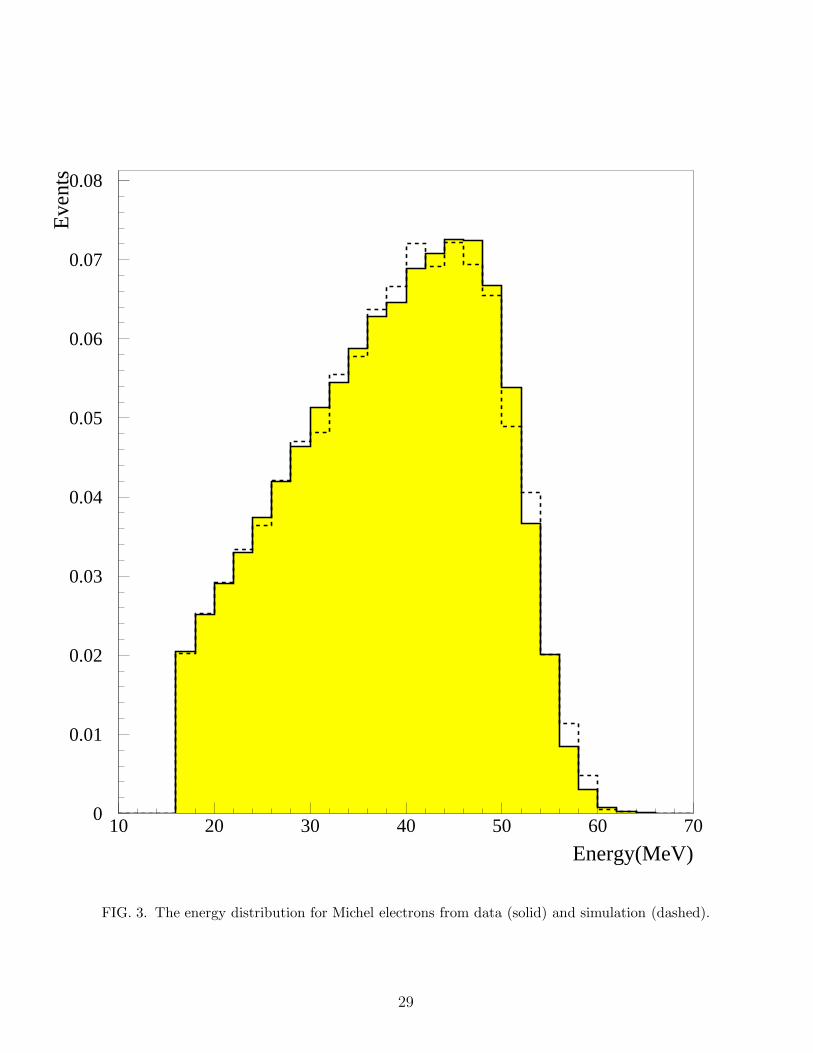
The detector is located 29.8 m downstream of the proton beam stop at an angle of 12◦
to the proton beam. Fig. 2 shows a side view of the setup. Approximately 2000 g/cm2
of shielding above the detector attenuates the hadronic component of cosmic rays to a low
6

level. Enclosing the detector, except on the bottom, is a highly efficient liquid scintillator
veto shield which is essential to reduce contributions from the cosmic ray muon background
to a low level. The detector is also well shielded from the beam stop so that beam-associated
neutrons are attenuated to a negligible level. Ref. 12 provides a detailed description of the
detector, veto and data acquisition system which we briefly review here.
The detector is a nearly cylindrical tank containing 167 tons of liquid scintillator and
viewed by 1220 uniformly spaced 8” Hamamatsu photomultiplier tubes (PMTs) covering
∼25% of the surface inside the tank wall. The digitized time and pulse height of each of
these PMTs (and of each of the 292 veto shield PMTs) are recorded when the deposited
energy in the tank exceeds a threshold of approximately 4 MeV electron-equivalent energy,
and there are fewer than 4 PMT hits in the veto shield. A veto, imposed for 15.2 µs following
the firing of > 5 veto PMTs, substantially reduces (10−3) the large number of background
events arising from the decay of cosmic ray muons that stop in the detector. Activity in
the detector or veto shield during the 51.2 µs preceding a primary trigger is also recorded
provided there are > 17 detector PMT hits or > 5 veto PMT hits. This activity information
is used in the analysis also to identify events arising from muon decay. In particular, in
this analysis the activity information is used to identify low energy µ− from the reaction
νµ + 12C→ µ−+ X. For such events the e− from the subsequent decay µ− → e− + νµ + ν̄e
provides the primary trigger. It should also be noted that the 15.2 µs veto applies only to
the primary trigger and not to the activities preceding a valid trigger.
Subsequent to a primary event trigger, data are recorded for 1 ms with a greatly re-
duced threshold of 21 PMTs (approximately 0.7 MeV electron energy equivalent). This low
threshold is necessary to detect γ’s associated with neutron capture, as described below.
The detector operates without reference to the beam spill, but the state of the beam is
recorded with the event. Approximately 93% of the data is taken between beam spills. This
allows an accurate measurement and subtraction of cosmic ray background surviving the
event selection criteria.
The detector medium consists of mineral oil (CH2) in which is dissolved a small con-
7

centration (0.031 g/l) of b-PBD [17]. This mixture allows the detection of both Cerenkov
light and approximately isotropic scintillation light and produces about 33 photoelectrons
per MeV of electron energy deposited in the oil. The combination of the two sources of
light provides direction information and makes particle identification (PID) possible for rel-
ativistic particles. Identification of neutrons is accomplished through the detection of the
2.2 MeV γ from neutron capture on free protons. Stopping µ− are captured on 12C 8% of
the time in the LSND detector. The µ± which decay are readily identified as muons by the
presence of subsequent spatially correlated Michel electrons.
The veto shield encloses the detector on all sides except the bottom. The main veto
shield [18] consists of a 15-cm layer of liquid scintillator. Additional counters were placed
below the veto shield after the 1993 run to reduce cosmic ray background entering through
the bottom support structure. These counters around the bottom support structure are
referred to as bottom counters. A veto inefficiency < 10−5 is achieved with this veto system
for incident charged particles.
IV. ANALYSIS TECHNIQUES
In the analysis presented in this paper we require a µ± followed by a delayed coincidence
with a decay e±. As a result of this coincidence requirement a clean beam excess sample
of events can be obtained with relatively loose selection criteria. Furthermore, it is easy to
verify that the events in this sample arise from muon decay since the muon lifetime and the
decay electron energy spectrum are well known, and the response of the LSND detector to
electrons from muon decay has been well determined from a large, clean sample of electrons
from decays of stopping cosmic ray muons.
Each event is reconstructed using the hit time and pulse height of all hit PMTs in the
detector. The present analysis relies on the reconstructed energy, position and particle ID
parameter, χtot [12]. The parameter χtot is used to distinguish electrons from interactions of
cosmic ray neutrons in the detector and will be explained below.
8

Fortunately, it is possible to measure the response of the detector to electrons and neu-
trons in the energy range of interest for this analysis. The response of the detector to
electrons was determined from a large, essentially pure sample of electrons (and positrons)
from the decay of stopped cosmic ray µ± in the detector. The known energy spectrum for
electrons from muon decay was used to determine the absolute energy calibration including
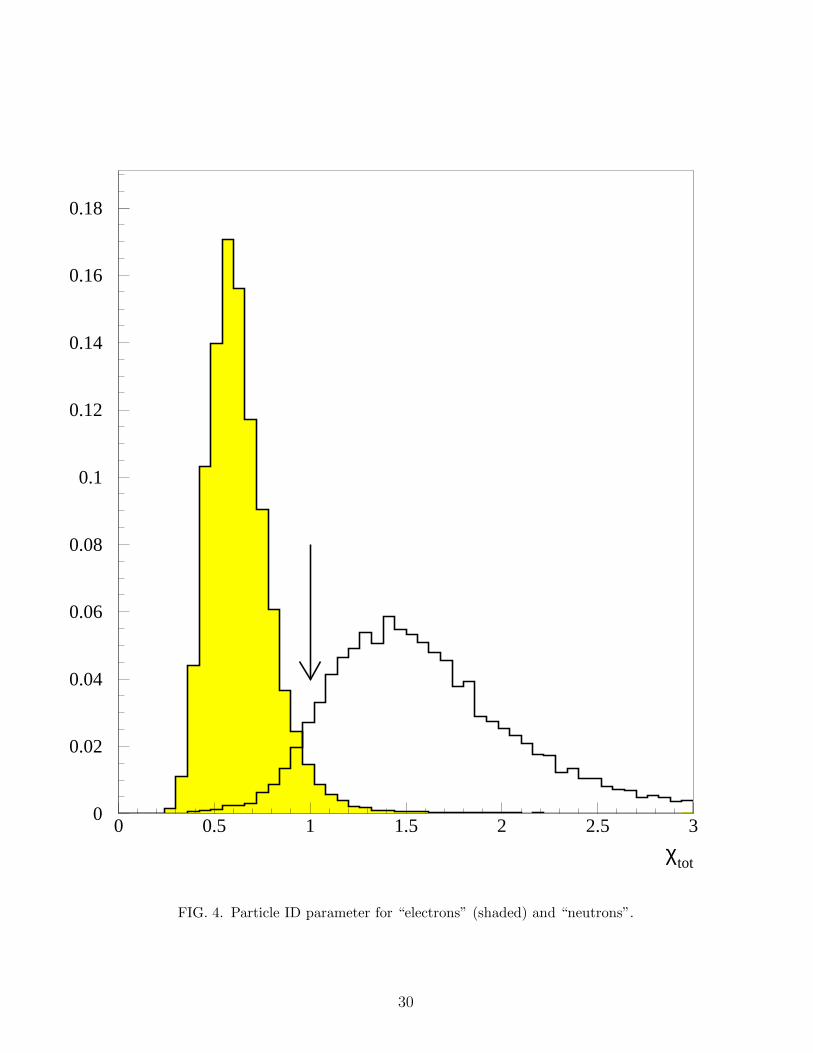
its small variation over the volume of the detector. The energy resolution was determined
from the shape of the electron energy spectrum as shown in Fig. 3 and was found to be
6.6% at the 52.8 MeV endpoint. We also make use of a detailed Monte Carlo simulation,
LSNDMC [19], which was written to simulate events in the detector using GEANT. The
position resolution obtained from the LSNDMC simulation is approximately 30 cm for a 20
MeV electron.
For relativistic electrons in the LSND detector approximately 70% of the photoelectrons
arise from direct or re-radiated Cerenkov light and only 30% from scintillator light. For
muons, the threshold kinetic energy for Cerenkov radiation in the LSND detector is 39
MeV. For the sample of muons analyzed in this paper only about half are above Cerenkov
threshold and none fully relativistic. As a result, the light output per MeV of energy loss
for the muons is significantly less than that for relativistic electrons. There is no calibration
sample available of low energy muons with known energies. Thus we rely on the Monte
Carlo simulation LSNDMC for muons. We discuss the muon energy scale further in sections
VI and VII when we compare observed and expected energy distributions.
There are no tracking devices in the LSND detector, and thus event positions must be
determined solely from the PMT information. The reconstruction process determines an
event position by minimizing a function X r which is based on the time of each PMT hit
corrected for the travel time of light from the assumed event position to the PMT [12].
This reconstruction procedure was found to systematically shift event positions away from
the center of the detector and thus effectively reduces the fiducial volume [12], as discussed
below. In the analysis presented in this paper a fiducial cut is imposed on the electron by
requiring D > 35 cm, where D is the distance between the reconstructed electron position
9

and the surface tangent to the faces of the PMTs.
The effect of the reconstruction bias on the fiducial acceptance was determined from the
analysis of a sample of stopping muon events for which both the muon and the subsequent
decay electron were detected. No fiducial cut was imposed on either the muon or the
electron so that essentially all muons which stopped in the scintillator and decayed were
included. For comparison a sample of simulated stopping muon events was generated using
LSNDMC. The observed and generated distributions of the distance D were compared for
electrons satisfying a minimum energy requirement. The observed distribution was found to
be shifted outward relative to the generated distribution. Several independent analyses of
this type yielded the acceptance factor of 0.85±0.05 for D > 35 cm due to the reconstruction
bias. There is independent support for this conclusion. A new reconstruction procedure has
been developed which relies primarily on PMT pulse height rather than timing information
and is not expected to have a significant bias. Comparison of vertex positions obtained
with the new and the standard reconstruction procedures indicate an outward shift in good
agreement with that obtained from the stopping muon analysis.
The particle identification procedure is designed to separate particles with velocities well
above Cerenkov threshold from particles below Cerenkov threshold by making use of the
four parameters defined in Ref. 12. Briefly, X r and X a are the quantities minimized for
the determination of the event position and direction, X t is the fraction of PMT hits that
occur more than 12 ns after the fitted event time and χtot is proportional to the product
of X r, X a and X t. For the present analysis we use only χtot and impose a requirement
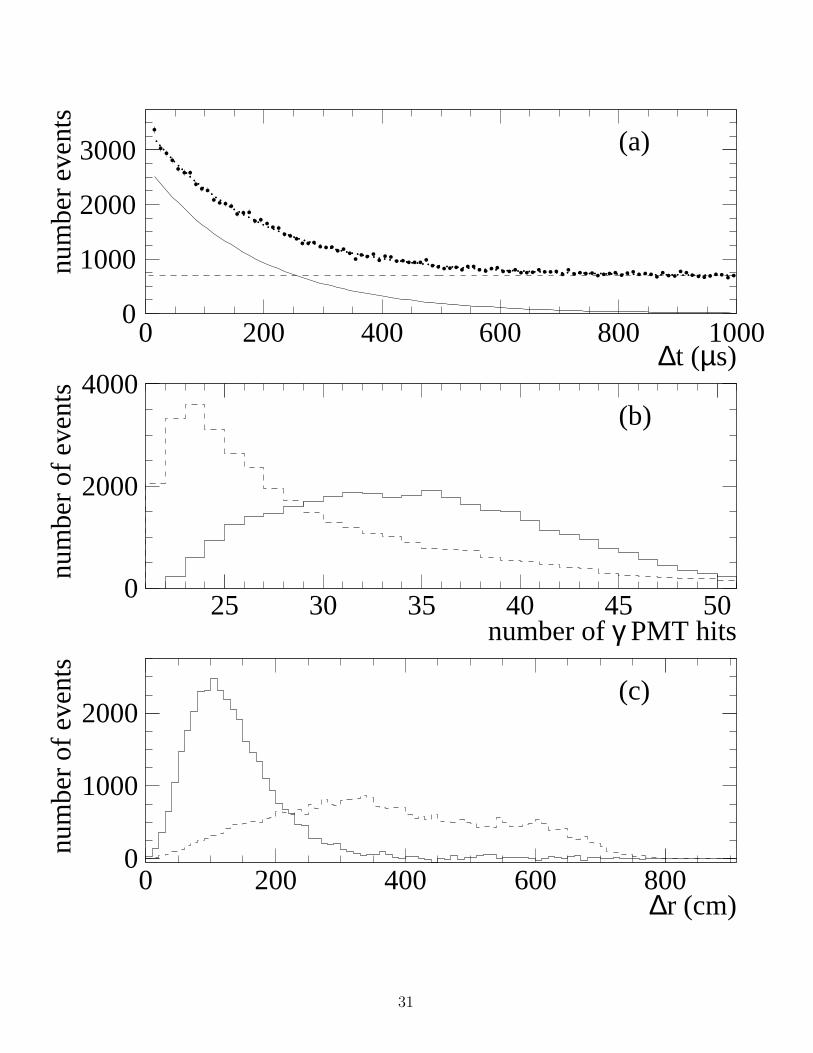
only on the electron candidate, not on the preceeding muon candidate. Figure 4 shows
the χtot distributions for electrons from stopping µ decay and for cosmic ray neutrons with
electron-equivalent energies in the 16 < Ee < 60 MeV range. For a neutron Ee is the
equivalent electron energy corresponding to the observed total charge. In the present analysis
a relatively loose χtot requirement reduces the neutron background to a negligible level.
The presence of a neutron can be established from the neutron capture reaction n +
p → d + γ. The mean capture time in the LSND detector is expected to be 186 µs,
10

essentially independent of the initial neutron energy. Three variables are used to identify
a capture γ correlated with a neutron in the primary event: the number of PMT hits
for the γ, the distance of the γ from the primary event and the time of the γ from the
primary event. Fig. 5 shows the distributions of these variables for correlated γ’s and
for uncorrelated (accidental) γ’s. A likelihood technique, discussed in Ref. 11, has been
developed to separate the correlated component due to neutrons from the uncorrelated
component. An approximate likelihood ratio R ≡ Lcor/Luncor is calculated for each event
from the three measured variables. If there is no γ within 1 ms and 2.5 m from the primary
event then R = 0 for the event. The expected distributions of R are shown in Fig. 6
for a correlated sample (every event has one neutron) and for an uncorrelated sample (no
event has a neutron). The correlated R distribution was found to be almost independent
of event position within the fiducial volume [11]. The accidental gamma rate is higher near
the bottom front corner of the detector than elsewhere, but the shape of the uncorrelated
R distribution has little position dependence. Also shown in Fig. 6 is the measured R
distribution [3] for a clean sample of over 500 events from the reactions 12C(νe, e−)12Ng.s..
Such events have no associated neutrons and thus this sample provides a useful check of
the uncorrelated R distribution. The agreement with the distribution for uncorrelated γ’s is
excellent. In the present paper we use the γ analysis to determine the fraction of the events
in the DIF sample that are accompanied by neutrons. The measured R distribution is fit to
a mixture of the correlated and uncorrelated distributions shown in Fig. 6, and the fraction
of events with neutrons is obtained.
Beam-off data taken between beam spills play a crucial role in the analysis of this exper-
iment. Most event selection criteria are designed to reduce the background due to cosmic
rays while retaining high acceptance for the neutrino process of interest. The cosmic ray
background which remains after all selection criteria have been applied is well measured
with the beam-off data and subtracted using the duty ratio, the ratio of beam-on time to
beam-off time. This ratio was 0.080 for 1994 and 0.060 for 1995. The smaller duty ratio in
1995 arose from changes in LAMPF beam operations, especially a reduction in the number
11

of proton beam spills per second at the A6 beam dump.
V. EVENT SELECTION
The analysis is designed to select the µ− from the reaction νµ + 12C → µ−+ X and
the subsequent electron from the decay µ− → e− + ν̄e + νµ. In the LSND detector medium
92% of the stopped µ− decay and 8% are captured. The µ− and other particles arising from
the charge-changing neutrino interaction produce light that causes an average of 250 PMTs
to fire. The detector signal, Qµ, measured in photoelectrons arises mostly from the µ− but
includes contributions from other particles produced in the reaction such as protons and
gammas.
Table I shows the selection criteria and corresponding efficiencies for the muon and elec-
tron for events in which there are more than 100 PMT hits at the time of the µ−. Slightly
tighter criteria, discussed below, are used for the ∼10% of the events with fewer than 100
PMT hits. These two samples are referred to as “high energy µ” and “low energy µ”, respec-
tively. For events in the decay-in-flight sample the event position is best determined from
the reconstructed electron position rather than the reconstructed muon position, especially
for events with low energy muons. Therefore, the fiducial selection is imposed primarily on
the electron. The reconstructed electron position is required to be a distance D > 35 cm
from the surface tangent to the faces of the PMTs. There are 3.65 × 1030 12C nuclei within
this fiducial volume. The muon is required to reconstruct only inside the region D > 0 cm.
A lower limit on the electron energy of 16.0 MeV eliminates the large background from 12B
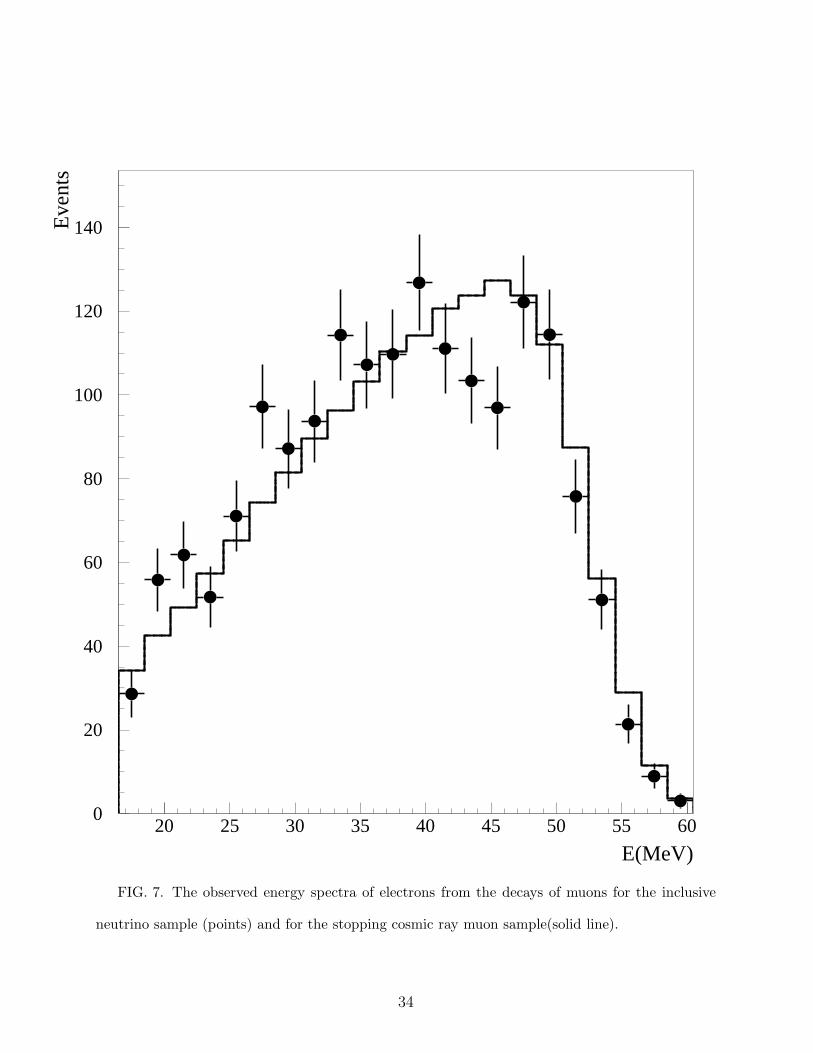
beta decay created by the capture of cosmic ray µ− on 12C. Fig. 7 shows the observed elec-
tron energy distribtuion compared with that obtained from a large clean sample of Michel
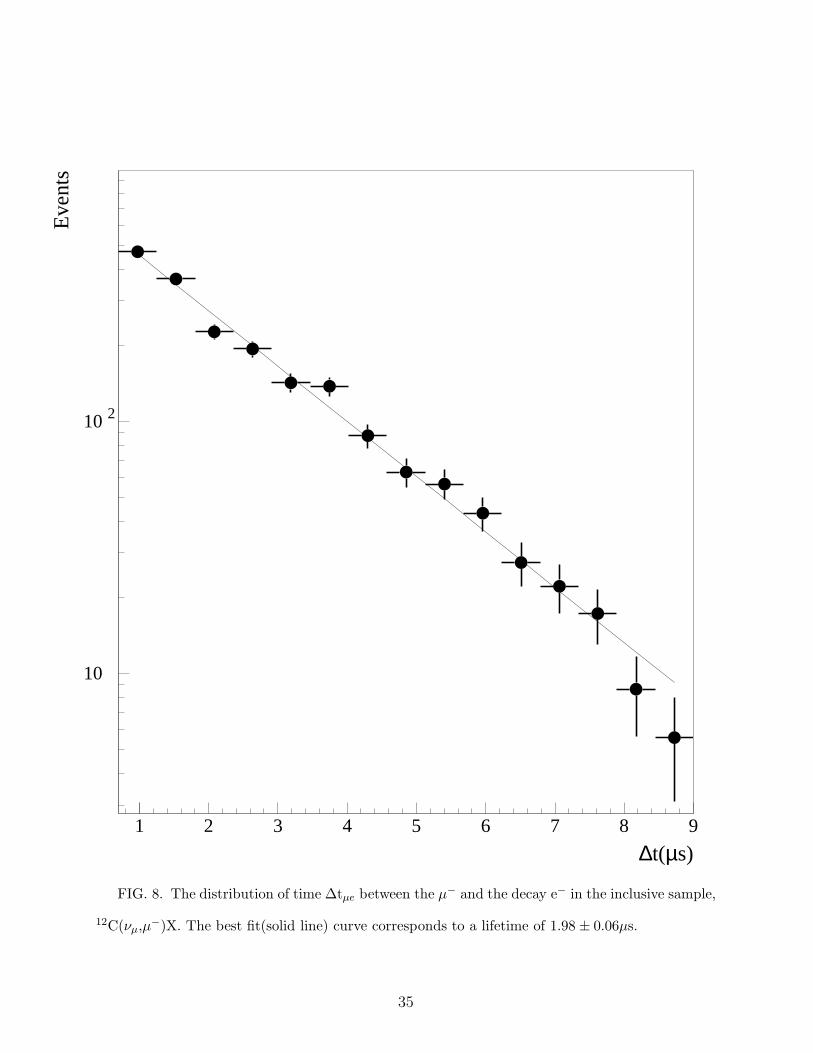
electrons from decays of stopping cosmic ray muons. The distribution of the time, ∆tµe,
between the muon and electron candidates, shown in Fig. 8, agrees well with the 2.03 µs
µ− lifetime in mineral oil. The best fit, also shown, corresponds to a lifetime 1.98 ± 0.06µs.
The requirement ∆tµe ≥ 0.7 µs is imposed to insure that the µ and e are clearly separated
12

in the trigger and in the readout of the data. The excellent agreement with expectations in
Fig. 7 and 8 clearly show that the events arise from muon decay. There is an 8% loss of
events due to µ− capture in the detector medium. Fig. 9 shows the spatial separation, ∆r,
between the reconstructed muon and electron positions. A loose requirement, ∆r < 1.5 m,
is imposed to minimize the background from accidental µ,e correlations while retaining high
acceptance.
Many of the selection criteria are designed to reduce the cosmic ray background, espe-
cially that arising from the decay of cosmic ray muons which stop in the detector. Events
are required to have fewer than 4 PMT hits in the veto at both the muon time and the
electron time. The detector PMT faces are 25 cm inside the tank and thus stopping cosmic
ray muons must traverse at least 60 cm of scintillator to reach the fiducial volume. As a
result these muons typically produce a large detector signal. The requirement Qµ < 2000
pe, where Qµ is the detector signal at the muon time measured in photoelectrons, elim-
inates most such background events with almost no loss of acceptance for muons arising
from neutrino interactions.
Frequently, in addition to the candidate muon which satisfies the criteria in Table I, there
are one or more other activities prior to the electron. If an activity is due to a stopping
muon, that muon could be the parent of the observed electron. Therefore an event is rejected
if, in the 35 µs interval prior to the electron, there is an activity with Q > 3000 pe or an
activity with > 4 PMT hits in the veto and > 100 PMT hits in the detector. This results in
a 7% loss of efficiency for neutrino events. The efficiency for the past activity criteria shown
in Table I also includes the effect of the veto that is applied for 15.2 µs following any event
with > 5 PMT hits in the veto shield.
The acceptances for the past activity and in-time veto cuts are obtained by applying
these cuts to a large sample of events triggered with the laser used for detector calibration.
These laser events are spread uniformly through the run and thus average over the small
variation in run conditions.
Only a loose particle ID requirement, X tot < 1.0, was imposed on the electron and none
13
on the muon. A sample of Michel electrons (electrons from the decay of stopped µ±) was
analyzed to obtain the acceptance of electrons for the χtot particle identification cut as shown
in Fig. 4.
For events in which fewer than 100 PMT hits occur at the muon time (low energy µ
events) tighter selection criteria are needed to keep the beam-off background small. These
tighter criteria are: (1) electron particle ID (X tot < 0.8 instead of 1.0), (2) muon decay
time (∆tµe < 6.6µs instead of 9.0 µs) and (3) a tighter past activity cut. As a result, the
efficiency for this inclusive “low energy µ” sample is only 67 ± 1% of the “high energy µ”
sample efficiency. This includes the small loss of acceptance for muons below the 18 PMT
detection threshold.
The Monte Carlo simulation LSNDMC was used to obtain the PMT hits distributions
expected from the various processes that contribute to the inclusive sample and to the
exclusive sample with an identified beta decay. Fig. 10 compares the observed and expected
distributions of PMT hits for inclusive events. There is excellent agreement, and thus we
expect that the simulation provides a reliable estimate of the fraction of “low energy µ”
events below 18 PMT hits (roughly 4 MeV). For the inclusive sample (exclusive sample) we
find that only 6% (18%) of the “low energy µ” events have fewer than 18 PMT hits. The
overall efficiency for the inclusive (exclusive) “low energy µ” sample is 67% (61%) of the
efficiency for the “high energy µ” sample.
For analysis of the exclusive process 12C(νµ, µ−)12Ng.s. we also require detection of the
e+ from the beta decay of 12Ng.s.. Therefore, for these events three particles are detected:
the muon, the decay electron and the positron from the beta decay of 12Ng.s.. Table II
gives the selection criteria and efficiencies for the 12N beta decay positron. These are the
same criteria [3] used previously in an analysis of a sample of over 500 events from the
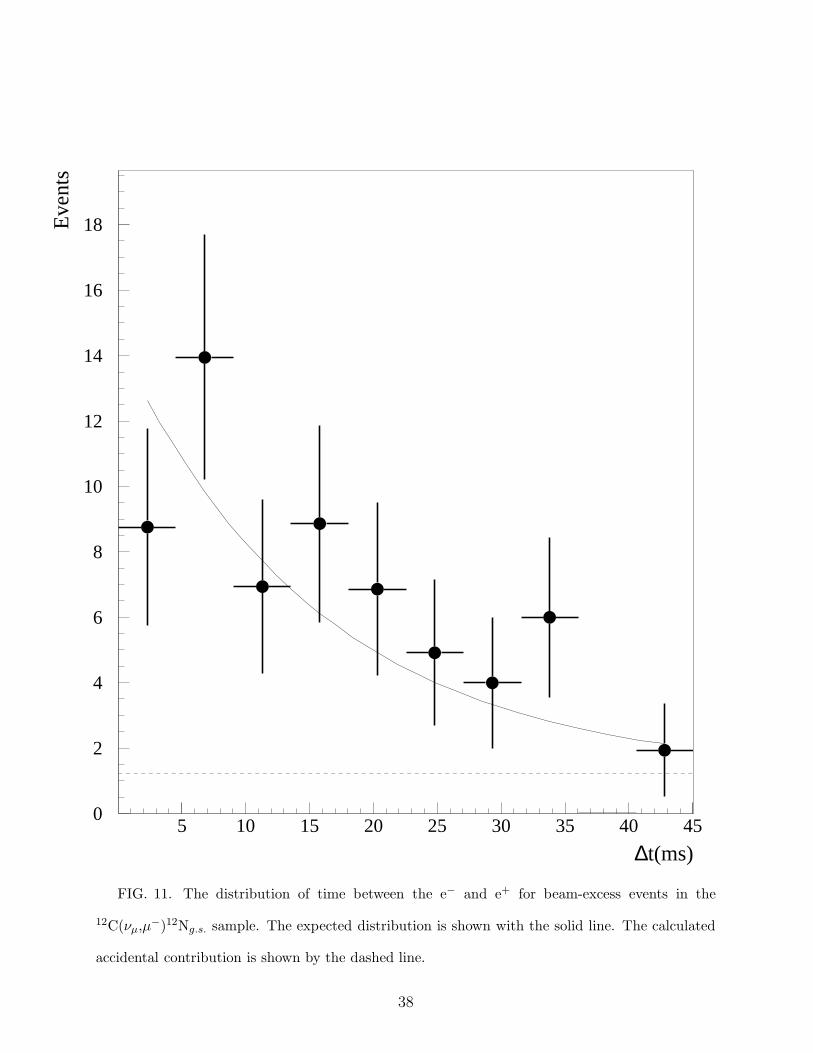
analogous process 12C(νe, e−)12Ng.s.. The beta decay has a mean lifetime of 15.9 ms and
maximum positron kinetic energy of 16.3 MeV. Fig. 11 shows the observed beta decay time
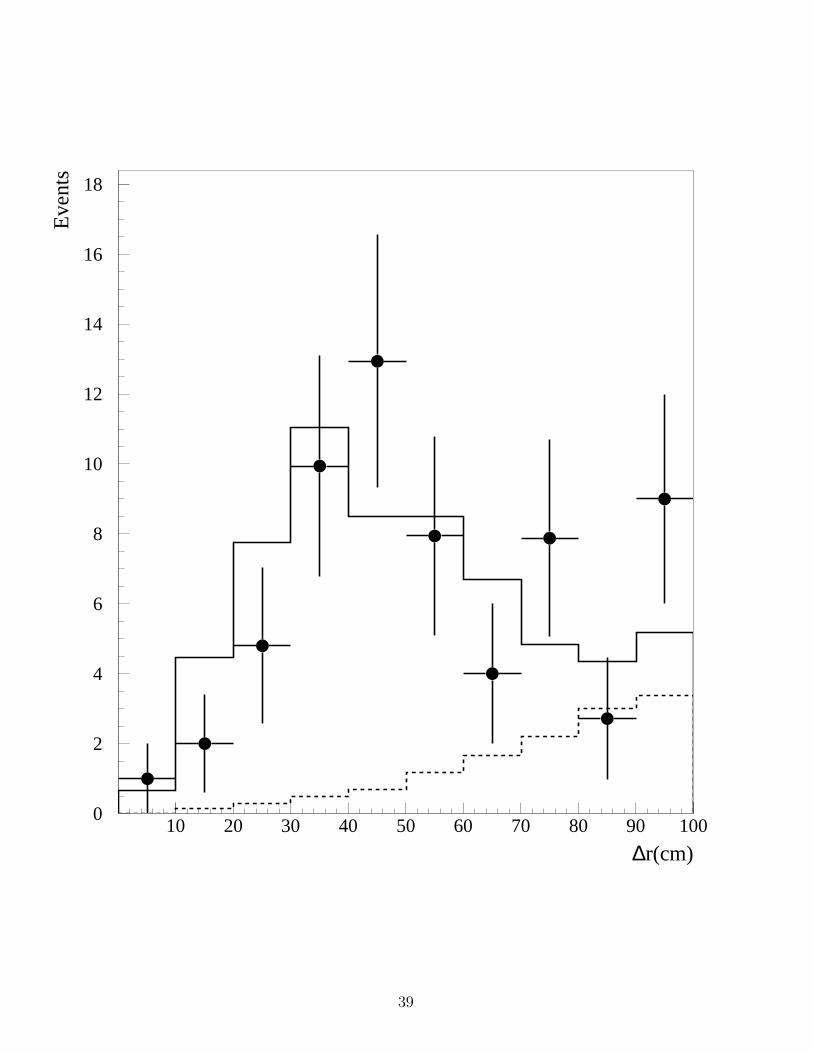
distribution compared with the expected 15.9 ms lifetime. Fig. 12 shows the distance
between the reconstructed electron and positron positions for the beam-excess sample. For
14
comparison, the distribution observed for the 12C(νe, e−)12Ng.s. sample is shown by the solid
line. A cut was applied at 100 cm resulting in an acceptance of (96 ± 2)%. The positron
is required to be spatially correlated with the electron rather than the muon because the
position of the electron in general is better determined. Following a muon produced by a
neutrino interaction, an uncorrelated particle, such as the positron from 12B beta decay, will
occasionally satisfy all the positron criteria including the requirements of time (45 ms) and
spatial (1 m) correlation with the electron. The probability of such an accidental coincidence
can be precisely measured from the Michel electron sample. The background from this source
is also shown in Figs. 11 and 12. The efficiency of 81.5% caused by the 15.2 µs veto and the
trigger dead time of 3% are the same as for the electron. Positrons with 4 or more in-time
veto hits or any bottom veto coincidence are rejected. The Monte Carlo was used to generate
expected distributions for the positron energy. There was a trigger requirement of 100 PMT
hits for 1994 and 75 PMT hits for 1995. The positron was required to have an energy less
than 18 MeV. Fig. 13 compares the observed and expected positron energy distributions.
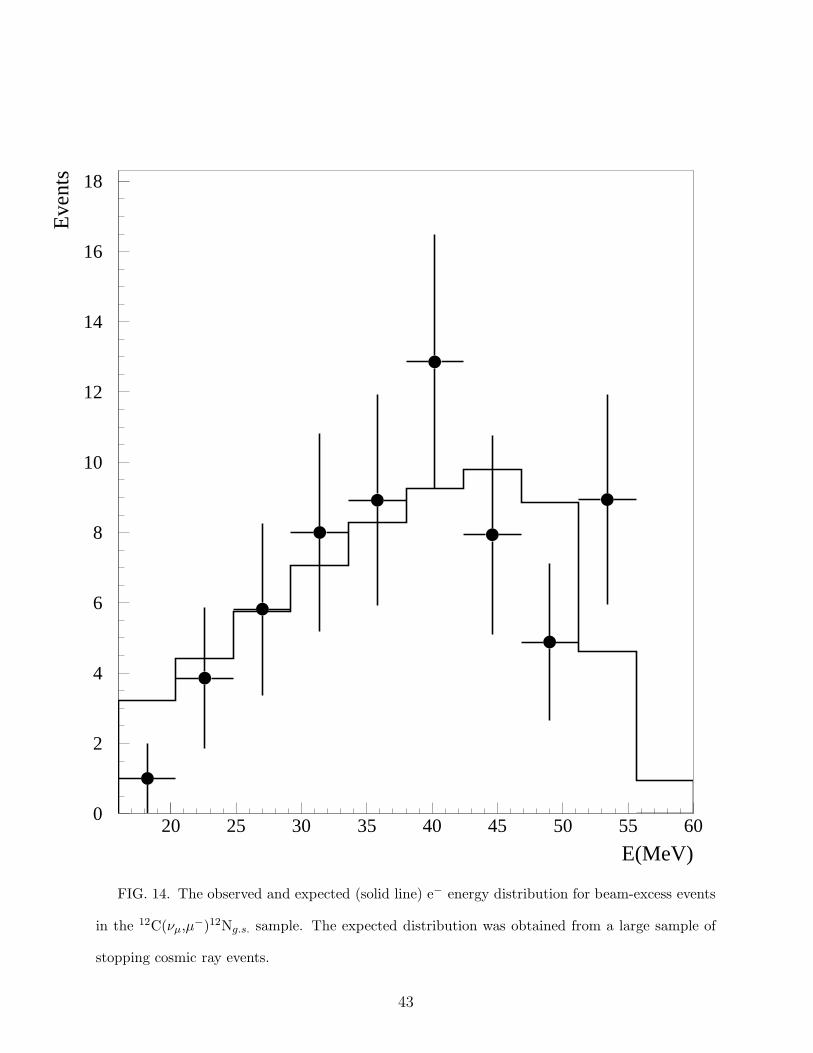
Fig. 14 compares the observed and expected energy distributions of the electron from the
muon decay, and Fig. 15 compares the observed and expected distributions of muon decay
time.
Table III shows the numbers of beam-on, beam-off and beam-excess events satisfying the
“high energy µ” and “low energy µ” selection criteria. The “low energy µ” events are given
a weight to compensate for the lower efficiency for this sample. This allows the relatively
small “low energy µ” sample to be combined with the “high energy µ” sample for the rest
of the analysis. The sample of inclusive µ-e events is used for the analysis of the reaction
νµ+12C → µ−+ X, while the exclusive sample of events with an identified beta decay is used
for analysis of the reaction νµ+12C → µ−+12Ng.s..
15

VI. THE TRANSITION TO THE 12N GROUND STATE
The reaction νµ+12C →12Ng.s. + µ− is identified by the detection of the µ−, the e− from
the decay µ− → e−+νµ + ν̄e and the positron from the β decay of the 12Ng.s.. This three-fold
delayed coincidence requirement provides a distinctive event signature. Excited states of 12N
decay by prompt proton emission and thus do not feed down to the 12N ground state or
contribute to the delayed coincidence rate. The form factors required to calculate the cross
section are well known from a variety of previous measurements [4]. This cross section and
the known νµ flux are used to obtain the expected muon kinetic energy spectrum which is
compared with the data in Fig. 16.
As stated in Section IV the energy calibration for muons (the conversion from photo-
electrons to MeV) is obtained from the Monte Carlo simulation LSNDMC. For this ground
state reaction, the expected muon energy distribution should be very reliable. Thus the good
agreement seen in Fig. 16 provides confirmation for the muon energy calibration within the
limited statistics.
There are two sources of background. The largest arises from the accidental coincidence
of a positron candidate with an event from the inclusive sample of neutrino-induced muons.
The probability of an uncorrelated particle satisfying all the positron criteria, including
the requirements of time (45 ms) and spatial correlation (1 m) with the electron, can be
precisely measured from a large Michel electron sample. The probability was 0.57% for 1994
and 0.84% for 1995. The probability is higher in 1995 because a lower PMT threshold was
required that year for the positron. The second background arises from the process 12C(ν̄µ,
µ+)12Bg.s., where we detect the e− from the beta decay of the 12B ground state [20]. This
background is small primarily because the flux of high energy ν̄µ is approximately a factor
of ten lower than the corresponding νµ flux and because the 12Bg.s. lifetime is longer than
the 12Ng.s. lifetime.
Table IV shows the number of beam excess events, the number of background events,
the “high energy µ” efficiency, the neutrino flux for Eν > 123.1 MeV and the cross section
16

averaged over the flux. The predicted flux-averaged cross section shown in Table IV was
calculated for the flux shape for the 1994 LSND beam dump configuration and not for the
average of the two years of data. Therefore, the measured flux-averaged cross section in
Table IV has been adjusted slightly so that it also corresponds to the 1994 configuration.
The flux-averaged cross section is
< σ >= (6.6 ± 1.0 ± 1.0) × 10−41cm2,
where the first error is statistical and the second systematic. The two dominant sources of
systematic error are the neutrino flux (15%) discussed in section II and the effective fiducial
volume (6%) discussed in section IV. The measured cross section is in very good agreement
with the predicted cross section of 6.4 × 10−41 cm2 [20]. There is very little uncertainty
in this predicted cross section for the exclusive process, as it is determined from measured
form factors in related electro-weak processes. If we assume that it is correct, we can use our
measurement to determine the νµ flux instead of the cross section. This yields a value for the
νµ flux above the muon production threshold that is (105±16)% of the value calculated using
the beam Monte Carlo, if we assume the shape of the νµ flux is correctly given by the Monte
Carlo. This excellent agreement provides a valuable confirmation of our understanding of
the flux from the neutrino source.
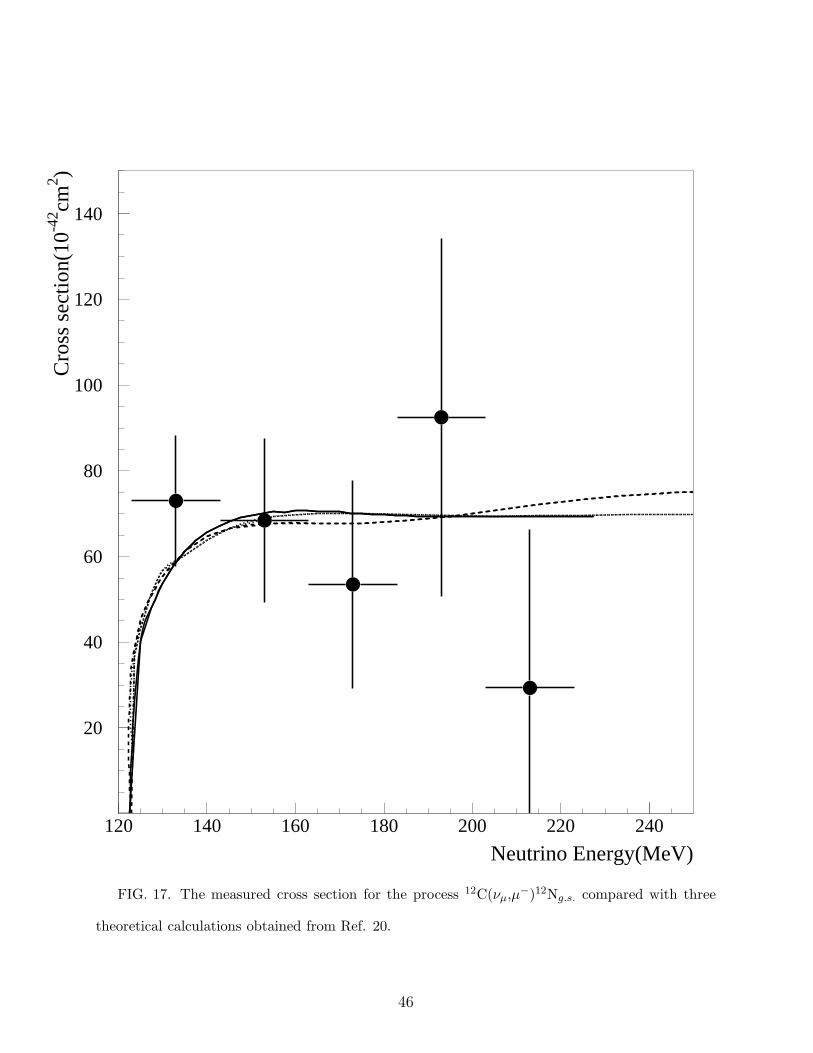
For this reaction to the 12N ground state it is also straightforward to measure the energy
dependence of the cross section. The recoil energy of the nucleus is small and to a very
good approximation, Eν = mµc2+ Tµ + 17.7 MeV, where mµ is the muon mass, Tµ the
muon kinetic energy and 17 .7 MeV arises from the Q value of the reaction and the nuclear
recoil. Fig. 17 compares the measured cross section as a function of Eν with four theoretical
calculations obtained from Ref. 20. The agreement is excellent within the limited statistics.
VII. THE INCLUSIVE REACTION
Most of the inclusive beam-excess events arise from the reaction 12C(νµ, µ−)X, but
approximately 10% are due to other sources. Table V shows the number of beam-excess
17

events, the calculated backgrounds, the “high energy µ” efficiency, νµ flux and the flux-
averaged cross section for this process. The backgrounds arising from the ν̄µ component of
the decay-in-flight beam are small, primarily because the high energy ν̄µ flux is approximately
a factor of ten lower than the corresponding νµ flux. The largest background arises from
the process ν̄µ+ p → µ++ n. The cross section is well known and the uncertainty in this
process is mainly due to the 15% uncertainty in the ν̄µ flux. A much smaller but less well
understood background arises from the process 12C(ν̄µ, µ+)X. Plausibly, as observed for the
process 12C(νµ, µ−)X, the cross section might be expected to be approximately 60% of that
given by a recent CRPA calculation [8]. We use this reduced cross section in calculating this
background but assign a large error to reflect the uncertainty in the cross section. An even
smaller background arises from the 1.1% 13C component of the scintillator. For the process
13C(νµ, µ−)X we use a Fermi Gas Model calculation and assign a 50% uncertainty.
The measured flux-averaged cross section for the inclusive reaction 12C(νµ, µ−)X is
< σ >= (11.2 ± 0.3 ± 1.8) × 10−40cm2,
where the first error is statistical and the second systematic. The mean energy of the
neutrino flux above threshold is 156 MeV. The systematic error is due almost entirely to
the uncertainty in the νµ flux. The inputs to the neutrino beam Monte Carlo program were
varied within the estimated uncertainties. The resulting variation in both the magnitude and
the shape of the νµ flux above muon production threshold results in a 15% uncertainty in the
inclusive cross section. As discussed in section VI, the flux-averaged cross section has been
adjusted so that it corresponds to the flux shape from the 1994 beam dump configuration
and not the average of the two years of data. This was done to permit direct comparison
with the CRPA calculation of Ref. [8] which was performed for the 1994 νµ flux. Ref. [8]
predicts a flux-averaged cross section of 20.5 × 10−40cm2 which is significantly higher than
that measured. The measured cross section reported in this paper is 2σ higher than that
originally reported by LSND [6]. A substantial part of the increase arises from a better
understanding of the loss of acceptance due to the spatial reconstruction program shifting
18
events outward as discussed in section IV.
The spatial distribution of the beam-excess electrons is shown in Fig. 18. There is a
clear enhancement of events at high x and high y due to the variation of the νµ flux over
the detector. The good agreement with expectation shows that this spatial distribution is
well modeled by the beam simulation program.
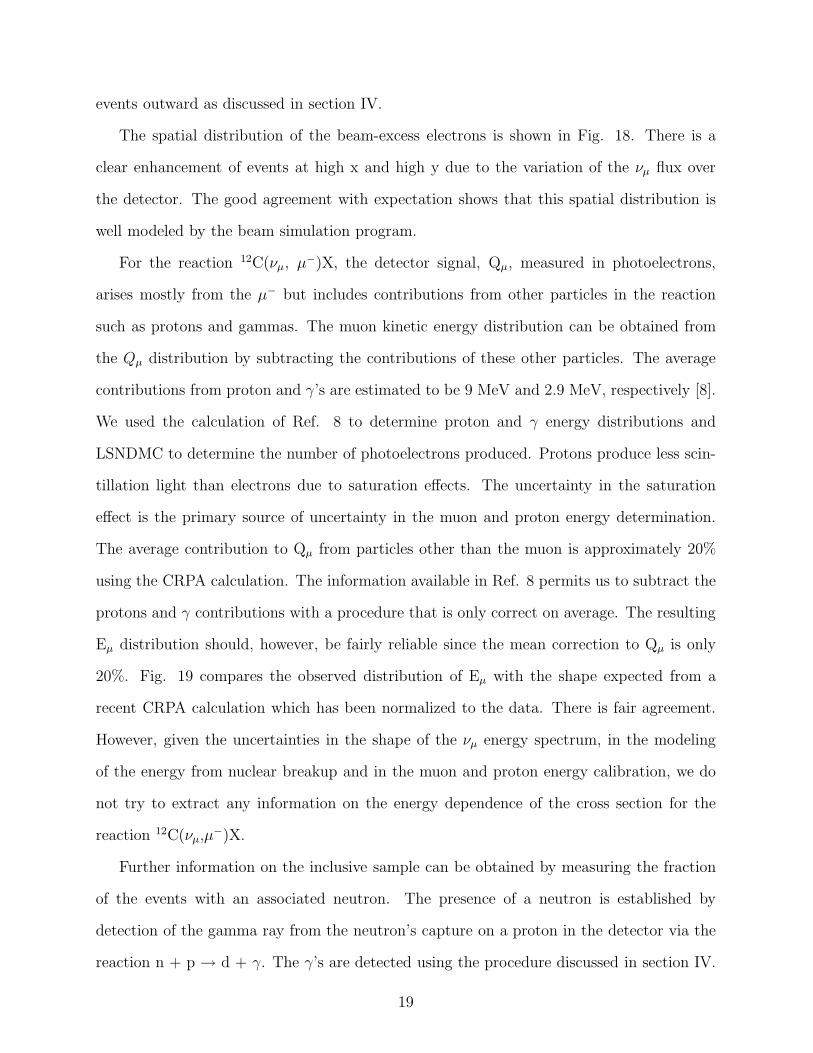
For the reaction 12C(νµ, µ−)X, the detector signal, Qµ, measured in photoelectrons,
arises mostly from the µ− but includes contributions from other particles in the reaction
such as protons and gammas. The muon kinetic energy distribution can be obtained from
the Qµ distribution by subtracting the contributions of these other particles. The average
contributions from proton and γ’s are estimated to be 9 MeV and 2.9 MeV, respectively [8].
We used the calculation of Ref. 8 to determine proton and γ energy distributions and
LSNDMC to determine the number of photoelectrons produced. Protons produce less scin-
tillation light than electrons due to saturation effects. The uncertainty in the saturation
effect is the primary source of uncertainty in the muon and proton energy determination.
The average contribution to Qµ from particles other than the muon is approximately 20%
using the CRPA calculation. The information available in Ref. 8 permits us to subtract the
protons and γ contributions with a procedure that is only correct on average. The resulting
Eµ distribution should, however, be fairly reliable since the mean correction to Qµ is only
20%. Fig. 19 compares the observed distribution of Eµ with the shape expected from a
recent CRPA calculation which has been normalized to the data. There is fair agreement.
However, given the uncertainties in the shape of the νµ energy spectrum, in the modeling
of the energy from nuclear breakup and in the muon and proton energy calibration, we do
not try to extract any information on the energy dependence of the cross section for the
reaction 12C(νµ,µ−)X.
Further information on the inclusive sample can be obtained by measuring the fraction
of the events with an associated neutron. The presence of a neutron is established by
detection of the gamma ray from the neutron’s capture on a proton in the detector via the
reaction n + p → d + γ. The γ’s are detected using the procedure discussed in section IV.
19
The distribution of the likelihood ratio R for correlated γ’s from neutron capture is very
different from that for uncorrelated (accidental) γ’s. The measured R distribution for the
inclusive sample, shown in Fig. 20, was fit to a mixture of the two possible gamma sources
to determine the fraction of events with associated neutrons. The best fit, also shown in the
figure, corresponds to a fraction of events with a neutron of (10.8 ± 1.8)%, where the error
includes systematic uncertainties.
The two largest backgrounds shown in Table V arise from the ν̄µ component of the
beam, and almost all of these events should have an associated neutron. In contrast, most
of the events arising from νµ interactions will not have an associated neutron. A CRPA
calculation predicts that 79% of the events from the reaction 12C(ν̄µ,µ+)X will have an
associated neutron compared to only 5.9% for the reaction 12C(νµ,µ−)X [8].
Table VI shows the measured component with an associated neutron for the beam excess
sample, the calculated backgrounds from ν̄µ interactions and the resulting numbers for the
νµ carbon sample. The percentage of events with neutrons for the νµ carbon sample, (1.9
± 2.6)%, is lower than but consistent with the CRPA prediction of 5.9%. The observed
number of events with neutrons also rules out a ν̄µ flux much bigger than that calculated
by the beam Monte Carlo.
VIII. CONCLUSIONS
The exclusive process 12C(νµ,µ−)12Ng.s. has been measured with a clean sample of 56.8
± 9.6 events for which the µ−, the decay e− and the e+ from the beta decay of the 12Ng.s. are
detected. For this process the cross section calculations are very reliable. The flux-averaged
cross section is measured to be (6.6±1.0±1.0)×10−41 cm2 in good agreement with theoretical
expectations. From comparison of this cross section with the cross section for the inclusive
process 12C(νµ,µ−)X we obtain a flux-averaged branching ratio of (5.9 ± 0.9 ± 0.6)%
The inclusive process 12C(νµ,µ−)X has also been measured. There are model dependent
uncertainties in the calculated cross section for this process that are not present for the
20

12Ng.s. cross section. The flux-averaged cross section is found to be (11.2±0.3±1.8)×10−40
cm2, about 55% of a recent CRPA calculation [8]. The mean energy of the neutrino flux
above threshold is 156 MeV. The measured distribution of the muon energy (including
contributions from other particles such as protons and gammas) agrees within errors with
the CRPA calculation [8]. The fraction of events with associated neutrons was measured to
be (1.9 ± 2.6)%. This is lower than, but consistent with, the CRPA calculation of 5.9%.
As discussed above, there has been considerable interest in the fact that our observed
cross section for the inclusive reaction νµ+12C → µ−+ X is only 0.55 ± 0.09 of the result
obtained in a sophisticated CRPA calculation [8] for the same process. Such CRPA calcu-
lations have to be tuned to fit the cross sections to final bound states, but without further
adjustments to continuum final states. The CRPA calculation also reproduces the inclusive
cross section (to well within the 17% experimental error) for the process νe+12C → e−+
12N∗, where the νe arise from µ+ decay at rest (Eν < 52.8 MeV) [3]. The situation has
been discussed in some detail in Ref. 8 but we wish to make some further observations.
First, the agreement between the CRPA calculation of νµ+12C → µ−+ X and the newer
data presented here is better, 55 ± 9% rather than 43±9%. A possible reason that the cal-
culation agrees with µ− capture and the low energy νe inclusive scattering but fails in the
case of the higher energy νµ is that both the muon capture and the νe processes involve only
low partial waves l = 0, 1. The momentum transfers for the νµ reaction (100-400 MeV/c)
are much larger than for the lower energy νe and muon capture processes (<100 MeV/c).
Thus the former reaction can involve partial waves through l = 3, 4, values not probed by
the lower energy processes. It is necessary to point out that no conclusion can be drawn
from our results on the ratio of νµ to νe cross sections as the measurements involved very
different neutrino energies and momentum transfers. However, it appears that factor of two
discrepancies may exist between sophisticated calculations and measured inclusive yields.
This makes it difficult to have confidence that for the lower energy atmospheric neutrino
data [21,22], which is only slightly above the LSND energy region, the observed lepton rates
can be reliably converted into absolute neutrino fluxes.
21

Acknowledgments The authors gratefully acknowledge the support of Peter Barnes,
Cyrus Hoffman, and John McClelland. This work was conducted under the auspices of
the US Department of Energy, supported in part by funds provided by the University of
California for the conduct of discretionary research by Los Alamos National Laboratory. This
work is also supported by the National Science Foundation. We are particularly grateful
for the extra effort that was made by these organizations to provide funds for running the
accelerator at the end of the data taking period in 1995.
22

TABLES
TABLE I. The muon and electron selection criteria and corresponding efficiencies for events
with more than 100 PMT hits at the muon time.
Quantity Criteria Efficiency
Fiducial Volume e D>35.0 cm 0.850±0.050
Fiducial Volume µ D>0 0.950±0.005
Electron Energy 16<Ee<60 MeV 0.890±0.005
Muon Charge Q<2000 pe 0.990±0.010
Electron Particle ID χtot<1.0 0.976±0.005
Intime Veto µ, e <4 PMTs 0.984±0.007
Past Activity ∆tp>35 µs 0.750±0.010
µ Decay Time 0.7<t<9.0 µs 0.687±0.005
Not µ− Capture 0.922±0.005
Spatial Correlation ∆r<1.5 m 0.993±0.002
DAQ Dead Time 0.970±0.010
Total 0.313±0.020
23

TABLE II. Beta decay e+ selection criteria and corresponding efficiencies for the reaction
12C(νµ, µ−)12Ng.s..
Quantity Criteria Efficiency
β Decay Time 52 µs<t<45 ms 0.938±0.002
Spatial Correlation ∆r<1 m 0.964±0.020
PMT Threshold >100 for 1994, >75 for 1995 0.823±0.015
Fiducial Volume D>0 cm 0.972±0.010
Trigger Veto >15.2 µs 0.815±0.005
Intime Veto <4 PMTs 0.992±0.001
DAQ Dead Time 0.970±0.010
Total 0.568±0.017
TABLE III. Inclusive events and events with an identified beta decay. Events are classified as
“high energy µ” (“low energy µ”) if there are more than (less than) 100 PMT hits at the time of
the muon. The “low energy µ” events are given a weight to compensate for the reduced efficiency
for the “low energy µ” sample.
Inclusive Events Events with beta decay
“high energy µ” “low energy µ” “high energy µ” “low energy µ”
>100 PMTs <100 PMTs >100 PMTs <100 PMTs
Beam-on 1755 176 47 16
Beam-off × Duty Ratio 39 23 1 0
Beam-excess × Weight 1716 153 × 1.48 46 16 × 1.65
Total beam-excess 1942 ± 46 72.4 ± 9.5
24

TABLE IV. Beam-excess events, background, efficiency, neutrino flux and flux-averaged cross
section for the exclusive reaction 12C(νµ, µ−)12Ng.s.
Corrected beam excess events 72.4 ± 9.5
ν̄µ+12C → µ++12Bg.s. background 2.0 ± 0.4
accidental e+ background 13.6 ± 1.4
νµ+12C → µ−+12Ng.s. 56.8 ± 9.6
“high energy µ” efficiency 0.178 ± 0.013
νµ flux (Eν > 123.1 MeV) 1.33 × 1012 cm−2
< σ > measured (6.6 ± 1.0 ± 1.0) × 10−41 cm2
< σ > theory 6.4 × 10−41 cm2
TABLE V. Beam excess events, background, efficiency, neutrino flux and flux averaged cross
section for the inclusive reaction 12C(νµ, µ)X.
Corrected Beam-excess events 1942 ± 46
ν̄µ+ p → µ++ n background 140 ± 22
ν̄µ+12C → µ++ X background 46 ± 23
νµ+13C → µ−+ X background 18 ± 9
νµ+12C → µ−+ X 1738 ± 56
“high energy µ” efficiency 0.313 ± 0.020
νµ Flux (Eν >123.1 MeV) 1.33 ×1012 cm2
< σ > measured (11.2±0.3 ± 1.8)10−40 cm2
< σ > CRPA model 20.5 × 10−40 cm2
25
TABLE VI. The expected and observed numbers of events with associated neutrons and the
calculated background from ν̄µ reactions.
Events from Fraction Events with
Source Table V with neutron neutron
Beam Excess 1942 (10.8±1.8)% 210 ± 35
ν̄µ p → µ+ n 140 100% 140±22
ν̄µ C → µ+ nX 46 79% 36±18
νµC → µ−X 1756 1.9±2.6% 34±45
26
FIGURES
Neutrino Energy(MeV)
Flux
0 50 100 150 200 250 300
27
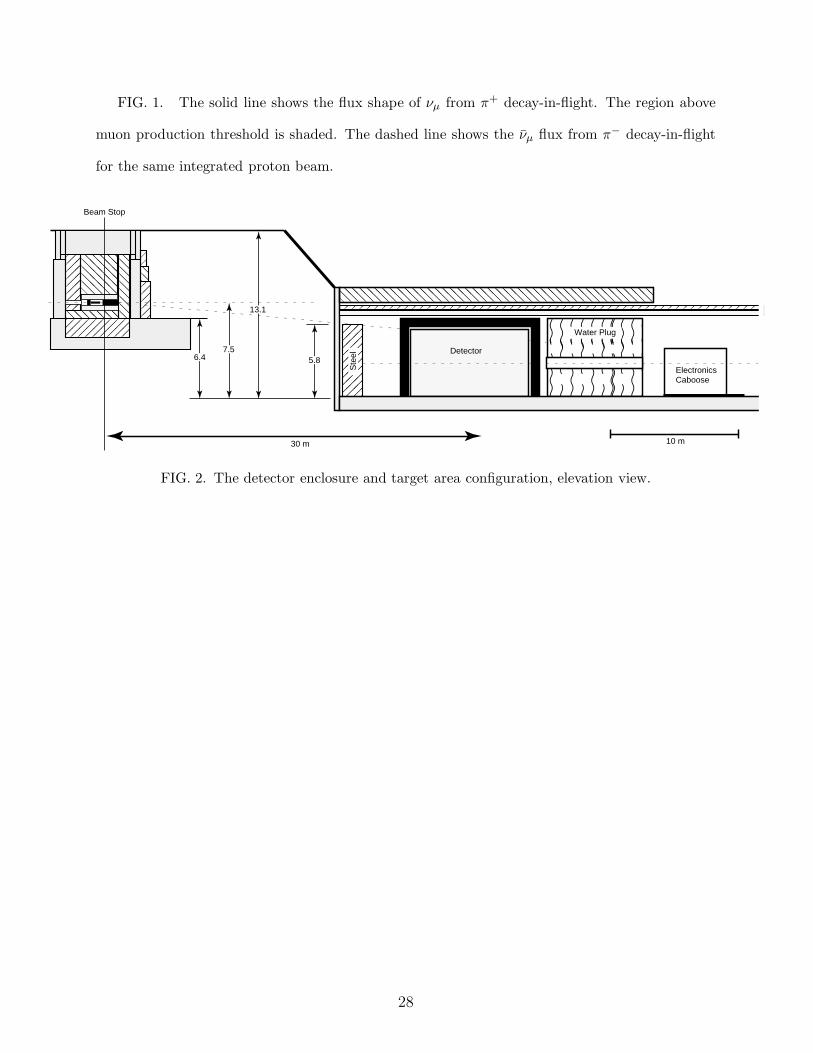
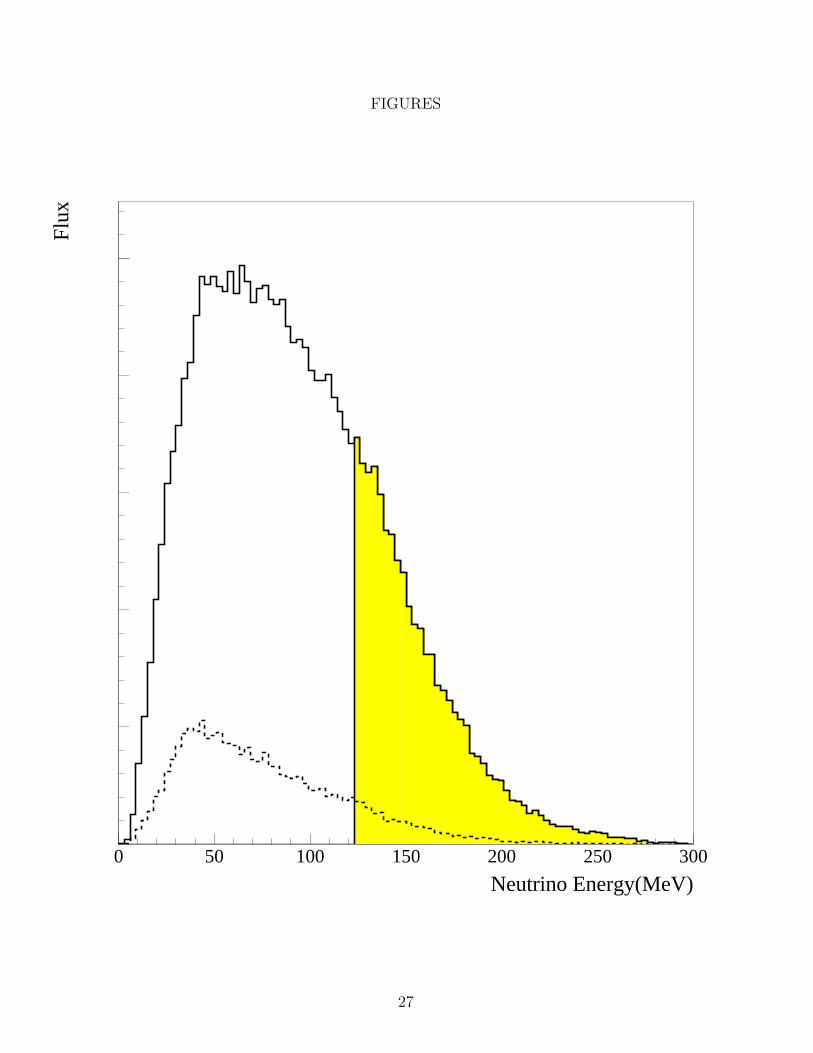
FIG. 1. The solid line shows the flux shape of νµ from π+ decay-in-flight. The region above
muon production threshold is shaded. The dashed line shows the ν̄µ flux from π− decay-in-flight
for the same integrated proton beam.
ElectronicsCaboose����Water Plug
Detector������������������������������������������������������������yyyyyyyyyyyyyyyyyyyyyyyyyyyyyyyyyyyyyyyyyyyyyyyyyyyyyyyyyyyyS
teel
������������������������������������������������������������������������������������������������������������������yyyyyyyyyyyyyyyyyyyyyyyyyyyyyyyyyyyyyyyyyyyyyyyyyyyyyyyyyyyyyyyyyyyyyyyyyyyyyyyyyyyyyyyyyyyyyyyyyyyyyyyyyyyyyyyyyy���������������������������������������������������������������������������������������������������������������������������������yyyyyyyyyyyyyyyyyyyyyyyyyyyyyyyyyyyyyyyyyyyyyyyyyyyyyyyyyyyyyyyyyyyyyyyyyyyyyyyyyyyyyyyyyyyyyyyyyyyyyyyyyyyyyyyyyyyyyyyyyyyyyyyyy������������������yyyyyyyyyyyyyyyyyy��yy ��yy10 m
��������������yyyyyyyyyyyyyy������������yyyyyyyyyyyy����yyyy�������������������������������������������������������yyyyyyyyyyyyyyyyyyyyyy������������������������yyyyyyyyyyyyyyyyyyyyyyyy������������������������������������yyyyyyyyyyyyyyyyyyyyyyyyyyyyyyyyyyyy������������������������������������������yyyyyyyyyyyyyyyyyyyyyyyyyyyyyyyyyyyyyyyyyyBeam Stop
30 m
����������5.8
7.56.4
13.1
FIG. 2. The detector enclosure and target area configuration, elevation view.
28
Energy(MeV)
Eve
nts
0
0.01
0.02
0.03
0.04
0.05
0.06
0.07
0.08
10 20 30 40 50 60 70
FIG. 3. The energy distribution for Michel electrons from data (solid) and simulation (dashed).
29
χtot
0
0.02
0.04
0.06
0.08
0.1
0.12
0.14
0.16
0.18
0 0.5 1 1.5 2 2.5 3
FIG. 4. Particle ID parameter for “electrons” (shaded) and “neutrons”.
30
0
1000
2000
3000
0 200 400 600 800 1000∆t (µs)
num
ber
even
ts
0
2000
4000
25 30 35 40 45 50number of γ PMT hits
num
ber
of e
vent
s
0
1000
2000
0 200 400 600 800∆r (cm)
num
ber
of e
vent
s
(a)
(b)
(c)
31

FIG. 5. Distributions obtained from cosmic-ray neutron data for γ’s that are correlated (solid)
or uncorrelated (dashed) with the primary event: (a) the time between the photon and primary
event; (b) the number of photon PMT hits; and (c) the distance between the photon and primary
event. The raw data points are also shown in (a).
32

R
Eve
nts
1
10
10 2
10 3
10-1
1 10 102
FIG. 6. The measured R distribution for events with the γ correlated (solid) or uncorrelated
(dashed) with the primary event. Also shown is the observed R distribution for a neutrino process
with no correlated γ’s, 12C(νe,e−)12Ng.s..
33
E(MeV)
Eve
nts
0
20
40
60
80
100
120
140
20 25 30 35 40 45 50 55 60
FIG. 7. The observed energy spectra of electrons from the decays of muons for the inclusive
neutrino sample (points) and for the stopping cosmic ray muon sample(solid line).
34
∆t(µs)
Eve
nts
10
10 2
1 2 3 4 5 6 7 8 9
FIG. 8. The distribution of time ∆tµe between the µ− and the decay e− in the inclusive sample,
12C(νµ,µ−)X. The best fit(solid line) curve corresponds to a lifetime of 1.98 ± 0.06µs.
35

∆r(cm)
Eve
nts
0
50
100
150
200
250
300
350
400
20 40 60 80 100 120 140
FIG. 9. The distribution of the distance between the reconstructed position of the µ− and the
e− in the beam-excess inclusive sample, 12C(νµ,µ−)X.
36

Number of PMT hits
Eve
nts
0
10
20
30
40
50
60
70
0 100 200 300 400 500 600
FIG. 10. The observed PMT hit distribution for the decay-in-flight sample (including
νµC → µ−X, ν̄µC → µ+X, and ν̄µp → µ+n). The solid histogram is the prediction from the
Monte Carlo simulation, normalized to the data.
37
∆t(ms)
Eve
nts
0
2
4
6
8
10
12
14
16
18
5 10 15 20 25 30 35 40 45
FIG. 11. The distribution of time between the e− and e+ for beam-excess events in the
12C(νµ,µ−)12Ng.s. sample. The expected distribution is shown with the solid line. The calculated
accidental contribution is shown by the dashed line.
38
∆r(cm)
Eve
nts
0
2
4
6
8
10
12
14
16
18
10 20 30 40 50 60 70 80 90 100
39

FIG. 12. The distribution of the distance between the reconstructed positions of e− and e+ for
beam-excess events in the 12C(νµ,µ−)12Ng.s. sample. The dashed line shows the calculated acciden-
tal contribution. The solid line shows the expected shape (including the accidental contribution)
obtained with a large sample of events from the reaction 12C(νe,e−)12Ng.s..
40

E(MeV)
Eve
nts
0
2.5
5
7.5
10
12.5
15
17.5
20
22.5
0 2 4 6 8 10 12 14 16 18 20
41
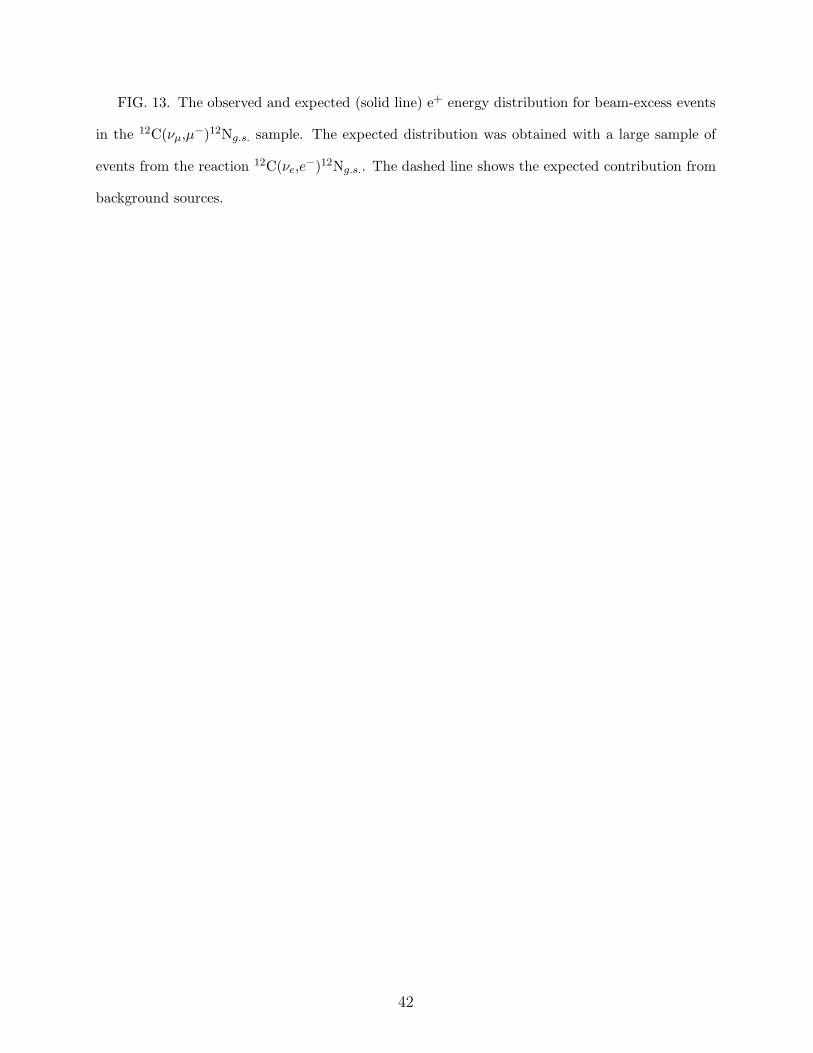
FIG. 13. The observed and expected (solid line) e+ energy distribution for beam-excess events
in the 12C(νµ,µ−)12Ng.s. sample. The expected distribution was obtained with a large sample of
events from the reaction 12C(νe,e−)12Ng.s.. The dashed line shows the expected contribution from
background sources.
42
E(MeV)
Eve
nts
0
2
4
6
8
10
12
14
16
18
20 25 30 35 40 45 50 55 60
FIG. 14. The observed and expected (solid line) e− energy distribution for beam-excess events
in the 12C(νµ,µ−)12Ng.s. sample. The expected distribution was obtained from a large sample of
stopping cosmic ray events.
43

∆t(µs)
Eve
nts
0
2.5
5
7.5
10
12.5
15
17.5
20
22.5
1 2 3 4 5 6
FIG. 15. The obtained and expected (solid line) distribution of time between the µ− and the
subsequent decay e− for beam-excess events in the 12C(νµ,µ−)12Ng.s. sample.
44

E(MeV)
Eve
nts
0
2.5
5
7.5
10
12.5
15
17.5
20
0 10 20 30 40 50 60 70 80 90 100
FIG. 16. The observed and expected (solid line) µ− kinetic energy distribution for beam ex-
cess-events in the 12C(νµ,µ−)12Ng.s. sample.
45
Neutrino Energy(MeV)
Cro
ss s
ectio
n(10
-42 cm
2 )
20
40
60
80
100
120
140
120 140 160 180 200 220 240
FIG. 17. The measured cross section for the process 12C(νµ,µ−)12Ng.s. compared with three
theoretical calculations obtained from Ref. 20.
46

x(cm)
Eve
nts
y(cm)
Eve
nts
z(cm)
Eve
nts
0
50
100
150
-200 -150 -100 -50 0 50 100 150 200
0
50
100
150
-150 -100 -50 0 50 100 150 200
0
50
100
-300 -200 -100 0 100 200 300
FIG. 18. The observed spatial distribution of beam-excess electrons compared with the ex-
pected (solid line) distribution for the process 12C(νµ,µ−)12X
47

E(MeV)
Eve
nts
0
100
200
300
400
500
600
700
800
900
0 20 40 60 80 100 120
FIG. 19. The observed and expected distribution of the muon kinetic energy, Eµ, for the
inclusive decay-in-flight sample. The expected distribution has been normalized to the data.
48

R
Eve
nts
1
10
10 2
10 3
10-1
1 10 102
49

FIG. 20. The observed distribution of the γ likelihood ratio R for the inclusive decay-in-flight
sample. Shown for comparison are the correlated distribution (dotted line), the uncorrelated
distribution (dashed line) and the best fit (solid line) to the data which has a (10.8±1.8)% correlated
component.
REFERENCES
1. D.A. Krakauer et al., Phys. Rev. C 45, 2450 (1992).
2. B.E. Bodmann et al., Phys. Lett. B 332, 251 (1994).
3. C. Athanassopoulos et al., Phys. Rev. C 55, 2078 (1997).
4. M. Fukugita et al., Phys. Lett. B 212, 139 (1988).
5. E. Kolbe, K. Langanke and S. Krewald, Phys. Rev. C 49, 1122 (1994).
6. M. Albert et al., Phys. Rev. C 51, 1065 (1995).
7. H.J. Kim et. al Proceedings of the 14th International Conference on Particles and
Nuclei (PANIC 96), 583 (1996).
8. E. Kolbe et al., Phys. Rev. C 52, 3437 (1995).
9. A. C. Hayes, paper presented at the Joint APS/AAPT meeting, April, 18-21, 1997
10. D.D. Koetke et al., Phys. Rev. C 46, 2554 (1992).
11. C. Athanassopoulos et al., Phys. Rev. C 54, 2685 (1996).
12. C. Athanassopoulos et al., submitted to Nucl. Instrum. Methods.
13. S. Willis et al., Phys. Rev. Lett. 44, 522 (1980).
14. S.J. Freedman et al., Phys. Rev. D 47, 811 (1993).
15. R.C. Allen, et al., Nucl. Instrum. Methods A 284, 347 (1989).
50

16. R.L. Burman, M.E. Potter and E.S. Smith, Nucl. Instrum. Methods A 291, 621
(1990).
17. R.A. Reeder et al., Nucl. Instrum. Methods A 334, 353 (1993).
18. J. Napolitano, et al., Nucl. Instrum. Methods A 274, 152 (1989).
19. K. McIlhany, et al., Proceedings of the Conference on Computing in High Energy
Physics, April 1994, LBL Report 35822, 357 (1995).
20. J. Engel, E. Kolbe, K. Langanke and P. Vogel, Phys. Rev. C 54, 2740 (1996).
21. R. Becker-Szendy et al. (IMB Collaboration), Phys. Rev. D 46, 3270 (1992).
22. K. S. Hirata et al. (Kamiokande Collaboration), Phys. Lett. B 280 146 (1992).
51