High Functional Diversity in Mycobacterium tuberculosis Driven by Genetic Drift and Human Demography
14
High Functional Diversity in Mycobacterium tuberculosis Driven by Genetic Drift and Human Demography Ruth Hershberg 1[ , Mikhail Lipatov 1[ , Peter M. Small 2,3 , Hadar Sheffer 2 , Stefan Niemann 4 , Susanne Homolka 4 , Jared C. Roach 5 , Kristin Kremer 6 , Dmitri A. Petrov 1 , Marcus W. Feldman 1 , Sebastien Gagneux 2,7* 1 Department of Biology, Stanford University, Stanford, California, United States of America, 2 Institute for Systems Biology, Seattle, Washington, United States of America, 3 Bill and Melinda Gates Foundation, Seattle, Washington, United States of America, 4 Forschungszentrum Borstel, National Reference Center for Mycobacteria, Borstel, Germany, 5 Seattle Children’s Hospital Research Institute, Seattle, Washington, United States of America, 6 Mycobacteria Reference Unit (CIb-LIS), National Institute of Public Health and the Environment, Bilthoven, The Netherlands, 7 MRC National Institute for Medical Research, London, United Kingdom Mycobacterium tuberculosis infects one third of the human world population and kills someone every 15 seconds. For more than a century, scientists and clinicians have been distinguishing between the human- and animal-adapted members of the M. tuberculosis complex (MTBC). However, all human-adapted strains of MTBC have traditionally been considered to be essentially identical. We surveyed sequence diversity within a global collection of strains belonging to MTBC using seven megabase pairs of DNA sequence data. We show that the members of MTBC affecting humans are more genetically diverse than generally assumed, and that this diversity can be linked to human demographic and migratory events. We further demonstrate that these organisms are under extremely reduced purifying selection and that, as a result of increased genetic drift, much of this genetic diversity is likely to have functional consequences. Our findings suggest that the current increases in human population, urbanization, and global travel, combined with the population genetic characteristics of M. tuberculosis described here, could contribute to the emergence and spread of drug-resistant tuberculosis. Citation: Hershberg R, Lipatov M, Small PM, Sheffer H, Niemann S, et al. (2008) High functional diversity in Mycobacterium tuberculosis driven by genetic drift and human demography. PLoS Biol 6(12): e311. doi:10.1371/journal.pbio.0060311 Introduction Mycobacterium tuberculosis is a gram-positive bacterium and the causative agent of human tuberculosis. The worldwide emergence of multidrug-resistant strains of M. tuberculosis is threatening to make tuberculosis incurable [1]. Although renewed efforts are being directed towards the development of new tools to better control tuberculosis [2], much about the evolution of this obligate human pathogen remains unknown [3]. In 1898, Harvard pathologist Theobald Smith demonstra- ted that tubercle bacilli isolated from humans differed significantly from bacilli isolated from cattle in their capacity to cause disease in different animal species [4]. Eventually, the two bacilli were granted separate species status, with M. tuberculosis designating the typical human pathogen, and Mycobacterium bovis referring to the bovine form [5]. Because M. bovis has the capacity to cause disease in a variety of animal species, including humans, it was originally thought to exhibit a much broader host range than M. tuberculosis. However, recent comparative genomic analyses have revealed such a high degree of genetic diversity in M. bovis that modern population geneticists now consider the species to be comprised of several ecotypes, each of which is adapted to particular animal host species [6–10]. Some of these ecotypes have been given distinct species designations. For example, Mycobacterium microti is a pathogen of voles [11], Mycobacterium pinnipedii a pathogen of seals and sea lions [12], and Mycobacterium caprae a pathogen of goats [13]. By contrast, the human-adapted members of the M. tuberculosis complex (MTBC) have traditionally been assumed to be essentially identical. This notion was primarily driven by the results of early studies that revealed very low levels of DNA sequence variation in human MTBC [14,15]. More recent surveys of global strain collections show that in fact human MTBC consists of separate strain lineages associated with different regions of the world [16–20]. However, all of these studies have important limitations such that the actual phylogenetic distances and relative genetic diversities within and between mycobacterial lineages have not been deter- mined [21,22]. Specifically, the study by Brudey et al. [17] used the standard molecular epidemiological method known as spoligotyping to determine the global population structure of M. tuberculosis. However, because this technique indexes genetic diversity based on the presence or absence of a repetitive sequence at a single locus (the ‘‘direct repeat region’’ of M. tuberculosis), which is prone to convergent Academic Editor: Martin J. Blaser, New York University School of Medicine, United States of America Received July 10, 2008; Accepted October 31, 2008; Published December 16, 2008 Copyright: Ó 2008 Hershberg et al. This is an open-access article distributed under the terms of the Creative Commons Attribution License, which permits unrestricted use, distribution, and reproduction in any medium, provided the original author and source are credited. Abbreviations: MTBC, Mycobacterium tuberculosis complex; SNP, single nucleotide polymorphism * To whom correspondence should be addressed. E-mail: [email protected] [ These authors contributed equally to this work. PLoS Biology | www.plosbiology.org December 2008 | Volume 6 | Issue 12 | e311 2658 P L o S BIOLOGY
-
Upload
systemsbiology -
Category
Documents
-
view
3 -
download
0
Transcript of High Functional Diversity in Mycobacterium tuberculosis Driven by Genetic Drift and Human Demography
High Functional Diversity in Mycobacteriumtuberculosis Driven by Genetic Drift andHuman DemographyRuth Hershberg
1[, Mikhail Lipatov
1[, Peter M. Small
2,3, Hadar Sheffer
2, Stefan Niemann
4, Susanne Homolka
4,
Jared C. Roach5
, Kristin Kremer6
, Dmitri A. Petrov1
, Marcus W. Feldman1
, Sebastien Gagneux2,7*
1 Department of Biology, Stanford University, Stanford, California, United States of America, 2 Institute for Systems Biology, Seattle, Washington, United States of America, 3
Bill and Melinda Gates Foundation, Seattle, Washington, United States of America, 4 Forschungszentrum Borstel, National Reference Center for Mycobacteria, Borstel,
Germany, 5 Seattle Children’s Hospital Research Institute, Seattle, Washington, United States of America, 6 Mycobacteria Reference Unit (CIb-LIS), National Institute of Public
Health and the Environment, Bilthoven, The Netherlands, 7 MRC National Institute for Medical Research, London, United Kingdom
Mycobacterium tuberculosis infects one third of the human world population and kills someone every 15 seconds. Formore than a century, scientists and clinicians have been distinguishing between the human- and animal-adaptedmembers of the M. tuberculosis complex (MTBC). However, all human-adapted strains of MTBC have traditionally beenconsidered to be essentially identical. We surveyed sequence diversity within a global collection of strains belonging toMTBC using seven megabase pairs of DNA sequence data. We show that the members of MTBC affecting humans aremore genetically diverse than generally assumed, and that this diversity can be linked to human demographic andmigratory events. We further demonstrate that these organisms are under extremely reduced purifying selection andthat, as a result of increased genetic drift, much of this genetic diversity is likely to have functional consequences. Ourfindings suggest that the current increases in human population, urbanization, and global travel, combined with thepopulation genetic characteristics of M. tuberculosis described here, could contribute to the emergence and spread ofdrug-resistant tuberculosis.
Citation: Hershberg R, Lipatov M, Small PM, Sheffer H, Niemann S, et al. (2008) High functional diversity in Mycobacterium tuberculosis driven by genetic drift and humandemography. PLoS Biol 6(12): e311. doi:10.1371/journal.pbio.0060311
Introduction
Mycobacterium tuberculosis is a gram-positive bacterium andthe causative agent of human tuberculosis. The worldwideemergence of multidrug-resistant strains of M. tuberculosis isthreatening to make tuberculosis incurable [1]. Althoughrenewed efforts are being directed towards the developmentof new tools to better control tuberculosis [2], much aboutthe evolution of this obligate human pathogen remainsunknown [3].
In 1898, Harvard pathologist Theobald Smith demonstra-ted that tubercle bacilli isolated from humans differedsignificantly from bacilli isolated from cattle in their capacityto cause disease in different animal species [4]. Eventually, thetwo bacilli were granted separate species status, with M.tuberculosis designating the typical human pathogen, andMycobacterium bovis referring to the bovine form [5]. BecauseM. bovis has the capacity to cause disease in a variety of animalspecies, including humans, it was originally thought to exhibita much broader host range than M. tuberculosis. However,recent comparative genomic analyses have revealed such ahigh degree of genetic diversity in M. bovis that modernpopulation geneticists now consider the species to becomprised of several ecotypes, each of which is adapted toparticular animal host species [6–10]. Some of these ecotypeshave been given distinct species designations. For example,Mycobacterium microti is a pathogen of voles [11], Mycobacteriumpinnipedii a pathogen of seals and sea lions [12], andMycobacterium caprae a pathogen of goats [13].
By contrast, the human-adapted members of the M.
tuberculosis complex (MTBC) have traditionally been assumedto be essentially identical. This notion was primarily drivenby the results of early studies that revealed very low levels ofDNA sequence variation in human MTBC [14,15]. Morerecent surveys of global strain collections show that in facthuman MTBC consists of separate strain lineages associatedwith different regions of the world [16–20]. However, all ofthese studies have important limitations such that the actualphylogenetic distances and relative genetic diversities withinand between mycobacterial lineages have not been deter-mined [21,22]. Specifically, the study by Brudey et al. [17] usedthe standard molecular epidemiological method known asspoligotyping to determine the global population structure ofM. tuberculosis. However, because this technique indexesgenetic diversity based on the presence or absence of arepetitive sequence at a single locus (the ‘‘direct repeatregion’’ of M. tuberculosis), which is prone to convergent
Academic Editor: Martin J. Blaser, New York University School of Medicine, UnitedStates of America
Received July 10, 2008; Accepted October 31, 2008; Published December 16,2008
Copyright: � 2008 Hershberg et al. This is an open-access article distributed underthe terms of the Creative Commons Attribution License, which permits unrestricteduse, distribution, and reproduction in any medium, provided the original authorand source are credited.
Abbreviations: MTBC, Mycobacterium tuberculosis complex; SNP, single nucleotidepolymorphism
* To whom correspondence should be addressed. E-mail: [email protected]
[ These authors contributed equally to this work.
PLoS Biology | www.plosbiology.org December 2008 | Volume 6 | Issue 12 | e3112658
PLoS BIOLOGY

evolution, this technique is of limited use for phylogeneticand population genetic analyses [16,18,20,21,23]. The study byBaker et al. [16] used a multilocus sequencing approach tostudy M. tuberculosis diversity, but because just seven geneswere analyzed, only a small number of phylogeneticallyinformative single nucleotide polymorphisms (SNPs) wereidentified. In the studies by Gutacker et al. [20] and Filliol etal. [18], the authors used a very similar approach: theycompared the full genome sequences of MTBC strainsavailable at the time and identified a series of synonymousSNPs, which they used to genotype large collections of strains.However, such approaches are known to lead to so-calledphylogenetic discovery bias and distorted phylogeneticinference [22,24,25]. In our previous study [19], we usedgenomic deletions (large sequence polymorphisms) to analyzea global collection of strains. Even though we were able to usethese deletions to classify strains unambiguously, geneticdistances based on genomic deletions are difficult tointerpret [3,21]. Finally, because of the inherent limitationsof the molecular markers used in all of the studies reviewedabove, the evolutionary processes that shape strain diversityin MTBC have not been adequately investigated; generally,actual DNA sequence data are preferred for phylogenetic andpopulation genetic analyses [26,27].
Here we report our in-depth analyses of a large set ofcoding sequence data from a global collection of MTBCstrains. These analyses reveal that the human-adaptedmembers of MTBC are more genetically diverse thangenerally recognized. We also demonstrate that genetic driftis likely to be an important evolutionary force generatingdiversity in MTBC, and that this diversity can be linked tochanges in human demography and to both ancient andrecent human migrations.
Results and Discussion
The Global Phylogeny of M. tuberculosisWe investigated the genetic diversity within MTBC using
seven megabases of DNA sequence data that we generated
from a representative collection of 108 MTBC strains (TableS1). This collection included 99 human-adapted strains thatwere selected to represent the broadest geographic andgenetic diversity from a global collection of 875 strainscharacterized previously by the analysis of deletions acrossthe genome [19]. An additional seven strains were selected torepresent four animal-adapted ecotypes, including M. bovis,M. microti, M. pinnipedii, and M. caprae. We also included thevaccine strain M. bovis BCG Pasteur and one strain ofMycobacterium canettii as our predicted outgroup. M. canettii isformally considered part of MTBC. However, in this study weuse ‘‘MTBC’’ to refer to all other members of MTBC,excluding M. canettii. M. canettii strains have been shown tobe more distantly related to the remaining MTBC than anytwo other MTBC strains are to each other [28]. For each ofthe 108 strains included in the study, we determined the DNAsequence of 89 genes, which together corresponded to 65,829base pairs per strain, or 1.5% of the ;4.4 Mbp genome ofMTBC (Tables S2 and S3, Figure S1). These 89 genescomprised housekeeping genes and antigens analyzed in theearly sequencing studies mentioned above [14,15], as well asgenes of special interest, including putative new drug targets[29–31], genes believed to be involved in latency andreactivation [32,33], DNA repair genes [34], genes encodinga novel bacterial secretion system [35,36], and novel antigens[37,38]. Although the selection of these 89 genes was notrandom, the genes are distributed fairly uniformly around theMTBC chromosome, thus covering all the main parts of theMTBC genome (Figure S1).We first used the concatenated DNA sequences of the 89
genes for each of the 108 strains and conducted a maximumparsimony analysis. Our analysis produced a single phyloge-netic tree with a homoplasy index of 0.0043 (Figure 1). Thisphylogenetic tree is completely congruent with the one weconstructed using the neighbor-joining method (Figure S2) aswell as with the deletion-based analysis we reported previously(Figure 1, Table S1) [19]. The negligible degree of homoplasyobserved in our sequence-based tree, and the fact that oursequence-based and deletion-based trees are congruentfurther supports the highly clonal population structure ofMTBC [39,40]. The primary branches of our sequence-basedtree are also consistent with earlier studies that classified M.tuberculosis into ‘‘ancient’’ and ‘‘modern’’ forms based on thepresence or absence of a genomic deletion known as TbD1 [8].However, because our new sequence data allow us to betterinterpret genetic distances between lineages, we find that thedifference between ancient and modern MTBC is morepronounced than one would assume on the basis of thepresence of a single genomic deletion (Figure 1).
Human-Adapted MTBC Is More Genetically Diverse thanAssumedWe further compared the genetic distances between
different strain lineages using our new sequence data.Overall, our analysis reveals greater genetic diversity of thehuman-adapted organisms than previously appreciated.Specifically, our sequence-based phylogeny shows that allthe animal-adapted members of MTBC form an ingrouprelative to the rest of the phylogeny. This suggests that eventhough these animal strains belong to four distinct ecotypesadapted to distinct animal host species, they represent only aproportion of the genetic diversity found in all of the human-
PLoS Biology | www.plosbiology.org December 2008 | Volume 6 | Issue 12 | e3112659
Functional Diversity in M. tuberculosis
Author Summary
Tuberculosis remains a worldwide public health emergency. Theemergence of drug-resistant forms of tuberculosis in many parts ofthe world is threatening to make this important human diseaseincurable. Even though many resources are being invested into thedevelopment of new tuberculosis control tools, we still do not knowthe extent of genetic diversity in tuberculosis bacteria, nor do weunderstand the evolutionary forces that shape this diversity. Toaddress these questions, we studied a large collection of humantuberculosis strains using DNA sequencing. We found that strainsoriginating in different parts of the world are more geneticallydiverse than previously recognized. Our results also suggest thatmuch of this diversity has functional consequences and could affectthe efficacy of new tuberculosis diagnostics, drugs, and vaccines.Furthermore, we found that the global diversity in tuberculosisstrains can be linked to the ancient human migrations out of Africa,as well as to more recent movements that followed the increases ofhuman populations in Europe, India, and China during the past fewhundred years. Taken together, our findings suggest that theevolutionary characteristics of tuberculosis bacteria could synergizewith the effects of increasing globalization and human travel toenhance the global spread of drug-resistant tuberculosis.
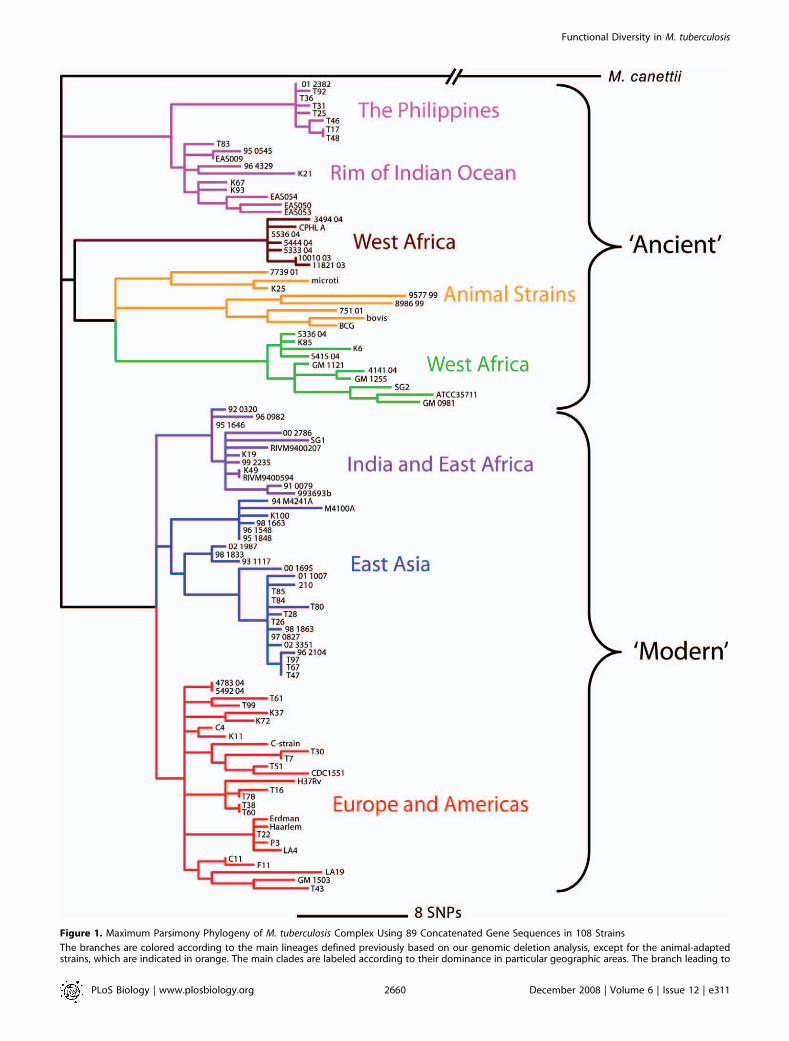
Figure 1. Maximum Parsimony Phylogeny of M. tuberculosis Complex Using 89 Concatenated Gene Sequences in 108 Strains
The branches are colored according to the main lineages defined previously based on our genomic deletion analysis, except for the animal-adaptedstrains, which are indicated in orange. The main clades are labeled according to their dominance in particular geographic areas. The branch leading to
PLoS Biology | www.plosbiology.org December 2008 | Volume 6 | Issue 12 | e3112660
Functional Diversity in M. tuberculosis

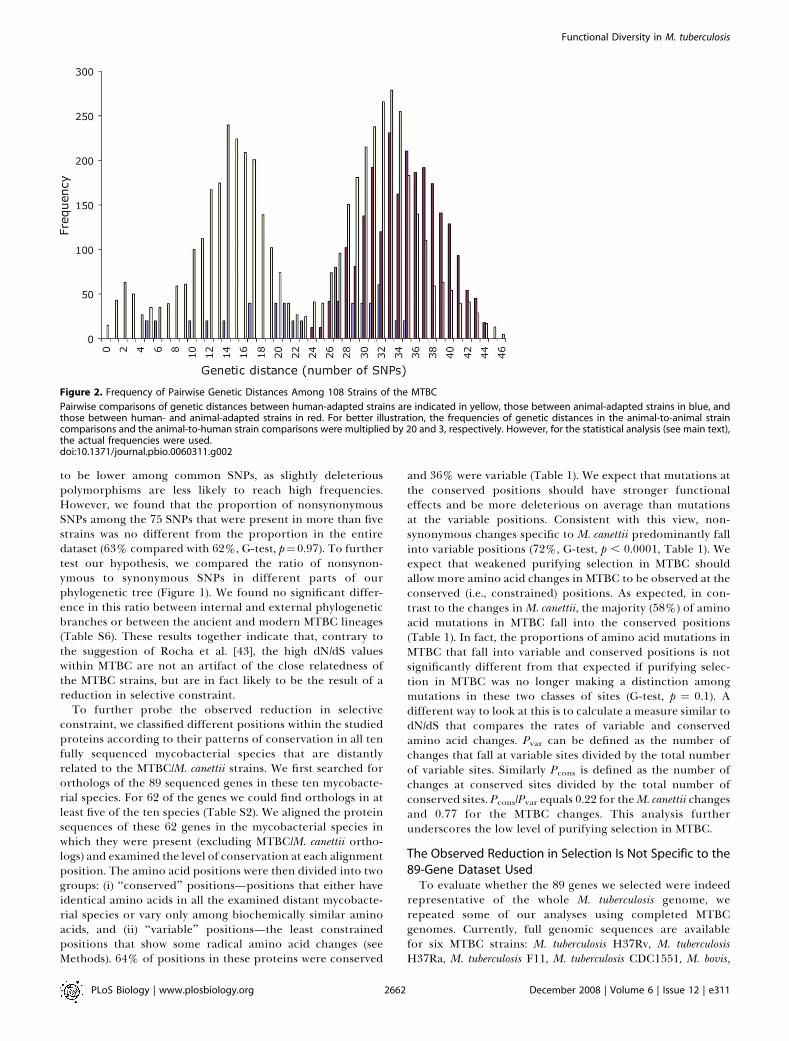
adapted MTBC (Figure 1). In fact, the average pairwisegenetic distance among animal-adapted strains is equal to theaverage distance among human-adapted strains (23.61 versus23.65 differences, respectively; Figure 2). Additionally, thedistribution of all possible pairwise genetic distances withinthe human-adapted group was not significantly differentfrom that within the animal-adapted group (Mann–Whitneyrank sum test, p ¼ 0.74). Taken together, this evidence showsthat the genetic diversity among the human-adapted mem-bers of MTBC is just as pronounced as that among theanimal-adapted strains tested. Although the human MTBCstrains used in this study are not a true population surveybecause they were selected to maximize either diversity orgeographical distribution, these observations suggest that thegenetic diversity among the human-adapted members ofMTBC is just as pronounced as that among the animal-adapted strains. This is especially surprising given the factthat the latter belong to four distinct ecotypes adapted todistinct animal host species.
Purifying Selection Is Severely Reduced in MTBCNext, we used our sequence dataset to estimate the role of
purifying selection in the evolution and genetic diversity ofMTBC. One commonly used method of examining the degreeof purifying selection acting on sequences is to calculate theratio of the rates of nonsynonymous and synonymouschanges (dN/dS). In the absence of selection this ratio isexpected to near unity. Purifying selection is expected toreduce this ratio, while positive selection is expected toincrease it.
We discovered a total of 488 SNPs in our 108 strains. TheM.canettii strain differed from each of the other MTBC strains at129–145 sites (0.2% of the examined sites, Table S4), while themaximum number of SNPs between any two other MTBCstrains was 46 (0.07% of the examined sites). This supports theuse ofM. canettii as a closely related outgroup. The comparisonof the proteins in the M. canettii strain with the majority-ruleconsensus of the proteins in the remaining MTBC strainsrevealed 125 nucleotide differences, of which 43 werenonsynonymous. This corresponds to the ratio of the ratesof nonsynonymous and synonymous changes (dN/dS) of 0.18.This ratio is similar to that previously observed between M.tuberculosis and the relatively more distantly related Mycobacte-rium avium (0.17) [41]. It is also similar to ratios we obtained bypairwise comparisons of the two fully sequenced M. aviumstrains: M. avium 104 and M. avium paratuberculosis (dN/dS ¼0.17), and for the two fully sequenced strains:Mycobacterium sp.JLS and Mycobacterium sp. MCS (dN/dS¼ 0.15). This appears torepresent the general dN/dS within the Actinobacteria, as weconclude from an examination of pairwise genome-widecomparisons of different fully sequenced Actinobacteriagenomes (unpublished data). It thus appears that the strengthof selection acting on M. canettii may be similar to that actingon other Mycobacteria and Actinobacteria.
Out of the 370 SNPs that segregated among the remaining107 MTBC strains (i.e., excluding M. canettii; Table S5), 231(62%) were nonsynonymous and 139 (38%) synonymous. Theaverage pairwise dN/dS ratio for the MTBC strains was 0.57.
This is substantially higher than that in most other bacteria[41] and is significantly higher than that observed for theSNPs specific to M. canettii (G-test, p , 0.0001).The high dN/dS in MTBC could be a consequence of
diversifying selection driven by host immunity. We addressedthis possibility by comparing the ratio of nonsynonymous tosynonymous SNPs in surface-exposed or excreted, virulence,and housekeeping genes (Table S2). Contrary to what wewould expect if immune selection was responsible for thehigh dN/dS in MTBC, we found that all three gene classes hadcomparable ratios of nonsynonymous to synonymous SNPs(Table S6), similar to the situation reported for Salmonellatyphi [42]. It is therefore unlikely that diversifying selectionexplains the high ratio of dN/dS unless housekeepingproteins, virulence proteins, and surface- exposed or secretedproteins are all equally and strongly exposed to immunesurveillance and are all involved in the creation of antigenicvariation. This latter possibility seems unlikely because, eventhough M. tuberculosis is an intracellular pathogen, duringvarious stages of the natural history of human tuberculosis(for example transmission and infection processes, andcavitary and disseminated disease) bacilli are in fact locatedextracellularly. Furthermore, there is increasing evidencethat M. tuberculosis interacts with both the humoral and thecellular immune system as evidenced by antibody-basedserological recognition of M. tuberculosis antigens in patientsera [38]. This suggests that surface-exposed or excreted geneproducts in MTBC should, in principle, be under strongerimmune surveillance than structural genes.In other organisms, high dN/dS ratios are often considered
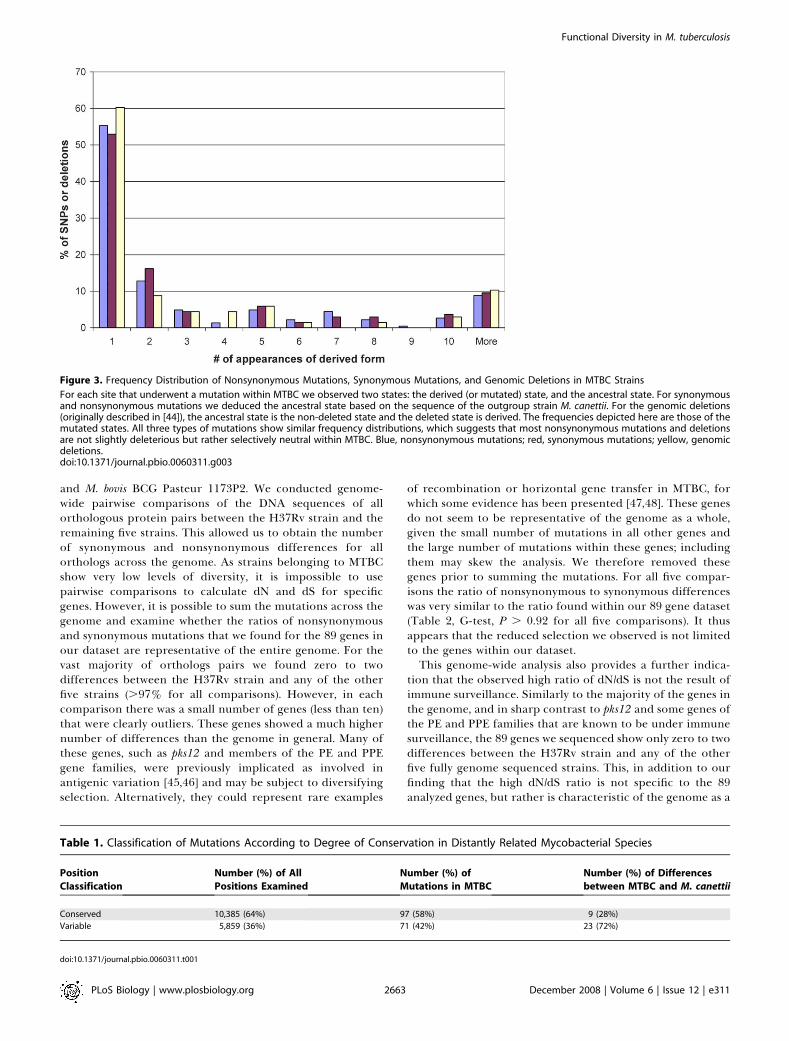
to indicate a reduction in purifying selection [26,27].However, such high dN/dS values may also stem from theclose relatedness of the MTBC strains. Rocha et al. pointedout that dN/dS is often higher in cases in which the organismsbeing compared are very closely related [43]. For such closelyrelated organisms the dN/dS ratio may be elevated becauseslightly deleterious nonsynonymous mutations that aredestined to be lost during long periods of time may not yethave been removed by purifying selection [43]. If dN/dSwithin MTBC is inflated because of nonsynonymous muta-tions being slightly deleterious, we expect the frequencydistribution for nonsynonymous SNPs to be skewed towardslow frequencies when compared with synonymous SNPs.Using our large dataset of sequences it was possible to testthis directly. We found that although the frequency distribu-tion of nonsynonymous SNPs was highly skewed towards lowfrequencies, this was equally true for the synonymous SNPs(Figure 3), with no difference in the proportion of singletonsin the two types of SNPs (G-test, p¼ 0.66). Similarly, when weexamined the frequency of 68 genomic deletions in 100clinical MTBC strains reported earlier [44], we found thatthese deletions were also not more likely to occur assingletons when compared with the synonymous SNPs foundhere (G-test, p ¼ 0.32). These results indicate that neithernonsynonymous SNPs nor deletions show any evidence ofbeing slightly deleterious within MTBC (i.e., they behave asselectively neutral). Second, if slightly deleterious mutationscontribute to the increased dN/dS in MTBC, we expect dN/dS
M. canettii has been truncated in the figure because of the large numbers of changes that separate this hypothesized outgroup from the rest of thephylogeny (Table S4). Ancient and modern strain lineages are indicated. The green and brown lineages correspond to strains traditionally known as M.africanum [21].doi:10.1371/journal.pbio.0060311.g001
PLoS Biology | www.plosbiology.org December 2008 | Volume 6 | Issue 12 | e3112661
Functional Diversity in M. tuberculosis
to be lower among common SNPs, as slightly deleteriouspolymorphisms are less likely to reach high frequencies.However, we found that the proportion of nonsynonymousSNPs among the 75 SNPs that were present in more than fivestrains was no different from the proportion in the entiredataset (63% compared with 62%, G-test, p¼0.97). To furthertest our hypothesis, we compared the ratio of nonsynon-ymous to synonymous SNPs in different parts of ourphylogenetic tree (Figure 1). We found no significant differ-ence in this ratio between internal and external phylogeneticbranches or between the ancient and modern MTBC lineages(Table S6). These results together indicate that, contrary tothe suggestion of Rocha et al. [43], the high dN/dS valueswithin MTBC are not an artifact of the close relatedness ofthe MTBC strains, but are in fact likely to be the result of areduction in selective constraint.
To further probe the observed reduction in selectiveconstraint, we classified different positions within the studiedproteins according to their patterns of conservation in all tenfully sequenced mycobacterial species that are distantlyrelated to the MTBC/M. canettii strains. We first searched fororthologs of the 89 sequenced genes in these ten mycobacte-rial species. For 62 of the genes we could find orthologs in atleast five of the ten species (Table S2). We aligned the proteinsequences of these 62 genes in the mycobacterial species inwhich they were present (excluding MTBC/M. canettii ortho-logs) and examined the level of conservation at each alignmentposition. The amino acid positions were then divided into twogroups: (i) ‘‘conserved’’ positions—positions that either haveidentical amino acids in all the examined distant mycobacte-rial species or vary only among biochemically similar aminoacids, and (ii) ‘‘variable’’ positions—the least constrainedpositions that show some radical amino acid changes (seeMethods). 64% of positions in these proteins were conserved
and 36% were variable (Table 1). We expect that mutations atthe conserved positions should have stronger functionaleffects and be more deleterious on average than mutationsat the variable positions. Consistent with this view, non-synonymous changes specific to M. canettii predominantly fallinto variable positions (72%, G-test, p , 0.0001, Table 1). Weexpect that weakened purifying selection in MTBC shouldallow more amino acid changes in MTBC to be observed at theconserved (i.e., constrained) positions. As expected, in con-trast to the changes inM. canettii, the majority (58%) of aminoacid mutations in MTBC fall into the conserved positions(Table 1). In fact, the proportions of amino acid mutations inMTBC that fall into variable and conserved positions is notsignificantly different from that expected if purifying selec-tion in MTBC was no longer making a distinction amongmutations in these two classes of sites (G-test, p ¼ 0.1). Adifferent way to look at this is to calculate a measure similar todN/dS that compares the rates of variable and conservedamino acid changes. Pvar can be defined as the number ofchanges that fall at variable sites divided by the total numberof variable sites. Similarly Pcons is defined as the number ofchanges at conserved sites divided by the total number ofconserved sites. Pcons/Pvar equals 0.22 for theM. canettii changesand 0.77 for the MTBC changes. This analysis furtherunderscores the low level of purifying selection in MTBC.
The Observed Reduction in Selection Is Not Specific to the89-Gene Dataset UsedTo evaluate whether the 89 genes we selected were indeed
representative of the whole M. tuberculosis genome, werepeated some of our analyses using completed MTBCgenomes. Currently, full genomic sequences are availablefor six MTBC strains: M. tuberculosis H37Rv, M. tuberculosisH37Ra, M. tuberculosis F11, M. tuberculosis CDC1551, M. bovis,
Figure 2. Frequency of Pairwise Genetic Distances Among 108 Strains of the MTBC
Pairwise comparisons of genetic distances between human-adapted strains are indicated in yellow, those between animal-adapted strains in blue, andthose between human- and animal-adapted strains in red. For better illustration, the frequencies of genetic distances in the animal-to-animal straincomparisons and the animal-to-human strain comparisons were multiplied by 20 and 3, respectively. However, for the statistical analysis (see main text),the actual frequencies were used.doi:10.1371/journal.pbio.0060311.g002
PLoS Biology | www.plosbiology.org December 2008 | Volume 6 | Issue 12 | e3112662
Functional Diversity in M. tuberculosis
and M. bovis BCG Pasteur 1173P2. We conducted genome-wide pairwise comparisons of the DNA sequences of allorthologous protein pairs between the H37Rv strain and theremaining five strains. This allowed us to obtain the numberof synonymous and nonsynonymous differences for allorthologs across the genome. As strains belonging to MTBCshow very low levels of diversity, it is impossible to usepairwise comparisons to calculate dN and dS for specificgenes. However, it is possible to sum the mutations across thegenome and examine whether the ratios of nonsynonymousand synonymous mutations that we found for the 89 genes inour dataset are representative of the entire genome. For thevast majority of orthologs pairs we found zero to twodifferences between the H37Rv strain and any of the otherfive strains (.97% for all comparisons). However, in eachcomparison there was a small number of genes (less than ten)that were clearly outliers. These genes showed a much highernumber of differences than the genome in general. Many ofthese genes, such as pks12 and members of the PE and PPEgene families, were previously implicated as involved inantigenic variation [45,46] and may be subject to diversifyingselection. Alternatively, they could represent rare examples
of recombination or horizontal gene transfer in MTBC, forwhich some evidence has been presented [47,48]. These genesdo not seem to be representative of the genome as a whole,given the small number of mutations in all other genes andthe large number of mutations within these genes; includingthem may skew the analysis. We therefore removed thesegenes prior to summing the mutations. For all five compar-isons the ratio of nonsynonymous to synonymous differenceswas very similar to the ratio found within our 89 gene dataset(Table 2, G-test, P . 0.92 for all five comparisons). It thusappears that the reduced selection we observed is not limitedto the genes within our dataset.This genome-wide analysis also provides a further indica-
tion that the observed high ratio of dN/dS is not the result ofimmune surveillance. Similarly to the majority of the genes inthe genome, and in sharp contrast to pks12 and some genes ofthe PE and PPE families that are known to be under immunesurveillance, the 89 genes we sequenced show only zero to twodifferences between the H37Rv strain and any of the otherfive fully genome sequenced strains. This, in addition to ourfinding that the high dN/dS ratio is not specific to the 89analyzed genes, but rather is characteristic of the genome as a
Figure 3. Frequency Distribution of Nonsynonymous Mutations, Synonymous Mutations, and Genomic Deletions in MTBC Strains
For each site that underwent a mutation within MTBC we observed two states: the derived (or mutated) state, and the ancestral state. For synonymousand nonsynonymous mutations we deduced the ancestral state based on the sequence of the outgroup strain M. canettii. For the genomic deletions(originally described in [44]), the ancestral state is the non-deleted state and the deleted state is derived. The frequencies depicted here are those of themutated states. All three types of mutations show similar frequency distributions, which suggests that most nonsynonymous mutations and deletionsare not slightly deleterious but rather selectively neutral within MTBC. Blue, nonsynonymous mutations; red, synonymous mutations; yellow, genomicdeletions.doi:10.1371/journal.pbio.0060311.g003
Table 1. Classification of Mutations According to Degree of Conservation in Distantly Related Mycobacterial Species
Position
Classification
Number (%) of All
Positions Examined
Number (%) of
Mutations in MTBC
Number (%) of Differences
between MTBC and M. canettii
Conserved 10,385 (64%) 97 (58%) 9 (28%)
Variable 5,859 (36%) 71 (42%) 23 (72%)
doi:10.1371/journal.pbio.0060311.t001
PLoS Biology | www.plosbiology.org December 2008 | Volume 6 | Issue 12 | e3112663
Functional Diversity in M. tuberculosis
whole, indicates that immune surveillance is not likely toexplain the observed high dN/dS values, unless it affects theentire tuberculosis genome. Furthermore, the fact that somegenes that are known to be under immune surveillance showmuch higher levels of diversity than most other genes in thegenome further indicates that most genes are not affected tosuch a high extent by immune surveillance.
We further used the six fully sequenced MTBC genomes tocalculate Pcons/Pvar at a genome-wide level. We createdmultiple sequence alignments of all of the annotated proteinsof the H37Rv strain that have clear orthologs in the other fiveMTBC genomes. We also searched for orthologs of thesesequences in the ten more distantly related fully sequencedmycobacterial strains mentioned earlier. For this analysis, weselected genes for which we could find clear orthologs in all ofthe six MTBC strains and create multiple sequence align-ments in these six strains that contained no gaps. We alsorequired that we find orthologs for these genes in at least fiveof the more distantly related mycobacterial strains. 1,970genes filled these requirements. We could find no SNPs withinthe six MTBC strains for 1,289 of these genes and thusremoved them from the analysis. We further removed fourgenes because they were clearly outliers and had well over tenSNPs each, whereas the vast majority of genes had three orfewer SNPs. These four genes include three-members of thePE and PPE protein families, which have been implicated asbeing involved in antigenic variation [45], as well as the pks12gene, which has been shown to produce a polyketide that is animportant T cell antigen [46]. After removing these fourgenes, we were left with 677 genes in which there was at leastone MTBC SNP. Within these genes 145,020 of the sites wereconserved in the distantly related Mycobacteria (49%) and149,728 were variable (51%). 448 of the MTBC SNPs foundwithin these genes were at conserved sites (47%) and 515 ofthe SNPs fell at variable sites (53%). As was the case for the 89genes in our dataset, there is no significant differencebetween the proportion of SNPs falling in variable andconserved sites and the random proportion we would expectif selection were not discriminating between the two types ofsites (G-test, p ¼ 0.1). Furthermore, when we calculated thegenome-wide Pcons/Pvar we found it was even higher (0.9) thanfor the 89 gene analysis (0.77). Taken together, our genome-wide analyses show that the severe reduction in purifyingselection we observed is not specific to the 89 genes in ourmain dataset. Rather there appears to be a genome-widereduction in purifying selection in MTBC.
Much of MTBC Diversity Has Functional ConsequencesThere are two possibilities regarding the nature of the
observed reduced constraint. One possibility is that thereduction in purifying selection is pathway specific and thatit affects only specificmutations that no longer have functionalconsequences as a result of changes in the ecological require-ments of the MTBC strains. If this were true, one would expectto see a relaxation of purifying selection in only a subset ofgenes, and not in housekeeping genes that are generallyuniversally required. However, the reduction of purifyingselection within the MTBC appears to be genome-wide andoccurs across different classes of genes, including house-keeping genes. This suggests the alternative possibility, inwhich a genome-wide reduction in the efficacy of purifyingselection has occurred. The weakened selective constraint inMTBC appears to allow amino acid changes that would beremoved by purifying selection in M. canettii and othermycobacteria to persist within MTBC. Such changes are likelyto have deleterious functional consequences in M. canettii, asotherwise they would not have been removed by selection.Mostof these mutations are still likely to have similar functionaleffects in the other MTBC strains. However, because of thereduced efficiency of selection they are more likely to persist.It is possible to roughly estimate the proportion of the
differences within MTBC that are likely to carry suchfunctional consequences. On the basis of our 89 gene dataset,we found that in M. canettii, 23 mutations fell into variablesites and nine, or ;2.6 times fewer, fell into conserved sites.Had selection been as strong in MTBC as it is in M. canettii,and assuming conservatively that the mutations at thevariable sites are entirely neutral, we would expect 2.6 timesfewer mutations to be observed at constrained sites withinMTBC as well. Considering that there are 71 mutations atvariable sites in MTBC we would expect ;27 mutations atconserved sites within MTBC. Instead, we find 97 suchmutations. This indicates that close to 72% of mutations atconserved sites (42% of the amino acid mutations overall)within MTBC would have been removed by selection in M.canettii. Because such amino acid mutations are likely to affectprotein function, this suggests that about 40% of amino acidchanges in MTBC have functional consequences.To put this in context, we can consider the number of
nonsynonymous differences found between the fully se-quenced M. tuberculosis H37Rv and other two fully sequencedstrains of M. tuberculosis present in our dataset: CDC1551 andF11. We considered only genes that are clear orthologs, couldbe aligned across their entire protein sequence, and had nogaps in their DNA alignment that could represent frameshiftevents. Again, we removed genes that were clear outliers withrespect to the number of mutations they contain (more thanten mutations).Within the remaining protein pairs, we found423 and 410 amino acid differences between H37Rv andCDC1551, and H37Rv and F11, respectively. Note that thegenome-sequenced strains do not represent the full diversitywithin MTBC, because they all belong to the same strainlineage (red in Figure 1). However, if the sequenced proteinsare representative of the genome as a whole, these numbersand the diversity in our dataset can be used to conservativelyestimate the range of functional amino acid differencesbetween an average pair of MTBC strains. For the 89 genes wesequenced, the number of differences between strain pairs
Table 2. Synonymous and Nonsynonymous MTBC Differences inthe 89 Gene Dataset and in Genome-Wide Pairwise Comparisons
Comparison Number (%) of
Synonymous
Differences
Number (%) of
Nonsynonymous
Differences
89 gene dataset 139 (37.6%) 231 (62.4%)
H37Rv/F11 223 (37.2%) 376 (62.8%)
H37Rv/CDC1551 240 (37.1%) 407 (62.9%)
H37Rv /H37Ra 29 (38.2%) 47 (61.8%)
H37Rv/M. bovis 607 (37.3%) 1,020 (62.7%)
H37Rv/M. bovis BCG 571 (37.2%) 962 (62.8%)
doi:10.1371/journal.pbio.0060311.t002
PLoS Biology | www.plosbiology.org December 2008 | Volume 6 | Issue 12 | e3112664
Functional Diversity in M. tuberculosis
ranged from zero to 46 (Figure 2), with an average of 25. Forthese genes we find 17 differences between H37Rv andCDC1551, and 13 differences between H37Rv and F11. Fromthese numbers we can estimate conservatively that an averagepair of MTBC strains should have around 300 functionaldifferences between them. At the same time, the leastdiverged strains may have close to no functional differenceswhereas the most diverged strains may differ at around 500functional sites (see Methods). Furthermore, because we useda highly conservative estimate of the number of amino aciddifferences per genome and took only point mutations intoaccount, this is likely to be a highly conservative estimate ofthe number of functional differences.
Taken together, our results strongly suggest that the highvalue of dN/dS in MTBC results from a significant reductionin purifying selection. This reduced selective constraint mostprobably results from a number of factors, all of which tendto reduce an organism’s effective population size. Thesefactors are high clonality (i.e., virtual absence of horizontalgene exchange) and the serial transmission bottleneckscharacteristic of this pathogen. These serial bottlenecks areparticularly tight in M. tuberculosis, because a single cell isenough to establish a new infection. Furthermore, thepopulation structure of human MTBC is highly subdivided,both geographically (Figures 1 and 4D) and within the lungs
of infected individuals. It has been shown that differentlesions in lungs of tuberculosis patients can harbor genet-ically distinct subclones of a particular infecting strain [49].Finally, clonal organisms are also prone to selective sweeps[6]. All of these features lead to small effective populationsizes, in which the effects of random genetic drift areincreased compared with those of natural selection[6,26,27]. Random genetic drift allows mutations to reachhigh frequencies that in organisms with large effectivepopulation sizes would be eliminated by natural selection.Such mutations are likely to affect protein function delete-riously (i.e., they are functional), which is why they areeliminated in other organisms. By contrast, the large amountof predicted functional variation we observed at conservedsites in MTBC shows that natural selection is not as efficientat removing deleterious mutations in this organism. This highfunctional diversity in MTBC reported here further stressesthe need to consider strain diversity in the development ofnew tuberculosis diagnostics, drugs, and vaccines [21].
An ‘‘Out-Of-And-Back-To-Africa’’ Scenario for Human
MTBCIn addition to natural selection and genetic drift, migration
and demographic changes can affect the generation anddistribution of genetic diversity in a particular organism.
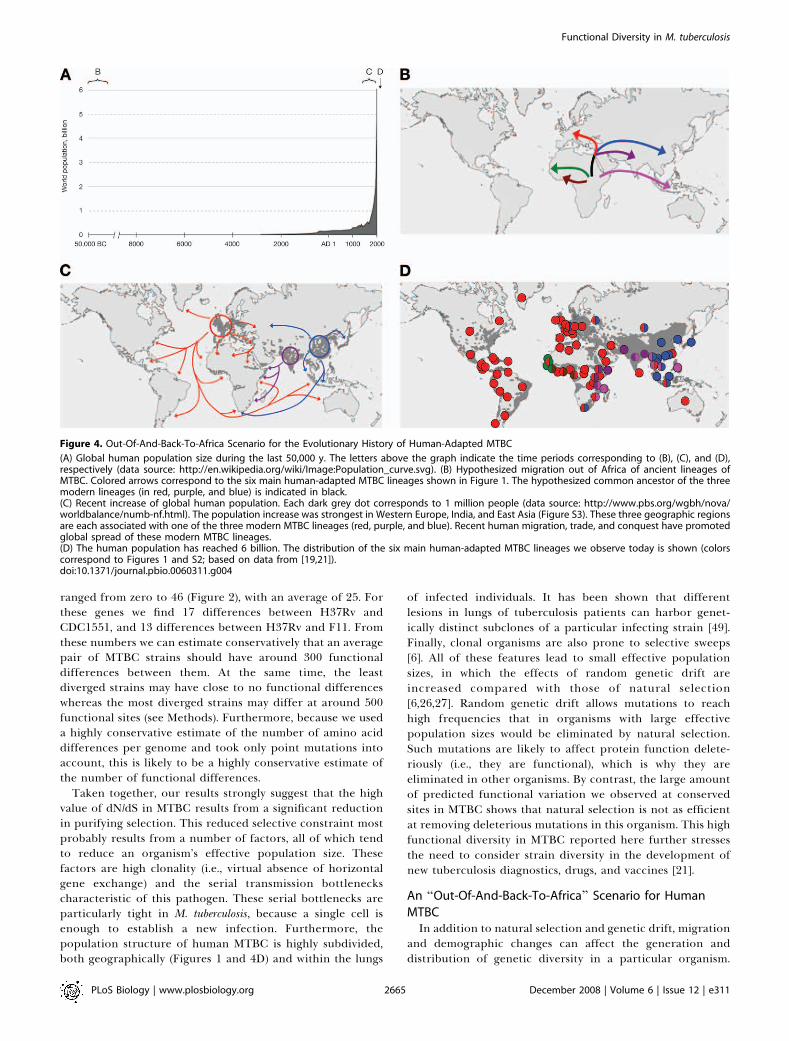
Figure 4. Out-Of-And-Back-To-Africa Scenario for the Evolutionary History of Human-Adapted MTBC
(A) Global human population size during the last 50,000 y. The letters above the graph indicate the time periods corresponding to (B), (C), and (D),respectively (data source: http://en.wikipedia.org/wiki/Image:Population_curve.svg). (B) Hypothesized migration out of Africa of ancient lineages ofMTBC. Colored arrows correspond to the six main human-adapted MTBC lineages shown in Figure 1. The hypothesized common ancestor of the threemodern lineages (in red, purple, and blue) is indicated in black.(C) Recent increase of global human population. Each dark grey dot corresponds to 1 million people (data source: http://www.pbs.org/wgbh/nova/worldbalance/numb-nf.html). The population increase was strongest in Western Europe, India, and East Asia (Figure S3). These three geographic regionsare each associated with one of the three modern MTBC lineages (red, purple, and blue). Recent human migration, trade, and conquest have promotedglobal spread of these modern MTBC lineages.(D) The human population has reached 6 billion. The distribution of the six main human-adapted MTBC lineages we observe today is shown (colorscorrespond to Figures 1 and S2; based on data from [19,21]).doi:10.1371/journal.pbio.0060311.g004
PLoS Biology | www.plosbiology.org December 2008 | Volume 6 | Issue 12 | e3112665
Functional Diversity in M. tuberculosis

Thus, we decided to use our new sequence-based diversitydataset to further explore the complex interactions betweenmycobacterial evolution and human population growth andtravel [50,51]. Overall, our data support a hypothesized ‘‘Out-of-and-back-to-Africa’’ scenario of the phylogeography ofhuman tuberculosis (Figures 1 and 4D) [19,21]. Specifically,most evidence indicates that MTBC originated in Africa. Forexample, Africa is the only continent in which all six majorhuman MTBC lineages occur, and the deeply rooted lineagesare present exclusively in West Africa (brown and green inFigures 1 and 4). An African origin for human tuberculosis isalso consistent with a previous report on M. canettii and otherso-called ‘‘smooth tubercle bacilli’’ that share a remotecommon ancestor with the other MTBC and which areprimarily associated with countries at the Horn of Africa[28,52]. During hunter–gatherer times, human populationsremained small and geographically scattered (Figure 4A),which favored within-family transmission and the resultingstable host–pathogen associations [19,21,39]; it has beenpostulated that the characteristic latency period in humantuberculosis might be an adaptation of M. tuberculosis to lowhost densities [53]. Thus, we would expect the ancient humanmigrations out of Africa ;50,000 y ago [54] to be reflected inthe population structure of human-adapted MTBC, similar tothe structure that has been observed for Helicobacter pylori [55].In our dataset, this is seen in the distribution of the threedeeply rooted ancient strains. For example, the contempo-rary distribution of the ancient pink lineage around theIndian Ocean (Figures 1 and 4D) corresponds to the earliestspread of modern humans out of Africa [54]. Importantly,early migration out of Africa would have occurred over landas ocean-going transport technologies were developed only ata much later time point in human history [51,54].
Ancient MTBC Spread by Land, Modern MTBC by SeaWe hypothesize that further overland migration seeded
Western Europe, Northern India, and East Asia with whatwould become the three modern M. tuberculosis lineages (red,purple, and blue lineages in Figures 1 and 4B). Concurrently,human populations started to increase dramatically anddisproportionately in these regions providing an ecologicalniche for the clonal expansion of these three strain lineages(Figures 4A, 4C, and S3). During the past few centuries withlarge-scale human migration, trade and conquest out of thesethree areas [51], these clades further spread to other areas ofthe world (Figure 4C). Specifically, the presence of Euro-American (red) strains on the American continent can beexplained in terms of the exodus from the over-populatedEuropean cities to America at the end of the 19th century—a‘‘vast movement that dwarfed all earlier migrations,’’ accord-ing to the historian William McNeill [51]. Furthermore, thepresence of strains from this cluster in Africa, Asia, and theMiddle East is in agreement with the cases of Europeancolonization of the post-Columbian era. In a similar vein, thepresence of strains from the Indian-East-African (purple)lineage in East Africa can be explained in terms of the recenthistory of migration to this region from the Indian subcon-tinent [56]. Finally, the presence of the East Asian/Beijing(blue) lineage in South Africa is best explained by therelatively recent import of slaves from Southeast Asia byDutch colonialists and later immigration of Chinese work-forces to South African gold mines [57,58]. Although some
human trade routes go back several millennia and thus couldhave contributed to the spread of MTBC, it appears that thelarge-scale migration events discussed above, which werepartially driven by the more recent and dramatic increases inpopulation densities in Europe, India, and East Asia (Figures4A and S3), were key for the spread of the modern MTBClineages. Importantly, in contrast to the ancient migrationsthat followed mostly land routes, modern waves of spreadincreasingly followed routes of ocean-going ships (Figure 4C)to arrive to their contemporary distribution (Figure 4D).The quantitative nature of our new diversity data permits a
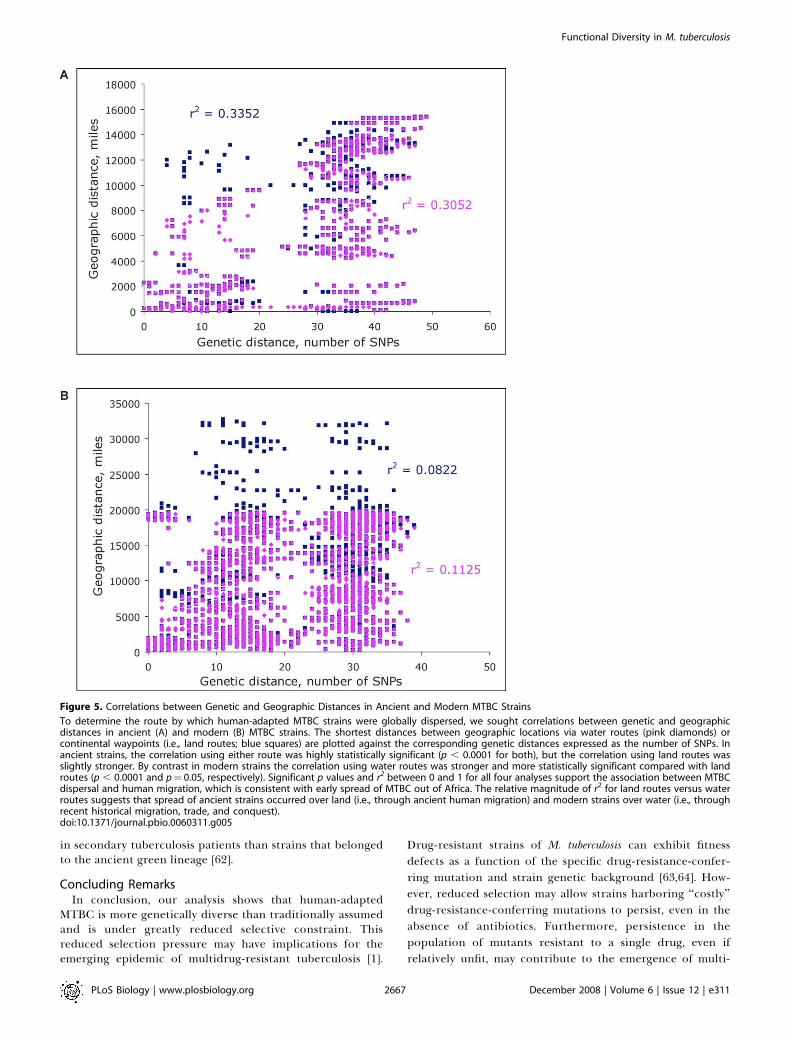
more rigorous analysis of this out-of-and-back-to-Africahypothesis. Theory predicts that for an organism populatingthe world from a given point of origin, we will find acorrelation between genetic variability and geographicdistance traveled [59,60]. Thus, if our hypothesis is correct,we expect the genetic difference between any two strains toincrease with geographic distance between where theyoriginated. For all isolates, we used the haversine methodwith and without waypoints [59] to define pairwise distancesover land routes and over water routes, respectively.Incorporation of waypoints into the calculation of geo-graphic distances allows for the additional distances traveledvia land routes during ancient human migrations. Moredirect geographic distances calculated without waypointscorrespond to the water routes along which more recenthuman travel occurred once ocean-going ships becameavailable. For each type of geographic distance, we computedthe coefficient of linear correlation between geographic andgenetic distances among ancient and modern strains, andtested its statistical significance. For all human-adaptedMTBC strains we found a significant correlation betweenpairwise geographic and genetic distances, indicating thateach group of strains carries a signal of the overall patterns ofhuman demography and migration (Figure 5A and 5B).Furthermore, given the difference that we hypothesizebetween the migratory routes of ancient and modern strainswe would expect that the correlation would be stronger forancient strains spreading via land routes and for modernstrains spreading via sea routes; this notion was supported byour statistical analysis (Figure 5A and 5B).In summary, our quantitative analysis enabled by the
sequence-based diversity data of MTBC strains supports thehypothesized relationship between the evolution of a verysuccessful human pathogen and past human migrations. It islikely that more recent air travel might also be contributing tothe global spread of MTBC variants, and part of the signal wedetected for the spread of MTBC by water routes might in factreflect more recent spread by air routes. However, as discussedabove, it appears that changes in the global populationstructure of MTBC are linked to significant demographicchanges and large-scale movements in human populations. Onthe long-term, increasing globalization and air travel couldlead to homogenization of the global population structure ofMTBC. Alternatively, it is conceivable that because of thedistinct evolutionary trajectories of ancient and modernMTBC lineages, fundamental differences in the optimalvirulence might limit the success of ancient lineages comparedwithmodern strains [61]. In support of this possibility, a recentstudy in The Gambia reported that modern strains were threetimes more likely to cause rapid progression to active disease
PLoS Biology | www.plosbiology.org December 2008 | Volume 6 | Issue 12 | e3112666
Functional Diversity in M. tuberculosis
in secondary tuberculosis patients than strains that belongedto the ancient green lineage [62].
Concluding RemarksIn conclusion, our analysis shows that human-adapted
MTBC is more genetically diverse than traditionally assumedand is under greatly reduced selective constraint. Thisreduced selection pressure may have implications for theemerging epidemic of multidrug-resistant tuberculosis [1].
Drug-resistant strains of M. tuberculosis can exhibit fitnessdefects as a function of the specific drug-resistance-confer-ring mutation and strain genetic background [63,64]. How-ever, reduced selection may allow strains harboring ‘‘costly’’drug-resistance-conferring mutations to persist, even in theabsence of antibiotics. Furthermore, persistence in thepopulation of mutants resistant to a single drug, even ifrelatively unfit, may contribute to the emergence of multi-
Figure 5. Correlations between Genetic and Geographic Distances in Ancient and Modern MTBC Strains
To determine the route by which human-adapted MTBC strains were globally dispersed, we sought correlations between genetic and geographicdistances in ancient (A) and modern (B) MTBC strains. The shortest distances between geographic locations via water routes (pink diamonds) orcontinental waypoints (i.e., land routes; blue squares) are plotted against the corresponding genetic distances expressed as the number of SNPs. Inancient strains, the correlation using either route was highly statistically significant (p , 0.0001 for both), but the correlation using land routes wasslightly stronger. By contrast in modern strains the correlation using water routes was stronger and more statistically significant compared with landroutes (p , 0.0001 and p¼ 0.05, respectively). Significant p values and r2 between 0 and 1 for all four analyses support the association between MTBCdispersal and human migration, which is consistent with early spread of MTBC out of Africa. The relative magnitude of r2 for land routes versus waterroutes suggests that spread of ancient strains occurred over land (i.e., through ancient human migration) and modern strains over water (i.e., throughrecent historical migration, trade, and conquest).doi:10.1371/journal.pbio.0060311.g005
PLoS Biology | www.plosbiology.org December 2008 | Volume 6 | Issue 12 | e3112667
Functional Diversity in M. tuberculosis
drug-resistant organisms through the sequential acquisitionof additional drug-resistance determinants. Given the com-plex linkage of this pathogen with past human demographicand migratory events, reduced selective constraint in M.tuberculosis could collude with the current increases in humanpopulation, urbanization, and global travel to exacerbate theworldwide epidemic of drug-resistant tuberculosis.
Materials and Methods
Bacterial strains. A total of 108 mycobacterial strains were used inthis study. A list with the detailed information on each strain isprovided in Table S1. Ninety-nine strains were selected from ourglobal collection of 875 strains from 80 countries previously analyzedby genomic deletion typing [19]. In addition, we included sevenstrains belonging to the four animal-adapted species of MTBC. Theseincluded two strains of M. bovis, two strains of M. caprae, two strains ofM. microti, one strain of M. pinnipedii, and the vaccine strain BCGPasteur. Finally, one strain of M. canettii was included as thehypothesized outgroup. Although we did not sample all the potentialdiversity among the animal-adapted mycobacteria, we includedseveral representatives of four recognized species that exhibitdifferent host preferences (i.e., four different ecotypes) [6–10].
DNA sequencing. Table S2 lists the information on the 89 genesanalyzed in this study, and Figure S1 shows their position relative tothe M. tuberculosis H37Rv genome. Eight of the 108 strains included inthis study had complete or partial genome sequence data available inthe public domain. These included the laboratory strain H37Rv (ourreference strain) [65], M. tuberculosis strain CDC1551 [66], M. bovisstrain AF2122/97 [5], M. bovis BCG Pasteur [67], M. tuberculosis strain210 (http://www.jcvi.org/), M. microti strain OV254 (http://www.sanger.ac.uk), and M. tuberculosis strains F11, C, and Haarlem (http://www.broad.mit.edu/seq/msc/). We used BLAST to identify sequence poly-morphisms in these genomes relative to strain H37Rv.
For the remaining 100 strains, the 89 genes were PCR amplifiedand directly sequenced using the primers listed in table S3. PCR andsequencing primers were designed using PrimerSelect (LasergeneInc.). DNA was amplified in a 96-well format and 25 ll reactions usinga GeneAmp system 9700 thermocycler (Applied Biosystems). Unin-corporated nucleotides and primers were removed by filtration withMultiscreen-PCR plates (Millipore). Sequencing reactions wereperformed with the BigDye Terminator (Applied Biosystems) andpurified in Multiscreen plates (Millipore) with Sephadex (AmershamBiosciences). Sequence data were generated with an ABI 3730 XLautomated sequencer (Applied Biosystems). For each gene, sequenceswere analyzed visually using the programs PHRED, PHRAP, andCONSED (University of Washington) and strain H37Rv as a reference.Only SNPs were considered in this analysis, and indels were ignored.SNPs that occurred in at least two strains were considered real. Toexclude potential sequencing errors, SNPs that occurred only in asingle strain were confirmed by sequencing of an independent PCRproduct, except for SNPs that occurred only in the M. canettii strainor in one of the strains with available whole genome sequences. Ofthe 20,500 initial sequencing reactions (205 primers in 100 strains;Table S3), 95 (,0.5%) failed to give interpretable results after severalPCR and/or sequencing attempts. The corresponding gene sequenceswere assumed to be the same as the consensus in the final analysis.
Phylogenetic analysis. For phylogenetic inference, a data matrixwas constructed, which included the concatenated sequences of the89 genes for each of the 108 strains included in the study. We usedDnaSP [68] to parse the raw data. Additional analyses were performedusing a combination of the software PAUP [69], a mySQL database(http://www.mysql.com), several custom PERL scripts (http://www.perl.org), and a programmer’s text editor TextMate (http://macromates.com). We first entered the NEXUS-formatted sequence output ofDnaSP into PAUP, and ran a heuristic search for a maximum-parsimony tree with M. canettii strain K116 set as the outgroup. Wethen used PAUP’s describetrees command to output the tree’s branchlengths, its homoplasy index, character change lists, and the patristicdistance matrix. The character change lists specify the tree branchwhere each single-nucleotide change occurred, according to themaximum parsimony criterion. The patristic distance matrix givesthe number of differences separating any given pair of strains fromeach other. A neighbor-joining tree was constructed using thesoftware MEGA 4 [70].
Genetic distances between lineages. We used a series of PERLscripts to parse, organize, and enter information about themaximum-parsimony tree into a mySQL database. To compute the
distribution of pairwise genetic distances on the tree for animal–animal, human–human, and animal–human strain pairings, weextracted the lists of patristic distances for each kind of pairingfrom the mySQL database. We entered each list into a MicrosoftExcel worksheet and constructed a series of overlapping histograms.To determine the significance of differences among the threedistributions, we entered the patristic distance lists into the softwarepackage R (http://www.r-project.org/), and ran the Mann–Whitneyrank sum test on each pair of distributions.
dN/dS values. The sequences of the 89 genes from each strain wereconcatenated and the resulting sequences were aligned usingClustalW. dN/dS within MTBC was calculated for the multiplealignment of the sequences of all the MTBC strains, using theprogram package DnaSP. dN/dS between MTBC and the outgroupstrain M. canettii was calculated by estimating dN/dS between themajority-rule consensus sequence of MTBC and M. canettii. Wecompared M. canettii with the consensus sequence, rather thancomparing M. canettii with each of the MTBC strains and averagingthe result to eliminate the effect of evolution within MTBC on thecomparisons. Pairwise dN/dS values were calculated using DnaSPaccording to the method of Nei and Gojobori [71]. In order toestimate whether the differences in dN/dS within MTBC and betweenMTBC and M. canettii are significant, we considered the fact that in allcomparisons we are looking at the same exact sites. This allowed us tocompare the number of nonsynonymous and synonymous mutationswithin MTBC with the same numbers between MTBC and M. canettiiusing a simple G-test of significance.
Frequency of MTBC SNPs and deletions. For synonymous andnonsynonymous mutations we deduced the ancestral state using thesequence of the outgroup strain M. canettii. Following this assignmentwe counted, for each SNP, the number of strains in which the derivedstate was observed. Deletion data were taken from the paper byTsolaki et al. [44].We assume that each deletion is the derived state,following Tsolaki et al. [44].
Defining conserved and variable amino acid positions. The fullannotated proteomes of the following ten mycobacterial species weredownloaded from the NCBI FTP server (ftp://ftp.ncbi.nlm.nih.gov/):M.avium 104, M. avium paratuberculosis, M. gilvum PYR-GCK, M. sp. JLS, M.sp. KMS, M. sp.MCS, M. leprae, M. smegmatisMC2 155, M. ulcerans Agy99,and M. vanbaaleniis PYR-1. To locate the orthologs of the 89 proteinsincluded in our study and later for all the proteins of M. tuberculosisH37Rv in these ten bacterial genomes, we conducted a bidirectionalFASTA [72] search of the protein sequences from the H37Rv strain ofM. tuberculosis in each of the ten genomes. AM. tuberculosis protein wasconsidered to have an ortholog in another Mycobacterium if it had areciprocal best hit that could be aligned across at least 80% of itssequence. If a protein could be found in at least five of the tenmycobacterial genomes, we aligned the sequences of the proteinsfrom each strain using ClustalW. Positions were divided into twogroups: (i) conserved positions—positions that are either identical orthat show only conservative amino acid differences and (ii) variablepositions—positions that show some radical amino acid changes.Differences in amino acids were classified as conservative or radicalbased on the method of Zhang et al. [73]. According to this methodamino acids are divided based on polarity and volume into six groups:special: C; neutral and small: A, G, P, S, and T; polar and relativelysmall: N, D, Q, and E; polar and relatively large: R, H, and K; nonpolarand relatively small: I, L, M, and V; nonpolar and relatively large: F, W,and Y. Changes among groups are considered radical whereaschanges within groups are considered conservative.
Estimating the percentage of amino acid mutations in MTBC thatare likely to be functional. The weakened purifying selection in MTBCappears to allow amino acid changes that would be removed bypurifying selection in M. canettii and other mycobacteria to persist. InM. canettii the ratio between the number of mutations falling atconserved sites and mutations falling at variable sites is 9/23. Hadselection been as strong in MTBC as it was in M. canettii, and assumingconservatively that the mutations at the variable sites are entirelyneutral, we would expect this ratio to hold forMTBC. Considering thatthere are 71 mutations at variable sites in MTBC we would expect tosee ;27 mutations at conserved sites within MTBC. Given that, in fact,we find 97 such mutations, we can deduce that, had selection been asstrong in MTBC as inM. canettii, 70 of the mutations at conserved siteswould have been removed. The total number of amino acid mutationsobserved in our dataset in MTBC is 168. Thus, had selection been asstrong as it is in M. canettii we would expect 70/168 (42%) amino acidmutations to have been removed. Since those mutations that wouldhave been removed by selection had it been stronger are likely to havefunctional consequences, we can deduce that close to 40% of aminoacid mutations in MTBC are likely to be functional.
PLoS Biology | www.plosbiology.org December 2008 | Volume 6 | Issue 12 | e3112668
Functional Diversity in M. tuberculosis
To conservatively estimate the number of synonymous, nonsynon-ymous and amino acid differences for fully sequenced strains of M.tuberculosis, the complete annotated proteomes of the following sixfully sequenced MTBC strains were downloaded from the NCBI FTPserver (ftp://ftp.ncbi.nlm.nih.gov/): M. tuberculosis H37Rv, M. tuberculosisCDC1551, M. tuberculosis H37Ra, M. tuberculosis F11, M. bovis and M.bovis BCS Pasteur 1173P2. In order to locate the clear orthologs of thegenes in the H37Rv strain, we conducted a bidirectional FASTA searchof each protein sequence from the H37Rv strain of M. tuberculosis ineach of the complete proteomes of the five other strains. A M.tuberculosis H37Rv protein was considered to have a clear ortholog inanother Mycobacterium if it had a reciprocal best hit and if thesynteny was maintained. Specifically, only pairs of genes that werereciprocal best hits and for which both adjacent genes were also eachother’s reciprocal best hits were considered orthologous. We furthereliminated from consideration gene pairs that could not be alignedacross their entire protein sequence at the DNA level or that had gapsin their DNA sequence alignment that could indicate frameshifts. Wealso removed from the analysis genes that were clearly outliers andhad over ten amino acid differences between the strain pairs. This leftus with 3,231 gene pairs for the H37Rv/F11 comparison, 2,568 genepairs for the H37Rv/CDC1551 comparison, 3,495 gene pairs for theH37Rv/H37Ra genes, 3,325 gene pairs for the H37Rv/M. boviscomparison and 3,218 gene pairs for the H37Rv/M. bovis BCGcomparison. For these protein pairs we counted the number ofsynonymous and nonsynonymous DNA changes based on their FASTApairwise DNA-level alignments. For the H37Rv/CDC1551 and H37Rv/F11 comparisons, we also counted the amino acid differences based ontheir FASTA protein level pairwise alignments.
To calculate the average, minimum, and maximum number offunctional differences we expect to see for any given pair of M.tuberculosis strains, we considered the following. We examined ourdataset and found that for the total of 89 genes sequenced, thenumber of pairwise differences between MTBC strains rangedbetween zero and 46, with an average of 25. If for a fully sequencedpair of strains we could find X amino acid differences, and for thesame pair of strains we found in our dataset Y differences, and giventhat ;40% of amino acid differences are expected to be functional,we can extrapolate that the average number of differences expectedbetween any given pair of strains is:
25Y
3X 3 0:4
For the two comparisons that could be carried out with the three fullysequenced strains that were also analyzed in our study, this gavebetween 249 differences (H37Rv/CDC1551 comparison, X ¼ 423, Y ¼17) and 315 differences (H37Rv/F11 comparison, X¼ 410, Y ¼ 13).
Similarly, the maximal number of functional differences expected is
46Y
3X 3 0:4
For the two comparisons we could perform this gave between 458(H37Rv/CDC1551 comparison) and 580 differences (H37Rv/F11comparison).
The minimal number expected is0Y
3X 3 0:4
which of course gives zero for both comparisons.To investigate the correlation between genetic and geographic
distances, we computed great-circle geographic distances between allpairs of strains, both for routes that allow crossing of the Earth’smajor bodies of water (‘‘water routes’’), and for those that do not(‘‘land routes’’). To do so, we used the haversine method ofRamachandran et al. [59], along with the five waypoints that theseauthors defined for land route distances. Then, for each type ofgeographic distance, we computed the coefficient of linear correla-tion between geographic and genetic distances among strains, andtested its significance using the Mantel test.
Supporting Information
Figure S1. Position of the 89 Genes Included in this Study Relative tothe M. tuberculosis H37Rv Genome Sequence
Found at doi:10.1371/journal.pbio.0060311.sg001 (35 KB DOC).
Figure S2. Neighbor-Joining Phylogeny Using the ConcatenatedSequences of 89 Genes in 108 MTBC Strains
The distance used is the number of SNPs, and the bootstrap values of1,000 replicates are indicated for the main branches. Branches arecolored according to the lineages defined by our genomic deletionanalyses reported previously [19] and correspond to those used inFigure 1. The branch leading to M. canettii has been truncated in thefigure because of the large numbers of changes that separate thishypothesized outgroup from the rest of the phylogeny (Table S4).Ancient and modern strain lineages are indicated.
Found at doi:10.1371/journal.pbio.0060311.sg002 (236 KB DOC).
Figure S3. Human Population Densities in the Year 2000
Western Europe, North India, and China are among the most denselypopulated areas in the Old World (Source NASA: http://visibleearth.nasa.gov/view_rec.php?id¼116).Found at doi:10.1371/journal.pbio.0060311.sg003 (2.68 MB DOC).
Table S1. Mycobacterial Strains Included in This Study
Found at doi:10.1371/journal.pbio.0060311.st001 (185 KB DOC).
Table S2. Genes Sequenced in This Study
Found at doi:10.1371/journal.pbio.0060311.st002 (197 KB DOC).
Table S3. Primers Used for PCR Amplification and Sequencing
Found at doi:10.1371/journal.pbio.0060311.st003 (293 KB DOC).
Table S4. SNPs Identified in M. canettii Strain K116
Found at doi:10.1371/journal.pbio.0060311.st004 (280 KB DOC).
Table S5. SNPs Identified in 107 MTBC Strains
Found at doi:10.1371/journal.pbio.0060311.st005 (820 KB DOC).
Table S6. Nonsynonymous and Synonymous SNPs Identified in 107M. tuberculosis Complex Strains by Gene Category, Phylogenetic Clade,and Branch in the Phylogenetic Tree (Figure 1)
Found at doi:10.1371/journal.pbio.0060311.st006 (50 KB DOC).
Acknowledgments
We acknowledge the Wellcome Trust Sanger Institute, the BroadInstitute, and the J. Craig Venter Institute for making draft DNAsequences available. We thank Lee Rowen, April Clark, and ScottBloom for technical assistance, as well as Douglas Young, AaronHirsh, and Inaki Comas for critical review of the manuscript.
Author contributions. RH, ML, PMS, DAP, MWF, and SG conceivedand designed the experiments. RH, ML, HS, SH, and SG performedthe experiments. RH, ML, SN, SH, JCR, and SG analyzed the data.PMS, SN, KK, and SG contributed reagents/materials/analysis tools.RH, ML, PMS, DAP, MWF, and SG wrote the paper.
Funding. This research was supported by the Wellcome Trust andby National Institutes of Health (NIH) grant AI34238 to PS, and byNIH grant GM28016 to MWF. RH was supported by an EMBO longterm post-doctoral fellowship, SN by the German Ministry of Healthand Ministry for Education and Research (BMBF) within thePathoGenomikPlus Network, and JCR by NIH grant 5K08AI056092.SG was supported by the Medical Research Council, UK and by NIHgrant HHSN266200700022C.
Competing interests. The authors have declared that no competinginterests exist.
References
1. Raviglione MC, Smith IM (2007) XDR tuberculosis–implications for globalpublic health. N Engl J Med 356: 656–659.
2. Young DB, PerkinsMD, DuncanK, Barry CE (2008) Confronting the scientificobstacles to global control of tuberculosis. J Clin Invest 118: 1255–1265.
3. Gagneux S, Small PM (2008) Molecular evolution of mycobacteria. In:
Kaufmann SH, Rubin E, editors. Handbook of tuberculosis. Weinheim:Wiley VCH.
4. Smith T (1898) A comparative study of bovine tubercle bacilli and ofhuman bacilli from sputum. J Exp Med 3: 451–511.
5. Garnier T, Eiglmeier K, Camus JC, Medina N, Mansoor H, et al. (2003) Thecomplete genome sequence of Mycobacterium bovis. Proc Natl Acad Sci U S A100: 7877–7882.
PLoS Biology | www.plosbiology.org December 2008 | Volume 6 | Issue 12 | e3112669
Functional Diversity in M. tuberculosis
6. Smith NH, Gordon SV, de la Rua-Domenech R, Clifton-Hadley RS,Hewinson RG (2006) Bottlenecks and broomsticks: the molecular evolutionof Mycobacterium bovis. Nat Rev Microbiol 4: 670–681.
7. Mostowy S, Inwald J, Gordon S, Martin C, Warren R, et al. (2005) Revisitingthe evolution of Mycobacterium bovis. J Bacteriol 187: 6386–6395.
8. Brosch R, Gordon SV, Marmiesse M, Brodin P, Buchrieser C, et al. (2002) Anew evolutionary scenario for the Mycobacterium tuberculosis complex. ProcNatl Acad Sci U S A 99: 3684–3689.
9. Smith NH, Kremer K, Inwald J, Dale J, Driscoll JR, et al. (2005) Ecotypes ofthe Mycobacterium tuberculosis complex. J Theor Biol 239: 220–225.
10. Mostowy S, Cousins D, Brinkman J, Aranaz A, Behr MA (2002) Genomicdeletions suggest a phylogeny for the Mycobacterium tuberculosis complex. JInfect Dis 186: 74–80.
11. Frota CC, Hunt DM, Buxton RS, Rickman L, Hinds J, et al. (2004) Genomestructure in the vole bacillus, Mycobacterium microti, a member of theMycobacterium tuberculosis complex with a low virulence for humans.Microbiology 150: 1519–1527.
12. Cousins DV, Bastida R, Cataldi A, Quse V, Redrobe S, et al. (2003)Tuberculosis in seals caused by a novel member of the Mycobacteriumtuberculosis complex: Mycobacterium pinnipedii sp. nov. Int J Syst EvolMicrobiol 53: 1305–1314.
13. Aranaz A, Cousins D, Mateos A, Dominguez L (2003) Elevation ofMycobacterium tuberculosis subsp. caprae Aranaz et al. 1999 to species rankas Mycobacterium caprae comb. nov., sp. nov. Int J Syst Evol Microbiol 53:1785–1789.
14. Sreevatsan S, Pan X, Stockbauer KE, Connell ND, Kreiswirth BN, et al.(1997) Restricted structural gene polymorphism in the Mycobacteriumtuberculosis complex indicates evolutionarily recent global dissemination.Proc Natl Acad Sci U S A 94: 9869–9874.
15. Musser JM, Amin A, Ramaswamy S (2000) Negligible genetic diversity ofMycobacterium tuberculosis host immune system protein targets: evidence oflimited selective pressure. Genetics 155: 7–16.
16. Baker L, Brown T, Maiden MC, Drobniewski F (2004) Silent nucleotidepolymorphisms and a phylogeny for Mycobacterium tuberculosis. Emerg InfectDis 10: 1568–1577.
17. Brudey K, Driscoll JR, Rigouts L, Prodinger WM, Gori A, et al. (2006)Mycobacterium tuberculosis complex genetic diversity: mining the fourthinternational spoligotyping database (SpolDB4) for classification, popula-tion genetics and epidemiology. BMC Microbiol 6: 23.
18. Filliol I, Motiwala AS, Cavatore M, Qi W, Hernando Hazbon M, et al. (2006)Global Phylogeny of Mycobacterium tuberculosis based on single nucleotidepolymorphism (SNP) analysis: insights into tuberculosis evolution, phylo-genetic accuracy of other DNA fingerprinting systems, and recommenda-tions for a minimal standard SNP set. J Bacteriol 188: 759–772.
19. Gagneux S, Deriemer K, Van T, Kato-Maeda M, de Jong BC, et al. (2006)Variable host-pathogen compatibility inMycobacterium tuberculosis. Proc NatlAcad Sci U S A 103: 2869–2873.
20. Gutacker MM, Mathema B, Soini H, Shashkina E, Kreiswirth BN, et al.(2006) Single-nucleotide polymorphism-based population genetic analysisof Mycobacterium tuberculosis strains from 4 geographic sites. J Infect Dis 193:121–128.
21. Gagneux S, Small PM (2007) Global phylogeography of Mycobacteriumtuberculosis and implications for tuberculosis product development. LancetInfect Dis 7: 328–337.
22. Achtman M (2008) Evolution, population structure, and phylogeography ofgenetically monomorphic bacterial pathogens. Annu Rev Microbiol 62: 53–70.
23. Warren RM, Streicher EM, Sampson SL, van der Spuy GD, Richardson M, etal. (2002) Microevolution of the direct repeat region of Mycobacteriumtuberculosis: implications for interpretation of spoligotyping data. J ClinMicrobiol 40: 4457–4465.
24. Alland D, Whittam TS, Murray MB, Cave MD, Hazbon MH, et al. (2003)Modeling bacterial evolution with comparative-genome-based markersystems: application to Mycobacterium tuberculosis evolution and patho-genesis. J Bacteriol 185: 3392–3399.
25. Pearson T, Busch JD, Ravel J, Read TD, Rhoton SD, et al. (2004)Phylogenetic discovery bias in Bacillus anthracis using single-nucleotidepolymorphisms from whole-genome sequencing. Proc Natl Acad Sci U S A101: 13536–13541.
26. Hartl DL, Clarck AG (2006) Principles of population genetics. Sunderland,MA: Sinauer Associates, Inc.
27. Lynch M (2007) The origins of genome architecture. Sunderland, MASinauer Associates.
28. Gutierrez C, Brisse S, Brosch R, Fabre M, Omais B, et al. (2005) Ancientorigin and gene mosaicism of the progenitor of Mycobacterium tuberculosis.PLoS Pathogens 1: 1–7. doi:10.1371/journal.ppat.0010005
29. Andries K, Verhasselt P, Guillemont J, Gohlmann HW, Neefs JM, et al.(2005) A diarylquinoline drug active on the ATP synthase of Mycobacteriumtuberculosis. Science 307: 223–227.
30. Manjunatha UH, Boshoff H, Dowd CS, Zhang L, Albert TJ, et al. (2005)Identification of a nitroimidazo-oxazine-specific protein involved in PA-824 resistance in Mycobacterium tuberculosis. Proc Natl Acad Sci U S A 103:431–436.
31. Walburger A, Koul A, Ferrari G, Nguyen L, Prescianotto-Baschong C, et al.
(2004) Protein kinase G from pathogenic mycobacteria promotes survivalwithin macrophages. Science 304: 1800–1804.
32. Kana BD, Gordhan BG, Downing KJ, Sung N, Vostroktunova G, et al. (2008)The resuscitation-promoting factors of Mycobacterium tuberculosis arerequired for virulence and resuscitation from dormancy but arecollectively dispensable for growth in vitro. Mol Microbiol 67: 672–684.
33. Voskuil MI, Schnappinger D, Visconti KC, Harrell MI, Dolganov GM, et al.(2003) Inhibition of respiration by nitric oxide induces a Mycobacteriumtuberculosis dormancy program. J Exp Med 198: 705–713.
34. Rad ME, Bifani P, Martin C, Kremer K, Samper S, et al. (2003) Mutations inputative mutator genes of Mycobacterium tuberculosis strains of the W-Beijingfamily. Emerg Infect Dis 9: 838–845.
35. Abdallah AM, Gey van Pittius NC, Champion PA, Cox J, Luirink J, et al.(2007) Type VII secretion–mycobacteria show the way. Nat Rev Microbiol 5:883–891.
36. Brodin P, Rosenkrands I, Andersen P, Cole ST, Brosch R (2004) ESAT-6proteins: protective antigens and virulence factors? Trends Microbiol 12:500–508.
37. Leyten EM, Lin MY, Franken KL, Friggen AH, Prins C, et al. (2006) HumanT-cell responses to 25 novel antigens encoded by genes of the dormancyregulon of Mycobacterium tuberculosis. Microbes Infect 8: 2052–2060.
38. Weldingh K, Rosenkrands I, Okkels LM, Doherty TM, Andersen P (2005)Assessing the serodiagnostic potential of 35 Mycobacterium tuberculosisproteins and identification of four novel serological antigens. J ClinMicrobiol 43: 57–65.
39. Hirsh AE, Tsolaki AG, DeRiemer K, Feldman MW, Small PM (2004) Stableassociation between strains of Mycobacterium tuberculosis and their humanhost populations. Proc Natl Acad Sci U S A 101: 4871–4876.
40. Supply P, Warren RM, Banuls AL, Lesjean S, Van Der Spuy GD, et al. (2003)Linkage disequilibrium between minisatellite loci supports clonal evolu-tion of Mycobacterium tuberculosis in a high tuberculosis incidence area. MolMicrobiol 47: 529–538.
41. Daubin V, Moran NA (2004) Comment on ‘‘The origins of genomecomplexity’’. Science 306: 978; author reply 978.
42. Roumagnac P, Weill FX, Dolecek C, Baker S, Brisse S, et al. (2006)Evolutionary history of Salmonella typhi. Science 314: 1301–1304.
43. Rocha EP, Smith JM, Hurst LD, Holden MT, Cooper JE, et al. (2006)Comparisons of dN/dS are time dependent for closely related bacterialgenomes. J Theor Biol 239: 226–235.
44. Tsolaki AG, Hirsh AE, DeRiemer K, Enciso JA, Wong MZ, et al. (2004)Functional and evolutionary genomics of Mycobacterium tuberculosis: insightsfrom genomic deletions in 100 strains. Proc Natl Acad Sci U S A 101: 4865–4870.
45. Brennan MJ, Delogu G (2002) The PE multigene family: a ’molecularmantra’ for mycobacteria. Trends Microbiol 10: 246–249.
46. Matsunaga I, Bhatt A, Young DC, Cheng TY, Eyles SJ, et al. (2004)Mycobacterium tuberculosis pks12 produces a novel polyketide presented byCD1c to T cells. J Exp Med 200: 1559–1569.
47. Liu X, Gutacker MM, Musser JM, Fu YX (2006) Evidence for recombinationin Mycobacterium tuberculosis. J Bacteriol 188: 8169–77.
48. Hughes AL, Friedman R, Murray M (2002) Genomewide pattern ofsynonymous nucleotide substitution in two complete genomes of Myco-bacterium tuberculosis. Emerg Infect Dis 8: 1342–1346.
49. Post FA, Willcox PA, Mathema B, Steyn LM, Shean K, et al. (2004) Geneticpolymorphism in Mycobacterium tuberculosis isolates from patients withchronic multidrug-resistant tuberculosis. J Infect Dis 190: 99–106.
50. Donoghue HD, Spigelman M, Greenblatt CL, Lev-Maor G, Bar-Gal GK, etal. (2004) Tuberculosis: from prehistory to Robert Koch, as revealed byancient DNA. Lancet Infect Dis 4: 584–592.
51. McNeill W (1984) Human migration in historical perspective. Popul DevRev 10: 1–18.
52. Smith NH (2006) A re-evaluation of M. prototuberculosis. PLoS Pathog 2: e98.doi:10.1371/journal.ppat.0020098
53. Blaser MJ, Kirschner D (2007) The equilibria that allow bacterialpersistence in human hosts. Nature 449: 843–849.
54. Goebel T (2007) Anthropology. The missing years for modern humans.Science 315: 194–196.
55. Linz B, Balloux F, Moodley Y, Manica A, Liu H, et al. (2007) An Africanorigin for the intimate association between humans and Helicobacter pylori.Nature 445: 915–918.
56. Gilbert E (2002) Coastal East Africa and the Western Indian Ocean: Long-Distance Trade, Empire, Migration, and Regional Unity, 1750–1970. TheHistory Teacher 36. http://www.historycooperative.org/journals/ht/36.1/gilbert.html
57. Mokrousov I, Ly HM, Otten T, Lan NN, Vyshnevskyi B, et al. (2005) Originand primary dispersal of the Mycobacterium tuberculosis Beijing genotype:clues from human phylogeography. Genome Res 15: 1357–1364.
58. van Helden PD, Warren RM, Victor TC, van der Spuy G, Richardson M, etal. (2002) Strain families of Mycobacterium tuberculosis. Trends Microbiol 10::167–168; author reply 168.
59. Ramachandran S, Deshpande O, Roseman CC, Rosenberg NA, FeldmanMW, et al. (2005) Support from the relationship of genetic and geographicdistance in human populations for a serial founder effect originating inAfrica. Proc Natl Acad Sci U S A 102: 15942–15947.
60. Kimura M, Weiss GH (1964) The stepping stone model of population
PLoS Biology | www.plosbiology.org December 2008 | Volume 6 | Issue 12 | e3112670
Functional Diversity in M. tuberculosis
structure and the decrease of genetic correlation with distance. Genetics49: 561–576.
61. Jensen KH, Little T, Skorping A, Ebert D (2006) Empirical support foroptimal virulence in a castrating parasite. PLoS Biol 4: e197. doi:10.1371/journal.pbio.0040197
62. de Jong BC, Hill PC, Aiken A, Awine T, Antonio M, et al. (2008) Progressionto active tuberculosis varies by M. tuberculosis lineage in The Gambia. JInfect Dis 198: 1037–1043.
63. Gagneux S, Burgos MV, DeRiemer K, Encisco A, Munoz S, et al. (2006)Impact of bacterial genetics on the transmission of isoniazid-resistantMycobacterium tuberculosis. PLoS Pathog 2: e61. doi:10.1371/journal.ppat.0020061
64. Gagneux S, Long CD, Small PM, Van T, Schoolnik GK, et al. (2006) Thecompetitive cost of antibiotic resistance in Mycobacterium tuberculosis.Science 312: 1944–1946.
65. Cole ST, Brosch R, Parkhill J, Garnier T, Churcher C, et al. (1998)Deciphering the biology of Mycobacterium tuberculosis from the completegenome sequence. Nature 393: 537–544.
66. Fleischmann RD, Alland D, Eisen JA, Carpenter L, White O, et al. (2002)
Whole-genome comparison of Mycobacterium tuberculosis clinical andlaboratory strains. J Bacteriol 184: 5479–5490.
67. Brosch R, Gordon SV, Garnier T, Eiglmeier K, Frigui W, et al. (2007)Genome plasticity of BCG and impact on vaccine efficacy. Proc Natl AcadSci U S A 104: 5596–601.
68. Rozas J, Sanchez-DelBarrio JC, Messeguer X, Rozas R (2003) DnaSP, DNApolymorphism analyses by the coalescent and other methods. Bioinfor-matics 19: 2496–2497.
69. Swofford DL (2002) PAUP*. Phylogenetic Aanalysis Using Parsimony (*andOther Methods). Version 4. Sunderland, Massachusetts: Sinauer Associates.
70. Tamura K, Dudley J, Nei M, Kumar S (2007) MEGA4: MolecularEvolutionary Genetics Analysis (MEGA) Software Version 4.0. Mol BiolEvol 24: 1596–1599.
71. Nei M, Gojobori T (1986) Simple methods for estimating the numbers ofsynonymous and nonsynonymous nucleotide substitutions. Mol Biol Evol 3:418–426.
72. Pearson WR, Lipman DJ (1988) Improved tools for biological sequencecomparison. Proc Natl Acad Sci U S A 85: 2444–2448.
73. Zhang J (2000) Rates of conservative and radical nonsynonymousnucleotide substitutions in mammalian nuclear genes. J Mol Evol 50: 56–68.
PLoS Biology | www.plosbiology.org December 2008 | Volume 6 | Issue 12 | e3112671
Functional Diversity in M. tuberculosis