DETERMINANTS OF STRATEGIC DRIFT AND THEIR ...
68
DETERMINANTS OF STRATEGIC DRIFT AND THEIR EFFECT ON PERFORMANCE OF COMMERCIAL BANKS IN KENYA BY HENRY OBARE MAOSA A RESEARCH PROJECT SUBMITTED IN PARTIAL FULFILMENT OF THE REQUIREMENTS FOR THE AWARD OF THE DEGREE OF MASTERS IN BUSINESS ADMINISTRATION, UNIVERSITY OF NAIROBI OCTOBER, 2015
-
Upload
khangminh22 -
Category
Documents
-
view
2 -
download
0
Transcript of DETERMINANTS OF STRATEGIC DRIFT AND THEIR ...

DETERMINANTS OF STRATEGIC DRIFT AND THEIR EFFECTON PERFORMANCE OF COMMERCIAL BANKS IN KENYA
BY
HENRY OBARE MAOSA
A RESEARCH PROJECT SUBMITTED IN PARTIAL FULFILMENT
OF THE REQUIREMENTS FOR THE AWARD OF THE DEGREE
OF MASTERS IN BUSINESS ADMINISTRATION, UNIVERSITY OF
NAIROBI
OCTOBER, 2015
i
DECLARATION
This research proposal is my original work and has not been presented for any award in
any other institution and all sources are duly acknowledged in the bibliography.
Signature…………………………….. Date……………………………..
Henry Obare Maosa
Reg. No: D61/75231/2009
I confirm that the work reported in this research proposal has been carried out by the
candidate under my supervision as the appointed university supervisor.
Signature: ……………………………. Date: …………………………….
Lecturer’s name: Jeremiah Kagwe
Department of Business Administration
School of Business
University of Nairobi
ii
DEDICATION
This project is dedicated to my parents Daniel Masese and Teresa Masese for their
continued encouragement, my siblings Anne, Janet, Everlyne and James who instilled in
me the spirit of perseverance and determination, and my wife Audrey Kubwa who
inculcated in me the virtues of patience and calmness that were valuable as I endured to
complete my studies.
I also dedicate this project to my wonderful children Kailey Nyamueya, Lexey Nyombura
and Harry Masese for being there for me throughout the entire program. The three of you
have been my best cheerleaders.
iii
ACKNOWLEDGEMENT
First and foremost, I am most grateful for the grace of God that has enabled me to
successfully complete my MBA and this research paper. Secondly, I thank my supervisor,
Mr. Jeremiah Kagwe for his professional guidance and patience in this research project.
He has been committed and always found time to offer wise counsel on the direction and
shape of this project despite his busy schedule.
Thirdly, I wish to thank all my lecturers in the postgraduate studies for imparting me with
requisite knowledge and skills. Their guidance in the course work enabled me to gain a
clearer understanding of various concepts and principles from both theoretical and practical
perspectives. Furthermore, I wish to salute all the respondents who accepted to participate
in this research project. Their contribution was invaluable in providing relevant data useful
for the study. Last but not least, I will always be indebted to my family for their
unconditional and unwavering support during the research study.

iv
TABLE OF CONTENTS
DECLARATION................................................................................................................ i
DEDICATION................................................................................................................... ii
ACKNOWLEDGEMENT............................................................................................... iii
LIST OF TABLES .......................................................................................................... vii
LIST OF FIGURES ....................................................................................................... viii
ABBREVIATIONS AND ACRONYMNS ..................................................................... ix
OPERATIONAL DEFINITION OF TERMS................................................................ x
ABSTRACT...................................................................................................................... xi
CHAPTER ONE: INTRODUCTION ............................................................................. 1
1.1 Background of the Study ......................................................................................... 1
1.1.1 Concept of Strategic Drift................................................................................. 2
1.1.2 Organizational Performance ............................................................................. 4
1.1.3 The Banking Industry in Kenya........................................................................ 5
1.1.4 Commercial Banks in Kenya............................................................................ 7
1.2 Research Problem .................................................................................................... 7
1.3 Research Objectives................................................................................................. 9
1.4 Value of the Study ................................................................................................... 9
CHAPTER TWO: LITERATURE REVIEW.............................................................. 11
2.1 Introduction............................................................................................................ 11
2.2 Theoretical Foundation .......................................................................................... 11
2.3 Determinants of Strategic Drift.............................................................................. 13
2.3.1 Organizational Culture ................................................................................... 13
v
2.3.2 Leadership ...................................................................................................... 14
2.3.3 Strategic Planning........................................................................................... 16
2.3.4 Innovation....................................................................................................... 18
2.4 Strategic Drift and Organizational Performance.................................................... 20
CHAPTER THREE: RESEARCH METHODOLOGY ............................................. 22
3.1 Introduction............................................................................................................ 22
3.2 Research Design..................................................................................................... 22
3.3 Population of the Study.......................................................................................... 22
3.4 Data Collection ..................................................................................................... 23
3.4.1 Validity ........................................................................................................... 23
3.4.2 Reliability ....................................................................................................... 24
3.5 Data Analysis ........................................................................................................ 24
CHAPTER FOUR: DATA ANALYSIS, RESULTS AND DISCUSSION ................ 25
4.1 Introduction............................................................................................................ 25
4.2 Response Rate........................................................................................................ 25
4.2.1 Reliability Test ............................................................................................... 26
4.3 Demographic Information of the Respondents ...................................................... 27
4.3.1 Position held by Respondent .......................................................................... 27
4.3.2 Gender of the Respondents............................................................................. 28
4.3.3 Number of Years Worked............................................................................... 28
4.4 Bank Demographic Information ............................................................................ 29
4.4.1 Age of the Bank in Kenya .............................................................................. 29
4.4.2 Number of Bank Branches ............................................................................. 30
4.4.3 Number of Employees .................................................................................... 31
4.4.4 Number of Customers..................................................................................... 31
vi
4.4.5 Listing Status at the NSE .............................................................................. 32
4.4.6 Ownership Structure of the Bank .................................................................. 33
4.4.7 Classification of the Bank ............................................................................. 33
4.5 Determinants of Strategic Drift.............................................................................. 34
4.6 Effects of Strategic Drift on Bank Performance .................................................... 36
4.7 Discussion of the Findings..................................................................................... 37
4.7.1 Comparison with Theory...................................................................................... 37
4.7.2 Comparison with other Empirical Studies ........................................................... 39
CHAPTER FIVE: SUMMARY, CONCLUSIONS AND RECOMMENDATIONS 41
5.1 Introduction............................................................................................................ 41
5.2 Summary of Findings............................................................................................. 41
5.3 Conclusions............................................................................................................ 42
5.4 Recommendations for Policy and Practice ............................................................ 43
5.5 Recommendations for Further Study..................................................................... 44
REFERENCES................................................................................................................ 46
APPENDICES ................................................................................................................. 51
Appendix I: Introductory Letter........................................................................................ 51
Appendix II: Licensed Commercial Banks....................................................................... 52
Appendix III: Research Questionnaire.............................................................................. 54

vii
LIST OF TABLES
Table 4.1: Reliability coefficients..................................................................................... 26
Table 4.2: Age of the bank................................................................................................ 30
Table 4.3: Number of branches......................................................................................... 30
Table 4.4: Number of employees...................................................................................... 31
Table 4.5: Number of customers....................................................................................... 32
Table 4.6: Ownership structure of the bank...................................................................... 33
Table 4.7: Bank classification........................................................................................... 34
Table 4.8: Determinants of strategic drift ......................................................................... 35
Table 4.9: Bank performance............................................................................................ 37
viii
LIST OF FIGURES
Figure 1: Position of the respondents................................................................................ 27
Figure 2: Gender of respondents....................................................................................... 28
Figure 3: Years of experience ........................................................................................... 29
Figure 4: Listing status at the NSE ................................................................................... 32

ix
ABBREVIATIONS AND ACRONYMNS
ATM: Automated Teller Machine
KBA: Kenya Bankers Association
CBK: Central Bank of Kenya
CCK: Communications Commission of Kenya
CMA: Capital Markets Authority
CRB: Credit Reference Bureau
GDP: Gross Domestic Product
KSH: Kenya Shillings
MFB: Microfinance Banks
MFI: Microfinance Institutions
MFC: Mortgage Finance Companies
NPL: Non-Performing Loans
NSE: Nairobi Securities Exchange
SCP: Structure-Conduct-Performance

x
OPERATIONAL DEFINITION OF TERMS
Environmental scanning is the acquisition and use of information about events,
trends, and relationships in an organization’s external
environment (Costa, 2010).
Innovation is the successful bringing of new commodities to the
market (Cakar and Erturk, 2010).
Performance is the achievement of organizational goals in pursuit of
business strategies that lead to sustainable competitive
advantage (Gephardt & Van Buren, 1996).
Strategy is the analysis of the firm’s environment, leading to what
the firm, given its environment, should achieve a fit
(Wheeller & Hunger, 2008).
Strategic drift is the progressive failure of existing strategies to address
the competitive position of the company (Johnson et al.,
2005).
Organizational culture refers to a system of shared meaning that members hold
that distinguishes the organization from other organizations
(Johnson et al., 2005).
xi
ABSTRACT
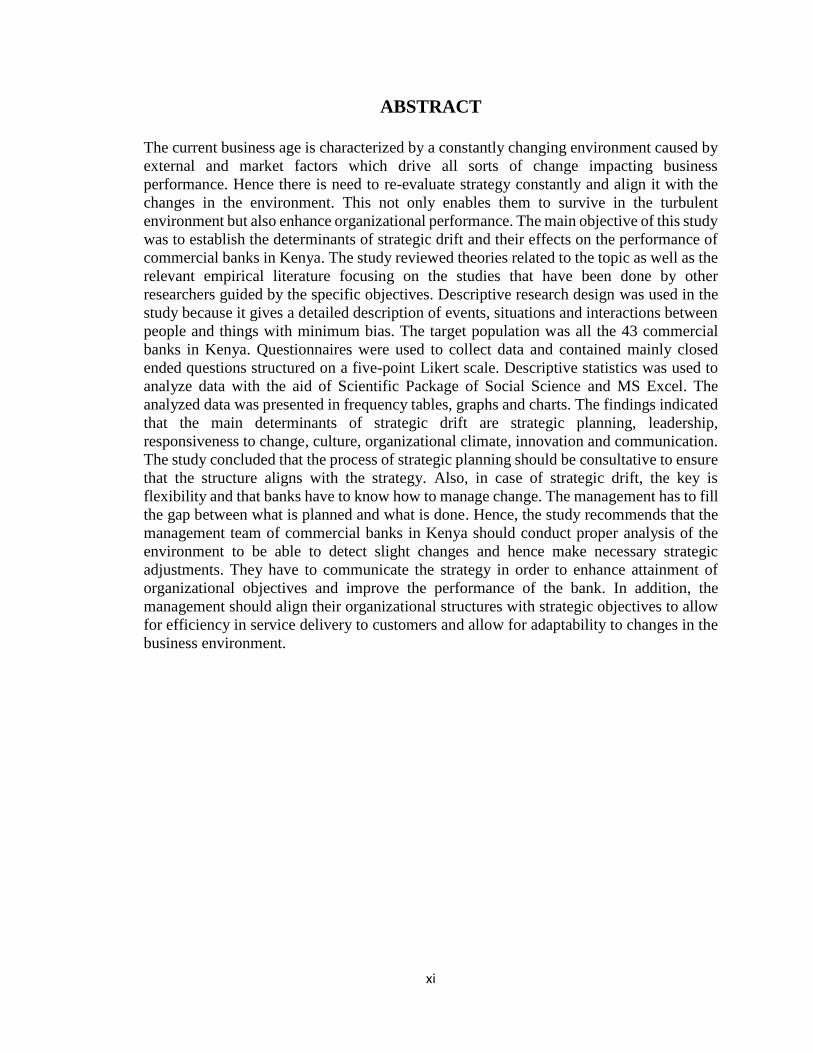
The current business age is characterized by a constantly changing environment caused byexternal and market factors which drive all sorts of change impacting businessperformance. Hence there is need to re-evaluate strategy constantly and align it with thechanges in the environment. This not only enables them to survive in the turbulentenvironment but also enhance organizational performance. The main objective of this studywas to establish the determinants of strategic drift and their effects on the performance ofcommercial banks in Kenya. The study reviewed theories related to the topic as well as therelevant empirical literature focusing on the studies that have been done by otherresearchers guided by the specific objectives. Descriptive research design was used in thestudy because it gives a detailed description of events, situations and interactions betweenpeople and things with minimum bias. The target population was all the 43 commercialbanks in Kenya. Questionnaires were used to collect data and contained mainly closedended questions structured on a five-point Likert scale. Descriptive statistics was used toanalyze data with the aid of Scientific Package of Social Science and MS Excel. Theanalyzed data was presented in frequency tables, graphs and charts. The findings indicatedthat the main determinants of strategic drift are strategic planning, leadership,responsiveness to change, culture, organizational climate, innovation and communication.The study concluded that the process of strategic planning should be consultative to ensurethat the structure aligns with the strategy. Also, in case of strategic drift, the key isflexibility and that banks have to know how to manage change. The management has to fillthe gap between what is planned and what is done. Hence, the study recommends that themanagement team of commercial banks in Kenya should conduct proper analysis of theenvironment to be able to detect slight changes and hence make necessary strategicadjustments. They have to communicate the strategy in order to enhance attainment oforganizational objectives and improve the performance of the bank. In addition, themanagement should align their organizational structures with strategic objectives to allowfor efficiency in service delivery to customers and allow for adaptability to changes in thebusiness environment.
1
CHAPTER ONE
INTRODUCTION
1.1 Background of the Study
The current business age is characterized by constantly changing environment caused by
external and market factors which affects business performance. There is need to re-
evaluate strategy constantly, agility is vital in order to respond to turbulent and shorter
unstable life cycles so as to avoid strategic drift (Aguilar, 2009). Organizations need to
respond to these changes by continuously scanning the environment and adopt strategies
that position them as viable in the market and enhance their performance (Fahey & King,
2010).
This study is anchored on Porter’s (1980) framework which builds on the structure-
conduct-performance (SCP) paradigm from industrial organization economics. The
essence of this paradigm is that the firm’s performance in the marketplace depends
critically on the characteristics of the industry in which it competes, that is, the structure
(Porter, 1980). Porter (1980) acknowledges the role of firms in formulating appropriate
competitive strategies to achieve superior economic performance and that may change the
industry rules in the firm’s favour. Nonetheless, in Porter’s (1980) work, the source of
profits is not to be found in the firm but rather in the structure of the industry, especially
the nature and balance of its competitive forces (Schoemaker, 1990). Porter’s strategy is
about positioning a business in a given industry structure so as to avoid strategic drifts and
eventually enhance organizational performance (Prahalad & Hamel, 1994).
2
For organizations to remain very competitive over time as the environment changes, they
have to learn to adapt and reorient themselves to the changing environment to avoid
strategic drift (Auster & Choo, 2004). There has to be a deliberate and coordinated learning
to a gradual systematic realignment between the environment and the organization’s
strategic positioning that result in improvement in performance, efficiency and
effectiveness so as to achieve the long term growth and improve their performance
(O’Regan et al., 2012). There is need to understand the challenges, opportunities and
threats that are provided by the external environment, so that these organizations can take
advantage of the opportunities and avoid threats by applying appropriate response
strategies as well as avoid strategic drift that will hinder their performance, survival and
competitiveness (Xu et al., 2003).
The banking industry is under pressure in today’s business climate. For banks to complete
successfully in this environment, continuous scanning of the environment is necessary to
purposely identify opportunities and threats posed by the state of the industry so as to
match strategy to industry conditions. Banks need to have a clear understanding of the
external economic trends that directly or indirectly affect their industry because they will
ultimately affect consumption patterns (Johnson & Scholes, 2008).
1.1.1 Concept of Strategic Drift
The concept of strategic drift is defined as the progressive failure of existing strategies to
address the competitive position of the company. It is the tendency for strategies to develop
3
incrementally on the basis of historical and cultural influences but fail to keep pace with a
changing environment (Johnson et al., 2005).
Strategic drift can also be defined as a gradual deterioration of competitive action that
results in the failure of an organization to acknowledge and respond to changes in the
business environment. The symptoms of strategic drift are a homogeneous mind set at
managerial and board levels, preservation of the status quo, lack of focus on the external
environment and decline in performance. The causes of strategic drift are found in
cognitive mapping and organizational culture (Sammut-Bonnici, 2015).
Strategic drift is a concept of strategic management that refers to the response of an
organization when going through a changing environment. Different situations and
unexpected challenges are very common aspects that may arise anytime when driving and
developing strategic change within the organization (Dwyer & Edwards, 2009). Danciu
(2010) proposes four sets of causes to address strategic drift: change in consumers’
expectations and needs, change in market structure and competition, change in macro-
environment and internal strategies. Not only does strategic drift distract the management
but also causes a loss of momentum. It can also waste time, money and valuable resources.
Thus, it increases the total operating cost and sometimes it leads organizations far away
from achieving competitive advantage (Grant, 2008).
Consequently, it is very crucial for organizations to make sure that they can avoid
unnecessary strategic actions or strategic drifts. Some effective ways to avoid strategic

4
drifts are: Firstly, to develop a flexible environment within the organization so that the
middle and lower management can effectively participate in the decision making process.
Secondly, managers need to be willing to listen to the views and opinions of their
subordinates. They should welcome and encourage feedback. Thirdly, managers need to
be able to clearly identify the nature of new challenges and prioritize them according to
importance. Finally, organizations must have to plan a comprehensive, well-focused and
clearly stated set of strategies (Danciu, 2010).
1.1.2 Organizational Performance
Performance is a measure of attainment achieved by an individual, team or organization
(Mathur, 2004). Richard & Stevenson (2009) argue that organizational performance
encompasses three specific areas of firm outcome, that is, financial performance (profits,
return on assets, return on investment); product market performance (sales, market share);
and shareholder return (total shareholder return, economic value added).
Kaplan & Norton (1996) noted that business enterprises must keep track of the non-
financial measures of performance such as market share, speed of response and product
quality; pay attention to externally focused measures such as customer satisfaction and
brand preference; and take into account forward-looking measures such as employee
satisfaction, retention and succession planning. Performance measurement becomes the
basis of strategy establishment and achievement in the future because it can definitely bring
a company’s vision and strategic target to all organization members and performs a role
that makes efficient internal business processes possible (Chang & Chuang, 2009).
5
The resulting deduction is that organizational performance is a multidimensional construct
tapping into the financial, operational and customer-related domains (Karanja et al., 2014).
Hence, performance may be regarded as resulting from two variables: firm specific which
are the internal capabilities of the firm and non-firm-specific variables and what can best
be described as environmental variables because they exist outside the immediate
boundaries of the firm (Mugambi et al., 2011). Conceptually therefore, organizational
performance has been viewed as the comparison of the value created by a firm, measured
through the three general elements (efficiency, effectiveness and relevance) of
organizational performance, with the value the owners expect to receive from the firm
(Fahey & King, 2010). The firm’s performance can therefore be reflected by indicators like
product sustainability, reliability, quality, productivity, profitability, cost management and
market share among others (Mathur, 2004).
1.1.3 The Banking Industry in Kenya
The banking industry in Kenya is regulated by the Central Bank of Kenya Act, Banking
Act and Companies Act among other guidelines issued by the Central Bank of Kenya
(CBK). These Acts are used together with the Prudential Guidelines which the CBK issues
from time to time. The banking sector was liberalized back in 1995 and exchange controls
revoked. The banks have come together under the Kenya Bankers Association, which acts
as lobby for the local banking industry (CBK, 2013).
Kenya’s banking sector has improved tremendously over the past 10 years not just in size
and profitability but also in terms of product offerings and service quality. According to
6
Bank Supervision Annual report (2013), the banking sector comprised of the Central Bank
of Kenya, as the regulatory authority, 44 banking institutions (43 commercial banks and 1
mortgage finance company- MFC), 7 representative offices of foreign banks, 9
Microfinance Banks (MFBs), 2 credit reference bureaus (CRBs), 1 money remittance
provider (MRP) and 101 forex bureaus. Out of the 44 banking institutions, 30 locally
owned banks comprise 3 with public shareholding and 27 privately owned while 14 are
foreign owned. The 9 MFBs, 2 CRBs and 101 forex bureaus are privately owned. The
foreign owned financial institutions comprise of 10 locally incorporated foreign banks and
4 branches of foreign incorporated banks (CBK, 2013).
The industry has over the past years enjoyed exponential growth in deposits, assets,
profitability and products offering, mainly attributed to automation of services and branch
network expansion both locally and regionally. The CBK is tasked with formulating and
implementation of monetary and fiscal policies. They ensure the proper functioning of the
Kenya financial system, the liquidity of the country and the solvency of the Kenya shilling.
The major issues facing the banking industry include: new regulations; the global financial
crisis experienced and more so the mobilization of deposits and trade reduction; and the
interest margin declines (CBK, 2013).
The major elements of a well-developed financial system have been put in place. Firstly,
the creation of a credit-reference bureau in 2010. Credit has grown rapidly in recent years
as the use of credit referencing is entrenched in banks’ credit appraisal system. Secondly,
rollout of the agency banking model. The creation of agency banking is intended to enable

7
institutions to provide banking services more cost effectively to customers. It is expected
that the initiative will enhance financial access to those people who are currently unbanked
on under banked (CBK, 2014).
1.1.4 Commercial Banks in Kenya
According to Bank Supervision Annual report (2013), the banking sector in Kenya had 43
licensed commercial banks. Out of the 43 commercial banking institutions, 29 locally
owned banks comprise 3 with public shareholding and 26 privately owned while 14 are
foreign owned (CBK, 2013).
The increased use of technological innovations continued to have a positive effect on banks
performance over the years. The bank staff productivity grew, as evidenced by the fact that
in 2012, the ratio of bank staff to customers served was 1 to 501 while in 2013 the ratio
stood at 1 to 640 customers (CBK, 2013). Further, banking sector performance has also
continued to grow owing to increased uptake of technology driven financial services. As
growth in mobile phone subscriptions increases, more banks have signed partnerships with
mobile services providers. This has increased the number of banks facilitating money
transfer services for their customers from 13 in 2011 to 17 in 2012 (Communications
Commission of Kenya [CCK], 2013).
1.2 Research Problem
Banks are essential in every country and have a vital role in supporting economic
development through efficient financial services. For over a decade, banks have been

8
affected by changes associated with globalization and financial liberalization as well as the
emergence of new technologies (Ayrga, 2011). In response to these changes, banks have
opted to provide a choice of services offered to the customers and enhance their reliance
on technology as well as develop strategic positioning that will enhance their survival and
attain sustainable competitiveness (Al-Smadi & Al-Wabel, 2011). In addition, banks
leadership have to employ right strategies in order to deal effectively with everything that
affects the performance and profitability of their organizations so that it can position itself
optimally in its competitive environment by maximizing the anticipation of environmental
change to avoid strategic drift (Ayrga, 2011).
In Kenya, some of the forces of change that have greatly influenced the banking industry
include intense competition, regulation and technological advancement (Banking
Supervision Survey Kenya, 2010). Studies have been conducted in relation to the concept
of strategic drift. Fitchet & Giraud (2007) did a study on how the information flow is
processed in project-based companies compared to others and how it affects strategic drift.
Dziri (2011) conducted a study on avoiding strategic drifts in a hypercompetitive market
with the case study of Nokia. Kiveu (2013) researched on challenges of implementation of
turnaround strategy at the new Kenya cooperative creameries in Kenya where one of the
objectives was strategic drift.
Taking into account the dynamism and turbulence in the banking industry in Kenya the
emphasis of this study is undertake an in depth evaluation of the determinants of strategic
drifts and their effects on performance of commercial banks in Kenya. In addition, the
9
empirical studies show that the concept is under-researched more so in the Kenyan
institutions and specifically the banking sector. Hence this study aims to fill the gap by
seeking to provide answers to the following questions:
i. What are the determinants of strategic drift in commercial banks in Kenya?
ii. To what extent does strategic drift affect the performance of commercial banks in
Kenya?
1.3 Research Objectives
The objectives of the study are:
i. To establish the determinants of strategic drift in commercial banks in Kenya.
ii. To determine the effects of strategic drift on the performance of commercial banks
in Kenya.
1.4 Value of the Study
The findings of this study are intended to make theoretical, practical and methodological
contributions specifically to the banking industry. The industry will greatly benefit as it
will know the type of strategies to adopt to fit every situations that would result in the
expected strategic outcome and hence improve their performance and competitiveness.
Policy makers in the industry will use the findings of this study to come up with universally
applicable strategies that may make their organizations well aligned with stakeholder needs
and facilitate the attainment of strategic ambitions and goals of both private and public
organizations.
10
The findings of this study would also be of great benefit to the practicing staff and
management of commercial banks in Kenya since it would shade light on the practices that
ought to be corrected in order to make the best out of the strategies adopted. This would
lead to high performance levels and aid in the achievement of the commercial banks
strategic goals and objectives. Lastly, the academia and business researchers will be able
to borrow from the findings of this research to support literary citations as well as develop
themes for further research.

11
CHAPTER TWO
LITERATURE REVIEW
2.1 Introduction
This chapter presents the theoretical review of literature. It details the theories that explain
the underlying causal relationship between the study variables. This will be followed by an
empirical review of literature done in this area relevant to the study. Finally, the study will
present the research gaps that need to be addressed as per the study objectives.
2.2 Theoretical Foundation
A theoretical framework is a collection of interrelated concepts. Theoretical frameworks
are structures that can hold or support a theory of a research work and explain why the
problem under study exists. In this study, the path dependency theory is considered useful
in making decisions on strategic drift with the main aim of achieving the desired goals of
an organization.
Path dependency is a dynamic theory with different stages. Building on the theoretical
explanations by Brian Arthur (1994), three phases of a path-dependence process can be
distinguished: Phase one is characterized by an undirected search process. Choices are still
unconstrained; decisions are seen as contingent events that cannot be explained by prior
events or initial conditions (Mahoney, 2000). This means that decision outcomes are
contingent occurrences. Once these decisions have been made, dynamic self-reinforcing
processes may be set into motion, which eventually lead to deterministic patterns. This
moment of setting the path dependency into motion represents a ‘critical juncture’ (Collier
12
& Collier, 1991). These junctures are ‘critical’ because, once a particular option has been
selected; it becomes progressively difficult to return to the initial point when multiple
alternatives were still available (Mahoney, 2000).
In Phase two options are increasingly narrowed to an extent that agents eventually do not
seem to have a choice anymore (Mahoney, 2000). In this phase a causal pattern evolves
that tracks a particular type of behavior building on social mechanisms by which the pattern
is likely to be reproduced over a certain period of time. Or, to use a notion from complexity
theory, the transition is marked by ‘bifurcation’ (Kauffman, 1993), that is, the contingent
or even random emergence of a small event that nonetheless has a significant and
sustainable impact upon the development, diffusion and adoption of a technology or an
institution. In this regard, it triggers a self-reinforcing process that is likely to become
essentially governed by the regime of increasing returns (Arthur, 1994).
The final transition to Phase three is marked by a lock-in (Arthur, 1994). In this Phase, one
particular technology or institution has been generally adopted and forcefully makes new
entrants adopt it too. Processes continue to bring about this particular outcome. Viable
alternatives are no longer at hand. The classical model of path dependency is based upon
rational choices. Individuals take rational decisions, but these may have unintended and
irrational consequences at a collective or system level (Arthur, 1994).
This theory is relevant to the study because it is increasingly important to identify actions
and events that may actually trigger a path-dependent process in and across organizations
13
as early as possible. The detection of strategic dissonance signals at ‘strategic inflection
points’ (Burgelman & Grove, 1996) was proposed in order to describe when one type of
industry dynamics gives way to another and/or when, on the firm or business unit-level,
one strategy changes into another, no matter whether deliberate or emergent. Once
identified, management should not give up, but join in the process of path-shaping, even
of path-breaking and creating so as to avoid strategic drifts (Ebbinghaus, 2005).
2.3 Determinants of Strategic Drift
This empirical review section presents a review of literature related to the problem and
purpose. The specific areas covered in this section are: organizational culture; leadership;
strategic planning and innovation.
2.3.1 Organizational Culture
Organizational culture refers to a system of shared meaning that members hold that
distinguishes the organization from other organizations (Johnson et al., 2005). This system
of shared meaning is a set of key characteristics that the organization values. Culture can
also be defined as ‘the collection of traditions, values, policies beliefs and attitudes that
constitute a pervasive context for everything we do and think in an organization’ (McLean
& Marshall, 1993). Culture is supported through the system of rites and rituals; patterns of
communication, the informal organization expected patterns of behaviour and perceptions
of the psychological contract (Johnson & Scholes, 2008). A study further asserts that a
mismatch between the perceptions of the employees about the organization and the
organizational strategy results in strategic drift (Burton et al., 2004).
14
Heskett (2011) pointed out that firms might avoid strategic drifts by aligning strategy and
competitive environment but they cannot be successful if there is no fit between both
aspects and the culture within the organization. The success of a firm to face increasingly
complex and dynamic environments and ultimately to attain a profitable growth, depends
on its ability to simultaneously explore new opportunities and exploit existing business
models and amalgamate with its culture (Schmitt et al., 2010; Raisch et al., 2009). Schmitt
et al. (2010) propose an organizational quality culture that consists in reconciling
adaptability, capacity to adjust to a dynamic environment by exploring new markets,
products alignment and ability to exploit existing business models and operations by
optimizing assets’ use in order to enhance performance.
2.3.2 Leadership
Leadership in an organization is very crucial as it determines the strategic planning of the
organization which has an impact in its performance. Good leadership pays attention to
leadership strategy along with the business strategy in order to identify any gap and enable
the organization to reach their performance potential (Pasmore, 2009). Organizational
leadership addresses the challenges most relevant to their business and creates the
direction, alignment and commitment needed to achieve the enduring performance of the
organization (Dinwoodie, 2013).
Van Velsor & Wright (2012) points out a number of aspects of a good leader: A good
manager should be the leader of change. Secondly, a leader should be able to shape
15
organizational culture. Thirdly, leaders understand and leverage organizational priorities
that may appear to be diametrically opposed, avoiding an ‘either/or’ approach, they find
‘both/and’ solutions. Fourthly, Leaders span organizational boundaries (Van Velsor &
Wright, 2012).
McGuire & Rhodes (2009) emphasize the importance of leadership culture in determining
the performance of organization. They define leadership culture as the self-reinforcing web
of individual and collective beliefs, practices, behaviors and patterns in an organization.
Leadership culture has a direct impact on organization’s ability to achieve the business
strategies set (McGuire & Rhodes, 2009).
According to Välikangas (2010) organizational leaders should develop strategic resilience
in order to avoid strategic drifts. Contrary to the situation of confronting (or recovering
from) a crisis, strategic resilience suggests preemptive actions to redefine the company’s
strategic course before suffering negative consequences (Välikangas, 2010). Starting from
the observation of an increased frequency of bankruptcies and a strong fluctuation of
corporate benefits, Hamel & Välikangas (2003) conclude that the ‘world is becoming
turbulent faster than organizations are becoming resilient’. They explain this ‘resilience
gap’ by the erosion of factors that insulated, so far, companies from competition, such as
regulatory protection and oligopolistic practices relatively stable product paradigms or high
entry barriers (Välikangas, 2010).
16
In order to achieve strategic resilience and increase the company’s strategic renewal
capability as well as avoid strategic drifts, Hamel & Välikangas (2003) propose mastering
four management challenges: The cognitive challenge whereby the company’s
management must acknowledge that its current success cannot be perpetual. The strategic
challenge where the organization must be aware that there are other strategic options – than
its own- and that it is capable of successfully pursuing them. Third, the political challenge
whereby the company must be able to redirect financial and human resources from its
current businesses to ventures expected to strengthen its future prospects. Fourth, the
ideological challenge where the leaders should be able to question the ‘doctrine of
optimization’ by prioritizing the continuous renewal of its business plan.
While it is important to be aware of potential environmental discontinuities and how they
could impact the company’s business, it is even more important to be prepared with
alternative strategies and resources to allocate (Van Velsor & Wright, 2012).
2.3.3 Strategic Planning
Strategic planning is inextricably interwoven into the entire fabric of management. It
provides a framework for decision-making throughout the company and forces the setting
of objectives, which provides a basis for measuring performance (Thompson et al., 2008).
Strategic planning results in a viable match between the firm and its external environment.
Strategy concerns an analysis of the firm’s environment, leading to what the firm, given its
environment, should achieve a fit (Wheeller & Hunger, 2008). Environmental analysis
reveals the market dynamics, business opportunities and challenges, customer
17
expectations, technological advancements and the firm’s internal capacities and this
provides the basis for strategy selection (Grant, 2008).
Strategic planning entails an attempt to alter a company’s strength relative to that of its
competitors, in the most efficient and effective way (Thompson et al., 2008). Strategic
planning focuses on the direction of the organization and actions necessary to improve its
performance. It is the process by which firms derive a strategy to enable them to anticipate
and respond to the changing dynamic environment in which they operate (Harrison &
Pelletier, 2000). Johnson et al. (2005) note that strategic drift occurs when the
organization’s strategy gradually moves away from relevance to the forces at work in its
environment. Effective strategic planning can transform the performance of an
organization, make fortunes for shareholders, or change the structure of an industry
(Wheeller & Hunger, 2008).
It is argued by Ambrosini & Bowman (2003) that every successful model must include
vision and mission, environmental analysis, setting objectives and strategic analysis
choice. Strategic planning, or any other management technique is of limited value by itself,
only a partnership with all parts of the management particularly execution, controls and
rewards can result in synergy and lead to substantial advancement (Grant, 2010).
To prevent the worn-out of the company’s strategies, it is important to apprehend the
complexity of the environment and incorporate it into the strategic development process

18
(Grant, 2010). Information collection should go beyond the formal information system by
including the environment indicators and signals (Miller, 2005).
2.3.4 Innovation
Innovation is one of the most emphasized sources of organizations’ sustainable competitive
advantage (Grant, 2010). Empirical and academic evidence verified the powerful impact
of faster releases of better versions of a product to capture and retain market shares and
increase profitability (Tidd & Bessant, 2009). A greater emphasis is made on the role that
innovation plays to grow stakeholders’ value in high-velocity markets where competition
is more dynamic and environment conditions are unstable (Teece, 2007).
Planning and implementing innovation strategies require addressing several paradoxes
inherent to innovation nature and requirements (Dziri, 2011). The first paradox emerges
from the dynamic capabilities theory (Teece, 2007) and posits that, with the influence of
external events, such as competitors’ innovation, new technologies emergence and internal
factors like insularity, excessive focus on the same goals, innovation turns certainly from
organizational core capability into core rigidity. Hence, from competitive strength, an
innovation capability can become a threat to the company’s performance future potential
(Dziri, 2011).
The second paradox concerns the required organizational structure in order to foster
innovation (Dziri, 2011). For instance, developing new products and bringing them to
global markets require an increasing scale and important financial and human investments,

19
while at the same time creativity, crucial to innovation, is better stimulated in small teams
working with entrepreneurial conditions.
The third paradox, which is also related to the exploration/exploitation organizational
configuration dilemma (Wang & Jiang, 2009), is highlighted by Haour (2004) who shows
that despite its recognized importance, top managers tend to dedicate relatively little time
to (explorative) innovation-related activities. The main explanation he advances is the
direct and immediate impact on shareholder’s value of the (exploitative) short-term
activities they would rather focus on which would eventually lead to strategic drift.
Any organization could possibly be confronted to a challenging course and ultimately risk
demise. According to Miller (2005), not only does this eventuality stand true for
outperforming firms, but these latter’s downfall derives often from their source of success.
In their pursuit for efficiency and/or a superior competitive advantage, organizations tend
to focus on what they are competent at, ending up losing their ability to adapt to external
changes thus leading to strategic drift (Doz & Kosonen, 2008).
Long-term involvement from top managers is required in order to tackle uncertainty that
comes with innovation (Tidd & Bessant, 2009). Addressing the third innovation paradox
maximizes success chances of new projects. However, in certain cases, such commitment
may lead the organization to follow inappropriate strategic directions. Välikangas (2010)
analyze the cases of different firms, which committed to particular innovations, wrongly
thinking they correspond to ‘big opportunities’.
20
2.4 Strategic Drift and Organizational Performance
History suggests that most organizations run into difficulties because of failure to
acknowledge and address strategic drift. Strategic drift is a situation where strategies
progressively fail to address the strategic position of the organization (Hill & Jones, 2001).
Strategic drift is the strategy that gradually fails to meet the exigencies of the environment
(Johnson & Whittington, 2006).
Strong forces from organizational environment are likely then to push firms into a strategic
drift. Incremental strategic change is a natural outcome of the influence of organizational
culture, individual and collective experience, political processes and prior decisions (Grant,
2010). However, if changes in an organization’s environment are at a greater rate than that
rate of incremental strategic change, the organizations will get out of line with its
environment (Miller, 2005).
Strategy development processes in organizations need to encourage people to have the
capacity and willingness to challenge and change their core assumptions and ways of doing
things so as to improve the company’s performance and avoid strategic gaps (Grant, 2010).
When a strategic gap occurs, it may have different reasons and different forms. Strategic
drift is a kind of strategic gap and is characterized by the fact that the strategy does not fit
anymore with its environment (Thompson et al., 2008).
According to Mark & Spencer (2008), strategic drift occurs when strategies fail to keep
pace with environmental change. Secondly, due to uncertainty of change hence a tendency
21
to stick to the familiar. Thirdly due to core rigidities whereby capabilities that are taken for
granted and deeply ingrained in routines are difficult to change even when they are no
longer suitable. Strategic drift is therefore characterized by highly homogeneous
organizational culture and paradigm, questioning is discouraged, there are major power
blockages to change, for instance, resistant dominant leaders and there is little focus on the
external environment of the organization (Mark & Spencer, 2008).
This study examined the determinants of strategic drift, namely, organization culture,
leadership, strategic planning, innovation versus their effect of the performance of
commercial banks in Kenya. Both financial and non-financial measures of performance
will be analyzed. The financial performance measures used included profitability, return
on assets and return on equity. The non-financial measures included market share, product
quality, customer satisfaction, organization branch network growth and employee’s
satisfaction among others.
22
CHAPTER THREE
RESEARCH METHODOLOGY
3.1 Introduction
This chapter describes how the study was conducted. It explains the research design,
population of the study, the data collection methods to be applied and how the data was
analyzed to produce the required information necessary for this study.
3.2 Research Design
The study used descriptive survey. This design gives a detailed description of events,
situations and interactions between people and things (Cooper & Schindler, 2006). The
descriptive research design was preferred because it ensures complete description of the
situation, making sure that there is minimum bias in the collection of data (Kothari, 2008).
3.3 Population of the study
Population is the entire group under study as specified by objectives of the research; it is
the universe from which the sample is to be selected (Ghauri & Gronhaug, 2005). Mugenda
& Mugenda (2003), explain that the target population should have some observable
characteristics, to which the researcher intends to generalize the results of the study. This
definition ensures that population of interest is homogeneous. The target population will
comprise all the forty three licensed commercial banks in Kenya (Appendix II).
23
3.4 Data Collection
The data collected was mainly primary data through questionnaires. Questionnaires are
practical, large amounts of information can be collected from a large number of people in
a short period of time and in a relatively cost effective way. It can also be carried out by
the researcher with limited effect to its validity and reliability and the results of the
questionnaires can be quickly and easily quantified through the use of a software package.
The questionnaires contained closed ended questions on a Likert scale so as to permit more
direct comparability of the responses and eliminate question/statement variability. The
study used purposive sampling technique to select the respondent. The researcher selected
the manager in charge of strategy in each bank to provide the information required for the
study. The researcher used the drop and pick method of administering the questionnaires.
3.4.1 Validity
The objective of validity is to ensure that the scale (each item or question of the
questionnaire) measures what it is supposed to measure (Kothari, 2008). In this study
content validity of the construct (composing, wording) measurements (of questionnaire
items) was of concern from early stage of questionnaire development. To ensure validity
of the instrument, the researcher thoroughly reviewed the relevant literature, to enable
development of an initial list of items representing each of the study’s constructs. The list
of items was then modified based on recommendations from the supervisor.
24
3.4.2 Reliability
According to Mugenda & Mugenda (2003), reliability refers to the degree to which the
research instrument can yield consistent results and data from repeated trials. Cronbach’s
Alpha test was used to examine the internal consistency of the data. A score over 0.70 was
considered appropriate for the study. Hence this was used as a benchmark for ascertaining
the reliability of factors extracted from the Likert scale in the questionnaire.
3.5 Data analysis
The data collected was first thoroughly edited and checked for completeness and
comprehensibility. Quantitative data, was collected using closed ended questions in the
questionnaires, was chronologically arranged with respect to the questionnaire outline to
ensure that the correct code was entered for the correct variable. The data was then cleaned,
tabulated and subjected to appropriate descriptive statistics, that is, the mean for central
tendency and standard deviation for variability and percentages and inferential statistics.
The data was then presented using tables, bar graphs and charts.

25
CHAPTER FOUR
DATA ANALYSIS, RESULTS AND DISCUSSION
4.1 Introduction
This chapter presents research findings, data analysis and interpretation of the results of
the study based on the objectives of the study. The main objective of the study was to
establish the determinants of strategic drift and their effect on the performance of
commercial banks in Kenya. To achieve the objective of the study, the research was
conducted through questionnaires which were used to obtain the required information.
The questionnaire was divided into four sections; section one sought to find the
demographic characteristics of the respondents, the second section sought to find the
demographic characteristics of commercial banks in Kenya, the third section sought to
establish the determinants of strategic drift in commercial banks in Kenya while the fourth
section sought to determine the effects of strategic drift on the performance of commercial
banks in Kenya.
4.2 Response Rate
Primary data collection was done through the use of a questionnaire and was administered
by ‘drop and pick’ to respondents of the study. The study targeted the 43 commercial
banks in Kenya. The questionnaires targeted senior managers, middle level managers and
low level managers who were conversant with the strategy of the organization. A total of
43 questionnaires were sent to every bank in the study population. Out of this, 41
questionnaires were completed representing a 95% valid response rate. The response rate
was significant enough to provide a valid and reliable conclusion on the determinants of
26
strategic drift and their effect on the performance of commercial banks in Kenya.
4.2.1 Reliability Test
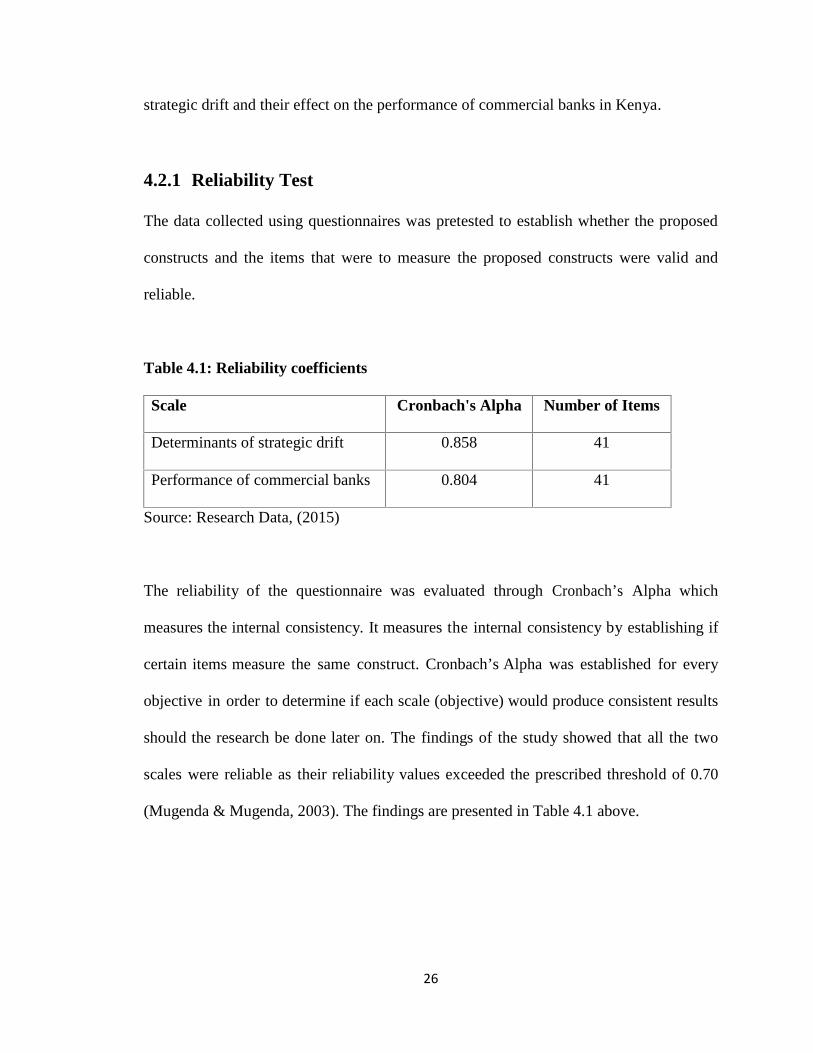
The data collected using questionnaires was pretested to establish whether the proposed
constructs and the items that were to measure the proposed constructs were valid and
reliable.
Table 4.1: Reliability coefficients
Scale Cronbach's Alpha Number of Items
Determinants of strategic drift 0.858 41
Performance of commercial banks 0.804 41
Source: Research Data, (2015)
The reliability of the questionnaire was evaluated through Cronbach’s Alpha which
measures the internal consistency. It measures the internal consistency by establishing if
certain items measure the same construct. Cronbach’s Alpha was established for every
objective in order to determine if each scale (objective) would produce consistent results
should the research be done later on. The findings of the study showed that all the two
scales were reliable as their reliability values exceeded the prescribed threshold of 0.70
(Mugenda & Mugenda, 2003). The findings are presented in Table 4.1 above.
27
4.3 Demographic Information of the Respondents
The demographic characteristics of the respondents in this study were measured with
respect to position held in the bank, their gender and work experience in the bank. The
demographic information of the respondents was captured under section A of the
questionnaire.
4.3.1 Position held by Respondent
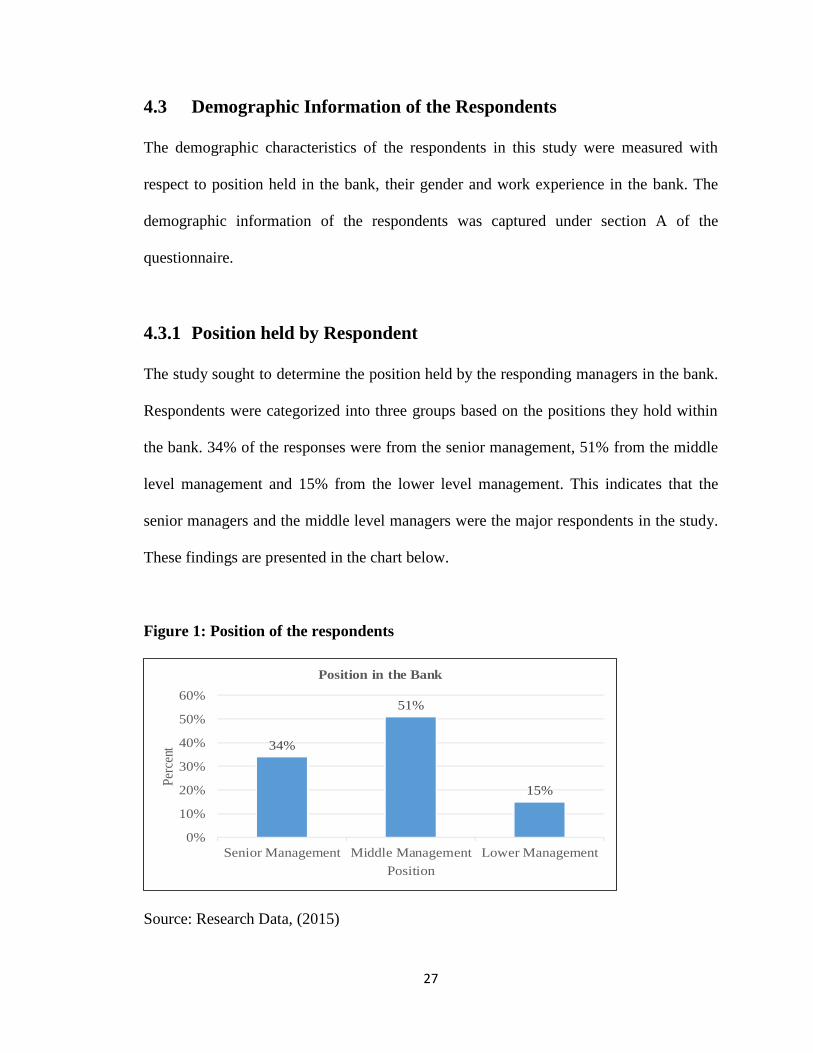
The study sought to determine the position held by the responding managers in the bank.
Respondents were categorized into three groups based on the positions they hold within
the bank. 34% of the responses were from the senior management, 51% from the middle
level management and 15% from the lower level management. This indicates that the
senior managers and the middle level managers were the major respondents in the study.
These findings are presented in the chart below.
Figure 1: Position of the respondents
Source: Research Data, (2015)
34%
51%
15%
0%
10%
20%
30%
40%
50%
60%
Senior Management Middle Management Lower Management
Perc
ent
Position
Position in the Bank
28
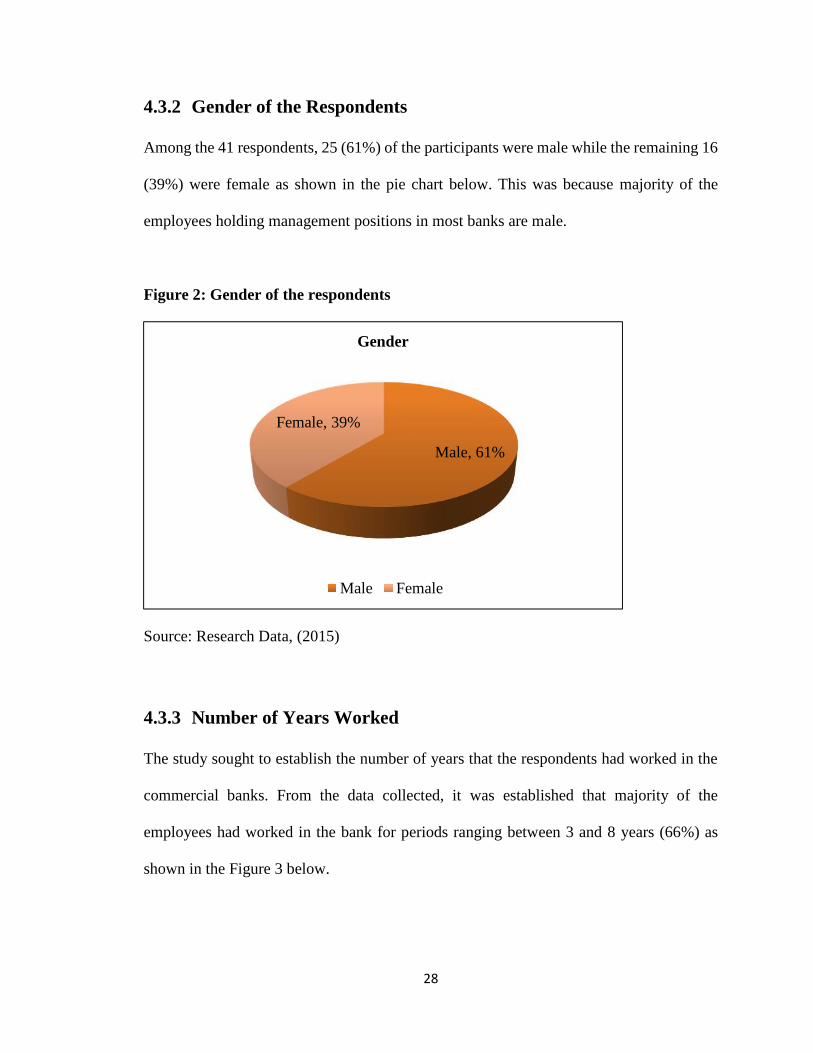
4.3.2 Gender of the Respondents
Among the 41 respondents, 25 (61%) of the participants were male while the remaining 16
(39%) were female as shown in the pie chart below. This was because majority of the
employees holding management positions in most banks are male.
Figure 2: Gender of the respondents
Source: Research Data, (2015)
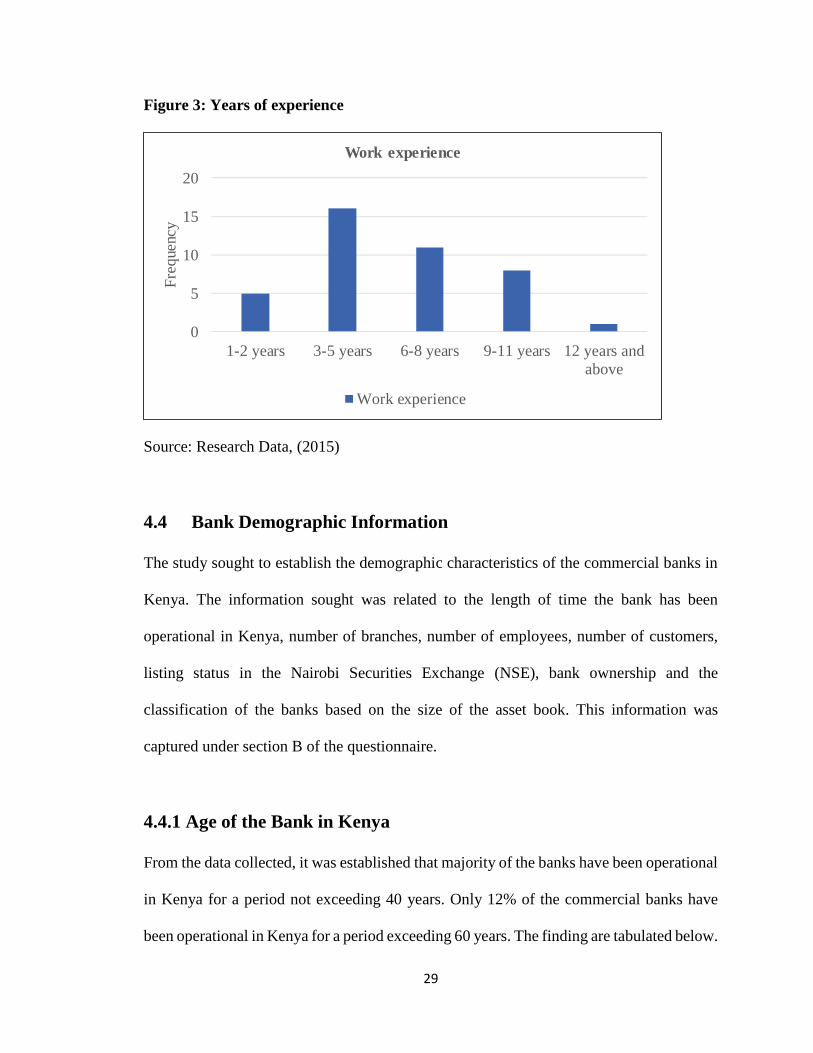
4.3.3 Number of Years Worked
The study sought to establish the number of years that the respondents had worked in the
commercial banks. From the data collected, it was established that majority of the
employees had worked in the bank for periods ranging between 3 and 8 years (66%) as
shown in the Figure 3 below.
Male, 61%
Female, 39%
Gender
Male Female
29
Figure 3: Years of experience
Source: Research Data, (2015)
4.4 Bank Demographic Information
The study sought to establish the demographic characteristics of the commercial banks in
Kenya. The information sought was related to the length of time the bank has been
operational in Kenya, number of branches, number of employees, number of customers,
listing status in the Nairobi Securities Exchange (NSE), bank ownership and the
classification of the banks based on the size of the asset book. This information was
captured under section B of the questionnaire.
4.4.1 Age of the Bank in Kenya
From the data collected, it was established that majority of the banks have been operational
in Kenya for a period not exceeding 40 years. Only 12% of the commercial banks have
been operational in Kenya for a period exceeding 60 years. The finding are tabulated below.
0
5
10
15
20
1-2 years 3-5 years 6-8 years 9-11 years 12 years andabove
Freq
uenc
yWork experience
Work experience

30
Table 4.2: Age of the bank
Number of years Frequency Percentage
1-20 16 39%
21-40 15 37%
41-60 5 12%
61-80 3 7%
81 and above 2 5%
Total 41 100%
Source: Research Data, (2015)
4.4.2 Number of Bank Branches
The study established that 80% of the commercial banks in Kenya have a network
distribution of less than 40 branches countrywide as shown in Table 4.3 below.
Table 4.3: Number of branches
Number of Branches Frequency Percentage
1-20 21 51%
21-40 12 29%
41-60 2 5%
61-80 1 2%
81-100 1 2%
Above 101 4 10%
Total 41 100%
Source: Research Data, (2015)
31
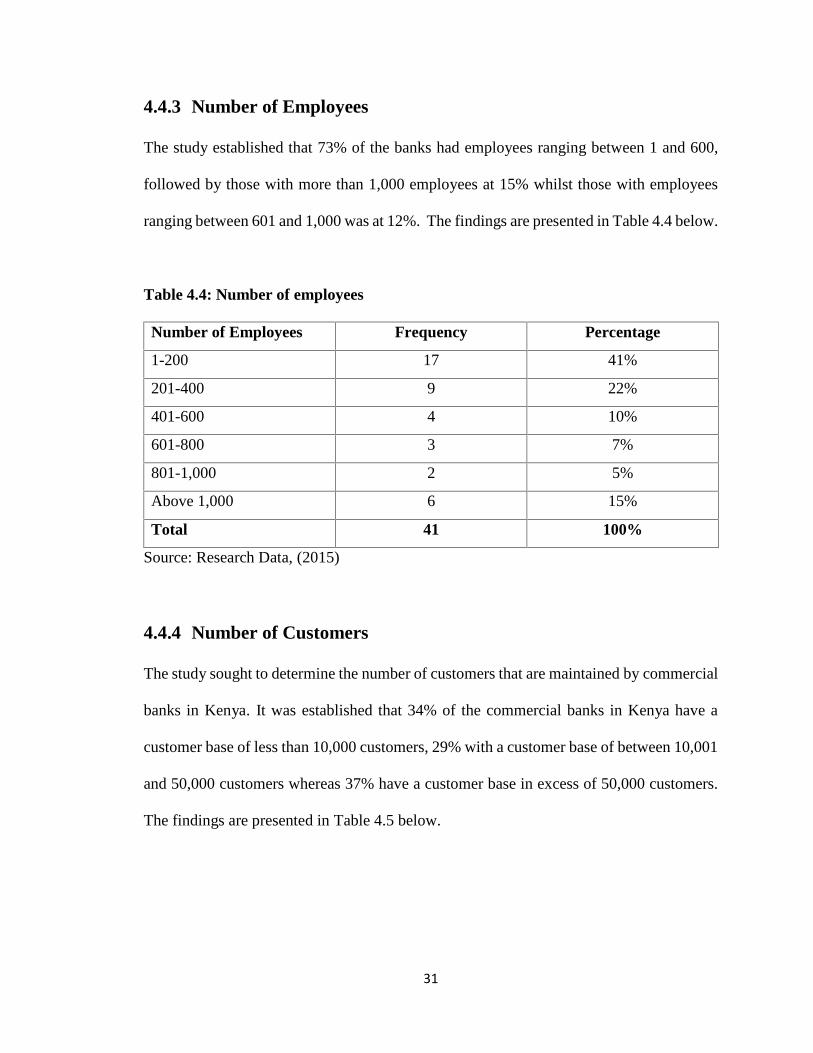
4.4.3 Number of Employees
The study established that 73% of the banks had employees ranging between 1 and 600,
followed by those with more than 1,000 employees at 15% whilst those with employees
ranging between 601 and 1,000 was at 12%. The findings are presented in Table 4.4 below.
Table 4.4: Number of employees
Number of Employees Frequency Percentage
1-200 17 41%
201-400 9 22%
401-600 4 10%
601-800 3 7%
801-1,000 2 5%
Above 1,000 6 15%
Total 41 100%
Source: Research Data, (2015)
4.4.4 Number of Customers
The study sought to determine the number of customers that are maintained by commercial
banks in Kenya. It was established that 34% of the commercial banks in Kenya have a
customer base of less than 10,000 customers, 29% with a customer base of between 10,001
and 50,000 customers whereas 37% have a customer base in excess of 50,000 customers.
The findings are presented in Table 4.5 below.

32
Table 4.5: Number of customers
Number of Customers Frequency Percentage
1-10,000 14 34%
10,001-20,000 5 12%
20,001-30,000 3 7%
30,001-40,000 2 5%
40,001-50,000 2 5%
Above 50,001 15 37%
Total 41 100%
Source: Research Data, (2015)
4.4.5 Listing Status at the NSE
The study found out that 24% of the banks were listed at the Nairobi Securities Exchange
(NSE) whilst 76% were not listed. The findings are presented in the pie chart below.
Figure 4: Listing status at the NSE
Source: Research Data, (2015)
Listed, 24%
Not Listed,76%
Listing Status at the NSE
Listed Not Listed

33
4.4.6 Ownership Structure of the Bank
The study sought to determine the ownership structure of the commercial banks in Kenya.
Locally owned commercial banks are the majority at 69%. The findings are presented in
Table 4.6 below.
Table 4.6: Ownership structure of the bank
Ownership Frequency Percentage
Private locally owned 22 54%
Foreign owned 13 32%
Public locally owned 6 15%
Total 41 100%
Source: Research Data, (2015)
4.4.7 Classification of the Bank
The study sought to establish the classification of the banks into ‘tiers’ based on the size
of their asset book. Tier III and Tier IV banks account for 56% of the commercial banks
in Kenya. The findings are shown in Table 4.7 below.

34
Table 4.7: Bank classification
Classification Frequency Percentage
Tier I - Assets above Ksh. 150 billion 7 17%
Tier II - Assets between Ksh. 50-150 billion 11 27%
Tier III - Assets between Ksh. 15-50 billion 12 29%
Tier IV- Assets below Ksh. 15 billion 11 27%
Total 41 100%
Source: Research Data, (2015)
4.5 Determinants of Strategic Drift
The objective of the research was to establish the determinants of strategic drifts and their
effect in the performance of commercial banks in Kenya. This section was necessary for
establishing the specific determinants of strategic in the performance of commercial banks
in Kenya. A 5 point Likert scale was used to collect data. The scale signified the extent to
which specific banks agreed or disagreed with the proposed determinants of strategic drift
in the questionnaire. On the 5 point Likert scale, 1 represented a position of strong
disagreement, whereas 5, which was the maximum score represented a position of strong
agreement. This information was captured under section C of the questionnaire.
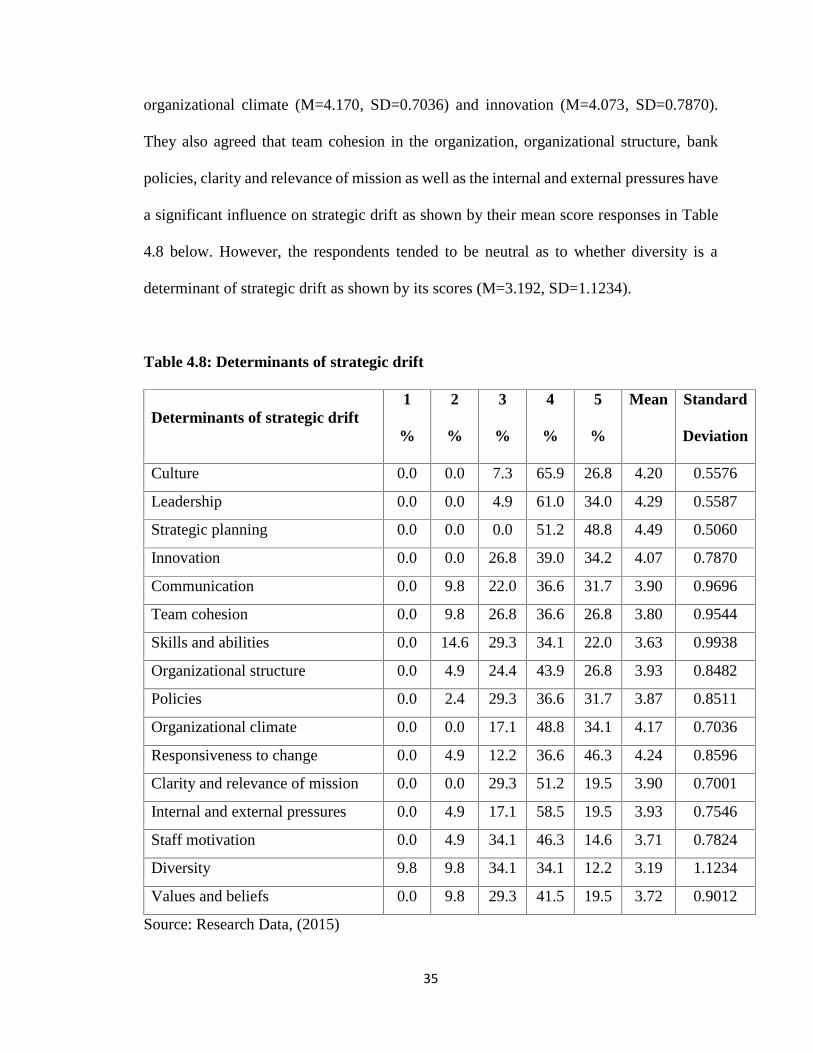
Sixteen items were used to seek the respondents’ degree of agreement or disagreement on
the determinants of strategic drift in commercial banks in Kenya. On the basis of mean
response scores, the respondents tended to agree to a greater extent with most of the aspects
provided. Specifically, they strongly agreed that strategic planning is the key determinant
of strategic drift (M=4.487, SD=0.5060), followed by leadership (M=4.292, SD=0.5587),
responsiveness to change (M=4.243, SD=0.8596), culture (M=4.195, SD=0.5576),
35
organizational climate (M=4.170, SD=0.7036) and innovation (M=4.073, SD=0.7870).
They also agreed that team cohesion in the organization, organizational structure, bank
policies, clarity and relevance of mission as well as the internal and external pressures have
a significant influence on strategic drift as shown by their mean score responses in Table
4.8 below. However, the respondents tended to be neutral as to whether diversity is a
determinant of strategic drift as shown by its scores (M=3.192, SD=1.1234).
Table 4.8: Determinants of strategic drift
Determinants of strategic drift1
%
2
%
3
%
4
%
5
%
Mean Standard
Deviation
Culture 0.0 0.0 7.3 65.9 26.8 4.20 0.5576
Leadership 0.0 0.0 4.9 61.0 34.0 4.29 0.5587
Strategic planning 0.0 0.0 0.0 51.2 48.8 4.49 0.5060
Innovation 0.0 0.0 26.8 39.0 34.2 4.07 0.7870
Communication 0.0 9.8 22.0 36.6 31.7 3.90 0.9696
Team cohesion 0.0 9.8 26.8 36.6 26.8 3.80 0.9544
Skills and abilities 0.0 14.6 29.3 34.1 22.0 3.63 0.9938
Organizational structure 0.0 4.9 24.4 43.9 26.8 3.93 0.8482
Policies 0.0 2.4 29.3 36.6 31.7 3.87 0.8511
Organizational climate 0.0 0.0 17.1 48.8 34.1 4.17 0.7036
Responsiveness to change 0.0 4.9 12.2 36.6 46.3 4.24 0.8596
Clarity and relevance of mission 0.0 0.0 29.3 51.2 19.5 3.90 0.7001
Internal and external pressures 0.0 4.9 17.1 58.5 19.5 3.93 0.7546
Staff motivation 0.0 4.9 34.1 46.3 14.6 3.71 0.7824
Diversity 9.8 9.8 34.1 34.1 12.2 3.19 1.1234
Values and beliefs 0.0 9.8 29.3 41.5 19.5 3.72 0.9012
Source: Research Data, (2015)
36
4.6 Effect of Strategic Drift on Bank Performance
Strategic drift is the strategy that gradually fails to meet the pressures of the environment.
Performance measurement is essential because it enables management to evaluate the
strategy and its implementation, and hence determine its effect on the bank. Without
credible and accurate measures of performance, it is difficult for the management to have
a good grasp of the banks activities that will allow them to make good and informed
decisions as well as avoid strategic gaps.
In order to establish the performance of commercial banks in Kenya, the respondents were
provided with eight statements with different aspects of performance measurement. They
were required to state the extent to which they agreed or disagreed with the statements on
a 5 point Likert scale. This information was captured under section D of the questionnaire.
The findings of the study established that majority of the banks have been performing well
as shown by their mean responses summarized in Table 4.9 below.

37
Table 4.9: Bank performance
Bank performance1
%
2
%
3
%
4
%
5
%
Mean Standard
Deviation
Yearly objectives 0.0 0.0 17.1 70.7 12.2 3.95 0.5455
Growth in market share 0.0 4.9 9.8 63.4 22.0 4.02 0.7242
Customer growth 0.0 0.0 7.3 65.9 26.8 4.20 0.5577
Dividends to shareholders 0.0 0.0 4.9 61.0 34.1 4.09 0.5587
Increased products 0.0 2.4 12.2 48.8 36.6 4.20 0.7490
Financial performance 0.0 0.0 4.9 51.2 43.9 4.39 0.5864
Branch expansion 0.0 14.6 14.6 34.1 36.6 3.93 1.0581
Employee management 0.0 7.3 7.3 48.8 34.1 4.12 0.8425
Source: Research Data, (2015)
4.7 Discussion of the Findings
4.7.1 Comparison with Theory
The emphasis of this study was to undertake an in depth evaluation and understanding of
the determinants of strategic drifts and their effects on performance of commercial banks
in Kenya. The findings of the study established that the process of strategic planning should
be consultative and flexible in order to ensure that structure aligns with the strategic
objectives of the bank. Communication of strategy is vital in order to enhance attainment
of organizational objectives and improved performance of the bank. This is in tandem with
Porter’s strategy which is about positioning a business in a given industry structure so as
to avoid strategic drifts and eventually enhance organizational performance (Prahalad &
Hamel, 1994).
38
The results of this study have also supported the path dependency theory by Arthur (1994),
because it is increasingly important to identify actions and events that may actually trigger
a path-dependent process in and across organizations as early as possible. Once identified,
management should not give up, but join in the process of path-shaping, even of path-
breaking and creating so as to avoid strategic drifts (Ebbinghaus, 2005).
The path dependency theory points to the irreversibility or the lock-in of certain processes
and their underlying decisions. The theory assumes that initially decisions are open to
revision, but from a certain point in time onwards, decisions taken increasingly restrain
present and future choices. As a result, decisions that have been taken in the past may
increasingly amount to an imperative for the future course of action. However, because of
market pressures, the most efficient solution will finally prevail, and that decisions are
principally reversible and will be reversed if better solutions are available.
This theory is therefore relevant to the study because the success of a firm to face
increasingly complex and dynamic environments, and eventually to attain a profitable
growth, depends on its ability to simultaneously explore new opportunities and exploit
existing business models (Schmitt et al., 2010; Raisch, 2008). Hence, for commercial banks
in Kenya to endure a highly competitive market, they need to balance the exploration of
new knowledge and the exploitation of existing knowledge.

39
4.7.2 Comparison with other Empirical Studies
Commercial banks in Kenya are faced by a myriad of changes in their environment
regardless of their size, number of branches, numbers of employees, number of customers,
listing status at the NSE, the number of years in operation or in the scope of business.
Strong forces from the environment are likely then to push banks into a strategic drift. This
concurs with Miller (2005) who stated that if changes in an organization’s environment are
at a greater rate than that rate of incremental strategic change, the organizations will get
out of line with its environment.
The finding of this study established that commercial banks that are in touch with their
environment and address the exigencies emanating in a timely, effective and efficient
manner are more likely to have a positive performance. This is supported by Chang &
Chuang (2009) who argue that performance measurement becomes the basis of strategy
establishment and achievement in the future because it can definitely bring a company’s
vision and strategic target to all organization members and performs a role that makes
efficient internal business processes possible.
This study shares some similarities with several studies that have been conducted in the
past. The findings indicate that strategic planning is a key determinant of strategic drift
because it centers on the direction of the organization and actions needed to improve its
performance. This is in agreement with Wheeller & Hunger (2008) who note that effective
strategic planning can transform the performance of an organization, make fortunes for
shareholders, or change the structure of an industry.
40
Organizational structure was also established to be a key determinant of strategic because
it influences communication flow within the organization. A study conducted by Kariuki
(2004) on the IT strategy and organization structure relationship in companies listed on the
NSE established that changes in IT strategy almost always meant changes in the
organization structure. The findings of this study indicated that the organization structure
had a very high effect on the response rate to technological changes in companies. This
finding was a confirmation of the need for commercial banks to adopt organization
structures that allow for adaptation to changes in strategy within the business environment.
Further, Otieno (2011) conducted a study on the strategy-structure alignment at Kenya
Commercial Bank Group Limited while Munyiva (2012) conducted a study on the strategy
and structure alignment at Barclays Bank of Kenya. Both researchers observed that every
organization needs an organization structure that is capable of delivering its strategic intent.
Therefore, the findings of this study affirmed the empirical findings of the other scholars
on the need for alignment of organization structure with the expected strategic objectives.
A majority of the commercial banks agreed to a greater extent that the determinants of
strategic drift must be tackled on an ongoing basis as an ingredient for positive
performance. This is supported by Aguilar (2009) and Fahey & King (2010) who argue
that there is need to re-evaluate strategy constantly in order to respond to turbulent and
shorter unstable life cycles so as to avoid strategic drift. Organizations need to respond to
these changes by continuously scanning the environment and adopt strategies that position
them as viable in the market and enhance their performance.
41
CHAPTER FIVE
SUMMARY, CONCLUSIONS AND RECOMMENDATIONS
5.1 Introduction
This chapter presents a summary of the findings with the main aim of answering the
research questions and draw conclusions based on those findings. In addition, appropriate
recommendations will be made and insights provided in the areas for further research.
5.2 Summary of Findings
The study sought to establish the determinants of strategic drift and their effects on the
performance of commercial banks in Kenya. The study conducted a census targeting all
the 43 commercial banks in Kenya. The response rate was at 95% and from the data
collected, majority of the respondents were male in the middle and senior management
levels and had worked in the commercial banks for more than three years.
According to the findings of this study, it was established that the main determinants of
strategic drift are strategic planning, leadership, responsiveness to change, culture,
organizational climate, innovation and communication. The respondents also agreed that
team cohesion, organizational structure, policies of the bank, clarity and relevance of
mission as well as internal and external pressures have a significant influence on strategic
drift and the performance of commercial banks in Kenya.
The study also established that there has been a tremendous improvement in the
performance of commercial banks in Kenya over the last five years. This is reflected by

42
the positive financial performance, increase in customer base, increase in competitive
products being introduced into the market, achievement of set yearly objectives as well as
the expansion in branch network in a majority of the banks. However, to achieve improved
bank performance, there is need to continuously monitor the implementation of strategy in
order to establish and detect if the strategy is correctly executed. Monitoring also allows
the management of commercial banks to determine if the strategy fits well with the
company’s environment and thus avoid strategic gaps that could lead to strategic drift.
5.3 Conclusions
From the analysis, the study concludes that all the variables under study, that is,
organizational culture, leadership, strategic planning, innovation and communication
among other determinants of strategic drift have a significant effect on the performance of
commercial banks in Kenya. First and foremost, the findings imply that the process of
strategic planning should be consultative to ensure that structures align with strategy. This
alignment will ensure that banks avoid strategic gaps and allow for the satisfaction of all
stakeholders’ needs and expectations.
Secondly, the findings also imply that the leadership and organization structure should be
flexible to facilitate prompt responses to environmental changes including political,
technological, economic and natural factors. Lastly, the findings imply that commercial
banks in Kenya need to adopt a learning culture so that the discipline of organization
learning practices are inculcated into the daily routine of the banks. By doing this, they can
be able to respond to both internal and external pressures of change in a holistic manner.
43
In case of a strategic drift situation, the key is flexibility. Commercial banks must know
how to manage changes in their domain and how to address and fill the gaps between what
is planned and what is delivered. This is because the study has established that strategic
drift could be caused by either a combination of many factors or due to a multitude of small
problems ranging from team cohesion, values and beliefs, staff motivation and clarity of
mission among others. It can also be caused by negligence from the top management if
they fail to monitor the direction of the company or they neglect the implementation of the
strategy. Strategic drift may also be due to either a bad analysis of the environment by the
top management and its inability to communicate the strategy, or by a low-quality feedback
from the operational level that is in direct contact with the environment on day-to-day
activities.
5.4 Recommendations for Policy and Practice
There is need for the management teams of commercial banks in Kenya to conduct proper
analysis of the environment. This will enable them to detect even the slightest changes in
the environment and hence make the necessary strategic adjustments and communicate the
refreshed strategy to their teams with the main aim of enhancing the attainment of
organizational objectives and improvement of bank performance.
There is also need for management to align the organization structures with strategic
objectives to allow for efficiency in service delivery to customers and allow for adaptability
to changes in the business environment. Further, to prevent a strategic drift of the

44
company’s strategies, it is important to appreciate the complexity of the environment and
incorporate it into the strategy development process.
The management teams of commercial banks in Kenya should ensure that their
organization structures allow for enhanced implementations of new strategies. This will
allow proper communication and hence facilitate a quicker response to competition,
technological changes, economic changes and socio-cultural changes in the business
environment. The culture in the organization should not be resistant to change. The mission
of the bank should be clear. The values and beliefs of the employees should be aligned with
the mission and vision of the bank hence enabling flexibility and efficiency in the
operations of the bank and thus enhancing bank performance.
5.5 Recommendations for Further Study
The researcher suggests that a study whose respondents include non-management staff be
carried out to provide a greater insight into their perception of the influence of strategic
drift on the performance of commercial banks in Kenya. Also, another study should be
conducted to examine whether the same results will be obtained as well as establish ways
of preventing strategic drift in not only banks but in other institutions.
Given that the study focused on one industry, a similar kind of study and research
approach can be used to establish the determinants of strategic drift and their effect on the
performance of other industries and sectors in Kenya such as micro finance, insurance
companies, non-bank lending companies and leasing companies among others to allow for

45
the establishment of whether the same determinants of strategic drift have the same effects
on the performance of other industries and sectors.

46
REFERENCES
Aguilar, F. J. (2009). Scanning the Business Environment. Macmillan, New York, NY.
Al-Smadi, M. O. & Al-Wabel, S. A. (2011). The impact of E-banking on the performanceof Jordanian Banks. Journal of Internet Banking and Commerce, 16(2).
Ambrosini, V. & Bowman, C. (2003). Managerial consensus and corporate strategy.European Management Journal, Vol. 21, pp. 213-21
Arthur, W. B. (1994). Increasing returns and path dependency in the economy. Universityof Michigan Press, Ann Arbor.
Auster, E. & Choo, C. W. (2004). How senior managers acquire and use information inenvironmental scanning. Information Processing and Management Journal, Vol.30, pp. 67-85.
Ayrga, A. (2011). Is Mauritius Ready to E-bank? From a Customer and BankingPerspective. Journal of Internet Banking and Commerce, 16(1).
Burgelman, R. A. & Grove, A. S. (1996). Strategic dissonance. California ManagementReview, vol. 38, pp. 8-25.
Burton, R. M., Lauridsen, J. & Obel, B. (2004). The impact of organizational climate andstrategic fit on firm performance. Human Resource Management, 43(1), pp. 67-82.
Cakar, N. D. & Erturk, A. (2010). Comparing innovation capability of Small and medium-sized enterprises: Examining the effects of organizational culture andempowerment. Journal of Small Business Management, 48, pp. 325-359.
Central Bank of Kenya, (2013). Kenya Monthly Economic Review.
Central Bank of Kenya [CBK], (2013). Bank Supervision Annual Report 2013. Availablefrom www.centralbank.go.ke.
Central Bank of Kenya [CBK], (2014). Bank Supervision Annual Report 2014. Availablefrom www.centralbank.go.ke.
Chang, T. & Chuang, S. (2009). Performance Effects of Knowledge Management:Corporate Management Characteristics and Competitive Strategy Enablers. AsianJournal of Management and Humanity Sciences, 4(4), pp. 181-199.
Collier, R. B. & Collier, D. (1991). Shaping the political arena: Critical junctures, thelabor movement and regime dynamics in Latin America. Princeton UniversityPress, Princeton, Penn.
47
Communications Commission of Kenya [CCK] (2013). Sector Statistics for Quarter 2,Available from www.cck.go.ke.
Cooper, D. R. & Schindler, P. S. (2006). Business Research Methods (third Ed.). NewYork, NY: McGraw-Hill.
Costa, J. (2010). A study of strategic planning and environmental scanning in the multi-unit Portuguese hotel sector. Guildford, University of Surrey.
Danciu, V. (2010). The Gravity Law of Marketing - a Major Reason for Change to aBetter Performance. Theoretical and Applied Economics, vol. XVII (4), pp. 7-18.
Dinwoodie, D. L. (2013). Strategic Leadership Challenges: Findings of Empirical DataAnalysis. Greensboro, NC: Center for Creative Leadership.
Doz, Y. & Kosonen, M. (2008). The Dynamics of Strategic Agility: Nokia’sRollercoaster Experience. California Management Review, 50(3), pp. 95-118.
Dwyer, L. & Edwards, D. (2009). Tourism Product and Service Innovation to avoid‘Strategic Drift’. International Journal of Tourism Research, 11, pp. 321-335.
Dziri, R. (2011). Avoiding strategic drifts in a hypercompetitive market. Published MBAMaster’s Thesis, Berlin School of Economics and Law.
Ebbinghaus, B. (2005). Can path dependence explain institutional change? Twoapproaches applied to welfare state reform. MPIfG Discussion Paper 05/2. MaxPlanck Institute for the Study of Societies, Cologne.
Fahey, L. & King, W. R. (2010). Environmental scanning for corporate planning.Business Horizons, Vol. 20, No 4, pp. 61-71
Fitchet, H. & Giraud, L. (2007). How the information flow is processed in project-basedcompanies and how it affects strategic drift. Published MBA Thesis: UMEAUniversity.
Gephardt, M. A. & Van Buren, M. E. (1996). The power of high performance worksystems. Training and Development, 50:10, pp. 21-36
Ghauri, P. & Gronhaug, K. (2005). Research Methods in Business Studies, A practicalGuide.3rd ed. Pearson Education Limited, London.
Grant, R. M. (2008). Contemporary Strategy Analysis: Concepts, Techniques,Applications, 3rd ed., Blackwell Business, Malden, MA.
Grant, M. R. (2010). Contemporary Strategy Analysis. 7th edition. John Wiley and Sons.

48
Hamel, G. & Välikangas, L. (2003). The quest for resilience. Harvard Business Review,pp. 52.
Haour, G. (2004). Resolving the innovation paradox: enhancing growth in technologycompanies. New York: Palgrave Macmillan.
Harrison, F. & Pelletier, M. (2000). Levels of strategic decision success. ManagementDecision Journal, Vol. 38, pp. 107‐117.
Heskett, J. (2011). The culture cycle: How to shape the unseen force that transformsperformance. New Jersey: FT Press.
Hill, C. W. L. & Jones, G. R. (2001). Strategic Management Theory, An integratedapproach. Boston: Houghton Mifflin.
Johnson, G., Scholes, R. & Whittington, R. (2005). Exploring Corporate Strategy. 7thedition. Hardow, UK: Pearson Education Limited.
Johnson, G. & Scholes, K. (2008). Exploring Corporate Strategy; Texts and Cases.Prentice Hall, New Delhi, 6th edition.
Johnson, J. & Whittington, R. (2006). Exploring corporate strategy. Prentice Hall, NewDelhi.
Kaplan, R. S. & Norton, D. P. (1996). The Balanced Scorecard. Harvard Business SchoolPress, Boston, MA.
Karanja, S. C., Muathe, S. M. A. & Thuo, J. K. (2014). Marketing Capability and theperformance of Mobile Service Provider. Organizations in Nairobi County,Kenya. International Journal of Education and Research, Vol. 2, No 5, May 2014.
Kauffman, S. A. (1993). The origin of order. Self-organization and selection in evolution.Oxford University Press, Oxford.
Kiveu, C. (2013). Challenges of implementation of turnaround strategy at the New KenyaCooperative Creameries (NKCC) in Kenya. Unpublished MBA Thesis:University of Nairobi.
Kothari, C. R. (2008). Research methodology: Methods and techniques. New Delhi: NewInternational Publishing.
Mahoney, J. (2000). Path dependence in historical sociology. Theory and Society 29,pp. 507-509.
Mankins, M.C. & Steele, R. (2005). Turning great strategy into great performance.Harvard Business Review.
49
Mark, T. & Spencer, M. (2008). Strategy Dynamics Presentation. Cambridge UniversityPress, Cambridge.
Mathur, A. A. (2004). Dimensions of e-quality. International Journal of Quality &Reliability Management, (19), pp. 246-58.
McGuire, J. B. & Rhodes, G. (2009). Transforming Your Leadership Culture. SanFrancisco, CA: Jossey-Bass.
McLean, A. & Marshall, J. (1993). Intervening in Cultures. Working Paper, University ofBath.
Miller, I. (2005). Managing for the long-run: Lessons in competitive advantage fromgreat family businesses. Boston, MA: Harvard Business School Press.
Mugambi, G. K., Chege, J. M. & K’Obonyo, P. (2011). ‘PIMS and CorporatePerformance: The influence of Strategic Capabilities and Contextual factors inKenya’. Unpublished PhD Thesis, Kenyatta University.
Mugenda, O. M. & Mugenda, A. G. (2003). Research Methods: Quantitative &Qualitative Approaches. Acts Press. Nairobi. Kenya.
O’Regan, N., Kling, G., Ghobadian, A. & Perren, L. (2012). Strategic positioning andgrand strategies for high-technology SMEs. Strategic Change Journal of BusinessStudies, 21, pp. 199-215.
Pasmore, W. (2009). Developing a Leadership Strategy: A Critical Ingredient forOrganizational Success. A White Paper. Greensboro, NC: Center for CreativeLeadership.
Porter, M. (1980). Competitive Strategy: Techniques for Analyzing Industries andCompetitors. New York, the Free Press.
Prahalad, C. K. & Hamel, G. (1994). Strategy as a Field of Study: Why Search for a NewParadigm? Strategic Management Journal, Vol. 15, pp. 5-16.
Raisch, S., Birkinshaw, J., Probst, G. & Tushman, M.L. (2009). OrganizationalAmbidexterity: Balancing Exploitation and Exploration for SustainedPerformance. Organization Science Journal 20(4), pp. 685–695.
Richard, G. & Stevenson, G. (2009). Localization of business activities: a local strategyapproach, Management Decision. Free Press & Collier Macmillan, New York,NY.
Sammut-Bonnici, T. (2015). Strategic Drift. Wiley Encyclopedia of Management.12:1–4.
50
Schmitt, A., Probst, G. & Tushman, M. L. (2010). Management in Times of EconomicCrisis: Insights into Organizational Ambidexterity. Management Journal, 13(3),pp. 128-150.
Schoemaker, P. (1990). Strategy, complexity and economic rent. Management ScienceJournal, Vol. 36, pp. 1178-1192.
Teece, D. J. (2007). Explicating dynamic capabilities: the nature and micro foundations of(sustainable) enterprise performance. Strategic Management Journal, vol. 28,pp. 131-135.
Thompson, A., Strickland, A. & Gamble, J. E. (2008). Crafting and Executing Strategy,15th Ed. New York: McGraw Hill.
Tidd, J. & Bessant, J. (2009). Managing innovation: Integrating technological, marketand organizational change, 4th edition. Chichester, UK: John Wiley.
Välikangas, L. (2010). The Resilient Organization, How adaptive cultures thrive evenwhen strategy fails. McGraw Hill.
Van Velsor, E. & Wright, J. (2012). Expanding the Leadership Equation: DevelopingNext generation Leaders. A White Paper. Greensboro, NC: Center for CreativeLeadership.
Wang, F. & Jiang, H. (2009). Innovation paradox and ambidextrous organization: A casestudy on development teams of air conditioner in Haier, Frontiers of BusinessResearch in China, 3(2), pp. 271-300.
Wheeller, L. T. & Hunger, J. D. (2008). Strategic Management and Business policy:concepts and cases, 11th Edition. New Jersey, Prentice Hall.
Xu, X. M., Lehaney, B., Clarke, S. & Duan, Y. (2003). Some UK and USA comparisonsof executive information systems in practice and theory. Journal of End UserComputing, 15, pp. 1-19.

51
APPENDICES
APPENDIX I: INTRODUCTORY LETTER
To whom it may concern,
Ref: Academic Research
I am a student at the University of Nairobi doing an academic research about the
‘Determinants of strategic drift and their effects on performance of commercial banks in
Kenya’. The study is in partial fulfilment for the award of a Master Degree in Business
Administration (Strategic Management Option).
The purpose of this letter is therefore to request that you fill the attached questionnaire that
provides the necessary data to be used in the research. The data provided in the
questionnaire will be used solely for academic purposes and will be treated with utmost
confidentiality.
Your assistance will be highly appreciated.
Yours Sincerely,
Henry O. Maosa
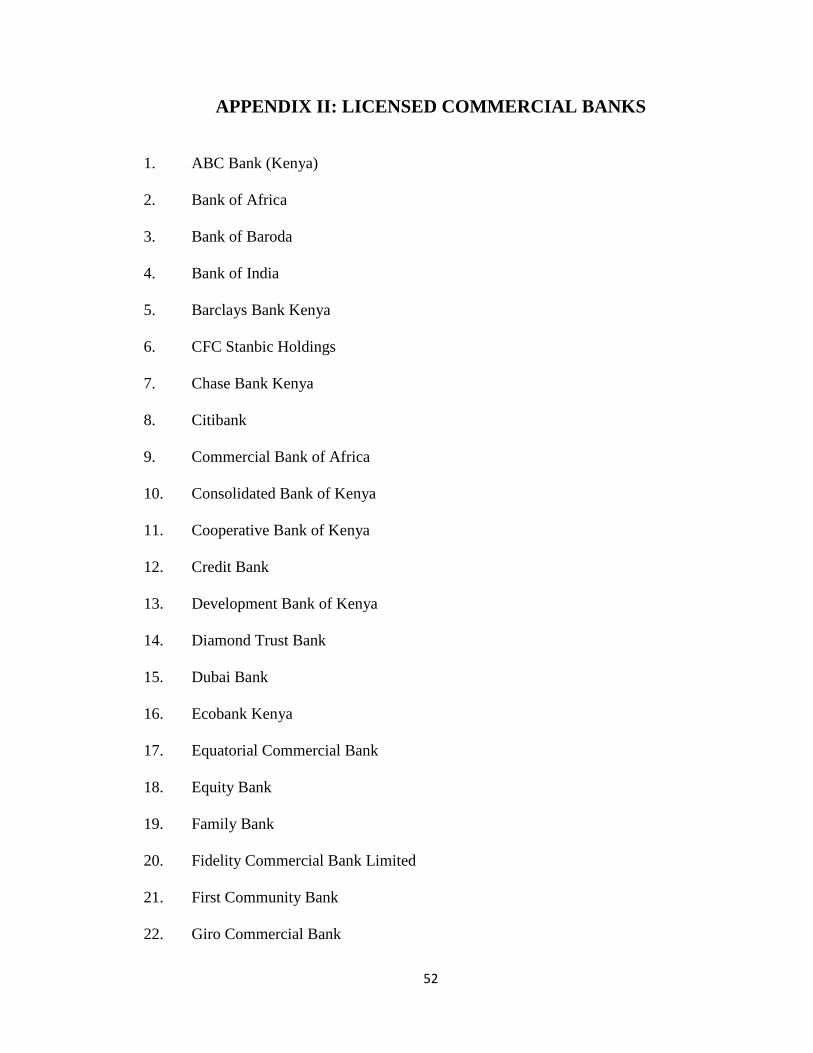
52
APPENDIX II: LICENSED COMMERCIAL BANKS
1. ABC Bank (Kenya)
2. Bank of Africa
3. Bank of Baroda
4. Bank of India
5. Barclays Bank Kenya
6. CFC Stanbic Holdings
7. Chase Bank Kenya
8. Citibank
9. Commercial Bank of Africa
10. Consolidated Bank of Kenya
11. Cooperative Bank of Kenya
12. Credit Bank
13. Development Bank of Kenya
14. Diamond Trust Bank
15. Dubai Bank
16. Ecobank Kenya
17. Equatorial Commercial Bank
18. Equity Bank
19. Family Bank
20. Fidelity Commercial Bank Limited
21. First Community Bank
22. Giro Commercial Bank
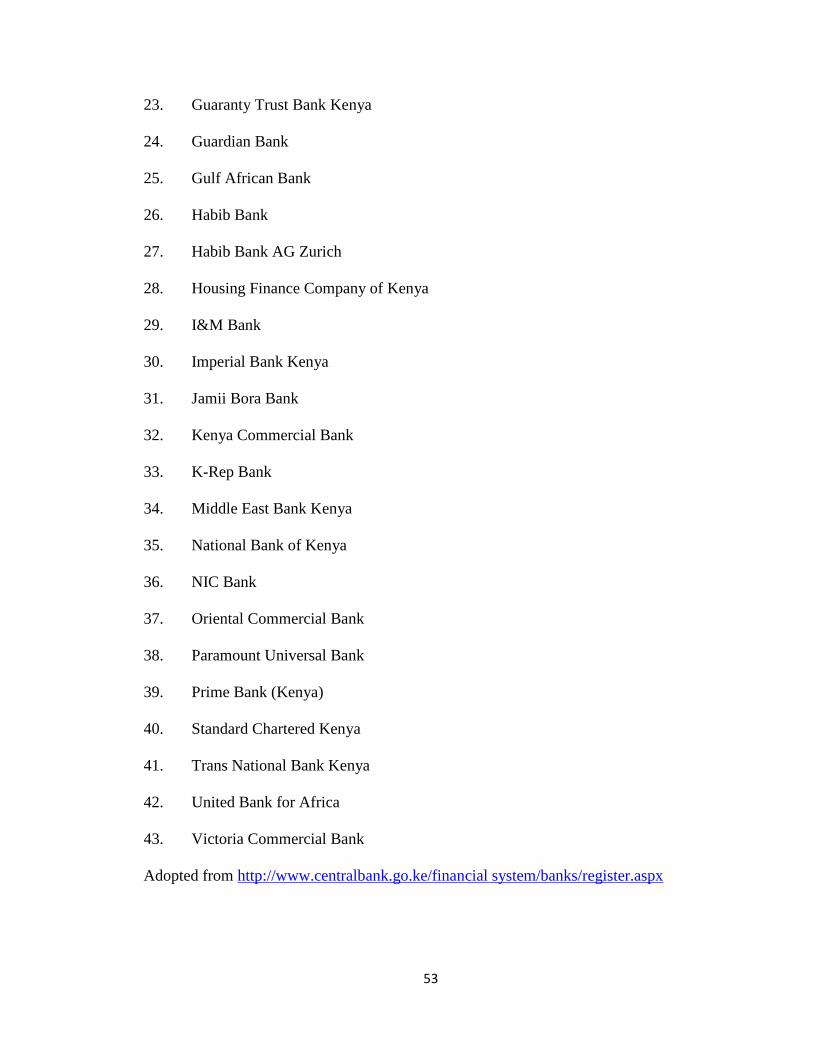
53
23. Guaranty Trust Bank Kenya
24. Guardian Bank
25. Gulf African Bank
26. Habib Bank
27. Habib Bank AG Zurich
28. Housing Finance Company of Kenya
29. I&M Bank
30. Imperial Bank Kenya
31. Jamii Bora Bank
32. Kenya Commercial Bank
33. K-Rep Bank
34. Middle East Bank Kenya
35. National Bank of Kenya
36. NIC Bank
37. Oriental Commercial Bank
38. Paramount Universal Bank
39. Prime Bank (Kenya)
40. Standard Chartered Kenya
41. Trans National Bank Kenya
42. United Bank for Africa
43. Victoria Commercial Bank
Adopted from http://www.centralbank.go.ke/financial system/banks/register.aspx
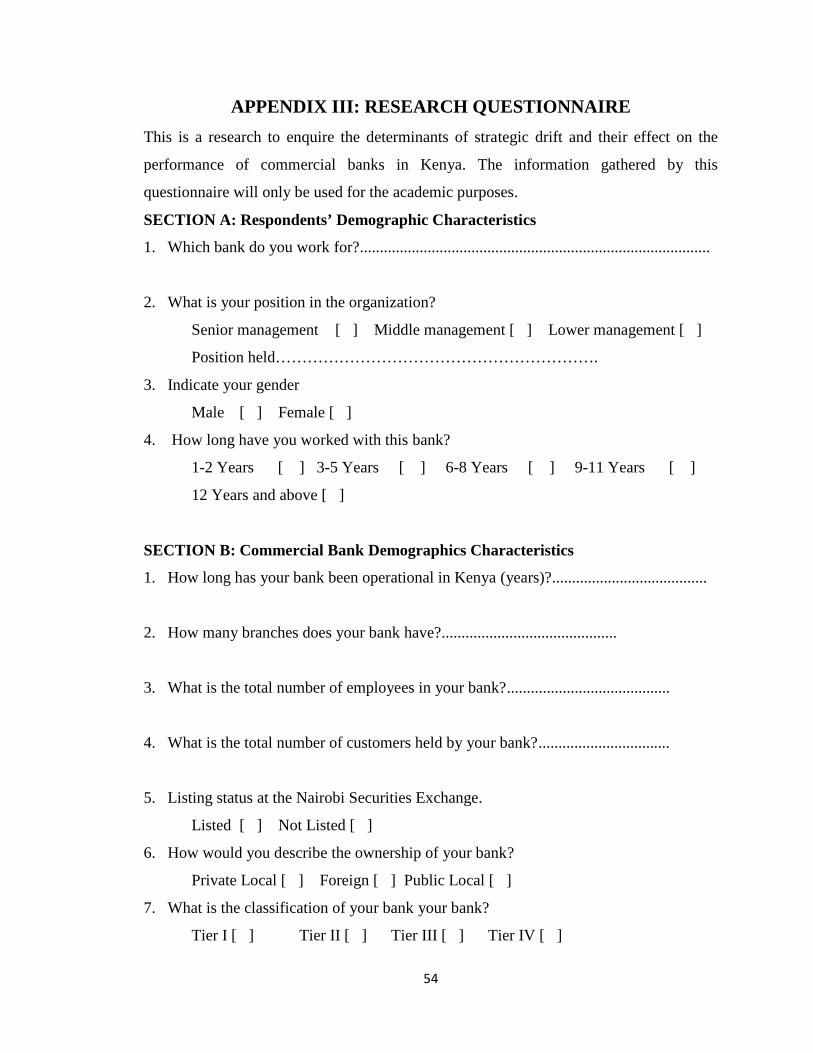
54
APPENDIX III: RESEARCH QUESTIONNAIRE
This is a research to enquire the determinants of strategic drift and their effect on the
performance of commercial banks in Kenya. The information gathered by this
questionnaire will only be used for the academic purposes.
SECTION A: Respondents’ Demographic Characteristics
1. Which bank do you work for?........................................................................................
2. What is your position in the organization?
Senior management [ ] Middle management [ ] Lower management [ ]
Position held…………………………………………………….
3. Indicate your gender
Male [ ] Female [ ]
4. How long have you worked with this bank?
1-2 Years [ ] 3-5 Years [ ] 6-8 Years [ ] 9-11 Years [ ]
12 Years and above [ ]
SECTION B: Commercial Bank Demographics Characteristics
1. How long has your bank been operational in Kenya (years)?.......................................
2. How many branches does your bank have?............................................
3. What is the total number of employees in your bank?.........................................
4. What is the total number of customers held by your bank?.................................
5. Listing status at the Nairobi Securities Exchange.
Listed [ ] Not Listed [ ]
6. How would you describe the ownership of your bank?
Private Local [ ] Foreign [ ] Public Local [ ]
7. What is the classification of your bank your bank?
Tier I [ ] Tier II [ ] Tier III [ ] Tier IV [ ]
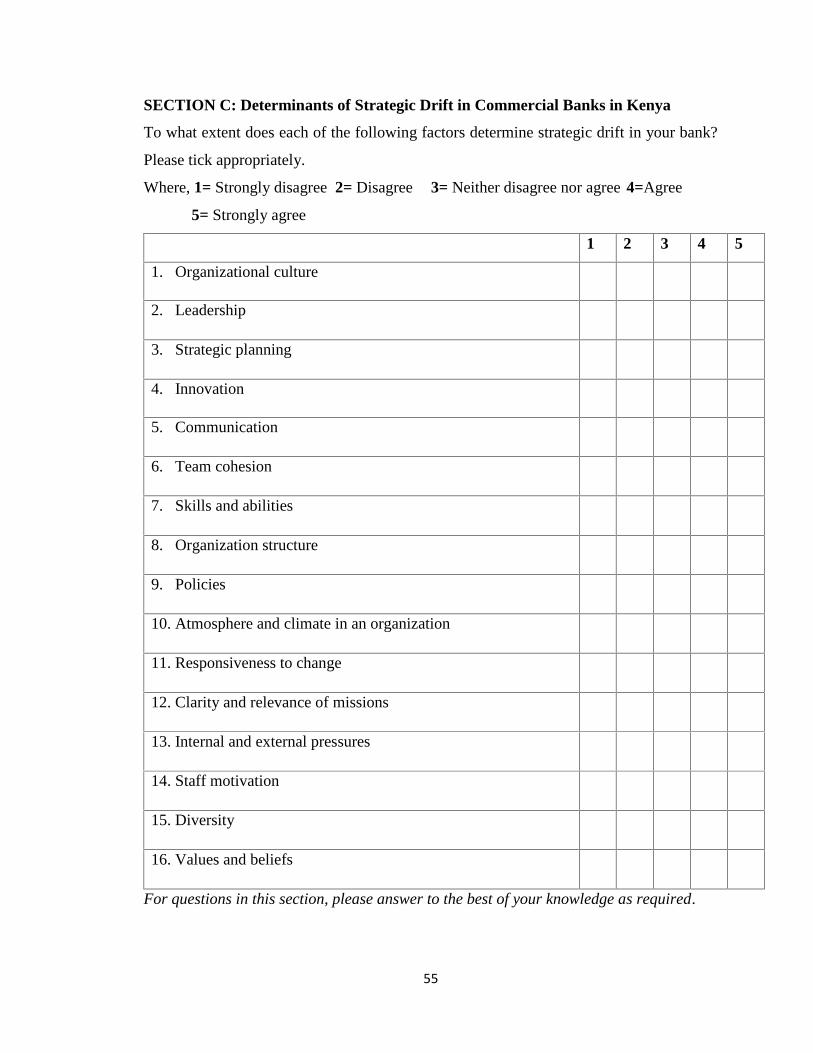
55
SECTION C: Determinants of Strategic Drift in Commercial Banks in Kenya
To what extent does each of the following factors determine strategic drift in your bank?
Please tick appropriately.
Where, 1= Strongly disagree 2= Disagree 3= Neither disagree nor agree 4=Agree
5= Strongly agree
1 2 3 4 5
1. Organizational culture
2. Leadership
3. Strategic planning
4. Innovation
5. Communication
6. Team cohesion
7. Skills and abilities
8. Organization structure
9. Policies
10. Atmosphere and climate in an organization
11. Responsiveness to change
12. Clarity and relevance of missions
13. Internal and external pressures
14. Staff motivation
15. Diversity
16. Values and beliefs
For questions in this section, please answer to the best of your knowledge as required.

56
SECTION D: Effects of Strategic Drift on the Performance of Commercial Banks in
Kenya
To what extent do you agree with the following statements? Please tick appropriately.
Where, 1= Strongly disagree 2= Disagree 3= Neither disagree nor agree 4=Agree
5= Strongly agree
1 2 3 4 5
1. The bank has been able to achieve yearly objectives andgoals for the last 5 years.
2. The market share of the bank has had a positive growth in thelast 5 years.
3. The bank’s customer base has had a positive growth in thelast 5 years.
4. The bank has been paying dividends to its shareholders in thelast 5 years.
5. The bank has had growth in competitive products offering inthe last 5 years.
6. The bank has had a positive financial performance(Profitability, Return on Assets and Return on Equity) in thelast 5 years.
7. The bank has had branch expansion in Kenya in the last 5years.
8. Employees’ terms and conditions of engagement(remuneration, retention, succession planning, benefits andpriviledges) have improved over the last 5 years.
Thank you for taking your time to fill this questionnaire.