MR elastography for evaluating regeneration of tissue-engineered cartilage in an ectopic mouse model
Upload
mayoclinicCategory
view
3download
0
High-Frequency Mode Conversion Technique for StiffLesion Detection with Magnetic Resonance Elastography(MRE)
Yogesh K. Mariappan,1 Kevin J. Glaser,1 Armando Manduca,2 Anthony J. Romano,3
Sudhakar K. Venkatesh,4 Meng Yin,1 and Richard L. Ehman1*
A novel imaging technique is described in which the modeconversion of longitudinal waves is used for the qualitativedetection of stiff lesions within soft tissue using magnetic res-onance elastography (MRE) methods. Due to the viscoelasticnature of tissue, high-frequency shear waves attenuate rapidlyin soft tissues but much less in stiff tissues. By introducingminimally-attenuating longitudinal waves at a significantly highfrequency into tissue, shear waves produced at interfaces bymode conversion will be detectable in stiff regions, but will besignificantly attenuated and thus not detectable in the sur-rounding soft tissue. This contrast can be used to detect thepresence of stiff tissue. The proposed technique is shown toreadily depict hard regions (mimicking tumors) present in tis-sue-simulating phantoms and ex vivo breast tissue. In vivofeasibility is demonstrated on a patient with liver metastases inwhom the tumors are readily distinguished. Preliminary evi-dence also suggests that quantitative stiffness measurementsof stiff regions obtained with this technique are more accuratethan those from conventional MRE because of the short shearwavelengths. This rapid, qualitative technique may lend itself toapplications in which the localization of stiff, suspicious neo-plasms is coupled with more sensitive techniques for thoroughcharacterization. Magn Reson Med 62:1457–1465, 2009.© 2009 Wiley-Liss, Inc.
Key words: MR elastography; high-frequency MRE; mode con-version; stiff lesion detection; stiffness
Dynamic magnetic resonance elastography (MRE) (1,2) is aphase-contrast MRI-based technique for quantitativelymapping the shear modulus of tissues. This technique isnow being used clinically for the assessment of liver fibro-sis (3,4) and is being investigated for imaging other organs,such as the breast, brain, and prostate (5–7). In MRE,vibrations are often applied to the tissue of interest usingan external mechanical wave driver, and the resultingmotion is encoded in the phase of the transverse magneti-zation with the help of synchronized motion-sensitizinggradients inserted into conventional MRI pulse sequences.
This process yields images of the propagating shear waves,which are processed with inversion algorithms to createimages depicting mechanical properties of the tissue suchas stiffness and viscosity (8,9).
Typically in these experiments, shear waves with fre-quencies in the range of 50 Hz to 200 Hz are induced in thetissue either directly by using shear drivers (drivers thatoscillate transversely to the tissue surface) or indirectly byusing longitudinal drivers oscillating perpendicular to thetissue surface that produce shear waves within the tissueby mode conversion. Mechanical waves of higher frequen-cies are not generally used in MRE experiments since, asthe frequency of vibration increases, the attenuation of thewaves increases and the depth of penetration of the wavesdecreases. As described in the following section, this re-sults in complete attenuation of shear waves above a cutofffrequency that is dependent upon the tissue properties andthe cutoff frequency typically rises with tissue stiffness.
Since malignant tumors are often much stiffer than sur-rounding normal tissues, we have sought to exploit thehigh-frequency shear-wave cutoff phenomenon as a way topreferentially visualize shear waves in tumors. We hy-pothesized that if longitudinal vibrations that are abovethe shear-wave cutoff frequency of normal soft tissues areapplied, then shear waves might be observed only in stiffertissues, such as tumors. While adequate shear-wave illu-mination is important for quantitative assessment of thetissue properties for an entire organ, this technique mightbe useful for the qualitative detection of tumors and otherstiff lesions. The purpose of this work was to test thishypothesis in tissue-simulating phantoms and in ex vivoand in vivo tissue experiments, and to investigate theadvantages and challenges of this technique.
THEORY
The basic contrast mechanism of the proposed techniqueis the differential attenuation of shear waves in stiff andsoft materials. If planar shear waves are introduced into asample, the wavelength � of the shear waves dependsupon the shear wave speed vs in the material and thefrequency f of the shear waves according to � � vs/f. Thewave speed and the attenuation � (per unit distance in thedirection of propagation) of the waves are related to thecomplex shear modulus � of the medium (10), and can bewritten as
�s2 �
2��r2 � �i
2�
���r � ��r2 � �i
2�; �2 �
�2���r2 � �i
2 � �r�
2��r2 � �i
2�, [1]
1Department of Radiology, Mayo Clinic, Rochester, Minnesota, USA.2Biomathematics Resource, Mayo Clinic, Rochester, Minnesota, USA.3Naval Research Laboratory, Washington, DC, USA.4Department of Diagnostic Radiology, Yong Loo Lin School of Medicine,National University of Singapore, Singapore.Contract grant sponsor: National Institutes of Health (NIH); Contract grantnumber: EB001981.*Correspondence to: Richard L. Ehman, MD, Department of Radiology,Mayo Clinic, 200 First Street SW, Rochester, MN 55905. E-mail:[email protected] 2 January 2009; revised 14 March 2009; accepted 29 April 2009.DOI 10.1002/mrm.22091Published online 26 October 2009 in Wiley InterScience (www.interscience.wiley.com).
Magnetic Resonance in Medicine 62:1457–1465 (2009)
© 2009 Wiley-Liss, Inc. 1457
where �r and �i are the real and imaginary parts of theshear modulus, � 2f, and � is the density (assumed tobe 1000 kg/m3). The above equations are model indepen-dent, but to simplify the analysis, a simple Voigt modelwith � � c � i�, where c is the static shear modulus and� is the frequency-independent shear viscosity, was usedin this work. The shear stiffness typically reported in MREis related to �vs
2, which provides a convenient estimate ofthe effective shear modulus at a particular frequency. If thefrequency of the shear waves is increased, the wavelengthdecreases while the wave attenuation increases. For in-stance, the single MRE wave image in Fig. 1a shows auniform gel phantom illuminated with shear waves at150 Hz. Compared to the wave images shown in Fig. 1band c indicating the shear wave propagation in the samephantom at 300 Hz and 450 Hz, respectively, it can be seenthat the wavelength and the depth of the wave penetrationdecrease as the frequency increases. If the shear wavefrequency is further increased, above a certain frequencythe attenuation of the waves would be so high that shearwaves would not be detectable in the phantom. Since theattenuation of the waves for a given distance of propaga-tion is generally less in stiff media than it is in softer media(11), this upper “cutoff” frequency at which the shearwaves disappear depends upon the stiffness of the me-dium and is higher for stiff media.
In the conventional low-frequency range for MRE, bothstiff and soft tissues have significant wave amplitude,whereas if very high frequency waves are used, the atten-uation is too high to image the waves anywhere in thetissue. Therefore, it is desirable to use a frequency justhigh enough to extinguish the waves in the soft tissueswhile still being able to image the waves in the stifferregions. To predict the frequency that needs to be used todistinguish stiff regions from soft background tissue, atheoretical model was used in which a planar shear waveattenuates exponentially as it propagates in a medium (i.e.,the wave attenuates according to e–�r, where � is the atten-uation factor and r is the distance in the direction ofpropagation). Since the wave is assumed to decay expo-nentially, mathematically the amplitude will reach zeroonly at infinity. For practical purposes, it is assumed thatif the wave amplitude reaches 1% of its original amplitude(i.e., the wave undergoes 99% decay) in a distance of
5 mm, then the wave is effectively attenuated and thefrequency at which this occurs is referred to as the “criticalfrequency” fc for that particular material (�(fc) � –ln(1/100)/(0.005 m) 921 m–1). By introducing longitudinalvibrations into tissue at a frequency above the criticalfrequency for the softer surrounding tissue, shear wavesproduced in the soft tissue due to mode conversion at theboundaries and internal surfaces will not be readily de-tectable, whereas the shear waves produced in stiff regionsin the tissue will be visible and will indicate the presenceof the stiff regions.
MATERIALS AND METHODS
A series of phantom studies were designed to test thehypothesis that it is possible to detect stiff regions inside asofter medium with the help of high-frequency mode-converted shear waves and to test the validity of the the-oretical model. A 1.5T whole-body scanner (GE Health-care, Milwaukee, WI, USA) was used for all the experi-ments. To induce the mechanical vibrations in the gelatinphantoms, an electromechanical driver capable of longitu-dinal vibrations was used (Fig. 2a). When an alternatingelectric current is sent through the voice coil of the driver,a local magnetic moment created perpendicular to themain magnetic field tries to align with the main field B0,moving the flexible platform vertically. When the currentreverses, the platform deflects in the other direction. Thismotion of the platform is coupled to the sample with thehelp of the drive shaft and the contact plate attached to it.Figure 2a also shows a schematic of a typical two-partphantom made up of 10% bovine gel (Sigma Life Sciences,St. Louis, MO, USA) to simulate normal soft tissue and a4% agar gel (DIFCO, MI, USA) inclusion, located awayfrom the contact plate, simulating a stiff lesion. A spin-echo MRE pulse sequence was used to acquire wave datawithin a coronal imaging plane using motion-encodinggradient pairs with an amplitude of 4 mT/m to sensitize tothe wave motion in the direction perpendicular to theimaging plane. Various mechanical excitation frequenciesfrom 60 Hz to 1500 Hz were used to study the wavepropagation in both media, and the number of motion-encoding gradient pairs was adjusted to have approxi-mately one gradient pair per 100 Hz frequency in each case
FIG. 1. Wave images of a homogeneous 16% bovine gel phantom with shear waves at (a) 150 Hz, (b) 300 Hz, and (c) 450 Hz. The boundaryof the phantom is shown with the dotted line. The wavelength and penetration depth of the shear waves decrease while the attenuationincreases with increasing frequency.
1458 Mariappan et al.

(motion-encoding time � 10–17 ms). Other typical MREimaging parameters for the phantom experiments were asfollows: field of view (FOV) � 24 cm, acquisition matrixsize � 256 � 128, TR � 300 ms, TE � 46 ms, receiverbandwidth � 16 kHz, number of excitations (NEX) � 1,slice thickness � 10 mm, time offsets � 4, and total scantime � 5 min. Since the wave fields created are a combi-nation of the induced longitudinal waves and the mode-converted shear waves of interest, Gaussian bandpass fil-ters with bounds of 5 and 100 cycles per FOV were used toremove the low-spatial-frequency longitudinal waves andthe high-frequency noise.
To demonstrate that the shear waves created in the stiffinclusion by mode conversion at the boundaries betweenthe stiff and soft media are similar to shear waves directlyinduced within the stiff inclusion, the drive shaft andcontact plate were replaced by a silver needle attached tothe flexible platform (similar to Ref. 12) and inserted intothe stiff inclusion through the soft surrounding gel. Whenthe alternating current flows through the voice coil, theneedle moves up and down in the inclusion, directly in-ducing shear waves inside it. This minimally invasiveneedle driver technique was the simplest way to directlyinduce shear waves inside the stiff region. Shear waveswith the same range of frequencies as above were inducedin the inclusion, imaged with the aforementioned pulsesequence, and compared to the shear waves created by themode conversion of longitudinal waves using the originalexperimental setup.
Images of stiffness estimates (elastograms) were calcu-lated using the local frequency estimation (LFE) algorithm(8) with the application of spatiotemporal directional fil-tering (13) for both the standard low-frequency MRE andthe high-frequency MRE data. To test the validity of thetheoretical model, data were collected in the inclusionphantom using the longitudinal driver at several frequen-cies from 100 to 1000 Hz. From the wave data obtained,wave amplitude maps were derived and wave attenuationfactors were calculated in regions where planar shearwaves could be approximated and these attenuation val-ues were compared to the theoretically predicted values.
To assess the feasibility of this technique in real tissues,experiments were performed on an ex vivo, formalin-fixedbreast specimen. To simulate a stiff lesion in this speci-men, a small volume within the specimen was ablatedwith focused ultrasound (FUS). The experimental setupand imaging parameters were similar to the phantom ex-
periments. The contact plate was placed directly on top ofthe specimen and used to induce longitudinal waves at 50to 1500 Hz within the tissue.
To demonstrate the feasibility of this technique for in vivoimaging, the technique was tested on a healthy volunteer anda patient with a malignant liver tumor in accordance with theMayo Clinic Institutional Review Board. The patient hadmetastatic tumors in an otherwise normal liver (i.e., not cir-rhotic and with no detectable fibrosis) and underwent clini-cal MRE performed at 60 Hz to assess liver and tumor tissuestiffness. Due to the limitations of the mechanical driver usedfor clinical MRE in the high-frequency range, a frequency of200 Hz was used for the high-frequency experiments. Theclinically-used mechanical wave driver, shown schemati-cally in Fig. 2b, is a pressure-activated driver in which me-chanical waves of the required frequency created by an activeaudio speaker are coupled to the abdomen through a passivedriver placed on the chest wall. This produces longitudinalmotion that is converted into shear waves by mode conver-sion from various tissue interfaces within the abdomen (14).To compare the results obtained from the patient experi-ment to a control case, a healthy volunteer also underwentMRE at 60 and 200 Hz. A gradient-echo MRE pulse se-quence and an eight-channel torso array coil were used forwave data acquisition. Other MRE imaging parameters in-cluded an axial slice orientation, FOV � 36 cm, acquisi-tion matrix size � 256 � 64, TR � 50 ms, TEs � 24.2 and27.5 ms for the 60-Hz and 200-Hz acquisitions, respec-tively, flip angle � 30°, receiver bandwidth � 16 kHz,NEX � 1, slice thickness � 5 mm, time offsets � 4, andtotal scan time � 19.6 s.
RESULTS
From the data obtained at multiple frequencies, the Voigtmodel parameters were calculated by a least squares fit ofwave speed (vs) as a function of the operating frequencies(15) and these were found to be (c,�) � (3.0 kPa, 1.36 Pa-s)for the B-gel and (120 kPa, 10.2 Pa-s) for the agar. Figure 3ashows plots of the attenuation factor for B-gel and agar asa function of excitation frequency. The stiffer gel can beseen to have less attenuation than the softer gel. Figure 3bshows plots of the decay distance for each gel at the samefrequencies. Because of its increased attenuation, thewaves in the softer gel decay more rapidly than in thestiffer gel. From Fig. 3, the B-gel can be seen to have acritical frequency of about 723 Hz.
FIG. 2. a: Schematic of the elec-tromechanical driver and inclu-sion phantom used for the phan-tom experiments. b: Schematic ofthe pressure-activated driver sys-tem used for the in vivo humanstudies. [Color figure can beviewed in the online issue, whichis available at www.interscience.wiley.com.]
High-Frequency Mode Conversion MRE 1459
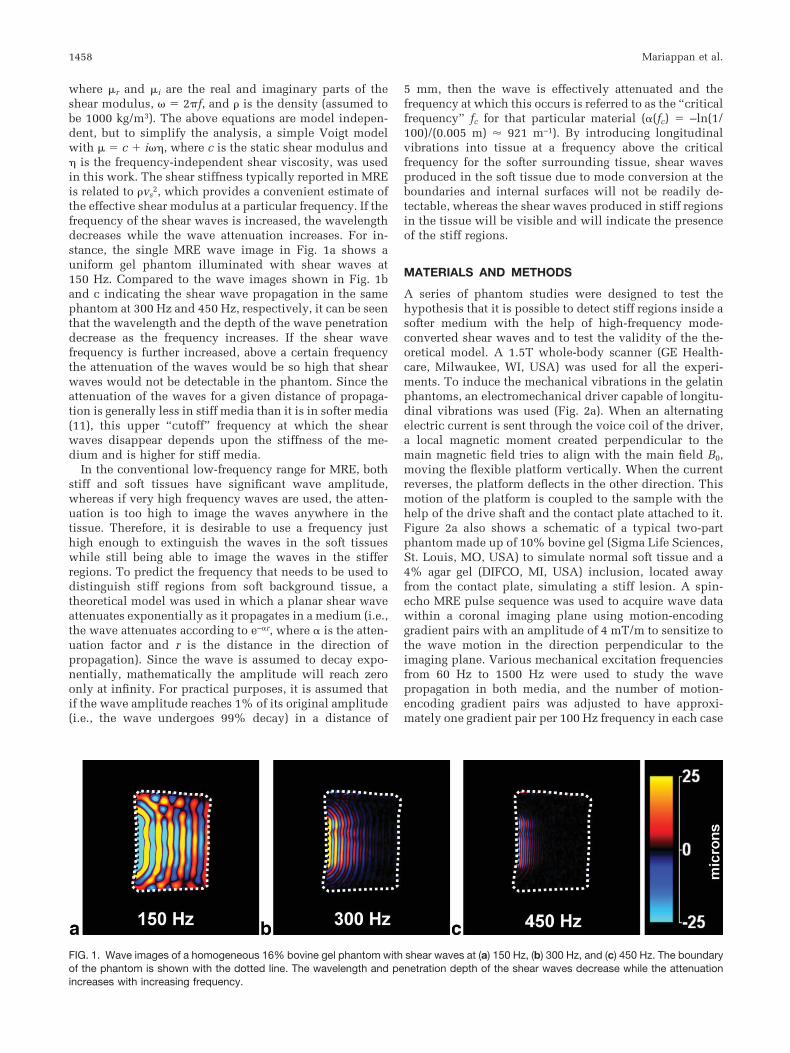
A magnitude image of the cross section of the inclusionphantom through the inclusion is shown in Fig. 4a, wherethe presence of the inclusion can be identified as thehypointense region near the middle of the phantom. Themechanical vibrations were applied in a direction perpen-dicular to the plane of this image and Fig. 4b shows asingle bandpass-filtered wave image of the phantom with60-Hz longitudinal waves produced in it. The waves visi-ble in Fig. 4b are the mode-converted shear waves pro-duced at the phantom and inclusion boundaries. The stiffregion cannot be distinguished from the soft backgroundregion simply by observation of these wave images (with-out the application of inversion algorithms). Figure 4cshows a single-wave image of the same phantom with750-Hz mechanical waves. From these data, the presenceof the stiff region can be easily identified since only thestiff region shows the presence of the shear waves createdat the interface between the background and the inclusionregion. Some residual low-spatial-frequency waves andedge artifacts due to the bandpass filtering are also visiblein the background gel in this image.
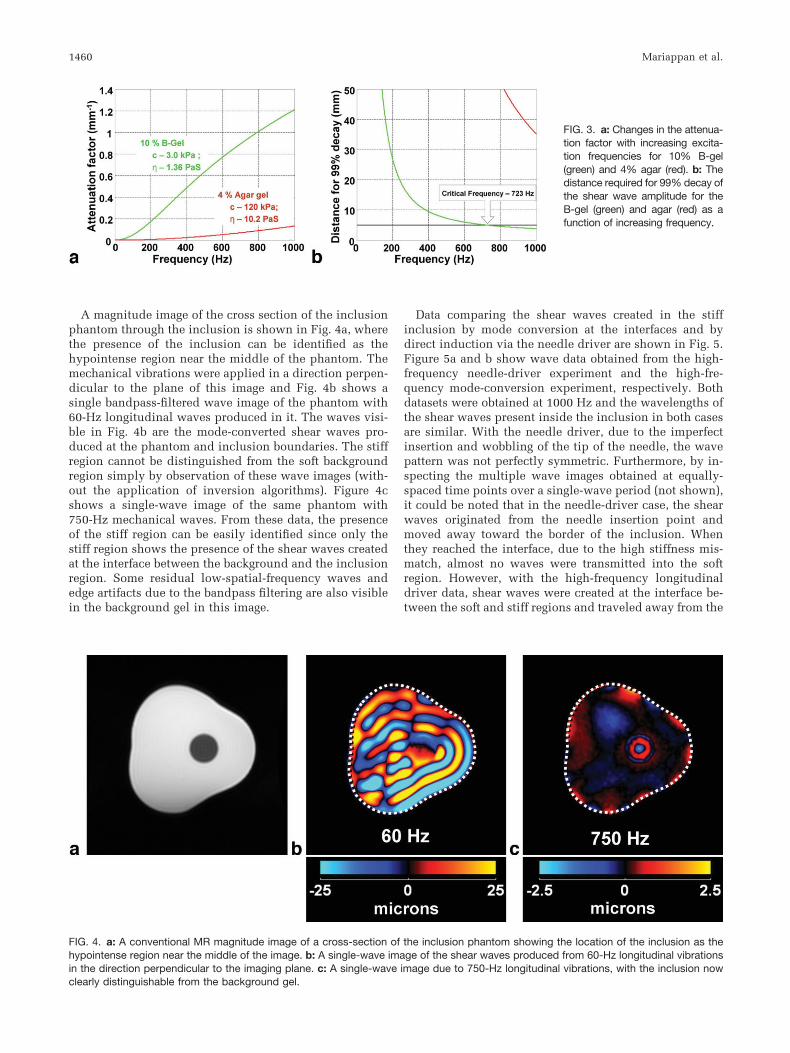
Data comparing the shear waves created in the stiffinclusion by mode conversion at the interfaces and bydirect induction via the needle driver are shown in Fig. 5.Figure 5a and b show wave data obtained from the high-frequency needle-driver experiment and the high-fre-quency mode-conversion experiment, respectively. Bothdatasets were obtained at 1000 Hz and the wavelengths ofthe shear waves present inside the inclusion in both casesare similar. With the needle driver, due to the imperfectinsertion and wobbling of the tip of the needle, the wavepattern was not perfectly symmetric. Furthermore, by in-specting the multiple wave images obtained at equally-spaced time points over a single-wave period (not shown),it could be noted that in the needle-driver case, the shearwaves originated from the needle insertion point andmoved away toward the border of the inclusion. Whenthey reached the interface, due to the high stiffness mis-match, almost no waves were transmitted into the softregion. However, with the high-frequency longitudinaldriver data, shear waves were created at the interface be-tween the soft and stiff regions and traveled away from the
FIG. 3. a: Changes in the attenua-tion factor with increasing excita-tion frequencies for 10% B-gel(green) and 4% agar (red). b: Thedistance required for 99% decay ofthe shear wave amplitude for theB-gel (green) and agar (red) as afunction of increasing frequency.
FIG. 4. a: A conventional MR magnitude image of a cross-section of the inclusion phantom showing the location of the inclusion as thehypointense region near the middle of the image. b: A single-wave image of the shear waves produced from 60-Hz longitudinal vibrationsin the direction perpendicular to the imaging plane. c: A single-wave image due to 750-Hz longitudinal vibrations, with the inclusion nowclearly distinguishable from the background gel.
1460 Mariappan et al.
interface in both directions (i.e., both toward the center ofthe inclusion and toward the boundary of the phantom).This bidirectional propagation pattern is evident in thezoomed single-wave image shown in Fig. 5c. The shearwaves that travel toward the center of the inclusion in-crease in wave amplitude due to constructive interferencewhile the waves that are moving away from the interfacewithin the soft region have very short wavelengths andtheir amplitudes reduce quickly, in accordance with thetheoretical prediction that shear waves of frequencieshigher than the critical frequency (723 Hz) would extin-guish very quickly inside the soft region.
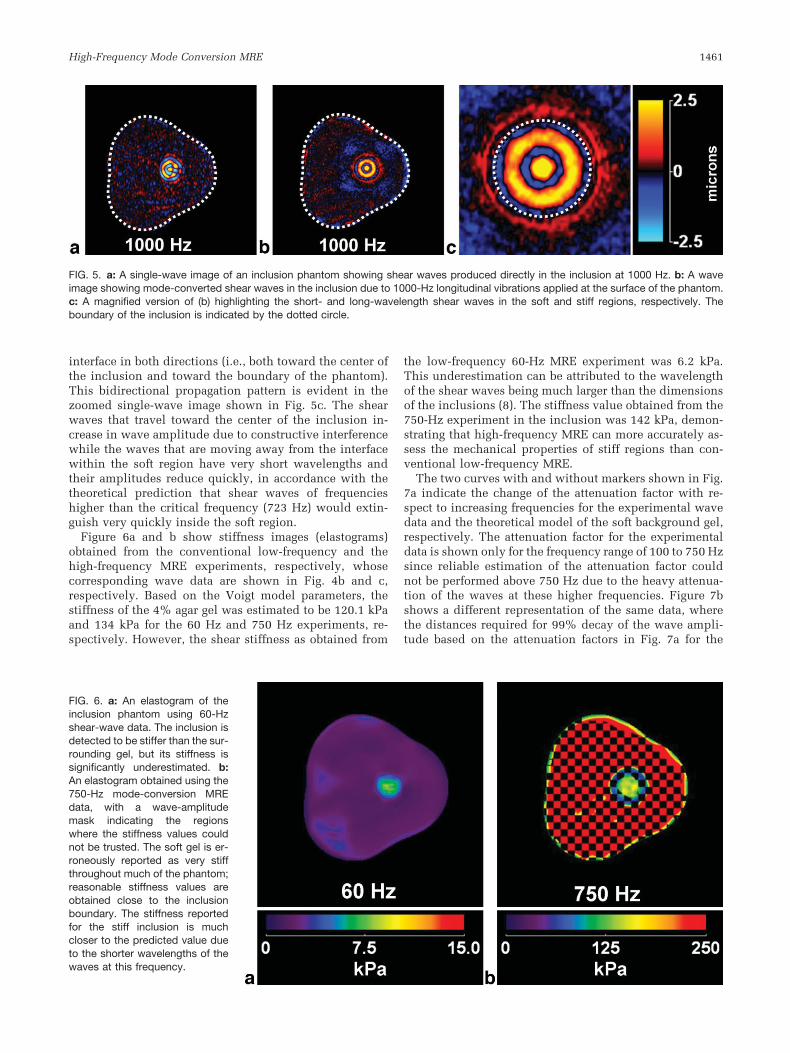
Figure 6a and b show stiffness images (elastograms)obtained from the conventional low-frequency and thehigh-frequency MRE experiments, respectively, whosecorresponding wave data are shown in Fig. 4b and c,respectively. Based on the Voigt model parameters, thestiffness of the 4% agar gel was estimated to be 120.1 kPaand 134 kPa for the 60 Hz and 750 Hz experiments, re-spectively. However, the shear stiffness as obtained from
the low-frequency 60-Hz MRE experiment was 6.2 kPa.This underestimation can be attributed to the wavelengthof the shear waves being much larger than the dimensionsof the inclusions (8). The stiffness value obtained from the750-Hz experiment in the inclusion was 142 kPa, demon-strating that high-frequency MRE can more accurately as-sess the mechanical properties of stiff regions than con-ventional low-frequency MRE.
The two curves with and without markers shown in Fig.7a indicate the change of the attenuation factor with re-spect to increasing frequencies for the experimental wavedata and the theoretical model of the soft background gel,respectively. The attenuation factor for the experimentaldata is shown only for the frequency range of 100 to 750 Hzsince reliable estimation of the attenuation factor couldnot be performed above 750 Hz due to the heavy attenua-tion of the waves at these higher frequencies. Figure 7bshows a different representation of the same data, wherethe distances required for 99% decay of the wave ampli-tude based on the attenuation factors in Fig. 7a for the
FIG. 5. a: A single-wave image of an inclusion phantom showing shear waves produced directly in the inclusion at 1000 Hz. b: A waveimage showing mode-converted shear waves in the inclusion due to 1000-Hz longitudinal vibrations applied at the surface of the phantom.c: A magnified version of (b) highlighting the short- and long-wavelength shear waves in the soft and stiff regions, respectively. Theboundary of the inclusion is indicated by the dotted circle.
FIG. 6. a: An elastogram of theinclusion phantom using 60-Hzshear-wave data. The inclusion isdetected to be stiffer than the sur-rounding gel, but its stiffness issignificantly underestimated. b:An elastogram obtained using the750-Hz mode-conversion MREdata, with a wave-amplitudemask indicating the regionswhere the stiffness values couldnot be trusted. The soft gel is er-roneously reported as very stiffthroughout much of the phantom;reasonable stiffness values areobtained close to the inclusionboundary. The stiffness reportedfor the stiff inclusion is muchcloser to the predicted value dueto the shorter wavelengths of thewaves at this frequency.
High-Frequency Mode Conversion MRE 1461

theoretical model and the experimental data are shown.The experimental observations follow the theoretical pre-dictions closely.
Data obtained from the ex vivo specimen experiment areshown in Fig. 8. A conventional MR magnitude image isshown in Fig. 8a, where the position of the FUS-ablatedstiff region is indicated with the dotted line at the bound-ary. Voigt-model-fit coefficients for this formalin-fixedbreast specimen were found to be c, � � 16.3 kPa, 9.36Pa-s. The vibrational energy was applied in the directionperpendicular to the imaging plane. A single-wave imageof the phantom at a conventional low frequency of 200 Hzis shown in Fig. 8b. The stiff region could not be detectedsimply by inspection of the wave images. For the Voigt-model values, the critical frequency was predicted to be2815 Hz, but due to the limitation of the driver at thisfrequency, a frequency of 1000 Hz was used for the high-frequency experiments. The stiff FUS-ablated region canbe easily differentiated from the soft breast tissue, as isevident from the wave image shown in Fig. 8c, due to the
presence of shear waves exclusively in the lesion. Since afrequency lower than the critical frequency was used, low-wavelength shear waves are also visible in the softer outerregion more than 5 mm away from the boundary.
Data from the preliminary in vivo study performed on apatient with stiff metastatic tumors (16) in an otherwisenormal liver is shown in Fig. 9 compared to data obtainedfrom a volunteer with a normal healthy liver. Figure 9aand d show the axial magnitude images of both the volun-teer and the patient, respectively. In this particular case,the tumor within the liver of the patient could be distin-guished in the magnitude image itself. Figure 9b and eshow wave images at the conventional liver MRE fre-quency (60 Hz) in the healthy liver and the diseased liver,respectively. Variations in the wavelength and wave prop-agation in the diseased liver are observable in this caseindicating substantial heterogeneity of the liver. Voigt-model-fit coefficients for normal hepatic tissue have beendetermined to be c, � � 2 kPa, 1.9 Pa-s (17), which corre-spond to a critical frequency of 690 Hz. However, as men-
FIG. 7. a: A graphical comparisonof the theoretical (without marker)and the observed (with marker) at-tenuation factors for the B-gel inthe inclusion phantom at variousfrequencies. b: A comparison ofthe distance required for 99% de-cay of the wave amplitude for thetheoretical model and the experi-mental observations. The mea-sured data agree well with the the-oretical model.
FIG. 8. a: A conventional MR magnitude image of a breast specimen where a stiffer, FUS-ablated region is shown by the dotted line. b:A single-wave image showing mode-converted shear waves produced by 200-Hz longitudinal vibrations. The stiff region can not be seenby inspecting the wave data. c: A wave image of mode-converted 1000-Hz shear waves showing the stiff region as clearly distinctive fromthe background tissue.
1462 Mariappan et al.

tioned before, these high-frequency experiments were per-formed at 200 Hz due to driver limitations. The wave datausing this relatively high frequency of 200 Hz indicate thatin the normal liver (Fig. 9c) there are almost no shearwaves present due to the highly attenuating nature ofhealthy liver tissue. However, in the patient data (Fig. 9f),shear waves are present in the tumor region while theyhave attenuated heavily (though not completely) in otherregions, indicating that the tumor is stiff in comparison toother parts of the liver. The region of the tumor is betterhighlighted in the 200-Hz wave images than it is in the60-Hz wave images.
DISCUSSION
The results demonstrate that it is possible to implementa simple technique that can depict stiff regions presentinside a softer medium based on the difference in shearwave attenuation characteristics of the two materials.This could potentially be a simple and fast technique forstiff lesion detection and hence might be used as alocalizer to quickly locate suspicious regions that could
be further interrogated as needed to characterize thetissue. Since the shear waves that are imaged with thistechnique are created by the mode conversion of longi-tudinal waves, which can propagate further and moreeasily in tissue than shear waves, organs that are locatedfarther from the surface of the body and are otherwisenot accessible with directly-induced shear waves couldbe analyzed with this technique. Furthermore, due tothe smaller wavelengths of the shear waves used in thistechnique, the accuracy of the shear stiffness estimatesof small stiff lesions obtained from these data could bebetter than those from conventional low-frequencyMRE. Though the accuracy of the Voigt model for thebehavior of biological tissues is still in contention (18 –20) and the attenuation model used to define the criticalfrequency is just one of many possible choices, theessential principle of differential wave attenuation isvalid irrespective of the rheological and wave propaga-tion models that are chosen, which would only alter thespecific value of the critical frequency. The phantomresults shown in Fig. 7, which demonstrate good agree-ment between the theoretical wave attenuation model
FIG. 9. Results from an in vivo hepatic study of a normal volunteer and a patient with metastatic liver tumors. Conventional MR magnitudeimages of the volunteer (a) and the patient (d) show the presence of numerous tumors in the patient. Wave data in the volunteer at 60 Hz(b) and 200 Hz (c) show that the shear waves at 200 Hz are completely attenuated in normal healthy soft liver tissue. The wave data in thepatient at 60 Hz (e) and 200 Hz (f) show that the waves in the stiff tumors are still clearly observable while the shear waves in the rest ofthe liver have been significantly attenuated.
High-Frequency Mode Conversion MRE 1463

and the measured attenuation, support the material andwave propagation models assumed in this work andjustified their use for the tissue studies.
As a qualitative imaging technique, it would only benecessary to obtain a wave image at a single time pointwith this technique to provide enough evidence for thepresence of a stiff region in tissue, unlike conventionalMRE in which multiple wave images are usually neces-sary. This would substantially reduce the acquisition timefor this method compared to conventional low-frequencyMRE. Depending on the operating frequency for thismethod for a particular application, the amplitude of thedriver system at that frequency, and the hardware capabil-ities of the MR scanner, the use of high-frequency (i.e.,short-duration) motion-encoding gradients in this methodcould result in reduced echo times compared to low-fre-quency MRE. This could potentially improve the imageSNR and make the technique well suited for low-T2 tis-sues.
There are also some potential disadvantages associ-ated with this high-frequency technique. For example,even though the accuracy of the stiffness measurementsof stiff regions can improve using this technique, sincethere are no shear waves present in the soft regions, thequantitative stiffness information of the surroundingmedium is lost, as is evident from Fig. 6b. Furthermore,the shear wave amplitude in the stiff regions can be lowbecause the waves are at higher frequencies that are lessefficiently produced and transmitted through soft tissueand are created by mode conversion that only converts afraction of the incident longitudinal wave energy intoshear waves. The mode conversion efficiency is depen-dent upon different parameters such as the angle ofincidence and proximity to the source. However, thespecifics were not addressed in this study and are thesubjects of further research. However, these limitationscould be partially rectified, for example, by increasingthe amplitude of the applied longitudinal waves (withinsafety limits, (21)), or by applying an array of drivers tocreate a higher amplitude wave field due to constructiveinterference (22). Even after increasing the amplitude atthese higher frequencies, patient comfort during thisexam could be as good or better than for conventionallow-frequency MRE.
Further work is needed to explore clinical applicationsof this technique. We expect the technique to potentiallybe complementary to contrast-enhanced MRI (23) in breastimaging. It may eventually be possible to develop thistechnique to serve clinical needs ranging from the detec-tion of lung tumors to locating blood vessel calcifications.However, for the clinical application of this technique,mechanical drivers that can produce high-amplitude lon-gitudinal waves at these high frequencies must be devel-oped. Investigations are currently underway to achievethis goal.
CONCLUSIONS
From the results shown in this study, it is concluded thatstiff regions in softer background media can be detected byexciting the media with high-frequency longitudinalwaves and imaging the mode-converted shear waves that
are exclusively present in the stiff regions. Since the shearwaves are created due to mode conversion of longitudinalwaves, it could be possible to study stiff tissues and re-gions of tissues deep within the body than are difficult toanalyze with conventional low-frequency MRE. The shearwaves in the targeted stiff regions at high frequencies havemuch shorter wavelengths than at conventional frequen-cies, from which more accurate stiffness measurementscan be obtained.
ACKNOWLEDGMENT
We thank Ingrid Menegezzo for help in performing some ofthe phantom studies.
REFERENCES
1. Muthupillai R, Lomas DJ, Rossman PJ, Greenleaf JF, Manduca A, Eh-man RL. Magnetic resonance elastography by direct visualization ofpropagating acoustic strain waves. Science 1995;269:1854–1857.
2. Muthupillai R, Rossman PJ, Lomas DJ, Greenleaf JF, Riederer SJ, EhmanRL. Magnetic resonance imaging of transverse acoustic strain waves.Magn Reson Med 1996;36:266–274.
3. Venkatesh S, Yin M, Talwalkar J, Ehman R. Application of liver MRelastography in clinical practice. In: Proceedings of the16th AnnualMeeting of ISMRM, Toronto, Ontario, Canada, 2008 (Abstract 2611).
4. Yin M, Talwalkar JA, Glaser KJ, Manduca A, Grimm RC, Rossman PJ,Fidler JL, Ehman RL. Assessment of hepatic fibrosis with magneticresonance elastography. Clin Gastroenterol Hepatol 2007;5:1207–1213.e2.
5. Sinkus R, Tanter M, Xydeas T, Catheline S, Bercoff J, Fink M. Viscoelas-tic shear properties of in vivo breast lesions measured by MR elastog-raphy. Magn Reson Imaging 2005;23:159–165.
6. Sack I, Beierbach B, Hamhaber U, Klatt D, Braun J. Non-invasive mea-surement of brain viscoelasticity using magnetic resonance elastogra-phy. NMR Biomed 2008;21:265–271.
7. Kemper J, Sinkus R, Lorenzen J, Nolte-Ernsting C, Stork A, Adam G. MRelastography of the prostate: initial in vivo application. RoFo 2004;176:1094–1099.
8. Manduca A, Oliphant TE, Dresner MA, Mahowald JL, Kruse SA, Am-romin E, Felmlee JP, Greenleaf JF, Ehman RL. Magnetic resonanceelastography: non-invasive mapping of tissue elasticity. Med ImageAnal 2001;5:237–254.
9. Van Houten EE, Miga MI, Weaver JB, Kennedy FE, Paulsen KD. Three-dimensional subzone-based reconstruction algorithm for MR elastogra-phy. Magn Reson Med 2001;45:827–837.
10. Auld BA. Acoustic fields and waves in solids. Malabar, FL: R.E.Krieger; 1990.
11. Yin M, Venkatesh S, Mariappan Y, Glaser K, Grimm R, Manduca A,Romano A, Ehman R. Value of shear wave attenuation as a tissuecharacterization parameter in MR elastography of the liver. In: Proceed-ings of the 16th Annual Meeting of ISMRM, Toronto, Ontario, Canada,2008 (Abstract 84).
12. Chan QC, Li G, Ehman RL, Grimm RC, Li R, Yang ES. Needle shearwave driver for magnetic resonance elastography. Magn Reson Med2006;55:1175–1179.
13. Manduca A, Lake DS, Kruse SA, Ehman RL. Spatio-temporal direc-tional filtering for improved inversion of MR elastography images. MedImage Anal 2003;7:465–473.
14. Yin M, Rouviere O, Ehman RL. Diffraction-biased shear wave fieldsgenerated with longitudinal magnetic resonance elastography drivers.Magn Reson Imaging 2005;26:770–780.
15. Kruse SA, Smith JA, Lawrence AJ, Dresner MA, Manduca A, Green-leaf JF, Ehman RL. Tissue characterization using magnetic resonanceelastography: preliminary results. Phys Med Biol 2000;45:1579 –1590.
16. Venkatesh SK, Yin M, Glockner JF, Takahashi N, Araoz PA, TalwalkarJA, Ehman RL. MR elastography of liver tumors: preliminary results.AJR Am J Roentgenol 2008;190:1534–1540.
1464 Mariappan et al.

17. Huwart L, Sempoux C, Salameh N, Jamart J, Annet L, Sinkus R,Peeters F, ter Beek LC, Horsmans Y, Van Beers BE. Liver fibrosis:noninvasive assessment with MR elastography versus aspartate ami-notransferase to-platelet ratio index radiology 2007;245:458 – 466.
18. Catheline S, Gennisson JL, Delon G, Fink M, Sinkus R, Abouelkaram S,Culioli J. Measuring of viscoelastic properties of homogeneous softsolid using transient elastography: an inverse problem approach. JAcoust Soc Am 2004;116:3734–3741.
19. Asbach P, Klatt D, Hamhaber U, Braun J, Somasundaram R, Hamm B,Sack I. Assessment of liver viscoelasticity using multifrequency MRelastography. Magn Reson Med 2008;60:373–379.
20. Sinkus R, Siegmann K, Xydeas T, Tanter M, Claussen C, Fink M. MR
elastography of breast lesions: understanding the solid/liquid dualitycan improve the specificity of contrast-enhanced MR mammography.Magn Reson Med 2007;58:1135–1144.
21. Ehman EC, Rossman PJ, Kruse SA, Sahakian AV, Glaser KJ. Vibrationsafety limits for magnetic resonance elastography. Phys Med Biol 2008;53:925–935.
22. Mariappan YK, Rossman PJ, Glaser KJ, Manduca A, Ehman RL. Mag-netic resonance elastography with a phased-array acoustic driver sys-tem. Magn Reson Med 2009;61:678–685.
23. Heywang-Kobrunner SH, Viehweg P, Heinig A, Kuchler C. Contrast-enhanced MRI of the breast: accuracy, value, controversies, solutions.Eur J Radiol 1997;24:94–108.
High-Frequency Mode Conversion MRE 1465
Copyright © 2022 FDOKUMEN