ORIGINAL PAPER QTL Mapping of Yield and Yield Components under Normal
Upload
independentCategory
view
4download
0
ORIGINAL PAPER
hi2-1, A QTL which improves harvest index, earlinessand alters metabolite accumulation of processing tomatoes
Amit Gur • Sonia Osorio • Eyal Fridman •
Alisdair R. Fernie • Dani Zamir
Received: 19 March 2010 / Accepted: 17 July 2010 / Published online: 3 August 2010
� The Author(s) 2010. This article is published with open access at Springerlink.com
Abstract Harvest index, defined as the ratio of repro-
ductive yield to total plant biomass, and early ripening are
traits with important agronomic value in processing
tomatoes. The Solanum pennellii introgression-line (IL)
population shows variation for harvest index and earliness.
Most of the QTL mapped for these traits display negative
agronomic effects; however, hi2-1 is a unique QTL dis-
playing improved harvest index and earliness. This intro-
gression was tested over several years and under different
genetic backgrounds. Thirty-one nearly isogenic sub-lines
segregating for the 18 cM TG33–TG276 interval were used
for fine mapping of this multi-phenotypic QTL. Based on
this analysis the phenotypic effects for plant weight, Brix,
total yield and earliness were co-mapped to the same
region. In a different mapping experiment these sub-lines
were tested as heterozygotes in order to map the harvest
index QTL which were only expressed in the heterozygous
state. These QTL mapped to the same candidate region,
suggesting that hi2-1 is either a single gene with pleiotropic
effects or represents linked genes independently affecting
these traits. Metabolite profiling of the fruit pericarp
revealed that a number of metabolic QTL co-segregate
with the harvest index trait including those for important
transport assimilates such as sugars and amino acids.
Analysis of the flowering pattern of these lines revealed
induced flowering at IL2-1 plants, suggest that hi2-1 may
also affect harvest index and early ripening by changing
plant architecture and flowering rate.
Introduction
Harvest index, defined as the ratio of reproductive yield to
total plant biomass, has been taken as a measure of effi-
ciency in partitioning assimilated photosynthates to har-
vestable product. This parameter was first considered in
1914 by Beaven, who described it as the ratio of grain yield
to total plant weight and termed it the ‘‘migration coeffi-
cient’’ [reviewed in (Sinclair 1998)]. Later on the term
‘‘harvest index’’ was suggested and recommended as an
important reference to assess progress in germplasm
development towards improved yield potential. Harvest
index has been commonly used as a parameter for plant
breeding, particularly in cereals. Domestication of grain
crops during the twentieth century caused continuous
improvement in harvest index along with increasing crop
yields (Hay 1995). However, it is not that harvest index of
ancestral grain crops was generally low. Indeed, there is
considerable evidence that some ancestral species of wheat
and rice had very high harvest indices (Sinclair 1998;
Doebley et al. 2006). The most dramatic improvement of
harvest index in wheat and rice was due to the exploitation
of a single gene mutation that causes dwarfism and the use
of this gene in the breeding of high-yielding short varieties
(Khush 2001; Thornsberry et al. 2001; Salamini 2003).
Communicated by M. Havey.
Electronic supplementary material The online version of thisarticle (doi:10.1007/s00122-010-1412-8) contains supplementarymaterial, which is available to authorized users.
A. Gur � E. Fridman � D. Zamir
The Institute of Plant Sciences and Genetics in Agriculture,
Faculty of Agriculture, The Hebrew University of Jerusalem,
P.O. Box 12, Rehovot 76100, Israel
S. Osorio � A. R. Fernie (&)
Max-Planck-Institute of Molecular Plant Physiology,
Am Muhlenberg 1, 14476 Potsdam-Golm, Germany
e-mail: [email protected]
123
Theor Appl Genet (2010) 121:1587–1599
DOI 10.1007/s00122-010-1412-8

Earliness can be defined in many ways. Basically, it rep-
resents the time it takes the plant from sowing to harvestable
product. The variation in earliness can be due to an earlier
switch from vegetative to reproductive growth or due to
faster ripening of the fruit (Doganlar et al. 2000; Tanksley
2004). The first stage is highly related to the harvest index
because it involves changes in the growth habit of the plant.
Breeding for increased harvest index and earliness in crop
plants is of major importance for several reasons:
(i) The harvest index represents the efficiency of using
both natural and man-made resources (water, carbon
dioxide, soil and artificial fertilizers) to produce
harvestable product, for that reason it is important
both from economical and ecological aspects.
(ii) High harvest index and early maturation represent
two mechanisms for plants to deal with abiotic
stresses. Improved harvest index represent enhanced
partitioning of the limited assimilated photosynthates,
under the stress conditions, into harvestable product.
From the plants perspective, early maturation is, on
the other hand, an escape mechanism to ensure its
propagation under conditions of stress.
(iii) The development of mechanical harvesting tech-
niques for most crops species provides an additional
preference for plants displaying a relatively small
canopy.
Intensive research concerning the developmental genes
for the transition from vegetative to reproductive has been
performed on the model plant Arabidopsis thaliana
(Alonso-Blanco et al. 1998; Koornneef et al. 1998; Samach
et al. 2000; El-Din El-Assal et al. 2001, 2003; Cremer and
Coupland 2003; Pineiro et al. 2003; Valverde et al. 2004;
Alonso-Blanco et al. 2009) and in other plant species
(Murai et al. 2003; Izawa 2007; Jimenez-Gomez et al.
2007). In addition, other factors such as source–sink rela-
tions and photosynthetic efficiency have been considered to
influence in this trait (Bugbee and Salisbury 1988; Nunes-
Nesi et al. 2005; Hackel et al. 2006). An example of the
implementation of such an approach is a work done in
tobacco over-expressing a phytochrome gene was produced
(Robson et al. 1996). The transgenic plants showed reduced
shade avoidance causing proximity-conditional dwarfing
and increased harvest index. Another example is the over-
expression of the arabidopsis LFY gene in aspen (Weigel
and Nilsson 1995) that caused floral development induc-
tion. In rice (Oryza sativa), which is a model crop plant,
earliness is defined as ‘‘heading date’’. Genetic research is
being made, mainly using natural variation, to identify and
characterize QTL involved in ‘heading date’ (Yamamoto
et al. 2000; Monna et al. 2002; Yu et al. 2002). Some of
these QTL were already cloned (Yano et al. 2000, 2001;
Doi et al. 2004; Xue et al. 2008) and these improving
alleles can be introduced in breeding programs for creation
of early maturing rice varieties. In tomato a single gene
mutation is responsible for converting indeterminate plant
into determinate, which is a very dramatic change in the
plant growth habit (Pnueli et al. 1998; Carmel-Goren et al.
2003). This recessive mutation (sp/sp) at the SP locus is the
basis for all mechanically harvested processing varieties.
However, variation in plant growth habit is still present
among determinate processing tomato varieties. Recent
studies have identified that S and AN, which encode a
homeobox transcription factor and an F-box protein,
respectively as well as single flower truss as important
genes in the determination of inflorescence development
and thus of heterosis (Lipmann et al. 2009; Krieger et al.
2010). Likewise the majority of the variation in fruit size
has recently been associated to fw2-2 (Frary et al. 2000),
and to a lesser extent to a YABBY like transcription factor
(Cong et al. 2008). Despite these important gains in
knowledge the objective of processing tomato breeders
remains to obtain compact ‘‘bushy’’ plants that have con-
centrated uniform ripening, so that yield can be harvested
at one time point, and the mechanical harvest can be as
efficient as possible (Atherton and Rudich 1986).
The objective of our current work was to use natural
variation in wild tomato, for the discovery of alleles that can
improve harvest index and earliness of processing tomatoes.
The introgression-line (IL) population of S. pennellii in a
processing-tomato variety (M82) is an efficient tool for
identification and mapping of QTL (Eshed and Zamir 1994).
Yield associated QTL were previously identified and map-
ped (Eshed and Zamir 1995) but not much attention was paid
to QTL affecting growth habit and the relationship between
reproductive and vegetative growth. In this work we used the
ILs population to look for QTL that modify the reproductive/
vegetative ratio and transition timing.
Materials and methods
Plant material and field trial
Whole genome phenotypic survey for yield and vegetation-
related traits was performed in different field experiments:
first on summer 1993, using the 50 ILs population (Eshed
and Zamir 1995). This original set of 50 ILs was extended
to create the 75 ILs population (Pan et al. 2000). The
extended population was phenotyped in the field on sum-
mer 2000. Both ILs and ILHs were evaluated on these
trials.
Thirty-one sub-NILs were extracted from the M82 9
IL2-1 F2 population. Distal markers from both extremes of
the introgression were used to detect those recombinant
lines following RFLP analysis (using TG33 and TG276).
1588 Theor Appl Genet (2010) 121:1587–1599
123

Detailed genotyping of those lines was performed to
determine the exact region of recombination, using 24
RFLP markers. Genetic distances in cM were calculated by
the ratio of recombinant progenies between adjacent
markers out of the 1,600 parental gametes that were
screened, and a genetic map of this region was created.
Ninety percent reduction in recombination was observed
compared to map distances as calculated from the
S. lycopersicon 9 S. pennellii F2 population (Tanksley
et al. 1992). This trend is in agreement with results of other
comparisons of recombination frequencies between early
crosses and late backcrossing in segregating populations
(Rick 1969, 1972; Ji and Chetelat 2003). The effect of
IL2-1p on the yield related traits were also tested in the
background of the line 9,225 which is an F7 selection from
an F2 population between two processing tomato inbreds.
The fragment IL2-1p was introgressed using molecular
markers until the F6 generation.
Three mapping trials were conducted: (1) progeny tests
for the F3 families in summer 1999, (2) in summer 2000
using fixed homozygous sub-NILs and (3) in summer 2002
using sub-NILs 9 M82 F1 plants. Tests for the introgression
effect under different genetic backgrounds were performed
in summer 1999 and 2000. All open-field experiments were
performed at the Western Galilee Experimental Station in
Akko, Israel. Seedlings (35 days old) were transplanted in
the field with 50 cm between plants and 2 m between rows
(1 plant/m2). All the plants were sprinkler-irrigated imme-
diately after transplanting with 30 m3 of water for every
1,000 m2 of field area. For the rest of the growing period, the
wet treatment was drip-irrigated with 250 m3 of water per
1,000 m2 while no water was applied to the dry treatment.
Inflorescence counting was performed in two different
experiments: (1) on the open-field experiment in Akko in
summer 1999 as described by Eshed and Zamir (1995) and
(2) in a greenhouse experiment at Rehovot in winter 2001/
2002. In the greenhouse experiment plants were grown in
4 liter pots. 35 days seedlings were transplanted on
November 2001 and were grown until March 2002.
Results for the comparison between IL2-1 and M82
under irrigated and dry conditions were obtained from a
genome-wide scan field experiment that was conducted
under these two irrigation regimes in summer 2000 (Gur
et al. 2010). The sub-lines were re-grown in an open-field
experiment in Akko in summer 2008 with pericarp tissue
being harvested for metabolite profiling exactly as descri-
bed in Schauer et al. (2006).
Extraction, derivatization, and analysis of polar
metabolites using GC–MS
Metabolite analysis by gas chromatography–mass spec-
trometry (GC–MS) was carried out essentially as described
by Fernie et al. (2004) and Lisec et al. (2006). The mass
spectra were cross-referenced with those in the Golm
Metabolome Database (Kopka et al. 2005).
Nucleic acid analysis
The parental and recombinant lines were genotyped using
RFLP analysis as described by Bernatzky and Tanksley
(1986). A large genetic gap remained at the TG31–CT106
interval. This 11.5 cM gap is a result of either random lack
of markers, or, more likely, due to ‘hot-spot’ of recombi-
nation in this region. In order to enrich this region with
more markers we surveyed a set of RAPD markers on the
two parents (IL2-1 and M82). The DNA from both parents
was amplified using 300 random RAPD primers (Operon
Technologies, Alameda, CA, USA) to select those that
generated polymorphic bands. The RAPD procedure was
as described by Doganlar et al. (2000). Six RAPD primers
produced polymorphic bands and were then used to
amplify DNA from the recombinant sub-lines of IL2-1, in
order to map them more precisely within the region.
The BAC clones that contained the TG31 sequence were
identified using hybridization on the tomato BAC library
filters. The corresponding clones were ordered from the
tomato BAC library at Clemson University (http://www.
genome.clemson.edu/cgi-bin/orders?page=productGroup&
service=bacrc&productGroup=166). The BAC ends were
sequenced and used as RFLP markers to place them on the
genetic map.
Phenotyping
In all open-field experiments, fruits were harvested when
80–100% of the tomatoes were red, preferably when the
M82 was 80–90% so that the early ripening effect of the
IL2-1p allele could be detected. Red and green fruits were
weighed separately to estimate the earliness (earliness is
defined as the number of days from sowing to the appearance
of the first ripe fruit). Plant vegetative weight (PW) was
determined by weighing only the vegetative tissue (after
harvesting the fruits) without the roots. Total fruit yield (TY)
per plant included both the red (RY) and the green (GY)
fruits. Mean fruit weight (FW) was calculated from a ran-
dom sample of 20 fruits per plant. Concentrations of total
soluble solids (BX, measured in degrees Brix) were mea-
sured from a random sample of 10 fruits per plant. Harvest
index (HI) was calculated as the ratio between the total yield
and total biomass (TY ? PW). Inflorescence labeling and
counting was done at intervals of 3–7 days from beginning
of flowering over a 40-day time period, on plants grown both
on the open field and in a greenhouse. At each counting time,
all new inflorescences that contained at least one post-
anthesis flower were labeled and counted.
Theor Appl Genet (2010) 121:1587–1599 1589
123

Mode of inheritance
The additive effect (a) was half of the difference between
each IL and M82, and its significance level was determined
by the comparison between the IL and M82. The domi-
nance deviation (d) is the difference between ILH and the
mid-value of its parents. Its significance level was calcu-
lated by contrasting the ILH (?1) with M82 (-0.5) and the
appropriate IL (-0.5). The degree of dominance for each
introgression (d/[a]) was calculated by dividing the mean
dominance deviation by the mean additive effect.
Statistical analyses
Statistical analyses were performed on the JMP V.5
software package for Macintosh (SAS institute). Mean
values for the parameters measured for the tested geno-
types were compared to the common control using the
‘‘Fit Y by X’’ function and ‘‘Compare with control’’ with
an alpha level of 0.05 (Dunnett 1955). All calculations
were performed with the phenotypic values while the
results are presented as the percentage difference from
M82. Interactions were calculated by multi-factorial
analysis of variance (ANOVA) using the ‘‘fit model’’
function and correlation was determined by Pearson’s
analysis.
Results
Correlation between vegetative and reproductive
growth and identification of QTL that modify
this relation in the ILs population
Analysis of data from whole genome phenotypic surveys on
field trials, over 2 years: (1) summer 1993 (Eshed and Zamir
1995) and (2) summer 2000 (Gur et al. 2010), demonstrate
that there is large variation for growth habit in the ILs
population. The 66 and 65% in 1993 and 2000, respectively,
of the phenotypic variation is explained by genetic variation
after exclusion of the lines that contain the S. pennellii
SELF-PRUNING (SP) allele from the analysis (Fridman
et al. 2002). Our interest in the current study was to detect
QTL that modifies the relationship between vegetative
growth and yield production in such a way that the harvest
index is improved. The frequency distribution for plant
weight is not normal since the variation is biased towards an
increase in comparison to M82 (Fig. 1). Twenty-five ILs
were observed to display an increased plant weight, whilst
only two displayed a reduced plant weight in comparison to
the M82 control (Dunnet; P \ 0.05). That said the frequency
distribution of total yield is normal—with M82 being
invariant from the population mean (Fig. 1). There are 12
lines in which the total yield was reduced with respect to the
control and 8, which improved the total yield (Dunnet;
P \ 0.05). The parameters of plant weight and total yield
appear to be highly correlated on the basis of measurements
of a homogenous population of M82 plants (for PW: M82,
1.2 kg; 75ILs, 2.2 kg; 75ILHs, 1.7 kg; for TY: M82n=100,
8.5 kg; 75ILsn=500, 6.7 kg; 75ILHsn=430, 10 kg; R = 0.74,
N = 107).Given that the harvest index is the ratio between
total yield and plant weight it follows that the correlation
between these traits can afford a good estimate for the var-
iation of harvest index within a population. The low corre-
lation coefficient within the S. pennellii IL library (for HI:
M82n=100, 0.71; 75ILsn=500, 0.08; 75ILHsn=430, 0.61; R =
0.08, N = 500) indicates large variability for this trait.
Intriguingly, the majority of variation apparent in this trait is
expressed as a reduction of harvest index in comparison to
M82 (Fig. 1). Critical assessment of these data revealed that
23 lines display a reduced harvest index in comparison to
M82, while only a few lines displayed transgressive segre-
gation and a consequent improvement of the harvest index.
For earliness, the picture is quite similar to that of the harvest
index in terms of the frequency distribution and numbers of
increasing and decreasing lines. IL2-1 is a unique genotype,
which displayed consistent transgressive segregation for
reduction of total plant weight. When tested as a heterozy-
gote (ILH2-1; IL2-1 9 M82), it improved the harvest index
(Fig. 1), and was, therefore, chosen for detailed analysis.
Phenotypic characterization of IL2-1
Yield-related traits
IL2-1 was tested over 3 years and in different genetic
backgrounds. Two genetic backgrounds of inbred lines
diverse in their phenotypic characteristics were used: (1)
the core background of M82, and (2) a semi-determinate
processing tomato inbred; 9,225. The effect of the intro-
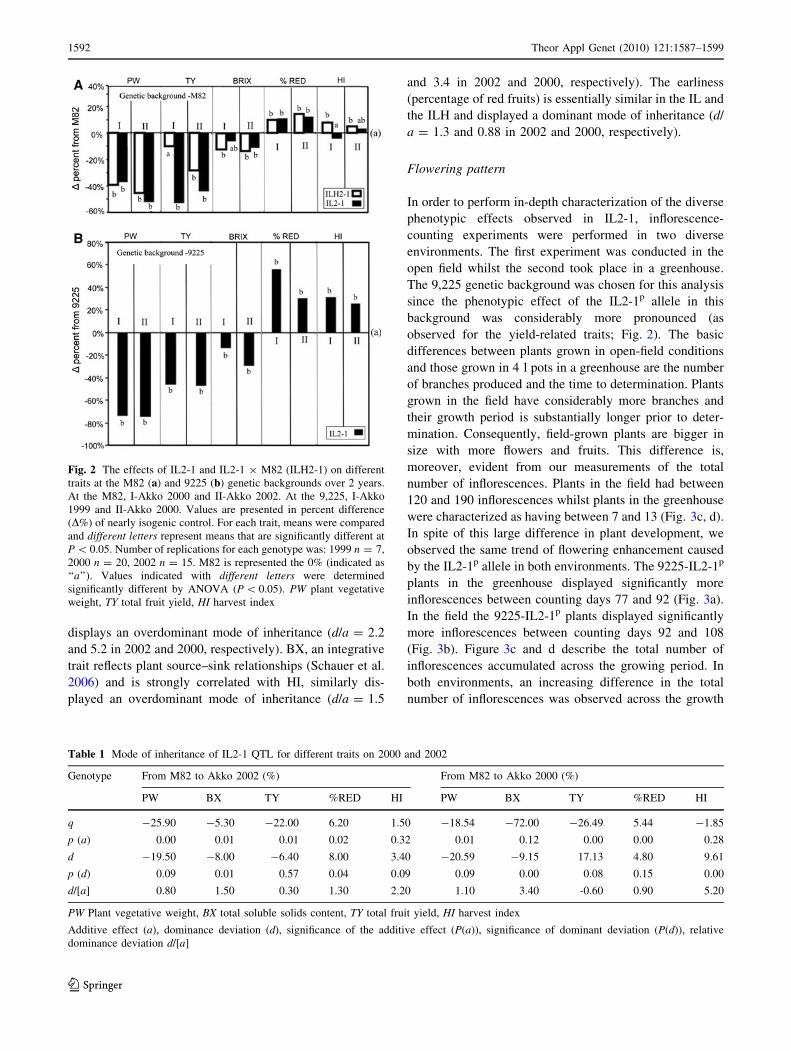
gression on plant weight (PW) was consistent, 40–60%
reduction compared to the near-isogenic control at the M82
background (Fig. 2a) and 70% reduction at the 9,225
background (Fig. 2b). For total yield (TY) the effect in the
homozygous lines was a reduction of 45–55% at both
genetic backgrounds whilst the IL2-1 9 M82 hybrid dis-
played a non-significant yield reduction of 10% in the 2000
trial but a substantially larger (and significant) yield
reduction of 28% in 2002 (Fig. 2a). Total soluble solids
content (BX) was reduced by 7–15% both in IL2-1 and in
the hybrid with respect to M82 and by 10 and 30% in the
1999 and 2000 trials with respect to the 9,225 control. Both
harvest index and earliness are derived parameters calcu-
lated from the measurements taken at the field. Earliness
(EA) is estimated as the percentage of red yield from the
total harvestable yield (green and red fruit). The harvest
1590 Theor Appl Genet (2010) 121:1587–1599
123

was performed at 80–95% red yield (depending on the
experiment), of the M82 control. There was a general effect
of increase in this parameter following introgression:
10–15% increase in percentage of red yield in the M82
background (Fig. 2a), and a dramatic 30–50% in the 9,225
background (Fig. 2b). Harvest index (HI) is calculated by
dividing the total harvestable yield by the total plant bio-
mass. Intriguingly, there was a consistent 5–7% increase in
HI in the IL2-1 9 M82 hybrid whilst the homozygote
IL2-1 displayed no significant change. In the 9,225 back-
ground, there was 30% increase in HI attributable to the
IL2-1 introgression.
Using two-way ANOVA, we calculated the IL2-1 9
genetic background interactions for the QTL effect in the
two diverse genetic backgrounds. A significant interaction
(P \ 0.05) was found for all traits in at least one season,
since the IL2-1p (S. pennellii allele at the IL2-1 segment)
effect was stronger in the 9,225 background than in M82.
Table 1 presents the mode of inheritance of the IL2-1
QTL for different traits in the M82 background. For PW,
the negative effect of the QTL is dominant (d/a = 0.8 and
1.1 in 2002 and 2000, respectively). TY is additively
reduced (d/a = 0.3 and -0.65 in 2002 and 2000, respec-
tively) and HI, which combines these two traits accordingly
Fig. 1 Frequency distributions
of the relative performance for
means of ILs and their hybrids
as measured on the replicated
trails on 1993 and 2000
(expressed in percent difference
(D%) of M82). Black barsrepresent the IL2-1 genotypes.
IL2-1 9 M82 is indicated in
black arrow
Theor Appl Genet (2010) 121:1587–1599 1591
123
displays an overdominant mode of inheritance (d/a = 2.2
and 5.2 in 2002 and 2000, respectively). BX, an integrative
trait reflects plant source–sink relationships (Schauer et al.
2006) and is strongly correlated with HI, similarly dis-
played an overdominant mode of inheritance (d/a = 1.5
and 3.4 in 2002 and 2000, respectively). The earliness
(percentage of red fruits) is essentially similar in the IL and
the ILH and displayed a dominant mode of inheritance (d/
a = 1.3 and 0.88 in 2002 and 2000, respectively).
Flowering pattern
In order to perform in-depth characterization of the diverse
phenotypic effects observed in IL2-1, inflorescence-
counting experiments were performed in two diverse
environments. The first experiment was conducted in the
open field whilst the second took place in a greenhouse.
The 9,225 genetic background was chosen for this analysis
since the phenotypic effect of the IL2-1p allele in this
background was considerably more pronounced (as
observed for the yield-related traits; Fig. 2). The basic
differences between plants grown in open-field conditions
and those grown in 4 l pots in a greenhouse are the number
of branches produced and the time to determination. Plants
grown in the field have considerably more branches and
their growth period is substantially longer prior to deter-
mination. Consequently, field-grown plants are bigger in
size with more flowers and fruits. This difference is,
moreover, evident from our measurements of the total
number of inflorescences. Plants in the field had between
120 and 190 inflorescences whilst plants in the greenhouse
were characterized as having between 7 and 13 (Fig. 3c, d).
In spite of this large difference in plant development, we
observed the same trend of flowering enhancement caused
by the IL2-1p allele in both environments. The 9225-IL2-1p
plants in the greenhouse displayed significantly more
inflorescences between counting days 77 and 92 (Fig. 3a).
In the field the 9225-IL2-1p plants displayed significantly
more inflorescences between counting days 92 and 108
(Fig. 3b). Figure 3c and d describe the total number of
inflorescences accumulated across the growing period. In
both environments, an increasing difference in the total
number of inflorescences was observed across the growth
Fig. 2 The effects of IL2-1 and IL2-1 9 M82 (ILH2-1) on different
traits at the M82 (a) and 9225 (b) genetic backgrounds over 2 years.
At the M82, I-Akko 2000 and II-Akko 2002. At the 9,225, I-Akko
1999 and II-Akko 2000. Values are presented in percent difference
(D%) of nearly isogenic control. For each trait, means were compared
and different letters represent means that are significantly different at
P \ 0.05. Number of replications for each genotype was: 1999 n = 7,
2000 n = 20, 2002 n = 15. M82 is represented the 0% (indicated as
‘‘a’’). Values indicated with different letters were determined
significantly different by ANOVA (P \ 0.05). PW plant vegetative
weight, TY total fruit yield, HI harvest index
Table 1 Mode of inheritance of IL2-1 QTL for different traits on 2000 and 2002
Genotype From M82 to Akko 2002 (%) From M82 to Akko 2000 (%)
PW BX TY %RED HI PW BX TY %RED HI
q -25.90 -5.30 -22.00 6.20 1.50 -18.54 -72.00 -26.49 5.44 -1.85
p (a) 0.00 0.01 0.01 0.02 0.32 0.01 0.12 0.00 0.00 0.28
d -19.50 -8.00 -6.40 8.00 3.40 -20.59 -9.15 17.13 4.80 9.61
p (d) 0.09 0.01 0.57 0.04 0.09 0.09 0.00 0.08 0.15 0.00
d/[a] 0.80 1.50 0.30 1.30 2.20 1.10 3.40 -0.60 0.90 5.20
PW Plant vegetative weight, BX total soluble solids content, TY total fruit yield, HI harvest index
Additive effect (a), dominance deviation (d), significance of the additive effect (P(a)), significance of dominant deviation (P(d)), relative
dominance deviation d/[a]
1592 Theor Appl Genet (2010) 121:1587–1599
123

period. In the greenhouse the number of inflorescences in
9225-IL2-1p was almost double that seen in its near-iso-
genic control (Fig. 3c). In the field, there is more than 50%
increase in the number of inflorescences 9225-IL2-1p in
comparison to its near-isogenic control (Fig. 3d).
Using fine mapping for characterization of the multiple
phenotypes displayed by IL2-1
The strategy of substitution mapping in combination with
linkage analysis was performed in order to try and more
precisely locate the genetic factor or factors, which are
responsible for the relevant phenotypic variation associated
with IL2-1. Phenotypic characterization of IL2-1 revealed
that traits such as plant weight, total yield, brix and earli-
ness could readily be mapped in a sub-NILs mapping
population, homozygous for the S. pennellii introgression,
while mapping the harvest index effect had to be performed
in the heterozygous condition. Mapping trials were made
independently for each population.
Thirty one nearly isogenic sub-lines segregating for the
18 cM TG33–TG276 interval were extracted from 800
plants screened in F2. These sub-lines were tested in field
experiments as F3 families (progeny test) in summer 1999
for preliminary mapping. Twenty-four lines were further
tested on a replicated trial as fixed genotypes in summer
2000. Each of the traits (PW, TY, FW, BX and %RED)
was mapped independently. Twenty-one sub-lines were
crossed to M82 to produce lines heterozygous for the
S. pennellii introgressions. These heterozygous sub-lines
were tested in a replicated trial in summer 2002 for the
harvest index mapping. Recombinant sub-NILs were divi-
ded into eight genotypic groups according to their position
of recombination and allelic composition. Figure 4 sum-
marizes the mapping data collected in 2000 and 2002. For
example, significant reduction of more than 50% was
observed in PW in groups A, C and D whilst the non-
significant effects in groups B, E and H locate the PW QTL
to the CT251–TG276 interval. Fourteen lines contained
recombination between TG31 and CT106 (recombination
distance of 5 cM; the physical distance is currently not
possible because the markers land on two independent
scaffolds). They were divided into groups F (six lines) and
G (eight lines) on the basis of their reciprocal allelic
composition. Individual lines of each group were further
subdivided according to their phenotypic values (F1, F2,
G1 and G2), which allowed us to narrow down the map-
ping to the TG31–CT106 interval. Unfortunately, either a
shortage of markers or a ‘‘hot-spot’’ of recombination left
us with this large genetic gap. The phenotypic segregation
of lines within the same genotypic group (following our
genetic map resolution), forced us to further fine map the
QTL on the basis of linkage analysis as opposed to sub-
stitution mapping. Five lines contained recombination
between TG31 and the QTL (2 on group F and 3 on G,
Fig. 4). Nine recombinants were found between CT106
Fig. 3 The effect of the IL2-1
introgression on flowering
pattern at the 9,225 genetic
background. The numbers of
inflorescence per count are
presented from two different
experiments: greenhouse and
open field. Each point represents
the mean value of 10 plants.
Means of the nearly isogenic
lines were compared on each
counting point using t test.
Mean values of 9225-IL2-1p
that were found significantly
different from their nearly
isogenic control (at P \ 0.05)
are circled
Theor Appl Genet (2010) 121:1587–1599 1593
123
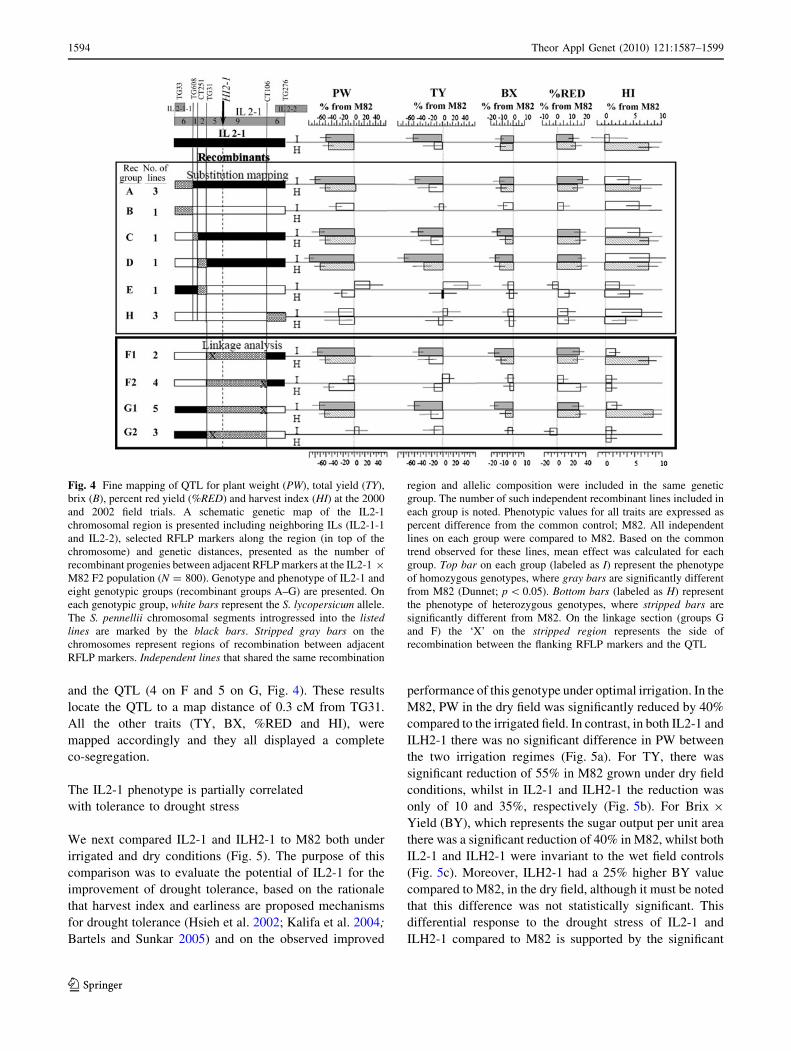
and the QTL (4 on F and 5 on G, Fig. 4). These results
locate the QTL to a map distance of 0.3 cM from TG31.
All the other traits (TY, BX, %RED and HI), were
mapped accordingly and they all displayed a complete
co-segregation.
The IL2-1 phenotype is partially correlated
with tolerance to drought stress
We next compared IL2-1 and ILH2-1 to M82 both under
irrigated and dry conditions (Fig. 5). The purpose of this
comparison was to evaluate the potential of IL2-1 for the
improvement of drought tolerance, based on the rationale
that harvest index and earliness are proposed mechanisms
for drought tolerance (Hsieh et al. 2002; Kalifa et al. 2004;
Bartels and Sunkar 2005) and on the observed improved
performance of this genotype under optimal irrigation. In the
M82, PW in the dry field was significantly reduced by 40%
compared to the irrigated field. In contrast, in both IL2-1 and
ILH2-1 there was no significant difference in PW between
the two irrigation regimes (Fig. 5a). For TY, there was
significant reduction of 55% in M82 grown under dry field
conditions, whilst in IL2-1 and ILH2-1 the reduction was
only of 10 and 35%, respectively (Fig. 5b). For Brix 9
Yield (BY), which represents the sugar output per unit area
there was a significant reduction of 40% in M82, whilst both
IL2-1 and ILH2-1 were invariant to the wet field controls
(Fig. 5c). Moreover, ILH2-1 had a 25% higher BY value
compared to M82, in the dry field, although it must be noted
that this difference was not statistically significant. This
differential response to the drought stress of IL2-1 and
ILH2-1 compared to M82 is supported by the significant
Fig. 4 Fine mapping of QTL for plant weight (PW), total yield (TY),
brix (B), percent red yield (%RED) and harvest index (HI) at the 2000
and 2002 field trials. A schematic genetic map of the IL2-1
chromosomal region is presented including neighboring ILs (IL2-1-1
and IL2-2), selected RFLP markers along the region (in top of the
chromosome) and genetic distances, presented as the number of
recombinant progenies between adjacent RFLP markers at the IL2-1 9
M82 F2 population (N = 800). Genotype and phenotype of IL2-1 and
eight genotypic groups (recombinant groups A–G) are presented. On
each genotypic group, white bars represent the S. lycopersicum allele.
The S. pennellii chromosomal segments introgressed into the listedlines are marked by the black bars. Stripped gray bars on the
chromosomes represent regions of recombination between adjacent
RFLP markers. Independent lines that shared the same recombination
region and allelic composition were included in the same genetic
group. The number of such independent recombinant lines included in
each group is noted. Phenotypic values for all traits are expressed as
percent difference from the common control; M82. All independent
lines on each group were compared to M82. Based on the common
trend observed for these lines, mean effect was calculated for each
group. Top bar on each group (labeled as I) represent the phenotype
of homozygous genotypes, where gray bars are significantly different
from M82 (Dunnet; p \ 0.05). Bottom bars (labeled as H) represent
the phenotype of heterozygous genotypes, where stripped bars are
significantly different from M82. On the linkage section (groups G
and F) the ‘X’ on the stripped region represents the side of
recombination between the flanking RFLP markers and the QTL
1594 Theor Appl Genet (2010) 121:1587–1599
123

genotype 9 environment interactions that were found for
these traits (Fig. 5). In contrast, when analyzing the harvest
index (HI) minor increase in both dry and wet conditions was
observed (Fig. 5d). Surprisingly in this harvest there was
only a significant increase in ILH2-1 (irrigated conditions)
and only a minor increase in IL2-1 itself. As such we were
unable to access this parameter reliable in this harvest and
further studies are thus required in order to achieve this goal.
Metabolic QTL co-segregating with the IL2-1
phenotype
In order to gain further insight into the physiological basis
of the phenotype we next performed GC–MS-based met-
abolic profiling of the lines grown in the field under the
same design in Summer 2008. The yield associated traits
were the same as those described above for other harvests
(data not shown), whilst the metabolite profiles were in
good accordance with those previously noted for the entire
2-1 introgression (compare Table 2 and Supplementary
Table 1 with Schauer et al. 2006, 2008). Notable changes
were that the four sub-lines from groups A, C and D with S.
pennellii chromosomal segments introgressed between
TG31 and CT106 interval exhibited significantly higher
content of the amino acids glutamine, histidine, homoser-
ine, lysine, tryptophan, tyramine, tyrosine, S-methyl cys-
teine. They additionally displayed significantly higher
content of galacturonic acid, maltotriose and glycerol-
3-phosphate in comparison sub-lines compare with the three
sub-lines from groups B, E and H with S. lycopersicum
background in hi2-1 position. Moreover, they displayed
significantly lower levels of glucose, fructose and trehalose
than M82, however, these changes did not completely
segregate with respect to the sub-lines. These changes did
however correlate with elevated levels of hexose phos-
phates and as such suggest that these fruits utilize their
sugars more efficiently in support of growth processes.
Discussion
Controlled vegetative growth in crop plants is generally a
positive trait. The discovery of a recessive mutation con-
ferring determinate habit (sp/sp) in tomato can be regarded
as a small scale ‘green revolution’ for this crop as it
allowed the development of processing tomato varieties
that are suited for open-field mechanical practices. Most of
the tomatoes grown worldwide today and used for indus-
trial products are processing tomatoes, which contain this
single-gene mutation. Nevertheless, there is still a consid-
erable amount of variation in plant growth–habit among all
these different sp/sp cultivars. M82 is an inbred processing
tomato variety with a relatively small plant size and high
harvest index. Searching for alleles from the wild that will
reduce plant size and increase harvest index at this genetic
background seemed like an ambitious objective. Indeed,
most of the wild alleles that were effective among the
S. pennellii ILs population caused an increase in plant
weight and reduction in harvest index. In that sense, IL2-1
is a unique genotype. The enhanced expression of this QTL
under a more vegetative genetic background (i.e. 9,225)
confirmed our assumption that the M82 is a stringent
background for detection of QTLs that improve harvest
index, and provided another example for the significance of
epistasis in QTL studies (Carlborg and Haley 2004;
Kroymann and Mitchell-Olds 2005; Semel et al. 2006;
Fig. 5 Phenotypic values for
total fruit yield (TY), plant
vegetative weight (PW), Brix
yield (BY) and harvest index
(HI) on the dry and wet fields.
Mean values ± SE for IL2-1,
ILH2-1 and M82 are presented.
Black bars represent values
from the irrigated field. Emptybars are the dry field values.
P value for the
genotype 9 environment
interaction (G 9 E) is presented
for each trait. Values indicated
with different letters were
determined significantly
different by ANOVA. Blackbars wet conditions and whitebars dry conditions
Theor Appl Genet (2010) 121:1587–1599 1595
123

Wentzell et al. 2007). It also highlights the importance of
analyzing QTL under the genetic background that reflects
their strongest effect if a detailed genetic analysis of the
QTL is the focus (Fridman et al. 2002). However, when
dealing with agronomically related traits, validation of a
QTL effect must be performed in the most relevant genetic
background (Gur and Zamir 2004; Fridman et al. 2004;
Lippman et al. 2008; Krieger et al. 2010). An indirect result
of breeding for improved harvest index and earliness is the
potential improvement of tolerance to abiotic stress, such
as drought; either by improved partitioning of assimilates
to harvestable product (Yadav et al. 2002, 2004) or through
avoidance mechanisms. Our results indicate that the
improved harvest index and earliness that were conferred
by the IL2-1p allele were correlated with some level of
drought tolerance. This tolerance was expressed in relative
values as the drought induced reductions in plant weight,
in total yield and in Brix 9 Yield of IL2-1 and ILH2-1
were less than that of M82 (Fig. 5). For all these traits, a
significant genotype 9 environment (G 9 E) interaction,
confirming this trend, was found. However, further breeding
is needed in order to test whether this improvement will
be consistent also in higher yielding genetic backgrounds.
Whilst the metabolite data we obtained provide a reasonable
rationale to support the improved harvest index and maybe
also fruit earliness there seems to be no clear link between the
metabolite data and the drought tolerance phenotype since
the metabolites that differentially accumulate in the pericarp
are quite different from those which we associated with
drought tolerance in an earlier study (Semel et al. 2007).
Since source–sink relationships have been widely demon-
strated to effect metabolites (Schauer et al. 2006; Prudent
et al. 2010) we cannot rule out that these play a role in the
metabolites changes observed. Indeed, for other traits
described in this study further genetic resolution will be
required to answer this question.
A major point which must be considered when using
wild germplasm for plant improvement is the forced intro-
gression of other wild alleles that sit next to the target genes
that were used for selection (Frisch and Melchinger 2001;
Hospital 2001). This process is termed ‘‘linkage drag’’ and
in many instances produces negative effects since there are
negative alleles linked to the selected one. For this reason
detailed characterization of a QTL that affects several
diverse traits is essential in order to determine if the effect is
pleiotropic or rather caused by linkage drag in which case
Table 2 Metabolite profiles in red fruits
Rec. groups
A C D B E H
Il2-1-12 SE Il2-1-17 SE Il2-1-8 SE Il2-1-1 SE Il2-1-20 SE Il2-1-6 SE Il2-1-18 SE
Amino acids
Cysteine, S-methyl 4.14 0.05 4.14 0.30 3.97 0.26 5.47 0.23 1.16 0.33 1.43 0.32 1.66 0.02
Glutamine 6.84 0.00 2.02 0.11 6.35 0.38 4.89 0.28 0.94 0.32 1.63 0.46 1.61 0.04
Histidine 2.27 0.15 1.65 0.11 3.55 0.47 1.97 0.13 0.96 0.27 1.60 0.34 1.63 0.12
Homoserine 1.77 0.00 2.83 0.27 3.21 0.48 1.93 0.18 0.90 0.01 1.01 0.28 1.38 0.07
Lysine 1.91 0.02 2.97 0.29 3.63 0.49 2.30 0.10 0.79 0.04 1.23 0.32 1.71 0.13
Tryptophan 1.74 0.05 1.73 0.14 3.02 0.50 1.63 0.07 0.93 0.10 0.97 0.26 1.30 0.05
Tyramine 2.91 0.27 1.98 0.22 2.71 0.47 1.67 0.18 3.55 0.62 1.45 0.28 1.53 0.29
Tyrosine 2.90 0.02 1.73 0.20 4.40 0.52 3.39 0.14 0.85 0.28 2.78 0.18 1.89 0.34
Organic acids
Galacturonic acid 3.40 0.21 1.68 0.11 2.98 0.53 3.00 0.00 1.96 0.37 2.14 0.20 1.10 0.08
Sugar and sugar alcohols
Fructose 0.75 0.17 0.83 0.12 0.81 0.10 0.71 0.06 0.95 0.22 0.98 0.16 0.77 0.06
Fructose-6-phosphate 2.03 0.08 1.84 0.14 1.70 0.21 1.69 0.07 1.09 0.00 1.00 0.18 1.40 0.00
Glucose 0.69 0.14 0.72 0.17 1.04 0.20 0.53 0.07 1.00 0.29 1.16 0.23 0.87 0.09
Glucose-6-phosphate 1.46 0.00 1.59 0.12 1.30 0.09 1.56 0.11 0.89 0.09 1.02 0.17 1.29 0.13
Maltotriose 1.96 0.18 4.63 0.19 7.04 0.10 5.70 0.26 0.78 0.48 1.26 0.18 3.64 0.22
Trehalose 0.41 0.09 0.61 0.16 0.42 0.23 0.44 0.09 0.72 0.21 0.87 0.10 0.65 0.05
Miscellaneous
Glycerol-3-phosphate 1.63 0.04 1.71 0.09 1.63 0.11 1.16 0.13 1.24 0.22 0.96 0.19 1.37 0.02
Data are normalized by the mean of M82 (M82 = 1.00). Values represent the calculated fraction of M82. Data points consist of the mean out of
six replicates ± SE
Bold type values were determined by the t test to be significantly different (P \ 0.05) from M82
1596 Theor Appl Genet (2010) 121:1587–1599
123

the various QTL could be dissected. The analysis of seg-
regating populations for the QTL mapping region is a
powerful strategy to address such questions since if the
multiple effects are caused by linkage then a sub-line that
has only the phenotype of interest should be achievable. For
this reason we here screened 1,600 gametes from an F2
population segregating for the IL2-1 genomic region. No
recombination was observed between any of the measured
traits at any of the recombinant lines (Fig. 4). This finding is
an indication that the multi-phenotypic effect of IL2-1 is
most likely a result of pleiotropic effect of a single gene,
rather than of linkage between independent loci. This is of
course only an assumption that can only be confirmed once
the gene associated with this QTL is cloned.
Concerning the development determinants for the tran-
sition from vegetative to reproductive development some
genes have been characterized (Samach et al. 2000; Cremer
and Coupland 2003; El-Din El-Assal et al. 2003; Pineiro
et al. 2003; Valverde et al. 2004) using the natural variation
in flowering time among different Arabidopsis species
(Alonso-Blanco et al. 1998; Koornneef et al. 1998; El-Din
El-Assal et al. 2001; Alonso-Blanco et al. 2009). Based on
these results and the conservation of this mechanism across
species (Laurie 1997; Andersen et al. 2003; Yamasaki et al.
2005), these genes have also be investigated in other plant
species (Murai et al. 2003; Izawa 2007; Jimenez-Gomez
et al. 2007). Although the modified flowering pattern was
only analyzed at the full-length introgression (IL2-1) and this
phenotype was not mapped on the recombinant sub-lines, we
personally strongly believe that the induced flowering is the
cause of the pleiotropic effects of early maturation, reduced
plant weight and Brix and increased harvest index. The
induction of flowering caused by the IL2-1p allele is essen-
tially the result of an accelerated transition from vegetative to
reproductive growth. In the homozygous state the intro-
gression results in a lack of setting of most flowers, a sub-
sequent reduction in fruit number and a consequent reduction
total yield. However, plants heterozygous for the introgres-
sion maintain the reduced plant weight, but exhibit better
flower setting and display only a minor reduction in total
yield (in comparison to M82). As a result lines heterozygous
for this introgression display an increased harvest index.
We demonstrate the detailed characterization of a QTL
which impacts the relationship between vegetative and
reproductive development. The genetic dissection of this
multi-phenotype QTL leads us to assume that its diverse
effects most likely result from pleiotropic effects following
the modulation of a single gene. We propose that the initial,
causal, effect underlying these changes is the enhanced floral
induction. Further support for this hypothesis is provided by
the fact that when IL2-1 was tested in an indeterminate
background (IL2-1p SP?) there was no Brix reduction in the
fruits in comparison to the near-isogenic control (SP?), and
the plants were visually indistinguishable from this control
line (data not shown). This suggests that SP, which is known
to be strongly epistatic over other genes which affect plant
development (Fridman et al. 2002) is also epistatic over hi2-
1. The fact that the Brix reduction, which is a major pheno-
typic effect of IL2-1 under determinate growth habit, was not
observed in the indeterminate background indicates that this
effect is most likely a result of the altered growth habit rather
than an independent unassociated effect. However, to reit-
erate as stated above formal evidence in go in support (or
conflict), of our theory will only be available following the
cloning of the gene(s) underlying these traits.
Despite the increase in earliness and harvest index these
beneficial traits come at the cost of decreased yield.
However, as stated above in this current study we were not
able to prove if these traits resulted by the pleiotropic
effects of change in a single gene or rather the close
linkage of two or more genes independently influencing
these traits. Future work in which recombinants harboring
smaller segments of the S. pennellii genome will be
required to fully dissect this locus. Obviously if these traits
effect of linkage of genes it may prove possible to segre-
gate advantageous from deleterious phenotypes.
The QTL investigated unfortunately maps to a genomic
region that is lacking in markers and rich in recombinations
(both in our population and in that studied by Tanksley
et al. 1992). These results when taken together with the fact
that none of the new RAPD markers which we developed
during this study and mapped to IL2-1 fell within this
region, leads us to assume that this interval is likely to be a
‘hot-spot’ of recombination which deviates from the
average bp/cM ratio of tomato. At the present moment we
do not have any good estimation for the physical distance
between the closest marker (TG31) and the QTL (although
we confirmed that they are separated by a physical distance
that is more than one BAC [*100 kb], as ends of BACs
that were positive for the TG31 clone did not genetically
map to different sides of the QTL; see ‘‘Materials and
methods’’). However, we believe that the distance between
hi2-1 and TG31 is less than the expected by just multi-
plying the genetic distance with the average bp/cM ratio of
tomato. As such we are confident that the results presented
here represent a good basis for further investigation (and
future cloning), of this QTL especially given that many
more candidate genes can be anticipated to be uncovered
given the imminent release of the tomato genome. We
anticipate that the cloning of this gene will bring greater
understanding of understanding both the process of
resource allocation and the phenomenon of heterosis in the
tomato in a similar manner to that of the recent cloning of
the genes ANANTHA, COMPOUND INFLORESCENCE
and SINGLE FLOWER TRUSS (Lippman et al. 2008;
Krieger et al. 2010).
Theor Appl Genet (2010) 121:1587–1599 1597
123

Acknowledgments We thank Gabi Gera and the Akko field
experiment station group for their assistance with the field experi-
ments. Financial support of the Deutsche Forshungsgemeinschaft to
SO, ARF and DZ in the frame of the trilateral project ‘‘Drought
Tolerant Sun-Dried Tomatoes: A novel Product Based on Heterotic
Natural Biodiversity’’ (FE552/3-2) is gratefully acknowledged.
Open Access This article is distributed under the terms of the
Creative Commons Attribution Noncommercial License which per-
mits any noncommercial use, distribution, and reproduction in any
medium, provided the original author(s) and source are credited.
References
Alonso-Blanco C, El-Assal SE, Coupland G, Koornneef M (1998)
Analysis of natural allelic variation at flowering time loci in the
Landsberg erecta and Cape Verde Islands ecotypes of Arabid-opsis thaliana. Genetics 149(2):749–764
Alonso-Blanco C, Aarts MGM, Bentsink L, Keurentjes JJB, Raymond
M, Vreugdenhil D, Koornneef M (2009) What has natural
variation taught us about plant development, physiology, and
adaptation? Plant Cell 21:1877–1896
Andersen CH, Jensen CS, Petersen K (2003) Similar genetic switch
systems might integrate the floral inductive pathways in dicots
and monocots. Trends Plant Sci 9:105–107
Atherton JG, Rudich J (1986) The tomato crop. Chapman and Hall,
London
Bartels D, Sunkar R (2005) Drought and salt tolerance in plants. Crit
Rev Plant Sci 24:23–58
Bernatzky R, Tanksley SD (1986) Methods for detection of single or
low-copy sequences in tomato on Southern blots. Plant Mol Biol
Rep 4:37–41
Bugbee BG, Salisbury FB (1988) Exploring the limits of crop
productivity. I. Photosynthetic efficiency of wheat in high
irradiance environments. Plant Physiol 88:869–878
Carlborg O, Haley CS (2004) Epistasis: too often neglected in
complex trait studies? Nat Rev Genet 5(8):618–625
Carmel-Goren L, Liu YS, Lifschitz E, Zamir D (2003) The SELF-
PRUNING gene family in tomato. Plant Mol Biol 52(6):
1215–1222
Cong B, Barrero LS, Tanksley SD (2008) Regulatory change in
YABBY-like transcription factor led to evolution of extreme
fruit size during tomato domestication. Nat Genet 40:800–804
Cremer F, Coupland G (2003) Distinct photoperiodic responses are
conferred by the same genetic pathway in Arabidopsis and in
rice. Trends Plant Sci 8:405–407
Doebley JF, Gaut BS, Smith BD (2006) The molecular genetics of
crop domestication. Cell 127:1309–1321
Doganlar S, Mutschler MA, Tanksley SD (2000) Identification and
molecular mapping of loci controlling fruit ripening time in
tomato. Theor Appl Genet 100:249–255
Doi K, Izawa T, Yamanouchi U, Kubo T, Shimatano Z, Yano M,
Yoshimura A (2004) Ehd1, a B-type response regulator in rice,
confers short-day promotion of flowering and controls FT-Iike
gene expression independently of Hd1l. Genes Dev 18:926–936
Dunnett CW (1955) A multiple comparison procedure for comparing
several treatments with a control. J Am Stat Assoc 50:1096–1121
El-Din El-Assal S, Alonso-Blanco C, Peeters AJ, Raz V, Koornneef
M (2001) A QTL for flowering time in Arabidopsis reveals a
novel allele of CRY2. Nat Genet 29(4):435–440
El-Din El-Assal S, Alonso-Blanco C, Peeters AJ, Wagemaker C,
Weller JL, Koornneef M (2003) The role of cryptochrome 2 in
flowering in Arabidopsis. Plant Physiol 133(4):1504–1516
Eshed Y, Zamir D (1994) A genomic library of Lycopersiconpennellii in L. esculentum: a tool for fine mapping of genes.
Euphytica 79:175–179
Eshed Y, Zamir D (1995) An introgression line population of
Lycopersicon pennellii in the cultivated tomato enables the
identification and fine mapping of yield-associated QTL.
Genetics 141(3):1147–1162
Fernie AR, Trethewey RN, Krotzky AJ, Willmitzer L (2004)
Metabolite profiling: from diagnostics to systems biology. Nat
Rev Mol Cell Biol 5:763–769
Frary A, Nesbitt TC, Grandillo S, Knaap E, Cong B, Liu J, Meller J,
Elber R, Alpert KB, Tanksley SD (2000) fw2.2: a quantitative trait
locus key to the evolution of tomato fruit size. Science 289:85–88
Fridman E, Liu YS, Carmel-Goren L, Gur A, Shoresh M et al (2002)
Two tightly linked QTLs modify tomato sugar content via
different physiological pathways. Mol Genet Genomics
266(5):821–826
Fridman E, Carrari F, Liu YS, Fernie AR, Zamir D (2004) Zooming
in on a quantitative trait for tomato yield using interspecific
introgressions. Science 305:1786–1789
Frisch M, Melchinger AE (2001) The length of the intact donor
chromosome segment around a target gene in marker-assisted
backcrossing. Genetics 157(3):1343–1356
Gur A, Zamir D (2004) Unused natural variation can lift yield barriers
in plant breeding. PLoS Biol 2(10):E245
Gur A, Semel Y, Osorio S, Friedmann M, Seekh S, Ghareeb B,
Mohammad A, Pleban T, Gera G, Fernie AR, Zamir D (2010)
Quantitative trait loci for yield in a tomato are predominately
expressed by the shoot. Theor Appl Genet (submitted)
Hackel A, Schauer N, Carrari F, Fernie AR, Grimm B, Kuhn C (2006)
Sucrose transporter LeSUT1 and LeSUT2 inhibition affects
tomato fruit development in different ways. Plant J 45:180–192
Hay RK (1995) Harvest index: a review of its use in plant breeding
and crop physiology. Ann Appl Biol 126:197–216
Hospital F (2001) Size of donor chromosome segments around
introgressed loci and reduction of linkage drag in marker-
assisted backcross programs. Genetics 158(3):1363–1379
Hsieh TH, Lee JT, Charng YY, Chan MT (2002) Tomato plants
ectopically expressing Arabidopsis CBF1 show enhanced resis-
tance to water deficit stress. Plant Physiol 130:618–626
Izawa T (2007) Adaptation of flowering-time by natural and artificial
selection in Arabidopsis and rice. J Exp Bot 58:3091–3097
Ji I, Chetelat RT (2003) Homoeologous pairing and recombination in
Solanum lycopersicoides monosomic addition and substitution
lines of tomato. Theor Appl Genet 106:979–989
Jimenez-Gomez JM, Alonso-Blanco C, Borja A, Anastasio G, Angosto
T, Lozano R, Martinez-Zapata JM (2007) Quantitative genetic
analysis of flowering time in tomato. Genome 50:303–315
Kalifa Y, Perlson E, Gilad A, Konrad Z, Scolnik PA, Bar-Zvi D
(2004) Over-expression of the water and salt stress-regulated
Asr1 gene confers an increased salt tolerance. Plant Cell Environ
27:1459–1468
Khush GS (2001) Green revolution: the way forward. Nat Rev Genet
2:815–822
Koornneef M, Alonso-Blanco C, Peeters AJ, Soppe W (1998) Genetic
control of flowering time in Arabidopsis. Annu Rev Plant
Physiol Plant Mol Biol 49:345–370
Kopka J, Schauer N, Krueger S, Birkemeyer C, Usadel B, Bergmuller E
et al (2005) [email protected]: the Golm Metabolome Database.
Bioinformatics 21:1635–1638
Krieger U, Lippman ZB, Zamir D (2010) The flowering gene
SINGLE FLOWER TRUSS drives heterosis for yield in tomato.
Nat Genet (in press)
Kroymann J, Mitchell-Olds T (2005) Epistasis and balanced poly-
morphism influencing complex trait variation. Nature 435(7038):
95–98
1598 Theor Appl Genet (2010) 121:1587–1599
123

Laurie DA (1997) Comparative genetics of flowering time. Plant Mol
Biol 35(1–2):167–177
Lippman ZB, Cohen O, Alvarez JP, Abu-Abied M, Pekker I, Paran I,
Eshed Y, Zamir D (2008) The making of a compound
inflorescence in tomato and related nightshades. PLoS Biol
6(11):e288
Lisec J, Schauer N, Kopka J, Willmitzer L, Fernie AR (2006) Gas
chromatography mass spectrometry-based metabolite profiling in
plants. Nat Protoc 1:387–396
Monna L, Lin X, Kojima S, Sasaki T, Yano M (2002) Genetic
dissection of a genomic region for a quantitative trait locus, Hd3,
into two loci, Hd3a and Hd3b, controlling heading date in rice.
Theor Appl Genet 104(5):772–778
Murai K, Miyamae M, Kato H, Takumi S, Ogihara Y (2003) WAP1, a
wheat APETALA1 homolog, plays a central role in the phase
transition from vegetative to reproductive growth. Plant Cell
Physiol 44(12):1255–1265
Nunes-Nesi A, Carrari F, Lytovchenko A, Smith AM, Loureiro ME,
Ratcliffe RG, Sweetlove LJ, Fernie AR (2005) Enhanced
photosynthetic performance and growth as a consequence of
decreasing mitochondrial malate dehydrogenase activity in
transgenic tomato plants. Plant Physiol 137:611–622
Pan Q, Liu YS, Budai-Hadrian O, Sela M, Carmel-Goren L, Zamir D,
Fluhr R (2000) Comparative genetics of nucleotide binding
site—leucine rich repeat resistance gene homologues in the
genomes of two dicotyledons: tomato and arabidopsis. Genetics
155(1):309–322
Pineiro M, Gomez-Mena C, Schaffer R, Martinez-Zapater JM,
Coupland G (2003) Early bolting in short days is related to
chromatin remodeling factors and regulates flowering in Ara-
bidopsis by repressing FT. Plant Cell 15(7):1552–1562
Pnueli L, Carmel-Goren L, Hareven D, Gutfinger T, Alvarez J, Ganal
M, Zamir D, Lifschitz E (1998) The SELF-PRUNING gene of
tomato regulates vegetative to reproductive switching of sym-
podial meristems and is the ortholog of CEN and TFL1.
Development 125(11):1979–1989
Prudent M, Bertin N, Genard M, Munos S, Rolland S, Garcia V, Petit
J, Baldet P, Rothan C, Causse M (2010) Genotype-dependent
response to carbon availability in growing tomato fruit. Plant
Cell Environ. doi:10.1111/j.1365-3040.2010.02139.x
Rick CM (1969) Controlled introgression of chromosomes of
Solanum pennellii into Lycopersicon esculentum: segregation
and recombination. Genetics 62:753–768
Rick CM (1972) Further studies on segregation and recombination in
backcross derivatives of a tomato species hybrid. Biol Zbl
90:209–220
Robson PR, McCormac AC, Irvine AS, Smith H (1996) Genetic
engineering of harvest index in tobacco through overexpression
of a phytochrome gene. Nat Biotechnol 14(8):995–998
Salamini F (2003) Hormones and the green revolution. Science
302:71–72
Samach A, Onouchi H, Gold SE, Ditta GS, Schwarz-Sommer Z,
Yanofsky MF, Coupland G (2000) Distinct roles of CONSTANS
target genes in reproductive development of Arabidopsis.
Science 288(5471):1613–1616
SAS Institute (2002) JMP statistics and graphics guide: version 5.
SAS Institute Inc., Cary
Schauer N, Semel Y, Roessner U, Gur A, Balbo I, Carrari F, Pleban T,
Perez-Melis A, Bruedigam C, Kopka J, Willmitzer L, Zamir D,
Fernie AR (2006) Comprehensive metabolic profiling and
phenotyping of interspecific introgression lines for tomato
improvement. Nat Biotechnol 24:447–454
Schauer N, Semel Y, Balbo I, Steinfath M, Repsilber D, Selbig J,
Pleban T, Zamir D, Fernie AR (2008) Mode of inheritance of
primary metabolic traits in tomato. Plant Cell 20:509–523
Semel Y, Nissenbaum J, Menda N, Zinder M, Krieger U, Issman N,
Pleban T, Lippmann Z, Gur A, Zamir D (2006) Overdominant
quantitative trait loci for yield and fitness in tomato. Proc Natl
Acad Sci USA 103:12981–12986
Semel Y, Schauer N, Roessner U, Zamir D, Fernie AR (2007)
Metabolite analysis for the comparison of irrigated and non-
irrigated field grown tomato of varying genotype. Metabolomics
3:289–295
Sinclair RS (1998) Historical changes in harvest index and crop
nitrogen accumulation. Crop Sci 38:638–643
Tanksley SD (2004) The genetic, developmental, and molecular bases
of fruit size and shape variation in tomato. Plant Cell 16:S181–
S189
Tanksley SD, Ganal MW, Prince JP, de Vicente MC, Bonierbale
MW, Broun P, Fulton TM, Giovannoni JJ, Grandillo S, Martin
GB (1992) High density molecular linkage maps of the tomato
and potato genomes. Genetics 132(4):1141–1160
Thornsberry JM, Goodman MM, Doebley J, Kresovich S, Nielsen D,
Buckler ES (2001) Dwarf8 polymorphisms associate with
variation in flowering time. Nat Genetics 314:286–289
Valverde F, Mouradov A, Soppe W, Ravenscroft D, Samach A,
Coupland G (2004) Photoreceptor regulation of constans protein
in photoperiodic flowering. Science 303:1003–1006
Weigel D, Nilsson O (1995) A developmental switch sufficient for
flower initiation in diverse plants. Nature 377(6549):495–500
Wentzell AM, Rowe HC, Hansen BGm Ticconi C, Halkier BA,
Kliebenstein DJ (2007) Linking metabolic QTLs with network
and cis-eQTLs controlling biosynthetic pathways. PLOS Genet-
ics 3:1687–1701
Xue WY, Xing YZ, Weng XY, Zhao Y, Tang WJ, Wang L, Zhou HJ,
Yu SB, Xu CG, Li XH, Zhang QF (2008) Natural variation in
Ghd7 is an important regulator of heading date and yield
potential in rice. Nat Genet 40:761–767
Yadav RS, Hash CT, Bidinger FR, Cavan GP, Howarth CJ (2002)
Quantitative trait loci associated with traits determining grain
and stover yield in pearl millet under terminal drought-stress
conditions. Theor Appl Genet 104(1):67–83
Yadav R, Hash C, Bidinger F, Devos K, Howarth C (2004) Genomic
regions associated with grain yield and aspects of post-flowering
drought tolerance in pearl millet across stress environments and
tester background. Euphytica 136(3):265–277
Yamamoto T, Lin H, Sasaki T, Yano M (2000) Identification of
heading date quantitative trait locus Hd6 and characterization of
its epistatic interactions with Hd2 in rice using advanced
backcross progeny. Genetics 154(2):885–891
Yamasaki M, Tenaillon MI, Bi IV, Schroeder SG, Sanchez-Villeda H,
Doebley JF, Gaut BS, McMullen MD (2005) A large-scale
screen for artificial selection in maize identifies candidate
agronomic loci for domestication and crop improvement. Cell
17:2859–2872
Yano M, Katayose Y, Ashikari M, Yamanouchi U, Monna L, Fuse T,
Baba T, Yamamoto K, Umehara Y, Nagamura Y, Sasaki T
(2000) Hd1, a major photoperiod sensitivity quantitative trait
locus in rice, is closely related to the Arabidopsis flowering time
gene CONSTANS. Plant Cell 12(12):2473–2484
Yano M, Kojima S, Takahashi Y, Lin H, Sasaki T (2001) Genetic
control of flowering time in rice, a short-day plant. Plant Physiol
127(4):1425–1429
Yu SB, Li JX, Xu CG, Tan YF, Li XH, Zhang Q (2002) Identification
of quantitative trait loci and epistatic interactions for plant height
and heading date in rice. Theor Appl Genet 104(4):619–625
Theor Appl Genet (2010) 121:1587–1599 1599
123
Copyright © 2022 FDOKUMEN