HETEROGENEOUS KINETIC MODELING OF THE CATALYTIC CONVERSION OF CYCLOPARAFFINS (Spine title: Kinetic...
24
HETEROGENEOUS KINETIC MODELING OF THE CATALYTIC CONVERSION OF CYCLOPARAFFINS (Spine title: Kinetic Modeling of Catalytic Conversion of Cycloparaffins) (Thesis format: Monograph) by Mustafa N. Al-Sabawi Graduate Program in Engineering Science Department of Chemical & Biochemical Engineering A thesis submitted in partial fulfillment of the requirements for the degree of Doctor of Philosophy The School of Graduate and Postdoctoral Studies The University of Western Ontario London, Ontario, Canada © Mustafa N. Al-Sabawi 2009 PREVIEW
Transcript of HETEROGENEOUS KINETIC MODELING OF THE CATALYTIC CONVERSION OF CYCLOPARAFFINS (Spine title: Kinetic...
HETEROGENEOUS KINETIC MODELING OF THE CATALYTIC CONVERSION OF CYCLOPARAFFINS
(Spine title: Kinetic Modeling of Catalytic Conversion of Cycloparaffins)
(Thesis format: Monograph)
by
Mustafa N. Al-Sabawi
Graduate Program in Engineering Science Department of Chemical & Biochemical Engineering
A thesis submitted in partial fulfillment of the requirements for the degree of
Doctor of Philosophy
The School of Graduate and Postdoctoral Studies The University of Western Ontario
London, Ontario, Canada
© Mustafa N. Al-Sabawi 2009
PREVIEW

1*1 Library and Archives Canada
Published Heritage Branch
395 Wellington Street Ottawa ON K1A0N4 Canada
Bibliotheque et Archives Canada
Direction du Patrimoine de I'edition
395, rue Wellington Ottawa ON K1A0N4 Canada
Your file Votre reference ISBN: 978-0-494-50191-7 Our file Notre reference ISBN: 978-0-494-50191-7
NOTICE: The author has granted a nonexclusive license allowing Library and Archives Canada to reproduce, publish, archive, preserve, conserve, communicate to the public by telecommunication or on the Internet, loan, distribute and sell theses worldwide, for commercial or noncommercial purposes, in microform, paper, electronic and/or any other formats.
AVIS: L'auteur a accorde une licence non exclusive permettant a la Bibliotheque et Archives Canada de reproduire, publier, archiver, sauvegarder, conserver, transmettre au public par telecommunication ou par Plntemet, prefer, distribuer et vendre des theses partout dans le monde, a des fins commerciales ou autres, sur support microforme, papier, electronique et/ou autres formats.
The author retains copyright ownership and moral rights in this thesis. Neither the thesis nor substantial extracts from it may be printed or otherwise reproduced without the author's permission.
L'auteur conserve la propriete du droit d'auteur et des droits moraux qui protege cette these. Ni la these ni des extraits substantiels de celle-ci ne doivent etre imprimes ou autrement reproduits sans son autorisation.
In compliance with the Canadian Privacy Act some supporting forms may have been removed from this thesis.
Conformement a la loi canadienne sur la protection de la vie privee, quelques formulaires secondaires ont ete enleves de cette these.
While these forms may be included in the document page count, their removal does not represent any loss of content from the thesis.
Canada
Bien que ces formulaires aient inclus dans la pagination, il n'y aura aucun contenu manquant.
PREVIEW
THE UNIVERSITY OF WESTERN ONTARIO SCHOOL OF GRADUATE AND POSTDOCTORAL STUDIES
CERTIFICATE OF EXAMINATION
Supervisor
Dr. Hugo de Lasa
Supervisory Committee
Dr. Ajay Ray
Dr. Dimitre Karamanev
Examiners
Dr. Teh Ho
Dr. Hesham El-Naggar
Dr. Ajay Ray
Dr. Amarjeet Bassi
The thesis by
Mustafa Naiem Al-Sabawi
entitled:
Heterogeneous Kinetic Modeling of the Catalytic Conversion of Cycloparaffins
is accepted in partial fulfillment of the requirements for the degree of
Doctor of Philosophy
Date Chair of the Thesis Examination Board
ii
PREVIEW
ABSTRACT
The limited availability of high value light hydrocarbon feedstocks along with the
rise in crude prices has resulted in the international recognition of the vast potential of
Canada's oil sands. With the recent expansion of Canadian bitumen production come,
however, many technical challenges, one of which is the significant presence of
aromatics and cycloparaffins in bitumen-derived feedstocks.
In addition to their negative environmental impact, aromatics limit fluid catalytic
cracking (FCC) feedstock conversion, decrease the yield and quality of valuable products
such as gasoline and middle distillates, increase levels of polyaromatic hydrocarbons
prone to form coke on the catalyst, and ultimately compromise the FCC unit
performance. Although cycloparaffins do not have such negative impacts, they are
precursors of aromatics as they frequently undergo hydrogen transfer reactions. However,
cycloparaffin cracking chemistry involves other competing reactions that are complex
and need much investigation.
This dissertation provides insights and understanding of the fundamentals of the
catalytic cracking of cycloparaffins using carefully selected model compounds such as
methylcyclohexane (MCH) and decalin. Thermal and catalytic cracking of these
cycloparaffins on FCC-type catalysts are carried out using the CREC Riser Simulator
under operating conditions similar to those of the industrial FCC units in terms of
temperature, reaction time, reactant partial pressure and catalyst-to-hydrocarbon ratio.
The crystallite size of the supported zeolites is varied between 0.4 and 0.9 microns, with
both activity and selectivity being monitored. Catalytic conversions ranged between 4 to
16 wt% for MCH and between 8 to 27 wt% for decalin. Reaction pathways of
cycloparaffins are determined, and these include ring-opening, protolytic cracking,
isomerization, hydrogen transfer and transalkylation. The yields and selectivities of over
60 and 140 products, formed during MCH and decalin catalytic conversions respectively,
are reported. Using these data, heterogeneous kinetic models accounting for
intracrystallite molecular transport, adsorption and thermal and catalytic cracking of both
cycloparaffin reactants are established. Results show that undesirable hydrogen transfer
reactions are more pronounced and selectively favoured against other reactions at lower
i i i
PREVIEW
reaction temperatures, while the desirable ring-opening and cracking reactions
predominate at the higher reaction temperatures. Moreover, results of the present work
show that while crystallite size may have an effect on the overall conversion in some
situations, there is a definite effect on the selectivity of products obtained during the
cracking of MCH and decalin and the cracking of MCH in a mixture with co-reactants
such as 1,3,5-triisopropylbenzene.
Keywords: cycloparaffins, naphthenes, fluid catalytic cracking, kinetic modeling, Y-zeolites, diffusion, adsorption, ring-opening, hydrogen transfer, catalyst selectivity
IV
PREVIEW

"Qod' - there is no godSut He - the ^Ever-Living, the Self-suSsistent, 'Eternal Neither
slumber overtakes 'Kim nor sleep. "His is all that is in the heavens and ad that is on
earth. 'Who is there that couCdintercede with 'Him, unless it 6e by His Ceave? He djiows
aCC that Res open before his creation and aCC that is hidden from them, whereas they
cannot attain to aught of His knowledge save that which He witts [them to attain].
His eternal power overspreads the heavens and the earth, and their upholding wearies
Him not. JLndHe is the 9/Lost High, the Supreme (in glory)." (The Hoble Quran, Chapter
2, Verse 255)
v
PREVIEW
To the inquisitive mind ofMaryam, which keeps me on my toes
To the gentle spirit ofYusuf, whose depth I have yet to understand
And to all the other little ones that Sarrah wishes for
vi
PREVIEW

ACKNOWLEDGEMENTS
First and foremost, all praise belongs to God, the Creator and Sustainer of all
things. I am most grateful to God Almighty, the Most Gracious and Most Merciful, for
giving me the strength and capability to complete this work successfully. I acknowledge
that it is only by His will and His mercy that this final product exists. I ask Him to accept
the effort and time put into this thesis for His sake only and to place all of my work on
the balance of good deeds on the Day of Judgment.
It is without doubt that I owe much gratitude to my advisor Dr. Hugo de Lasa for
providing me with the opportunity to work under his supervision on this project. You
were a great model of professionalism, and your guidance and support throughout the
years that I spent completing the Masters and Doctorate programs at UWO are greatly
appreciated and will never be forgotten.
I would like to also thank Mr. Jose Munoz for his assistance in the laboratory.
You were always around to lend me a helping hand, even if you were pre-occupied with
other more important things.
I am very appreciative for the financial support of the Natural Sciences and
Engineering Research Council of Canada (NSERC), which provided me with a Canada
Graduate Scholarship (CGS).
I would like to express my gratitude to the two most important people in the
world, my parents Naiem and Iman, for sacrificing their lives to provide me with
everything that I wished for. You have instilled in me the qualities that have brought me
to where I am today. May God Al-Mighty bless you for the time and effort that you
invested in me since the day you became parents.
"My Lord! Bestow on them your Mercy even as they cherished me in childhood. "
(The Noble Quran, Chapter 17, Verse 24)
Last but definitely not least, I would like to thank my wife Sarrah, God's special
gift to me. Your love, loyalty and sense of humour are what carry me forward through the
obstacles of life. You always put me ahead of yourself and inspire me to reach beyond
the stars.
vii
PREVIEW
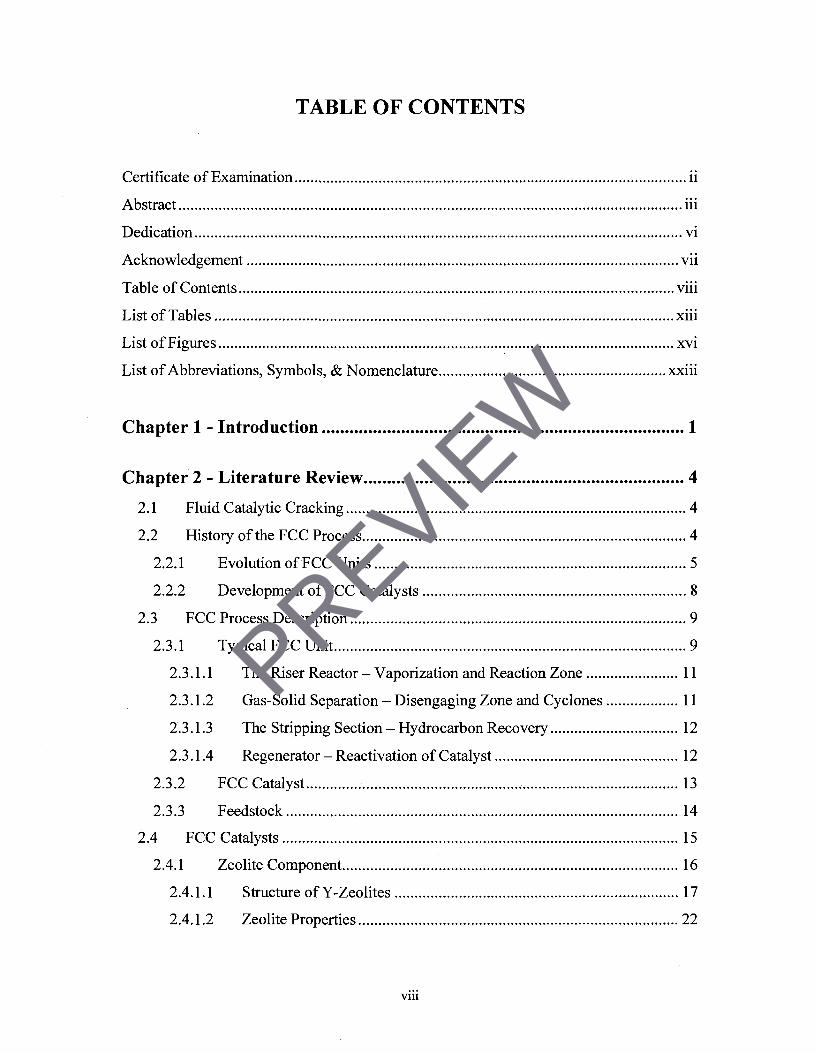
TABLE OF CONTENTS
Certificate of Examination ii
Abstract iii
Dedication vi
Acknowledgement vii
Table of Contents viii
List of Tables xiii
List of Figures xvi
List of Abbreviations, Symbols, & Nomenclature , xxiii
Chapter 1 - Introduction 1
Chapter 2 - Literature Review 4
2.1 Fluid Catalytic Cracking 4
2.2 History of the FCC Process 4
2.2.1 Evolution of FCC Units 5
2.2.2 Development of FCC Catalysts 8
2.3 FCC Process Description 9
2.3.1 Typical FCC Unit 9
2.3.1.1 The Riser Reactor - Vaporization and Reaction Zone 11
2.3.1.2 Gas-Solid Separation - Disengaging Zone and Cyclones 11
2.3.1.3 The Stripping Section - Hydrocarbon Recovery 12
2.3.1.4 Regenerator - Reactivation of Catalyst 12
2.3.2 FCC Catalyst 13
2.3.3 Feedstock 14
2.4 FCC Catalysts 15
2.4.1 Zeolite Component 16
2.4.1.1 Structure of Y-Zeolites 17
2.4.1.2 Zeolite Properties 22
viii
PREVIEW

2.4.2 Matrix Component 22
2.4.3 Filler and Binder Components 23
2.5 FCC Feedstocks 24
2.5.1 Types of Oil Reserves 24
2.5.2 Bitumen-derived Crude Oil 25
2.5.2.1 Canadian Oil Sands 25
2.5.2.2 Bitumen Extraction Techniques 26
2.5.2.3 Upgrading Bitumen to Synthetic Crude Oil 27
2.6 FCCofCycloparaffins 30
2.6.1 Significance of Cycloparaffins 30
2.6.2 Previous Cycloparaffin Studies 31
2.6.2.1 Monocyclic Cycloparaffins 32
2.6.2.2 Bicyclic cycloparaffins 34
2.6.2.3 Drawbacks of Existing Cycloparaffin Studies 37
2.7 Fluid Catalytic Cracking Modeling 38
2.7.1 Role of Reactions in FCC Kinetic Modeling 38
2.7.1.1 Kinetic Models for Model Compounds 38
2.7.1.2 Kinetic Models for Gas Oil Feedstocks 39
2.7.1.3 Drawbacks of Existing Kinetic Modeling Studies 40
2.7.2 Other Phenomena in FCC Modeling 42
2.8 Diffusion in Porous Solids 44
2.8.1 Types of Diffusion 45
2.8.1.1 Bulk (Molecular) Diffusion 46
2.8.1.2 Knudsen Diffusion 46
2.8.1.3 Configurational Diffusion 47
2.8.2 Role of Diffusion in a Catalytic Chemical Reaction 49
2.8.3 Role of Diffusion in Fluid Catalytic Cracking 50
2.8.4 Measuring Diffusion in Zeolites 52
2.9 Adsorption in Porous Solids 54
2.9.1 Types of Adsorption 54
2.9.1.1 Physical Adsorption - Physisorption 54
ix
PREVIEW
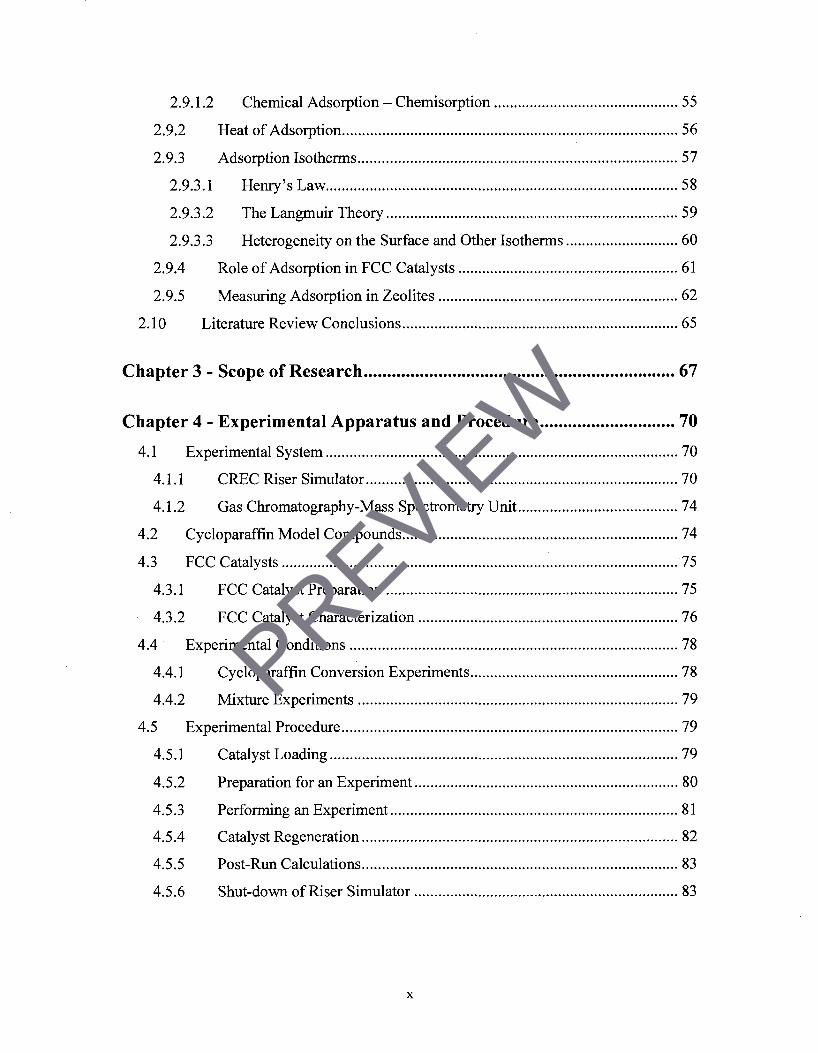
2.9.1.2 Chemical Adsorption - Chemisorption 55
2.9.2 Heat of Adsorption 56
2.9.3 Adsorption Isotherms 57
2.9.3.1 Henry's Law 58
2.9.3.2 The Langmuir Theory 59
2.9.3.3 Heterogeneity on the Surface and Other Isotherms 60
2.9.4 Role of Adsorption in FCC Catalysts 61
2.9.5 Measuring Adsorption in Zeolites 62
2.10 Literature Review Conclusions 65
Chapter 3 - Scope of Research 67
Chapter 4 - Experimental Apparatus and Procedure 70
4.1 Experimental System 70
4.1.1 CREC Riser Simulator 70
4.1.2 Gas Chromatography-Mass Spectrometry Unit 74
4.2 Cycloparaffin Model Compounds 74
4.3 FCC Catalysts 75
4.3.1 FCC Catalyst Preparation 75
4.3.2 FCC Catalyst Characterization 76
4.4 Experimental Conditions 78
4.4.1 Cycloparaffin Conversion Experiments 78
4.4.2 Mixture Experiments 79
4.5 Experimental Procedure 79
4.5.1 Catalyst Loading 79
4.5.2 Preparation for an Experiment 80
4.5.3 Performing an Experiment 81
4.5.4 Catalyst Regeneration 82
4.5.5 Post-Run Calculations 83
4.5.6 Shut-down of Riser Simulator 83
x
PREVIEW

Chapter 5 - Catalytic Cracking and Kinetic Modeling of a Monocyclic
Cycloparaffin 84
5.1 Introduction 84
5.2 MCH Cracking Results 85
5.2.1 Thermal Conversion of MCH 85
5.2.2 Catalytic Conversion of MCH 86
5.2.3 MCH Reaction Mechanisms 89
5.2.4 Hydrocarbon Product Yields 95
5.2.5 Catalyst Selectivity Results - CAT-LC vs. CAT-SC 105
5.3 Heterogeneous Kinetic Modeling of MCH Catalytic Conversion: Diffusion,
Adsorption and Reaction Phenomena 115
5.3.1 Proposed Heterogeneous Kinetic Model 115
5.3.2 Assessment of MCH Adsorption Parameters 125
5.3.3 Evaluation of Intrinsic Kinetic Parameters 132
5.3.3.1 Modeling Results - Thermal Cracking Parameters 132
5.3.3.2 Modeling Results - Catalytic Cracking Parameters 135
5.3.3.3 Model Simulation-Yield Plots 143
5.4 Conclusions 150
Chapter 6 - Catalytic Cracking and Kinetic Modeling of a Bicyclic
Cycloparaffin 152
6.1 Introduction 152
6.2 Decalin Cracking Results 153
6.2.1 Thermal Conversion of Decalin 153
6.2.2 Catalytic Conversion of Decalin 154
6.2.3 Decalin Reaction Mechanisms 157
6.2.4 Hydrocarbon Product Yields 165
6.2.5 Catalyst Selectivity Results - CAT-LC vs. CAT-SC 176
6.3 Heterogeneous Kinetic Modeling of Decalin Catalytic Conversion: Diffusion,
Adsorption and Reaction Phenomena 186
6.3.1 Proposed Heterogeneous Kinetic Model 186
xi
PREVIEW

6.3.2 Assessment of Decalin Adsorption Parameters 193
6.3.3 Evaluation of Intrinsic Kinetic Parameters 197
6.3.3.1 Modeling Results - Thermal Cracking Parameters 197
6.3.3.2 Modeling Results - Catalytic Cracking Parameters 199
6.3.3.3 Model Simulation - Yield Plots 204
6.4 Conclusions 209
Chapter 7 - Investigation of Mass Transport Limitations on
Cycloparaffin Conversion 211
7.1 Introduction 211
7.2 Calculation of Conversion for Mixture Experiments 212
7.3 Influence of Co-reactant on Cycloparaffin Conversion 213
7.3.1 Thermal Cracking - Mixture versus Pure Compound Experiments 214
7.3.2 Catalytic Cracking - Mixture versus Pure Compound Experiments 215
7.4 Mixture Experiments - Catalyst Activity and Selectivity Results 220
7.4.1 1,3,5-TIPB Catalytic Conversion 220
7.4.2 MCH Catalytic Conversion 222
7.5 Conclusions 227
Chapter 8 - Conclusions and Recommendations 229
Bibliography 234
Appendix I - Assessment of Volume 246
Appendix II - Chromatogram Analysis 249
Appendix III - Experimental Results 253
Appendix IV - Calculation of Conversion in Mixture Experiments 297
Appendix V -MATLAB Program for Modeling 299
Curriculum Vitae 307
Xll
PREVIEW
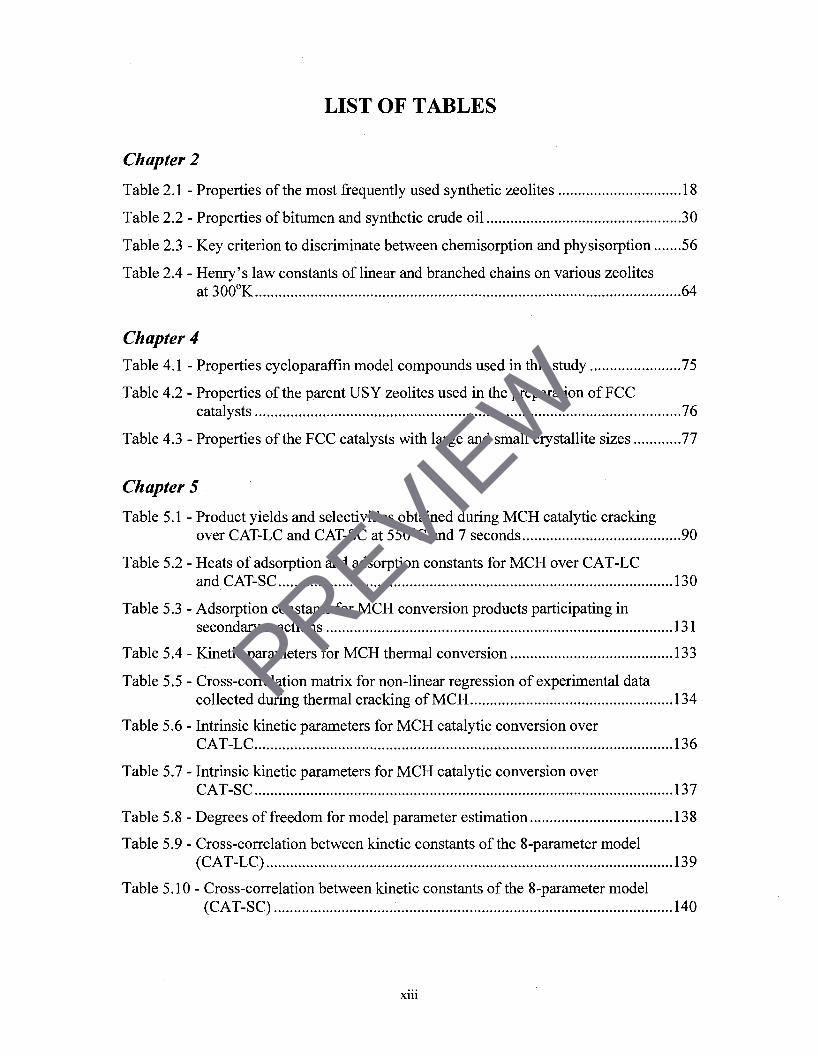
LIST OF TABLES
Chapter 2
Table 2.1 - Properties of the most frequently used synthetic zeolites 18
Table 2.2 - Properties of bitumen and synthetic crude oil 30
Table 2.3 - Key criterion to discriminate between chemisorption and physisorption 56
Table 2.4 - Henry's law constants of linear and branched chains on various zeolites at300°K 64
Chapter 4
Table 4.1 - Properties cycloparaffin model compounds used in this study 75
Table 4.2 - Properties of the parent USY zeolites used in the preparation of FCC catalysts 76
Table 4.3 - Properties of the FCC catalysts with large and small crystallite sizes 77
Chapter 5
Table 5.1 - Product yields and selectivities obtained during MCH catalytic cracking over CAT-LC and CAT-SC at 550°C and 7 seconds 90
Table 5.2 - Heats of adsorption and adsorption constants for MCH over CAT-LC and CAT-SC 130
Table 5.3 - Adsorption constants for MCH conversion products participating in secondary reactions 131
Table 5.4 - Kinetic parameters for MCH thermal conversion 133
Table 5.5 - Cross-correlation matrix for non-linear regression of experimental data collected during thermal cracking of MCH 134
Table 5.6 - Intrinsic kinetic parameters for MCH catalytic conversion over CAT-LC 136
Table 5.7 - Intrinsic kinetic parameters for MCH catalytic conversion over
CAT-SC 137
Table 5.8 - Degrees of freedom for model parameter estimation 138
Table 5.9 - Cross-correlation between kinetic constants of the 8-parameter model (CAT-LC) 139
Table 5.10 - Cross-correlation between kinetic constants of the 8-parameter model (CAT-SC) 140
Xlll
PREVIEW
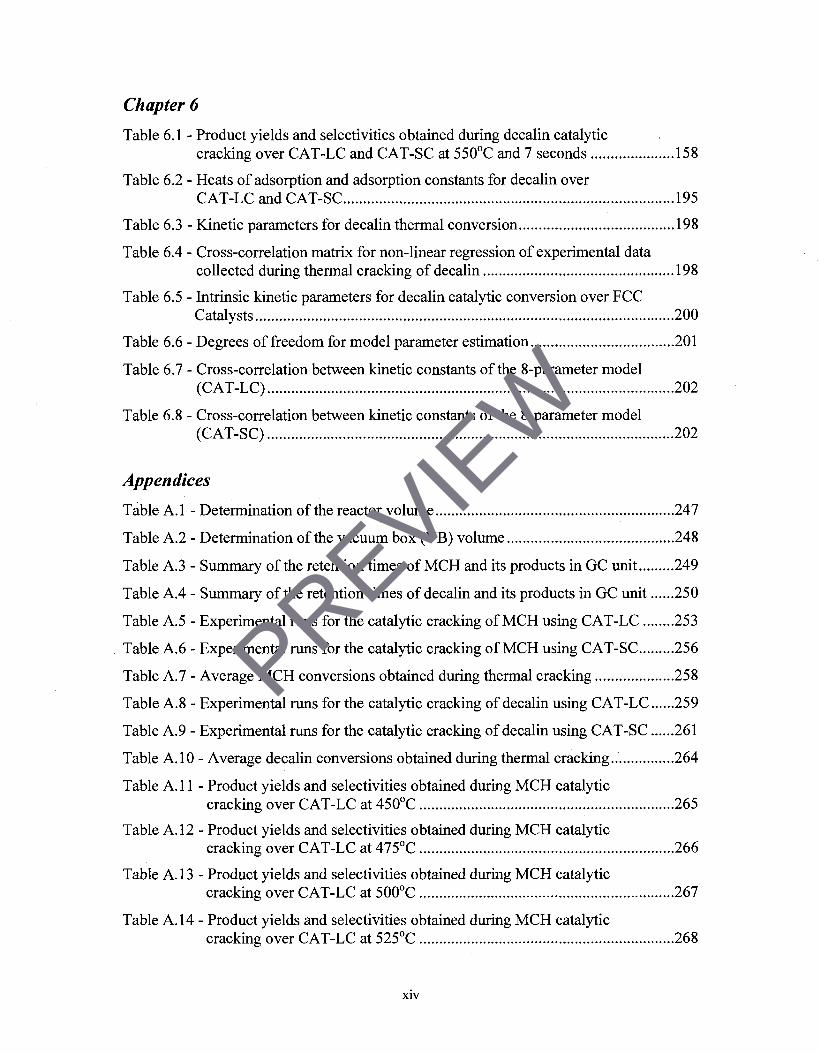
Chapter 6
Table 6.1 - Product yields and selectivities obtained during decalin catalytic cracking over CAT-LC and CAT-SC at 550°C and 7 seconds 158
Table 6.2 - Heats of adsorption and adsorption constants for decalin over CAT-LC and CAT-SC 195
Table 6.3 - Kinetic parameters for decalin thermal conversion 198
Table 6.4 - Cross-correlation matrix for non-linear regression of experimental data collected during thermal cracking of decalin 198
Table 6.5 - Intrinsic kinetic parameters for decalin catalytic conversion over FCC Catalysts 200
Table 6.6 - Degrees of freedom for model parameter estimation 201
Table 6.7 - Cross-correlation between kinetic constants of the 8-parameter model (CAT-LC) 202
Table 6.8 - Cross-correlation between kinetic constants of the 8-parameter model (CAT-SC) 202
Appendices
Table A.l - Determination of the reactor volume 247
Table A.2 - Determination of the vacuum box (VB) volume 248
Table A.3 - Summary of the retention times of MCH and its products in GC unit 249
Table A.4 - Summary of the retention times of decalin and its products in GC unit 250
Table A.5 - Experimental runs for the catalytic cracking of MCH using CAT-LC 253
Table A.6 - Experimental runs for the catalytic cracking of MCH using CAT-SC 256
Table A.7 - Average MCH conversions obtained during thermal cracking 258
Table A.8 - Experimental runs for the catalytic cracking of decalin using CAT-LC 259
Table A.9 - Experimental runs for the catalytic cracking of decalin using CAT-SC 261
Table A. 10 - Average decalin conversions obtained during thermal cracking 264
Table A. 11 - Product yields and selectivities obtained during MCH catalytic cracking over CAT-LC at 450°C 265
Table A. 12 - Product yields and selectivities obtained during MCH catalytic cracking over CAT-LC at 475°C 266
Table A. 13 - Product yields and selectivities obtained during MCH catalytic cracking over CAT-LC at 500°C 267
Table A. 14 - Product yields and selectivities obtained during MCH catalytic cracking over CAT-LC at 525°C 268
xiv
PREVIEW
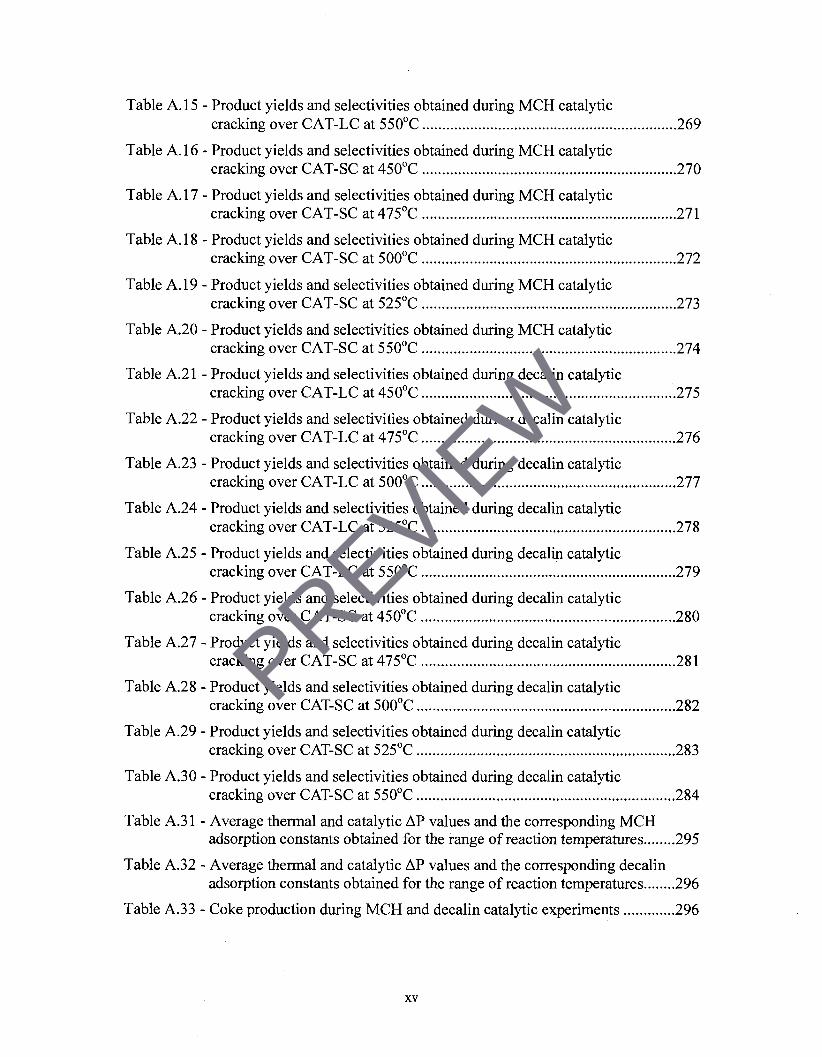
Table A. 15 - Product yields and selectivities obtained during MCH catalytic cracking over CAT-LC at 550°C 269
Table A. 16 - Product yields and selectivities obtained during MCH catalytic cracking over CAT-SC at 450°C 270
Table A. 17 - Product yields and selectivities obtained during MCH catalytic cracking over CAT-SC at 475°C 271
Table A. 18 - Product yields and selectivities obtained during MCH catalytic cracking over CAT-SC at 500°C 272
Table A. 19 - Product yields and selectivities obtained during MCH catalytic cracking over CAT-SC at 525°C 273
Table A.20 - Product yields and selectivities obtained during MCH catalytic cracking over CAT-SC at 550°C 274
Table A.21 - Product yields and selectivities obtained during decalin catalytic cracking over CAT-LC at 450°C 275
Table A.22 - Product yields and selectivities obtained during decalin catalytic cracking over CAT-LC at 475°C 276
Table A.23 - Product yields and selectivities obtained during decalin catalytic cracking over CAT-LC at 500°C 277
Table A.24 - Product yields and selectivities obtained during decalin catalytic cracking over CAT-LC at 525°C 278
Table A.25 - Product yields and selectivities obtained during decalin catalytic cracking over CAT-LC at 550°C 279
Table A.26 - Product yields and selectivities obtained during decalin catalytic cracking over CAT-SC at 450°C 280
Table A.27 - Product yields and selectivities obtained during decalin catalytic cracking over CAT-SC at 475°C 281
Table A.28 - Product yields and selectivities obtained during decalin catalytic cracking over CAT-SC at 500°C 282
Table A.29 - Product yields and selectivities obtained during decalin catalytic cracking over CAT-SC at 525°C 283
Table A.30 - Product yields and selectivities obtained during decalin catalytic cracking over CAT-SC at 550°C 284
Table A.31 - Average thermal and catalytic AP values and the corresponding MCH adsorption constants obtained for the range of reaction temperatures 295
Table A.32 - Average thermal and catalytic AP values and the corresponding decalin adsorption constants obtained for the range of reaction temperatures 296
Table A.3 3 - Coke production during MCH and decalin catalytic experiments 296
XV
PREVIEW

LIST OF FIGURES
Chapter 2
Figure 2.1 - Flow plan of a typical refinery 5
Figure 2.2 - Orthoflow Resid FCC Converter 7
Figure 2.3 - Fluid Catalytic Cracking Unit - Exxon Model IV 7
Figure 2.4 - Flexicracking IIIR Unit 8
Figure 2.5 - A typical fluid catalytic cracking unit 10
Figure 2.6 - Conversion of heavy feedstocks into lighter fractions 14
Figure 2.7 - Configuration of a FCC catalyst pellet showing: the pellet, the dispersed
zeolite crystallites and the zeolite faujasite 16
Figure 2.8 - Composition of atypical FCC catalyst 17
Figure 2.9 - Primary tetrahedral building blocks of zeolites 18
Figure 2.10 - Sodalite cage structure 19
Figure 2.11 - Arrangement of the sodalite cage unit of Zeolite Y 20
Figure 2.12 - Faujasite elementary cell 20
Figure 2.13 - Structure of faujasite zeolite (type Y) 21
Figure 2.14 - Geometry of Y zeolites (faujasites) structure 21
Figure 2.15 - Breakdown of the total world oil reserves 24
Figure 2.16 - Physical and chemical steps involved in the heterogeneously catalyzed
reaction (A -> B) 44
Figure 2.17 - Effect of pore size on diffusivity 48
Figure 2.18 - Effect of pore size on activation energy of diffusion 48
Figure 2.19 - The six main types of gas physisorption isotherms, according to the IUPAC classification 58
Chapter 4
Figure 4.1 - Quarter section view of the CREC Riser Simulator 71
Figure 4.2 - Schematic diagram of the CREC Riser Simulator experimental set-up 71
Figure 4.3 - Typical pressure profile in the CREC Riser Simulator during a catalytic cracking run 73
XVI
PREVIEW
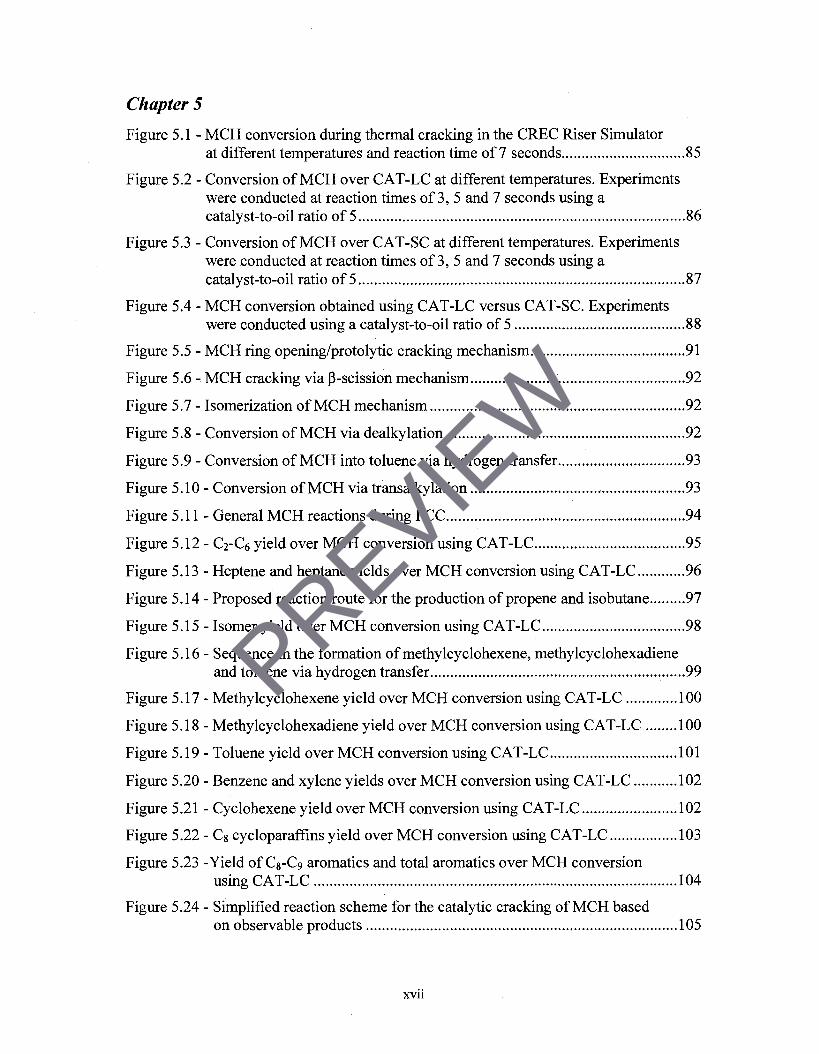
Chapter 5
Figure 5.1 - MCH conversion during thermal cracking in the CREC Riser Simulator at different temperatures and reaction time of 7 seconds 85
Figure 5.2 - Conversion of MCH over CAT-LC at different temperatures. Experiments were conducted at reaction times of 3, 5 and 7 seconds using a catalyst-to-oil ratio of 5 86
Figure 5.3 - Conversion of MCH over CAT-SC at different temperatures. Experiments were conducted at reaction times of 3, 5 and 7 seconds using a catalyst-to-oil ratio of 5 87
Figure 5.4 - MCH conversion obtained using CAT-LC versus CAT-SC. Experiments
were conducted using a catalyst-to-oil ratio of 5 88
Figure 5.5 - MCH ring opening/protolytic cracking mechanism 91
Figure 5.6 - MCH cracking via |3-scission mechanism 92
Figure 5.7 - Isomerization of MCH mechanism 92
Figure 5.8 - Conversion of MCH via dealkylation 92
Figure 5.9 - Conversion of MCH into toluene via hydrogen transfer 93
Figure 5.10 - Conversion of MCH via transalkylation 93
Figure 5.11 - General MCH reactions during FCC 94
Figure 5.12 - C2-C6 yield over MCH conversion using CAT-LC 95
Figure 5.13 - Heptene and heptane yields over MCH conversion using CAT-LC 96
Figure 5.14 - Proposed reaction route for the production of propene and isobutane 97
Figure 5.15 - Isomer yield over MCH conversion using CAT-LC 98
Figure 5.16 - Sequence in the formation of methylcyclohexene, methylcyclohexadiene and toluene via hydrogen transfer 99
Figure 5.17 - Methylcyclohexene yield over MCH conversion using CAT-LC 100
Figure 5.18 - Methylcyclohexadiene yield over MCH conversion using CAT-LC 100
Figure 5.19 - Toluene yield over MCH conversion using CAT-LC 101
Figure 5.20 - Benzene and xylene yields over MCH conversion using CAT-LC 102
Figure 5.21 - Cyclohexene yield over MCH conversion using CAT-LC 102
Figure 5.22 - Cg cycloparaffins yield over MCH conversion using CAT-LC 103
Figure 5.23 -Yield of Cs-C9 aromatics and total aromatics over MCH conversion using CAT-LC 104
Figure 5.24 - Simplified reaction scheme for the catalytic cracking of MCH based on observable products 105
XVll
PREVIEW

Figure 5.25 - Average selectivity of C2-C6 hydrocarbon products at various reaction temperatures for CAT-LC and CAT-SC. Reaction time = 7 seconds 106
Figure 5.26 - Average C2-C7 paraffin selectivity various reaction temperatures for CAT-LC and CAT-SC. Reaction time = 7 seconds 108
Figure 5.27 - Average C2-C7 olefin selectivity at various reaction temperatures for CAT-LC and CAT-SC. Reaction time = 7 seconds.... 109
Figure 5.28 - Average Cg cycloparaffin selectivity various reaction temperatures for CAT-LC and CAT-SC. Reaction time = 7 seconds 110
Figure 5.29 - Average selectivity of Cs and C9 aromatics at various reaction temperatures for CAT-LC and CAT-SC. Reaction time = 7 seconds 110
Figure 5.30 - Average cyclohexene selectivity various reaction temperatures for CAT-LC and CAT-SC. Reaction time = 7 seconds 112
Figure 5.31 - Average toluene selectivity various reaction temperatures for CAT-LC and CAT-SC. Reaction time = 5 seconds 112
Figure 5.32 - Average xylene selectivity various reaction temperatures for CAT-LC and CAT-SC. Reaction time = 7 seconds 113
Figure 5.33 - Average isomer selectivity various reaction temperatures for CAT-LC and CAT-SC. Reaction time = 7 seconds 114
Figure 5.34 - Proposed MCH catalytic conversion model 118
Figure 5.35 - Proposed MCH thermal conversion model 119
Figure 5.36 - Typical pressure profile in the CREC Riser Simulator during MCH thermal and catalytic cracking over Y-zeolite catalyst at 450°C andC/0 = 5 126
Figure 5.37 - Adsorption constants for MCH at different temperatures over CAT-LC and CAT-SC 129
Figure 5.38 - Arrhenius plot for MCH over CAT-LC and CAT-SC 130
Figure 5.39 - Residual distribution for non-linear regression of data obtained during MCH thermal cracking runs in the CREC Riser Simulator 134
Figure 5.40 - Residual distribution for non-linear regression of data obtained using CAT-LC (16-Parameter Model) 141
Figure 5.41 - Residual distribution for non-linear regression of data obtained using CAT-SC (16-Parameter Model) 141
Figure 5.42 - Yields of primary products obtained using CAT-LC at a temperature of 450°C and for a C/O =5 146
Figure 5.43 - Yields of secondary products (aromatics) obtained using CAT-LC at a temperature of 450°C and for a C/O -5 146
Figure 5.44 - Yields of primary products obtained using CAT-SC at a temperature of 450°C and for a C/O =5 147
XVlll
PREVIEW
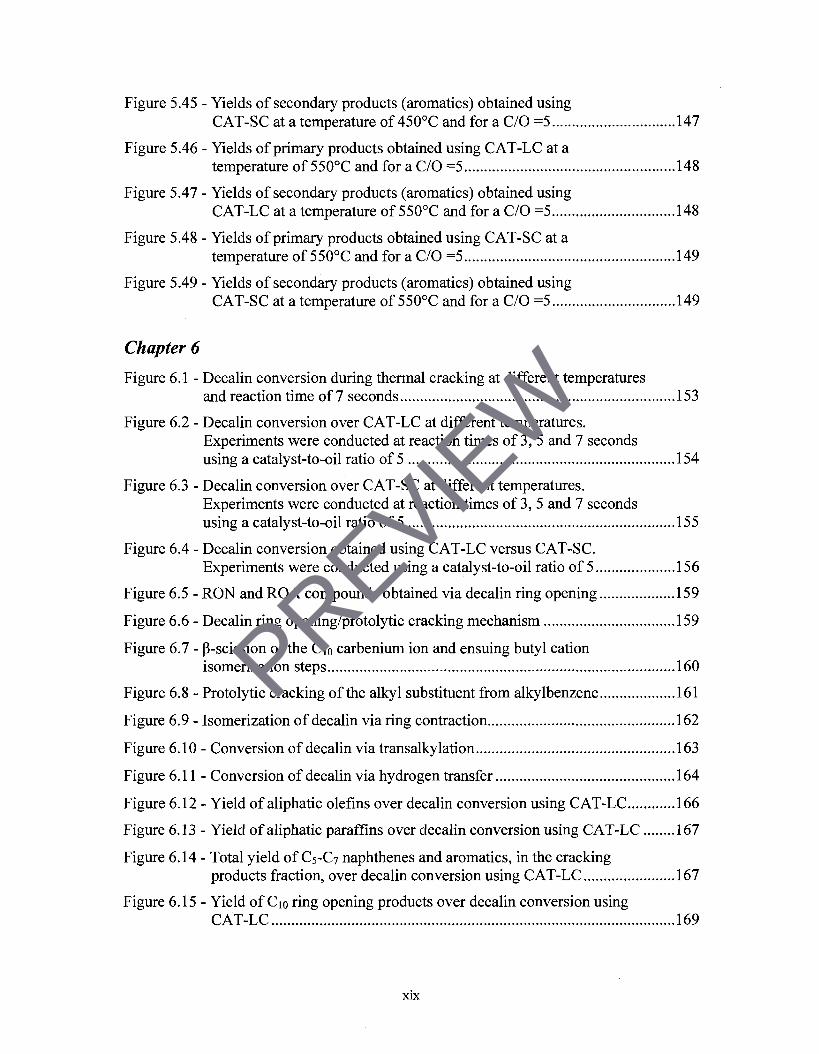
Figure 5.45 - Yields of secondary products (aromatics) obtained using CAT-SC at a temperature of 450°C and for a C/O =5 147
Figure 5.46 - Yields of primary products obtained using CAT-LC at a temperature of 550°C and for a C/O =5 148
Figure 5.47 - Yields of secondary products (aromatics) obtained using CAT-LC at a temperature of 550°C and for a C/O =5 148
Figure 5.48 - Yields of primary products obtained using CAT-SC at a temperature of 550°C and for a C/O =5 149
Figure 5.49 - Yields of secondary products (aromatics) obtained using CAT-SC at a temperature of 550°C and for a C/O =5 149
Chapter 6
Figure 6.1 - Decalin conversion during thermal cracking at different temperatures and reaction time of 7 seconds 153
Figure 6.2 - Decalin conversion over CAT-LC at different temperatures. Experiments were conducted at reaction times of 3, 5 and 7 seconds using a catalyst-to-oil ratio of 5 154
Figure 6.3 - Decalin conversion over CAT-SC at different temperatures. Experiments were conducted at reaction times of 3, 5 and 7 seconds using a catalyst-to-oil ratio of 5 155
Figure 6.4 - Decalin conversion obtained using CAT-LC versus CAT-SC. Experiments were conducted using a catalyst-to-oil ratio of 5 156
Figure 6.5 - RON and ROA compounds obtained via decalin ring opening 159
Figure 6.6 - Decalin ring opening/protolytic cracking mechanism 159
Figure 6.7 - p-scission of the Cio carbenium ion and ensuing butyl cation isomerization steps 160
Figure 6.8 - Protolytic cracking of the alkyl substituent from alkylbenzene 161
Figure 6.9 - Isomerization of decalin via ring contraction 162
Figure 6.10 - Conversion of decalin via transalkylation 163
Figure 6.11 - Conversion of decalin via hydrogen transfer 164
Figure 6.12 - Yield of aliphatic olefins over decalin conversion using CAT-LC 166
Figure 6.13 - Yield of aliphatic paraffins over decalin conversion using CAT-LC 167
Figure 6.14 - Total yield of C5-C7 naphthenes and aromatics, in the cracking products fraction, over decalin conversion using CAT-LC 167
Figure 6.15 - Yield of Cio ring opening products over decalin conversion using CAT-LC 169
xix
PREVIEW

Figure 6.16 - Yield of Cio naphtheno-aromatics over decalin conversion using
CAT-LC 170
Figure 6.17 - Yield of naphthalene over decalin conversion using CAT-LC 171
Figure 6.18 - Yield of bicyclical aromatics having more carbons than the feed over decalin conversion using CAT-LC 171
Figure 6.19 - Yield of naphthenes having more carbons than the feed over decalin conversion using CAT-LC 172
Figure 6.20 - Yield of all products having more carbons than the feed over decalin
conversion using CAT-LC 173
Figure 6.21 - Isomer yield over MCH conversion using CAT-LC 174
Figure 6.22 - Reaction scheme for the catalytic cracking of decalin using USY zeolite catalysts 175
Figure 6.23 - Average selectivity of cracking products at various reaction temperatures for CAT-LC and CAT-SC. Reaction time = 7 seconds 177
Figure 6.24 - Average selectivity of Cio ring opening products at various reaction temperatures for CAT-LC and CAT-SC. Reaction time = 7 seconds 178
Figure 6.25 - Average selectivity of C2-C7 paraffins and isoparaffins at various reaction temperatures for CAT-LC and CAT-SC. Reaction time = 7 seconds 179
Figure 6.26 - Average selectivity of C2-C7 olefins at various reaction temperatures for CAT-LC and CAT-SC. Reaction time = 7 seconds 180
Figure 6.27 - Average selectivity of Cio naphtheno-aromatic products at various reaction temperatures for CAT-LC and CAT-SC. Reaction time = 7 seconds 181
Figure 6.28 - Average selectivity of naphthalene at various reaction temperatures for CAT-LC and CAT-SC. Reaction time = 5 seconds 182
Figure 6.29 - Average selectivity of large C11-C12 aromatic products at various reaction temperatures for CAT-LC and CAT-SC. Reaction time = 7 seconds 183
Figure 6.30 - Average selectivity of large C11-C12 cycloparaffins products at various reaction temperatures for CAT-LC and CAT-SC. Reaction time = 7 seconds 184
Figure 6.31 - Average selectivity isomer products at various reaction temperatures for
CAT-LC and CAT-SC. Reaction time = 7 seconds 185
Figure 6.32 - Proposed decalin catalytic conversion model 187
Figure 6.33 - Proposed decalin thermal conversion model 189
Figure 6.34 - Adsorption constants for decalin at different temperatures over CAT-LC and CAT-SC 194
XX
PREVIEW
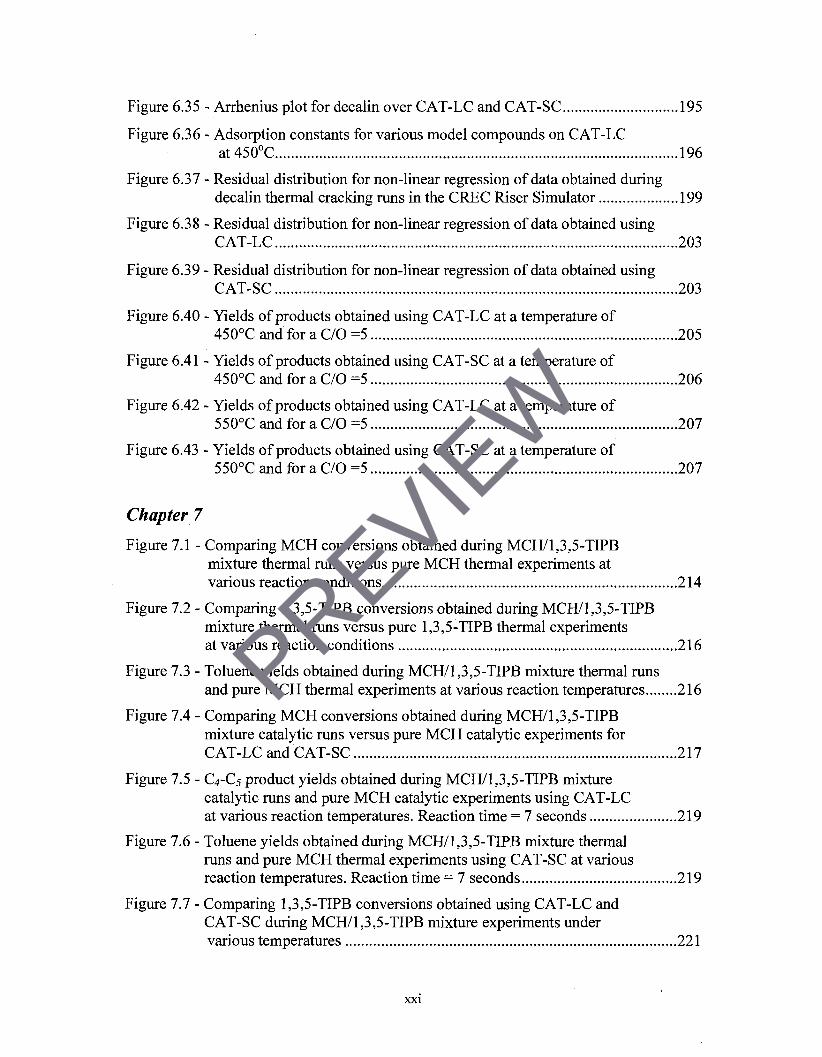
Figure 6.35 - Arrhenius plot for decalin over CAT-LC and CAT-SC 195
Figure 6.36 - Adsorption constants for various model compounds on CAT-LC at450°C 196
Figure 6.37 - Residual distribution for non-linear regression of data obtained during decalin thermal cracking runs in the CREC Riser Simulator 199
Figure 6.38 - Residual distribution for non-linear regression of data obtained using CAT-LC 203
Figure 6.39 - Residual distribution for non-linear regression of data obtained using CAT-SC 203
Figure 6.40 - Yields of products obtained using CAT-LC at a temperature of 450°C and for a C/O =5 205
Figure 6.41 - Yields of products obtained using CAT-SC at a temperature of 450°C and for a C/O =5 206
Figure 6.42 - Yields of products obtained using CAT-LC at a temperature of 550°C and for a C/O =5 207
Figure 6.43 - Yields of products obtained using CAT-SC at a temperature of 550°C and for a C/O =5 207
Chapter 7
Figure 7.1 - Comparing MCH conversions obtained during MCH/1,3,5-TIPB mixture thermal runs versus pure MCH thermal experiments at various reaction conditions 214
Figure 7.2 - Comparing 1,3,5-TIPB conversions obtained during MCH/1,3,5-TIPB mixture thermal runs versus pure 1,3,5-TIPB thermal experiments at various reaction conditions 216
Figure 7.3 - Toluene yields obtained during MCH/1,3,5-TIPB mixture thermal runs and pure MCH thermal experiments at various reaction temperatures 216
Figure 7.4 - Comparing MCH conversions obtained during MCH/1,3,5-TIPB mixture catalytic runs versus pure MCH catalytic experiments for CAT-LC and CAT-SC 217
Figure 7.5 - C4-C5 product yields obtained during MCH/1,3,5-TIPB mixture catalytic runs and pure MCH catalytic experiments using CAT-LC at various reaction temperatures. Reaction time = 7 seconds 219
Figure 7.6 - Toluene yields obtained during MCH/1,3,5-TIPB mixture thermal runs and pure MCH thermal experiments using CAT-SC at various reaction temperatures. Reaction time = 7 seconds 219
Figure 7.7 - Comparing 1,3,5-TIPB conversions obtained using CAT-LC and CAT-SC during MCH/1,3,5-TIPB mixture experiments under various temperatures 221
XXI
PREVIEW

Figure 7.8 - Comparing MCH conversions obtained using CAT-LC and CAT-SC during MCH/1,3,5-TIPB mixture experiments under various temperatures 223
Figure 7.9 - Comparing the difference in MCH conversion (AXMCH) obtained during MCH/1,3,5-TIPB mixture runs versus pure MCH runs using CAT-LC and CAT-SC at various reaction temperatures 224
Figure 7.10 - Toluene selectivity obtained during (a) MCH/1,3,5-TIPB mixture runs (left) and (b) pure MCH runs (right), using CAT-LC and CAT-SC at reaction time = 5 seconds 226
Figure 7.11 - Toluene selectivity obtained during (a) MCH/1,3,5-TIPB mixture runs (left) and (b) pure MCH runs (right), using CAT-LC and CAT-SC at reaction time = 3 seconds 226
Appendices
Figure A.l - Pressure profile recorded during thermal conversion of MCH at 475°C and 7 seconds 285
Figure A.2 - Pressure profile recorded during catalytic conversion of MCH at 550°C and 3 seconds using CAT-LC 285
Figure A.3 - Pressure profile recorded during thermal conversion of MCH at 550°C and 5 seconds 290
Figure A.4 - Pressure profile recorded during catalytic conversion of MCH at 550°C and 7 seconds 290
XXll
PREVIEW

LIST OF ABBREVIATIONS, SYMBOLS & NOMENCLATURE
Nomenclature
At Area of species i in chromatogram
6, Adsorption coefficient of species /
Ci Concentration of lump i in the vapor phase (mol/m )
Ciex Concentration of species i outside the US Y crystallite (mol/m )
Clin Concentration of species i within pore network of the US Y crystallite (mol/m3)
c dp
»eff
DK
A>
ED
E>
ETi
G
H
K
Mass concentration of species i in the vapour phase (kg/m3)
Catalyst pore diameter (m"1)
Effective diffusivity (m2/s)
Knudsen diffusion (m2/s)
Pre-exponential factor for diffusion (m /s)
Activation energy for diffusion (kJ/mol)
Intrinsic activation energy catalytic reaction / (kJ/mol)
Intrinsic activation energy for thermal reaction i (kJ/mol)
Gibbs Free Energy (kJ)
Enthalpy (kJ) 1 ->
Intrinsic kinetic constant for catalytic reaction i (s") or [m /(mol-s)] or [l/(mol-s)]
ki0 Pre-exponential factor for catalytic reaction i (s"1) or [m3/(mol-s)] or
[l/(mol-s)]
kTi Intrinsic kinetic constant for thermal reaction i (s"1)
kTi0 Pre-exponential factor for thermal reaction i (s"1)
Kt Adsorption constant for species i [m3/(kg of catalyst)]
Ki0 Adsorption pre-exponential factor [m3/(kg of catalyst)]
xxiii
PREVIEW