Heterogeneous excess argon and Neoproterozoic heating in the Usagaran Orogen, Tanzania, revealed by...
12
Heterogeneous excess argon and Neoproterozoic heating in the Usagaran Orogen, Tanzania, revealed by single grain 40 Ar/ 39 Ar thermochronology Steven M. Reddy a, * , Alan S. Collins a,1 , Craig Buchan a , Abdul H. Mruma b a Department of Applied Geology, Tectonics Special Research Centre, Curtin University of Technology, P.O. Box U1987, Perth, WA 6845, Australia b Department of Geology, University of Dar-Es-Salaam, P.O. Box 35091, Dar-Es-Salaam, Tanzania Available online 15 September 2004 Abstract Existing tectonic models for the evolution of the Usagaran Orogen place much significance on Palaeoproterozoic K–Ar and Rb–Sr ages. Laser 40 Ar/ 39 Ar data from single mica grains from the Isimani Suite near the western margin of the orogen indicate that excess 40 Ar is common in micas and this casts considerable doubt on tectonic models that are based on previously published K–Ar ages. Biotites lying within a well-developed S 2 foliation (previously constrained at 1999–1991 Ma) yield ages up to 3.3 Ga and con- tain a significant excess 40 Ar component that is variable at an intra- and inter-sample scale. Textural evidence indicates that mus- covite grew or recrystallized after the synkinematic biotites and they also record younger 40 Ar/ 39 Ar ages with individual steps from 524 to 1055 Ma. It is shown that the mica age variation does not reflect different periods of growth but the preferential partitioning of excess 40 Ar into the biotite. The muscovite data also have a component of excess 40 Ar and the youngest muscovite 40 Ar/ 39 Ar date (535.4 ± 2.3 Ma) indicates a maximum age for greenschist facies metamorphism. This date corresponds to thermal activity associ- ated with the East African Orogen. Greenschist facies deformation (D 4 and D 5 ) is interpreted to have been coincident with this ther- mal event and indicates localized tectonic activity associated with Gondwanan amalgamation. The data are also consistent with greenschist facies deformation, metamorphism and deposition of the Usagaran Konse Group being of Neoproterozoic–Early Pal- aeozoic age. These new data therefore preclude a solely Palaeoproterozoic tectonic history for the Usagaran Orogen and indicate a complex thermal-tectonic reworking in the Neoproterozoic–Early Palaeozoic. Ó 2004 Elsevier Ltd. All rights reserved. Keywords: Palaeoproterozoic; Usagaran Orogen; East African Orogen; Ar laser microprobe; 40 Ar/ 39 Ar geochronology; Deformation 1. Introduction The worldÕs oldest known low-medium temperature subduction-related eclogites are found in the Usagaran Orogen of central Tanzania (Mo ¨ller et al., 1995). The existence of these Palaeoproterozoic eclogites indicates the likelihood that subduction zone metamorphism was active as early as 2.0 Ga and the Usagaran Orogen therefore provides an excellent opportunity to study ‘‘modern’’ plate tectonic processes in an ancient oro- genic setting. An understanding of the thermal-tectonic evolution of the Usagaran Orogen has the potential to shed light on the thermal structure and tectonic evolu- tion of Palaeoproterozoic subduction zone environ- ments. It addition it may provide valuable constraints on the thermal evolution of the Earth and the geody- namic birth of ‘‘modern’’ plate tectonics. Numerous studies have highlighted the Palaeoproter- ozoic history of the Usagaran Orogen (Wendt et al., 0899-5362/$ - see front matter Ó 2004 Elsevier Ltd. All rights reserved. doi:10.1016/j.jafrearsci.2004.07.052 * Corresponding author. Tel.: +61 8 9266 4371; fax: +61 8 9266 3153. E-mail address: [email protected] (S.M. Reddy). 1 Present address: Department of Earth and Geographic Sciences, The University of Western Australia, Crawley, WA 6009, Australia. www.elsevier.com/locate/jafrearsci Journal of African Earth Sciences 39 (2004) 165–176
-
Upload
independent -
Category
Documents
-
view
0 -
download
0
Transcript of Heterogeneous excess argon and Neoproterozoic heating in the Usagaran Orogen, Tanzania, revealed by...

www.elsevier.com/locate/jafrearsci
Journal of African Earth Sciences 39 (2004) 165–176
Heterogeneous excess argon and Neoproterozoic heating in theUsagaran Orogen, Tanzania, revealed by single grain
40Ar/39Ar thermochronology
Steven M. Reddy a,*, Alan S. Collins a,1, Craig Buchan a, Abdul H. Mruma b
a Department of Applied Geology, Tectonics Special Research Centre, Curtin University of Technology, P.O. Box U1987, Perth, WA 6845, Australiab Department of Geology, University of Dar-Es-Salaam, P.O. Box 35091, Dar-Es-Salaam, Tanzania
Available online 15 September 2004
Abstract
Existing tectonic models for the evolution of the Usagaran Orogen place much significance on Palaeoproterozoic K–Ar and
Rb–Sr ages. Laser 40Ar/39Ar data from single mica grains from the Isimani Suite near the western margin of the orogen indicate that
excess 40Ar is common in micas and this casts considerable doubt on tectonic models that are based on previously published K–Ar
ages. Biotites lying within a well-developed S2 foliation (previously constrained at 1999–1991Ma) yield ages up to 3.3Ga and con-
tain a significant excess 40Ar component that is variable at an intra- and inter-sample scale. Textural evidence indicates that mus-
covite grew or recrystallized after the synkinematic biotites and they also record younger 40Ar/39Ar ages with individual steps from
524 to 1055Ma. It is shown that the mica age variation does not reflect different periods of growth but the preferential partitioning
of excess 40Ar into the biotite. The muscovite data also have a component of excess 40Ar and the youngest muscovite 40Ar/39Ar date
(535.4 ± 2.3Ma) indicates a maximum age for greenschist facies metamorphism. This date corresponds to thermal activity associ-
ated with the East African Orogen. Greenschist facies deformation (D4 and D5) is interpreted to have been coincident with this ther-
mal event and indicates localized tectonic activity associated with Gondwanan amalgamation. The data are also consistent with
greenschist facies deformation, metamorphism and deposition of the Usagaran Konse Group being of Neoproterozoic–Early Pal-
aeozoic age. These new data therefore preclude a solely Palaeoproterozoic tectonic history for the Usagaran Orogen and indicate a
complex thermal-tectonic reworking in the Neoproterozoic–Early Palaeozoic.
� 2004 Elsevier Ltd. All rights reserved.
Keywords: Palaeoproterozoic; Usagaran Orogen; East African Orogen; Ar laser microprobe; 40Ar/39Ar geochronology; Deformation
1. Introduction
The world�s oldest known low-medium temperature
subduction-related eclogites are found in the Usagaran
Orogen of central Tanzania (Moller et al., 1995). The
existence of these Palaeoproterozoic eclogites indicates
the likelihood that subduction zone metamorphism
0899-5362/$ - see front matter � 2004 Elsevier Ltd. All rights reserved.
doi:10.1016/j.jafrearsci.2004.07.052
* Corresponding author. Tel.: +61 8 9266 4371; fax: +61 8 9266
3153.
E-mail address: [email protected] (S.M. Reddy).1 Present address: Department of Earth and Geographic Sciences,
The University of Western Australia, Crawley, WA 6009, Australia.
was active as early as �2.0Ga and the Usagaran Orogen
therefore provides an excellent opportunity to study
‘‘modern’’ plate tectonic processes in an ancient oro-
genic setting. An understanding of the thermal-tectonic
evolution of the Usagaran Orogen has the potential to
shed light on the thermal structure and tectonic evolu-
tion of Palaeoproterozoic subduction zone environ-ments. It addition it may provide valuable constraints
on the thermal evolution of the Earth and the geody-
namic birth of ‘‘modern’’ plate tectonics.
Numerous studies have highlighted the Palaeoproter-
ozoic history of the Usagaran Orogen (Wendt et al.,

166 S.M. Reddy et al. / Journal of African Earth Sciences 39 (2004) 165–176
1972; Gabert, 1973; Gabert and Wendt, 1974; Reddy
et al., 2003; Moller et al., 1995; Collins et al., 2004)
and provided valuable constraints on the conditions
and timing of high-pressure metamorphism. However,
the Usagaran Orogen is bordered in eastern Tanzania
by the East African Orogen, a Neoproterozoic toCambrian orogenic belt thought to have developed at
an active continental margin (Moller et al., 2000) and
during subsequent amalgamation of Gondwana by col-
lision of the Indian Dharwar craton with East Africa
(Stern, 1994; Dalziel, 1997). The structural and thermal
significance of this collision event in modifying the exist-
ing Palaeoproterozoic architecture and thermal struc-
ture of the Usagaran Belt, although hinted at byseveral previous studies (Wendt et al., 1972; Moller
et al., 1995), is far from clear. Discriminating the super-
imposed effects of the East African Orogen from older
events is critical to correctly interpreting the Palaeopro-
terozoic evolution of the Usagran Orogen.
Reddy et al. (2003) outlined a complex deformation
history for the Isimani Suite exposed in the Great Ruaha
river valley (Fig. 1) and subsequently placed constraintson the timing of high grade deformation and metamor-
phism (Collins et al., 2004). This study presents prelim-
inary laser microprobe 40Ar/39Ar data from muscovites
and biotite in an attempt to place temporal constraints
on the lower grade parts of this deformation history.
In so doing we assess both the potential problem of ex-
cess 40Ar in Usagaran high-pressure metamorphic min-
erals and whether existing K–Ar data from theUsagaran Orogen (Wendt et al., 1972) could be affected
by an excess 40Ar component. The role of Neoprotero-
zoic metamorphism and accompanying deformation
associated with an East African Orogen overprint of
the Usagaran Orogen is also addressed. Finally the mica
data is used within a regional context to speculate on the
stratigraphic age of Usagaran volcano-sedimentary
cover sequences (the Konse Group) and is comparedto data collected in previous studies from similar rocks
of the Ubendian Orogen further west.
Fig. 1. Location of the Usagaran Orogen and its relationship to the EAO a
Tan = Lake Tanganyika.
2. Geological background and geochronological con-
straints
The Usagaran Orogen of central Tanzania is a Palaeo-
proterozoic orogenic belt that lies directly east of the
Late Archaean Tanzanian craton (Fig. 1). It is subdi-vided into two major litho-tectonic units; the Konse
Group and the Isimani Suite (Fig. 2). The Konse Group
(Meinhold, 1970; Mruma, 1989, 1995), formerly the
Konse Series (Whittingham, 1959; Harpum, 1970),
comprises a stratigraphic succession of sedimentary and
volcanic formations considered to have been deposited
in the Palaeoproterozoic and subsequently metamor-
phosed at greenschist facies (Meinhold, 1970; Mruma,1989) (Fig. 2). Locally the Konse Group lies uncom-
formably on deformed rocks of the Isimani Suite
(Whittingham, 1959; Mruma, 1989), indicating its
younger age. However, this contact is commonly re-
worked as a zone of younger localized deformation
(Reddy et al., 2003).
The Isimani Suite (Mruma, 1989), previously referred
to as the ‘‘Usagaran highly metamorphosed rocks’’(Whittingham, 1959; Harpum, 1970) lies to the east of
the Konse Group and comprises numerous different
rock types that record a range of different metamorphic
assemblages from eclogite (750–800 �C and �18kbar;
Moller et al., 1995) through granulite-, amphibolite-
and greenschist-facies (Mruma, 1989; Reddy et al.,
2003). In part this range reflects variable degrees of ret-
rograde synkinematic recrystallization (Reddy et al.,2003), but may also reflect varying metamorphic condi-
tions within different parts of the suite.
Complex deformation within the Isimani Suite of the
northern Usagaran Orogen can be described in terms of
five events (Reddy et al., 2003). The most important of
these (D2) took place at amphibolite facies conditions
and resulted in the accumulation of pervasive high strain
deformation and mylonite formation throughout all ofthe exposed Isimani Suite in the Great Ruaha river sec-
tion (Fig. 2). This D2 deformation overprints high-pres-
nd the Ubendian Orogen. The box marks the boundaries of Fig. 2. L.

Fig. 2. Geological map of part of the Usagaran Orogen, Tanzania. Map and lithological subdivisions are after Mruma (1989) and Whittingham
(1959). Ifwambo = Ifwambo Thrust, identified and named in Mruma (1989). Yalumba Hill, contains well preserved eclogite-facies assemblages
(Moller et al., 1995).
S.M. Reddy et al. / Journal of African Earth Sciences 39 (2004) 165–176 167
sure D1 deformation and has been interpreted to reflect
strain localization and kinematic partitioning during
sinistral transpression (Reddy et al., 2003). Younger
greenschist facies shear zones with both extensional
(D4) and thrust (D5) geometries cut the Isimani Suite,
commonly marking the boundaries of D2 structural do-mains, and also thrust the Isimani Suite over the Konse
Group (Reddy et al., 2003).
Geochronological and isotopic data constrain the age
of protolith formation, deformation and metamorphism
within the Usagaran Orogen. Nd(TDM) model ages of
2.5–3.1Ga (Maboko and Nakamura, 1996; Moller
et al., 1998; Maboko, 2000) and Pb–Pb feldspar data
(Moller et al., 1998) indicate considerable Archaeanmaterial and little Palaeoproterozoic juvenile material
within the Usagaran gneisses. Sensitive high resolution
ion microprobe (SHRIMP) U–Pb ages of 2705 ± 11
and 2698 ± 15Ma from zircon cores, interpreted to date
the timing of igneous crystallization of some of the Isi-
mani protoliths also indicate the presence of Late
Archaean material (Reddy et al., 2003) and indicate a
protolith that on temporal grounds appears similar tothe Tanzanian craton (Maboko, 2000; Reddy et al.,
2003).
Eclogite facies metamorphic conditions of 750 �C and
18kbar have been dated at �2000Ma using 207Pb/206Pb
monazite and titanite data (Moller et al., 1995) and more
recently SHRIMPU–Pb zircon ages (Collins et al., 2004).
An amphibolite facies overprint older than 1991 ± 2Ma
has been constrained by SHRIMP 207Pb/206Pb dating ofzircons from a pegmatite that cuts high strain amphibo-
lite facies fabrics (Collins et al., 2004). These data show
that previously published younger Rb–Sr ages from
Usagaran gneisses (e.g. Wendt et al., 1972) reflect distur-
bance of Sr after original crystallization.
The Usagaran Orogen contains a series of post-tec-
tonic granites, some of which have been dated by whole
rock Rb/Sr and SHRIMP U/Pb zircon techniques. Post-
kinematic granites in the Isimani Suite yield a whole-rock Rb/Sr age of 1845 ± 110Ma (MSWD = 8.4,
recalculated from Wendt et al. (1972) using the decay
constant of (Steiger and Jager, 1977)) and a SHRIMP207Pb/206Pb crystallization age of 1877 ± 7Ma (Reddy
et al., 2003), while post-kinematic granites cutting the
Ndembera Group yield a Rb/Sr date of 1787 ± 91Ma
(MSWD = 13, recalculated from Wendt et al. (1972)
using the decay constant of Steiger and Jager (1977)).These data can be interpreted to indicate that the
thermal-tectonic history for the Usagaran Orogen has
been largely restricted to the Palaeoproterozoic. How-
ever, Rb–Sr and K–Ar data from biotite sampled
from throughout the region span a range of ages with
a minimum of �450Ma (Wendt et al., 1972; Gabert
and Wendt, 1974; Priem et al., 1979). Reworking
of Tanzanian crust by the East African Orogen is datedin Tanzania at 610–655Ma, (Moller et al., 2000;
Muhungo et al., 2001) and the observed variation in
biotite ages has been interpreted to reflect thermal
resetting associated with the development of the East
African Orogen to the east of the Usagaran Orogen
(Wendt et al., 1972; Gabert, 1973; Priem et al., 1979).
The thermal boundary recorded by these age variations
has been used by previous workers to delineate the west-ern margin of the East African Orogen in this region
(Fig. 1) (Stern, 1994; Shackleton, 1996; Boven et al.,
1999).
168 S.M. Reddy et al. / Journal of African Earth Sciences 39 (2004) 165–176
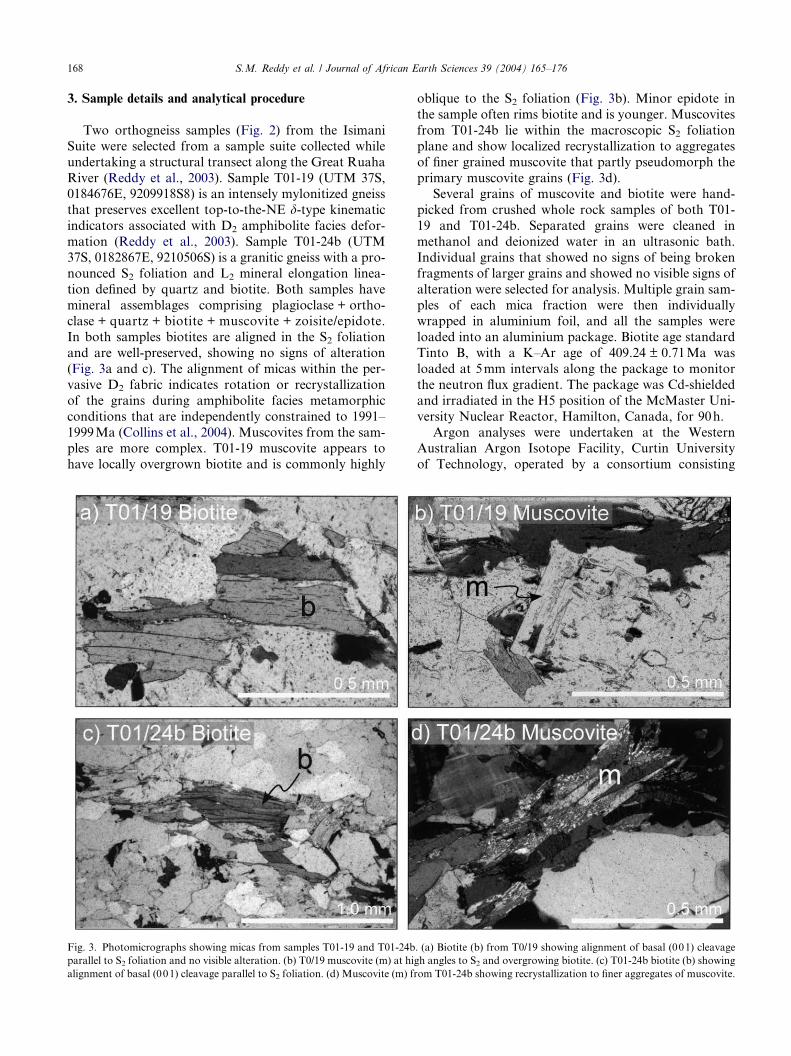
3. Sample details and analytical procedure
Two orthogneiss samples (Fig. 2) from the Isimani
Suite were selected from a sample suite collected while
undertaking a structural transect along the Great Ruaha
River (Reddy et al., 2003). Sample T01-19 (UTM 37S,0184676E, 9209918S8) is an intensely mylonitized gneiss
that preserves excellent top-to-the-NE d-type kinematic
indicators associated with D2 amphibolite facies defor-
mation (Reddy et al., 2003). Sample T01-24b (UTM
37S, 0182867E, 9210506S) is a granitic gneiss with a pro-
nounced S2 foliation and L2 mineral elongation linea-
tion defined by quartz and biotite. Both samples have
mineral assemblages comprising plagioclase + ortho-clase + quartz + biotite + muscovite + zoisite/epidote.
In both samples biotites are aligned in the S2 foliation
and are well-preserved, showing no signs of alteration
(Fig. 3a and c). The alignment of micas within the per-
vasive D2 fabric indicates rotation or recrystallization
of the grains during amphibolite facies metamorphic
conditions that are independently constrained to 1991–
1999Ma (Collins et al., 2004). Muscovites from the sam-ples are more complex. T01-19 muscovite appears to
have locally overgrown biotite and is commonly highly
Fig. 3. Photomicrographs showing micas from samples T01-19 and T01-24b
parallel to S2 foliation and no visible alteration. (b) T0/19 muscovite (m) at hi
alignment of basal (001) cleavage parallel to S2 foliation. (d) Muscovite (m) fr
oblique to the S2 foliation (Fig. 3b). Minor epidote in
the sample often rims biotite and is younger. Muscovites
from T01-24b lie within the macroscopic S2 foliation
plane and show localized recrystallization to aggregates
of finer grained muscovite that partly pseudomorph the
primary muscovite grains (Fig. 3d).Several grains of muscovite and biotite were hand-
picked from crushed whole rock samples of both T01-
19 and T01-24b. Separated grains were cleaned in
methanol and deionized water in an ultrasonic bath.
Individual grains that showed no signs of being broken
fragments of larger grains and showed no visible signs of
alteration were selected for analysis. Multiple grain sam-
ples of each mica fraction were then individuallywrapped in aluminium foil, and all the samples were
loaded into an aluminium package. Biotite age standard
Tinto B, with a K–Ar age of 409.24 ± 0.71Ma was
loaded at 5mm intervals along the package to monitor
the neutron flux gradient. The package was Cd-shielded
and irradiated in the H5 position of the McMaster Uni-
versity Nuclear Reactor, Hamilton, Canada, for 90h.
Argon analyses were undertaken at the WesternAustralian Argon Isotope Facility, Curtin University
of Technology, operated by a consortium consisting
. (a) Biotite (b) from T0/19 showing alignment of basal (001) cleavage
gh angles to S2 and overgrowing biotite. (c) T01-24b biotite (b) showing
om T01-24b showing recrystallization to finer aggregates of muscovite.

Table 1
Ar isotopic data obtained by infra-red single grain laser step-heating of muscovites and biotites from orthogneiss samples T01-19 and T01-24b from the Isimani Suite, Usagaran Orogen
Sample 40Ar/39Ar +� 38Ar/39Ar +� 37Ar/39Ar +� 36Ar/39Ar +� 39Ar (cm3) +� Cumulative % 39Ar Atoms. Ar% 40Ar*/39Ar +� Age (Ma) +� (1r)
T01-19biotite: J value = 0.018579 ± 0.000093
T01-19 bte grain 1.1 69.022 0.043 0.01439 0.00001 0.00346 0.00085 0.00104 – 1.30E�11 8.13E�15 64.2 0.44 68.715 0.043 1484 5
T01-19 bte grain 1.2 70.019 0.058 0.01496 0.00001 – – 0.00121 – 6.73E�12 5.42E�15 97.4 0.51 69.662 0.058 1498 5
T01-19 bte grain 1.3 67.665 0.120 0.00535 0.00000 – – – – 5.23E�13 0.00E+00 100.0 0.00 67.665 0.120 1469 5
T01-19 bte grain 2.1 63.366 0.050 0.01409 0.00001 0.00429 0.00000 0.00798 0.00001 1.05E�11 8.13E�15 7.7 3.72 61.008 0.048 1367 5
T01-19 bte grain 2.2 62.296 0.026 0.01307 0.00006 0.00274 0.00021 0.00131 0.00005 5.37E�11 2.17E�14 46.9 0.62 61.908 0.030 1381 5
T01-19 bte grain 2.3 62.171 0.016 0.01311 0.00008 0.00345 0.00044 0.00053 0.00008 3.60E�11 5.59E�15 73.3 0.25 62.015 0.027 1393 5
T01-19 bte grain 2.4 61.990 0.006 0.01322 0.00016 0.00205 0.00000 – – 1.65E�11 0.00E+00 85.3 0.00 61.990 0.006 1382 5
T01-19 bte grain 2.5 62.597 0.026 0.01326 0.00001 0.00564 0.00056 0.00054 – 2.00E�11 8.13E�15 100.0 0.25 62.438 0.026 1389 5
T01-19 bte grain 3.1 72.772 0.026 0.01462 0.00000 0.00672 0.00044 0.00525 – 2.53E�11 8.13E�15 29.9 2.13 71.219 0.025 1521 5
T01-19 bte grain 3.2 72.063 0.017 0.01306 0.00000 0.00236 – – – 1.46E�11 2.71E�15 47.1 0.00 72.063 0.017 1533 5
T01-19 bte grain 3.3 72.293 0.041 0.01383 0.00001 0.00565 – 0.00036 – 4.47E�11 2.44E�14 100.0 0.15 72.186 0.041 1535 5
T01-19 muscovite: J value = 0.018592 ± 0.000093
T01-19 ms grain 1.1 22.058 0.014 0.01310 0.00003 0.10402 0.00041 0.00062 0.00001 1.20E�10 7.32E�14 66.6 0.83 21.875 0.014 616 3
T01-19 ms grain 1.2 21.905 0.014 0.01335 0.00005 0.28198 0.00122 0.00041 0.00005 2.55E�11 1.63E�14 80.7 0.55 21.785 0.021 613 3
T01-19 ms grain 1.3 22.530 0.016 0.01303 0.00015 0.06878 0.00163 – – 2.01E�11 1.36E�14 91.9 0.00 22.575 0.016 632 3
T01-19 ms grain 1.4 24.216 0.020 0.01138 0.00021 0.11030 0.00528 0.00039 – 6.52E�12 3.03E�15 95.5 0.47 24.101 0.020 668 3
T01-19 ms grain 1.5 29.551 0.021 0.01256 0.00001 0.08003 0.00136 0.00099 – 8.02E�12 5.42E�15 100.0 0.99 29.257 0.020 784 3
T01-19 ms grain 2.1 18.663 0.008 0.01307 0.00004 0.00114 0.00000 0.00175 – 7.75E�11 3.25E�14 36.4 2.77 18.146 0.008 524 2
T01-19 ms grain 2.2 19.420 0.009 0.01275 0.00009 0.00188 0.00037 0.00304 – 2.94E�11 1.36E�14 50.2 4.63 18.522 0.009 534 2
T01-19 ms grain 2.3 19.124 0.006 0.01289 0.00005 0.00103 0.00000 0.00162 5.36E�11 1.80E�14 75.4 2.50 18.647 0.006 537 2
T01-19 ms grain 2.4 18.800 0.010 0.01250 0.00006 0.00323 0.00045 0.00062 0.00006 2.41E�11 1.08E�14 86.7 0.97 18.617 0.019 536 2
T01-19 ms grain 2.5 18.645 0.007 0.01245 0.00005 0.00157 0.00039 0.00034 0.00005 2.82E�11 5.42E�15 100.0 0.53 18.546 0.016 534 2
T01-24b biotite: J value = 0.018579 ± 0.000093
T01-24b bte grain 1.1 266.982 0.299 0.01881 0.00002 0.01606 0.00002 0.00594 0.00001 7.29E�12 8.13E�15 16.9 0.66 265.225 0.297 3208 8
T01-24b bte grain 1.2 288.839 0.189 0.01481 0.00001 0.02204 0.00001 0.00254 – 8.50E�12 5.42E�15 36.5 0.26 288.087 0.188 3333 8
T01-24b bte grain 1.3 282.350 0.558 0.01518 0.00047 0.01845 0.02219 0.00189 0.00095 2.86E�12 5.59E�15 43.2 0.20 281.791 0.624 3300 8
T01-24b bte grain 1.4 287.861 0.191 0.01547 0.00010 0.01279 0.00477 0.00224 0.00020 1.33E�11 8.24E�15 73.9 0.23 287.199 0.200 3329 8
T01-24b bte grain 1.5 273.170 1.085 0.02196 0.00008 0.06136 0.01510 – – 7.65E�13 2.71E�15 75.7 0.00 273.175 1.508 3253 11
T01-24b bte grain 1.6 284.985 0.152 0.01465 0.00001 0.01117 0.00155 0.00077 0.00036 1.05E�11 5.42E�15 100.0 0.08 284.757 0.186 3316 8
T01-24b bte grain 2.1 327.508 0.730 0.02053 0.00005 0.00861 0.01895 0.00298 0.00222 1.36E�12 3.03E�15 8.3 0.27 326.627 0.981 3526 9
T01-24b bte grain 2.2 361.214 0.379 0.01501 0.00050 0.00217 0.00478 0.00025 0.00025 5.41E�12 5.59E�15 41.2 0.02 361.140 0.387 3683 8
T01-24b bte grain 2.3 373.727 0.408 0.01231 0.00001 0.07049 0.00462 – – 2.50E�12 2.71E�15 56.5 0.00 373.732 0.408 3736 8
T01-24b bte grain 2.4 371.301 0.568 0.01415 0.00002 0.00000 0.00000 – – 1.78E�12 2.71E�15 67.3 0.00 371.301 0.568 3726 8
T01-24b bte grain 2.5 370.337 0.293 0.01455 0.00001 0.01020 0.00001 – – 3.46E�12 2.71E�15 88.4 0.00 370.338 0.293 3722 8
T01-24b bte grain 2.6 371.699 1.586 0.01320 0.00006 0.00617 0.00003 – – 1.91E�12 8.13E�15 100.0 0.00 371.700 1.586 3728 10
T01-24b muscovite: J value = 0.018566 ± 0.000093
T01-24b ms grain 1.1 42.812 0.048 0.01276 0.00043 – – – – 3.18E�12 2.71E�15 2.6 0.00 42.812 0.048 1055 4
T01-24b ms grain 1.2 33.229 0.012 0.01247 0.00004 0.00232 0.00015 0.00015 7.42E�11 2.44E�14 62.2 0.13 33.186 0.011 866 3
T01-24b ms grain 1.3 31.549 0.052 0.01085 0.00012 0.00702 0.00197 – – 1.15E�11 1.90E�14 71.4 0.00 31.550 0.052 832 4
T01-24b ms grain 1.4 31.998 0.035 0.01221 0.00007 – 0.00000 – – 2.00E�11 2.17E�14 87.6 0.00 31.998 0.035 841 3
T01-24b ms grain 1.5 30.421 0.015 0.01303 0.00018 0.00075 0.00073 – – 1.55E�11 2.71E�15 100.0 0.00 30.421 0.054 808 3
T01-24b ms grain 2.1 41.721 0.040 0.01217 0.00001 0.01404 0.00279 0.00141 0.00047 5.75E�12 5.42E�15 20.8 1.00 41.304 0.145 1027 5
T01-24b ms grain 2.2 36.259 0.025 0.01251 0.00001 0.00836 0.00137 0.00033 0.00033 8.28E�12 5.42E�15 50.7 0.27 36.163 0.100 927 4
T01-24b ms grain 2.3 34.122 0.014 0.01283 0.00014 0.00594 0.00117 – – 9.71E�12 3.03E�15 85.8 0.00 34.122 0.084 885 4
T01-24b ms grain 2.4 34.694 0.052 0.01387 0.00034 0.00587 0.00289 0.00069 0.00069 3.94E�12 5.59E�15 100.0 0.59 34.491 0.210 893 6
See Fig. 2 for sample locations.
S.M
.Reddyet
al./JournalofAfrica
nEarth
Scien
ces39(2004)165–176
169

170 S.M. Reddy et al. / Journal of African Earth Sciences 39 (2004) 165–176
of Curtin University and the University of Western Aus-
tralia. Argon data were collected by infra-red laser step-
heating of single grains. Irradiated mineral samples were
loaded into an ultra-high vacuum laser chamber with a
Kovar viewport and baked to 120 �C overnight to re-
move adsorbed atmospheric argon from the samplesand chamber walls. A 110W spectron laser systems con-
tinuous-wave neodymium–yttrium–aluminium-garnet
(CW–Nd–YAG) laser (k = 1064nm), fitted with a
TEM00 aperture, was used to laser step-heat the mineral
sample at increasing laser power (9.9–10.1A). The laser
was fired through a Merchantek computer-controlled
X–Y–Z sample chamber stage and microscope system,
Fig. 4. Ar laser step heating profiles on single grains. (a) Three biotite grain
grains from T01-24b, (d) two muscovite grains from T01-24b. Data are prese
correspond to greyscales for the different grains shown by the age data.
fitted with a high-resolution CCD camera, 6· computer
controlled zoom, high magnification objective lens, and
two light sources for sample illumination. Prior to anal-
ysis, the dimensions of each grain were measured using
the calibrated stage system.
The gases released by laser heating were getteredusing 3 SAES AP10 getter pumps to remove all active
gases (CO2, H2O, H2, N2 ,O2, CH4 ). The remaining no-
ble gases were equilibrated into a high sensitivity mass
spectrometer (MAP 215-50), operated at a mass-resolu-
tion of 600, and fitted with a Balzers SEV 217 multiplier.
The automated extraction and data acquisition system
was computer controlled, using a Lab View program.
s from T01-19, (b) two muscovite grains from T01-19, (c) two biotite
nted in Table 1. Greyscale variations for 38Ar/39Ar and 37Ar/39Ar data

S.M. Reddy et al. / Journal of African Earth Sciences 39 (2004) 165–176 171
Mean 5 minute extraction system blanks obtained dur-
ing data collection were 4.6 · 10� 12, 7.7 · 10�15, 5 ·10�15,1.1 · 10�13, and 3 · 10�14 cm3 at standard temper-
ature and pressure for 40Ar, 39Ar, 38Ar, 37Ar, and 36Ar
respectively. Data were corrected for mass spectrometer
discrimination and nuclear interference reactions.40Ar/39Ar ages were calculated using the decay constant
quoted by Steiger and Jager (1977). J values and 1r er-
rors are noted in Table 1. Errors shown in step-heating
profiles (Fig. 4) represent analytical errors and do not
include J value uncertainties.
4. 40Ar/39Ar results
Muscovite and biotite argon data from two samples
less than 2km apart (Fig. 2) are reported in Table 1
and plotted with respect to cumulative 39Ar% in (Fig.
4). For each sample, age (calculated from 40Ar/39Ar),37Ar/39Ar and 38Ar/39Ar are plotted for each sample.
The latter two ratios are related to Ca/K and Cl/K ratios
respectively (McDougall and Harrison, 1999). Eachstep-heating profile represents the analysis of a single
mica grain.
Biotite data from individual grains of T01-19 yield
relatively flat apparent age profiles with individual step
ages increasing with cumulative 39Ar% (Fig. 4a). How-
ever apparent ages from different single grains vary by
up to 160Ma and range from �1370 to 1530Ma. This
variation does not correlate with measured grain diam-eters (Fig. 4a). None of the grains yield statistically valid
plateaux. However, if J value errors (Table 1) are in-
cluded in the plateaux calculations, then grain 2 yields
a plateau age of 1383.9 ± 2.4Ma (1r) and grain 3 gives
a plateau age of 1529 ± 3Ma (1r). These plateaux in-
clude all but step 1 and 92.3% of 39Ar (MSWD = 0.58)
for grain 2 and 100% of the 39Ar of grain 3
(MSWD = 2.1). 38Ar/39Ar data from the same grainsare low and show flat spectra of �0.014 and indicate lit-
tle variation in Cl both within grains and between grains
(Fig. 4a). Small values of 37Ar/39Ar (Fig. 4a) indicate no
significant contamination by Ca-bearing phases. In most
cases the 37Ar/39Ar step pattern mirrors that shown by
the age spectra. However, the first step, which correlates
with lower apparent age, always yields a higher37Ar/39Ar ratio than the second step. This appears toindicate a small compositional control on the first step
and a very minor component of lower apparent age
material within the biotite grain.
A similar pattern of within-grain apparent ages pro-
files is seen in biotite grains from T01-24b (Fig. 4c.)
However, individual grains yield significantly older
apparent ages than T01-19 biotites, ranging from
�3200 to 3740Ma (Fig. 4c). Again, individual grainsyield different ages (Fig. 4c). No plateaux were obtained
when J value errors were excluded from the plateaux
calculations. However, including J value uncertainty
gave a plateau (steps 3–6) for grain 2 of 3728.2 ±
4.3Ma (1r), which includes 58.8% of the 39Ar and an
MSWD of 0.56. In both analysed grains the first step
yields ages younger than subsequent steps. Values for37Ar/39Ar and 38Ar/39Ar are low (Fig. 4c) and are similarto those in T01-19 biotites. However, the relationship
between apparent age and both 37Ar/39Ar and 38Ar/39Ar
are complex. This complexity is seen in the relationship
of apparent age highs and lows with corresponding steps
in the 37Ar/39Ar and 38Ar/39Ar profiles. In some cases
(e.g. grain 1, step 5) apparent age lows correspond to
highs in both 37Ar/39Ar and 38Ar/39Ar (Fig. 4c). In grain
2 (step 3) an apparent age high correlates with a high in37Ar/39Ar and a low in 38Ar/39Ar (Fig. 4c). An apparent
age low corresponds to a low in 37Ar/39Ar and a high in38Ar/39Ar in grain 1, step 1 (Fig. 4c). These relationships
indicate that a number of factors affect the range in
apparent ages obtained from single grains. However, it
should be noted that the values of 37Ar/39Ar and38Ar/39Ar are small, as are within-grain variations with
respect to 2r errors, indicating no significant contamina-tion by Ca-bearing phases and little Cl variability asso-
ciated with heterogeneous alteration.
Muscovite grains from T01-19 yield ages ranging
from �524 to 728Ma (Table 1). The data form relatively
flat spectra with grain 1 giving older apparent ages in the
last few steps of the profile (Fig. 4b). Although the pro-
files are relatively flat, grain 2 only yields a plateau if J
value errors are included in the plateau calculation.The plateau age of 535.4 ± 1.2Ma (1r) includes 4 steps
incorporating 63.6% of the 39Ar (MSWD = 0.39) and
is significantly younger than biotite ages from the same
sample (Fig. 4a). Again the ages of the two different
mica grains differ by �100Ma despite a similar grain
diameter of 300lm (Fig. 4b). 38Ar/39Ar data from mus-
covite are relatively homogenous and similar for both
grains. However, 37Ar/39Ar data from the two grainsare very different with grain 1 having values an order
of magnitude greater than other micas analysed in this
study (Fig. 4).
Apparent ages from muscovite grains from T01-24b
range from 832 to 1055Ma (Table 1). Age spectra indi-
cate some variability and the data yield no plateaux even
if J value uncertainties are taken into account. The spec-
tra show that earlier steps yield older apparent ages thansteps released later in the heating cycle (Fig. 4d).
However all apparent ages from T01-24b muscovite
are higher than muscovite ages from T01-19 (cf. Fig.
4b and d). 38Ar/39Ar data from the muscovite have sim-
ilar values to other mica analyses (�0.013) and are rela-
tively homogenous, though increasing slightly with
increasing 39Ar%. 37Ar/39Ar data from the two grains
differ with respect to the apparent age profiles. In grain2 the profiles for apparent age and 37Ar/39Ar are compli-
mentary and follow the same decreasing pattern at
172 S.M. Reddy et al. / Journal of African Earth Sciences 39 (2004) 165–176
increasing 39Ar%. However, grain 1 generally shows
lower values than grain 2 and apparent age highs and
lows correspond to 37Ar/39Ar lows and highs respec-
tively. It must be noted though that if 2r errors are con-
sidered then the 37Ar/39Ar ratios for each step within
individual grains are within error and the significanceof similarity in apparent ages and 37Ar/39Ar profiles is
difficult to confirm.
All mica analyses have negligible 36Ar, indicating that
there is no atmospheric 40Ar component in the samples
and also precluding the use of inverse isochron
(39Ar/40Ar vs 36Ar/40Ar) plots to recognize any excess40Ar component.
5. Discussion
5.1. Interpretation of the Ar data
The Ar data show complexity that cannot be ex-
plained by simple closure temperature models for Ar dif-
fusion in micas. The 40Ar/39Ar data record a wide rangeof apparent ages with biotite from both samples being
older than corresponding muscovite ages. This is incon-
sistent with higher closure temperature estimates for Ar
diffusion in muscovite than biotite for the similar grain
sizes analysed here (Villa, 1997; McDougall and Harri-
son, 1999). In addition, age variations amongst single
grains from individual samples show no correlation with
measured grain diameter (Fig. 4). The closure tempera-ture model therefore fails to account for such variations
and within-sample heterogeneity in Ar isotope systemat-
ics at the grain scale is required.
The age variation amongst biotite single grain data
from both samples does not seem to reflect primary
compositional variations or secondary alteration that
can be inferred from the distribution of 38Ar and 37Ar
isotopes. However, the correlation of slightly increased37Ar/39Ar with lower apparent ages in the first steps of
T01-19 biotite analyses may reflect minor contamination
by a component with a slightly higher 37Ar/39Ar ratio
and younger apparent age, for example muscovite
(Fig. 4b). The correlation of younger age with slightly
increased 38Ar/39Ar ratios in T01-24b biotites may indi-
cate slight alteration and Ar loss from the least retentive
sites of the lattice. However, all of these variations areminor and cannot account for the observed range of
ages.
The 40Ar/39Ar ages from T01-24b biotite are signifi-
cantly older than the �2.7Ga igneous protolith age of
Isimani gneiss (Reddy et al., 2003) and are also older
than the 1991–1999Ma age of syn-D2 amphibolite facies
fabrics (Collins et al., 2004) in which the analysed micas
lie. These data are therefore interpreted to reflect thepresence of an excess 40Ar component within the biotite.
The observation of increased age with smaller grain
diameter is consistent with such an interpretation if
the excess 40Ar component was added to the grain by
a diffusive process after grain growth rather than being
incorporated into the grain during original growth
(Reddy et al., 1996).
Biotite data from T01-19 are more difficult to inter-pret because they yield ages that are younger than the
inferred age of the D2 fabrics. The ages could therefore
reflect cooling from �2Ga amphibolite facies metamor-
phism. However an alternative interpretation is that the
ages could still reflect a component of excess 40Ar added
to the biotite since original cooling from this 2Ga event.
In this case the difference in ages between single grain
analyses may reflect the heterogeneous distribution ofan excess 40Ar component in the rock and the ability
of grains to be affected by this component (Reddy
et al., 1996, 1997).
Muscovite from both T01-19 and T01-24b yield Neo-
proterozoic ages that are significantly younger than the
Palaeoproterozoic eclogite and amphibolite metamor-
phic ages for the Isimani Suite (Moller et al., 1995;
Collins et al., 2004). Muscovite apparent ages fromT01-19 are significantly younger than apparent ages
from T01-24b—a pattern that mimics the apparent age
distribution of the biotite data.
T01-24b muscovites lie within the S2 foliation, are
interpreted to have grown or recrystallized at the same
time as the foliation (�2Ga) and have been subse-
quently recrystallized to finer grained aggregates of mus-
covite (Fig. 3d). Ar data from T01-24b muscoviteindicate that, within error limits, there is little composi-
tional control on apparent age and lower retentivity sites
correlate with slightly increased apparent ages. In addi-
tion the slightly smaller of the two analysed grains yields
slightly higher apparent ages. However, the measured
grain size may be misleading because we were unable
to assess the extent of recrystallization in the analysed
grains. Two possible interpretations of the 900Ma ageare that it represents the time that the muscovites passed
through their closure temperature or the time of coarse
muscovite recrystallization to fine aggregates. The data
from T01-19 preclude the first of these interpretations
because the coarser grain size of T01-19 muscovite
would require the finer grain size of T01-24 to yield ages
<535Ma. In the second interpretation the recrystalliza-
tion age would only be preserved if the recrystallizationtemperature was less than the closure temperature of the
recrystallized muscovite (Reddy and Potts, 1999). Since
data from T01-19 indicates that the closure tempera-
ture for coarser muscovite was much younger than
900Ma, this age cannot correspond to the timing of
recrystallization.
Earlier it was suggested that >3.3Ga biotite ages
from T01-24 were related to heterogeneous excess 40Arand have no geological significance. Biotite tends to
have a greater affinity for excess 40Ar than muscovite

S.M. Reddy et al. / Journal of African Earth Sciences 39 (2004) 165–176 173
(Roddick et al., 1980; Dahl, 1996), but the presence of
excess 40Ar in biotite indicates that muscovite may also
be affected by a smaller excess 40Ar component. Musco-
vite data from T01-24b cannot be reconciled with clo-
sure temperature or recrystallization models. However,
the fact that ages are �400Ma older than nearby musco-vites of T01-19 demonstrates that the muscovites of
T01-24 are probably affected by excess 40Ar.
A correlation of increased muscovite age with order
of magnitude increase in 37Ar/39Ar in T01-19 is inter-
preted to reflect minor contamination by a Ca bearing
phase of older apparent age. This indicates that the
younger age of 535.4 ± 1.2Ma (1r) is the most reliable
muscovite age. Since muscovites in T01-19 overprintbiotite and lie oblique to the S2 foliation (Fig. 3b), indi-
cating that they post-date biotite growth, the age of
535Ma may reflect either the timing of this muscovite
growth and metamorphism, if the temperature condi-
tions of growth were lower than the closure tempera-
ture, or the time at which the muscovite passed
through it�s closure temperature after growth. For the
first interpretation to be correct, the muscovite wouldneed to have grown at temperatures below its closure
temperature (�350 �C). The metamorphic conditions of
muscovite growth are difficult to constrain. However,
given the occurrence of both muscovite and epidote
and the resetting of monazite U–Pb ages (Moller
et al., 1995), we suggest greenschist facies conditions
with temperatures higher than the muscovite closure
temperature. It is therefore more likely that the age re-flects isotopic modification after growth.
The diffusion parameters for Ar diffusion in biotite
and muscovite are such that Ar diffusion in biotite
should be faster than in muscovite in grains of the same
grain size within the same sample (e.g. McDougall and
Harrison, 1999). This is reflected in the lower closure
temperature of biotite for Ar diffusion and it would be
expected that 300lm biotite grains from T01-19 wouldrecord lower ages than muscovite of the same grain size.
This is not so and older biotite ages are interpreted to
reflect the preferred partitioning of excess 40Ar into bio-
tite (Roddick et al., 1980; Dahl, 1996). The presence of
excess 40Ar in biotite indicates the plateau age of
535.4Ma from T01-19 may also be artificially high due
to an excess 40Ar component. Therefore, the age of
535.4Ma must be interpreted to be a maximum agefor closure of the muscovite to Ar diffusion, noting that
if it did contain an excess 40Ar component that the tim-
ing of isotopic closure would be younger.
The differences in ages amongst individual grains
from the same samples are not easily explained by the
available data. However, such variations are commonly
observed in detailed studies of intragrain microstructure
and argon isotope systematics (e.g. Reddy et al., 1996;2001). From such studies it is clear that the internal
microstructure of individual grains can vary markedly
within individual samples and this variation can lead
to significant age variations between grains. In part this
reflects the heterogeneous reduction in effective diffusion
distances and diffusion pathways within grains. In this
study we have not undertaken a detailed microstructural
analysis of the actual grains analysed for Ar. Howeverthis work is currently ongoing.
In summary, the preferred interpretation is that the
Mesoproterozoic ages recorded by T01-19 and T01-
24b biotites reflect the incorporation of an excess 40Ar
component. The different ages recorded by different
grains from each sample reflects a heterogeneous distri-
bution of excess 40Ar within different grains. The best
estimate of the timing of the addition of the excess40Ar to both samples is around the time recorded by
the least affected muscovite grain, that is around
535Ma. This date may reflect a maximum age for a per-
iod of muscovite growth or, more likely, a maximum age
for muscovite cooling through its closure temperature.
In either case the data indicate a significant thermal
event associated with the East African Orogen.
5.2. Relationship of 40Ar/39Ar ages to previous studies
Previous mineral age data collected from the south-
ern Usagaran Orogen has been used to argue for a pro-
gressive overprint of Usagaran micas by a Palaeozoic
heating event (Wendt et al., 1972). The basis for this
interpretation was the range of Palaeoproterozoic to
Palaeozoic Rb–Sr and K–Ar ages (Wendt et al., 1972).However, the original data of Wendt is difficult to rec-
oncile with a simple Palaeoproterozoic cooling history
followed by a localized thermal event for several
reasons.
Firstly, several of the samples yield K/Ar ages that
are older than the protolith age and were interpreted
as being affected by excess 40Ar (Wendt et al., 1972).
The distribution of these samples and a further 8 datedsamples, is not shown in Wendt et al.�s (1972) locationmap, therefore we are unable to comment on the spatial
distribution of excess 40Ar ages. However, it is unlikely
that all samples affected by excess 40Ar will yield ages
older than the protolith ages and dates younger than
the protolith age may also contain an excess 40Ar com-
ponent. Indeed, although acknowledging that our data
come from samples from a different area, we argue thatthe data from T01-19 indicates that biotites yielding
Mesoproterozoic ages are affected by an excess 40Ar
component.
Secondly, the distribution of biotite K–Ar and Rb–Sr
ages are often discordant (Wendt et al., 1972) when they
should be similar because of the diffusion characteristics
of the two isotope systems. It is difficult to assess the rea-
son for this from the original data. However in the mostextreme example, biotites yielding 479Ma Rb–Sr ages
give K–Ar ages >2700Ma. In this case excess 40Ar
174 S.M. Reddy et al. / Journal of African Earth Sciences 39 (2004) 165–176
affecting the K–Ar date is the most likely interpretation.
In addition, the method by which Wendt et al. (1972)
estimated initial 87Sr/86Sr ratios for mineral ages is un-
clear but could be a source of error in the Rb/Sr mica
age.
The spatial distribution of Rb/Sr and K/Ar variationsseems to follow a NE–SW trend (Wendt et al., 1972)
similar to the orientation of structures in the East Afri-
can Orogen further east. This similarity in orientation
has been used to argue for resetting of radiometric ages
during this orogenic event (Wendt et al., 1972). How-
ever, the variation in K/Ar ages has similarities to the
spatial distribution of rock types in the Usagaran Oro-
gen, with younger ages correlating with the location ofIsimani Suite migmatites (Gabert, 1973). These migma-
tites have much lower K contents than Usagaran gran-
ites (Gabert, 1973) that yield the older K/Ar ages.
Since the amount of locally derived excess 40Ar may re-
flect the bulk-rock K content of the rock (Reddy et al.,
1997), the distribution of apparent K–Ar ages is there-
fore consistent with incorporation of heterogeneous
excess 40Ar derived by degassing of local K-rich phases.The 535Ma muscovite age from T01-19 indicates that
at least parts of the Isimani Suite were at temperatures
above the closure temperature for muscovite (350–
400 �C), and thus biotite, in the Early Palaeozoic. The
data presented, combined with the wide range in K–Ar
ages and the published discordance between Rb/Sr and
K/Ar ages, are consistent with the thermal opening of
micas to isotopic diffusion during the early Palaeozoicand the heterogeneous diffusion of excess 40Ar into
mica. The range of Palaeoproterozoic to Palaeozoic ages
do not therefore represent the timing of cooling below
the biotite closure temperature, or simple thermal reset-
ting but the heterogeneous distribution of excess 40Ar
during Palaeozoic heating at greenschist facies
conditions.
To the south and west, the Usagaran Orogen linkswith the similar Ubendian Orogen of western Tanzania.
These two orogenic belts are considered by many to be
equivalent (Meinhold, 1970; Gabert and Wendt, 1974;
Priem et al., 1979; Lenoir et al., 1994). Recent geochron-
ological data support the similar metamorphic histories
of the two belts with high pressure granulite-eclogite
facies metamorphism at �2000Ma (Moller et al.,
1995; Ring et al., 1997; Collins et al., 2004) over-printed by younger amphibolite facies metamorphism
at <1991Ma in the Usagaran Orogen (Collins et al.,
2004) and younger than 1860Ma in the Ubende belt
(Lenoir et al., 1994). 40Ar/39Ar data from the Ubendian
Orogen are limited to barroisite analyses. These data are
difficult to interpret and individual release spectra range
from Palaeozoic to Palaeoproterozoic in age (Boven
et al., 1999). Despite this complexity, Boven et al.(1999) interpret an age of 1848 ± 6Ma to reflect cool-
ing through the amphibole closure temperature
(500–550 �C) with older ages reflecting a component of
excess 40Ar and younger ages reflecting alteration and40Ar loss. These data were interpreted to show that
exhumation of the Ubendian high-pressure metamor-
phic rocks took place in the Palaeoproterozoic with little
subsequent thermal activity (Boven et al., 1999). A sim-ilar range of ages and complexity to the Ubende Ar data
is shown by the mica data presented here. However our
interpretation differs significantly from that of Boven
et al. (1999). Clearly resolution of the Palaeoproterozoic
cooling of these high pressure rocks and any subsequent
reheating associated with the East African Orogen
requires further studies at a regional scale.
5.3. Relationship of 40Ar/39Ar ages to structural and
stratigraphic models
Easterly dipping shear zones are found at various
structural levels within the Isimani Suite of the Usarga-
ran Orogen (D4 and D5 of Reddy et al., 2003). These
record both W-directed thrust and E-directed exten-
sional displacements and clearly overprint peakmetamorphic assemblages. Both kinematic types of
shear zone preserve microstructures and mineral assem-
blages that suggest deformation took place at green-
schist facies conditions. The kinematic framework of
these structures contrasts that preserved in amphibolite
grade structures (Reddy et al., 2003) but have similar
geometries and kinematics to structures in the nearby
East African Orogen. 40Ar/39Ar data demonstrates thatthe Isimani Suite was at greenschist facies temperatures
in Early Palaeozoic times and given the absence of
annealing of D4 and D5 structures it is interpreted that
they formed in late Neoproterozoic–Early Palaeozoic
times towards the western margin of the East African
Orogen.
The metasedimentary and metavolcanic Konse
Group is thought to have been deposited and metamor-phosed in the Palaeoproterozoic (Meinhold, 1970;
Whittingham, 1959; Mruma, 1989, 1995). Greenschist
facies metamorphism in the Konse Group was previ-
ously thought to have developed simultaneously with
the main deformation phase in the Isimani Suite
(Mruma, 1989). However where undisturbed, the Konse
Group unconformably overlies foliated rocks of the
Tanzanian Craton and the Isimani Suite (Whittingham,1959; Mruma, 1989) and therefore must represent a vol-
cano-sedimentary sequence formed after exhumation of
the Isimani Suite. In the area studied here, the contact
between the Isimani Suite and Konse Group is a green-
schist facies high strain zone (D5), the Ifwambo Thrust
of Mruma (1989), which accommodates westward
thrusting of the higher grade Isimani Suite onto the
Konse Group (Reddy et al., 2003). Kinematic data(Reddy et al., 2003) and the 40Ar/39Ar data pre-
sented here indicate that this deformation was probably

S.M. Reddy et al. / Journal of African Earth Sciences 39 (2004) 165–176 175
associated with the East African Orogeny. It is therefore
possible that the greenschist facies metamorphism and
deformation of the structurally lower Konse Group re-
flects heating and more pervasive deformation in the
footwall of the Ifwambo Thrust at the same time as East
African Orogeny crustal thickening. If it is correct thatKonse Group deformation and metamorphism devel-
oped during the Neoproterozoic–Early Palaeozoic East
African Orogeny rather than the Palaeoproterozoic
Usagaran Orogeny, then the age of the Konse Group
deposition is also questionable. The Palaeoproterozoic
depositional age of the Konse Group is only independ-
ently supported by correlation of the Konse Group with
a sequence of rocks known as the Ndembera Volcanics(Whittingham, 1959; Mruma, 1989). These rocks have
been dated using Rb–Sr and yield depositional ages of
1895 ± 27Ma (age recalculated from Wendt et al.
(1972) using the decay constant of Steiger and Jager
(1977)). If these volcanics can be linked directly to the
Konse Group volcanics or if the Ndembera Volcanics
clearly post-date the Konse Group then the Palaeopro-
terozoic depositional age of the Konse Group is con-firmed. However, the correlation and relationship
between the two units is far from clear. At this stage
there is no evidence to support the Palaeoproterozoic
depositional age of the Konse Group and, given the
likelihood that its metamorphic overprint reflects Neo-
proterozoic–Early Palaeozoic tectonism, it can be spec-
ulated that the volcano-sedimentary sequence may be
much younger than previously thought. Clearly furtherdetailed geochronological work is required to further
test these ideas.
6. Conclusions
The main conclusions of this study are:
(1) 40Ar/39Ar single grain data from biotites and mus-
covites taken from orthogneisses of the Isimani
Suite within the Palaeoproterozoic Usagaran Oro-
gen demonstrate complex Ar isotope systematics
due to isotopic remobilization and incorporation
of excess 40Ar.
(2) Textural evidence that muscovite growth postdates
biotite growth does not explain the observed agedifference between the older biotite and younger
muscovite data. Instead it reflects the heterogene-
ous partitioning of excess 40Ar preferentially into
the biotite.
(3) The youngest reliable muscovite age of 535Ma is a
maximum age for cooling of the samples through
the muscovite closure temperature and indicates
that the thermal event responsible for Ar migrationwas associated with the Neoproterozoic–Early
Palaeozoic East African Orogen.
(4) Greenschist facies shear zones that cut the Isimani
Suite (D4 and D5 of Reddy et al., 2003) are inter-
preted to have formed during a Neoproterozoic–
Early Palaeozoic event associated with the East
African Orogen. The Ar data are consistent with
pervasive greenschist facies metamorphism, defor-mation and deposition of the Konse Group also
having taken place at this time.
(5) These new data preclude a solely Palaeoproterozoic
tectonic history for the Usagaran Orogen and indi-
cate a complex thermal-tectonic reworking in the
Neoproterozoic–Early Palaeozoic that is more sig-
nificant than previously thought.
Acknowledgments
This work was funded by Australian Research Coun-
cil grants to SMR, ASC and ACB. Jo-Anne Wartho is
thanked for assistance in the Ar lab. Ken Ludwig
(Berkeley) is thanked for supplying his programme Iso-
plot 2.49. Andreas Moller and Jean-Paul Liegeois arethanked for critical reviews of the manuscript. This
paper is Tectonics Special Research Centre Publication
No. 238.
References
Boven, A., Theunissen, K., Sklyarov, E., Klerkx, J., Melnikov, A.,
Mruma, A., Punzalan, L., 1999. Timing of exhumation of a high
pressure mafic granulite terrane of the Palaeoproterozoic Ubende
belt (west Tanzania). Precambrian Research 93, 119–137.
Collins, A.S., Reddy, S.M., Buchan, A.C., Mruma, A.H., 2004.
Temporal constraints on Palaeoproterozoic eclogite formation and
exhumation (Usagaran Orogen). Earth and Planetary Science
Letters 224, 175–192.
Dahl, P.S., 1996. The crystal-chemical basis for Ar retention in
micas—inferences from interlayer partitioning and implications for
geochronology. Contributions to Mineralogy and Petrology 123,
22–39.
Dalziel, I.W.D., 1997. Neoproterozoic–Paleozoic geography and
tectonics: review, hypothesis, environmental speculation. Geolog-
ical Society of America Bulletin 109, 16–42.
Gabert, G., 1973. Uber praambrische Olivinmonzoite (Kentallenite) in
Zentral-Tanzania. Geologische Jahrbuch B 6, 51–79.
Gabert, G., Wendt, I., 1974. Datierung von granitische Gesteine im
Dodoman- und Usagaran-System und in der Ndembera-Serie
(Tanzania). Geologische Jahrbuch B 11, 3–55.
Harpum, J.R., 1970. Summary of the Geology of Tanzania. Part V:
Structure and Geotectonics of the Precambrian, Resources Divi-
sion, Dodoma, Tanzania.
Lenoir, J.-L., Liegeois, J.-P., Theunissen, K., Klerkx, J., 1994. The
Palaeoproterozoic Ubendian shear belt in Tanzania: geochronol-
ogy and structure. Journal of African Earth Sciences 19, 169–184.
Maboko, M.A.H., 2000. Nd and Sr isotopic investigation of the
Archean-Proterozoic boundary in north eastern Tanzania: con-
straints on the nature of Neoproterozoic tectonism in the Mozam-
bique Belt. Precambrian Research 102, 87–98.
Maboko, M.A.H, Nakamura, E., 1996. Nd and Sr isotopic maping of
the Archaean-Proterozoic boundaru in southeastern Tanzania
176 S.M. Reddy et al. / Journal of African Earth Sciences 39 (2004) 165–176
using granites as probes for crustal growth. Precambrian Research
107, 105–115.
McDougall, I., Harrison, T.M., 1999. Geochronology and Thermo-
chronology by the 40Ar/39Ar Method. Oxford University Press,
Oxford, UK, p. 269.
Meinhold, K.D., 1970. Petrographie, Metamorphose, Tektonik und
Stratigraphische Stellung der Konse-Series in Zentral-Tanzania
(Ostafrika). Geologische Jahrbuch 91, 137.
Moller, A., Appel, P., Mezger, K., Schenk, V., 1995. Evidence for a
2Ga subduction zone: eclogites in the Usagarian belt of Tanzania.
Geology 23, 1067–1070.
Moller, A., Mezger, K., Schenk, V., 1998. Crustal age domains and the
evolution of the continental crust in the Mozambique Belt of
Tanzania: combined Sm–Nd, Rb–Sr, and Pb–Pb isotopic evidence.
Journal of Petrology 39, 749–783.
Moller, A., Mezger, K., Schenk, V., 2000. U–Pb dating of metamor-
phic minerals: Pan-African metamorphism and prolonged slow
cooling of high pressure granulites in Tanzania, East Africa.
Precambrian Research 104, 123–146.
Mruma, A.H., 1989. Stratigraphy, metamorphism and tectonic evo-
lution of the Early Proterozoic Usagaran Belt, Tanzania. Research
Terrae 2 (Ser. A), 203.
Mruma, A.H., 1995. Stratigraphy and palaeodepositional environment
of the palaeoproterozoic volcano-sedimentary Konse Group in
Tanzania. Journal of African Earth Sciences 21, 281–290.
Muhungo, S., Kroner, A., Nemechin, A.A., 2001. Single zircon
evaporation and SHRIMP ages for granulitefacies rocks in the
Mozambique Belt of Tanzania. Journal of Geology 109, 171–189.
Priem, H.N.A., Boelrijk, N.A.I.M., Hebeda, E.H., Verdurmen,
E.A.T., Verschure, R.H., Oen, I.S., Westra, L., 1979. Isotopic
age determinations on granitic and gneissic rocks rrom the
Ubendian–Usagaran system in southern Tanzania. Precambrian
Research 9, 227–239.
Reddy, S.M., Collins, A.S., Mruma, A., 2003. Complex high-strain
deformation in the Usagaran Orogen, Tanzania: structural setting
of Palaeoproterozoic eclogites. Tectonophysics 375, 101–123.
Reddy, S.M., Kelley, S.P., Magennis, L., 1997. A microstructural and
argon laserprobe study of shear zone development on the western
margin of the Nanga Parbat Syntaxis, North Pakistan. Contribu-
tions to Mineralogy and Petrology 128, 16–29.
Reddy, S.M., Kelley, S.P., Wheeler, J., 1996. A 40Ar/39Ar laserprobe
study of rocks from the Sesia Zone: excess argon, argon loss and
implications for metamorphic and deformation histories. Journal
of Metamorphic Geology 14, 493–508.
Reddy, S.M., Potts, G.J., Kelley, S.P., 2001. 40Ar/39Ar ages in
deformed potassium feldspar: evidence of microstructural control
on Ar isotope systematics. Contributions to Mineralogy and
Petrology 141, 186–200.
Reddy, S.M., Potts, G.J., 1999. Constraining absolute deforma-
tion ages: the relationship between deformation mechanisms
and isotope systematics. Journal of Structural Geology 21, 1255–
1265.
Ring, U., Kroner, A., Toulkeridis, T., 1997. Palaeoproterozoic
granulite-facies metamorphism and granitoid intrusions in the
Ubendian–Usagaran Orogen of Northern Malawi, East-central
Africa. Precambrian Research 85, 27–51.
Roddick, J.C., Cliff, R.A., Rex, D.C., 1980. The evolution of excess
argon in Alpine biotites—a 40Ar–39Ar analysis. Earth and Plane-
tary Science Letters 48, 185–208.
Shackleton, R.M., 1996. The final collision between East and West
Gondwana; where is it? Journal of African Earth Sciences 23, 271–
287.
Steiger, R.H., Jager, E., 1977. Subcommision on geochronology:
convention on the use of decay constants in geo- and cosmochro-
nology. Earth and Planetary Science Letters 36, 359–362.
Stern, R.J., 1994. Arc assembly and continental collision in the
Neoproterozoic East African orogeny—implications for the con-
solidation of Gondwana. Annual Review of Earth and Planetary
Sciences 22, 319–351.
Villa, I.M., 1997. Isotopic closure. Terra Nova 10, 42–47.
Wendt, I., Besang, C., Harre, W., Kreuzer, H., Lenz, H., Muller, P.,
1972. Age determinations of granitic intrusions and metamorphic
events in the early Precambrian of Tanzania. In: 24th International
Geological Congress, Montreal, Section 1. pp. 295–314.
Whittingham, J.K., 1959. The Geology of the Nyanzwa area. In:
Bulletin of the Geological Survey of Tanganyika. p. 27.