Spectroscopic measurements and electrical diagnostics of microhollow cathode discharges in argon...
12
Eur. Phys. J. D 60, 505–516 (2010) DOI: 10.1140/epjd/e2010-00219-0 Regular Article T HE EUROPEAN P HYSICAL JOURNAL D Spectroscopic measurements and electrical diagnostics of microhollow cathode discharges in argon flow at atmospheric pressure B.N. Sismanoglu 1, a , K.G. Grigorov 1, 2 , R. Caetano 2 , M.V.O. Rezende 1 , and Y.D. Hoyer 1 1 Departamento de F´ ısica, Laborat´oriode ´ Opticae Espectroscopia, InstitutoTecnol´ogico deAeron´autica, P¸caMarechal Eduardo Gomes 50, 12 228-900, S˜ao Jos´ e dos Campos, SP, Brazil 2 Institute of Electronics, Bulgarian Academy of Science, 72 Tzarigradsko Chaussee, Sofia 1784, Bulgaria Received 22 April 2010 / Received in final form 19 July 2010 Published online 30 August 2010 – c EDP Sciences, Societ`a Italiana di Fisica, Springer-Verlag 2010 Abstract. This paper is dedicated to the study of the electrical and optical characteristics of direct current microhollow cathode discharges (MHCD) in argon flow. Experiments have been carried out in order to determine the so-called Paschen’s curves in a static open MHCD. Current-voltage characteristics were obtained as a function of the pressure and hole diameter. MHCD enable stable direct current discharge operation, which could be ignited for pressures ranging from 12 to 800 Torr, in a very wide range of current densities and electrodes materials. Optical emission spectroscopy and analysis of the spectral line broadening of plasma line emissions were performed in order to measure parameters such as electron number density (2–4 × 10 14 cm -3 ), gas temperature (460–640 K), excitation temperature (∼ 7000 K) and electron temperature (∼ 8500 K), for current ranging from 7 to 15 mA. Lower gas temperature was measured compared to the static MHCD ones. 1 Introduction Uniform and homogeneous atmospheric pressure plasma can be achieved in small dimensions of the discharge, within hundreds of μm[1–3]. The non-thermal equilib- rium is characteristic of microplasmas which are stable at high pressure and gas temperature less than 1000 K, allow- ing for many applications of general interest in a number of different configurations [1–8], mainly due to collisional and radiative processes occurring in the plasma bulk. By reason of the lower power consumption, MHCD is a cheap and efficient approach to many industrial appli- cations operating at high pressure and low voltage. Atmo- spheric pressure direct current (DC) MHCD at low current (< 20 mA) has been widely studied [1,9] in a static mode (without gas flow). In dynamic mode, MHCD can operate with massive gas flow, where the gas flows through the device borehole from anode (inner region) to cathode side (open air). The dynamic MHCD in argon flow, driven at low voltage in open atmospheric air is compact and suit- able for use in different applications in research, industry and medical area, such as surface treatment (cleaning, ac- tivation and deposition), detoxification of gaseous pollu- tion, etc. The understanding of this kind of microplasma behavior at high pressure is important for the optimiza- tion of these applications and at the moment, there are a e-mail: [email protected] few experimental results for plasma parameters in the lit- erature, at atmospheric pressure operation. In this paper optical emission spectroscopy (OES) is used to diagnose the microplasma in order to measure the basic discharge parameters such as electron temperature and density, in the plasma bulk, at atmospheric-pressure DC open dynamic MHCD. In a recent paper [10] we mea- sured plasma parameters in argon microplasma jet at at- mospheric pressure using OES. In this paper, plasma pa- rameters were determined from spectral line intensity and broadening. In there, collisional processes occurring in the microplasma perturb the emitting atoms/molecules, in- fluencing the shape and width of emitted spectral lines. Stark and Van der Waals broadening of these lines can be used to measure the gas temperature (T g ) and elec- tron number density (n e ). The analysis of the light emis- sion from the cathode surface sputtered excited atoms can be used to determine the electron excitation temper- ature (T exc ). The high electron number density present in atmospheric-pressure MHCD enables the use of OES to probe n e and electron temperature T e . The thermal nonequilibrium T e T g in MHCD shows that this dis- charge operates in a glow mode and a further glow-to-arc transition is possible at high current. The measurements of gas temperature, electron/excitation temperature and electron number density were done in a Ar + 2%H 2 gas mixture, through OES of OH (from residual water vapor),
-
Upload
independent -
Category
Documents
-
view
0 -
download
0
Transcript of Spectroscopic measurements and electrical diagnostics of microhollow cathode discharges in argon...

Eur. Phys. J. D 60, 505–516 (2010)DOI: 10.1140/epjd/e2010-00219-0
Regular Article
THE EUROPEANPHYSICAL JOURNAL D
Spectroscopic measurements and electrical diagnosticsof microhollow cathode discharges in argon flowat atmospheric pressure
B.N. Sismanoglu1,a, K.G. Grigorov1,2, R. Caetano2, M.V.O. Rezende1, and Y.D. Hoyer1
1 Departamento de Fısica, Laboratorio de Optica e Espectroscopia, Instituto Tecnologico de Aeronautica, Pca Marechal EduardoGomes 50, 12 228-900, Sao Jose dos Campos, SP, Brazil
2 Institute of Electronics, Bulgarian Academy of Science, 72 Tzarigradsko Chaussee, Sofia 1784, Bulgaria
Received 22 April 2010 / Received in final form 19 July 2010Published online 30 August 2010 – c© EDP Sciences, Societa Italiana di Fisica, Springer-Verlag 2010
Abstract. This paper is dedicated to the study of the electrical and optical characteristics of direct currentmicrohollow cathode discharges (MHCD) in argon flow. Experiments have been carried out in order todetermine the so-called Paschen’s curves in a static open MHCD. Current-voltage characteristics wereobtained as a function of the pressure and hole diameter. MHCD enable stable direct current dischargeoperation, which could be ignited for pressures ranging from 12 to 800 Torr, in a very wide range ofcurrent densities and electrodes materials. Optical emission spectroscopy and analysis of the spectral linebroadening of plasma line emissions were performed in order to measure parameters such as electronnumber density (2–4 × 1014 cm−3), gas temperature (460–640 K), excitation temperature (∼ 7000 K)and electron temperature (∼ 8500 K), for current ranging from 7 to 15 mA. Lower gas temperature wasmeasured compared to the static MHCD ones.
1 Introduction
Uniform and homogeneous atmospheric pressure plasmacan be achieved in small dimensions of the discharge,within hundreds of μm [1–3]. The non-thermal equilib-rium is characteristic of microplasmas which are stable athigh pressure and gas temperature less than 1000 K, allow-ing for many applications of general interest in a numberof different configurations [1–8], mainly due to collisionaland radiative processes occurring in the plasma bulk.
By reason of the lower power consumption, MHCD isa cheap and efficient approach to many industrial appli-cations operating at high pressure and low voltage. Atmo-spheric pressure direct current (DC) MHCD at low current(< 20 mA) has been widely studied [1,9] in a static mode(without gas flow). In dynamic mode, MHCD can operatewith massive gas flow, where the gas flows through thedevice borehole from anode (inner region) to cathode side(open air). The dynamic MHCD in argon flow, driven atlow voltage in open atmospheric air is compact and suit-able for use in different applications in research, industryand medical area, such as surface treatment (cleaning, ac-tivation and deposition), detoxification of gaseous pollu-tion, etc. The understanding of this kind of microplasmabehavior at high pressure is important for the optimiza-tion of these applications and at the moment, there are
a e-mail: [email protected]
few experimental results for plasma parameters in the lit-erature, at atmospheric pressure operation.
In this paper optical emission spectroscopy (OES) isused to diagnose the microplasma in order to measure thebasic discharge parameters such as electron temperatureand density, in the plasma bulk, at atmospheric-pressureDC open dynamic MHCD. In a recent paper [10] we mea-sured plasma parameters in argon microplasma jet at at-mospheric pressure using OES. In this paper, plasma pa-rameters were determined from spectral line intensity andbroadening. In there, collisional processes occurring in themicroplasma perturb the emitting atoms/molecules, in-fluencing the shape and width of emitted spectral lines.Stark and Van der Waals broadening of these lines canbe used to measure the gas temperature (Tg) and elec-tron number density (ne). The analysis of the light emis-sion from the cathode surface sputtered excited atomscan be used to determine the electron excitation temper-ature (Texc). The high electron number density presentin atmospheric-pressure MHCD enables the use of OESto probe ne and electron temperature Te. The thermalnonequilibrium Te � Tg in MHCD shows that this dis-charge operates in a glow mode and a further glow-to-arctransition is possible at high current. The measurementsof gas temperature, electron/excitation temperature andelectron number density were done in a Ar + 2%H2 gasmixture, through OES of OH (from residual water vapor),

506 The European Physical Journal D
H2 (added to discharge), Mo (sputtered from cathode) andAr lines.
The main broadening mechanisms responsible for Hβ ,Ar 603.213 nm and 565.070 nm line broadenings were in-vestigated. Argon is used because it is cheaper comparedto others rare gases and has high weight and low thermalconductivity. In this paper, the electron number densitywas determined through the Hβ line. In our experimen-tal conditions, both Ar 603.213 nm and 565.070 nm linesare substantially broadened by Van der Waals and Starkeffects, allowing the estimation of ne and Te simultane-ously. The gas temperature could be measured both byVan der Waals broadening of Ar 603.213 nm line and theOH radicals Q1 branch. The excitation temperature wasdetermined from the two Mo lines method and from thewell-known Boltzmann-plot method using the strong Ar4p–4s and 5p–4s transition lines. The electrical perfor-mance of the static MHCD for ranges of pressures hasbeen studied also by plotting the characteristic current-voltage and Paschen’s curves.
2 Theory
2.1 Spectral line broadening mechanisms
The main mechanisms that broaden emission lines areStark, Van der Waals, Doppler, resonance, instrument andnatural ones [11,12]. At low electron number densities andpressure, the broadening of a line is dominated by instru-mental, natural and Doppler mechanisms. In the MHCDsystem, where the electron density is about 1014 cm−3
at atmospheric pressure, Stark and Van der Waals arethe most important effects, because the line shape is in-fluenced by interactions of the radiating atoms with sur-rounding particles [11]. Natural broadening is usually neg-ligible and resonance broadening is negligible too in theBalmer and Ar 603.213 nm and 565.070 nm lines, once ifthere are no transitions involving a dipole-coupled level tothe ground state [11].
The Doppler and instrumental (see next section)contributions give origin to Gaussian shape line pro-files. Stark and Van der Waals contributions generateLorentzian component. The convolution of the Gaussianand Lorentzian components results in a Voigt profile. Therelation between Gaussian, Lorentzian and the resultedVoigt full-widths at half-maximum (FWHM) profiles isgiven by [13]:
ΔλV =ΔλL
2+
√Δλ2
L
4+ Δλ2
G
where ΔλL = ΔλW + ΔλS
and ΔλG =(Δλ2
D + Δλ2I
)1/2(1)
where the subscripts represent: L = Lorentzian,G = Gaussian, V = Voigt, W = Van der Waals, S = Stark,D = Doppler, I = Instrumental.
An observed line generally has a Voigt profile andits FWHM can be measured directly. Gaussian and
Lorentzian FWHM can be calculated or obtained by de-convolution of the experimental profile using free soft-ware [14].
The random motion of the atoms in the plasma causesthe broadening of the spectral lines. The FWHM of theGaussian shape of the Doppler profile is [15]:
ΔλD = 7.17 × 10⁻⁷λ0
√T
M(2)
where T is the temperature of the emitter in Kelvin, M isthe atomic mass in a.m.u. and λ0 is the wavelength. Thistemperature is not necessarily equal to the gas tempera-ture, mainly in non-equilibrium discharges [16].
Van der Waals broadening results from the interactionof an excited atom with neutral ground-state atom of an-other species [12,17] and is an important broadening mech-anism in high-pressure plasmas. Using impact approxima-tion of the classical Fourier integral theory of pressurebroadening, Hindmarsh et al. deduced a formula [18] tocalculate the Van der Waals (FWHM) broadening of theline:
ΔλW(cm) = 8.2× 10⁻¹²λ2(α
⟨R2
⟩)2/5(
Tg
μ
)3/10
N. (3)
In equation (3) α is the mean atomic polarizability of theneutral perturber (16.53×10⁻²⁵ cm3 for argon), Tg is thegas temperature in K, μ is the atom-perturber reducedmass in a.m.u., N is the neutral ground-state atom den-sity in cm−3 (considering the plasma an ideal gas, N isgiven by p/KBTg, where p is the pressure, and KB is theBoltzmann constant). 〈R2〉 is the squares difference of themean coordinate vector of the radiating atom, in a0 units,for the upper and lower levels, R2
u −R2l . One can see that
the Van der Waals broadening is a gas temperature de-pendent: the higher is the temperature the lower is thebroadening. From the broadening of the argon lines it ispossible to determine the gas temperature.
Collisions between emitter and charged particles, suchas electrons and ions in the neighborhood of the radiat-ing atom, result as broadening of the emitted line. Thiseffect may be used in plasmas to probe the density ofcharged particles. It is well known that the electron den-sity and temperature are the basic parameters that governthe Stark broadening [11]. Once the electron temperatureis known, the determination of the electron number den-sity from the hydrogen Hβ line may be used as a diagnosticmethod [19–21].
It was shown experimentally that the movement of theperturbing ions in the plasma bulk influences the shape ofBalmer lines [22,23]. In this sense, in 2003, Gigosos andCardenoso [22] listed a set of tables (GIG-CARD tables)of the Stark width as a function of electron temperatureand density for lines of the Balmer series of hydrogen,obtained by means of a computer simulation technique.They showed how ions dynamics affect the broadening ofhydrogen Balmer lines. Hβ line is widely used for diag-nosis because it is relatively isolated, has no significantself-absorption and its width is almost independent of theplasma temperature and ion dynamics [22].

B.N. Sismanoglu et al.: Spectroscopic measurements and electrical diagnostics of microhollow cathode discharges... 507
GIG-CARD are best results that correlates Starkwidth, electron density and temperature and are suit-able to be used to determine the electron density in at-mospheric pressure discharges [20,24,25]. A fitting proce-dure provides analytical expressions for Stark FWHM as afunction of electron number density and electron temper-ature. In the present work, excited non-hydrogenic neu-tral atoms like Ar lines 603.213 nm and 565.070 nm wereused for diagnostic purposes because they are intense andwell isolated. The shapes of Ar plasma-broadened linesare mainly determined by electron impacts with the radi-ating atom and a small contribution arises from the elec-tric microfields generated by static plasma ions [17]. Usingquasi-static approximation, Griem [11] took into accountthe small contribution of ion broadening in addition to theelectron impact broadening of an isolated line profile. ForAr 603.213 nm line the Stark width (FWHM) is given by:
ΔλS(nm) = 2(0.2206 + 1.77 × 10⁻⁴Te − 1.072 × 10⁻⁸T 2
e
+ 2.408× 10⁻¹³T 3e
)[1 + 1.75 × 10⁻⁴n1/4
e
× (0.0628 + 0.1042 exp(−Te/4216.168))
× (1 − 0.068n1/6e T−1/2
e )] × 10−17ne (4)
and the Stark width (FWHM) for Ar 565.070 nm line is:
ΔλS(nm) = 2(0.2093 + 1.231×10⁻⁴Te − 6.0645×10⁻⁹T 2
e
+ 1.323 × 10⁻¹³T 3e − 1.042× 10⁻¹⁸T 4
e
)× [1 + 1.75 × 10⁻⁴n1/4
e × (0.00299 + 0.01513× exp(−Te/1128.45) + 0.00399 exp(−Te/14592.93))
× (1 − 0.068n1/6e T−1/2
e )] × 10−17ne. (5)
Solving simultaneously equations (4) and (5) one can ob-tain ne and Te, implying that the widths of the lines areknown previously. In the next section two methods aregiven for determination of the electron excitation temper-ature.
2.2 Excitation temperature
Atmospheric-pressure microplasmas are generally in near-partial-local thermodynamic equilibrium (PLTE) [11].This suggests the use of equilibrium equations like theBoltzmann equation for determination of the populationof excited atomic levels. The microplasmas consist ofmoderate degree of ionization where the excitation pro-cesses are dominated by electron collisions [26] and sothe electron excitation kinetics plasmas (EEKP) predom-inate [26]. If we consider the MHCD as EEKP, the distri-bution of atoms and ions in the different excited states canbe described by the Boltzmann distribution, and the well-known method of Boltzmann plot or the two-line methodmay be used to estimate the excitation temperature. Thelight intensity Iul of radiative transition between levels uand l may be given by [11]:
Iul =S
4πhc
nu
Z
Aulgu
λulexp
[− Eu
kBTexc
](6)
Table 1. Line parameters of the Mo lines [27].
Line λ (nm) Eu (eV) El (eV) gu gl Aul (108 s−1)
Mo 441.157 4.90 2.084 11 11 0.263
Mo 443.495 4.88 2.079 9 9 0.251
Mo 445.736 4.86 2.076 7 7 0.128
Mo 449.165 6.98 4.214 11 11 0.209
where S is the plasma length, h is the Planck constant,c is the velocity of light, Aul is the Einstein coefficient fortransition u → l, gu is the statistical weight of the up-per level u, Z is the canonical partition function, nu isthe population of the upper level and Eu is the energy ofthe upper level. The excitation temperature may be de-termined from Ar emission lines intensities. From the plotln(Iulλul/guAul) versus the energy Eu, one can estimatethe excitation temperature from the slope of the best linethat fits the experimental points.
The two-line method could be used in our MHCD be-cause the cathode surface sputters neutral atoms into thenegative glow. The process of excitation/de-excitation ofthese atoms may give information about excitation tem-perature. Considering two lines emitted by an excitedatom, the excitation temperature may be given by [11]:
Texc =Eu,2 − Eu,1
KB
[ln
(I1λ1gu,2Au,2
I2λ2gu,1Au,1
)]−1
(7)
where the subscripts 1, 2 are related to the lines. To avoidany spectral corrections, it is necessary that the wave-lengths are close to each other and the difference of theenergies between the levels involved in the emission of thelines should be as large as possible. The molybdenum foilcathode in our experiment enables us to choice the linesgiven in Table 1. We can use two pairs for the calculationof the excitation temperature. The estimation of the ex-citation and gas temperature, are fundamental to obtainthe electron number density and other parameters of theplasma.
2.3 Gas temperature
The rotational temperature (Trot) can be measured by us-ing the OH (A 2Σ+, ν = 0 → X 2Π, ν′ = 0) emission bandat 306.357 nm. The OH radical emissions in the atmo-spheric plasma are result of water vapor naturally presentas impurity in the gas or in the open air. This band isused to estimate the gas temperature from Q1 branch, as-suming that these radicals are in equilibrium with the gasneutral atoms [28–30]. At atmospheric pressure transla-tional equilibrium is rapidly achieved after few collisions,while rotational equilibrium involves a variety of colisionalprocesses. At atmospheric pressure KBT ∼ ΔErot, so therotational temperature provides a good approximation ofthe gas kinetic temperature since the collisional rates arehigh enough to assure near-local thermodynamic equilib-rium.

508 The European Physical Journal D
Fig. 1. (Color online) Experimental set-up showing MHCDand light acquisition. End-on photography of dynamic MHCDin gas flow in open air is depicted.
In MHCD it was observed the OH emission band be-tween 306.0 and 312.0 nm. The Trot value may be takenfrom the slope of the plot ln(I0λ/A) as a function of theupper state energy. Here, I0 is the line intensity, λ is thetransition wavelength and A the transition probability.The standard deviation on Trot is less than 10%.
3 Experimental set-up
Figure 1 shows the experimental set-up for studying theMHCD plasmas. The electrodes of our open MHCD are100 μm thick molybdenum sheet separated by a 250 μmdielectric with opening varying from 200 to 1000 μm (di-ameter D) through cathode, dielectric, and anode. Sus-taining glow discharge voltages were in the range of 200–400 V for Ar, for static MHCD. Discharge currents Id var-ied between 0.1 and 15 mA. The experiments were carriedout for pd range between 0.3 and 14 Torr/cm. The oper-ating gas was moderate to high-pressure Ar, between 12and 800 Torr. For static MHCD, the electrode system wasplaced in a cylindrical quartz chamber with 10 cm diam-eter and 16 cm length. Before each experiment the cham-ber was cleaned, dried and evacuated to about 1 m Torr.After that, the chamber was filled with pure argon gasand placed at the desired pressure. Resistors of 47 KΩwere used to limit the discharge current. A digital camerawas used also to record pictures of the glow discharges. Apicoammeter model 414S from Keithley and digital volt-meter from Minipa were used to measure the current andvoltage in the pre-breakdown phase.
To study the dynamic mode MHCD, the gas used inspectroscopic experiment was a mixture of Ar + 2%H2.The Ar and H2 plasmogenic gases, of 99.99% purity, wereconnected to the MHCD through mass flow controllerstype MKS 247C. The Ar and H2 flow was 700 sccm and15 sccm, respectively. The MHCD was connected to theopen end of a Teflon tube and the gas flow passes over thedevice borehole from anode to cathode side. To study theplasma parameters the radiation emitted from the cath-ode borehole was focused onto optical fiber of 1 mm innerdiameter aperture by means of a convergent lens. This ra-diation was send to the entrance slit (width of 100 μm)of 1 m Czerny-Turner monochromator (THR1000) made
0 2 4 6 8 10 12
270
280
290
300
310
320
330E
DC
B
A
Vd (
V)
Id (mA)
Fig. 2. I−V characteristic curve for a hole diameter of 400 μmat 40 Torr. For A–B, B–C, C–D and D–E regions, see text.
by Jobin-Yvon. The monochromator was equipped with aholographic diffraction grating of 1800 lines mm−1, blazedat 580.0 nm. The radiation was collimated at the exitslit where a photomultiplier tube (PMT), converts pho-tons into an electric signal. The current generated bythe PMT was sent to data acquisition electronics, wherethe signal was processed by software. The optical sys-tem was absolutely calibrated with the aid of a tungstenlamp. The instrumental FWHM was obtained from Arlow-pressure lamp and found to be 0.0463 nm. We usedthe Hg 435.8 nm strong line to measure the instrumentalbroadening for this entrance slit using Gaussian fit. TheFWHM are mainly instrumental because at this pressureall other broadening contributions are negligible.
4 Results and discussion
4.1 Electrical parameters
Figure 2 shows the evolution of the current with the ap-plied voltage to an open static MHCD in Ar, at 40 Torr. Asit can be seen the low current abnormal mode (AB region)is present, which is characterized by a positive differentialresistance. A self-pulsed mode (BC region) appearing forcurrents of 0.6 mA can be remarked by a voltage drop withcurrent increase, i.e. the negative differential resistance.This region is characterized by high efficiency in ions andmetastable species producing inside the cathode cavity.The confinement of the discharge inside the hole can beseen by the optical appearance of the glow. Increasing thedischarge current, one can observe a gradually expansionbeyond the cavity, covering the cathode surface. The nor-mal glow discharge mode is seen in the CD region wherethe voltage is held constant as the current increases. Af-ter point D the discharge shifts to a high-current abnormalglow discharge (DE region), where a positive slope in thecurrent-voltage characteristics is observed. We avoid gen-erally the abnormal mode of operation due to overheatingof the sample. However, limiting the cathode surface area,the positive slope in I − V curve is always present.
B.N. Sismanoglu et al.: Spectroscopic measurements and electrical diagnostics of microhollow cathode discharges... 509
0 2 4 6 8 10250
300
350
400
450
Vd (
V)
Id (mA)
p (Torr) 12 40 100 180 350 500 620 710 800
Fig. 3. (Color online) I − V characteristic curve for openMHCD operated in Ar with hole diameters of 200 μm as afunction of current and pressure.
Figure 3 shows I − V characteristics of an open staticMHCD (Mo foils) in Ar, pressure range of 12–800 Torr,for current ranging from 0 to 8 mA. With the pressureincrease, the sustaining voltage decreases due to more fa-vorable conditions for ionization. The curves plotted inFigure 3 refer to the self-pulsed and normal mode of oper-ation. The discharge mode described by a negative differ-ential resistance was attributed by Schoenbach et al. [31]to the onset of the classical hollow cathode effects, wherehigh ionization efficiency is due to pendulum electrons.Meanwhile, calculations showed that cavity electrons donot have enough energy to do ionizing collisions. Albertet al. [32] showed that BC region (Fig. 2) is characterizedby self-pulsed mode of operation, where the frequency isdriven by the capacitance of the MHCD and by the av-eraged current delivered by the power supply. The High-pressure MHCD operation is expected to be governed byother processes of ionization due to the more efficient ionsproducing, photons and metastable excited atoms, caus-ing secondary electron emission from the cathode. In Fig-ure 3 we note that pD (D = 200 μm) varies between0.24 to 16 Torr cm limit being larger than the theoretical1 Torr cm for Ar, predicted by the Allis-White law [3,4].This was observed by Schoenbach et al. [33], indicatingthat others mechanisms than the classical hollow cathodedischarges are influencing the discharge maintenance. InFigure 3 the total uncertainty (statistical and systematicerrors) of the measured Vd was about 3% for the MHCD of200 μm and this value has been attributed to the voltageinstabilities.
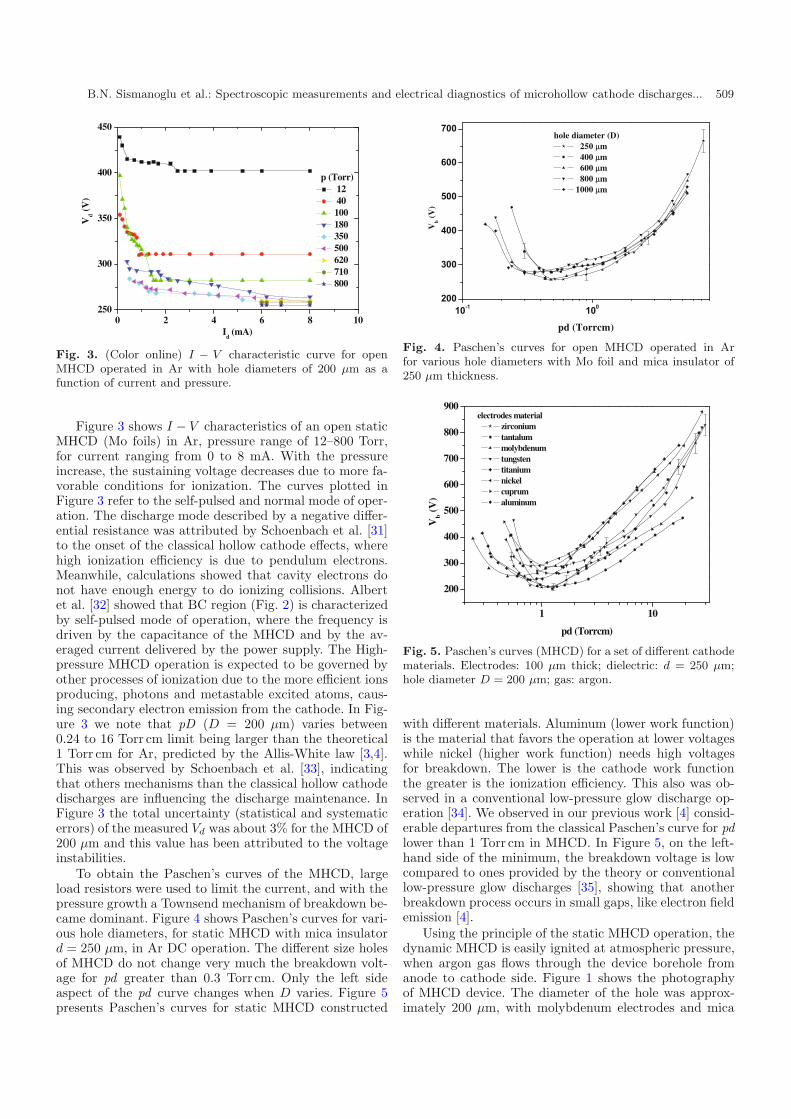
To obtain the Paschen’s curves of the MHCD, largeload resistors were used to limit the current, and with thepressure growth a Townsend mechanism of breakdown be-came dominant. Figure 4 shows Paschen’s curves for vari-ous hole diameters, for static MHCD with mica insulatord = 250 μm, in Ar DC operation. The different size holesof MHCD do not change very much the breakdown volt-age for pd greater than 0.3 Torr cm. Only the left sideaspect of the pd curve changes when D varies. Figure 5presents Paschen’s curves for static MHCD constructed
10-1 100200
300
400
500
600
700
Vb (V
)
pd (Torrcm)
hole diameter (D) 250 μm 400 μm 600 μm 800 μm 1000 μm
Fig. 4. Paschen’s curves for open MHCD operated in Arfor various hole diameters with Mo foil and mica insulator of250 μm thickness.
1 10
200
300
400
500
600
700
800
900
Vb (
V)
pd (Torrcm)
electrodes material zirconium tantalum molybdenum tungsten titanium nickel cuprum aluminum
Fig. 5. Paschen’s curves (MHCD) for a set of different cathodematerials. Electrodes: 100 μm thick; dielectric: d = 250 μm;hole diameter D = 200 μm; gas: argon.
with different materials. Aluminum (lower work function)is the material that favors the operation at lower voltageswhile nickel (higher work function) needs high voltagesfor breakdown. The lower is the cathode work functionthe greater is the ionization efficiency. This also was ob-served in a conventional low-pressure glow discharge op-eration [34]. We observed in our previous work [4] consid-erable departures from the classical Paschen’s curve for pdlower than 1 Torr cm in MHCD. In Figure 5, on the left-hand side of the minimum, the breakdown voltage is lowcompared to ones provided by the theory or conventionallow-pressure glow discharges [35], showing that anotherbreakdown process occurs in small gaps, like electron fieldemission [4].
Using the principle of the static MHCD operation, thedynamic MHCD is easily ignited at atmospheric pressure,when argon gas flows through the device borehole fromanode to cathode side. Figure 1 shows the photographyof MHCD device. The diameter of the hole was approx-imately 200 μm, with molybdenum electrodes and mica

510 The European Physical Journal D
Fig. 6. (Color online) Current voltage curve for MHCD in aAr + 2%H2 gas flow in open air and end on photography ofthe plasma inside the cathode aperture.
as dielectric. Due to the low intensity of light emitted bymicrodischarge, we opted to collect the radiation on axis(Fig. 1). The convergent lens and optical fiber were posi-tioned axially in front of the cathode opening hole.
The emitted radiation was send to the monochroma-tor. The advantage of this type of axial view is that thedetection capacity of the monochromator increases con-siderably. Figure 6 depicts the current-voltage character-istics of an open MHCD in argon flow for current rangingfrom 7 to 15 mA. The discharge voltage is lower thanthat observed in static mode and larger currents could bepractically reached in the normal mode (∼230 V). Refer-ence [36] measured gas voltage of about 200 V at 3 mA instatic argon MHCD. One can see in Figure 6 that in flowregime, the discharge starts at high current (comparedto the static mode, Fig. 3) due to the reduced thermalstress, and the current-voltage characteristic shows a pos-itive slope from 12 mA. For currents above 15 mA it wasobserved generation of sparks that damage the device, ina transition to arc.
4.2 OES measurements
MHCD in argon flow at atmospheric open air with molyb-denum electrodes was used to determine the excitationTexc and electron temperature Te. Three different meth-ods were employed: (1) two Molybdenum lines method(Texc); (2) Boltzmann-plot method (Fig. 7), for Ar 4p–4sand 5p–4s transition lines (Texc); (3) Ar 603.213 nm and565.070 nm lines method that permits simultaneously toobtain Te and ne (will be shown later). For current rangingfrom 7 to 15 mA, Texc
∼= (7000 ± 300) K for the first twomethods and Te
∼= (8500 ± 1000) K for Ar lines method.For Boltzmann-plot method it was recorded the emissionintensity of a series of Ar lines from 400 to 820 nm (Fig. 8),with corrected intensities for the spectral response of themonochromator. Finally from the plot ln(Iulλul/guAul)versus the energy Eu, one can estimate the excitation tem-perature from the slope of the best linear fit (Fig. 7).
13.0 13.2 13.4 13.6 13.8 14.0 14.2 14.4 14.6 14.8 15.0
1.0
1.5
2.0
2.5
3.0
3.5
4.0
linear fit
Ar 5p - 4s
Ar 4p - 4s
Y = A+Bx = 25.24 - (1.65 ± 0.03)xTexc = (7036 ± 128)K
ln(I ul
λ ul/g
uA ul)
Eu(eV)
Fig. 7. (Color online) Boltzmann plot for both Ar levels 4p–4sand 5p–4s, the line slope is −1/KBTexc for MHCD in argonflow at atmospheric open air, at 10 mA.
The emission of high intensity of Ar lines correspond-ing to the 5p–4s transitions indicates high electron tem-peratures in the investigated region. The difference be-tween Te and Texc was already observed in the litera-ture [37] and the explanation is that the excitation tem-perature is the one obtained from the upper excited statesdistribution, which corresponds to a part of electrons ofthe energy distribution function. The temperature of thetwo Ar lines could be associated with the electrons temper-ature because this method takes into account a significantpart of the electrons energy distribution function.
The presence of Ar+ lines in the microplasma spectrafrom 400 to 450 nm (Tab. 2) shows that electrons withenergies between 13 and 24 eV are present in the plasmabulk, which populates the tail of the electrons energy dis-tribution function. The presence of these argon ions iscommonly observed in low-pressure plasmas but not inhigh-pressure discharges. Differently to our microplasma,the references [30,37–40] do not mention the presence ofthese intense lines at atmospheric pressure plasma andreference [37] states that Ar 5p–4s transitions are almostnegligible, indicating low electrons temperature in theirRF microplasma.
When applying two Mo lines method, the wavelengthregion of 440 to 452 nm was considered because of the ex-istence of atomic lines of the excited molybdenum. Theseatoms are released from the cathode surface by the bom-bardment of Ar+, and are excited in the region of negativeglow. The most appropriate lines for the applicability ofthis method are shown in Table 1.
After a Lorentzian fitting of each Mo measured linethe intensity was obtained by the area under the fittingcurve. To confirm the presence of these lines and not toconfuse them with others, especially by Ar+ lines, thebackground was removed from the measured spectrum.For this wavelength region the molybdenum cathode wasreplaced by copper one because of absence of line copperemission there.
In Figure 9 the gas temperature is obtained from theanalysis of the rotational band of OH, Q1 branch and from

B.N. Sismanoglu et al.: Spectroscopic measurements and electrical diagnostics of microhollow cathode discharges... 511
420 430 440 4500
200
400
600
800
1000
1200
1400
1600
1800In
tens
ity (a
. u.)
Wavelength (nm)
(a)
700 720 740 760 780 800 820
0
100000
200000
300000
400000
500000
Inte
nsity
(a. u
.)
Wavelength (nm)
(b)
Fig. 8. (a) Ar 5p–4s line transitions and Ar+ lines in the region of 400 to 450 nm and (b) Ar 4p–4s strong transitions in theregion of 700 to 820 nm in MHCD in argon flow.
Table 2. Ar and Ar+ lines parameters [27].
Line λ (nm) Up. state (u) Low. state (l) Eu (eV) El (eV) gu gl Aul(108 s−1)
Ar 415.859 5p 4s 14.56 11.55 5 5 0.0140
Ar 416.418 5p 4s 14.53 11.55 3 5 0.00288
Ar 418.188 5p 4s 14.69 11.72 3 1 0.00561
Ar 419.071 5p 4s 14.51 11.55 5 5 0.00280
Ar 419.832 5p 4s 14.58 11.62 1 3 0.0257
Ar 420.068 5p 4s 14.50 11.55 7 5 0.00967
Ar 425.936 5p 4s 14.74 11.83 1 3 0.0398
Ar 427.217 5p 4s 14.52 11.62 1 1 0.00797
Ar+ 427.753 4p 4s 21.35 18.45 4 6 0.800
Ar+ 433.356 5p 4s 14.69 11.83 5 3 0.00568
Ar+ 434.806 4p 4s 19.49 16.64 8 6 1.171
Ar+ 437.133 4p 3d 19.26 16.43 4 6 0.221
Ar+ 437.595 4p 4s 19.97 17.14 2 4 0.205
Ar+ 437.967 4p 4s 19.64 16.81 2 2 1.004
Ar+ 440.099 4p 3d 19.22 16.41 6 8 0.304
Ar+ 442.600 4p 4s 19.55 16.75 6 4 0.817
Ar+ 444.888 5s 4p 24.28 21.50 6 6 0.650
Ar+ 447.476 4p 3d 21.43 18.66 2 4 0.290
Ar 452.232 5p 4s 14.46 11.72 3 1 0.000898
Ar 706.722 4p 4s 13.30 11.55 5 5 0.0380
Ar 714.704 4p 4s 13.28 11.55 3 5 0.00625
Ar 727.294 4p 4s 13.33 11.62 3 3 0.0183
Ar 738.398 4p 4s 13.30 11.62 5 3 0.0847
Ar 750.387 4p 4s 13.48 11.83 1 3 0.445
Ar 751.465 4p 4s 13.27 11.62 1 3 0.402
Ar 763.511 4p 4s 13.17 11.55 5 5 0.245
Ar 794.818 4p 4s 13.28 11.72 3 1 0.186
Ar 800.616 4p 4s 13.17 11.62 5 3 0.0490
Ar 801.479 4p 4s 13.09 11.55 5 5 0.0928
Ar 810.369 4p 4s 13.15 11.62 3 3 0.250
Ar 811.531 4p 4s 13.08 11.55 7 5 0.331

512 The European Physical Journal D
6.4x10⁻¹⁹ 6.6x10⁻¹⁹ 6.8x10-193
4
5
6
7
linear fitY = 76.10 - (1.09 ± 0.08)E20X
Tg = (658.3 ± 49.1)Kln
(I 0λ/
A)
Eu (J)
(a)
6 8 10 12 14 16400
440
480
520
560
600
640
680
720 (b) Tg: from OH Tg: from 603.213nm Ar electron number density
current (mA)
gas
tem
pera
ture
(K)
1
2
3
4
5electron num
ber density (10 14cm-3)
Fig. 9. (Color online) (a) OH rotational temperature plot method for Id = 15 mA and (b) gas temperature from two methodsfor a range of current.
485.4 485.6 485.8 486.0 486.2 486.4 486.6 486.8
100
150
200
250
300
350
400
450
486.742nm
Hβ
486.584nm
half widht
Inte
nsity
(a.
u.)
wavelength (nm)
Fig. 10. (Color online) Hβ spectral profile showing HWHM.
Ar 603.213 nm spectral line broadening (described below).The gas temperature increases with the current in thesetwo cases with good concordance within the experimentalerrors.
The Ar line method for gas temperature measure-ment procedure is as follow. As shown in Table 3, theAr 603.213 nm is mainly dominated by Van der Waalsbroadening, therefore, it is a suitable line for measurementof the gas temperature. Doppler broadening is negligibleand so the Gaussian component is mainly due to the in-strument (ΔλI = 0.0463 nm). After deconvolution [14],the Lorentzian profile is obtained. From the Hβ profile ne
may be estimated and, finally, Tg may be obtained. Thismethod has been used for high-pressure plasmas in thefollowing papers [10,28]. Attention must be paid for cor-rection of the line asymmetry [41]. The 603.210 nm linebroadening yields the gas temperature as a function ofcurrent with a similar trend to that of the gas tempera-ture obtained from the OH method, being approximatelyequal within the experimental error.
The Hβ spectral profile is shown in Figure 10, whereit can be seen two Ar+ lines at the right-hand side of the
line. Thereby, a correction must be made to deconvolveHβ from these adjacent lines.
The electron number density (ne) is estimated fromtwo methods: (a) Hβ line and (b) from Ar 603.213 nm and565.070 nm lines methods. From Hβ line method, we canchoose Th = Tg as a first approximation and calculate ne
from GIG-CARD table, using equation (1). GIG-CARDmaps also gives practically same ne values for this range ofcurrent, showing the invariance of the line broadening withelectron temperature. ne varies from 1.9 to 3.9×1014 cm−3
in the current range 7–15 mA (Tab. 4). In Tables 3 and 4the errors are due to propagation of uncertainties resultingfrom three random measurements. From Ar 603.213 nmand 565.070 nm lines we obtain ne and Te by solving si-multaneously equations (4) and (5) and yielded a densityof 2.4 to 4.5 × 1014 cm−3 and Te
∼= (8500 ± 1000) K forthis range of current. The FWHM of these Ar lines aregiven in Tables 3 and 5.
The results are in a good agreement showing that ne
increases with the current as should be for glow discharges.The errors in ne from Ar lines method are larger due tothe small Stark broadening, mainly at low current, com-pared with de Hβ line method. In recent papers, there aresome results for ne and Tg for atmospheric pressure staticopen MHCD in argon [36,42]. The results are ne ∼ 1015
to 1016 cm−3, Tg ∼ 2000 K and Texc ∼ 10 000 K for cur-rents ranging from 3 to 10 mA. In our dynamic MHCDthe gas temperature is lower because the plasma and theelectrodes are cooled by the argon flux. The difference be-tween Te and Texc may be related to the non-Boltzmanndistribution of the free electrons energy. The tail of thisdistribution is populated by electrons with high energy,but the electron number density is not high enough toequate this electron energy distribution with the electronexcitation distribution.
5 Analytical description of microdischarges
An electrical measurement has been described in microdis-charges set with spherical cavity at 100 Torr [43]. Usingboth Langmuir probes and analytical approaches, yield

B.N. Sismanoglu et al.: Spectroscopic measurements and electrical diagnostics of microhollow cathode discharges... 513
Table 3. FWHM and gas parameters of Ar 603.213 line.
Id (mA) ΔλD(nm) ΔλW (nm) ΔλL (nm) Tg (K) ne (1014 cm3)
7 0.0014 0.055 0.061 450 ± 20 2.4 ± 0.3
9 0.0015 0.051 0.059 496 ± 34 3.3 ± 0.3
11 0.0016 0.049 0.058 520 ± 34 3.7 ± 0.3
13 0.0017 0.045 0.055 600 ± 66 4.1 ± 0.2
15 0.0017 0.043 0.054 630 ± 60 4.5 ± 0.2
Table 4. FWHM and gas parameters of Hβ line.
Id (mA) ΔλD (nm) ΔλW (nm) ΔλL (nm) Tg (K) ne (1014 cm3) ΔλS (nm)
7 0.0077 0.059 0.127 493 ± 48 1.94 ± 0.21 0.068
9 0.0082 0.055 0.149 549 ± 47 3.13 ± 0.04 0.094
11 0.0085 0.052 0.156 594 ± 50 3.65 ± 0.21 0.105
13 0.0086 0.051 0.160 609 ± 39 3.86 ± 0.16 0.109
15 0.0089 0.048 0.158 658 ± 49 3.93 ± 0.16 0.110
Table 5. FWHM and gas parameters of Ar 565.070 line.
Id (mA) ΔλD(nm) ΔλW (nm) ΔλL (nm) Tg (K) ne (1014 cm3)
7 0.0014 0.046 0.051 450 ± 20 2.4 ± 0.3
9 0.0014 0.043 0.049 496 ± 34 3.3 ± 0.3
11 0.0015 0.042 0.049 520 ± 34 3.7 ± 0.3
13 0.0016 0.038 0.045 600 ± 66 4.1 ± 0.2
15 0.0016 0.036 0.044 630 ± 60 4.5 ± 0.2
that the plasma contains at least 2.0×10¹³ electrons/cm3.We used the continuity equation associated to a recentdata of mobility and diffusion coefficient in order to esti-mate the ion and electron number density in the plasmabulk for a cylindrical high-pressure DC static MHCD. Letus consider a circular cylindrical shape hollow cathodewith length L and base radius R. The ionization rate inthis configuration can be described in a circular cylindricalcoordinates by:
Rprod(ρ, z) = Rprod(ρ)Rprod(z) = υionni(ρ, z) (8)
where ρ and z are the radius and longitudinal length re-spectively, Rprod is the ionization rate, νion is the ioniza-tion frequency and ni(ρ, z) is the ion density. Our sys-tem has azimuth angle symmetry and therefore this anglewas not considered. The electric field is not uniform inthe cavity and its radial component is more intense com-pared with de axial component. That may be explained bythe fact that practically all sustained voltage (Vd) dropsacross cathode sheath region (cathode fall Vc), mainly athigh pressures. The steady-state ion distribution ni(ρ, z)for this configuration refers to ambipolar diffusion in acircular cylindrical system, and neglecting any loss by re-combination (not considering bulk sources of annihilationof particles), will be:
Da
[1ρ
∂
∂ρ
(ρ∂ni(ρ, z)
∂ρ
)+
∂2ni
(ρ, z)∂2
z
]= −νionni(ρ, z)
(9)
where Da is the coefficient of ambipolar diffusion. We canassume that ni(ρ, z) is not simultaneously dependent ofρ and z and, using the method of separations of vari-ables, we can write ni(ρ, z) = ni(ρ)ni(z). Then, the so-lutions are ni(z) = A cos(zπ/L), with boundary condi-tions ni(z = ±L/2) = 0 and ni(z = 0) = A, andni(ρ) = BJ0(2.405ρ/ρ0). This is the Bessel solution ofzero order, with the imposed condition ni(ρ0) = 0, whereρ0 is the physical limit of the existence of the sheath at thecathode wall, practically the same as R in high-pressureglow plasma operations.
From a physical point of view we can expect ion gen-eration in the region of negative glow to rise rapidly to amaximum near the edge of cathode sheath and then falloff slowly as the electrons lose energy [43]. These electronswere ejected from cathode surface by ion bombardmentand are accelerated in radial direction due to a huge poten-tial gradient at the cathode sheath region. Thus, the iondistribution in a radial dependence can be convenientlyrepresented by an expression of the form [43]:
Rprod(ρ) = K
[(ρ
ρ0
)n
−(
ρ
ρ0
)n+1]
(10)
where n is a number that depends on the mean free pathof the electrons collisions. Large values of n are character-istic of a distribution which rises sharply to a maximumclose to the sheath edge, then ρ0 at the point is given byρmax = ρ0n/(n + 1). We will see further that K in this

514 The European Physical Journal D
equation is a function of discharge parameters like cur-rent, secondary emission coefficient and cathode cavitiesdiameter. High-pressure operations results in a large n andhigh ionization rates too.
By carrying out the integrations of equation (9) andwith the use of equation (10), the general solution forni(ρ, z) will be:
ni(ρ, z) =Kρ2
0
Da
{1
(n + 3)2
[(ρ
ρ0
)n+3
− 1
]
− 1(n + 2)2
[(ρ
ρ0
)n+2
− 1
]}A cos
(πz
L
)(11)
and for Rprod(ρ, z),
Rprod(ρ, z) = KA cos(πz
L
) [(ρ
ρ0
)n
−(
ρ
ρ0
)n+1]
+Kπ2ρ2
0A
L2cos
(πz
L
) {1
(n + 3)2
[(ρ
ρ0
)n+3
− 1
]
− 1(n + 2)2
[(ρ
ρ0
)n+2
− 1
]}. (12)
The maximum ion production rate Rprod(ρ, z = 0) is lo-cated at a point close to ρmax = ρ0n/(n + 1), because thesecond term at the right-hand side of equation (12) is verysmall compared with the first term. The rate at which ionsleave the plasma can be given by:
Γ =∫V
RproddV = 2π
ρ0∫0
L/2∫−L/2
Rprod(ρ, z)ρdρdz. (13)
For the case where all secondary electrons are produced byions leaving the plasma, Γ = Id/(1 + γ)e (where Id is thedischarge current, γ is the secondary emission coefficientfor ions impact and e is electron charge) [43]. By carryingout the integrations, equation (13) results:
Γ =4KALρ2
0
(n + 2)(n + 3)+
4Kπ2ρ40A
L
×[
3(n + 1)(n + 2)2(n + 4)
− 4(n + 1)(n + 3)2(n + 5)
]
(14)
and, therefore, the maximum ion density, ni(ρ = 0, z = 0),will be:
ni (0, 0) =(2n + 5) Id
Da (n + 3)2 (n + 2)2 (1 + γ) e[
4L(n+2)(n+3) + 4π2ρ2
0L (C)
](15)
where
C =3
(n + 1) (n + 2)2 (n + 4)− 4
(n + 1) (n + 3)2 (n + 5).
Let us apply equation (15) for MHCD in argon at atmo-spheric pressure, with L = 100 μm and R = 100 μm. First,we need to calculate the parameter n for this particularcase. A mean free path (λ) for ionization by electrons colli-sion is defined like the mean distance an electron traversesbetween two successive collisions against gas neutrals par-ticles with sufficient energy to transform this neutrals intoions. After this collision electrons energy drops. The dis-tributions of the free paths is given by n(x) = n0e
−x/λ,where n(x) is the number of electrons that reach a dis-tance x without collision. Then, the probability of colli-sion is given by P = 1 − n(x). Secondary electrons areknocked out from the cathode surface and gain kineticenergy through cathode sheath gap and enter inside thenegative glow region, traversing a distance x = λ, and hasabout 63% of probability to produce charged particles.λ will be taken as approximately equal to (ρ0 − ρmax),where ρmax is the radius of maximum ionization. Frompλ = 0.03 cm Torr [39], we get λ = 3.95 × 10⁻⁵ cm andρmax = 9.96× 10⁻³ cm. Then, ρmax/ρ0 = 0.997 and, con-sequently n/(n + 1) = 0.997, and n = 332. We can notethat for high pressure, n is large for a very small cathodesheath thickness. The diffusion coefficient for electrons inair is given by (De)T0
∼= 6.3× 10⁵/p (Torr cm2/s) at roomtemperature T0 [35]. For higher temperatures, we admitthat Dep (and μep) varies linearly with the temperature:
(Dep)T =T
T0(Dep)T0 . (16)
The electron mobility is given by (μeP )T0 = 0.33 ×10⁶(cm2 Torr/Vs) [35] and the ion mobility can be esti-mated by Langevin equation:
μi =2.7 × 10⁴
√1 + M/Mi
P (Torr)√
(α/a30)A
(17)
where A is the atomic weight, α is the argon polarizability,a0 is Bohr radius, M and Mi the neutral and ion mass,respectively.
Let us consider the ions formed basically by Ar+. Thus,(μiP )T0 = 1576 (cm2 Torr/V s). In the case of MHCDTe > Ti and, therefore, Da
∼= Deμi/μe [35]. Table 6 showsthe results for ion density (ni) obtained from analyticalmodel for static MHCD, with the order of magnitude ofabout 1015 cm−3. Franzke’s group [36] has measured 1015
to 1016 cm−3 for electron number density for static argonMHCD. In reality, in this reference, the measured gas tem-perature varied from 500 at 75 Torr to 2000 K at 750 Torrand one may obtain better agreement between these re-sults increasing the gas temperature in the above model,consequently increasing the coefficient of ambipolar diffu-sion and so ni. The results from Table 6 show that the iondensity increases with the current as should be for glowdischarges. This behavior was also observed in Section 3from spectroscopic measurements of electron number den-sity for dynamic MHCD (Tab. 6, last column).
The great variation observed in ion density distribu-tion inside the hole, between cathode surface and the cen-ter of cylinder (ρ = 0), determine the plasma existence and

B.N. Sismanoglu et al.: Spectroscopic measurements and electrical diagnostics of microhollow cathode discharges... 515
Table 6. MHCD parameters and results for ni (static mode) and ne (dynamic mode), where the latter is obtained fromspectroscopic measurements (Fig. 9).
Id (mA) T (K) De (cm2/s) μe (cm2/V s) μi (cm2/V s) Da (cm2/s) ni (cm−3) ne (1014 cm−3)
7 493 1.46 × 10³ 765 3.7 7.1 3.7 × 10¹⁴ 1.94 ± 0.21
9 549 1.63 × 10³ 852 4.1 7.8 4.3 × 10¹⁴ 3.13 ± 0.04
11 594 1.76 × 10³ 922 4.5 8.6 4.8 × 10¹⁴ 3.65 ± 0.21
13 609 1.80 × 10³ 945 4.6 8.8 5.5 × 10¹⁴ 3.86 ± 0.16
15 658 1.95 × 10³ 1021 4.9 9.4 6.0 × 10¹⁴ 3.93 ± 0.16
ambipolar diffusion and, for that, Δni/ni∼= (dDe/R)2 � 1
would be satisfied [44], where
dDe =
√ε0KBTe
e2n(18)
is Debye length. Therefore, for our case, dDe∼= 3.3 ×
10−5 cm and (dDe/R)2 ∼= 10−5, and the conditions ofplasma existence are satisfied.
6 Conclusions
Electrical parameter has been studied for static DCMHCD. Emission spectroscopy and power measurementswere employed to study a DC MHCD in a Ar + 2% H2
gas flow at atmospheric pressure in open air. Hβ Balmerline and Ar 603.213 nm and 565.070 nm lines were used tocharacterize the plasma bulk formed in the cathode bore-hole. Gas temperature was estimated from two methods:from OH radical Q1 branch and from Ar 603.213 nm line.The measured gas temperature was in the ranges from 460to 640 K for current ranging from 7 to 15 mA, lower thanthat for static MHCD (∼2000 K). The electron excitationtemperature was estimated from Mo two lines method andwas below the electron temperature. This latter was ob-tained using two Ar lines (8500 K). The electron numberdensity was measured both from Hβ line Stark broadening(it ranges from 2–4 × 1014 cm−3 for this current range),and from Ar 603.213 nm and 565.070 nm lines broaden-ings (2.4 to 4.5 × 1014 cm−3). An analytical descriptiongives electron number density for static MHCD in goodconcordance with results from literature.
References
1. R. Foest, M. Schmidt, K. Becker, Int. J. Mass Spectrom.248, 87 (2005)
2. K.H. Becker, K.H. Schoenbach, J.G. Eden, J. Phys. D 39,R55 (2006)
3. E.E. Kunhardt, IEEE Trans. Plasma Sci. 28, 189 (2000)4. B.N. Sismanoglu, J. Amorim, Eur. Phys. J. Appl. Phys.
41, 165 (2008)5. C. Tendero, C. Tixier, P. Tristant, J. Desmaison, P.
Leprince, Spectrochim. Acta B 61, 2 (2006)6. S.D. Angel, A. Simon, Plasma Source. Sci. Technol. 16,
B1 (2007)
7. T. Kikuchi, Y. Hasegawa, H. Shirai, J. Phys. D 37, 1537(2004)
8. L. Baars-Hibbe, P. Sichler, C. Schrader, N. Lucas, K.H.Gericke, S. Buttgenbach, J. Phys. D 38, 510 (2005)
9. D. Staack, B. Farouk, A. Gutsol, A. Fridman, PlasmaSource. Sci. Technol. 17, 025013 (2008)
10. B.N. Sismanoglu, J. Amorim, J.A. Souza-Correa, C.Oliveira, M.P. Gomes, Spectrochim. Acta B 64, 1287(2009)
11. H.R. Griem, Plasma Spectroscopy (McGraw-Hill, NewYork, 1964)
12. H.R. Griem, Principles of Plasma Spectroscopy(University Press, Cambridge, 1997)
13. C. Penache, M. Miclea, O. Hohn, S. Schoessler, T. Jahnke,K. Niemax, H. Schmidt-Boecking, Plasma Source. Sci.Technol. 11, 476 (2002)
14. G.M. Petrov, J. Quant. Spectrosc. Radiat. Transfer 72,281 (2002)
15. H.G. Kuhn, Atomic Spectra (Academic Press, New York,1969)
16. C. Oliveira, J.A. Souza-Correa, M.P. Gomes, B.N.Sismanoglu, J. Amorim, Appl. Phys. Lett. 93, 041503(2008)
17. N. Konjevic, Phys. Rep. 316, 339 (1999)18. W.R. Hindmarsh, A.D. Petford, G. Smith, Proc. Roy. Soc.
Lond. A 297, 296 (1967)19. H.R. Griem, Contrib. Plasma Phys. 40, 46 (2000)20. M.A. Gigosos, M.A. Gonzalez, V. Cardenoso, Spectrochim.
Acta B 58, 1489 (2003)21. H.R. Griem, Spectral line broadening by plasmas
(Academic Press, New York, 1974)22. M.A. Gigosos, V. Cardenoso, J. Phys. B: At. Mol. Opt.
Phys. 29, 4795 (1996)23. J. Cooper, E.W. Smith, C.R. Vidal, J. Phys. B: At. Mol.
Phys. 7, L101 (1974)24. C.O. Laux, T.G. Spence, C.H. Kruger, R.N. Zare, Plasma
Source. Sci. Technol. 12, 125 (2003)25. C. Yubero, M.C. Garcia, M.D. Calzada, Spectrochim. Acta
B 61, 540 (2006)26. A. Sola, M.D. Calzada, A. Gamero, J. Phys. D 28, 1099
(1995)27. www.nist.gov, accessed in February 201028. C. Yubero, M.S. Dimitrijevic, M.C. Garcıa, M.D. Calzada,
Spectrochim. Acta B 62, 169 (2007)29. M.D. Calzada, Memor. Soc. Astronom. Ital. 7, 198 (2005)30. J. Happold, P. Lindner, B. Roth, J. Phys. D 39, 3615
(2006)31. K.H. Schoenbach, A. El-Habachi, W. Shi, M. Ciocca,
Plasma Source. Sci. Technol. 6, 468 (1997)32. X. Aubert, G. Bauville, J. Guillon, B. Lacour, V. Puech,
A. Rousseau, Plasma Source. Sci. Technol. 16, 23 (2007)

516 The European Physical Journal D
33. K.H. Schoenbach, M. Moselhy, W. Shu, R. Bentley, J. Vac.Sci. Technol. A 21, 1260 (2003)
34. H.D. Hagstrom, Phys. Rev. 104, 309 (1956)35. Yu.P. Raizer, Gas Discharge Physics (Springer-Verlag,
New York, 1997)36. M. Miclea, K. Kunze, U. Heitmann, S. Florek, J. Franzke,
K. Niemax, J. Phys. D 38, 1709 (2005)37. M.D. Calzada, M. Moisan, A. Gamero, A. Sola, J. Appl.
Phys. 80, 46 (1996)38. M. Christova, E. Castanos-Martinez, M.D. Calzada, Y.
Kabouzi, J.M. Luque, M. Moisan, Appl. Spectrosc. 58,1032 (2004)
39. S. Yugeswaran, V. Selvarajan, Vacuum 81, 347(2006)
40. A. Yanguas-Gil, K. Focke, J. Benedikt, A. von Keudell, J.Appl. Phys. 101, 1033071 (2007)
41. S. Djurovic, R. Kobilarov, B. Vujicic, Bull. Astron.Belgrade 153, 41 (1996)
42. M. Moselhy, K.F. Petzenhauser, K.H. Schoenbach, J. Phys.D 36, 2922 (2003)
43. A.D. White, J. Appl. Phys. 30, 711 (1959)44. M.A. Liebermann, A.J. Lichtenberg, Principles of Plasma
Discharges and Materials Processing (John Wiley & SonsInc., New York, 1994)