Matuyama–Brunhes reversal and Kamikatsura event on Maui: paleomagnetic directions, 40Ar/ 39Ar ages...
18
Matuyama–Brunhes reversal and Kamikatsura event on Maui: paleomagnetic directions, 40 Ar/ 39 Ar ages and implications $ Robert S. Coe a, * , Brad S. Singer b , Malcolm S. Pringle c , Xixi Zhao a a Earth Sciences Department, University of California, Santa Cruz, CA 95064, USA b Department of Geology and Geophysics, University of Wisconsin, Madison, WI 53706, USA c Scottish Universities Research and Reactor Centre, East Kilbride, G75 OQF, Scotland, UK Received 12 June 2003; received in revised form 27 February 2004; accepted 1 March 2004 Abstract Eighty-nine basaltic lava flows from the northwest wall of Haleakala caldera preserve a concatenated paleomagnetic record of portions of the Matuyama – Brunhes (M – B) reversal and the preceding Kamikatsura event as well as secular variation of the full-polarity reversed and normal geomagnetic field. They provide the most detailed volcanic record to date of the M – B transition. The 24 flows in the transition zone show for the first time transitional virtual geomagnetic poles (VGPs) that move from reverse to normal along the Americas, concluding with an oscillation in the Pacific Ocean to a cluster of VGPs east of New Zealand and back finally to stable polarity in the north polar region. All but one of the 16 Kamikatsura VGPs cluster in central South America. The full-polarity flows, with 40 Ar/ 39 Ar ages spanning a total of 680 kyr, pass a reversal test and give an average VGP insignificantly different from the rotation axis, with standard deviation consistent with that for other 0 – 5 Ma lava flows of similar latitude. Precise 40 Ar/ 39 Ar dating consisting of 31 incremental heating experiments on 12 transitional flows yields weighted mean ages of 775.6 F 1.9 and 900.3 F 4.7 ka for the M–B and Kamikatsura transitional flows, respectively. This Matuyama –Brunhes age is f 16 kyr younger than ages for M–B flows from the Canary Islands, Tahiti and Chile that were dated using exactly the same techniques and standards, suggesting that this polarity transition may have taken considerably longer to complete and been more complex than is generally believed for reversals. D 2004 Elsevier B.V. All rights reserved. Keywords: Matuyama – Brunhes; Kamikatsura event; 40 Ar/ 39 Ar ages 1. Introduction Polarity reversals are the most dramatic manifesta- tion of the Earth’s magnetic field. Paleomagnetic records of reversals from lava flows, sedimentary rocks, and to a lesser extent igneous intrusions pro- vide important insight into the geodynamo, not to mention lithospheric dynamics, geochronology and stratigraphy [1–4]. In addition, numerical simulations of the geodynamo [5,6] with different patterns of core – mantle boundary heat flux have produced spon- taneous reversals that open our eyes to the consider- able range in duration and complexity that might occur in real reversals [7]. Thus, although they are 0012-821X/$ - see front matter D 2004 Elsevier B.V. All rights reserved. doi:10.1016/j.epsl.2004.03.003 $ Supplementary data associated with this article can be found, in the online version at doi: 10.1016/j.epsl.2004.03.003. * Corresponding author. E-mail addresses: [email protected] (R.S. Coe), [email protected] (B.S. Singer), [email protected] (X. Zhao). www.elsevier.com/locate/epsl Earth and Planetary Science Letters 222 (2004) 667 – 684
-
Upload
independent -
Category
Documents
-
view
0 -
download
0
Transcript of Matuyama–Brunhes reversal and Kamikatsura event on Maui: paleomagnetic directions, 40Ar/ 39Ar ages...

www.elsevier.com/locate/epsl
Earth and Planetary Science Letters 222 (2004) 667–684
Matuyama–Brunhes reversal and Kamikatsura event on Maui:
paleomagnetic directions, 40Ar/39Ar ages and implications$
Robert S. Coea,*, Brad S. Singerb, Malcolm S. Pringlec, Xixi Zhaoa
aEarth Sciences Department, University of California, Santa Cruz, CA 95064, USAbDepartment of Geology and Geophysics, University of Wisconsin, Madison, WI 53706, USAcScottish Universities Research and Reactor Centre, East Kilbride, G75 OQF, Scotland, UK
Received 12 June 2003; received in revised form 27 February 2004; accepted 1 March 2004
Abstract
Eighty-nine basaltic lava flows from the northwest wall of Haleakala caldera preserve a concatenated paleomagnetic
record of portions of the Matuyama–Brunhes (M–B) reversal and the preceding Kamikatsura event as well as secular
variation of the full-polarity reversed and normal geomagnetic field. They provide the most detailed volcanic record to date
of the M–B transition. The 24 flows in the transition zone show for the first time transitional virtual geomagnetic poles
(VGPs) that move from reverse to normal along the Americas, concluding with an oscillation in the Pacific Ocean to a
cluster of VGPs east of New Zealand and back finally to stable polarity in the north polar region. All but one of the 16
Kamikatsura VGPs cluster in central South America. The full-polarity flows, with 40Ar/39Ar ages spanning a total of 680 kyr,
pass a reversal test and give an average VGP insignificantly different from the rotation axis, with standard deviation
consistent with that for other 0–5 Ma lava flows of similar latitude. Precise 40Ar/39Ar dating consisting of 31 incremental
heating experiments on 12 transitional flows yields weighted mean ages of 775.6F 1.9 and 900.3F 4.7 ka for the M–B and
Kamikatsura transitional flows, respectively. This Matuyama–Brunhes age is f 16 kyr younger than ages for M–B flows
from the Canary Islands, Tahiti and Chile that were dated using exactly the same techniques and standards, suggesting that
this polarity transition may have taken considerably longer to complete and been more complex than is generally believed for
reversals.
D 2004 Elsevier B.V. All rights reserved.
Keywords: Matuyama–Brunhes; Kamikatsura event; 40Ar/39Ar ages
1. Introduction
Polarity reversals are the most dramatic manifesta-
tion of the Earth’s magnetic field. Paleomagnetic
0012-821X/$ - see front matter D 2004 Elsevier B.V. All rights reserved.
doi:10.1016/j.epsl.2004.03.003
$ Supplementary data associated with this article can be found,
in the online version at doi: 10.1016/j.epsl.2004.03.003.
* Corresponding author.
E-mail addresses: [email protected] (R.S. Coe),
[email protected] (B.S. Singer), [email protected]
(X. Zhao).
records of reversals from lava flows, sedimentary
rocks, and to a lesser extent igneous intrusions pro-
vide important insight into the geodynamo, not to
mention lithospheric dynamics, geochronology and
stratigraphy [1–4]. In addition, numerical simulations
of the geodynamo [5,6] with different patterns of
core–mantle boundary heat flux have produced spon-
taneous reversals that open our eyes to the consider-
able range in duration and complexity that might
occur in real reversals [7]. Thus, although they are

R.S. Coe et al. / Earth and Planetary Science Letters 222 (2004) 667–684668
fragmentary or imperfectly recorded, these records
comprise an important part of the observational data
against which numerical simulations may be evaluat-
ed and improved. Lava flows are the most accurate
paleomagnetic recorder, and they can often be dated
precisely using 40Ar/39Ar dating [8]. Although even
rapidly erupted sequences of lava flows provide only
a series of ‘‘snapshots’’ of paleofield behavior, exam-
ining many lava sequences together that record a
particular reversal has the potential to enrich our
visualization of the reversal process [7,9–11].
Using a portable fluxgate magnetometer, one of us
(RSC) discovered a reversed-to-normal polarity tran-
sition recorded in basalt flows along the Halemauu
Trail into Haleakala caldera on the island of Maui,
Hawaii (Fig. 1). Based on available K–Ar ages [12],
it seemed likely to be the Matuyama–Brunhes (M–B)
transition. RSC and V. Hsu drilled 27 reconnaissance
Fig. 1. Location of the sampled section along the northwestern rim of Halea
topographic map. Contour labels are in meters. Flow unit numbers 1–89
samples from nine of those flows and demonstrated
stable reversed, transitional and normal directions.40Ar/39Ar dating of four of the transitional flows by
Baksi et al. [13] confirmed a M–B age for three of
them, but the lowest of the four gave an age of >850
ka, too old for the M–B transition, that they dismissed
as probably contaminated by excess argon [13]. Fur-
ther paleomagnetic and geochronological study of a
different, better-exposed section of the Haleakala
caldera wall indicated that this flow and many others
at the base of the transitional sequence likely record
the Kamikatsura event of [14] at ca. 900 ka [10], one
of a growing number of dipolar instabilities that are
being documented in the Quaternary and hold great
promise for long-range, high-resolution stratigraphic
correlation [10,15].
In this paper, we present a set of paleomagnetic
flow-mean directions for 89 successive basaltic units
kala caldera. Details from the Kilohana 7.5V U.S. Geological Surveycorrespond to Table 1.

R.S. Coe et al. / Earth and Planetary Science Letters 222 (2004) 667–684 669
of this better-exposed section, expand the number of
flows precisely dated by the 40Ar/39Ar from 9 to 23,
and improve some of the earlier age determinations of
Singer et al. [9,10]. Our objective is to document in
as great detail as possible the paleomagnetic field
behavior associated with the Kamikatsura event and
the M–B reversal as recorded at Haleakala and to
place these recordings in as precise and accurate
temporal a framework as possible. Comparing these
data for the M–B reversal record at Haleakala vol-
cano with those obtained from three other lava
sections distributed about the globe that have also
been precisely dated as M–B [11], it appears that this
polarity transition took considerably longer than
commonly thought for reversals.
2. Sample collection
We carried out a thorough sampling of the section
shown in Fig. 1. It spans 370 m in elevation, the entire
caldera wall at that location, and is composed of basalt
flows of the Kula Formation [16]. Reconnaissance
work showed that the lower 125 m was of reversed
polarity, the next 65 m was characterized by interme-
diate directions and mixed polarity, and the upper 190
m was of normal polarity. We drilled groups of
standard paleomagnetic cores, each group consisting
of samples typically spread laterally a distance of 5–
15 m and confined to a single well-defined cooling
unit, usually a flow but in one case an agglomeratic
ashy deposit containing lava blocks (unit 19, Table 1).
In the normal and reversed polarity zones we often
skipped one or two flows between sample groups,
whereas in the intermediate zone we sampled almost
every cooling unit that could be drilled, sometimes in
two or more separate places. We also took consider-
able care not to sample in places badly remagnetized
by lightning, that is, in areas with extremely high
remanent magnetization detected with a fluxgate gra-
diometer or by anomalous deflection of a compass
needle. In total, we took 588 cores from 89 flows in
stratigraphic succession, including 19 flows from the
reversed zone, 30 from the normal zone, and 40 from
the intermediate zone that lies between the full-polar-
ity sequences (Table 1).
All samples were oriented with respect to vertical
and true north with an estimated uncertainty of about
1–2j using a paleomagnetic core-orienting stage
equipped with inclinometer and a recess for holding
a sighting compass. We measured azimuths for each
core relative to local magnetic north and corrected
them to true north by sighting the magnetic azimuth of
the sun or of a distant landmark whose true bearing
was known. The great majority of these corrections
are between 0j and 5j, but some are larger, ranging
up to a maximum of 87j for one sample from the
uppermost flow. There were a few flows such as this
one where lightning strikes were so common that we
had trouble finding places to sample that were not
strongly overprinted.
3. Paleomagnetic laboratory procedure
We carried out progressive thermal or alternating
field (AF) demagnetization on at least one specimen
from each core. High unblocking temperatures gen-
erally less than 580 jC and median destructive
alternating fields of 10 to 50 mT confirm that the
remanence-carrying mineral is predominantly iron-
rich titanomagnetite. Lower-stability components re-
moved by these methods appear to be a combination
of viscous remanent magnetization (VRM) and light-
ning-induced isothermal remanent magnetization
(IRM). These secondary components were relatively
large in the transition zone, and substantial alteration
of magnetic minerals frequently occurred during
laboratory heating, foiling our attempts to obtain a
record of absolute paleointensities of the reversing
field. Nonetheless, we were able to obtain a good
directional record throughout the section.
In the full-polarity parts of the section, the second-
ary components were usually easy to eliminate. Fig.
2a shows the removal by AF demagnetization of an
atypically large VRM to isolate the direction of
characteristic remanent magnetization (ChRM) of a
sample from the lowermost flow. We can be confident
that this ChRM represents the primary direction
acquired during original cooling because it agrees
well with the ChRMs of the other five samples from
the same flow. Compared to the mean NRM direction
of the six samples from this flow, which is poorly
defined (D/I = 146/� 13, a95 = 41), the mean ChRM
direction given in Table 1 is 10 times better deter-
mined (D/I= 161/� 31, a95 = 4).

Table 1
Flow-by-flow paleomagnetic results, 40Ar/39Ar ages and stratigraphic position for Haleakala section
Flow Field Height AgeF 2r Directions VGPs No. No. Flow Field Height AgeF 2r Directions VGPs No. No.
unit no. (m) (ka)Dec Inc a95 k Long. Lat. A95 K
samples GC a unit no. (m) (ka)Dec Inc a95 k Long. Lat. A95 K
samples GC a
89 56 368.0 136.5F 43.1 8.9 8.6 21.8 7.4 354.9 71.4 15.6 13.4 9 of 9 8 44 24 166.5 26.5 56.0 3.7 335.3 253.4 62.0 4.2 254.6 6 of 6
88 55 364.0 146.4F 3.8 0.5 16.6 18.4 16.0 21.5 77.7 13.5 28.1 6 of 6 3 43 23 162.1 41.7 57.7 6.2 32.5 255.7 49.3 7.8 20.8 18 of 39
87 54 359.0 509.5F 10.8 6.9 50.4 12.1 143.1 233.3 77.9 10.9 169.0 3 of 5 1 42 22A 159.8 134.0 � 50.9 2.6 406.3 318.5 � 47.7 3.2 266.8 9 of 9
86 53 354.0 353.3 44.9 4.7 215.6 157.9 81.6 4.7 215.6 6 of 6 1 41 22 157.6 192.3 � 53.8 3.8 252.1 59.6 � 72.3 4.8 156.6 7 of 7
85 52 351.0 530.6F 20.1 358.3 43.9 2.4 843.1 186.4 84.9 2.4 843.1 6 of 6 2 40 21B 154.6 189.1 � 58.4 5.3 94.8 43.3 � 69.9 6.8 58.7 9 of 11
84 51 343.0 28.2 8.8 6.6 195.6 320.8 58.1 4.7 383.1 4 of 5 39 21AV 153.9 180.7 � 52.9 8.5 573.5 26.5 � 77.3 9.8 416.9 3 of 3 2
83 50 331.7 10.1 22.1 5.8 281.9 336.1 76.6 4.5 417.9 4 of 4 38 21A 153.2 150.2 � 41.4 5.3 208.2 305.6 � 62.2 6.1 160.9 5 of 9
82 49 322.4 14.6 24.5 10.1 83.0 321.2 74.1 8.7 113.3 4 of 4 37 21 151.6 773.0F 3.0 188.6 0.1 4.9 62.5 180.9 � 67.5 3.5 120.2 15 of 16
81 48 309.0 357.4 37.8 10.1 153.8 123.6 87.5 9.2 180.6 4 of 4 3 36 20C 148.7 174.5 � 26.8 4.2 491.1 243.3 � 81.6 2.5 1305.7 4 of 4
80 47 303.8 1.0 33.0 7.6 146.6 4.1 87.1 5.7 256.4 4 of 4 35 20B 147.9 902.0F 11.0 113.0 � 28.8 6.5 108.3 301.3 � 26.4 5.2 165.0 6 of 6
79 46 299.7 359.0 33.9 3.8 578.8 46.9 87.6 2.8 1045.9 4 of 4 34 20A 146.1 896.0F 8.0 106.8 � 26.1 4.2 172.5 301.4 � 20.3 3.4 274.1 8 of 8
78 45 295.6 12.3 47.3 3.6 734.6 257.0 76.5 3.8 642.6 4 of 6 1 33 20 144.9 108.2 � 26.5 5.9 105.3 301.2 � 21.6 5.6 117.1 7 of 7
77 44 291.5 10.8 45.1 7.1 166.8 260.0 78.5 6.7 191.3 4 of 4 32 19D 143.5 102.3 � 27.8 10.5 77.8 303.9 � 16.3 9.8 89.5 4 of 4
76 43 286.3 19.1 41.8 7.4 155.9 279.0 72.2 6.3 216.2 4 of 4 31 19C 142.8 104.4 � 27.9 5.5 277.1 303.2 � 18.4 3.8 594.4 4 of 4
75 42 279.1 4.1 47.3 9.2 100.1 226.5 81.2 8.5 117.5 4 of 4 30 19B 139.8 109.2 � 30.4 27.4 85.1 303.4 � 23.1 24.7 104.0 2 of 2
74 41 276.0 359.4 42.0 6.8 184.4 192.5 86.4 7.1 167.4 4 of 4 29 19 137.5 101.3 � 27.2 16.1 59.5 303.7 � 15.4 12.9 92.4 3 of 4
73 40 273.5 358.6 40.7 10.4 79.4 174.1 86.8 9.4 96.6 4 of 4 28 17J – L* 135.2 898.7F 10.0 97.7 � 38.0 15.1 67.7 311.6 � 14.3 16.6 56.5 3 of 3
72 39 272.9 12.0 46.0 9.3 98.9 259.1 77.0 7.9 134.7 4 of 4 27 17G – I* 133.8 107.5 � 30.1 4.7 377.7 303.6 � 21.7 3.7 634.4 4 of 4
71 38 269.3 8.7 42.9 8.3 122.7 264.2 81.1 10.0 85.4 4 of 4 26 17E – F* 132.4 102.3 � 25.8 3.8 1067.1 302.6 � 16.1 2.3 2919.0 3 of 3
70 37 263.7 0.6 48.2 5.1 331.5 207.6 81.5 5.7 264.0 4 of 4 25 17C –D* 130.1 95.7 � 30.3 9.8 89.3 307.3 � 10.9 10.3 80.9 4 of 4
69 36 257.5 2.5 46.0 5.8 249.4 222.5 82.9 5.5 282.7 4 of 4 24 17B 128.7 900.7F 16.0 99.3 � 23.6 5.7 471.2 302.3 � 12.9 4.7 677.3 3 of 4
68 35 254.4 2.1 45.2 4.0 534.9 221.2 83.7 3.4 710.7 4 of 4 23 17A 126.4 101.0 � 33.4 5.8 1856.7 307.6 � 16.3 5.1 2354.6 2 of 2
67 34 249.2 577.0F 9.1 6.5 43.9 1.7 2042.6 253.5 82.3 1.8 1736.6 5 of 5 22 17 125.0 911.0F 12.0 104.2 � 27.0 5.3 301.0 302.7 � 18.0 3.7 618.3 4 of 4
66 33 242.0 359.0 44.8 5.8 253.2 194.7 84.3 5.8 251.9 4 of 4 21 16B 123.0 894.0F 27.0 104.6 � 30.1 5.7 182.2 304.5 � 18.9 6.1 159.0 5 of 5
65 32 231.7 344.1 40.6 3.8 599.9 137.4 74.5 3.8 599.9 4 of 4 20 16A 121.6 215.3 � 24.2 5.8 60.5 121.7 � 55.3 4.5 99.7 13 of 13 13
64 31 211.1 338.8 48.8 4.5 203.2 134.0 69.8 4.5 203.2 7 of 10 1 19 16agg 114.0 188.8 � 43.3 5.5 151.7 83.5 � 80.7 6.2 119.2 6 of 6
63 30 207.0 353.9 36.9 8.7 36.3 116.0 84.1 9.0 33.4 9 of 11 18 16 106.5 915.0F 10.0 187.9 � 34.3 4.1 491.4 127.1 � 82.3 4.0 517.6 4 of 4
62 29 198.8 9.3 32.2 4.4 229.0 312.9 80.6 3.7 328.9 6 of 8 17 15A 105.0 180.3 � 37.8 4.6 393.5 52.6 � 89.5 3.4 750.6 4 of 4
61 28 188.0 763.0F 18.0 354.8 32.5 2.6 399.4 82.2 84.2 2.2 548.7 9 of 12 16 15 100.0 942.0F 29.0 190.5 � 31.2 6.3 216.2 133.6 � 79.3 6.2 223.1 4 of 4
60 27B 185.8 756.0F 6.0 356.5 38.5 4.7 202.5 130.7 86.5 4.7 200.5 6 of 6 15 14AB 98.2 195.5 � 38.7 3.4 315.7 106.6 � 75.5 3.2 365.3 7 of 7
59 27A 184.0 774.2F 3.6 190.2 41.6 7.2 91.1 190.8 � 44.2 6.9 97.5 6 of 7 1 14 14 94.5 194.0 � 40.5 6.5 198.1 100.8 � 76.8 7.1 169.3 4 of 4
58 27 182.0 778.3F 5.2 188.9 36.7 3.1 340.6 191.3 � 47.9 2.8 411.8 8 of 9 4 13 13 82.6 183.8 � 37.2 10.2 57.2 109.6 � 86.6 9.9 61.1 5 of 6
57 26D 181.3 196.9 28.8 4.6 246.9 177.8 � 50.2 3.8 352.8 6 of 7 3 12 12 74.3 191.9 � 40.9 13.4 49.4 98.2 � 78.7 12.5 55.0 4 of 4
56 26C 181.0 195.1 26.6 6.8 79.8 179.7 � 52.0 5.4 125.1 7 of 7 11 11 65.2 194.3 � 36.2 2.8 1103.0 114.3 � 76.6 2.6 1258.7 4 of 5
55 26B 180.6 186.4 40.1 7.9 95.1 195.3 � 45.7 7.1 117.5 5 of 7 10 10 51.4 188.8 � 28.0 4.6 208.9 147.5 � 79.8 4.1 133.5 6 of 7
54 26A 179.9 189.9 44.1 7.2 166.0 191.7 � 42.4 8.8 109.3 4 of 5 9 9 41.3 958.0F 24.0 189.9 � 33.2 7.5 120.6 128.1 � 80.3 6.4 158.3 5 of 10 2
53 26 177.6 193.8 42.2 4.3 101.8 186.6 � 42.6 4.3 104.0 12 of 13 8 8 25.7 191.1 � 22.8 3.8 210.6 152.0 � 76.1 3.9 199.4 8 of 8
52 25A 176.2 782.4F 26.4 212.9 35.8 3.0 85.0 163.3 � 38.2 2.6 111.3 28 of 29 6 7 7 22.9 187.8 � 25.7 2.8 288.7 156.4 � 79.6 2.4 416.9 10 of 10
51 24A 174.6 229.2 54.0 8.7 49.2 163.2 � 16.7 10.5 33.8 7 of 7 6 6 14.7 172.0 � 40.8 6.3 211.8 314.2 � 82.2 6.0 235.5 4 of 6
50 25 173.2 778.7F 6.9 345.6 45.9 4.1 96.8 142.8 75.7 4.5 79.5 14 of 22 5 5 11.0 195.4 � 36.0 5.5 277.1 114.2 � 75.6 5.0 332.2 4 of 4
49 24CCV 171.7 351.9 45.2 2.7 508.6 154.1 80.5 2.8 458.0 7 of 7 4 4 7.3 188.1 � 35.0 4.6 405.8 123.3 � 82.3 4.9 353.4 4 of 4
48 24CC 170.9 327.3 53.2 39.6 10.7 152.0 56.6 36.1 12.7 3 of 3 3 3 4.6 159.0 � 41.8 3.2 823.8 307.5 � 70.3 3.4 744.2 4 of 4
47 24BB 170.2 328.2 55.6 11.4 118.2 150.0 58.1 14.3 75.7 3 of 4 2 2 3.7 156.6 � 38.0 2.5 1331.3 299.5 � 68.1 2.0 2154.9 4 of 4
46 24AA 169.5 351.1 66.2 7.4 153.6 192.1 60.9 10.1 83.3 4 of 4 1 1 0.0 961.4F 23.4 160.8 � 30.8 4.2 254.7 284.1 � 71.4 4.0 277.3 6 of 6
45 24 167.3 785.1F 8.0 4.8 51.8 4.3 244.5 222.8 77.5 4.7 202.8 6 of 6
a Number of remagnetization great circles used in the analysis.
* Composites of two to three very thin pahoehoe cooling units, each 20 to 30 cm thick.
R.S.Coeet
al./Earth
andPlaneta
ryScien
ceLetters
222(2004)667–684
670

Fig. 2. (a) Orthogonal vector diagram showing complete removal of an unusually large VRM by AF demagnetization to only10 mT, isolating the
ChRM which then decays univectorially toward the origin between 10 and 100 mT. Pluses (diamonds) = horizontal (vertical) component. (b)
Equal-area projection (lower hemisphere) showing successful application of remagnetization-circle technique. Arcuate lines = great circles best-
fit to AF demagnetization results for two samples with deviant NRMs due to secondary IRM from lightning; crosses =NRMs; squares =ChRMs
of samples with clustered NRMs; diamonds =ChRMs of samples with deviant NRMs.
R.S. Coe et al. / Earth and Planetary Science Letters 222 (2004) 667–684 671
Secondary IRM due to lightning could also be
completely removed by AF demagnetization to reveal
the ChRM of most full-polarity samples. For one flow
in the reversed zone and eight flows in the normal
zone, however, some samples were too strongly
remagnetized by lightning to recover the primary
direction of magnetization. In such cases, we used a
remagnetization-circle technique [17], as illustrated in
Fig. 2b. Two of the six samples from flow 85 near the
top of the section had NRM directions that deviated
appreciably from the rest, and during demagnetiza-
tion, they moved toward but failed to reach the
clustered ChRM directions of the other four. Great
circles fitted through the demagnetization directions
do intersect the cluster, and thus these samples can be
used to help define the flow mean. Twenty-two full-
polarity samples that otherwise would have been
excluded from the mean, or would have significantly
increased its uncertainty if they had been included,
were recovered by this method. In the three flows at
the very top of the section, many samples showed
evidence of remagnetization in more than one direc-
tion by multiple lightning strikes, making application
of the great-circle technique more difficult and less
accurate (see Table 1).
In the zone of intermediate directions, where the
primary remanence is lower owing to the lower field
intensity that prevailed during the polarity transition,
directional deviations by secondary components are
typically larger and characterisitic remanence more
difficult to isolate than in the full-polarity zones.
Nonetheless, AF demagnetization usually worked
well for removing VRM, as illustrated in Fig. 3,
where first AF and finally thermal demagnetization
carried out on the same sample both yielded almost
the same direction of ChRM. Thus, this direction very
likely is the primary direction acquired during original
cooling. Likewise, in the majority of cases both
demagnetization techniques also yielded very similar
directions of ChRM when they were carried out on
sister specimens from the same core. On flows with
directions of remanence very scattered by lightning,
however, AF demagnetization clearly outperforms
thermal demagnetization, as shown in Fig. 4.
The magnified effects of lightning due to the
weaker primary remanence in the intermediate zone

Fig. 3. Demagnetization of a transitional sample with a VRM overprint. AF treatment at 20 mT completely removes the VRM, as confirmed by
subsequent thermal treatment from 350 to 530 jC, which continues the same trend toward the origin as the AF demagnetization and yields the
same direction of ChRM. Orthogonal vector diagram: pluses (diamonds) = horizontal (vertical) component.
R.S. Coe et al. / Earth and Planetary Science Letters 222 (2004) 667–684672
required more use of the remagnetization-circle tech-
nique, and even this technique failed in some samples.
This was especially true for flows 43 and 50, which
we had to resample at different places to obtain
useable results (Tables 1 and 2b). Generally, though,
application of the remagnetization-circle technique
was well worth the effort, enabling 29 samples with
deviant or no ChRM to contribute usefully in defining
flow-mean directions. The most extreme example was
the lowest flow in the transition zone, which required
remagnetization-circle analysis for all 13 of its sam-
ples (Table 1, flow 20). Although the mean is well
defined (a95 = 5.8j), the real accuracy could be con-
siderably less because no stable-endpoint ChRMs
contributed to the mean direction.
4. Paleomagnetic results
In Table 1, we give the flow-mean data, strati-
graphic positions and 40Ar/39Ar ages for every flow
that was sampled. Of the 588 samples demagnetized,
about half by AF and half by thermal demagnetiza-
tion, 516 yielded useable results. The majority of the
samples excluded, mainly because of severe remagne-
tization by lightning, were from only 5% of the flows.
In retrospect, if AF demagnetization or hybrid (AF
followed by thermal) demagnetization had been
employed more frequently, the exclusion rate would
have been lower. However, there were also a few
samples rejected because they were unstable during
AF demagnetization, their directions jumping errati-
cally at each AF step.
The clustering of sample directions within a flow
was generally good: 50% of the flows had precision
parameter k over 200 and 92% over 50. Moreover, the
average k for transitional flows with intermediate
directions was only 25% less than the average k of
full-polarity flows, not a significant difference by the
F test [18]. Because the primary objective of this
study was to examine transitional field behavior, we
typically kept the number of samples per flow to four

Fig. 4. AF and thermal demagnetization of sister samples from the same core that carry an IRM overprint from lightning. (a) AF efficiently
removes the IRM and recovers the direction of ChRM, as shown by the rapid initial drop in intensity and straight-line decay toward the origin on
the orthogonal projection and clustering of points on the equal area projection from 20 to 70 mT. (b) Thermal demagnetization all the way to 575
jC clearly fails to the ChRM direction.
R.S. Coe et al. / Earth and Planetary Science Letters 222 (2004) 667–684 673
or five so as to be able to collect essentially all of the
units in the zone with intermediate directions. Addi-
tional samples were collected in later visits from flows
that were important for determining the transitional
behavior if their mean directions were not acceptably
well defined. In the end, 82% of all the flows had 95%
confidence limits less than 10j, with the median
a95 = 5.7j. Moreover, the considerable redundancy in
successive flow directions adds confidence that the
overall description of the field variation is robust.
The means of the directions and virtual geomag-
netic poles (VGPs) of the full-polarity flows from the
normal and reversed sequences at the top and bottom
of the section are given in Table 2a for two cases: (i)
for all the flows and (ii) for those flows with
a95 < 10j. In all cases, the normal and reversed means
are within a few degrees of antipodal, deviations not
significant at 95% confidence. For instance, the nor-
mal and reversed VGP means for the data sets with
a95 < 10j deviate from antipodal by only 3.8j and
have a probability of being different of only 61% by
the F test [18]. This deviation would have to be 6.8jfor the difference in directions from antipodal to be
significant at 95% confidence; thus these data pass a
class B reversal test of McFadden and McElhinny
[19]. Moreover, these means, both separately and
combined (flipping the polarity of the reversed and
combining them with the normal VGPs), do not differ
significantly from the rotation axis. The angular
standard deviation S of 12j of the combined VGPs

Table 2a
Mean directions, VGPs and statistics of full-polarity flows
Polarity Directions VGPs Antipodal?a
N Dec Inc a95 k s R Longitude Latitude A95 K S R Diff b Probc
Normal 30 3.4 38.3 4.5 35.1 13.7 29.173963 266.6 86.8 3.8 48.7 11.6 29.404064
Reversed 19 184.3 � 36.0 4.8 49.9 11.5 18.639199 122.3 � 86.0 5.1 43.9 12.2 18.589909 2.3 35.1
Both N and R 49 3.8 37.4 3.3 40.1 12.8 47.802731 282.2 86.7 3.0 47.3 11.8 47.984668
N (a95 < 10) 24 3.1 40.4 4.5 43.3 12.3 23.468875 246.1 86.3 4.2 50.6 11.4 23.545775
R (a95 < 10) 17 183.9 � 35.6 5.3 45.6 12.0 16.649150 127.4 � 86.4 5.7 40.0 12.8 16.599978 3.8 61.2
Both (a95 < 10) 41 3.4 38.4 3.4 43.6 12.3 40.083159 270.4 86.8 3.3 45.7 12.0 40.124768
a How close the mean N and R VGPs are to antipodal.b Difference from antipodal (j).c Probability not antipodal (%).
R.S. Coe et al. / Earth and Planetary Science Letters 222 (2004) 667–684674
is slightly, but not significantly, lower than the aver-
age value for the latitude band containing Maui
[20,21].
Five major swings of the field are recorded, shown
in terms of both directions and VGPs in Figs. 5 and 6.
Layers of ash, talus or soil or indications of gullying
Fig. 5. Plots of magnetic inclination, declination and latitude of the virtual
units at Haleakala volcano. Flows that were dated are shown in open symb
weighted mean ages are given for lavas thought to record the Kamikatsur
lie between the flows recording the largest jumps in
direction; however, we also noted similar signs of
possible temporal breaks between some flows with
closely similar directions. A total of 29 flows com-
prising these swings have intermediate directions,
defined here as having VGP latitudes less than 60j.
geomagnetic pole (VGP) for the stratigraphic succession of 89 flow
ols. 40Ar/39Ar isochron ages are in ka with F 2r uncertainties. The
a event and Matuyama–Brunhes reversal.

Fig. 6. Virtual geomagnetic poles for Haleakala Caldera flow units from Table 1. Squares = flows in full-polarity zones: Matuyama reversed
(1–19) and Brunhes normal (60–89). Pluses =Kamikatsura event (K, 20–35). Circles =Matuyama–Brunhes transition (36–59).
Star = sampling site.
R.S. Coe et al. / Earth and Planetary Science Letters 222 (2004) 667–684 675
An important concern is how well the flows record the
transitional field directions, when the weaker-than-
normal field produced a smaller primary TRM. For
instance, could there be a significant systematic error
due to incomplete removal of VRM? To answer this
question, we show the stable-endpoint and remagne-
tization-circle data for two of the most critical flows
for constraining the duration of the M–B transition,
units 58 and 59 (Fig. 7). These flows are especially
important because they are at the top of the transition
zone and yielded exceptionally precise 40Ar/39Ar
ages. One or two of the samples in these flows did
not exhibit convincingly stable endpoints because of
unusually stubborn VRM secondary overprints. The
great-circle fits for these samples, however, are en-
tirely consistent with the stable-endpoint directions of
the other samples, both for thermal and AF demag-
netization (Fig. 7). Thus, we do not think that unre-
moved secondary components are a serious source of
systematic error in the flow-mean directions.
Note, however, that the two site-mean directions
for unit 58 are slightly (6.1j) different from each other
(Fig. 7). This is most likely caused by differences in
the local field direction due to magnetic anomalies,
differences that are larger than usual because of the
weaker transitional field, although other causes such
as post-cooling movement of blocks could also have
contributed. We sampled seven of the transitional
flows at two or more locations to assess the magnitude
of the directional deviations and found an average
difference of 6.5j (Table 2b). The pairs of sites are
typically about 15 m apart, but the four sites in unit 52
range in separation from 5 m up to 100 m. Two of the
seven interflow directional differences are statistically
significant, whereas five are not. Thus, there is no
indication of a large error due to differences in the
local magnetic anomaly (or other causes) at sites
separated by up to 100 m. Nonetheless, it is still
possible that a significant effect could arise from
broader-scale anomalies distorting the ambient field
direction away from that produced by the geody-
namo—for example, due to the magnetization of the
whole volcanic edifice.
To sum up, most of the flows yielded mean
directions that probably represent the ancient field at
the time they cooled within 10j or less, even for the

Fig. 7. Demagnetization results for the two flows at the top of the transition zone that provide the most important constraints on the duration of
the M–B reversal. The best-fit great circles to the demagnetization steps (circles and crosses) for five samples that did not yield stable endpoints
in vector diagrams are consistent with the ChRM directions (squares) of samples that did. This is true for both AF (flow 58/site 1) and thermal
(flow 58/site 2 and flow 59) demagnetization. Stars and surrounding circles give the combined stable-endpoint and remagnetization-circle mean
directions and the 95% confidence limits for each site [17]. Thus, despite the unusually serious overprinting by VRM experienced by these
flows, they give robust paleomagnetic directions.
R.S. Coe et al. / Earth and Planetary Science Letters 222 (2004) 667–684676
transition-zone flows with intermediate directions. A
possible exception is unit 20, with a transitional
direction unlike those in flows immediately above
Table 2b
Paleomagnetic results from sites in same flow
Flow/site Dec Inc N k a95 Ang diff Proba
58/1 189.0 39.8 4 617.4 4.3
58/2 189.2 33.7 4 370.8 5.6 6.1 97.7
57/1 196.9 27.3 3 133.9 12.5
57/2 196.3 30.8 3 772.6 7.3 3.5 45.3
56/1 199.1 23.5 3 129.4 10.9
56/2 191.9 28.8 4 72.2 10.9 8.4 74.8
53/1 197.4 43.3 4 94.3 9.5
53/2 191.2 45.7 5 191.2 5.5 5.0 64.9
50/1 339.1 41.6 6 139.6 5.7
50/2 351.2 48.1 8 178.8 4.2 10.7 99.9
43/1 41.9 59.1 12 30.2 8.0
43/2 40.8 54.3 8 31.3 10.1 4.8 39.4
52/1 214.1 41.5 6 98.1 7.1
52/2 221.3 33.1 4 690.5 4.8
52/3 209.8 35.6 7 49.3 8.7
52/4 211.7 35.5 11 267.5 2.8 7.1* 78.9
Average 6.5 71.6
a Probability directions are different (%).
*Average difference in direction (j) between all pairs of these
four sites, which ranged from 5 to 100 m apart.
and below that had to be estimated entirely by
remagnetization circles. We encountered no evidence
in the section of extraordinarily rapid change in field
direction, such as pronounced smearing of paleomag-
netic direction as a function of vertical position in a
single flow like that found in the transition zone of the
Steens Mountain reversal [22,23]. The transitional
VGPs on the Americas (Fig. 6) fit the proposed ideas
of VGP preferences for certain geographical areas on
the globe [24,25], but the group of eight VGPs in the
southern Pacific (units 52–59) do not.
5. 40Ar/39Ar methods
The ages of 23 of the lava flows were determined
from 52 incremental heating experiments that were
conducted at the University of Wisconsin-Madison,
Scottish Universities Research and Reactor Centre,
and the University of Geneva. Analyses in each lab
employed virtually identical methods that are fully
described in [9,10,15]. These experiments used a
metal furnace to degas ca. 100 mg samples in 5–
20 steps between 500 and 1400 jC. In the case of
aphyric lavas, the samples were 5-mm-diameter

R.S. Coe et al. / Earth and Planetary Science Letters 222 (2004) 667–684 677
cores drilled out of the 2.5-cm-diameter cores used
for paleomagnetic analysis, whereas for the few
olivine or clinopyroxene-phyric flows the holocrys-
talline groundmass was separated at the 200-Am size
fraction and wrapped in copper foil.
The 40Ar/39Ar ages are calculated relative to
standard minerals including sanidine from the 28.34
Ma Taylor Creek rhyolite (TCs) or 1.194 Ma Alder
Creek rhyolite (ACs) that have been calibrated
aga ins t a common pr imary s tandard , the
98.79F 0.96 Ma GA-1550 biotite [26]. Ages for nine
flows (18, 21, 22, 24, 28, 34, 35, 58 and 59) were
originally reported relative to an earlier age of 27.92
Ma for the TCs standard [10,15]; these and other ages
from the literature have been recalculated where
necessary so that they are comparable directly to
the present results. We have measured new sub-
samples from flows 18, 35, 37, 58 and 59 that
augment and improve the precision of the original
ages given in [9] and [10]. Ages determined from
flows 1, 9, 15, 61, 67, 85, 87, 88 and 89 are reported
here for the first time.
The samples were irradiated for 1 h adjacent to
TCs or ACs monitors in evacuated quartz vials at the
Oregon State University Triga reactor in the Cadmi-
um-Lined In-Core Irradiation Tube (CLICIT). Cor-
rections for undesirable nucleogenic reactions on 40K
and 40Ca are [40Ar/39Ar]K = 0.00086, [36Ar/37Ar]
Ca = 0.000264, [39Ar/37Ar]Ca = 0.000673 [27]. In-
verse-variance weighted mean plateau ages and
uncertainties are calculated according to [28]. Pre-
cision estimates for the neutron monitors based on
six to seven measurements each suggest that the
uncertainty in J, the neutron fluence parameter, was
between 0.4% and 0.8% (F 2r). This uncertainty
was propagated into the final plateau and isochron
age for each analysis, but contributes < 0.1% to the
total uncertainty in these age estimates. Ages were
calculated using the decay constants of Steiger and
Jager [29] and are reported with F 2r analytical
and standard intercalibration uncertainties (see [26]).
Criteria used to determine whether an incremental
heating experiment gave meaningful results were (i) a
plateau must be defined by at least three contiguous
steps all concordant in age at the 95% confidence
level and comprising >50% of the 39Ar released, and
(ii) a well-defined isochron, calculated using the
algorithm of York [30] must exist for the plateau
points as defined by the Mean Square Weighted
Deviate (MSWD). The isochron ages are preferred
over the weighted mean plateau ages because they
combine estimates of analytical precision plus internal
disturbance of the sample without making an assump-
tion about the trapped argon component. To improve
precision, multiple sub-samples from several lavas
were measured. The resulting isochrons—each calcu-
lated with its own J value and uncertainty in J—were
treated as independent from one another. Thus, the
inverse-variance weighted mean [28] of the isochrons
combines to give the best estimate of the age and
uncertainty for these flows.
6. 40Ar/39Ar results
Given the aim of this study to resolve paleomag-
netic field behavior recorded by the lava sequence in
as precise and accurate a temporal framework as
possible, we report isochron ages relative to a single
primary 40Ar/39Ar dating standard with uncertainties
that arise solely from the analytical procedures and
intercalibration of our standards to the primary stan-
dard [26]. When comparing ages within the lava
sequence this is the appropriate level of uncertainty,
because the age of each sample was determined using
an identical procedure and primary standard. Uncer-
tainty in the age of the primary standard and 40K
decay constant may contribute additional uncertainty,
perhaps up to 1.5% [26], to the ages reported here.
However, this only becomes important should one
wish to compare our ages to those obtained using a
different 40Ar/39Ar standard or to chronometers that
are independent of the 40Ar/39Ar system, including
for example, U–Pb, U–Th/He, or astronomical
methods.
Forty-three of the 52 incremental heating experi-
ments yielded age spectra with more than 75% of the
gas defining the age plateau (Fig. 8 and Table 3).
Table 1 in the online version of this paper gives the
data for each heating step for all flows we have dated
from Haleakala caldera: for flows 1, 9, 16, 18, 35,
37, 45, 50, 52, 58, 59, 60, 61, 67, 85, 87, 88 and 89
reported for the first time and for flows 21, 22, 24,
28 and 34 reported earlier [10]. Most of the small
percentage of discordant steps yielded apparent ages
only slightly lower or higher than the plateau ages,

Fig. 8. 40Ar/39Ar age spectra and isochron diagrams for eight of the dated lava flows from which new data are reported. Where multiple sub-samples were measured from a flow, the
weighted mean isochron age is reported and gives the best estimate of time since eruption. The 40Ar/36Ari values were obtained from regressing all the plateau points and verify that,
with the exception of flow 35, no lavas contain evidence for an excess argon component (see text).
R.S.Coeet
al./Earth
andPlaneta
ryScien
ceLetters
222(2004)667–684
678
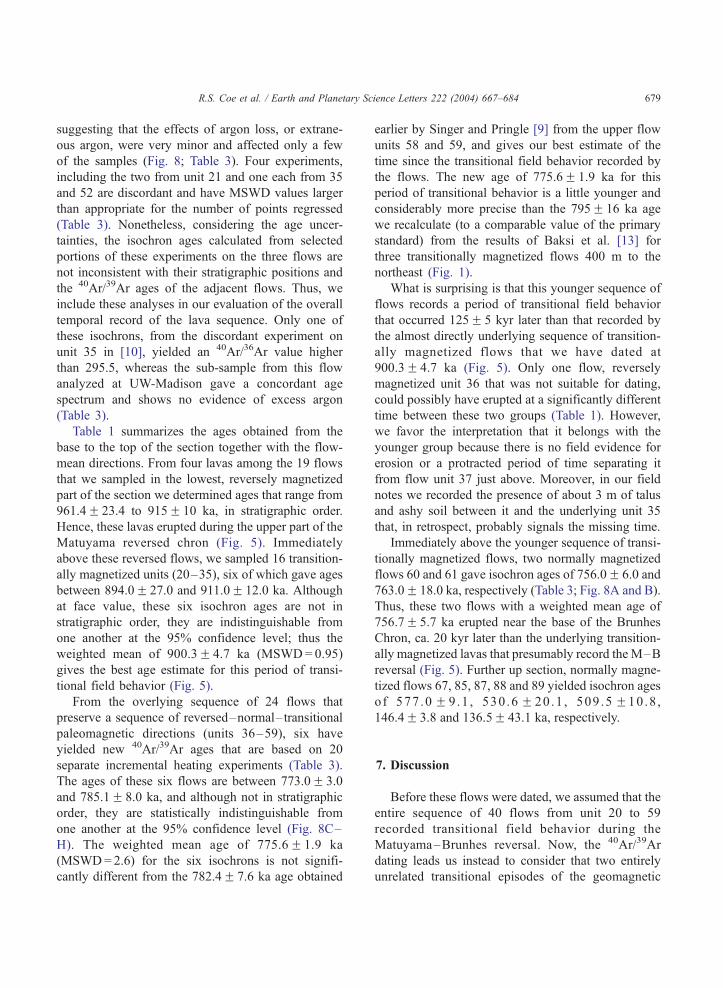
R.S. Coe et al. / Earth and Planetary Science Letters 222 (2004) 667–684 679
suggesting that the effects of argon loss, or extrane-
ous argon, were very minor and affected only a few
of the samples (Fig. 8; Table 3). Four experiments,
including the two from unit 21 and one each from 35
and 52 are discordant and have MSWD values larger
than appropriate for the number of points regressed
(Table 3). Nonetheless, considering the age uncer-
tainties, the isochron ages calculated from selected
portions of these experiments on the three flows are
not inconsistent with their stratigraphic positions and
the 40Ar/39Ar ages of the adjacent flows. Thus, we
include these analyses in our evaluation of the overall
temporal record of the lava sequence. Only one of
these isochrons, from the discordant experiment on
unit 35 in [10], yielded an 40Ar/36Ar value higher
than 295.5, whereas the sub-sample from this flow
analyzed at UW-Madison gave a concordant age
spectrum and shows no evidence of excess argon
(Table 3).
Table 1 summarizes the ages obtained from the
base to the top of the section together with the flow-
mean directions. From four lavas among the 19 flows
that we sampled in the lowest, reversely magnetized
part of the section we determined ages that range from
961.4F 23.4 to 915F 10 ka, in stratigraphic order.
Hence, these lavas erupted during the upper part of the
Matuyama reversed chron (Fig. 5). Immediately
above these reversed flows, we sampled 16 transition-
ally magnetized units (20–35), six of which gave ages
between 894.0F 27.0 and 911.0F 12.0 ka. Although
at face value, these six isochron ages are not in
stratigraphic order, they are indistinguishable from
one another at the 95% confidence level; thus the
weighted mean of 900.3F 4.7 ka (MSWD= 0.95)
gives the best age estimate for this period of transi-
tional field behavior (Fig. 5).
From the overlying sequence of 24 flows that
preserve a sequence of reversed–normal–transitional
paleomagnetic directions (units 36–59), six have
yielded new 40Ar/39Ar ages that are based on 20
separate incremental heating experiments (Table 3).
The ages of these six flows are between 773.0F 3.0
and 785.1F 8.0 ka, and although not in stratigraphic
order, they are statistically indistinguishable from
one another at the 95% confidence level (Fig. 8C–
H). The weighted mean age of 775.6F 1.9 ka
(MSWD=2.6) for the six isochrons is not signifi-
cantly different from the 782.4F 7.6 ka age obtained
earlier by Singer and Pringle [9] from the upper flow
units 58 and 59, and gives our best estimate of the
time since the transitional field behavior recorded by
the flows. The new age of 775.6F 1.9 ka for this
period of transitional behavior is a little younger and
considerably more precise than the 795F 16 ka age
we recalculate (to a comparable value of the primary
standard) from the results of Baksi et al. [13] for
three transitionally magnetized flows 400 m to the
northeast (Fig. 1).
What is surprising is that this younger sequence of
flows records a period of transitional field behavior
that occurred 125F 5 kyr later than that recorded by
the almost directly underlying sequence of transition-
ally magnetized flows that we have dated at
900.3F 4.7 ka (Fig. 5). Only one flow, reversely
magnetized unit 36 that was not suitable for dating,
could possibly have erupted at a significantly different
time between these two groups (Table 1). However,
we favor the interpretation that it belongs with the
younger group because there is no field evidence for
erosion or a protracted period of time separating it
from flow unit 37 just above. Moreover, in our field
notes we recorded the presence of about 3 m of talus
and ashy soil between it and the underlying unit 35
that, in retrospect, probably signals the missing time.
Immediately above the younger sequence of transi-
tionally magnetized flows, two normally magnetized
flows 60 and 61 gave isochron ages of 756.0F 6.0 and
763.0F 18.0 ka, respectively (Table 3; Fig. 8A and B).
Thus, these two flows with a weighted mean age of
756.7F 5.7 ka erupted near the base of the Brunhes
Chron, ca. 20 kyr later than the underlying transition-
ally magnetized lavas that presumably record the M–B
reversal (Fig. 5). Further up section, normally magne-
tized flows 67, 85, 87, 88 and 89 yielded isochron ages
of 577 .0 F 9.1 , 530.6 F 20 .1 , 509 .5 F10.8 ,
146.4F 3.8 and 136.5F 43.1 ka, respectively.
7. Discussion
Before these flows were dated, we assumed that the
entire sequence of 40 flows from unit 20 to 59
recorded transitional field behavior during the
Matuyama–Brunhes reversal. Now, the 40Ar/39Ar
dating leads us instead to consider that two entirely
unrelated transitional episodes of the geomagnetic

Table 3
Summary of 40Ar/39Ar dataa from 52 incremental heating experiments on Haleakala basalt flows
Sample Experiment K/Ca Total fusion Age spectrum Isochron analysis
site no. (total) age
(ka)Increments
used (jC)
39Ar
(%)
AgeF 2r(ka)
MSWD N MSWD 40Ar/36ArF2r intercept
AgeF 2r(ka)
89 UW18H75 0.55 130.9F14.6 775–1250 100.0 145.8F17.8 0.33 6 of 6 0.45 298.1F6.2 129.2F52.4
UW18H74 0.54 144.9F19.8 875–1265 100.0 139.0F18.1 0.50 5 of 5 0.43 295.0F5.8 151.8F75.8
weighted mean isochron age from two experiments: 11 of 11 0.41 296.8F3.9 130.0F13.0
88 UW18H71 0.561 141.7F4.0 875–1270 100.0 143.7F3.4 1.06 4 of 4 0.25 293.4F2.5 146.1F4.4
UW18H72 0.602 142.9F5.4 825–1300 100.0 144.4F4.1 0.77 5 of 5 0.60 292.9F4.5 >147.2F6.4
weighted mean isochron age from two experiments: 9 of 9 0.34 293.3F2.2 146.4F3.8
87 UW18H69 0.35 501.0F9.5 750–1275 100.0 504.0 F7.9 0.50 6 of 6 0.09 293.5F2.6 509.5F10.8
85 UW18G63 0.46 525.1F10.3 850–1225 100.0 525.2 F9.7 0.28 6 of 6 0.26 294.7F2.7 530.6F20.1
67 95gec47 1.07 563.9F6.8 650–980 98.5 570.1 F4.4 1.50 8 of 9 1.38 292.5F3.9 580.0F12.0
MB5f0085 0.68 576.2F22.5 590–1250 100.0 573.3 F9.6 0.58 5 of 5 0.72 295.8F1.0 572.8F14.0
weighted mean isochron age from two experiments: 13 of 14 0.61 577.0F9.1
61 MB5f0056 0.91 830.0F20.8 710–1215 86.9 781.0 F13.0 1.60 5 of 7 1.60 297.7F2.9 763.0F26.0
MB5f0089 1.06 780.9F18.6 495–1055 93.3 767.7 F16.2 0.17 6 of 7 0.16 296.5F4.4 763.9F25.0
weighted mean isochron age from two experiments: 11 of 14 0.21 763.0F18.0
60 95gec06 1.04 773.4F6.0 710–950 74.3 760.8 F4.8 0.92 10 of 17 0.79 300.2F7.6 757.9F6.4
MB5f0048 1.06 743.3F10.2 495–710 68.1 749.0 F10.0 1.03 3 of 6 0.35 302.1F9.4 740.0F18.0
weighted mean isochron age from two experiments: 13 of 23 1.80 756.0F6.0
59 MB5f0050 0.78 794.1F9.8 590–1330 92.7 785.4 F7.9 0.24 6 of 7 0.37 296.5F5.9 782.0F23.0
MB5f0046 0.86 776.1F8.0 565–1120 87.0 774.7 F4.3 1.09 8 of 12 1.40 297.3F1.8 770.7F6.1
95GEC14y 0.93 785.6F6.0 650–1160 90.7 784.9 F6.0 1.50 17 of 20 1.50 296.2F2.2 782.5F9.9
UW08M127 0.83 772.0F7.0 750–1340 100.0 771.4 F6.9 0.51 6 of 6 0.47 293.0F6.2 773.6F8.6
UW08M107 0.79 773.3F6.4 800–1260 97.5 775.8 F6.2 0.89 5 of 6 1.20 295.6F8.7 775.7F8.9
UW10G147 0.46 786.4F89.8 875–1450 100.0 771.3 F7.1 0.96 8 of 8 1.02 293.1F5.8 773.1F8.4
weighted mean isochron age from six experiments: 50 of 59 0.96 774.2F3.6
58 MB5f0053 0.86 776.9F10.6 880–1160 58.7 761.0 F13.0 0.27 3 of 6 0.27 299.0F12.0 739.0F73.0
95GEC20y 1.13 798.7F10.0 725–1115 79.4 785.7 F10.0 1.15 8 of 10 1.42 296.6F3.4 780.9F18.6
95GEC21y 0.91 798.8F8.2 776–1170 59.3 791.6 F6.0 0.50 11 of 17 0.52 296.9F2.2 782.4F9.8
UW08M106 0.47 784.9F11.0 700–1320 100.0 780.7 F6.8 0.60 6 of 6 0.76 295.5F1.8 780.8F8.5
UW10G146 0.46 765.6F9.7 800–1450 100.0 767.8 F8.4 1.16 6 of 6 0.96 294.4F2.1 770.7F9.9
weighted mean isochron age from five experiments: 34 of 45 1.16 778.3F5.2
52 MB6f0065 0.92 774.8F8.0 640–1150 78.0 779.1 F12.0 5.94# 8 of 13 11.73# 293.4F7.2 782.4F26.4
50 MB6f0083 0.85 784.3F9.8 635–1150 82.1 780.7 F6.4 0.52 9 of 14 0.34 296.8F1.5 778.7F6.9
45 MB6f0045 1.19 777.7F7.8 590–1120 85.1 783.2 F7.5 1.62 9 of 14 1.38 293.9F0.8 785.1F8.0
37 MB6f0049 1.12 774.2F7.1 440–1140 99.3 775.3 F2.7 1.30 15 of 16 2.00 294.8F1.9 776.0F4.7
UW08M145 0.40 773.8F5.8 750–1200 90.0 770.6 F5.3 0.97 6 of 7 1.21 295.4F3.8 770.7F7.0
UW10F113 0.37 767.9F6.6 990–1375 76.9 770.0 F7.0 1.81 4 of 7 1.97 295.1F1.0 771.0F7.4
UW10F112 0.38 769.3F7.3 900–1400 99.0 766.6 F7.4 1.55 5 of 6 1.85 296.2F2.3 765.6F8.4
UW08M125 0.45 788.9F7.8 900–1270 76.3 786.4 F7.7 0.69 9 of 13 0.37 301.1F6.6 778.6F12.1
UW08M105 0.91 771.5F11.0 880–1250 83.9 782.7 F10.7 0.33 8 of 12 0.24 300.1F9.9 777.2F16.1
weighted mean isochron age from six experiments: 47 of 61 1.30 773.0F3.0
35 UW08M103 0.22 893.6F10.7 700–1270 100.0 897.7 F8.5 0.33 6 of 6 0.07 293.8F2.9 902.7F12.0
MB6f0048 0.33 1058.6F36.0 520–1200 100.0 963.7 F32.0 7.27# 11 of 12 3.08# 300.6F1.6 899.7F26.0
weighted mean isochron age from six experiments: 17 of 18 0.04 902.0F11.0
34 MB6f0050 0.44 891.6F10.0 440–1140 98.5 893.3 F8.0 1.37 13 of 14 1.19 293.7F1.6 896.0F8.0
28 MB6f0064 0.47 882.2F10.0 630–930 60.9 900.1 F8.0 0.44 6 of 12 0.47 297.6F10.1 898.7F10.0
24 MB6f0062 0.66 916.3F14.0 630–990 68.3 899.8 F8.0 0.30 7 of 14 0.52 295.2F6.2 900.7F16.0
22 MB5f0088 0.41 985.8F50.0 490–1060 97.0 958.0 F42.0 1.23 6 of 7 0.99 287.5F19.0 950.6F40.0
MB5f0086 0.43 907.4F20.0 710–1060 68.2 891.5 F196.0 0.08 3 of 6 0.11 296.0F3.6 888.0F36.0
MB5f0055 0.44 892.8F24.0 490–1160 100.0 900.9 F22.0 1.12 5 of 5 1.24 292.6F3.6 928.6F44.0
95gec27 0.44 924.0F22.0 700–1060 59.2 901.8 F14.0 0.28 10 of 11 0.40 295.5F2.4 902.2F24.0
weighted mean isochron age from four experiments: 24 of 29 1.70 911.0F12.0
R.S. Coe et al. / Earth and Planetary Science Letters 222 (2004) 667–684680

Table 3 (continued)
Sample Experiment K/Ca Total fusion Age spectrum Isochron analysis
site no. (total) age
(ka)Increments
used (jC)
39Ar
(%)
AgeF 2r(ka)
MSWD N MSWD 40Ar/36ArF2r intercept
AgeF 2r(ka)
21 MBf50052 0.44 866.8F16.0 490–1160 100.0 889.4 F22.0 6.65 6 of 6 7.24# 289.0F20.6 896.0F32.0
95gec34 0.31 930.4F22.0 780–1200 96.3 918.0 F18.0 2.12 11 of 15 2.49# 297.9F3.6 887.4F50.0
weighted mean isochron age from four experiments: 17 of 21 0.08 894.0F27.0
18 95gec41 0.33 941.9F18.2 700–1200 100.0 927.7 F15.0 1.59 15 of 15 1.78 298.3F2.2 900.3F28.0
MB5f0049 0.29 913.5F16.0 490–1330 100.0 912.5 F12.0 0.69 6 of 6 0.84 295.4F3.8 913.5F14.0
UW09Q139 0.10 921.6F33.0 650–1325 99.3 919.3 F22.0 0.15 7 of 8 0.17 295.8F2.2 916.3F31.7
UW08M99b 0.29 912.7F25.3 650–1250 100.0 922.3 F18.6 0.72 12 of 12 0.67 294.5F1.8 931.1F24.2
weighted mean isochron age from four experiments: 40 of 41 0.97 915.0F10.0
16 MB5f0018 0.38 975.8F20.0 490–8500 82.3 912.5 F15.4 0.50 4 of 6 0.19 450.6F458.9 854.3F159.0
MB5f0087 0.39 922.4F32.6 590–1160 100.0 938.3 F34.1 1.42 5 of 5 0.63 286.0F9.4 945.3F29.8
weighted mean isochron age from two experiments: 9 of 11 0.51 942.0F29.0
9 MB5f0090 0.25 989.1F33.0 590–1160 92.6 965.3 F22.2 0.89 5 of 6 1.19 295.9F3.0 964.6F25.6
MB5f0083 0.37 848.4F42.6 590–880 84.5 913.1 F23.4 1.39 3 of 5 2.62 296.6F28.6 911.5F66.8
weighted mean isochron age from two experiments: 8 of 11 2.20 958.0F24.0
1 95gec52 0.43 934.0F6.6 730–930 63.9 954.1 F6.3 1.01 6 of 12 1.28 288.0F23.8 961.4F23.4
a All ages calculated relative to sanidine from 28.34 Ma Taylor Creek rhyolite, or 1.194 Ma Alder Creek rhyolite [26].y Data from Singer and Pringle [9] recalculated to revised age of 28.34 Ma for Taylor Creek rhyolite sanidine standard used in this study.# MSWD suggests some geologic or experimental error beyond analytical precision (see text).
R.S. Coe et al. / Earth and Planetary Science Letters 222 (2004) 667–684 681
field are juxtaposed in vertical section, an interpreta-
tion that demands careful evaluation.
The earlier group of 16 transitional flows, numbers
20–35 in Table 1, dated at 900.3F 4.7 ka appears to
record the Kamikatsura event [14]. This brief episode
of unstable field behavior variously termed an event, a
cryptochron, or an excursion might represent an
aborted reversal or simply abnormally large secular
variation of the field. Our age from the six isochrons
reported here accords well with the single 40Ar/39Ar
age determined from a transitional flow on Tahiti [10].
Together, they give a revised age of 900.4F 4.6 ka
(MSWD=0.81) for the Kamikatsura event, which now
stands as a well-established, high-resolution paleomag-
netic stratigraphic marker in the late Matuyama Chron.
The immediately overlying group, flows 36–59,
records a reversed–normal–transitional sequence of
directions that appears to have occurred during the later
stages of the M–B reversal. The weighted mean age
775.6F 1.9 ka of this group of 24 flows compares well
with the astronomical age of the M–B reversal deter-
mined from several orbitally tuned oxygen isotope
records in marine sediment [32–34]. That the six lower
reversed flows, units 36–41, do not belong to the full-
polarity Matuyama chron is evident for two reasons. (i)
The intensity of primary TRM of these flows, as
estimated by ChRM intensity after cleaning to 250
jC or 20 mT, is on average five to seven times lower
than that of the full-polarity Brunhes and Matuyama
flows and is not significantly different from that of the
18 overlying flows in the group (units 42–59). Al-
though admittedly crude, the average ChRM intensity
of sequences of basalt flows has proven useful in the
absence of successful absolute paleointensity determi-
nations as a qualitative indicator of relative paleointen-
sity (e.g., [35]). (ii) Precisely dated sequences of M–B
transitional lava flows in several parts of the world are
significantly older than the 775.6F 1.9 ka age of this
one from Maui, as we discuss next.
Sequences of lava flows thought to record the M–
B transition are known also from Iceland [36], La
Guadeloupe Island [37], La Palma Island [9,15],
Tahiti [38] and Chile [9,39]. Besides the results
presented here, a total of 15 of these flows from
Tahiti, La Palma and Chile have been dated using
identical 40Ar/39Ar incremental heating methods and
standards [9,11,15,39]. Nine isochrons from three
flows on Tahiti yield an inverse-variance weighted
mean age of 791.7F 5.6 ka (MSWD= 0.58); 19
isochrons from eight flows in Chile yield an age of
792.0F 3.0 ka (MSWD= 0.43); and 14 isochrons
from three flows from La Palma, Canary Islands, yield

R.S. Coe et al. / Earth and Planetary Science Letters 222 (2004) 667–684682
an age of 798.5F 6.5 ka (MSWD=0.70). Moreover,
the flow directly overlying this latter sequence on La
Palma yields an age of 770.1F16.3 ka, more compa-
rable with the 775.6F 1.9 ka age of the 24 Maui flows.
Thus, there is the strong presumption that these flows
from Maui record a later part of the M–B reversal.
Interpreting these ages at face value, it appears that the
M–B reversal may have taken f 16 kyr or more to
complete, two to three times longer than most esti-
mates for reversal duration (e.g., [40]).
Although undoubtedly fragmentary, our younger,
Maui M–B record is nonetheless the most detailed yet
discovered in lava flows (Fig. 6). It shows for the first
time a reversed-to-normal segment with VGPs on or
near the Americas, followed by an oscillation to poles
in the vicinity of New Zealand and back again to high
northern latitude. The most precisely dated flows
(flows 37 and 59, Table 1) occur near the beginning
and end of the M–B sequence and are statistically
indistinguishable (773.0F 3.0 and 774.2F 3.6 ka,
respectively). The nearest other M–B record in lavas
is that from Tahiti [38], with mean age 791.7F 5.6 ka
discussed above, and consists of a reversed-to-normal
VGP path with poles that cluster west of Australia 75jwest of the transitional Maui poles. The Chilean M–B
VGPs form a single cluster in central Australia [39]
about 30jwest of the closest Maui poles, and are about
16 kyears older [9]. The M–B VGP path from La
Palma [15] does lie mainly near the Maui path, but part
of it progresses in the opposite direction and all but the
uppermost flow are about 22 kyears older. Thus, it
seems that, besides taking longer, the M–B polarity
transition was also more complex than it and other
reversals are generally depicted, in agreement with the
unusually complex M–B record from rapidly deposit-
ed sediment drift deposits in the North Atlantic found
by Channell and Lehman [41].
Of course, it could be argued that this later unstable
behavior recorded in theMaui sequence and also by the
single flow on La Palma represents a separate, post-
reversal excursion. Or, for that matter, one could
consider instead that the older transitional sequences
of flows from Tahiti, Chile and La Palma record aM–B
precursory excursion. These appear to be more seman-
tic than real physical possibilities. In light of the 30–
50-kyear post-reversal inhibition period inferred from
analysis of the polarity time scale [31], it makes more
sense to consider all these transitional records as part of
the M–B reversal process. An interesting question
remains, however: Did the reversal take 16 kyears or
more to occur everywhere, or was the reversal time-
transgressive, starting and ending at different times at
different places over the globe? Time-transgressive
behavior is exhibited in the geodynamo simulations
of Glatzmaier et al. [5], especially in the comparably
long and very complex, second reversal of the tomo-
graphic heat-flux model [6]. It seems likely that the
signatures of polarity transitions are quite varied.
We are encouraged by the fact that 40Ar/39Ar results
from these young lavas obtained in three different
laboratories over a sustained period of analysis are in
excellent agreement, both at the scale of sub-samples
measured from an individual lava flow, and also among
the 23 dated lava flows, which do not violate strati-
graphic order within the 95% confidence error limits.
Further, we contend that the temporal resolution gen-
erated during this effort, i.e., ages precise to better than
1% at the 95% confidence level, is necessary to
delineate the paleomagnetic record preserved in Pleis-
tocene lava flow sequences like this one and to resolve
questions such as the duration and degree of simulta-
neity or time-transgressiveness of individual reversals.
8. Conclusions
The northwest wall of Haleakala volcano preserves
a concatenated record of two temporally distinct
periods of transitional behavior of the Earth’s mag-
netic field within the Kamikatsura event and the M–B
polarity transition, brought to light by a detailed
paleomagnetic investigation of the entire section and
a sustained effort to date many basaltic lava flows at a
precision of better than 1% using the 40Ar/39Ar
incremental heating technique.
The full-polarity reversed and normal flows com-
prising the bottom and top parts of the section,
respectively, collectively span 680 kyears and carry
stable directions of remanence that pass a reversal test.
The average of their VGPs does not differ significant-
ly from the rotation axis and their angular standard
deviation is consistent with the mean value for other
0–5 Ma lava flows in the same latitude band.
The flows that lie between the upper and lower
full-polarity sequences carry intermediate, reversed
and normal directions with distinctly lower intensities
R.S. Coe et al. / Earth and Planetary Science Letters 222 (2004) 667–684 683
of NRM after cleaning away secondary components at
200 mT or 250 C. The precision parameters of the
flow-mean directions for these transitional flows are
not significantly less than those for the full-polarity
flows. Moreover, the differences in direction between
sites in the same transitional flow up to 100 m apart is
small, indicating that the effects of local magnetic
anomalies due to irregularity of shape and magneti-
zation of the flow and the flows underlying it are not
important.
The VGP path contains five large jumps of 50–
100j, each occurring where the geology indicates at
least a small interlude between flows. The within-flow
directions reveal neither systematic streaking nor any
other indications of extraordinarily rapid field
changes.
The Kamikatsura event is recorded by 16 flows, 15
of which have VGPs clustered in central South
America. The age determinations of six flows cover-
ing the time span of the cluster are not significantly
different from each other and yield an average age of
900.3F 4.7 ka. Together with another flow from
Tahiti dated with identical techniques and standards,
the best age for the Kamikatsura event is 900.4F 4.6
ka, which now stands as a well-established, high-
resolution paleomagnetic stratigraphic marker in the
late Matuyama Chron.
Twenty-four flows record a portion of the M–B
polarity transition, showing for the first time a re-
versed-to-normal swing of the VGP over the Amer-
icas and an oscillation to a position east of New
Zealand and back to normal. This is the most detailed
record of this reversal yet discovered in lava flows.
Six flows spanning these swings yield 40Ar/39Ar ages
that are indistinguishable within experimental uncer-
tainty and give an average age of 775.6F 1.9 ka, in
agreement with several astronomical estimates for the
age of this reversal.
When compared to other M–B lava flow sequen-
ces from La Palma, Chile and Tahiti dated using the
same 40Ar/39Ar techniques and standards, these lavas
at Haleakala are f 16 kyears younger and thus
preserve a snapshot of what is probably the waning
stages of the reversal. Taken together, these lava-flow
records suggest that the M–B reversal was more
complex and may have taken considerably longer to
complete than is generally considered to be the case.
They raise the possibility that the transition was time-
transgressive, starting and ending at different times at
different places around the globe.
Acknowledgements
We are indebted to Scott Rowland, Dan Miller,
Scott Miller, Carol English and Greg Baker for help in
the field and in the paleomagnetic laboratory and to
Brian Jicha for assistance with the argon analyses and
figures. Reviews by Scott Bogue and Terry Spell
helped to clarify several issues and are much
appreciated. This work was supported by NSF grants
EAR-8417639, EAR-9526553, EAR-9909309, EAR-
0114055 and EAR-0310316. [KF]
References
[1] A. Cox, Plate Tectonics and Geomagnetic Reversals, Freeman,
San Francisco, 1973.
[2] J.A. Jacobs, Reversals of the Earth’s Magnetic Field, Cam-
bridge Univ. Press, Cambridge, 1994, 346 pp.
[3] R.T. Merrill, P.L. McFadden, Paleomagnetism and the nature
of the geodynamo, Science 248 (1990) 345–350.
[4] N.D. Opdyke, J.E.T. Channell, Magnetic Stratigraphy, Aca-
demic Press, San Diego, CA, 1996346 pp.
[5] G.A. Glatzmaier, R.S. Coe, L. Hongre, P.H. Roberts, The role
of the Earth’s mantle in controlling the frequency of geomag-
netic reversals, Nature 401 (1999) 885–890.
[6] R.S. Coe, L. Hongre, G.A. Glatzmaier, An examination of sim-
ulated geomagnetic reversals from a palaeomagnetic perspec-
tive, Philos. Trans. R. Soc. Lond., A 358 (2000) 1141–1170.
[7] R.S. Coe, J.M.G. Glen, The complexity of reversals, in: J.E.T.
Channell, et al. (Eds.), Timescales of the Internal Geomagnetic
Field, American Geophysical Union Monograph Series, 2004,
in press.
[8] I. McDougall, T.M. Harrison, Geochronology and Thermo-
chronology by the 40Ar/39Ar Method, Oxford Univ. Press,
New York, 1999.
[9] B.S. Singer, M.S. Pringle, The age and duration of the
Matuyama–Brunhes geomagnetic polarity reversal from40Ar/39Ar incremental heating analyses of lavas, Earth Planet.
Sci. Lett. 139 (1996) 47–61.
[10] B.S. Singer, K.A. Hoffman, A. Chauvin, R.S. Coe, M.S.
Pringle, Dating transitionally magnetized lavas of the late
Matuyama Chron: toward a new 40Ar/39Ar timescale of
reversals and events, J. Geophys. Res. 104 (1999) 679–693.
[11] B.S. Singer, R.S. Coe, K.A. Hoffman, L.L. Brown, B.R. Jicha,
M.S. Pringle, A. Chauvin, Duration and structure of the
Matuyama–Brunhes geomagnetic polarity reversal from40Ar/39Ar dated flows, Eos Trans. Am. Geophys. Union 83
(2002) F423.

R.S. Coe et al. / Earth and Planetary Science Letters 222 (2004) 667–684684
[12] I. McDougall, Potassium–argon ages from lavas of the Ha-
waiian Islands, Geol. Soc. Amer. Bull. 75 (1964) 107–128.
[13] A.K. Baksi, V. Hsu, M.O. McWilliams, E. Farrar, 40Ar/39Ar
dating of the Brunhes–Matuyama geomagnetic field reversal,
Science 256 (1992) 356–357.
[14] D.E. Champion, M.A. Lanphere, M.A. Kuntz, Evidence for a
new geomagnetic reversal from lava flows in Idaho: discus-
sion of short polarity reversals in the Brunhes and late
Matuyama polarity chrons, J. Geophys. Res. 93 (1988)
11667–11680.
[15] B.S. Singer, M.R. Relle, K.A. Hoffman, A. Battle, H. Guillou,
C. Laj, J.C. Carracedo, 40Ar/39Ar ages of transitionally mag-
netized lavas on La Palma, Canary Islands, and the geomag-
netic instability timescale, J. Geophys. Res. 107 (2002) 2307
(doi: 2310.1029/2001JB001613).
[16] G.A. MacDonald, Geologic map of the crater section of
Haleakala National Park, Maui, Hawaii, U.S. Geological Sur-
vey Map 1-1088, 1:24000 (1978).
[17] P.L. McFadden, M.W. McElhinny, The combined analysis of
remagnetization circles and direct observations in paleomag-
netism, Earth Planet. Sci. Lett. 87 (1988) 161–172.
[18] G.S. Watson, Analysis of dispersion on a sphere, Mon. Not. R.
Astron. Soc. Geophys. Suppl. 7 (1956) 153–159.
[19] P.L. McFadden, M.W. McElhinny, Classification of the rever-
sals test in palaeomagnetism, Geophys. J. Int. 103 (1990)
725–729.
[20] C.L. Johnson, C.G. Constable, Palaeosecular variation
recorded by lava flows over the past five million years,
Philos. Trans. R. Soc. Lond., A 354 (1996) 89–141.
[21] P.L. McFadden, R.T. Merrill, M.W. McElhinny, S. Lee, Rever-
sals of the Earth’s magnetic field and temporal variations of
the dynamo families, J. Geophys. Res. 96 (1991) 3923–3933.
[22] R.S. Coe, M. Prevot, P. Camps, New evidence for extraordi-
narily rapid change of the geomagnetic field during a reversal,
Nature 374 (1995) 687–692.
[23] R.S. Coe, M. Prevot, Evidence suggesting extremely rapid
field variation during a geomagnetic reversal, Earth Planet.
Sci. Lett. 92 (1989) 292–298.
[24] C. Laj, A. Mazaud, R. Weeks, M. Fuller, E. Herrero-Bervera,
Geomagnetic reversal paths, Nature 351 (1991) 447.
[25] K.A. Hoffman, Long-lived transitional states of the geomag-
netic field and the 2 dynamo families, Nature 354 (1991)
273–277.
[26] P.R. Renne, C.C. Swisher, A.L. Deino, D.B. Karner, T.L.
Owens, D.J. DePaolo, Intercalibration of standards, absolute
ages and uncertainties in 40Ar/39Ar dating, Chem. Geol. 145
(1998) 117–152.
[27] J.R. Wijbrans, M.S. Pringle, A.A.P. Koppers, R. Scheveers,
Argon geochronology of small samples using the Vulkaan ar-
gon laserprobe, Proc. Dutch Acad. Sci. 98 (1995) 185–218.
[28] J.R. Taylor, An Introduction to Error Analysis, University
Science Books, Mill Valley, CA, 1982, 270 pp.
[29] R.H. Steiger, E. Jager, Subcommission on geochronology:
convention on the use of decay constants in geo- and cosmo-
chronology, Earth Planet. Sci. Lett. 5 (1977) 320–324.
[30] D. York, Least squares fitting of a straight line with correlated
errors, Earth Planet. Sci. Lett. 5 (1969) 320–322.
[31] P.L. McFadden, R.T. Merrill, Inhibition and geomagnetic
field reversals, J. Geophys. Res.-Solid Earth V98 (1993)
6189–6199.
[32] N.J. Shackleton, A. Berger, W.R. Peltier, An alternative as-
tronomical calibration of the lower Pleistocene timescale
based on ODP site 677, Trans. R. Soc. Edinb. 81 (1990)
251–261.
[33] L. Tauxe, T. Herbert, N.J. Shackleton, Y.S. Kokk, Astronom-
ical calibration of the Matuyama–Brunhes boundary: conse-
quences for magnetic remanence acquisition in marine
carbonates and the Asian loess sequences, Earth Planet. Sci.
Lett. 140 (1996) 133–146.
[34] J.E.T. Channell, H. Kleiven, Geomagnetic palaeointensities
and astrochronological ages for the Matuyama–Brunhes
boundary and the boundaries of the Jaramillo subchron: palae-
omagnetic and oxygen isotope records from ODP Site 983,
Philos. Trans. R. Soc. London., A 358 (2000) 1027–1047.
[35] M. Prevot, S. Gromme, Intensity of magnetization of subaerial
and submarine basalts and its possible change with time, Geo-
phys. J. R. Astr. Soc. 40 (1975) 207–224.
[36] L. Kristjansson, H. Johannesson, J. Eiriksson, A.I. Gudmunds-
son, Brunhes–Matuyama paleomagnetism in 3 lava sections
in Iceland, Can. J. Earth Sci. 25 (1988) 215–225.
[37] J. Carlut, X. Quidelleur, V. Courtillot, G. Boudon, Paleomag-
netic directions and K/Ar dating of 0 to 1 Ma lava flows from
La Guadeloupe Island (French West Indies): implications for
time-averaged field models, J. Geophys. Res. 105 (2000)
835–849.
[38] A. Chauvin, P. Roperch, R.A. Duncan, Records of geomag-
netic reversals from volcanic islands of French Polynesia: 2.
Paleomagnetic study of a flow sequence (1.2–0.6 Ma) from
the island of Tahiti and discussion of reversal models, J. Geo-
phys. Res. 95 (1990) 2727–2752.
[39] L. Brown, J. Pickens, B. Singer, Matuyama–Brunhes transi-
tion recorded in lava flows of the Chilean Andes: evidence for
dipolar fields during reversals, Geology 22 (1994) 299–302.
[40] R.T. Merrill, P.L. McFadden, Geomagnetic polarity transi-
tions, Rev. Geophys. 37 (1999) 201–226.
[41] J.E.T. Channell, B. Lehman, The last two geomagnetic polar-
ity reversals recorded in high-deposition-rate sediment drifts,
Nature 389 (1997) 712–715.