POST-OROGENIC EVOLUTION OF THE DABIE SHAN, EASTERN CHINA, FROM (U-Th)/He AND FISSION-TRACK...
30
American Journal of Science JUNE 2003 POST-OROGENIC EVOLUTION OF THE DABIE SHAN, EASTERN CHINA, FROM (U-Th)/He AND FISSION-TRACK THERMOCHRONOLOGY PETER W. REINERS*, ZUYI ZHOU**, TODD A. EHLERS***, CHANGHAI XU**, MARK T. BRANDON*, RAYMOND A. DONELICK****, AND STEFAN NICOLESCU* ABSTRACT. The Dabie Shan of eastern China is a 200 kilometers wide mountain range with nearly 2 kilometers of relief and is an archetype of deep ultrahigh-pressure metamorphic rock exhumation. Despite its regional and petrologic importance, little is known about the low-temperature and post-orogenic evolution of the Dabie Shan. Here we present apatite and zircon (U-Th)/He (AHe and ZHe, respectively) and apatite fission-track (AFT) cooling ages from the Dabie Shan that constrain the patterns and history of exhumation over the last 115 myr. On the scale of the whole orogen, ZHe and AHe ages are inversely correlated with mean elevation and are systematically younger in the core of the range. These cooling ages were converted to exhumation rates assuming steady-state erosion and accounting for topographic effects. These results indicate that, since the Eocene, flanks of the range have eroded at rates as low as 0.02 km/myr, while the range core has eroded at about 0.06 km/myr. Even in the core of the range, these recent exhumation rates are at least 10 to 20 times slower than those estimated for the initial stages of exhumation in the Triassic-Jurassic. In a 1.4 kilometer vertical transect in the core of the range, all ages are positively correlated with elevation, with ZHe ages increasing from 76 to 112 Ma, AFT from 44 to 70 Ma, and AHe from 24 to 43 Ma. We present a simple model for topographic correction of thermochronometric ages in vertical transects, using the admittance ratio (ratio of isotherm relief to topographic relief). Applied to the AHe age-elevation relationship, this yields Tertiary exhumation rates of 0.05 to 0.07 km/myr in the core of the Dabie Shan, in good agreement with regional exhumation rate patterns. Finally, age-elevation relationships for all three chronometers in the vertical transect are consistent with a constant exhumation rate of 0.06 0.01 km/myr since the Creta- ceous, with a possible modest increase in exhumation rates (as high as 0.2 km/myr) between 80 to 40 Ma. These data show no evidence for significant variations in exhumation rates over the last 115 myr, as might be expected for decay of old topography or tectonic reactivation of old structures. introduction Collisional orogenies typically produce topographic and geophysical anomalies persisting several hundred million years. The post-orogenic evolution of mountain ranges and their responses to erosion and subsequent tectonic events provides insights to a variety of problems, including the deep crustal architecture of orogens, dynamics of lithospheric roots, and the erosional decay of topographic anomalies. Typically, the topographic and structural decay of an ancient mountain range is not monotonic, and *Department of Geology and Geophysics, Yale University, P.O. Box 208109, New Haven, Connecticut 06520-8109, USA; [email protected] **MOE Lab of Marine Geology, Tongji University, Shanghai 200092, China ***Department of Geological Sciences, University of Michigan, Ann Arbor, Michigan 48109, USA ****Apatite to Zircon, Inc., Viola, Idaho 83872, USA [American Journal of Science, Vol. 303, June, 2003, P. 489 –518] 489
Transcript of POST-OROGENIC EVOLUTION OF THE DABIE SHAN, EASTERN CHINA, FROM (U-Th)/He AND FISSION-TRACK...
American Journal of ScienceJUNE 2003
POST-OROGENIC EVOLUTION OF THE DABIE SHAN, EASTERNCHINA, FROM (U-Th)/He AND FISSION-TRACK
THERMOCHRONOLOGY
PETER W. REINERS*, ZUYI ZHOU**, TODD A. EHLERS***, CHANGHAI XU**,MARK T. BRANDON*, RAYMOND A. DONELICK****,
AND STEFAN NICOLESCU*
ABSTRACT. The Dabie Shan of eastern China is a �200 kilometers wide mountainrange with nearly 2 kilometers of relief and is an archetype of deep ultrahigh-pressuremetamorphic rock exhumation. Despite its regional and petrologic importance, little isknown about the low-temperature and post-orogenic evolution of the Dabie Shan.Here we present apatite and zircon (U-Th)/He (AHe and ZHe, respectively) andapatite fission-track (AFT) cooling ages from the Dabie Shan that constrain thepatterns and history of exhumation over the last �115 myr. On the scale of the wholeorogen, ZHe and AHe ages are inversely correlated with mean elevation and aresystematically younger in the core of the range. These cooling ages were converted toexhumation rates assuming steady-state erosion and accounting for topographiceffects. These results indicate that, since the Eocene, flanks of the range have erodedat rates as low as 0.02 km/myr, while the range core has eroded at about 0.06 km/myr.Even in the core of the range, these recent exhumation rates are at least 10 to 20 timesslower than those estimated for the initial stages of exhumation in the Triassic-Jurassic.In a 1.4 kilometer vertical transect in the core of the range, all ages are positivelycorrelated with elevation, with ZHe ages increasing from 76 to 112 Ma, AFT from 44 to70 Ma, and AHe from 24 to 43 Ma. We present a simple model for topographiccorrection of thermochronometric ages in vertical transects, using the admittance ratio(ratio of isotherm relief to topographic relief). Applied to the AHe age-elevationrelationship, this yields Tertiary exhumation rates of 0.05 to 0.07 km/myr in the coreof the Dabie Shan, in good agreement with regional exhumation rate patterns. Finally,age-elevation relationships for all three chronometers in the vertical transect areconsistent with a constant exhumation rate of 0.06 � 0.01 km/myr since the Creta-ceous, with a possible modest increase in exhumation rates (as high as 0.2 km/myr)between 80 to 40 Ma. These data show no evidence for significant variations inexhumation rates over the last �115 myr, as might be expected for decay of oldtopography or tectonic reactivation of old structures.
introductionCollisional orogenies typically produce topographic and geophysical anomalies
persisting several hundred million years. The post-orogenic evolution of mountainranges and their responses to erosion and subsequent tectonic events provides insightsto a variety of problems, including the deep crustal architecture of orogens, dynamicsof lithospheric roots, and the erosional decay of topographic anomalies. Typically, thetopographic and structural decay of an ancient mountain range is not monotonic, and
*Department of Geology and Geophysics, Yale University, P.O. Box 208109, New Haven, Connecticut06520-8109, USA; [email protected]
**MOE Lab of Marine Geology, Tongji University, Shanghai 200092, China***Department of Geological Sciences, University of Michigan, Ann Arbor, Michigan 48109, USA****Apatite to Zircon, Inc., Viola, Idaho 83872, USA
[American Journal of Science, Vol. 303, June, 2003, P. 489–518]
489

characteristics such as topographic relief, lithospheric structure, and erosional fluxeschange in response to post-orogenic deformation, climatic changes, fluvial adjust-ments, or convective instabilities (for example, Pazzaglia and Brandon, 1996; Duceaand Saleeby, 1998; Ratschbacher and others, 2000; Jull and Kelemen, 2001; Baldwinand others, 2003). In some cases, post-orogenic dynamics of ancient ranges may recordeffects of relatively subtle or far-field tectonic activity or climatic changes, becausethese high-relief regions are susceptible to subtle erosion rate changes, which can bequantified with low-temperature thermochronometry such as (U-Th)/He or fission-track dating.
This study examines the post-orogenic evolution of the Dabie Shan of easternChina, an early Mesozoic mountain range whose initial high-temperature evolution iswell-studied following the discovery of diamond- and coesite-bearing crustal rocksthere. Here we present results and interpretations of the low-temperature post-orogenic history of the Dabie Shan, using apatite and zircon (U-Th)/He (AHe andZHe, respectively) and apatite fission-track (AFT) thermochronometry. The goal is toconstrain the timing and rates of shallow crustal exhumation since the last majororogenic episode (mid-Cretaceous). Other than a previous study with four zircon(U-Th)/He ages (Kirby and others, 2002), this study represents the first regionalapplication of zircon (U-Th)He thermochronometry to understand orogenic exhuma-tion, and our results support previous interpretations suggesting that ZHe ages can beassumed to represent cooling ages associated with an effective closure temperature of180° � 20°C.
In interpreting these data we demonstrate the use of three different and relativelysimple methods for interpreting topography-corrected exhumation rates from low-temperature thermochronologic ages. The first method interprets exhumation ratesfrom isolated ages in the context of a steady exhumation rate model that accounts forclosure depth variations arising from variable cooling rates, topography above a criticalwavelength, and other effects (Brandon and others, 1998). This method is used todemonstrate a strong cross-range gradient in exhumation rates in the Dabie Shan. Thesecond method interprets exhumation rates from age-elevation relationships of verti-cal transects by correcting for topographic effects (for example, Stuwe and others,1994; Mancktelow and Grasemann, 1997) using the admittance ratio (the ratio ofisotherm to topographic relief). Admittance ratio has been introduced by Braun(2002a) for assessing temporal changes in topographic relief; here we use it to correctfor topographic effects on age-elevation relationships as a function of topographicwavelength and closure temperature. Our method makes use of the fact that admit-tance is largely independent of topographic relief, thus providing a useful andeasily-applied correction for vertical-transect data. Finally, we directly model thethermal evolution of samples in the vertical transect using production-diffusion andannealing models, allowing for different thermal histories caused by topography in thelatest stages of exhumation. Application of all three of these methods indicate thatexhumation since at least the mid-Tertiary in the core of the Dabie Shan has been0.06 � 0.01 km/myr.
tectonic settingThe Dabie Shan of east-central China (fig. 1) lies at the eastern terminus of the
currently contiguous part of a �2000 kilometer long orogenic belt of generallysubdued topographic relief (�2 km), extending from the Dabie Shan west towards thenorthern edge of the Tibetan plateau. Over most of its length, this belt is interpreted asthe Triassic suture zone between the Yangtze craton to the south (now part of theSouth China block), and the Sino-Korean craton to the north (now part of the NorthChina block). From west to east, it comprises the Qinling, Tongbai, Hong’an, andDabie Shan. The Sulu region, about 500 kilometers northeast of the Dabie and
490 Peter W. Reiners and others—Post-orogenic evolution of the Dabie Shan,
separated from it by the Tan-Lu fault, is interpreted to be an eastern extension of thisbelt. Yin and Nie (1993) proposed that the originally irregular margin of the Yangtzecraton block may be responsible for the apparent separation between the Dabie andSulu areas.
A variety of geochronologic and sedimentologic evidence points to a Triassic agefor the initial cratonal collision, with metamorphism continuing into the Jurassic (Nieand others, 1994; Hacker and others, 1996). High- and ultrahigh-pressure (UHP)supracrustal rocks are thought to have been exhumed from depths as great as 120 to
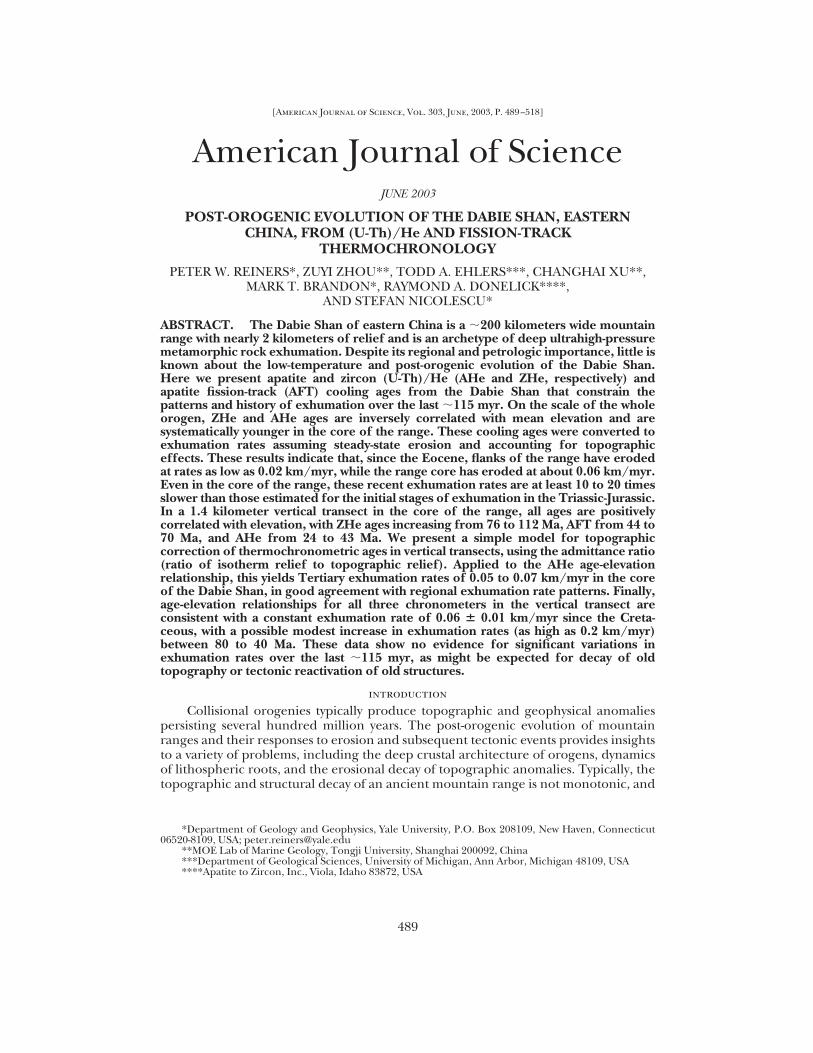
Fig. 1. A. Generalized tectonic map of part of southeast Asia, showing major active faults (black lines),mountain ranges, and location of the Dabie Shan (after Wang and others, 2001). B. Digital elevation modelof the Dabie Shan region, and sample locations. Black lines are locations of cross-range profiles onto whichsample data have been orthogonally projected in figures 2 and 4. Dashed blue line delineates samples fromthe core and flanks of the range, as referred to in text. Yellow square is location of central point used toreference radial distance of samples in figures 2 and 5. C. Mean elevation (km above sea level) for a 10-kmwindow, for yellow boxed region in (B), used for closure depth calculations for the AHe system.
491eastern China, (U-Th)/He and fission-track thermochronology

140 kilometers (or higher; Zhang and others, 1999) near the end of the Triassic-Jurassic orogenic event (Hacker and others, 1996; Liou and others, 1996), to depthscorresponding to �200°C by the middle Jurassic (Hacker and others, 2000). Evidencefor collision and rapid initial exhumation during the Triassic-Jurassic comes in partfrom zircon U/Pb ages throughout the Dabie Shan that are �210 to 240 Ma, (althoughProterozoic upper intercepts or cores are common) (Rowley and others, 1997; Hackerand others, 1998, 2000), as well as from white mica and biotite 40Ar/39Ar ages betweenabout 280 to 118 Ma (Okay and others, 1993; Eide and others, 1994; Hacker and Wang,1995; Hacker and others, 2000; Ratschbacher and others, 2000).
In the early to middle Cretaceous, the Dabie Shan experienced a second majororogenic event, as did many other regions in eastern China, that was dominantlyextensional and accompanied by voluminous magmatism. This event was probablyrelated to subduction of the paleo-Pacific plate to the east (Ratschbacher and others,2000). Cretaceous plutons and orthogneisses with crystallization ages of 137 to 125 Ma(Xue and others, 1997; Ratschbacher and others, 2000) and estimated emplacementpressures of 4 to 9 kbar comprise almost half of the presently exposed rocks in theDabie Shan. Assuming an average depth of 18 kilometers for these plutons (Ratsch-bacher and others, 2000), the time-averaged exhumation rate since their averagecrystallization age (133 Ma) would be about 0.14 km/myr. Ductile and brittle exten-sional deformation during and subsequent to the Cretaceous magmatism also resultedin exhumation of high-pressure and ultra-high-pressure coesite-diamond bearingrocks from about 18 to 30 kilometers depths to shallow crustal depths (Eide and others,1994; Webb and others, 1999; Ratschbacher and others, 2000), although it is unclear ifUHP rocks were already at the surface prior to the Cretaceous orogeny. Feldspar40Ar/39Ar dating and petrologic and structural evidence indicate that the NorthernOrthogneiss unit in the northern part of the range developed a broad domal structureat this time. 40Ar/39Ar cooling models of K-feldspar indicate that rocks now at thesurface cooled through temperatures of approximately 200°C between �200 to 90 Ma.Some of these K-feldspar ages are interpreted as cooling from re-heating between 110to 90 Ma, and as late as 75 Ma in the nearby Tongbai region (Webb and others, 1999;Ratschbacher and others, 2000).
Although both the Triassic-Jurassic and Cretaceous orogenic events may havebeen responsible for most of the exhumation of the currently exposed UHP rocks inthe Dabie, evidence for the timing of first exposure of UHP rocks at the earth’s surfacein this range is ambiguous (Xue and others, 1996; Ratschbacher and others, 2000).Grimmer and others (2003) addressed this by measuring 207Pb/206Pb and 40Ar/39Arages of detrital zircon and white mica, respectively, in synorogenic Triassic-Jurassicforeland sedimentary rocks surrounding the Hong’an-Dabie. They showed that theHong’an-Dabie was the dominant sediment source, and they found two Triassic zirconsand a few high-Si phengites in the Mesozoic sedimentary rocks. On this basis, theytentatively suggested that UHP rocks in the Dabie may have been exposed as early asthe Middle Jurassic (190-160 Ma).
Cenozoic tectonic activity in the Dabie Shan has been inferred from geomorphicand kinematic evidence of Tertiary motion along large strike-slip and normal faultssurrounding it and the Qinling Shan to the west (Peltzer and others, 1985; Ratsch-bacher and others, 2000), as well as from fault-proximal basins filled by Tertiarysediments. Ratschbacher and others (2000) estimated a total Tertiary exhumationfrom the Dabie Shan �5 kilometers, which is similar to the depth of Eocene sedimentsin the proximal basins east of the Dabie Shan. Part of the significance of this potentialTertiary exhumation derives from the possible influence of far-field and regionalTertiary tectonic events on the Dabie Shan, such as the Indo-Asian collision to thesouthwest (for example, Molnar and Tapponnier, 1975; Grimmer and others, 2002),
492 Peter W. Reiners and others—Post-orogenic evolution of the Dabie Shan,

strike-slip-dominated escape tectonics to the south (for example, Tapponnier andMolnar, 1977; Tapponnier and others, 1986), and extensional deformation to thenorth (Peltzer and others, 1985). The question of orogenic reactivation of the rangeover its �200 myr history may also provide insight into the relationships betweenlong-term exhumation rates, multiple orogenic pulses, and UHP rock exhumation(Xue-Cheng and others, 2003). Finally, the Cenozoic evolution of the Dabie Shan mayalso provide constraints on the problem of long-term maintenance of topographicrelief in ancient orogens (for example, Pazzaglia and Brandon, 1996; Baldwin andothers, 2003).
The only previous low-temperature thermochronologic constraints on the DabieShan come from a recent apatite fission-track dating study by Grimmer and others(2002) of the eastern Dabie and adjacent foreland basin. The range of AFT agesreported is 42 to 158 Ma, but most samples have ages of 55 to 90 Ma, attributed togradual cooling from mid-Cretaceous heating. Eight samples, most of which are fromnear the Tan-Lu fault on the eastern boundary of the range however, have AFT agesbetween 42 and 55 Ma. Grimmer and others (2002) interpreted this as evidence forEocene reactivation of the Tan-Lu fault zone and exhumation in the eastern Dabie;possibly a far-field effect of the Indo-Asian collision. However, none of the track lengthmodels of any of the samples in that study clearly require increased cooling rates sincethe Cretaceous. Although Grimmer and others (2002) interpreted track length modelsof a small number of samples as suggesting increased cooling rates in the Eocene,constant cooling rates since at least the late Cretaceous (in most cases mid-Cretaceous)provide suitable “good-fit” models to all the track-length data. In the present study,although we identify spatially variable cooling and exhumation rates in the DabieShan, we find no clear evidence for temporal variations in cooling rates since theCretaceous. Furthermore, even if temporal changes in cooling rates did occur in theDabie Shan (and elsewhere), they could not be convincingly demonstrated by onlyregional ages from a single system. This requires either topographically-controlledvertical transects of ages, or ages from multiple systems with different closure tempera-tures, both of which are presented here.
methods and samplesWe measured (U-Th)/He ages of apatite and zircon and fission-track ages of
apatite in twenty-two individual samples from the Dabie Shan, although not all systemswere measured on every sample. Numerous studies have established the utility ofapatite (U-Th)/He dating, and its approximate closure temperature (for commoncooling rates and crystal sizes) of 65° to 70°C (Wolf and others, 1996; Farley, 2000).Similarly, the basis and utility of apatite fission-track dating are well established, as isthe closure temperature of about 110°C, for typical apatite compositions and coolingrates (for example, Gallagher and others, 1998).
Zircon (U-Th)/He thermochronometry has only recently been applied to tec-tonic studies, but both He diffusion experiments and age comparisons with othersystems in slowly-cooled rocks suggest a closure temperature in the range of 160° to200°C (Reiners and others, 2002). In particular, comparisons between zircon He agesand cooling trends derived from multi-domain diffusion models of K-feldspar 40Ar/39Ar dating support a zircon He closure temperature in this range (Kirby and others,2002; Reiners and Spell, 2002; Reiners and others, unpublished data). In this study, weassume diffusion characteristics for He in zircon and ZHe closure temperature basedon recent diffusion experiments at Yale that are consistent with previous results(Reiners and others, 2002); and are described in detail in a forthcoming study (Reinersand others, unpublished data; a subset are also described in Reiners and Spell, 2002).These step-heating experiments were performed on both rapidly cooled Cretaceouszircons with cooling and crystallization ages (100-150 Ma), U concentrations (�100-
493eastern China, (U-Th)/He and fission-track thermochronology

400 ppm), and dimensions (50-60 �m tetragonal prism radii) similar to Dabie Shanzircons of this study, as well as on interior fragments of undamaged gem-qualityzircons. Results from both types of specimens are essentially the same and indicate anactivation energy (Ea) of 40 � 1 kcal/mol, and a frequency factor (D0) of 0.6 cm2/s forHe diffusion in zircon. These characteristics yield a closure temperature of 180°C forcooling rate of 10°C/myr and crystal size of 60 �m. Therefore, in subsequentinterpretations requiring assumptions of zircon (U-Th)/He closure temperature, weassume a nominal closure temperature of 180° � 20°C for ZHe.
Our samples (fig. 1) were collected from elevations between 32 and 1730 metersabove sea level in the Dabie Shan, encompassing the full range of relief. Most sampleswere collected to provide broad areal coverage, but six samples were collected in a�1.4-kilometer vertical transect (over a horizontal distance of �5-6 km) from near thecenter of the range where the relief is highest. Most samples are from Cretaceousgranitic and orthogneissic rocks originally emplaced or metamorphosed at �12-25kilometers depth. The remaining samples were collected from Carboniferous metasand-stone (sample DB15), and Jurassic or Cretaceous sandstones (samples DB12, DB30,DB32). All ages reported here are interpreted as cooling ages of bedrock from whichthe samples were derived. Stratigraphic reconstructions suggest that the Jurassic/Cretaceous sandstones were buried beneath approximately 6 kilometers of sedimen-tary rocks (Xue and Jin, 2001), so even ZHe ages of these samples probably representin-situ cooling ages, rather than unreset or partially reset cooling ages of theirsource(s).
resultsIn the following discussions, we distinguish between samples from the flanks of
the range and core of the range (fig. 1), by referring to samples as either range-flanks,or range-core samples. Although this spatial classification coincides roughly with thegeographic location of samples with respect to the mean topographic center of theDabie Shan (and range-core samples are from areas with 50-km-averaged meanelevations �300 m, except for samples DB21 and DB27), the distinction betweenrange-flank and range-core is made primarily on the basis of ages, not structural orrigorous topographic differences between the central and outer part of the Dabie.
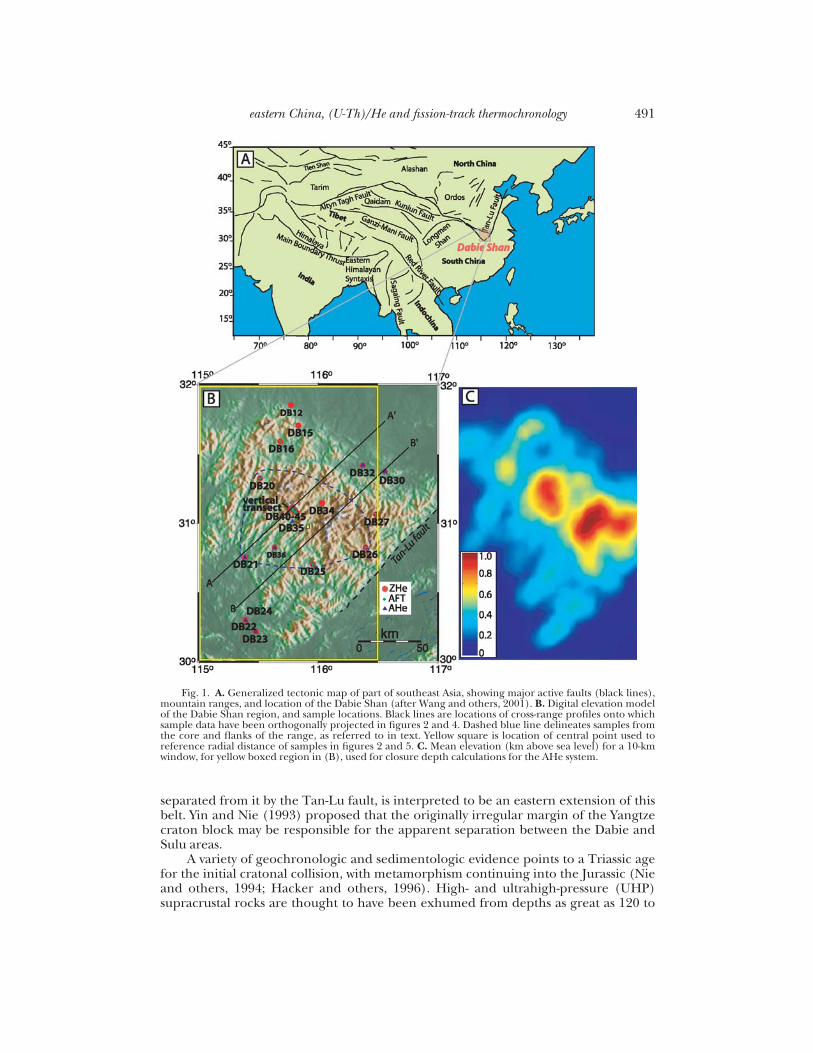
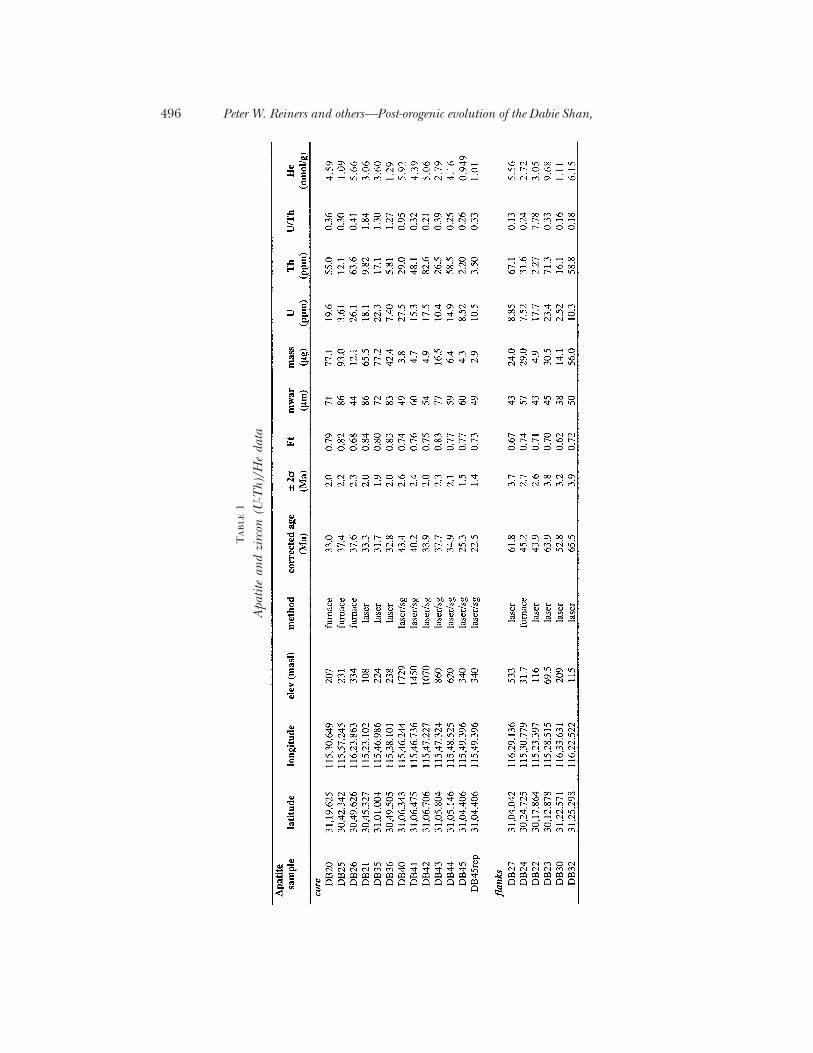
ZHe ages throughout the orogen (table 1) are 76 to 155 Ma, and show an overallincrease in age with distance from the center of the range (fig. 2). ZHe ages fromrange-flank samples are 114 to 155 Ma (with one exception at 88 Ma), whereas thosefrom the range-core are 76 to 115 Ma (figs. 2 and 3). The oldest ZHe age, equal to 155Ma is found in the northwestern corner of the range, even though in the cross-rangetransect it appears to be close to the range-core (fig. 2). ZHe ages in the verticaltransect in the range-core increase from 76 Ma at 388 meters, to 112 Ma at 1730 meters,but the four highest samples (860 to 1730 m) are indistinguishable within error at 110to 112 Ma. Below 860 meters, ZHe ages decrease rapidly with elevation, with a slope of0.015 (�0.002/-0.003, 2�) km/myr (R2 � 0.95) (fig. 3). Slopes of age-elevationrelationships for ZHe and other systems were estimated using weighted regression withthe cooling ages as the dependent variable and the weights set using the errors for theages. The estimated slope and uncertainties were then inverted to give the estimatedexhumation rate and uncertainties.
AFT ages range from 44 to 86 Ma throughout the orogen (table 2). There are toofew AFT data to resolve the flanks-to-core younging seen in the ZHe and AHe. Theoldest AFT age (86 Ma) is from the most distal sample, in the far northwest corner ofthe range, which also has the oldest ZHe age (155 Ma). AFT ages increase withelevation in the vertical transect, from 44 to 73 Ma (except for the uppermost twosamples, which decrease from 73 and 70 Ma with height), with a slope of 0.048(�0.007/-0.009) km/myr (R2 � 0.92).
494 Peter W. Reiners and others—Post-orogenic evolution of the Dabie Shan,

AHe ages range from 24 to 66 Ma throughout the orogen, and, similar to ZHe,show a general younging towards the core of the range, where samples have AHe agesof 24 to 44 Ma, compared with 44 to 66 Ma for range flanks samples. Samples from thevertical transect span the entire range of range-core ages (24-44 Ma), and show apositive age-elevation correlation (R2 � 0.83), with a slope of 0.070 � 0.004 km/myr.
discussion
Cross-Range Exhumation Rate GradientPrevious K-feldspar 40Ar/39Ar cooling models for Dabie Shan samples indicate
final cooling through �200°C at �90 to 150 Ma (Hacker and others, 2000; Ratsch-bacher and others, 2000), with some samples from Hong’an Shan west of the DabieShan indicating younger ages of 75 to 85 Ma (Webb and others, 1999). Our ZHe agesof 76 to 155 Ma are broadly consistent with these results, given a ZHe closuretemperature of 180° � 20°C (Reiners and others, 2002; Reiners and Spell, 2002). Theoverall increase in ZHe ages away from the center of the range is also similar toprevious observations of roughly concentric patterns in apparent reheating ages(above about 200°C) from K-feldspar thermochronometry, and inferred depths ofexhumation (Hacker and others, 1996).
The concentric pattern of K-feldspar cooling ages has been interpreted asresulting from a mid-Cretaceous thermal dome with the �200°C isotherm oblique tothe present-day exposure level (Ratschbacher and others, 2000). To produce thespatial-temporal pattern observed in both the K-feldspar Ar ages and ZHe ages, theseisotherms would have to have migrated towards the core over �50 myr, at �2 km/myr.An alternative interpretation is that ages young towards the core simply becauseexhumation rates have been higher there. The flank-to-core exhumation rate gradientwould have existed through most of the Cretaceous to produce the 75 to 155 Ma ZHeages observed across the range, and perhaps into the Tertiary, to produce the similarpattern of roughly concentric AHe ages, from 24 to 66 Ma from core-to-flanks.
To evaluate the hypothesis that there is a large-scale gradient in exhumation ratesacross the range, we need to estimate local exhumation rates from the age of eachsample. In principle, this means simply dividing the closure depths by the measuredcooling ages. However, closure depth for each sample is itself a function of exhuma-tion rate, even in steady-state, since closure temperature is function of cooling rate. Inaddition, variations between measured ages are a function of not only differences inexhumation rates, but also differences in sample elevations with respect to the closuredepth. One possible approach to account for these effects would be to first correctmeasured ages to those that would be observed at the mean local elevation (to accountfor differences in depth of the closure isotherm) using an assumed exhumation ratedetermined from the vertical transect (0.07 km/myr, or lower, as discussed below).Closure depth could also be determined from geotherms and cooling rates calculatedfrom this assumed exhumation rate, and the ratio of closure depth to age would yieldapparent local exhumation rate. This approach has the drawback of requiring anassumption of a single exhumation rate for samples suspected of having differentexhumation rates. In addition, the apparent exhumation rate from the verticaltransect is subject to some uncertainty because of short wavelength topographiceffects, as described below.
Here we take an alternative approach, as outlined by Brandon and others (1998),for converting observed cooling ages to exhumation rates (for detailed description seeAppendix A of Brandon and others, 1998). To estimate closure depth for each AHeage, we use a steady erosion model that relates closure temperature, depth, exhuma-tion rate, and age as a function of the following parameters: pre-exhumationalgeothermal gradient (here assumed to be 20° or 25°C/km), thermal diffusivity (32
495eastern China, (U-Th)/He and fission-track thermochronology
Tab
le1
Apa
tite
and
zirc
on(U
-Th)
/He
data
496 Peter W. Reiners and others—Post-orogenic evolution of the Dabie Shan,
Tab
le1
(con
tinue
d)
Not
e:Ft
isal
pha-
ejec
tion
corr
ecti
on(F
arle
y,20
02);
sgis
sin
gle-
grai
nan
alys
is;m
war
ism
ass-
wei
ghte
dav
erag
era
dius
(or
sim
ply
radi
usfo
rsi
ngl
egr
ain
s).
497eastern China, (U-Th)/He and fission-track thermochronology

Fig. 2. A. Cross-range elevation (left y-axis) profiles along lines A-A (black) and B-B (grey) in figure 1,with He and fission-track ages (right y-axis) projected onto line B-B. For the ZHe and AHe systems there isan overall decrease in cooling ages from flanks to core of the range. The most obvious exception to this is theoldest ZHe age (DB16); although this sample projects to near the core of the range, it is actually in thecluster of three ZHe samples far to the northwest of the core of the range seen in figure 1, and is shown herein a smaller symbol to distinguish it from the other samples. B. AHe, ZHe, and AFT ages as a function ofradial distance from center of the range. In both A and B, the age of samples in the vetical transect is shownas the average age, and white boxes represent total range of ages. Error bars on (U-Th)/He ages are 2�,those on AFT ages are 1�.
498 Peter W. Reiners and others—Post-orogenic evolution of the Dabie Shan,

Fig. 3. A. Age-elevation plot for all data. Black circles: AHe; white triangles: AFT; grey squares: ZHe.Samples from the flanks of the range are shown as smaller size symbols. For the ZHe system, the range-flanksamples show an inverse correlation with elevation, as expected from the general observation of increasingages towards the lower-elevation range flanks. B. Age-elevation relationships (AER) for samples from thevertical transect (location in fig. 1).
499eastern China, (U-Th)/He and fission-track thermochronology

Tab
le2
Apa
tite
fissi
on-tr
ack
age
and
leng
thda
ta
500 Peter W. Reiners and others—Post-orogenic evolution of the Dabie Shan,
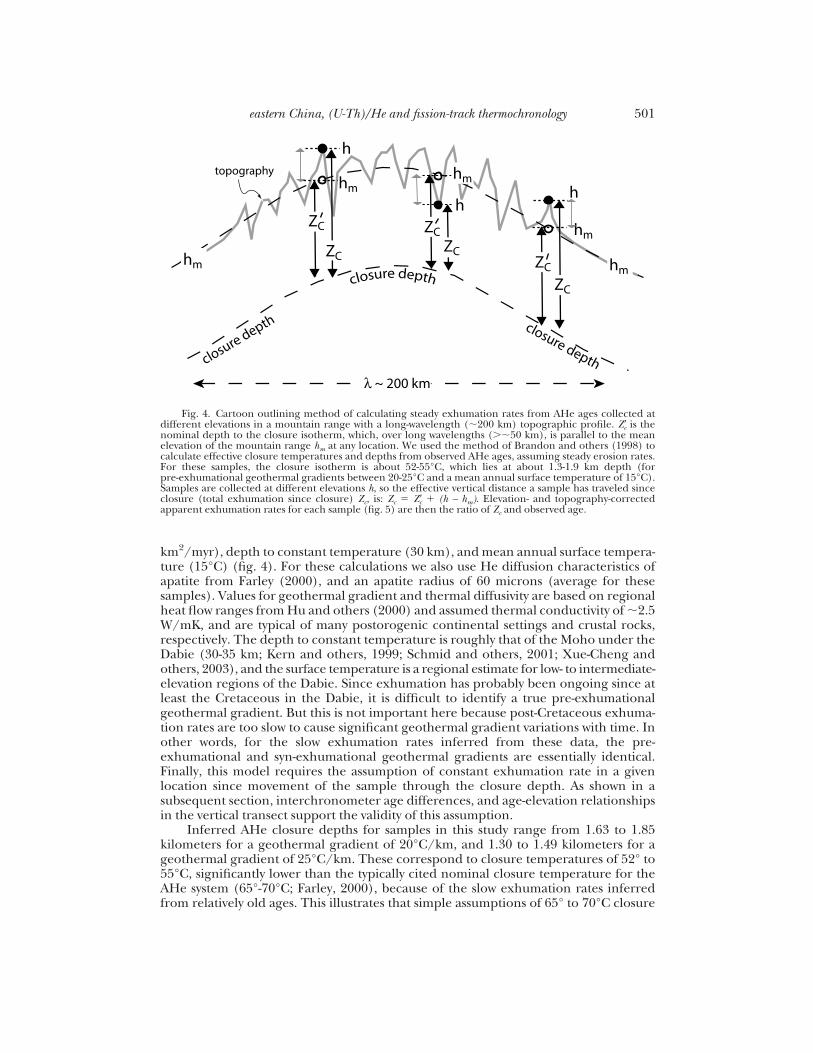
km2/myr), depth to constant temperature (30 km), and mean annual surface tempera-ture (15°C) (fig. 4). For these calculations we also use He diffusion characteristics ofapatite from Farley (2000), and an apatite radius of 60 microns (average for thesesamples). Values for geothermal gradient and thermal diffusivity are based on regionalheat flow ranges from Hu and others (2000) and assumed thermal conductivity of �2.5W/mK, and are typical of many postorogenic continental settings and crustal rocks,respectively. The depth to constant temperature is roughly that of the Moho under theDabie (30-35 km; Kern and others, 1999; Schmid and others, 2001; Xue-Cheng andothers, 2003), and the surface temperature is a regional estimate for low- to intermediate-elevation regions of the Dabie. Since exhumation has probably been ongoing since atleast the Cretaceous in the Dabie, it is difficult to identify a true pre-exhumationalgeothermal gradient. But this is not important here because post-Cretaceous exhuma-tion rates are too slow to cause significant geothermal gradient variations with time. Inother words, for the slow exhumation rates inferred from these data, the pre-exhumational and syn-exhumational geothermal gradients are essentially identical.Finally, this model requires the assumption of constant exhumation rate in a givenlocation since movement of the sample through the closure depth. As shown in asubsequent section, interchronometer age differences, and age-elevation relationshipsin the vertical transect support the validity of this assumption.
Inferred AHe closure depths for samples in this study range from 1.63 to 1.85kilometers for a geothermal gradient of 20°C/km, and 1.30 to 1.49 kilometers for ageothermal gradient of 25°C/km. These correspond to closure temperatures of 52° to55°C, significantly lower than the typically cited nominal closure temperature for theAHe system (65°-70°C; Farley, 2000), because of the slow exhumation rates inferredfrom relatively old ages. This illustrates that simple assumptions of 65° to 70°C closure
Fig. 4. Cartoon outlining method of calculating steady exhumation rates from AHe ages collected atdifferent elevations in a mountain range with a long-wavelength (�200 km) topographic profile. Zc is thenominal depth to the closure isotherm, which, over long wavelengths (��50 km), is parallel to the meanelevation of the mountain range hm at any location. We used the method of Brandon and others (1998) tocalculate effective closure temperatures and depths from observed AHe ages, assuming steady erosion rates.For these samples, the closure isotherm is about 52-55°C, which lies at about 1.3-1.9 km depth (forpre-exhumational geothermal gradients between 20-25°C and a mean annual surface temperature of 15°C).Samples are collected at different elevations h, so the effective vertical distance a sample has traveled sinceclosure (total exhumation since closure) Zc, is: Zc � Zc � (h – hm). Elevation- and topography-correctedapparent exhumation rates for each sample (fig. 5) are then the ratio of Zc and observed age.
501eastern China, (U-Th)/He and fission-track thermochronology
temperatures and �2 to 3 km closure depths for the AHe system can be 25 to 50percent (or more) too high for slowly-cooled settings, even for typical geothermalgradients and crystal sizes such as these.
Because samples were collected at different elevations relative to the meanelevation of the long-wavelength topography, an elevation correction must be added tothese inferred closure depths to derive total exhumation depths. Total exhumation foreach sample is thus closure depth plus the difference between the sample collectionelevation and the mean elevation (for a 10-km circle; see fig. 1C) of the samplecollection region (fig. 4). Model exhumation rates for each sample are then theelevation-corrected closure depth divided by age. This steady-state model used toconvert the AHe ages to exhumation rates does not correct for closure depth variationscaused by topography with wavelengths shorter than that used to calculate meantopography (10 km). As shown in a subsequent section, for slow cooling rates such asthese, two-dimensional topography with wavelengths less than 10 kilometers couldpotentially produce closure depth variations as high as 20 to 25 percent of thetopographic relief within a 10 kilometer circle. With the exception of the vertical-transect samples, local (�10-km) topography around each of the samples in this studyis less than �500 meters, so the maximum variation of closure depth due to �10kilometers wavelength topography would be about 125 meters, which is about 7 to 10percent of the inferred closure depth discussed in the previous paragraph. Thus thefact that our model calculation here ignores the influence of short-wavelengthtopography may introduce errors in the estimated exhumation rates of about 7 to 10percent. Moreover, this is a maximum error, because in general, real 3-D topographywill not deflect topography as strongly as predicted by model calculations using 2-Dtopography.
Model exhumation rates determined from AHe ages of each sample using thismethod are shown in figure 5 as a function of distance across the range from SW to NE.Assuming a geothermal gradient of 20°C/km, rates increase from 0.025 to 0.058km/myr from flanks to core, and assuming a gradient of 25°C/km, rates increase fromabout 0.020 to 0.047 km/myr. These data can be interpreted as a large (factor of 2-3)difference in long-term, Tertiary exhumation rates across the Dabie Shan, with thehighest exhumation rates in the center of the range.
An alternative explanation for higher model exhumation rates in the core of therange is a recent increase in exhumation rates in the core of the range relative to theflanks, rather than a long-term difference across the range. This amounts to a decreasein the long-wavelength topographic relief of the range, as envisioned in models ofBraun (2002a, 2002b). Several features of our data lead us to favor a model ofspatially-varying but temporally-constant exhumation rates instead of a model of recentexhumation change in the core (recent-relief-reduction). First, we show in a subse-quent section that the age-elevation relationship of the vertical transect in therange-core suggests a near-constant exhumation rate in this location since the Creta-ceous through at least the mid-Tertiary, at a rate that is consistent with rates deter-mined for other samples in the core of the range. Furthermore, extrapolation of thisAHe age-elevation relationship in the vertical transect yields a zero-age intercept at adepth of �1.2 kilometers below sea level. Adding the 0.7 kilometer mean elevation ofthe vertical transect to this yields the mean depth below the earth’s surface for thezero-age intercept for the AHe system: 1.9 kilometers. This depth is precisely theinferred depth of closure for a steady exhumation rate of 0.06 km/myr, geothermalgradient of 20°C/km, and AHe age of 32 Ma (the average at the mean elevation of thevertical transect), suggesting steady exhumation has prevailed to the present. Second,the relief-reduction model would imply that exhumation rates across the range wereconstant until sometime after �24 Ma, at which time the core of the range began
502 Peter W. Reiners and others—Post-orogenic evolution of the Dabie Shan,

Fig. 5. Apparent average exhumation rates from observed AHe ages, across the Dabie Shan for timeinterval since each AHe age (23-44 Ma) as a function of distance across the range in the same transect as infigure 2 (A.), or radial distance from the center of the range (B.). Apparent rates are shown for assumptionsof geothermal gradients of 20° and 25°C. The vertical transect samples are represented by a single age (31.7Ma) corresponding to the age of the regression through the vertical transect AHe data at the mean elevationof that location (0.8 km). This location is the highest apparent exhumation rate in the range (0.058 km/myrfor a geothermal gradient of 20°C/km, or 0.047 km/myr for a geothermal gradient of 25°C/km). Note thatthis is slower than the apparent exhumation rate from regression of the AER through the vertical transectitself (0.07 km/myr), although it is similar to the topography-corrected exhumation rate of 0.044-0.049km/myr (fig. 7; see text for discussion). There is an overall increase in apparent exhumation rates from theflanks to core of the range, over a factor of about two to three.
503eastern China, (U-Th)/He and fission-track thermochronology
exhuming several times faster than the flanks. This implies significantly highertopographic relief yet constant exhumation rates across the Dabie Shan prior to the�24 Ma, counter to expectations that a decaying mountain range would erode faster inthe high-elevation and high-relief regions. Finally, although not as clear as for AHe, theZHe system also shows a similar flanks-to-core age variation, and there is a suggestion ofsuch a trend for the AFT system as well. This spatial gradient in exhumation rates forthe ZHe system could not be produced by a recent decrease in relief, since differencesin ZHe ages are set much deeper than AHe (�6-8 km as opposed to �1.5-2.0 km), andwould require unreasonable extents and rates of recent exhumation, especially ifrestricted to more recently than 24 Ma. Thus we contend that the cross-range agegradient in ZHe may also be due to a long-term exhumation rate gradient, though wecannot apply a rigorous quantitative steady exhumation rate model to the ZHe agesbecause of the evidence for rapidly changing cooling rates at 90 to 120 Ma.
At least one testable prediction of our model for a long-term exhumation rategradient across the Dabie Shan is that vertical transects on the flanks of the rangeshould show not only older AHe ages, but also lower slopes of age-elevation relation-ships. It would be more difficult to collect long vertical transects in range-flank regions,because of their generally low relief, but shorter transects may be possible.
In summary, the spatial variation in AHe ages across the Dabie Shan reflectsvariation in long-term exhumation rates across the range, with the range-core erodingat a rate 2 to 3 times faster than the range-flanks, throughout the Tertiary, and possiblysince the Cretaceous. Although it may be expected that the cores of post-orogenicmountain ranges would be eroding faster than the flanks, if topography is indeeddecaying, we know of few if any observations such as these that have actually quantifiedthe phenomenon.
Age-Elevation Relationships and Exhumation RatesWhereas spatial variations in exhumation rates reflect different cooling ages
across the range, temporal variations in exhumation rate are recorded in the age-elevation relationship (AER) of the vertical transect in the core of the range. To a firstorder, slopes of the AER for each thermochronometer record the vertical velocity ofsamples relative to the relevant closure isotherm. Deriving robust estimates of exhuma-tion rates through time from these AERs, however, requires an assessment of thedegree to which closure isotherm depths were spatially or temporally variable duringexhumation, primarily because of potential complications from advective or topo-graphic effects.
Outside of magmatic effects (no magmatic rocks younger than �125 Ma areknown from the Dabie Shan), the most commonly cited potential cause of temporalvariations in geothermal gradients is high and transient exhumation rates. Thermaltransients can be safely ignored however, if they arise from transients in exhumationrates that are less than about 0.1 mm/yr (Peclet number �0.2). With the exception ofthe near-vertical upper part of the ZHe AER, the highest exhumation rate from theDabie Shan AERs is several times lower than this, suggesting dominantly conductivecontrol on heat transfer in the shallow crust since about 110 Ma.
A more important issue with the interpretation of AER slopes is topographicbending of near surface isotherms (Stuwe and others, 1994; Mancktelow and Grase-mann, 1997; House and others, 1998, 2001; Stuwe and Hintermuller, 2000; Ehlers andothers, 2001; Braun, 2002a, 2002b; Ehlers and Farley, 2003). Thermal gradients attemperatures below about 100°C in the upper crust can be significantly increasedunder valleys and depressed under ridges. This can lead to overestimation of exhuma-tion rates from AERs because of the depth difference between thermochronometricclosure of samples emerging at different elevations. Potential overestimation ofexhumation rates from “vertical” transects is most significant for those thermochronom-
504 Peter W. Reiners and others—Post-orogenic evolution of the Dabie Shan,
eters with the lowest closure temperature, and for long wavelength topography (forexample, Stuwe and others, 1994).
The effect of topographic bending of isotherms in the upper crust is widelyrecognized (for example, Turcotte and Schubert, 1982), and has been used to provideminimum ages of topography and the evolution of paleorelief (House and others,1998, 2001; Braun, 2002a, 2002b). More commonly, topographic effects are consid-ered because of their complicating effects on interpretations of exhumation rates fromlow-temperature thermochronometric data. Two- and three-dimensional thermal mod-els have also been devised to quantify such topographic influences (Stuwe and others,1994; Mancktelow and Grasemann, 1997; Stuwe and Hintermuller, 2000; Ehlers andothers, 2001; House and others, 1998, 2001; Braun, 2002a, 2002b; Ehlers and Farley,2003).
Here we address a common problem related to topographic effects on age-elevation data in vertical transects, without involving sophisticated thermal models.There are essentially two questions: 1) if a vertical transect is collected over a giventopographic profile with a characteristic wavelength, how much are closure isothermsbent by this topography, and 2) how much does this bending affect the apparent rateof exhumation from the AER? Stuwe and others (1994) addressed these questions for avariety of specific cases, including the effects of erosional exhumation, with anemphasis on the AFT system. We take a simplified approach, using a 2-D model ofsteady-state temperature distribution in the shallow crust underlying periodic topogra-phy of various wavelengths, following the methods of Turcotte and Schubert (1982,2002, eqs 4-66) and Mancktelow and Grasemann (1997, eqs 25 and 26). Our modeldoes not include the effects of erosional exhumation on crustal thermal structurebecause the very low Peclet numbers (�0.05-0.10) for these low exhumation rateswould not significantly perturb isotherms from the static case.
We calculated the depth of 50° to 100°C isotherms beneath periodic topographichighs and lows (ridges and valleys), and then calculated the ratio of relief on theseisotherms to relief of the topography, called the admittance ratio, (Braun, 2002a).Braun introduced the admittance ratio in the context of a spectral analysis method forinverting low-T thermochronometric ages for changes in paleorelief (2002a); here wefollow his notation but instead focus on the use of for correcting topographic effectson age-elevation relationships. For an isotherm of a given temperature, is a functionof topographic wavelength, and is essentially zero at short wavelengths. Figure 6Bshows this for the 50° to 100°C isotherms: at short wavelengths (�� 5 km for50-100°C), isotherms for temperatures above �50°C are essentially flat and unper-turbed by topography ( � 0). At long wavelengths, they are strongly bent bytopography and follow it closely ( �0.5-0.8). In this example, reaches a maximumvalue of �0.8, regardless of temperature or wavelength, because of surface tempera-ture differences in valley and ridge locations (atmospheric lapse rate � �; if � � 0, 31 at high wavelengths).
Examining the bending of isotherms by topography in this way has the advantagethat the is only slightly dependent on topographic amplitude (relief). At the relief inthe region near the vertical transect in the Dabie Shan (�0.7 km, or one-half thedistance from valley bottom to ridge top), topographic relief has a negligible effect on at any wavelength. Thus figure 6B provides a convenient measure of how much anisotherm of interest (that is, a closure isotherm) is bent under topography of a specificwavelength of interest, regardless of topographic relief. For the present problem ofevaluating the effect of topography on the AER of the AHe system in our verticaltransect then, we need estimates for the temperature of the closure isotherm, as well asthe wavelength of topography.
505eastern China, (U-Th)/He and fission-track thermochronology

Fig. 6. A. Schematic illustration of the topographic influence on isotherms under a “vertical” transectused for constraining exhumation rates from thermochronometric ages. Samples are collected over �/2,and relief of 2h0. Note that we specify 2h0 as the full topographic relief (rather than h0, as some papers use);thus h0 is amplitude of topographic relief, in agreement with typical use of the term in the context of a sine orcosine wave. Measured from a reference (mean) elevation (y � 0), the depth to the closure isotherm isgreater under valleys (Zv) than under ridges (Zr). This difference decreases with depth and highertemperature isotherms, or, for a given temperature isotherm, with decreasing �. For the vertical transect ofsamples in the core of the Dabie Shan, � � 12 km and h0 � 0.70 km (see text for discussion). B. Theadmittance ratio , as a function of topographic wavelength. is the ratio of relief on an isotherm to relief on
506 Peter W. Reiners and others—Post-orogenic evolution of the Dabie Shan,

As shown above, assuming geothermal gradients of about 20° to 25°C and steadycooling, Tertiary exhumation rates for the range-core of the Dabie Shan are in therange of 0.05 to 0.07 km/myr. For the crystal sizes of these samples, this means thatclosure temperatures, and therefore closure isotherms of interest, are in the range of�50° to 55°C. We approximate the topographic wavelength and amplitude for thevertical transect as those along the sampling transect, which is oriented approximatelyorthogonal to topographic grain. Although the real topography in the vicinity of thevertical transect is far from periodic infinite valleys and ridges, the transect wascollected over a distance of about 6 kilometers, from the lowest point in a valley to thehighest point at the top of a roughly symmetric peak with a general elongation to thenortheast and southwest (fig. 1). Because the samples capture the entire range ofelevation in this topography, we assume that the appropriate topographic wavelengthfor this problem is 12 kilometers (2 times the horizontal distance between lowest andhighest samples).
Figure 6B shows that for a topographic wavelength of 12 kilometers, 50° to 55°Cisotherms will be deflected beneath a 2-D valley and ridge by about 30 to 37 percent ofthe topographic relief (that is, � 0.30-0.37). It should be noted that this estimate isbased on a 2-D representation of topography, whereas real 3-D topography may beimportant to consider, especially in the absence of long parallel ridges (Stuwe andothers, 1994; Stuwe and Hintermuller, 2000). In our case, assuming 2-D topographyprobably leads to overestimation of , since the topography of the vertical transect isnot an infinite ridge and is in fact more like a single peak, which has less isothermbending “power.” Thus this analysis provides a useful estimate of the likely maximum, or maximum deflection of the closure isotherm under the topography of the verticaltransect.
The next question we address is how much this admittance ratio () affects theapparent exhumation rate inferred from the AER of a vertical transect collected overthis topography. Stuwe and others (1994) noted that the apparent exhumation ratefrom a vertical transect, can be simply related to the “model” exhumation rate(assuming steady-state and other conditions are also satisfied) by the relative ampli-tudes of topography and isotherms. Their analysis used a slightly different conventionhowever, in which isotherm depth at any point was measured from the lowest point inthe topography. If isotherm depth is instead measured from a reference height of localmean elevation, as in the Turcotte and Schubert (1982, 2002) and Mancktelow andGrasemann (1997) models, then “model” exhumation rate Ur, is equal to apparentexhumation rate Ua, multiplied by (1-) (Braun, 2002a). This is the same result as thatof Stuwe and others (1994), but the convenient correction factor for exhumation ratesfrom vertical transects is more easily obtained by this approach, because is largelyindependent of topographic relief. In our case, for � 0.30-0.37, and � � 12 km, wefind that model exhumation rate as measured by AHe ages for the vertical transect in
its overlying topography, � (Zv – Zr)/2h0. For isotherms of about 50-70°C, topographic wavelengths greaterthan about 5 km produce significant relief on isotherms at depth and thus significantly influence apparentexhumation rates from AER of “vertical” transects. does not exceed �0.8 for any topographic wavelengthin this example because of the effect of atmospheric lapse rate (4.5 K/km) on surface temperaturedifferences beneath valleys and ridges (mean annual surface temperature is assumed to be 15°C in thisexample). Parameters used for these calculations are: surface radiogenic heat production: 1 �W m-3;reduced heat flow: 45 mW m-1; characteristic depth of heat production: 10 km; thermal conductivity: 2.4 WK-1m-1. C. The function (1-), as a function of isotherm temperature. (1-) is the factor applied to apparentexhumation rates Ua, to derive “real” exhumation rates Ur, from vertical transects to correct for topographiceffects on isotherm depths (also see Braun, 2002a). This is the same as Stuwe and others’s (1994) Ur �Ua( z/h), but (1-) is largely independent of topographic relief. For the case of � � 12 km, and closureisotherm � 52-55°C, (1-) is �0.63-0.70. So the exhumation rate derived from the vertical transect in thecore of the Dabie Shan is �0.67 x (0.070 km/myr), or � 0.047 km/myr.
507eastern China, (U-Th)/He and fission-track thermochronology
the core of the Dabie Shan is 0.63 to 0.70 times the apparent exhumation rate (fig. 6C).Thus the apparent exhumation rate since the mid-Eocene of 0.070 km/myr becomes amodel exhumation rate of about 0.044 to 0.049 km/myr. This shows that apparentexhumation rates calculated from AHe vertical transects collected over distances asshort as 6 kilometers could potentially require corrections as large as 30 to 40 percent.
We emphasize that the estimated here is likely to be a maximum, because of 3-Dtopographic effects, so the model exhumation rate indicated by the AHe AER can bethought of as bracketed by a minimum of 0.05 km/myr (for maximum ) andmaximum of 0.07 km/myr ( � 0). Even with this maximum topographic correctionhowever, the model exhumation rate from the vertical transect in the range-core isabout 2 to 2.5 times faster than the exhumation rates estimated for the flanks of therange from steady-rate models discussed above. Finally, although it is well known thathigh exhumation rates can increase the topographic effect on AERs (for example,Stuwe and others, 1994; Mancktelow and Grasemann, 1997) as isotherms are “pushed”higher into the topography, this exercise shows that extremely slow exhumation ratescan also enhance topographic effects on AERs, for a different reason. In such cases,slow cooling rates significantly decrease closure temperatures of minerals of interest,meaning effective closure isotherms are closer to the surface and more stronglyaffected by topography.
As suggested in figure 6, for a given topographic wavelength, apparent exhuma-tion rates from AFT data in vertical transects are not as strongly affected by topographyas rates from AHe data. For our case of 12 kilometers wavelength, the maximum for aclosure isotherm of about 100°C is less than about 0.1, so the apparent exhumationrate from AFT data in the vertical transect would be within 10 percent of that of themodel exhumation rate, or �0.042 to 0.047 km/myr since 44 to 70 Ma.
The topographic bending effect of 12 kilometers wavelength topography on thedepth of the �180°C isotherm is less than 5 percent (fig. 6C), so apparent exhumationrates from the ZHe data are not significantly affected by topography of the transect.However, as discussed above, the extremely rapid cooling before �110 Ma implied bythe essentially vertical AER for ZHe in the upper part of the vertical transect is difficultto relate directly to exhumation rates. Although this part of the transect could beinterpreted as exhumation rates of at least 0.5 km/myr, it is quite possible that ratesthat fast, as well as previous events in the well-documented high-temperature Creta-ceous orogeny, led to highly transient thermal effects, such as thermal relaxationfollowing rapid exhumation, that prohibit accurate exhumation rate inferences.Subsequent to this rapid Cretaceous cooling (and perhaps rapid exhumation) how-ever, cooling rates decreased, as the lower part of the ZHe AER and the AFT AER implyexhumation rates of only 0.015 and 0.048 km/myr, respectively.
Reconstructed Multi-Chronometer AERTo better constrain the timing and magnitude of exhumation rate changes in the
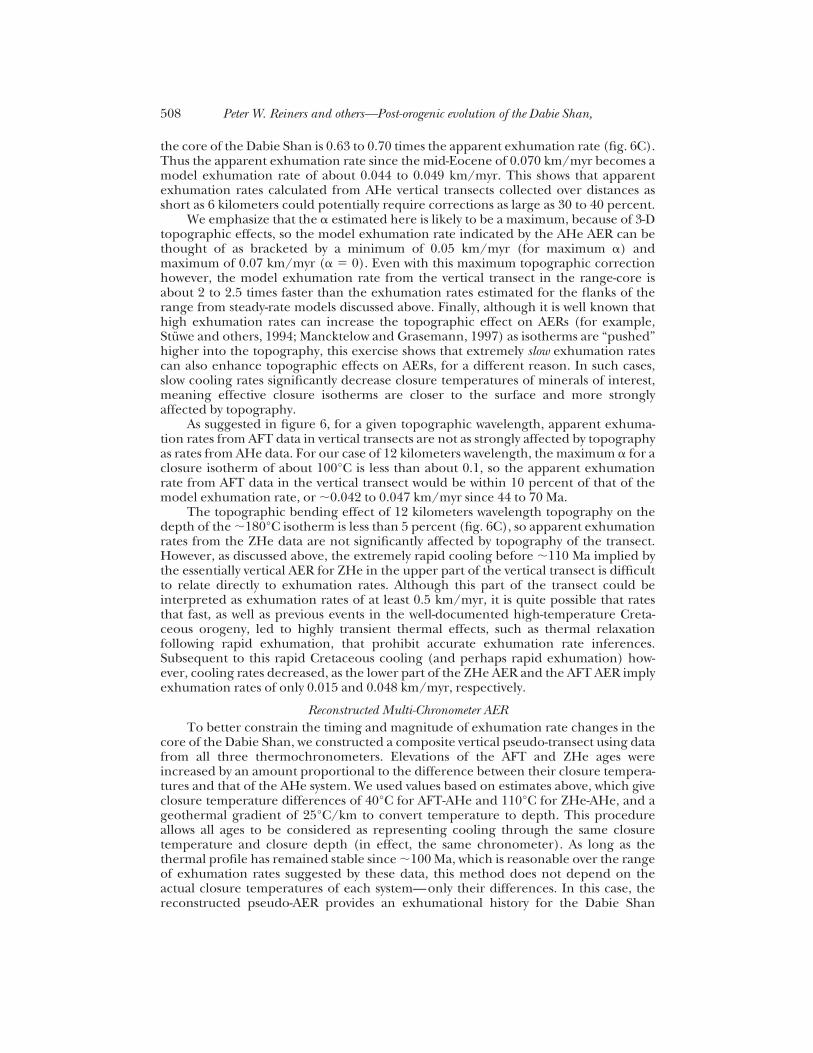
core of the Dabie Shan, we constructed a composite vertical pseudo-transect using datafrom all three thermochronometers. Elevations of the AFT and ZHe ages wereincreased by an amount proportional to the difference between their closure tempera-tures and that of the AHe system. We used values based on estimates above, which giveclosure temperature differences of 40°C for AFT-AHe and 110°C for ZHe-AHe, and ageothermal gradient of 25°C/km to convert temperature to depth. This procedureallows all ages to be considered as representing cooling through the same closuretemperature and closure depth (in effect, the same chronometer). As long as thethermal profile has remained stable since �100 Ma, which is reasonable over the rangeof exhumation rates suggested by these data, this method does not depend on theactual closure temperatures of each system—only their differences. In this case, thereconstructed pseudo-AER provides an exhumational history for the Dabie Shan
508 Peter W. Reiners and others—Post-orogenic evolution of the Dabie Shan,
analogous to that of �5 to 6 kilometers vertical transect for a single chronometer(fig. 7).
The vertical pseudo-AER (fig. 7) shows a pattern similar to that in many exhumedcrustal sections (for example, Fitzgerald and others, 1995). Ages at the top of thesection are nearly invariant with elevation, suggesting a pulse of rapid exhumationsometime before �100 Ma, preserved in the structurally highest, or in this case,highest-temperature, samples of the range-core. At lower elevations, ages decreasestrongly with decreasing elevation, suggesting lower exhumation rates after �100 Ma.It is difficult to discern changes in slope in younger-aged samples in this plot, althoughit could be qualitatively suggested from figure 7 that there is a higher slope in themultichronometer trend (and therefore possibly an increased exhumation rate)between about 60 to 80 Ma, followed by slower rates through 25 to 30 Ma. Morequantitative estimates of exhumation rate changes in this time require modelingapproaches discussed below.
Model Long-Term Cooling and Exhumation HistoriesModel cooling and exhumation rates through time in the Dabie Shan can be
constrained more quantitatively by forward modeling (U-Th)/He and fission-track ageevolution, for samples in the vertical transect, for time-temperature paths resultingfrom various exhumation histories. This can be done by essentially guessing an initialthermal history, and therefore exhumational history (assuming constant geothermal
Fig. 7. Composite vertical pseudo-transect constructed from ages of all three chronometers, withelevations corrected in proportion to closure temperature difference with AHe. A geothermal gradient of25°C/km was assumed. Closure temperature differences were assumed to be 40°C for AHe-AFT and 110°Cfor AHe-ZHe. Samples from the range flanks are shown as small symbols. The overall pattern of thecomposite pseudo-transect suggests a period of rapid cooling at about 110 Ma, followed by slower andrelatively constant rates until at least 24 Ma, with possible minor changes. Symbols as in figure 2. Error barson (U-Th)/He ages are 2�, those on AFT ages are 1�.
509eastern China, (U-Th)/He and fission-track thermochronology
gradients of 20-30°C), that yields a predicted age close to the observed age for theshallowest sample. This then predicts fixed cooling and exhumational histories for allother samples in the transect, as we assume that relative sample depths were constantand equivalent to modern elevation differences through time. Thermal/exhumationalhistories are then adjusted to produce a “best-fit” thermal history with good correspon-dence between observed and predicted ages for all systems at all elevations.
Regardless of regional exhumation rate, samples in the vertical transect cooled atdifferent rates during exhumation through the upper 1 to 3 kilometers because oftopographic bending of isotherms. Thus in order to avoid spurious effects in themodel age trends for the lowest temperature systems (AHe and AFT), and to accountfor topographic effects in the final stage of cooling, the low-elevation samples mustcool faster, and high-elevation samples slower. This effect is lessened to some degree bythe atmospheric temperature lapse rate, which causes cooler present-day temperaturesat higher elevation samples. We have combined these effects to account for bothcooling through topography, and lapse rate, by assuming a final temperature of 15°C,less lapse rate (6 K/km) times elevation.
For the thermal and exhumational history of each sample we modeled AFT agesusing a fission-track production-annealing model (AFTSolv; Ketcham and others,2000) incorporating kinetic annealing parameters, and AHe and ZHe ages using a Heproduction-diffusion model (after Wolf and others, 1998). As no model currentlysolves the inverse problem for combined He and fission-track ages (and track-lengths,for the latter), we tested several dozen candidate thermal histories using both codes toproduce a “best-fit” thermal/exhumational history.
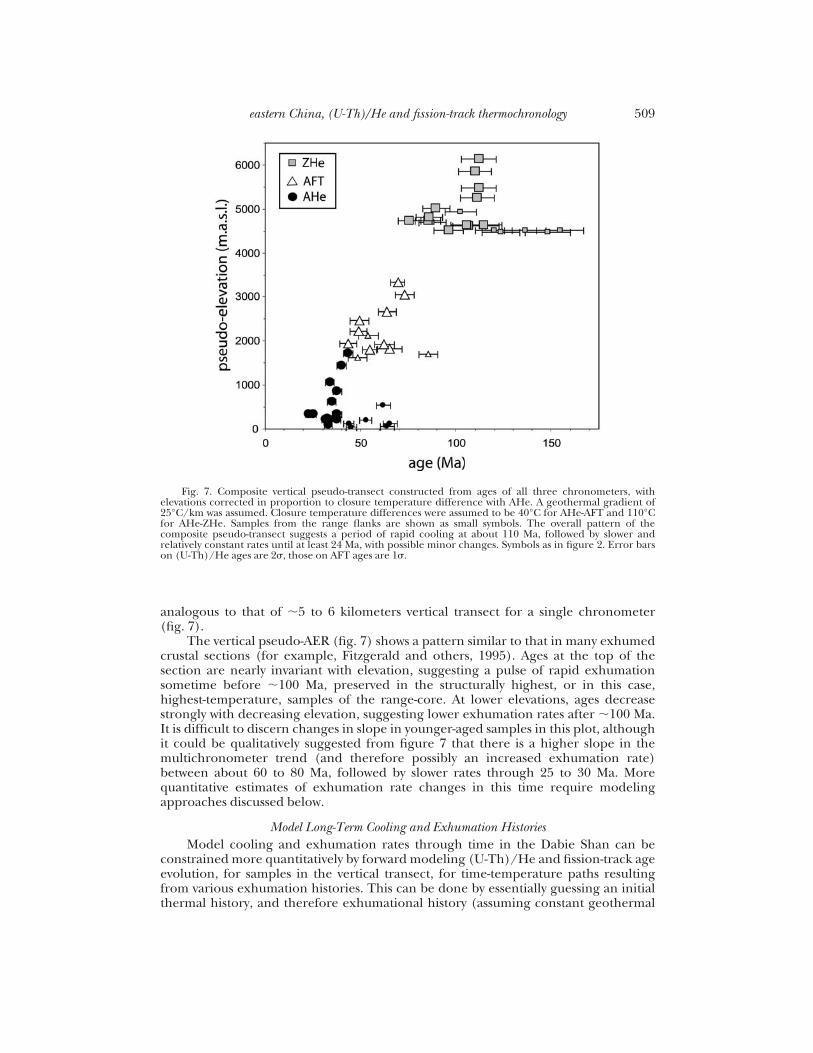
Figure 8 shows best-fit thermal histories and predicted ages for three cooling-history models, all involving cooling of a 1.4 kilometer vertical section of crustanalogous to that of the vertical transect in the core of the range. All models share acommon feature of relatively rapid cooling prior to 115 Ma, modeled here as 8° to13°C/myr, or an exhumation rate of about 0.3 to 0.5 km/myr, although this model isnot sensitive to this rate, and values several times higher could also satisfy the data. Theages and AERs of the AFT and AHe samples, as well as those of the lower elevation ZHesamples, are more sensitive to cooling rates subsequent to 115 Ma.
The first model (first row of fig. 8) shows that overall distribution of ages and AERsfor all samples can be reproduced quite well by assuming constant exhumation rates(0.06 � 0.01 km/myr) since 115 Ma. The only predicted ages falling more than 2�outside of measured ages for this model are in the ZHe system (fig. 8C). The constantrate model fails to predict the strong curvature in the lower-elevation part of the ZHeAER. If model exhumation rates are strongly decreased after 115 Ma (that is, followingthe Cretaceous orogenic event) to until �60 to 80 Ma, the curvature of the ZHe AERcan be matched more precisely, as shown in the second and third rows of figure 8.Matching the inflection in the low elevation part of the ZHe AER requires holdingexhumation close to zero until �60 Ma (second row of fig. 8), when it increases to 0.12to 0.19 km/myr until 40 Ma, and then decreases again until the present, at rates of0.06 � 0.01 km/myr as in the first model. This model provides a good fit for all dataexcept for some of the higher elevation AFT ages, which are underpredicted by 12 to22 myr. The fit to these AFT ages can be improved by invoking very slow exhumationrates from 80 to 60 Ma (0.01-0.02 km/myr), and a higher rate (0.06-0.09 km/myr)between 80 to 40 Ma, before returning to rates of 0.06 � 0.01 km/myr since 40 Ma.
The most important general result of these forward models is that although smallchanges in exhumation rates after about 115 Ma can reproduce some minor featuresof the AERs from the core of the Dabie, models that invoke changing exhumation ratesdo not significantly improve the overall fit of predicted to observed ages relative to aconstant rate model. Aside from evidence in the lower ZHe AER for relatively slow
510 Peter W. Reiners and others—Post-orogenic evolution of the Dabie Shan,
Fig. 8. Model thermal histories, exhumation rates, and predicted versus observed (U-Th)/He andfission-track ages for samples from the range-core vertical transect. Each row of plots represents thermalhistories, exhumation rates, and predicted ages for a different exhumation model (see below, and text fordiscussion). A. Model thermal histories (solid lines and left y-axis) for samples of the range-core verticaltransect, and corresponding exhumation rates (dashed line and right y-axis). Three different exhumationrates are shown in each model thermal history, corresponding to geothermal gradients of 20°, 25°, and30°C/km (the highest rate at any time corresponds to the lowest geothermal gradient). Exhumation ratesare calculated based on the thermal history of the sample with a present elevation of 860 meters above sealevel (close to mean elevation of the vertical transect and topography in this location), so that the late-stageexhumation rates are not significantly affected by topographic and lapse rate effects on the post-40-Ma partof the thermal history. These thermal histories were chosen to predict cooling ages of all three systems shownin B and C, using a He diffusion-production model (after Wolf and others, 1998) and AFTSolv (Ketcham andothers, 2000). Thermal histories prior to 115 Ma (the age of rapid cooling recorded by ZHe in the verticaltransect) are poorly known, and could be significantly faster than shown here without affecting the predictedZHe, AFT, and AHe ages shown in this model. This region of the plots in part A are shaded grey. B. Predictedages (x’s joined by black lines) and observed ages (other symbols) for samples from the vertical transect, forthermal histories shown in A. Fission-track production-annealing models use Dpar kinetic parametersmeasured on each sample (which are different for each sample, thus non-constant slopes for AFT AERs),and He production-diffusion models use He diffusion parameters from Farley (2000), apatite radius of 60�m (average for these samples), and incorporate the effects of alpha ejection. C. Composite verticalpseudo-transect showing predicted versus observed ages of all chronometers (see text and fig. 6 caption fordetails of pseudo-transect construction). Error bars on (U-Th)/He ages are 2�, those on AFT ages are 1�.The first row of model results represents a thermal history of a constant cooling and exhumation rate(0.06 � 0.01 km/myr) since 115 Ma. The second row represents constant temperature and no exhumationfrom 115-60 Ma, followed by relatively rapid cooling and exhumation (0.10-0.20 km/myr) from 60-40 Ma,and slow cooling and exhumation (0.06 � 0.01 km/myr) until present. The third row is similar to the secondmodel, except that 115 to 60 Ma cooling and exhumation rates are low (0.01-0.02 km/myr) but not zero, and60 to 40 Ma rates are lower (0.06-0.09 km/myr). The first model (constant rates) is designed to illustrate theplausibility of a constant exhumation rate in reproducing the He and FT ages of the core of the Dabie Shan.The second model seeks primarily to match the inflection at low elevation in the ZHe AER by holdingtemperatures constant in the ZHe partial retention zone until 60 Ma, but this model underpredicts some ofthe high-elevation AFT ages. The third model seeks to improve the fit to the high-elevation AFT ages byallowing earlier cooling, but in doing so does not reproduce the youngest ZHe age at low elevation.
511eastern China, (U-Th)/He and fission-track thermochronology

cooling immediately following high cooling rates of the mid-Cretaceous, there is littlecompelling evidence for exhumation rate changes after 115 Ma except perhapsmodestly increased rates between 80 to 40 or 60 to 40 Ma (fig. 8A, two lower models).However, even in these models, exhumation rates of 0.06 � 0.01 km/myr since �40Ma provide the best-fit to the AHe and AFT data (fig. 8).
The possible increased exhumation rates in the late Cretaceous through earlyTertiary suggested by two of the models are consistent with a Dabie source for much ofthe 4.8 kilometers of sediment filling early Tertiary basins around the Dabie, as well asevidence for Tertiary faulting in the area (Peltzer and others, 1985; Ratschbacher andothers, 2000). One potential cause for increased exhumation rates beginning �50 Mais far-field deformation from the Indo-Asian collision, �1500 to 2000 kilometers to thewest-southwest, as suggested by Grimmer and others (2002). However, at least oneother study has noted that not all Late Cretaceous-Early Tertiary tectonic activity insoutheast Asia is necessarily attributable to the Indo-Asian collision, but may instead berelated to changes in Pacific-Eurasian plate motions at this time (Northrup and others,1995). In any case, even if late Cretaceous through early Tertiary exhumation rateswere higher than following the mid-Cretaceous event (which is not clearly required;fig. 8), they were quite modest in magnitude compared with those in the mid-Cretaceous (� 0.15 km/myr, compared with �0.5 km/myr).
More notable is the lack of evidence for an increase in exhumation ratesbeginning after 60 Ma. All three of the best-fit models in figure 8 involve either nochange in exhumation rates, or a decrease in exhumation rates at 40 Ma. This contrastswith the interpretations of Grimmer and others (2002), who suggested an increase incooling rates at 45 � 10 Ma in the Dabie, based on several 40 to 55 Ma AFT ages.Although we observe a clustering of early to mid-Tertiary AHe ages in the core of theDabie, by itself this does not constitute evidence for a discrete cooling or exhumationevent at this time. In fact, relative AHe, AFT, and ZHe ages in the same samples, as wellas AERs in the vertical transect of the core of the range, indicate relatively steadycooling and exhumation rates (�1.6 °C/myr, or 0.06 � 0.01 km/myr) in the core ofthe Dabie since the Cretaceous.
The Eocene AFT ages of Grimmer and others (2002) were found within �10 to 35kilometers of the Tan-Lu fault, on the eastern border of the Dabie Shan, leading themto suggest Cenozoic reactivation of the Tan-Lu fault as a cause for some unspecifiedamount of tectonic exhumation. Among our samples, the one closest to the Tan-Lufault (�20 km away; DB26) has the oldest AHe age among the range-core samples(36.7 Ma), aside from high-elevation samples of the vertical transect. Another nearbysample, 30 kilometers from the fault, also has an old AHe age, of 61.8 Ma. However,our sample locations are not well suited to addressing the question of younger agestowards the Tan-Lu fault, so we cannot rule out Tertiary tectonic exhumation at theeastern margin with any certainty.
Finally, the exhumational history of rocks in the core of the Dabie Shan can alsobe extended to the initial Triassic-Jurassic UHP metamorphism (fig. 9). Moderatelywell-constrained depth-time data can be derived from 1) 120 to 140 kilometerestimates of UHP metamorphism and U/Pb and Ar/Ar ages on high-temperatureassemblages (Hacker and others, 2000), 2) Al-in-hornblende barometry (Ratschbacherand others, 2000) and zircon U/Pb ages (Hacker and others, 1998) on samples of theCretaceous granites and orthogneisses, 3) assumptions of closure depths correspond-ing to cooling through inferred closure temperatures of 200°C for K-spar 40Ar/39Ar at90 to 120 Ma (Ratschbacher and others, 2000), and 4) cooling ages and closure depthsof the (U-Th)/He and fission-track systems (this study). Figure 9 shows that althoughexhumation rates in the Late Triassic and Jurassic were at least �1 km/myr, rates overthe last �100 myr have been at least 10 to 20 times slower, and no more than about 5 to
512 Peter W. Reiners and others—Post-orogenic evolution of the Dabie Shan,
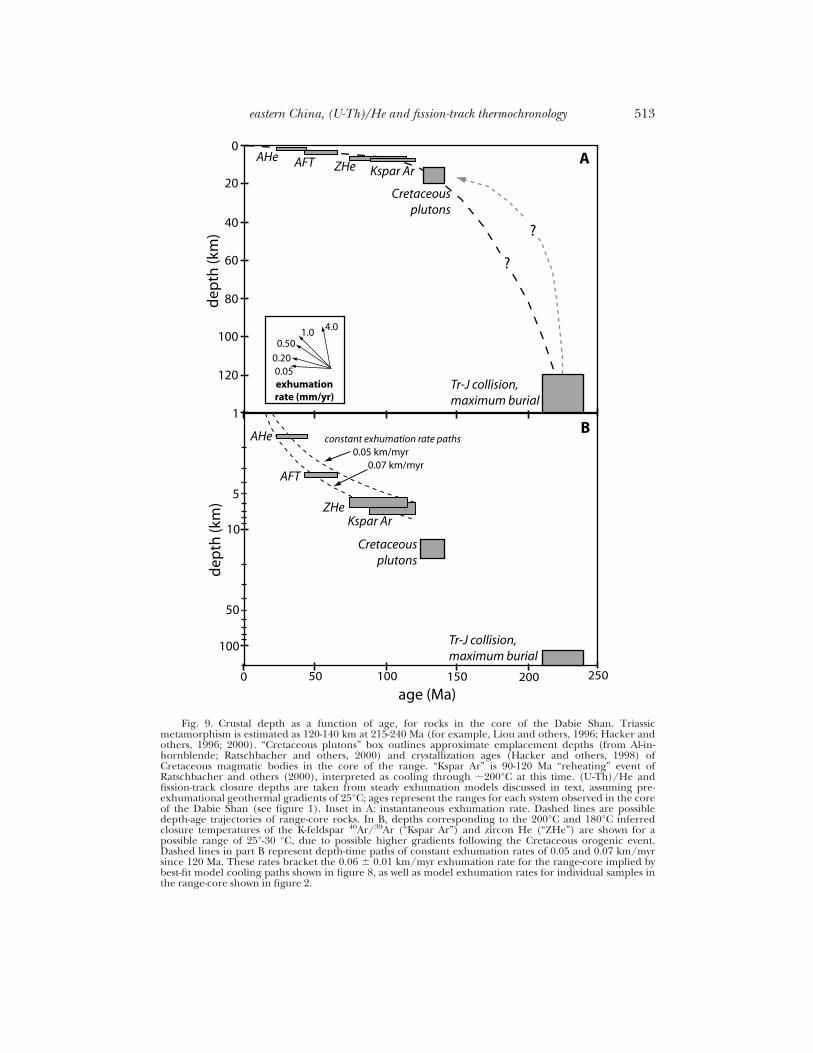
Fig. 9. Crustal depth as a function of age, for rocks in the core of the Dabie Shan. Triassicmetamorphism is estimated as 120-140 km at 215-240 Ma (for example, Liou and others, 1996; Hacker andothers, 1996; 2000). “Cretaceous plutons” box outlines approximate emplacement depths (from Al-in-hornblende; Ratschbacher and others, 2000) and crystallization ages (Hacker and others, 1998) ofCretaceous magmatic bodies in the core of the range. “Kspar Ar” is 90-120 Ma “reheating” event ofRatschbacher and others (2000), interpreted as cooling through �200°C at this time. (U-Th)/He andfission-track closure depths are taken from steady exhumation models discussed in text, assuming pre-exhumational geothermal gradients of 25°C; ages represent the ranges for each system observed in the coreof the Dabie Shan (see figure 1). Inset in A: instantaneous exhumation rate. Dashed lines are possibledepth-age trajectories of range-core rocks. In B, depths corresponding to the 200°C and 180°C inferredclosure temperatures of the K-feldspar 40Ar/39Ar (“Kspar Ar”) and zircon He (“ZHe”) are shown for apossible range of 25°-30 °C, due to possible higher gradients following the Cretaceous orogenic event.Dashed lines in part B represent depth-time paths of constant exhumation rates of 0.05 and 0.07 km/myrsince 120 Ma. These rates bracket the 0.06 � 0.01 km/myr exhumation rate for the range-core implied bybest-fit model cooling paths shown in figure 8, as well as model exhumation rates for individual samples inthe range-core shown in figure 2.
513eastern China, (U-Th)/He and fission-track thermochronology
8 kilometers of exhumation has occurred in the core of the Dabie Shan in the last 100myr. Figure 9B also reinforces the interpretation that a constant exhumation rate of0.06 � 0.01 km/myr can explain the apparent depth-time relationships of data withclosure temperatures lower than about 200°C, or since �100 Ma.
conclusionApatite and zircon (U-Th)/He ages from the Dabie Shan show cross-range age
distributions consistent with a gradient in erosional exhumation rates between therange-flanks and range-core over the last �100 Ma. Apatite He ages indicate averageexhumation rates since the middle Tertiary were as low as 0.02 km/myr on the rangeflanks, to as high as 0.06 km/myr in the range core. We also used an admittance ratiomodel to correct the age-elevation relationship of apatite He ages in a vertical transectin the core of the range and derive model exhumation rates. These results indicate anexhumation rate as low as 0.05 km/myr and as high as 0.07 km/myr in the range coresince the mid-Tertiary. Thermal modeling of the apatite He and zircon He ages andapatite fission-track ages in the range-core vertical transect also suggest a long-termexhumation rate of 0.06 � 0.01 km/myr, that may have been constant since as early asthe mid-Cretaceous. Some details of the ZHe and AFT data suggest modestly increasedexhumation rates in the Late Cretaceous through early Tertiary, but none of these datasupport an increase in exhumation rates later than about 60 Ma. Most of the ages in theDabie Shan represent steady-rate exhumation ages, not exhumation rate changes dueto discrete tectonic or erosional events. Finally, this study represents the first large-scaleapplication of zircon (U-Th)/He thermochronometry to regional exhumation prob-lems, and supports the efficacy of the technique for providing constraints on timingand rates of crustal exhumation through depths corresponding to temperaturesgreater than those of apatite fission-track, but less than those of K-feldspar Ar dating.
acknowledgmentsWe thank Ethan Baxter, Brad Hacker, Danny Stockli, and Kelin Whipple for
constructive reviews, Jim Spotila for helpful comments, and Jean Braun and LotharRatschbacher for enlightening discussions about topographic effects and regionalgeology, respectively. Acknowledgment is made to the U.S. NSF for grant EAR-9909996, to NFS-China for grant 40272093, to MOST-China for grant G2000078501,and to the Donors of The Petroleum Research Fund, administered by the AmericanChemical Society, for partial support of this research.
Appendix A
analytical procedures
(U-Th)/He ChronometryApatite and zircon (U-Th)/He ages were performed at Yale and Washington State Universities by both
furnace and laser (both CO2 and Nd-YAG) heating for He extraction, and both quadrupole and sectorICP-MS for U-Th determinations. All samples in the vertical transect (samples DB40-45 in table 1) were datedby single-grain, Nd-YAG laser heating and sector ICP-MS methods at Yale; procedures for other samples weresimilar.
Dated crystals were hand-picked from separates (see fission-track procedures) with high power (160x)stereo-zoom microscopes with cross-polarization for screening inclusions. Selected crystals were measuredand digitally photographed in at least 2 different orientations, for alpha-ejection corrections. Crystals wereloaded into 1-mm Pt foil tubes (in some cases, Mo was used for zircon), which were then loaded into copperor stainless steel sample planchets with 30 sample slots. Planchets were loaded into a �10 centimeter lasercell with sapphire (or ZnS for the CO2 laser) window, connected by high-vacuum flexhose to the Heextraction/measurement line. Once in the laser cell and pumped to 10-7-10-8 torr, crystal-bearing foil tubeswere individually heated by lasing with about 1-5 W on the Nd-YAG, or 5-15 W on the CO2, laser, for threeminutes for apatite or 20 minutes for zircon. Temperatures of heated foil packets were not measured, but
514 Peter W. Reiners and others—Post-orogenic evolution of the Dabie Shan,
from experiments relating luminosity and step-wise degassing of both apatite and zircon, we estimate typicalheating temperatures of 1000° to 1200°C for apatite, and 1250° to 1400°C for zircon. 4He blanks (0.05-0.5femtomol 4He, after correction for 4He in the spike) were determined by heating empty foil packets usingthe same procedure. Crystals were checked for quantitative degassing of He by sequential reheating. Whileapatites rarely exhibited residual gas after the first degassing, about 50 percent of zircons did, and frequentlyrequired 2 to 3 reheatings to reduce the yield to �1 to 2 percent of the original extract. Gas liberated fromsamples was processed by: 1) spiking with �0.4 pmol of 3He, 2) cyrogenic concentration at 16K on a charcoaltrap (condensation time calibrated for no significant 4He/3He fractionation), and purification by release at37K, and 3) measurement of 4He/3He ratios (corrected for HD and H3 by monitoring H�) on a quadrupolemass spectrometer next to a cold Zr-alloy getter. All ratios were referenced to multiple same-day measuredratios and known volumes of 4He standards processed in the same way. Linearity of this standard referencingprocedure has been confirmed over four orders of magnitude of 4He intensity. 4He standard reproducibilityaverages 0.2 percent on a daily and long-term (tank-depletion corrected) basis. Estimated 2� analyticaluncertainty on sample He determinations, including precision and accuracy from original manometric 4Hestandard calibrations, is 1 to 2 percent.
Following degassing, samples were retrieved from the laser cell, spiked with a calibrated 229Th and 233Usolution, and dissolved. Apatites were dissolved in-situ from Pt tubes in �30 percent HNO3 in teflon vials.Zircons were removed from foil and then dissolved in teflon microvials in Parr bombs with HF and HNO3,followed by HCl and/or H3BO3 to remove fluoride salts, and a final dissolution in HNO3. Each sample batchwas prepared with a series of acid blanks and spiked normals to check the purity and calibration of thereagents and spikes. Spiked solutions were analyzed as 0.5 ml of �1-5 ppb U-Th solutions by isotope dilutionon a Finnigan Element2 ICP-MS with a teflon micro-flow nebulizer and double-pass spray chamber.Procedural U and Th blanks by this method are 1 � 0.5 pg and 2 � 1 pg, respectively. Routine in-runprecisions and long-term reproducibilities of standard 232Th/229Th and 238U/233U are 0.1 to 0.4 percent,and estimated uncertainty on sample U-Th contents are estimated to be 1 to 2 percent (2�).
Alpha ejection was corrected using the method of Farley and others (1996), modified by Farley (2002).Replicate analyses of Durango apatite and Fish Canyon Tuff zircon during the period of these analysesyielded mean ages of 32.5 � 1.5 Ma (2�; n�41) and 28.3 � 2.4 Ma (2�; n�37), respectively. On the basis ofreproducibility of these and other intralab standards, we estimate an analytical uncertainty of 6 percent and 8percent (2�) for apatite and zircon age determinations, respectively, in this study.
Apatite Fission-Track ChronometryApatite grains were mounted in epoxide resin cured at 90°C for 1 hour, and all grain mounts were
polished using 3.0 �m Al2O3 and then 0.3 �m Al2O3 slurries on a polishing wheel to expose internal crystalsurfaces. Grains were etched in 5.5N HNO3 for 20.0 (�0.5) seconds at 21 (�1) °C to reveal spontaneousfission tracks. After spontaneous fission-track densities were measured for the apatite grains of interest,grains were irradiated with 252Cf-derived fission fragments (Donelick and Miller, 1991) in a nominal vacuumand then re-etched in 5.5N HNO3 for 20.0 (�0.5) seconds at 21 (�1) °C to reveal the 252Cf-derived fissiontracks and any spontaneous confined fission tracks. Length measurements were performed only onhorizontal, confined, spontaneous fission tracks with well-defined ends lying in planes parallel to thecrystallographic c-axis (all 252Cf-derived fission tracks are incident upon the etched apatite surface and aretherefore not confined within the grain). Measurements were performed using an optical microscope and acombination of reflected and unpolarized transmitted light at a magnification of 1562.5x (100x dryobjective, 1.25x projection tube, and 12.5x oculars). Full details on the methods used are summarized inDonelick (1991).
Apatite grains were classified according to their kinetics of fission-track annealing (the rate at whichfission tracks are lost), inferred using parameter Dpar (units �m). Dpar is the fission-track etch pit diameterparallel to the crystallographic c-axis at the polished, etched, and analyzed apatite surface (Crowley andothers, 1991; Naeser, 1992; Donelick, 1993; Burtner and others, 1994; Grønlie and others, 1994; Donelick,1995). Dpar exhibits general but imperfect correlations with apatite fission-track annealing kinetics (Carlsonand others, 1999; Ketcham and others, 1999), and chemical composition (Burtner and others, 1994), withsmall Dpar (2.00 �m) grains typical of fast-annealing, Ca-F-apatite and large Dpar grains typical of slow- tofast-annealing Ca(�Fe, Mn, rare earth elements)-F(�Cl)(�OH)-apatite. Dpar is at least as reliable as Cl- orOH-content for constraining apatite fission-track annealing kinetics (Carlson and others, 1999; Donelick,unpublished data). The parameter Dpar, calculated as the arithmetic mean of between 1 and 4 individualDpar values per grain, was determined for each apatite grain that yielded either fission-track age data ortrack length data. Full details of the methods used are summarized in Burtner and others (1994).
515eastern China, (U-Th)/He and fission-track thermochronology

Fission-track ages were determined using the external detector method and all counting was performedusing an optical microscope (details as in first paragraph of this section). Polished and etched grain mountswere covered by thin sheets of low-uranium muscovite mica prior to neutron irradiation; for purposes ofstandardization, similar sheets of muscovite were placed in direct contact with small chips of CN-1 U-dopedglass (courtesy of Dr. Jan Schreurs, Corning Glass Works, Corning, New York). The samples (together withtheir respective CN-1 glass standards) were irradiated for 45 minutes (nominal thermal-neutron fluence ofabout 1016 neutrons/cm2) in position D-9 in the nuclear reactor at Washington State University (1 MWpower level). After irradiation, the short-lived radionuclides in the samples were allowed to decay tobackground levels before further analyses were performed. Once removed from the samples and glassstandards, mica sheets were etched for 12 minutes in 48 percent HF at 24°C, revealing the induced (formedby irradiation in the reactor) fission tracks for optical viewing. Fission track ages were calculated using a zetacalibration factor of 113.8 � 2.9 for Fish Canyon Tuff and Durango apatite age standards (Hurford andGreen, 1983).
References
Baldwin, J. A., Whipple, K. X., and Tucker, G. E., 2003, Implications of the shear stress river incision modelfor the timescale of postorogenic decay of topography: Journal of Geophysical Research, v. 108, doi:10.1029/2001JB000550.
Brandon, M. T., Roden-Tice, M. K., and Garver, J. I., 1998, Late Cenozoic exhumation of the Cascadiaaccretionary wedge in the Olympic Mountains, northwest Washington State: Geological Society ofAmerica Bulletin, v. 110, p. 985–1009.
Braun, J., 2002a, Quantifying the effect of recent relief changes on age-elevation relationships: Earth andPlanetary Science Letters, v. 200, p. 331–343.
–––––– 2002b, Estimating exhumation rate and relief evolution by spectral analysis of age-elevation datasets:Terra Nova, v. 14, p. 210–214.
Burtner, R. L., Nigrini, A., and Donelick, R. A., 1994, Thermochronology of Lower Cretaceous source rocksin the Idaho-Wyoming thrust belt: American Association of Petroleum Geologists Bulletin, v. 78, n. 10,p. 1613–1636.
Carlson, W. D., Donelick, R. A., and Ketcham, R. A., 1999, Variability of apatite fission track annealingkinetics I: Experimental results: American Mineralogist, v. 84, p. 1213–1223.
Crowley, K. D., Cameron, M., and Schaefer, R. L., 1991, Experimental studies of annealing of etched fissiontracks in fluorapatite: Geochimica et Cosmochimica Acta, v. 55, p. 1449–1465.
Donelick, R. A., 1991, Crystallographic orientation dependence of mean etchable fission track length inapatite: An empirical model and experimental observations: American Mineralogist, v. 76, p. 83–91.
–––––– 1993, A method of fission track analysis utilizing bulk chemical etching of apatite: U.S. Patent Number5,267,274.
–––––– 1995, A method of fission track analysis utilizing bulk chemical etching of apatite: Australian PatentNumber 658,800.
Donelick, R. A., and Miller, D. S., 1991, Enhanced TINT fission track densities in low spontaneous trackdensity apatites using 252Cf-derived fission fragment tracks: A model and experimental observations:Nuclear Tracks and Radiation Measurements, v. 18, p. 301–307.
Ducea, M. N., and Saleeby, J .B., 1998, A case for delamination of the deep batholithic crust beneath theSierra Nevada, California: International Geology Review, v. 40, p. 78–93.
Ehlers, T. A., and Farley, K. A., 2003, Apatite (U-Th)/He thermochronology: methods and applications toproblems in tectonics and surface processes: Earth and Planetary Science Letters, v. 206, p. 1–14.
Ehlers, T. A., Armstrong, P. A., and Chapman, D. S., 2001, Normal fault regimes and the interpretation oflow-temperature thermochronometers: Physics of the Earth and Planetary Interiors, v. 126, p. 179–194.
Eide, E. A., McWilliams, M. O., and Liou, J. G., 1994, 40Ar/39Ar geochronology and exhumation ofhigh-pressure to ultrahigh-pressure metamorphic rocks in east-central China: Geology, v. 22, p. 601–604.
Farley, K. A., 2000, Helium diffusion from apatite: General behavior as illustrated by Durango fluorapatite:Journal of Geophysical Research, v. 105, p. 2903–2914.
–––––– 2002, (U-Th)/He dating: Techniques, calibrations, and applications: Mineralogical Society ofAmerica, Reviews in Mineralogy and Geochemistry, v. 47, p. 819–844.
Farley, K. A., Wolf, R. A., and Silver, L. T., 1996, The effects of long alpha-stopping distances on (U-Th)/Heages: Geochimica et Cosmochimica Acta, v. 60, p. 4223–4229.
Fitzgerald, P. G., Sorkhabi, R. B., Redfield, T. F., and Stump, E., 1995, Uplift and denudation of the centralAlaska Range: A case study in the use of apatite fission-track thermochronology to determine absoluteuplift parameters: Journal of Geophysical Research, v. 100, 20,175–20,191.
Gallagher, K., Brown, R. W., and Johnson, C. J., 1998, Geological applications of fission track analysis: AnnualReviews of Earth and Planetary Sciences, v. 26, p. 519–572.
Grimmer, J. C., Jonckheere, R., Enkelmann, E., Ratschbacher, L., Hacker, B. R., Blythe, A. E., Wagner, G. A.,Wu, Q., Liu, S., and Dong, S., 2002, Cretaceous-Cenozoic history of the southern Tan-Lu fault zone:apatite fission-track and structural constraints from the Dabie Shan (eastern China): Tectonophysics,v. 359, p. 225–253.
516 Peter W. Reiners and others—Post-orogenic evolution of the Dabie Shan,
Grimmer, J. C., Ratschbacher, L., McWilliams, M., Franz, L., Gaitzch, I., Tichomirowa, M., Hacker, B. R., andZhang, Y., 2003, When did the ultra-high pressure rocks reach the surface? A 207Pb/206Pb zircon,40AR/39AR white mica, Si-in-white mica, single-grain provenance study of Dabie Shan synorogenicforeland sediments: Chemical Geology, v. 197, p. 87–110.
Grønlie, A., Naeser, C. W., Naeser, N. D., Mitchell, J. G., Sturt, B. A., and Ineson, P. R., 1994, Fission-track andK-Ar dating of tectonic activity in a transect across the Møre-Trøndelag Fault Zone, central Norway:Norsk Geologisk Tidsskrift, v. 74, p. 24–34.
Hacker, B. R., and Wang, Q. C., 1995, Ar/Ar geochronology of ultrahigh-pressure metamorphism in centralChina: Tectonics, v. 14, p. 994–1006.
Hacker, B. R., Wang, X., Eide, E. A., and Ratschbacher, L., 1996, The Qinling-Dabie ultra-high-pressurecollisional orogen, in Yin, A., and Harrison, T. M., editors, The tectonic evolution of Asia: Cambridge,Cambridge University Press, p. 345–370.
Hacker, B. R., Ratschbacher, L., Webb, L., Ireland, T., Walker, D., and Dong, S., 1998, U/Pb zircon agesconstrain the architecture of the ultrahigh-pressure Qinling-Dabie Orogen, China: Earth and PlanetaryScience Letters, v. 161, p. 215–230.
Hacker, B. R., Ratschbacher, L., Webb, L., McWilliams, M. O., Ireland, T., Calvert, A., Dong, S., Wenk, H. R.,and Chateigner, D., 2000, Exhumation of ultrahigh-pressure continental crust in east central China:Late Triassic-Early Jurassic tectonic unroofing: Journal of Geophysical Research, v. 105, p. 13,339–13,364.
House, M. A., Wernicke, B. P., and Farley, K. A., 1998, Dating topography of the Sierra Nevada, California,using apatite (U-Th)/He ages: Nature, v. 396, p. 66–69.
–––––– 2001, Paleo-geomorphology of the Sierra Nevada, California, from (U-Th)/He ages in apatite:American Journal of Science, v. 301, p. 77–102.
Hu, S., He, L., and Wang, J., 2000, Heat flow in the continental area of China: a new data set: Earth andPlanetary Science Letters, v. 179, p. 407–419.
Hurford, A. J., and Green, P. F., 1983, The zeta age calibration of fission-track dating: Chemical Geology, v. 1,p. 285–317.
Jull, M., and Kelemen, P. B., 2001, On the conditions for lower crustal convective instability: Journal ofGeophysical Research, v. 106, p. 6423–6446.
Kern, H., Gao, S., Jin, Z., Popp, T., and Jin, S., 1999, Petrophysical studies on rocks from the Dabieultrahigh-pressure (UHP) metamorphic belt, Central China: implications for the composition anddelamination of the lower crust: Tectonophysics, v. 301, p. 191–215.
Ketcham, R. A., Donelick, R. A., and Carlson, W. D., 1999, Variability of apatite fission track annealingkinetics III: Extrapolation to geological time scales: American Mineralogist, v. 84, p. 1235–1255.
Ketcham, R. A., Donelick, R. A., and Donelick, M. B., 2000, AFTSolve: A program for multi-kinetic modelingof apatite fission-track data: Geological Materials Research, v. 2, n. 1.
Kirby, E., Reiners, P. W., Krol, M., Hodges, K., Farley, K. A., Whipple, K., Yiping, L., Tang, W., and Chen, Z.,2002, Late Cenozoic uplift and landscape evolution along the eastern margin of the Tibetan plateau:Inferences from 40Ar/39Ar and U-Th-He thermochronology: Tectonics, 10.1029/2000TC001246.
Liou, J. G., Zhang, R. Y., Wang, X., Eide, E. A., Ernst, W. G., and Maruyama, S., 1996, Metamorphism andtectonics of high-pressure and ultra-high pressure belts in the Dabie-Sulu region, China, in Yin, A., andHarrison, T. M., editors, The tectonic evolution of Asia: Cambridge, Cambridge University Press,p. 300–344.
Mancktelow, N. S., and Grasemann, B., 1997, Time-dependent effects of heat advection and topography oncooling histories during erosion: Tectonophysics, v. 270, p. 167–195.
Molnar, P., and Tapponnier, P., 1975, Cenozoic tectonics of Asia: Effects of a continental collision: Science,v. 189, p. 419–426.
Naeser, N. D., 1992, Miocene cooling in the southwestern Powder River Basin, Wyoming - Preliminaryevidence from apatite fission-track analysis: U.S. Geological Survey Bulletin 1917-O, 17 p.
Nie, S., Yin, A., Rowley, D. B., and Jin, Y., 1994, Exhumation of the Dabie Shan ultra-high-pressure rocks andaccumulation of the Songpan-Ganzi flysch sequence, central China: Geology, v. 22, p. 999–1002.
Northrup, C. J., Royden, L. H., and Burchfiel, B. C., 1995, Motion of the Pacific plate relative to Eurasia andits potential relation to Cenozoic extension along the eastern margin of Eurasia: Geology, v. 23,p. 719–722.
Okay, A. I., Sengor, A. M. C., and Satir, M., 1993, Tectonics of an ultrahigh-pressure metamorphic terrane:The Dabie Shan/Tongbai Shan orogen, China: Tectonics, v. 12, p. 1320–1334.
Pazzaglia, F. J., and Brandon, M. T., 1996, Macrogeomorphic evolution of the post-Triassic AppalachianMountains determined by deconvolution of the offshore basin sedimentary record: Basin Research, v. 8,p. 255–278.
Peltzer, G., Tapponnier, P., Zhang, Z. T., and Xu, Z. Q., 1985, Neogene and Quaternary faulting along theQinling Shan: Nature, v. 317, p. 500–505.
Ratschbacher, L., Hacker, B. R., Webb, L. E., McWilliams, M., Ireland, T., Dong, S., Calvert, A., Chateigner,D., and Wenk, H. R., 2000, Exhumation of the ultrahigh-pressure continental crust in east centralChina: Cretaceous and Cenozoic unroofing and the Tan-Lu fault: Journal of Geophysical Research,v. 105, p. 13,303–13,338.
Reiners, P. W., and Spell, T. L., 2002, Intercalibration of zircon (U-Th)/He and K-feldspar 40Ar/39Arthermochronometry: Geochimica et Cosmochimica Acta, v. 66, p. A631.
Reiners, P. W., Farley, K. A., and Hickes, H. J., 2002, He diffusion and (U-Th)/He thermochronometry ofzircon: Initial results from Fish Canyon Tuff and Gold Butte: Tectonophysics, v. 349, p. 247–308.
Rowley, D. B., Xue, F., Tucker, R. D., Peng, Z. X., Baker, J., and Davis, A., 1997, Ages of ultrahigh pressuremetamorphism and protolith orthogneisses from the eastern Dabie Shan: U/Pb zircon geochronology:Earth and Planetary Science Letters, v. 151, p. 191–203.
517eastern China, (U-Th)/He and fission-track thermochronology
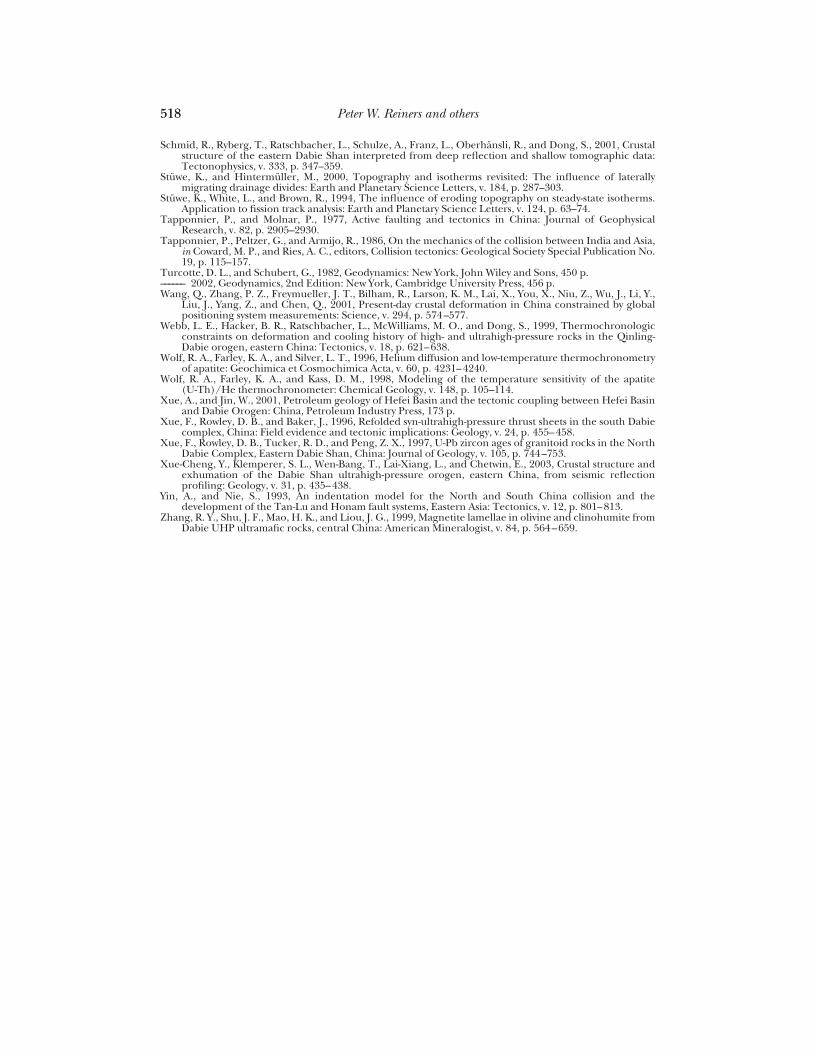
Schmid, R., Ryberg, T., Ratschbacher, L., Schulze, A., Franz, L., Oberhansli, R., and Dong, S., 2001, Crustalstructure of the eastern Dabie Shan interpreted from deep reflection and shallow tomographic data:Tectonophysics, v. 333, p. 347–359.
Stuwe, K., and Hintermuller, M., 2000, Topography and isotherms revisited: The influence of laterallymigrating drainage divides: Earth and Planetary Science Letters, v. 184, p. 287–303.
Stuwe, K., White, L., and Brown, R., 1994, The influence of eroding topography on steady-state isotherms.Application to fission track analysis: Earth and Planetary Science Letters, v. 124, p. 63–74.
Tapponnier, P., and Molnar, P., 1977, Active faulting and tectonics in China: Journal of GeophysicalResearch, v. 82, p. 2905–2930.
Tapponnier, P., Peltzer, G., and Armijo, R., 1986, On the mechanics of the collision between India and Asia,in Coward, M. P., and Ries, A. C., editors, Collision tectonics: Geological Society Special Publication No.19, p. 115–157.
Turcotte, D. L., and Schubert, G., 1982, Geodynamics: New York, John Wiley and Sons, 450 p.–––––– 2002, Geodynamics, 2nd Edition: New York, Cambridge University Press, 456 p.Wang, Q., Zhang, P. Z., Freymueller, J. T., Bilham, R., Larson, K. M., Lai, X., You, X., Niu, Z., Wu, J., Li, Y.,
Liu, J., Yang, Z., and Chen, Q., 2001, Present-day crustal deformation in China constrained by globalpositioning system measurements: Science, v. 294, p. 574–577.
Webb, L. E., Hacker, B. R., Ratschbacher, L., McWilliams, M. O., and Dong, S., 1999, Thermochronologicconstraints on deformation and cooling history of high- and ultrahigh-pressure rocks in the Qinling-Dabie orogen, eastern China: Tectonics, v. 18, p. 621–638.
Wolf, R. A., Farley, K. A., and Silver, L. T., 1996, Helium diffusion and low-temperature thermochronometryof apatite: Geochimica et Cosmochimica Acta, v. 60, p. 4231–4240.
Wolf, R. A., Farley, K. A., and Kass, D. M., 1998, Modeling of the temperature sensitivity of the apatite(U-Th)/He thermochronometer: Chemical Geology, v. 148, p. 105–114.
Xue, A., and Jin, W., 2001, Petroleum geology of Hefei Basin and the tectonic coupling between Hefei Basinand Dabie Orogen: China, Petroleum Industry Press, 173 p.
Xue, F., Rowley, D. B., and Baker, J., 1996, Refolded syn-ultrahigh-pressure thrust sheets in the south Dabiecomplex, China: Field evidence and tectonic implications: Geology, v. 24, p. 455–458.
Xue, F., Rowley, D. B., Tucker, R. D., and Peng, Z. X., 1997, U-Pb zircon ages of granitoid rocks in the NorthDabie Complex, Eastern Dabie Shan, China: Journal of Geology, v. 105, p. 744–753.
Xue-Cheng, Y., Klemperer, S. L., Wen-Bang, T., Lai-Xiang, L., and Chetwin, E., 2003, Crustal structure andexhumation of the Dabie Shan ultrahigh-pressure orogen, eastern China, from seismic reflectionprofiling: Geology, v. 31, p. 435–438.
Yin, A., and Nie, S., 1993, An indentation model for the North and South China collision and thedevelopment of the Tan-Lu and Honam fault systems, Eastern Asia: Tectonics, v. 12, p. 801–813.
Zhang, R. Y., Shu, J. F., Mao, H. K., and Liou, J. G., 1999, Magnetite lamellae in olivine and clinohumite fromDabie UHP ultramafic rocks, central China: American Mineralogist, v. 84, p. 564–659.
518 Peter W. Reiners and others518