Propagation of orographic barriers along an active range front: insights from sandstone petrography...
26
Propagation of orographic barriers along an active range front: insights from sandstone petrography and detrital apatite fission-track thermochronology in the intramontane Angastaco basin, NW Argentina Isabelle Coutand, n w Barbara Carrapa, w Anke Deeken, z Axel K. Schmitt, ‰ Edward R. Sobel w and Manfred R. Strecker w n Universite¤ des Sciences et Technologies de Lille 1, UMR-CNRS 8110, UFR des Sciences de laTerre (ba“ t.SN5), Villeneuve d’Ascq cedex, France wUniversitȄt Potsdam, Institut fˇr Geowissenschaften, Potsdam, Germany zInstitut fˇr Geowissenschaften, Freie UniversitȄt Berlin, Maltesestrasse, Berlin, Germany ‰Department of Earth and Space Sciences, University of California, Los Angeles, CA, USA ABSTRACT The arid Puna plateau of the southern Central Andes is characterized by Cenozoic distributed shortening forming intramontane basins that are disconnected from the humid foreland because of the defeat of orogen-traversing channels.ThickTertiary and Quaternary sedimentary ¢lls in Puna basins have reduced topographic contrasts between the compressional basins and ranges, leading to a typical low-relief plateau morphology. Structurally identical basins that are still externally drained straddle the eastern border of the Puna and document the eastward propagation of orographic barriers and ensuing aridi¢cation. One of them, the Angastaco basin, is transitional between the highly compartmentalized Puna highlands and the undeformed Andean foreland. Sandstone petrography, structural and stratigraphic analysis, combined with detrital apatite ¢ssion-track thermochronology from a 6200-m-thick Miocene to Pliocene stratigraphic section in the Angastaco basin, document the late Eocene to late Pliocene exhumation history of source regions along the eastern border of the Puna (Eastern Cordillera (EC)) as well as the construction of orographic barriers along the southeastern £ank of the Central Andes. Onset of exhumation of a source in the EC in late Eocene time as well as a rapid exhumation of the Sierra de Luracatao (in the EC) at about 20 Ma are recorded in the detrital sediments of the Angastaco basin. Sediment accumulation in the basin began 15 Ma, a time at which the EC had already built su⁄cient topography to prevent Puna sourced detritus from reaching the basin. After 13 Ma, shortening shifted eastward, exhuming ranges that preserve an apatite ¢ssion-track partial annealing zone recording cooling during the late Cretaceous rifting event. Facies changes and fossil content suggest that after 9 Ma, the EC constituted an e¡ective orographic barrier that prevented moisture penetration into the plateau. Between 3.4 and 2.4 Ma, another orographic barrier was uplifted to the east, leading to further aridi¢cation and pronounced precipitation gradients along the mountain front.This study emphasizes the important role of tectonics in the evolution of climate in this part of the Andes. INTRODUCTION The Altiplano-Puna plateau stretches for 2000 km from southern Peru to northwestern Argentina and is a ¢rst-or- der topographic feature of the Central Andes.The plateau is bounded on the west by active stratovolcanoes of the Western Cordillera and on the east by the basement- involved thrust system of the Eastern Cordillera (EC) (Fig.1a and b). Both Cordilleras reach elevations in excess of 6500 m and delimit the plateau region of 3800 m average elevation.The present-day elevation of the plateau is com- monly attributed to crustal thickening in the course of dis- tributed tectonic shortening (e.g. Isacks, 1988; Allmendinger et al ., 1997; Lamb et al ., 1997; Kley & Monaldi, 1998; McQuar- rie, 2002), and subsequent wholesale uplift following delami- nation of mantle lithosphere in its southern part (Argentinian Puna) (Kay et al .,1994; Allmendinger et al ., 1997). Correspondence: Isabelle Coutand, Universite¤ des Sciences et Technologies de Lille 1, UMR-CNRS 8110, UFR des Sciences de la Terre (ba“ t. SN5), 59655 Villeneuve d’Ascq cedex, France. E-mail: [email protected] Basin Research (2006) 18, 1–26, doi: 10.1111/j.1365-2117.2006.00283.x r 2006 The Authors. Journal compilation r 2006 Blackwell Publishing Ltd 1
Transcript of Propagation of orographic barriers along an active range front: insights from sandstone petrography...
Propagation of orographic barriers alongan activerange front: insights fromsandstone petrographyanddetrital apatite fission-track thermochronology in theintramontane Angastaco basin,NWArgentinaIsabelle Coutand,nw Barbara Carrapa,w Anke Deeken,z Axel K. Schmitt,‰ Edward R. Sobelwand Manfred R. StreckerwnUniversite¤ des Sciences etTechnologies de Lille 1, UMR-CNRS 8110, UFR des Sciences de laTerre (ba“ t.SN5),Villeneuve d’Ascq cedex, FrancewUniversit�t Potsdam, Institut fˇr Geowissenschaften, Potsdam, GermanyzInstitut fˇr Geowissenschaften, Freie Universit�t Berlin, Maltesestrasse, Berlin, Germany‰Department of Earth and Space Sciences, University of California, Los Angeles, CA, USA
ABSTRACT
The arid Puna plateau of the southern Central Andes is characterized by Cenozoic distributedshortening forming intramontane basins that are disconnected from the humid foreland because ofthe defeat of orogen-traversing channels.ThickTertiary and Quaternary sedimentary ¢lls in Punabasins have reduced topographic contrasts between the compressional basins and ranges, leading to atypical low-relief plateau morphology. Structurally identical basins that are still externally drainedstraddle the eastern border of thePuna anddocument the eastward propagation of orographic barriersand ensuing aridi¢cation. One of them, the Angastaco basin, is transitional between the highlycompartmentalized Puna highlands and the undeformed Andean foreland. Sandstone petrography,structural and stratigraphic analysis, combinedwith detrital apatite ¢ssion-track thermochronologyfrom a �6200-m-thickMiocene to Pliocene stratigraphic section in the Angastaco basin, documentthe late Eocene to late Pliocene exhumation history of source regions along the eastern border of thePuna (Eastern Cordillera (EC)) as well as the construction of orographic barriers along thesoutheastern £ank of the Central Andes.Onset of exhumation of a source in the EC in late Eocene time as well as a rapid exhumation of the
Sierra de Luracatao (in the EC) at about 20Ma are recorded in the detrital sediments of the Angastacobasin. Sediment accumulation in the basin began �15Ma, a time atwhich the EC had already builtsu⁄cient topography to prevent Puna sourced detritus from reaching the basin. After �13Ma,shortening shifted eastward, exhuming ranges that preserve an apatite ¢ssion-track partial annealingzone recording cooling during the late Cretaceous rifting event. Facies changes and fossil contentsuggest that after 9Ma, the EC constituted an e¡ective orographic barrier that prevented moisturepenetration into the plateau.Between3.4 and2.4Ma, another orographic barrier was uplifted to the east,leading to further aridi¢cation and pronounced precipitation gradients along the mountain front.Thisstudy emphasizes the important role of tectonics in the evolution of climate in this part of the Andes.
INTRODUCTION
TheAltiplano-Puna plateau stretches for �2000 km fromsouthern Peru to northwestern Argentina and is a ¢rst-or-der topographic feature of the Central Andes.The plateauis bounded on the west by active stratovolcanoes of the
Western Cordillera and on the east by the basement-involved thrust system of the Eastern Cordillera (EC)(Fig. 1a and b). Both Cordilleras reach elevations in excessof 6500m and delimit the plateau region of 3800m averageelevation.The present-day elevation of the plateau is com-monly attributed to crustal thickening in the course of dis-tributed tectonic shortening (e.g. Isacks, 1988; Allmendingeretal., 1997; Lamb et al., 1997; Kley &Monaldi, 1998;McQuar-rie, 2002), and subsequentwholesale uplift following delami-nation of mantle lithosphere in its southern part(ArgentinianPuna) (Kay etal.,1994;Allmendingeretal.,1997).
Correspondence: Isabelle Coutand, Universite¤ des Sciences etTechnologies de Lille 1, UMR-CNRS 8110, UFR des Sciencesde la Terre (ba“ t. SN5), 59655 Villeneuve d’Ascq cedex, France.E-mail: [email protected]
BasinResearch (2006) 18, 1–26, doi: 10.1111/j.1365-2117.2006.00283.x
r 2006 The Authors. Journal compilationr 2006 Blackwell Publishing Ltd 1

PUNA
PUNA
(a)
(b)
Fig.1. (a) Geological map of the southeastern Central Andes (redrawn from the geological maps of Salta, Catamarca and Tucumanprovinces, scale1 : 500 000). (b) DEMof the southern central Andes between 24^271S and 69^641W.Data are from SRTM90-m square-gridDEM.The heavydashed line shows the boundarybetween the internallydrainedPuna plateau and the foreland areas that drain to theeast. (c) Coloured mean annual precipitation distribution along the southeastern Central Andes based on data fromWMO (1975) andBianchi&Yan� ez (1992).Location of (a^c) is given by the black square in inset (a).Abbreviations areAcon,Aconquija range;Ang,Angastacobasin;Ant,Antofalla salar;Ar,Arizaro salar;Bar,SantaBarbara ranges;Ca,Calalaste range;Chan,ChangoReal range;OC,Oire intrusivecomplex; Gal, CerroGala¤ n; Lur, Cumbres de Luracatao;Mar, SantaMaria valley; Quil, Quilmes range; SRT, Santa Rosa deTast|¤ l.
r 2006 The Authors. Journal compilationr 2006 Blackwell Publishing Ltd,Basin Research, 18, 1^262
I. Coutandet al.

The Puna plateau comprises internally drained, par-tially over¢lled contractional basins where up to 6000mof late Eocene to Pliocene continental clastics and evapor-ites have accumulated (Jordan & Alonso, 1987; Kraemeret al., 1999; Adelmann, 2001; Coutand et al., 2001). Thesebasins are thrust-bounded and isolated from each otherby �N^S trending basement ranges, typically 1000^1500m higher than the plateau £oor (Coutand,1999; Cou-tand et al., 2001 and references therein) (Fig.1a and b).Thedeposition of thick evaporite units is related to internaldrainage and sustained aridity, at least during the last 27^14Myr (Alonso et al., 1991; Vandervoort et al., 1995; Adel-mann, 2001; Carrapa et al., 2005).The aridity results fromthe latitudinal position in a region of descending airmasses (e.g. Hartley, 2003; R. Alonso, B. Carrapa, I. Cou-tand, M. Haschke, G.E. Hilley, E.R. Sobel, M.R. Strecker&M.H.Trauth, submitted) and the condensation of Atlan-tic-derived moisture along the eastern (windward) £ank ofthe orogen (e.g. Masek et al., 1994; Haselton et al., 2002)(Fig.1c).
Sobel etal. (2003) andHilley&Strecker (2005) have sug-gested a model for the Puna plateau and adjacent regionsin which the low internal relief, aridity and internal drai-nage are intimately linked and have persisted in this regionbecause tectonic uplift has overwhelmed the ine⁄cient£uvial system and caused orogen-traversing channels tobe defeated, thus disconnecting the interior of the orogenfrom the foreland base level. The combination of an aridclimate and tectonic activity along range fronts impliesthat progressive aridi¢cation of the hinterland is pro-motedwhen laterally continuous orographic barriers alongthe margin of the plateau are perpendicular to moisture-bearing winds. If aridity is coupled with low erodibility,and moderate to high uplift rates of orographic barriers,the channel network draining the hinterland will be frag-mented.Consequently,material removed from the leewardside of the uplifts will ¢ll internally drained basins. The
failure of erosional mass export will increase gravitationalstresses in the hinterland and eventually promote the mi-gration of contractional deformation into the foreland, ad-vancing orographic barriers and precipitation in the samedirection (Sobel & Strecker, 2003; Sobel et al., 2003; Hilley& Strecker, 2004).
To further evaluate this model and to understand theupper crustal and sur¢cial mechanisms that promote theformation, maintenance and lateral growth of a highplateau, it is important to better constrain the space^timedevelopment of orographic barriers. Most estimates forthe timing of shortening and associated crustal thickeningand surface uplift in NW Argentina rely on the synoro-genic record of contractional basins within and adjacentto the orogenic belt (Jordan & Alonso, 1987; Strecker et al.,1989; Allmendinger et al., 1997; Jordan et al., 1997; Kraemeretal., 1999; Coutand etal., 2001).However, across and at theborder of the southern Puna, little is known about (1) theonset of tectonic shortening as a proxy for mountain build-ing and (2) the spatial distribution and propagation of con-tractional deformation through time.Whereas some arguethat the propagation of the contractional front was uni-form in space from west to east with shortening startingwithin the plateau in the earlyMiocene (�15^20Ma) (Jor-dan&Alonso,1987; Allmendinger etal., 1997) and reachingthe plateau margin by the lateMiocene (10^6Ma) (Streck-er et al., 1989; Allmendinger et al., 1997;Marrett & Strecker,2000), other studies suggest that early contraction and up-lift occurredwithin and at the eastern periphery of the pla-teau as early as the late Eocene^Oligocene time (Kraemeret al., 1999; Adelmann, 2001; Coutand et al., 2001; Carrapaet al., 2005), similar to observations made to the north inthe Bolivian Andes (Horton et al., 2002; Horton, 2005).
In this study, we evaluate the tectono-sedimentary his-tory of the southeastern Puna margin by reconstructingthe evolution of the intramontane Angastaco basin, lo-cated between the plateau and eastern foreland ranges.The Angastaco basin is part of the semi-arid Calchaqu|¤Valley receiving �200mm of rainfall annually; it is thustrapped between the arid Puna plateau to the west(�100mmyr�1) and the humid Chaco lowlands of theAndean foreland to the east (1200mmyr�1) (Haseltonet al., 2002) (Fig. 1c). Our new structural, sedimentologic,provenance and detrital apatite ¢ssion-track data fromthe Neogene Angastaco basin help reconcile di¡erentviews on the timing of plateau evolution and constrainthe Cenozoic structural and palaeoecologic evolution ofthe southeastern plateau margin. We demonstrate thatcontractional deformation began in the late Eocene, simi-lar to other areas on the southern Puna plateau. Further-more, we show that the migration of compressionaldeformation and related building of orographic barriersfocused precipitation on the eastern, windward £anks ofranges east of the Puna. This starved the western hinter-land of moisture and thus promoted the maintenance ofinternally drained areas in the plateau and the creation oftransient internally drained basins in the transition be-tween the plateau border and the foreland.
PUNA
(c)
Fig.1. Continued
r 2006 The Authors. Journal compilationr 2006 Blackwell Publishing Ltd,Basin Research, 18, 1^26 3
Propagation of orographic barriers along an active range front

REGIONAL GEOLOGICAL SETTING
The narrow, N^S trending Angastaco basin is located inthe distal part of a once contiguous Palaeogene RetroarcForeland basin (Jordan & Alonso, 1987) (Fig. 1a). The re-verse-fault-bounded basin is located in the semi-aridCal-chaqu|¤ valley between the EC to the west, and the forelandranges of the Santa Barbara structural province to the east,an inverted Cretaceous extensional province (Grier et al.,1991; Mon & Sal¢ty, 1995) (Fig. 1a and b). On the west, thebasin is overthrust by late Proterozoic to early Cambrianmetasediments of the Puncoviscana Formation (Fig. 2aand b), and to the east it is limited by outcrops of Cretac-eous coarse clastic rift-related sediments (Marquillas etal.,2005). The Angastaco basin ¢ll comprises continentalclastic deposits of the latePalaeogene toNeogenePayogas-tilla Group (D|¤ az & Malizzia, 1983), which is tilted east-ward and gently folded (Fig. 2b).
The Puncoviscana Formation contains low-grade me-tamorphosed sandstones and shales (Turner, 1960;Toselli,1990; Durand, 1992) that grade southward into schists,gneisses and migmatites (La Paya Fm. and Tolombo¤ ncomplex).These units are intruded by Cambrian to Ordo-vician granites (Lork et al., 1990; Lork & Bahlburg, 1993;Omarini et al., 1999). Further west, the north^south-or-iented Oire intrusive complex of Ordovician granites andgranodiorites crops out (Me¤ ndez et al., 1973; Omarini etal., 1984; Lork & Bahlburg, 1993) (Figs 1a and 2a). Thesebasement lithologies constitute the source for the Payo-gastilla Group. The basement rocks are unconformablyoverlain by the rift-related Neocomian to early Eocenestrata of the Salta Group (Bianucci et al., 1981; Grier et al.,1991; Sal¢ty &Marquillas, 1994).
The Payogastilla Group (D|¤ az & Malizzia, 1983) restsunconformably on these units and consists of four forma-tions (Figs 2a, b and 3): (1) the basalQuebrada de los Color-ados Formation comprises sequences of coarse-grainedsandstones (sometimes conglomeratic) that grade upwardinto ¢ne- to medium-grained sandstones and siltstoneswith palaeosols (D|¤ az et al., 1987; Grier, 1990), interpretedto be alluvial plain deposits (D|¤ az & Malizzia, 1983). Itsage is poorly constrained as either early Miocene (D|¤ azet al., 1987) or Oligocene (Starck & Vergani, 1996). In theAngastaco basin, the base of the formation is not exposedbecause of faulting along the eastern side of Cerro Negro(Fig. 2a and b), but the unit is 340-m thick in the Pucara¤valley in thewest (Ruiz,1993). (2)The unconformably over-lying 4200-m-thick Angastaco Formation is composed ofgrey to beige conglomerates, sandstones and muddy silt-stones organized in upward- ¢ning £uvial cycles. In thelower and upper parts of the section, sandy and silty tex-tures dominate and the sequence is interpreted as a braidedstream system typical of a piedmont plain (D|¤ az & Maliz-zia, 1983) (Fig. 3). In the middle part of the section, con-glomeratic lenses intercalated with coarse-grainedsandstones and massive conglomeratic layers increase, in-dicating a distal to proximal alluvial fan origin (D|¤ az &Malizzia, 1983; D|¤ az et al., 1987; D|¤ az & Miserendino
Fuentes, 1988). The virtual absence of fossils and the pre-sence of desiccation polygons suggest that these stratamay have been deposited under arid to semi-arid condi-tions similar to coeval units in the Santa Mar|¤ a basin tothe south (D|¤ az & Malizzia, 1983; D|¤ az & MiserendinoFuentes, 1988; Bossi et al., 2001; Starck & Anzo¤ tegui,2001). A tu¡ at the base of the Angastaco Formation datedby the 40Ar/39Ar method on biotite yielded an age of13.4� 0.4Ma (Grier &Dallmeyer, 1990), indicating a mid-dle Miocene age. (3) The Palo Pintado Formation is con-formable with the underlying Angastaco Formation andcan be divided into two parts (Fig. 3). The lower 1500mconsist of ¢ne- to coarse-grained sandstones interlayeredwith siltstones and mudstones, interpreted as meanderingriver deposits locally withwetland facies (D|¤ az &Malizzia,1983;D|¤ az &Miserendino Fuentes,1988).The upper 450mcomprise an upward-coarsening succession of coarser-grained sandstones inter¢ngered with massive conglom-eratic strata and intercalated tu¡ beds, interpreted asbraided stream deposits (D|¤ az & Malizzia, 1983; D|¤ az &Miserendino Fuentes, 1988). Mammal fossils in the lowersection indicate a late Miocene to early Pliocene age andpalaeoenvironments characterized by relative humidity(Marshall et al., 1983; Anzo¤ tegui, 1998; Starck & Anzo¤ tegui,2001). A volcanic ash at the top of this unit (sample AI29,Fig. 3) yielded a U^Pb zircon age of 5.27� 0.28Ma (seethe next section). (4) Finally, the San Felipe Formation cov-ers the Palo Pintado strata and consists of 650-m-thickconglomeratic upward- ¢ning sequences (Grier, 1990), in-terpreted as braided stream deposits transitional with dis-tal alluvial fan deposits (D|¤ az & Malizzia, 1983; D|¤ az &Miserendino Fuentes, 1988). Capped by an angular uncon-formity, these units are overlain by gravels that contain re-cycled pyroclastic material at the base, 2.4Ma old (M. R.Strecker, unpubl. data).
U^PB ZIRCON DATING
To better constrain the stratigraphic age of theNeogene se-diments of theAngastaco basin, an ash located at the top ofthe Palo PintadoFormationwas dated by theU^Pbmethodon zircons (Table 1). Epoxy grain mounts of hand-selectedzircons were sectioned to expose grain interiors andpolished with 1mm Al2O3. After ultrasonic cleaning withsoapywater, dilutedHCl and distilledwater, theAu-coatedmounts were transferred into a high vacuum chamber(410� 8Torr) and kept overnight. Zircon analysis was per-formed using the UCLACameca ims1270 ion microprobewith a mass- ¢ltered, �15nA 16O� beam focused to an�30^35mm diameter spot. The analysis surface was£oodedwith O2 at a pressure of �4� 10� 3Pa to enhancePb1 yields. Secondary ions were extracted at 10 kV with anenergy band pass of 50 eV. Following a 4min pre-sputterperiod to reduce surface contamination intensitiesfor 94Zr2O
1, 204Pb1, 206Pb1, 207Pb1, 208Pb1, 238U1,232Th16O1 and 238U16O1 were then sequentially measuredin 10 cycles at a mass resolution of �5000, which is su⁄ -cient to resolve most molecular interferences.The relative
r 2006 The Authors. Journal compilationr 2006 Blackwell Publishing Ltd,Basin Research, 18, 1^264
I. Coutandet al.

N
A
BB
' A'
CC
'
25°3
0′S
25°4
5′S
66°1
5′W
66°0
0′W
135(km
)
A' B
A
B' C
C
'
WE
Eas
tern
Cor
dille
ra(C
umbr
es d
e Lu
raca
tao)
Puc
ara
valle
yA
ngas
taco
bas
in
Sie
rra
de lo
sC
olor
ados
Cer
roN
egro
4 km
Cumbres de Luracatao
Co
Dur
aznoCo
Run
no
Co.
Bay
o
El C
arm
en
Ang
asta
co
Sta
Ros
a
Co.
Neg
ro
Co
Col
orad
o
San
Car
los
Sierra de los Colorados
Oire
intr
usiv
eco
mpl
exA
ngas
taco
Fm
. (M
iddl
e-La
te M
ioce
ne)
Puc
arill
a Ig
nim
brite
(M
ioce
ne)
Que
brad
a de
los
Col
orad
os F
m. (
Olig
ocen
e (?
)-
Ear
ly M
ioce
ne)
Sta
Bár
bara
Sub
grou
p (P
aleo
cene
-Mid
dle
Eoc
ene)
Bal
buen
a S
ubgr
oup
(Maa
stric
htia
n)
Pirg
ua S
ubgr
oup
(Neo
com
ian-
Maa
stric
htia
n)
Met
amor
phic
bas
emen
t (P
reca
mbr
ian-
Pal
eozo
ic)
Gra
nite
s an
d gr
anod
iorit
es (
Late
Pro
tero
zoic
-
O
rdov
icia
n)
Pal
o P
inta
do F
m. (
Late
Mio
cene
-Ear
ly P
lioce
ne)
San
Fel
ipe
Fm
. (La
te P
lioce
ne)
Qua
tern
ary
allu
vial
dep
osits
Syn
clin
e
Ant
iclin
e
Cro
ss-s
ectio
nS
trat
igra
phic
sec
tion
Thr
ust f
ault
Str
ike
and
dip
Salta GroupPayogastilla Group
(a)
(b)
Fig.2.
(a)G
eologicaland
structuralmap
ontheAng
astaco
basinarea
(mod
i¢ed
afterG
rier,1990;Hongn
etal.,1999).(b)S
ection
acrosstheAng
astaco
basinarea.For
location
anduseofshadingand
patterns,see
Fig.2a.
r 2006 The Authors. Journal compilationr 2006 Blackwell Publishing Ltd,Basin Research, 18, 1^26 5
Propagation of orographic barriers along an active range front

AnS4
AnS5
AI1
Cc1
Cc2
Cc3
Cc4
Cc5
Cc6
Cc7
Cc8
Cc9
Cc10
Cc11
Cc12
Cc13
Cc14
Cc15
AI6
AI9
AI11
AnS6
AnS9
AnS13
AnS14
AnS15AI13
AI16
AI18
AnS17
AnS19
Cc16
Cc17
Cc18
Cc19
Cc20
Cc21
AnS28
AI23
AI25
AI26
AI28AI29
AI35
AnS30
AnS32
AN
GA
STA
CO
FM
.
AN
GA
STA
CO
FM
.
PAL
O P
INTA
DO
FM
.
QBA DE LOS COLORADOS
AnS22~14.3±1a
~9±1c
13.4±0.4b
5.27±0.28d
SAN FELIPE FM.
500 m
2500 m
4500 m
5000 m
5500 m
6000 m
3000 m
3500 m
4000 m
1000 m
1500 m
2000 m
Mudstones
Sandstones
Conglomerates
Gravel and pebble lenses
Conglomeratic channel
Ashes
1 2 3 4 5 6 1 2 3 4 5 6
1 2 3 4 5 6
Granulometry 1- Clay2- Fine-grained sandstone3- Medium-grained sandstone4- Coarse-grained sandstone5- Gravels6- Pebbles
Fig. 3. Stratigraphic column of the lateNeogene sedimentary ¢ll of the Angastaco basin measured in the ¢eld (this study). Symbols areas follows: white stars indicate detrital apatite ¢ssion-track samples; grey squares, sandstone petrography samples; white squares, clastcounts in conglomeratic layers. a, age of the bottom of the Angastaco Fm., calculated from b and c assuming a constant sedimentationrate; b, CorteElCan� on tu¡dated by
39Ar/40Ar on biotite (Grier&Dallmeyer,1990); c,mammal fossils (Marshall etal.,1983); d, 206Pb/238Uzircon age (this study).
r 2006 The Authors. Journal compilationr 2006 Blackwell Publishing Ltd,Basin Research, 18, 1^266
I. Coutandet al.

sensitivities forPb andUwere determined on reference zir-con AS-3 (Paces &Miller, 1993) using a calibration techni-que similar to Compston et al. (1984). Th and U contentswere calculated from 232Th16O1/94Zr2O
1 and 238U16O1/94Zr2O
1 with relative sensitivities calibrated on referencezircon 91500 (Wiedenbeck et al., 1995), and are reported inTable1. 206Pb/238Uageswere calculated from theU^Pb iso-topic ratios by linear regression and by computing theweighted average of individual results as outlined inSchmitt et al. (2002). In both calculation schemes, a com-mon 207Pb/206Pb typical for anthropogenic sources wasused (e.g. San� udo-Wilhelmy&Flegal, 1994). Both methodsyield ages that are in close agreement: 6.16� 0.42Ma(mean square of weighted deviates MSWD5 8.4) and5.76� 0.42Ma (MSWD5 5.1; uncertainties at the 95%con¢dence levels with errors scaled by the square root ofMSWD). The consideration that zircons from an earliermagmatic phase could be present in the sample led us toexclude some of the older zircon results (open symbols inFig. 4,Table 1) and recalculate the ages for the younger zir-con population. Excluding three older grains signi¢cantlyreduces theMSWDtovalues close to one, andwe obtainedmodi¢ed age estimates forAI29,whichwere 5.29� 0.27Ma(intercept age) and 5.27� 0.28Ma (weighted average age;Fig. 4). These ages are thought to represent the time ofzircon crystallization in the magma that produced theAI29 ash.
SANDSTONE AND CONGLOMERATEMODAL PROVENANCE ANALYSES
Method
Provenance analyses on both sandstones and conglomer-ates were carried out in the Angastaco and Palo PintadoFormations in order to identify di¡erent source terrainsand to relate possible upsection changes to source area re-organization through time (e.g. Ingersoll et al., 1984).Thir-
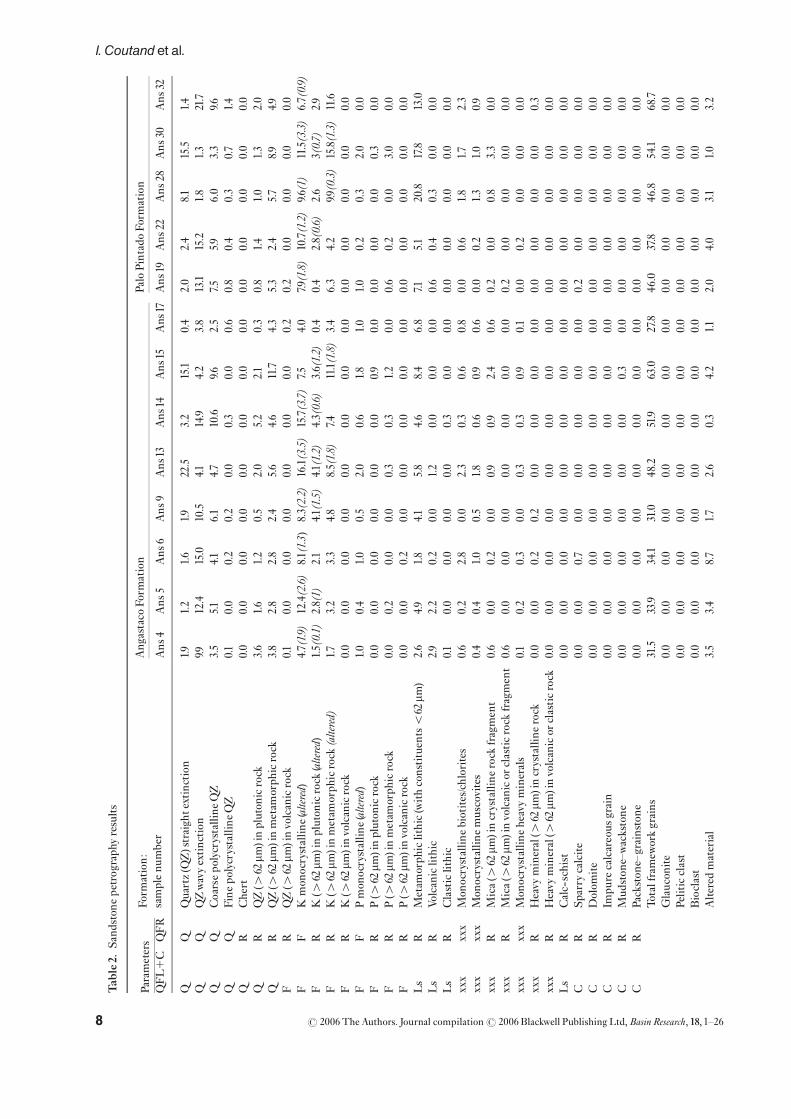
teen sandstones indicated in Fig. 3 were analysed using theGazzi^Dickinson method (G^D) (Gazzi,1966; Dickinson,1970). All constituents, and at least 250 framework grains,were counted in thin sections following well-establishedcounting procedures (Valloni, 1985; DiGiulio, 1990). Weused a detailed counting form (Table 2) in order to re-cal-culate and present the data according to both theG^D andthe Folk methods (Folk, 1968; Basu, 1976) following theprocedure proposed by DiGiulio and Valloni (1992).Table2 contains detailed information on the framework cate-gories (quartz, feldspars and rock-lithic fragments) de¢n-
0 500 1000 1500 2000 2500 30000.0
0.2
0.4
0.6
0.8
1.0
3451015
AI29
intercept age: 5.29±0.27 Ma (95% confidence, MSWD = 0.9)
age
[Ma]
4.5
5.0
5.5
6.0
6.5
7.0individual 207Pb-corrected ages
w.m.: 5.27±0.28 Ma (95% confidence, MSWD = 0.8)
207 P
b/2
06P
b
238U/206Pb
Fig.4. 207Pb/206Pb vs. 238U/206Pb of AI29 zircons (uncorrectedfor common Pb; error bars 1s). Xenocrystic zircon g9 (Table1)has been omitted for clarity. Also note that three apparently olderzircons (open symbols) have been excluded in the regression.Theregression age is obtained from intersection of concordia(modi¢ed for disequilibrium assuming initial activity ratio230Th/238U5 0.15) from linear extrapolation throughuncorrected datawith a ¢xed intercept (207Pb/206Pb5 0.83). Insetshows individual 207Pb-corrected ages and the weighted averageage fromyounger zircon population (n5 7; solid symbols).
Table1. ZirconU^Pb results for ash AI29
Analysis
206Pbn/238U� 10� 3
206Pbn/238U1SE� 10� 3
207Pbn/235U� 10� 3
207Pbn/235U1SE� 10� 3
Correlationof concordiaellipses
207Pb corrected.disequilibriumcorrected 206/238 aget (Ma)
1st (Ma)
Radio-genic(%)
U(p.p.m.)
Th(p.p.m.)
AI29-g1 0.9283 0.043 16.34 1.06 0.26 5.42 0.28 89.6 270 275AI29-g2 0.9161 0.0395 20.42 3.06 0.56 5.11 0.31 85.2 535 360AI29-g3 0.9709 0.0262 8.413 0.442 0.85 6.21 0.21 97.9 2164 827AI29-g4 0.8209 0.0504 8.226 1.1 0.89 5.18 0.33 96.6 376 295AI29-g5 0.8393 0.0571 6.765 0.748 0.85 5.42 0.37 98.4 2113 463AI29-g6 0.8631 0.0499 8.23 0.608 0.50 5.49 0.32 97.1 1113 518AI29-g7 0.7757 0.032 6.207 0.572 0.78 5.01 0.21 98.5 1229 674AI29-g8 0.9032 0.0639 6.428 0.503 0.78 5.87 0.41 99.3 4868 2095AI29-g9 143 2 1404 26.2 0.78 858 28 99.5 1068 120AI29-g10 1.005 0.0156 6.53 0.146 0.83 6.54 0.22 99.9 9436 7407AI29-g11 0.9518 0.0186 6.655 0.37 ^0.10 6.18 0.20 99.4 1581 936
r 2006 The Authors. Journal compilationr 2006 Blackwell Publishing Ltd,Basin Research, 18, 1^26 7
Propagation of orographic barriers along an active range front
Tab
le2.
Sand
ston
epetrographyresults
Parameters
Form
ation:
samplenu
mber
Ang
astaco
Form
ation
PaloPintadoForm
ation
QFL
1C
QFR
Ans
4Ans
5Ans
6Ans
9Ans
13Ans
14Ans
15Ans
17Ans
19Ans
22Ans
28Ans
30Ans
32
Quartz(Q
Z)straightextinction
1.91.2
1.6
1.922.5
3.2
15.1
0.4
2.0
2.4
8.115.5
1.4
QZwavyextinction
9.912.4
15.0
10.5
4.114.9
4.2
3.8
13.1
15.2
1.8
1.3
21.7
Coarsepo
lycrystalline
QZ
3.5
5.14.1
6.1
4.7
10.6
9.62.5
7.55.9
6.0
3.3
9.6Q
QFine
polycrystalline
QZ
0.1
0.0
0.2
0.2
0.0
0.3
0.0
0.6
0.8
0.4
0.3
0.7
1.4
QR
Chert
0.0
0.0
0.0
0.0
0.0
0.0
0.0
0.0
0.0
0.0
0.0
0.0
0.0
QR
QZ(4
62mm
)inpluton
icrock
3.6
1.6
1.2
0.5
2.0
5.2
2.1
0.3
0.8
1.4
1.0
1.3
2.0
QR
QZ(4
62mm
)inmetam
orph
icrock
3.8
2.8
2.8
2.4
5.6
4.6
11.7
4.3
5.3
2.4
5.7
8.9
4.9F
RQZ(4
62mm
)involcanicrock
0.1
0.0
0.0
0.0
0.0
0.0
0.0
0.2
0.2
0.0
0.0
0.0
0.0
FF
Kmon
ocrystallin
e(altered)
4.7(1.9)
12.4(2.6)
8.1(1.3)
8.3(2.2)
16.1(3.5)
15.7(3.7)
7.54.0
7.9(1.8)
10.7(1.2)
9.6(1)
11.5(3.3)
6.7(0.9)
FR
K(4
62mm
)inpluton
icrock
(altered)
1.5(0.1)
2.8(1)
2.1
4.1(1.5)
4.1(1.2)
4.3(0.6)
3.6(1.2)
0.4
0.4
2.8(0.6)
2.6
3(0.7)
2.9
FR
K(4
62mm
)inmetam
orph
icrock
(altered)
1.73.2
3.3
4.8
8.5(1.8)
7.411.1(1.8)
3.4
6.3
4.2
9.9(0.3)
15.8(1.3)
11.6
FR
K(4
62mm
)involcanicrock
0.0
0.0
0.0
0.0
0.0
0.0
0.0
0.0
0.0
0.0
0.0
0.0
0.0
FF
Pmon
ocrystallin
e(altered)
1.0
0.4
1.0
0.5
2.0
0.6
1.8
1.0
1.0
0.2
0.3
2.0
0.0
FR
P(4
62mm
)inpluton
icrock
0.0
0.0
0.0
0.0
0.0
0.0
0.9
0.0
0.0
0.0
0.0
0.3
0.0
FR
P(4
62mm
)inmetam
orph
icrock
0.0
0.2
0.0
0.0
0.3
0.3
1.2
0.0
0.6
0.2
0.0
3.0
0.0
FR
P(4
62mm
)involcanicrock
0.0
0.0
0.2
0.0
0.0
0.0
0.0
0.0
0.0
0.0
0.0
0.0
0.0
Ls
RMetam
orph
iclithic(withconstituentso62
mm)
2.6
4.91.8
4.15.8
4.6
8.4
6.8
7.15.1
20.8
17.8
13.0
Ls
RVolcaniclithic
2.9
2.2
0.2
0.0
1.2
0.0
0.0
0.0
0.6
0.4
0.3
0.0
0.0
Ls
RClasticlithic
0.1
0.0
0.0
0.0
0.0
0.3
0.0
0.0
0.0
0.0
0.0
0.0
0.0
xxx
xxx
Mon
ocrystallin
ebiotites/chlorites
0.6
0.2
2.8
0.0
2.3
0.3
0.6
0.8
0.0
0.6
1.8
1.72.3
xxx
xxx
Mon
ocrystallin
emuscovites
0.4
0.4
1.0
0.5
1.8
0.6
0.9
0.6
0.0
0.2
1.3
1.0
0.9
xxx
RMica(4
62mm
)incrystalline
rock
fragment
0.6
0.0
0.2
0.0
0.9
0.9
2.4
0.6
0.2
0.0
0.8
3.3
0.0
xxx
RMica(4
62mm
)involcanicor
clasticrock
fragment
0.6
0.0
0.0
0.0
0.0
0.0
0.0
0.0
0.2
0.0
0.0
0.0
0.0
xxx
xxx
Mon
ocrystallin
eheavyminerals
0.1
0.2
0.3
0.0
0.3
0.3
0.9
0.1
0.0
0.2
0.0
0.0
0.0
xxx
RHeavy
mineral(4
62mm
)incrystalline
rock
0.0
0.0
0.2
0.2
0.0
0.0
0.0
0.0
0.0
0.0
0.0
0.0
0.3
xxx
RHeavy
mineral(4
62mm
)involcanicor
clasticrock
0.0
0.0
0.0
0.0
0.0
0.0
0.0
0.0
0.0
0.0
0.0
0.0
0.0
Ls
RCalc-schist
0.0
0.0
0.0
0.0
0.0
0.0
0.0
0.0
0.0
0.0
0.0
0.0
0.0
CR
Sparry
calcite
0.0
0.0
0.7
0.0
0.0
0.0
0.0
0.0
0.2
0.0
0.0
0.0
0.0
CR
Dolom
ite
0.0
0.0
0.0
0.0
0.0
0.0
0.0
0.0
0.0
0.0
0.0
0.0
0.0
CR
Impu
recalcareous
grain
0.0
0.0
0.0
0.0
0.0
0.0
0.0
0.0
0.0
0.0
0.0
0.0
0.0
CR
Mud
ston
e^wackstone
0.0
0.0
0.0
0.0
0.0
0.0
0.3
0.0
0.0
0.0
0.0
0.0
0.0
CR
Packston
e^grainstone
0.0
0.0
0.0
0.0
0.0
0.0
0.0
0.0
0.0
0.0
0.0
0.0
0.0
Totalframew
orkgrains
31.5
33.9
34.1
31.0
48.2
51.9
63.0
27.8
46.0
37.8
46.8
54.1
68.7
Glaucon
ite0.0
0.0
0.0
0.0
0.0
0.0
0.0
0.0
0.0
0.0
0.0
0.0
0.0
Peliticclast
0.0
0.0
0.0
0.0
0.0
0.0
0.0
0.0
0.0
0.0
0.0
0.0
0.0
Bioclast
0.0
0.0
0.0
0.0
0.0
0.0
0.0
0.0
0.0
0.0
0.0
0.0
0.0
Alte
redmaterial
3.5
3.4
8.7
1.72.6
0.3
4.2
1.12.0
4.0
3.11.0
3.2
r 2006 The Authors. Journal compilationr 2006 Blackwell Publishing Ltd,Basin Research, 18, 1^268
I. Coutandet al.

Tab
le2.
(Con
tinu
ed)
Parameters
Form
ation:
samplenu
mber
Ang
astaco
Form
ation
PaloPintadoForm
ation
QFL
1C
QFR
Ans
4Ans
5Ans
6Ans
9Ans
13Ans
14Ans
15Ans
17Ans
19Ans
22Ans
28Ans
30Ans
32
Authigenicmineralin
unkn
owngrain
0.0
0.0
0.2
0.7
0.3
0.0
0.0
0.0
0.0
0.0
0.0
0.0
0.0
Poreinun
know
ngrain
0.3
0.2
0.0
0.0
0.0
0.0
0.0
0.0
0.0
1.2
0.0
0.0
0.3
Coarsesilt
0.9
0.8
1.8
2.0
1.2
0.0
1.2
0.8
1.6
4.0
3.9
3.6
0.3
Siliciclasticmatrix
3.8
6.9
12.7
4.4
2.6
13.5
1.5
2.2
4.7
9.14.9
3.3
6.4
Carbonatematrix
0.0
0.0
0.7
0.2
1.5
0.3
0.6
0.0
0.0
0.0
0.0
0.0
0.0
Qzcement
0.0
0.0
0.0
0.0
0.0
0.0
0.0
0.0
0.0
0.0
0.0
0.0
0.0
Phyllosilicatecement
10.6
7.722.4
2.6
7.35.2
8.7
4.0
6.9
4.4
0.8
1.3
3.8
Carbonatecement
0.1
0.0
2.1
2.4
1.8
0.3
1.2
0.0
0.0
0.0
0.0
0.0
0.3
Othercements
0.0
0.0
0.0
0.0
0.0
0.0
0.0
0.0
0.0
0.0
0.0
0.0
0.0
Interg
ranu
larpo
rosity
40.8
31.2
1.3
41.8
0.0
6.6
0.0
61.9
30.4
24.8
17.1
0.0
7.0Calciticovergrow
th0.0
0.0
3.5
0.2
0.3
0.0
0.0
0.0
0.0
0.0
0.0
0.0
0.0
Oversized
pore
0.0
0.0
0.0
0.0
0.0
0.0
0.0
0.0
0.0
0.0
0.0
0.0
0.0
Totalrock
100
100
100
100
100
100
100
100
100
100
100
100
100
QFL
Q61
4759
5050
5455
4455
5435
3755
F24
3935
4141
3934
3230
3534
4228
Ls1
C15
146
99
711
2415
1132
2117
Average
1standarddeviation
Q53
610
45F
356
634
Ls1
C12
68
21QFR
Q40
3849
4340
4036
2643
4624
2445
F44
4744
4851
5453
5141
4345
5638
R17
147
99
711
2415
1131
2017
Average
1standarddeviation
Q39
712
34F
494
745
R12
68
21Finelithics
Lm
Fine
QZ
1.15.3
1.4
xxx
3.2
5.8
xxx
xxx
1.15.1
2.9
4.3
xxx
Lm
Chert
0.0
0.0
6.9
xxx
0.0
0.0
xxx
xxx
0.0
0.0
0.0
0.0
xxx
Lm
Radiolarite
0.0
0.0
0.0
xxx
0.0
0.0
xxx
xxx
0.0
0.0
0.0
0.0
xxx
Lm
Quarzite
1.10.0
0.0
xxx
0.0
0.0
xxx
xxx
0.0
0.0
0.0
0.7
xxx
Lm
SchistQZ
1biotite
14.9
13.2
9.7xxx
19.4
25.6
xxx
xxx
10.6
7.65.7
17.0
xxx
Lm
SchistQZ
1biotite
1muscovite
1
feldspar
1heavymineral
8.5
52.6
16.7
xxx
14.5
24.4
xxx
xxx
16.2
11.4
27.1
14.2
xxx
Con
tinu
ed
r 2006 The Authors. Journal compilationr 2006 Blackwell Publishing Ltd,Basin Research, 18, 1^26 9
Propagation of orographic barriers along an active range front

Tab
le2.
(Con
tinu
ed)
Parameters
Form
ation:
samplenu
mber
Ang
astaco
Form
ation
PaloPintadoForm
ation
QFL
1C
QFR
Ans
4Ans
5Ans
6Ans
9Ans
13Ans
14Ans
15Ans
17Ans
19Ans
22Ans
28Ans
30Ans
32
Lm
Phyllite
1.115.8
9.7xxx
6.5
4.7
xxx
xxx
12.3
34.2
17.1
40.4
xxx
Lm
Fine
micaschist(o32
mm)
0.0
0.0
2.8
xxx
1.6
3.5
xxx
xxx
1.10.0
2.9
1.4
xxx
Lm
SchistQZ
1muscovite
16.0
10.5
20.8
xxx
24.2
33.7
xxx
xxx
31.8
15.2
30.0
14.9
xxx
Lm
SchistQZ
1muscovite
1heavymineral
1.12.6
15.3
xxx
29.0
2.3
xxx
xxx
25.1
17.7
14.3
5.0
xxx
Lm
SchistQZ
1epidot
1chlorite
1ph
illosilicate
0.0
0.0
0.0
xxx
0.0
0.0
xxx
xxx
0.0
0.0
0.0
0.0
xxx
Lm
Chlorite
Schist
0.0
0.0
0.0
xxx
0.0
0.0
xxx
xxx
0.0
0.0
0.0
0.0
xxx
Lv
Volcanics(crystalline
matrix)
43.6
0.0
13.9
xxx
0.0
0.0
xxx
xxx
1.78.9
0.0
2.1
xxx
Lv
Glass
0.0
0.0
0.0
xxx
0.0
0.0
xxx
xxx
0.0
0.0
0.0
0.0
xxx
Lv
Acidvolcanics
0.0
0.0
1.4
xxx
0.0
0.0
xxx
xxx
0.0
0.0
0.0
0.0
xxx
Lv
Middle-basicvolcanics
0.0
0.0
1.4
xxx
0.0
0.0
xxx
xxx
0.0
0.0
0.0
0.0
xxx
Lv
Pyroclastics
0.0
0.0
0.0
xxx
0.0
0.0
xxx
xxx
0.0
0.0
0.0
0.0
xxx
Ls
Argillite
0.0
0.0
0.0
xxx
0.0
0.0
xxx
xxx
0.0
0.0
0.0
0.0
xxx
Ls
Siltston
e0.0
0.0
0.0
xxx
0.0
0.0
xxx
xxx
0.0
0.0
0.0
0.0
xxx
Ls
Calcsiltston
e0.0
0.0
0.0
xxx
0.0
0.0
xxx
xxx
0.0
0.0
0.0
0.0
xxx
CMud
ston
e^wackstone
0.0
0.0
0.0
xxx
0.0
0.0
xxx
xxx
0.0
0.0
0.0
0.0
xxx
CDolom
ite
0.0
0.0
0.0
xxx
0.0
0.0
xxx
xxx
0.0
0.0
0.0
0.0
xxx
CSp
arry
calcite
0.0
0.0
0.0
xxx
0.0
0.0
xxx
xxx
0.0
0.0
0.0
0.0
xxx
CPackston
e-grainstone
0.0
0.0
0.0
xxx
0.0
0.0
xxx
xxx
0.0
0.0
0.0
0.0
xxx
Totalaph
aniticgrains
100
100
100
xxx
100
100
xxx
xxx
100
100
100
100
xxx
Lm^L
v^Ls1
CLm
49100
82xxx
98100
xxx
xxx
9891
100
98xxx
Lv
510
18xxx
00
xxx
xxx
29
02
xxx
Ls1
C0
00
xxx
20
xxx
xxx
00
00
xxx
Italicnu
mbersinbracketscorrespo
ndto
alteredgrains
ofthesamemineral.
r 2006 The Authors. Journal compilationr 2006 Blackwell Publishing Ltd,Basin Research, 18, 1^2610
I. Coutandet al.

ing the parameters for the QFLs1C (G^D method) andthe QFR (Folk method) diagrams, respectively (Fig. 5aand b).Additional counting of the ¢ne lithic fraction (lithicgrainswith constituentso62mm)was also performed (Ta-ble 2). Only nine of the 13 samples provided results andonly two (Ans 20 and 32) had more than 100 ¢ne lithics.However, a qualitative description of the lithics is pro-vided, together with a ternary diagram (Lm^Lv^Ls1C;DiGiulio & Valloni, 1992), based on the available data (Fig.5c). Pebble composition was also analysed in the Payogas-tilla Group by counting at least100 pebbles at 25 countingstations in the ¢eld (Fig. 5d).
Results
The compositions of the Angastaco and Palo Pintado For-mations are feldspathic to feldspatho-lithic, with an in-creasing lithic component up sequence (R, Ls1C; Fig. 5aand b). The Lm^Lv^Ls1C diagram shows an increase ofmetamorphic and a corresponding decrease in volcanicclasts upsection (Fig. 5c). Metamorphic lithics are mainlyquartz-muscovite schist and phyllite, whereas volcaniclithics are altered and di⁄cult to di¡erentiate.
Clast count data re£ect an up-section increase in meta-morphic clasts vs. a decrease of granitic andvolcanic clastsupsection; volcanics are absent from Cc 11 upward (Fig.5d), in agreement with the sandstone petrography results.Finally, from the top of the Palo Pintado Formation andupsection, a minor (not re£ected in the plots), but diagnos-tic contribution of red sandstone and limestone clasts ofthe Cretaceous Salta Group is notable. Limited publishedpalaeocurrent data in the Angastaco and Palo Pintado For-mations indicate a source in the adjacent EC to the westand northwest (Sal¢ty et al., 1984; D|¤ az & MiserendinoFuentes, 1988) (Fig.1a and b).
The evidence of a source of volcanic detritus in thePuna interior is ambiguous because the volcanic lithiccontents of sandstones and conglomerates are very minoror absent. However, the feldspathic to feldspatho-lithiccomposition of the sandstones could represent a contam-ination from ignimbrites that are widespread on the Punaand/or an eolian contribution by airfall tu¡s (Figs1a and 3).Occasional volcanic lithics in the basal Angastaco Forma-tion and their eventual disappearance up-section suggestthat a morphological high acting as a barrier already ex-isted to thewest-northwest of the basin in themiddleMio-cene, preventing volcanic material from the Puna frombeing £uvially transported eastward (Fig.1a).
DETRITAL APATITE FISSION-TRACKTHERMOCHRONOLOGY
Fission-trackmethod
The majority of detrital ¢ssion-track studies to date haveutilized zircon ¢ssion-track analysis because this thermo-chronologic system is less susceptible to post-depositionalthermal overprinting (e.g. Hurford, 1986; Brandon et al.,1998). However, we have used apatite crystals because inthe study area, there has been too little Cenozoic exhuma-tion to expose signi¢cant volumes of young zircons(Andriessen & Reutter, 1994; Coutand et al., 2001; Deekenet al., 2004).
Fission-track thermochronology is based on the spon-taneous ¢ssion decay of 238U in uranium-bearing miner-als, which creates a linear damage zone (a ¢ssion track) inthe crystal lattice. For apatite, tracks begin to be retainedat temperatures below ca. 150^120 1C, depending on thecooling rate and the kinetic characteristics of the crystal(e.g. Green et al., 1985; Ketcham et al., 1999). Determining
F
Q
Ans4Ans14
Ans9
Ans6Ans5
Ans13
Ang19
Ans15Ans28Ang17
Ans30Ans22
Ans32
R Ls+C
Q
F
Ans30
Ans15Ans14
Ans4
Ang17
Ang19Ang22
Ang32
Ans28
Ans13-Ans9
Ans6
Ans5
(a) (b)
Fig. 5. Provenance discrimination diagrams. (a^c) Sandstone ternary diagrams (QFR, QFLs1C and LmLvLs1C) from point-counting analysis; rawdata for the calculation of speci¢c parameters are reported inTable 2. (d)Provenance discrimination diagram frompebble-counting analysis.
r 2006 The Authors. Journal compilationr 2006 Blackwell Publishing Ltd,Basin Research, 18, 1^26 11
Propagation of orographic barriers along an active range front

So
urc
e d
iscr
imin
atio
n f
rom
co
ng
lom
erat
es
Ang
asta
co F
orm
atio
nP
alo
Pin
tado
F
orm
atio
n
020406080100
San Felipe Formation
Gra
nite
Sye
nite
Met
amor
phic
(Pun
covi
scan
a ty
pe)
Peg
mat
ite
Qua
rtzi
te
Vol
cani
cs (
Sed
imen
tary
*)
Ang
asta
co F
orm
atio
n
Pal
o P
inta
do F
orm
atio
n
Ave
rage
Tren
d up
-sec
tion
Lm
Ls+
CLv
Ans
7
Ang
15
Ans
13
Ans
4
Ang
19Ans
30-A
ng17
Ans
28-
Ans
32
(c)
(d)
Fig.5.
Con
tinu
ed
r 2006 The Authors. Journal compilationr 2006 Blackwell Publishing Ltd,Basin Research, 18, 1^2612
I. Coutandet al.

the density of spontaneous ¢ssion tracks and the concen-tration of 238U yields a single-grain ¢ssion-track age (e.g.Naeser, 1976). Fission tracks are unstable features thatshorten (anneal) by thermal and time-dependent re-crys-tallization processes. Over geological timescales, signi¢ -cant track shortening occurs in £uorine-rich apatitebetween 60 and 110 1C (e.g. Laslett et al., 1987; Laslett &Galbraith, 1996; Donelick et al., 1999); this temperaturerange is called the partial annealing zone (PAZ) (Gleadow& Duddy, 1981; Green et al., 1986). At su⁄ciently low tem-peratures, both old and new tracks are fully retained in thecrystal, whereas at increasing temperatures within thePAZ, newly formed tracks are long and older tracks areprogressively shortened. Therefore, a track-length distri-bution is a measure of the time spent within and belowthe PAZ.
Interpretation of a ¢ssion-track data set in terms of aT^t path requires an integrated analysis of ¢ssion-trackage, track-length distribution and kinetic characteristics ofthe apatite grains.Thermal modelling programmes (Galla-gher, 1995; Ketcham et al., 2000) incorporate quantitativeannealing models for apatite crystals with di¡erent kineticcharacteristics (Laslett et al., 1987; Ketcham et al., 1999).
Twelve sandstone samples, �6^10 kg in weight, werecollected through the continuous �6200-m-thick An-gastaco section, with an average sample spacing of�600m (Table 3, Fig. 3). In the laboratory, bulk sampleswere crushed, washed, sieved and apatite crystals were se-parated using standard magnetic and heavy liquids meth-ods. Analytical details are presented inTable 3. About 100grains were dated per detrital sample (Tables 3 and 4). Foreach sample, ¢ssion-track grain-age (FTGA)distributionswere decomposed following the binomial peak- ¢t method(Galbraith &Green, 1990) incorporated into BINOMFITprogram (Brandon, 1992, 1996; for details see, Brandon,2002) to identify discrete populations (or components, P1to Pn). The ages within each component are by de¢nitionconcordant. Con¢ned track lengths were only measuredin crystals that were dated; the angles between the con-¢ned track and the C-crystallographic axis (C-axis pro-jected data) and the etch pit diameter (Dpar; Donelicket al., 1999) were also measured.
Results
The FTGA distributions typically show a large single-grain age span, from166 to 2Ma (Fig. 6), with central agesranging between 62.6 � 2.4 and 28.9� 2.5Ma (Table 3). Allsamples clearly fail the w2 test (Galbraith, 1981; Green,1981) with P(w2)5 0 (Table 3), indicating that FTGA dis-tributions are discordant and are a mixture of componentsor peak ages (Brandon, 1992, 1996). All observed FTGAdistributions were decomposed into their main grain-agecomponents or peaks andyielded three to ¢ve componentsper sample (P1, . . . , Pn from the youngest to the oldestpeak,Table 4). Assignment of each FTGA component to adetritalDn path (Ruiz etal., 2004) or trend and consequentinterpretations are presented below.
Con¢ned track-lengths and Dpar measurements wereobtained from the greatest possible number of datedgrains.UsingBINOMFIT, each singular dated grain, tracklength and Dpar measurement was assigned to a speci¢cpeak age. Thus, we obtained representative track-lengthdistributions for 14 peak ages (number of tracks 420 ex-cept in three cases), mainly from P4 and P5 (for details, seeTable 5), as expected from their older apparent ages, andhence higher ¢ssion-track density.The mean track lengthsdid not vary signi¢cantly throughout the sedimentary sec-tion (Table 5, Fig. 7); values ranged between 11.55 � 0.31and12.93 � 0.26mm.There was no clear trend in the meantrack-length vs. stratigraphic position (Fig. 7). All popula-tions yielded similar Dpar values of 1.64^1.94mm (Table 5),suggesting that all populations contained monocomposi-tional apatites with similar low resistance to annealing.
EVIDENCE AGAINST THERMALRESETTING
The interpretation of detrital apatite FTages depends onwhether the ages have been partially reset by post-deposi-tional burial and reheating.We are particularly concernedabout this problem because of the large thickness of thesampled sedimentary sequence (46000m). However, forthe following reasons, our observations argue stronglyagainst signi¢cant post-depositional annealing:
(1) All the FTGA distributions are discordant; evenwith multiple ages, there could still be a possibility thatless retentive grains have been selectively reset and giveyounger peak ages (Garver et al., 1999). However, all popu-lations have apatites with similar kinetic characteristics(Table 5), ruling out this possibility. (2) All resolvable peakages in the distributions are older than the depositionalage (Table 4); furthermore, very young age peak recur-rently appear close to the depositional age but neveryounger than it. (3) Both the central ages and the peak agesincrease systematically down-section, whereas partiallyannealed samples would show the opposite (Tables 3 and4). (4) Finally, progressive burial heating should be ex-pressed as a decrease in the mean track-lengthwith depth;however, such a variation was absent (Table 5 and Fig. 7).These observations indicate that the detrital grain agesre£ect cooling in the source area because partial annealingdue to burial reheating during the sedimentary ¢lling ofthe Angastaco basin did not occur as intensely as expectedfor such a thick preserved sedimentary section.Two possi-ble explanations for this unanticipated result include: (1)the e¡ective geothermal gradient in the basinwas reducedbecause of the e¡ects of rapid sedimentation and topogra-phically driven groundwater recharge (Garven, 1989;Deming et al., 1990; Willett et al., 1997); and (2) complexstructural and depositional geometries lead to depocentremigration, preventing the base of the section from beingburied beneath the full stratigraphic thickness. Below, weexplore both of these possibilities.
r 2006 The Authors. Journal compilationr 2006 Blackwell Publishing Ltd,Basin Research, 18, 1^26 13
Propagation of orographic barriers along an active range front

Tab
le3.
Apatite¢ssion
trackdatafrom
Ang
astaco
basin
Sample
Location
Stratigraphic
unit
Cum
ulative
thickn
ess(m)
Num
bero
fgrains
(N)
Spon
taneou
sr s�
106cm�2
(Ns)
Indu
ced
r i�
106cm�2
(Ni)
Dosim
eter
r d�
106cm
-2
(Nd)
P(w2)
(%)
Central
age�
1s(M
a)Latitu
deLon
gitude
(1S)
(1W)
AI1
25141.584
66110.0670
Ang
astaco
Fm.
096
1.0114
(5456)
3.0767
(16598)
1.0843
(5261)
062.6�
2.4
AI6
25141.104
66109.1350
Ang
astaco
Fm.
601.7
110
1.1698(7165)
4.1051(25144)
1.0932
(5261)
056.7�
2.7
AI9
25141.409
66108.6860
Ang
astaco
Fm.
1066.4
910.8359
(3636)
2.8289
(12305)
1.1022(5261)
059.6�
2.5
AI11
25141.4400
66108.1780
Ang
astaco
Fm.
1620.3
100
0.7919
(5623)
2.7905
(19813)
1.1111(5261)
053.9�
2.3
AI13
25141.9600
66107.6970
Ang
astaco
Fm.
2235.9
480.5577
(1653)
2.2674
(6720)
1.1179(5261)
047.2�
3.0
AI16
25142.7800
66107.5190
Ang
astaco
Fm.
3280.3
115
0.9432
(8542)
3.1059(28128)
1.1335(5261)
059.4�
2.4
AI18
25141.2820
66106.2610
Ang
astaco
Fm.
3945.5
100
0.6655
(3413)
2.5634
(13146)
1.1447(5261)
052.4�
2.6
AI23
25140.4400
66105.5070
PaloPintadoFm.
4578.5
104
0.9746
(7015)
3.6268
(26104)
1.2604
(9321)
045.9�
3.6
AI25
25140.6030
66104.9790
PaloPintadoFm.
5077.3
970.6729
(3175)
3.708(174
96)
1.2869
(9321)
043.1�
2.4
AI26
25140.3130
66104.6540
PaloPintadoFm.
5508.5
101
0.5617
(3331)
3.5825
(21246)
1.3134
(9321)
038.4�
2.7
AI28
25140.4120
66104.3340
PaloPintadoFm.
6027.1
100
0.4183
(2697)
2.9695
(19146)
1.3399
(9321)
028.9�
2.5
AI35
25140.4320
66102.2140
SanFelip
eFm.
xxx
100
0.6567
(4691)
3.0718
(219
43)
1.3664
(9321)
048.4�
2.8
Notes:C
umulativestratigraphicthickn
essism
easuredfrom
thebo
ttom
oftheA
ngastaco
Fm.tothetopoftheP
aloPintadoFm.;N,num
bero
find
ividualgrainsd
ated
persam
ple;r s,spo
ntaneous
trackdensity
;Ns,nu
mbero
fspon
taneou
strackscoun
ted;
r i,ind
uced
trackdensity
inexternaldetector
(muscovite);N
i,nu
mbero
find
uced
tracks
coun
ted;r
d,indu
cedtrackdensity
inexternaldetector
adjacent
todosimetry
glass;N
d,nu
mbero
ftracks
coun
tedin
determ
iningr d
;P(w
2 ),w
2probability;Trackkeysoftware(D
unkl,2002)was
used
forcalculating
thecentral¢
ssiontrackages�
1s.A
patitealiquotsweremou
nted
inaralditeepoxyon
glassslides,groun
dand
polishedtoexpo
seinternalgrainsurfaces,thenetched
for20sin5.5MHNO3at211Ctorevealspon
taneous¢
ssiontracks.A
llmou
ntsw
ereprepared
usingtheexternal-detectorm
etho
d(H
urford
&Green,1983).Sam
plesand
CN-5
glassstandardsw
ereirradiated
with
thermalneutrons
inthewell-thermalized
OregonStateUniversity
reactor.After
theirradiation,thelow-U
muscovitedetectorsthatcoveredapatite
grainmou
ntsandglassdo
si-
meterwereetched
in40
%HFfor45minat211Ctorevealindu
ced¢ssion
tracks.Sam
pleswereanalysed
with
anOlympu
sBX61microscop
eat�
1250
magni¢cationwithadraw
ingtube
locatedaboveadigitizing
tabletanda
Kinetek
compu
ter-controlledstagedriven
bytheF
TStageprogramme(Dum
itru,1993).Fission
-track
ageswerecalculated
usingaw
eightedmeanzetacalib
ration
factor(H
urford
&Green,1983)basedon
IUGSagestandards
(Durango,F
ishCanyonandMou
ntDromedaryapatites)(M
illeretal.,1985,H
urford,1990).B
ased
on19
analyses,the
zvalue
forI.C
outand
is369.6�
5.1(�
1standard
error).
r 2006 The Authors. Journal compilationr 2006 Blackwell Publishing Ltd,Basin Research, 18, 1^2614
I. Coutandet al.

In a basin that is in a thermal steady state, the basal tem-perature is given by
T ¼ sumðziðQ=kiÞÞ þ T0 ð1Þ
where Q is the heat £ow (mWm� 2), ki is the thermal con-ductivity of a lithologic unit (Wm�1K�1), zi is the thick-ness of that unit and T0 is the mean surface temperature,taken to be10^15 1C.
Heat £ow data are not available in the study area; how-ever, an extensive study in Bolivia provides predictions fordi¡erent tectonic elements within the Central Andes(Springer & F˛rster, 1998), suggesting that the heat £ow intheEC is between 60 and40mWm� 2.Thermal conductiv-ity data are not available.Therefore, we consider a range ofplausible conductivities based on the literature values (e.g.Blackwell &Steele,1988).We subdivided theAngastaco ba-sin section into three units from bottom to top: sandstone(4200m), shale with subordinate sandstone (1500m) andsandstone (1100m). For these three units, we examinedthermal conductivities of 2.0^3.0, 1.4^2.3 and 2.0^3.0Wm�1K�1, respectively. At steady state, these para-meters implied basal temperatures between 107 and238 1C, far in excess of the maximum temperature re-quired to preserve the observed detrital thermochrono-
metric signal. This suggests that the Angastaco basin didnot reach a thermal steady state.
Transient e¡ects associated with rapid sedimentationcan depress the geothermal gradient in a sedimentary ba-sin (e.g. Deming et al., 1990). In the Angastaco basin, accu-mulation rates were 700 � 100mMa�1, which is rapid.Such transient e¡ects could allow for a slightly thicker ef-fective burial depth. Topographically driven groundwaterrecharge may also a¡ect the thermal structure of a basin,cooling proximal areas and heating more distal regions(Garven, 1989; Willett et al., 1997). This e¡ect could per-haps explain 10^20 1C of cooling; however, hydraulic datarequired to quantitatively test this hypothesis are lacking.
The stratal geometry in the Angastaco basin is poorlyconstrained by ¢eld observations because of lack of 3-Dexposure. However, the overall structural style of an east-ward-migrating deformation front observed in this areafavours syntectonic growth strata. In particular, in the ab-sence of an eastward migration of the depocentre, both thesubsidence and the exhumation rate of the basin would beextremely high. Therefore, it is plausible that depocentremigration prevented the sampled base of the section fromhaving been buried beneath the 6-km-thick section.
Although we cannot de¢nitively prove which of theseexplanations is more important, both arguments are con-
Table4. Best- ¢t age populations for apatite FTGA samples from the Angastaco basin
Sample
Strati-graphicage (Ma) N
FTagerange(Ma) P1 P2 P3 P4 P5 P6
AI 35 [3.4^1.6] 100 3.9^118.7 xxx 12.7 � 2.6/2.1 xxx xxx 50 � 3.3/3.1 82.7 � 7.0/6.420.1% 56.4% 23.5%
AI 28 5.6 100 2.6^110.9 6.6 � 1.4/1.2 xxx 22.5 � 2.9/2.6 xxx 60.9 � 3.8/3.6 xxx39.1% 20.3% 40.6%
AI 26 6.5 101 4.0^139.7 xxx 14.3 � 1.5/1.3 xxx xxx 53.2 � 3.5/3.3 103.9 � 20.6/17.241.3% 51.9% 6.9%
AI25 7.3 97 3.8^100.5 xxx xxx 20.6 � 3.2/2.8 45.6 � 20.5/14.1 75.7 � 20.0/15.9 xxx32.8% 44.0% 23.2%
AI23 8.3 104 3.9^154.3 9.9 � 1.5/1.3 xxx xxx xxx 70.8 � 6.1/5.7 123.2 � 56.1/38.640.5% 52.6% 6.9%
AI18 9.3 100 5.9^166.6 xxx 17.7 � 5.9/4.4 xxx 39.8 � 4.0/3.7 67.3 � 4.7/4.4 158.2 � 48.4/37.27.5% 41.2% 48.9% 2.4%
AI16 10.1 115 3.0^156.5 10.2 � 12.8/5.7 xxx 26.8 � 13.1/8.8 56 � 4.6/4.3 74 � 5.4/5.1 119.7 � 35.1/27.25.8% 6.3% 45.1% 39.8% 3%
AI13 11.4 48 14.3^102.3 xxx xxx 31.3 � 5.3/4.5 51.8 � 7.1/6.3 84.7 � 12.6/11.0 xxx39.9% 46.5% 13.6%
AI11 12.2 100 13.8^133.8 15.6 � 8.0/5.3 xxx 36.6 � 4.2/3.8 60.9 � 3.9/3.7 82.2 � 8.6/7.8 128.5 � 91.3/53.63.6% 33.0% 48.9% 13.5% 0.9%
AI9 12.9 91 21.0^158.8 xxx xxx 30.2 � 6.9/5.6 49.1 � 5.4/4.9 75.5 � 5.6/5.2 xxx10.4% 39.5% 50.2%
AI6 13.5 110 11.4^129.1 14.3 � 2.0/1.8 xxx 36.7 � 4.5/4.0 65.3 � 4.6/4.3 88.4 � 12.2/10.7 xxx12.4% 16.7% 54.0% 16.9%
AI1 14.3 96 15.4^147.0 xxx xxx 40.2 � 4.3/3.9 72.1 � 3.9/3.7 xxx 130 � 34.2/27.130% 68.7% 1.2%
Notes: Binomial peak- ¢t ages (P1^P6) were determinedwithBINOMFIT (Brandon,1996; 2002) and are indicated by their mean age � 2SE (equivalent to95% con¢dence interval; note that these intervals are asymmetric), followed by their relative abundance (%);N, total of grains counted.FTGA, ¢ssion-track grain age.
r 2006 The Authors. Journal compilationr 2006 Blackwell Publishing Ltd,Basin Research, 18, 1^26 15
Propagation of orographic barriers along an active range front
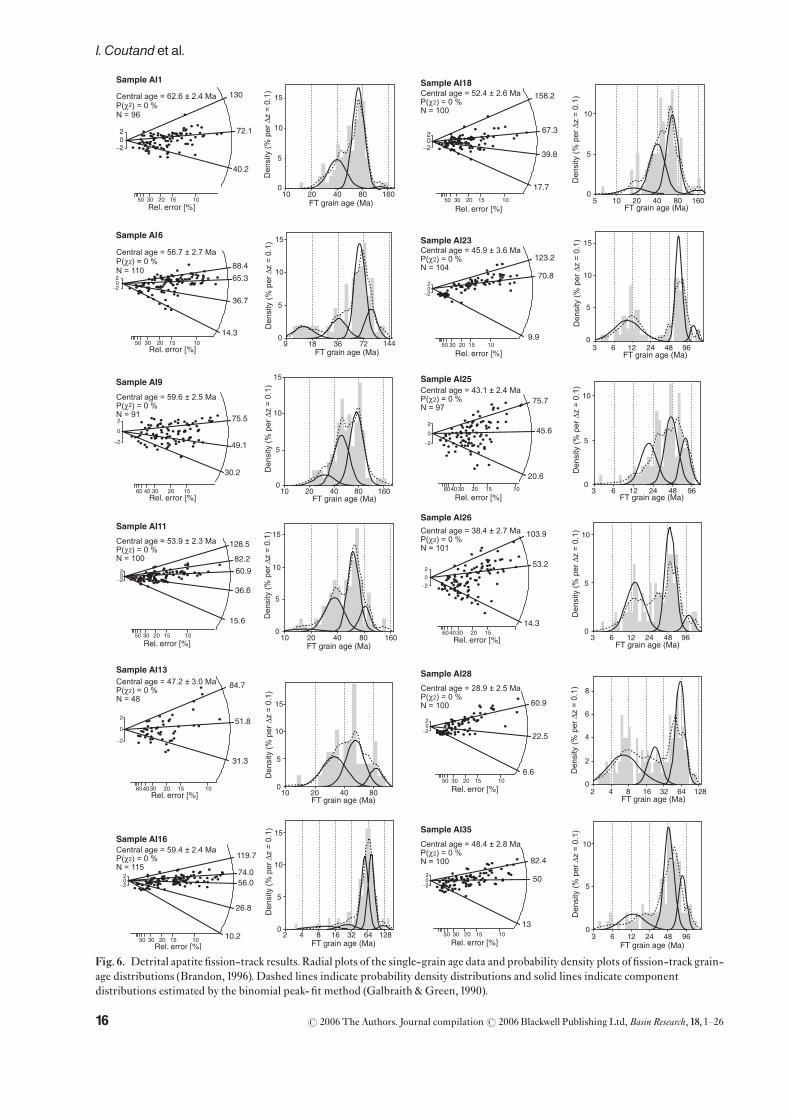
Fig. 6. Detrital apatite ¢ssion-track results.Radial plots of the single-grain age data and probability density plots of ¢ssion-track grain-age distributions (Brandon, 1996). Dashed lines indicate probability density distributions and solid lines indicate componentdistributions estimated by the binomial peak- ¢t method (Galbraith &Green, 1990).
r 2006 The Authors. Journal compilationr 2006 Blackwell Publishing Ltd,Basin Research, 18, 1^2616
I. Coutandet al.

sistent with the basic observation that the AFT data werenot signi¢cantly reset by burial during ¢lling of the basin.Hence, our data most likely re£ect the thermal history ofthe source terrains of the clastic material.
DETRITALTHERMOCHRONOLOGYANDHINTERLAND EVOLUTION
The distribution of detrital mineral cooling ages in sedi-ments can provide a record of the erosional exhumationof the hinterland source area. However, converting a cool-ing age extracted from a detrital sample into an exhuma-tion rate for the source area requires several majorassumptions that we brie£y discuss below (for a review,see Garver et al., 1999; Brewer et al., 2003; Ruiz et al., 2004).
The procedure used to derive the average exhumationrate of a hinterland source from a population of thermo-chronologic data collected through a reasonably well-dated sedimentary sequence is discussed by Garver et al.(1999). In summary, the average exhumation rate is givenby
dz=dt ¼ ððTc � TsÞ=ðdT=dzÞÞ=Dt ð2Þ
which is equivalent to
dz=dt ¼ Zc=Dt ð3Þ
whereTc is the closure temperature of the thermochron-ometer,Ts is the surface temperature, dT/dz is the geother-mal gradient,Dt is the lag time andZc is the closure depth.The lag time is de¢ned as the time elapsed between thetime of closure of a crystal for a given geochronologicalsystem in the source region and the time at which it is de-posited in the sedimentary basin. The assumption isusually made that the time taken by newly eroded detritusto be transported and then deposited in the sedimentarybasin is negligible compared with the time taken to reachthe surface (and be eroded) from the closure depth (Cer-veny et al., 1988; Garver et al., 1999; Ruiz et al., 2004).Thus,to be valid, the lag time concept implies that during theirtransit from the source to the basin, the detritus are notstored in transient depocentres during time periods longenough (ca. �1Ma) to bias their stratigraphic age in thebasin signi¢cantly. In addition, subsequent to deposition,recycling of non-reset sediments does not signi¢cantlymodify the initial stratigraphic age (Ruiz et al., 2004). Per-haps the most signi¢cant condition for the Angastaco ba-sin is that the detritus must have cooled from atemperature higher than the apatite ¢ssion-trackTc. If this
Table5. Mean-track length and related etch pit (Dpar) values obtained for di¡erent detrital age components
Sample Component
Peak age( � 95%CI)(Ma)
Numberof tracks
Mean tracklength(mm � 1s)
Mean tracklength STD(mm)
Dpar
(mm)Dpar STD(mm)
AI1 P4 72.1 � 3.9/3.7 78 12.3 � 0.17 1.46 1.71 0.12AI6 P3 36.7 � 4.5/4.0 13 12.2 � 0.32 1.16 1.74 0.07
P4 65.3 � 4.3/4.6 61 12.44 � 0.15 1.25 1.70 0.09P5 88.4 � 12.2/10.7 30 11.73 � 0.31 1.69 1.75 0.17
AI9 P5 75.5 � 5.6/5.2 33 11.72 � 0.27 1.55 1.71 0.12AI11 P4 60.9 � 3.9/3.7 22 11.55 � 0.31 1.45 1.69 0.15
P5 82.2 � 7.8/8.6 21 11.76 � 0.40 1.83 1.71 0.10AI16 P4 56.0 � 4.6/4.3 28 12.53 � 0.19 0.99 1.67 0.08
P5 74.0 � 5.4/5.1 75 11.83 � 0.18 1.60 1.64 0.09AI18 P4 39.8 � 4.0/3.7 20 12.88 � 0.28 1.26 1.94 0.42
P5 67.3 � 4.7/4.4 22 12.07 � 0.32 1.49 1.78 0.19AI23 P5 70.8 � 6.1/5.7 57 12.0 � 0.16 1.20 1.75 0.19AI25 P5 75.7 � 20.0/15.9 19 12.07 � 0.19 0.81 1.85 0.10AI26 P5 53.2 � 3.5/3.3 22 11.71 � 0.40 1.88 1.72 0.15
P6 103.9 � 20.6/17.2 17 12.12 � 0.41 1.68 1.92 0.14AI28 P5 60.9 � 3.8/3.6 43 12.93 � 0.26 1.68 1.75 0.16AI35 P5 50.0 � 3.3/3.1 24 12.62 � 0.36 1.76 1.79 0.19
P6 82.7 � 7.0/6.4 33 11.77 � 0.32 1.82 1.79 0.12
Dep
ositi
onal
age
(M
a)
0
2
4
6
8
10
12
14
16
0 2 4 6 8 10 12 14
Mean track-length (µm)
Fig.7. Mean track-length values plotted against depositional age(see alsoTable 5).
r 2006 The Authors. Journal compilationr 2006 Blackwell Publishing Ltd,Basin Research, 18, 1^26 17
Propagation of orographic barriers along an active range front

were not the case, detrital thermochronologic data col-lected could not be converted into exhumation rates forthe corresponding source regions.
For hinterland regions, our approach requires other as-sumptions. It is necessary to assume a steady geothermalgradient at the time of closure of the geochronological sys-tem, although the geothermal gradient at that time is nottrivial to derive (Garver etal.,1999). Isotherms are assumedto remain horizontal and particle paths toward the surfacevertical. The exhumation rate remains constant from thetime of closure to the time of deposition of the crystal.Hence, this approach neglects isotherm warping in thesource region caused by topography and advection (e.g.Stˇwe et al., 1994;Mancktelow &Grasemann, 1997; Braun,2002) as well as non-vertical displacements of particlesduring exhumation (Batt & Brandon, 2002). As long asthe spatial distribution of cooling ages within a sourcecatchment during a time increment remains di⁄cult todetermine (Brewer et al., 2003), quantifying exhumationrates from detrital thermochronologic data is fraughtwithuncertainty. Finally, the simplest model supposes that theexhuming topography is eroded principally from higherelevations and strictly in a vertical direction. In reality, thedrainage basin may cover a large range of elevations in thesource topography; thus, di¡erent peak ages identi¢ed inthe detrital sediments will not necessarily be derived fromdistinct source terrains but rather could be derived fromdi¡erent elevations within a single catchment (Garver etal., 1999). These restrictions imply that interpretation ofdetrital peak age provenance aswell as long-term exhuma-tion rates derived from them should always be treatedwithcaution.Nevertheless, detrital thermochronology remainsa valuable tool for constraining the cooling and exhuma-tion history of sources terrains partially or totally eroded.
INTERPRETATION OF THE ANGASTACOBASIN DETRITAL SIGNAL
Plotting the ¢ssion-track ages of a given componentvs. thestratigraphic ages of the host strata yields a graphical as-sessment of the lag time variability through the strati-graphic column and thus, through time (e.g. Ruiz et al.,2004), thereby providing information on the long-term ex-humation of the source region for that particular detritalage population (Fig. 8).The source-area signal of the prox-imal Angastaco foreland basin changes through time, forinstance because of sporadic drainage re-organization,and unlike Ruiz etal. (2004), we do not expect every sampleto contain the same number ofPn age components.Conse-quently, ourDn paths or trends are not de¢ned by automa-tically connecting individual components with the samen of each sample. Instead, we sorted the Pn componentssuch as they de¢ned geologically realistic processessmoothly evolving through time following aDn trend.
Here, we describe this population subdivision and sub-sequently interpret each path. In this dataset, lag time foreach path either remains constant or decreases upsection,
which is consistent with exhumation. Increasing lag timescould represent recycling of sediments. Althoughwe can-not exclude such a process, if it exists, the resulting signalappears to be hidden behind the dominant decreasing lagtime trend.
P1component
The ¢rst population (P1) had extremely short lag times(Fig. 8 and Table 4); ¢ve samples had cooling ages between15.6 and 6.6Ma and lag times between 0 and 4Ma.
A constant lag time approaching 0 re£ects either persis-tent and extremely rapid cooling and exhumation in thehinterland or volcanic contamination of the clasticmateri-al shed into the basin (Ruiz et al., 2004). The publishedapatite ¢ssion-track data set in the Andean hinterland atthese latitudes (e.g. Andriessen & Reutter, 1994; Coutandet al., 2001; Deeken et al., 2004; Carrapa et al., 2005) doesnot reveal any ages young enough to produce the detritalages in population P1, suggesting that rapid exhumationwas not the cause of this young age component. Alterna-tively, the hypothesis of volcanic contamination seemsplausible.The region contains numerous airfall tu¡s withsimilar ages (Strecker et al., 1989; Grier & Dallmeyer, 1990;Muruaga, 2001a, b) (Fig. 3). The P1 population is presentfrom bottom to top of the stratigraphic section but spora-dically, as would be expected from episodic input of volca-nic ash into the basin.
P2 component
The next population, P2, contains only three samples withages between 17.7 and 12.7Ma, and similar lag times of 8^10Myr. It ¢rst appears at 9.3Ma; however, it is possiblethat the next older sample (�10Ma) contains some grainswith similar ages that have not been statistically distin-guished from the P1population.
The relatively constant lag time of 8^10Ma is character-istic for a constant, high erosion rate (Bernet et al., 2001;Ruiz et al., 2004) and likely representative of material thathas rapidly cooled through the entire apatite PAZ. For alagtime Dt5 8^10Myr, Tc5110� 5 1C, Ts515 1C, dT/dz5 25� 5 1C km�1, Eqn (2) yields a range of exhuma-tion rates of 0.3^0.6mmyr�1. This signal ¢rst appears at9^10Ma, suggesting that at this time either the ¢rst apa-tites exhumed from belowTc were exposed at the surfaceor that drainage reorganization, which ¢rst supplied thisdetritus to the basin, had occurred. One method to di¡er-entiate between these possibilities is to ascertain whetherapatites representing the exhumed PAZ are preserved inthe basin; this is discussed below (see P4). Alternatively,we can look for appropriate source areas in the vicinity ofthe basin. Palaeocurrent directions throughout the sectionsuggest sediment transport from the west (e.g. Starck &Anzo¤ tegui, 2001). The Cumbres de Luracatao, belongingto the EC (Figs 1a and 2a), is the most prominent range tothe west of the Angastaco basin and contains granite andgranodiorite of the Oire intrusive complex. Three AFTvertical pro¢les from the northern portion of this range
r 2006 The Authors. Journal compilationr 2006 Blackwell Publishing Ltd,Basin Research, 18, 1^2618
I. Coutandet al.

reveal reset AFTages between 16 and 20Ma over a com-bined elevation range of 2100m (Deeken et al., 2004). Asingle partially reset sample at high elevation de¢nes akink in the age^elevation curve and suggests that relativelyrapid exhumation commenced by 20Ma at ca. 0.4mmyr�1. At this exhumation rate, the ¢rst reset apatiteswouldhave been exposed at the surface at ca. 10Ma.The similarage range and exhumation rate observed at Cumbres deLuracatao and in the D2 trend suggests a genetic link.However, the youngest ages observed in the D2 path havenot yet been retrieved from bedrock samples.
P3 component
The third component (P3) had cooling ages between 40.2and 20.6Ma; D3 path is a ‘forward-moving peak’ with alag time that regularly decreases upsection from�25Myr at the bottom to �15Myr at the top (Fig. 8).Thiskind of pattern is generally interpreted as re£ecting anoverall increase in cooling rate in the source regionthrough time and is classically interpreted as being asso-ciated with a phase of orogenic growth (Garver et al.,1999). However, this statement is valid only if the ages re-corded by the apatite crystals re£ect cooling through theclosure temperature. For young, non-volcanic apatites,this hypothesis is likely correct; for older apatiteswithverylong lag times, and hence very slow cooling rates, this isprobably incorrect. In the case that the samples were fullyreset during the ultimate exhumation event, an exhuma-tion rate can be calculated using the same approach aswas applied forP2, resulting in 0.1^0.2mmyr�1at the baseand increasing to 0.2^0.3mmyr�1 at 5Ma. The lowestsample in theP3 population re£ects cooling during the in-terval from 40Ma (passing throughTc) to 14.3Ma (deposi-tion in the basin); the youngest sample in P3 re£ectscooling between 21 and 7.3Ma. Potential source areas withsimilar ages (e.g. 38� 3 to 29� 3Ma) have been dated inthe Chango Real Range, located ca. 100 km to the SSW
(Fig. 1a and b) (Coutand et al., 2001) and a single age of30.3 � 3.0 has been reported from Santa Rosa de Tastil(Quebrada del Toro) located ca. 100 km to the NNE (Fig.1a and b) (Andriessen & Reutter, 1994). Both localities arepart of the present-day EC.Although neither of these agesprovides an exact match to theP3 component, they suggestthat appropriate sources existed on the eastern £ank of theAndes. Cooling ages of 29 � 1 to 24 � 3Ma have been ob-tained from Sierra de Calalaste, in the southern Puna pla-teau to the west (Carrapa et al., 2005). A large suite of AFTdatawith ages between62 and30Ma characterizes theCor-dillera Domeyko in the Western Cordillera (Chile) (Mak-saev & Zentilli, 1999). However, the scarcity of volcanicmaterial within the Angastaco basin, which would be ex-pected from £uvial systems draining the Puna, strongly ar-gues against source areas on the far western side of theplateau. Although it has not yet been precisely identi¢edin the modern landscape, the source for theP3 componentmust be locatedwithin the present-day EC
P4 component
The fourth population,P4, contains a much broader rangeof cooling ages and a less well-de¢ned trend on the lagtime plot. Cooling ages range between 65.3 and 39.8Ma;this population disappears from the section above ca.7Ma. D4 is also a ‘forward-moving peak’; however, the lagtime decreases upsection in a complicated pattern, from�57Myr at the bottom to �30Myr at 9Ma (Fig. 8).Thestratigraphically youngest FTGA peak has a longer lagtime of 38Myr and an age of 45 � 21/14Ma (sample AI25,seeTable 4 and Fig. 8).The next older FTGA peak in thissample also has a very large error bar; the errors of thesetwo age clusters overlap. Therefore, we suspect that thepeak ages for this sample are poorly resolved and we donot consider them to be highly signi¢cant. More impor-tantly, no FTGA peaks for P4 are identi¢ed higher in thestratigraphic section (Fig. 8).This suggests two possibili-
Lagtime < 0 My
D1 D2 D3 D4 D5
0 10 20 30 40 50 60 70 80 90 100Detrital apatite fission track age (Ma)
0
5
10
15
Str
atig
raph
ic a
ge (
Ma)
0 My
5 My
20 My
30 My
40 My
50 My
60 My
70 My
80 My
90 My
10 My
Fig. 8. Evolution of the detrital paths (D1^D5) through the stratigraphic record. Error bars are � 2 SE for apatite FTages and � 1Mauncertainty for depositional ages. Dashed grey lines indicate iso-lag time lines. Symbols indicate binomial peak- ¢t ages extracted from themixedgrain age distributions (P1^P6, seeTable4 andFig.6) andgrey shaded boxes underline relateddetrital path tendency upsection (D1^D5).
r 2006 The Authors. Journal compilationr 2006 Blackwell Publishing Ltd,Basin Research, 18, 1^26 19
Propagation of orographic barriers along an active range front

ties: (1) the component representing this source area wasno longer deposited in the basin after ca. 9Ma, or (2) theD4 path became signi¢cantly younger at this time.The for-mer idea cannot be ruled out: similar ages are present inthe Sierra Famatina ca. 350 km to the south (Coughlinet al., 1998). However, 9Ma corresponds closely to the ¢rstappearance of the P2 component.Therefore, it is possiblethat the D4 path represents the exhumed PAZ that for-merly overlay the P2 source area.We link the latter sourcearea with rapid exhumation of Cumbres de Luracatao,commencing at ca. 20Ma. A single sample from the ex-humed PAZ that formerly overlay the range yielded an ageof 56� 2Ma (Deeken et al., 2004), ¢tting well with the agerange recorded by P4.The large scatter of ages within theD4 path is consistent with the exhumation of a PAZ, be-cause a variety of ages would be exposed within a narrowrange of elevation.The pronounced decrease in age upsec-tion in D4 is also more typical of exhumation through aPAZ.Therefore, we conclude that the proximal Cumbresde Luracatao is a likely source for the P4 component.
P5 component
The ¢fth component (P5) has cooling ages between 88.4and 50.0Ma. P4 and P5 together contribute between 50and 70% of the dated crystals (Table 4). D5 is a ‘forward-moving peak’ with ages and lag times decreasing upwardfrom 88 to 50Ma and 75 to 47Myr, respectively. Indeed,the rigorous de¢nition of a lag time applies to neitherthese samples nor the P4 component; the old ages and ex-tremely long lag times suggest that this material was de-rived from an exhumed PAZ that was slowly eroded ratherthan cooled through a closure temperatureTc. A verticalAFT pro¢le through Cerro Durazno, immediately west(Fig. 2a), yielded cooling ages between 95 and 52Ma (Dee-ken et al., 2004; A. Deeken, E.R. Sobel, I. Coutand, M.Haschke, U. Riller & M.R. Strecker, submitted). Track-length modelling of these samples indicates exhumationcommencing between12 and 7Ma (A.Deeken, E.R. Sobel,I. Coutand, M. Haschke, U. Riller & M.R. Strecker, sub-mitted). Similar ages between 93 � 5 and 42 � 2Ma werereported from Santa Rosa de Tastil at 241S (Coutand,1999). The similarity likely re£ects a common tectono-thermal history; however, the detritus in the basin wasmost likely derived from the adjacent Durazno range.Thesimilar age range of the P5 component and the adjacentCerroDurazno suggests that they represent the same (late)Cretaceous PAZ.
P6 component
The oldest population (P6) ranges between 158.2 and82.7Ma, with lag times between 150 and 80Myr. Most ofthese FTGA peaks represent a minor fraction of the datedcrystals (1^7%) and hence have quite large errors; how-ever, the youngest sample AI35 contains 23% of the detri-tal apatite (Table 4).There is a crude decrease in age and lagtime upsection (not represented in Fig. 8); however, withthe exception of the stratigraphically youngest sample,
this pattern is poorly resolved.There are several potentialsources for this minor component. One possibility is thePuna plateau, which includes old AFT source regions(Deeken et al., 2004; A. Deeken, E.R. Sobel, I. Coutand,M. Haschke, U. Riller & M.R. Strecker, submitted), butour sedimentary petrography data argue against this.Alternatively, the presently outcropping Cretaceous andPalaeogene strata could have provided a source for re-cycled detrital apatite with old ages.
DISCUSSION
Sandstone petrography and clast counts in conglomeratesidentify the EC as the main source of the detritus depos-ited in the intramontane Angastaco basin between 14.5and 5.5Ma. A cooling event starting in the late Eocene^Oligocene is clearly visible in the D3 detrital path. Thissource was exhumed until the Pliocene at a rate increasingfrom 0.1 to 0.3mmyr�1. Although the location of thesource area has not yet been identi¢ed, the existence ofmodern outcrops that yielded late Eocene to Oligocenerapid cooling AFTages (Andriessen & Reutter, 1994; Cou-tand et al., 2001) supports a provenance from the EC.Wepropose that this cooling event re£ects an early compres-sional episode in the eastern part of the Andean orogen.This event created enough topography to produce detritus(Fig. 9a). Detrital path D2 highlights faster exhumation oftheEC that initiated 20^18Myr ago and lasted at least untilthe Pliocene at a nearly constant rate between 0.3 and0.6mmyr�1. Palaeocurrent indicators (Starck & Anzo¤ te-gui, 2001), sandstone petrography and apatite ¢ssion-track data (Deeken et al., 2004; A. Deeken, E.R. Sobel, I.Coutand, M. Haschke, U. Riller & M.R. Strecker, sub-mitted) suggest that the adjacent Cumbres de Luracatao(Fig. 2a) was being exhumed and eroded at that time. Up-lift was accommodated by a north^south striking, west-dipping reverse fault on the eastern side of the range (Fig.2a). The evolution of the compressional Angastaco basinbeganwhen su⁄cient accommodation space had been cre-ated in the footwall of the Luracatao thrust to accumulateand preserve erosional products from this range and othersources. If our interpretation of the detrital pathD3 is cor-rect, and that a topography-creating exhumation event inthe EC commenced in the late Eocene^early Oligocene,then the former foreland basin must have been segmentedas itwas farther west in the Puna in the Sierra deCalalaste-Salar de Antofalla area (Carrapa etal., 2005). Subsidence inthe Angastaco basin accelerated at about 15Ma (Fig. 9b).Our sandstone petrographydata con¢rm that the EC musthave constituted an e⁄cient orographic barrier, because itwas able to prevent transport of detritus derived fromwidely outcropping volcanics of the Puna plateau into theAngastaco basin (Figs 1a, 5 and 9b). During sediment de-position between �15 and 9 � 1Ma, the climatic condi-tions are interpreted to have been arid (Starck &Anzo¤ tegui, 2001) as would be expected at this latitude (R.Alonso, B. Carrapa, I. Coutand, M. Haschke, G.E. Hilley,
r 2006 The Authors. Journal compilationr 2006 Blackwell Publishing Ltd,Basin Research, 18, 1^2620
I. Coutandet al.

W E
Condensation of Atlantic-derivedmoisture along the windward flankof the eastern Cordillera between ~ 9 −3.5 Ma
Condensation of Atlantic-derivedmoisture along the windward flankof the frontal uplifts from ~ 3.5 Ma
Stage 1 : 40-20 Ma
Stage 2 : 20-13 Ma
Stage 3 : 13-3.5 Ma
Stage 4 : 3.5 Ma to present
Eastern Cordillera
Eastern Cordillera
Runno, Durazno & Negro ranges
Pucara-Angastaco basin
Angastaco basin
Proto Eastern Cordillera(?)
Arid Wet
Arid WetSemi-arid
(a)
(b)
(c)
(d)
Fig.9. Cartoons illustrating the tectonic, topographic and climatic evolution of the Eastern Cordillera and Calchaqu|¤ valley at thelatitude of the Angastaco basin, during the last 40Myr.
r 2006 The Authors. Journal compilationr 2006 Blackwell Publishing Ltd,Basin Research, 18, 1^26 21
Propagation of orographic barriers along an active range front

E.R.Sobel,M.R. Strecker&M.H.Trauth, submitted).Thisassessment is also compatible with oxygen-isotope datafrom the Corral Quemado basin located further south, inthe Sierras Pampeanas province (Latorre et al., 1997).
During or right after the deposition of the AngastacoFormation, regional shortening shifted eastward, drivingthe exhumation of the Runno,Durazno andNegro Ranges(Figs 2a and 9c); this led to compartmentalization in thePucara and Luracatao valleys to the west, and the modernAngastaco basin to the east.The late Cretaceous AFTagesobtained by Deeken et al. (2004) and A. Deeken, E.R.Sobel, I. Coutand, M. Haschke, U. Riller &M.R. Strecker(submitted) across these ranges indicate that the magni-tude of exhumation is less than in the Luracatao Range.The increasing contribution of the D5 detrital populationto over 50% of the apatite fraction from sample AI16 (topof the Angastaco Formation, seeTable 4 and Fig. 3) and anincreased contribution of low-grade metamorphic detri-tus constituting these ranges (Fig. 5b) support the onset ofexhumation in the Runno, Durazno and Negro Rangesbetween13 and10Ma.
Depositional environments changed drastically betweenthe deposition of the Angastaco and Palo Pintado Forma-tions after about 9Ma (Fig. 3) (Marshall et al., 1983; Starck& Anzo¤ tegui, 2001).The Palo Pintado and basal San FelipeFormations contain a rich fossil mammal fauna, freshwatermollusc fossils, pollen, leaves and tree-trunk remnants (e.g.Anzo¤ tegui, 1998; Starck & Anzo¤ tegui, 2001), from which awarm, humid forested environment, similar to the presentforeland (e.g. Vergani & Starck, 1989; Starck & Vergani,1996), can be inferred for the late Miocene to early Plio-cene. In contrast, intramontane basins within the presentPuna record sustained aridity and evaporite deposition atthat time (Alpers&Brimhall,1988;Alonso etal.,1991;Alon-so,1992;Vandervoort etal.,1995).These observations docu-ment that between about 9 and 5Ma, the EC had reached athreshold elevation that forced precipitation from easterlysources, independent of global changes inferred from pa-laeo-temperatures (Starck & Anzo¤ tegui, 2001; R. Alonso,B. Carrapa, I. Coutand, M. Haschke, G.E. Hilley, E.R. So-bel, M.R. Strecker &M.H.Trauth, submitted) (Fig. 9c). Si-milar results were obtained from stable isotope analysis ofpalaeosols in the adjacent Santa Maria valley (Kleinert &Strecker, 2001) (Fig.1).
In the late Pliocene, during deposition of the upper partof the San Felipe Formation, major changes in provenanceand climatic conditions recurred. Palaeocurrent and pro-venance data indicating westward transport (Starck & An-zo¤ tegui, 2001) of sediments derived from the Sierra de losColorados to the east (Fig. 2a and b) mark the onset of ac-tivity along a N^S striking, east-dipping thrust faultbounding the western £ank of the Sierra.The uplift of thisrange (present-day elevation of 3500m) coincided with achangeover to arid conditions in the Angastaco basin andthe formation of calcretes sometime between 5.4 and2.4Ma (Fig. 9d), a scenario identical to the situation re-corded in the Santa Maria basin to the south (Fig. 1)(Strecker etal.,1989;Kleinert &Strecker, 2001).This envir-
onmental change was accompanied by the deformationand exhumation of the entire Angastaco sedimentary se-quence, the establishment of transient internal drainageconditions and the deposition of massive conglomerateswith inter¢ngered lacustrine sediments. In agreementwith Starck & Anzo¤ tegui (2001), we propose that the latePliocene uplift of the Sierras de los Colorados to the eastcreated an orographic barrier that subsequently led to thearidi¢cation of the Calchaqu|¤ valley, by forcing Atlantic-derived moisture to condense along the windward £ank ofthis then frontal foreland uplift (Fig.9d).
CONCLUSIONS
Sandstone petrography, structural and stratigraphic analy-sis combinedwith detrital thermochronology in the intra-montaneAngastaco basin provide valuable information onthe late Eocene to late Pliocene exhumation history of theeastern border of the Puna plateau and the successive es-tablishment of orographic barriers along the southeastern£ank of the Central Andes. Long-term exhumation ratesbased on detrital thermochronology revealed an increasefrom 0.1 to 0.3mmyr�1 from late Eocene^Oligocenethrough Pliocene. However, the Luracatao Range in theEC was exhumed at a nearly constant rate between 0.3and 0.6mmyr�1 from the early Miocene (20^18Ma) untilthe Pliocene.This created su⁄cient crustal thickening toinitiate the Pucara-Angastaco compressional basin atabout15Ma,when clastic material eroded from theEC be-gan to be preserved. Apparently, by this time, the EC hadundergone su⁄cient surface uplift to disrupt the £uvialnetwork, disconnecting the interior of the Puna plateaufrom the foreland. By ca. 13^10Ma, compressional defor-mation had shifted eastward, dividing the early basin intotwo subordinate depocentres: the Pucara valley to the westand the Angastaco basin to the east.
From about 15 to 9Ma, the Angastaco Formation accu-mulated in theAngastaco basin under arid conditions.Theoverlying Palo Pintado Formation marks a drastic environ-mental change from a dry to a humid climate, similar toconditions in the Chaco lowlands and the Subandeanranges (Vergani & Starck, 1989; Starck & Vergani, 1996). Atthe same time, arid conditions characterized the Puna pla-teau to the west. This suggests that between about 9 and5Ma, the EC had built su⁄cient topography to focusAtlantic-derived precipitation and block moisture trans-port toward the Puna plateau.
In the late Pliocene (3.4^2.4Ma), shortening was trans-ferred to the eastern £ank of the Angastaco basin, buildinganother orographic barrier further east and establishingsemi-arid conditions across the Calchaqu|¤ Valley. Alongthe southeastern £ank of the Central Andes, the migrationof compressional deformation and coeval building of oro-graphic barriers in an environmentwith an easterly moist-ure source thus focused precipitation onto the windward(eastern) £anks of uplifts and starved the western hinter-land of moisture.
r 2006 The Authors. Journal compilationr 2006 Blackwell Publishing Ltd,Basin Research, 18, 1^2622
I. Coutandet al.
The tectonic and climatic conditions in the southernCentral Andes have led to an interesting relationship be-tween tectonics and climate, where the eastward migrationof deformation has been accompanied by successive aridi-¢cation in the same direction. This evolution caused thetectonic defeat of £uvial systems by tectonically driven sur-face uplift, resulting in ine⁄cient mass removal from theinterior of the orogen (Sobel et al., 2003), and helped topreserve and aerially expand the internal drainage condi-tions of the Puna plateau.
ACKNOWLEDGEMENTS
This project is part of Collaborative Research Center(SFB) 267, ‘Deformationsprozesse in den Anden’, fundedby the German Research Council (DFG) to M. Strecker.I. Coutand and B. Carrapa thank the Alexander vonHum-boldt Foundation for providing funding during their stayinGermany.The ion microprobe facility atUCLA is partlysupported by a grant from the Instrumentation and Facil-ities Programme, Division of Earth Sciences, NationalScience Foundation. Simone Gaab is thanked for assis-tance in the ¢eld, S. Bonnet for providing Fig.1b and G.E.Hilley forFig.1c.Constructive reviews byF.M.Da¤ vila, P.G.DeCelles and P.A. van der Beek helped to improve themanuscript.
REFERENCES
Adelmann, D. (2001) K�nozoische Beckenentwicklung in dersˇdlichen Puna am Beispiel des Salar de Antofolla (NW-Ar-gentinien). PhDThesis,FreiUniversit�t Berlin, Berlin,180 pp.
Allmendinger, R.W., Jordan,T.E.,Kay, S.M. & Isacks, B.L.(1997)The evolution of theAltiplano-Puna plateau of the cen-tral Andes.Annu. Rev. Earth Planet. Sci., 25, 139^174.
Alonso, R. (1992) Estratigraf|¤ a del Cenozoico de la cuenca Pas-tosGrandes (Puna Salten� a) con e¤ nfasis en la Formacio¤ n Sijes ysus boratos.Rev. Asoc. Geol. Argentina, 47, 189^199.
Alonso, R.N., Jordan, T.E., Tabutt, K.T. & Vandervoort,D.S. (1991) Giant evaporite belts of the Neogene central An-des.Geology, 19, 401^404.
Alpers, C.N. & Brimhall, G.H. (1988) Middle Miocene cli-matic change in theAtacamaDesert, northernChile; evidencefrom supergene mineralization at La Escondida.Geol. Soc. Am.Bull., 100(10), 1640^1656.
Andriessen, P.A.M. & Reutter, K.J. (1994) K^Ar and ¢ssiontrack mineral age determination of igneous rocks related tomultiple magmatic arc systems along the 231S latitude ofChileand NW Argentina. In: Tectonics of the Southern Central Andes(Ed. by K.-J. Reutter, E. Scheuber & P.Wigger), pp. 141^153.Springer, Berlin.
Anzo¤ tegui, L.M. (1998) Hojas de Angiospermas de la Forma-cio¤ n Palo Pintado, Mioceno superior, Salta, Argentina, ParteI: Anacardiaceae, Lauraceae y Moraceae. Ameghiniana, 35(1),25^32.
Basu, A. (1976) Petrology of Holocene £uvial sand derived fromplutonic source rocks: implication to paleoclimatic interpre-tation. J. Sedim. Petrol., 46, 694^709.
Batt,G.E.&Brandon,M.T. (2002)Lateral thinking: 2-D inter-pretation of thermochronology in convergent orogenic set-tings.Tectonophysics, 349, 185^201.
Bernet, M., Zattin, M., Garver, J.I., Brandon, M.T. &Vance, J.A. (2001) Steady-state exhumation of the EuropeanAlps.Geology, 29, 35^38.
Bianchi, A.R. & Yan� ez, C.E. (1992) Las precipitaciones en elnoroeste Argentino: Salta, Instituto Nac|¤ onal de Tecnolog|¤ aAgropecuaria, Estac|¤ on Agropecuaria, 35pp.
Bianucci,H.,Acevedo,O.&Cerdan, J. (1981) Evolucio¤ n tecto-sedimentaria del Grupo Salta en la subcuenca Lomas de Ol-medo (Provincias de Salta y Formaso). Congr. Geol. Argent.,VIII, 159^172.
Blackwell,D.D.&Steele, J.L. (1988)Thermal conductivity ofsedimentary rocks:measurement and signi¢cance. In:ThermalHistory of SedimentaryBasins ^Methods andCaseHistories (Ed. byN.D. Naeser & T.H.McCulloh), pp.13^36. Springer, Berlin.
Bossi, G.E., Georgieff, S.M., Gavriloff, I.J.C., Iba¤ n� ez,L.M.&Muruaga,C.M. (2001) Cenozoic evolution of the in-tramontane Santa Maria basin, Pampean Ranges, northwes-tern Argentina. J. South Am. Earth Sci., 14, 725^734.
Brandon,M.T. (1992)Decomposition of ¢ssion-track grain-agedistributions.Am. J. Sci., 292, 535^564.
Brandon,M.T. (1996) Probability density plots for ¢ssion-trackage distributions.Rad.Meas., 26, 663^676.
Brandon,M.T. (2002)Decomposition of mixed grain age distri-butions using binom¢t.OnTrack, 24, 13^18.
Brandon,M.T., Roden-Tice,M.K. &Garver, J.I. (1998) LateCenozoic exhumation of the Cascadia accretionary wedge inthe Olympic Mountains, northwest Washington State. Geol.Soc. Am. Bull., 110, 985^1009.
Braun, J. (2002) Estimating exhumation rate and relief evolutionby spectral analysis of age-elevation datasets. Terra Nova, 14,210^214.
Brewer, I.D.,Burbank,D.W.&Hodges,K.V. (2003)Modellingdetrital cooling-age populations: insights from twoHimalayancatchments.Basin Res., 15, 305^320.
Carrapa,B.,Adelmann,D.,Hilley,G.E.,Mortimer,E.,So-bel, E.R. & Strecker, M.R. (2005) Oligocene range upliftand development of plateau morphology in the southern Cen-tral Andes.Tectonics, 24,TC4011. doi:10.1029/2004TC001762.
Cerveny, P.F., Naeser, N.D., Zeitler, P.K., Naeser, C.W. &Johnson, N.M. (1988) History of uplift and relief of the Hi-malaya during the past 18 million years; evidence from sand-stones of the Siwalik Group. In: New Perspectives in BasinAnalysis (Ed. byK.L.Kleispehn&C. Paola), pp. 43^61. Spring-er-Verlag, Berlin.
Compston,W.,Williams, I.S. &Meyer, C. (1984) U^Pb geo-chronology of zircons from lunar breccia 73217 using a sensi-tive high mass-resolution ion microprobe. J. Geophys. Res.,89(Suppl.), B525^B534.
Coughlin,T.J., O’Sullivan, P.B., Kohn, B.P. & Holcombe,R.J. (1998) Apatite ¢ssion-track thermochronology of theSierras Pampeanas, central western Argentina; implicationsfor the mechanism of plateau uplift in the Andes. Geology,26(11), 999^1002.
Coutand, I. (1999) Tectonique ce¤ nozo|« que du haut plateau de laPuna,Nord-Ouest argentin,AndesCentrales. PhD,Universite¤de Rennes1.
Coutand, I.,Cobbold,P.R.,de Urreiztieta,M.,Gautier,P.,Chauvin, A., Gapais, D., Rossello, E.A. & Lo¤ pez-
Gamund|¤ ,O. (2001) Style and history of Andean deformation,
r 2006 The Authors. Journal compilationr 2006 Blackwell Publishing Ltd,Basin Research, 18, 1^26 23
Propagation of orographic barriers along an active range front

Puna plateau, northwestern Argentina. Tectonics, 20(2),210^234.
Deeken, A.D., Sobel, E.R.,Haschke,M.R., Strecker,M.R.
&Riller,U. (2004)Age of initiation andgrowth pattern of thePuna Plateau, NW-Argentina, constrained by AFT thermo-chronology. In 10th International Fission Track 2004 Conference,Amsterdam.
Deming,D.,Nunn, J.A. & Evans,D.G. (1990) Thermal e¡ectsof compaction-driven groundwater £ow from overthrust belts.J. Geophys. Res., 95(5), 6669^6683.
DiGiulio, A. (1990) Litostratigra¢a e petrogra¢a della succes-sione Eo-Oligocenica del BacinoTerziario Ligure-Piemontesenell’area compresa tra le Valli Grue e Curone (provincia diAlessandria, Italia Settentrionale). Boll. Soc. Geol. Ital., 109,279^298.
DiGiulio,A.&Valloni,R. (1992)Sabbie e areniti, analisi otticae classi¢cazione.ActaNat., 28, 55^101.
Dickinson, W.R. (1970) Interpreting detrital modes of grey-wacke and arkose. J. Sedim. Petrol., 40, 695^707.
Donelick, M.B., Ketcham, R.A. & Carlson, W.D. (1999)Variability of apatite ¢ssion-track annealing kinetics: II. Crys-tallographic orientation e¡ects.Am.Mineral., 84, 1224^1234.
Dumitru,T.A. (1993) A new computer-automated microscopestage system for ¢ssion track analysis.Nucl.TracksRadiat.Meas.,21, 575^580.
Dunkl, I. (2002) Trackkey:windows program forcalculation and gra-phical presentation of EDM ¢ssion track data, version 4.2: http://www.gzg.uni-goettingen.de/forschung/abt_sediment/sed_mitarb/website_id/softwares/trackkey.html.
Durand,F. (1992) Avances y problemas en la de¢nicio¤ n del l|¤ m-ite Preca¤ mbrico-Ca¤ mbrico en el Noroeste Argentino. In:El Paleozoico Inferior en Latinoamerica y la Ge¤ nesis del Gondwana(Univ. Nacl Tucuma¤ n 9, 127^138.
D|¤ az, J.I.&Malizzia,D.C. (1983) Estudio geolo¤ gico y sedimen-tolo¤ gico del Terciario Superior del valle Calchaqu|¤ (departa-mento de San Carlos, provincia de Salta). Bol. Sedimentol., 2,8^28.
D|¤ az, J.I.,Malizzia,D.C. & Bossi,G.E. (1987) Ana¤ lisis estrati-gra¤ ¢co y sedimentolo¤ gico del Grupo Payogastilla (Terciariosuperior).Dec. Congr. Geol. Argent., 113^117.
D|¤ az, J.I.&Miserendino Fuentes,A. (1988) El ambito depos-icional y tectonico del Grupo Payogastilla (Provincia de Salta,Republica Argentina).Congr. Geol. Chil., 39, 87^103.
Folk, R.L. (1968) Petrology of Sedimentary Rocks. HemphillPublishing Co., Austin,TX, 182pp.
Galbraith, R.F. (1981) On statistical models for ¢ssion trackcounts.Math. Geol., 13, 471^478.
Galbraith,R.F.&Green,P.F. (1990)Estimating the componentages in a ¢nite mixture.Nucl.Tracks Radiat.Meas., 17, 197^206.
Gallagher,K. (1995) Evolving temperature histories from apa-tite FT data. Earth Planet. Sci. Lett., 136, 421^435.
Garven, G. (1989) A hydrogeologic model for the formation ofthe giant oil sands deposits of the Western Canada sedimen-tary basin.Am. J. Sci., 289, 105^166.
Garver, J.I., Brandon, M.T., Roden-Tice, M. & Kamp, P.J.J.(1999) Exhumation history of orogenic highlands determinedby detrital ¢ssion-track thermochronology. In: ExhumationProcesses: Normal Faulting, Ductile Flow and Erosion (Ed. by U.Ring, M.T. Brandon, G.S. Lister & S.D. Willett), Geol. Soci.Lond., 154, 283^304.
Gazzi, P. (1966) Le arenarie del Flysh opra-cretaceo dell’Appen-nino modenese; correlazioni con il Flysh di Monghidoro.Mineral. Petrogr. Acta, 12, 69^97.
Gleadow, A.J.W. &Duddy, I.R. (1981) A natural long-term an-nealing experiment for apatite.Nucl.Tracks, 5, 169^174.
Green,P.F. (1981) A new look at statistics in ¢ssion track dating.Nucl.Tracks Radiat.Meas., 5, 77^86.
Green, P.F., Duddy, I.R., Gleadow, A.J.W. & Tingate, P.R.(1985)Fission track annealing in apatite: track lengthmeasure-ments and the form of the Arrhenius plot.Nucl.Tracks Radiat.Meas., 10, 323^328.
Green, P.F., Duddy, I.R., Gleadow, A.J.W.,Tingate, P.R. &Laslett, G.M. (1986) thermal annealing of ¢ssion tracks inapatite, 1. A qualitative description.Chem. Geol., 59, 237^253.
Grier,M.E. (1990)The in£uence of theCretaceousSalta rift ba-sin on the development of andean structural geometries. PhD,Cornell University, NWArgentine Andes.
Grier,M.E. &Dallmeyer, R.D. (1990) Age of the PayogastillaGroup: implication for foreland basin development, NWAr-gentina. J. South. Am. Earth Sci., 3(4), 269^278.
Grier,M.E., Salfity, J.A. & Allmendinger, R.W. (1991) An-dean reactivation of the Cretaceous Salta rift, northwesternArgentina. J. South Am. Earth Sci., 4(4), 351^372.
Hartley, A.J. (2003) Andean uplift and climate change. J. Geol.Soc. Lond., 160(1), 7^10.
Haselton,K.,Hilley,G.E. & Strecker,M.R. (2002) AveragePleistocene climatic patterns in the southern central Andes:controls on mountain glaciation and paleoclimate implica-tions. J. Geol., 110, 211^226, doi: 10.1086/338414.
Hilley,G.E.&Strecker,M.R. (2004)Steady state erosion of criti-calCoulombwedgeswith applications toTaiwan and theHimalaya.J.Geophys. Res., 109, B01411. doi:10.1029/2002JB002284.
Hilley,G.E. & Strecker,M.R. (2005) Processes of oscillatorybasin ¢lling and excavation in a tectonically active orogen:Quebrada del Toro Basin, NWArgentina. Geol. Soc. Am. Bull.,117(7/8), 887^901.
Hongn, F., Seggiaro, R. & Ramalio, E. (1999) Cachi, 2566-III. SEGEMAR, Instituto de Geologia y RecursosMinerales.
Horton, B.K. (2005) Revised deformation history of the centralAndes: inferences from Cenozoic foredeep and intermontanebasins of the Eastern Cordillera, Bolivia.Tectonics, 24, TC3011.doi :10.1029/2003TC001619.
Horton, B.K.,Hampton, B.A., LaReau, B.N. & BaldelloØ n,E. (2002)Tertiary provenance history of the northern and cen-tral Altiplano (Central Andes, Bolivia): a detrital record of theplateau-margin tectonics. J. Sed. Res., 72(5), 711^726.
Hurford, A.J. (1986) Cooling and uplift patterns in the Lepon-tine Alps, South Central Switzerland and an age of verticalmovement on the Insubric fault line. Contrib. Mineral. Petrol.,92, 413^427.
Hurford,A.J. (1990) Standardization of ¢ssion-track dating ca-libration: recommendation by the Fission Track WorkingGroup of the I.U.G.S. Subcommission on geochronology.Chem. Geol., 80, 171^178.
Hurford, A.J. &Green, P.F. (1983) The zeta age calibration of¢ssion-track dating. Isot. Geosci., 1, 285^317.
Ingersoll, R.V., Bullard, T.F., Ford, R.L., Grimm, J.P. &Pickle, J.D. (1984) The e¡ect of grain size on detrital modes:a test of the Gazzi^Dickinson point-counting method. J. Se-dim. Petrol., 54(1), 103^116.
Isacks, B.L. (1988) Uplift of the Central Andean Plateau andbending of the Bolivian Orocline. J. Geophys. Res., 93(B4),3211^3231.
Jordan,T.E. & Alonso, R.N. (1987) Cenozoic stratigraphy andbasin tectonics of theAndesMountain, 20^281 South latitude.Am. Assoc. Petrol. Geol. Bull., 71(1), 49^64.
r 2006 The Authors. Journal compilationr 2006 Blackwell Publishing Ltd,Basin Research, 18, 1^2624
I. Coutandet al.

Jordan,T.E.,Reynolds, J.H.&Erikson, J.P. (1997) Variabilityin age of initial shortening and uplift in the central Andes, 16^331300S. In:Tectonic Uplift and Climate Change (Ed. byW.F. Rud-diman), pp. 41^61. Plenum Press, NewYork.
Kay, S.M.,Coira,B.&Viramonte, J. (1994) Young ma¢c back-arc volcanic rocks as indicators of continental lithospheric de-lamination beneath the Argentine Puna Plateau, Central An-des. J. Geophys. Res., 99, 24323^24340.
Ketcham, R.A., Donelick, R.A. & Carlson, W.D. (1999)Variability of apatite ¢ssion-track annealing kinetics: III. Ex-trapolation to geological time scales. Am. Mineral., 84, 1235^1255.
Ketcham, R.A., Donelick, R.A. & Donelick, M.B. (2000)AFTSolve: a program for multi-kinetic modeling of apatite¢ssion-track data.Geol.Mat. Res., 2(1), 1^32.
Kleinert, K. & Strecker, M.R. (2001) Climate change in re-sponse to orographic barrier uplift: paleosol and stable isotopeevidence from the late Neogene SantaMaria basin, northwes-tern Argentina.Geol. Soc. Am. Bull., 113(6), 728^742.
Kley, J. &Monaldi,C.R. (1998) Tectonic shortening and crus-tal thickness in the Central Andes: how good is the correlation?Geology, 26, 723^726.
Kraemer, B., Adelmann, D., Alten, M., Schnurr,W., Er-penstein, K., Kiefer, E., van den Bgaard, P. & G˛rler,K. (1999) Incorporation of the Paleogene foreland into Neo-gene Puna plateau: the Salar de Antofalla, NW Argentina. J.South Am. Earth Sci., 12, 157^182.
Lamb, S.,Hoke, L.,Kennan, L. &Dewey, J. (1997) Cenozoicevolution of the Central Andes in Bolivia and northern Chile.In: OrogenyThrough Time (Ed. by J.-P. Burg & M. Ford), Geol.Soc. Spec. Publ., 121, 237^264.
Laslett,G.M. &Galbraith, R.F. (1996) Statistical modellingof thermal annealing of ¢ssion tracks in apatite. Geochim. Cos-mochim. Acta, 60, 5117^5131.
Laslett, G.M., Green, P.F., Duddy, I.R. & Gleadow, A.J.W.
(1987)Thermal annealing of ¢ssion tracks in apatite. A quanti-tative analysis.Chem. Geol. (Isot. Geosci. Sect.), 65, 1^13.
Latorre, C., Quade, J. & McIntosh,W.C. (1997) The expan-sion of C-4 grasses and global change in the late Miocene:stable isotopes evidence from the Americas. Earth Planet. Sci.Lett., 146, 83^96.
Lork, A. & Bahlburg, H. (1993) Precise U^Pb ages of mona-zites from the Faja Eruptiva de la Puna Oriental and the Cor-dillera Oriental, NW Argentina. XII Congr. Geol. Argent. IICongr. Expl. Hidrocarburos, 12, 1^6.
Lork, A., Miller, H. & Kramm, U. (1990) U^Pb zircon andmonazite ages of the Angostura granite and the orogenic his-tory of the northwest Argentine basement. J. South Am. EarthSci., 2, 147^153.
Maksaev,V. & Zentilli, M. (1999) Fission track thermochro-nology of the Domeyko Cordillera, northern Chile: implica-tions for Andean tectonics and porphyry coppermetallogenesis. Expl.Mining Geol., 8, 65^89.
Mancktelow,N.S.&Grasemann,B. (1997) Time-dependente¡ects of heat advection on topography and cooling historiesduring erosion.Tectonophysics, 270, 167^195.
Marquillas, R.A., del Papa, C. & Sabino, I.F. (2005) Sedi-mentary aspects and paleoenvironmental evolution of a riftbasin: salta Group (Cretaceous^Paleogene), northwestern Ar-gentina. Int. J. Earth Sci., 94(1), 94^113.
Marrett,R.A.&Strecker,M.R. (2000)Response of intracon-tinental deformation in the central Andes to late Cenozoic re-
organization of South American Plate motions. Tectonics, 19,452^467.
Marshall,L.G.,Hoffstetter,R.&Pascual,R. (1983)Mam-mals and stratigraphy: geochronology of the continentalmammal-bearingTertiary of South America. Palaeovertebrata,Special Volume, 93.
Masek, J.G., Isacks, B.L., Gubbels, T.L. & Fielding, E.J.(1994) Erosion and tectonics at the margins of continental pla-teaus. J. Geophys. Res., 99(B7), 13941^13956.
McQuarrie,N. (2002) The kinematic history of the central An-dean fold-thrust belt, Bolivia: implications for building a highplateau.Geol. Soc. Am. Bull., 114(8), 950^963.
Miller,D.S.,Duddy, I.R.,Green,P.F.,Hurford,A.J.&Nae-
ser, C.W. (1985) Results of interlaboratory comparison of ¢s-sion-track age standards.Nucl.TracksRadiat.Meas., 10, 381^391.
Mon, R. & Salfity, J.A. (1995) Tectonic evolution of the Andesof northern Argentina. In: Petroleum Basins of South America(Ed. by A.J. Tankard, R.S. Soruco & H.J.Welsink), Am. Assoc.Petrol. Geol.Mem., 62, 269^283.
Muruaga,C.M. (2001a) Estratigraf|¤ a y desarrollo tectosedimen-tario de los sedimentos terciarios en los alrededores de la Sier-ra de Hualf|¤ n, borde suroriental de la Puna, Catamarca,Argentina.Assoc. Argent. Sedimentol., 8(1), 27^50.
Muruaga, C.M. (2001b) Petrograf|¤ a y procedencia de areniscasterciarias en la Subcuenca deHualf|¤ n, provincia deCatamarca,noroeste de Argentina.Assoc. Argent. Sedimentol., 8(2), 15^35.
Me¤ ndez,V., Navarini, A., Plaza, D. & Viera, O. (1973) FajaEruptiva de la Puna Oriental.Congr. Geol. Argent., 89^100.
Naeser,C.W. (1976)Fission track dating,U.S.Geological Survey,p. 65.
Omarini, R.H., Sureda, R.J., G˛tze, H.J., Seilacher, A. &Pflˇger, F. (1999) Puncoviscana folded belt in northwesternArgentina: testimony of Late Proterozoic Rodinia fragmenta-tion and pre-Gondwana collisional episodes. Int. J. Earth Sci.,88, 76^97.
Omarini,R.H.,Viramonte, J.G.,Cordani,U., Salfity, J.A.&Kawashita,K. (1984) Estudio geocronolo¤ gicoRb/Sr de laFajaEruptiva de la Puna en el sector de San Antonio de los Cobres,Provincia de Salta, Argentina. Noveno Congr. Geol. Argent.,146^158.
Paces, J.B. & Miller, J.D. (1993) Precise U^Pb ages of Duluthcomplex and relatedma¢c intrusions, northeasternMinnesota;geochronological insights to physical, petrogenetic, paleomag-netic, and tectonomagnetic processes associatedwith the1.1GaMidcontinent Rift System. J. Geophys. Res., 98, 13997^14013.
Ruiz, P.S. (1993) Estudio geolo¤ gico en el valle de Pucara, Depar-tamento SanCarlos, Provincia de Salta.Tesis Profesional,Uni-versidad Nac|¤ onal de Salta.
Ruiz,G.M.H., Seward,D. &Winkler,W. (2004) Detrital ther-mochronology ^ a new perspective on hinterland tectonics, anexample from the Andean Amazon Basin, Ecuador. Basin Res.,16, 413^430.
Salfity, J.A.,Gorustovich, S.A.,Moya,M.C. & Amengual,R. (1984) Marco tecto¤ nico de la sedimentacio¤ n y efusividadCenozoicas en la Puna Argentina. Congr. Geol. Argentino, IX,539^554.
Salfity, J.A. & Marquillas, R.A. (1994) Tectonic and sedi-mentary evolution of the Cretaceous-Eocene Salta Group ba-sin, Argentina. In: Cretaceous Tectonics of the Andes (Ed. by J.A.Sal¢ty), pp. 266^315. Fried.Vieweg & Sohn, Germany.
San� udo-Wilhelmy, S.A. & Flegal,A.R. (1994) Temporal var-iations in lead concentrations and isotopic composition in the
r 2006 The Authors. Journal compilationr 2006 Blackwell Publishing Ltd,Basin Research, 18, 1^26 25
Propagation of orographic barriers along an active range front

Southern California Bight.Geochim. Cosmochim. Acta, 58, 3315^3320.
Schmitt,A.K.,Grove,M.,Harrison,T.M.,Lovera,O.,Hu-
len, J.B.&Walters,M. (2002)TheGeysers^CobbMountainSystem, California. (Part 1): U^Pb zircon ages of volcanicrocks, conditions of zircon crystallization and magma resi-dence times.Geochim. Cosmochim. Acta, 67, 3423^3442.
Sobel,E.R.,Hilley,G.E.&Strecker,M.R. (2003) Formationof internally drained contractional basins by aridity-limitedbedrock incision. J. Geophys. Res., 108(B7), 2344. doi:10.1029/2002JB001883.
Sobel, E.R. & Strecker, M.R. (2003) Uplift, exhumation andprecipitation: tectonic and climatic control of Late Cenozoiclandscape evolution in the northern Sierras Pampeanas, Ar-gentina.Basin Res., 15, 431^451.
Springer,M.&F˛rster,A. (1998)Heat- £owdensity across theCentral Andean subduction zone.Tectonophysics, 291, 123^139.
Starck, D. & Anzo¤ tegui, L.M. (2001) The late miocene cli-matic change ^ persistence of a climatic signal through theorogenic stratigraphic record in northwestern Argentina. J. S.Am. Earth Sci., 14, 763^774.
Starck,D. &Vergani,G. (1996) DesarrolloTecto-sedimentar-io del Cenozoico en el Sur de la provincia de Salta-Argentina.13 Congr. Geol. Argent. Tercero Congr. Expl. Hidrocarburos, 13,433^452.
Strecker, M.R., Cerveny, P., Bloom, A.L. & Malizzia, D.(1989) Late tectonism and landscape development in the fore-land of the Andes: Northern Sierras Pampeanas (26^281S),Argentina.Tectonics, 8(3), 517^534.
Stˇwe, K.,White, L. & Brown, R. (1994) The in£uence oferoding topography on steady-state isotherms: application to¢ssion track analysis. Earth Planet. Sci. Lett., 124, 63^74.
Toselli, A. (1990) Metamor¢smo del Ciclo Pampeano. In:ElCicloPampeano en elNoroesteArgentino (Ed. byF.G.Acen� olaza,H.Miller & A.J.Toselli),Univ. Nac.Tucuma¤ n, 4, 181^197.
Turner, J.C.M. (1960) Estratigraf|¤ a delNevado deCachi y sectoral oeste.Acta Geol. LilloanaTucuma¤ n, 3, 191^226.
Valloni, R. (1985) Reading provenance from modern marinesands. In: Provenance of Arenites (Ed. by G.G. Zu¡a), NATO-ASISer., 148, 309^332.
Vandervoort, D.S., Jordan, T.E., Zeitler, P.K. & Alonso,R.N. (1995) Chronology of internal drainage developmentand uplift, southern Puna plateau, Argentine central Andes.Geology, 23(2), 145^148.
Vergani,G.& Starck,D. (1989) Geolog|¤ a del Sur de la Provin-cia de Salta ^ Parte II: Estratigraf|¤ a y evolucio¤ n tectosedimen-taria del Cenozoico entre el Valle Calchaqu|¤ y Meta¤ n,Unpublished.Y.P.F.
Wiedenbeck,M., Alle, P., Corfu, F., Griffin,W.L.,Meier,M., Oberli, F.,Von Quadt, A., Roddick, J.C. & Spiegel,W. (1995) Three natural zircon standards for U T̂h^Pb,Lu^Hf, trace element and REE analyses. Geostand. Newslett.,91, 1^23.
Willett, S.D., Issler, D., Beaumont, C., Donelick, R.A. &Grist, A. (1997) Inverse modeling of annealing of ¢ssiontracks in apatite 2; application to the thermal history of theWestern Canada Sedimentary Basin.Am. J. Sci., 297, 970^1011.
World Meteorological Organization (WMO) (1975) Cli-matic atlas of South America: World Meteorological Organi-zation, Geneva, scale1:1,000,000, 28pp.
Manuscript received 26 May 2005; Manuscript accepted19 January 2006.
r 2006 The Authors. Journal compilationr 2006 Blackwell Publishing Ltd,Basin Research, 18, 1^2626
I. Coutandet al.