HELP FILE TRADE INTERCEPTOR Mac OS Version 3.4.1
31
Copyright © ThinkMarkets 2017 HELP FILE TRADE INTERCEPTOR Mac OS Version 3.4.1
-
Upload
khangminh22 -
Category
Documents
-
view
0 -
download
0
Transcript of HELP FILE TRADE INTERCEPTOR Mac OS Version 3.4.1

Copyright © ThinkMarkets 2017
HELP FILE
TRADE INTERCEPTOR
Mac OS Version 3.4.1

……………………………………………………2 Copyright © ThinkMarkets 2017
Mac OS Help Manual
1. WHY TRADE LIVE WITH TRADE INTERCEPTOR? ....................................................................... 7
2. OPEN AN ACCOUNT ............................................................................................................... 8
2.1. OPEN A DEMO ACCOUNT ............................................................................................................. 8
2.2. OPEN A LIVE ACCOUNT ................................................................................................................ 8
3. DEPOSITS AND WITHDRAWALS .............................................................................................. 8
3.1. DEPOSITS ................................................................................................................................. 8
3.2. WITHDRAWALS ......................................................................................................................... 8
4. LEVERAGE AND MARGIN CALL POLICY .................................................................................... 9
4.1. LEVERAGE ................................................................................................................................ 9
4.2. MARGIN .................................................................................................................................. 9
4.3. MARGIN CALCULATION ............................................................................................................... 9
4.4. BALANCE ................................................................................................................................. 9
4.5. TOTAL P/L ............................................................................................................................... 9
4.6. EQUITY.................................................................................................................................... 9
4.7. FREE MARGIN ........................................................................................................................... 9
4.8. MARGIN CALL POLICY ................................................................................................................ 10
5. SECURITY OF FUNDS ............................................................................................................ 10
6. QUOTES & INSTRUMENTS....................................................................................................... 11
7. ORDER TYPES ...................................................................................................................... 11
7.1. INSTANT EXECUTION: ................................................................................................................ 11
7.2. PENDING ORDERS: ................................................................................................................... 11
7.2.1. BUY LIMIT ...................................................................................................................................... 11
7.2.2. SELL LIMIT ...................................................................................................................................... 11
7.2.3. BUY STOP ....................................................................................................................................... 12
7.2.4. SELL STOP ...................................................................................................................................... 12
8. TRADING FROM THE APPLICATION ......................................................................................... 12
8.1. FROM “QUOTES” .................................................................................................................... 12
8.1.1. INSTANT (MARKET) ORDERS ............................................................................................................... 12
8.1.2. PENDING ORDERS ............................................................................................................................ 12
8.2. FROM CHARTS ........................................................................................................................ 13

Copyright © ThinkMarkets 2017 3
Mac OS Help Manual
8.2.1. INSTANT EXECUTIONS ....................................................................................................................... 13
8.2.2. PENDING ORDERS ............................................................................................................................ 13
8.3. STOP LOSS AND TAKE PROFIT ..................................................................................................... 13
8.4. MODIFY POSITION ................................................................................................................... 13
8.5. CLOSE POSITION ...................................................................................................................... 14
8.6. TRADING REPORTS ................................................................................................................... 14
9. CHART FEATURES ................................................................................................................... 14
9.1. CHARTS MENU ........................................................................................................................ 14
9.2. TOP BAR ............................................................................................................................... 15
9.2.1. ACCOUNTS ..................................................................................................................................... 15
9.2.2. VIEW SECTIONS ............................................................................................................................... 15
9.2.3. SETTINGS........................................................................................................................................ 15
9.3. CHARTS POP-UP MENU ............................................................................................................ 15
9.4. GRAPHICAL TOOLS ................................................................................................................... 15
9.4.1. TOOLS LIST ..................................................................................................................................... 15
9.4.2. ADD A TOOL .................................................................................................................................... 16
9.4.3. EDIT A TOOL .................................................................................................................................... 17
9.4.4. COPY A TOOL .................................................................................................................................. 17
9.4.5. DELETE A TOOL ................................................................................................................................ 18
9.5. INDICATORS ........................................................................................................................... 18
9.5.1. INSERT INDICATORS .......................................................................................................................... 18
9.5.2. DELETE INDICATORS ......................................................................................................................... 18
9.5.3. GROUP INDICATORS ......................................................................................................................... 18
9.5.4. INDICATOR TEMPLATES ..................................................................................................................... 18
9.6. TIME FRAMES ......................................................................................................................... 19
9.7. MULTIPLE CHARTS ................................................................................................................... 19
9.8. LINKING CHARTS ...................................................................................................................... 19
9.9. CHART SCALE .......................................................................................................................... 19
9.10. ZOOM ................................................................................................................................. 19
9.11. RE-SCALE PANES .................................................................................................................... 19
9.12. SHIFT CHARTS ....................................................................................................................... 19
9.13. CHART TYPES ........................................................................................................................ 20
9.13. CHART TYPES ........................................................................................................................ 20
9.14. CHART DETACHMENT .............................................................................................................. 20
10. TRENDRISK ........................................................................................................................... 20
10.1. GENERAL ............................................................................................................................. 20
10.2. TRENDRISK INDICATORS .......................................................................................................... 22
10.2.1. TRENDRISK TREND ......................................................................................................................... 22
10.2.2. TRENDRISK NEUTRAL ..................................................................................................................... 22

Copyright © ThinkMarkets 2017 4
Mac OS Help Manual
10.2.3. TRENDRISK BANDWIDTH ................................................................................................................. 23
10.2.4. TRENDRISK PERCENT ...................................................................................................................... 23
11. TRENDRISK SCANNER ........................................................................................................... 24
12. ALARMS & EVENT ALERTS ..................................................................................................... 25
12.1. PRICE/INDICATOR ALARMS ...................................................................................................... 25
12.2. SET/MODIFY ALARMS FROM CHART ........................................................................................... 25
12.2.1 ADD A PRICE ALARM ........................................................................................................................ 25
12.2.2 ADD AN INDICATOR ALARM .............................................................................................................. 25
12.2.3. EDIT/GROUP ALARM CONDITIONS ..................................................................................................... 25
12.3. SET/MODIFY ALARMS FROM ALARMS MENU ............................................................................... 26
12.3.1. ADD AN ALARM ............................................................................................................................. 26
12.3.2. MODIFY AN ALARM ........................................................................................................................ 26
12.3.3. SET MULTIPLE CONDITIONS .............................................................................................................. 26
12.4. ECONOMIC EVENT ALERTS ........................................................................................................ 26
13. LIVE NEWS ........................................................................................................................... 26
14. ECONOMIC CALENDAR ......................................................................................................... 27
16. DESKTOP SYNCHRONIZATION ............................................................................................... 27
17. TRADERS GYM ...................................................................................................................... 27
17.1. WHAT IS THE TRADERS GYM? ................................................................................................... 27
17.2. WHAT ARE THE MAIN ADVANTAGES OF TRADERS GYM? .................................................................. 27
17.3. HOW TO GET STARTED ............................................................................................................. 28
17.3.1. LOG IN ......................................................................................................................................... 28
17.3.2. REGISTER A PAPER TRADING ACCOUNT............................................................................................... 28
17.3.3. SET THE INSTRUMENT AND THE TIME INTERVAL FOR WHICH YOU WANT TO SIMULATE A TRADE .................... 28
17.3.4. START THE SIMULATION .................................................................................................................. 29
17.3.5. CONTROL THE SIMULATION SPEED .................................................................................................... 29
17.3.6. CONTROL EACH CANDLE’S MOVEMENTS ............................................................................................. 30
17.4. HOW TO SEE A POSITION ON THE CHART ...................................................................................... 30
17.5. MODIFY AN ORDER................................................................................................................. 30
17.6. CLOSE AN ORDER ................................................................................................................... 30
17.7. RUN A REPORT ...................................................................................................................... 31
17.8. DELETE A POSITION ................................................................................................................. 31
17.9. SIMULATE DEPOSIT/WITHDRAW ................................................................................................ 31
17.10. ADD NEW PAPER ACCOUNT ..................................................................................................... 31
Copyright © ThinkMarkets 2017 5
Mac OS Help Manual
17.11. DELETE A PAPER ACCOUNT...................................................................................................... 31
17.12. CHART TYPES, TOOLS, INDICATORS ........................................................................................... 31

Copyright © ThinkMarkets 2017 6
Mac OS Help Manual
Forex Trading Platform
Trade Interceptor 3.4.1. Mac OS is a proprietary trading platform of ThinkMarkets which
offers a unique trading, technical analysis and back-testing environment.
The platform was designed for professional traders and therefore offers a series of advanced
features, combined with an intuitive interface.
Trade Interceptor allows trading from the charts; using a wide range of technical indicators,
studies and graphical tools; saving and instantly reloading your preferred group of indicators;
using our proprietary analytical tool TrendRisk indicators and market scanner, and more…
Professional news are broadcasted round-the-clock, covering global market events as they
happen, thanks to the insights of FXWirePro newswire experts.
With Trade Interceptor you can also set-up your own alarms based on prices, technical indicators, graphical tools and economic data releases. Alerts are saved on our servers therefore you can create them on your desktop and receive notifications on your mobile, even if Trade Interceptor app is turned off.
Trade Interceptor mobile and desktop applications are all synchronized in real-time, meaning that you can use both the mobile & desktop applications to monitor and place trades, and see your orders updated on all devices simultaneously.

Copyright © ThinkMarkets 2017 7
Mac OS Help Manual
1. Why trade live with Trade Interceptor?
Best mobile technology Trade Interceptor has received the “Best Mobile Platform” award from the Forex industry for its advanced trading and technical analysis features. With Trade Interceptor you can trade your account from various devices, working under Windows, Android, iOS and MacOS. You will be able to use exclusive trading features such as cloud-based trade alarms, exclusive indicators, professional market news, economic calendar alerts and much more. It is free to use Using Trade Interceptor is absolutely free. Your trading conditions are the same as on ThinkMarket’s native platform. Synchronized applications You will be able to use Trade Interceptor applications on iPads, iPhones, Blackberry, Android phones & tablets, Windows and Mac desktops, through a single account login. All our applications are synchronized and you will be able to manage your trading positions from any device in real-time. Security of funds When Opening a live account with Trade Interceptor you will benefit from the full protection of ThinkMarkets regulation under both FCA and ASIC, with ultimate trading conditions.

Copyright © ThinkMarkets 2017 8
Mac OS Help Manual
2. Open an account
2.1. Open a demo account
Once you register for Trade Interceptor, your demo account will be visible in the Demo
accounts panel. You can create more than account by clicking on the “+” symbol. Your demo
account will be funded with 100,000 of notional equity.
2.2. Open a live account
Opening an account with Trade Interceptor is simple. The application process starts with filling
an application form, receiving account approval, funding your account and start trading. To
go to the application form, please go to “Open Live Account”. You can also open a live account
directly from Demo mode by clicking on the “+” symbol in the Accounts panel or by clicking
on “Accounts in the upper-right corner of the platform.
3. Deposits and withdrawals
3.1. Deposits
To make a deposit, select “Accounts” from the application’s main menu and fill the required information.
Client funds are safely placed on segregated accounts with approved banking institutions, in accordance with the FCA’s and AISIC’s “Client Money” rules. The minimal deposit requirement of Trade Interceptor is 250 USD, EUR, GBP or AUD. Deposits can be made via Bank Wire Transfer, MasterCard and VISA Credit/Debit Card, Skrill, Neteller, China Union Pay, FasaPay and PayPal*. *Certain payment options may not be available based on your country of residence.
3.2. Withdrawals
Withdrawing funds from your Trade Interceptor account is simple, quick and easy. Withdrawal requests can be submitted online by completing a short withdrawal form from the Accounts panel. To comply with AML guidelines, Trade Interceptor operates a “Return to Source” policy. For example, if funds were deposited using Skrill then we will refund you via Skrill along with any profits. The same applies to Neteller, PayPal, Cards, FasaPay, China Union Pay, Bank Wire and any other payment method used to deposit. If for any reason we are unable to return funds back to source, we will preferably return them via Bank Wire in the name of the trading account holder*. *We reserve the right to request proof of account ownership at any time.

Copyright © ThinkMarkets 2017 9
Mac OS Help Manual
4. Leverage and margin call policy
4.1. Leverage
Leverage allows a client to trade without putting up the full amount. It can be considered as a loan that is provided by the broker. In Trade Interceptor, you can trade with a leverage of 1:25, 1:50, 1:100, 1:200 or 1:400. If your Leverage is set to 1:400, this means that when you trade currencies, for every $1 you deposit, Trade Interceptor gives you the opportunity to trade with $400.
4.2. Margin
Leverage implies that a margin amount is deposited to cover potential losses. When you open a position, you are required to put up a fraction of that position’s value as a collateral. The amount required is visible in the “Accounts” tab.
4.3. Margin calculation
Margin requirements are calculated as follows: (100,000 units* Number of Standard lots)/Leverage * conversion rate to your base currency For example, for a USD account with 400:1 leverage, iof you place a EUR/USD buy order of 0.1 lots (10,000 EUR) @ 1.3632, the calculation would be as follows: {(100,000 *1.3632) * (0.1)}/400 = 34.08 100,000EUR * 1.3632 = $136,320 (margin required for a standard ot when leverage is 1:1) $136,320 * 0.1 = $13,632 (margin required for 0.1 lots when leverage is 1:1) $13,362/*400 = $34.08 (margin required for 0.1 lots when leverage is 400:1)
4.4. Balance
Balance is a static indicator, showing the amount of funds in your account before opening a position.
4.5. Total P/L
The Total P/L is a fluctuating figure that continually updates showing the current profit or loss on your open positions.
4.6. Equity
Equity is a dynamic indicator, showing your Balance + Total running P/L.
4.7. Free margin
The Free margin level shows how much cash you can use as a margin deposit for new positions or as a protection from potential losses. The Free margin is visible in the “Accounts” tab. If you have set pending orders, when triggered, they will decrease your Free margin.

Copyright © ThinkMarkets 2017 10
Mac OS Help Manual
4.8. Margin call policy
Trading accounts with Trade Interceptor follow the margin call policies as set forth by ThinkMarkets. Trading accounts will automatically experience a margin call if the criteria below are met. It is important to note that proper risk management and placing of stop losses reduces the need for a margin call on a trader's account. We advise all clients and traders to strictly adhere to margin requirements when trading. Minimum Margin Requirements on Open Positions must be maintained by the customer at all times. All open positions are subject to liquidation by Trade Interceptor should the Minimum Margin Requirement fail to be maintained. Margin requirements may change at any time. Trade Interceptor will do its best to inform the customer about any projected changes by email and via the trading platform's message system at least a week before changes go into effect. Trade Interceptor will liquidate all Open Positions in a customer's account if the total equity, at any time, equals or falls below 50% of the Used Margin. Positions will be closed based on the best execution prices available at the time to Trade Interceptor. The placing of Stop Loss Orders, used to minimize losses, is the clients’ responsibility. Please click here to view the ThinkMarkets Margin Call Policy.
5. Security of funds
Industry standard is not good enough — instead, we strive to deliver “Trade Interceptor Security of Funds.” Throughout the financial services industry, there are stringent requirements to keep clients’ money secure. Most brokers adopt an industry-standard approach to protecting your money, but at Trade Interceptor we go above and beyond to ensure your money is as safe as possible. As a regulated FX broker, we are regularly audited. Therefore we continually maintain high standards to provide you with the peace of mind when trading with us. In the UK, we are authorised and regulated by the Financial Conduct Authority (FCA) under FRN 629628. The FSCS is the UK's compensation fund of last resort for customers of authorised financial services firms. With the standard Financial Services Compensation Scheme (FSCS) you are covered under the ‘investments’ claim category, whereby the cover is up to £50,000 per person per firm in case of a brokers default or insolvency.
At no extra cost to clients of Trade Interceptor, we have purchased insurance protection which protects eligible clients for up to £1m over any claim with the FSCS in the event of our default or insolvency.

Copyright © ThinkMarkets 2017 11
Mac OS Help Manual
In Australia, we are regulated by the Australian Investments and Security Commissions (ASIC), who administers the Corporations Act 2001. Clients of TF Global Markets (Aust) Pty Ltd. have the full protection of the Australian regulator: AFSL Number: 424700 ABN Number: 69 158 361561.
To further enhance security, all of our clients’ funds are segregated from our own funds in carefully selected top-tier banks, with daily fund reconciliations.
6. Quotes & Instruments
To personalize your quote grid, click the “Quotes” icon from the main menu. You can add more instruments, by clicking the “+” button in bottom left corner. In order to trade, choose FXCM feed and activate the selected instruments symbols. To edit your list of instruments, click-and-drag the instruments to reorder them. You can delete by selecting an instrument with single click and then click “-“symbol at the bottom of the Quotes Grid or right-click and select “Remove”. To open a chart, double click on an instrument or drag-and-drop it on a particular chart window.
7. Order Types
In Trade Interceptor, clients can place market (instant) orders and pending (entry) orders.
7.1. Instant execution:
In instant execution mode, the client can buy or sell FX and CFDs immediately at the best available price.
7.2. Pending orders:
7.2.1. Buy Limit
A buy order to open a position at a specified price, which is below the current market price. In Trade Interceptor you can place a Buy Limit order with pre-defined stop loss and take profit levels.
7.2.2. Sell Limit
A sell order to open a position at a specified price, which is above the current price. In Trade Interceptor you can place a Sell Limit order with pre-defined stop loss and take profit levels.

Copyright © ThinkMarkets 2017 12
Mac OS Help Manual
7.2.3. Buy Stop
A buy order to open a position at a specified price, which is above the current price. In Trade Interceptor you can place a Buy Stop order with pre-defined stop loss and take profit levels.
7.2.4. Sell Stop
A sell order to open a position at a specified price, which is below the current market price. In Trade Interceptor you can place a Sell Stop order with pre-defined stop loss and take profit levels.
8. Trading from the Application
Before placing a trade, you must log into your account from the “Accounts” panel at the bottom of the application.
8.1. From “Quotes”
8.1.1. Instant (market) orders
To trade from the Quotes grid, right click on the instrument’s quotation and select “Order at market price”. Check carefully the details in the pop-up window. You can also set Stop Loss and Take profit levels. (See more in the “S/L and T/P” section). It is possible that the price may change from the time you submit your order until it is executed by the server. Then you will see a pop-up window asking you to
accept or decline the new price. When everything is set, click on “Place Order”.
8.1.2. Pending orders
If you want to place a pending order, choose “Pending Order” from the order’s menu and select the type of order (see section “Order Types”). As in instant execution mode, you can set Stop Loss and Take Profit levels.

Copyright © ThinkMarkets 2017 13
Mac OS Help Manual
8.2. From Charts
8.2.1. Instant executions
Right-click on the chart and select “Order at market price”. Check carefully the details in the pop-up window. You can also set Stop Loss and Take profit levels. It is possible that the price may change from the time you submit your order until it is executed by the server. Then you will see a pop-up window asking you to accept or decline the new price. When everything is set, click on “Place Order”.
8.2.2. Pending orders
If you right- click on the chart below or above the current market price, you will see the type of pending order that could be placed at this level. As in instant execution mode, you can set Stop Loss and Take Profit levels.
8.3. Stop Loss and Take Profit
Stop Loss and Take Profit levels could be defined at a fixed price or as pips from the current price. If you want to set a stop level at a certain price, just click on “Price” and set the price in the box. Click on “Pips” to set the Stop loss or Take Profit level as pip distance from the current price. You can also drag the price label of the order on the chart screen in the “Open order” window. To modify your orders’ Stop Loss and Take Profit levels, click-and-drag their labels which are located on the left-hand side of the chart.
8.4. Modify position
• From the “Accounts” panel
To modify an order/position, go the order / positions list in the “Accounts” panel (in the bottom of the application), right-click on the order/position that you want to modify and select “Modify Order”. Then you will be able to set or modify Stop Loss (S/L) and Take Profit (T/P) levels by filling the price/pips boxes. If the S/L and T/P levels are already set, you can modify them by dragging on the chart. If you want to remove S/L or T/P level, uncheck the S/L or T/P boxes and click on “Modify order”.

Copyright © ThinkMarkets 2017 14
Mac OS Help Manual
• From the Chart
You can also modify a position by right-clicking on it from the chart’s context menu.
8.5. Close position
To close a position or to cancel a pending order, go the orders/positions list in the “Accounts” panel (in the bottom of the application), right-click on the order that you want to close/cancel and select “Close Order”.
8.6. Trading reports
You can generate a summary of all your trades when you click on “Trading report” from the
accounts panel.
9. Chart Features
9.1. Charts Menu
Show or hide the indicators data
Activate the Cross Hair
Activate the Pip&Bar measuring tool
Open the Tools List and select a tool
Activate this button to snap the tool to the price’s Low, High, Open or Close
Open and select the Multi-Chart Templates
View and select indicators templates
View and select indicators
Link charts to synchronize currencies on various charts View and manage your main chart settings

Copyright © ThinkMarkets 2017 15
Mac OS Help Manual
9.2. Top Bar
9.2.1. Accounts
Allows you to open a new live or demo account, or to register an existing demo account
9.2.2. View Sections
In top right corner of the screen you will find the “View Sections” button which allows to visualize in a different way the main sections of the interface which are the charting section, accounts section and the sidebar.
9.2.3. Settings
To access the main settings of the application, select the “Gear” icon above the chart. From
here you can:
• Set your time zone
• Set chart color templates and 3D candles
• Set historical data units
• Show/hide trading indicator
• Show/hide original OHLC values on Heikin Ashi charts
9.3. Charts Pop-Up Menu
Right-click (or use command CTRL + Trackpad tap on a MacBook) on the chart to open the pop-up menu, in order to:
• Shift the position of the last bar • Select what order type to execute • Save a Template or load a Template • Set Alarms • Set intraday settings of the chart.
9.4. Graphical Tools
9.4.1. Tools List
Trade Interceptor offers over 50 advanced charting tools that can easily be applied by beginners, and at the same time, offer enough functionalities to meet the requirements of the most sophisticated professional traders.

Copyright © ThinkMarkets 2017 16
Mac OS Help Manual
Graphical tools are grouped as follows:
• Lines • Regressions • Fibonacci tools • Gann tools • Elliott Wave designator • Harmonic Patterns • Text writing tool • Objects • Icons
9.4.2. Add a tool
You can add tools on both the main chart and indicators windows. Click on the Pencil icon to open the list of tools, select a tool from the list and start drawing it on the chart. Click away to exit drawing mode.

Copyright © ThinkMarkets 2017 17
Mac OS Help Manual
9.4.3. Edit a tool
To edit a tool you can either right-click on it, or use the Tool Editor Menu
• Right-click on a tool By right-clicking on a tool, you will be able to
➢ Change tool properties ➢ Copy a tool ➢ Delete a tool ➢ Delete all graphical tools
• Using the Tool Editor menu
Click on the tool, and the Tool Editor menu will show up. The Tool Editor menu allows to:
➢ Select/change the tool color ➢ Change Display Size ➢ Select line type ➢ Hide or Show the tool (eye icon) ➢ Fix a tool in the current position (lock-pad) ➢ Open and Modify the Tool Properties Tool (settings icon) ➢ Copy a tool ➢ Delete a tool
9.4.4. Copy a tool
To copy a tool, you can either:
• Right-click on it and select “Copy tool”. • Use the Copy icon in the Tool Editor menu

Copyright © ThinkMarkets 2017 18
Mac OS Help Manual
9.4.5. Delete a tool
To delete a tool, you can either:
• Click on a tool and use the Backspace or delete key from your computer’s keyboard
• Right-click on it and select “Delete tool”. There is also an option to delete all tools, applied on the chart
• Use the recycle icon from the Tool Editor menu
9.5. Indicators
9.5.1. Insert Indicators
To insert an indicator, click on the indicators icon and select the button “Add Indicators”. Scroll to find which indicator you want to add, click on it and select “Add indicator”, then close the indicators window.
9.5.2. Delete Indicators
Indicators can be deleted in two ways
• Right-click on the indicator and select from the pop-up menu “Delete “indicator name”
• Click on the Indicators icon and select the “x” on right-hand side of the indicator you chose to delete.
9.5.3. Group Indicators
To merge several indicators on a single pane, open the indicators list, select, drag an indicator and drop it next to another.
9.5.4. Indicator Templates
To open or create indicator template, click the templates icon or right-click on the chart and select form the pup-up menu “Load template” or “ Save Template”. The “All” list shows all the existing templates. To add templates to your Favorites List, click the star next to each template. The “Recent” list shows the template you recently used. You can upload them on a chart, or save them to your favorites list.
Copyright © ThinkMarkets 2017 19
Mac OS Help Manual
To create a new template, first select a chart and right-click on it, then choose from the pop-up menu “Save Template”. Give a name and description to your template and click “Save”. The new template will appear in the “All” list. To delete templates from the “All” list, select the “x” next to each template to delete them one by one.
9.6. Time Frames
The drop down menu located in the chart menu bar allows you to select the time frame.
9.7. Multiple Charts
Use the multiple chart icon to select the number of charts you want to visualize on the charting screen and their configuration.
9.8. Linking Charts
To link charts together and change currency simultaneously on a multiple chart set-up, click on the chain icon and select the charts you want to link together. A small padlock image in the bottom left corner of the chart pane shows you if a chart is linked to another (closed padlock) or not (opened padlock).
9.9. Chart Scale
You can modify the scale of a chart by dragging with a mouse (or hold and drag on the TrackPad on a MacBook) vertically across the price axis.
9.10. Zoom
Scroll with a mouse wheel or scrolling gesture if using a magic mouse. Alternatively use the pinch/zoom gesture on the Trackpad of a MacBook.
9.11. Re-scale Panes
To modify the height of an indicator frame click and drag vertically on the price axis to do this effect.
9.12. Shift Charts
To change position of the last bar, move the arrow on the horizontal axis to the new position. If this is done forward, price will auto-scroll automatically to the new position. If this is done

Copyright © ThinkMarkets 2017 20
Mac OS Help Manual
backwards (to the left), then after moving the arrow, right-click on the chart and select “Shift chart” in order to displace the chart to the new position.
9.13. Chart types
Trade Interceptor offers a wide choice of charts (Candlesticks, Bars, Line, High/Low, Heikin
Ashi, Mountain, Candlevolume, Equivolume, Renko, Point and Figure, Kagi) , which could be
selected from the chart’s icon below the chart window.
9.13. Chart types
Trade Interceptor offers a wide choice of charts (Candlesticks, Bars, Line, High/Low, Heikin Ashi, Mountain, Candlevolume, Equivolume, Renko, Point and Figure, Kagi) , which could be selected from the chart’s icon below the chart window.
9.14. Chart detachment
There is an option to detach charts from the main screen by clicking on the arrow icon in the
chart’s tab. There is an option to attach the chart to the main screen again - when closing a
detached chart, click on “Attach” from the dialogue window.
10. TrendRisk
10.1. General
TrendRisk indicators are proprietary analytical tools which are available exclusively on Trade Interceptor. TrendRisk is an indicator and a system at the same time; it could be classified as both as a trend following and trading range indicator that facilitates the decision making process of every trader. It is very useful when applied on existing systems that traders use – it gives them a good tool that can be incorporated into their established strategy or help them in developing new ones. TrendRisk indicators are composed of 2 series of bands and a central indicator:
• TrendRisk Bands
• TrendRisk Stop Bands
• TrendRisk TIP Center
Copyright © ThinkMarkets 2017 21
Mac OS Help Manual
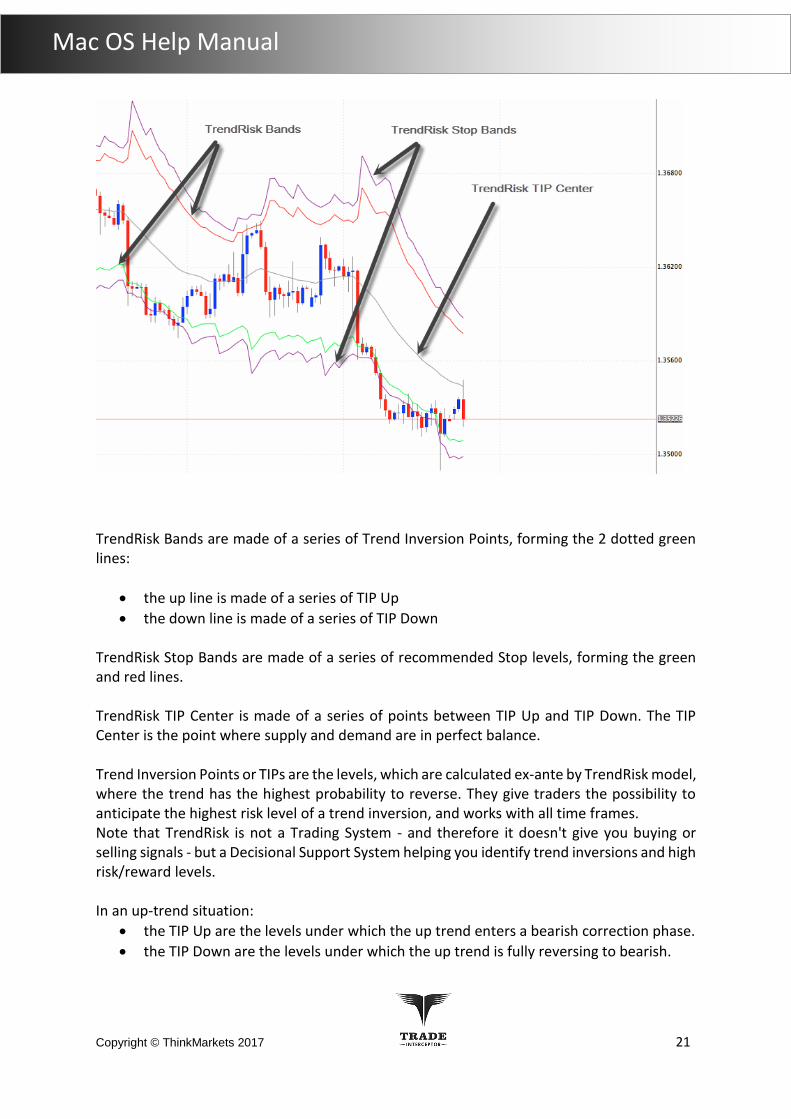
TrendRisk Bands are made of a series of Trend Inversion Points, forming the 2 dotted green lines:
• the up line is made of a series of TIP Up
• the down line is made of a series of TIP Down TrendRisk Stop Bands are made of a series of recommended Stop levels, forming the green and red lines. TrendRisk TIP Center is made of a series of points between TIP Up and TIP Down. The TIP Center is the point where supply and demand are in perfect balance. Trend Inversion Points or TIPs are the levels, which are calculated ex-ante by TrendRisk model, where the trend has the highest probability to reverse. They give traders the possibility to anticipate the highest risk level of a trend inversion, and works with all time frames. Note that TrendRisk is not a Trading System - and therefore it doesn't give you buying or selling signals - but a Decisional Support System helping you identify trend inversions and high risk/reward levels. In an up-trend situation:
• the TIP Up are the levels under which the up trend enters a bearish correction phase.
• the TIP Down are the levels under which the up trend is fully reversing to bearish.

Copyright © ThinkMarkets 2017 22
Mac OS Help Manual
In a down trend situation:
• the TIP Down are the levels above which the down trend enters a bullish correction phase.
• the TIP Up are the levels above which the down trend is fully reversing to bullish. You will find the TrendRisk indicators by clicking on the “Broken arrow” icon under the chart pane.
10.2. TrendRisk Indicators
10.2.1. TrendRisk Trend
The TrendRisk Trend is a technical indicator, available exclusively on the Trade Interceptor platform, which visualizes the current trend. It is of great help when you try to determine the direction of the trend. You can find TrendRisk Trend in the “Indicators” menu on Trade Interceptor, submenu “TrendRisk” - > TrendRisk Trend. Different colors are available for both phases of the trend. TrendRisk Trend is a very simple and at the same time very efficient indicator. The color of a new trend appears when a certain number of candles breaks above the Tip Up or below the Tip Down. You can change TrendRisk Trend’s properties by tapping on it in the “Indicators” list. The default number of candles breaking the Tip bands (which is used to indicate a change of the trend) is 3, but it can be customized by every user. If the market is in a downtrend and 3 consecutive candles close above the Tip Up band, then an uptrend has started and the color would turn green. Alternatively, when the market is in a downtrend and 3 candles close below the Tip Down band, then the color of the trend changes to red and a downtrend begins. If the option “Use stable tip” is enabled, TrendRisk Trend will be more conservative, as the last bar needs to close beyond the Stop Tip (UP or Down) band to indicate the change of trend. TrendRisk Trend is valuable tool for discretionary or automated trading system, as it gives visual information about the direction of the trend and reduces the chance to place orders against the trend.
10.2.2. TrendRisk Neutral
This indicator is closely related with TrendRisk Trend but it indicates another state to the trend. Trendrisk trend indicates two phases of the trend : bearish and bullish, while Trendrisk Neutral adds a the third state - range movement. The philosophy of TrendRisk Neutral is simple – when prices move in a trend and even one candle closes above or below the band which is considered as trend-changing, then the candles change color and we accept that prices start to move in a range. If we see a break of more than one candle, then we may see a change of the trend, which will be reflected by

Copyright © ThinkMarkets 2017 23
Mac OS Help Manual
TrendRiskTrend. For example, if we are in a down trend and one bar closes above the Tip Up, it is accepted as a signal that the down trend has finished and prices start to move in a range. The default color for the Trend Neutral indicator is yellow, but the platform allows choosing another color. All settings can be modified by tapping on “Trendrisk Neutral” from the “Indicators” menu. The trading range goes on until prices close beyond any of the TrendRisk bands several times. How many closes we need depends on the number of breaks we have set in Trade Interceptor. The default is 3 breaks. The number of breaks indicates if there is a change in the trend, which will be reflected either by TrendRiskTrend or TrendRisk Neutral.
10.2.3. TrendRisk Bandwidth
The TrendRisk Bandwidth is a volatility indicator that measures the distance between the Tip Up and the Tip Down. It is visualized in a separate pane below the chart. Bandwidths are the extreme levels for indication of buying or selling pressure. This indicator is based on the Mean reversion concept, which assumes that extreme high and low prices are temporary and they tend to move to the average price over time. This means that the distance between the Tip Up and Tip Down bands is constantly changing, depending on market volatility, and this change can be visualized by TrendRisk Bandwidth indicator. The algorithm for calculating TrendRisk bands is set by default on a ratio of up moves and down moves for a 14 time-unit period, and the period can be changed by tapping on “Trendrisk Bandwidth” from the “Indicators” menu. The purpose of TrendRisk Bandwidth is very simple: to detect imbalances in the market and generate signals that can help us gain from these imbalances. The calculation of TrendRisk Bandwidth is easy to understand, as it doesn’t use standard deviation or any other complicated statistical algorithm. Levels above 0.010 indicate high volatility, and levels below 0.007 indicate low volatility.
10.2.4. TrendRisk Percent
TrendRisk Percent gives quick reference if prices are below or above the TrendRisk Tip Bands. This indicator shows the location of the most recent close price relative to the TrendRisk Bands as well as to what degree it is above or below any of the bands. If the close price is equal to the Tip Up, TrendRisk Percent will be 100 (percent). If the close price is equal to the Tip Down, TrendRisk Percent will be 0.0. A TrendRisk Percent value of 50 means the close price is equal to Tip Center band. Furthermore, readings above 100 and below 0 indicate that the close price is outside of the TrendRisk Bands by a corresponding percentage of the TrendRisk Bandwidth. A TrendRisk Percent value of 125 means that the close price is above the Tip Up band by 25% of the Bandwidth. A TrendRisk Percent value of -25 means that the close price is below the Tip Down Band by 25% of the Bandwidth.

Copyright © ThinkMarkets 2017 24
Mac OS Help Manual
11. TrendRisk Scanner
This market scanner filters the highest reward-risk trading opportunities based on TrendRisk System algorithm. You can access TradeRisk Scanner from the menu bar above the Quotes grid. The TR scanner is a valuable tool for identifying potential trades. The process of identification is based on a reward/risk ratio, calculated by two parameters:
• The distance between last price and the target level, defined by the TrendRisk system
• The distance between the last price and the stop level, defined by TrendRisk Stop Band
This market scanner filters the highest reward-risk trading opportunities based on TrendRisk System algorithm. The highest the reward/risk ratio, the more attractive is the potential trade. TrendRisk (the TrendRisk bands, TrendRisk indicator, TrendRisk target) is not a trading system which gives you information when to enter a position. It’s a tool that gives signals about the potential reward at a certain level of risk, but every trader must make his own decision whether or not to place a trade. Stop and target levels depend on which phase of the trend the market is currently in. In an uptrend, the target level will be located above the Stop Tip Up band, and the stop level will be at the Stop Tip Down band. In a downtrend, the target level will be somewhere below the Stop Tip Down line, and the stop level will be defined by the Stop Tip Up band. TrendRisk Scanner provides static information for the selected time frame. In order to update this information, users shall tap on the “Refresh” button. Except the reward/risk ratio, TrendRisk Scanner also displays the level of the Stop Tip band (Stop Tip Up or Stop Tip Down, depending on the direction of the trend), the recommended Close and Target levels (for the respective timeframes). Users can also see the time of last refreshment of the TrendRisk Scanner. From the top menu bar you can sort trading opportunities by time frame, security and Risk/Reward ratio. You can apply filter option from the gear icon in the to right corner. You can open positions directly from TrendRisk Scanner by tapping on a currency pair. The orders will automatically include TrendRisk Stop Loss and Take Profit levels. You can also open a currency chart by touching one of the currency pairs in TrendRisk Scanner list.

Copyright © ThinkMarkets 2017 25
Mac OS Help Manual
12. Alarms & Event Alerts
12.1. Price/Indicator Alarms
Trade Interceptor Alarms are cloud-based, which allows you to configure and receive them on any mobile and desktop application. You will be notified on your mobile device through push notification message, even when the Trade Interceptor app is closed. On the Mac you will get notification even when the app is not running. Trade Interceptor Alarms can be based on prices, indicators, or a combination of both. For example: “If EUR/USD price is higher than 1.33, and if the Moving Average crosses over the EUR/USD price”.
12.2. Set/Modify Alarms from chart
Right-click on a chart and select "Alarms" from the pop-up menu
12.2.1 Add a price alarm
Right-click on the chart and select “Alarms” from the context menu. Select "Add Price Alarm” from the bottom bar. Click and drag to set the alert level. The new alarm will appear on the chart and it will automatically be added to the list of alarms in the left-hand sidebar section where the Alarms menu is. You can modify the alarm by clicking on it on the chart and selecting “Modify” or “Delete”. To modify it, just drag it to the new level.
12.2.2 Add an indicator alarm
To add an indicator alarm: Select "Add Indicator Alarm” from the bottom bar. First select the Left Expression then select an indicator. Then choose the condition (“greater than" or "less than"). Finally select the Right Expression (Value / Indicator / or Price). “Price” is the real-time price. If you select "Indicator", select another indicator on the charting screen. To set an indicator “Value” click the indicator pane to select a level. To modify an Indicator Alarm, go to the sidebar Alarms menu. Tap “Save” to add the new alarm. To exit the alarm mode, tap "Close" in the bottom bar below the chart.
12.2.3. Edit/group alarm conditions
To edit and group alarm conditions. You can edit alarm conditions, or group multiple conditions in a single alarm from the Alarms menu.

Copyright © ThinkMarkets 2017 26
Mac OS Help Manual
12.3. Set/Modify Alarms from Alarms Menu
In the sidebar section select “Alarms” bell icon on top.
12.3.1. Add an alarm
To add a price alarm: Select “+” in the bottom left corner. Add Left Expression (Price or Indicator) Select condition. Add Right Expression Click the button "Create" to confirm and create the new alarm.
12.3.2. Modify an alarm
To modify an alarm: Click an existing alarm and right-click on it Select "Edit Alarm Condition". Make changes and tap on “Modify” to confirm changes.
12.3.3. Set multiple conditions
Set multiple conditions Open the Alarm list in the sidebar section. Select an alarm, drag and drop it next to another alarm. This will combine conditions and the new alarm will trigger only when all conditions are true.
12.4. Economic event alerts
Click the Calendar icon in the top menu of the sidebar. Set event alerts, by right-clicking an event and configuring your alert.
13. Live News
Professional news are broadcasted round-the-clock, covering global market events as they
happen, thanks to the insights of FXWirePro newswire experts.
You receive instant coverage of all macroeconomic, geo-political and market moving news events, as they happen, including real-time alerts for Economic Indicator releases and round-the-clock coverage during Asian, European and American trading hours. The news feed broadcasts an average of 700 news items per day. To view news headlines, select “News” from the main menu. At the bottom of the news list you can allow or mute the sound for incoming new messages from the news feed.

Copyright © ThinkMarkets 2017 27
Mac OS Help Manual
14. Economic Calendar
To view the Economic calendar, click on the calendar icon form the main menu. You will be able to view past and future economic events, filter important events by using the “gear” icon in the bottom left corner, set event alerts. Event calendar alerts are available to Live and Premium Service users.
16. Desktop synchronization
You can use Trade Interceptor for Mac with the same username and password as the one you registered for any Trade Interceptor application. All Trade Interceptor applications are fully synchronized.
17. Traders Gym
17.1. What is the Traders Gym?
Traders Gym is an innovative feature of Trade Interceptor allowing traders to simulate trading
in the past. It is ideal for testing various strategies and train with real past trading data. You
can trade various currencies on various time frames, just like in a real market environment.
With Traders Gym you can speed up the testing and learning process tremendously. You won’t
need to loose time with demo accounts to test if a strategy is profitable or not. No matter if
you are a beginner or an experienced trader, you will find Traders Gym irreplaceable in
mastering your trading strategy and improving your trading skills.
17.2. What are the main advantages of Traders Gym?
• Chose the time period in which you want to test a strategy
• Chose the starting date of your trade
• Control the speed of the testing process
• Choose among real past-data feeds from various brokers
• Choose among 7 major currencies for your account
• Use the leverage that your broker offers
• Fund your account with the exact amount that you want to trade in real environment
• Select options to simulate deposits and withdrawals
• Generate reports for your trades

Copyright © ThinkMarkets 2017 28
Mac OS Help Manual
17.3. How to get started
17.3.1. Log in
After you launch Trade Interceptor on your Mac computer, log in “Traders Gym”. You can log
in with the same username and password as in Demo or Live mode.
17.3.2. Register a paper trading account
After logging in, you will see a charting screens and the trading control panel. Click on “Add
Trading Account” and set the account name, deposit amount, the account’s currency and the
leverage that you will use.
17.3.3. Set the instrument and the time interval for which you want to simulate a trade
The next step is to select the instrument that you want to trade and a time interval for which you want
to perform a trade.
Click on the “+” symbol in the top left corner of the charting window and set the simulated
trading configuration. You can choose the price feed, instrument, price type and timescale.
Then you can set the time interval for the simulated trade and the date on which to place a
trade.

Copyright © ThinkMarkets 2017 29
Mac OS Help Manual
17.3.4. Start the simulation
When you are ready with the above settings, place your trade from the Buy/Sell buttons in
the upper right corner of the chart or by right-clicking on the charting pane.
Then go to the market Player (below the chart) and click on the start button. You can play the
simulation automatically, pause it, or forward/rewind candle by candle. When the testing
period finishes, you will see a notification “Simulation over. End of data reached”.
17.3.5. Control the simulation speed
You can control the simulation speed from the bar below the charting screen.

Copyright © ThinkMarkets 2017 30
Mac OS Help Manual
17.3.6. Control each candle’s movements
You can control the movements within each candle using the drop-down menu below the
charting screen. For example, if you are simulating trading on 1H time frame, and you set 1
min from the drop down menu, you will see how the candle moves 60 times before
completion. If you are simulating trading on 1H time frame, and you set 15 min from the drop
down menu, you will see how the candle forms in 4 steps before completion.
17.4. How to see a position on the chart
Right-click on a position (active, pending or closed) and select “Open chart”.
17.5. Modify an order
Right-click on an active or pending order and select “Modify order”
17.6. Close an order
Right-click on an active or pending order and select “Close order”

Copyright © ThinkMarkets 2017 31
Mac OS Help Manual
17.7. Run a report
You can generate a summary of all your trades when you click on “Trading report” from the
account panel.
17.8. Delete a position
Right-click on a position (active, pending or closed) and select “Delete position”. After
deleting, the position will not be visible in the Trading report or in the accounts panel.
17.9. Simulate deposit/withdraw
You can simulate deposit or withdrawal when you click on the gear icon from the account
panel.
17.10. Add new paper account
You can create a new paper trading account by clicking on the “+” sign from the accounts
panel.
17.11. Delete a paper account
Click on the gear icon from the account panel and select “Delete account”
17.12. Chart types, tools, indicators
Please read section 5 of the Help Manual