Help File - Academics | dss lab
99
10/4/2018 Help File https://web5.marketplace-live.com/engine.php?tpl=help&instructorID=10353&sessionID=9c643fdc8c13b099d714380554bb28c1&quarter=9&languag… 1/99 Help File International Corporate Management A. Introduction to Marketplace 1. Game Scenario 2. How to Win 3. Decisions to be Made by Quarter B. Player Activities 1. Functional Organization of the Executive Team 2. Goals and Strategic Direction 3. Company Name 4. Executive Briengs C. Market Research 1. Initial Research: Market Opportunity Analysis (MOA) 2. Types of Information Available 3. Precision of Survey Data 4. Interpreting the Survey Data 5. Understanding What Customers Value 6. Test Marketing: Feedback and Control 7. End User Feedback: Fast Tests 8. Competitive Benchmark D. Brand Management 1. Brand Management Decisions 2. Brand Design 3. Match-up Benets and Features 4. Consider the Price the Market Will Bear 5. Evaluate the Effects of Brand Design on Production 6. Test Market To Discover the Performance Response Curve 7. Brand Name 8. Brand Loyalty 9. Research and Development 10. Licensing R&D E. Advertising 1. Planning the Advertising Program 2. Ad Copy Design 3. Deceptive Advertising 4. Media Placement 5. Advertising Effectiveness F. Sales Oce 1. Territory Development 2. Sales Oce Management 3. Brand Selection 4. Brand Price 5. Costs of Production and Operations 6. Price Elasticity 7. Competitive Prices 8. Price Rebate 9. Sales Order Priority 10. Point of Purchase Displays 11. Sales Force Management 12. Number of Sales People 13. Target Market Specialty
-
Upload
khangminh22 -
Category
Documents
-
view
3 -
download
0
Transcript of Help File - Academics | dss lab

10/4/2018 Help File
https://web5.marketplace-live.com/engine.php?tpl=help&instructorID=10353&sessionID=9c643fdc8c13b099d714380554bb28c1&quarter=9&languag… 1/99
Help File
International Corporate Management
A. Introduction to Marketplace1. Game Scenario2. How to Win3. Decisions to be Made by Quarter
B. Player Activities1. Functional Organization of the Executive Team2. Goals and Strategic Direction3. Company Name4. Executive Brie�ngs
C. Market Research1. Initial Research: Market Opportunity Analysis (MOA)2. Types of Information Available3. Precision of Survey Data4. Interpreting the Survey Data5. Understanding What Customers Value6. Test Marketing: Feedback and Control7. End User Feedback: Fast Tests8. Competitive Benchmark
D. Brand Management1. Brand Management Decisions2. Brand Design3. Match-up Bene�ts and Features4. Consider the Price the Market Will Bear5. Evaluate the Effects of Brand Design on Production6. Test Market To Discover the Performance Response Curve7. Brand Name8. Brand Loyalty9. Research and Development
10. Licensing R&D
E. Advertising1. Planning the Advertising Program2. Ad Copy Design3. Deceptive Advertising4. Media Placement5. Advertising Effectiveness
F. Sales O�ce1. Territory Development2. Sales O�ce Management3. Brand Selection4. Brand Price5. Costs of Production and Operations6. Price Elasticity7. Competitive Prices8. Price Rebate9. Sales Order Priority
10. Point of Purchase Displays11. Sales Force Management12. Number of Sales People13. Target Market Specialty

10/4/2018 Help File
https://web5.marketplace-live.com/engine.php?tpl=help&instructorID=10353&sessionID=9c643fdc8c13b099d714380554bb28c1&quarter=9&languag… 2/99
14. Brand Promotions15. Special Sales Force Programs16. Web Sales Center
G. Human Resource ManagementH. Manufacturing
1. Production Facility Location2. Fixed Production Capacity3. Forecasting Capacity4. Seasonality5. Operating Production Capacity6. Production Scheduling7. Market Pull to Determine Production Schedule8. Daily Production Schedule9. Target and Replenishment Points
10. Unwanted Inventory11. Quality Improvement12. Quality Strategy Options13. Key Quality Questions14. Quality Decisions by Quarter15. Quality Improvement Decision Example16. Table 7-1: Important Quality Improvement Decisions17. Table 7-2: Illustrating Costs for Components18. Table 7-3: Examples of Quality Decisions for Components
I. Accounting1. Accounting Statements2. Pro Forma3. Activity Based Costing (ABC)4. Financial Planning and Analysis5. Earning a Pro�t6. Bankruptcy7. Independent Auditor
J. Finance1. Funding Sources2. Equity3. Debt Financing4. 3 Month Certi�cate of Deposit5. Depreciation6. Payment to Business Partners
K. Guidelines for Preparing the Tactical Plan for the Business Plan1. How to Proceed2. Working the Details
L. Guidelines for Preparing Pro Forma Financial Statements for the Business Plan1. Working the Details
M. Balanced ScorecardN. Glossary
1. Brand Components2. Fatal Errors

10/4/2018 Help File
https://web5.marketplace-live.com/engine.php?tpl=help&instructorID=10353&sessionID=9c643fdc8c13b099d714380554bb28c1&quarter=9&languag… 3/99
A. Introduction to Marketplace
1. Game Scenario2. How to Win3. Decisions to be Made by Quarter
A vast array of decisions must be made to compete in Marketplace. These decisions are patterned after real-world decisionsmade by new venture �rms. Each decision has been limited to its most important dimensions in order to keep the gamemanageable. Still, there is su�cient complexity and realism to challenge you to the maximum.
The real challenge in the game, and in real-life new ventures, is that you must continually make a large number of concurrentstrategic and tactical decisions. There is no rest from the advertising decision or the market development decision while yousolve the pricing decision.
Not only do you have to worry about the tradeoffs within each decision area, but you must also evaluate the tradeoffsbetween decision areas. Part of the value of the Marketplace experience is learning to manage a dynamic and complexworld.
Marketplace will also give you practice in strategic and tactical decision making. After identifying your options, weighing theadvantages and disadvantages of each, you must commit yourself to a course of action.
The outcome of that action will always be uncertain, but you will �nd that you can make educated guesses and learn fromthe results of these decisions in the next quarter. You can then make adjustments so that even questionable decisions canbe managed (our hindsight is so much better than our foresight).
The content, context, and educational objective of each decision to be made in the simulation are reviewed in the chaptersfound under the Help �le icon. This help �le contains a conceptual discussion of the decisions that you must make. Thematerial found here will help you become familiar with every step in the decision process. The decisions are presented inapproximately the order in which they would be executed in the real world, starting with executive team formation, throughmarket analysis, brand design, manufacturing, advertising, distribution, and �nancing. This step-by-step process will help youorganize your decision making while playing the game.
It is recommended that you �rst review all the material found in each chapter in its entirety in order to get a feel for the"whole" of the decision context. Next, sit down at your computer and work your way through each decision to be made. It isimportant that you physically enter decisions and investigate the effects of alternate decisions. This form of "hands-on"experience will help familiarize you with the consequences of your decisions.
Finally, Table 1-1 will help you organize your work throughout the simulation exercise. Table 1-1 contains a list of the speci�cdecisions that must be made each quarter.
Game Scenario
Your executive team is about to enter the microcomputer business. You will be responsible for introducing a new line ofmicrocomputers into several international markets.

10/4/2018 Help File
https://web5.marketplace-live.com/engine.php?tpl=help&instructorID=10353&sessionID=9c643fdc8c13b099d714380554bb28c1&quarter=9&languag… 4/99
Within the PC industry, other �rms will be entering the market at the same time as your division. To keep the scenario simple,assume the microcomputer industry is in its introductory stage of the product life cycle. That is, there is no history and thereare no established competitors. Furthermore, assume that all competitors, including your own division, will start with exactlythe same resources and knowledge of the market.
All manufacturers will sell through company-owned sales o�ces in major metropolitan markets around the world. Yourtarget market will be the business sector. You will not be selling to the home market, and you will not sell through retailstores. Thus, your marketing strategy will be tightly focused on direct sales to business customers.
There are �ve market segments to serve in the PC market. They are referred to as the Costcutter, Workhorse, Traveler,Innovator, and Mercedes segments. The accompanying chart illustrates the positioning of the �ve segments on the priceand performance dimensions. The size of each circle indicates the relative size of the market for each segment.
Market segmets
Each segment has different needs and wants and requires a differentmarket strategy to appeal to it. One of your �rst decisions will be toselect one or two segments to target. Having selected your targetmarket(s), you will develop and execute a very focused strategy topro�tably serve each segment.
The Costcutter segment is a large segment that is looking for acomputer that's very easy to use for basic o�ce applications. Thesegment is extremely price sensitive.
The Workhorse segment is the largest group of customers. They wantan easy to use PC for o�ce workers. It should also have a modestprice.
The Traveler segment wants a practical computer to use on the road.Traveler customers are executives and sales people who travel a greatdeal. This segment is also price sensitive.
The Mercedes segment is looking for a high performance computer to use in engineering and manufacturing applications.Mercedes customers are willing to pay extra for the high performance.
The Innovator segment is a small segment that needs a computer to handle large computational problems (accounting,inventory management, engineering). This segment wants the latest technology and will pay a small premium for this highperformance.
Investment timeline
As the executive team, you will provide the seed capital (investment money) to start up your business. You can use thismoney to build a production facility, open sales o�ces, and design brands. The executive team will invest 1,000,000 in eachof the �rst 4 quarters. Up to an additional 5,000,000 will become available in the �fth quarter from venture capitalists, for atotal of up to 9,000,000.
Your executive team has the next two to three years (eight to twelve quarters or decision periods, depending on how theexercise was set up by your instructor) to get this company off the ground. Within this time frame, you should become a self-su�cient �rm, earning substantial pro�ts from your operations.
Balanced Scorecard
A Balanced Scorecard will be used to measure your �rm's performance. The team's total business performance will be basedupon its �nancial performance, �nancial risk, market performance, marketing effectiveness, investment in future, wealth,asset management, human resource management, and manufacturing productivity. Starting with the fourth quarter, theteam can check its own performance by viewing the Balanced Scorecard in the Performance Report section.
How to Win
The formula for success in business and marketing is very simple. Make lots of people happy and you can earn a lot of money.
Here are the rules:

10/4/2018 Help File
https://web5.marketplace-live.com/engine.php?tpl=help&instructorID=10353&sessionID=9c643fdc8c13b099d714380554bb28c1&quarter=9&languag… 5/99
Find out what people want.Give them what they want.Tell them you have what they want (advertise).Hire sales people to explain how you have the solution to their needs (distribution and sales force management).Collect the money for a job well done.
Sounds easy, right? Of course, there are a couple of things that get in the way.
First, not all customers are alike. One offer will not work for everyone. People have different tastes, preferences, needs, etc.
As a result, many potential customers will wait until they �nd the "right" solution for their needs. To paraphrase a famousquote, you can satisfy some of the people all of the time, but never all of the people all of the time. So, demand may not beas great as you would like or hope.
The way around this problem is to discover the differences in needs among your customers (market research), break thecustomers down into smaller groups with similar needs (segmentation), and then develop a strategy for each group (targetmarketing).
Second, everyone wants more for less. A lower price for the same goods should help in generating more demand and takingbusiness away from your competition.
Sure, you would like to sell for less, but you have to pay your expenses and earn a pro�t.
One solution to this pricing dilemma is often found in larger sales volumes. If you can generate large sales volumes,production costs per unit will usually drop dramatically. Lower costs for the goods sold will allow you to lower your pricesand/or increase your pro�ts.
How do you create larger sales volumes? Offer a better product at a better price and tell everyone about it (advertising andsales force).
Third, there will always be someone that wants to make money in the same market as you. Competitors will always emergeand try to take your sales and pro�ts.
How will they do this?
Smart competitors will study the customers' needs PLUS study what you have to offer (benchmark) and then create and sella better solution. Usually, they �nd a group (segment) whose needs are not well served and then develop a superior strategytargeted at that group.
Fourth, customers will always gravitate towards the better offer.
Your job is never done. You must always check your offer against the customers' evolving needs (satisfaction level) and thatof the competition (benchmark) and make sure you have the better product, price, promotion, and distribution.
In a nutshell, be the best at giving the customer what the customer wants. Then advertise to the customers about how goodyou are at meeting their needs. This should create lots of sales that will drive down your costs and thus allow you to offergood prices with good pro�ts.
Of course, it is not this easy, but this is the essence of business and marketing.
Keep these guidelines in mind as you compete in Marketplace. If you follow them, you will be successful. You will be awinner in Marketplace!
Good luck!
Decisions to be Made by Quarter
Note: Be prepared to justify your decisions, and explain the rationale used to form them.
Quarter 1: Organize the �rm.
Determine desired image of companyDesignate a company name
Focus on process of working as a team to achieve goals

10/4/2018 Help File
https://web5.marketplace-live.com/engine.php?tpl=help&instructorID=10353&sessionID=9c643fdc8c13b099d714380554bb28c1&quarter=9&languag… 6/99
Assess team skills and work styles, then assign corporate responsibilities and leadershipOrganize the work and establish personal goalsDetermine how to manage the organization and establish team norms
Sell common stock to executive teamContract for market survey
Quarter 2: Evaluate market opportunities, setup operations, and prepare for test market.
Review market survey results - evaluate segments, markets, and potential competitionAnalyze market opportunities
Establish corporate goals and strategic directionSelect target segmentsWrite mission statementSpecify and rank order corporate goalsEstablish strategic direction
Create customer value - match components to bene�ts (Quality Function Deployment)Design initial brands for test marketEvaluate impact of different components on changeover costs and scale economies
Select test marketsOpen sales o�cesOpen a web sales center (Optional)
Setup manufacturing operations - compare regional cost differences of labor and distribution on production facilitylocation and evaluate economy and liquidity of different capacity investments
Build production facilityInvest in �xed production capacity
Sell common stock to executive team
Quarter 3: Go to market to test strategy, and market assumptions.
Human resourcesEstablish sales force compensation packageEstablish production worker compensation package
Sales o�ce managementHire sales people - choose segment training (optional)Set brand prices - price promotionsSet sales priorityChoose POP displaysOpen new sales o�ces (optional)Hire and assign web sales center staff (If applicable)Select web tra�c and productivity tactics (If applicable)
AdvertisingAd copy designMedia placement and ad frequency
Establish production plan for quarterForecast demand by brandSet the current quarter production schedule - operating capacity, target and replenish points and productionrulesRun production simulation
Budget market researchSell common stock to executive teamCompute pro forma cash �ow
Quarter 4: Evaluate test market performance and revise strategy, become a learning organization.
Evaluate �nancial performancePro�tability analysis
Evaluate market performanceCustomer opinion - brand designs, prices, advertising, and sales forceMarket demand - by company, brand, and per sales personCompetitor tactics - segments targeted and selection of marketing tactics
Budget market researchRevise marketing tactics as needed, and continue test marketing
Brand designsBrand prices, price promotions, priority, and POP displays

10/4/2018 Help File
https://web5.marketplace-live.com/engine.php?tpl=help&instructorID=10353&sessionID=9c643fdc8c13b099d714380554bb28c1&quarter=9&languag… 7/99
Sales o�ce locationsSales force numbers and assignmentsWeb sales tacticsCompensation packagesAdvertising copyMedia placement and frequency
ManufacturingReview production results from previous quarterOperating capacityTarget and replenishment pointsProduction rulesRun production simulationQuality ImprovementChangeover investmentInvest in �xed production capacity (optional)
Budget market researchSell common stock to executive teamCompute pro forma cash �ow
Quarter 5: Seek external funding - prepare business plan and negotiate equity investment.
Evaluate �nancial performancePro�tability analysis
Evaluate market performanceCustomer opinion - brand designs, prices, advertising, and sales forceMarket demand - by company, brand, and per sales personCompetitor tactics - segments targeted and selection of marketing tactics
Develop two year business planGoals - marketing, �nancial and ownershipMarketing strategyManufacturing strategyFinancial strategyPro forma cash �ows and �nancial statementsSize of equity request, number of shares offered, and share price
Present business plan to venture capitalists and negotiate equity investment (consult your instructor or theMarketplace processing center for details)Begin global roll out of business planInvest in R&D for new technologyExpand marketing tactics
Brand designsSales o�ce locationsSales forceWeb sales tacticsCompensation packagesAdvertising copyMedia placement and frequency
ManufacturingReview production results from previous quarterOperating capacityTarget and replenishment pointsProduction rulesRun production simulationQuality ImprovementChangeover investmentInvest in �xed production capacity (optional)
Budget market researchCompute pro forma cash �owPrepare tactical plan
Quarter 6: Monitor, improve, and execute.
Evaluate team - self assessment of roles played, contributions made, and adjustments neededEvaluate performance - �nancial, marketing, and market research surveysSkillfully adjust strategy

10/4/2018 Help File
https://web5.marketplace-live.com/engine.php?tpl=help&instructorID=10353&sessionID=9c643fdc8c13b099d714380554bb28c1&quarter=9&languag… 8/99
Unanticipated competitive movesFinancial capability
Marketing - make incremental changes in tacticsUse activity based costing (ABC) to evaluate pro�tability of brands and sales o�cesConduct demand analysis to estimate brand, price, advertising, and sales force elasticity
Brand designContinuously improve component selection (R&D)Introduce new brands with new R&D componentsExplore R&D licensing opportunities and strategic alliances
Human resourcesCompensation packages
Sales channelsSales o�cesSales forceWeb sales tactics - increase visitor sales and customer satisfaction
AdvertisingAd copy ratingsMedia placement and frequency
Manufacturing - improve production economiesQuality ImprovementChangeover investmentInvest in �xed production capacity
Budget market researchCompute pro forma cash �owMake adjustments to tactical plan
Quarters 7 & 8: Continue to monitor, improve, and execute.
Manage strategyUnanticipated competitive movesFinancial capability
Marketing - make incremental changes in tacticsUse activity based costing (ABC) to evaluate pro�tability of brands and sales o�cesConduct demand analysis to estimate brand, price, advertising, and sales force elasticity
Continuously improve judgment ratingsBrand rating - R&DPricing - price promotionsAd copyReliability - quality improvement
Human resourcesCompensation packages
Manufacturing - improve production economiesQuality ImprovementChangeover investmentInvest in �xed production capacity
Budget market researchCompute pro forma cash �owMake adjustments to tactical plan
Final Quarter: Report to the board.
Evaluate team performance - self assessment of roles played, contributions made, and adjustments neededEvaluate �nancial performance
Pro�tability analysisEvaluate market performance
Customer opinion - brand designs, prices and advertisingMarket demand - by company, brand, and per sales personCompetitor tactics - segments targeted and selection of marketing tactics
Report to board on operations since presentation of business planMarket and �nancial performanceValuation of the �rmDepartures from plan, justi�cation
Present plan for the future

10/4/2018 Help File
https://web5.marketplace-live.com/engine.php?tpl=help&instructorID=10353&sessionID=9c643fdc8c13b099d714380554bb28c1&quarter=9&languag… 9/99
B. Player Activities
1. Functional Organization of the Executive Team2. Goals and Strategic Direction3. Company Name4. Executive Briefings
This chapter focuses on the functional organization of the executive team. It begins with recommendations for organizingyour executive team in terms of functional assignments. There is also a description of how to record your company nameand team responsibilities in the decision template.
The balance of the chapter is devoted to possible discussion topics with the Chairperson of the Board. These topics will beuseful as you prepare for your regular executive brie�ngs with the Chairperson (Instructor). They will also suggest issuesthat you should be considering as you work through the exercise from one quarter to the next.
Learning Objectives: The primary objective of the team effort is to learn how to work with others in order to accomplishbusiness objectives. This team-based exercise will help you to understand how work gets done by dividing responsibilities,depending upon others to carry out their assignments, and ful�lling one's own responsibilities.
At the same time, you will learn that con�ict is inevitable because of differences in viewpoints, training, experience,motivation, ability, perceptions of workload, and effort. Because you cannot walk away, you must �gure out how to work withothers and move the organization forward to accomplish its tasks and excel in the market.
A second objective of the team effort is to develop your critical thinking skills in business. A very large part of the learningthat occurs in the Marketplace results from the team debates and interactions. High-level thought processes are required tounderstand, inform, and persuade one's colleagues on a continuous stream of interconnected issues.
Concepts Emphasized
Organization: Division and assignment of tasks.
Team work: Pulling one's weight, helping others to accomplish their tasks, working for the good of the team rather thanfocusing only on one's own needs and rewards.
Leadership: Figuring out where to go and how to get there, guiding the team, setting priorities, organizing the work, takinginitiative, helping others, and resolving con�ict.
Time management: Setting priorities, organizing the work and completing it according to priorities, being e�cient in workingwith others and in one's own work.
Con�ict management: Recognizing con�ict, separating issues from personalities, working toward solutions based uponbusiness needs and consideration for the individual. Being willing to:
1. Consider other viewpoints.2. Compromise.3. Support team decisions.4. Not dwell on the past, but focus on the future.
Functional Organization of the Executive Team
One of your �rst responsibilities in setting up your new venture will be to organize your executive team and assignresponsibilities. This task is critical because Marketplace requires more work than any one person can do.
It is not e�cient for everyone to participate in all aspects of the business. Ultimately, team organization and managementwill determine team effectiveness and the team's satisfaction in working together.
Teams may have members rotate positions periodically, so that everyone experiences more than one decision area. Theadvantage to this approach is that the participants develop a good feeling for all of the decisions to be made. It also helpsthe team members to develop a common frame of reference.
Functional Roles

10/4/2018 Help File
https://web5.marketplace-live.com/engine.php?tpl=help&instructorID=10353&sessionID=9c643fdc8c13b099d714380554bb28c1&quarter=9&langua… 10/99
There are many ways to divide the team's responsibilities. Here are the possible executive assignment categories:
President - Overall Leadership: Coordinates all functional areas, participates in all areas, setting objectives,organizing and assigning work, managing schedules and meetings, monitoring overall performance (balancedscorecard) and managing the team to lead the industry.Vice President, Marketing: Delivery of customer needs through brand design, pricing, ad copy design and mediaplacement.Vice President, Sales Management: Distribution (location and timing of sales o�ces and web sales centers),selection and funding of web tra�c and productivity tactics, and sales force management (number, targeting, trainingand incentives).Vice President, Manufacturing: Capacity planning, production scheduling, and quality improvement.Vice President, Accounting and Finance: Financial performance, cash �ow management, pro�t analysis, and capitalstructure.Vice President, Business Analytics: Analysis of market and operational data.Vice President, Human Resources: Compensation plans and worker productivity.
There are many variations on this division of tasks. For example, in a �ve-person team the president would also beresponsible for one of the six VP assignments and the VP of Accounting and Finance could also perform the role of VicePresident of Human Resources.
You could have the leadership responsibility rotate through the team at appropriate points so that almost everyone obtainsleadership experience. For example, one team member could be the leader during the start-up phase, a second membercould be the leader during the preparation of the business plan and negotiations with venture capitalists, a couple ofmembers could be the leaders during the growth phase of the business, and a �nal person could be the leader during thepreparation and delivery of the �nal report. This is an excellent format if your group has six members.
Other variations to the team assignments will depend upon the number of participants. If your group has four members,consider assigning the President a VP responsibility, and combining the VP of Accounting and Finance with the role of VP ofHuman Resources, and the VP of Marketing with the role of VP of Business Analytics.
Another way to organize your team is to use the brand management format. There would still be a President and VicePresidents, but in this case, a brand management position would be assigned for each brand or segment that is to betargeted. Thus, one individual would be responsible for their normal role as President or Vice Presidents plus all of themarketing research, marketing, and sales for an individual brand or segment.
The advantage of this format is that one individual is in charge of knowing all there is to know about a segment of themarket and is responsible for developing an effective strategy. It also provides a broader base of experience for more peopleon the team. The disadvantage is that competition can develop among brand managers as they vie for the resources andattention of the �rm.
A variation on brand management is territory management. Once again, there would still be a President and Vice Presidents.The team is broken up into city managers, and each city manager is in charge of knowing everything about a city anddeveloping an effective strategy for competing in that city.
Keep in mind that these guidelines are merely suggestions. Feel free to depart from these guidelines if individualpreferences, experiences, or workloads would allow a more equitable allocation of tasks. Also, do not hesitate to reallocateresponsibility if con�icts arise or the workload is unevenly distributed.
Team Management
Consider the following points about team management. First, very few new ventures succeed without strong leadership,shared goals, a willingness to compromise, a strong work ethic, and a willingness to carry one's share of the burden.
You will have a very short time to organize your �rm and bring it on-line as an effective, hard-hitting business enterprise.None of you can do it alone. You must learn to work as a team with everyone pulling his or her weight in the same direction.
Second, con�ict within the team is inevitable. This is because you must make some tough decisions that are �lled withuncertainty and risk. You will never have enough information or enough resources to do all that you want.
Furthermore, members of your executive team will have con�icting opinions on strategy, tactics, and resource management.The ability to resolve con�ict and the manner in which it is resolved may very well make the difference in whether or not youcan succeed in business.
Finally, time management will be vital to your success in playing Marketplace. There is more to do than you have time for.Many teams get bogged down in executive committee meetings.

10/4/2018 Help File
https://web5.marketplace-live.com/engine.php?tpl=help&instructorID=10353&sessionID=9c643fdc8c13b099d714380554bb28c1&quarter=9&langua… 11/99
As a suggestion, the president should preside over each executive meeting, making sure that the discussion does notwander from the business at hand. Each team meeting should begin with an agenda and a timetable. Meetings should notlast more than two hours. Long, drawn-out meetings are not productive and raise frustration levels about not getting thingsdone. The meeting should conclude with a set of action items for each executive. The outcome of these actions should bereviewed at the start of the next meeting.
To facilitate the running of executive meetings, each team member should prepare his/her work in advance. The executiveshould know the ins and outs, problems, and tradeoffs of his/her area of responsibility.
When the executive committee meets as a whole, each executive should have a plan of action to recommend to the team.The executive should be prepared to thoroughly discuss the options open to the company and be �exible on the �naldecision of the executive team.
Goals and Strategic Direction
Your company must decide the order of priority for corporate goals and your target market, as well as de�ne the company'smission statement and strategic direction.
At the outset of your business, the single most important set of decisions you will make involves de�ning your organizationgoals and strategic direction. In essence, you must choose the path you are going to take for the next year or two of yourbusiness.
The path will cause you to channel your energies, hopefully in a manner that will be productive for both you and theorganization. However, the further you go down that path, the more di�cult it will be to change direction. All of yourinvestments, both intellectual and �nancial, will be pumped into an increasingly narrower and more focused set of decisions.
The �rst task in quarter 2 is to analyze the market information that you purchased from your market research �rm. Thismarket analysis will help you to determine the available market opportunities. With this information as a backdrop, you mustmake decisions in the following areas:
Corporate Goals: your company should determine what is most important: pro�tability of company as a whole (asmeasured by retained earnings), return on investment to the Executive Team, or sales volume.Target Markets: your company should decide which market segment/s to target with your product and whichmarketing efforts will most effectively reach that market segment/s.Mission Statement: your company should de�ne the mission/purpose of your company, keeping in mind that themission statement will be read by customers, investors, and even your competition.Strategic Direction: your company should decide where it is headed in the future. What are your future goals for:market size; geographic markets; competitive posture; and distinctive competency.
In quarter 2, consider your goals and strategic direction to be tentative. As you gain experience through test marketing, feelfree to modify these initial decisions. However, by quarter 5, your strategic direction should be �rmly established. If not, youwill probably not have an opportunity to catch up with the leading teams in your industry.
Players can sell to all segments in each quarter of sales, and, in most quarters, they will. Even though they are not targeting asegment, a number of customers of the non-targeted segments may like the computers offered and buy them. Money madefrom sales to any segment will help revenues and, in turn, will positively affect certain areas of the Balanced Scorecard, suchas �nancial performance. The reason players have to designate which segments are their primary and secondary targetsegment is to enable the Balanced Scorecard to evaluate their marketing performance. If the majority of a team's sales are intheir primary target market and the second largest amount of sales is in their secondary target segment, then they will havea good score for marketing. In other words, they are meeting their marketing goals with brand and ad designs that are agood �t for those segments. If they have a large amount of sales in segments that are not their primary or secondarychoices, then their marketing scores will be lower as they are not appealing to the segments they have targeted. Thebalanced scorecard measures several factors of a �rm's performance to get a rounded view of the company's overallsuccess rather than just �nancial success. The players can see the full calculation for how the balanced scorecard isdetermined in that section of their team software and, in addition, there should also be a reference in the instructormaterials.
Company Name
Select a name for your enterprise. Start by de�ning the image you wish your company to project. Keep in mind what thename may mean to end-users, your competition, and potential investors.

10/4/2018 Help File
https://web5.marketplace-live.com/engine.php?tpl=help&instructorID=10353&sessionID=9c643fdc8c13b099d714380554bb28c1&quarter=9&langua… 12/99
A good company name is important in establishing a good �rst impression. You can use it to in�uence the expectations ofthose who do not know you.
However, your competitive behavior and style of business will ultimately de�nes your image and what your name will cometo mean. After all, while the words apple or google have no intrinsic value, Apple and Google have come to represent highlyprofessional organizations that tend to do things right.
Executive Briefings
The Chairperson of the Board (Instructor) may meet periodically with each team. The �rst meeting will be during the �rst orsecond quarter of play. During the rest of the simulation exercise, each team will meet with the Chairperson whenever a setof decisions is to be submitted.
During these executive brie�ngs, the team will review its:
PerformanceMarket analysisCurrent decisionsDecisions for the future
Each and every member of the team must be prepared to defend the analysis and the logic behind all of the team's decisionsand plans.
See below for a list of possible discussion topics for meetings with the Chairperson of the Board during each quarter:
Quarter 1
Theme: Introduction and initial goals
All Team Members should:
Explain why you want the job and why you will be good at it.Review team member selection and how each will help your company to excel.What image does your company wish to project? After two years of business, what do you want competitors to sayabout your �rm?Give name of company and rationale for its selection.
Quarter 2
Theme: What path are you going to take initially?
President:
Restate (revise) your desired company image.Establish speci�c, quanti�able corporate goals and the rationale for them.Brie�y describe segments selected for initial market development.Describe the strategic direction your executive team has established for the �rm and the rationale for such direction.
Business Analytics:
Name and describe each market segment (provide customer pro�les).Estimate market potential and demand of each segment. Explain assumptions.Estimate market potential and demand of each metropolitan market. Explain assumptions.Identify cities chosen for test marketing. Explain choices.
Marketing:
Lay out initial strategy for market development (i.e., market entry sequence by segment and geographic area). Justify.Describe brands to be produced for chosen segment(s). Justify features selected.Give names of brands to be produced and rationale for them.
Sales:
Describe expected sales strategies and tactics.

10/4/2018 Help File
https://web5.marketplace-live.com/engine.php?tpl=help&instructorID=10353&sessionID=9c643fdc8c13b099d714380554bb28c1&quarter=9&langua… 13/99
Lay out initial strategy for market development (i.e., market entry sequence by segment and geographic area). Justify.
Human Resources:
Could be the responsibility of the VP of Manufacturing for production workers and VP of Sales Management for salespeople.What is the research telling you in terms of sales force and production workers' compensation? What will be yourstrategy in terms of Human Resources management?
Production:
Describe and justify your production facility location decision.Describe and justify your production capacity decisions.
Finance:
Describe your current �nancial status.Describe how you plan to �nance your initial operating investments and expenditures.
Quarter 3
Theme: Let's go to market!
President:
How are you beginning to accomplish your corporate goals?What do you hope to accomplish in the test market?How are you functioning as a team?
Business Analytics:
Estimate market demand by segment for each brand. Explain process.What cities were chosen for test marketing?Explain your marketing research plan for the test market.
Marketing:
Lay out your marketing strategy for each brand (i.e., marketing mix). Justify your decision.Describe any new brands to be produced. Justify features selected.
Sales:
De�ne speci�c, quanti�able goals for the test market.Describe sales strategy and tactics.Do you plan to open any new sales o�ces in quarter 4? If so, why?
Human Resources:
Could be the responsibility of the VP of Manufacturing for production workers and VP of Sales Management for salespeople.Describe and justify any modi�cation to your employees' compensation packages.Explain how your efforts are aligned with your mission and corporate strategy.
Production:
Describe and justify your production facility decisions, �xed capacity.Describe and justify your production scheduling decisions. What have been the results of your productionsimulations?
Finance:
De�ne speci�c, quanti�able, �nancial goals for the test market.Describe your current �nancial status. Prepare pro forma cash �ow, balance sheet and income statement for thequarter.Justify your pricing decisions. Show how all expenditures are accounted for in your �nal selling price. Allocate eachexpenditure (by proportion) against your sales �gures.

10/4/2018 Help File
https://web5.marketplace-live.com/engine.php?tpl=help&instructorID=10353&sessionID=9c643fdc8c13b099d714380554bb28c1&quarter=9&langua… 14/99
Quarter 4
Theme: The results are in! What now?
President:
How did your performance compare to your corporate goals?How do you assess your competition?Are you planning any changes in your corporate goals and/or strategy?What do you hope to accomplish in this next test market?
Business Analytics:
What was the market's reaction to your brands, advertising and prices? How do you compare to your competition?How do in-store decisions affect market demand?How do advertising and brand design affect market demand?Revise estimates of market demand by segment for each brand.Explain your marketing research plan for the test market.
Marketing:
How did your performance compare to your business goals?How are you revising your goals and strategy for the current test market in response to the last test market?Lay out your marketing strategy for each brand (i.e., marketing mix).Describe any new brands to be produced. Justify features selected.Estimate advertising impact and �nancial effectiveness. Compare with your competitors.
Sales:
How did your performance compare to your market goals?What was your demand per sales person for each test market? How did it compare to the competition? What causedthe differences?Have your market experiences caused you to revise your goals, strategy, or tactics for the current test market?How strong is your position in each market? How can you improve it?Describe your sales strategy and tactics for each geographic market.Describe and justify your decisions to open sales o�ces.
Human Resources:
Describe how your human resources' actions are affecting your sales people and production workers' productivity.How do your compensation packages measure up relative to the competition?Describe any adjustments you are making to your HR strategy and tactics.
Production:
Review your production facility operation in the previous quarter. How much was produced and sold? Was there anyunmet demand? What are your inventory levels? What were your warranty costs? What was the capacity utilization ofthe production facility?How will you revise your daily production scheduling for the current quarter?Describe and justify your changeover and quality improvement investments.
Finance:
How did your performance compare to your �nancial goals? To other �rms in the industry?Are you revising your goals or strategy for the current test market in response to the last test market?Describe your current �nancial status. How is it affecting your ability to achieve your corporate, marketing and/or�nancial goals?Justify your pricing decisions. Using the Activity Based Costing information provided on the decision template,evaluate the contribution of each brand and region to the pro�tability of the �rm. Show how all expenditures areaccounted for in your �nal selling price. Allocate each expenditure (by proportion) against your sales �gure.
Quarter 5
Theme: So, you want $5,000,000. Discuss your business plan with venture capitalists (consult your instructor or the Marketplace processingcenter).

10/4/2018 Help File
https://web5.marketplace-live.com/engine.php?tpl=help&instructorID=10353&sessionID=9c643fdc8c13b099d714380554bb28c1&quarter=9&langua… 15/99
All Team Members should:
Prepare Tactical Plan for following quarters.Prepare Pro Forma Cash Flow for the following quarters.Describe and justify your R&D decisions.
Quarter 6
Theme: Departures from the business plan.
President:
What is your position in the market?What is your competition up to now?What trends are beginning to take shape in the market? How will they affect you?Are you on target with your business plan? Any departures? If yes, why?How do you assess your team's performance? What are your strengths and weaknesses? What changes must bemade to become a high-performance team?
Business Analytics:
Are there any changes in the market that will affect you?What is the market's reaction to your brands, advertising and prices? How do you compare to your competition?How do in-store decisions affect market demand?How does advertising and brand design affect market demand?Forecast market demand by segment for each brand.What is your marketing research plan?
Marketing:
Are you on target with your marketing goals?Are you revising your goals, strategy and/or tactics in response to competitive or customer decisions? If yes, how andwhat is the anticipated effect?Lay out your marketing strategy for each brand (i.e., marketing mix).Describe and justify your R&D decisions.Describe any new brands to be produced. Justify features selected.Estimate advertising impact and �nancial effectiveness. Compare with your competitors.
Sales:
How is your market performance comparing to your market goals? Compare your demand/sales person �gures withyour competitors. Who is ahead and why?Have your recent market experiences caused you to revise your goals, strategy and/or tactics in dealing with yourgeographic markets?Describe your most recent tactics and how they are helping or hurting you in achieving your objectives.
Human Resources:
Describe how your human resources' actions are affecting your sales people and production workers' productivity.How do your compensation packages measure up relative to the competition?Describe any adjustments you are making to your HR strategy and tactics. Explain how your efforts will impact otherfunctions.Describe and justify any deviations to your tactical plan.
Production:
Review your production facility operation in the previous quarter.Will you revise your �xed production capacity for the current quarter?How will you revise your production scheduling for the current quarter?Lay out your plan for continuous improvement. What do you hope to accomplish? What investments will be required?What is the timetable for improvement?
Finance:
How did your performance compare to your �nancial goals? To other �rms in the industry?Describe your current �nancial status. How is it affecting your ability to achieve your marketing and �nancial goals?

10/4/2018 Help File
https://web5.marketplace-live.com/engine.php?tpl=help&instructorID=10353&sessionID=9c643fdc8c13b099d714380554bb28c1&quarter=9&langua… 16/99
Evaluate the �nancial performance of each brand and sales o�ce. Allocate relevant costs and revenues using ActivityBased Costing. Which are the winners or losers?How must your marketing strategy change in light of your �nancial performance?
Quarter 7
Theme: Preparing for the big push.
President:
What is your position in the market?How does your performance compare to your stated goals?How are things shaping up for the end of the year �nale (in quarter 8)?Any surprises from your competition? The customers?Are you on target with your business plan? Any departures? If yes, why?
Business Analytics:
Are there any changes in the market that may affect you?Can you quantify the effect of brand design, pricing, advertising and various in-store decisions on customer demand?Forecast market demand by segment for each brand.What is your marketing research plan?
Marketing:
Are you on target with regard to your marketing goals?What are you doing to accomplish your end of year objectives?Lay out your marketing strategy for each brand (i.e., marketing mix). How do they all �t together into the "Big Picture"?Describe any new brands to be produced. Justify decision.Estimate advertising impact and �nancial effectiveness. Compare with your competitors.
Sales:
How does your market performance compare to your market goals?Lay out your sales force strategy for each geographic market (i.e., marketing mix). How do they all �t together into the"Big Picture"?What are you doing to win the necessary support you will need from the rest of the executive team to achieve youryear-end sales objectives?
Human Resources:
Describe how your human resources' actions are affecting your sales people and production workers' productivity.How do your compensation packages measure up relative to the competition?Describe any adjustments you are making to your HR strategy and tactics. Explain how your efforts will impact otherfunctions.Describe and justify any deviations to your tactical plan.
Production:
Review your production facility operation in the previous quarter.How will you revise your daily production scheduling for the current quarter?What are you doing to prepare the production operation for the seasonal spurt in sales in quarter 8?How are you progressing with your continuous improvement program?
Finance:
How did your performance compare to your �nancial goals? To other �rms in the industry?Describe your current �nancial status. How is it affecting your ability to achieve your marketing and/or �nancialgoals?Evaluate the �nancial performance of each brand and sales o�ce. Allocate relevant costs and revenues using ActivityBased Costing. Which are the winners or losers?How must your business strategy change in light of your �nancial performance?
Quarter 8:
Theme: Next year in a maturing market.

10/4/2018 Help File
https://web5.marketplace-live.com/engine.php?tpl=help&instructorID=10353&sessionID=9c643fdc8c13b099d714380554bb28c1&quarter=9&langua… 17/99
President:
What will the market be like next year? What are the trends/clues that lead you to this prediction?What are your predictions about your customers and competition?What are your goals for next year in light of these projected market conditions?How will your strategy have to change in the coming quarters?
Business Analytics:
Are there any trends/clues in your research and analysis that may suggest the market is evolving? What are they andwhat do they suggest about the market?In a maturing market, how will the relative importance of brand design, pricing, advertising, and various in-storedecisions change and affect customer demand?Revise your estimate of market potential by segment and geographic market.
Marketing:
How are you planning to change your marketing strategy and tactics in a maturing market? What changes do youanticipate in your product line, advertising, pricing and distribution decisions?What are your marketing goals for next year?Lay out your marketing strategy for next year (i.e., marketing mix). How do all parts �t together into the "Big Picture"?What new technologies or R&D programs should you initiate for the coming year? Where do you think the market isgoing or where do you want to take it?Estimate advertising impact and �nancial effectiveness. Compare with your competitors.
Sales:
What will it be like to do business next year? What leads you to these predictions?How strong is your position in each geographic market? How can you improve it?What are your sales goals for next year?What will be your strategy for next year?Describe and justify your sales o�ce-opening decisions for next year.
Human Resources:
Describe how your human resources' actions are affecting your sales people and production workers' productivity.How do your compensation packages measure up relative to the competition?Describe any adjustments you are making to your HR strategy and tactics. Explain how your efforts will impact otherfunctions.Describe and justify any deviations to your tactical plan.
Production:
How will production contribute to the competitiveness of your �rm in a maturing market?What are you doing to prepare the production operation for the next year in business?
Finance:
Are you revising your �nancial goals and strategy in response to market demands?Describe your current �nancial status. How will it change in a maturing market? How will it affect your ability toachieve your corporate, marketing and/or �nancial goals?Show how your expected expenditures will have to be reapportioned to improve your �nancial performance in thethird year
Final Quarter:
Theme: Review your performance.
All Team Members should:
Review Balanced Scorecard.How does your company compare to the competition?Did you achieve your objectives?What should you have done differently?Prepare a �nal report of the company's position and present to investors.

10/4/2018 Help File
https://web5.marketplace-live.com/engine.php?tpl=help&instructorID=10353&sessionID=9c643fdc8c13b099d714380554bb28c1&quarter=9&langua… 18/99
C. Market Research
1. Initial Research: Market Opportunity Analysis (MOA)2. Types of Information Available3. Precision of Survey Data4. Interpreting the Survey Data5. Understanding What Customers Value6. Test Marketing: Feedback and Control7. End User Feedback: Fast Tests8. Competitive Benchmark
Initially, your company should conduct marketing research to determine:
1. The structure of the market.2. The market requirements of customers.3. The strengths and weaknesses of competitors.
This is known as a Market Opportunity Analysis (MOA). An outside research �rm will collect the data that you will require. Allthey need to know is what you are willing to pay for the degree of precision of the survey data. Once the raw data iscollected, you should begin the task of interpreting the survey data, keeping in mind that the degree of precision you selectedcould have an effect on your interpretation.
As a starting point, prepare a market pro�le for each segment. Look for patterns within and between the segments to beginto understand what customers value.
Construction of your MOA is a continuing process which will be updated as new information such as end-user feedback andcompetitive benchmark surveys become available in future quarters.
One of the objectives of your continuing MOA must be to develop market forecasts of market potential, market demand,and/or brand/sales outlet demand. In your �rst sales quarter, you will be able to conduct test marketing on your product andother marketing tactics. In the following quarter, you will receive data on customer opinions and competitive tactics. Thistest market data should enable you to skillfully adjust your tactics in order to better serve the needs of the market andoutsmart your competition.
Learning Objective
The primary objective of the MOA effort is to give you experience in the study and evaluation of market opportunities. Thestarting point of all marketing effort is the determination of the needs and wants of the available markets and an estimationof the market potential of each segment. The �rm must then evaluate the relative cost to serve each segment versus its�nancial attractiveness.
The ultimate objective is to select one or more target markets for development. The target market decision, in turn, stronglyaffects all subsequent marketing decisions, including brand design, pricing, advertisement, media planning, and distribution.Thus, the �rst step in the process of strategic planning is Market Opportunity Analysis.
Concepts Emphasized
MOA: The identi�cation and assessment of market opportunities based upon an analysis of:
1. The structure of the market.2. The market requirements of customers.3. The strengths and weaknesses of competitors.
Value of information: Weighing the relative costs and bene�ts of more precision versus other investment options.
Market analysis: Sorting through and evaluating the information, and ascertaining the strategic implications of the �ndings.
Laddering and means-end hierarchy: Interpreting the data in terms of the linkages between bene�ts and features andbene�ts and values desired.
Forecasting: Prediction of market potential and demand based upon market data and one's assumptions regarding:
1. The accuracy of customer purchase intentions.

10/4/2018 Help File
https://web5.marketplace-live.com/engine.php?tpl=help&instructorID=10353&sessionID=9c643fdc8c13b099d714380554bb28c1&quarter=9&langua… 19/99
2. The ability of their industry to serve the market.3. The comparative advantage of your �rm versus your competition.
Initial Research: Market Opportunity Analysis (MOA)
A market opportunity analysis (MOA) is the identi�cation and assessment of market opportunities based upon an analysisof:
1. The structure of the market.2. The market requirements of customers.3. The strengths and weaknesses of competitors.
An MOA provides the foundation for designing an effective strategy to capitalize on one or more of the identi�edopportunities. At this stage in the development of your industry, it is not possible to seriously evaluate your potentialcompetitors. Just like your company, they are all entrepreneurial �rms without a track record.
After some quarters, you should be able to judge their strengths and weaknesses and use this information in your strategicand tactical planning. For now, you must focus on the end-users. They are your ultimate boss, and you must ascertain what itwill take to make them happy.
Your initial MOA should begin with an analysis of your potential customers. The marketing research data that you haveavailable are patterned after the real-world. The data has been modi�ed and simpli�ed in order to facilitate its use in thesimulation. Since the market modeled in the simulation is based upon this information, it is important for your �rm toanalyze the data.
To begin your MOA, read the topics below to learn more about:
Types of Information Available Interpreting the Survey Data Understanding What Customers Value
Types of Information Available
There are several types of initial market information that the outside market research �rm has collected for you. The majorcategories are customer needs, use patterns, media preferences, price willing to pay, industry employees compensation, andmarket size.
The data on customer needs and wants, use patterns, and media preferences will be reported for the market as a whole.Data for individual cities and regions will not be provided. Price willing to pay and market size estimates are available foreach city. Each type of information is discussed in detail below.
The �rst part of the market survey seeks to determine what bene�ts are sought by each of the �ve major market segments.Potential customers are asked to review a list of bene�ts and rate their relative importance on a scale from 1 to 100. Thesevalues are then standardized with a mean of 100.
Values between 90 and 110 are well within the norm for the population. They represent minimum performance requirementsfor a segment, but do not indicate anything unique about the segment.
It is not until the rating score exceeds the norm that the bene�t becomes an important factor in distinguishing betweensegments. You will want to be especially sensitive to the high scores because your �rm must provide that bene�t in order toappeal to the segment.
The second part of the survey will provide you with a pro�le of the product use of each segment. The pro�le includesinformation on the different categories of customers, and their speci�c uses or applications for the product. The informationis scaled in the same fashion as the bene�t list, where the mean is equal to 100.
The third type of information to be obtained is a demographic pro�le of the key decision-makers in each market segment.Data are collected relative to the media preferences of the decision makers. (Please note the decision-maker is responsiblefor the decision to purchase the product, but may not be the user of the product.) The responses are standardized with amean of 100. Again, look for distinguishing factors that are well in excess of 100.
In the fourth part of the questionnaire, potential customers are asked about their buying intentions for the next 12 months.After appropriate data manipulation, you will receive information on the price the customer would consider paying for theideal brand.

10/4/2018 Help File
https://web5.marketplace-live.com/engine.php?tpl=help&instructorID=10353&sessionID=9c643fdc8c13b099d714380554bb28c1&quarter=9&langua… 20/99
For the �fth part of the questionnaire, we again use the data from when potential customers were asked about their buyingintentions for the next 12 months. After appropriate data manipulation, you will receive information on the market size. Thisnumber is computed for you by multiplying:
the percent of customers who intend to buy (x) the number of potential customers in each segment (x) the number of units that a customer is likely to buy in the next 12 months
This information is based upon census data and the customer pro�le data described above. It is a very rough estimate andshould be used with great caution.
Again, please be cautious in using this market information. At best, these estimates are very rough projections. Buyingintentions are notorious for being wrong about actual purchases. The actual purchase rate will ultimately depend upon howwell the product is designed, priced, and distributed, as well as the condition of the economy and how well you and yourcompetition serve the market.
Precision of Survey Data
Your marketing research �rm has advised you to collect information on customer needs, wants, buying patterns, and mediapreferences. Twenty cities will be surveyed and the information will be compiled across these twenty potential test markets.To help determine market size, the information on buying intentions and the number of customers potentially in the marketwill be obtained separately for each geographic market surveyed.
How much precision should you buy? The more end users who are included in your survey, the less error you can expect inthe data, but the costs go up accordingly. Professional researchers estimate that your survey data will be accurate to withinplus or minus 15 percent of the average if only 100 end users are surveyed.
By collecting information from more potential buyers, you should be able to reduce this variance and improve your estimateof the underlying factors of market demand. A larger sample of geographically dispersed end users drawn from diverseeconomic markets and population sizes should yield an accuracy of plus or minus 8 percent, a minimum in survey research.If a large number of end users are included in the survey, accuracy should improve to plus or minus 4 or 5 percent.
Remember, this information can be used only to project market-wide trends and not regional or other sub-marketpreferences. (The precision estimate is based upon the statistical concept of the con�dence interval. The con�denceinterval used in this market research was two standard deviations, accounting for 95% of the population.)
Interpreting the Survey Data
The interpretation of research data is more art than science. The marketing research �rm will give you data. Your analysisand interpretation of the data is needed to convert it into information. Your objective should be to look for patterns in thedata. These patterns should help you understand the overall structure of the market and the subtleties of each segment.
As a starting point, prepare a market pro�le for each segment. Place each segment pro�le on a separate piece of paper.Then take each section of the survey and summarize the distinguishing characteristics of each segment.
Within each section, list the characteristics from highest to lowest priority. There is no need to provide an exhaustive list;include only those items that set the segment apart from the rest of the market.
As a caution, the precision of your data could have an effect on your interpretation of the data. Speci�cally, the rank order ofthe bene�ts sought could be altered due to chance, if your precision is low. For example, if speed was given a rating of 115and ease of use was given a rating of 120 by a particular segment, you would want to make ease of use a feature of yourproduct before worrying about speed. The higher number means that ease of use is obviously more important to the end-user than speed.
However, if your precision level is plus or minus 8 percent of the average score, then speed might really be rated 124 (115 *1.08) and ease of use might really be rated 110 (120 * 0.92). Thus, their positions could be reversed.
In this light, you will want to look for relatively large differences, given your level of precision. Attributes or bene�ts with smalldifferences in ratings should probably be treated as equally important to the end-user.
Once you have a pro�le of each segment, look for the patterns within and between the segments. There are no statisticaltechniques to help you here. You will have to draw upon your natural insight and creativity. The patterns exist; it is only amatter of discerning them.

10/4/2018 Help File
https://web5.marketplace-live.com/engine.php?tpl=help&instructorID=10353&sessionID=9c643fdc8c13b099d714380554bb28c1&quarter=9&langua… 21/99
After you have a good mental picture of the segment, give it a name, for example, "the sensory segment" as in toothpasteusers. A name will make it easier to think about the segment and discuss it with your teammates. Choose a name thatembodies the image you have of the segment. To help you out, we have given each segment a tentative name and these canbe found in the Introduction to Marketplace section.
Also, �nd a picture that conveys the type of people who use the product and how they use it. Attach it to your pro�le. (Look inmagazines that carry related ads.) Marketers for the Saturn Corporation have used this technique to help them visualize theirtarget customers.
In planning for the Saturn car, they assembled a large collection of pictures depicting their target customers and how theyuse their cars and placed them on a large bulletin board. Executives would stop by and study the board when they weretrying to resolve di�cult problems. They even held meetings in front of it. Their objective was to make sure they think of theircustomers as real people and not as abstractions or tables of numbers.
As noted above, the marketing research �rm recommends that you study the information on price willing to pay and on thenumber of customers in each segment for all metropolitan markets. This information can be used to estimate marketpotential.
As a word of caution, never forget the difference between market potential and market demand. Market demand will alwaysbe less than market potential. The rate at which market potential is converted into actual sales demand will depend upon thequality and quantity of the industry's total marketing effort. Your share of that demand will, in turn, depend upon the qualityand quantity of your marketing efforts relative to your competitors'.
As a �nal note on market surveys, keep in mind that respondents are not infallible in their responses to a researcher'squestions. On occasion, they may not give a response that re�ects their true position on an issue because they are eitherunable or unwilling to do so. As a consequence, it is extremely important that you include market testing in your MOA.
That is, design your brands and ads and set your prices in a fashion that your market survey suggests is best for your targetmarkets; then see how the market reacts to them. Customers' reactions (actual purchases) are better indicators of theirmotives than their words.
Thus, a complete MOA should include a market survey and test marketing. To obtain test market feedback on your marketoffering, you will want to purchase Market research.
Understanding What Customers Value
Once you have organized your data by market segment, your interpretative work has just begun. It is necessary to furthertranslate this data into useful information. Speci�cally, the data regarding customer needs is very helpful in understandingthe bene�ts and costs perceived in the use of the product.
But, this data tells you almost nothing about which components can deliver the bene�ts desired or avoid the costs feared.Also, the data barely touches on the values desired through product use. Customers do not buy components or features;they buy bene�ts. At a higher level, these bene�ts help users to accomplish their goals and to realize certain values or endstates.
It is your job to �gure out how to deliver the value desired. A good way to start is to apply the logic behind the means-endhierarchy. Take the most important bene�ts desired by each segment and speculate on which components or services willbe necessary to deliver these bene�ts.
Draw ladders downward linking the bene�ts with the features or components (also referred to as attributes) which can bebuilt into a new product at the production facility. Next, extend the ladder upwards and speculate on the values being soughtthrough these bene�ts.
For each segment, you need to build several ladders linking the available components to the bene�ts desired and then up tothe values to be served. Once all of the ladders have been built for each of the important bene�ts, try to bring them togetherinto a coherent whole.
The ladders and the overall means-end hierarchy will be useful in designing your new brands. In fact, this information is aprerequisite to brand design decisions. It will form the foundation of the Quality Function Deployment (QFD) techniques to beused in designing brands.
Test Marketing: Feedback and Control

10/4/2018 Help File
https://web5.marketplace-live.com/engine.php?tpl=help&instructorID=10353&sessionID=9c643fdc8c13b099d714380554bb28c1&quarter=9&langua… 22/99
You must recognize that you do not operate in a vacuum. In every case, your marketing decisions are judged on both anabsolute and a relative basis. On an absolute basis, you must satisfy the needs of a target segment if you hope to sell thatsegment any product. The more closely you match your market offer to the needs and wants of your marketplace, thegreater will be the interest in your brands.
But your potential customers do not stop with this evaluation. They also compare your market offer to the offer of yourcompetition. On a relative basis, the better offer will earn the larger share of the business. Thus, it is imperative for you toperiodically check on your competition and compare their marketing programs to your own.
To obtain feedback on your marketing plan, you need to survey your customers and monitor your competition. Yourmarketing research �rm offers two types of test market research that might be of interest - End-User Feedback andCompetitive Benchmark data.
The market research data should be purchased during the test market phase, and periodically thereafter. If your companywants to subscribe to these services, you must budget for the expenditure during the current quarter. The information will becollected during the current quarter and will be made available to you at the start of the next quarter of business. If youpurchase Market Research in the current quarter, you will be given a copy of each brand design and rating in the followingquarter.
It is not possible to collect market research data and deliver the results during the same quarter. Events are still in progressthroughout the quarter. It is not until all decisions are �nalized and submitted to the instructor that the data collection canbegin. As a result, you will always be working with information that is one quarter old.
End User Feedback: Fast Tests
The end-user feedback is in the form of fast tests. The fast tests give you a summary judgment or evaluation of currentlyavailable brands, prices and advertising copy from your customers' viewpoint. They are labeled Brand Judgment, PriceJudgment, Ad Judgment and Reliability Judgment. Except for the Reliability Judgment the rating service can be purchasedfor any region in which you believe a competitor operates a sales o�ce. The Reliability Judgment is computed for thecompany as a whole and re�ects the average reliability of all brands sold globally, the rating is not available by region. (Norefunds are given if no sales o�ces are open.)
See below for more information on:
Brand, Price, Ad and Reliability RatingsThe Source of Fast Test DataThe Use of Fast Test Data
Brand, Price, Ad and Reliability Ratings
The brand judgment provides an indication of how closely a brand matches the basic needs of each market segment. All ofthe brands sold in a particular geographic market are rated by several panels of local buyers. Each brand will receive a ratingof between 1 and 100 from each market segment.
A rating of 100 indicates that a brand satis�es all of the basic needs of the segment. A score of less than 100 indicates thatthe brand design is de�cient in some respect. The lower the score, the lower the interest in the brand and the lower the salesfrom that segment.
The price judgment is obtained in the same way. The price of every brand in the local market is evaluated by the samepanels of current buyers. Each price is given a score of from 1 to 100 by each of the �ve segments. A good rating is 95 orhigher. Ratings of 100 would indicate the market might actually be willing to pay more.
For both the brand judgment and price judgment, a score of 70 is the minimum needed to serve the market. At this level,customers will begin to give serious consideration to buying the brand. The score, however, suggests that the market willrespond vigorously to further improvements in brand design and cuts in price.
A judgment score over 90 is considered very good. Demand should increase exponentially as price and brand ratings climbabove the 70 score minimum, all other things being equal. However, it is not enough to have a high score on one variable;both dimensions (price and design) must be satis�ed simultaneously to win market favor.
The Reliability Judgment is similarly scored. A rating of 100 indicates a product of very high reliability and consistentperformance. It suggests the brands and the company which produces them, have their production systems in control.
High reliability brands do not break down, which results in satis�ed customers, few complaints and low warranty costs. Arating as low as 70 is unacceptable to most end users. A rating of 80 suggests that serious work is needed. End users will

10/4/2018 Help File
https://web5.marketplace-live.com/engine.php?tpl=help&instructorID=10353&sessionID=9c643fdc8c13b099d714380554bb28c1&quarter=9&langua… 23/99
tolerate the low reliability but will reward suppliers with their purchases if the reliability can be improved.
The Reliability Judgment is computed for the company as a whole and re�ects the average reliability of all brands soldglobally, the score does not vary by region.
Ad Copy Judgments can also be obtained under the fast test program. The ratings represent a summary judgment of theappeal of an advertisement to each market segment. The consumer panels are asked to evaluate each one of these ads.
For each ad, you will be given a simple rating score that may vary from 1 to 100. A separate rating is obtained from eachsegment. The higher the rating, the more appealing the ad is to a market segment. End-users seem to be very demanding intheir evaluation of a �rm's advertisements. Ratings in the 70s are di�cult to obtain. A rating over 80 is generally consideredto be very good.
The Source of Fast Test Data
To help you visualize how the numbers are derived, it is useful to review the marketing research procedure. Speci�cally, yourmarketing research �rm has been hired to conduct personal interviews in each trading area that you select for study.Potential customers are presented with the actual brands, prices, and full color copies of all ads.
The customers evaluate every brand for sale in that market, the price of each brand and all advertisements that have beenrun in any media. As they evaluate each brand, price, or advertisement, they can compare one to another. For example, whenthey are conducting the brand judgments, they are permitted to physically examine each brand.
After the brand evaluations are completed, a price card is positioned in front of the brand and the judgments are taken. In thecase of the magazine ads, the tear sheets are mounted on stiff cardboard and presented to each subject in a differentrandom order.
The end-user is then permitted to sort through the ads until all ads have been rated. (Due to the comparative proceduresemployed, the ratings could change as new brands and advertisements are introduced into the market and the evaluation setis enlarged.)
In each case, the end-user is not asked to justify his or her rating. To expand the study and collect customer opinionregarding these evaluations would substantially increase the cost.
In addition, the research �rm has reservations about the accuracy of customer opinion for this application. It is felt thatcustomers make their purchase decisions based upon the whole package (gestalt) of what is offered rather than an analysisof individual components or ad bene�ts. (The whole is greater than the sum of the parts.)
A sample of subjects is recruited from each market-segment group. Every brand, price and ad is rated by each sample. Thisprocedure allows a rating to be computed separately for each segment. Thus, the same price, brand design, oradvertisement may receive a high rating from one segment and a low to moderate rating from the remaining four segments.If your target marketing efforts have been successful, the high ratings should appear in the segment(s) targeted.
The reliability judgment is determined differently than the price and brand judgments. In this case, a sample of end userswho have bought each brand is selected and asked for their overall opinion of the brand's performance. They are asked torecall out-of-the-ordinary failures, maintenance problems, unexplained crashes, etc. and give an overall assessment of thebrand's reliability.
You can expect different ratings for the same brand design, price, or ad in different regions of the market. At this time, it isnot known if the market is homogeneous throughout or if there are regional or local differences in customer requirementsand attitudes. It will be necessary for you to sample different markets in order to make this determination.
The Use of Fast Test Data
To obtain insight into the relative appeal of different features or ad bene�ts, it will be necessary for you to apply deductivereasoning. That is, simultaneously compare several brand designs and their respective ratings.
Ideally, look for two brands that have everything in common except for one or two features. A comparison of the brandratings with slightly different brand designs should suggest the relative importance of one feature over another. Becauseeach segment has a different set of needs, this analysis must be conducted separately for each one. Ad ratings can beanalyzed in the same fashion.
The end-user feedback will be useful in different ways at each stage in your market development. During the test-marketingphase, the fast tests will be invaluable in testing your assumptions of what the end-user is actually looking for in a brand,price, or advertisement.
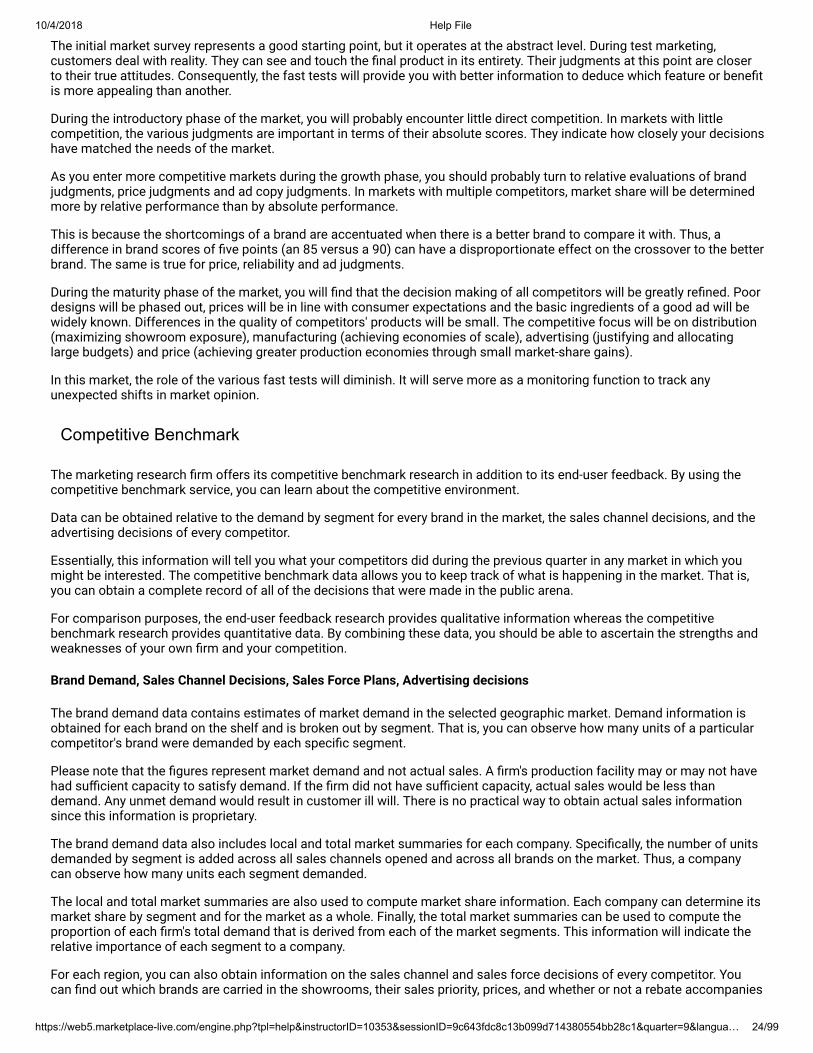
10/4/2018 Help File
https://web5.marketplace-live.com/engine.php?tpl=help&instructorID=10353&sessionID=9c643fdc8c13b099d714380554bb28c1&quarter=9&langua… 24/99
The initial market survey represents a good starting point, but it operates at the abstract level. During test marketing,customers deal with reality. They can see and touch the �nal product in its entirety. Their judgments at this point are closerto their true attitudes. Consequently, the fast tests will provide you with better information to deduce which feature or bene�tis more appealing than another.
During the introductory phase of the market, you will probably encounter little direct competition. In markets with littlecompetition, the various judgments are important in terms of their absolute scores. They indicate how closely your decisionshave matched the needs of the market.
As you enter more competitive markets during the growth phase, you should probably turn to relative evaluations of brandjudgments, price judgments and ad copy judgments. In markets with multiple competitors, market share will be determinedmore by relative performance than by absolute performance.
This is because the shortcomings of a brand are accentuated when there is a better brand to compare it with. Thus, adifference in brand scores of �ve points (an 85 versus a 90) can have a disproportionate effect on the crossover to the betterbrand. The same is true for price, reliability and ad judgments.
During the maturity phase of the market, you will �nd that the decision making of all competitors will be greatly re�ned. Poordesigns will be phased out, prices will be in line with consumer expectations and the basic ingredients of a good ad will bewidely known. Differences in the quality of competitors' products will be small. The competitive focus will be on distribution(maximizing showroom exposure), manufacturing (achieving economies of scale), advertising (justifying and allocatinglarge budgets) and price (achieving greater production economies through small market-share gains).
In this market, the role of the various fast tests will diminish. It will serve more as a monitoring function to track anyunexpected shifts in market opinion.
Competitive Benchmark
The marketing research �rm offers its competitive benchmark research in addition to its end-user feedback. By using thecompetitive benchmark service, you can learn about the competitive environment.
Data can be obtained relative to the demand by segment for every brand in the market, the sales channel decisions, and theadvertising decisions of every competitor.
Essentially, this information will tell you what your competitors did during the previous quarter in any market in which youmight be interested. The competitive benchmark data allows you to keep track of what is happening in the market. That is,you can obtain a complete record of all of the decisions that were made in the public arena.
For comparison purposes, the end-user feedback research provides qualitative information whereas the competitivebenchmark research provides quantitative data. By combining these data, you should be able to ascertain the strengths andweaknesses of your own �rm and your competition.
Brand Demand, Sales Channel Decisions, Sales Force Plans, Advertising decisions
The brand demand data contains estimates of market demand in the selected geographic market. Demand information isobtained for each brand on the shelf and is broken out by segment. That is, you can observe how many units of a particularcompetitor's brand were demanded by each speci�c segment.
Please note that the �gures represent market demand and not actual sales. A �rm's production facility may or may not havehad su�cient capacity to satisfy demand. If the �rm did not have su�cient capacity, actual sales would be less thandemand. Any unmet demand would result in customer ill will. There is no practical way to obtain actual sales informationsince this information is proprietary.
The brand demand data also includes local and total market summaries for each company. Speci�cally, the number of unitsdemanded by segment is added across all sales channels opened and across all brands on the market. Thus, a companycan observe how many units each segment demanded.
The local and total market summaries are also used to compute market share information. Each company can determine itsmarket share by segment and for the market as a whole. Finally, the total market summaries can be used to compute theproportion of each �rm's total demand that is derived from each of the market segments. This information will indicate therelative importance of each segment to a company.
For each region, you can also obtain information on the sales channel and sales force decisions of every competitor. Youcan �nd out which brands are carried in the showrooms, their sales priority, prices, and whether or not a rebate accompanies

10/4/2018 Help File
https://web5.marketplace-live.com/engine.php?tpl=help&instructorID=10353&sessionID=9c643fdc8c13b099d714380554bb28c1&quarter=9&langua… 25/99
any brands. You can also determine which companies have sales channels open in the city, the size of their sales force andhow many sales people are trained in each segment's needs.
Another type of data that you can obtain is the competitor's ad plans. The ad plans contain information on the quantity andalso quality of their ad campaigns. You can determine what message is being conveyed, its frequency, its media outlet andits geographic target for every competitor.
Now that you know what data is available, read below to learn about the use of Competitive Benchmark Data. If you candiscover patterns in the decision-making process of end-users and competitors, you will have substantially improved yourodds of succeeding in Marketplace.
Use of Competitive Benchmark Data
The most direct application of the competitive benchmark data is simply keeping track of what is happening in the market.Too often, young executives are attuned to only what they do to generate business for the company. It is almost as if the restof the world does not count.
Then they are heard to complain that the market is not responding to their marketing efforts or that it is over-responding.What they have failed to realize is that a large portion of their success or failure can be attributed to the actions of theircompetitors.
For example, when a company did not observe the expected jump in demand after cutting the price by 20 percent, was itbecause competitors also cut their prices on comparable brands? If a sales volume is not experiencing any growth, but therest of the industry is doubling sales, the team needs to know that the other competitors have twice as many brands, twiceas many salespeople, and twice as many sales channels in operation.
If the bottom falls out of the market, could it be that everyone scaled back their marketing efforts by raising prices, reducingsales forces, and cutting back on advertising because there was not enough capacity to meet expected demand? Was theblitz ad campaign of one company counteracted by the blitz ad campaign of another?
These examples may seem obvious, but too many executive teams do not know why their sales are �at, decreasing, or evenincreasing. To determine the effectiveness of their decisions, each team must include the decisions of its competitors in itsanalysis. In almost every case, the investment in marketing research is worth the price.
When you receive your marketing research, you will be overwhelmed with numbers. The answers to your questions will notjump out at you. It will take work to �nd them. Multiple regression, discriminate analysis, analysis of variance, and linearprogramming do not seem to work. They are usually not helpful because there are too many variables working at the sametime, and because many of the relationships are curvilinear.
Most statistical packages assume linear relationships. The key to the analysis is �nding patterns in the data. Compare onesituation with another. If at all possible, �nd situations that are nearly identical. If all other things are equal (ceteris paribus),then it is possible to isolate the effect of a change or difference on a single variable.
For example, if two �rms in the same market carry a brand with the same features, give it the same sales priority (or close)and a similar price; then the only major difference between the two cases should be the �rms' advertising efforts. Toeliminate the effect of sales force, it is suggested that you divide the brand demand by the number of salespeople in thesales channel.
A company with six salespeople will always generate more demand than one with two, all other things being equal. It is alsosuggested that you avoid comparing �rms that carry vastly different numbers of brands. A �rm with a wide selection ofbrands is likely to generate more total demand than a �rm offering only one or two brands, even though sales of each brandmight be less if sold individually.
The company might also try different prices and observe the combined effect of differences in brand design and pricing. Orthe company might try vastly different sales priorities and observe the combined effect of design and sales priority.Obviously, the task becomes more di�cult if more than one variable at a time is affecting sales.
If you wish to determine the relative importance of different design features to a segment, �nd similar brands being sold inthe same geographic market and compare their brand judgments. If you get lucky (it happens often because more than onecompetitor will target the same market), two or three brands will enter the market with only one or two features that aredifferent. The same is true for advertisement.
As you undertake your marketing research, keep �ve points in mind.
1. Try to set up or �nd situations in which only one variable is different. Sales managers are able to experiment with theiruse of sales priorities, brand selection, prices, and sales force allocation. A sales manager can manipulate key

10/4/2018 Help File
https://web5.marketplace-live.com/engine.php?tpl=help&instructorID=10353&sessionID=9c643fdc8c13b099d714380554bb28c1&quarter=9&langua… 26/99
variables and study their effect on demand. Alternatively, you can engage in experimentation by identifying situationswhere only one, or at most two variables are different.
2. You want to look for patterns in the data. A 10 percent price difference may have very little effect on demand for thehigh-performance segment, but it could have a sizable effect on the price-conscious segment. The single best sourcefor discovering these patterns is the city competitor pro�les. If you have purchased all of the available test marketdata, a special report can be printed that details individual brand demand (by segment) as well as brand, price, and adjudgments.
This data also includes the media schedule, sales force plans for the city, and the key indicator of demand persalesperson. The goal is to determine what causes the sales per salesperson for one competitor to be higher or lowerthan another. Are there differences in prices, brand judgments, or media plans that might explain the differences?Does one competitor have more brands targeted to a segment, or more service personnel?
Whatever the sources of differences in demand, the competitor pro�les will help you �nd important clues. Look forpatterns in the data. If you can determine how the market is responding to the decisions of your company and yourcompetitors, you will have a signi�cant advantage over the competition.
3. You can learn as much from the decisions of others as you can from your own. There is a good chance that one ofyour competitors executed a decision that you were considering. By studying the effect of their decision, you can gainsome insight whether or not it was a good course of action. In the same vein, do not limit your market research toonly the cities in which you are represented, especially during the test market phase. Many valuable lessons may belost if you focus on only your marketing efforts.
4. Plan on investing some time in reviewing the marketing research. The learning will not come easy. You must display aconsiderable amount of insight and creativity to discern the patterns in the data and �gure out how to use them toyour advantage. Every time you go back and review the data, you can learn something more.
5. Keep in mind that the computer model is logical. When you become frustrated because you cannot �gure out whysomething is happening the way it is, remember that the world of Marketplace is based upon logic. There are norandom events; everything is cause and effect.
It is all patterned after the basic principles of marketing found in most introductory textbooks. In a sense, thecomputer model is unrealistic because it is totally logical, but that is the way computers are. (The seemingly illogicaland random part is provided by the players.) To make the programming task manageable, the real world had to besimpli�ed and logically organized. What makes the analysis task di�cult is the large number of decision variablesthat are simultaneously in�uencing events.
In a sense, your research task is to reverse engineer the Marketplace model - that is, to �gure out what is in the black boxand how it works through the study of what is observable. You might argue that this approach is unfair or unrealistic, but is itnot what you must do with real consumers and industrial buyers? From the study of their decisions, you try to determinewhat makes the customer tick. What goes on in their minds (the black box)? What is motivating them to action? What ismore important - price, state of the art technology, a high sales priority, or something else?
The key to market research in the real world is the discovery of patterns in the decision making of the end user andcompetitors. If you can discover these patterns, you will have substantially improved your odds of succeeding in the realmarketplace.

10/4/2018 Help File
https://web5.marketplace-live.com/engine.php?tpl=help&instructorID=10353&sessionID=9c643fdc8c13b099d714380554bb28c1&quarter=9&langua… 27/99
D. Brand Management
1. Brand Management Decisions2. Brand Design3. Match-up Benefits and Features4. Consider the Price the Market Will Bear5. Evaluate the Effects of Brand Design on Production6. Test Market To Discover the Performance Response Curve7. Brand Name8. Brand Loyalty9. Research and Development
10. Licensing R&D
After completing your market opportunity analysis (MOA) you are asked to make the following brand managementdecisions:
Brand designBrand nameResearch and Development
Learning Objective:
The primary objective of the brand management effort is to help you understand the relationship between the abstractbene�ts sought by customers and the physical components which can be produced in the production facility. Consumersbuy sex appeal, speed, less work, relaxation, excitement, and so forth. The production facility cannot deal with theseabstractions. As a brand or marketing manager, you must tell the production division what speci�c components are to bebuilt into each brand.
The entire organization depends upon your ability to evaluate whether component X or component Y provides the rightamount of the desired bene�t. Moreover, will the �nal selection of components satisfy the complete set of needs of thecustomer while keeping the �nal price within his or her price sensitivity constraints?
A secondary objective of the brand management effort is to help you realize the interdependence between the branddesign and production scheduling. Working to maximize customer satisfaction by providing multiple brand designs willcause stress in the production facility by negating economies of scale in purchasing and causing lost capacity utilization.The desire to maximize customer satisfaction must be balanced against the desire to minimize production costs.
Concepts Emphasized
Brand design: Selection of production components which provide the desired level of an abstract bene�t while remainingwithin the price constraints of the target market.
Quality Function Deployment (QFD): A technique for systematically matching features to bene�ts.
Brand labeling: Selection of a brand name designed to project a de�ned image, purpose, or bene�t of a brand.
Target marketing: Selection of individual segments for market development.
Differentiated marketing strategy: Development of a unique marketing strategy for each segment. -versus- Mass marketing strategy: Development of a generic marketing strategy designed to appeal to multiple segments.
Decision-making: Evaluation of the pros and cons of available investment options, and making a commitment of resourcesto an uncertain future.
Brand Management Decisions
Brand management includes Brand Design, Brand Name, Research and Development, and Licensing R&D decisions. Your taskis to interpret the abstract bene�ts which end users say they want in a brand and select features or components that willprovide the desired bene�ts.

10/4/2018 Help File
https://web5.marketplace-live.com/engine.php?tpl=help&instructorID=10353&sessionID=9c643fdc8c13b099d714380554bb28c1&quarter=9&langua… 28/99
During the early stages of market development, this task is �lled with risk. Both you and the consumers lack su�cientexperience to know for sure what will or will not meet their needs. It is not until the consumer sees and uses the physicalproduct that he or she can truly judge the value of the offer. As the product assortment grows and consumers make theirchoices from among the available brands, the relative attractiveness of the available features should become clearer.
Brand Design
Initially, your company should conduct marketing research to determine:
1. The structure of the market.2. The market requirements of customers.3. The strengths and weaknesses of competitors.
This is known as a Market Opportunity Analysis (MOA). After you have completed your MOA, your next step is to design afew brands to put on the market. To accomplish this task, you must: Match up Bene�ts and Features that are attractive toyour target market, Consider the Price the Market Will Bear, and Test Market to Discover the Performance Response Curve.
Through your selection of features and their accompanying costs, you must position each brand favorably relative to yourtarget market. Choose two segments which you consider to be the most attractive, and design a brand or two for eachsegment. It is generally recommended that you avoid designing more than two brands until you receive the results of your�rst test marketing efforts.
Your �rm will be given a set of standard features from which to begin designing brands. The company will later haveadditional options which can be obtained with su�cient investment in R&D. Your job is to pick and choose the features thatwill appeal, in combination, to your target segment(s). You have several options under each component area.
Each market segment evaluates each component or feature in light of its needs. In some cases, a feature will fall short ofthe requirements of one segment, while in another case, it may provide more capability than is needed. Without providing toolittle or too much in the way of performance, you must match up the features to the needs of the market.
The role you are ful�lling is that of a brand manager. To help you visualize the responsibility, imagine that you are in acommittee meeting with the engineering staff. Your task is to provide the engineering staff with a speci�cation sheet (specsheet) on the product you want them to make in the production facility. This spec sheet lists each component or feature thatwill go into the product you intend to test market. You must decide on the exact features. You cannot hedge your bets. Youmust commit to the design that you think has the best chance of succeeding.
This responsibility is always di�cult and �lled with risk. As you will discover, it is even more di�cult and risky for a �rm thatdoes not have any market experience.
Note the cost to design or modify a brand. You can modify the same brand multiple times in the same quarter and you willonly be charged once. So if you create brand "A" in quarter 3 and then decide to modify brand "A" while still in quarter 3 youwill only be charged once, but if you modify brand "A" once and brand "B" once you will be charged twice. If you enter thebrand design screen and decide you do not want to design/modify the brand then use the cancel option so that you will notbe charged.
If you modify a brand then you must change the name of the new brand. The only exception to this rule is if the brand wascreated in the current quarter. If you design a brand in quarter 4 and then decide to modify it while still in quarter 4 then youdo not have to change the name. You must change the name for any brand you modify that was designed in a previousquarter.
Match-up Benefits and Features
Your market opportunity analysis is very important to your understanding of what a customer wants in a product. Thisinformation should help you decide what features to build into your brands in order to satisfy these wants. Many executiveshave di�culty coming to grips with this responsibility.
The problem is that customers buy bene�ts, not features. Every day, the executive must deal with components - their design,costs, production, availability, compatibility, etc. In most cases, the customers do not care if the manufacturer includescomponent A or component B. All they want to know is, will it do the job?
For this reason, you must understand the value, utility, or bene�t of each and every component or feature that could be builtinto your brands. You cannot design a brand without this knowledge.

10/4/2018 Help File
https://web5.marketplace-live.com/engine.php?tpl=help&instructorID=10353&sessionID=9c643fdc8c13b099d714380554bb28c1&quarter=9&langua… 29/99
For your Market Opportunity Analysis we recommended that you start with the bene�ts (wants and needs) most desired by atarget segment and then speculate on the features or components which would provide these bene�ts. For the Brand Designdecision, we recommend that you undertake the �ip side of that task. That is, start with the features and speculate on thebene�ts delivered by each.
Start by doing some homework in the real world on the product category. Find out the usefulness of each feature and towhom it would be of use. Not everyone will �nd each feature to be equally desirable. Then, take the list of the featuresavailable to you and write a brief description of what need is ful�lled or bene�t provided by each feature. You are essentiallybuilding a ladder from features to bene�ts.
Next, match up the list of bene�ts provided with the list of bene�ts sought. This matching process should enable you toidentify which features are likely to appeal to which segments. While the exercise is not foolproof, it should provide you witha logical basis for designing brands.
While matching up bene�ts and features, you must also Consider the Price the Market Will Bear.
Consider the Price the Market Will Bear
Your brand design decision must also include consideration of the price the market is willing to pay. There is always aprice/performance trade-off. Higher performance features will generally cost more than lower performance features. Will thetarget market pay for the additional capability?
Your MOA should help you to determine how sensitive your target market is to price versus performance. Considerestablishing a price point for each segment and then designing a brand within that constraint. A good rule of thumb is tomultiply your total materials cost for the component times two or three to obtain an estimate of what the brand would retailfor. (Choose the materials cost estimate from the brand design summary under Brand Management.)
If the projected brand price is higher than you think the market will bear, you should consider scaling back the design to �tthe price. This issue of pricing will be discussed in more depth under the topic of Brand Price, but it cannot be ignored duringyour brand design efforts.
Evaluate the Effects of Brand Design on Production
Your brand design decisions must consider more than target market needs. You must also look into the production facilityand assess how the different designs will impact your production operations. The fundamental issue revolves around theincorporation of common or unique components from one brand to the next.
From a marketing perspective, your goal may be to maximize customer satisfaction by providing every customer with exactlywhat he or she needs. Conceivably, there would be as many brand designs as there are customers. The better you can meetindividual needs, the more likely it is that you will be able to sell large volumes of product, charge a better prices and maketons of money.
From a manufacturing perspective, your goal may be to minimize the variation in design from one brand to the next. If theexact same component is built into multiple brands, the production facility can save money in purchasing raw materials andparts.
There are economies of scale in larger purchase volumes. Also, productivity of workers is in�uenced by the learning curve;therefore you will experience learning curve economies if the same component is built into several products coming downthe assembly line.
Perhaps the most visible effect of disparate brand designs is on production scheduling. If each brand design employs manydifferent components, then the time required to shut down the production line and change all of the �ttings and �xtures andchange the incoming raw material and parts will go up.
If the opposite is true (alternate brands contain many identical components), the time and cost to changeover the productionline will be minimized. The important point is that production line changeovers result in lost capacity because nothing can bebuilt while the line is being torn down and rebuilt for the next product.
The problem with experiencing lost capacity is that the production facility will still incur operating expenses during thechangeover time. For example, the workers must be paid while they are standing around waiting for the production line to bemade ready and the production facility must have heating, electricity, etc. These idle expenses become further overhead forthe company and must be charged against the brand which will be produced next. Thus, the next brand produced isburdened with extra costs, which must result in a higher selling price.

10/4/2018 Help File
https://web5.marketplace-live.com/engine.php?tpl=help&instructorID=10353&sessionID=9c643fdc8c13b099d714380554bb28c1&quarter=9&langua… 30/99
As an organizational unit, your success depends on balancing marketing goals (maximizing customer satisfaction) withmanufacturing goals (minimizing production costs). By managing both the brand design decisions and the manufacturingdecisions, you will actually move in the direction of simultaneously achieving more of both.
It is possible to continuously reduce the amount of time and money required to changeover the production line from onemodel or brand to another. These improvements tend to be small, incremental changes in the way the changeover isimplemented. The improvement may result from a change in operating procedure, a change in the layout of the work �ow,modi�cations to the machines themselves, or even construction of special equipment to facilitate and speed up the change.
A reduction in time is more likely to occur than a reduction in cost. It is generally not possible to eliminate changeover timeand cost altogether. Large reductions are possible in any given quarter, but they are expensive. Smaller incremental changesare more practical and economical.
The next important step will be to Test Market to Discover the Performance Response Curve of your proposed product.
Test Market To Discover the Performance Response Curve
After you have completed your initial brand designs, it will be necessary to test market your brands and your suggestedbrand prices. Remember that your market survey is based upon an abstract evaluation of theoretical bene�ts. Until yourcustomers see, touch, and use your product, there is no way to know for sure how attractive they will �nd it.
To bring this point home, suppose you were asked what you would like to have in a candy bar. You could probably tell theresearcher how much you liked caramel, chocolate, nuts and so forth. A manufacturer might then develop four or �veversions of your "preferred" candy bar. In a taste test, there is a good chance that the one you "really" like is different from theone they might have predicted from your survey responses.
Until they combine the ingredients into a particular formula and you taste it, they are simply making an educated guessabout your preferences. In the same vein, the market survey will help you make a good educated guess, but it is stillnecessary to test market your brands to determine true consumer preferences.
You should start with the expectation that you will have to revise your initial brands within the �rst six to nine months. Withso little experience in this market, you will be lucky to have a highly rated brand right from the �rst.
As a point of comparison, Apple Computer withdrew its pioneering Lisa brand from the market within seven months andintroduced the far more successful Macintosh line. It is not uncommon for a new venture �rm to upgrade its productsalmost immediately after launch. It is virtually impossible to have fully anticipated all of the ways in which a product can beused (or misused). The objective of your test marketing will be to learn what you did right and what needs to be improvedand then to quickly revise your design to better match end-user requirements.
Another caution to keep in mind is that more is not always better. Some executives might think they could appeal to lower-end segments by simply cutting the price on a brand with extra features. This tactic will not always work.
To illustrate the point, suppose you placed a scienti�c calculator with 36 special function keys on sale alongside a standardfour-function calculator. Both are sold for the same price. You would �nd that a good number of customers would purchasethe simpler machine. That is because there is a hidden price in the more complicated calculator.
Customers must spend the time to �gure out how to work with it. They might also worry about hitting the wrong keys or inthe wrong order. The scienti�c calculator could be intimidating. The point is that for some segments simplicity will be one ofthe bene�ts sought. Consumers would not necessarily rate the more sophisticated brands as better.
To further illustrate this important point, consider the seven hypothetical response functions:
1. More of a feature is always better. This is the assumption most engineers and product managers make; and in alarge number of cases it is true. For example, a faster processor on a PC will create increasing excitement andproduct use among calculation (engineers) and data intensive (order processors) end-users. Greater miles per gallon,battery life, insulating capability and rpm are almost always desired. However, it is wrong to assume that more of afeature is always better. Some consumers have different response functions where more does not add value and mayeven detract from it.
2. More of the feature will add value to a brand up to a point, but then it ceases to add anything more. For example, TVmanufacturers have found that the addition of stereo sound to a TV created lots of enthusiasm (almost 90% of allprimary TVs sold today have stereo sound). However, adding further sound capability (adding a broader range ofsound reproduction or more powerful speakers) creates no further excitement or additional sales. Some consumersfeel this way about modem speed or storage capacity on a hard drive. Others reach a plateau with the number ofchannels on cable TV, the number of speeds on a bike, the horsepower of an engine or the durability of a fabric.

10/4/2018 Help File
https://web5.marketplace-live.com/engine.php?tpl=help&instructorID=10353&sessionID=9c643fdc8c13b099d714380554bb28c1&quarter=9&langua… 31/99
3. More of the feature will add value, up to a point and beyond that point, more of the feature will detract from theexperience or enjoyment. For example, romance in a movie can be enjoyable, but too much romance can beoverbearing. And, attentive waiters and waitresses can be an asset to a restaurant, but they can quickly become anuisance to customers if they constantly interrupt the dinner conversation. And, the amount of carbonation, syrup andwater in a fountain drink all have tight tolerances where too much or too little is undesirable.
4. A little of a feature is just right, more only takes away value. Some consumers do not want anything more on acalculator than the basic four functions: addition, subtraction, division and multiplication. Each additional functiononly adds to confusion and frustration. In other cases, increasing the number of gears on a bicycle, the length of amanual, the amount of fat in prepared foods or the number of commercials on a TV show will reduce satisfaction forsome consumers.
5. Any amount of the feature is bad. Some consumers feel this way about violence in a movie or TV show. Otherconsumers are turned off by: sugar or caffeine in soft drinks, the use of prepared foods in a restaurant, plasticwrapped fruits and vegetables in the produce department or polyester in clothes.
6. Little interest until threshold is crossed. In cases of many new products, interest remains low until the capabilities ofthe product reach a critical level. For example, the personal computer did not become a household tool until Windows95 made it easy enough for the average person to use it. Similarly, the Internet did not achieve widespread adoptionuntil Netscape came on the scene and made very easy to browse the World Wide Web.
7. The presence of some features in a product can have no effect on consumer excitement. Adding clipless pedals orhigh grip tires to a bicycle is not likely to cause even a ripple of excitement in customers who are only concernedabout a bike that is comfortable or easy to ride. Other consumers might be indifferent to colorful brushstrokes, lights,or decals.
In the current exercise, one of your tasks is to ascertain what the response function looks like for different features fordifferent segments. You can deduce segment preferences and response functions by studying end-user reactions to thevarious brand offerings on the market. Try to determine if more or less of a feature improves end-user judgments. Keep inmind that end-user preferences may or may not match your expectations or prior assumptions. In fact, what you think makessense is not important. The objective is to give the end-users what they want, not what you think they should want.
Comment: The goal of marketing is to select features that add value to end-users. This goal must be balanced against the goal ofminimizing production costs in order to be able to offer competitive prices and realize substantial pro�ts for the �rm.Therefore, a secondary goal of marketing is to determine which features add the greatest value and which add the least.
If you �nd indifference between alternate models of the same component, or one is only slightly preferred, perhaps themodel which is used in other brands should be selected. Thus marketing must understand these response functions so thatthey can recommend features which can be standard across multiple brands and which must be unique.
Brand Name
At the same time you are developing your brand designs, it is important to select a brand name. Even though this decisionwill not affect demand generation in Marketplace, it should not be taken lightly. A name can help or hinder communication. Awell-chosen name may convey the totality, essence, image or even, simply, the function of the brand.
The brand name might attract attention and serve in a promotional capacity, or it can be a clever play on words that makespeople smile or otherwise stop to notice the name. For example, Excel is a spread sheet program by Microsoft that saysnothing about the product, but might communicate to the user that the user can "excel" by using the product. Other namesthat denote excellence might include the Intel Pentium computer chip, In�nity automobiles or Craftsman power-tools.
Fun brand names include PlayStation (a video game console), Red Robin or Swiffer. Brand names which convey the activityor functional use of the product include the Fitbit (a small activity tracking device worn on your wrist, intended to help usersget into shape), Mr. Clean (household products) or Dunkin Donuts.
Sometimes, brand names have no meaning whatsoever, but develop an identity from use. A good example of such a brandname is Kleenex tissues. And �nally, many companies use numbers or letters in their brand names to indicate the differencebetween later versions and early ones (ex. Windows 10 versus Windows 8), or between economical models (iPhone 6) andfull performance models (iPhone 6 Plus).
A brand name will project an image of the �rm. Careful attention to the name can ensure that the right kind of image isprojected.
Finally, brand recognition can also help boost sales. If a previous brand named "Titan" had good sales, and you now want tomodify the brand to include new R&D, you will want to retain at least 60% of the original name so that customers willrecognize it as a continuation of the "Titan" line. You could name it "Titan II", "Titan 200" or something similar. This will notguarantee you any sales but it does improve your chances by playing off the loyalty already created with the original "Titan"brand.

10/4/2018 Help File
https://web5.marketplace-live.com/engine.php?tpl=help&instructorID=10353&sessionID=9c643fdc8c13b099d714380554bb28c1&quarter=9&langua… 32/99
Brand Loyalty
Brand loyalty is expressed as positive feelings towards a brand and a desire to purchase it now and in the future. Brandloyalty is acquired by providing products that meet and exceed the customer's needs and wants. It can be built up through
1. pricing that �ts the customer's pocketbook,2. advertising that appeals to their needs and wants,3. informed and responsive sales and service personnel, and4. quality manufacturing.
Brand loyal customers are less price sensitive and less affected by competitor product enhancements, advertising appeals,service enticements, and quality improvements.
But loyalty is not unassailable. It can get strained and even overcome if competitors have signi�cant advantages in any ofthese areas.
There are also lessons here for you as you challenge competitors. For you to weaken the brand loyalty of their brands, youmust be substantially better in value, price, advertising, sales and support, and quality. Small improvements over what yourcompetitors offer will not cause many of their customers to switch their loyalty to you.
Research and Development
Initially, you have a modest set of components with which to design new brands. Through research and development (R&D),you can add new features.
The R&D features are expected to cause considerable excitement in the market. In every case, they are capable ofoutperforming a currently available component or providing a bene�t that is not now available. If incorporated into newbrand designs, these features could make existing models virtually obsolete within certain market segments.
R&D is necessary as both an offensive and a defensive tactic. As an offensive weapon, R&D-based brands will facilitate yourefforts to capture market share from competing brands with older technology. Moreover, if you are the �rst on the marketwith state of the art technology, you will enjoy certain pioneer advantages in the form of customer loyalty. As a defensiveweapon, you may have to match your competition in order to keep from losing business to superior brands.
To bring the new features out of the lab and into the production, you must invest in the necessary R&D. The exact cost forcompleting the R&D for any project is determined by the degree of di�culty inherent in the project and the speed at whichyou want the work completed.
These costs can be determined by experimenting with several investment options on your decision template. As you will see,you can speed up a project by investing more money and placing more engineers on the project. However, you pay a price ine�ciency.
The additional engineering staff creates a new set of communication and coordination problems. There is also a limit as tohow quickly you can speed up a project. With the more di�cult projects, you must allow a certain amount of gestation timefor the engineers to work out various problems. Thus, you do not get a proportional increase in work by adding personnel.You may have to triple your investment in order to cut the development time in half.
As you experiment with the R&D investment options, you will also discover that you cannot afford to undertake all projects atthe same time. You must choose the best two or three projects in which to invest. This, in turn, presumes that you haveselected your target markets and you know the value of each R&D feature to each segment. Thus, your R&D decision mustbe made in concert with your target market decision and your other Brand Design decisions.
There are several strategies that you can apply in selecting your research projects.
Invest in Technologies to Bene�t One Segment. You can make all of your investments in projects that bene�t yourprimary target segment. This strategy could give you a strong technology advantage in that segment but would putyou in a weaker position in your secondary segment.Invest in Technologies that Bene�t Different Segments. You can pick projects that bene�t different segments. Forexample, one project could exclusively bene�t your primary segment and a second project could exclusively bene�tyour secondary segment. Each project would add value to the relevant segment but add no value to another segment.With this strategy, you would advance your bike designs in two segments, but the designs would not be as strong ashaving 3 new brand features in one segment.Invest in Technologies that Bene�t Multiple Segments. You can pick projects that bene�t both your primary andsecondary segments at the same time. If you can �gure out which projects have value in multiple segments, then

10/4/2018 Help File
https://web5.marketplace-live.com/engine.php?tpl=help&instructorID=10353&sessionID=9c643fdc8c13b099d714380554bb28c1&quarter=9&langua… 33/99
your R&D investments could be quite e�cient. However, these projects might not be as valuable as projects that arespeci�cally targeted to a single segment.License Technology to a Competitor. You can license technologies to your competitors and recoup part or all of yourinvestment. Any technology that you develop in one quarter, can be licensed to a competitor in the next quarter. Thelicensing fee is typically 50% of the development cost. If you sell two licenses, you can receive 100% of yourinvestment.License Technology from a Competitor. You can purchase licenses from competitors, often for 50% of thedevelopment cost. It would have to be a technology that the competitor developed in one quarter.Cross License with a Competitor. You can enter in cross licensing deals where your �rm and another developseparate technologies and swap them for one-half the difference in the cost.
Licensing R&D
You have the opportunity to license technology to your competitors. If you license an R&D feature that you have acquired,you will be able to recoup some of your investment.
To license a technology, you must negotiate the terms with the �rm that would like to buy it. In particular, you must decide onwhich technology to license and the licensing fee. The licensing fee for R&D is a one-time expense and the payments cannotbe spread over multiple quarters.
There are also special terms that might be negotiated. For example, you might limit the resale of the technology to a third-party or restrict its use in a particular segment. You may wish to add a �nancial penalty if the contract is broken by the otherparty.
Cross-licensing is also possible. You could offer one R&D feature in return for another. There are many different licensingagreements that are possible.
Here are the minimum conditions that must be ful�lled:
The contract is written by the �rm that owns the R&D feature and is granting the license.The seller chooses the technology and the �rm that is to receive the license.The seller enters the licensing fee and any special terms that both parties have agreed to.The minimum licensing fee is 1.00. It is not possible to write a license at zero cost to the buyer.The seller sends the contract to the buyer in the current quarter for review and approval.The buyer reviews the contract and either accepts or rejects the terms and conditions of the license.The buyer must electronically approve the contract and accept the terms before the contract will be executed.Once the contract is accepted by the buyer, it is non-revocable. In other words, it cannot be undone.The exchange of technology and money will occur at the start of the quarter indicated in the contract.
Warning: No verbal agreements are acceptable. Only those conditions that are in writing can be enforced. Once theproposed contract has been sent to the potential buyer, it cannot be revoked or modi�ed.
Here is how the licensing works:
A contract that is written in the current quarter will be executed in the next quarter. That is, the money and technology will betransferred during the processing of all team decisions at the end of each quarter. The transaction will appear on the booksin the next quarter. Thus, there is a one quarter delay in transferring money and technology. It is not possible to pay inadvance for a new technology.
To illustrate the licensing process, suppose Team A invests 2,100,000 in a new R&D feature. Once the feature is available forTeam A to use in new brands, Team A can then license the new feature to any one of its competitors.
Suppose now that Team B wants to license the new R&D feature from Team A for 1,000,000. Team A will write a licenseagreement to Team B. Team B will incur the licensing expense and receive the new technology in the following quarter. TeamA will receive the licensing income in the following quarter as well.

10/4/2018 Help File
https://web5.marketplace-live.com/engine.php?tpl=help&instructorID=10353&sessionID=9c643fdc8c13b099d714380554bb28c1&quarter=9&langua… 34/99
E. Advertising
1. Planning the Advertising Program2. Ad Copy Design3. Deceptive Advertising4. Media Placement5. Advertising Effectiveness
Effective advertising is an important component of your marketing mix. Planning the advertising program for your �rm willrequire you to consider the following:
Ad copy designMedia placementAdvertising effectiveness
Learning Objective
The purpose of this advertising effort is to force you to think through the tradeoffs inherent in advertising and promotionplanning and to see how advertising relates to the broader strategic decisions of the �rm. To succeed at advertising design,you must understand what each segment wants in a product and then design an ad that effectively appeals to those needs.
In media planning, you must balance the lower cost, lower precision of local advertising against the higher cost and higherprecision of regional advertising. The former represents a mass marketing approach, while the latter represents adifferentiated marketing strategy. Advertising, however, is not the only way to stimulate sales. On the margin, various typesof trade and consumer promotions may yield a better return.
Ultimately, the advertising decision must be judged against the �rm's other investment options. With limited resources,would it be better to spend the next 100,000 on advertising, or could a higher payoff be realized by investing in additional�xed production capacity, R&D, or new sales outlets?
Similarly, how much weight should be given to advertising within the marketing strategy of the �rm? In terms of marginalreturns, which is more important: expanded advertising, further brand development, lower prices, or more sales people?
The size of your advertising budget relative to other expenditures implies a certain set of priorities. To make effectivedecisions, you must know your investment options, estimate their payoffs, and consciously establish your strategicpriorities. You will �nd that these priorities will change as your �rm and the industry pass through the introductory stage ofthe product life cycle, to the growth stage, and on into maturity.
Concepts Emphasized
Ad copy design: Identifying and prioritizing bene�ts to be stressed in an ad message.
Media selection: Selecting the right media to achieve the greatest market exposure for a given target market.
Media budgeting: Determining the size of the budget based upon consideration of available resources, competitiveexpenditures, target advertising-sales ratios, and advertising objectives.
Advertising effectiveness: Advertising impact and effectiveness of advertising expenditures.
Market positioning: Establishing an image [in part, through ad copy design] relative to target market needs and wants.
Mass marketing -versus - Differentiated marketing: An emphasis on undifferentiated local advertising versus narrowlyfocused regional media.
Promotional mix: Deciding on relative emphasis of advertising, sales force support, point-of-purchase (POP) displays,rebates, and incentive programs.
Strategic decision-making: Determining the relative emphasis of advertising versus important asset investment options,and other elements of the marketing mix. Learning to make commitments in the face of uncertainty.
Planning the Advertising Program

10/4/2018 Help File
https://web5.marketplace-live.com/engine.php?tpl=help&instructorID=10353&sessionID=9c643fdc8c13b099d714380554bb28c1&quarter=9&langua… 35/99
Advertising is an important part of the marketing mix. It can be used to inform, persuade, and reinforce the market relative tothe qualities of your �rm, your brands, and your distribution system. An effective ad campaign can help you to outsell yourcompetition, even if some of your brands are not perfectly positioned relative to the needs of your customers.
Effective and sizable investments in advertising also create barriers to entry. If the price to overcome your name recognitionand buyer loyalty is su�ciently great, competitors will have to think long and hard before they challenge you in your markets.In short, advertising can make or break an otherwise effective marketing strategy. Your advertising decision includesconsideration of the following: Ad Copy Design; Media Placement ; and Advertising Effectiveness.
The major disadvantage of advertising is that it is an expense, and not an asset. Once it is spent, you have nothing tangibleto show for it. There is no tangible product, sales channel, or production facility to show to investors.
There is simply a higher probability that customers will buy your product; and it is very di�cult to quantify how thatprobability has changed as a result of advertising. Given the serious cash �ow problems of new ventures, mostentrepreneurs have great di�culty investing in advertising, no matter how important it is.
The advertising decision with which you are faced is composed of three parts: Advertising Copy Design, Media Placement,and Advertising Effectiveness. For advertising copy design, you must select which bene�ts you wish to stress in your ads andthe priority to be given to those bene�ts in terms of message emphasis. Media placement includes the selection of speci�cmedia in which to place your advertisements, and the number of insertions for each ad during the planning period.Advertising effectiveness consists of estimating how well you are reaching your target markets, especially in relation to yourcompetition, and how you can improve the advertising response.
Ad judgment and media effectiveness are segment-speci�c. A good ad placed in the wrong media outlet will be ineffective,and vice versa. You must design the right message and place it in the right media outlet in order to persuade each segment.
The size of your company's advertising investment compared to that of your competitors will also in�uence total advertisingeffectiveness. If your competition outbids you for the attention of your customers, they will take market share away fromyou.
With patronage advertising, the objective is to attract customers to the company without reference to a particular brand. Theemphasis is on the company as a whole. You are able to in�uence the number of customers being drawn from eachsegment by altering the relative emphasis of your advertising to match the media and message preferences of the differentsegments.
Once the customers have selected your �rm as one of their preferred suppliers, brand advertising takes over. The differentbrands compete for the attention of the customers who are now predisposed to buy from your �rm. Brands that have highername recognition or have been pre-sold will have higher sales potential.
Ad Copy Design
The copy design decision begins by reviewing the needs and wants of your target market and then designing an advertisingmessage that should appeal to the segment. To help visualize this responsibility, imagine you are working with the accountrepresentative from your newly employed ad agency.
The advertising agent is skilled in the mechanics of copy preparation and media placement. He or she also has access tothe creative talents of copywriters, graphic designers, photographers, models, and so forth. However, you know more aboutyour particular business than the account rep or anyone else at the ad agency.
You must provide the agency with the content of the advertisements. You must decide on the message or theme to beconveyed. The ad agency will then take your guidelines and create an attractive advertisement that conveys the intendedmessage.
The Marketplace decision template lists the possible bene�ts that are thought to be important to various market segments.To assist the advertising agency in copy preparation, you must select and prioritize the bene�ts you want stressed in yourads. You must decide what is the most important point you want conveyed in an ad.
You must then decide on the second most important bene�t, the third most important, and so on. Taken in combination, theselection and order of bene�ts should serve to position your �rm and products to match the needs and wants of your targetmarkets.
If you are unsure about how advertisements are designed, try studying ads for real brands in current periodicals. In mostcases, you will �nd an ad contains a multifaceted message. That is, several major and minor points are addressed in the ad.These points highlight needs of the consumer or bene�ts of the brand or company.

10/4/2018 Help File
https://web5.marketplace-live.com/engine.php?tpl=help&instructorID=10353&sessionID=9c643fdc8c13b099d714380554bb28c1&quarter=9&langua… 36/99
You can almost rank-order the different points made in the ad by the size of type and their placement on the page (i.e., largebold letters at the top versus small letters in the lower right). You should also see the identi�cation of a speci�c brand orcompany name. The name is probably not the most important point in the message.
There is probably some key bene�t that gets top billing. All of these factors combine to create a message to a targetedaudience. Again, visualize the marketing or brand manager who approved the content of these ads. You will be ful�lling thatresponsibility.
As you design each ad, keep in mind that the importance of the bene�ts will vary by segment. An ad designed to onesegment will not appeal to other segments.
Thus, you must design a separate ad for each segment to be targeted. Past experience also suggests that ads should notconvey too many bene�ts in the message. As the number of bene�ts increases, ad clutter goes up, and messageeffectiveness goes down.
In summary, you must build the content of an ad by manipulating three variables at the same time:
1. What to say in the ad (which bene�ts are important to a target segment).2. How much to say in the ad (how many bene�ts to mention in the ad).3. The priority of the content (what should be given top billing, second, and so forth).
Long ads are not necessarily better than short ads. Experimentation will be necessary to optimize the ad design. Theaddition or deletion of a bene�t or the rearrangement of the message priorities could make a noticeable improvement.
Even modest improvements in ad design can greatly extend your advertising expenditure. For example, by improving an ad'srating from 60 to 90 (out of a possible 100 rating points), your advertising effectiveness jumps by 50% ((90-60)/60).Alternatively, better ad designs will allow you to spend less on advertising with the same effectiveness.
In making the ad copy design selection, be certain that you can document the bene�ts you select. In other words, do notengage in Deceptive Advertising because you may be subject to penalties.
Note the cost to design or modify an ad. You can modify the same ad multiple times in the same quarter and you will only becharged once. So if you create ad "A" in quarter 3 and then decide to modify ad "A" while still in quarter 3 you will only becharged once, but if you modify ad "A" once and ad "B" once you will be charged twice. If you enter the ad design screen anddecide you do not want to design/modify the ad then use the cancel option so that you will not be charged.
Deceptive Advertising
In designing your ads, be careful to select claims that you can document. All ad claims must be supportable by the marketresearch data for the region or city in which the ad is run. For ads that do not mention a brand name (Company Ad) you musthave at least one brand that satis�es the claim. To design an ad for a speci�c brand choose "Mention brand name" from thead features list. This will allow you to select a speci�c brand to be mentioned in the ad. To design a company ad do notchoose "Mention brand name".
Ties (or having the same conditions) will allow two or more �rms to make a superlative claim. The only exception is theclaim "More reliable than any other PC", only one company is allowed to make this claim. If more than one company is tiedfor the highest reliability rating then neither company can use this speci�c claim.
For example, if you run an ad in quarter 4 which includes the claim "Lowest price in town", then you must be able todocument that your company has a brand available for sale in quarter 4 that is priced as low as any competitors' brandswere in quarter 3.
It is permissible to test market any conceivable ad copy during the �rst quarter of sales without the worry of a deceptiveadvertising lawsuit. Starting with the second quarter of sales, all claims must be supportable.
Note: Include any applicable rebates for price comparisons.
Caution: If a brand is modi�ed, any market research data based on the original brand is not valid for the newly modi�ed brand.
Ad Claim Requirements
The following list contains all of the possible ad claims and the corresponding technical requirements for each claim.
Bargain prices under market average: All brands must be priced as low as the average price of all competitor brandsin the previous quarter.

10/4/2018 Help File
https://web5.marketplace-live.com/engine.php?tpl=help&instructorID=10353&sessionID=9c643fdc8c13b099d714380554bb28c1&quarter=9&langua… 37/99
Lowest price in town: Brand must be priced as low as all competitor brands were in the previous quarter.
Rebate - special price deal: A rebate must be offered for the brand.
Technical leader, most R&D: Company must have as many R&D components in their brands available for sale thanany other company had in the previous quarter.
Does a wide variety of tasks: Subjective, there are no speci�c requirements for this claim.
Most powerful PC on market: Brand must have as powerful a processor as any competitor brand had in the previousquarter.
Faster and bigger cloud storage: Brand must include "Large & fast Cloud storage" component.
Largest data storage on market: Brand must have as large a data storage as any competitor brand had in theprevious quarter.
Largest selection of PCs in town: Company must offer as many brands as any competitor offered in the previousquarter.
New and improved brand: Can be used once per brand when introducing a new brand design or modi�cation.
More freedom, long battery life: Brand must include "Long-life Battery" component.
Local sales and support: Company must have either a web sales center or sales o�ce staffed by a sales persontrained in the "Support" specialty.
Regional sales/serv-4 mkts/region: The region must have either a web sales center or four sales o�ces, each staffedby a sales person trained in the "Support" specialty.
Global sales/service-2mkts/region: Every region must have either a web sales center or at least two sales o�ces,each staffed by a sales person trained in the "Support" specialty.
Feature o�ce applications: Brand must include "O�ce Software Lite" or "O�ce Software Professional" or "O�ceSoftware Professional - upgrade" component.
More productive o�ce upgrade: Brand must include "O�ce Software Professional - upgrade" component.
Business graphics applications: Brand must include "Bus. graphics Software" component.
Engineering applications: Brand must include "Engineering Software" component.
Bookkeeping applications: Brand must include "Bookkeeping Software" component.
Data management applications: Brand must include "Database Software" component.
Presentation applications: Brand must include "Presentation Software" component.
Manufacturing applications: Brand must include "Manufacturing Software" component.
Statistical applications: Brand must include "Statistical Software" component.
Web design applications: Brand must include "Web design Software" component.
More secure (viruses, attacks): Brand must include "Security suite Software" component.
More reliable than average PC: Company reliability rating must be as high as the average for all competitors in theprevious quarter.
More reliable than any other PC: Company reliability rating must be higher than all competitors were in the previousquarter. Ties are not allowed for this claim.
Easy to use, simple design: Subjective, there are no speci�c requirements for this claim.
Easy on eyes with larger screen: Brand must include "19" standard Monitor (desktop)" or "21" high res. Monitor(desktop)" or "23" high res. Monitor (desktop)" or "32" wide screen Monitor (desktop)" or "17" advanced Monitor(laptop)" component.
Easier on wrists-comfort keyboard: Brand must include "High comfort Keyboard" component.

10/4/2018 Help File
https://web5.marketplace-live.com/engine.php?tpl=help&instructorID=10353&sessionID=9c643fdc8c13b099d714380554bb28c1&quarter=9&langua… 38/99
Work tiny detail, high resolution: Brand must include "21" high res. Monitor (desktop)" or "23" high res. Monitor(desktop)" or "32" wide screen Monitor (desktop)" component.
More productive with wide screen: Brand must include "32" wide screen Monitor (desktop)" component.
Very easy to use - touch screen: Brand must include "Touch screen" component.
Includes navigator and locator: Brand must include "GPS navigation/locator" component.
Ready for video conferencing: Brand must include "Video conferencing" component.
Many bundled applications: Brand must include at least two software packages.
Smart backup system: Brand must include "Auto backup system" component.
Fail-proof data storage: Brand must include "Fail-proof ultra cap. Hard drive" component.
Protected from loss of power: Brand must include "Uninterruptible power supply" component.
Finger print access security: Brand must include "Finger-print secure access" component.
Highest rated brand-Traveler: Brand must have been the highest rated for the Traveler segment in the previousquarter.
Highest rated brand-Mercedes: Brand must have been the highest rated for the Mercedes segment in the previousquarter.
Highest rated brand-Innovator: Brand must have been the highest rated for the Innovator segment in the previousquarter.
Highest rated brand-Costcutter: Brand must have been the highest rated for the Costcutter segment in the previousquarter.
Highest rated brand-Workhorse: Brand must have been the highest rated for the Workhorse segment in the previousquarter.
Portable design: Brand must be a laptop.
New slimmer design: Brand must include "Slim Case (desktop)" or "Slim stylish Case (desktop)" or "Slim Case(laptop)" or "Slim stylish Case (laptop)" component.
New slim stylish design: Brand must include "Slim stylish Case (desktop)" or "Slim stylish Case (laptop)" component.
New easy to use operating system: Brand must include "Basic w/ ease of use enhancement" or "Professional w/ease of use" component.
New hi-tech operating system: Brand must include "Professional w/ hi-tech enhancement" component.
Link PCs with network/internet: Brand must include "Standard Networking" or "High speed Networking" or "Globalhigh speed wireless Networking" component.
High speed network/internet: Brand must include "High speed Networking" or "Global high speed wirelessNetworking" component.
High speed global net: Brand must include "Global high speed wireless Networking" component.
Order tracking online: Company must have "Order tracking software" option operational in their web sales center.
Secure website for privacy: Company must have "Secure web site for privacy" option operational in their web salescenter.
Buy online at our web site: Company must have a web sales center staffed with sales personnel.
Toll free phone number on web: Company must have "Toll free phone number" option operational in their web salescenter.
Picture manufacturing setting: There are no speci�c requirements for this claim.
Picture business professionals: There are no speci�c requirements for this claim.

10/4/2018 Help File
https://web5.marketplace-live.com/engine.php?tpl=help&instructorID=10353&sessionID=9c643fdc8c13b099d714380554bb28c1&quarter=9&langua… 39/99
Picture people in travel setting: There are no speci�c requirements for this claim.
Picture engineering setting: There are no speci�c requirements for this claim.
Picture o�ce setting: There are no speci�c requirements for this claim.
Lawsuits
You are free to challenge any ad that a competitor places in the media (excluding the ads for the �rst quarter of sales). Theprocess begins when you issue a formal complaint to the Federal Trade Commission (instructor) that a competitor hasengaged in false advertising. At the same time you present the FTC with the complaint, you must submit a copy to thepresident of the �rm(s) named in the complaint. The complaint must be �led within 24 hours of the quarter being processed(or as speci�ed by the instructor). The complaint can only address ads that were run in the previous quarter, any ads thatwere run prior to that have passed the due date required for �ling. Each claim must be �led in a separate email.
In the lawsuit, the plaintiff must provide the following information for each claim:
name of the company being suedname of the ad being cited as falsename of the brand linked to the adwhere the ad was placed (name of media)quarter in which the ad was runthe speci�c claim which is believed to be falsethe reason the claim is false (the facts which make the ad false)
The defendant has 48 hours after the quarter has been processed, to respond to the claim (or as speci�ed by the instructor).
If the defendant wishes to challenge the lawsuit, then the following information must be provided:
name of �rm �ling the lawsuitname of the ad being cited as falsename of the brand linked to the adwhere the ad was placed (name of media)quarter in which the ad was runthe speci�c claim which is believed to be falsethe reason the claim is true (the facts which make the ad true)
The FTC will then review the charge(s) and the defense. The FTC will deliver their ruling prior to processing of the currentquarter. Their decisions are �nal.
Penalties
If a team is found guilty of multiple deceptive advertising claims in the same quarter, it shall be penalized as a singleoffense. The FTC reserves the right to adjust these penalties as it deems necessary for fair game play. Using a claim whichhas been previously prohibited as the result of a deceptive advertising penalty is itself considered deceptive advertising andis subject to further prosecution.
If the �rm is found to be guilty of deceptive advertising, then, the penalty will be as follows:
First offense: The defendant will not be allowed to make the claim for the next 4 quarters. No other penalty is allowed. Special note: If a company's �rst offense occurs during the last quarter of the game it shall be penalized as thesecond offense.Second offense: The defendant will be �ned an amount equal to 5% of its total revenues for the quarter in which the false ad was run.The money will be distributed to the other teams in the industry in such a way as that each team will receive 1/n ofthe �ne, where n equals the number of �rms in the industry. The �rm �ling the winning lawsuit will receive 2/n of the�ne. Also, the defendant will not be allowed to make the claim for the next 4 quarters.Third offense: The �ne will be 10% of the defendant's total revenues for the quarter. Also, the defendant will not be allowed to makethe claim for the next 4 quarters.Fourth offense: The �ne will be 20% of the defendant's total revenues for the quarter, and so on.
Note: These are the default FTC rules provided as a guideline for the instructor. The instructor may choose to modify these rules to �t the particularneeds of each game.

10/4/2018 Help File
https://web5.marketplace-live.com/engine.php?tpl=help&instructorID=10353&sessionID=9c643fdc8c13b099d714380554bb28c1&quarter=9&langua… 40/99
Media Placement
The second step in the advertising decision is media planning. The decision template lists examples of different media thatare available to you for communicating to your target markets. Your market opportunity analysis should tell you which mediaare more effective in reaching the different segments. After selecting the right media for a particular market segment, youmust decide which ad to run and how many times the ad will run.
Both local outlets and regional outlets (major media) exist. The local media represent a "shotgun" approach to advertising.The expenditures represent a potpourri of advertising from spot television and radio to newspaper ads. While there are somedifferences between segments, the local media are thought to cover all segments of a given metropolitan area. (This alsomeans that if you have nothing to sell to one or more segments, then that portion of your coverage is wasted.)
The regional media represent a "ri�e" approach to advertising. Each outlet is more narrowly targeted to the differentsegments, although some overlap may occur. The regional media is more effective in reaching your target markets simplybecause there is a higher probability of potential customers viewing your advertisements. The media can be purchased on aregional basis, with each region covering four geographic markets. As you review your decision template, you will �nd thatthese are very expensive relative to local advertising.
One concern with regional media is advertising waste. With regional editions, you may end up advertising in cities in whichyou have no product distribution. Without product in local sales outlets, you will create demand that you cannot serve. Thecarryover in brand recognition from one quarter to the next is limited and is negated by the creation of ill will amongcustomers who could not �nd your brands.
The advantage of local media is that you can better coordinate your advertising with your distribution. Thus, your mediaplacement decision must consider the number of customers who have access to your brands, along with the cost andeffectiveness of the media.
The media listed in the template should be considered examples of the types of regional outlets available to you. Yourmarket survey revealed a broad assortment of magazines that your potential customers read on a regular basis.
You can count on your ad agency to review and select the best media outlets in each category. For example, the agency willdiscover the best Business Magazines or the best Trade Journals and place your ads in the top 3 or 4 outlets in thatcategory. Furthermore, the ad agency will try to avoid saturation in any single magazine. Thus, if you want to place 12insertions in New Venture Magazines in a given quarter, the ad agency will spread them out so that the ad will appear every4th week in each of the top 3 magazines. As a general rule, the ad agency will select magazines that run weekly. Theregional media are published weekly over the 13 weeks of the quarter, and the local media can be used daily over the 90days of the quarter.
As you prepare your media plan, you need to worry about media saturation. It is possible to wear out the persuasive appealof an advertisement if it is run too many times in the same media category. For example, if you were to run the same ad 36times in Sport Magazines, it would appear weekly in the top 3 magazines. This would be too much for the market to endure.It would be better to create 3 different advertisements and run them a dozen times each or to go to other media choices thatare high on the list for the targeted segment.
Another consideration to keep in mind as you plan your media budget is that your target customers read more than one typeof magazine. They may read general news, leisure and entertainment, or sport magazines. As you expand your budget,consider more than the highest rated magazine. Exposure in multiple contexts will increase the probability of the messagegetting through the clutter of the media and the customer's natural defenses against advertising.
As a general rule, the more often you advertise, the more likely you will move a potential customer through the awareness,interest, decision, and selection sequence.
However, this rule has three limitations:
1. After a certain point, additional insertions start to result in diminishing returns.2. The ads must be on target, both in design and placement, to be effective.3. Your advertising will be judged against the quality and quantity of advertising of your competition. If your competition
does a better overall job than you do, they will capture a larger share of the market.
The ultimate decision that you must make in media planning is how much to invest in advertising. Authors of marketingtextbooks usually identify four methods of setting advertising budgets: all you can afford, competitive parity (i.e., the sameamount as your strongest competitors), percentage of sales (i.e., 5% of projected sales), or objective and task.
Theoretically, the objective and task method is the most attractive because you must spell out your objectives, assumptions,and the expected payoff of the amount of money invested. Practically speaking, the �rst three methods help to establish

10/4/2018 Help File
https://web5.marketplace-live.com/engine.php?tpl=help&instructorID=10353&sessionID=9c643fdc8c13b099d714380554bb28c1&quarter=9&langua… 41/99
benchmarks for comparison between brands and competitors and should be part of the decision.
A �nal point to consider in advertising planning is your �rm's advertising effectiveness. The �rst sales outlet to enter a citywill generally encounter buying resistance on the part of the end-user. Local buyers do not know who you are, what you haveto offer, or why they should buy from you.
When you are the new kid on the block, it will usually take a quarter or two for customers to become familiar with your salesoutlet and the brands you carry. Heavy advertising will prove wasteful. A more moderate budget is preferred in order to movepotential customers from the awareness stage to a purchase decision. Later entrants into the market should not experiencethis startup problem, although they must overcome the buyer loyalty built up by the pioneering �rm.
Breakdown of media discounts:
Media cost = Cost per insertion * Number of ad inserts^ (Elasticity for frequency discount) Elasticity to determine frequency discount = 0.90
Sample Calculations:
1. Sample media cost per ad insert = 5,000 Number of insertions = 10 Total media cost = 39,716.41 Ending cost per insertion = 3,971.64
2. Sample media cost per ad insert = 5,000 Number of insertions = 100 Total media cost = 315,478.67 Ending cost per insertion = 3,154.79
Advertising Effectiveness
It is important to estimate how well you are reaching your target markets, especially in relation to your competition. While itis di�cult to estimate advertising impact and �nancial effectiveness, it can be done with a little work. First, you mustestimate the advertising impact of the local media and then the advertising impact of the regional media. To obtain anestimate of local advertising �nancial effectiveness, divide the estimate for local media impact by the local advertisingbudget. Similarly, if you divide the estimate for regional media impact by the regional advertising budget, you will have anestimate of regional advertising �nancial effectiveness.
To estimate impact for local advertisements, multiply 100, by the frequency with which the advertisement is run, times thejudgment rating of the advertisement.
Local Impact of an advertisement = 100 * the number of times the advertisement is run * the judgment rating of the advertisement
To estimate impact for regional advertisements, multiply the media preferences rating (found in the end-user pro�le), by thefrequency with which the advertisement is run, times the judgment rating of the advertisement.
Regional Impact of an advertisement = media preferences rating * the number of times the advertisement is run * the judgment rating of the advertisement
By repeating these steps with different media plans, you can compare the advertising effectiveness of each and determinewhich plan will provide the best return for the advertising expenditure.
Equally important, you can compare your advertising impact and �nancial effectiveness to your competitors. You may besurprised that the �rm with the largest advertising budget may not have the most effective advertising campaign.
Please note, advertising impact and �nancial effectiveness must be computed separately for each segment. That is, it issegment-speci�c.

10/4/2018 Help File
https://web5.marketplace-live.com/engine.php?tpl=help&instructorID=10353&sessionID=9c643fdc8c13b099d714380554bb28c1&quarter=9&langua… 42/99
F. Sales Office
1. Territory Development2. Sales Office Management3. Brand Selection4. Brand Price5. Costs of Production and Operations6. Price Elasticity7. Competitive Prices8. Price Rebate9. Sales Order Priority
10. Point of Purchase Displays11. Sales Force Management12. Number of Sales People13. Target Market Specialty14. Brand Promotions15. Special Sales Force Programs16. Web Sales Center
Distribution is one of the least understood elements of the marketing mix. Most of us can relate to brand design, pricing, andadvertising decisions because they impact upon us as consumers of household and personal goods. It is rare for most of usto have any experience with distribution.
When we walk into the grocery store, we assume that the detergent, milk, cereal, or whatever else we want will be there,because it has always been there. Who thinks about how it got there or why one brand is on the top shelf and another is onthe bottom, or why one brand is on special but not another, or even why one brand is carried but not another? It is the job ofmarketers to worry about these decisions and many more like them.
There are two components to distribution or sales o�ce decisions. First, you must consider Territory Development byevaluating the sales potential of each city in the world market and decide upon your preferred order of entry.
Second, you must make Sales O�ce Management and Sales Force Management decisions by deciding what brands to carry,prices, and sales force size and allocation.
Learning Objectives
The primary objective of the sales o�ce management effort is to force you to deal with demand management. Your marketorientation can profoundly affect the complexity of your sales o�ce decisions and potential payoffs. If you consider only theconsumer's viewpoint, the task of making sales o�ce decisions is manageable. Through careful study of the relativecontribution of each decision to sales and pro�tability, it is possible to �nd the right combination to maximize short-term andlong-term pro�ts.
A second objective is to give you experience in sales o�ce planning. Brand assortment selection, price determination,priority setting and sales staff planning are all common selling activities. While limited in comparison to real-world decision-making, they provide a realistic experience in dealing with the basics of the Sales Force Management.
A third objective is to give you experience in translating customer needs and wants into brand-design speci�cations. Saleso�ce managers are essentially buying agents for the end-user. Their job is to anticipate and understand end-user needs andassemble an assortment of brands that will satisfy these needs. Successful sales o�ce managers cannot afford to simplytake what is offered. They must be able to recognize a strong performer from the rest and possibly become involved in thebrand-creation decision itself.
Finally, the objective of the pricing effort is to give you experience in making pricing decisions which simultaneouslyconsider consumer preferences, competitive pressures, pro�tability, and return-on-investment variables. The pricingexercise should help you to understand the multidimensional nature of the pricing decision. Too often, business peopleconsider only one variable at a time. They might begin by focusing on markups over cost, or what the market will bear. Atother times, they may concentrate on competition. A few may consider the margin - volume tradeoff and a target return oninvestment. All of these variables must be considered simultaneously.
Concepts Emphasized

10/4/2018 Help File
https://web5.marketplace-live.com/engine.php?tpl=help&instructorID=10353&sessionID=9c643fdc8c13b099d714380554bb28c1&quarter=9&langua… 43/99
Sales o�ce management: Manipulation of brand assortment, pricing, sales priorities, and sales force strategies toaccomplish sales and pro�tability objectives.
Financial strategy: Margin versus turnover operation.
Brand evaluation: Assessing end-user needs and determining the best brand designs to satisfy needs.
Brand assortment: Depth of product line.
Forecasting: Predicting unit sales by brand based upon market potential, current market performance, the predicteddecisions of competitors, and an evaluation of one's own performance versus the predicted performance of others.
Inventory management: Consideration of the opportunity costs of lost demand versus the costs of holding inventory forsafety stocks.
Sales/production coordination: Coordinating production with planned sales events such as manufacturer price rebates andblitz ad campaigns.
Postponement: Maximizing decision �exibility and minimizing risk by waiting to see what happens. -versus- Speculation: Early commitment of resources in order to gain a cost advantage and a jump on competition.
Cash-�ow management: Understanding the sources and uses of money and how various business decisions affect theavailability of cash.
Pricing strategy: Role of price to achieve corporate objectives relative to customer, competition, and pro�tabilityconsiderations.
Pricing tactics: Penetration pricing, skim-the-cream pricing, price lining, and so forth.
Price computation: Overhead and variable costs, cost allocation among brands, margins.
Financial accountability: Return on investment requirements and need for continued corporate �nancial support.
Pricing economics: Monopoly [only brand with new technology], oligopoly [one or two competitors], or monopolisticcompetition [everyone has it, use other variables to differentiate brand].
Price elasticity: The responsiveness of a market segment to a change in price.
Demand management: Manipulation of sales variables to control demand relative to supply and to maximize pro�tabilityacross available brands.
Decision-making: Evaluation of the pros and cons of available investment options and a commitment of resources to anuncertain future.
Territory Development
Your territory development decision is among the more straightforward decisions with which you are faced. Each city has adifferent sales potential or number of prospective buyers. In addition, there are differences in the composition of the marketsegments.
One metropolitan area may have a greater proportion of one segment than another city. These differences in marketcomposition will in�uence the sales volume of the different brands on the market.
Your MOA should provide you with a rough estimate of the sales potential by segment and by geographic market. Determinewhich markets have the highest concentrations of potential customers in your target segments. With this information, youshould be able to establish a priority list of geographic markets.
As you enter these markets, keep in mind that actual sales will be less than market potential, especially in the early stages ofthe industry's product life cycle. Unit demand will depend upon how well the needs of each target market are ful�lled.
There are other concerns beyond market size to keep in mind as you open sales o�ces. The �rst is operating expense. Thebetter markets tend to have higher operating expenses. These include the setup costs (leasehold improvements, o�ceequipment, furniture, and supplies), quarterly lease rates, and sales force salaries. Thus, the greater market potential ofthese markets must be balanced against the greater cost of serving them.
10/4/2018 Help File
https://web5.marketplace-live.com/engine.php?tpl=help&instructorID=10353&sessionID=9c643fdc8c13b099d714380554bb28c1&quarter=9&langua… 44/99
The second factor affecting the location decision is competition. Territories with high demand are likely to attract morecompanies, and competition is expected to be stronger. Markets with lesser demand may attract fewer competitors.
Another competitive consideration is that early entrants will have the pioneering advantage of building unchallengedcustomer loyalty, but they pay a price in low initial sales due to a lack of customer awareness of the product category. Lateentrants into the market avoid the delays in market recognition but may require one or two quarters to overcome the brandloyalty factor.
Shipping economies are the third issue that you must consider in opening sales o�ces. All shipments from the productionfacility go to transshipment centers in each region where the inventory is sorted and reshipped to individual markets,depending upon demand. Customers pay the freight from the transshipment centers to their destinations. That is, shippingis FOB dock.
The freight rate from the central warehouse to a regional transshipment center depends upon distance and the volumeshipped. As more inventory is passed through the regional centers, distribution economies improve and per-unit shippingcharges drop substantially. Consequently, there is an economic incentive to concentrate sales o�ce openings into a limitednumber of nearby regions rather than have a few sales o�ces spread thinly in several regions.
Advertising economies are also a factor in the territory development decision. As the region becomes �lled with saleso�ces, advertising in the regional media becomes more attractive. Advertising in a regional edition of a regional mediameans your message goes to all metropolitan markets in the region.
If you do not have something to sell in one or more of those markets, then you will have wasted that portion of youradvertising investment. Consequently, there is additional economic incentive to concentrate sales o�ce openings into alimited number of regions in order to get the most out of your advertising expenditure.
In summary, the territory development decisions are in�uenced by market potential, competition, operating expenses, andadvertising economies. The sales appeal of the larger markets must be balanced against the higher overhead to enter andcompete in these markets. Finally, each �rm should have a basic plan regarding the sequence of markets to be entered. Asinformation becomes available regarding the decisions of the other companies, this plan should be revised.
Identify the top markets by segment and then decide upon the order of marketing. Decide which sales o�ces will be open inquarter 2, which will be open in quarter 3, and so forth. When you are �nished with this priority list, you should have atimeline of sales o�ce openings by quarter.
As you enter each new market, you will want to address Sales O�ce Management decisions. These decisions can in�uencedemand.
Sales Office Management
Brand Design, Brand Pricing, and Advertising Effectiveness are the most important variables affecting demand. A design thatmeets the needs of the target market and is priced within their spending limits should be a good sales performer. A weakdesign or too high a price will result in a signi�cant reduction in demand relative to market potential.
Advertising is also very important because it is necessary to create awareness of a brand and its want-satisfying capabilityfor the end-user. Even a good design with an acceptable price cannot achieve its full potential without solid advertisingsupport.
You can in�uence demand by your management of the sales o�ce. Brand Selection, Brand Price, Price Rebates, Sales OrderPriority, POP Displays, and Sales Force Management can have an incremental effect on demand. A top sales order priority, aPOP display, and sales people with technical training could favorably help the sales of a brand by 20 percent to 40 percent. Inaddition, Price Rebates and Special Sales Force Programs can provide a substantial short-term stimulant to demand.
Most of your sales o�ce decisions are made on a regional basis. That is, your decisions regarding Brand Selection, BrandPrice, Price Rebates, and Sales Order Priority will be identical or standardized across all sales o�ces within a given region.
The metropolitan markets within the same region are thought to be more similar than markets in different regions. Ratherthan expend the extra time and effort to design a new sales o�ce plan for every market, you will discover that it is faster andless expensive to employ the same sales program throughout the region. Essentially, this is the philosophy of many real-world retail chains that develop a top-rated plan and then set up the sales o�ces across the country in a cookie-cutterfashion.
You do have the �exibility to change the sales o�ce plan from region to region. This may be desirable in order to takeadvantage of regional differences in competition, market needs and the concentration of the different market segments.

10/4/2018 Help File
https://web5.marketplace-live.com/engine.php?tpl=help&instructorID=10353&sessionID=9c643fdc8c13b099d714380554bb28c1&quarter=9&langua… 45/99
You have complete �exibility to adjust your sales force by metropolitan market. You can adjust the total number of salespeople and the relative emphasis they place on different segments.
Finally, there are three Special Sales Force Programs that serve the entire sales force. These programs include professionaltraining, company-wide contests and kits to show and demonstrate your products.
When allocating sales people in an o�ce, the �rst number entered is the total pool of staff available. Subsequent numbersdetermine the number of people who will be trained for either speci�c market segments or support. Specialized people willspend 70% of their time either selling to a speci�c market or performing support, whichever the case may be. The remaining30% will be spent selling to all segments evenly. Unassigned sales people will divide their time selling to any and everyoneand are less e�cient in sales to any particular market segment but are more likely to meet needs you may not have plannedfor.
Brand Selection
One of your most important sales o�ce decisions is the selection of the brands to be sold. If you do not offer what yourcustomers want, they will not call for a sales presentation or visit your sales o�ces.
Mechanics: Essentially, the Brand Selection decision is the speci�cation of which brands will be sold through the saleso�ces in the region. Any brand designated for regional sales must also be given a brand price and assigned a sales priority.
It is this combination of decisions that determines the brand assortment in the regional market. You are free to have adifferent assortment of brands in each region. This tactic will allow you to respond to regional differences in market needsand demand.
Be careful about moving brands into and out of a market. Brand loyalty increases the longer a particular brand is sold. Thisloyalty is lost if you remove the brand for even a single quarter.
Brand Price
All sales to the end-users are through your sales channels. You must establish a sales price for each brand. When setting theprice, you must consider:
1. Cost of manufacturing and operations - for each brand, you are given the value of Cost of Goods. This numberrepresents all the expenses related to number of units sold.
2. Price Elasticity - how price sensitive is your target market?3. Competitive Prices - what price are your competitors going to charge?
Costs of Production and Operations
Your production costs include materials, labor, and production overhead. The cost of materials represents the largest shareof your production costs. Materials costs are variable and are determined by the production volume.
Each feature has a different material cost. These costs drop as your production volume increases. Since some features costmore than others, the features which you decide to include in your brand design directly affect unit production costs.Carefully review production costs as you design each brand. They will establish a price �oor for the brand, assuming youintend at least to cover your variable costs.
In addition to production costs, your prices should cover your company overhead expenses, often referred to as GeneralSales and Administration (GSA). Overhead includes interest on loans, R&D, engineering, marketing research, advertising,lease payments, shipping expenses, and sales force salaries and training, to name a few.
Interest, marketing research, engineering, leases, and sales force salaries tend to support all brands equally. These expensescan be allocated to each brand in proportion to its production volume.
Some GSA expenses should not be allocated to a brand simply based upon the number of units produced. For example, thesize of your investment in R&D, sales force incentives and advertising will vary by brand (i.e., advertising in high-endmagazines to appeal to the power user can be very expensive).
Therefore, these expenses, and others that vary by brand, should be allocated to individual brands based upon actualexpenditures. The technique of allocating expenses to their correct activity is termed Activity Based Costing (ABC). An ABC

10/4/2018 Help File
https://web5.marketplace-live.com/engine.php?tpl=help&instructorID=10353&sessionID=9c643fdc8c13b099d714380554bb28c1&quarter=9&langua… 46/99
analysis is provided in the brand pro�tability section under brand management, and in the regional pro�tability section undersales channel, starting in quarter 4.
Your price should also include a target pro�t level. Low-volume, high-ticket brands usually include more pro�t than high-volume, low-price brands. Keep in mind that your net pro�ts will determine your ability to expand from internally generatedfunds and are a measure of your success. Many executives fail to price for future growth.
Price Elasticity
Your pricing decision should also consider what the market will bear. All segments are responsive to lower prices. However,some are less sensitive than others. To some segments, a ten percent difference in price will have little bearing on demand.In other cases, the difference could cause a substantial switch from one brand to another.
It is very important to test and know the Price Elasticity (sensitivity) of your target segments. This knowledge will help you todecide whether to use penetration pricing (deep price cuts), Price Rebates, or skim-the-cream pricing (premium prices).
In addition to segment-speci�c price sensitivity it is believed that the total market will expand as prices drop. Thus, as yourprices drop, expect more potential customers to shift into an active buying mode. The rate at which customers enter themarket as prices drop will vary by market segment.
Competitive Prices
The �nal consideration in setting prices is the action of your competitors. If they price below you, they can expect a largershare of the market, all other things being equal. The size of this brand switching will be dependent upon the sensitivity ofthe segment to pricing issues and the size of the difference.
Keep in mind that your �rm will develop a price image in the region. If your �rm's average price in a region is below thecompetition, the price differential should help in generating more demand and taking business away from your competition.
You should also recognize that this price sensitivity extends to your own product line. Your lower-priced models will be moreattractive than your higher-priced brands for any given market segment. Even if no other competitor is in your sales area,your brands will compete with each other for market share.
Again, test the market's sensitivity to prices. Also, determine if the added sales volume is worth the decline in gross margindue to the lower price.
As a planning tool, you might wish to prepare a price worksheet for each brand you carry. The worksheet would include theidentity of the target market, suggested brand price, price sensitivity of the target market, predicted price judgment, brandprices of comparable competing brands, and a breakdown of your direct variable costs, R&D, and advertising.
It would also include a sales volume estimate and a total pro�t contribution (pro�t margin * sales volume) for each brand.This worksheet should help you to visualize the different variables affecting your pricing decision and ensure that they are aconscious part of the decision. It will also be a good resource for your marketing plan and to use in meetings with thechairperson of the board.
Note: The price judgment ratings are based on the �nal price after any rebates.
Price Rebate
Price rebates are a short-term stimulant to market demand. Rebates are popular amongst all customers and they are goodtra�c builders for sales outlets. Among price sensitive customers, rebates create excitement and encourage them to buyimmediately. If you need to move excess inventory or you want to attack an established competitor in a new market, youmay wish to promote a price rebate for one or more brands.
The down side of a rebate program is that you may be borrowing from future sales. Some of your customers may have beenintending to buy at a later date. Rebates simply encourage them to act sooner. In addition, a large proportion of thecustomers would have made their purchases without a rebate. Also, while your price image will be improved in the quarter ofthe sale, it will deteriorate in the quarter the rebate is removed, as customers perceive a price increase.
Rebates in the order of 100 to 300 are typical for price sensitive customers. You can expect that 50 percent of all sales madeduring the quarter in which a rebate of this magnitude is offered will result in a rebate request. The farther that you increasethe rebates above this range, the more likely the customers are to claim the rebates.

10/4/2018 Help File
https://web5.marketplace-live.com/engine.php?tpl=help&instructorID=10353&sessionID=9c643fdc8c13b099d714380554bb28c1&quarter=9&langua… 47/99
Disproportionally large rebates will also affect customers' perception of price. In other words, if you price a product too highand also offer a large rebate on it, you should not expect your customers to perceive the actual price they pay as the fullprice minus the rebate. Your customers will have to come up with the cash to cover the full price before they receive therebate later. Buyers will tend to ignore unusually high rebates and will be discouraged from making a purchase if the priceseems too high.
Sales Order Priority
Once you have decided which brands to carry in your showroom, you must then decide on the sales priority for each brand.The sales priority is a clear indicator to the sales staff regarding management's interest in selling one brand over the other.
The brand given the number one priority will be pushed the hardest by the sales people. A brand given a number two prioritywould be promoted hard by the sales staff, but not as hard as the number one brand. A brand with a number 10 prioritywould be almost ignored by the sales staff. Customers would have to come looking for the brand and be determined to notaccept any substitutions.
The sales order priority will also be used in establishing the shelf locations in your showroom. A good shelf location willimprove the visibility of the brand, encourage closer inspection, and may even stimulate impulse buying. Thus, the samebrand will sell in larger quantities in a high-tra�c location near the front of the showroom than in an out-of-the-way spot inthe back of the showroom, all other things being equal.
You may want to create point-of-purchase (POP) Displays to place on the showroom �oor in hopes of generating demand.
Point of Purchase Displays
You have the option to create Point of Purchase (POP) displays for each brand sold on the market. If you elect to place aPOP in the showroom for a particular brand, its sales potential will be enhanced. Displays draw attention to a brand andusually contain persuasive information on how the product can be useful to the customers.
Point of Purchase (POP) displays will give a brand a differential advantage in the showroom. You, however, must be carefulabout how many displays are placed in the showroom - too many POPs detract from their effectiveness. More than two orthree POP displays tend to divide attention, and clutter the display area.
There is a charge of 200 per brand per sales o�ce to create a POP display. Your ad agency will take care of the creative andproduction details if you authorize their use. The displays are only useful for one quarter because they become soiled andotherwise unattractive from handling. Therefore, you must create new POP displays for any quarter in which you wish to usethem.
Sales Force Management
Your �nal Sales Channel decision is sales force management. You must decide the Number of Sales People to employ ineach sales channel, and their Target Market Specialty.
You must also decide on whether to employ special incentive programs such as Brand Promotions, and/or provide otherSpecial Sales Force Programs in the form of demonstration kits and other kinds of professional training.
Number of Sales People
The number one decision to make in Sales Force Management is how many salespeople to employ in each city. Demand isthought to be directly affected by the number of salespeople that you place in a market. As you add salespeople, unit saleswill increase, but at a decreasing rate.
The support people will spend 70% of their time supporting the products and 30% in sales. Their role is to enhance sales tosegments concerned with after sales support for their products. As the demand from sales outlets grows, so should thenumber of support people and overall sales people. One support person in each sales o�ce may be su�cient to begin with,but as sales rise, more than one support person will probably be needed to be able to adequately provide after sales supportand satisfy the customer needs.
There is a �nancial cost for adjusting the size of your sales force from quarter to quarter. It is costly to �nd and hire newsales people. The cost of recruiting new sales people escalates as the number of sales people increases because of thedi�culty of �nding quali�ed people. Similarly, it is costly to lay sales people off. Also, the market is a little sensitive to a

10/4/2018 Help File
https://web5.marketplace-live.com/engine.php?tpl=help&instructorID=10353&sessionID=9c643fdc8c13b099d714380554bb28c1&quarter=9&langua… 48/99
decrease in the sales staff. From the customer's viewpoint, a reduction in staff generally indicates a drop in service. There isno �nancial cost to move sales people around within a region. Thus, ine�cient sales people in one market can be moved toanother city within the region without paying a premium.
There are practical limits to the number of salespeople you can employ in a market. After a while, they begin to get in eachother's way. The number of salespeople to hire will depend upon the market potential of the city and the quality of yourbrands, prices, and advertising relative to market needs and competition.
In the early stages of the market, you can assume that each sales person will sell between 30 and 70 units per quarter.Initially, a conservative approach would be to estimate that each salesperson sells 50 units in a given quarter.
Caution: These starting �gures for demand estimates are based upon the averages. Demand can be less or greater than the estimates given here ifyour marketing efforts are well below or above the average.
As you gain experience in the market and re�ne your marketing decisions, the number of sales per salesperson will increaseand the sales curve will likely move upward. Later, when you introduce new technology and substantially invest in advertisingand sales training, the curve is likely to shift upwards again. Just how high the curve will move will depend on the size of thetarget segment and the marketing decisions made by you and your competition.
As you can ascertain from this discussion, the number of units sold per salesperson is a critical number to watch. Be certainto compute this �gure for each segment in each city and compare it to your competition's estimate in order to gauge theeffectiveness of your marketing efforts.
Target Market Specialty
One particularly important dimension of the sales force decision stems from their market training. You can favorablyin�uence the sales of a brand by having some of the sales staff receive special training on speci�c segment's needs.
The training program has a modest cost per salesperson. With this training, your salespeople will be more knowledgeableabout a particular segment's needs, more persuasive in closing the deal, and provide better support to the customer after thesale is complete.
The designation of a Target Market Specialty will also direct the salesperson when making outside cold calls. If asalesperson has received training to specialize in the Workhorse segment, then he or she will look for customers that �t thepro�le of the Workhorse segment and largely ignore the other segments.
To illustrate this point, imagine a salesperson driving through a major market looking for new business. He or she might stopat all of the small businesses but bypass most of the production facilities or engineering �rms. The latter businesses are inthe Mercedes segment. The salesperson is not well equipped to sell to these segments and therefore he or she tends toignore them.
Overall, the specialized sales person can still be expected to support all the brands carried, but he or she will be targetedtoward a speci�c segment. In any case, the more sales people you assign to speci�c segments, the more effective your totalmarketing effort will be, versus your competition.
A second important option of the target market decision is whether to allocate one or more salespeople to a service/supportrole. Certain segments are concerned about after-sale support. They want to have someone available to help withinstallation and troubleshooting, should problems develop. You can enhance your sales to these segments by assigningsales people to this service role. The bene�t is spread across all segments concerned about sales support. These servicesupport personnel do little direct selling; however, they do enhance the selling potential of your other sales personnel.
Brand Promotions
Sales people are strongly motivated by �nancial incentives. You can channel their energies toward a speci�c brand byoffering either a cash bonus or a free gift to the top sellers of the brand in a region. Either incentive will encourage the salespeople to promote the designated brand and unit sales will generally increase noticeably.
The use of a cash bonus or a free gift is attractive if you want to promote a brand with a better than average margin. Some�rms use them to boost sales at the end of the year in order to make the �nancial books look better. The disadvantages ofthese techniques are that their effect is short-lived and they may distract the sales people's attention from the rest of theproduct line.

10/4/2018 Help File
https://web5.marketplace-live.com/engine.php?tpl=help&instructorID=10353&sessionID=9c643fdc8c13b099d714380554bb28c1&quarter=9&langua… 49/99
Special brand promotions can also create what is called "pipeline whiplash" by causing spikes in demand. Demand spikescause huge swings in production as the production facility attempts to compensate with �rst the shortage and then excessin inventory. The problem is exacerbated if the production facility is not forewarned about the promotions. It can be a seriouspoint of tension between sales people and manufacturing people.
Special Sales Force Programs
In additional to regional incentive programs, you can undertake three company-wide sales support programs. The �rst is aprofessional training program where salespeople can develop skills related to teamwork, interpersonal relations, makingpresentations, and proposal writing.
The professional training is also designed to further develop the sales forces' understanding of business practices andmethods and keep them informed about the latest philosophies and theories of business. The effect of this kind of trainingis much more di�cult to measure but is thought to add to the professionalism of the sales force, which enhances thecompany's reputation among your customers.
The second support program that you can offer is a company-wide sales contest. In this case, the contest is for a specialvacation trip for the top performers among your sales staff. These vacation contests are strong motivators, especially forthe more expensive and exotic vacations.
The disadvantage is that the incentive to excel can decline in the quarter following a sales contest. The staff works hard toclose their pending deals and exhausts their sales leads during the contest period. These contests must also be coordinatedwith the production facility to insure that daily production schedules are properly balanced.
The �nal support program is the demonstration kit. These kits are notebooks containing professional presentationsdesigned to sell product. The advantage of preparing a demonstration kit is that the sales argument can be carefully thoughtthrough, scripted and illustrated to show company products in the most favorable light. They also help to standardize thesales pitch by the sales force, thus avoiding ill-conceived presentations.
While these demonstration kits enhance the selling power of the sales staff, they do not provide a sudden boost to sales.They are more likely to add to the professionalism of the staff and enhance the company's image. Over time, these bene�tsadd to the marketability of your products and customer loyalty.
Web Sales Center
The World Wide Web represents one of the two distribution options open to you. The other is the more traditional brick-and-mortar sales channel. You may choose one or both of these channels of distribution.
One advantage of a web sales channel is that it will allow you to quickly serve a large geographic market.
A second advantage of the web is that it can be more e�cient. The number of sales and support people required to servethe market will almost certainly be less. You do not have to open staff o�ces in all markets. Also adding to your e�ciency isthe fact that the customer does much of the work for you. The customer �nds you, evaluates the available products, andthen places the order, rather than the other way around.
The preparation and distribution of marketing materials is also e�cient because they are in electronic form. It is also nicethat they can be readily changed and improved as you learn how to better appeal to the web market.
However, there are disadvantages of the web sales channel when you compare it to the brick-and-mortar sales channel. Amajor advantage of a traditional brick-and-mortar sales channel is that it allows you to more precisely target speci�csegments. That is, you can hire sales people and direct them to target certain customers, even to the point of telling themwhich doors to knock on.
This ability to go out and �nd customers also means that demand within that sales territory and segment can be greaterthan that obtained via a web site. For example, a sales person selling to the workhorse segment in the Chicago trading areais more likely to �nd and convert workhorse prospects than a generic web site serving the entire North America. If theChicago area has many workhorse customers, then you can hire more sales people to work this territory and quicklygenerate lots of business. Thus, the targeting of these marketing and sales efforts can be very e�cient and effective.
Another disadvantage of an e-commerce channel is that you must wait for the customer to �nd you (your web site). If thepath they take on the web does not lead them to your web site, how will they buy from you. To be sure, you will hire a salesand service staff to facilitate customers wanting a personal touch, but they must wait for the phone to ring.

10/4/2018 Help File
https://web5.marketplace-live.com/engine.php?tpl=help&instructorID=10353&sessionID=9c643fdc8c13b099d714380554bb28c1&quarter=9&langua… 50/99
Web marketers have learned a great deal about how to make the phone ring. They have discovered a number of webmarketing tactics that make it easier for the customer to �nd the path to your door, and once there, entice them to lookaround and buy. These options will be discussed in the next section.
It might occur to you to develop both the web sales channel and the traditional sales channel. This strategy would allow youto take advantage of the strengths of each and minimize their limitations. And, you could increase total demand since allcustomers will not fall into both categories.
Before you get too excited about this option, look at the cost. In the early stages of your �rm, you will not have the �nancialresources to aggressively pursue both. If you try, bankruptcy will �gure prominently in your future. A better �nancial choicewill be to pursue one channel aggressively, create a successful and pro�table customer base, and then pursue the otherchannel option.
Be aware that if and when you develop both channels of distribution, you will have to deal with cannibalization. That is, thebrick-and-mortar sales o�ces will cannibalize sales from the web channel, and vice versa. For example, some customersthat may have bought from your web site will switch over to your sales o�ces because that is their preference. Thus, dualdistribution will lower the productivity of both sales channels. On the other hand, dual distribution may create more demandin total. The question is, will dual distribution be more pro�table?
You might wish to experiment with each sales channel in order to discover the advantages and disadvantages of each.
Tra�c Building Tactics
There is an old marketing adage that says, "Build a better mousetrap, and the world will beat a path to your door." Nothingcould be further from the truth. No one will come if they are not invited, even persuaded to visit. They are too busy doingother things.
One huge attraction of the web is that you can �nd virtually everything you want to know and buy on it. This is also its majordisadvantage. The web is so vast that it is not hard to miss a site, even if you wanted to �nd it.
Web marketers have been hard at work trying to overcome the inherent limitations of commerce on the web. They havecreated a number of tactics to increase the tra�c to a web site and to increase the probability of purchase once a potentialcustomer is there.
You will have the opportunity to deploy six tra�c building tactics over the �rst two years of business. These options arelisted and described below. Your productivity options are described in the next section.
Activities to Encourage Increased Tra�c to Your Site
Continuous upgrading of site to appeal to web crawlers that catalogue sitesListing your site with major search enginesContract with major search engines to be listed in the computer shopping section from their main pageContract with major web sites that sell related products to have a link from their siteContract with major e-retailers that sell electronics goods to be listed on their siteContract with major search engines to show a popup window ad if user �ts customer pro�le
These tactics will be phased in over the �rst two years of operation. It is not practical to implement them all at the sametime. Thus, you will start modestly and add new tactics as you are able. Also, these tactics do not instantly generate their fullpotential. They must be implemented for several quarters in order to re�ne their use and get the kinks worked out.
The �rst two options are designed to make your web site highly visible to search engines. Web crawlers are like little robotsthat travel over the internet cataloging web sites. They are programmed to look for key words and links to other web sites.The key words are especially important since they help the web crawlers to classify the site and place it in appropriategrouping for retrieval should someone look for a similar category. If the key words are not thoughtfully written into the texton your web page, then the classi�cation may be wrong or less effective. Thus, your staff must study the search protocol ofweb crawlers and write web pages to appeal to them.
The listing of your site with major search engines is also important. For a small fee and a little paper work, you canproactively have your web site listed with the major search engines. Of course, you must continue to invest in these twoactivities because the web crawlers and search engines evolve over time and the web itself changes. Also, continuing effortswill ensure that you are also visible to the less, well-known search engines.
With the third tactic, you can contract with major search engines to be listed in their shopping section. The search enginesusually have a shopping section highlighted somewhere on the �rst page. Clicking on this link will give the user a list ofproducts that can be purchased over the web, including personal computers. When the computer link is selected, a list ofcomputer brand names will be listed, often with their logos prominently displayed. You can insure that your products are

10/4/2018 Help File
https://web5.marketplace-live.com/engine.php?tpl=help&instructorID=10353&sessionID=9c643fdc8c13b099d714380554bb28c1&quarter=9&langua… 51/99
among the �rst to be seen by paying for this spot. Thus, you can increase the tra�c to your web site if you are willing tonegotiate with these search engines and pay a commission for customers that click through to your site and make apurchase.
For the fourth option, you can contract with web sites that sell related goods. In most cases, they are featuring their ownproducts but will provide links to other suppliers of related goods. For example, a supplier of printers might place a link toyour site in return for a small commission for anyone that clicks through and buys a computer.
The �fth option enables you to be listed on the web site of major e-retailers of electronic goods. These sites sell all kinds ofelectronic goods, including telephones, fax machines, copiers, printers, computers, and related supplies. Web surfers whocome to these sites have a higher probability of buying because they have already self-selected themselves as being in themarket. The e-retailers are also magnate sites because they have built up their own brand loyalty (like many brick and mortarretailers). As a newcomer to the electronics market, you can trade on their brand name and customer draw and make salesthat would not be possible otherwise. Of course to do this, you must work with the e-retailer and be willing to pay substantialcommissions for everything sold through them.
The last option enables you to place a popup ad on the web surfer's screen if they �t a certain pro�le. For example, thesearch engine will note if someone is searching for computers or electronic goods of any kind. The surfer may or may not bebuying, but their search pattern suggests they are users or curious about electronic goods. These people are more likely tobuy a computer online than others who are sur�ng for other purposes.
Thus, when the conditions are right, a popup ad will appear on the chance that the surfer might be interested in buying acomputer. Again, if someone clicks through to your site, you must pay a commission to the originator.
There are many other tactics that could be deployed to increase the tra�c to your web site. However, this set represents areasonable sample of these options. Of course, they are not guaranteed to work. And, some will be more effective thanothers. Part of your task will be to determine which options are the most productive and worth the money to be spent.
Productivity Tactics
There are also several tactics that you can deploy to increase the probability that visitors to your web site will buy while theyare there. Leading web magazines have reported that these activities have helped other companies sell their products andservices. The following tactics could be useful for you too.
Activities to Increase Purchase Probability Once a Visitor is at Your Site
Toll-free phone number for advising customers in the decision making process and for handling service callsSecure web site to insure privacy in taking orders and collecting credit card and personal informationAdvanced shopping cart and checkout procedures to make it easier to shop and place ordersContinuous upgrading of site to improve content, visual appeal and navigationCustomer pro�le data banks to store mailing information, credit card numbers, past purchases, etc. to facilitatepurchases, customer service and data miningData mining to pro�le visitors and their web behavior in order to present product options that might best appeal tocustomers (customer pro�le banks must be set up at the same time)Order tracking software to allow customers and service reps to track orders/shipments
The �rst option is to provide a toll-free phone number on your web site to help customers who need advice and/or want helpservicing their computers. Many web surfers like to use web sites as information sources and then call and place an orderwith a sales/service rep. Some people do not trust that the site can protect their credit card and personal information if it isentered online; others want to discuss the options and bene�ts; and still others �nd comfort in speaking with a "real person".
The second option is designed to address the anxiety that many people have about the security of their personal informationwhen it is entered online. If this option is used, your site will feature encryption technology and a corporate policy to protectthis information.
Advanced shopping cart and checkout procedures represent your third productivity option. These procedures and softwareare designed to make it easier for customers to select products from your web site, store them in an imaginary shoppingcart, review and adjust what is in the cart, and make a purchase of the items they want. These procedures reduce the time,effort and anxiety that people can experience while trying to shop at your web site.
The fourth option represents a continuous effort to present your �rm and your products in the most interesting, appealing,informative and persuasive manner possible. Continuous improvement is necessary because newer and better software iscontinually being introduced. This software must be mastered and programmed into your web site. Also, you can learn agreat deal from other webmasters who create clever ways of presenting information. You will want to study and imitate the

10/4/2018 Help File
https://web5.marketplace-live.com/engine.php?tpl=help&instructorID=10353&sessionID=9c643fdc8c13b099d714380554bb28c1&quarter=9&langua… 52/99
best sites. In short, you should consider choosing this option every quarter because the upgrading of your site is a never-ending effort.
For your �fth option, you can setup customer pro�le data banks to store mailing information, credit card numbers, pastpurchases, etc. to facilitate purchases, customer service and data mining. This tactic bene�ts both you and your customerbecause it makes it easier to access relevant information when customers make repeat purchases or they need serviceassistance.
Data mining represents your sixth option. It allows you to pro�le visitors and their web behavior in order to present productoptions that might best appeal to a new customer. Data mining takes advantages of the data banks that you have set up.Individual customers do not behave in unique ways. Rather, many perform the same kinds of searches and buy similarproducts. To the extent that you can detect these patterns early, then you can present products that are more likely to satisfythe customer, and thus create more sales. You might view these pro�les as online shopping segments. This tactic can onlybe implemented if the customer pro�le banks are also set up at the same time.
Order tracking software is your last tactical option to increase the probability of purchase. Some customers like to be able totrack their orders/shipments. It gives them peace of mind to know where their order is in the system and when it is likely toarrive at their destination. It is also handy for service reps to know where a product is for customers that call in wanting thisinformation. So, this tracking option will appeal to some of your potential customers.
Again, there are many tactical options that can be employed to increase the odds that a visitor to your web site will make apurchase while they are there. The seven that will be made available to you represent major tactics that are used within theweb community. Some are better than others. Some are very cost effective and others are less so. One of your tasks is todetermine which ones are the most pro�table and worth pursuing.
Role of Advertising
Advertising is just as important with a web distribution channel as it is with a traditional brick-and-mortar sales channel.While it is true that your web tra�c and productivity tactics will build sales, these efforts will be hindered if you do not havebrand recognition and a strong brand identity. Potential customers need to know who you are, what you offer, why you arebetter than the rest, and where they can buy what you offer.
Also, you do not have a local sales force for targeting speci�c segments. You must rely heavily on advertising for that job.With the available market research, you can discover what media your target segments view and what they want from acomputer and supplier. You can then craft advertising messages to appeal to your target segments and place them in mediawhere they are likely to see them. The more precisely you target your messages and advertising, the more likely yourtargeted customers will get on the web, �nd your web site and make a purchase.
Role of Sales and Support People
To the inexperienced, the web sales channel sounds ideal. Everything is done online. Customers review your products,prices, and promotions on line; select the products they want to buy; provide credit card information for immediate payment;and check back on their own to track the progress of their purchase. Everything is electronic, which suggests that webmarketing is cheap and e�cient.
The truth is that many potential and current customers require personal assistance with their purchase. Your web site maybe nothing more than an online catalogue to many customers. They want to talk to someone. Thus, your ability to acquireand retain customers is directly affected by the customer sales assistance and support you provide. Long delays on thephone or by email will harm your reputation and sales.
The more sales and support personnel you provide, the happier your customers will be. This does not mean that your websales center would require as many people as you would employ in a group sales o�ces that would cover the same market.A major advantage of the web is that it is more e�cient than traditional sales channels. Still, ample sales and supportpersonnel is important.
Sales and support personnel are expensive to hire and employ, and at some point you will encounter diminishing returns. So,it is important to balance the cost and bene�t of the sales force you assign to service your web customers.
Role of Brand Selection
Brand selection is very important on the web. Often customers use the web to discover more products than are availablelocally. Also, with the web site, you do not have the bene�t of the sales rep who calls and persuades potential customers tobuy this or that brand.

10/4/2018 Help File
https://web5.marketplace-live.com/engine.php?tpl=help&instructorID=10353&sessionID=9c643fdc8c13b099d714380554bb28c1&quarter=9&langua… 53/99
For the most part, customers will look around your web site, make their selection and then contact you (either on the web orby phone) to make the purchase. If they do not see what they want, they are more likely to click onto the next web site insearch of the computer that matches their needs.
Thus, you have a limited window of opportunity to make your case that you have what they want. A wide selection of brandswill increase the odds that the customer will �nd what they want.
Not only should you have a wide assortment across segments, but also within a segment. It is not enough to have one brandfor each target segment. You might need multiples of each to attract attention and get people to shop.
Role of Regional Web Sites
You have the option to create separate web sites to target different regions of the world. Opening a web sales center inChicago would allow you to create a web site aimed at the NORAM customers. In Accra, your website would targetcustomers located in the MEA region. A web sales center in Sao Paulo would allow you to target web customers in theLATAM region, a web sales center in Paris would target Europe, and one in Mumbai would cover the APAC region.
You might think one site would be good for all. After all, the Internet is called the World Wide Web. Such a strategy could bepartially successful. There are numerous sites that sell to the whole world, often in English, but this strategy has limitations.Being able to create different websites will allow you to:
1. Emphasize different languages (for example, the NORAM website may be in English, French and Spanish but otherlanguages would be emphasized in the MEA region).
2. Market the site content in a way that is appealing to customers in a particular region.3. Employ salespeople that come from the region and are therefore more sensitive to the region's customs and culture.
It is also easier to relocate a sales employee in a particular region than across the world.
Each regional web sales center will generate demand only in its region. In other words, you cannot make sales via the websales channel in a region where you do not have a web sales center.
Channel Pro�tability
Both the web sales channel and the sales o�ce channel can be very pro�table. However, a dual channel strategy will bedi�cult to implement in the short-term. This is because both channels are very expensive to startup and build. Breakeven,much less pro�tability, will not occur for several quarters. Thus, it is prudent to pick one channel and develop it into amoneymaker before embarking on a second channel.
Even with this caution, you are likely to be operating two channels of distribution at some point. When the time comes, youshould check and manage the pro�tability of each sales channel.
To help you manage your distribution channels, you will be given a pro�t analysis each quarter. This accounting report willinclude all the revenue and expenses that can be assigned to each sales channel. The method of Activity Based Costing isemployed to generate this report.
You will discover that one channel or the other will be more pro�table. Your job is to discover the strengths and weaknessesof each outlet and work to make them both very pro�table. Your problems might stem from your own actions such as poorproduct assortment, high prices, too few sales and support people or a weak advertising campaign. Or, your problems mightstem from the actions of your competition; probably one or another of them outsmarted you in some important way. In anycase, the start of good management is good information on the pro�tability of each activity. Be sure to use this informationto make good tactical adjustments in your strategy.

10/4/2018 Help File
https://web5.marketplace-live.com/engine.php?tpl=help&instructorID=10353&sessionID=9c643fdc8c13b099d714380554bb28c1&quarter=9&langua… 54/99
G. Human Resource Management
Human Resource Management entails recruiting the best employees, satisfying their needs, and motivating them to excel.The primary vehicle available to you to recruit, satisfy, and motivate employees is the compensation package that you offerthem. The package includes an annual salary, health bene�ts, vacation time, and a contribution to the employees' pensionfund.
Each quarter you must decide how much to pay your employees. You are free to set different compensation packages forthe sales people and production workers. Worker expectations and industry norms are different in each case.
To help you make your �rst compensation decisions, the Human Resource Department will provide you with the results of asurvey showing the typical salary, health bene�ts, vacation, and pension contribution for your industry.
Each quarter, the Human Resource Department will also survey employees of your industry as to which areas of theiremployment package they would like to see improved. In the early quarters, they will most likely want to see signi�cantimprovement in their salary base. As salaries improve, they will begin to shift their focus to other things such as their healthbene�ts, vacation time and pension contributions. These changes will be re�ected in the survey results.
Finally, your Human Resource Department will monitor the compensation packages and productivity levels of all of the �rmsin your industry. Each quarter, you will learn the salary and bene�ts offered to sales people and production workers by eachcompetitor. Industry experts predict that the �rms that offer the best compensation package will tend to have the mostproductive workers. This is very important.
In the case of sales people, this will mean that each sales person will sell more units during the quarter, all other things beingequal. For example, a �rm that is on the bottom of the pay scale might have sales people that generate 50 units per salesperson while a �rm at the top of the pay scale might have employees that generate 70 units per sales people, assumingeverything else is the same.
The same is expected for production workers. If you pay the lowest wage in the industry, your effective operating capacitymight drop by 30% or more. For example, if you have 30 units scheduled per day, the effective capacity could be as low as 21units per day. You will have as many employees as every other �rm with an operating capacity of 30 units per day, but yourproduction employees will not work as hard. With lower productivity, the labor content of each unit produced goes up, in turn,driving up the total production cost of each unit.
The importance of the compensation package and its effect on employee motivation and productivity cannot beemphasized enough. Unhappy employees do not work as hard or as effectively. Unhappy sales people do not generate asmuch revenue. Lower revenues and higher costs can strangle a company.
Over time, there will be upward pressure on compensation packages. Initially, the pressure will come from employees whosimply want a better paying job. Later on, it will result from employees being able to move to better paying jobs with thecompetition. After all, who can fault anyone from moving to another company to obtain a higher salary? When they move,you will be left with less skillful and motivated personnel.
What is the best compensation package? It is hard to know. At the very least, you should strive to be near the top of theindustry. Do you need to offer the best package of salary, health bene�ts, vacation time, and pension contribution? This, youwill have to discover.
As a word of caution, do not overemphasize the results of the employee surveys. There are lots of problems with surveyresearch. It is very di�cult to obtain a true reading of how people feel by asking them questions in a survey. Rather, theiractions are better indicators of their true feelings than words. Thus, look at how employees respond to the packages that areoffered. Their productivity levels will be a good indicator of their motivation. Look at how productivity changes with differentpackages, in addition to the survey results.

10/4/2018 Help File
https://web5.marketplace-live.com/engine.php?tpl=help&instructorID=10353&sessionID=9c643fdc8c13b099d714380554bb28c1&quarter=9&langua… 55/99
H. Manufacturing
1. Production Facility Location2. Fixed Production Capacity3. Forecasting Capacity4. Seasonality5. Operating Production Capacity6. Production Scheduling7. Market Pull to Determine Production Schedule8. Daily Production Schedule9. Target and Replenishment Points
10. Unwanted Inventory11. Quality Improvement12. Quality Strategy Options13. Key Quality Questions14. Quality Decisions by Quarter15. Quality Improvement Decision Example16. Table 7-1: Important Quality Improvement Decisions17. Table 7-2: Illustrating Costs for Components18. Table 7-3: Examples of Quality Decisions for Components
Once you have designed the brands that you intend to sell, you must manufacture them in su�cient quantities to meetdemand. There are a number of decisions which must be made.
1. You must decide on Production Facility Location and capacity. This includes not only where geographicallyproduction facility location should be within the market, but also the extent of Fixed Production Capacity andOperating Production Capacity once the site is selected.
2. You must determine the Daily Production Schedule for running the production facility for the 65 days available to youfor producing inventory (5 days per week * 13 weeks per quarter).
You will have the opportunity to make Quality Improvement decisions for your manufacturing operations throughstatistical process control.
In the �rst quarters of test marketing and production, the focus should be on the test marketing. The production facility cannotoperate at its peak e�ciency; the production volumes will be too low. Do not become too concerned about whether or not theproduction volume is perfect in the test market phase.
The goal should be to use the test market phase to learn what the customers want and what the competition is likely to do. Setsafe target and replenishment points and modest operating capacity levels. Do not "go for broke" or "bet the farm" until you geta little experience in the market and have a chance to see how the production facility works.
Learning Objective: The purpose of the manufacturing decisions are to introduce you to some of the trade-offs inherent inproduction planning and quality control, and to see how they relate to the broader strategic decisions of the �rm. As you gainexperience in the market and are better able to predict events and demand, you should be able to work through these trade-offsmore quickly. You will also become more comfortable making the necessary decisions. Finally, you will �nd that yourpreference for decision �exibility over cost savings will shift as the product moves out of the introductory stage through thegrowth stage and into the maturity phase of its life cycle.
Concepts Emphasized
Forecasting: Predicting unit sales by brand based upon:
1. Market potential.2. Current market performance.3. The predicted decisions of competitors.4. An evaluation of one's own performance versus the predicted performance of others.
Production planning: Determining the timing and size of production investments.
Pull -versus- Push production scheduling: Producing to demand versus producing to forecast.

10/4/2018 Help File
https://web5.marketplace-live.com/engine.php?tpl=help&instructorID=10353&sessionID=9c643fdc8c13b099d714380554bb28c1&quarter=9&langua… 56/99
Quality manufacturing process: Working through the process of checking for quality, determining error in the productionoperation, discovering the sources of error and �nding and implementing solutions.
Financial management: Allocation of a scarce resource among production scheduling, inventory investment, and qualitycontrol options, and living within a budget.
Cash �ow: Understanding the sources and uses of money and how various business decisions affect the availability of cash.
Inventory management: Consideration of the opportunity costs of lost demand [including the need for safety stocks] versusthe costs of holding inventory.
Postponement: Maximizing decision �exibility and minimizing risk by waiting to see what happens -versus- Speculation: Early commitment of resources in order to gain a cost advantage and a jump on competition.
Decision making: Evaluation of the pros and cons of available investment options and making a commitment of resources toan uncertain future.
Production Facility Location
You can build a production facility in any one of the cities scattered in different regions of the overall market. Productionfacility location does not affect productivity, but it does affect shipping costs. Once you choose a production facility location, anearby distribution center will be built as a central warehouse for the �rm. The cost of shipping a product from your productionfacility to this distribution center may be more or less depending on where you decide to locate your production facility.
This cost difference is why it is important to review the graph that shows the differences in shipping costs for transportingyour product from your production facility location to the distribution center. Think about these differences in costs when youdecide where to locate your production facility.
The x-axis of the graph shows the number of units shipped. The y-axis shows the cost to ship each unit. Notice that the cost toship one unit is much more than the cost of shipping 2,000 units. This is known as "economies of scale". In other words, themore you ship at a time, the lower the shipping cost.
Also, notice that a different colored line corresponds to each region of the country where you can choose to locate yourproduction facility. If you now look at 2,000 units on the x-axis, you will notice that the same 2,000 units shipped from yourproduction facility to your regional distribution center is different for each region.
As you consider the shipping expenses, take a long-term perspective. That is, you may locate a production facility in the �rstregion because that is where you intend to focus your initial selling efforts, thus reducing shipping costs into these markets.However, a year or two from now, you may decide to expand into other regions where the cost to ship from this productionfacility could be substantial. Thus, as you make the production facility location decision, look at where you will be openingsales o�ces and the associated shipping costs for the years ahead.
The decision with which you are faced is to balance the "economies of scale" for shipping units from certain production facilitylocations with the potentially greater costs of shipping the units to distant markets. Please note the production facility locationdecision is a one-time decision. The production facility location decision cannot be changed. The cost and time to close aproduction facility and open a new one will take longer than you will be working as an executive for the �rm. Also, you will nothave the money or time to open more than one production facility.
Fixed Production Capacity
Your second production-related decision concerns the size of the production facility - �xed capacity. There are two kinds ofproduction settings, �xed capacity and daily production scheduling. Setting your �xed production capacity will decide themaximum number of units your production facility can produce each day.
The decision to increase �xed capacity has a one quarter delay. In other words, if you decide to increase �xed capacity to 100units per day in quarter 4, �xed capacity will not actually be increased until quarter 5 and therefore you will not be able to beginproducing 100 additional units per day until quarter 5.
Once a production line is in place, the Vice President of Manufacturing can decide how much of that capacity to schedule fordaily production in the current quarter. It is possible to adjust operating capacity up or down by hiring and laying off people. Itis not possible to adjust �xed capacity in the current quarter. This is why you must forecast capacity requirements for futurequarters of production.

10/4/2018 Help File
https://web5.marketplace-live.com/engine.php?tpl=help&instructorID=10353&sessionID=9c643fdc8c13b099d714380554bb28c1&quarter=9&langua… 57/99
To give you a little background, production is scheduled on a daily basis. In other words, on day 1, you will produce X units ofbrand A. On day 2, you will decide whether to continue producing brand A or to switch to brand B. On any day, the maximumwhich can be produced is X. To increase capacity, you must expand the production line, and thus, increase the number of unitswhich can be built in a single day. There are 65 days available to you to run your production facility (13 weeks in a quarter * 5days per week). Thus, the maximum potential capacity for the quarter is 65 times the daily capacity.
Financial Tradeoffs in the Capacity Decision
A major factor affecting your decision to increase �xed capacity is the amount of cash available to pay for the increase. As youwill discover, you do not have enough equity capital to satisfy all of your operating requirements. Thus, you must decide howmuch to invest in �xed production capacity by considering other investment opportunities.
You can minimize your cash �ow requirements by adding capacity in small steps. That is, if you increase �xed capacity insmaller, frequent purchases, you will reduce the amount of equity capital tied up in assets. The unused cash will give yougreater �exibility to respond to unexpected opportunities or problems. If too much of your equity is tied up in �xed assets, youmay be unable to quickly respond to events in the marketplace.
The problem with smaller purchases of �xed production capacity is that they are also more expensive in the long run. Theyhave a higher overhead because of the need to repeat the front-end work of planning and initiating the production facilityaddition and the tail-end work of debugging the production line and cleaning up the area.
Larger, less frequent capacity acquisitions avoid much of this extra overhead cost. Consequently, a large, single, one-timeacquisition of �xed production capacity is less expensive than two acquisitions of half the size. However, one-time �xedcapacity increase costs go up very rapidly after a certain level because of the need to have land quickly available for productionfacility expansion. Your challenge is to balance short-term �exibility against signi�cantly greater, long-term cash outlays.
Forecasting Capacity
Since there is a one quarter delay when increasing �xed capacity, you must predict your future need for �xed productioncapacity. How much �xed capacity should you invest in? If this is your �rst quarter of production, you are advised to beconservative.
During the introductory period, you can expect sales to be slow (in the hundreds per brand per quarter). Also, there is a goodchance your �rst brand designs will need improvement. (Customers may not like some aspects of your brand designs and thusnot want to buy as many of them as you had hoped.) You could become stuck with too much capacity while you redesign yourbrands and reintroduce them to the market. On the other hand, if your brand was exactly what the customer wanted, the extracapacity could give you an early advantage over competitors. However, the odds favor a conservative approach.
A conservative decision will be to add enough �xed capacity to satisfy your needs for the next 2 to 4 quarters. After you haveobtained some experience in the market, you will have a better idea of how much �xed capacity to add. Maybe in another year,you can add more �xed capacity by making a larger investment.
To decide on how much �xed capacity to build, you must �rst estimate number of units your customers are likely to buy in thenext and future quarters. This technique is called "forecasting". Forecasting is always di�cult. However, you will get better atforecasting as you gain experience and the market matures and becomes more predictable.
Here are the basic steps for forecasting production requirements:
1. Determine which cities you want to have sales o�ces in the future quarters (the next 2 or 4 quarters).2. Estimate the number of sales people you want to employ in each city each quarter.3. Estimate the number of units you think each sales person will sell in each city.4. Multiply the number of sales people [from step 2] by the projected sales per sales person for each city [from step 3] and
add these numbers together for all cities each quarter.5. Adjust the demand estimate depending on the selling season. For example, some products, like toys, sell better in the
summer (3rd quarter) and the fall (4th quarter), because of children being out of school and the Christmas sellingseason. When you estimate the units you can sell, take this into account.
6. Pick the quarter with the largest probable demand. The demand of that quarter will be the maximum �xed capacitywhich you will require over the planning period.
In the early quarters, the unit sales per sales person is likely to be low (30 to 60) because the market is unfamiliar with yourcompany and its products. Also, your marketing strategy is likely to be wrong in some way (weak brand designs, ineffectiveads, limited advertising, few support people, and/or high prices).
Moreover, in the early quarters, the industry as a whole is still undeveloped. Potential users know little about the use of thisnew technology and why they would want to buy it. As you work to improve your strategy (new R&D features, better ads, more

10/4/2018 Help File
https://web5.marketplace-live.com/engine.php?tpl=help&instructorID=10353&sessionID=9c643fdc8c13b099d714380554bb28c1&quarter=9&langua… 58/99
advertising) and you and your competitors increase your advertising for the product category, sales per sales person willincrease in the range of 60 to 100 or more.
How much you sell in the range of 30 to 60 in the early quarters and 60 to 100 in later quarters will depend on whether youmake better decisions than your competitors and the size of the markets entered. For example, New York has a larger marketpotential than Miami and one market segment may be larger than another segment.
If you are targeting a large market segment in a large geographic market, estimate sales higher. If your market �nds yourstrategy especially attractive or unattractive, your demand per sales person could be much higher or lower than theseestimates.
In later quarters, you can look back and see how many units in the past were demanded per sales person and calculate anaverage (historical average). You can use this �gure to make sure your forecast for the future is reasonable. For example, if youhave been averaging 90 units per sales person in New York for the past two quarters, this will be a good starting number forprojecting demand. You can adjust this number if you plan major changes (new brands, new technology, lower prices, moreadvertising, etc.) or expect seasonal increases (in quarters 3 and 4) or decreases (in quarters 1 and 2).
In other words, if you double your advertising, cut prices by 10%, and introduce a new brand, you might feel comfortableincreasing the number of units you believe each person will sell by 30% or so. You might think a larger number would be better,but that would assume your competition has not improved their marketing efforts. If this is the low season of the year, eventhis low number could be too high.
Caution: These starting �gures for demand estimates are based upon the averages. Demand can be less or greater than the estimates given here ifyour marketing efforts are well below or above the average.
In summary, you are making educated guesses. You have scarce resources and you must decide what investments to make inthe future. You must forecast demand for a product that has never been on the market before. You must balance the ability toproduce as much as you want with the cost of producing as much as you want. There are no easy answers because there arerisks and advantages associated with each of your decision alternatives.
Seasonality
There are seasonal ups and downs in every market. For toy makers, the best buying seasons are the summer (3rd quarter) andfall (4th quarter). For �shing and pleasure boats, the best seasons are spring (2nd quarter) and summer (3rd quarter). Forsnow skis, the best season is obviously the winter (1st quarter), although the fall (4th quarter) is also good.
In the case of personal computers, the fall (4th quarter) is the best because of end of the year buying. Managers often waituntil the end of the year to see how much money is left in the budget. If they have managed the money well and business hasbeen good, they will invest more heavily in o�ce equipment. Buying drops dramatically from the fall to the winter (4th to 1stquarter) and then again in the spring (the 2nd quarter is the worst). Business picks back up in the summer (3rd quarter) andpeaks again in the fall.
Operating Production Capacity
The �xed capacity sets the maximum number of units the production facility can produce on the assembly line. The operatingproduction capacity is the number of units actually scheduled for production. By setting the operating capacity, you effectivelytell the production manager how many workers to hire for the quarter and for how long to operate your production facility eachworkday.
Your operating capacity cannot exceed your �xed capacity. If the �xed capacity is 50 units per day, then the operating capacitycan be no more than 50 units per day.
For example, you may have increased �xed production capacity enough to produce 50 units per day. However, demand mightbe projected to be no more than 30 units per day. You would set your operating capacity at 30 units per day or 1950 units forthe quarter. (30 units per day times 65 working days per quarter).The operating capacity could never be more than 50 units perday. The �xed capacity is 50 units per day, meaning that 50 units is the most number of units the production facility canproduce per day.
You can adjust the operating capacity from quarter to quarter as you make changes in your marketing strategy. The operatingproduction capacity determines the number of workers on the assembly line. If you expect demand to rise in any given quarter,you can immediately hire more workers and increase the operating capacity. If you expect demand to fall from the previousquarter, you can lay off part of your workforce and leave part of the production facility idle.

10/4/2018 Help File
https://web5.marketplace-live.com/engine.php?tpl=help&instructorID=10353&sessionID=9c643fdc8c13b099d714380554bb28c1&quarter=9&langua… 59/99
If you anticipate that demand in the next quarter will exceed the current available �xed capacity, then it will be necessary to addmore �xed capacity for the next quarter. Remember, it takes one full quarter to add �xed production capacity.
To determine your daily operating capacity, take your forecasted total demand for all brands and then divide it by 65 days. Addabout 10% to your forecast as a safety stock. The resulting �gure will give you an estimate of what you should set your dailyoperating capacity for the current quarter.
When making the operating capacity decision, there are three costs that must be considered: the cost to employ productionworkers per unit (direct labor cost), the overhead cost per unit of capacity, and the expense to change operating capacity.
The production facility is not operating e�ciently when too little of the production line is used, as well as when the productionfacility is at its maximum peak. Experimentation with the operating capacity will be necessary to �nd the optimum level ofcapacity utilization.
Operating capacity is so expensive because of the cost of recruiting and training new employees. It costs money to decreaseoperating capacity because you must pay for unemployment insurance, severance pay, and the associated paperwork. Usually,the cost of laying people off is less expensive than the cost of keeping them employed during slow periods.
One factor to consider when setting the operating capacity is not obvious. At �rst, you might think that decreasing operatingcapacity keeps you from having workers with nothing to do. This is a rational decision because you will pay for the labor andassociated overhead if you decide to stop the production facility for the day or several days because demand is low.
Nevertheless, there is an advantage to having more operating capacity. If you produce in large daily quantities, you will be ableto build inventory quickly and avoid stock-outs.
Consider what happens to your inventory levels when you make long production runs and where only one brand can beproduced at a time. During Brand A's production run, its inventory is increasing; however, the inventory of Brands C and D isdecreasing while they wait for their turn on the production line. With three or more brands, there are always more brands beingpurchased and taken out of inventory than are being made and put back in inventory to replace the unit that sold.
Thus, another decision that you must manage is to balance the cost of too much operating capacity against the risks of lostsales caused by stock-outs and the slow restocking of inventory.
Fortunately, experts in manufacturing processes have discovered that you can reduce both your operating costs and the risk oflost sales by reducing production changeover times. Operating capacity can be effectively increased by speeding upchangeovers. During changeover, the production line is shut down and operating capacity is zero.
Fast changeovers allow more frequent changeovers which allows each brand to be produced more often. More frequentproduction results in the inventory being replaced more often. If the inventory is being replaced more often, you will not need asmuch product to cover the time between production runs.
Thus, improving changeover time can reduce:
1. Idle production time and inventory levels.2. The probability of stock-outs, dissatis�ed customers, and lost sales.
Production Scheduling
Modern Manufacturing Thought
Having set the operating capacity for the quarter, the next set of decisions to make revolves around production scheduling forthe quarter. In other words, what brand should be produced on any given day and how many units should be produced over ade�ned time period. Historically, the quantity to be produced was determined by the economic order quantity (EOQ) for eachbrand.
Modern manufacturing planning has moved away from the EOQ concept that is based upon the forecasted demand ofindividual brands or models. The EOQ model assumes that one has a good forecast of market demand for a de�ned timeperiod. Experience teaches us that good forecasts for total demand across all brands is di�cult, but a reasonable task. Goodforecasts for individual brands or models is all but hopeless.
The reason it is so di�cult to forecast individual brand demand is that there are many, many factors which determine demand,most of which are outside of the supplier's control. For example, if there is an upward shift in the economy, buyers might bewilling to purchase higher performance brands at a higher price, or if the economy slowed, the opposite would be true.
Alternatively, one's own marketing department might suddenly decide to offer a price rebate to stimulate sales, or it mightdevelop a surprisingly good ad campaign. Or the sales department might re-align sales territories, sales assignments or

10/4/2018 Help File
https://web5.marketplace-live.com/engine.php?tpl=help&instructorID=10353&sessionID=9c643fdc8c13b099d714380554bb28c1&quarter=9&langua… 60/99
incentive programs.
To these internal causes of demand variation, we must add the activities of our competitors. Every competitor is trying mightilyto take your business and add it to theirs. So, what will happen when they add a new product, lower prices, add sales people, orexpand advertising? No matter what they do, the demand for your individual brands will be affected. Thus, it is an almostimpossible task to forecast demand at the brand level.
To be sure, in a market with stable demand, it is possible to build to forecast. The task might even be manageable if there areonly a couple of brands and we are looking at only a couple of months of inventory to worry about.
If it is di�cult to forecast demand at the brand level, what happens to manufacturing and inventory control? With the EOQmodel and a mindset for long production runs, the end result is the high probability that your �rm will produce the wrong brandat the wrong time. This condition, in turn, results in huge stores of inventory that are not in high demand.
To further elaborate on this point, consider the di�culty of forecasting when the market is changing quickly (new brands arebeing added frequently and new marketing tactics are being applied) - What is the risk of getting the forecast wrong? Also, howbig is the task when there are 5 or 10 brands and not 2.
What happens to the inventory in the warehouse when we have been building inventory to the forecast for several planningperiods, perhaps years? Mismatches will occur with increasing frequency and the warehouse will begin to �ll up with inventorythat was produced in anticipation of demand, demand that did not materialize. Unfortunately, that same warehouse will havealmost none of the brands which had unexpected high demand.
The reason for the mismatch is the mindset to build to forecast and not to current demand. In other words, if the EOQ modelsaid to produce 1200 units of brand A and then 800 units of brand B, then that is what will be produced. But, suppose theactual demand was just the reverse, 800 units of Brand A and 1200 units of Brand B. This set of circumstances would result in800 units of brand A being taken out of the warehouse over the course of the quarter (leaving 400 units of excess inventory)and all of Brand B being taken out (leaving 400 unsatis�ed customers).
Overtime, the models or brands with unexpected high demand will have almost no inventory in the warehouse and the modelswith unexpected low demand will be left sitting on the shelf in the warehouse. Consider, instead, using the Market Pull toDetermine Production Schedule.
Market Pull to Determine Production Schedule
Because it is very di�cult to forecast demand for individual brands, modern manufacturing experts have begun to use amethod called the "demand pull approach" to schedule production at the facility. That is, the production schedule is determinedby whatever brand is selling the fastest out of the warehouse. The brand with the highest demand will get the most time on theproduction line.
The way the demand pull approach works is by setting target and replenishment points (maximum and minimum inventorylevels). The production planner sets the maximum inventory he or she wants for a brand, as well as the minimum desiredinventory.
If the current production pushes the inventory over the target or maximum for a brand, then the production manager will stopproduction of that brand. There is no need for any more. On the other hand, if the inventory drops to the set minimum orreplenishment point, then a signal is sent to the production manager to begin production as soon as possible.
As a result of these rules, any brand which is having its inventory sold quickly out of the warehouse will be selected forproduction. Any brand that is not selling well will have inventory far in excess of the replenishment point, thus there will be noreason to produce more.
The new goal of manufacturing is to minimize inventory of all brands, especially those that are moving slowly out of thewarehouse. This goal re�ects the risk in having excess inventory, including high inventory carrying costs and brandobsolescence.
Carried to the logical conclusion, the new goal will also call for stopping the production line when the targets have been met.That is, send the employees home rather than continue to build inventory when a brand is not selling.
This extension of the goal is very di�cult for most business students to accept. It seems that it would be smarter to let theworkers keep making inventory as long as they are already at work, but that is not true because the labor cost is added to thecost of goods. If the inventory is not needed, there is a greater risk of holding on to unwanted stock, which may need to bemarked down later to make customers buy it.

10/4/2018 Help File
https://web5.marketplace-live.com/engine.php?tpl=help&instructorID=10353&sessionID=9c643fdc8c13b099d714380554bb28c1&quarter=9&langua… 61/99
To restate the goal in operational terms, the objective should be to set the target inventory and replenishment points as low aspossible and to stop the production facility whenever there is su�cient inventory to meet the target goals.
Daily Production Schedule
The operating capacity for the quarter should be set to be equal to the total daily demand for all brands, plus 25% to 50% as ahedge against unexpected surges in demand (safety stock).
Operating capacity in the Marketplace is based on the number of units produced per day. Suppose you think that your companycan sell 1200 units in the next quarter. Let's further assume that the production facility will run for 60 days of 65 possible workdays in the quarter (the remaining 5 days will be lost due to changeover from one brand to the next.).
What should you set as your operating capacity? You need to produce at least 20 units a day (1200/60). To be on the safe side,you might plan on producing 25 to 30 units a day. (The extra 5 to 10 units per day represent our safety stock).
Target and Replenishment Points
As a guideline, you might set the replenishment point at approximately 5 days of forecasted demand.
This will give you 5 days to �nish the production of one or more brands before the production facility turns to the brand withlow inventory. The target should probably be 2 or 3 times the replenishment point (10 to 15 days of inventory) so that theproduction facility will have several days to produce other brands before it must switch back to a particular brand.
Here is another guideline that might be used, although it is not optimal. If a production manager wants long production runs,then the replenishment point should be set high. If total demand is expected to be 600 units for the quarter, then thereplenishment point might be set at 1/4 of this value (150 units). No other brand will be produced until this replenishment pointis reached.
The advantage of high replenishment points is that they reduce changeover time and costs. It also allows the manager morecontrol over what and how much is produced. The major disadvantages are that it results in large inventories and could resultin a poor assortment of available brands if the forecasts are wrong (which they will be). A word of caution: if the replenishmentpoint is set high, then the target should be set just a little higher, say 10%. The high replenishment point will drive theproduction schedule. A correspondingly high target could cause excess inventories. The production manager should never setthe target and replenishment points higher than a few hundred in the early stages of market development (quarters 3 through6). There are almost no circumstances that would justify these numbers and the risks of excess product or obsolescence arehigh.
Until you become comfortable with the production planning process, it is safest to set the target inventory at 100 units and thereplenishment at 50. As demand grows, increase the target to 200 and keep the replenishment at 50. After quarter 4, begin tore�ne your production rules. The experience you will have had in quarters 3 and 4 should be a big help.
These guidelines vary over time. If the changeover time is low (in hours or minutes), then you can make more frequentchangeovers and keep the target and replenishment points low.
Unwanted Inventory
Ideally, your goal is to move your products through the production line to the warehouse and on to the customer quickly, butoccasionally you may �nd that a brand did not sell as expected and it piles up in the warehouse. In that case, you may want todiscontinue the brand and sell the left-over inventory to the secondary market. It takes one full quarter to sell the unwantedinventory.
Importantly, the sale price is typically set below production costs in the secondary market. So if you have several hundred unitsof an unwanted brand, you may decide that selling it in a slow region at a discounted price would be better than salvaging itwhich would cause your �rm to lose money on every unit sold. However if you do decide to sell the unwanted inventory bymeans of your sales outlets, you run the risk of potentially generating too much demand for a product that has only a fewremaining units available and is not scheduled for production anymore. So, be sure to weigh the pros and cons of salvaging(selling at a loss in the secondary market) versus selling your brands (via your sales outlet to make a pro�t).
Quality Improvement

10/4/2018 Help File
https://web5.marketplace-live.com/engine.php?tpl=help&instructorID=10353&sessionID=9c643fdc8c13b099d714380554bb28c1&quarter=9&langua… 62/99
Typically, when a production facility is �rst designed, there are unknown problems in production. In many cases, these can onlybe discovered and �xed after the production facility is up and running. It will be important for you to study and re�ne theproduction process for all of your critical components.
A company's success or failure in the production process will be expressed in reliability ratings, losses due to warranty costs,and losses due to the production defects cost.
Quality Strategy Options
When considering quality issues, you can adopt one of the following strategies for managing your business:
Strategy 1: Close your eyes. You might choose to do nothing for quality. You will save the costs associated with inspectionand quality improvement steps (such as variance studies, source studies, and actions). By adopting this strategy, you shouldexpect high warranty costs due to external defects, low reliability ratings, and lower product demand as a result yourcompany's poor product image.
Strategy 2: Inspection. Choosing to do product inspection is a short-term strategy. You will need to pay for inspections and thecosts of �xing internal defects found by inspections. On the other hand, you could expect reduced warranty costs and slightlyimproved reliability ratings. Inspection alone will not eliminate warranty costs or to signi�cantly improve the reliability of yourproducts.
Strategy 3: Process improvement. The long-term strategy would be to combine inspection and quality improvement steps(variance study, source study, and actions). The goal of this strategy would be to reduce the variance of critical componentsand thus reduce warranty costs, increase reliability, reduce internal defect costs, and allow you to discontinue inspection, thussaving inspection costs. On the basis of warranty costs and the results of variance studies, you can decide whether it is reallynecessary to inspect all of the critical components before implementing an action to improve the production process.
Key Quality Questions
To improve quality, you have to decide on priorities and an action plan for quality improvement. The vital questions are:
For which components is inspection needed? Excessive warranty costs indicate poor customer satisfaction with the reliabilityof your product? In all likelihood, there is something wrong with the production process. Inspection of a component will allowyou to catch the problems before the �nal product is shipped to customers. Inspection will result in lower warranty costs and abetter product image because fewer "bad" products will �nd their way into customer hands. On the other hand, there is a costto perform the inspection and the inspection will identify components that do not meet acceptable performance levels. Thesedefective components will need to be reworked or scrapped, resulting in further expense.
For which components is a variance study needed? If warranty costs are high for a component or there are many defectsdetected by the inspection, then there is a need to do a variance study. The variance study will determine the amount of error orvariation in the production process. That is, to what extent are the components not manufactured within speci�ed tolerances?
For which components are a source and action study needed? The variance study will indicate if there is any shift or variancein the production process. Shift indicates that a component has an average performance substantially different from the targetperformance (i.e., the diameter of a shaft averages 2.2 cm while the target is 2.0 cm).
A high variance value indicates that there is a great deal of variation in the performance measures (i.e., the diameter of a shaftvaries from 1.8 cm to 2.4 cm where the acceptable variation is from 1.9 to 2.1 cm). If either the shift or the variance is toogreat, then something is seriously wrong with the production process. A source and action study should be conducted todetermine the causes of the production error and what actions can be taken to improve the process.
Which actions should be chosen for implementation, and how much money should be spent for the improvement? There maybe a variety of causes for the production error, including the poor quality of incoming materials from suppliers, machines thatare in need of repair, and/or a dirty or humid environment.
For each cause, there might be multiple actions that could be taken to improve the situation and reduce the shift and variation.It might be necessary to require suppliers to control the quality of their products, or to train machine operators to detectmachine error and to adjust them so they produce within tolerance, or to control the temperature and cleanliness of the workarea.
At this point in the quality control process, it is necessary to decide which actions to take and how much to invest in eachaction. Investments to improve the production process result in a more accurate production process, a more reliable �nalproduct, happier customers, more demand, and less expense in inspection and rework.

10/4/2018 Help File
https://web5.marketplace-live.com/engine.php?tpl=help&instructorID=10353&sessionID=9c643fdc8c13b099d714380554bb28c1&quarter=9&langua… 63/99
As the above questions imply, a quality control process takes time to implement. The normal sequence of events is as follows:
1. Watch warranty costs for problem components.2. Inspect problem components to avoid shipping "bad" product.3. Perform variance study to determine nature of error in production process.4. Conduct source study to determine causes of error and potential solutions.5. Invest in actions to reduce error in production process.
At a minimum, your company can plan on taking at least 3 quarters to set up and execute a quality production process. Whilethis investment in time may be discouraging, the payoff in reduced costs and greater demand (due to greater customersatisfaction) will more than make up for it. And, if your competitors are slow to start this process, you may have a head startthat will require several quarters to close the performance gap.
Quality Decisions by Quarter
The decisions to be made each quarter in the quality improvement process are described below. As noted above, several of thedecisions must follow a particular order. For example, a source and action study for a component can be chosen only after avariance study for this component has been performed in a previous quarter. On the other hand, the decision to start, continue,or quit inspection for a component can be made regardless of decisions from previous quarters.
Depending on decisions made in previous quarters, new information about the component becomes available in new quarters.The tables (Table 7-1, Table 7-2, and Table 7-3) describe the information available and the decisions you can make for eachcritical component by quarter. You make separate decisions for each component.
For example, you may start a variance study for component A in quarter 4, which would then be quarter "n" for component A. Ifyou start a variance study for component B in quarter 6, it will become quarter "n" for component B. The table also shows youhow to predict when you can expect to see the results of an improved process.
However, for results to be on schedule, you must take each improvement step as soon as the prerequisites are met.Improvement will be delayed for either of the following reasons:
Not enough money is invested to complete the work and thus only a partial process improvement can be achieved. Onlyafter investing the rest of the money will the rest of the possible reduction in variation be achieved.Some actions require more than a single quarter for complete results.
Quality Improvement Decision Example
Warranty costs are a burden which you should eliminate. They eat up your money and reduce your reliability which will lead toimage problems. Some warranty costs can be reduced by implementing inspection to prevent defective products from beingshipped to the customer. However, the rest of warranty costs can be eliminated only by improving the processes (i.e. reducingprocess variation by implementing speci�c actions). The problem is that when starting production you have limited knowledgeof how much of the warranty costs you can eliminate by inspection and how much you can eliminate by reducing variation.
Moreover, inspection costs vary from product to product due to different testing methods and equipment. Sometimes theamount that is invested in inspection is more than what can be saved in reduced warranty costs; other times an inexpensiveinspection can substantially reduce warranty costs. The same can be also true for process improvement, making yourdecisions complex and di�cult. This means that you need to thoroughly consider and plan for investments into inspection andactions for process improvement. The plan needs to be optimized and corrected each quarter based on new information andmarket changes.
Tables 7-1, 7-2, and 7-3 set up a hypothetical example to illustrate how the decisions work together in the game.
Suppose that in quarter 4 you start with inspection and a variance study for components A and C. The only basis for yourdecisions are data about inspection costs and warranty costs - warranty costs because the product was both produced andsold in the previous quarter. You do not have enough money to inspect all three components this quarter (you have only 100available), and so the question is: what is the best way to allocate the 100 in order to reduce warranty costs? Afterconsideration, you might decide to begin with inspections of components A and C. You know that the investment intoinspection of 70 (20+50) will reduce warranty costs of 330 (150+180), but you do not know by how much. This is because onlya portion of the warranty costs can be reduced by inspection, the remainder can be eliminated only by process improvement. Inthis quarter you do not know how much of the warranty costs you can reduce by inspection; you will learn this in the nextquarter.
In quarter 5 you see that the reduction of warranty costs due to inspection is very low for component C. This is because muchof the warranty cost for this component is due to process variation. It would cost 50 to inspect C and you to reduce the

10/4/2018 Help File
https://web5.marketplace-live.com/engine.php?tpl=help&instructorID=10353&sessionID=9c643fdc8c13b099d714380554bb28c1&quarter=9&langua… 64/99
warranty costs are only 20. Therefore you decide not to inspect component C but to proceed with process improvement inorder to reduce the variation, the main contribution to the warranty costs for component C. In this example you will also beginto inspect component B.
In quarter 6 you stop inspection for component A because you implement process improvement which reduces variation. Theprocess for component A is good, i.e. within the tolerances, therefore inspection is not necessary. The process for componentC is also good (inspection was discontinued in the previous quarter).
In quarter 7 you stop inspection for component B, because you implement process improvement which reduces the variationas in the previous quarter for A and C.
Table 7-1: Important Quality Improvement DecisionsQuality improvement decisions over game quarters
Quarter Information for each component at the beginning of thequarter Decision to make for each component
n Warranty costs (only when some products have been sold inprevious quarter/quarters)
Inspect the component? Start variance study for the component?
n+1
Inspection: Identify and �x defective components Variance study: Y-Learn how much error (variance and shift) isin production process Quality costs (when applicable): Inspection costs, defect costs,warranty costs, variance study costs When to inspect: Y = high defect rate, number of defects, defectcost
Inspect the component? Start source and action study for thecomponent?
n+2
Source and action study: Y - learn causes of error and actionswhich can improve process Quality costs (when applicable): Inspection costs, defect costs,warranty costs, variance study costs, source and action studycosts When to inspect: Y - defect rate, number of defects, defect cost
Inspect the component? How much to invest in the actions?
n+3Same as in previous quarter + costs invested in the actions When money is appropriately invested, the variance andwarranty costs will be reduced
Inspect the component? How much to invest in the actions?
Table 7-2: Illustrating Costs for Components
Before decision Qn After decision Qn+1
Component Inspection costs Warranty costs Defect costs Reduction of warrantycosts
A 20 150 30 90
B 80 300 40 150

10/4/2018 Help File
https://web5.marketplace-live.com/engine.php?tpl=help&instructorID=10353&sessionID=9c643fdc8c13b099d714380554bb28c1&quarter=9&langua… 65/99
C 50 180 10 20
All costs are in thousands of currency units for the quarter.
Before decision: Data available at the beginning of quarter n
After decision: Data available only when appropriate decision was made in previous quarter
Defect costs: Costs which are to be expected when the inspection is introduced
Reduction of warranty costs: A portion of warranty costs which can be expected when inspection is introduced
Table 7-3: Examples of Quality Decisions for ComponentsImprovement Steps for Components
Quarter Component Inspect Variance Source andAction Implement Comment
n
A Yes Yes n.a. n.a.
B No No n.a. n.a.
C Yes Yes n.a. n.a.
n+1
A Yes p.q. Yes n.a.
B Yes Yes n.a. n.a. Inspection is introduced due to highwarranty costs
C No p.q. Yes n.a.Inspection is ceased due toacceptable results from variancestudy
n+2
A No p.q. p.q. Yes Inspection is ceased due to actionto reduce error
B Yes p.q. Yes n.a.
C No p.q. p.q. Yes
n+3A No p.q. p.q. No
B No p.q. p.q. Yes Inspection is ceased due to action

10/4/2018 Help File
https://web5.marketplace-live.com/engine.php?tpl=help&instructorID=10353&sessionID=9c643fdc8c13b099d714380554bb28c1&quarter=9&langua… 66/99
to reduce error
C No p.q. p.q. No
n = Number of the quarter in which the �rst decision about quality is made (i.e. start the inspection and/or start the variancestudy for at least one component).
n.a. = Not applicable in this quarter: for this decision there is a prerequisite decision in previous quarter (i.e. a variance study isa prerequisite for source and action study).
p.q. = No new decision is necessary and the decision from previous quarter allows you to see the updated results (whereupdate is applicable) of the study in current quarter (this is valid for all the studies, it is enough to pay for them in one quarterfor speci�c component for the whole simulation exercise).

10/4/2018 Help File
https://web5.marketplace-live.com/engine.php?tpl=help&instructorID=10353&sessionID=9c643fdc8c13b099d714380554bb28c1&quarter=9&langua… 67/99
I. Accounting
1. Accounting Statements2. Pro Forma3. Activity Based Costing (ABC)4. Financial Planning and Analysis5. Earning a Profit6. Bankruptcy7. Independent Auditor
Review the following topics to help make wise decisions regarding your accounting and �nancial planning:
Accounting StatementsPro FormaActivity Based Costing (ABC)Financial Planning and AnalysisEarning a Pro�tBankruptcyIndependent Auditor
Learning Objectives: The primary objective of the accounting information is to help you to learn to work within a budget.Students often complain that the Marketplace requires too much accounting and �nance. Some feel that they should not haveto worry about cash �ow requirements in a marketing or new venture class.
In contrast, executives who are familiar with the simulation think it is one of its strongest assets. Every executive is faced withmore opportunities and problems than can be handled with available resources. This condition forces choice and the analysisof options. Proper assessment of the risks, payoffs, and cash �ow requirements lie at the core of executive decision making.The ability to work successfully within a budget while maximizing Return on Investment is vital to every executive.
A second objective is to help you understand cash �ow and how it impacts the decision making and liquidity of the �rm.Surprisingly, many new executives do not really understand cash �ow and how it impacts/constrains decision making and thepursuit of business opportunities. Many new ventures in the real world fail because of this lack of understanding. Soundmanagement of the �rm's cash position can make the difference between a "winner" and an "also ran" in the business world.
A third objective is to help you understand the importance of evaluating the pro�tability of your business decisions throughthe use of Activity Based Costing. You should learn to allocate revenues and expenses to their proper activity in order toassure the pro�tability of your brand and sales channel decisions.
Concepts Emphasized
Cash �ow: Understanding the sources and uses of money and how various business decisions affect the availability of cash.
Financial statements: Understanding how revenues and various expense and investment decisions affect the incomestatement and balance sheet.
Pro forma analysis: Projecting the �nancial impact of expense and investment decisions and revenues on the incomestatement, balance sheet, and cash-�ow statement.
Activity Based Costing: Proper allocation of revenue and expenses to the relevant demand creating activities.
Accounting and �nancial concepts: Assets, liabilities, liquidity, margins, turnover, leverage, ROI, payback, and so forth.
Decision making: Evaluation of the pros and cons of available investment options and making a commitment of resources toan uncertain future.
Accounting Statements
To help you in your accounting and �nancial planning, your accounting �rm has prepared a set of interconnected �nancialstatements. As you make your business decisions, the accountants will automatically post the expenses or investments to theaccounting ledger and adjust your current quarter cash �ow statement, income statement, and balance sheet accordingly.

10/4/2018 Help File
https://web5.marketplace-live.com/engine.php?tpl=help&instructorID=10353&sessionID=9c643fdc8c13b099d714380554bb28c1&quarter=9&langua… 68/99
In the second quarter, the accounting �rm will show a historical record of your �nancial decisions and performance for lateranalysis. This historical information will be invaluable in assessing the quality of your decisions given actual market conditionsand not just anticipated conditions. Careful review of this �nancial information relative to your prior planning and forecastingshould help you to adjust your knowledge base and thus your decision making process.
In your �rst sales quarter, you will also be able to project your cash �ows for the current and all future quarters. These ProForma �nancial statements will enable you to explore the �nancial impact of alternative business scenarios before committingyourself to any one course of action.
Finally, your accounting �rm serves the role of Independent Auditor. It has the legal right to refuse to certify your �nancialstatements if it concludes you are placing your �rm at risk with overly aggressive expenditures. It will set limits on the amountof spending you can do in any quarter in order to protect the equity in your �rm (reduce the risk of Bankruptcy).
Production costs and cost of goods sold (COGS) are very similar, but relate to the difference in time and activity with regard tothe disposition of inventory. When inventory is produced in the production facility, the �rm incurs production costs. Theinventory sits in the warehouse and the value of the inventory is based upon the cost to produce it. Thus, the balance sheetshows the inventory according to the cost to produce it.
Once a unit of inventory is sold, it has to be expensed. At that point, the classi�cation for the unit is changed to cost of goodssold. There is no change in its value, only its designation. This is done for accounting purposes.
Another way to look at it is from the viewpoints of the cash �ow statement, balance sheet and the income statement. Forexample, the production facility might produce 1000 units at a unit production cost of 2000. Thus, the cash �ow statementwould show that 2,000,000 had been spent on production. Until these units are sold, they will sit in the warehouse as inventory.On the balance sheet, they will appear as �nished goods inventory. Their value is 2,000,000 or 2000 for each of the 1000 units.
As time goes by, various units will be sold and the inventory will be drawn down. Suppose 10 units are sold on the �rst day, thenthe accounts must expense these 10 units. The cost of these 10 units will appear on the income statement as a "cost of goodssold". The unit value is the same as when they were produced or sitting in the warehouse. However, now the units are sold.
The remaining 990 units are still sitting in the warehouse and they are valued on the balance sheet at their product cost. Itmight appear to be semantics, but it helps accounts keep track of inventory and expenditures.
Pro Forma
Current Quarter
The pro forma accounting statements for the current quarter permit you to tentatively enter decisions and observe the effecton your cash �ows, income statement, and balance sheet. They are essentially a budgeting tool.
You are free to make and change any of the tactical decisions in your �rm up until the time you submit them for processing.Almost every decision you make affects your �nancial position by increasing or decreasing the available cash in your checkingaccounts. Some of the decisions are simultaneously re�ected on the income statement as a current quarter expense (mediaadvertising, sales force salaries, etc.), while others change the cash to another asset on the balance sheet (the purchase ofadditional production capacity or a 3-month certi�cate of deposit). Still other decisions change the cash account on the assetside of the balance sheet while simultaneously changing either a liability or equity account on the debt/equity side of thebalance sheet (taking out or repaying an emergency loan, etc.).
The important point is that the current quarter �nancial statements are adjusted with almost every business decision youmake. Statements will change automatically as you change the decisions you are making in the template. Therefore, think ofthe current quarter cash �ow statement, income statement, and balance sheet as pro forma worksheets to help you in yourplanning for the current quarter.
To complete the cash �ow analysis for the current quarter, you will need to run the production simulation and load the resultsinto the cash �ow statement. There are a number of production related cash �ows that will not be realized until after yourdecisions have been submitted for processing and the results are posted to the accounting statements for the period justending. Since it is not possible to know the future, you can make some educated guesses about demand and run them throughthe production simulator. With whatever numbers you forecast, the production simulation will operate exactly as it wouldduring processing. Thus, you can see what your production costs might be as well as the number of units produced and soldfor the forecast you made. You can try different forecasts and study their potential effect on production operations.
The results of the production simulation can be loaded into the Pro Forma cash �ow statement, income statement, andbalance sheet. Thus, you can see how your production operations could play themselves out in your cash �ows, net incomeand balance sheet.

10/4/2018 Help File
https://web5.marketplace-live.com/engine.php?tpl=help&instructorID=10353&sessionID=9c643fdc8c13b099d714380554bb28c1&quarter=9&langua… 69/99
It is recommended that you investigate the �nancial implications of several different demand scenarios by running themthrough the production simulation. Observe the effect of your demand projections on production operations and your �nancialposition. Are you satis�ed with it? If not, �gure out what must be changed in your planned tactics, make the changes, rerun thesimulation and then load results again into the cash �ow statement. Even when the numbers are acceptable, try a differentdemand or operating scenario and rerun the simulation. Continue in this fashion until you understand how your decisions arelikely to play out in the �nancial accounts.
It is particularly important to forecast your cash position at the close of the books for the quarter. It is absolutely imperative toend the quarter with a positive cash position. If you overestimate demand and insu�cient revenue is generated from sales,then an emergency loan will be taken out for the �rm to cover the de�cit. As a general rule, your pro forma cash balance shouldbe at least 300,000 in the early quarters and probably more than 500,000 later on.
Keep in mind that the pro forma is nothing more than an educated guess as to the likely �nancial outcome of all of yourbusiness decisions. In every case, your forecast will be wrong. You will either generate more cash than you planned or less.You can only hope that your decisions are good and your forecast is reasonable. After that, you have to sit back and wait to seewhat really transpires.
To place this condition in a real-world context, every �rm must commit its resources in the pursuit of sales even before it isknown what the sales are likely to be. It is not until the books are closed at the end of the accounting period that the �rmknows for sure that a positive cash position has been realized and a pro�t made.
Once you are satis�ed with your decisions and their �nancial effect on the �rm, you can submit your decisions for processing.After the game administrator processes your decisions, they become locked in place and are no longer reversible.
Future Quarters
During the Marketplace business simulation, you must prepare a business plan for the international market rollout. Tocomplete this task and determine your funding needs, it will be necessary to develop pro forma cash �ow projections and�nancial statements. (See Chapter Guidelines for Preparing Pro Forma Financial Statements for the Business Plan.)
Cash �ow planning must be integrated into the business planning process. It is an iterative process whereby you must �rstdevelop a plan of action. Next, you must estimate the cash receipts, disbursements, and funding needs to activate the plan.
If the plan cannot sustain the cash �ow capabilities of the �rm, then you must adjust the plan and the related estimates ofreceipts, disbursements, and funding needs. This iterative process continues until your business plan and cash �ow cansustain one another.
Thus, the �rst step in preparing a �nancial plan is to prepare your strategic plan relative to geographic market entry, sales forceexpansion, new product development, advertising, production capacity, etc. Using the tactical plan within the Marketplacesoftware, you can lay out the tactics of your strategic plan on a quarter-by-quarter basis. For guidance on how to prepare thetactical plan, please review the chapter on Tactical Plan Guidelines within this help �le.
With your tactical plan in hand, the next step will be to project all of the related receipts and disbursements from your businessoperations. A set of step-by-step guidelines has been prepared to help you through this process. These guidelines are labeled,Cash Flow Guidelines, and can also be found within this help �le.
Understand the Connections between Tactics and Cash Flows. As you prepare both your tactical plan and your pro forma�nancial statements, always be watchful for the interactions among your decisions. As you add new sales outlets, you willnecessarily add new sales people. As you add new sales people, the cost of your sales force will go up proportionately. And asyou add new sales outlets and new sales people, demand should go up.
The rate at which demand will increase will depend upon the level and quality of your advertising and the addition of new brandfeatures. If demand goes up, then you must plan production runs to meet demand. In turn, you must purchase �xed productioncapacity at least one quarter in advance. And so forth.
Always keep in mind that demand will not increase without your �rm taking proactive steps to develop that demand. Thismeans that you must re�ne products, re�ne the ad copy, expand advertising budgets, lower prices, introduce new features, orenter new territories.
Investors Look for the Correspondence between the Plan and the Financials. You are likely to present your business plan andpro forma �nancial statements to outside investors. The investors will be looking for detailed plans and �nancial projectionsfor several quarters into the future.
Experienced investors know how plans and �nancial statements work together. They will look at the correspondences amongthe tactics, expenditures and revenues. For example, if the investor sees that sales are increasing at a rapid rate, but the

10/4/2018 Help File
https://web5.marketplace-live.com/engine.php?tpl=help&instructorID=10353&sessionID=9c643fdc8c13b099d714380554bb28c1&quarter=9&langua… 70/99
advertising expenditures or the new product introductions are not timed to that expansion, they will rightfully ask what isdriving the increase in demand.
If you are planning a geographic market expansion in a given quarter, the investor would expect to see a jump in marketdemand to correspond with that market entry. Similarly, if you anticipate a blitz advertising campaign, the investor would alsoexpect to see a corresponding increase in demand.
The important point is that your �rm's sales �gures in both units and currency amounts should correspond to your businessdecisions. Where they appear to be independent, it causes serious concern on the part of the investor as to how well you arecapable of planning your �rm's future and reasonably anticipating the market's reaction to these plans.
Thus, everything is tied to everything else. The secret to strategic and tactical planning is to recognize which tactical decisionsdrive other tactical decisions and how all of these are related to cash �ows. The tactical and cash �ow guidelines will help youwith this process. Be sure to use them.
Determine the Need for Additional Equity or Debt. One very important purpose of the cash �ow analysis is to determine your�nancial position for each and every quarter throughout the planning horizon. That is, you must determine if you will be�nancially solvent given your anticipated disbursements and revenues.
It is easy to determine if you will need outside capital to keep your business alive. After you have estimated all of your cash�ows for any quarter, simply look at the bottom of the cash �ow statement. If your ending cash position is negative, then youmust seek alternative sources of funds or you must change your plans.
For most new ventures, there is a greater cash out�ow than in�ow simply because there is a lag between your marketinvestments and the market's response to these investments. For example, you must pay for the new �xed production capacitya quarter before you can use that capacity to produce more goods. Or, you must hire engineers and task them to develop newproduct features before they can be built into new products and generate sales.
The pro�ts from current sales are seldom su�cient to pay for this necessary expansion. In short, you can expect cashshortfalls in the early stages of a �rm's growth. Through the pro forma cash �ow spreadsheet, you can determine how muchyou will need to borrow from the bank or acquire from venture capitalists in order to make a go of your business. Keep addingnew equity or loans until there is a cash surplus in every quarter. And, when these surpluses become large, start paying theloans back so that you do not have unnecessary cash.
Perform Sensitivity Analysis. In closing this section, it is always important to conduct sensitivity analysis on your forecast and�nancial plan. Investors will assume that your most likely case is in reality an optimistic case. Their experiences havedemonstrated time and time again that it takes longer to develop a market than the entrepreneur ever anticipates or it is lesspro�table due to price competition or a rise in costs. Thus, the investor is likely to ask if you have explored alternate scenariosin the preparation of your business plan and pro forma �nancial statements.
For example, what if the market prices become very competitive two quarters out and you are forced to reduce your price by10% in order to generate the same unit demand. What would happen to your net income, cash �ow, and funding requirements?
Alternatively, what if you learn that a competitor is planning to introduce some new technology a quarter earlier than your ownscheduled introduction and you must speed up the R&D investment. How would that affect your cash �ow position? In short,you should investigate alternate market scenarios and project their impact on your �nancial position in the future. As amanagement team, you should be ready if any of these scenarios materialize.
Historical Quarters
At the end of each quarter, the pro forma �nancial statements will be replaced by the actual transactions that materializedfrom the Marketplace simulator. That is, all of your decisions and those of your competitors will be run through theMarketplace simulator and demand will be computed based upon your relative success in attracting customers. Thesedemand numbers are then fed through your production operations and all of the accounting ledger items are updatedaccording to the real events. The closeout �nancial statements are then posted to your team �le and made available to you atthe start of the new quarter. These statements can be found within the Performance Report menu item within the software.
This �nancial information for the quarter just ended will be invaluable in assessing the quality of your decisions given actualmarket conditions and not just anticipated conditions. Careful review of this �nancial information relative to your prior planningand forecasting should help you to adjust your knowledge base and thus your decision making process.
The �nancial statements also provide you with a historical record of your past decisions and results. Again, you want to lookfor patterns in how well you have been able to make business decisions and realize �nancial gains. If there are recurrentproblems (insu�cient cash, low gross margins), delve into the causes and try to correct the decisions that are inhibiting your�rm.

10/4/2018 Help File
https://web5.marketplace-live.com/engine.php?tpl=help&instructorID=10353&sessionID=9c643fdc8c13b099d714380554bb28c1&quarter=9&langua… 71/99
Activity Based Costing (ABC)
Given the di�culty of starting up a new business, it is imperative to know precisely the pro�tability of each brand and market.Activity Based Costing is a valuable tool for evaluating the contribution of each market activity to the �nancial vitality of the�rm. The objective is to assign each activity and cost related to the creation of a sale to the brand or market that generated thesale.
For example, suppose 300,000 was spent in total advertising. Should this cost be charged to the overhead of the �rm as aselling expense? If yes, then every unit sold would effectively carry the same advertising burden. But, what if we know that200,000 was spent on Brand A and 100,000 was spent on Brand B.
Wouldn't it make more sense to charge Brand A with the greater advertising burden? We can similarly charge each brand withits relevant demand creating costs (such as advertising, rebates, R&D, etc.) as well as the cost to produce it. When all of therevenues and costs are properly allocated, we can discover which brands are making the greatest contribution to thepro�tability of the �rm.
We can similarly evaluate the regional markets in which the �rm is selling. It is not di�cult to allocate revenue or cost of goodssold, but we can also assign costs associated with the regional rebates, sales force salaries, leases, and advertising costs.Again, our objective is to learn the relative pro�tability of each region so that we can allocate our resources effectively.
As part of their support function, your accountants have prepared an ABC analysis on each brand and sales region. At the veryleast, this analysis will help you to evaluate the pro�tability of all of your demand generating activities. However, it will not tellyou what to do. You may elect to retain a brand that has a low contribution to pro�ts if it helps you to accomplish otherobjectives, such as having a full product line or greater economies in purchasing components for all brands.
Or you may realize that it will take time to build the business and a new brand or market may not become pro�table for a fewquarters. Regardless of the reason, if you are losing money, you should know it. If you are making more money on some brandsor regions, then perhaps you should reallocate some resources to take further advantage of these gains.
Financial Planning and Analysis
Financial planning is very important to your success in Marketplace. Research indicates that poor cash �ow management isone of the major reasons for the failure of new ventures.
Cash �ow problems can be traced to slow-moving inventory, unused capacity, large accounts payable, investments with longpayback periods, and unnecessary expenditures. In each case, the resources of the �rm are tied up for an extended period oftime, thus limiting the entrepreneur's �exibility to respond to the events of the marketplace.
The basic problem with which you must deal is this: do you commit your resources early in order to get a jump on thecompetition or should you hold back until you see how the market develops? If you commit early, you will lose �exibility torespond to new developments. A little experience may also help you to avoid serious errors. If you wait too long, you may nevercatch up. You must discover the right balance between liquidity and a competitive head start.
Part of your �nancial planning must include future quarter cash �ow projections. As a suggestion, create pro forma cash �owtables, income statements, and balance sheets for at least four quarters into the future. In order to facilitate this �nancialplanning, in Q5 the pro forma cash �ow template will allow you to start entering projected data for future quarters.
After you have made your cash �ow projections for the next year in business, explore various "what if" scenarios by budgetingalternate investment options, sales projections, advertising expenditures, distribution expenses, and so forth. Extend these"what if" scenarios four quarters into the future to study their probable impact on your future �nancial position. Consider mostlikely, worst case, and optimistic scenarios.
You will probably discover that your cash position is more limited than you originally thought. Most of your spending optionshave hidden overhead expenditures and hidden long-term commitments. Just thinking through the cash �ow projectionsshould help to determine how current decisions will impact future operations and options.
From this analysis, determine how much money can be safely invested in longer-term, potentially higher-payoff opportunitiesversus investments in short-term, liquid assets. Also, determine which investment options provide the best balance between�exibility and �nancial return.
Return on investment (ROI) considerations must also be part of your �nancial planning and analysis. Look at pro�t margins,turnover, ROI, and so forth, of both your investment options and current operations. Are you allocating your resources inproportion to the �nancial return?

10/4/2018 Help File
https://web5.marketplace-live.com/engine.php?tpl=help&instructorID=10353&sessionID=9c643fdc8c13b099d714380554bb28c1&quarter=9&langua… 72/99
It is surprising how many executives cannot tell an investor how much bottom line pro�t can be traced to each brand or saleso�ce or how the pro�tability analysis is in�uencing other business decisions, especially marketing efforts.
Payback considerations are also very important for new venture �rms. For any given investment or expenditure, you must askwhen it will be paid back. Without an established income stream, the turnover of cash is very important. The faster it is paidback, the more quickly it can be used for other investments or expenses.
Finally, entrepreneurs often overlook the difference between cash �ow and income. If the income statement shows large salesvolumes and a pro�t on every sale, the entrepreneur may conclude that everything is rosy. However if the market is growing, thecash from current sales will not be su�cient to pay for the increase in work-in-process inventory required for the next quarterand the business will �nd itself short of cash to pursue new opportunities or �ght off new threats.
Earning a Profit
It is not unusual to show losses during the start-up phase of your company. During the �rst two quarters of play, you will likelyexperience negative income as you incur the normal start-up costs of any new venture.
Contributing to the problem will be the low gross margins coming from limited brand sales during the test market phase. Also,your cost of goods sold is unusually high due to the low production volumes.
The pro�tability challenges continue into the second year, but for different reasons. After the business plans have beenaccepted in the second year, you will initiate the market development programs that you have laid out.
Your executive team is "growing the company" which is a very resource intensive period of time. From a cash �ow point ofview, you are �nancing in �xed production capacity and demand ful�llment capabilities as you expand markets and productlines. If you are smart, you will anticipate this condition when preparing your business plan and �nancial request. Otherwise,you must �nance tomorrow's growth with yesterday's revenue.
In terms of pro�tability, you will �nd your net income dropping precipitously during the test market phase. These losses arealso due to the need to "grow the company". Speci�cally, you must expense the set-up costs of the new sales outlets and theresearch and development costs. It is generally not possible to cover these growth expenses out of revenues because of thepressure on prices in the marketplace.
An acid test of your �nancial management is to compare operating expenses to operating revenue. First subtract the growthexpenses from your statement of current expenses. The balance is your operating expense. Next, compare the gross margin ofall sales to your operating expenses. Does the gross margin exceed your operating expenses? The answer should be aresounding yes! If not, then you are not managing your demand creation activities pro�tably.
When you spend money on advertising, lease expenses, sales force expenses, etc., it should be with the intention of creatingsu�cient demand to cover the cost of these expenses. After the test market phase, you should be earning a pro�t on every unityou sell, excluding your growth expenses. If you do not have a positive income from normal operations, then you are pricingbelow your costs. In all likelihood, you are paying too much attention to market share and not enough to pro�tability.
Pricing is critical during the market development phase of the business. There is a tendency to cut prices to be competitive;unfortunately, the tendency is to cut them below costs. This could be very detrimental to your �rm. It is important to recognizethat pricing is not the only way to gain sales. Your team would be better off pricing higher and spending some of that money onsales people and advertising in order to create demand. A low price will not bring people into the business. You need salespeople and advertising to create interest in your product and price.
Bankruptcy
A �rm is technically bankrupt if its cumulative losses exceed its common stock investment. More speci�cally, bankruptcyoccurs when the sum of the retained earnings and the common stock is a negative number. Stated differently, themanagement has used up all of the equity of the �rm when the negative value of the retained earnings exceeds the value of thecommon stock.
Why Bankruptcy Occurs
The primary cause of bankruptcy is having the unreasonable expectation that the industry is locked into the growth phase ofthe product life cycle. The executive team thus reasons it can count on increasing revenue to pay for substantial investments.
This expectation emerges as a result of market growth in the early quarters. The underlying assumption is that the marketgrowth is driven by forces outside the company and will continue unabated. This is a faulty assumption. The truth is that the

10/4/2018 Help File
https://web5.marketplace-live.com/engine.php?tpl=help&instructorID=10353&sessionID=9c643fdc8c13b099d714380554bb28c1&quarter=9&langua… 73/99
market is driven by the collective decisions of the industry's participants as well as seasonal swings.
There is no growth curve built into Marketplace. If demand is growing, it is because the �rms are introducing new products,expanding into new markets, hiring new sales people, developing better advertising campaigns, and lowering prices. If a �rm'sdemand is increasing relative to others, it means that, for now, it is doing a better job than the competition.
Executive teams are often shocked when demand drops off sharply. Sudden loss of demand may be caused by many factors,including:
1. A curtailing of marketing efforts across the entire industry (usually due to a lack of supply).2. The entrance of a new competitor in the �rm's market.3. A major market push by a competitor (usually accompanied by new brand designs, lower prices, and/or better
advertising).4. A miscalculation of the effectiveness of one's own marketing decisions (brands are weaker than hoped, and/or ads are
poorly rated).5. A normal seasonal downturn (often overlooked in quarters 5 and 6).
The fundamental problem is that the executive team bets that demand will grow and budgets large expenditures in anticipationof this growth.
A second cause of bankruptcy is when an executive team fails to realize that R&D expenditures are treated as an expenserather than an asset. R&D expenditures of two, three and four million are re�ected on the bottom line, causing large losses thatare accumulated in retained earnings. If pro�ts from continuing operations do not offset the expenses, the negative retainedearnings �gure can quickly exceed the common stock �gure. As a rule of thumb, the �rm should not spend more in R&D than itreceives in venture capital as a result of the business plan.
A surprising (for some) side effect of declining retained earnings is a loss of borrowing power. The clever executive team thatinvested early in R&D may �nd itself without the debt capacity it anticipated. It therefore becomes technology rich and cashpoor, and is unable to produce su�cient quantities of the brands containing the new technology.
How to Avoid Bankruptcy
There is no reason for a team to roll the dice on the future. Demand is entirely logical. The executives must ask themselveswhat they have done in the way of market stimulation to ensure that their demand �gures are reasonable. Have they increasedadvertising at a faster rate than their competitors?
Do they have new sales outlets, more sales people, or lower prices? Are there other forces at work which could cause demandto soften (a seasonal downturn or mass reduction of marketing by the rest of the industry)?
A simple and conservative test is to compare the projected gross margin to the �rm's projected expenses. First, multiply lastquarter's demand per sales person * the number of sales people scheduled for the current quarter * the average selling price ofall brands carried.
Second, multiply the projected number of units sold * the historical production cost. This will give you an estimate of theproduction costs. Third, subtract the production costs estimate from the revenue estimate to give you the gross marginestimate.
Finally ask: Is the gross margin a number larger that the negative cash position at the end of decision-making? And is the grossmargin su�cient to cover most, if not all, costs so that retained earnings do not decline prematurely? If the answer is no ineither case, then expenditures should be curtailed.
How to Get Out of Bankruptcy
Bankruptcy is a clear signal that the executive team has not managed its �nancial resources wisely. It has essentially failed thetest of the market. However, the team cannot walk away from the business.
Like Chrysler, it must �gure out how to get itself out of this mess. In this way, it can redeem its reputation in the �nancialcommunity.
A bankrupt �rm will �nd that it has no additional borrowing capacity. Therefore, debt is not an option. The executive team mustcurtail all unnecessary expenditures and stimulate pro�t building demand.
The only way a �rm can pull itself out of bankruptcy is by focusing its energies and resources on its best opportunities. The�rm must adopt the earlier recommendation of focus, excel, and expand with success.

10/4/2018 Help File
https://web5.marketplace-live.com/engine.php?tpl=help&instructorID=10353&sessionID=9c643fdc8c13b099d714380554bb28c1&quarter=9&langua… 74/99
To initiate the refocusing effort, the executive team must decide which single segment represents its best option in the market.All marketing activities must be focused on this one segment, and all other market development activities must be placed onthe back burner.
The same is true for production. The only brands to be produced must be targeted at the chosen segment. Production of allother brands must be stopped or slowed to a trickle.
Curtailing marketing efforts will only exacerbate the problem. It is easy to be caught in a downward spiral of cutting sellingexpenses which reduces demand which requires further cuts in selling expenses. The best approach is to stimulate demand.
Advertising must be reworked in light of the above constraints. Advertising and sales force should be pumped up to createdemand and put cash into the checking account. Reducing prices is not wise since it will only reduce margins, and probablyretained earnings. With the possible exception of a poorly-rated brand, non-price techniques must be employed to createdemand. In all cases, the anticipated revenue must be su�cient to pay for all expenses.
The above recommendations will not result in an instant return to good �nancial health. They will have to be employed for twoor three quarters. Only after the �rm is solidly in the black should it resume its market expansion activities.
Independent Auditor
There is an independent auditor whose mission is to keep your team honest and solvent. It will not allow a team to spend all ofits equity on new business development to the point that it places the team at risk. This auditor forces more conservativeaction. Thus, teams with big plans or poor �nancial management may have di�culty doing everything they desire.
Your independent auditor requires that your team remain solvent. It therefore requires that you maintain a minimum amount ofequity at the end of each quarter. You must have an equity balance of 10% of your common stock in the current quarter plusretained earnings from the previous quarter.
Stated another way, you can spend 90% of your common stock plus retained earnings. Keep in mind that debt and cash hasnothing to do with keeping your �rm out of bankruptcy. You may be able to borrow substantial money based upon last quarter'sretained earnings. However, your limit in the current quarter is not based upon debt, but net equity.
Suppose your common stock plus retained earnings is something like 1,500,000. If you were to spend 1,800,000 on sales andmarketing, all of it would be expensed and your retained earnings would likely be more negative than your equity investment ispositive. You would have EXPENSED all of the equity that you, your team and the venture capitalists have invested in yourcompany. At that point, your company is bankrupt.
Your independent auditor will place limits on what you can spend on new business development. If you receive a fatal warningabout overspending, you must cut some of your expenses. If you are receiving this warning, then you are dangerouslyundercapitalized. You are cutting it too close from a �nancing point of view. Your auditor will be right in refusing to let youclose the books until you resolve this issue.

10/4/2018 Help File
https://web5.marketplace-live.com/engine.php?tpl=help&instructorID=10353&sessionID=9c643fdc8c13b099d714380554bb28c1&quarter=9&langua… 75/99
J. Finance
1. Funding Sources2. Equity3. Debt Financing4. 3 Month Certificate of Deposit5. Depreciation6. Payment to Business Partners
Strategic planning and execution of your strategy require strong �nancial management skills. The management of resourcesusually translates into the management of money. You must anticipate the timing of disbursements and receipts relative to theexecution of your business plan.
Cash �ow is almost always a constraint on any �rm or organizational unit. It imposes restrictions on current operations and thedevelopment of new opportunities. It forces choices among high-priority alternatives. Enhancing your ability to manage cash�ow will allow you to accomplish more with the same resources.
Initially, the �nancial resources available to your �rm will be limited to the equity that your executive team can invest. Cash�ows from sales will be insigni�cant during the start-up phase as you focus primarily on test marketing and development. Asthe company grows, �nancial planning will become increasingly important.
In the second year, you will be able to go to the �nancial community with a business plan and negotiate common stockinvestments by venture capitalists. You will also be able to borrow money from the bank on a line of credit or possibly go to thebond market for long-term loans. In addition, your sales will increasingly generate cash as you expand your product offeringand sales territories.
The income statement, balance sheet, and cash �ow statement are provided to help you manage the �rm and report yourcurrent status to the �nancial community. You will discover that these statements integrate all aspects of the �rm's business.
You can immediately see how your decisions impact the various accounts and the �rm's pro�tability. As you plan your future,you can also project your receipts, disbursements, and funding requirements several quarters into the future by preparing proforma statements.
Finally, several analytical tools are provided to help you evaluate the pro�tability of your brands, markets, and company. Withthese �nancial tools, you should be able to skillfully adjust your strategy and resources to maximize the pro�tability of yourbrands, markets, and company. Your focus must always be on long-term bottom-line pro�tability. Remember that as investors,your goal is to maximize your return on investment.
First consider:
1. The �nancial options available to you.2. The information provided in the �nancial statements.3. The analytical tools which can be used to evaluate your �rm's performance.4. The need for careful �nancial management.5. The conditions and remedies for bankruptcy.
With this information, you will be in a better position to achieve high levels of pro�t and market performance.
Learning Objectives: The primary objective is to help you understand the relative advantages and disadvantages of alternatesources of capital. There is no perfect source of capital, as each has its unique costs and bene�ts and these must beunderstood. Also, multiple sources are likely to be needed and the relative mix must be managed as the �rm progressesthrough its different stages of development.
Concepts Emphasized
Financial Management: Allocation of a scarce resource (Cash), and living within a budget.
Financial Accountability: Return on investment requirements, and the need for continued corporate �nancial support.
Postponement: Maximize decision �exibility, and minimize risk by waiting to see what happens. -versus- Speculation: Early commitment of resources in order to gain a cost advantage, and a jump on competition.

10/4/2018 Help File
https://web5.marketplace-live.com/engine.php?tpl=help&instructorID=10353&sessionID=9c643fdc8c13b099d714380554bb28c1&quarter=9&langua… 76/99
Funding Sources
There are three major sources of funds for your company: Equity investment; Debt Financing; and sales revenue. For the �rstyear in business, you cannot count on sales revenue and no �nancial institution will lend you money until you have proven yourcreditworthiness. Therefore, your initial capitalization must all come from the executive team.
Sales should pick up substantially during the second year. It is expected that you should begin to show a positive net incomeduring the second or third quarter of the second year.
After your �rst year in business, you will have the option to issue common stock to venture capitalists. You will also be able totake on debt in the form of a bank line of credit or bonds sold to other �nancial institutions.
Equity
The �nancial analysts have determined that you will need 1,000,000 in cash for each of the �rst four quarters of business(4,000,000 in total). After test marketing, your �rm will probably need another 3,000,000 to 5,000,000 in equity �nancing andpossibly an equal amount in debt �nancing.
In anticipation of these two rounds of �nancing, forty thousand (40,000) shares of common stock have been authorized. Yourinstructor may authorize an additional 50,000 shares of stock for the second round of �nancing. (Ask your Instructor).
The initial stock value for both rounds of �nancing is 100 per share. This value may change during quarter 5 depending uponthe performance of your team and your negotiations with the venture capitalists.
Closely-held common stock
You and the other members of the executive team must invest the initial 4,000,000. You are expected to raise this money bypledging your own personal assets and �nding family members and friends to back you. You may issue forty thousand sharesof common stock to yourself and the other members of the executive team in exchange for the 4,000,000 investment.
Your �rm has been authorized to accept one million (1,000,000) in equity capital in each of the �rst four quarters. You willreceive the equity investment into your cash account and common stock to members of the executive team will beautomatically issued.
Until the stock has been issued, the money will not be added to your checking account and balance sheet. You have completeauthority to invest this money as you see �t. You are expected to invest this money wisely.
Your �rst round of �nancing will provide su�cient funding to conduct a market opportunity analysis, build a small productionfacility, open a few sales o�ces and test market your products and ideas. The �nancial analysts do not expect you to make apro�t in this phase of your business.
If anything, you are expected to lose from 200,000 to 600,000 each quarter due to your start-up expenses and low economiesof scale. Your primary goal in the �rst year is to learn enough about the business so that you can develop a successfulbusiness plan for the second year and beyond. With the business plan, you will be able to approach the venture capital marketfor your second round of �nancing.
Venture capital
After your �rst year in business, you will have the opportunity to approach the venture capital community for additional equityfunding. They expect you to prepare a comprehensive business plan and submit this plan for their review in quarter 5.
Your business plan should include a market analysis, a market development strategy, a pro forma income statement andbalance sheet and a cash �ow budget for the next eight quarters of business. It should also include a historical record of yourprior decisions and your market and �nancial performance to date. Speci�c guidelines on how to prepare a tactical plan andpro forma projections can also be found in this help �le.
As part of the business plan, the venture capitalists also expect a request for additional equity capital. The �nancial requestshould include the total amount of the �nancial request, the number of shares of stock which you are willing to sell to theventure capitalists and the stock price which you are asking.
For your part, keep in mind that common stock will grant ownership and voting rights to the venture capitalists. If you sell moreshares of common stock than owned by the executive team, the venture capitalists would gain legal control of the �rm. To besure, most are not interested in managing a young �rm; they are effectively investing in your team to manage it well.

10/4/2018 Help File
https://web5.marketplace-live.com/engine.php?tpl=help&instructorID=10353&sessionID=9c643fdc8c13b099d714380554bb28c1&quarter=9&langua… 77/99
The venture capitalists will probably want to negotiate the terms of the sale of your company's stock. The price they are willingto pay will depend upon their assessment of your performance to date, the soundness of your business plan and your potentialpro�tability in the future. The suggested stock price range is 70 - 120 per share.
In terms of the amount of the investment, do not expect a free ride. Several new ventures are to be evaluated and funded. Aninvestment in your business will come at the expense of an investment in another one. In such a competitive environment, youmust demonstrate how investment in your company would be more pro�table than their investing in someone else's company.
Also keep in mind that venture capitalists are not likely to give you everything you wish. Your future investors will purposelyplace �nancial constraints on you. They want you to prove yourself before they invest substantial money. With insu�cient cash,you will be forced to make choices.
They want to know how you make decisions, the outcome of these decisions and what you have learned in the process. Theyare also convinced that the marginal return on their investment will drop if they give you unlimited money. A resourcefulexecutive team ought to be able to accomplish a great deal with the limited money they give you. In fact, it may even workharder and smarter with �nancial constraints.
Consult your instructor or the Marketplace processing center about the structure of the venture capital negotiations and theissue of common stock. The additional equity will be available in Q5. Your loan capacity will not be expanded until Q6.
Dividends
To provide additional source of return to shareholders your team may elect to pay stock dividends. Enter the amount of stockdividend you wish to pay, this amount is on a per share basis.
Creation of Wealth is a measure of how well the executive team has been able to add wealth to the initial investments of thestockholders. If dividends are paid, they will be added back into the net equity of the �rm for purposes of calculating theCreation of Wealth because they represent wealth that has been created and distributed to the stockholders.
Debt Financing
Another source of funds for your business is debt. There are three types of debt: conventional bank loans, long-term loans andemergency loans.
Bank loans
After your �rst year in business, you will be able to borrow money from the bank on a short-term basis. The bank will set up aline of credit that you can borrow against at any time you wish. The line of credit is equal to one and one-half times the equityof the �rm (common stock plus retained earnings from the previous quarter) minus any current (conventional loan andemergency loan) or long-term liabilities.
*Conventional loan capacity = [1.5 (CSq-1 + REq-1) - (CLq + ELq-1 + LTLq )] where q = current quarter.
The interest for a bank loan is determined by the amount of debt capacity utilized. As your use of debt increases relative toyour �rm's debt capacity, the interest rate will slide upwards. Conversely, if you sell stock or add to your retained earnings, thenyour debt capacity will increase and your interest rate will decline.
Warnings: First, the bank is highly risk adverse and will automatically call in (reduce) your loan in part or whole if your debtcapacity declines due to unusual or extended losses. This can become a serious problem during quarters 6 and 7 as a result ofthe large expenditures in R&D which hurt the current retained earnings. If debt capacity declines and you have not madeprovisions for the disbursement to the bank (a forced payback of part or all of your loan), your cash �ows may be in jeopardyand you may incur an emergency loan.
Second, short-term debt capacity is subservient to long-term debt use. As a result, a scheduled increase in short-term debt usewill be adjusted downward if you subsequently attempt to take out a long-term loan and thereby exceed your short-term debtcapacity.
Long-term loans
It is possible to obtain long-term debt �nancing through the sale of �ve-year bonds to various �nancial institutions. These�nancial institutions will buy your long-term notes for a premium interest rate over conventional bank loans (approximately +2interest points, it is a �oating number based on debt to equity ratio). The acceptable debt capacity is two times the �rm's equityposition in the previous quarter minus any current debt.

10/4/2018 Help File
https://web5.marketplace-live.com/engine.php?tpl=help&instructorID=10353&sessionID=9c643fdc8c13b099d714380554bb28c1&quarter=9&langua… 78/99
*Long-term loan capacity = [2 (CSq-1 + REq-1) - (CLq + ELq-1 + LTLq )] where q = current quarter.
In addition to the larger debt capacity, the advantage of long-term debt is that it is for a �xed period of time. Except in the caseof bankruptcy, there is little possibility of the �nancial institution calling in your note due to short-term swings in income.
The chief disadvantage is the higher interest rate that must be paid. Also, you cannot pay off the loan balance before the 5-yearterm has elapsed. And there is a need to set aside a �xed amount each quarter into a sinking fund in anticipation of paying theloan back at the end of loan period.
As noted above, short-term bank loans are subservient to long-term debt.
Emergency loans
Sound �scal policy is an absolute must in any organization. The banks and other creditors will not allow your �rm to engage inde�cit spending. That is, you cannot spend more money than you take in from sales, loans, or equity investments. In simpleterms, you may not end the quarter with a negative cash position. If you do, your bank has the authority to take out anemergency loan from a loan shark on your behalf to correct the situation.
The emergency loans are covered by a loan shark. A loan shark is a very tough businessman who charges an exorbitantinterest rate, requires repayment in the next quarter, and takes an equity position in your company in exchange for keeping your�rm from becoming insolvent. The interest rate is a sliding scale that begins at 5% per quarter and may go as high as 25% perquarter.
If you experience an emergency loan, you must take immediate action to eliminate it. You must either raise cash or cutexpenditures. If you cannot raise cash, you must cut production across the board or limit it to only one or two brands.
It may be necessary to close unpro�table sales outlets. The chairperson of the board (instructor) has the authority to imposerestrictions on your �rm's activities or to take independent action (change your decisions) if you are not able to eliminate theemergency loan within one quarter.
The loan shark requires an equity position in your company in return for the favor of honoring the checks marked "insu�cientfunds" by the bank. For each 100 that he places in your checking account, he will take one share of stock in your �rm. If youhave a 100,000 emergency loan, he will take 1,000 shares of stock. A 1,000,000 loan will cause the loan shark to take 10,000shares of stock.
The stock owned by the loan shark causes a dilution of your stock and hence its value to yourself and the venture capitalists. Inother words, your share of the company will decline with the use of emergency loans.
Emergency loans will be repaid automatically as soon as your company has positive cash at the end of a quarter. However theloan shark will keep his shares forever.
Be careful with bank loans: In Marketplace, debt is not possible until the 5th quarter. Most entrepreneurs would not haveaccess to bank �nancing until they have established themselves and proven their �nancial accountability. There are twosources of debt which become available in the 5th quarter of play, conventional bank loans and long-term debt.
There is considerable risk in taking out conventional bank loans.
Speci�cally, there is an automatic recall by the bank if a team's debt capacity declines in a later quarter. For example, supposea team has a 3,000,000 debt capacity in Q6 and borrows the entire 3,000,000. Then in Q6, the team has a net income loss ofalmost 1,500,000 as a result of its investments in R&D for new features. In Q7, the team's debt capacity will drop to near zeroas a result of the loss in Q6. As a result, the bank will automatically call in 50% of the loan and take 1,500,000 out of the cashaccount.
Notice: The 1,500,000 drop in cash will occur at the start of Q7. There is no notice or warning. The company will �nd that itscash account is 3,000,000 short of the team's expectations.
In another scenario, the team might not have an income loss, but encountered a 4,000,000 emergency loan in Q6. Perhaps theywere too optimistic in setting their daily production schedule and ended up with costly excess capacity.
In this case, the emergency loan takes precedence over the regular bank loan. In Q7, the team's debt capacity will drop tominus 1,000,000 (the 4,000,000 emergency loan took all of the debt capacity and more). As a result, the bank will call in alarger part of the loan and take 2,000,000 out of the cash account.
The team faces triple jeopardy if it experiences an emergency loan after having taken out a bank loan. First, it is forced to repaymost of the bank loan (2,000,000 comes out of the cash account). Second, it loses the ability to borrow money (the emergencyloan erases all debt capacity).

10/4/2018 Help File
https://web5.marketplace-live.com/engine.php?tpl=help&instructorID=10353&sessionID=9c643fdc8c13b099d714380554bb28c1&quarter=9&langua… 79/99
And third, the loan shark is expecting the emergency loan to be repaid in the current quarter. Repayment will require a cut inexpenditures and/or an increase in revenue to generate the positive cash �ow.
This debt problem does not occur if a team uses long-term debt and so it is recommended to the teams. The downside of thelong-term loan is that it is for 5 years, even if the team no longer needs it after 3 quarters. It is also at a higher interest rate.
Of course, careful �nancial management is the way to avoid these problems. You must �nd the balance between risk takingand insolvency. If you take risks, be prepared to accept the consequences.
3 Month Certificate of Deposit
Commercial banks and other institutions in the marketplace offer a 3-Month Certi�cate of Deposit that allows you to investcash and earn a 1.5% quarterly interest rate.
Depreciation
Depreciation is used to allocate the cost of assets other than land that will bene�t a business for more than one year over theasset's service life. These tangible �xed assets which are depreciated include: buildings/production facilities; machinery;equipment; furniture and �xtures; and motor vehicles.
The amount of annual depreciation expense recognized for an accounting period (in this case a quarter) depends on thechoice of depreciation method and estimates of the useful life and salvage value of the asset. For the purposes ofMarketplace, the straight-line depreciation method is used rather than accelerated depreciation. The straight-line depreciationmethod spreads the expense evenly each quarter.
Payment to Business Partners
Provides a way to share �nancial resources with business partners. You can enter into a joint venture with any other companyin your game to share the cost of some expenditures. Please note, the payment will be made in the current quarter. ThePayment to Business Partners option is located in the menu item labeled "Additional Decisions".

10/4/2018 Help File
https://web5.marketplace-live.com/engine.php?tpl=help&instructorID=10353&sessionID=9c643fdc8c13b099d714380554bb28c1&quarter=9&langua… 80/99
K. Guidelines for Preparing the Tactical Plan for the Business Plan
1. How to Proceed2. Working the Details
During the �fth quarter of play, it is customary to prepare a business plan for one to two years into the future.
This business plan will include:
1. an analysis of the market,2. a set of business objectives to pro�tably serve the market,3. a strategy to achieve the objectives,4. a tactical plan to realize the strategy, and5. a set of pro forma �nancial statements that summarize the �nancial transactions and outcomes of the strategy and
tactical plan.
The focus of this chapter is on how to prepare a tactical plan once the overall objectives and strategy have been formulated.The tactical plan �ows from the strategy. It represents the details of how the strategy is to be executed. It lays out the speci�cactions that must be taken and the order in which they must be executed.
To facilitate the preparation of your tactical plan, a template has been prepared within the Marketplace software. It isessentially a strategy worksheet. It is designed to help you think through the activities and outcomes that are necessary torealize the �rm's objectives and strategy.
There are many advantages to using this strategy worksheet to help prepare a business plan. First, it is comprehensive. Itincludes all of your important tactical decisions. Thus, you are forced to think through all of the details.
Second, it is integrative. It is laid out so that you must consider the linkages between one tactical decision and the next.Integration is necessary because decisions cannot be made in isolation; you must follow each one through to the other partsof the organization to fully understand their �nancial and organizational impact.
Third, it is time-sequenced. It forces you to think about how decisions are linked over time. Every decision is dependent uponprior decisions and sets the stage for future decisions. The strategy worksheet will help you see how the past affects thepresent and how the present must be managed to shape future possibilities.
Fourth, it is �nancially animated. Wherever possible, tactical decisions are linked to investments, expenses and revenues.These can be imported directly into the pro forma cash �ow statement and from there, into the pro forma income statementand balance sheet. Thus, you will be able to see if the plan is �nancially viable.
Fifth, it is organized. All the relevant decisions and linkages have been considered and mapped out for you. It is aworksheet/template that effectively guides you through a very di�cult, and often bewildering, task.
Last, it nourishes a mental discipline that is invaluable in business. It is organized, comprehensive, integrative, time-sequenced,and �nancially-driven.
How to Proceed
Working out the details of a tactical plan is like solving a mathematical equation. You must often work both sides of theequation to �nd a solution.
For example, you can start with the present quarter, make your decisions and �nancial projections and then move to the nextquarter. When the second quarter is complete, move on to the third one, and so on. Or, you can start at the end of your planninghorizon and work your way backwards in time to the present.
If you start in the current quarter and work your way forward, the tactical plan works like a layered cake. That is, this quarter'sdecisions will be built upon the layer of decisions and outcomes of the prior quarter. And as you make new decisions thisquarter, you will build the layer upon which the next quarter will rest.
Conversely, you can follow the old adage about vision, and "Start with the end in mind." This means you start with the end goaland determine what must be put in place before you can achieve this goal. For example, to achieve your goals by the end of thesecond year (quarter 8), what must be done in quarter 7? What segments should you be in; how many sales outlets should beoperational; how many brands will you need to carry, how much production capacity will you need? Similarly, what must bedone in quarters 5 and 6 to set things up for quarter 7? And, so on.

10/4/2018 Help File
https://web5.marketplace-live.com/engine.php?tpl=help&instructorID=10353&sessionID=9c643fdc8c13b099d714380554bb28c1&quarter=9&langua… 81/99
Practically speaking, it is easier to work forward than backward. This is because the near term is more tangible and has fewerunknowns. Once you get out a few quarters, anything can happen; it is all educated guesswork. Thus, it is recommended thatyou start with your decisions for quarter 5 and move forward in time.
Most of the quarter 5 decisions will be comparatively easy because you have already made them a couple of times. And, youhave a complete set of marketing, operational and accounting data from quarter 4 upon which to rely.
Next, move to quarter 6. Although there is no new data upon which to make decisions, you will have put in place manyactivities that will shape your quarter 6 decisions. You are merely following through on your quarter 5 actions. For example, ifyou opened a sales outlet in quarter 5 for quarter 6, you know you have to staff it, select and price brands, and advertise todraw customers in. These decisions are natural extensions of the current quarter decisions.
Once you move out 2 or more quarters into the future, it becomes more uncomfortable to plan your �rm's tactics. For thisreason, you should view them as tentative. As the marketplace advances into future quarters, feel free to adjust the plan.However, it is good to have a plan for these future quarters so that what you want to happen, has a good chance of actuallyhappening.
When you reach the �nal quarter of your planning period, step back and assess your satisfaction with the pace and progress ofyour �rm. At this point, you are "starting with the end in mind." And, it is easier to make adjustments with the whole plan beforeyou. Are you moving at the right speed? Are you as big or as focused as you had originally desired? If not, adjust the end resultsand work backwards to make sure your prior decisions support the �nal results.
Of course, you cannot fully evaluate the tactical plan until you prepare your pro forma �nancial statements for the same timeperiod. Will your tactics result in the cash, revenue and pro�t objectives you have set for yourself and the investors? Can youafford to do all that you have planned?
It is not uncommon to experience an "oops" when the tactical plan is translated into the pro forma �nancial statements. Morelikely than not, the plan is too ambitious given the available resources. Thus, the plan must usually be scaled back until it cansustain and be supported by the projected cash �ows and pro�tability. The tactical plan and pro formas must be synchronizedin order to have a realist strategy.
Working the Details
It is recommended that you start with the current quarter and move forward one quarter at a time.
Current Quarter
The completion of the tactical plan for the current quarter is very simple. Here is how it is done.
First, make all of the current quarter decisions in the normal fashion. Second, go to manufacturing, estimate demand by brandand run the production simulation. Third, go to the pro forma cash �ow statement, choose <Modify> and then <Load Data>.This will cause the software to load into the cash �ow template all of the �nancial transactions that are associated with yourtactical decisions. The software will also load the revenue and production costs generated by the production simulation. Besure to save the data.
Fourth, go to the Tactical Plan, choose <Modify> and then <Load Data>. This will cause the software to load a summary of yourtactical decisions plus relevant �nancial information from the pro forma statements into the tactical plan.
This is all you have to do to prepare the tactical plan for the current quarter.
For better viewing of the tactical plan details, save the data and then return to the tactical plan. Upon your return, you will �ndthe information formatted for ease of viewing. Scroll up and down and left and right to view the historical data plus the currentinformation.
The current quarter tactical plan will serve as your foundation upon which the subsequent quarters will be built. Keep in mindthat these decisions are not set in stone. You may discover the need to adjust a tactical decision in the current quarter in orderto set up a decision that you want to make in the following quarter. For example, you may want to produce 6,000 units inquarter 6 as a result of the new brands and new sales outlets that you have scheduled. Because it takes one quarter to add�xed production capacity, you would have to schedule a production facility expansion in quarter 5. You may not realize thisneed until you start to make the decisions in the quarter 6. This "ah ha," is precisely why you plan.
Future Quarters

10/4/2018 Help File
https://web5.marketplace-live.com/engine.php?tpl=help&instructorID=10353&sessionID=9c643fdc8c13b099d714380554bb28c1&quarter=9&langua… 82/99
Once the current quarter is more or less complete, move to the next quarter. As you work through each quarter, start at the topof the tactical plan and work your way down through each row in the table. Think of each row as a separate step in theplanning process. The sequence of decisions/entries has been organized within the template so that each one builds upon theprior ones.
For example, Step 1 is the selection of target segments. This is your most important decision because many other decisionscascade down from this one, including the selection of sales outlets, R&D, brand designs, advertising media, pricing, etc. All ofthese decisions depend upon the selection of your target segments.
Step 2 is the selection of sales outlets. It depends upon the target markets and it, in turn, impacts many other decisions. Themore sale outlets you have, the more sales people, advertising, production, etc. you will need. You are also asked to estimatethe cost to open and operate your sales outlets. This information will be used in your cash �ow projections for the quarter.
After your sales outlet decisions, you must make your brand decisions, followed by pricing decisions and advertising decisions.How aggressive will you be in offering new technology, an assortment of brands, price points and advertising? Thisaggressiveness is re�ected in your budgets and is also used in the cash �ow projections.
Consideration of the sales force is next. This set of decisions depends upon the targeting and distribution decisions you madeearlier. How many will you employ, what will they be paid and how much demand are they likely to generate? Again, thisinformation will be used in generating �nancial information for the cash �ow projections.
And, the number of outlets and sales people greatly shape your estimates for demand. Demand, in turn, drives revenueprojections and many of the manufacturing decisions. And your funding requirements and decisions will be driven by all of theprior decisions.
The number of tactical decisions that must be made can be daunting. Further advice is available by clicking on the "?"associated with each line item in the tactical plan. When the "?" is selected, a pop-up window will appear that contains a briefdescription of the nature of the decision or information to be entered in a cell.
Decisions On Debt and Equity
Save this set of decisions for last. There are several additional steps that must be taken before you can arrive at an estimate ofyour �nancial needs.
Here is the recommended procedure. First, complete all of the entries in the tactical plan for the planning horizon. Second, goto the pro forma cash �ow statement, choose <Modify> and then <Import Tactical Plan Data for Future Quarters>. This actionwill cause all of the �nancial information created within the tactical plan to be imported into the pro forma �nancial statementsfor the quarters beyond the current one.
Third, inspect the cash �ow projections to determine if there are any cash shortfalls and, if yes, when and how much. You willhave to choose between equity and debt and then determine the timing and amount of each source of money.
Fourth, return to the tactical plan and enter the amount of equity and debt that is desired for each quarter.
Fifth, return to the pro forma cash �ow statement, choose <Import Tactical Plan Data for Future Quarters> in order to updatethe �nancial statements.
Sixth, inspect the cash �ow statement to be sure the ending cash position is positive for each quarter in the planning horizon.
Last, check the pro forma balance sheet to make sure that the sum of the retained earnings and common stock (net equity) ispositive for all quarters. If it is not positive, then your �rm will be bankrupt. This is unacceptable. It will be necessary to take onmore equity or reduce expenditures.
As noted before, the tactical plan cannot be prepared without simultaneously completing the pro forma �nancial statements.When both sets of documents are completed, print them out and lay them side-by-side. Together, they represent the tacticaldetails of your strategy and how it will be translated into revenue and wealth for the owners. Study the documents to make surethey are internally consistent and viable as a means to achieve your objectives.

10/4/2018 Help File
https://web5.marketplace-live.com/engine.php?tpl=help&instructorID=10353&sessionID=9c643fdc8c13b099d714380554bb28c1&quarter=9&langua… 83/99
L. Guidelines for Preparing Pro Forma Financial Statements for the Business Plan
1. Working the Details
Need for Financial Planning
You cannot formulate a realistic strategy and tactical plan without working through the �nancial issues. There are manyreasons for preparing pro forma �nancial statements. Here are �ve to consider.
First, you need to play out your decisions to see if they turn out as �nancially positive as you hope. Will you meet your �nancialgoals? Will you be solvent over the course of the planning horizon? Most �rms discover that their appetite for growth exceedstheir available resources. That is, the tactical plan cannot be supported by the projected cash �ows and net income. Thus, thepro forma �nancial statements will help in the evaluation of the strategy and tactical plan.
Second, pro forma planning is necessary to determine the amount and type of outside funding that will be necessary. Forexample, if your growth goals require large expenditures for R&D, new distribution outlets, etc., then equity �nancing will berequired because these investments are expensed each quarter. If growth requires large capital expenditures to build �xedcapacity to satisfy market demand, then long-term debt may be ideal. If you perceive many short-term uncertainties in demandand revenue, then short-term debt may be a good choice.
Third, outside investors need pro forma statements in order to evaluate the executive team. They want to know if the executiveteam can manage the �nancial resources of the �rm. Has the executive team carefully thought through the �nancialrami�cations of their strategy and tactical decisions? Are the two linked in a logical, mutually supportive way? Are there errorsin the �nancial transactions that are reported (a certain killer for further funding)? Investors can ascertain a great deal aboutthe quality of an executive team by studying its pro forma �nancial statements.
Fourth, investors want to assess the �nancial attractiveness of the investment. What are the cost of goods, marketingexpenses, research and development expenditures, overhead, asset investments, etc.? What is the pattern of these expensesover the planning horizon? What do these patterns suggest regarding the tactical emphasis of the �rm during its next phase ofdevelopment?
Also, when is the �rm expected to break even, turn a pro�t and create positive cash �ows? How much pro�t and cash can begenerated? Are these numbers realistic for the industry in which the �rm is competing? Are there risky aspects to the revenueand expense projections?
Every investor knows that the business plan and pro forma statements will not be realized as they are presented. Nevertheless,the pro forma statements can help the investor assess the potential gain and risk in his or her investment.
Last, the pro forma projections are necessary to determine the value of the �rm. With the information contained in the �nancialstatements, it is possible to estimate how much the company will be worth at various points in the future.
If the projected value is high, the �rm will be much more attractive to investors. If you are projecting signi�cant wealth, you willalso have a stronger position in negotiating the amount of equity to sell in return for the investment. If the valuation is low, youmay need to rethink your business plan or aspirations for outside funding.
There are many questions that pro forma �nancial statements can help answer. Pro forma �nancial planning is a necessarycomponent of any business plan, and well worth the time and effort to prepare.
Working the Details
Let us consider now the preparation of the pro forma �nancial statements. Here, the focus is on the cash �ow statement. Thisis because the income statement and balance sheet can be derived from the entries in the cash �ow statement. Additionally,cash is a critical resource in a startup venture. There never seems to be enough. It is always the constraint on the �rm'sactivities and ambitions. The cash �ow statement helps you to keep track of the money �owing in and out of the �rm, and thusthe �rm's solvency and potential to grow.
Fortunately, once you complete the tactical plan, almost all of the numbers required to �ll in the pro forma statements areavailable. The tactical plan was designed with this purpose in mind.
For example, in �lling out the tactical plan, you estimated your average selling price and the projected number of units sold.Revenue can be estimate by multiplying the two numbers together. Similarly, production expenses can be estimated bymultiplying the average production cost times the projected production volume. And, sales force salaries can be estimated bymultiplying the number of sales people by their projected average compensation, and so forth.

10/4/2018 Help File
https://web5.marketplace-live.com/engine.php?tpl=help&instructorID=10353&sessionID=9c643fdc8c13b099d714380554bb28c1&quarter=9&langua… 84/99
Hopefully, you can see the logic of how these numbers are derived as you work through the tactical plan. It requires aconsiderable amount of educated guessing, but there is almost no other way when you are projecting the future. And, ofcourse, you can develop your own process and enter a different set of numbers into the cash �ow statement if you are notsatis�ed with the proffered logic and assumptions.
This chapter contains basic instructions on how to complete the pro forma �nancial statements for the current quarter andfuture quarters.
Current Quarter
The preparation of your pro forma statements for the current quarter is comparatively easy. This is because the accountantspost all of your disbursements to your �nancial statements as you make your decisions. What is missing from the pro formasare the revenue, production and cost of goods sold estimates. As you should know by now, these numbers can be obtained byrunning the production simulation.
For the current quarter, here is the recommended procedure. First, analyze your �nancial, marketing and operational data.Second, revaluate your strategy. Third, make all of your tactical decisions. Fourth, project your demand by brand and run theproduction simulation. Fifth, load the production simulation data into the pro forma cash �ow statement. Sixth, check theending cash position and then your income statement and balance sheet.
The objective of the pro forma analysis is to observe the effect of your tactical decisions, production plan and demandprojections on your �nancial position. Are you satis�ed with it? Start by looking at the cash �ow statement, then the incomestatement and �nally the balance sheet.
Cash �ow statement
Are you projecting a positive cash position for the end of the quarter? This is the critical question. If not, �gure out what mustbe changed in your tactics, make the changes, then rerun the production simulation and check your projected �nancial positionagain.
If you are short of cash, perhaps you need to sell more equity or borrow some money from the bank. Alternatively, it might benecessary to scale back on your expansion plans. Should you open fewer sales outlets, reduce production facility expansionsor cut back on research and development? Or, can you expand your marketing efforts and bring in more revenue?
Income statement
After you have checked your cash �ow statement, check your income statement. Chances are, the �rm will have net lossesuntil quarter 7. This is because you are making many costly expansion decisions as you prepare the �rm to be a bettercompetitor in the future. Is the loss acceptable given your pace of expansion? A good indicator of the strength of the �rm is the operating pro�t after your investment decisions have been added back in.The investments that bene�t the future but which are expensed in the current quarter include research and development, newsales outlets, and quality improvements. Add these expenses back to the operating pro�t on the income statement. This willtell you if you are making a pro�t on current operations.
In other words, given your projected revenue and all the costs required to generate that revenue in the current quarter, can youexpect a pro�t? Most �rms should be positive by quarter 5. A few strong �rms will be positive by quarter 4.
If you are not making a pro�t on current operations, something is seriously wrong and needs to be corrected. What can you do?Perhaps, you are in the wrong segment and it is not generating su�cient demand to drive down production costs. Should youadd a third segment that could improve production volumes and lower cost of goods? Should you reallocate your marketingmoney to more effectively create demand? Do you need more advertising or more sales people or should they be moved tomarkets that generate a better marginal return?
Balance sheet
After you have analyzed your income statement, turn to your balance sheet. All the numbers are important, but specialattention should be give to the ending cash position (discussed above) and your retained earnings.
Retained earnings will normally trend downwards during your early quarters of operation. This is because your investments inthe future fall to the bottom line and cause substantial losses. These losses are then subtracted from your retained earnings.
The worry is that your cumulative losses (retained earnings) could exceed the investment money from the executive team andoutside investors. At that point, you are bankrupt and severely constrained in your �rm's operations.
Watch your retained earnings �gure carefully. It should never be a greater negative value than the value of the common stock.In other words, the retained earnings plus common stock should be a positive number.

10/4/2018 Help File
https://web5.marketplace-live.com/engine.php?tpl=help&instructorID=10353&sessionID=9c643fdc8c13b099d714380554bb28c1&quarter=9&langua… 85/99
As you plan for the current quarter, be sure to leave yourself a margin of safety in the net equity of the �rm (common stock +retained earnings). Unexpected bad conditions could occur in the market. Perhaps the market will not grow as fast as youhope. Or, your competition might be more aggressive than you anticipated. Or, your business decisions may not be as effectiveas you planned.
Be prepared for the unexpected. Do not let your retained earnings sink so low that the viability of the �rm is threatened. Leave acushion in your net equity. The sum of your common stock plus retained earnings probably should never drop below 500,000.
Next, look at your projected inventory position. If the inventory value is near zero, than you are either over-stimulating demandor under-producing. If you cannot satisfy demand, then why spend so heavily in creating it? Shift your resources to expandingsupply and scale back on marketing until you can satisfy the demand created.
If your projected inventory is more than 500,000, then you clearly are not creating enough demand or you have scheduled toomuch production. Both are bad and need to be corrected.
Worst-case scenario
Finally, run a worst-case scenario. Assume that things can go wrong. Reduce your demand by 25% to 40% but assume thateverything else stays the same. Rerun the production simulation and load the data into the cash �ow. Check your ending cash,pro�tability, and retained earnings. You want to have at least 300,000 in both your net equity and projected ending cashposition under your worst-case scenario. Will you be solvent at the end of the quarter if your worst nightmare occurs? What canyou do to prepare for this potentiality? Borrow money, cut expansion plans, try to create more demand, or what?
The purpose of the pro forma planning is to help you anticipate what could happen in the future. Do not wait until theunexpected happens, anticipate and act based upon the probable and potential outcomes.
Future Quarters
Mechanics of Making Pro Forma Projections. The tactical planning worksheet has been augmented to help in the preparationof your pro forma �nancial statements. If you have worked through the tactical plan for each quarter in the planning horizon,then you have already estimated most of the numbers needed in the pro forma cash �ow statement.
Here are the steps to take to prepare the pro forma statements.
First, complete the tactical plan for each quarter in the planning horizon beyond the current one. If you are in quarter 5 and youwant pro forma statements for the second year, this means completing the tactical plan for quarters 6, 7 and 8.
Second, import the �nancial data from the tactical plan. Go to the pro forma cash �ow statement and click on the buttonlabeled, Import Tactical Plan Data for Future Quarters. This action will transfer your projected revenues and plannedexpenditures into the cash �ow template. For example, you will see that the advertising, sales force, sales outlets, andproduction numbers that you worked out in the tactical plan are now in the cash �ow statement.
Third, review the entries in the pro forma cash �ow statement. While most of the entries come directly from the tactical plan,there are several ledger items that do not have a counterpart in the tactical plan. To facilitate your work, these items areestimated for you based upon other entries that you have made. These items can be overwritten if you do not like theestimates provided.
The items computed for you include the following:
Shipping costs: an average shipping cost was computed for the last quarter of business. This average was multiplied by theprojected number of units to be sold to obtain an estimate of the total shipping cost in future quarters. In all probability, yourshipping costs will be a little lower as your shipping volumes increase.
Marketing research: the amount that has been budgeted for the current quarter has been applied to future quarters. Youractual marketing research budget might be higher if you buy research from additional regions.
Cost of goods sold: it was assumed that you would sell everything that you produced in future quarters. This estimate is overlyoptimistic since it assumes perfect forecasting. A more realistic estimate is that the cost of goods sold will be less than theproduction cost and that there will be some inventory left over after each quarter. You may wish to reduce the cost of goodssold number at the bottom of the cash �ow statement in order to re�ect this probable condition.
Taxes: taxes are estimated based upon the projected net income (the tax rate is 40%).
Interest: Interest expense is estimated based upon the size and type of loan.
If you change any of the above values, do not click the <Import Tactical Plan Data for Future Quarters> button. The importingaction will overwrite any other entries you have made.

10/4/2018 Help File
https://web5.marketplace-live.com/engine.php?tpl=help&instructorID=10353&sessionID=9c643fdc8c13b099d714380554bb28c1&quarter=9&langua… 86/99
Fourth, �ll in the missing values in the cash �ow statement with reasonable numbers. Most of the missing ledger items will notsigni�cantly affect cash �ow or net income.
Fifth, determine how much is needed in the way of debt or equity �nancing. Once all of the above entries have been made, lookat the bottom of the cash �ow template to determine if your cash position is negative (very likely). If it is negative in anyquarter, save your decisions and go to the tactical plan worksheet and enter the amount of equity or debt that you would like toadd to your balance sheet.
In a sense, the equity and debt entries represent your balancing numbers for �nancial planning. They are added after all otherentries have been made and it is possible to determine how much money is needed and when. Thus, keep adding equity(quarter 5 only) and debt until your net equity and cash are positive for Q5 and all future quarters.
Depending upon the aggressiveness of the plan, your �rm will need to obtain between 4,000,000 and 8,000,000 in equity anddebt. The maximum equity that is available is 5,000,000. The maximum debt will depend upon your debt capacity which isdetermined by your net equity of the quarter before. There are guidelines in the next section to help you decide how muchmoney to take from either outside investors or lenders.
Sixth, determine whether or not you have reached your �nancial goals. Check your income statement and balance sheet. Whendo you achieve positive cash �ows? When does the �rm turn pro�table? Are the pro�ts great enough to attract outsideinvestors? What do the projections suggest for the valuation of the �rm at the end of the planning horizon? Are you satis�edwith the predicted results of your efforts?
Typically, your �rst pass through the pro forma �nancial statements will result in an unsatisfactory assessment. You willprobably discover that your business plan is beyond your �nancial capability (the symptoms are negative equity or negativecash, even after taking 5,000,000 from the venture capitalists and borrowing money from the bank or other lendinginstitutions). When you make this discovery, you will have to scale back on some of your business development plans and thenredo the cash �ow statement.
Alternatively, you may discover that your �nancial projections are too modest to attract outside investors. You may not beaggressive enough to appeal to investors who are looking for very high rates of returns.
In any case, you will need to work back and forth from the tactical plan to the cash �ow template to the balance sheet, back tothe tactical plan and back to the cash �ow template and balance sheet, until you obtain a business plan that is supported bythe cash �ow and pro�t projections.
Equity Funding
Your instructor will determine the maximum amount that can be obtained from outside investors. The software is programmedfor the venture capitalists to give each �rm 5,000,000 in Q5. Typically, this is the maximum equity offered. If you are required topresent your business plan to potential investors and negotiate the size of the equity investment, the amount could be lessthan 5,000,000.
Note: the number of shares of common stock and the stock price determine the amount of equity sold. The default values are50,000 shares at 100 per share. If you are able to negotiate a higher stock price, then you will not have to sell as many sharesto obtain the money desired. If your business plan and negotiations do not go well, then you will probably have to sell moreshares of stock at a lower price.
The amount of equity to be sold is for you to determine. The author designed the simulation so that at least 3,000,000 in equitywill be required. Taking less than 3,000,000 will make it di�cult for your �rm to succeed. This is because the �rm will need tomake sizeable investments in R&D, new distribution outlets, quality improvements, etc. All of these activities must be expensedin the current quarter and thus fall to the bottom line on the income statement and retained earnings on the balance sheet.
Here is how this works. Suppose that your �rm has lost money during each of the �rst four quarters and the total losses equal2,000,000. As a result, your retained earnings �gure at the end of quarter 4 is a minus 2,000,000. (Remember that the retainedearnings �gure in quarter 4 is the sum of the net income for quarters 1 to 4.) Assume further that the executive team invested4,000,000 over the �rst four quarters. Consequently, the net equity is 2,000,000 (4,000,000 in common stock - 2,000,000 inretained earnings).
Finally, assume that the �rm is breaking even on current sales. That is, the cost to generate and serve the �rm's demand exactlyequals the revenue generated.
Under these circumstances, any money spent on research and development or new sales outlets will appear as losses on theincome statement. (There are no pro�ts from operations to pay for them.) These losses will be added to the retained earnings,thus further reducing the net equity of the �rm.

10/4/2018 Help File
https://web5.marketplace-live.com/engine.php?tpl=help&instructorID=10353&sessionID=9c643fdc8c13b099d714380554bb28c1&quarter=9&langua… 87/99
The maximum loss that the �rm can sustain is 2,000,000, or the net equity as of quarter 4. If any more is spent on R&D andsales outlets, then the �rm will be bankrupt. At this point, the losses will exceed the investment by the executive team.
2,000,000 is not very much to spend on new business development. You might be able to acquire one R&D project, but probablyno new sales outlets. If you want to invest in two or three R&D projects and open several new sales outlets, then you will needto raise outside money in the form of new equity.
Debt will not help you solve this problem because it is not part of the equity base of the company. If you borrow 3,000,000 fromthe bank and still have losses of more than 2,000,000, your �rm is bankrupt. In this case, the cash does not determinebankruptcy, but the size of the cumulative losses (retained earnings) compared to the amount of common stock. If yourcumulative losses are 4,000,000 and your equity is 4,000,000, there is nothing left of the owner's investment. At this point, thelenders have all the risk. It is their money that is subsidizing the �rm. Technically, they own everything that is left in thecompany.
This point about the role of debt versus equity is very important. Many people make the mistake that debt can be used tocompensate for losses that exceed the equity investment in the �rm. This is not true.
Before you consider how much money you want to borrow, determine how much equity you will need in order to maintain apositive equity position at the end of every quarter in the planning horizon. That is, the sum of the retained earnings andcommon stock must always be positive.
Here is how to determine how much equity you will need. First, complete your tactical plan. Include all of your new businessdevelopment expenses. Second, import the �nancial data from the tactical plan into the pro forma cash �ow. Third, check theincome statement. If you are projecting losses, you know there will be a need for new equity to cover these losses. Fourth, goto the balance sheet and check the retained earnings. This number should trend downwards for the �rst quarter or two andthen slowly head upwards as the new investments turn into new sales and pro�ts.
Fifth, add together the retained earnings and common stock for each quarter. If it all the numbers are positive, then you do notneed any equity. More likely, the sum will be negative for one or more quarters. Choose the quarter in which the �rm willexperience the greatest negative equity (largest negative number). This is how much equity your �rm will have to sell at aminimum.
Let's return to the above example to illustrate this point. Recall, the �rm wants to invest 5,000,000 in new businessdevelopment in quarter 5. Assume you will breakeven on sales and so you will not have any pro�ts to pay for the new businessexpenses. Thus, your losses for the quarter will be 5,000,000. In quarter 4, your retained earnings �gure was a minus 2,000,000.If you add a further loss of 5,000,000, your retained earnings in quarter 5 will be a minus 7,000,000.
Up to this point, the executive team has invested 4,000,000. The sum of the negative retained earnings and the equity is aminus 3,000,000 (4,000,000 - 7,000,000). Thus, you will need at least 3,000,000 in new equity. 3,000,000 in new equity will bringthe net equity to zero on the balance sheet.
Actually, there is a need for more than 3,000,000. The external auditors require that you maintain a reserve of equity in theevent that things go badly for the �rm. The auditors are risk adverse because they know that one in �ve �rms will go bankrupt ifthey are not restrained. To protect all investors and lenders, they require that you maintain a reserve of at least 10% of theavailable equity. Thus, if the �rm has 2,000,000 in net equity in quarter 4 and it takes in 3,000,000 more in quarter 5, then theavailable equity in quarter 5 is 5,000,000. The auditors will restrict investments in new business development to 90% of5,000,000 or 4,500,000. Thus, to invest 5,000,000, the �rm will have to take in 3,500,000. This will leave 500,000 in net equityafter the investment (10% of 5,000,000).
In light of all of these considerations, it is not unusual for a �rm to require at least 3,000,000 in new equity. The norm isprobably 4,000,000 and an aggressive �rm will need the full 5,000,000. This is because there are so many expansionopportunities that it will be easy to use up 6,000,000 to 7,000,000 for new business development.
If you do not see a need for 3,000,000 to 5,000,000 in equity, you may not have a strong enough plan or you areundercapitalizing your �rm. Think of your competitive disadvantage if your competitors take 5,000,000 and you take only2,000,000.
On the other hand, if your �rm has done well in its �rst year of business and has retained earnings greater than a minus1,000,000, then you might not need a full 5,000,000.
Typical Problems Stemming from Equity Decisions
There are certain problems that can befall a team if it is not careful in making its equity decision. In most cases, the team doesnot take all the capital available and ends up being under-funded. These problems relate to tactics regarding majorityownership and R&D investment and overly optimistic demand projections.

10/4/2018 Help File
https://web5.marketplace-live.com/engine.php?tpl=help&instructorID=10353&sessionID=9c643fdc8c13b099d714380554bb28c1&quarter=9&langua… 88/99
Taking equity �rst, there are a couple of different problems that might surface in selling equity to outside investors. For one, anexecutive team may not want to give up control of the �rm. Thus, it might not want to sell more than 49% of the stock, perhapsits limit might be 40%. The risk inherent in this equity strategy is that the �rm could be undercapitalized. It may not haveenough capital to deal with a downturn in the market, unexpected advances by competition or new opportunities in the market.Although the executive team might have a bigger piece of the pie, insu�cient capital could result in a much smaller pie.
A way around this limitation is to prepare a very good business plan and demonstrate good team skills and business savvyduring the venture capital negotiations. If you can sell the stock at a price that is higher than the 100 paid by the executiveteam, then it will be possible to sell fewer shares and maintain control. A stock price of 120 or higher would be very helpful inthis respect.
Another problem involving equity is that a team may �nd itself faced with unfavorable venture capital options. Perhaps thebusiness plan was not well received or the presentations and negotiations did not go as well as hoped. If the proffered stockprice were signi�cantly less than 100 per share, then the team would have to give up control of the �rm. Rather than give theventure capitalists the satisfaction of winning the negotiations or because the team does not want to give up control, it maychoose to take in less equity. This is a serious mistake. Again, if the competition has 5,000,000 in new equity and you have2,000,000, your �rm will have a major disadvantage.
Turning to R&D decisions, there are various expenditure tactics that can also cause problems. One has to do with large, quickinvestments in R&D and sales outlet expansions. In order to get a jump on the competition, many teams will make largeexpenditures in R&D and new sales outlets during quarter 5. The goal is to have almost everything in place within one quarter.The problem is that some teams will use up all of the available investment money in one large gulp and then �nd themselveswith no �nancial cushion to launch a solid marketing campaign or deal with an unexpected decline in demand. This "�rst-mover advantage" can work, but usually it requires that the team obtain the maximum equity investment possible.
A second R&D tactic that can cause problems is a decision to spread the payments out over two or more quarters. Theobjective is to reduce the total amount of the investment. In some cases, team will do this to reduce the amount of equity thatmight be required to complete the development program. This strategy is very viable and many teams successfully employ it.
However, there is one set of circumstances that will always result in failure. This is when the team chooses to sell a relativelysmall amount of equity stock and simultaneously tries to take on too many projects. Rather than pursue 2 R&D projects, itmight go after 4, even 5. The assumption is that the revenue and pro�ts in quarter 5 will generate enough money to pay for thecompletion of the R&D in quarter 6. Unfortunately, quarter 5 is usually a slow quarter and most �rms do not obtain the incomethey were predicting. If demand, revenue and pro�ts fall short of expectations, the �rm may not be allowed to complete one ormore of these projects in subsequent quarters. Sometimes, none of the projects can be completed.
The reason these projects cannot be completed is because the external auditors will not let the executives put the �rm at risk.The auditors will not allow the team to spend more than 90% of the net equity of the quarter that has just been completed. Ifmost of the equity has been used up in the prior quarter, then the R&D will be the �rst casualty. Again, the solution is to havesu�cient equity to withstand a downturn in revenue and pro�ts.
As a side note, observe that the auditors focus on the results of the prior quarter rather than the pro forma projections of thecurrent one. This orientation is because the last quarter's results are a certainty and this quarter's results are speculative,perhaps even wishful thinking. Some teams might consider this position to be unfair, but the auditors have considerableexperience that tells them to only count what is in the bank and not what is promised.
Another problem that teams have is that demand during quarters 5 and 6 fails to live up to expectations. The teams see thatdemand has jumped substantially between quarter 3 and quarter 4. They assume that the growth will continue into quarters 5and 6. What they fail to take into account is 1) the seasonal downturn in quarters 5 and 6, 2) much smaller marginalimprovement in their marketing decisions, and 3) better decisions by some competitors.
The seasonal downturn in demand is well documented in the software. However, many teams fail to head the warnings. Theyconnect the two dots on demand from quarter 3 to 4 and assume the line will continue upwards. Wrong assumption!
The problem with the reduced marginal success of marketing is harder to grasp or anticipate. The primary reason demandjumps so strongly from quarter 3 to quarter 4 is that all the teams make substantially better decisions in quarter 4. Theimprovement is due to the better information that is available to the �rm after the �rst quarter of test marketing. Analysis ofthe market data will help the marketers develop a better understanding of what the customers want and are willing to pay for.All the teams make many skillful adjustments that result in substantial demand increases.
However, from quarter 4 to 5, the teams do not make as many improvements in their decisions. They tend to continue whatthey did in quarter 4 because it was successful. Without a substantial improvement in brand designs, pricing, advertising, salesforce deployment, etc., demand will not improve by very much. Finally, some teams fail to anticipate unusually strong actions by competitors. If even one competitor signi�cantly drops price,expands brand selection, advertises aggressively, or hires lots of sales people, a team's demand may take a nosedive. This

10/4/2018 Help File
https://web5.marketplace-live.com/engine.php?tpl=help&instructorID=10353&sessionID=9c643fdc8c13b099d714380554bb28c1&quarter=9&langua… 89/99
drop in demand will probably result in signi�cant losses that, in turn, will reduce retained earnings that, in turn, will reduce theamount that the auditors will allow the team to invest. The only antidote is su�cient equity capital to survive the unexpectedlosses.
This is a common theme: teams run into problems because they tend to undercapitalize the �rm. For one reason or another,they do not take as much equity as they should, then something bad happens in the market and they are constrained fromful�lling their dreams. If you are to make a mistake, it should be in taking too much equity rather than not enough. There willalways be something that can be done with the extra funding.
Debt Funding
The determination of the amount of debt to take should be made after the equity decision is made. As argued before, debtcannot substitute for equity. If you start with the debt decision (usually because you want to avoid taking too much equity),then you will almost certainly run into �nancial di�culties later.
Here is the recommended procedure. First, determine the amount of equity required in the fashion outlined above. Do not betoo stingy in taking on equity; it will give you more freedom to deal with unexpected problems and opportunities.
Second, after the equity decisions have been entered into the tactical plan and imported into the cash �ow statement, checkthe ending cash position. If it is negative, then you may want to consider borrowing money in order to turn it positive.
The assumption here is that the �rm sold enough common stock to cover any losses that may occur. Thus, the negative cashis probably not due to lost income. It is probably due to an increase in assets. The most likely cause is an increase in �xedproduction capacity.
To illustrate, if your �rm decides to spend 2,000,000 to increase �xed production capacity, it is not treated as a current periodexpense. Rather, it is considered a long-term asset and is expensed over several quarters via a charge for depreciation. As aresult, your cash position is drawn down by 2,000,000 but this outlay does not show up in the retained earnings �gure. Thus, itwould not trigger an equity decision.
However, you have converted 2,000,000 from cash to an asset. Thus, the 2,000,000 disbursement does show up as a reductionin cash. So, if you have a cash shortage after you have taken all the equity you need to pay for any losses incurred, then youprobably need a loan equal to or greater than the negative cash amount. Actually, you will want to take out a loan that is greaterthan the negative cash �gure because you should build in a safety margin of several hundred thousand.
There is one other potential user of cash that would not trigger an equity investment but could require a loan. This is increasinginventories. If the �rm's ending inventories are large or growing, they will draw down on the �rm's cash reserves. Essentially,you are converting cash to inventory. Unusually large inventories result from either large safety stocks or overestimatingdemand. In any case, they will show up as a drain on cash and a negative cash position. Fortunately, large inventories canusually be sold off quickly and so the need is for short-term debt.
This raises the question of using short-term versus long-term debt. If your pro forma projections show a signi�cantimprovement in your ending cash position within one or two quarters, you may wish to consider short-term debt. On the otherhand, if the cash shortage lasts for several quarters, then you may wish to consider long-term debt.
The advantage of short-term debt is that it can be paid back. By paying down on the loan, interest is saved. In addition, it willreduce the total assets of the �rm (reducing unnecessary cash) which will improve asset turnover, which in turn, will improvethe balanced scorecard.
There is one disadvantage to short-term debt; it can be re-called by the bank if the �rm's net equity declines. And, a recalledloan could further hurt a �rm's ability to compete.
If you are expecting large, short-term losses, then long-term debt may be necessary in order to avoid the risk of having the banktake away some of your cash. If you think your strategy has a great deal of risk, then long-term debt may be your best choice.
The disadvantage of long-term debt is that you cannot pay it back quickly if you �nd yourself with plenty of cash in a laterquarter.
Typical Problems Stemming from Debt Decisions
The most frequent problem has already been discussed. That is, the assumption that debt can be used to cover losses. Manyparticipants feel that as long as they have cash (even if it is from a lending agency), they are in good �nancial shape. This isnot true.
The next most frequent problem is that a team will take out a short-term loan and then experience an unexpected decline inrevenue and pro�ts. A �rm's debt capacity in any quarter is determined by its net equity in the prior quarter. If a �rmexperienced a loss in the prior quarter, the loss will have reduced retained earnings, which, in turn, will have reduced debt

10/4/2018 Help File
https://web5.marketplace-live.com/engine.php?tpl=help&instructorID=10353&sessionID=9c643fdc8c13b099d714380554bb28c1&quarter=9&langua… 90/99
capacity. This, in turn, will cause the bank to call in part of the loan. And, this in turn, will worsen an already bad situation(unexpected losses, cash shortfalls). A long-term loan would eliminate this potentiality.
Unexpected losses are the largest cause of �nancial trouble for any �rm. Thus, it is prudent to do some worst-case planning. Itis recommended that you reduce the projected demand but keep all other expenses the same. Consider reductions of 20% to40%. This scenario will almost certainly result in large losses and large increases in inventory, both of which will result insubstantial reductions in available cash. Check your ending cash position and your retained earnings under this worst-casescenario. Will you have positive equity and positive cash? If not, think seriously about tempering you plans.
Finally, there are guidelines in the tactical plan to help make your debt decisions. Click on the "?" next to the loan options.
In conclusion, good strategy requires time and effort. You must consider all the possibilities, think every decision through to itslogical conclusion, and be willing to make many adjustments to "get it right." It is not easy to formulate a strategy that willachieve the desired goals and be within the resource capabilities of the �rm. Use the tactical plan and pro forma �nancialstatements to help you plan for the future and anticipate potential problems from the outset.

10/4/2018 Help File
https://web5.marketplace-live.com/engine.php?tpl=help&instructorID=10353&sessionID=9c643fdc8c13b099d714380554bb28c1&quarter=9&langua… 91/99
M. Balanced Scorecard
The balanced scorecard is the most important measure of your total performance. It provides a single number that can becompared between companies. As such, it is the main indicator for evaluating your performance in the market. It becomesavailable after the �rst quarter of sales.
The cumulative balanced scorecard provides the average of your performance over the past 4 quarters at most. It smooths outany spikes or dips in your performance and therefore re�ects your ability to perform, not in one particular quarter, but overtime.
Total Performance The Total Business Performance indicator is a quantitative measure of the executive team's ability to effectively manage theresources of the �rm. It considers both the historical performance of the �rm as well as how well the �rm is positioned tocompete in the future. As such, it measures the action potential of the �rm. The index employs what is called a balanced scorecard to measure the executive team's performance. The most importantmeasure is the team's �nancial performance, and thus its ability to create wealth for the investors. However, the focus oncurrent pro�ts has caused many executives to stress the present at the expense of the future. The long-term viability of the �rm requires that the executive team be good at managing not only the �rm's pro�tability, but alsoits marketing activities, production operations, human resources, cash, and �nancial resources. The management team mustalso invest in the future. These expenses might depress the current �nancial performance, but are vital to creating newproducts, markets, and manufacturing capabilities. In short, top managers must be good at managing all aspects of the �rm. The balanced scorecard puts this perspective intopractice. It focuses attention on multiple performance measures, and thus multiple decision areas. None can be ignored ordownplayed. The best managers will be strong in all areas measured. The Total Business Performance measure is computed by multiplying several indicators of business performance. This modelunderscores the importance of all measures. This is because any strength or weakness will have multiple effects on the �naloutcome, the Action Potential of the Firm. The following is a summary of the measure of the �rm's Total Business Performance and its key performance indicators. Thecomputational details follow. Note that a negative score in any of these indicators will result in a Total Performance of "0".
Total Performance = Financial Performance * Market Performance * Marketing Effectiveness * Investment in Future * Wealth* Human Resource Management * Asset Management * Manufacturing Productivity * Financial Risk
Financial Performance measures how well the executive team has been able to create pro�ts for its shareholders. Apositive number is always desired and the larger the better. It is computed in three steps. First, a measure of the company's pro�tability is computed by taking the average of your gross pro�t and your net pro�t fromoperations. The gross pro�t is the company's revenue minus the costs of making your products. It is computed subtracting rebates and thecost of the goods sold from total revenues. Gross pro�t measures how e�ciently you produce revenue. The net pro�t from operations is computed by taking the operating pro�t shown in the income statement and adding backinvestments in the future that are expensed in the current quarter. It measures how well the managers are able to createrevenue from the current quarter's marketing, sales and manufacturing activities. Note that the income statement also includes investments that will bene�t your �rm's future (referred to as 'Investment inFuture' in the balanced scorecard). Because these expenses will help you to create new business opportunities, they are addedback to the operating pro�t so that the �nancial performance measure is entirely focused on current quarter revenues andexpenses. Second, the total number of shares of stock is computed by adding all forms of equity investment. If an emergency loan hasbeen taken out, shares of stock will automatically be issued to the loan shark and they become a permanent part of the equity�nancing.

10/4/2018 Help File
https://web5.marketplace-live.com/engine.php?tpl=help&instructorID=10353&sessionID=9c643fdc8c13b099d714380554bb28c1&quarter=9&langua… 92/99
Third, the average of your gross pro�t and your net pro�t from current operations is divided by the number of shares of stockissued to determine the pro�tability per share of stock.
Financial Performance = (Net Pro�t from Current Operations + Gross Pro�t ) / 2 / Total Shares Issued
Net Pro�t from Current Operations = Operating Pro�t + Investments in Firm's Future
Operating Pro�t = Gross Pro�t - Total Expenses
Investments in Firm's Future = Cost to Open New Sales O�ces and Web Sales Centers + R&D Investment in New BrandFeatures and New brands + R&D Licenses + R&D to Improve Changeover + Quality Improvements + Depreciation
Total Shares Issued = Number of Shares Issued to Executive Team + Number of Shares Issued to Venture Capitalists +Number of Shares Issued to Loan Shark
Market Performance is a measure of how well the managers are able to create demand in their primary and secondarysegments. The �rm's market share in two target segments is used to measure this demand creation ability. The market sharescore is adjusted downwards if there were any stock-outs. This penalty for stock-outs is to underscore two points. First,unnecessary resources have been spent to generate more demand than can be satis�ed. Second, ill will has been created byhaving potential customers become frustrated when they do not �nd the products that they have been persuaded to buy. Thescore ranges from 0 to 1.0 and will depend upon the number of competitors. If there are 3 �rms, a good score would be greaterthan 0.5. If there are 8 teams, a good score would be greater than 0.35.
Market Performance = Average Market Share in Targeted Segments / 100 * Percent of Demand Actually Served / 100
Average Market Share in Targeted Segments = ( Market Share in Primary Segment + Market Share in Secondary Segment )/ 2
Percent of Demand Actually Served = ( ( Total Net Demand - Number of Stock-outs ) / Total Net Demand ) * 100
Marketing Effectiveness is a measure of how well the managers have been able to satisfy the needs of the customers asmeasured by the quality of their brands and ads. Customer perceptions of the �rm's brands and ads in its primary andsecondary segments are used to measure customer satisfaction. The two scores are then averaged to obtain the indicator formarketing effectiveness. The score ranges from 0 to 1.0. A good score would be greater than 0.8.
Marketing Effectiveness = ( Average Brand Judgment / 100 + Average Ad Judgment / 100 ) / 2
Average Brand Judgment = ( Highest Brand Judgment in Primary Segment + Highest Brand Judgment in SecondarySegment ) / 2
Average Ad Judgment = ( Highest Ad Judgment in Primary Segment + Highest Ad Judgment in Secondary Segment ) / 2
Investment in Future re�ects the willingness of the executive team to spend current revenues on future businessopportunities. They are necessary but risky. In the short-term, these expenditures can cause large negative pro�ts on theincome statement. As a result, the retained earnings may become highly negative, thus indicating that a substantial portion ofthe stockholder's investment has disappeared into the operations of the �rm. In the long-term, these investments areabsolutely necessary if the �rm is to be competitive. Thus, there is a need to balance the loss of stockholder's equity againstinvestments which could create even greater returns for the investors in the future. The score is always greater or equal to 1.0and a good score would be greater than 3.0.
Investment in Future = ( Cumulative Expenses that Bene�t Firm's Future / Cumulative Net Revenues ) * 10 + 1
Cumulative Expenses that Bene�t Firm's Future = Cumulative Cost to Open New Sales O�ces and Web Sales Centers +Cumulative R&D Investment in New Brand Features and New brands + Cumulative R&D Licenses + Cumulative R&D toImprove Changeover + Cumulative Quality Improvements + Cumulative Depreciation
Cumulative Net Revenues = Cumulative Sales Revenue - Cumulative Rebates
Wealth is a measure of how well the executive team has been able to add wealth to the initial investments of thestockholders. During the start-up phase of the company, it is expected that expenses will greatly exceed revenues leading tolarge losses and retained earnings �gures that are largely negative.

10/4/2018 Help File
https://web5.marketplace-live.com/engine.php?tpl=help&instructorID=10353&sessionID=9c643fdc8c13b099d714380554bb28c1&quarter=9&langua… 93/99
To compute the creation of wealth measure, the net equity of the �rm is �rst computed by adding the retained earnings to thetotal of the investments from all of the stockholders. The retained earnings �gure is the sum of all pro�ts from the inception ofthe �rm. As noted above, the retained earnings will be negative in the early quarters as the �rm invests money to start up andgrow the business. Next, the net equity is divided by the total of all equity investments to obtain a ratio of wealth creation. A value of zero or lessindicates bankruptcy. A value greater than zero and less than one indicates the executive team is relying upon the initialstockholder's investments to pay day-to-day expenses plus invest in the future. A value greater than one indicates the �rm isadding wealth to the stockholders.
Wealth = Net Equity / Total Stockholders Equity
Net Equity = Retained Earnings + Common Stock + Dividends Paid to Date
Total Stockholders Equity = Common Stock
Human Resource Management is a measure of how well the executive team is able to recruit the best employees, satisfytheir needs, and motivate them to excel. Sales force productivity and production worker productivity are averaged together toobtain a single score. High performance is only possible if the �rm's compensation packages are competitive and in tune withwhat is important to employees over time. The scores range from zero to 1.00 and a good score would be greater than 0.80.
Human Resource Management = ( Sales Force Productivity / 100 + Production Worker Productivity / 100 ) / 2
Asset Management is a measure of the executive team's ability to use the �rm's assets to create sales revenue. The �rststep in measuring asset management is to compute the asset turnover of the �rm. Effective managers are able to use theassets to create sales which are two or three times the value of the assets. Thus, a very good score would be 3.0. In addition to asset turnover, ending inventories are also measured and included. To avoid stock-outs, and their associatedpenalties, managers might be inclined to build excessive inventory. To discourage large ending inventories, there is a penaltyfor producing more inventory than is needed to meet demand. The penalty increases as the proportion of ending inventory toproduction increases. Note that a negative penalty for excess inventory will result in an Asset Management of "0".
Asset Management = Asset Turnover * Penalty for Excess Inventory
Asset Turnover = Net Revenues / Total Assets
Net Revenues = Sales Revenue - Rebates + Interest Income
Penalty for Excess Inventory = 1 - Ending Inventory / Production
Manufacturing Productivity measures the executive team's ability to e�ciently create reliable products. Reliable productsare a high priority of all customers and thus it is the �rst measure of manufacturing productivity. To achieve a reliablemanufacturing process, the managers will have to invest money to study and then improve upon the production processes. It isa multi-step process which takes time and considerable resources. The second measure of productivity focuses on how much of the operating capacity is actually used in production versus thatportion lost to changeover or excess capacity. Changeover can be improved by making investments which improve procedures,equipment and materials needed to switch from one component to the next. Excess capacity costs occur when the productionfacility is scheduled to produce more units than is needed to meet demand or stock the warehouse. Good forecasting andproduction scheduling will reduce penalties for excess capacity. The score ranges from 0.0 to 1.0. A very good score would be 0.80.
Manufacturing Productivity = ( Reliability Judgment / 100 ) * ( Percent of Operating Capacity Used in Production / 100 )
Percent of Operating Capacity Used in Production = ( Total Effective Operating Capacity Used / Operating CapacityScheduled ) * 100

10/4/2018 Help File
https://web5.marketplace-live.com/engine.php?tpl=help&instructorID=10353&sessionID=9c643fdc8c13b099d714380554bb28c1&quarter=9&langua… 94/99
Financial Risk measures the executive team's ability to manage debt as a �nancial resource. The �nancial risk indicator isbased upon the degree to which debt is part of the capital of the �rm. As debt increases relative to the total capital, then the�nancial risk associated with the company increases. Conversely, as the proportion of equity in the total capital increases, thenthe perceived �nancial risk in the �rm decreases. To compute �nancial risk, the proportion of equity is obtained by computing the amount of equity in the �rm and dividing it bythe amount of capital invested in the �rm from all sources. Speci�cally, the amount of equity is equal to the sum of commonstock plus retained earnings. The amount of capital is equal to the sum of debt plus common stock plus retained earnings. Asthe ratio of equity to capital decreases (meaning more debt), then �nancial risk increases. A value of 1.00 would indicate there is no debt and, therefore, no perceived �nancial risk. It is important to realize that �nancial managers do not want to totally discourage debt. The optimum capital structure will varyby �rm depending on its tax situation, overall risk, asset base, and �nancial slack. Some debt may be desirable in order to helpthe �rm take advantage of value enhancing business opportunities (i.e., opportunities that earn more than the company'sweighted average cost of capital). In order to mitigate or downplay the effect of low amounts of debt in the capital structure, the value for the share of equity inthe company is raised to a power of 0.5 (square root). Thus, if debt represented 20% of the capital structure, then the Financialrisk indicator would be 0.89 (0.80 ^ 0.5). If debt were 50% of the capital structure, the Financial Risk indicator would be 0.71. A Financial Risk indicator below 0.80 (more than 36% debt) would be considered unfavorable.
Financial Risk = ( Total Equity / Total Capital ) ^ 0.5
Total Equity = Common Stock + Retained Earnings
Total Capital = Common Stock + Retained Earnings + Debt

10/4/2018 Help File
https://web5.marketplace-live.com/engine.php?tpl=help&instructorID=10353&sessionID=9c643fdc8c13b099d714380554bb28c1&quarter=9&langua… 95/99
N. Glossary
1. Brand Components2. Fatal Errors
Brand Components
Essentials
Base components are hardware components to which all other hardware features are connected. This includes themain circuit board, video and sound adapters, memory chips, internal wiring, external ports, speaker and other features.
Case
Standard desktop encasement is a basic rectangular shaped tower case for a desktop model computer.Slim desktop encasement is a rectangular shaped tower case for a desktop model computer with lower width pro�lethan a standard case.Slim stylish desktop encasement is a stylishly shaped and contoured tower case for a desktop model computer withlower width pro�le than a standard case.Standard laptop encasement is a �at, rectangular shaped laptop case for a portable model computer.Slim laptop encasement is a �at, rectangular shaped laptop case for a portable model computer with lower heightpro�le than a standard case.Slim stylish laptop encasement is a �at, stylishly shaped and contoured laptop case for a portable model computer withlower height pro�le than a standard case.
Rewritable optical drive
DVD RW drive is a component that enables users to write large amounts of data onto inexpensive DVD RW disks.Hi speed/density DVD RW drive allows the user to write data onto DVD RW disks faster than with the standard drive. It isalso capable of storing more data on each disk when special high density disks are used.
Hard drive
Standard hard drive is a hardware component that allows the computer to store digital data.High capacity hard drive is a hardware component with greater storage capacity compared to a standard hard drive. Itusually describes a set of two disk drives.Ultra capacity hard drive is a hardware component with greater storage capacity compared to a high capacity harddrive. It usually represents three disk drives for maximum storage capacity.Fail-proof ultra capacity hard drive provides the same storage capacity as the ultra capacity hard drive and it offersbetter protection against the loss of data.
O�ce software
O�ce software - Lite provides basic functionality for manipulating text and spreadsheet documents for reading andediting, including formatting, arithmetic and graphing functions as well as other features.O�ce software - Professional provides full functionality for manipulating text and spreadsheet documents for readingand editing, including formatting, arithmetic and graphing functions as well as other advanced features.O�ce software - Professional upgrade contains all the functionality of the previous version in an updated format, plusadds several new features.
Other software
Business graphics software allows users to create advanced graphical demonstrations and animations. It includesfunctions for importing data from other o�ce applications and for publishing for the web.Presentation software allows users to create stylized slide shows and reports. It includes functions for creating chartsand graphs from scratch or by importing the data from a spreadsheet application.Database software allows the users to store, modify and organize large sets of data, extract information and present itin a variety of formats.Bookkeeping/budgeting software allows users to manage business accounting and �nance information.

10/4/2018 Help File
https://web5.marketplace-live.com/engine.php?tpl=help&instructorID=10353&sessionID=9c643fdc8c13b099d714380554bb28c1&quarter=9&langua… 96/99
Web Design software enables users to design, implement and maintain visually appealing websites and webapplications.Statistical analysis software enables users to obtain the results of standard statistical procedures without the need oflow-level numerical programming.Engineering design software allows users to create, edit, and navigate three dimensional models and surfaces as visualimages in the design process, and translate them into scienti�c documents.Manufacturing control software allows users to monitor, direct and adjust manufacturing and inventory processeswithin a factory.Game programs allow the computer to run electronic versions of several board and arcade games.Security suite helps protect the computer from malicious programs such as viruses and spyware or Internet threats thatcan destroy user's data or compromise personal information.
Monitor
17 inch standard monitor for desktop computer is an output device that allows the operator to interface with thecomputer through a visual display of data.19 inch standard monitor for desktop is an output device that allows the operator to interface with the computerthrough a visual display of data.21 inch high resolution monitor for desktop is an output device that allows the operator to interface with the computerthrough a visual display of data with �ner visual quality.23 inch high resolution monitor for desktop is an output device that allows the operator to interface with the computerthrough a visual display of data with �ner visual quality.32 inch wide screen monitor for desktop provides a large display area that allows the operator to view many differentapplications on the screen at the same time.14 inch standard monitor for laptop is an output device that allows the operator to interface with the computer througha visual display of data.17 inch advanced monitor for laptop is an output device that allows the operator to interface with the computer througha visual display of data with �ner level of visual quality.
Computing power
Budget computing power describes a basic central processing unit managing and performing data processingoperations.Mid-range computing power describes a central processing unit capable of managing data faster than a budgetcomputing power component.High speed computing power describes a central processing unit capable of managing data faster than a mid-rangecomputing power component.Ultra-fast computing power describes a central processing unit with advanced architecture capable of managing datafaster than a high speed computing power component.Massive computing power component describes a central processing unit with advanced architecture capable ofmanaging data faster than an ultra-fast computing power component.
Keyboard & mouse
Standard keyboard is an input device that allows the operator to enter data in the computer through a set of typewriter-like keys.Expanded keyboard is an input device that contains the standard key set plus 15 additional special-function keys and 10programmable hot keys.High comfort keyboard is an input device that contains the standard key set with ergonomic design and padded wristrest to reduce physical stress on the user.
Special features
Expansion slots allow users to connect a variety of external devices to the personal computer thus allowing it toperform highly customized tasks and special functions.Auto backup system is an external component that wirelessly connects to a computer and automatically backs up data.It is used to restore data in case of hard drive failure or operator error.Uninterruptible power supply is an external unit that keeps the computer running for a short time when the primarypower source is lost. It signals the power loss and allows users to save data before the computer shuts down.GPS navigation/locator is a satellite-based radio-navigation system that allows users to determine their locationanywhere in the world. It can provide navigation during travel or help locate a lost or stolen computer.Video conferencing system consists of a built-in camera, microphone and software that allows users to establish avideo conference call with another user with similar capabilities.

10/4/2018 Help File
https://web5.marketplace-live.com/engine.php?tpl=help&instructorID=10353&sessionID=9c643fdc8c13b099d714380554bb28c1&quarter=9&langua… 97/99
Finger-print secure access device consists of a small built-in �nger print scanner and software that allows users to use�ngerprint authentication instead of a password to log in to the computer.Touch screen allows user to control the computer via tapping directly on the monitor screen. It serves as an alternativeto keyboard and mouse input devices.
Networking
Standard networking describes a device that enables a computer to connect to a network and/or the Internet.High speed networking describes a device that enables a computer to connect to a network and/or the Internet allowinga faster data transfer than a standard networking component.Global high speed wireless networking describes a device that enables a computer to connect to a network and/or theInternet from anywhere in the world. The device allows a faster data transfer than a standard networking component.
Battery
Standard battery allows portable computers to run for relatively short periods of time without access to an electricalsource.Long life battery allows portable computers to run for extended periods of time without access to an electrical source.
Operating system
Operating system is a system of programs that manage the computer's resources, data �les, keyboard, screen and otherdevices, as well as execution of all custom applications. The basic edition provides limited functionality.Operating system for professionals provides advanced functionality that enables users to customize their workexperience, connect to more custom devices, more e�ciently share data with other users, and remotely access theirdata and applications.Operating system - Basic edition with ease of use enhancement provides the same functionality as the Basic edition butwith a redesigned interface that greatly improves the ease of use.Operating system - Professional edition with ease of use enhancement provides the same advanced functionality as theOS for Professionals but with a redesigned interface that greatly improves the ease of use.Operating system - Professional edition with hi-tech enhancement allows the computer to more e�ciently handle largescale technical tasks with improved performance for engineering and manufacturing control applications.
Fatal Errors
As you begin to compete in the Marketplace, you will �nd that your auditor will impose a number of limitations on yourdecisions. These constraints will be listed in the Final Check link at the end of your decisions. Unless you correct all fatalerrors, you will not be able to wrap up your decisions.
The following table indicates the limitations that you can expect in each quarter of play. These constraints will keep you in asafe zone until you get more experience. As you will note, in later quarters, the constraints imposed by the auditor will graduallybe released.
Fatal errors overview over all game quarters
FINAL CHECKFATAL ERRORS
Quarter 1
Quarter 2
Quarter 3
Quarter 4
Quarter 5
Quarter 6
Quarter 7
Quarter 8
Limit on number ofnew sales o�ces
(max: 2 saleso�ces per quarter)
x x
Limit on number ofnew web centers(max 1 web sales
center per quarter)
x x
Limit on number ofsales people (7 or

10/4/2018 Help File
https://web5.marketplace-live.com/engine.php?tpl=help&instructorID=10353&sessionID=9c643fdc8c13b099d714380554bb28c1&quarter=9&langua… 98/99
less)x
Limit on number ofweb sales people (7
or less) x
Limit to 2 brandfeatures R&D
projects x
Brand price minusrebate must be
greater than 1,300 x x x x x x
Brand price must beless than 8,500 x x x x x x
Target inventorycannot be greater
than 6,000 x x x x x x
Limit on advertisingexpenditures Q3: 150,000 Q4: 300,000
x x
Limit on spendingfor brand feature
R&D and new salesoutlets must be less
than 90% of netequity (commonstock + retained
earnings)
x x x x
Limit on debtcapacity (based onprevious quarter's
balance sheet + newequity in current
quarter)
x x x x
Due to the high riskin designing good
brands in this earlystage of the market,the external auditorhas placed a limiton your operating
capacity. Operatingcapacity cannot
exceed the numberof salespeople in all
x x

10/4/2018 Help File
https://web5.marketplace-live.com/engine.php?tpl=help&instructorID=10353&sessionID=9c643fdc8c13b099d714380554bb28c1&quarter=9&langua… 99/99
of your sales outletstimes 200.
In order to avoid anemergency loan, the
external auditorrequires that yourcash balance mustbe greater or equal
to one (1). If it isnot, you may need
to reduceexpenditures for�xed capacity or
sales outlets or takemoney out of the
CD.
x x
Limit on how much�xed capacity can
be added (maximum50 units/day in each
indicated quarter)
x x
Other limitations (valid for the entire game): - You cannot have more than 40 brands. - You cannot have more than 25 differently designed advertisements. - Any new salary you set must be at least 1/3 of the previous quarter's salary. - Any new salary you set must be less than twice last quarter's salary. - In any quarter, you cannot increase your operating capacity by more than 400 units/day (even if you have su�cient �xedcapacity).