Population Genetic Structure of Vallisneria americana, a Dioecious Clonal Macrophyte
Upload
khangminh22Category
view
0download
0
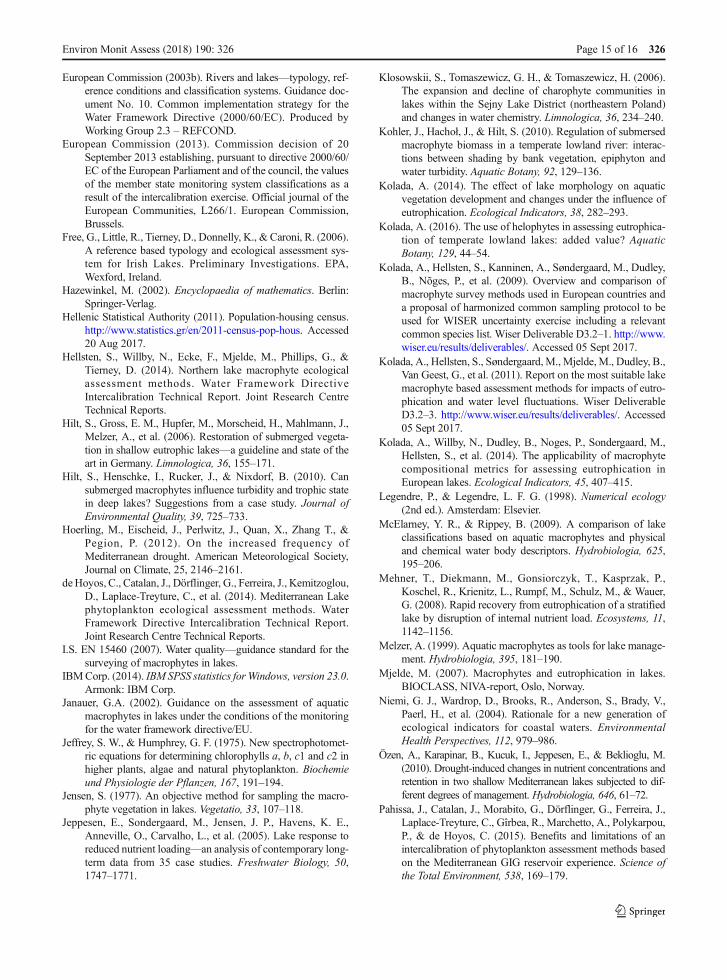
HeLM: a macrophyte-based method for monitoringand assessment of Greek lakes
Dimitrios Zervas & Vasiliki Tsiaoussi &Ioannis Tsiripidis
Received: 6 November 2017 /Accepted: 26 April 2018 /Published online: 5 May 2018# The Author(s) 2018
Abstract The Water Framework Directive (WFD) re-quires Member States to develop appropriate assess-ment methods for the classification of the ecologicalstatus of their surface waters. Mediterranean region haslagged behind in this task, so we propose here the firstdeveloped method for Greek lakes, Hellenic Lake Mac-rophyte (HeLM) assessment method. This method isbased on two metrics, a modified trophic index andmaximum colonization depth Cmax that quantify thedegree of changes in lake macrophytic vegetation, as aresponse to eutrophication and general degradationpressures. The method was developed on the basis of adata set sampled from 272 monitoring transects in 16Greek lakes. Sites from three lakes were selected aspotential reference sites by using a screening process.Ecological quality ratios were calculated for each metricand for each lake, and ecological status class boundarieswere defined. For the evaluation of effectiveness of themethod, the correlations between individual metrics andfinal HeLM values and common pressure indicators,
such as total phosphorus, chlorophyll a and Secchidepth, were tested and found highly significant andrelatively strong. In addition, the ability of HeLM valuesand its individual metrics to distinguish between differ-ent macrophytic communities’ structure was checkedusing aquatic plant life-forms and found satisfactory.The HeLM method gave a reliable assessment of themacrophytic vegetation’s condition in Greek lakes andmay constitute a useful tool for the classification ofecological status of other Mediterranean lakes.
Keywords Macrophytes . Greek lakes . Ecologicalstatus . Reference conditions . Class boundaries .WaterFrameworkDirective
Introduction
The Water Framework Directive (WFD; EuropeanCommission 2000) supervises the monitoring and as-sessment of the ecological status of surface waters with-in the EU. One of the main aims of the Directive is thedevelopment of ecological assessment methods for dif-ferent groups of organisms (biological quality elements(BQEs), i.e., phytoplankton, macrophytes andphytobenthos, macroinvertebrates, fish) for aquatic eco-systems (lakes, rivers, transitional waters, and coastalwaters) (European Commission 2003a). These methodsneed to classify the ecological status of surface waters ata five-level ecological classification scheme, indicatingthe degree of deviation from reference conditions(European Commission 2003a).
Environ Monit Assess (2018) 190: 326https://doi.org/10.1007/s10661-018-6708-1
Electronic supplementary material The online version of thisarticle (https://doi.org/10.1007/s10661-018-6708-1) containssupplementary material, which is available to authorized users.
D. Zervas :V. TsiaoussiThe Goulandris Natural History Museum - Greek Biotope /Wetland Centre, 14th km Thessaloniki-Mihaniona, Thermi,P.O. Box 60394, 57001 Thessaloniki, Greece
D. Zervas (*) : I. TsiripidisDepartment of Botany, School of Biology, Aristotle University ofThessaloniki, GR-54124 Thessaloniki, Greecee-mail: [email protected]

Aquatic macrophytes are commonly used in classifi-cation systems in lakes as they play a significant role indetermining the structure and functions of lake ecosys-tems, by altering environmental conditions, nutrient cy-cling, biotic assemblages, and interactions (Engelhardtand Ritchie 2001; Spoljar et al. 2017; Wang et al. 2009).Moreover, their time of response to changes in nutrientconditions in a water body lies between the fast-responsive phytoplankton and phytobenthos organismsand the slow-responsive invertebrates and fish, whichmakes them valuable bioindicators, when monitoringthe ecological quality of water bodies (Pall and Moser2009; Penning et al. 2008a, b; Schneider and Melzer2003). Sunlight penetration and availability are impor-tant factors for the development of submerged macro-phytes and explain greater than half of the variation inmacrophyte composition and abundance (De Boer2007). Loss of macrophytic vegetation has been expe-rienced in many lakes around the world during the lastcentury due to the increase in the availability of nutrientsin the water column that led to a rapid growth of phyto-plankton, which in turn caused an increase in waterturbidity and a decrease in sunlight penetration andavailability (Blindow et al. 2006; Hilt et al. 2006).
After the publication of WFD, most Member States(MS) have focused efforts to develop WFD-compliantaquatic macrophyte methods to assess the ecologicalstatus of lakes (Birk et al. 2012; Poikane et al. 2015).However, there are still gaps in the Mediterranean re-gion, as a reflection of different monitoring traditions incomparison to Central and Northern European countries(Birk et al. 2012). More specifically, with regard tonatural lakes, MS in the Mediterranean region encoun-tered difficulties in the development of their ecologicalassessment methods due to the small number and highvariability of natural lakes, as well as the limited dataavailability (Poikane et al. 2015). Another importantreason for this time-lag in the monitoring and assess-ment research in the Mediterranean region is the sub-stantial differences between warm Mediterranean lakesand colder temperate ones (Alvarez Cobelas et al. 2005;Beklioglu et al. 2007). The Mediterranean climate ischaracterized by a strong seasonality of rainfall and airtemperature, whereas rainfall occurs mostly in springand autumn (Alvarez Cobelas et al. 2005). According toHoerling et al. (2012), the land area surrounding theMediterranean Sea has experienced 10 of the 12 driestwinters since 1902 in just the last 20 years. Correspond-ingly, water shortages and droughts are not uncommon
in many Mediterranean areas. As a result, Mediterra-nean lakes experience continuous intra-annual and inter-annual water-level fluctuations which render them atype of aquatic ecosystems under constant alterations(Özen et al. 2010). All the above add to the necessity forthe development of a complete lake assessment methodbased on aquatic macrophytes for the Mediterraneanregion.
In this study, we overcome this gap and we presentthe newly developed ecological assessment methodnamed as Hellenic Lake Macrophyte assessment meth-od (HeLM) for classification of Greek lakes. In partic-ular, the development of this method was grounded in(a) the collection of macrophyte and environmental datafrom natural lakes of the Greek National Water Moni-toring Network, (b) the definition of type-specific refer-ence conditions for aquatic macrophytes, (c) the use ofappropriate metrics to calculate the deviation of eachlake’s ecological status from reference conditions, and(d) the setting of status class boundaries. The result is anassessment method that can address changes in theecological status of lakes due to eutrophication andgeneral degradation pressures, in compliance withWFD requirements.
The aims of this study are (a) to describe the rationaleand the application of the HeLM method, (b) to test itseffectiveness to assess the ecological status of Greeknatural lakes, and (c) to discuss its limitations and needsfor further improvements in the future.
Materials and methods
Study area
The Greek National Water Monitoring Network becameoperational in 2012. In total, 50 lake water bodies (in-cluding 24 natural lakes and 26 reservoirs) have beenincluded in the network. Sixteen lakes have been mon-itored for aquaticmacrophytes during 2013–2015 (Fig. 1and Table 1). According to ETC/ICM (2015), they allbelong into the Mediterranean lake types. In particular,eight of them are warm monomictic, deep natural lakeswith mean depth > 9 m (national type GR-DNL) andeight are polymictic, shallow natural lakes with meandepth 3–9 m (national type GR-SNL). From the eightGR-DNL type lakes, Feneos lake (no. 15) is a reservoirconstructed for irrigation purposes. However, since theirrigation network has not been constructed, water level
326 Page 2 of 16 Environ Monit Assess (2018) 190: 326

fluctuates only due to natural conditions; therefore, aspecies-rich and abundant aquatic vegetation has been
developed to such an extent that lake Feneos resemblesecologically a natural lake.
Fig. 1 Lakes in the GreekNational Water MonitoringNetwork for which macrophyticdata were acquired. See Table 1for lake names
Table 1 Sampling period and number of transects established for the investigation of the macrophytic vegetation, in the 16 lakes of theGreek National Monitoring Network
No. Lake Abbreviation Type No. of transects Sampling period
1 Volvi VOL GR-DNL 20 September 2013
2 Doirani* DOI GR-SNL 10 August 2013
3 Vegoritida VEG GR-DNL 20 August 2013
4 Zazari ZAZ GR-SNL 12 August 2015
5 Kastoria KAS GR-SNL 20 August 2014
6 Megali Prespa* MEP GR-DNL 12 August 2015
7 Mikri Prespa* MIP GR-SNL 15 August 2015
8 Pamvotida PAM GR-SNL 20 September 2013
9 Amvrakia AMV GR-DNL 20 June 2014
10 Ozeros OZE GR-SNL 20 June 2014
11 Lysimachia LYS GR-SNL 20 June 2014
12 Trichonida TRI GR-DNL 20 July 2015
13 Paralimni PAR GR-SNL 19 July 2014
14 Yliki YLI GR-DNL 20 July 2014
15 Feneos FEN GR-DNL 10 August 2014
16 Kourna KOU GR-DNL 14 May 2014
Total 16 lakes 2 types 272 3-year period
GR-DNL type are warm monomictic, deep natural lakes with mean depth > 9 m while GR-SNL type are polymictic, shallow natural lakeswith mean depth 3–9 m. Transboundary lakes that only the part of their surface area in Greece was surveyed are marked with asterisks
Environ Monit Assess (2018) 190: 326 Page 3 of 16 326

Sampling
In all 16 lakes, the belt transect-mapping method wasapplied. It is the most commonly applied method foraquatic vegetation surveys and monitoring in manyEuropean countries and it is also recommended by theEuropean Committee for Standardization (CEN), as itprovides at the same time abundance, frequency, anddepth distribution data of different species in a lake(Kolada et al. 2009).
The number and location of transects were selectedusing the Jensen’s method (1977), bathymetric data,habitat maps, and land use maps for the lakes and theircatchment area. Four different groups of riparian habitattypes were distinguished around each lake, using theclassification scheme of XP T90–328 (2010) Standard.In each group, at least three transects were established.This number was increased in cases of high variability(e.g., ecological, morphological, hydrological reasons)within each group of riparian habitat types. The finalnumber of transects in each lake ranged from 10 to 20.In total, 272 transects were established (Table 1).
Sampling within each transect followed the guide-lines proposed by I.S. EN 15460 (2007) and Koladaet al. (2009). Transects were perpendicular to the lakeshoreline and represented a strip area from the shorelineto the maximum depth of plant growth. The strip areahad a width of ca. 5 m to enable boat maneuvering andthe handling of the sampling tools. Sampling was con-ducted in five depth zones: 0–1, 1–2, 2–4, 4–8 m, and >8 m (Janauer 2002) by means of a double-headed rakewith a scaled handle or attached to a rope, a bathyscope,and a geo-bathymetric device. In each depth zone, fiveplots, evenly distributed along the increasing depth gra-dient, were sampled. All angiosperms (helophytes, hy-drophytes, amphiphytes, and aquatic forms of land spe-cies), pteridophytes, bryophytes, charophytes, and othergreen filamentous macroalgae (e.g., Cladophora spp.)were recorded in each plot, and their abundance wasestimated by using the semi-quantitative five-pointDAFOR scale (Palmer et al. 1992). Angiosperms, pte-ridophytes, bryophytes, and charophytes were deter-mined to the species or subspecies level by using suit-able floras and identification keys (Online Resource,Supplement 1).
Furthermore, for each transect, the maximum coloni-zation depth of aquatic macrophytes (Cmax) was record-ed. To ensure its proper measurement, at the end of eachtransect, more than one plots with no vegetation were
sampled. At each lake, three transects with larger Cmax
values were revisited annually during the 3-year period.Thus, 36 transects were revisited, and in total, 308measurements of Cmax at transect level were made.
Environmental data indicating eutrophication pres-sure were also collected during the 3-year samplingperiod. In each lake, two to three monthly samples forchlorophyll a (CHLA) and Secchi depth (SD) measure-ments were taken during each summer season (June toAugust). Samplings for total phosphorus (TP) wereseasonal for each year. Water samples were taken atthe deepest part of the lakes, from the euphotic zone(2.5 × SD depth) by using either an integrated-type or aNansen-type sampler (de Hoyos et al. 2014). TP wasdetermined with persulfate digestion (Rice et al. 2012)and CHLA by using 90% acetone and applying thetrichromatic equation (Rice et al. 2012; Jeffrey andHumphrey 1975). Land use data for the catchment areaof each lake was acquired by Corine Land Cover (CLC)2012, version 18.5.1 (Copernicus Service–Pan-Europe-an Component 2012). Population data were acquired bythe 2011 Population-Housing Census (HellenicStatistical Authority 2011).
Development of the HeLM assessment method
Rationale for metric selection
According to WFD requirements, ecological status as-sessment based on aquatic macrophytes should take intoconsideration both their taxonomic composition andabundance (European Commission 2000). Existing tax-onomic composition metrics vary from simple ones,such as diversity indices (total number of taxa or numberof submerged taxa, etc.), proportions of different func-tional groups of species (relative coverage ofcharophytes, isoetids, etc.), to more complex ones basedon each species’ sensitivity to disturbance representedby scores, such as trophic indices, indicator species, andsensitive/tolerant taxa (Birk 2010; Birk et al. 2012;Poikane et al. 2015). For the measurement of abun-dance, the most widely used metric is Cmax, whichsimply expresses the maximum observed depth of a lakewhere submerged rooted macrophytes are present (Birk2010; Poikane et al. 2015). Cmax is considered as a veryuseful measure of total macrophyte abundance in lakes,being tightly connected to water transparency and thusto trophic state (Pall and Moser 2009). It respondsquickly to changes of water quality (Mehner et al.
326 Page 4 of 16 Environ Monit Assess (2018) 190: 326

2008) and its assessment is quite unbiased (Willby et al.2009).Cmax values can range from zero meters in hyper-eutrophic lakes with no submerged aquatic vegetation tomany meters of depth in oligotrophic lakes with exten-sively developed submerged vegetation. In very shallowlakes, where there is not a depth limit of macrophyticgrowth, the relative mean percent of macrophyte cover-age of total lake area is used instead (Birk 2010; Kolada2014; Poikane et al. 2015).
The response of the most common macrophyte met-rics in eutrophication gradients in lakes was exploredand tested by Dudley et al. (2011), Kolada et al. (2011),and Kolada et al. (2014). Their results signified thatindices based on trophic scores perform better, withthe Intercalibration Common Metric for lake macro-phytes (ICMLM) being the best performer, followed byEllenberg Index (EI). Species richness metrics (numberof taxa and number of submerged taxa) respondedweakly to eutrophication gradients, while the metricsbased on proportions of functional groups respondeddifferently in ecosystems of lower and higher trophy,weakening their diagnostic value. For the abundancemetrics, it was found that both Cmax and the coverageof aquatic macrophytes respond significantly to eutro-phication stressors. The former metric was recommend-ed for use in lakes with mean depth > 3 m and the latterin very shallow lakes (mean depth < 3 m) (Kolada et al.2011; Kolada 2014).
During the development of the HeLM assessmentmethod, we tested the above-mentioned metrics in var-ious combinations, for their response to eutrophicationpressure with data from the Greek Monitoring Network.We found that ICMLM and Cmax were the best-performing ones; thus, HeLM assessment method wasdesigned using these two metric components.
Trophic index HeLM
The trophic index metric HeLM (TIHeLM) we appliedis a modified form of ICMLM, which is based on taxon-specific trophic scores (lake trophic ranks (LTRs)), orig-inally developed for the purpose of the WFD intercali-bration exercise for lakes (Hellsten et al. 2014; Koladaet al. 2011, 2014). ICMLM had to be modified in order tobe more effective in evaluating the eutrophication pres-sure in Mediterranean-type lakes. Three modificationswere made concerning the calculation of (a) the LTRsfor taxa not included in Kolada et al. (2011, 2014), (b)the weighted average of LTRs per transect by using
species cover as weight, and (c) the trophic index ofeach lake by averaging the corresponding index valuesof the transects sampled in the lake.
In Kolada et al. (2011, 2014), there were LTR scoresfor 43 taxa out of the 92 recorded in the 16 Greek lakes.Most of the taxa not included were helophytes, which insome cases were the only representatives of macrophyt-ic vegetation in eutrophic and degraded lakes. Thesetaxa provide reliable information on ecosystem ecolog-ical conditions and can support assessment of the eco-logical status of lakes under eutrophication pressure(Alahuhta et al. 2012; Kolada 2014, 2016). Moreover,the inclusion of helophytes is recommended since theassessment of eutrophication seems to be more reliablewhen more scored taxa are considered (Kolada 2014;Kolada et al. 2011). So, following the method used byKolada et al. (2011, 2014), the missing LTRs wereestimated from the regression equation between LTRvalues and the indicator values of Ellenberg for nutrientsN (Ellenberg 1988; Ellenberg et al. 1991): LTR =1.395N − 0.6276 (R2 = 0.64, n = 98, p < 0.0001). At thecurrent state, LTR scores for macrophytic taxa, as cal-culated during the pan-European intercalibration exer-cise, were used due to lack of available data for thedevelopment of a Mediterranean or a Greek specifictaxa list. The other two modifications were made tooptimize the ICMLM metric. Cover-abundance valuesand metric calculations per transect are commonly usedin calculations of trophic indices in otherMS assessmentmethods (Hellsten et al. 2014; Pall et al. 2014; Portieljeet al. 2014). For the calculation of the weighted averageof LTR values per transect, the LTR value of each taxonwas multiplied with its relative abundance within thetransect. The latter was calculated after transforming theordinal values of DAFOR scale to percentage covervalues on the basis of the following correspondence:dominant = 87.5%, abundant = 50%, frequent = 17.5%,occasional = 5.5%, and rare = 0.5%, and raising the per-centage cover values to the power 0.2, to avoid a highweight of dominant taxa in the index. Finally, aTIHeLM value for each lake was calculated by averag-ing the TIHeLM values of the transects sampled in thelake.
Maximum depth of colonization (Cmax)
All 16 lakes in the current data set have mean depthabove 3 m, so Cmax was chosen as the best availablemacrophytic abundance metric (Kolada 2014; Kolada
Environ Monit Assess (2018) 190: 326 Page 5 of 16 326

et al. 2011, 2014). As Kolada et al. (2011, 2014)remarked, Cmax is subject to annual variations, whichshould be taken into account to reduce the risk ofmisclassification of a lake. For that reason, the valuethat we used in the HeLM assessment method for eachlake was the mean average of annual Cmax values mea-sured in the 3-year period.
Establishment of type-specific reference conditions
Establishment of reference conditions for BQEs is cru-cial to ecological assessment of surface water bodies, astheir ecological status is determined by their degree ofdeviation from these conditions. Sites in reference con-ditions do not equate to water bodies in pristine state.They are defined as those expected in natural or near-natural state, with no or minimal disturbance and withhuman pressure resulting in minor effects on biologicalelements (European Commission 2003b).
Reference conditions for HeLM assessment methodwere based on existing near-natural reference sites, withthe application of appropriate pressure criteria (e.g.,European Commission 2003b; Poikane et al. 2015):
& Total phosphorus concentration (TP) calculated asmean annual value,
& Chlorophyll a concentration (CHLA) calculated asmean summer value (June–August),
& Secchi depth (SD) calculated as mean summer value(June–August),
& Artificial land use (ALU), composed of the sum ofpercent cover of all the categories of CLC belongingto class 1 (urban areas continuous and discontinu-ous, industrial and commercial zones, communica-tion infrastructures and networks, mines, etc.) in thecatchment area,
& Intensive agriculture (IA), composed of the sum ofpercent cover of CLC categories corresponding to ahigh potential impact from agricultural activities(arable and irrigated land, permanent and annualcrops, vineyards, orchards, olive groves, complexcultivation patterns; CLC codes 2.1, 2.2, 2.41, 2.4.2)in the catchment area,
& Natural and semi-natural land use (NASN), com-posed of the sum of percent cover of forest andnatural areas, wetlands, and water bodies (CLCcodes 3.1.1, 3.1.2, 3.1.3, 3.2, 3.3, 4, and 5) in thecatchment area,
& Population density (PD), calculated as inhabitantsper square kilometer (h/km2) in the catchment area.
Many of these pressure criteria may be correlatedstrongly to each other, but applying all of them simulta-neously is expected to give a better filtering of low-impacted and thus potential reference sites. For eachone of them, a threshold value has been determined(Table 2), for accepting or rejecting a site as a potentialreference one, similar to the ones set in MediterraneanMS (e.g., Pahissa et al. 2015). If a site fails even in oneof these pressure criteria, then it cannot be considered asa reference site.
After the initial screening on the basis of pressurecriteria, an extra step of filtering was applied, in order todisqualify sites that deviate significantly (outlier values)from those expected under reference conditions. Suchdeviations could be found for sites with no apparentanthropogenic pressures, but with restricted macrophytedevelopment due to extreme natural landscape parame-ters (e.g., substrate restrictions, extreme inclination).Sites that qualified for both stages of the screeningprocess were considered to represent reference condi-tions and were used in the ecological status class bound-ary setting procedure.
Ecological status class boundary setting procedure
Reference values and ecological status class boundariesfor TIHeLM and Cmax were calculated as recommendedby REFCOND (European Commission 2003b). ForTIHeLM, common class boundaries for both nationallake types (GR-DNL and GR-SNL) were established,since taxonomic composition was not affected by theirdifference in maximum depth (there were no deep lakespecific taxa and no more depth zone divisions after 8 mof depth). Different class boundaries were calculated forCmax, since the potential maximum colonization depthin GR-SNLs is limited by their maximum depth, incontrast to GR-DNLs which do not have this limitation.
Reference values for both TIHeLM and Cmax metricswere determined as the median values in the selectedreference sites. Subsequently, each lake’s metric valueswere transformed to ecological quality ratios (EQRs) bydividing them by those reference values. In order todetermine a high/good (H/G) class boundary for eachmetric, the 90th percentile (P90) of the distribution of itsvalues in the selected reference sites was used(European Commission 2003b). To determine good/
326 Page 6 of 16 Environ Monit Assess (2018) 190: 326

moderate (G/M) class boundaries, we followed theresulting TP range adopted for the Mediterranean As-sessment System for Phytoplankton NMASRP (deHoyos et al. 2014; Pahissa et al. 2015). We also assessedthis range’s relevance with our data by checking thechanges in aquatic plant life-forms predominance andcomposition/abundance metrics along the eutrophica-tion gradient. This TP range was found to correspondto the transition point from submerged-dominated tohelophyte-dominated macrophytic communities (On-line Resource, Supplement 2) and to the space beforethe metrics cross-over point (which is associated withmoderate ecological status sites) in a paired metric anal-ysis between TIHeLM, Cmax, and TP (Online Resource,Supplement 3). Thus, G/M class boundaries were deter-mined at 75th percentile (P75) of the distribution of eachmetric’s values, in sites that belong to the 20–50-μg/LTP group (de Hoyos et al. 2014). For the remaining classboundaries, the EQRs ranging from below the G/Mclass boundary to their minimum values were equallydivided to form the moderate/poor (M/P) class boundaryand poor/bad (P/B) class boundary (EuropeanCommission 2003b).
Final calculation of EQR for each lake and assessmentof its ecological status
For the combination of the two metrics (TIHeLM andCmax) in a final value for each lake, a normalizationprocedure of each lake’s EQR values was applied fol-lowing piecewise linear interpolation (Hazewinkel2002) between each status class’ upper and lowerboundary value. This implied the conversion of eachmetric’s EQR to a normalized scale with equal classwidths and standardized class boundaries, where thehigh-good (H/G), good-moderate (G/M), moderate-poor (M/P), and poor-bad (P/B) boundaries were at0.8, 0.6, 0.4, and 0.2, respectively.
The final lake assessment was determined using theprinciple of equal weight for taxonomic compositionand abundance metrics. Thus, following the calculation
of EQRs for both metrics and their normalization pro-cedure for each lake, a final HeLM score and its subse-quent ecological status class were calculated by theiraverage.
Statistical assessment of method’s performance
In order to evaluate the performance of the HeLMassessment method addressing eutrophication and gen-eral degradation pressures, the pressure-response rela-tionships were investigated. The pressure indicatorsused for the evaluation of the metrics were TP, CHLA,and SD. By means of linear regression analysis andmultivariate regression analysis (Legendre andLegendre 1998), the relationships between the threepressure indicators and the two metrics of the methodseparately as well as the final values of the HeLMmethod were determined.
To improve data distribution, TIHeLM metric valueswere log-transformed, while Cmax metric values weresquare-root-transformed. The transformation of HeLMfinal values did not improve the distribution; thus, thevalues remained untransformed. Pressure indicatorvalues were all log-transformed. For linear relationships,a linear regression model was applied using IBM SPSSStatistics v.23 (IBM 2014) software, and the resultingcoefficient of determination (R2), Pearson’s correlationcoefficient (R), and p value (p) of the model wereassessed. As proposed by Kolada et al. (2011), thevalues of the coefficients R2 > 0.30 and R > 0.55, forstatistically significant models (p < 0.05), were assumedas sufficient to accept a metric as a well-performing one.For the relationship between HeLM and all three pres-sure indicators, a multivariate regression model wasapplied and the same coefficients were assessed usingthe same software.
Finally, relative abundance values of different life-forms of the macrophytic vegetation (elodeids,helophytes, charids, ceratophyllids, nymphaeids, andlemnids) were calculated for each lake. These valueswere plotted against the calculated metric values for
Table 2 Pressure criteria and their threshold limits established for screening potential reference sites, following the results from Pahissa et al.(2015)
National lake type TP (μg/L) CHLA (μg/L) SD (m) ALU (%) IA (%) NASN (%) PD (h/km2)
Deep natural lakes (GR-DNL) < 12 < 2 > 6 < 4 < 25 > 70 < 30
Shallow natural lakes (GR-SNL) < 15 < 5 > 2 < 4 < 25 > 70 < 30
Environ Monit Assess (2018) 190: 326 Page 7 of 16 326

each lake and polynomial adjustments were appliedusing IBM SPSS Statistics v.23 software (IBM 2014),in order to quantify the responses of different groups ofaquatic macrophytes along the eutrophication gradient.
Results
Development of the HeLM assessment method
In total, 92 macrophyte taxa were recorded in 16 Greeklakes. The lists of these taxa along with their LTR valuesfor the calculation of TIHeLM are given in OnlineResource, Supplement 4.
Based on the environmental data used as pressure indi-cators, three lakes were selected as potential reference ones:Kourna and Feneos (GR-DNL type) and Paralimni (GR-SNL type) (Table 3). The difference in the distribution of thepressure criteria values between non-reference and referencelakes is shown inOnline Resource, Supplement 5. For thesethree lakes, 41 out of the 43 sampled transects were quali-fied as reference on the basis of the macrophytic vegetationand they were selected to represent reference conditions.Following the setting of reference conditions, type-specificecological status class boundaries were calculated for eachmetric (Table 4).
HeLM method application
The results of the calculations of TIHeLM and Cmax
for the 16 Greek lakes (raw values and normalizedecological quality ratios), the final HeLM values,and the consequent ecological status class for eachlake are given in Table 5. Twelve out of the 16 lakeswere classified at high and good ecological status.The remaining four were positioned in the lowerclasses. In six lakes (Kourna, Feneos, Trichonida,
Paralimni, Lysimachia, and Zazari), both metricsindependently resulted in classifying them in thesame ecological status class. For the other 10, thetwo metrics gave results that differ up to two classesof ecological status. TIHeLM values exhibited asimilar variance among the transects within eachlake (Online Resource, Supplement 6). An obviousexception was Lysimachia lake (LYS), in which halfof its transect showed a high level of degradation,whereas the other half did not.
Evaluation of HeLM method’s performance
All linear regression models between the TIHeLM, Cmax,and HeLM values and the three pressure indicators werefound significant at the 0.01 level, with coefficient ofdetermination (R2) higher than 0.3 (the lower value was0.454) and Pearson’s correlation coefficient (R) higher than0.5 (the lower value was 0.674) (Table 6). Specifically, theTIHeLM metric showed a relatively high positive correla-tion with TP and CHLA, and an equal negative correlationwith SD (Fig. 2 and Table 6). On the other hand, Cmax
metric showed a high negative correlation with TP andCHLA and an equal positive one with SD (Fig. 2 andTable 6). More importantly, final HeLM values showed ahigh negative correlation with TP and CHLA, and a highpositive onewith SD (Fig. 3 and Table 6). Themultivariateregression analysis was also significant at the 0.01 leveland with high coefficient of determination (R2) andPearson’s correlation coefficient (R) (Table 6). Best linearfits, limits of 95% confidence, and prediction limits areshown in Figs. 2 and 3.
Figure 4 represents the changes in relative abundanceof different life-forms of macrophytes over the range ofvalues of both taxonomic composition metric(TIHeLM) and abundance metric (Cmax), as well as thefinal HeLM assessment method values. In all three
Table 3 The lakes selected to represent reference conditions, after the pressure screening process, with their calculated values for theselected indicators of eutrophication and general degradation pressure
Lake Type TP (μg/L) CHLA (μg/L) SD (m) ALU (%) IA (%) NASN (%) PD (h/km2)
Kourna GR-DNL < 10 1.27 7.5 0.00 2.70 97.30 6.68
Feneos GR-DNL 10.27 0.47 9.9 0.00 0.00 95.47 0.00
Paralimni GR-SNL 13.63 3.78 2.5 0.16 22.24 77.59 9.57
For the pressure indicator abbreviations, seeMaterials and methods / Development of the HeLM assessment method / Establishment of type-specific reference conditions Section
GR-DNL Greek deep natural lakes, GR-SNL Greek shallow natural lakes
326 Page 8 of 16 Environ Monit Assess (2018) 190: 326

cases, a clear trend was observed of elodeid-dominatedmacrophytic communities at high ecological status lakesbeing replaced by helophyte-dominated macrophyticcommunities at lakes of lower ecological status classes.Charids were also quite commonly found in lakes athigher classes, and they were absent in lakes at lowerclasses. On the other hand, lemnids and nymphaeidsshowed a slight increasing trend towards lakes at lowerclasses of ecological status.
Discussion
Development of the HeLM assessment method
Our results show that HeLM assessment method is afully WFD-compliant assessment method, able to clas-sify the Greek lakes according to their ecological status.Currently, 17 MS have developed, intercalibrated, andharmonized their methods for assessing the ecological
Table 4 The type-specific ecological status class boundaries (ecological quality ratio and raw values) as calculated for each metric of theHeLM assessment method
Metric TIHeLM Cmax (m) Cmax (m)
National lake types GR-DNL and GR-SNL GR-DNL GR-SNL
Class EQR Value EQR Value EQR Value
Reference 1 7.14 1 12.2 1 6.1
High > 0.94 < 7.60 > 0.89 > 10.86 > 0.69 > 4.21
Good 0.94–0.90 7.60–7.93 0.89–0.36 10.86–4.39 0.69–0.58 4.21–3.54
Moderate < 0.90–0.82 > 7.93–8.71 < 0.36–0.24 < 4.39–2.93 < 0.58–0.39 < 3.54–2.38
Poor < 0.82–0.75 > 8.71–9.52 < 0.24–0.12 < 2.93–1.46 < 0.39–0.19 < 2.38–1.16
Bad < 0.75 > 9.52 < 0.12–0 < 1.46–0 < 0.19–0 < 1.16–0
GR-DNL Greek deep natural lakes, GR-SNL Greek shallow natural lakes
Table 5 Calculated values for metrics TIHeLM and Cmax of the HeLM assessment method (raw values and normalized ecological qualityratios (nEQRs)) and final assessment of the ecological status for each one of the 16 lakes of the Greek National Water Monitoring Network
Lake Type TIHeLM nEQR TIHeLM Cmax (m) nEQR Cmax HeLM Ecological status
Kourna GR-DNL 7.163 0.989 13.20 1.000 0.995 High
Feneos GR-DNL 7.322 0.917 12.80 1.000 0.959 High
Megali Prespa GR-DNL 7.483 0.847 7.00 0.681 0.764 Good
Trichonida GR-DNL 7.694 0.740 10.00 0.773 0.757 Good
Amvrakia GR-DNL 7.497 0.841 6.60 0.668 0.755 Good
Vegoritida GR-DNL 7.579 0.807 7.67 0.701 0.754 Good
Volvi GR-DNL 7.444 0.864 3.87 0.528 0.696 Good
Yliki GR-DNL 7.439 0.866 3.80 0.519 0.693 Good
Paralimni GR-SNL 7.141 1.000 6.80 1.000 1.000 High
Doirani GR-SNL 7.783 0.687 4.67 0.848 0.768 Good
Mikri Prespa GR-SNL 8.389 0.478 5.60 0.947 0.712 Good
Kastoria GR-SNL 8.119 0.548 4.40 0.820 0.684 Good
Lysimachia GR-SNL 7.958 0.593 3.40 0.576 0.585 Moderate
Ozeros GR-SNL 8.788 0.379 3.10 0.524 0.452 Moderate
Zazari GR-SNL 8.737 0.392 1.40 0.240 0.316 Poor
Pamvotida GR-SNL 9.068 0.307 0.53 0.092 0.199 Bad
GR-DNL Greek deep natural lakes, GR-SNL Greek shallow natural lakes
Environ Monit Assess (2018) 190: 326 Page 9 of 16 326

Table 6 Overview of the relationships between HeLM metrics(TIHeLM andCmax) andHeLM final values and pressure indicatorvalues (total phosphorus concentration, TP; chlorophyll a
concentration, CHLA; and Secchi depth, SD), after linear regres-sion and multivariate regression analysis
Relationship n R2 R p Regression equation
TIHeLM-TP 16 0.494 0.703 0.002 logTIHeLM = 0.049 × log TP + 0.821
TIHeLM-CHLA 16 0.454 0.674 0.004 logTIHeLM = 0.031 × logCHLA + 0.865
TIHeLM-SD 16 0.475 − 0.689 0.003 logTIHeLM = 0.912 − 0.051 × log SDCmax-TP 16 0.686 − 0.828 < 0.001
ffiffiffiffiffiffiffiffiffiffiffi
Cmaxp ¼ 4:379−1:383� logTP
Cmax-CHLA 16 0.808 − 0.899 < 0.001ffiffiffiffiffiffiffiffiffiffiffi
Cmaxp ¼ 3:247−0:994� logCHLA
Cmax-SD 16 0.751 0.867 < 0.001ffiffiffiffiffiffiffiffiffiffiffi
Cmaxp ¼ 1:528� logSDþ 1:764
HeLM-TP 16 0.682 − 0.826 < 0.001 HeLM = 1.276 − 0.39 × log TPHeLM-CHLA 16 0.655 − 0.809 < 0.001 HeLM = 0.931 − 0.253 × logCHLAHeLM-SD 16 0.580 0.762 < 0.001 HeLM = 0.38 × log SD + 0.556
HeLM-TP, CHLA, and SD 16 0.694 − 0.833 0.002 HeLM = 1.256 − 0.29 × log TP − 0.112 × logCHLA − 0.068 × log SD
The coefficient of determination (R2 ), Pearson’s correlation coefficient (R), and the p value of significance are given for each regression
Fig. 2 Linear relationshipsbetween the metrics TIHeLM (a–c) andCmax (e–g) and the pressureindicators total phosphorus (TP),chlorophyll a (CHLA), andSecchi depth (SD). Best linearfits, limits of 95% confidence, andprediction limits are shown. Bestlinear fits’ equations andcoefficients can be seen at Table 6
326 Page 10 of 16 Environ Monit Assess (2018) 190: 326

status of lakes based on aquatic macrophytes (EuropeanCommission 2013; Poikane et al. 2011). All these MS,without exception, belong to the Central and NorthernEuropean regions, whereas there is still not a fullyharmonized method in Mediterranean region (Poikaneet al. 2011, 2015). In these methods, MS follow threeapproaches with regard to the assessment of macrophytetaxonomic composition. The first is based on the relativeabundance of sensitive and/or tolerant taxa [e.g., Dutchmethod (Coops et al. 2007), Norwegian method (Mjelde2007), German method (Schaumburg et al. 2004)], thesecond on diversity indices [e.g., Polish method(Portielje et al. 2014), British method (Willby et al.2009)], and the third approach on trophic scores of taxa[e.g., Swedish method (Ecke 2007), Austrian method(Pall and Moser 2009)]. In regard to abundance,
maximum colonization depth (Cmax) is commonly usedin the assessment methods of many other MS [e.g., Irishmethod (Free et al. 2006), Austrian method (Pall andMoser 2009), German method (Schaumburg et al.2004), Danishmethod (Sondergaard et al. 2010)]. Basedon the results of our tests that applied the rationale ofDudley et al. (2011) and Kolada et al. (2011, 2014),Cmax and a trophic score index were chosen to becomethe constituent metrics of HeLM assessment method.
Another important issue we had to address during thedevelopment of a water ecological status assessmentmethod was the establishment of reference conditionsand ecological status class boundaries. In the HeLM
Fig. 3 Linear relationships between final HeLM values and thepressure indicators total phosphorus (TP) (a), chlorophyll a(CHLA) (b), and Secchi depth (SD) (c). Best linear fits, limits of95% confidence, and prediction limits are shown. Best linear fits’equations and coefficients can be seen at Table 6
Fig. 4 Scatterplots between TIHeLM (a), Cmax (b), and finalHeLM values (c) and the calculated relative abundance (square-root-transformed) of different life-forms of macrophytes in thestudied lakes. The lines represent polynomial adjustments
Environ Monit Assess (2018) 190: 326 Page 11 of 16 326

method, potential reference sites were selected on thebasis of pressure indicators and ecological criteria whichpresent the potential anthropogenic effect in the catch-ment area of the lakes. These criteria were also recom-mended by REFCOND (European Commission 2003b)and were among the ones that are commonly used inother published assessment methods (Pahissa et al.2015; Pall et al. 2016; Poikane et al. 2015; Portieljeet al. 2014, etc.). Reference conditions for Europeanlakes have been mostly developed on the basis of phy-toplankton, with accepted lakes having annual TP con-centrations up to 35 μg/L and annual CHLA concentra-tions up to 5 μg/L (Cardoso et al. 2007; Carvalho et al.2008; McElarney and Rippey 2009; Toth et al. 2008).Thus, the thresholds set for reference criteria in HeLMmethod are consistent with those found in assessmentmethods of other MS (Hellsten et al. 2014; Portieljeet al. 2014). Ecological status class boundaries wereset following the recommendations of REFCOND(European Commission 2003b) and the work done inMediterranean region (Pahissa et al. 2015). The resultedvalues are also comparable with the boundary values setin other MS (Hellsten et al. 2014; Portielje et al. 2014).However, for their final refinement, more dataconcerning changes in species compositions in Mediter-ranean lakes may be required.
Application and evaluation of the HeLM method’sperformance
TIHeLM and Cmax independently do not always resultin the same ecological status. There were cases thatCmax
classified the lake to a lower class than TIHeLM andvice versa. This can be attributed to the different time ofresponse of the two metrics to changes in water quality.Taxonomic composition of macrophytes has been foundto respond relatively slow to changes of trophic condi-tions, requiring some years to adapt to the new condi-tions within a lake (Jeppesen et al. 2005; Mehner et al.2008; Melzer 1999; Robertson et al. 2000). On the otherhand, Cmax seems to adapt much faster to changes oftrophic conditions (Asplund and Cook 1997; Mehneret al. 2008; Robertson et al. 2000; van den Berg et al.1999). For this reason, it is important for an assessmentmethod to cover different aspects of macrophytic vege-tation, with the inclusion of short-time as well as long-time reacting components to eutrophication and re-oligotrophication processes (Pall and Moser 2009;Portielje et al. 2014; Schaumburg et al. 2004).
Furthermore, calculation of the spatial variability ofTIHeLM among transects within each lake can be avaluable tool for the identification of point sources ofwater pollution and the prevalence of different levels ofecological status in different sub-bodies of a lake(Brazner et al. 2007; Niemi et al. 2004). For example,in our data set, around half of Lysimachia lake showed ahigh level of degradation due to eutrophication andgeneral degradation pressures, whereas the other halfthat receives water from the nearby lake Trichonida(Avramidis et al. 2013) did not.
The performance of the HeLM assessment methodwas tested by exploring the relationships of its constit-uent metrics with the most common eutrophicationpressure indicators. The data set that was used for theabove-mentioned test covered the full nutrient-pressuregradient that can be found in Greek natural lakes, so asto evaluate the reliability of the method to classify waterbodies in all different classes of ecological status. Themajority of the sites in the data set used were within theconfidence limits (95%) of the assessment model, whileall of them were within its prediction limits for all threepressure indicators. The final HeLM values were foundto describe eutrophication pressures strongly and withhigh significance. For example, the coefficient of deter-mination (R2) in the correlation with TP was found atR2 = 0.682. This value is among the highest valuesfound in assessment systems of other MS (e.g., FinlandTP, R2 = 0.29; Ireland TP, R2 = 0.56; Norway TP, R2 =0.65; United Kingdom TP, R2 = 0.48; Germany TP,R2 = 0.50; France TP, R2 = 0.33; Austria TP, R2 = 0.27)(Hellsten et al. 2014; Pall et al. 2014; Portielje et al.2014). Furthermore, all values of determination coeffi-cient (R2) and Pearson’s correlation coefficient (R), forall correlations between HeLM’s metrics and finalvalues and pressure indicator values, over-exceededthe thresholds of R2 > 0.30 and R > 0.55 proposed forwell-performing metrics by Kolada et al. (2011). All theabove are indicative of the effective performance of theHeLM assessment method in addressing eutrophicationand general degradation pressures in Greek naturallakes.
Individual metric and final HeLM values were alsofound to discriminate quite well the lakes whereelodeids and charids are dominating the macrophyticvegetation from the lakes where only helophytes,lemnids, and nymphaeids are present and thus the shiftfrom a submerged macrophytic vegetation to an emer-gent one (Kolada 2014). This shift has been found to be
326 Page 12 of 16 Environ Monit Assess (2018) 190: 326

strongly connected with a change from a transparentstate of water to a turbid one, thus representing a waterdeterioration gradient (Hilt et al. 2010; Klosowskii et al.2006; Kohler et al. 2010; Kolada 2014; Spoljar et al.2017). Specifically, a great number of charophytes andelodeids are considered as indicative of high and goodecological status sites (Hellsten et al. 2014; Pall et al.2014; Portielje et al. 2014), while for less than goodstatus communities, the above-mentioned taxa are beingreplaced by more tolerant taxa, such as nymphaeids,lemnids, and helophytes (Kolada 2014; Pall et al.2014; Penning et al. 2008a, b; Portielje et al. 2014;Toth et al. 2008).
Limitations and future needs
The taxonomic composition metric TIHeLM used in theHeLM assessment method is a trophic score metric,calculated on the basis of species trophic scores (LTR).Since there is neither a current trophic scoring systemfor macrophytes in Greek lakes nor the amount of datanecessary for the development of one, the calculation ofthe TIHeLM metric uses the scoring system resultedfrom the European intercalibration exercise (Hellstenet al. 2014; Kolada et al. 2011, 2014). Furthermore,new LTR values have been calculated by applying aregression (Kolada et al. 2011) for about half of the taxarecorded in our data set, as no LTR values existed forthem. The continuous operation of Monitoring Net-works by Mediterranean MS will provide more dataconsidering TP optima for macrophytes in the Mediter-ranean region in the future; thus, the LTR values of taxamay be revised to represent more accurately their re-sponse to the trophic status of lakes.
An additional issue to be treated is that the develop-ment of the HeLM assessment method was based on adata set representing 16 lakes and a 3-year samplingperiod. Future sampling campaigns in the context of themonitoring network will provide additional data. Asmore data become available, the method needs to bechecked and revised accordingly in subjects such asanalysis of the uncertainty, temporal stability of metricvalues within reference sites, analysis of importance ofthe inclusion or not of specific groups of taxa in themetrics calculation, and readjustment of boundary loca-tions according to changes in species composition.
Finally, an important issue for the future is the har-monization of the methods used in the Mediterraneanregion. Following the development efforts for the
French macrophyte assessment method for lakes, IBML(Bertrin et al. 2016), Italian macrophyte method VL-MMI (Azella 2016), and the Spanish assessment meth-od (CEDEX 2010a, b), all Mediterranean MS, shouldfocus on the intercalibration of their adoptedmethods, inorder to ensure that good ecological status represents thesame level of ecological quality for all lakes in theMediterranean region, consistent with WFD normativedefinitions (Poikane et al. 2011; Toth et al. 2008).
Conclusions
The WFD-compliant HeLM assessment method formacrophytes in Mediterranean lakes in Greece was de-veloped on the basis of two metrics concerning thetaxonomic composition and abundance of aquatic mac-rophytes. According to the so far collected data from theGreek National Water Monitoring Network, the devel-oped method depicts in a satisfactory manner the re-sponse of aquatic macrophytes to eutrophication andgeneral degradation pressures. It is also able to discrim-inate lakes with macrophytic vegetation dominated bydifferent life-forms. In the light of new data and underthe requirements among other MS in the Mediterraneanregion, future additions and improvements in this as-sessment method may be required.
Acknowledgements The present study was executed in theframe of the Greek National Water Monitoring Network, accord-ing to the JMD 140384/2011, implemented by The GoulandrisNatural History Museum, Greek Biotope/Wetland Centre(EKBY). The study was co-financed by the European UnionCohesion Fund (Partnership Agreement 2014-2020, MIS5001204. The network is supervised by the Directorate for theProtection and Management of Water Resources of the SpecialSecretariat for Waters of the Ministry of Environment and Energy.The data used in this report come from Acts MIS 371010, 371138,371140, 371144, and 371145 of the Operational ProgramBEnvironment and Sustainable Development^ financed by theEuropean Regional Development Fund. Special thanks must begiven to G. Poulis for his contribution to aquatic macrophytesamplings and identification and to E. Tsakiri for the identificationof bryophytes. EKBY’s personnel conducted monitoring sam-plings and analysis of pressure data.
Open Access This article is distributed under the terms of theCreative Commons Attribution 4.0 International License (http://creativecommons.org/licenses/by/4.0/), which permits unrestrict-ed use, distribution, and reproduction in any medium, providedyou give appropriate credit to the original author(s) and the source,provide a link to the Creative Commons license, and indicate ifchanges were made.
Environ Monit Assess (2018) 190: 326 Page 13 of 16 326

References
Alahuhta, J., Kanninen, A., & Vuori, K. M. (2012). Response ofmacrophyte communities and status metrics to natural gradi-ents and land use in boreal lakes. Aquatic Botany, 103, 106–114.
Alvarez Cobelas, M., Rojo, C., & Angeler, D. G. (2005).Mediterranean limnology: current status, gaps and the future.Journal of Limnology, 64, 13–29.
Asplund, T. R., & Cook, C. M. (1997). Effects of motor boats onsubmerged aquatic macrophytes. Lake and ReservoirManage, 13, 1–12.
Avramidis, P., Samiotis, A., Kalimani, E., Papoulis, D.,Lampropoulou, P., & Bekiari, V. (2013). Sediment character-istics and water physicochemical parameters of theLysimachia Lake, Western Greece. Environment EarthScience, 70, 383–392.
Azella, M.M. (2016). Report of the Italian macrophyte method forMediterranean lakes: VL–MMI. https://circabc.europa.eu/faces/jsp/extension/wai/navigation/ container.jsp.Accessed 05 Sept 2017.
Beklioglu,M., Romo, S., Kagalou, I., Quintana, X., & Bé cares, E.(2007). State of the art in the functioning of shallowMed i t e r r anean l ake s : wo rk shop conc lus i on s .Hydrobiologia, 584, 317–326.
Bertrin, V., Boutry, S., Reyjol, Y., & Argillier, C. (2016). Frenchmacrophyte assessment method for lakes, IBML (IndiceBiologique Macrophytique lac): Report for MediterraneanLakes intercalibration exercise. https://circabc.europa.eu/faces/ jsp/extension/wai/navigation/container.jsp.Accessed 05 Sept 2017.
Birk S., 2010. Database on assessment methods for lakes, rivers,coastal and transitional waters in Europe. Wiser deliverableD2.2-1. http://www.wiser.eu/results/ deliverables/. Accessed03 Sept 2017.
Birk, S., Bonne,W., Borja, A., Brucet, S., Courrat, A., Poikane, S.,Solimini, A., van de Bund, W., Zampoukas, N., & Hering, D.(2012). Three hundred ways to assess Europe’s surface wa-ters: an almost complete overview of biological methods toimplement the water framework directive. EcologicalIndicators, 18, 31–41.
Blindow, I., Hargeby, A., Meyercordt, J., & Schubert, H. (2006).Primary production in two shallow lakes with contrastingplant form dominance: a paradox of enrichment?Limnology and Oceanography, 51, 2711–2721.
Brazner, J. C., Danz, N. P., Trebitz, A. S., Niemi, G. J., Regal, R.R., Hollenhorst, T., Host, G. E., Reavie, E. D., Brown, T. N.,Hanowski, J. A. M., Johnston, C. A., Johnson, L. B., Howe,R. W., & Ciborowski, J. J. H. (2007). Responsiveness ofGreat Lakes wetland indicators to human disturbances atmultiple spatial scales: a multi-assemblage assessment.Journal of Great Lakes Research, 33, 42–66.
Cardoso, A. C., Solimimi, A., Premazzi, G., Carvalho, L., Lyche,A., & Rekolainen, S. (2007). Phosphorus reference concen-trations in European lakes. Hydrobiologia, 584, 3–12.
Carvalho, L., Solimini, A., Phillips, G., van Den Berg, M.,Pietilainen, O. P., Solheim, L. A., et al. (2008). Chlorophyllreference conditions for European lake types used for
intercalibration of ecological status. Aquatic Ecology, 42,203–211.
CEDEX. (2010a). Selección de métricas para la evaluación delestado ecológico de las masas de agua de la categoría Blagos^basadas en el elemento de calidad Bcomposición yabundancia de otra flora acuática^ en aplicación de laDirectiva Marco del Agua. Clave CEDEX: 44-407-1-002.
CEDEX. (2010b). Establecimiento de condiciones de referencia yvalores frontera entre clases de estado ecológico en masas deagua de la categoría lago para los elementos de calidadBcomposición, abundancia y biomasa de fitoplancton^ yBcomposición y abundancia de otro tipo de flora acuática^,en aplicación de la Directiva Marco del Agua. ClaveCEDEX: 44-407- 1-002.
Coops, H., Kerkum, F. C. M., van den Berg, M. S., & vanSplunder, I. (2007). Submerged macrophytes vegetationand the European water framework directive: assessment ofstatus and trends in shallow, alkaline lakes in the Netherlands.Hydrobiologia, 584, 395–402.
Copernicus Service - Pan-European Component: Corine LandCover CLC (2012). Version 18.5.1. http://land.copernicus.eu/. Accessed 20 Aug 2017.
De Boer, W. (2007). Seagrass-sediment interactions, positive feed-backs and critical thresholds for occurrence: a review.Hydrobiologia, 591, 5–24.
van den Berg, M. S., Scheffer, M., van Nes, E., & Coops, E.(1999). Dynamics and stability of Chara sp. andPotamogeton pectinatus in a shallow lake changing in eutro-phication level. Hydrobiologia, 408, 335–342.
Dudley, B., Dunbar, M., Penning, E., Kolada, A., Hellsten, S., &Kanninen, A. (2011). Report on uncertainty in macrophytemetrics. Wiser Deliverable D3.2–2. http://www.wiser.eu/results/deliverables/. Accessed 03 Sept 2017.
Ecke, F. (2007). Bedomningsgrunder for makrofyter i sjoar -Bakgrundsrapport of Lulea University of Technology, depart-ment of chemical engineering and geosciences. Lulea,Sweden.
Ellenberg, H. (1988). Vegetation ecology of Central Europe (4thed.). Cambridge: Cambridge University Press.
Ellenberg, H., Weber, H. E., Dull, R., Wirth, V., Werner, W., &Paulissen, D. (1991). Zeigerwerte von Pflanzen inMitteleuropa. Scripta Geobotanica, 18, 1–248.
Engelhardt, K. A. M., & Ritchie, M. E. (2001). Effects of macro-phyte species richness on wetland ecosystem functioning andservices. Nature, 411, 687–689.
ETC/IC (2015). European Freshwater Ecosystem Assessment:cross-walk between the Water Framework Directive andHabitats Directive types, status and pressures, ETC/ICMTechnical Report 2/2015, Magdeburg: European TopicCentre on inland, coastal and marine waters, 95 pp. plusAnnexes.
European Commission (2000). Directive 2000/60/EC of theEuropean Parliament and of the council of 23rd October2000. Establishing a framework for community action inthe field of water policy. Official journal of the EuropeanCommunities, L327/1. European Commission, Brussels.
European Commission (2003a). Monitoring under the WaterFramework Directive. Guidance document No. 7. Commonimplementation strategy for the Water Framework Directive(2000/60/EC).
326 Page 14 of 16 Environ Monit Assess (2018) 190: 326
European Commission (2003b). Rivers and lakes—typology, ref-erence conditions and classification systems. Guidance doc-ument No. 10. Common implementation strategy for theWater Framework Directive (2000/60/EC). Produced byWorking Group 2.3 – REFCOND.
European Commission (2013). Commission decision of 20September 2013 establishing, pursuant to directive 2000/60/EC of the European Parliament and of the council, the valuesof the member state monitoring system classifications as aresult of the intercalibration exercise. Official journal of theEuropean Communities, L266/1. European Commission,Brussels.
Free, G., Little, R., Tierney, D., Donnelly, K., & Caroni, R. (2006).A reference based typology and ecological assessment sys-tem for Irish Lakes. Preliminary Investigations. EPA,Wexford, Ireland.
Hazewinkel, M. (2002). Encyclopaedia of mathematics. Berlin:Springer-Verlag.
Hellenic Statistical Authority (2011). Population-housing census.http://www.statistics.gr/en/2011-census-pop-hous. Accessed20 Aug 2017.
Hellsten, S., Willby, N., Ecke, F., Mjelde, M., Phillips, G., &Tierney, D. (2014). Northern lake macrophyte ecologicalassessment methods. Water Framework DirectiveIntercalibration Technical Report. Joint Research CentreTechnical Reports.
Hilt, S., Gross, E. M., Hupfer, M., Morscheid, H., Mahlmann, J.,Melzer, A., et al. (2006). Restoration of submerged vegeta-tion in shallow eutrophic lakes—a guideline and state of theart in Germany. Limnologica, 36, 155–171.
Hilt, S., Henschke, I., Rucker, J., & Nixdorf, B. (2010). Cansubmerged macrophytes influence turbidity and trophic statein deep lakes? Suggestions from a case study. Journal ofEnvironmental Quality, 39, 725–733.
Hoerling, M., Eischeid, J., Perlwitz, J., Quan, X., Zhang T., &Pegion, P. (2012). On the increased frequency ofMediterranean drought. American Meteorological Society,Journal on Climate, 25, 2146–2161.
deHoyos, C., Catalan, J., Dörflinger, G., Ferreira, J., Kemitzoglou,D., Laplace-Treyture, C., et al. (2014). Mediterranean Lakephytoplankton ecological assessment methods. WaterFramework Directive Intercalibration Technical Report.Joint Research Centre Technical Reports.
I.S. EN 15460 (2007). Water quality—guidance standard for thesurveying of macrophytes in lakes.
IBMCorp. (2014). IBM SPSS statistics for Windows, version 23.0.Armonk: IBM Corp.
Janauer, G.A. (2002). Guidance on the assessment of aquaticmacrophytes in lakes under the conditions of the monitoringfor the water framework directive/EU.
Jeffrey, S. W., & Humphrey, G. F. (1975). New spectrophotomet-ric equations for determining chlorophylls a, b, c1 and c2 inhigher plants, algae and natural phytoplankton. Biochemieund Physiologie der Pflanzen, 167, 191–194.
Jensen, S. (1977). An objective method for sampling the macro-phyte vegetation in lakes. Vegetatio, 33, 107–118.
Jeppesen, E., Sondergaard, M., Jensen, J. P., Havens, K. E.,Anneville, O., Carvalho, L., et al. (2005). Lake response toreduced nutrient loading—an analysis of contemporary long-term data from 35 case studies. Freshwater Biology, 50,1747–1771.
Klosowskii, S., Tomaszewicz, G. H., & Tomaszewicz, H. (2006).The expansion and decline of charophyte communities inlakes within the Sejny Lake District (northeastern Poland)and changes in water chemistry. Limnologica, 36, 234–240.
Kohler, J., Hachoł, J., & Hilt, S. (2010). Regulation of submersedmacrophyte biomass in a temperate lowland river: interac-tions between shading by bank vegetation, epiphyton andwater turbidity. Aquatic Botany, 92, 129–136.
Kolada, A. (2014). The effect of lake morphology on aquaticvegetation development and changes under the influence ofeutrophication. Ecological Indicators, 38, 282–293.
Kolada, A. (2016). The use of helophytes in assessing eutrophica-tion of temperate lowland lakes: added value? AquaticBotany, 129, 44–54.
Kolada, A., Hellsten, S., Kanninen, A., Søndergaard, M., Dudley,B., Nõges, P., et al. (2009). Overview and comparison ofmacrophyte survey methods used in European countries anda proposal of harmonized common sampling protocol to beused for WISER uncertainty exercise including a relevantcommon species list. Wiser Deliverable D3.2–1. http://www.wiser.eu/results/deliverables/. Accessed 05 Sept 2017.
Kolada, A., Hellsten, S., Søndergaard,M.,Mjelde,M., Dudley, B.,Van Geest, G., et al. (2011). Report on the most suitable lakemacrophyte based assessment methods for impacts of eutro-phication and water level fluctuations. Wiser DeliverableD3.2–3. http://www.wiser.eu/results/deliverables/. Accessed05 Sept 2017.
Kolada, A., Willby, N., Dudley, B., Noges, P., Sondergaard, M.,Hellsten, S., et al. (2014). The applicability of macrophytecompositional metrics for assessing eutrophication inEuropean lakes. Ecological Indicators, 45, 407–415.
Legendre, P., & Legendre, L. F. G. (1998). Numerical ecology(2nd ed.). Amsterdam: Elsevier.
McElarney, Y. R., & Rippey, B. (2009). A comparison of lakeclassifications based on aquatic macrophytes and physicaland chemical water body descriptors. Hydrobiologia, 625,195–206.
Mehner, T., Diekmann, M., Gonsiorczyk, T., Kasprzak, P.,Koschel, R., Krienitz, L., Rumpf, M., Schulz, M., & Wauer,G. (2008). Rapid recovery from eutrophication of a stratifiedlake by disruption of internal nutrient load. Ecosystems, 11,1142–1156.
Melzer, A. (1999). Aquatic macrophytes as tools for lake manage-ment. Hydrobiologia, 395, 181–190.
Mjelde, M. (2007). Macrophytes and eutrophication in lakes.BIOCLASS, NIVA-report, Oslo, Norway.
Niemi, G. J., Wardrop, D., Brooks, R., Anderson, S., Brady, V.,Paerl, H., et al. (2004). Rationale for a new generation ofecological indicators for coastal waters. EnvironmentalHealth Perspectives, 112, 979–986.
Özen, A., Karapinar, B., Kucuk, I., Jeppesen, E., & Beklioglu, M.(2010). Drought-induced changes in nutrient concentrations andretention in two shallow Mediterranean lakes subjected to dif-ferent degrees of management. Hydrobiologia, 646, 61–72.
Pahissa, J., Catalan, J., Morabito, G., Dörflinger, G., Ferreira, J.,Laplace-Treyture, C., Gîrbea, R., Marchetto, A., Polykarpou,P., & de Hoyos, C. (2015). Benefits and limitations of anintercalibration of phytoplankton assessment methods basedon the Mediterranean GIG reservoir experience. Science ofthe Total Environment, 538, 169–179.
Environ Monit Assess (2018) 190: 326 Page 15 of 16 326

Pall, K., & Moser, V. (2009). Austrian index macrophytes (AIM-module 1) for lakes: a water framework directive compliantassessment system for lakes using aquatic macrophytes.Hydrobiologia, 633, 83–104.
Pall, K., Bertrin, V., Buzzi, F., Boutry, S., Dutartre, A., Germ, M.,et al. (2014). Alpine lake macrophyte ecological assessmentmethods. Water Framework Directive IntercalibrationTechnical Report. Joint Research Centre Technical Reports.
Pall, K., Gecheva, G., Soare-Minea, A., & Lukacs, B.A. (2016).Eastern continental intercalibration of national-based classi-fication methods for status assessment in lakes. WaterFramework Directive Intercalibration Technical Report.Joint Research Centre Technical Reports.
Palmer, M. A., Bell, S. L., & Butterfield, I. A. (1992). A botanicalclassification of standing waters in Britain: application forconservation and monitoring. Aquatic Conservation: Marineand Freshwater Ecosystems, 2, 125–143.
Penning, W. E., Dudley, B., Mjelde, M., Hellsten, S., Hanganu, J.,Kolada, A., van den Berg, M., Poikane, S., Phillips, G.,Willby, N., & Ecke, F. (2008a). Using aquatic macrophytecommunity indices to define the ecological status ofEuropean lakes. Aquatic Ecology, 42, 253–264.
Penning, W. E., Mjelde, M., Dudley, B., Hellsten, S., Hanganu, J.,Kolada, A., van den Berg, M., Poikane, S., Phillips, G.,Willby, N., & Ecke, F. (2008b). Classifying aquatic macro-phytes as indicators of eutrophication in European lakes.Aquatic Ecology, 42, 237–251.
Poikane, S., van den Berg, M., Hellsten, S., de Hoyos, C., Ortiz-Casas, J., Pall, K., Portielje, R., Phillips, G., Solheim, A. L.,Tierney, D., Wolfram, G., & van de Bund, W. (2011). Lakeecological assessment systems and intercalibration for theEuropean water framework directive: aims, achievementsand further challenges. Procedia Environmental Sciences, 9,153–168.
Poikane, S., Birk, S., Bohmer, J., Carvalho, L., de Hoyos, C.,Gassner, H., et al. (2015). A hitchhiker’s guide to Europeanlake ecological assessment and intercalibration. EcologicalIndicators, 52, 533–544.
Portielje, R., Bertrin, V., Denys, L., Grinberga, L., Karottki, I.,Kolada, A., et al. (2014). Central Baltic lake macrophyteecological assessment methods. Water Framework Directive
Intercalibration Technical Report. Joint Research CentreTechnical Reports.
Rice, E.W., Baird, R.B., Eaton, A.D., & Clesceri, L.S. (Eds.)(2012). Standard methods for the examination of water andwastewater. 22nd ed., American Public Health Association,American Water Works Association, Water EnvironmentFederation.
Robertson, D. M., Goddard, G. L., Helsel, D. R., & MacKinnon,K. L. (2000). Rehabilitation of Delavan lake, Wisconsin.Lake and Reservoir Management, 16, 155–176.
Schaumburg, J., Schranz, C., Hofmann, G., Stelzer, D., Schneider,S., & Schmedtje, U. (2004). Macrophytes and phytobenthosas indicators of ecological status in German lakes—a contri-bution to the implementation of the water framework direc-tive. Limnologica – Ecology and Management of InlandWaters, 34, 302–314.
Schneider, S., & Melzer, A. (2003). The trophic index of macro-phytes (TIM)—a new tool for indicating the trophic state ofrunning waters. International Review of Hydrobiology, 88,49–67.
Sondergaard, M., Johansson, L. S., Lauridsen, T. L., Jorgensen, T.B., Liboriussen, L., & Jeppesen, E. (2010). Submerged mac-rophytes as indicators of the ecological quality of lakes.Freshwater Biology, 55, 893–908.
Spoljar, M., Zhang, C., Drazina, T., Zhao, G., & Lajtner, J. (2017).Development of submerged macrophytes and epiphyton in aflow-through system: assessment and modelling predictions ininterconnected reservoirs. Ecological Indicators, 75, 145–154.
Toth, L. G., Poikane, S., Penning, W. E., Free, G., Maemets, H.,Kolada, A., & Hanganu, J. (2008). First steps in the Central-Baltic intercalibration exercise on lake macrophytes: wheredo we start? Aquatic Ecology, 42, 265–275.
Wang, G. X., Zhang, L. M., Chua, H., Li, X. D., Xia, M. F., & Pu,P. M. (2009). A mosaic community of macrophytes for theecological remediation of eutrophic shallow lakes.Ecological Engineering, 35, 582–590.
Willby, N., Pitt, J., & Phllips, G. (2009). The ecological classifi-cation of UK lakes using aquatic macrophytes. Environmentagency science report. Project SC010080/R2. Bristol.
XP T90–328 (2010). Water quality—sampling of macrophytecommunities in water bodies.
326 Page 16 of 16 Environ Monit Assess (2018) 190: 326
Copyright © 2022 FDOKUMEN