Inhibition of microbial sulfate reduction in a flow-through column system by (per)chlorate treatment
Upload
independentCategory
view
6download
0
1 23
WetlandsOfficial Scholarly Journal of the Societyof Wetland Scientists ISSN 0277-5212Volume 33Number 1 Wetlands (2013) 33:129-140DOI 10.1007/s13157-012-0358-9
Experimental Evidence of the Tolerance toChlorate of the Aquatic Macrophyte Egeriadensa in a Ramsar Wetland in SouthernChile
Alvaro T. Palma, Alex O. Schwarz & JoséM. Fariña
1 23
Your article is protected by copyright and
all rights are held exclusively by Society
of Wetland Scientists. This e-offprint is for
personal use only and shall not be self-
archived in electronic repositories. If you
wish to self-archive your work, please use the
accepted author’s version for posting to your
own website or your institution’s repository.
You may further deposit the accepted author’s
version on a funder’s repository at a funder’s
request, provided it is not made publicly
available until 12 months after publication.

ARTICLE
Experimental Evidence of the Tolerance to Chlorateof the Aquatic Macrophyte Egeria densa in a RamsarWetland in Southern Chile
Alvaro T. Palma & Alex O. Schwarz & José M. Fariña
Received: 4 July 2012 /Accepted: 20 November 2012 /Published online: 7 December 2012# Society of Wetland Scientists 2012
Abstract In 2004, a massive die-off of the aquatic macro-phyte Egeria densa occurred in a Ramsar wetland in south-ern Chile. In 2004, a pulp mill started its operationsupstream from the wetland. Chlorate, a chemical compoundfound in pulp mill effluent, was one of the suspected causesof the observed ecosystem-level changes. The hypothesiswas that high concentrations of chlorate in the wetlandcaused a massive die-off of the large populations of Egeriadensa in this ecosystem. In this study several experimentalefforts were aimed to understanding the potential effect ofchlorate on E. densa. Plants were exposed to different dosesof chlorate for variable periods in a large mesocosm arrayand several morphometric endpoints were quantified.Additionally, an ecotoxicological assay was implementedproviding the first insight into the tolerance to chlorate ofthis aquatic plant. Both mesocosm and ecotoxicologicalevidences suggest that E. densa is tolerant to fairly highlevels of chlorate (i.e. EC50 in the order of 1000 mg/L), atleast three orders of magnitude larger than the highest con-centration recorded in the wetland. Our results provideevidence that should guide the efforts of understanding thereal causes of this environmental change.
Keywords Pulp mill effluent . Chlorate .Water quality .
Aquatic macrophyte .Wetland
Introduction
In 2004, important ecosystem-level changes were detected inthe Carlos Anwandter Nature Sanctuary, a large wetland sys-tem in southern Chile (40°S) designated as a Ramsar site in1981.1 One of the most conspicuous changes affecting theSanctuary during this period included a massive die-off of theaquatic macrophyte Egeria densa, a species originally fromsouthern Brazil (Boettcher 2007) that serves as a major foodsource to several charismatic species like the black neckedswanCygnusmelancoryphus and other bird species (Corti andSchlatter 2002). The submerged macrophyte community con-tinued its decline until it had virtually disappeared by Octoberof 2005 (Marín et al. 2009). These ecosystem-level changesoccurred by the time a newly installed pulp mill (Valdiviaplant) owned by Celulosa Arauco y Constitución S.A. (here-after referred to as CELCO) started its operations, some 30 kmupstream from the wetland. It is still under debate what causedthe demise of Egeria densa from the system.
The Río Cruces wetland is a nationally and internation-ally important migratory bird habitat. Besides being the fieldlaboratory for innumerable descriptive Masters and Doctoraltheses, the Sanctuary has been monitored and protected bywildlife wardens of the Corporación Nacional Forestal(CONAF) since 1982. Nevertheless, few studies providereliable information about the wetland’s dynamics and theforces that shape its plant and animal communities. Due tothis lack, the causes of the sudden biotic changes thatoccurred in 2004 are unknown. Since then, several scientistsanalyzed the situation and produced a plethora of possibleexplanations from different perspectives. While some argu-mental lines-mainly representing inferences from temporal-ly limited field observation-pointed to chemical changesattributed to the operations of CELCO (i.e. Mulsow and
1 http://www.ramsar.org.
A. T. Palma (*) : J. M. FariñaCenter for Advanced Studies in Ecology and Biodiversity(CASEB), Pontificia Universidad Católica de Chile, Alameda 340,Santiago, Chilee-mail: [email protected]
A. O. SchwarzCivil Engineering Department, Universidad de Concepción,Casilla 160-C, Correo 3, Ciudad Universitaria,Concepción, Chile
Wetlands (2013) 33:129–140DOI 10.1007/s13157-012-0358-9
Author's personal copy
Grandjean 2006; Lopetegui et al. 2007) or to the effect ofphysical and biological factors (Pinochet et al. 2004; Ramírezet al. 2006; Woelfl et al. 2006; Lagos et al. 2008), others eitherdisproved the former by emphasizing the lack of appropriatedata analyses (Harding et al. 2007; Soto-Gamboa et al. 2007)or provided experimental evidence that refuted some of theirarguments (Palma et al. 2008; Marín et al. 2009). Hence, thewhole issue has become very controversial.
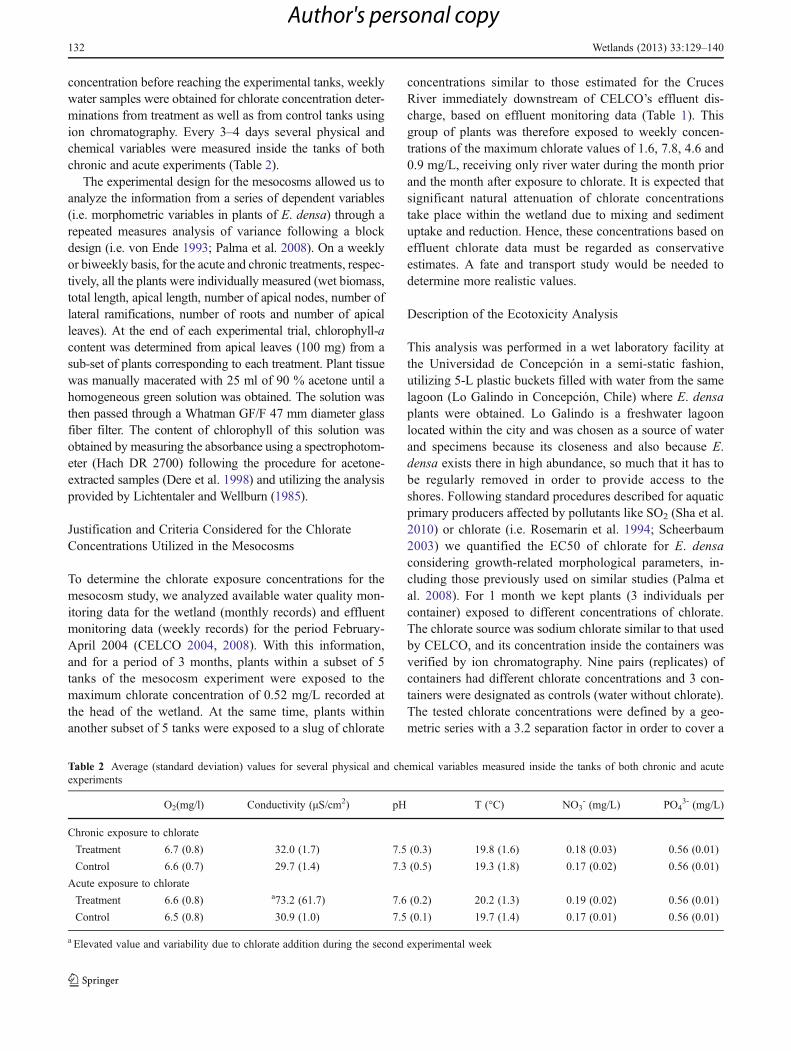
Various hypotheses were proposed that attributed thisenvironmental change to either natural or man-made causes(UACH 2005; Marín et al. 2009). One of these hypothesesstated that chlorate present in the effluent from CELCO hada toxic effect on E. densa, which susequently disappeared,thus triggering the aforementioned environmental change inthe wetland. This was suggested after a concentration spikeof chlorate was detected in the facility’s discharge effluents(values endorsed by governmental authorities) resulting in amaximum estimated concentration of 7.8 mg/L in theCruces River just downstream of the effluent discharge(see Table 1) during the period ranging from February toApril 2004. At the same time, above natural concentrationsof chlorate (with a maximum of 0.52 mg/L) were recordedin April of 2004 in the water column at the head of thewetland, located 30 km downstream of CELCO’s effluentdischarge. This situation is comparable, to some extent, towhat occurred in Sweden with the recorded negative effect
of chlorate, originated from a pulp mill plant, on a marinebrown alga (Rosemarin et al. 1994). In our system, however,the main species negatively affected (presumably by chlo-rate) was a freshwater macrophyte.
Several environmental sources for chlorate are known.Chlorate may leach from agricultural lands where com-pounds containing chlorate are used as herbicides or defoli-ating agents (Logan 1998). Chlorate is also a by-product ofwater disinfection, mainly with chlorine dioxide (USEPA1999). Compounds containing chlorate are also used bycellulose plants in the production of chlorine dioxide, acommon bleaching agent (Logan 1998). In turn, use ofchlorine dioxide produces residual concentrations of chlo-rate ion in the effluents of cellulose plants.
Prior to our study, the only significant toxicity on largeprimary producers, attributed to chlorate, was demonstratedfor brown algae at low levels of this compound (van Wijk andHutchinson 1995) based on long-term mesocosm studies. Inorder to protect the most sensitive freshwater species, presum-ably green algae, the Government of British Columbia,Canada, stated an environmental standard for chlorate of30 mg/L (Warrington 2002), although long-term toxicity datafor freshwater systems is scarce. Comparatively, to protectbrown algae, this standard is 0.005 mg/L of chlorate for marineaquatic life, based on long-term toxicity data. Since chlorateand nitrate are structural analogs, the toxicity of chlorate isassociated with its reduction to toxic chlorite by the enzymenitrate reductase (Aberg 1947; Balch 1987; van Wijk andHutchinson 1995; Stauber 1998; Chaudhuri et al. 2002).Chlorate is regarded as a chemically stable species and mobilein aquatic ecosystems, given its high solubility and poor sorp-tion properties (Siddiqui 1996; Couture 1998; Logan 1998;vanWijk and Hutchinson 1995; USEPA 1999). Chlorate is notpersistent though in these systems, since specialized popula-tions of facultative bacteria are known to rapidly reduce chlo-rate to chloride in anaerobic sediments (Malmqvist et al. 1991;van Ginkel et al. 1995; Logan 1998; Coates et al. 1999;Schwarz et al. 2012). The above mentioned lines of evidenceregarding the effect of chlorate on different biological end-points are diverse and preclude us from disregarding or accept-ing the hypothesis about the direct negative effect of chlorateon E. densa, in particular, in view of the lack of long-termtoxicity data for freshwater species. Neither Chile, USA orCanada have emissions or water quality standards for chlorate,only one recommendation from the Canadian environmentalauthority regarding a limit of chlorate (30 mg/L) for freshwaterbiota (Warrington 2002). Hence, considering all the availableinformation on ecotoxicity associated to chlorate, no acutetoxic effect of chlorate should be expected on Egeria densaunder the circumstances witnessed in the system in 2004.Hence, the main objective of this research was to test thehypothesis of the lethal and sublethal effect of chlorate onEgeria densa under different experimental conditions within
Table 1 Chlorate concentrations on CELCO’s effluent during the firstmonths of 2004a and the estimation of Chlorate concentrations in thewetland located 32 km downstream (in bold: highest weekly chlorateconcentrations recorded)
Week Chlorate in CELCO’seffluent (mg/L)
Estimated chlorate inCruces River immediatelyafter discharge (mg/L)b
Feb 9-Feb 15 17 0.5
Feb 16-Feb 22 24 0.6
Feb 23-Feb 29 28 1.3
Mar 1-Mar 7 19 0.6
Mar 8-Mar 14 37 1.6
Mar 15-Mar 21 170 7.8
Mar 22-Mar 28 90 4.6
Mar 29-Apr 4 23.7 0.9
Apr 5-Apr 11 CELCO did not operate –
Apr 12-Apr 18 40 0.4
Apr 19-Apr 25 10.4 0.1
Apr 26-May 2 0.65 0.0
a Effluent water quality monitoring report for the Feb-Apr 2004 period.The chemical analyses were performed in CELCO’s laboratory at theValdivia Plant as autocontrols. The analytical procedure involved mo-lecular absorption spectrophotometry (O-toluidine method)b Based on a chlorate mass balance calculation for the Cruces River,involving the point of effluent discharge
130 Wetlands (2013) 33:129–140
Author's personal copy
a mesocosm system, which is an amenable tool to answer suchquestions (i.e. Liston et al. 2008; Palma et al. 2008). Thechlorate levels and other abiotic conditions considered in theexperiment were selected to recreate several different scenarioslikely to have affected this species in its natural environmentduring March and April of 2004 in the Ramsar wetland. Ourgeneral working hypothesis is that plants exposed to chloratelevels equivalent to those present in the natural system by thetime the environmental changes in the wetland wereevident (early 2004) experience significant negativeeffects on morphological (e.g., changes in length, biomass,number of roots) as well as physiologically related (i.e.chlorophyll-a) endpoints.
A second objective aims to expand the findings of themesocosm experiment through the use of a more general setof chlorate concentrations in order to understand the toxicitythreshold of this compound on E. densa.
Methods
A series of experiments, using a mesocosm experimental array,were implemented between 2009 and 2011. In each opportuni-ty, several different morphometric and physiologically relatedvariables were quantified inE. densa plants exposed to differentconcentrations of chlorate. Additionally, we implemented anecotoxicological assay in order to determine the 50 % effectconcentration (EC50) toxicity level of chlorate on E. densa.
Description of the Basic Mesocosm System and Experiments
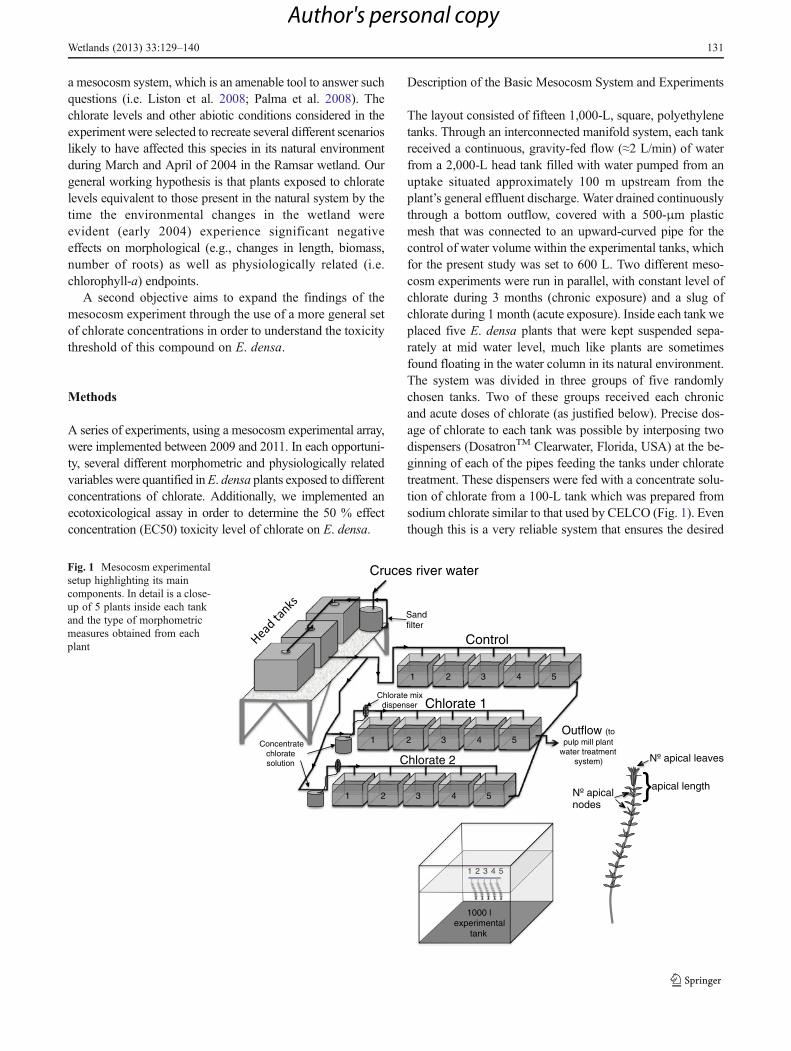
The layout consisted of fifteen 1,000-L, square, polyethylenetanks. Through an interconnected manifold system, each tankreceived a continuous, gravity-fed flow (≈2 L/min) of waterfrom a 2,000-L head tank filled with water pumped from anuptake situated approximately 100 m upstream from theplant’s general effluent discharge. Water drained continuouslythrough a bottom outflow, covered with a 500-μm plasticmesh that was connected to an upward-curved pipe for thecontrol of water volume within the experimental tanks, whichfor the present study was set to 600 L. Two different meso-cosm experiments were run in parallel, with constant level ofchlorate during 3 months (chronic exposure) and a slug ofchlorate during 1 month (acute exposure). Inside each tank weplaced five E. densa plants that were kept suspended sepa-rately at mid water level, much like plants are sometimesfound floating in the water column in its natural environment.The system was divided in three groups of five randomlychosen tanks. Two of these groups received each chronicand acute doses of chlorate (as justified below). Precise dos-age of chlorate to each tank was possible by interposing twodispensers (DosatronTM Clearwater, Florida, USA) at the be-ginning of each of the pipes feeding the tanks under chloratetreatment. These dispensers were fed with a concentrate solu-tion of chlorate from a 100-L tank which was prepared fromsodium chlorate similar to that used by CELCO (Fig. 1). Eventhough this is a very reliable system that ensures the desired
51 2 43
51 2 43
51 2 43
Cruces river water
Sandfilter
Concentratechloratesolution
Chlorate mixdispenser
Chlorate 2
Control
Outflow (to pulp mill plant
water treatmentsystem) Nº apical leaves
Nº apicalnodes
Chlorate 1
}apical length
1 2 3 4 5
1000 lexperimental
tank
Fig. 1 Mesocosm experimentalsetup highlighting its maincomponents. In detail is a close-up of 5 plants inside each tankand the type of morphometricmeasures obtained from eachplant
Wetlands (2013) 33:129–140 131
Author's personal copy
concentration before reaching the experimental tanks, weeklywater samples were obtained for chlorate concentration deter-minations from treatment as well as from control tanks usingion chromatography. Every 3–4 days several physical andchemical variables were measured inside the tanks of bothchronic and acute experiments (Table 2).
The experimental design for the mesocosms allowed us toanalyze the information from a series of dependent variables(i.e. morphometric variables in plants of E. densa) through arepeated measures analysis of variance following a blockdesign (i.e. von Ende 1993; Palma et al. 2008). On a weeklyor biweekly basis, for the acute and chronic treatments, respec-tively, all the plants were individually measured (wet biomass,total length, apical length, number of apical nodes, number oflateral ramifications, number of roots and number of apicalleaves). At the end of each experimental trial, chlorophyll-acontent was determined from apical leaves (100 mg) from asub-set of plants corresponding to each treatment. Plant tissuewas manually macerated with 25 ml of 90 % acetone until ahomogeneous green solution was obtained. The solution wasthen passed through a Whatman GF/F 47 mm diameter glassfiber filter. The content of chlorophyll of this solution wasobtained by measuring the absorbance using a spectrophotom-eter (Hach DR 2700) following the procedure for acetone-extracted samples (Dere et al. 1998) and utilizing the analysisprovided by Lichtentaler and Wellburn (1985).
Justification and Criteria Considered for the ChlorateConcentrations Utilized in the Mesocosms
To determine the chlorate exposure concentrations for themesocosm study, we analyzed available water quality mon-itoring data for the wetland (monthly records) and effluentmonitoring data (weekly records) for the period February-April 2004 (CELCO 2004, 2008). With this information,and for a period of 3 months, plants within a subset of 5tanks of the mesocosm experiment were exposed to themaximum chlorate concentration of 0.52 mg/L recorded atthe head of the wetland. At the same time, plants withinanother subset of 5 tanks were exposed to a slug of chlorate
concentrations similar to those estimated for the CrucesRiver immediately downstream of CELCO’s effluent dis-charge, based on effluent monitoring data (Table 1). Thisgroup of plants was therefore exposed to weekly concen-trations of the maximum chlorate values of 1.6, 7.8, 4.6 and0.9 mg/L, receiving only river water during the month priorand the month after exposure to chlorate. It is expected thatsignificant natural attenuation of chlorate concentrationstake place within the wetland due to mixing and sedimentuptake and reduction. Hence, these concentrations based oneffluent chlorate data must be regarded as conservativeestimates. A fate and transport study would be needed todetermine more realistic values.
Description of the Ecotoxicity Analysis
This analysis was performed in a wet laboratory facility atthe Universidad de Concepción in a semi-static fashion,utilizing 5-L plastic buckets filled with water from the samelagoon (Lo Galindo in Concepción, Chile) where E. densaplants were obtained. Lo Galindo is a freshwater lagoonlocated within the city and was chosen as a source of waterand specimens because its closeness and also because E.densa exists there in high abundance, so much that it has tobe regularly removed in order to provide access to theshores. Following standard procedures described for aquaticprimary producers affected by pollutants like SO2 (Sha et al.2010) or chlorate (i.e. Rosemarin et al. 1994; Scheerbaum2003) we quantified the EC50 of chlorate for E. densaconsidering growth-related morphological parameters, in-cluding those previously used on similar studies (Palma etal. 2008). For 1 month we kept plants (3 individuals percontainer) exposed to different concentrations of chlorate.The chlorate source was sodium chlorate similar to that usedby CELCO, and its concentration inside the containers wasverified by ion chromatography. Nine pairs (replicates) ofcontainers had different chlorate concentrations and 3 con-tainers were designated as controls (water without chlorate).The tested chlorate concentrations were defined by a geo-metric series with a 3.2 separation factor in order to cover a
Table 2 Average (standard deviation) values for several physical and chemical variables measured inside the tanks of both chronic and acuteexperiments
O2(mg/l) Conductivity (μS/cm2) pH T (°C) NO3- (mg/L) PO4
3- (mg/L)
Chronic exposure to chlorate
Treatment 6.7 (0.8) 32.0 (1.7) 7.5 (0.3) 19.8 (1.6) 0.18 (0.03) 0.56 (0.01)
Control 6.6 (0.7) 29.7 (1.4) 7.3 (0.5) 19.3 (1.8) 0.17 (0.02) 0.56 (0.01)
Acute exposure to chlorate
Treatment 6.6 (0.8) a73.2 (61.7) 7.6 (0.2) 20.2 (1.3) 0.19 (0.02) 0.56 (0.01)
Control 6.5 (0.8) 30.9 (1.0) 7.5 (0.1) 19.7 (1.4) 0.17 (0.01) 0.56 (0.01)
a Elevated value and variability due to chlorate addition during the second experimental week
132 Wetlands (2013) 33:129–140
Author's personal copy
broad range of concentrations (in mg/L): 1; 3.2; 10.2; 32.8;104.9; 335.5; 1,073.7; 3,436.0 and 10,995.1.
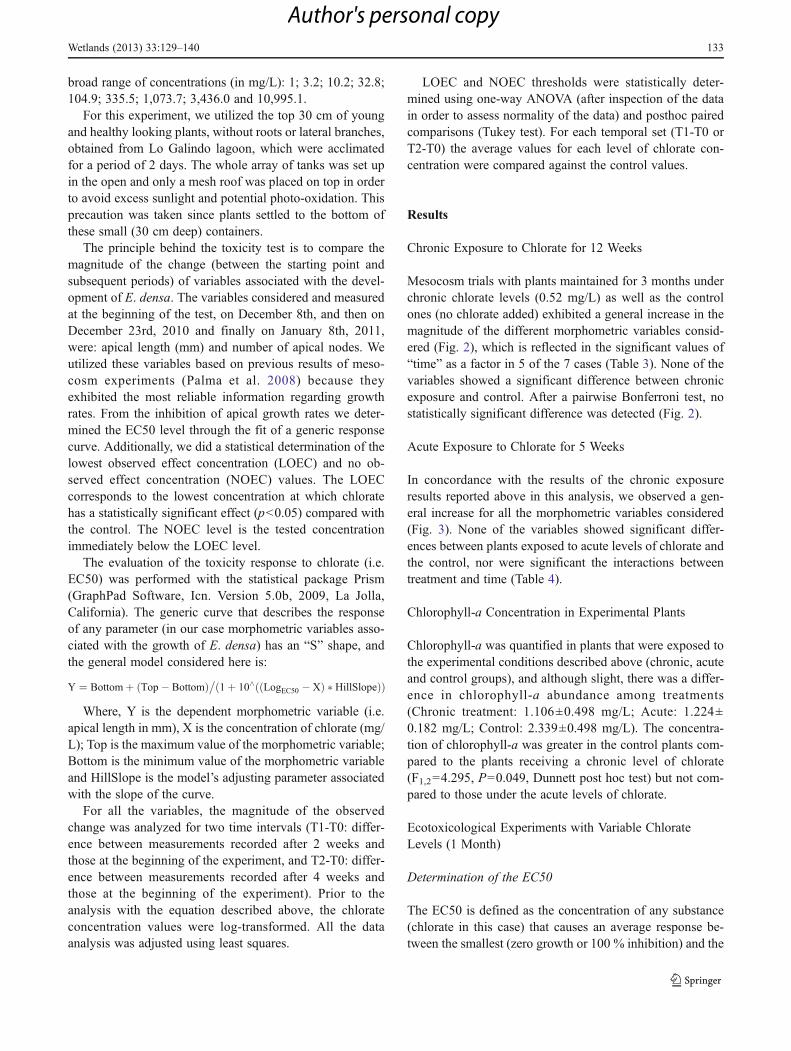
For this experiment, we utilized the top 30 cm of youngand healthy looking plants, without roots or lateral branches,obtained from Lo Galindo lagoon, which were acclimatedfor a period of 2 days. The whole array of tanks was set upin the open and only a mesh roof was placed on top in orderto avoid excess sunlight and potential photo-oxidation. Thisprecaution was taken since plants settled to the bottom ofthese small (30 cm deep) containers.
The principle behind the toxicity test is to compare themagnitude of the change (between the starting point andsubsequent periods) of variables associated with the devel-opment of E. densa. The variables considered and measuredat the beginning of the test, on December 8th, and then onDecember 23rd, 2010 and finally on January 8th, 2011,were: apical length (mm) and number of apical nodes. Weutilized these variables based on previous results of meso-cosm experiments (Palma et al. 2008) because theyexhibited the most reliable information regarding growthrates. From the inhibition of apical growth rates we deter-mined the EC50 level through the fit of a generic responsecurve. Additionally, we did a statistical determination of thelowest observed effect concentration (LOEC) and no ob-served effect concentration (NOEC) values. The LOECcorresponds to the lowest concentration at which chloratehas a statistically significant effect (p<0.05) compared withthe control. The NOEC level is the tested concentrationimmediately below the LOEC level.
The evaluation of the toxicity response to chlorate (i.e.EC50) was performed with the statistical package Prism(GraphPad Software, Icn. Version 5.0b, 2009, La Jolla,California). The generic curve that describes the responseof any parameter (in our case morphometric variables asso-ciated with the growth of E. densa) has an “S” shape, andthe general model considered here is:
Y ¼ Bottomþ Top� Bottomð Þ 1þ 10^ LogEC50 � Xð Þ � HillSlopeð Þð Þ�
Where, Y is the dependent morphometric variable (i.e.apical length in mm), X is the concentration of chlorate (mg/L); Top is the maximum value of the morphometric variable;Bottom is the minimum value of the morphometric variableand HillSlope is the model’s adjusting parameter associatedwith the slope of the curve.
For all the variables, the magnitude of the observedchange was analyzed for two time intervals (T1-T0: differ-ence between measurements recorded after 2 weeks andthose at the beginning of the experiment, and T2-T0: differ-ence between measurements recorded after 4 weeks andthose at the beginning of the experiment). Prior to theanalysis with the equation described above, the chlorateconcentration values were log-transformed. All the dataanalysis was adjusted using least squares.
LOEC and NOEC thresholds were statistically deter-mined using one-way ANOVA (after inspection of the datain order to assess normality of the data) and posthoc pairedcomparisons (Tukey test). For each temporal set (T1-T0 orT2-T0) the average values for each level of chlorate con-centration were compared against the control values.
Results
Chronic Exposure to Chlorate for 12 Weeks
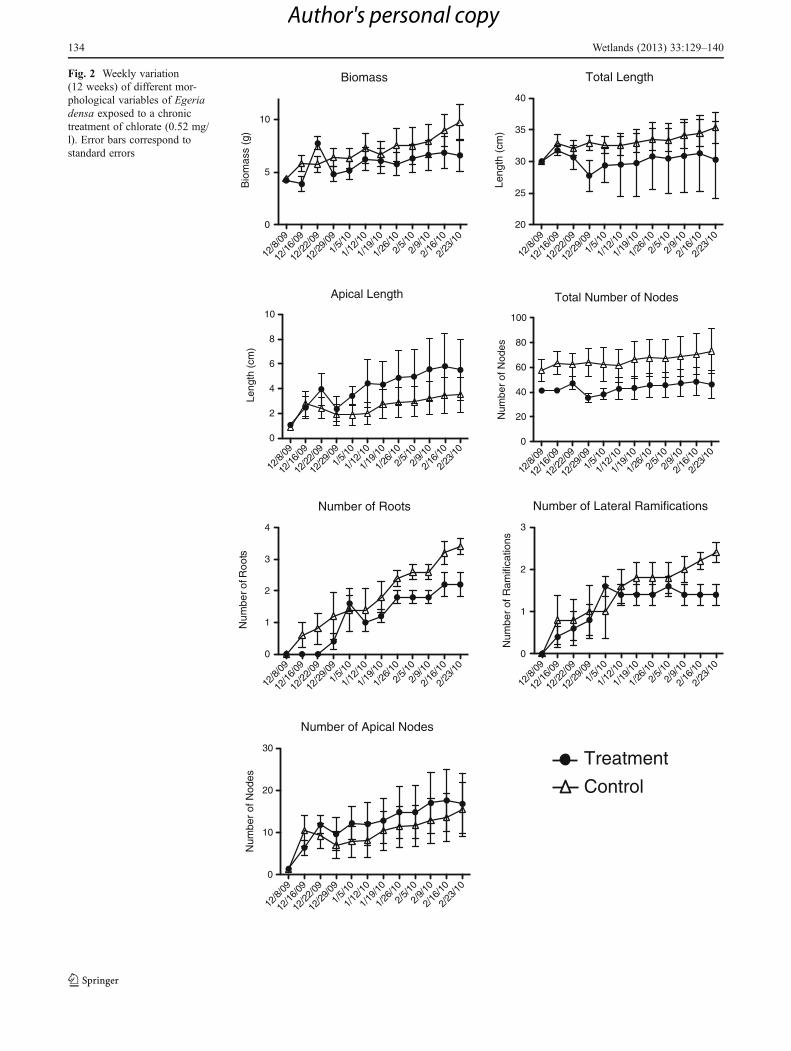
Mesocosm trials with plants maintained for 3 months underchronic chlorate levels (0.52 mg/L) as well as the controlones (no chlorate added) exhibited a general increase in themagnitude of the different morphometric variables consid-ered (Fig. 2), which is reflected in the significant values of“time” as a factor in 5 of the 7 cases (Table 3). None of thevariables showed a significant difference between chronicexposure and control. After a pairwise Bonferroni test, nostatistically significant difference was detected (Fig. 2).
Acute Exposure to Chlorate for 5 Weeks
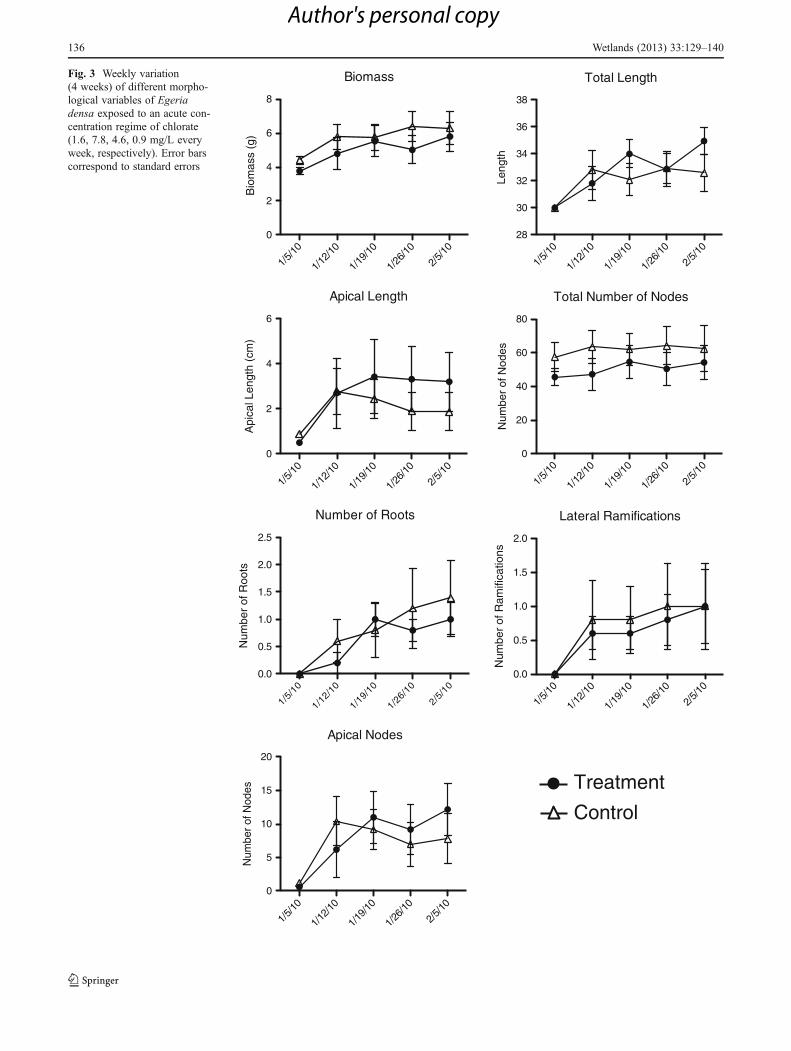
In concordance with the results of the chronic exposureresults reported above in this analysis, we observed a gen-eral increase for all the morphometric variables considered(Fig. 3). None of the variables showed significant differ-ences between plants exposed to acute levels of chlorate andthe control, nor were significant the interactions betweentreatment and time (Table 4).
Chlorophyll-a Concentration in Experimental Plants
Chlorophyll-a was quantified in plants that were exposed tothe experimental conditions described above (chronic, acuteand control groups), and although slight, there was a differ-ence in chlorophyll-a abundance among treatments(Chronic treatment: 1.106±0.498 mg/L; Acute: 1.224±0.182 mg/L; Control: 2.339±0.498 mg/L). The concentra-tion of chlorophyll-a was greater in the control plants com-pared to the plants receiving a chronic level of chlorate(F1,204.295, P00.049, Dunnett post hoc test) but not com-pared to those under the acute levels of chlorate.
Ecotoxicological Experiments with Variable ChlorateLevels (1 Month)
Determination of the EC50
The EC50 is defined as the concentration of any substance(chlorate in this case) that causes an average response be-tween the smallest (zero growth or 100 % inhibition) and the
Wetlands (2013) 33:129–140 133
Author's personal copy
Treatment
Control
Number of Lateral Ramifications
12/8
/09
12/1
6/09
12/2
2/09
12/2
9/09
1/5/
10
1/12
/10
1/19
/10
1/26
/10
2/5/
10
2/9/
10
2/16
/10
2/23
/100
1
2
3
Num
ber
of R
amifi
catio
nsNumber of Roots
12/8/
09
12/1
6/09
12/2
2/09
12/2
9/09
1/5/1
0
1/12/1
0
1/19/1
0
1/26/1
0
2/5/1
0
2/9/1
0
2/16/1
0
2/23/1
00
1
2
3
4
Num
bero
fRo o
ts
Total Number of Nodes
12/8/
09
12/1
6/09
12/2
2/09
12/2
9/09
1/5/1
0
1/12/1
0
1/19/1
0
1/26/1
0
2/5/1
0
2/9/1
0
2/16/1
0
2/23/1
00
20
40
60
80
100
Num
ber
of N
odes
Biomass
12/8/
09
12/16
/09
12/22
/09
12/29
/09
1/5/1
0
1/12
/10
1/19
/10
1/26
/10
2/5/1
0
2/9/1
0
2/16
/10
2/23
/100
5
10
Bio
mas
s (g
)
Total Length
12/8/
09
12/1
6/09
12/2
2/09
12/2
9/09
1/5/
10
1/12/
10
1/19/
10
1/26/
10
2/5/
10
2/9/
10
2/16/
10
2/23/
1020
25
30
35
40
Leng
th (
cm)
Apical Length
12/8
/09
12/16
/09
12/22
/09
12/29
/09
1/5/10
1/12/
10
1/19/
10
1/26/
10
2/5/10
2/9/10
2/16/
10
2/23/
100
2
4
6
8
10
Leng
th (
cm)
Number of Apical Nodes
12/8/
09
12/1
6/09
12/2
2/09
12/2
9/09
1/5/1
0
1/12/1
0
1/19/1
0
1/26/1
0
2/5/1
0
2/9/1
0
2/16/1
0
2/23/1
00
10
20
30
Num
ber
of N
odes
Fig. 2 Weekly variation(12 weeks) of different mor-phological variables of Egeriadensa exposed to a chronictreatment of chlorate (0.52 mg/l). Error bars correspond tostandard errors
134 Wetlands (2013) 33:129–140
Author's personal copy

greatest observed value for a chosen variable (maximumgrowth or 0 % inhibition) based on the model consideredhere. The EC50 values were recorded 4 weeks after
beginning the exposure of the plants to increasing concen-trations of chlorate (Fig. 4).
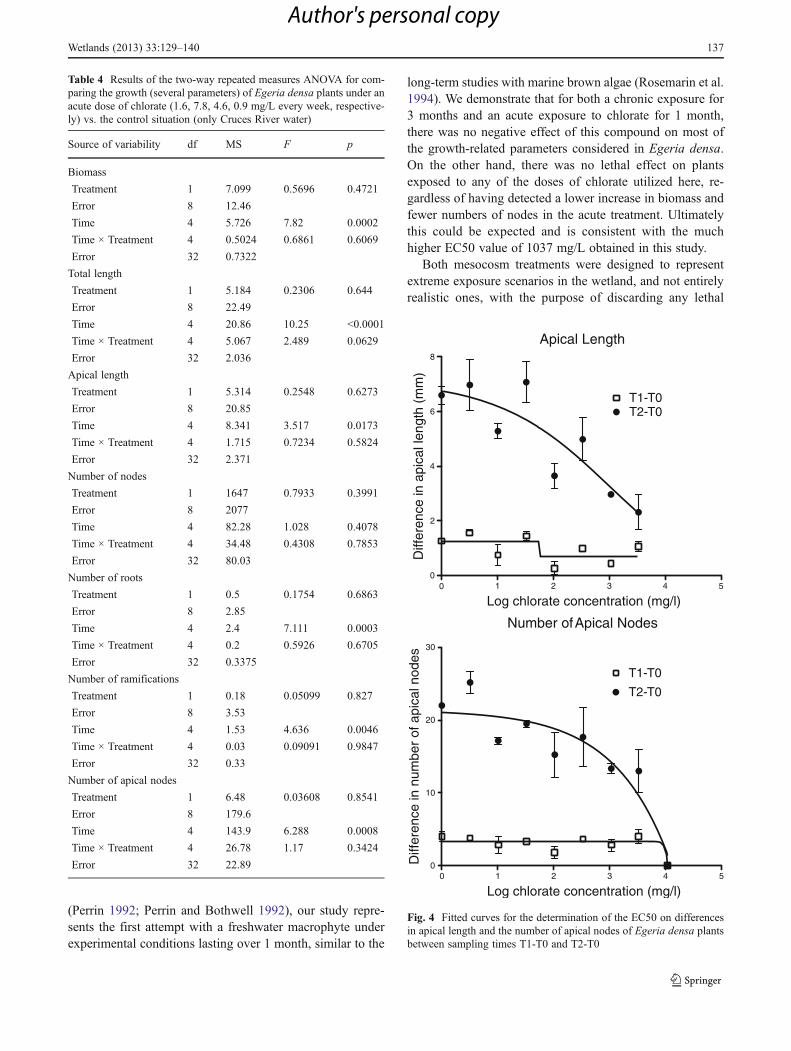
In our assay, an EC50 value of 1037 mg/L (the onlysignificant different value with a determination coefficientof 0.69) was detected, but only for the inhibition of apicalgrowth by measuring apical length. It is important to noticethat even though the model only detected EC50 values after4 experimental weeks, the graphs (Fig. 4) show a cleardecay of the fitting curves toward the end of the testedconcentrations, and mainly for the T2-T0 exposure interval.
Determination of the LOEC
The variables quantified in all plants in two opportunities (2and 4 weeks after the beginning of the experiment)exhibited a response to the addition of chlorate (Fig. 4).The change in size (apical length and number of apicalnodes) was always positive, after 2 and after 4 weeks,although the later change in size was more noticeable.Compared to control plants, those receiving chlorate startedshowing a significant decrease in growth rate at the highestchlorate concentrations utilized here. The significance of thedifferences between plants exposed to different chlorateconcentrations versus the controls allowed us the determi-nation of the chlorate concentration at which E. densastarted showing signs of growth inhibition (i.e. the lowestobserved effect concentration, LOEC). For the two param-eters considered, significant differences were first and onlyobserved in plants after 2 weeks of exposure to 104.9 mg/l (P<0.01). Hence, the NOEC (no observable effects con-centration) is 32.8 mg/l.
Discussion
Although difficult, particularly because receiving aquaticsystems are often exposed to multiple stressors (Lowell etal. 2000), the ability to understand the relative effect ofindividual factors represents a step forward toward improv-ing our ability to make valid ecologically-based predictionsand to contribute with regulatory guidelines (Wiegner et al.2005). Mesocosms have been successfully utilized in orderto achieve those goals in river systems (i.e. Culp et al. 1996;Dubé et al. 2002). The relatively large size and flow-throughcharacteristics of this experimental approach allows control-ling exposure conditions while maintaining environmentalrealism (Dubé 2004). Hence, the use of mesocosms allowsthe isolation of factors that are hypothesized to have nega-tive effects on identified ecosystem endpoints.
While other mesocosm studies have considered the effectof chlorate on diatoms and other freshwater microalgaeassemblages for periods lasting less than 1 month and find-ing NOEC between 0 mg/L and 300 mg/L of chlorate
Table 3 Results of the two-way repeated measures ANOVA compar-ing the growth (several parameters) of Egeria densa plants under achronic dose of chlorate (0.52 mg/l) vs. the control situation (onlyCruces River water)
Source of variability df MS F p
Biomass
Treatment 1 41.8 0.6734 0.4356
Error 8 62.06 32.02 <0.0001
Time 11 13.24 6.83 <0.0001
Time × Treatment 11 3.868 1.995 0.0381
Error 88 1.938
Total length
Treatment 1 242 0.4929 0.5026
Error 8 490.9 30.8 <0.0001
Time 11 8.896 0.5581 0.8574
Time × Treatment 11 5.464 0.3428 0.9733
Error 88 15.94
Apical Length
Treatment 1 68.68 0.8221 0.391
Error 8 83.53 17.27 <0.0001
Time 11 11.81 2.443 0.0104
Time × Treatment 11 2.072 0.4284 0.9395
Error 88 4.836
Number of nodes
Treatment 1 14301 2.148 0.1809
Error 8 6658 69.58 <0.0001
Time 11 135.5 1.417 0.1797
Time × Treatment 11 38.6 0.4034 0.9511
Error 88 95.68
Number of roots
Treatment 1 11.41 3.287 0.1074
Error 8 3.471 9.246 <0.0001
Time 11 9.039 24.08 <0.0001
Time × Treatment 11 0.3902 1.039 0.4196
Error 88 0.3754
Number of ramifications
Treatment 1 3.008 0.6171 0.4548
Error 8 4.875 20.43 <0.0001
Time 11 3.493 14.64 <0.0001
Time × Treatment 11 0.4083 1.711 0.0838
Error 88 0.2386
Number of apical nodes
Treatment 1 165.7 0.1608 0.6989
Error 8 1031 30.9 <0.0001
Time 11 165.5 4.964 <0.0001
Time × Treatment 11 13.69 0.4106 0.9479
Error 88 33.35
Wetlands (2013) 33:129–140 135
Author's personal copy
Biomass
1/5/
10
1/12
/10
1/19
/10
1/26
/10
2/5/
100
2
4
6
8
Bio
mas
s (g
)
Total Length
1/5/
10
1/12
/10
1/19
/10
1/26
/10
2/5/
1028
30
32
34
36
38
Leng
th
Apical Length
1/5/
10
1/12
/10
1/19
/10
1/26
/10
2/5/
100
2
4
6
Api
cal L
engt
h (c
m)
Total Number of Nodes
1/5/
10
1/12
/10
1/19
/10
1/26
/10
2/5/
100
20
40
60
80
Num
ber
of N
odes
Apical Nodes
1/5/
10
1/12
/10
1/19
/10
1/26
/10
2/5/
100
5
10
15
20
Num
ber
of N
odes
Number of Roots
1/5/1
0
1/12/1
0
1/19/
10
1/26/1
0
2/5/1
00.0
0.5
1.0
1.5
2.0
2.5
Num
ber
of R
oots
Lateral Ramifications
1/5/
10
1/12
/10
1/19
/10
1/26
/10
2/5/
100.0
0.5
1.0
1.5
2.0
Num
ber
of R
amifi
catio
ns
Treatment
Control
Fig. 3 Weekly variation(4 weeks) of different morpho-logical variables of Egeriadensa exposed to an acute con-centration regime of chlorate(1.6, 7.8, 4.6, 0.9 mg/L everyweek, respectively). Error barscorrespond to standard errors
136 Wetlands (2013) 33:129–140
Author's personal copy
(Perrin 1992; Perrin and Bothwell 1992), our study repre-sents the first attempt with a freshwater macrophyte underexperimental conditions lasting over 1 month, similar to the
long-term studies with marine brown algae (Rosemarin et al.1994). We demonstrate that for both a chronic exposure for3 months and an acute exposure to chlorate for 1 month,there was no negative effect of this compound on most ofthe growth-related parameters considered in Egeria densa.On the other hand, there was no lethal effect on plantsexposed to any of the doses of chlorate utilized here, re-gardless of having detected a lower increase in biomass andfewer numbers of nodes in the acute treatment. Ultimatelythis could be expected and is consistent with the muchhigher EC50 value of 1037 mg/L obtained in this study.
Both mesocosm treatments were designed to representextreme exposure scenarios in the wetland, and not entirelyrealistic ones, with the purpose of discarding any lethal
Table 4 Results of the two-way repeated measures ANOVA for com-paring the growth (several parameters) of Egeria densa plants under anacute dose of chlorate (1.6, 7.8, 4.6, 0.9 mg/L every week, respective-ly) vs. the control situation (only Cruces River water)
Source of variability df MS F p
Biomass
Treatment 1 7.099 0.5696 0.4721
Error 8 12.46
Time 4 5.726 7.82 0.0002
Time × Treatment 4 0.5024 0.6861 0.6069
Error 32 0.7322
Total length
Treatment 1 5.184 0.2306 0.644
Error 8 22.49
Time 4 20.86 10.25 <0.0001
Time × Treatment 4 5.067 2.489 0.0629
Error 32 2.036
Apical length
Treatment 1 5.314 0.2548 0.6273
Error 8 20.85
Time 4 8.341 3.517 0.0173
Time × Treatment 4 1.715 0.7234 0.5824
Error 32 2.371
Number of nodes
Treatment 1 1647 0.7933 0.3991
Error 8 2077
Time 4 82.28 1.028 0.4078
Time × Treatment 4 34.48 0.4308 0.7853
Error 32 80.03
Number of roots
Treatment 1 0.5 0.1754 0.6863
Error 8 2.85
Time 4 2.4 7.111 0.0003
Time × Treatment 4 0.2 0.5926 0.6705
Error 32 0.3375
Number of ramifications
Treatment 1 0.18 0.05099 0.827
Error 8 3.53
Time 4 1.53 4.636 0.0046
Time × Treatment 4 0.03 0.09091 0.9847
Error 32 0.33
Number of apical nodes
Treatment 1 6.48 0.03608 0.8541
Error 8 179.6
Time 4 143.9 6.288 0.0008
Time × Treatment 4 26.78 1.17 0.3424
Error 32 22.89
Apical Length
0 1 2 3 4 50
2
4
6
8
T1-T0T2-T0
Log chlorate concentration (mg/l)
Diff
eren
ce in
api
cal l
engt
h (m
m)
Number of Apical Nodes
0 1 2 3 4 50
10
20
30
T1-T0
T2-T0
Log chlorate concentration (mg/l)
Diff
eren
ce in
num
ber
of a
pica
l nod
es
Fig. 4 Fitted curves for the determination of the EC50 on differencesin apical length and the number of apical nodes of Egeria densa plantsbetween sampling times T1-T0 and T2-T0
Wetlands (2013) 33:129–140 137
Author's personal copy
effects, that could have produced the massive disappearanceof E. densa in 2004. On the one hand, the chronic treatmenthad a duration of 3 months while the actual measured valueof 0.52 mg/L is representative of only 1 month in the CrucesRiver and, on the other, the acute exposure did not take intoaccount natural attenuation of the chlorate slug in the wet-land due to mixing and sediment uptake. Hence, the sub-lethal effects observed in some variables are likely to be anoverstatement of what could have occurred given the 2004conditions in the wetland. More realistic exposure scenarioscould be determined by a chlorate fate and transport study.
In spite of the negative effect of chlorate on brown algaein coastal ecosystems in the Baltic Sea (Lehtinen et al. 1988;van Wijk and Hutchinson 1995), there is limited evidence oftoxicity for aquatic angiosperms like E. densa (e.g., fresh-water aquatic plant Lemna minor (Scheerbaum 2003)).Thus, it is not valid to just extrapolate the negative effectof chlorate on this algal species to the macrophyte E. densa.Reported chlorate threshold toxicity values available foraquatic plants are elevated (EC50/7 days0105 mg/L forgrowth rates of Lemna minor (Scheerbaum 2003)).Additionally, in order to evaluate the risk of chlorate inaquatic ecosystems, van Wijk and Hutchinson (1995)reviewed the toxicity of chlorate to aquatic organisms. Thegeometric means of the E(L)C50 (toxic or lethal concentra-tion for 50 % of the population) values for marine as well asfor freshwater species were: microorganisms 0 39 mg/L;micro algae 0 560 mg/L; invertebrates 0 2,442 mg/L andfish 0 3,815 mg/L. These authors concluded that chlorate isnon-toxic (acute toxicity or lethal concentrations for 50 % ofthe population > 100 mg/L) for most of marine and fresh-water species examined. Chlorate was only toxic (acutetoxicity <0.1 mg/L) for certain brown algal species(Macrocystis and Fucus), which do not occur in theCruces River. The most relevant reference for a possibletoxic effect of chlorate on E. densa is the EC50 value of105 mg/L found in Lemna minor (Scheerbaum 2003).Comparatively, the maximum concentration of chlorate es-timated for the Cruces River upstream of the wetland in2004 was 7.8 mg/L, which is expected to be attenuatedwithin the wetland due to mixing of river and wetlandwaters. The EC50 for chlorate in our study was 1,037 mg/L, the LOEC 104.9 mg/L and the NOEC 32.8 mg/L. Therather high acute toxicity threshold (EC50) of chlorate forthe apical growth detected in this study is more than 3 ordersof magnitude higher than the maximum chlorate concentra-tions measured and estimated for the Cruces River wetland.These toxicity thresholds constitute evidence in favor ofrejecting the hypothesis suggesting chlorate as the agentbehind the environmental changes that affected this ecosys-tem. The EC50 values for E. densa were also significantlygreater than the values determined for Lemna minor and formarine and freshwater algae.
It is assumed that chlorate is taken-up by the plant cellsthrough the system that assimilates nitrate and then is con-verted to chlorite, the supposedly toxic compound. Hence, itis expected then that the toxic effect of chlorate be expressedunder environmental conditions of low nitrate levels. Forexample, Stauber (1998) found that nitrate inhibits the up-take of chlorate in species of marine micro-algae (Nitzschiaclosterium and Dunaliella tertiolecta). Previous studies inthe Cruces River between 1995 and 1996 indicate thatnitrate levels in the Cruces River are relatively high (annualaverage of 268.9 μg/L) in comparison with other watersystems in southern Chile. Furthermore, nitrate concentra-tions are greater during the winter months, likely due togreater uptake by primary producers during summer months(Campos 1997). On the other hand, there is evidence that E.densa shows preference for ammonia as nitrogen source andthat this nitrogen uptake takes place mainly by diffusiondirectly from the water and not through the roots (Feijoó etal. 2002). There is also evidence that phosphorous in theCruces River basin is comparatively more limiting thannitrogen (Yarrow et al. 2009). Hence, our results showingno significant negative effect of chlorate on E. densa plantsunder experimental conditions agree with the previouslydescribed scenario whereas the toxic mechanism for chlo-rate toxicity is not favored in this Ramsar wetland.Furthermore, recent field observations (unpublished data)show that E. densa (as well as large numbers of blacknecked swans) is returning to the system while the pulp millplant is still operating and discharging effluents into theCruces River. Future research should focus on a betterunderstanding of the ecophysiology of this important aquat-ic macrophyte as well as on implementing a thorough andlong-lasting environmental monitoring program in this wet-land system.
Acknowledgments We thank the enthusiastic help provided byNoemí Solar and Juan Pablo Fuentes. This research is part of acooperation program between Celulosa Arauco and Constitucion S.A.and the Center for Advanced Studies in Ecology and Biodiversity ofthe Universidad Católica de Chile.
References
Aberg B (1947) On the mechanism of the toxic action of chlorates andsome related substances upon young wheat plants. KungligaLantbrukshogskolans Annaler 15:37–107
Balch WM (1987) Studies of nitrate transport by marine phytoplanktonusing 36ClO3
- as a transport analogue. Physiological Findings.Journal of Phycology 23:107–118
Boettcher C (2007) Variación comparativa de biomasa estacional endos macrófitos de la región de Valdivia, Chile. Ciencia y Trabajo9:191–199
Campos H (1997) Investigación sobre la calidad del agua del ríoCruces y estudios limnológicos. Estudio N°4 de línea baseproyecto Valdivia. Universidad Austral de Chile, Chile
138 Wetlands (2013) 33:129–140
Author's personal copy
CELCO (2004) Effluent water quality monitoring. Report, Feb.-Apr.2004 period
CELCO (2008) Environmental monitoring. Report, 3rd Quarter 2008Chaudhuri SK, O’Connor SM, Gustavson RL, Achenbach LA, Coates
JD (2002) Environmental factors that control microbial perchlo-rate reduction. Applied and Environmental Microbiology68:4425–4430
Coates JD, Michaelidou U, Bruc RA, O’Connor SM, Crespi JN, LaurieA, Achenbach LA (1999) Ubiquity and diversity of dissimilatory(per)chlorate-reducing bacteria. Applied and EnvironmentalMicrobiology 65:5234–5241
Corti P, Schlatter RP (2002) Feeding ecology of the black-necked swanCygnus melanocoryphus in two wetlands of southern Chile.Studies on Neotropical Fauna and Environment 37:9–14
Couture E (1998) Chlorate and chlorite analysis in seawater, chloratesinks, and toxicity to phytoplankton. Dissertation, DalhousieUniversity, Halifax, Nova Scotia, Canada
Culp JM, Podemski CL, Cash KJ, Lowell RB (1996) Utility of field-based artificial streams for assessing effluent effects on riverineecosystems. J Aquat Ecosyst Health 5:117–124
UACH (Universidad Austral de Chile) (2005) Estudio sobre origen demortalidades y disminución poblacional de aves acuáticas en elsantuario de la naturaleza Carlos Anwandter, en la provincia deValdivia. Final Report. Valdivia, Chile
Dere S, Günes T, Sivaci R (1998) Spectrophotometric determination ofchlorophyll—A, B and total carotenoid contents of some algaespecies using different solvents. Trends journal of Botany ofBotany 22:13
Dubé MG (2004) Advances in assessing the effects of pulp and papermill effluents on aquatic systems. In: Borton DL, Hall TJ, FisherRP, Thomas JF (eds) Pulp and paper mill effluent environmentalfate and effects. DEStech, Lancaster, pp 397–409
Dubé MG, MacLatchy DL, Culp JM, Gillis G, Parker R, Courtenay S,Gilman C (2002) Utility of mobile, field-based artificial streamsfor assessing effects of pulp mill effluents on fish in the Canadianenvironmental effects monitoring (EEM) program. J AquatEcosyst Stress Recov 9:85–102
USEPA (US Environmental Protection Agency) (1999) Alternativedisinfectants and oxidants guidance manual. EPA 815-R-99-014. Washington, D.C
Feijoó C, García M, Momo F, Toja J (2002) Nutrient absorption by thesubmerged macrophyte Egeria densa Planch.: effect of ammoni-um and phosphorus availability in the water column on growthand nutrient uptake. Limnetica 21:3–104
Harding L, Pretorius J, McGurk M (2007) Recent changes in the RíoCruces: comment on Mulsow & Grandjean (2006). Ethics inScience and Environmental Politics 2007:1–3
Lagos NA, Paolini P, Jaramillo E, Lovengreen C, Duarte C, ContrerasH (2008) Environmental processes, water quality degradation,and decline of waterbird populations in the Rio Cruces Wetland,Chile. Wetlands 28:938–950
Lehtinen KJ, Notini M, Mattsson J, Landner L (1988) Disappearanceof bladder-wrack (Fucus vesiculosus L.) in the Baltic Sea: relationto pulp mill chlorate. Ambio 17:387–393
Lichtentaler HK, Wellburn AR (1985) Determination of total carote-noids and chlorophylls A and B of leaf in different solvents.Biological Society Transactions 11:591–592
Liston SE, Newman S, Trexler JC (2008) Macroinvertebrate commu-nity response to eutrophication in an oligotrophic wetland: an insitu mesocosm experiment. Wetlands 28:686–694
Logan B (1998) A review of chlorate -and perchlorate-respiring micro-organisms. Bioremediation Journal 2:69–79
Lopetegui EJ, Vollmann RS, Cifuentes HC, Valenzuela CD, SuarezNL, Herbach EP, Huepe JU, Jaramillo GV, Leischner BP, RiverosRS (2007) Emigration and mortality of black-necked swans(Cygnus melancoryphus) and disappearance of the macrophyte
Egeria densa in a Ramsar Wetland site of southern Chile. Ambio36:607–609
Lowell RB, Culp JM, Dubé MG (2000) A weight-of-evidence ap-proach for northern river risk assessment: integrating the effectsof multiple stressors. Environmental Toxicology and Chemistry19:1182–1190
Malmqvist A, Welander T, Gunnarsson L (1991) Anaerobic growth ofmicroorganisms with chlorate as an electron acceptor. Appliedand Environmental Microbiology 57:2229–2232
Marín VH, Tironi A, Delgado LE, Contreras M, Novoa F, Torres-Gómez M, Garreaud R, Vila I, Serey I (2009) On the suddendisappearance of Egeria densa from a Ramsar wetland site ofSouthern Chile: a climatic event trigger model. EcologicalModeling 220:1752–1763
Mulsow S, Grandjean M (2006) Incompatibility of sulphate compoundsand soluble bicarbonate salts in the Rio Cruces waters: an answer tothe disappearance of Egeria densa and black-necked swans in aRamsar sanctuary. Ethics in Science and Environmental Politics2006:5–11
Palma AT, Silva M, Muñoz C, Cartes C, Jaksic F (2008) Effect ofprolonged exposition to pulp mill effluents on the InvasiveAquatic Plant Egeria densa and other primary producers: a mes-ocosm approach. Environmental Toxicology and Chemistry27:387–396
Perrin CJ (1992) The growth and structure of a lotic periphytoncommunity in relation to additions of chlorate: completion report.Limnotek Research and Development Inc., Vancouver, BC.Submitted to Dept. Fisheries and Oceans, Vancouver, BC
Perrin CJ, Bothwell ML (1992) Chlorate discharges from pulp mills:an examination of effects on river algal Communities. WaterPollution Research Journal of Canada 27:473–485
Pinochet D, Ramírez C, MacDonald R, Riedel L (2004) Concentracionesde elementos minerales en Egeria densa Planch. colectada en elSancuario de la naturaleza Carlos Anwandter, Valdivia, Chile. Agrosur 32:80–86
Ramírez C, Carrasco E, Mariani S, Palacios N (2006) La desaparicióndel luchecillo (Egeria densa) del sanctuario del Río Cruces(Valdivia, Chile): un hipótesis plausible. Ciencia y Trabajo8:79–86
Rosemarin A, Lehtinen KJ, Notini M, Mattsson J (1994) Effects ofpulp mill effluent on Baltic Sea algae. Environmental Pollution85:3–13
Scheerbaum D (2003) Sodium chlorate aquatic plant toxicity test,Lemna minor, static, 7 d. Dr. U. Noack–Laboratorien, Germany,Report no.: TLA93762
Schwarz AO, Urrutia H, Perez N, Vidal JM (2012) Chlorate reductioncapacity and characterisation of chlorate reducing bacteria com-munities in sediments of the Río Cruces wetland in SouthernChile. Water Research. doi:10.1016/j.watres.2012.03.046
Sha C, Wang T, Lu J (2010) Relative sensitivity of wetland plants toSO2 pollution. Wetlands 30:1023–1030
Siddiqui MS (1996) Chlorine-ozone interactions: formation of chlo-rate. Water Research 30:2160–2170
Soto-Gamboa M, Lagos N, Quiroz E, Jaramillo E, Nespolo R,Casanova-Katny A (2007) Causes of the disappearance of theaquatic plant Egeria densa and black necked swans in a Ramsarsanctuary: comment on Mulsow & Grandjean (2006). Ethics inScience and Environmental Politics 7:7–10
Stauber JL (1998) Toxicity of chlorate to marine microalgae. AquaticToxicology 41:213–227
van Ginkel CG, Plugge CM, Stroo CA (1995) Reduction of chloratewith various energy substrates and inocula under anaerobic con-ditions. Chemosphere 31:4057–4066
van Wijk DL, Hutchinson TH (1995) The ecotoxicity of chlorate toaquatic organisms: a critical review. Ecotoxicology andEnvironmental Safety 32:244–253
Wetlands (2013) 33:129–140 139
Author's personal copy
von Ende CN (1993) Repeated-mesures analysis: Growth and othertime-dependent measures. In: Scheiner SM, Gurevitch J (eds)Designs and analysis of ecological experiments. Chapman &Hall, New York, pp 113–137
Warrington PD (2002) Water quality: ambient water quality guidelinesfor chlorate. Technical Background Report. Water, Air andClimate Change Branch, Ministry of Environment, Governmentof British Columbia
Wiegner TN, Kaplan LA, Newbold JD, Ostrom PH (2005)Contribution of dissolved organic C to stream metabolism- a
mesocosm study using 13C-enriched tree-tissue leachate.Journal of the North American Benthological Society 24:48–67
Woelfl S, Mages M, Encina F, Bravo F (2006) Trace metals in micro-crustaceans and brazilian waterweed from a contaminated chileanwetland using total reflection X-ray fluorescence spectrometry.Microchim Acta 154:261–268
Yarrow M, Marín VH, Finlayson M, Tironi A, Delgado LE, Fischer F(2009) The ecology of Egeria densa Planchon (Liliopsida:Alismatales): a wetland ecosystem engineer? Revista Chilena deHistoria Natural 82:299–313
140 Wetlands (2013) 33:129–140
Author's personal copy
Copyright © 2022 FDOKUMEN