
Assessment of the spatio-temporal distribution of soil properties in East Kolkata wetland ecosystem...
12
Assessment of the spatio-temporal distribution of soil properties in East Kolkata wetland ecosystem (A Ramsar site: 1208) S Pal 1,3,∗ , S Manna 2 , A Aich 3 , B Chattopadhyay 3 and S K Mukhopadhyay 4 1 Department of Conservation Biology, Durgapur Government College, Durgapur 713 214, West Bengal, India. 2 School of Oceanographic Studies, Jadavpur University, Kolkata 700 032, West Bengal, India. 3 Government College of Engineering & Leather Technology, Salt Lake, LB-III, Kolkata 700 098, West Bengal, India. 4 Hooghly Mohsin College, Hooghly, Chinsurah 712 101, West Bengal, India. ∗ Corresponding author. e-mail: [email protected] The present investigation was made to characterize spatial and temporal variations in soil properties and to evaluate possible differences that could be dependent on the tannery effluent discharges, municipal sewage discharges, vegetation cover, soil settlement rate, crop rotation, etc. Soil total organic matter (TOM), cations like, Sodium (Na), Ammonium (NH 4 ), Potassium (K), Calcium (Ca) and Magnesium (Mg) contents in the bank soils and bottom sediments were recorded from seven different characteristic sites in East Kolkata wetland ecosystem, a Ramsar site (Ramsar site No. 1208). The profile maps were constructed by geostatistical methods to describe the spatial distribution as well as temporal variations of all the factors to identify the influences of composite wastewaters. The work was initiated to identify causes and consequences of the waste dumping in the concerned region for the past hundred years and thereby to suggest necessary precautionary measures to prevent further loss of soil quality. 1. Introduction Organic matter plays a major role in wetland ecosystem. It affects various biochemical processes, chemical transport, bio-availability of nutrients and nutrient cycling. The soil organic matter (SOM) is also a very sensible indicator of climate, and it can also indicate climate changes (Xiao et al. 1999). SOM is also an important ecologi- cal entity of wetland ecosystems and it influences the productivity of these areas. In case of anaer- obic respiration, organic matter decomposition is often incomplete. Therefore, lack of oxygen is one of the main factors determining plant detritus turnover. The organic matter is either produced from the wetlands itself and it gets accumulated in wetlands at different decomposition stages (Collins and Kuehl 2001; Holden 2005), or the organic mat- ter comes from outside of the system creating a net retention of organic matter (Mitsch and Gosselink 2007). The chemical constituents of organic matter are categorized by nonhumic substances (carbohy- drates, proteins, fats), phenolic substances (lignins and tannins) and humic substances (Stevenson 1994). The storage of organic matter, in other words, is the storage of carbon in an ecosystem. It is also to be kept in mind that in our ecosys- tem, the wetlands occupy only 4–6% of the earth’s Keywords. Total organic carbon; cations; Ramsar site; East Kolkata wetland; composite wastewater; geostatistical methods; spatial maps. J. Earth Syst. Sci. 123, No. 4, June 2014, pp. 729–740 c Indian Academy of Sciences 729
-
Upload
independent -
Category
Documents
-
view
2 -
download
0
Transcript of Assessment of the spatio-temporal distribution of soil properties in East Kolkata wetland ecosystem...
Assessment of the spatio-temporal distribution of soilproperties in East Kolkata wetland ecosystem
(A Ramsar site: 1208)
S Pal1,3,∗, S Manna
2, A Aich3, B Chattopadhyay
3 and S K Mukhopadhyay4
1Department of Conservation Biology, Durgapur Government College, Durgapur 713 214, West Bengal, India.2School of Oceanographic Studies, Jadavpur University, Kolkata 700 032, West Bengal, India.
3Government College of Engineering & Leather Technology, Salt Lake, LB-III, Kolkata 700 098,West Bengal, India.
4Hooghly Mohsin College, Hooghly, Chinsurah 712 101, West Bengal, India.∗Corresponding author. e-mail: [email protected]
The present investigation was made to characterize spatial and temporal variations in soil properties andto evaluate possible differences that could be dependent on the tannery effluent discharges, municipalsewage discharges, vegetation cover, soil settlement rate, crop rotation, etc. Soil total organic matter(TOM), cations like, Sodium (Na), Ammonium (NH4), Potassium (K), Calcium (Ca) and Magnesium(Mg) contents in the bank soils and bottom sediments were recorded from seven different characteristicsites in East Kolkata wetland ecosystem, a Ramsar site (Ramsar site No. 1208). The profile maps wereconstructed by geostatistical methods to describe the spatial distribution as well as temporal variationsof all the factors to identify the influences of composite wastewaters. The work was initiated to identifycauses and consequences of the waste dumping in the concerned region for the past hundred years andthereby to suggest necessary precautionary measures to prevent further loss of soil quality.
1. Introduction
Organic matter plays a major role in wetlandecosystem. It affects various biochemical processes,chemical transport, bio-availability of nutrientsand nutrient cycling. The soil organic matter(SOM) is also a very sensible indicator of climate,and it can also indicate climate changes (Xiaoet al. 1999). SOM is also an important ecologi-cal entity of wetland ecosystems and it influencesthe productivity of these areas. In case of anaer-obic respiration, organic matter decomposition isoften incomplete. Therefore, lack of oxygen is oneof the main factors determining plant detritus
turnover. The organic matter is either producedfrom the wetlands itself and it gets accumulated inwetlands at different decomposition stages (Collinsand Kuehl 2001; Holden 2005), or the organic mat-ter comes from outside of the system creating a netretention of organic matter (Mitsch and Gosselink2007). The chemical constituents of organic matterare categorized by nonhumic substances (carbohy-drates, proteins, fats), phenolic substances (ligninsand tannins) and humic substances (Stevenson1994). The storage of organic matter, in otherwords, is the storage of carbon in an ecosystem.It is also to be kept in mind that in our ecosys-tem, the wetlands occupy only 4–6% of the earth’s
Keywords. Total organic carbon; cations; Ramsar site; East Kolkata wetland; composite wastewater; geostatistical
methods; spatial maps.
J. Earth Syst. Sci. 123, No. 4, June 2014, pp. 729–740c© Indian Academy of Sciences 729
730 S Pal et al.
land area (Matthews and Fung 1987; Aselmannand Crutzen 1989) but among 350–535 Gt car-bon (Post et al. 1982; Gorham 1995; Mitra et al.2005), corresponding to 20–25% of the world’sorganic soil carbon. So, assessment of percentageof SOM is necessary to adopt strategies for pol-icy making, planning, and implementation pro-cesses for improving carbon storage of that area.Apart from this, it is very important to knowthe composition of SOM containing essential nutri-ents like Na, NH4, K, Ca, Mg in soil samplesfrom the study area because all these nutrientshave a major role in prokaryotic and eukaryoticgrowth, helping in proper cell division and elon-gation, cell wall development, metabolism, enzymeactivity, etc. On the contrary, these cations preventsoil enzymes inhibition by interacting with organicmatter (Reddy and Delaune 2008). Temperature isalso one of the key regulators for biogeochemicalprocess in a wetland ecosystem. Depending uponthe seasons the temperature changes by whichmicrobial activity, organic matter, decompositionrate are altered. Therefore, indepth understandingabout these cations and organic matter concentra-tion in spatio-temporal scale are very much neededto maintain the ecological and economical valuesof wetland ecosystems.
The East Kolkata Wetland (EKW) ecosystem,a globally focused wetland area, has been usedsustainably for resource recovery and ameliora-tion of toxic wastes (Chatterjee et al. 2006).Thereby, the concerned wetland area has gainedmuch attention of the scientists from the standpoint of ecosystem health and human health.The Kolkata city wastewater has been produc-tively used in pisciculture and agriculture for thepast several decades. On the journey through thewastewater carrying canals (Dry Weather Flowand Storm Water Flow canals), wastewater is pro-ductively used in pisciculture and as irrigationwater in agricultural farms on garbage dumping.Spill-over wastewater from wastewater-fed fish-eries and agricultural runoff are mixed with canalwastewater to influence the characteristics of thewastewater dramatically. Chattopadhyay et al.(2004) recorded spatial and temporal changes ofphysico-chemical factors like air and water tem-perature, water velocity, pH, conductivity, TDS,TSS, DO, nitrate, phosphate, sulfate, chlorides,BOD and COD of water of four different siteson the wastewater carrying canal of the EKWecosystem. The EKW produced 10,915 metric tonsof fish annually along with the garbage farmingand yielded nearly 370,650 kg ha−1Y−1 vegeta-bles, which amounts to 150 metric tons of vegeta-bles daily (Chatterjee et al. 2006). Wastewater inthe EKW areas has been used for wastewater-fedfish farming and as irrigation water for garbage
farming for the last several decades with ahigh risk of contamination with waste elements.Chatterjee et al. (2006) studied the occurrenceof six elements, namely, Cr, Mn, Fe, Cu, Znand Pb in water, bottom soil of the wastewater-fed fish ponds together with the accumulation ofthese elements in the tissues of two cichlid fishspecies cultivated in wastewater-fed fish pondsof EKW. Information on soil characteristics andthe amelioration capacity of the vast economi-cally important EKW region is, thereby, thoughtto be extremely important from the standpointof ecosystem services. No such systematic workson soil quality are on record from the concernedwetland ecosystem. Therefore, the explicit objec-tive of this study is to identify the changes inspatial and temporal patterns of physical andchemical properties of soil with special referenceto agriculturally important factors like soil totalorganic matter (TOM), cations like, Sodium (Na),Ammonium (NH4), Potassium (K), Calcium (Ca)and Magnesium (Mg), involving different seasonsof the year. To show this spatio-temporal variationmore minutely, with the help of global position-ing systems, geographic information systems, andgeostatistics, the interpolation and extrapolationmaps are constructed. The geostatistical methods,formulated mathematically, allow the random vari-ation in soil properties. This method ensures thatthe prediction error is minimum for the observedvariables and it also provides confidence for thepredictions of unsampled locations. In addition,the process quantifies the detrimental impact ofanthropogenic activity on wetlands, the areas dif-ficult to approach physically, at spatio-temporalscale, and provides valuable information on theareas concerned to design strategies for wetlandconservation and restoration projects. Though suchlandscape-scale assessments have attracted lit-tle attention in India, a good number of publishedinformation is available from different parts ofthe globe (Craft and Richardson 1998; DeBuskand Reddy 1998, 2003; DeBusk et al. 2001; Brulandand Richardson 2004, 2005; Grunwald et al. 2005;Corstanje et al. 2006). Such understanding wouldhelp us to plan future research efforts, aiming atwise use of the EKW by the way of sustain-able pisciculture and agricultural practices on theone hand and on the other, to record seasonwiseand sitewise sequestration of carbon and otherpollutants spewed by the city of Kolkata.
2. Materials and methods
2.1 Study area and site description
The East Kolkata Wetland (EKW; lat. 22◦25′–22◦40′N; long. 88◦22′–88◦35′E), currently a Ramsarsite (No. 1208), is widely considered as a unique
Spatio-temporal distribution of soil properties in East Kolkata wetland 731
site which demonstrates the natural reduction oftoxicity by the biota and physico-chemical inter-actions. The elevation profile of the study arearanged between 1 and 5 m, with a gradual slo-ping from west to east. This causes natural uni-directional flow of sewage water in EKW. TheEKW has received untreated municipal and indus-trial wastewater from the city through differentcanals and channels for the last 100 years. Thetotal area of 12,741 ha, comprised water spreadof an area of 4728 ha, degraded water spread 1124ha, agricultural land 4959 ha, garbage farming area602 ha and urban and rural settlement nearly 1326ha. Huge composite industrial effluent (50,000 m3
d−1) mixed with city sewage from Kolkata city isdischarged, without any pre-treatment and nearly2000–3000 metric tons of solid wastes in differ-ent forms are being deposited daily in the EKWareas. The EKW, thus, receives enormous amountof nutrients that support rich and luxuriant pri-mary producers on the one hand and trap unusedcarbon in different physico-chemical states. Chem-ical compounds, especially from leather industry(Mukherjee et al. 2013), in the abiotic environmentof the EKW are also important in sequesteringcarbon, other elements, and nutrients in the EKW.
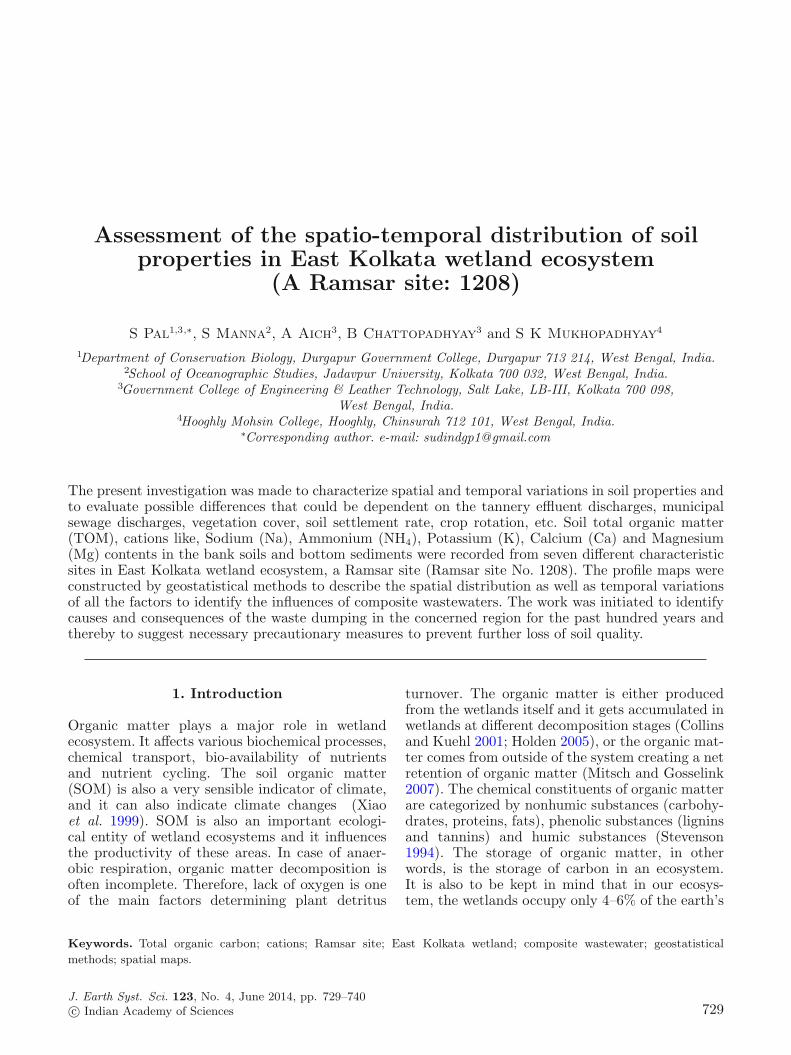
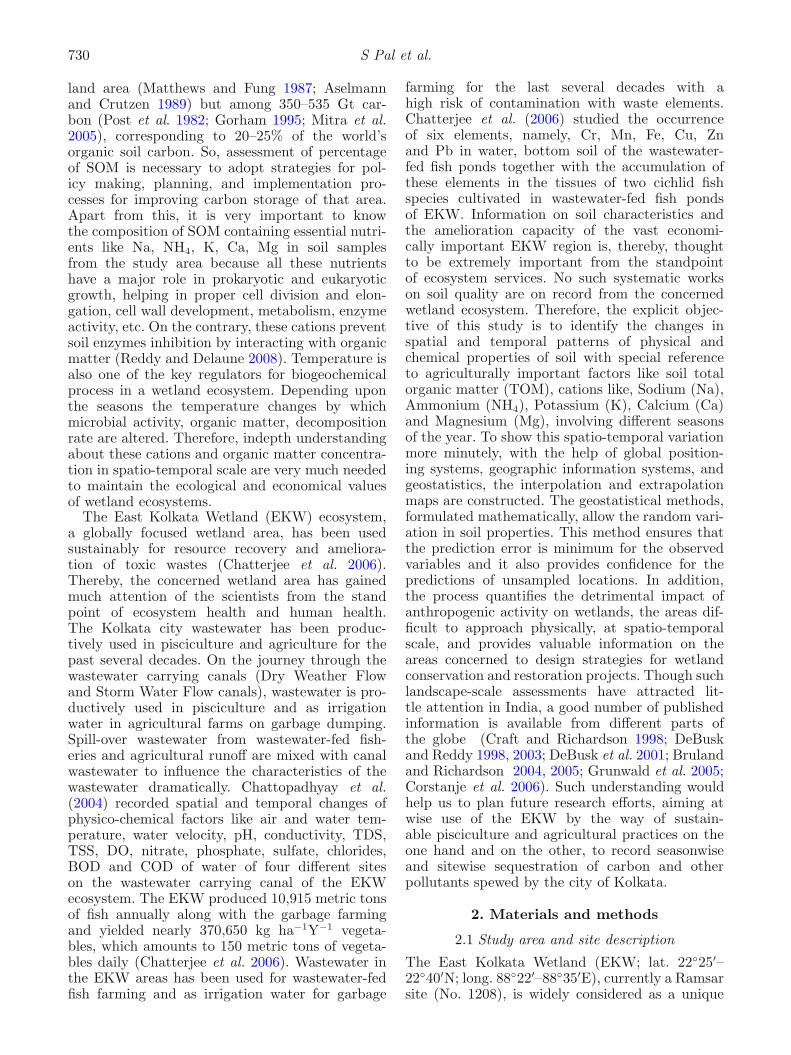
Depending upon the different wastewater inputs,the canal’s characteristics were changed whichmight have affected the surrounding area. Based onthe wastewater input and use, seven different char-acteristic sites (with roughly overlapping bound-aries) are taken from where the soils are collected.Site-I is located around 1 km away from Tan-gra tannery agglomerate (China town) of Kolkatafrom which a canal carries raw composite tanneryeffluent; Site-II is the area of tannery effluent-fedfish ponds, adjacent to Site-I; Site-III is locatedaround 8 km away from Site-I where the tanneryeffluent is being mixed with municipal wastewa-ter and other industrial effluents coming throughBallygunge Pumping Station; Site-IV is the areaof wastewater-fed fish ponds at Chowbaga, nearly0.5 km away from Site-III; Site-V is near KolkataLeather Complex (KLC), Bantala, around 15 kmaway from Site-I; this is the area where furthercomposite tannery effluents from the KLC aremixed with heterogeneous wastewater; Site-VI islocated between Site-IV and Site-VII, nearly 30 maway from Site-I. Site-VII, nearly 40 m away fromthe Site-I, where effluents are discharged finallyinto the Kultigong River (figure 1). The majorcanals from which EKW has received differentwaste water are shown in figure 2.
2.2 Soil sampling and analysis
Soils samples are sampled from seven differentselected site areas. The sampling has been done
Figure 1. Site map of East Kolkata wetland ecosystem.(India and West Bengal maps are not in scale.)
Figure 2. Entry points of sewage in East Kolkata wetlandecosystem.
randomly, 3–4 km radius around each demarcatedsite. Bank soils of the margin of the wastewatercarrying canals and from agricultural farms are col-lected from the upper 2 cm layer. Collected soilsamples are dried at 60◦C in a hot air oven. Driedsoil samples are hand picked off visible roots and
732 S Pal et al.
leaves and then ground into a powder and sievedwith a 2 mm sieve. The percentage of soil totalorganic carbon is determined by Walkley–Blackmethod, and by multiplying with 1.724 the per-centage of soil organic matter has been derived(Eaton et al. 1995). Cations like Sodium (Na),Ammonium (NH4), Potassium (K), Calcium (Ca)and Magnesium (Mg) are determined by MethromIon Exchange Chromatograph (Jackson 2000).
The statistical analysis like single linkage Euclid-ian distance of different variables by STATISTICAw 5.0 software and all the bar graphs with standarddeviation are made by using Origin 6.1 software.
2.3 Generation of spatial interpolation maps
The spatial interpolation maps are generated byusing ArcGIS 9.3 software. The surface soil is anal-ysed using deterministic method to generate spa-tial maps of six different parameters. Since theterrain has an unchanged elevation gradient withrespect to mean sea level and the study is made in asmall area covering a radius of 25 km, the effects ofwastewater on the soil on either side of the canalspassing through EKW for use of wastewater in pis-ciculture and agriculture are assessed with system-atic sampling of seven zones through three seasons,namely, pre-monsoon, monsoon and post-monsoon.The maps were produced using exact interpolatorwhere the spatially predicted values are similar tomeasured values. We used radial basis functionsand the functions are described in Bishop (1995).Further descriptions of radial basis functions andtheir relationships to splines and kriging can befound in Cressie (1993) and Chiles and Delfinder(1999).
The wetlands and settlements including man-made structures were mapped from IRS P6 LISS4 image of 2012. The satellite image was geo-metrically and atmospherically corrected for thisdelineation. Normalized Differential VegetationIndex – NDVI (Tucker 1979) has been used effi-ciently for wetland studies (Ozesmi and Bauer2002) and also in our study for preparing landuse–landcover map of EKW. The image was takenin February which was post-harvest period forthe study area and also atmospheric interferencesremained less during that time. The base map withfewer classes was prepared using unsupervised clas-sification on NDVI image. Post-classification accu-racy was assessed by ground truthing, using groundcontrol points, which were collected from studyarea acquired by Garmin GPS 72 and visual inter-pretation from Google Earth. The new resultantclasses were merged to produce new image with twoclasses; ‘water bodies and settlement’ and ‘others’.Water bodies and settlement comprised of all the
surface water features and man-made structuresincluding buildings, culverts, metal and concreteroads. The final image was used as a mask on theinterpolation maps.
3. Result
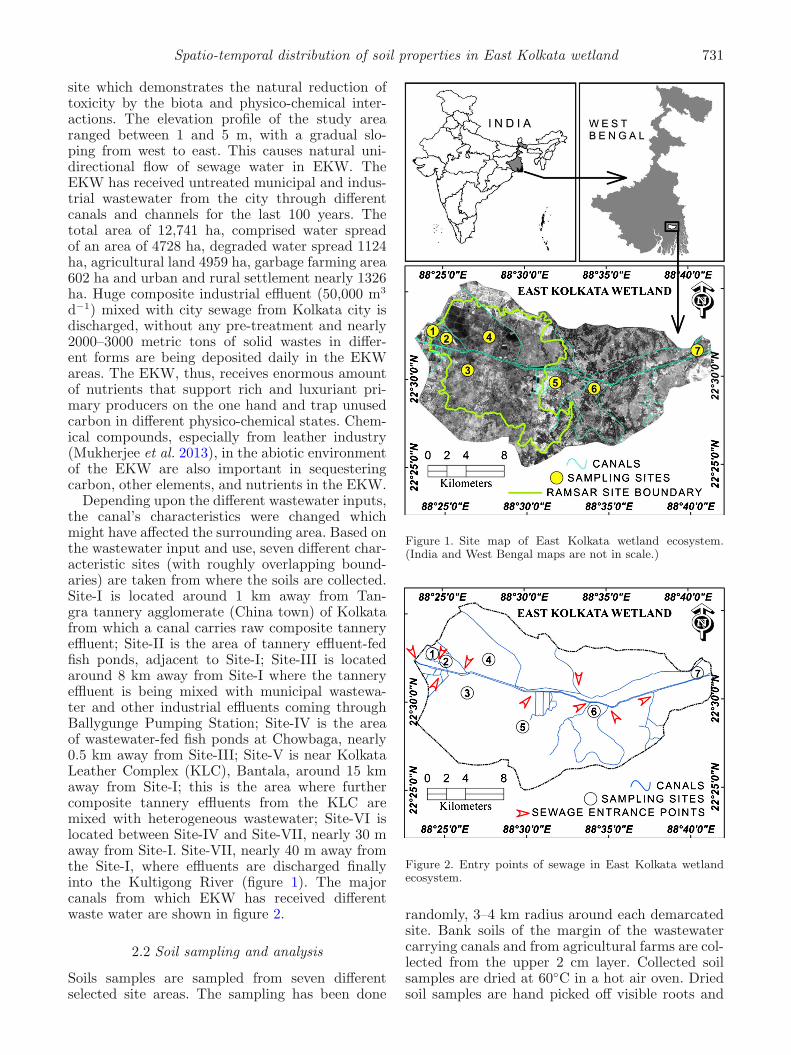
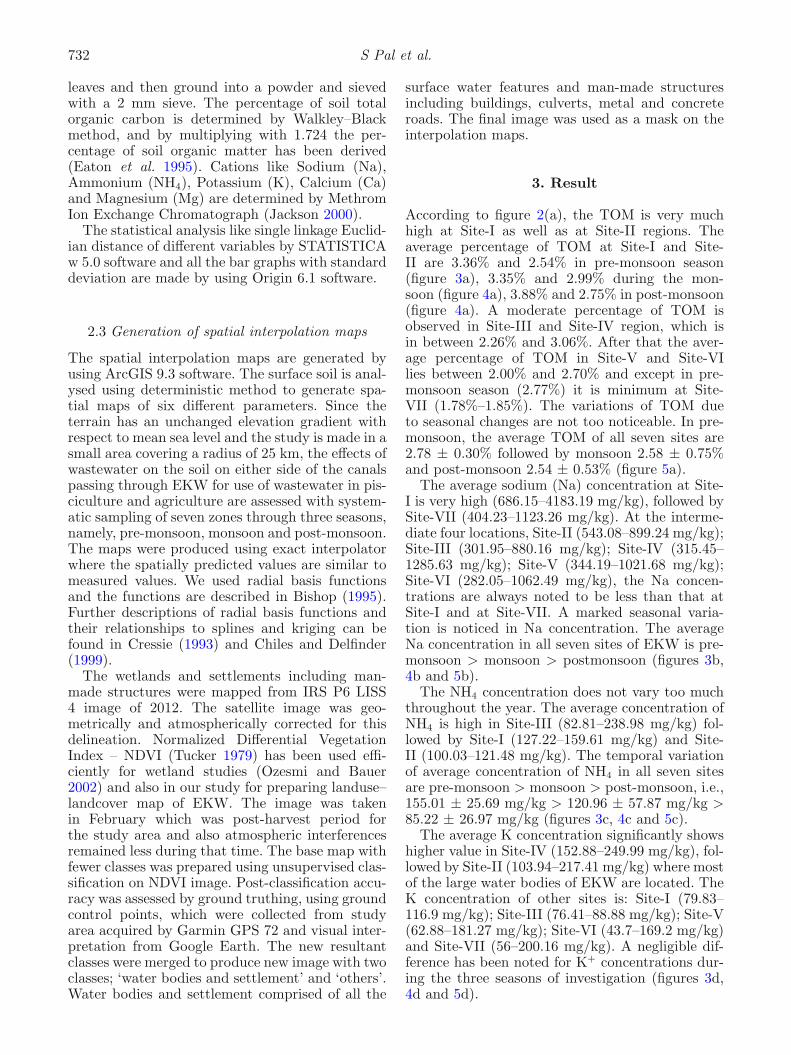
According to figure 2(a), the TOM is very muchhigh at Site-I as well as at Site-II regions. Theaverage percentage of TOM at Site-I and Site-II are 3.36% and 2.54% in pre-monsoon season(figure 3a), 3.35% and 2.99% during the mon-soon (figure 4a), 3.88% and 2.75% in post-monsoon(figure 4a). A moderate percentage of TOM isobserved in Site-III and Site-IV region, which isin between 2.26% and 3.06%. After that the aver-age percentage of TOM in Site-V and Site-VIlies between 2.00% and 2.70% and except in pre-monsoon season (2.77%) it is minimum at Site-VII (1.78%–1.85%). The variations of TOM dueto seasonal changes are not too noticeable. In pre-monsoon, the average TOM of all seven sites are2.78 ± 0.30% followed by monsoon 2.58 ± 0.75%and post-monsoon 2.54 ± 0.53% (figure 5a).
The average sodium (Na) concentration at Site-I is very high (686.15–4183.19 mg/kg), followed bySite-VII (404.23–1123.26 mg/kg). At the interme-diate four locations, Site-II (543.08–899.24 mg/kg);Site-III (301.95–880.16 mg/kg); Site-IV (315.45–1285.63 mg/kg); Site-V (344.19–1021.68 mg/kg);Site-VI (282.05–1062.49 mg/kg), the Na concen-trations are always noted to be less than that atSite-I and at Site-VII. A marked seasonal varia-tion is noticed in Na concentration. The averageNa concentration in all seven sites of EKW is pre-monsoon > monsoon > postmonsoon (figures 3b,4b and 5b).
The NH4 concentration does not vary too muchthroughout the year. The average concentration ofNH4 is high in Site-III (82.81–238.98 mg/kg) fol-lowed by Site-I (127.22–159.61 mg/kg) and Site-II (100.03–121.48 mg/kg). The temporal variationof average concentration of NH4 in all seven sitesare pre-monsoon > monsoon > post-monsoon, i.e.,155.01 ± 25.69 mg/kg > 120.96 ± 57.87 mg/kg >85.22 ± 26.97 mg/kg (figures 3c, 4c and 5c).
The average K concentration significantly showshigher value in Site-IV (152.88–249.99 mg/kg), fol-lowed by Site-II (103.94–217.41 mg/kg) where mostof the large water bodies of EKW are located. TheK concentration of other sites is: Site-I (79.83–116.9 mg/kg); Site-III (76.41–88.88 mg/kg); Site-V(62.88–181.27 mg/kg); Site-VI (43.7–169.2 mg/kg)and Site-VII (56–200.16 mg/kg). A negligible dif-ference has been noted for K+ concentrations dur-ing the three seasons of investigation (figures 3d,4d and 5d).

Spatio-temporal distribution of soil properties in East Kolkata wetland 733
Figure 3. (a–f) Maps of spatio-temporal pattern of six different factors in soil of East Kolkata wetland ecosystem duringpre-monsoon.
A significant amount of Ca is present inEKW soil. The Ca+ concentration is alwayshigh in all three seasons studied and theextent of fluctuations is not distinguishable.Site-I contains 2265.6–2568.81 mg/kg followedby Site-III (1404.26–2201.7 mg/kg) and Site-V
(928.64–1274.67 mg/kg). The Ca concentrationsof large water bodies of surrounding area areSite-II (725.33–989.03 mg/kg) and Site-IV (737.2–934.06 mg/kg). Perceptible differences of averageCa concentrations are noted between pre-monsoonand the other two seasons (figures 3e, 4e and 5e).

734 S Pal et al.
Figure 4. (a–f) Maps of spatial variation of six different parameters in soil of East Kolkata wetland ecosystem duringmonsoon.
Mg is another constituent of most agriculturallime. Predictable in Site-I (250.95–349.38 mg/kg)Ca content is higher than in others except Site-III in monsoon. The average Mg concentrations ofall sites in all three seasons are Site-II (151.03–230.18 mg/kg); Site-III (147.4–370.08 mg/kg);
Site-IV (168.22–211.85 mg/kg); Site-V (170.95–255.81 mg/kg); Site-VI (138.98–239.2 mg/kg);Site-VII (145.98–239.1 mg/kg). During pre-monsoon (251.15 ± 43.7 mg/kg) and post-monsoon(169.92 ± 37.58 mg/kg), the difference among theseven sites is not significant; significant differences
Spatio-temporal distribution of soil properties in East Kolkata wetland 735
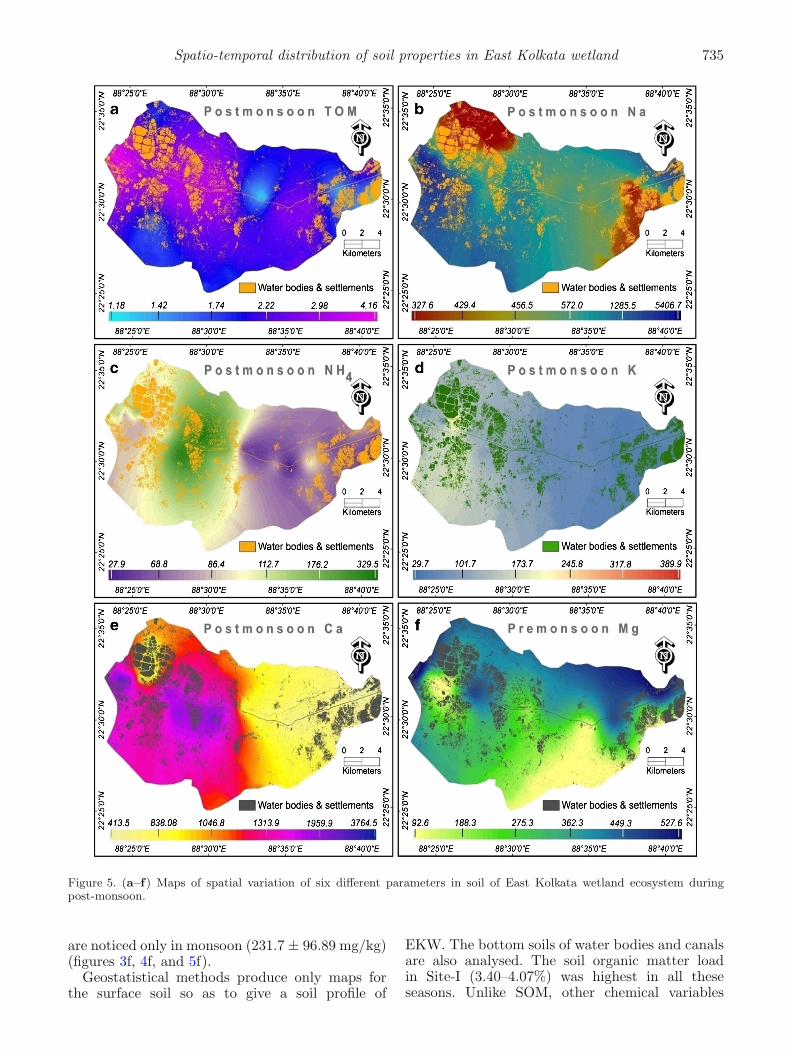
Figure 5. (a–f) Maps of spatial variation of six different parameters in soil of East Kolkata wetland ecosystem duringpost-monsoon.
are noticed only in monsoon (231.7 ± 96.89 mg/kg)(figures 3f, 4f, and 5f).
Geostatistical methods produce only maps forthe surface soil so as to give a soil profile of
EKW. The bottom soils of water bodies and canalsare also analysed. The soil organic matter loadin Site-I (3.40–4.07%) was highest in all theseseasons. Unlike SOM, other chemical variables
736 S Pal et al.
in bottom soils were also relatively high in pre-monsoon, viz., Na (2458.8 ± 1903.6 mg/kg); NH4
(174.37±97.49 mg/kg); K (178.17±131.17 mg/kg);Ca (2111.7 ± 1504.8 mg/kg); Mg (421.75 ±112.01 mg/kg) and lowest in monsoon, Na (697.78± 225.22 mg/kg); NH4 (111.66 ± 41.94 mg/kg);K (106.15 ± 42.72 mg/kg); Mg (273.92 ±60.88 mg/kg) except Ca (1504.8 ± 491.59 mg/kg)which is lowest in post-monsoon (1378.1 ±548.66 mg/kg).
4. Discussion
Organic matter is added to wetlands from bothinternal and external sources. The internal sourcesinclude the dead parts of macrophytes, detritalmatter from algal and microbial mats and thebelow ground portion such as roots and rhizomes(Reddy and Delaune 2008). The external sourcesare mostly municipal sewage water and industrialwastewater. So, it may be pointed out that the highvalue of TOM in Site-I and Site-II, is due to thepresence of the raw tannery effluent carrying canaland the tannery effluent-fed fish ponds in thoseregions. Similarly, the tannery effluent, municipalwastewater and industrial wastewater are mixed atSite-III and the mixed wastewater is used at Site-IV for pisciculture and agriculture, causing mode-rate availability of TOM at both the sites. Fromthe previous study of water characteristics of EKW(Chattopadhyay et al. 2004), a gradual decreasewas recorded after Site-III region. Possibly due torelocation of tanneries at Bantala (Kolkata LeatherComplex), the entry of tannery effluent in Site-V causes the TOM content to be high. Similarly,the high TOM content at Site-VI may be due tothe agricultural runoff water. The lower percent-age of TOM in Site-VII is possibly due to strongtidal effects and lack of wastewater sources in thisregion.
Sodium is a highly important nutrient of anecosystem. The availability of Na is dependenton the reaction rate between soil solutions andexchangeable phases of Na, which is stronglydependent on the type of clay minerals present(Li and Ji 1992). As raw tannery effluent containssodium chloride used in tannery operation calledsalt-pickling, the Na concentration is high in Site-I and in Site-VII, the direct influence of tides,where saline water containing sodium salt period-ically flushes the location, makes the Na concen-tration high. In pre-monsoon periods the averageair temperature is noted above 38◦C, therefore, theevaporation rate is high and as a consequence, ahigh Na concentration is recorded in pre-monsoonperiods (figure 3b). In the monsoon season, per-haps due to heavy rainfall, Na drips downwards
from surface soil and is also flushed with runoff.A marked decrease at all seven sites is due tosuch Na removal from soil surface during monsoon(figure 4b). In the post-monsoon season, most ofthe EKW areas are used for agriculture and Nauptake as an essential nutrient for plant growthmay be envisaged. Thereby, may be the uptake ofNa by cultivated plants reduces the Na concentra-tion in soil in post-monsoon periods (figure 5b).
Similar to Na, the spatial variation of othercations like ammonium (NH4), potassium (K), Cal-cium (Ca), and Magnesium (Mg) show more orless the same general pattern. Barshad (1951)explains that when ammonia reaches the soil sur-face, it reacts with water and gets transformedinto ionic form ammonium (NH+
4 ). This NH4 dis-associates or it is nitrified into nitrite (NO−
2 ) ornitrate (NO−
3 ) releasing H+ ions into the soil. Ifnot, then it is transformed into methane which isremoved from the soil by runoff or leaching. Theuses of ammonium chloride and ammonium sulfatein the tanning process are the main sources of NH4
of EKW ecosystem. During the pre-monsoon sea-son, at Site-V to Site-VII, the NH4 concentrationis low which may be due to gradual filtration byEKW ecosystem (figure 3c). The concentration ishigh during monsoon at all sites possibly due torunoff on either side of the canal area and is com-paratively low at agricultural field (figure 4c). TheNH4 content is lower in the post-monsoon seasonthan in the other two seasons, perhaps because thepost-monsoon period is conducive for the growthof nitrifying bacteria (figure 5c).
A very small amount (only 0.1–2.0%) of K+ fromthe total K pool is available for plants (Schroeder1979; Bertsch and Thomas 1985). Much of theunavailable K is bound with other minerals. TheK+ are attracted to and held by negatively chargedcolloids (Sparks 1980) which make up the cationexchange capacity (CEC) of the soil and anincrease of CEC increases the uptake of K+ byplants. The K+ is higher at Site-III and Site-IVwhere most of the large water bodies of EKWare located and may be with the increase of soilwater contained in the adjacent areas, the CEC ofthe soil increases as pointed out by Sparks (2000).During the pre-monsoon season, high evaporationrate together with low soil water content probablycauses less uptake of K+ by plants and high K+
concentration in upper soil (figure 3d). However,during monsoon, rainfall increases the soil watercontent, but may be due to leaching and runoffthe K+ is low in surface soil (figure 4d). Further,due to high TOM, the K+ that may be associatedwith TOM increases CEC and in turn causes anincrease in plant uptake, thereby, decreasing K+
concentration of soil during post-monsoon periods(figure 5d).
Spatio-temporal distribution of soil properties in East Kolkata wetland 737
Calcium (Ca) is found with many of the pri-mary and secondary minerals in the soil and it isrelatively insoluble. The Ca+ is the soluble form
which plants can imbibe directly from soil. Intanning industry the sodium salt is used in highquantities during industrial processing and due to
1 2 3 4 5 6 70.0
0.5
1.0
1.5
2.0
2.5
3.0
3.5
4.0
4.5
a TOM
%
1 2 3 4 5 6 70
50
100
150
200
250
300
350
400
450
e
mg
/kg
NH4
1 2 3 4 5 6 70
500
1000
1500
2000
2500
3000
3500
4000
i
mg
/kg
Ca
1 2 3 4 5 6 70.0
0.5
1.0
1.5
2.0
2.5
3.0
3.5
4.0
4.5
5.0
b
%
TOM1 2 3 4 5 6 7
0
50
100
150
200
250
300
350
400
450
f
mg
/kg
NH4
1 2 3 4 5 6 70
1000
2000
3000
4000
5000
6000
7000
j
mg
/kg
Ca
1 2 3 4 5 6 70
1000
2000
3000
4000
5000
6000
7000
8000
9000
c
mg
/kg
Na1 2 3 4 5 6 7
0
50
100
150
200
250
300
350
g
mg
/kg
K1 2 3 4 5 6 7
0
50
100
150
200
250
300
350
400
450
500
550
k
mg
/kg
Mg
1 2 3 4 5 6 70
1000
2000
3000
4000
5000
6000
7000
d
mg
/kg
Na1 2 3 4 5 6 7
0
50
100
150
200
250
300
350
400
450
500
h
mg
/kg
K1 2 3 4 5 6 7
0
100
200
300
400
500
600
700
800
l
mg
/kg
Mg
PRE MON POST
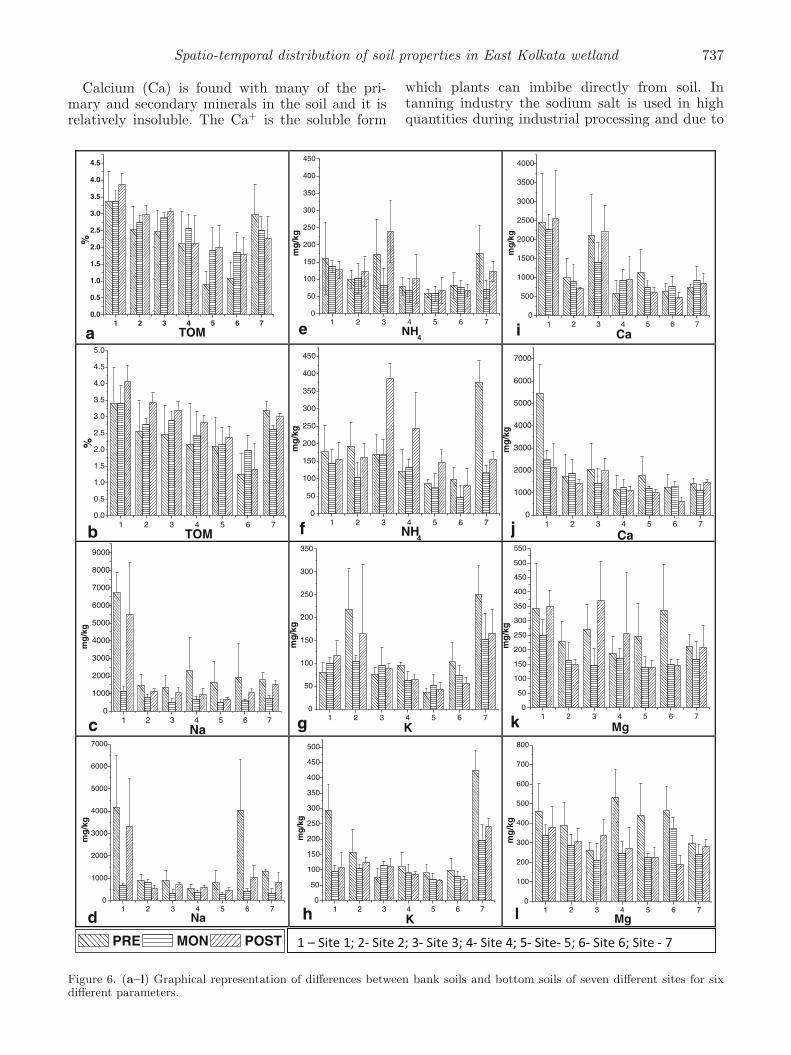
Figure 6. (a–l) Graphical representation of differences between bank soils and bottom soils of seven different sites for sixdifferent parameters.

738 S Pal et al.
the discharge of composite tannery wastewater, thesoils of EKW are enriched with sodium. Potassiumsalts, on the other hand, are much in use in agri-cultural practices as a fertilizer. For both these rea-sons, with the prevalence of Na+ and K+ in EKWsoil, perhaps the Ca+ is displaced with a reductionof uptake of Ca+ by plants (Levy et al. 1988). Rawtannery effluent at Site-I and Site-II and also theeffect of composite wastewater at Site-III and Site-IV with high load of waste Ca salts, account forhigh concentration of Ca in soil. The Ca+ concen-tration gradually decreases from Site-I to Site-VII.The Ca+ concentration is moderately high duringpre-monsoon at Site-V and VI perhaps due toreintroduction of tannery effluent and agriculturewastewater. At Site-II and Site-IV, where the max-imum number of water bodies are located at EKW,most of these are dried up to avoid the eutrophiccondition during pre-monsoon and at that time anadequate amount of lime (CaCO3) is used to neu-tralize soil acidity (figure 3e). Probably as in case ofother cations, the Ca+ concentration decreases insoil as it is diluted and flushed out in the monsoonrain (figure 4e). However, during post-monsoon, itis slightly higher than in monsoon (figure 5e) as itsretention in soil increases with receding monsoonflush off.
Soil Mg++ adheres to soil colloidal complex.Mg++ availability is related to soil CEC and it isin competition with other cations with K+ beinga stronger competitor (Levy et al. 1988). The soiladsorption of Ca is preferred over Mg (Spositoet al. 1986). During pre-monsoon, the differenceamong the seven sites is not significant; only atSite-I the Mg concentration is slightly high andtidal saline water which contains Mg-salt enrichesthe soil contained at the adjoining areas of Site-VIand Site-VII (figure 3f). The composite wastewaterat Site-III, which contains the municipal wastew-ater in bulk mixed with tannery wastewater, isthe possible cause for the presence of high amountof Mg++ during pre-monsoon and monsoon sea-sons (figure 4f). In the post-monsson season, theMg content of soil again increases in all the sitespossibly due to the use of Mg salts (magnesium car-bonate, epsom salt, Mg chelates) as plants nutrientand neutralizing agent to decrease soil acidity(figure 5f).
In temporal scale, depending upon the tanneryeffluent discharge, municipal sewage mixing, vege-tation cover, soil settlement rate, the SOM was lowin the monsoon due to heavy rainfall and soils wereflushed out, both in the case of the bank througherosion and the bottom soil through stirring andthat is why the standard deviation of mean dataset was high in some cases. During other parts ofthe year, the SOM did not fluctuate much; slightlyhigher values in winter than summer were noted
(figure 6a and b). Unlike SOM, other chemicalvariables in both bank and bottom soil, werealso relatively high in the pre-monsoon season. Inbottom soil, Ca, K, Na, Mg, and NH4 were presentin moderately high concentrations during the post-monsoon season. It should be mentioned here thatgraphical representations of data given here wereconstructed on the mean of seven study sites fortwo years. Therefore, in case of Site-VI and Site-VII, the sampling time at these locations and thetidal activities affected the dataset for the seasonalchanges of concentrations of variables under study(figure 6c–l).
Dendrogram showed the relationship between allseven sites with respect to the above-mentionedsix parameters. For bank soil and agricultural fieldsoils of EKW the water body surrounded region(Site-II and Site-IV) and reintroduction of leatherwaste and agricultural runoff area (Site-V andSite-VI) were clustered together. Untreated raw
Tree Diagram for 7 Variables
Single Linkage Euclidean distances
Bank Soil
Linkage Distance
SITE_7
SITE_3
SITE_6
SITE_5
SITE_4
SITE_2
SITE_1
0 500 1000 1500 2000 2500
a
Tree Diagram for 7 Variables
Single Linkage Euclidean distances
Bottom Soil
Linkage Distance
SITE 5
SITE 7
SITE 6
SITE 4
SITE 3
SITE 2
SITE 1
0 500 1000 1500 2000 2500 3000 3500 4000
b
Figure 7. Dendrogram showing the results of hierarchicalcluster analysis on the seven sites of East Kolkata wetlandsunder investigation depending on six factors of bank soils(a) and bottom soils (b).

Spatio-temporal distribution of soil properties in East Kolkata wetland 739
tannery effluent affected area (Site-I), compositewaste water affected area (Site-III) and tidal salinewater affected area (Site-VII) are distantly clus-tered with others (figure 7a).
Bottom soil conditions were directly correlatedwith the water physico-chemical conditions. Site-II was the tannery effluent-fed fish pond, wherethe water chemical conditions were stabilized inthe bottom soil and from Site-I to Site-III the tan-nery wastewater was filtered through wetland soils.However, further mixing of municipal wastewaterpolluted the physico-chemical regimes and for thatreason Site-II and Site-III were clustered together.Similar situation was noted at Site-IV and Site-VI. The reintroduction of tannery effluent at theSite-V, due to relocation of tanneries at KolkataLeather Complex, near the Site-V, formed a distantcluster separated from other clusters (figure 7b).
5. Conclusions
From the present study it was revealed that EKWhas a great potential for the storage of organic mat-ter in soil, and in turn the storage of carbon. Thecarbon storage efficiency of EKW give this eco-nomically as well as ecologically important wetlandecosystem an extra count towards conservation,sustainable development and the wise use of thisregion. It was evident from the present study thatcomposite wastewater enhanced the concentrationof cations in soil samples. In high concentrations,competition between these cations reduces theiruptake through plants (Sposito et al. 1986; Levyet al. 1988) which directly affect the developmentof plant species and decrease the productivity ofa system. EKW is very much economically impor-tant for pisciculture and agriculture operations.Thus certain control measures should be taken toavoid such accelerated waste discharge from thisfragile ecosystem. Spatial distributions of chemicalfactors in surface soils showed noticeable variabi-lity in East Kolkata Wetland and clear distributionpatterns were noted among the seven sites. Thisillustrates that spatially explicit model of samplingis needed to confirm the underlying variability ofsoil properties. In this study, in combination withthe geostatistics, the spatially explicit samplingapproach served as a model for the estimation ofsoil properties and it could also act as a guide fora comprehensive plan for the conservation of thefragile ecosystem, East Kolkata Wetlands. Detailedholistic studies could only make this natural efflu-ent treatment plant, with which the Kolkata city’seastern backyard is blessed, more efficient in ame-liorating hazardous wastes and would prove thearea safe for productive use in agriculture and
pisciculture by the introduction of proper manage-ment strategies.
Acknowledgements
First author thankfully acknowledges INSPIREDivision, Department of Science and Technology,Ministry of Science and Technology, Govt. of Indiafor INSPIRE Fellowship and contingency grants.Authors express their thanks to Dr Anjan Biswasfor providing the laboratory facilities and DrSugata Hazra for his valuable help. The authorsalso express gratitude to the Director of PublicInstruction and the Director of Technical Educa-tion, Govt. of West Bengal, India, for co-operationand necessary support. SKM also expresses hisgratitude to the University Grants Commission fora minor research grant with which a part of thepresent work has been supported.
References
Aselmann I and Crutzen P J 1989 Global distribution ofnatural freshwater wetlands and rice paddies, their netprimary productivity seasonality and possible methaneemissions; J. Atmos. Chem. 8 307–358.
Barshad I 1951 Cation exchange in soils: I. Ammonium fixa-tion and its relation to potassium fixation and to deter-mination of ammonium exchange capacity; Soil Sci. 77463–472.
Bertsch P M and Thomas G W 1985 Potassium status oftemperate region soils. In: Potassium in agriculture (ed.)Munson R D, American Society of Agronomy, Madison,WI, pp. 131–162.
Bishop C M 1995 Neural networks for pattern recognition;Oxford Press, Oxford, 482p.
Bruland G L and Richardson C J 2004 A spatially explicitinvestigation of P sorption and related soil properties intwo riparian wetlands; J. Environ. Qual. 33 785–794.
Bruland G L and Richardson C J 2005 Spatial variabilityof soil properties in created, restored and paired naturalwetlands; Soil Sci. Soc. Am. J. 69 273–284.
Chatterjee S, Chattopadhyay B and Mukhopadhyay S K2002 Bioaccumulation of metals in the East KolkataWetland Ecosystem; Aquat. Eco. Health Manag. 5(2)191–203.
Chatterjee S, Chattopadhyay B and Mukhopadhyay S K2006 Trace metal distribution in tissues if cichlids (Ore-ochromis niloticus & O. mossambicus) collected fromwastewater-fed fishponds in East Kolkata wetlands, aRamsar site; Acta Ichthyol. et Piscat 36(2) 119–125.
Chattopadhyay B, Chatterjee S and Mukhopadhyay SK 2004 Seasonality in physico-chemical parameters oftannery wastewater passing through the East Kolkatawetland ecosystem; J. Soc. Leath. Tech. Chem. 88(1)27–36.
Chiles J and Delfinder P 1999 Geostatistics. Modeling SpatialUncertainty; John Wiley & Sons, New York, 695p.
Collins M E and Kuehl R J 2001 Organic matter accumu-lation in organic soils. In: Wetland soils. Genesis, hydrol-ogy, landscapes, and classification (eds) Richardson J Land Vepraskas M J, Lewis, CRC, Boca Rato, pp. 137–162.

740 S Pal et al.
Corstanje R, Grunwald S, Reddy K R, Osborne T Z andNewman S 2006 Characterization of the spatial distri-bution and uncertainty of soil properties in Water Con-servation Area 1, South Florida; J. Environ. Qual. 35938–949.
Craft C B and Richardson C J 1998 Recent and long-termorganic soil accretion and nutrient accumulation in theEverglades; Soil Sci. Soc. Am. J. 62 834–843.
Cressie N 1993 Statistics for Spatial Data; John Wiley andSons, New York, 900p.
DeBusk W F, Newman S and Reddy K R 2001 Spatio-temporal patterns of soil phosphorus enrichment in Ever-glades Water Conservation Area 2A; J. Environ. Qual.30 1438–1446.
DeBusk W F and Reddy K R 1998 Turnover of detritalorganic carbon in a nutrient-impacted Everglades Marsh;Soil Sci. Soc. Am. J. 62 1460–1468.
DeBusk W F and Reddy K R 2003 Nutrient and hydrologyeffects on soil respiration in a northern Everglades marsh;J. Environ. Qual. 32 702–710.
Eaton A D, Clesceri L S and Greenberg A E 1995 StandardMethods of the Examination of Water and Wastewater ;19th edn, American Public Health Association, Washing-ton DC.
Gorham E 1995 Biotic Feedbacks in the Global Climatic Sys-tem (eds) Woodwell G M and MacKenzie F T, OxfordUniversity Press, New York, pp. 169–187.
Grunwald S, Corstanje R, Weinrich B E and Reddy K R2005 Spatial patterns of labile forms of phosphorus in asubtropical wetland; J. Environ. Qual. 35 378–389.
Holden J 2005 Peatland hydrology and carbon release: Whysmall scale process matters; Phil. Trans. Roy. Soc. 3632891–2913.
Jackson P E 2000 Ion chromatography in environmentalanalysis; In: Encyclopedia of Analytical Chemistry (ed.)Meyers R A (Chichester: John Wiley & Sons Ltd), pp.2779–2780.
Levy G J, Van der Watt H V H and Du Plessis H M 1988Effect of sodium-magnesium and sodium calcium systemson soil hydraulic conductivity and infiltration; Soil Sci.146 303–310.
Li H Y and Ji G L 1992 Adsorption of potassium and sodiumions by variable charge soils; Pedosphere 2 245–254.
Matthews E and Fung I 1987 Methane emissions from natu-ral wetlands: Global distribution, area and environmen-tal characteristic of sources; Global Biogeochem. Cycles 161–86.
Mitra S, Wassmann R and Vlek L G P 2005 An appraisal ofglobal wetland area and its organic carbon stock; Curr.Sci. 88(1) 25–35.
Mitsch W J and Gosselink J G 2007 Wetlands; 4th edn,Wiley, New York.
Mukherjee G, Debnath B, Mondal C and Chakraborty S2013 Importance of carbon footprint with perspective
to leather industry; J. Energy Environ. Sci. 127 177–188.
Ozesmi S L and Bauer M E 2002 Satellite remote sensing ofwetlands; Wetlands Eco. Manag. 10 381–402.
Post W M, Emanuel W R, Zinke P J and StangenbergerA G 1982 Soil carbon pools and world life zones; Nature298 156–159.
Reddy K R and Delaune R D 2008 Biogeochemistry of Wet-lands; Taylor & Francis CRC Press, USA, pp. 119–134.
Schloeder C A, Zimmerman N E and Jacobs M J 2001 Com-parison of methods for interpolating soil properties usinglimited data; Soil Sci. Soc. Am. J. 65 470–479.
Scholz M 2006 Wetland systems to control urban runoff;Elsevier, Amsterdam.
Schroeder D 1979 Structure and weathering of potas-sium containing minerals; Proc. Congress of InternationalPotash Institute 11 43–63.
Sparks D L 1980 Chemistry of soil potassium in Atlanticcoastal plain soils: A review; Comm. Soil Sci. Plant Anal.11 435–449.
Sparks D L 2000 Bioavailability of soil potassium; In: Hand-book of Soil Science D-38–D-52 (ed.) Sumner M E, CRCPress, Boca Raton, FL.
Sposito G, LeVesque C S and Hesterberg D 1986 Calcium-magnesium exchange on illite in the presence of adsorbedsodium; Soil Sci. Soc. Am. J. 50 905–909.
Stevenson F J 1986 Cycles of soils: Carbon, Nitrogen,Phosphorus, Sulfur, Micronutrients; Wiley, New York,380p.
Stevenson F J 1994 Humus Chemistry: Genesis, Compo-sition, Reactions; 2nd edn, John Wiley & Sons, NewYork.
Tucker C J 1979 Red and photographic infrared linear com-binations for monitoring vegetation; Rem. Sens. Environ.8(2) 127–150.
Vymazal J 2007 Removal of nutrients in various types ofconstructed wetlands; Sci. Total Environ. 380 48–65.
Walkley A and Black I A 1934 An examination of the Degt-jareff method for determining soil organic matter, anda proposed modification of the chromic acid titrationmethod; Soil Sci. 37 29–38.
Webster R 2000 Is soil variation random? Geoderma 97149–163.
Webster R and Oliver M A 2001 Geostatistics for environ-mental scientists; John Wiley & Sons, New York.
Whalen S C 2005 Biogeochemistry of methane exchangebetween natural wetlands and the atmosphere; Environ.Eng. Sci. 22 73–94.
Xiao C L, Ma Q and Sarigumba T 1999 Effects of soil ontrace metal leachibility from paper mill ashes and sludge;J. Environ. Qual. 28 321–333.
Zhang J B, Song C C and Yang W Y 2005 Cold seasonCH4, CO2 and N2O from freshwater marshes in northeastChina; Chemosphere 59 1703–1705.
MS received 30 May 2013; revised 24 October 2013; accepted 12 December 2013