Helical Gearbox Faults Detection and Diagnosis Based on Vibration ...
10
International Journal of Computer Engineering and Sciences Research VOL. 02, NO. 01, January-February 2020 Pages 01–09 (ISSN: 2581-8481) Available online at: www.ijcesr.com Saleh S. H. Emtaubel Page 10 Helical Gearbox Faults Detection and Diagnosis Based on Vibration Analysis Techniques Saleh S. H. Emtaubel 1 , Yoonis A. M. Esham 2 1 Department of Mechanical Engineering, The University of Omar El-Mukhtar, al-Bayda, Libya 2 Department of Mechanical Engineering, Higher Institute of Science and Technology, Tobruk, Libya Abstract: This paper describes and summarises the progress which has been made to monitor two stages of helical gearbox. This investigation was carried out using a signal vibration technique to detect helical gearbox faults. Time synchronous average (TSA) has been applied firstly to remove the noise interference and mixed in raw signals, after that, Order Tracking has been applied to get reliable results. In the industrial area, the detection of faults and diagnosis of gear transmission systems for rotating machinery are becoming more interesting subject. These include areas, such as compressors, turbines, internal combustion engines, and helicopter engines. Vibration signals from a gearbox generally are noisy, so, it is not easy to identify clear symptoms of fault in gearbox. This causes difficulty to find early symptoms of failure in a gearbox. Over recent decades, the task of the fault detection system and methods has been modified from a post processing tool to a diagnostic tool, which usually contains information for the machine operating condition, and for forecasting the available service life to reduce the maintenance cost. Results show that the frequency time domain with using time synchronous average (TSA) is a good indicator of the occurrences of faults in the gearbox, however, Order Tracking was more affective to identify faults. It is recommended that more advanced adaptive signal processing would be applied, and gear fault modelling should also be investigated for more accurate condition monitoring (CM) extraction to obtain better features identification for diagnosis gearbox faults. Keywords: Vibration Analysis, helical gearbox, Time synchronous average (TSA), Fault Diagnosis. I. Introduction Condition monitoring (CM) is one of the most common methods for inspecting sources of information. It is defined as the use of advanced technologies to identify the condition of machines, and predict failure before it happens (Runkel, 1996). Although CM is the most widely used method, there are still predictive maintenance techniques which can be used, including human senses such as hearing, and touching. Gears are considered as the most important elements used in the gearbox. In normal working condition, gearbox generates various time series compared with faulty one whether it is cracked or broken (Guan, et al., 2009). In this work, a detail background of condition monitoring of a gearbox, laboratory, and vibration testing will be presented. Faulty and healthy gear signals will be collected and analysed This research aims to understand and diagnose the fault in the gearbox based on the analysis technique, where the detection of defects in the early stages before they become critical is an important element to reduce maintenance costs. Vibrations analysis is widely used in engineering (e.g. in civil engineering) to identify the gaps in buildings, bridges, while it used in mechanical engineering to identify faults in machinery. It is well- known that, mechanical devices produce movement which is accompanied by sound and vibration. Each device has a different vibration, which can be considered as a signature of the device; if there is any malfunction effect
-
Upload
khangminh22 -
Category
Documents
-
view
4 -
download
0
Transcript of Helical Gearbox Faults Detection and Diagnosis Based on Vibration ...

International Journal of Computer Engineering and Sciences Research
VOL. 02, NO. 01, January-February 2020
Pages 01–09 (ISSN: 2581-8481)
Available online at: www.ijcesr.com
Saleh S. H. Emtaubel Page 10
Helical Gearbox Faults Detection and Diagnosis
Based on Vibration Analysis Techniques
Saleh S. H. Emtaubel1, Yoonis A. M. Esham
2
1Department of Mechanical Engineering, The University of Omar El-Mukhtar, al-Bayda, Libya 2Department of Mechanical Engineering, Higher Institute of Science and Technology, Tobruk, Libya
Abstract: This paper describes and summarises the progress which has been made to monitor two stages of
helical gearbox. This investigation was carried out using a signal vibration technique to detect helical gearbox
faults. Time synchronous average (TSA) has been applied firstly to remove the noise interference and mixed in
raw signals, after that, Order Tracking has been applied to get reliable results. In the industrial area, the
detection of faults and diagnosis of gear transmission systems for rotating machinery are becoming more
interesting subject. These include areas, such as compressors, turbines, internal combustion engines, and
helicopter engines. Vibration signals from a gearbox generally are noisy, so, it is not easy to identify clear
symptoms of fault in gearbox. This causes difficulty to find early symptoms of failure in a gearbox. Over recent
decades, the task of the fault detection system and methods has been modified from a post processing tool to a
diagnostic tool, which usually contains information for the machine operating condition, and for forecasting the
available service life to reduce the maintenance cost. Results show that the frequency time domain with using
time synchronous average (TSA) is a good indicator of the occurrences of faults in the gearbox, however, Order
Tracking was more affective to identify faults. It is recommended that more advanced adaptive signal
processing would be applied, and gear fault modelling should also be investigated for more accurate condition
monitoring (CM) extraction to obtain better features identification for diagnosis gearbox faults.
Keywords: Vibration Analysis, helical gearbox, Time synchronous average (TSA), Fault Diagnosis.
I. Introduction
Condition monitoring (CM) is one of the most common methods for inspecting sources of information. It is
defined as the use of advanced technologies to identify the condition of machines, and predict failure before it
happens (Runkel, 1996). Although CM is the most widely used method, there are still predictive maintenance
techniques which can be used, including human senses such as hearing, and touching. Gears are considered as
the most important elements used in the gearbox. In normal working condition, gearbox generates various time
series compared with faulty one whether it is cracked or broken (Guan, et al., 2009). In this work, a detail
background of condition monitoring of a gearbox, laboratory, and vibration testing will be presented. Faulty and
healthy gear signals will be collected and analysed
This research aims to understand and diagnose the fault in the gearbox based on the analysis technique, where
the detection of defects in the early stages before they become critical is an important element to reduce
maintenance costs. Vibrations analysis is widely used in engineering (e.g. in civil engineering) to identify the
gaps in buildings, bridges, while it used in mechanical engineering to identify faults in machinery. It is well-
known that, mechanical devices produce movement which is accompanied by sound and vibration. Each device
has a different vibration, which can be considered as a signature of the device; if there is any malfunction effect
Helical Gearbox Faults Detection and Diagnosis Based on Vibration Analysis Techniques
Saleh S. H. Emtaubel Page 11
in the state of machine, this leads to a change in vibration, thus the vibration signal of this device is also
changed. This is the basic of many condition monitoring methods. Gears are considered as one of the important
elements in many industrial applications, such as gearbox and transmission machines(Svetlitsky, 2004; Amit
Aherwar, 2012).
In detecting defects during the early stages in rotating machines, particularly the gearbox, the vibration analysis
signal is used. During the process of operation, many technologies have been evolved for the detection of errors.
Most of those methods depend on time domain analysis. Among these techniques, time domain averaging is the
most used the vibration signal processing technique that periodically extracts waveforms from the noisy signals.
One complete rotation of the gear produces vibrations which represents the time domain average. However,
despite clearly showing the complete smooth operation of the gearbox, the time domain averaging experiences
shortcomings in terms of detecting faults at its early stages. The technique is also inadequate in terms of
detecting multiple faults. Nevertheless, over the last decade, research studies have shown that other techniques
for processing the time domain average are more accurate in the determination of the error. In addition, more
research of vibration signal analysis in the time and frequency domain has been conducted recently with the
ultimate aim of combining the advantages of the signal representation of both the frequency and the time
domains (Baydar and Ball, 2001). In this respect, the wavelet analysis technique is in no doubt the best time-
frequency domain technique as it can strike a balance between the resolution of the time and frequency domain.
There are some parameters usually used in condition monitoring, they can give results from different types of
analysis. The parameters used for detection and diagnosis of faults in machines are: The Root Mean Square
(RMS) value of the signal, The Crest Factor (CF), the Kurtosis,Time Synchronous Average (TSA), Order
Analysis, andCepstrum Domain Analysis.
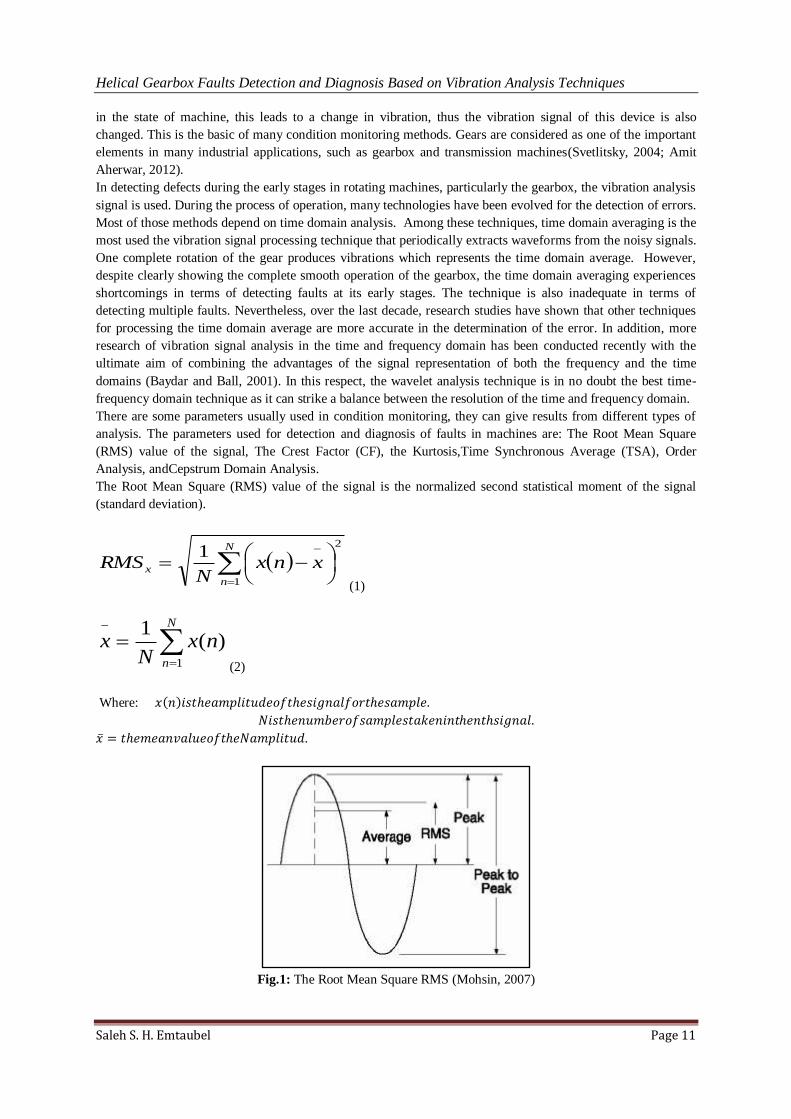
The Root Mean Square (RMS) value of the signal is the normalized second statistical moment of the signal
(standard deviation).
N
n
x xnxN
RMS1
21
(1)
N
n
nxN
x1
)(1
(2)
Where: 𝑥 𝑛 𝑖𝑠𝑡𝑒𝑎𝑚𝑝𝑙𝑖𝑡𝑢𝑑𝑒𝑜𝑓𝑡𝑒𝑠𝑖𝑔𝑛𝑎𝑙𝑓𝑜𝑟𝑡𝑒𝑠𝑎𝑚𝑝𝑙𝑒.
𝑁𝑖𝑠𝑡𝑒𝑛𝑢𝑚𝑏𝑒𝑟𝑜𝑓𝑠𝑎𝑚𝑝𝑙𝑒𝑠𝑡𝑎𝑘𝑒𝑛𝑖𝑛𝑡𝑒𝑛𝑡𝑠𝑖𝑔𝑛𝑎𝑙.
𝑥 = 𝑡𝑒𝑚𝑒𝑎𝑛𝑣𝑎𝑙𝑢𝑒𝑜𝑓𝑡𝑒𝑁𝑎𝑚𝑝𝑙𝑖𝑡𝑢𝑑.
Fig.1: The Root Mean Square RMS (Mohsin, 2007)

Helical Gearbox Faults Detection and Diagnosis Based on Vibration Analysis Techniques
Saleh S. H. Emtaubel Page 12
The crest factor is a ratio that can be calculated by dividing the peak value on the RMS of the signal as follows:
N
N
xnx
N
i
nx
RMS
peaklevelCF
1
2)(
)(sup
(3)
Fig. 2:Crest factor (InteluxElectronics,2012)
This level of a signal is used in a similar style of the crest factor, which can provide a measure of the nature of
the signal as in Figure 2. The Kurtosis is a very sensitive value because values are raised to the fourth power.
Fig. 3: Kurtosis (DeCarlo, 1997)
It can be calculated as:
(4)
Where: y (n) is the data; n = 1, 2, 3……. N.
N: is the total number of data samples,
𝑥(𝑛) 𝑡𝑒𝑚𝑎𝑥𝑖𝑚𝑢𝑚𝑎𝑏𝑠𝑜𝑢𝑙𝑡𝑒𝑣𝑎𝑙𝑢𝑒𝑠𝑜𝑓𝑡𝑒𝑠𝑖𝑔𝑛𝑎𝑙.
Time Synchronous Average (TSA) technique is used to remove non-stationary noise from a repetitive signal
based on a pre-processing. Basically, it is used in the previous method, where the vibration signal of the gear
can be termed as „cycle-stationary‟. Vibration of components that are not synchronous along with the rotation of
3
)(1
)(1
2
1
2
1
4
N
i
N
n
xnxN
xnxN
kurtosis

Helical Gearbox Faults Detection and Diagnosis Based on Vibration Analysis Techniques
Saleh S. H. Emtaubel Page 13
gear prevent from appearing on the screen by the synchronous averaged signal, thereby leaving only the
vibration of the gear in one revolution. As a result, it can process and analyse the signal caused by the gear that
appears individually on the screen, and can distinguish the difference in the signals which becomes clearer (Jing,
Yip et al., 2010).
Fig. 4: Illustration of the effect of Time Synchronous Averaging (Clara, 2009)
Order Analysis is a type of analysis designed specifically for the analysis of rotating machinery and how
frequencies change as the rotational speed of the machine changes. It resamples raw signals from the time
domain into the angular domain, aligning the signal with the angular position of the machine(Amit Aherwar,
2012).
In Cepstrum Domain Analysis the spectrum as an analytic function, has a lot of applications in the processing of
the signal. It is utilized in the removal of the echo, in deconvolution, in finding harmonics and any in
pinpointing any sidebands that may be hidden. This is because it is very sensitive and can significantly limit the
noise in the transmission. Its sensitivity also makes it a useful tool in spectrum analysis as it gives it the ability
to differentiate between different large groups at varying frequencies(Childers,et al. 1977).
II. EXPERIMENTAL DETAILS
The Test Rig
The test was carried out on the test rig comprises of two stages helical gearbox, Planetary gearbox
manufactured, a three-phase induction motor which produced by the Brook Crompton Company, and a load
system consisting of two flexible tyre coupling and DC generator. The induction motor is powered by 3-phase
power supply (11kW, 1465rpm and four poles) and is flanged in a cantilever type arrangement to the helical
gearbox. A two-stage helical gearbox with 3.6 contact ratios is used in the test. The input shaft is driven by an
AC motor at speed 1465. The motor speed is controlled by controller with the maximum speed is up to 50% ≈
730 rpm, thus the speed input the Planetary gearbox 203rpm then increase to speed 1460 rpm by Planetary
gearbox ratio7.2. An incremental optical encoder is equipped to measure instantaneous angular speed (IAS) over
the range of 10Hz to 2 kHz. It is installed to the end of the induction motor shaft. The encoder provides one
pulse for each complete revolution and is connected to a data acquisition system directly. The vibration of the
test gearbox is measured by an accelerometer (Type PCB 338C04) with a sensitivity of 100 mv/g, and frequency
response range is from 1HZ to 20 kHz. It is mounted on gearbox housing casing and a caustic sensor
(microphone) type YG-201 with microphone sensitivity of 50mv/pa and frequency response range is from 16HZ
to 100 kHz.
Fault Simulation
Industrial applications that rely on gearbox facing several errors, one of the most common is breaking teeth. In
this work, two industrial degrees of tooth breakages were simulated which are 50% and 100% of the tooth
damage, as shown in fig. 6. They are formed by removing the section of the tooth face on the pinion gear, in the
width direction. Vibration signals collected from a same gearbox where, two broken gears were tested and
compared them with healthy one.

Helical Gearbox Faults Detection and Diagnosis Based on Vibration Analysis Techniques
Saleh S. H. Emtaubel Page 14
Fig. 5:The Gearbox Test Rig
Table 1: Design Data for the Helical Gearbox
Description First
Stage
(Input
Shaft)
Second Stage
(Output Shaft)
Number of
teeth
58 /47
(Z1/Z2)
13 /59 (Z3/Z4)
Shaft speeds ωr1
24.98
rev/sec.
(input) at
full load
ω r2
6.79rev/sec.
(output) at full
load
Meshing
Frequency
1450Hz.
401.05Hz.
Contact ratio
1.45
1.469
Reduction
ratio
ωr1/ ω r2 =
[(Z2/Z1)] [ (Z4/Z3)] =3.67
Overlap
ratio
2.89 1.289
Fig. 6: (50% and 100%) of the tooth damage
III. RESULTS AND DISCUSSION
Data Acquisition System Process
The placement of transducers is presented in the fig. 6. The transducers - accelerometers and angular speed
encoder were fitted directly on the test rig. Each transducer produces a voltage output proportional to the
amplitude of the measured parameter and each is connected to a DQS by coaxial BNC cables to reduce signal
noise. The accelerometer, which was used to detect the vibration signal in the test, was connected to the gearbox
this accelerometer has bases firmly screwed at the side of the helical gearbox. It was taken from the PCB Type
336C04. The system is equipped with encoder from the gradual optical type RI32 to measure instantaneous
angular speed (IAS) over the range of 10Hz to 2 KHz. It was fixed at the end of the induction motor shaft.

Helical Gearbox Faults Detection and Diagnosis Based on Vibration Analysis Techniques
Saleh S. H. Emtaubel Page 15
Fig. 7: Position of the Accelerometers and Encoder
The vibration data that have been recorded by accelerometer and were analysed by using traditional signal
processing methods. Time domain, (TSA), and order tracking have been used to analyse, and understanding
results to identify the fault on the helical gearbox.
Time Domain Analysis of Vibration Signal of Healthy and Faulty Gears
Many mechanical faults such as tooth break in gears create periodical excitation forces in the equipment. This
consequently creates an impulse in each revolution that is appear on the vibration signal. To characterize the
time signal induced by this type of defects, indicators that reflect some properties of the signal can be used to
evaluate the state of the device. Where change in signal is expected when the device is operating under fault
conditions. Different statistical parameters have been measured through this study, such as (RMS) root, and
kurtosis. Combination of RMS,
Fig. 8: Raw Data of Helical Gearbox at 40% speed, and 90% load
and Kurtosis are expected to supply more reliable decisions on gear health situation, if compared to that
collected by using just one parameter.
Fig. 9: Average of RMS and Kurtosis of Healthy and Faulty Gear at 40% speed, and 90% load
Gearbox Vibration Signal Analysis by Time Synchronous Average (TSA)
1 2 30
0.005
0.01
0.015
0.02
0.025
0.03
0.035
0.04
0.045
RM
S
Gear Conditions
1 2 3-0.6
-0.4
-0.2
0
0.2
0.4
0.6
0.8
1
1.2
Kurt
osis
Gear Conditions
Helical Gearbox Faults Detection and Diagnosis Based on Vibration Analysis Techniques
Saleh S. H. Emtaubel Page 16
The time domain was used to extract a reliable feature from raw data of the gearbox vibration signal, but it
seems so difficult to identify any specific features for detecting faults as shown in Fig. 8. Despite the difference
in the amplitude signal between the healthy and faulty gears, it is still difficult to identify the reason of the fault
exactly. Hence, further efficient analysis techniques are required to determine the reason of fault with more
accuracy.
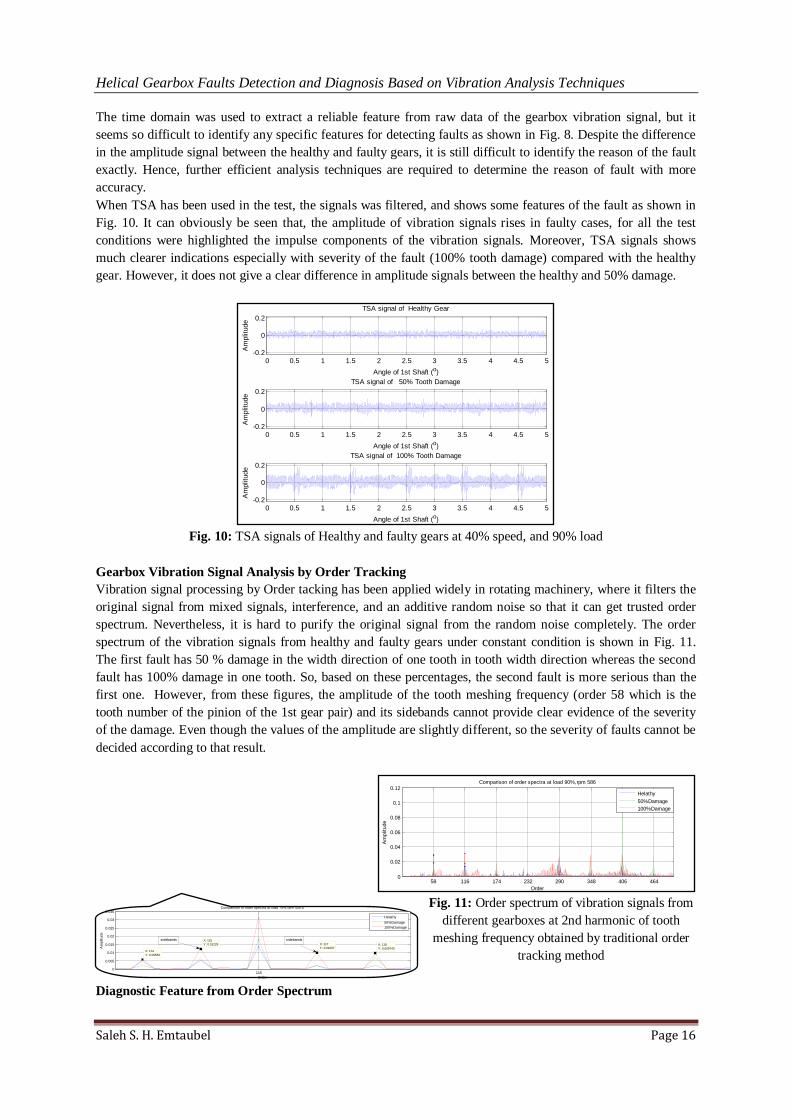
When TSA has been used in the test, the signals was filtered, and shows some features of the fault as shown in
Fig. 10. It can obviously be seen that, the amplitude of vibration signals rises in faulty cases, for all the test
conditions were highlighted the impulse components of the vibration signals. Moreover, TSA signals shows
much clearer indications especially with severity of the fault (100% tooth damage) compared with the healthy
gear. However, it does not give a clear difference in amplitude signals between the healthy and 50% damage.
Fig. 10: TSA signals of Healthy and faulty gears at 40% speed, and 90% load
Gearbox Vibration Signal Analysis by Order Tracking
Vibration signal processing by Order tacking has been applied widely in rotating machinery, where it filters the
original signal from mixed signals, interference, and an additive random noise so that it can get trusted order
spectrum. Nevertheless, it is hard to purify the original signal from the random noise completely. The order
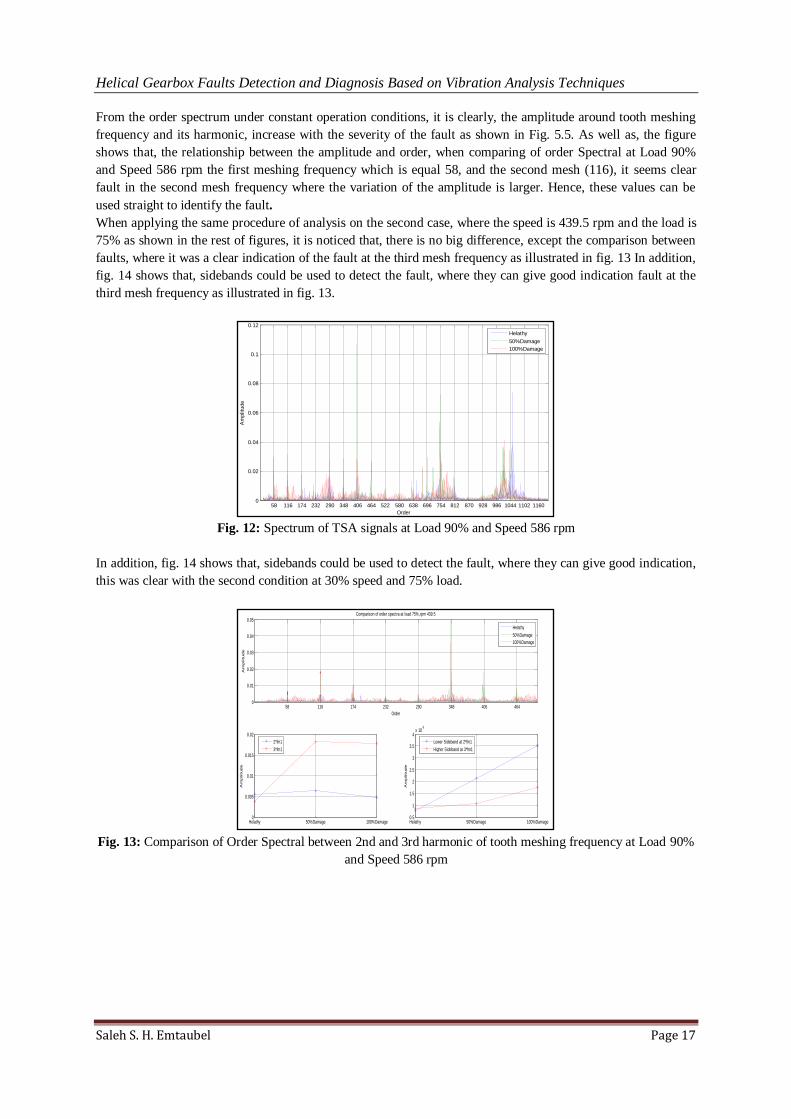
spectrum of the vibration signals from healthy and faulty gears under constant condition is shown in Fig. 11.
The first fault has 50 % damage in the width direction of one tooth in tooth width direction whereas the second
fault has 100% damage in one tooth. So, based on these percentages, the second fault is more serious than the
first one. However, from these figures, the amplitude of the tooth meshing frequency (order 58 which is the
tooth number of the pinion of the 1st gear pair) and its sidebands cannot provide clear evidence of the severity
of the damage. Even though the values of the amplitude are slightly different, so the severity of faults cannot be
decided according to that result.
Fig. 11: Order spectrum of vibration signals from
different gearboxes at 2nd harmonic of tooth
meshing frequency obtained by traditional order
tracking method
Diagnostic Feature from Order Spectrum
0 0.5 1 1.5 2 2.5 3 3.5 4 4.5 5-0.2
0
0.2
Angle of 1st Shaft (o)
Am
plit
ude
TSA signal of Healthy Gear
0 0.5 1 1.5 2 2.5 3 3.5 4 4.5 5-0.2
0
0.2
Angle of 1st Shaft (o)
Am
plit
ude
TSA signal of 50% Tooth Damage
0 0.5 1 1.5 2 2.5 3 3.5 4 4.5 5-0.2
0
0.2
Angle of 1st Shaft (o)
Am
plit
ude
TSA signal of 100% Tooth Damage
58 116 174 232 290 348 406 4640
0.02
0.04
0.06
0.08
0.1
0.12Comparison of order spectra at load 90%,rpm 586
Order
Am
plit
ude
Helathy
50%Damage
100%Damage
Helathy 50%Damage 100%Damage0.01
0.015
0.02
0.025
0.03
0.035
Am
plit
ude
1Xfm1
2Xfm1
Helathy 50%Damage 100%Damage1
1.5
2
2.5
3x 10
-3
Am
plit
ude
Lower Sideband at 3Xfm1
Higher Sideband at 3Xfm1
1160
0.005
0.01
0.015
0.02
0.025
0.03
0.035
X: 114
Y: 0.00583
Comparison of order spectra at load 75%,rpm 439.5
Order
Am
plit
ude
X: 115
Y: 0.01229 X: 118
Y: 0.009743
X: 117
Y: 0.01007
Helathy
50%Damage
100%Damage
sidebands sidebands
Helical Gearbox Faults Detection and Diagnosis Based on Vibration Analysis Techniques
Saleh S. H. Emtaubel Page 17
From the order spectrum under constant operation conditions, it is clearly, the amplitude around tooth meshing
frequency and its harmonic, increase with the severity of the fault as shown in Fig. 5.5. As well as, the figure
shows that, the relationship between the amplitude and order, when comparing of order Spectral at Load 90%
and Speed 586 rpm the first meshing frequency which is equal 58, and the second mesh (116), it seems clear
fault in the second mesh frequency where the variation of the amplitude is larger. Hence, these values can be
used straight to identify the fault.
When applying the same procedure of analysis on the second case, where the speed is 439.5 rpm and the load is
75% as shown in the rest of figures, it is noticed that, there is no big difference, except the comparison between
faults, where it was a clear indication of the fault at the third mesh frequency as illustrated in fig. 13 In addition,
fig. 14 shows that, sidebands could be used to detect the fault, where they can give good indication fault at the
third mesh frequency as illustrated in fig. 13.
Fig. 12: Spectrum of TSA signals at Load 90% and Speed 586 rpm
In addition, fig. 14 shows that, sidebands could be used to detect the fault, where they can give good indication,
this was clear with the second condition at 30% speed and 75% load.
Fig. 13: Comparison of Order Spectral between 2nd and 3rd harmonic of tooth meshing frequency at Load 90%
and Speed 586 rpm
58 116 174 232 290 348 406 464 522 580 638 696 754 812 870 928 986 1044 1102 11600
0.02
0.04
0.06
0.08
0.1
0.12
Order
Am
plit
ude
Spectrum of TSA signals
Helathy
50%Damage
100%Damage
58 116 174 232 290 348 406 4640
0.01
0.02
0.03
0.04
0.05Comparison of order spectra at load 75%,rpm 439.5
Order
Am
plitu
de
Helathy
50%Damage
100%Damage
Helathy 50%Damage 100%Damage0
0.005
0.01
0.015
0.02
Am
plitu
de
2*fm1
3*fm1
Helathy 50%Damage 100%Damage0.5
1
1.5
2
2.5
3
3.5
4x 10
-3
Am
plitu
de
Lower Sideband at 2*fm1
Higher Sideband at 3*fm1

Helical Gearbox Faults Detection and Diagnosis Based on Vibration Analysis Techniques
Saleh S. H. Emtaubel Page 18
Fig. 14: Order Spectrum of Vibration Signals from Different Gears at 3nd Harmonic of Tooth Meshing
Frequency Obtained by Traditional Order Tracking Method
Conclusions
This research conducted Analysis and experimental investigations by using CM methods to identify the fault
which was abroken gear tooth. The analysis has shown good results and was enough for detection and diagnosis
of faults. Through this research, it was possible to understand the installation of gearbox and using condition
monitoring to reveal faults.In addition,it was possible tounderstand and analyse the signal for each of healthy
and faulty gears and using the softwareMATLAB 2013 for the analysis of vibration signals of the gearbox.
Significant attenuation and interference between vibration signals make it difficult to extract helpful information
about the situation of the gearbox by using time domain, however, when combined indicators of statistical
parameters of time domain such as RMS and Kurtosis were used, they show some indications of faults, but
these indications could be the reason of wrong diagnosis.
In the second stage of analysis, when spectral analysis was used, it gave clearer detection of faults, where,
vibration signals that representing meshing characteristics of the mating gears were affected.Also, the severity
of the fault caused a significant change in the signal, and thus, it can easily be determined. finally, when the
order tracking was used, it gave the best results of analysis, where the difference in amplitude of gears signals
was clearer, hence, it could easily detect the fault, also sidebands show good indication of fault.
References
[1.] Amit Aherwar, M. S. K. (2012). "Vibration Analysis Techniques for Gearbox Diagnostic: A review."
International Journal of Advanced Engineering Technology 3(2): 04-12.
[2.] Baydar, N. and A. Ball (2001). "A comparative study of acoustic and vibration signals in detection of
gear failures using Wigner–Ville distribution." Mechanical systems and signal processing15(6): 1091-
1107.
[3.] Childers, D. G., D. P. Skinner, et al. (1977). "The cepstrum: A guide to processing." Proceedings of the
IEEE65(10): 1428-1443.
[4.] Clara. S. (2009). "Time Synchronous Averaging." Crystal Instruments: 5.
[5.] DeCarlo, L. T. (1997). "On the Meaning and Use of Kurtosis” Psychological Methods 2(3): 292-307.
[6.] InteluxElectronicsPvt.Ltd.(2012).http://www.inteluxindia.com/FAQs.html Retrieved 01-09, 2015.
[7.] Jing, Y., L. Yip, et al. (2010). "Notice of retraction wavelet analysis with time-synchronous averaging
of planetary gearbox vibration data for fault detection, diagnostics, and condition-based maintenance”.
Mechanical and Electronics Engineering (ICMEE), 2nd International Conference on 2010.
[8.] Guan, L., Y. Shao, et al. (2009). “Gearbox fault diagnosis under different operating conditions based on
time synchronous average and ensemble empirical mode decomposition”. ICCAS-SICE, 2009, IEEE.
58 116 174 232 290 348 406 4640
0.01
0.02
0.03
0.04
0.05Comparison of order spectra at load 75%,rpm 439.5
Order
Am
plitude
Helathy
50%Damage
100%Damage
Helathy 50%Damage 100%Damage0
0.005
0.01
0.015
0.02
Am
plitude
2*fm1
3*fm1
Helathy 50%Damage 100%Damage0.5
1
1.5
2
2.5
3
3.5
4x 10
-3
Am
plitude
Lower Sideband at 2*fm1
Higher Sideband at 3*fm1

Helical Gearbox Faults Detection and Diagnosis Based on Vibration Analysis Techniques
Saleh S. H. Emtaubel Page 19
[9.] Mohsin, kiet. (2007).instantaneous, peak, peak to peak and rms value,
"http://www.edaboard.com/thread93427.html."Retrieved 25-08, 2015.
[10.] Runkel, J. S., V.; Reimche, U. A.; W. and Stegemann, D (1996). "Condition Monitoring of Industrial
Machines, Institute of Nuclear Engineering and Non-destructive Testing." University of Hannover
Elbestraße 38A: 30419 Hannover, Germany.
[11.] A. Svetlitsky (2004). Engineering Vibration Analysis: Worked Problems 1, Berlin:Springer-Verlag
Berlin Heidelberg.