
Solving Gearbox Frequent Failure Problem - Research Explorer
363
The University of Manchester Research Solving Gearbox Frequent Failure Problem Link to publication record in Manchester Research Explorer Citation for published version (APA): Elbhbah, K., Sinha, J., & Hahn, W. (2018). Solving Gearbox Frequent Failure Problem. In The 3nd International Conference on Maintenance Engineering (IncoME-III) 2018 Published in: The 3nd International Conference on Maintenance Engineering (IncoME-III) 2018 Citing this paper Please note that where the full-text provided on Manchester Research Explorer is the Author Accepted Manuscript or Proof version this may differ from the final Published version. If citing, it is advised that you check and use the publisher's definitive version. General rights Copyright and moral rights for the publications made accessible in the Research Explorer are retained by the authors and/or other copyright owners and it is a condition of accessing publications that users recognise and abide by the legal requirements associated with these rights. Takedown policy If you believe that this document breaches copyright please refer to the University of Manchester’s Takedown Procedures [http://man.ac.uk/04Y6Bo] or contact [email protected] providing relevant details, so we can investigate your claim. Download date:06. Jul. 2022
-
Upload
khangminh22 -
Category
Documents
-
view
1 -
download
0
Transcript of Solving Gearbox Frequent Failure Problem - Research Explorer

The University of Manchester Research
Solving Gearbox Frequent Failure Problem
Link to publication record in Manchester Research Explorer
Citation for published version (APA):Elbhbah, K., Sinha, J., & Hahn, W. (2018). Solving Gearbox Frequent Failure Problem. In The 3nd InternationalConference on Maintenance Engineering (IncoME-III) 2018
Published in:The 3nd International Conference on Maintenance Engineering (IncoME-III) 2018
Citing this paperPlease note that where the full-text provided on Manchester Research Explorer is the Author Accepted Manuscriptor Proof version this may differ from the final Published version. If citing, it is advised that you check and use thepublisher's definitive version.
General rightsCopyright and moral rights for the publications made accessible in the Research Explorer are retained by theauthors and/or other copyright owners and it is a condition of accessing publications that users recognise andabide by the legal requirements associated with these rights.
Takedown policyIf you believe that this document breaches copyright please refer to the University of Manchester’s TakedownProcedures [http://man.ac.uk/04Y6Bo] or contact [email protected] providingrelevant details, so we can investigate your claim.
Download date:06. Jul. 2022

1
ISBN 978-989-8200-17-4

2

3

4
Preface
This is first time the IncoME-III 2018 conference is organised out side the Univer-
sity of Manchester UK since 2016. It is likely that the IncoME-IV 2019 will be
organised in Dubai, UAE.
The conference has received more than 50 papers from academic institutions and
industries from several countries worldwide. The conference proceedings contains
peer full papers and a few abstracts related to industrial maintenance activities.
Prof Torres Farinha (Polytechnic Institute of Coimbra, Portugal) and Mr Dakheel
Alharthi (Saudi Aramco, KSA) will be presenting the keynote lectures in the con-
ference.
The organisers of IncoME-III would like to thank the keynote speakers, authors,
presenters, committee members, invited guests, participants and session chairs for
taking part and contributing to the success of this conference. Sincerest apprecia-
tion goes to Mrs. Ana Valeira, Mr. Hugo Santos, Ms. Noélia Marques and Mr.
Pedro Neves (conference secretaries) for managing efficiently the event of
IncoME-III 2018. The support by Dr Keri Elbhbah, the University of Manchester
UK during the preparation of the conference proceedings is also acknowledged.
Prof Jyoti K. Sinha
The University of Manchester, UK
Prof Filipe Didelet
Polytechnic Institute of Setubal, Portugal

5
About Coimbra
Coimbra is located in the middle of Portugal, in a region called Beiras. Beiras is
the traditional name of a region running south of Douro River and north of Tagus
River. This region is made up of two contrasting areas. The extensive beaches and
fishing villages that lies along the Atlantic coastline, while in interior the
mountains dominate the landscape.
In the heart of this hinterland rises the Serra da Estrela (Estrela Mountain Range),
the highest in continental Portugal. This is where the Mondego River rises, later
running down to the city of Coimbra. Here, the river that over the centuries has so
many odes composed to it by generations of university students flows out into the
Atlantic Ocean by the lengthy Figueira da Foz beach.
Coimbra has an area of 316,8Km2 and around 140 000 inhabitants and a rich
history. Six of Portugal’s Kings were born here. In the Middle Ages, from 1139
until 1256, Coimbra was the capital of Portugal. The original name in the Roman
period was Aeminium but it was changed to Coimbra influenced by the greater
nearby town at the time - Conimbriga (today Conimbriga is a large archaeological
site of great interest).
The University of Coimbra (UC) is one of the oldest in the world, having been
founded in 1290 by King Dinisis. UC was classified as a World Heritage by the
United Nations Committee for Education, Science and Culture (UNESCO).
Known as the "city of students" here the daily life is marked by the students.
Academic traditions are very important in the town and student’s life. During
special celebrations l, students use black academic gowns, giving a special
ambient to the streets. The city is divided into two distinct areas, the baixa (lower
town) by the river, where most of the city’s commercial activity is concentrated,
and the alta (upper town), the older part. The upper town consists of steep narrow
streets, where the Repúblicas (typical students’ residences) are found, as well as
some of the city’s most important buildings.

6
Conference Chairs
Prof Filipe Didelet
Polytechnic Institute of Setubal, Portugal
Prof. Jyoti K. Sinha
The University of Manchester, UK
Committee
Prof A. Ball, University of Huddersfield, UK
Prof Aditya Parida, Lulea University of Technology, Sweden
Dr Akilu Kaltungo, The University of Manchester, UK
Prof Ashraf Labib, University of Portsmouth, UK Ashraf Labib
Prof Basim Al-Najjar, Linnaeus University, Sweden
Prof Daniel Gaspar, Polytechnic Institute of Viseu, Portugal
Dr David Baglee, Dr David Baglee, UK
Prof D. Mba, De Montfort University
Dr Erkki Jantunen, VTT Technical Research Centre, Finland
Dr Kassandra Papadopoulou, The University of Manchester, UK
Dr F. Gu, University of Huddersfield, UK
Prof Inácio Fonseca, CEMMPRE and ISEC, Portugal
Prof José Sobral, Polytechnic Institute of Lisbon, Portugal
Prof José Torres Farinha, CEMMPRE and ISEC, Portugal
Prof Luís Andrade Ferreira, University of Porto, Portugal
Mrs María del Carmen García Lizárraga, INEEL, Mexico
Prof Mirka Kans, Linnaeus University of Sweden, Sweden
Dr Moray Kidd, The University of Manchester, UK
Mr Nasser Alshahrani, ARAMCO, Saudi Arabia
Prof Paulo Bartolo, The University of Manchester, UK
Mr Paul Wheelhouse, Red Wheel Solutions Ltd, UK
Prof R. Zimroz, Wroclaw University of Technology, Poland
Prof Uday Kumar, Lulea University of Technology, Sweden
Dr Wolfgang Hahn, EDF, UK
Prof Z.K. Peng, Shanghai Jiao Tong University, China
Prof Zuzana Dimitrovová, Universidade Nova de Lisboa, Portugal
Conference Secretary Ana Paula Valeira, APMI, Portugal
Hugo Santos, HARIDA, Portugal
Noélia Marques, APMI, Portugal
Pedro Neves, Harida, Portugal

7
IncoME-III 2018 photograps

8
Contents
ME2018_K02 Life Cycle Cost versus Life Cycle
Investment, a New Paradigm
José Torres Farinha
12
ME2018_1103 Rotating Equipment Energy
Conservation Initiatives
Mohammed AlTamimi, Faisal Al-Jamhoor
22
ME2018_1107 Potential risks in implementation of
maintenance outsourcing projects (Case
study for Russia and CIS)
Boris Kryukov
30
ME2018_1108 Method for a qualitative cost benefit
evaluation of process standardisation
for industrial services
Achim Kampker, Maximilian Lukas,
Tobias Leiting, Philipp Jussen
40
ME2018_1109 Creating Competitive Advantage by
Transforming Maintenance
Organisation F. Lesmeister, A. Costa, G. Papandrea
51
ME2018_1110 Forest Maintenance Management
Centred on Biomass Collection
Filipe Didelet Pereira
63
ME2018_1111 Solving Gearbox Frequent Failure
Problem
Keri Elbhbah, Jyoti K. Sinha, W. Hahn
69
ME2018_1114 Shortcomings of applying standalone
conventional reliability method for
rolling stock risk assessment
Frederick Appoh
78

9
ME2018_1115 Hybrid model for maintenance
frequency extension using Weibull and
wear analysis
Frederick Appoh
88
ME2018_1120 The Importance of Reliability and
Maintenance for the Circular Economy Luís Ferreira, José Sobral
98
ME2018_1122 Maintenance Management and Design
of Experiments
Nuno R. Costa, Filipe D. Pereira
111
ME2018_1123 Pipeline inspection and maintenance via
acoustic methods and tools Kassandra A. Papadopoulou,
Saeed Abdullah Alzahrani, Jyoti Sinha
120
ME2018_1124 A Decision Support Framework for
Human Reliability Analysis Mohammed Almatani, Moray Kidd, Ahmed
Khezam
131
ME2018_1125 A Structural Model of the Impact of
Organisational Culture on Participation
of Autonomous Maintenance in the
Power Industry
Abdulla Y. Alseiari, Peter Farrell
145
ME2018_1126 The Impact of Effective Model of
Maintenance Optimisation (Predicting
Remaining Useful Life) on Successful
Participation of Autonomous
Maintenance in the Power Industry
Abdulla Y. Alseiari, Peter Farrell
167

10
ME2018_1129 High Pressure Gas Compressor Dry Gas
Seal System Enhancement Case Study Faisal Al Dossary, Abdullah Al Turiki
186
ME2018_1131 Frailty Models for Survival Data
Applied to Maintenance Management
Sílvia Madeira, Paulo Infante, Filipe
Didelet
196
ME2018_1136 Non-dimensional pattern recognition
approach for the faults classification in
rotating machines Natalia F. Espinoza Sepulveda,
Jyoti K. Sinha
211
ME2018_1138 Journey Towards Vessels Replacement
Program
Ahmad Al-Abdulqader
221
ME2018_1140 Mono Sensor Empirical Curve-Fitting
Determination of Acoustic Attenuation
Coefficient for Pipeline Monitoring
Mohd S A M Yusoff, P Mandal, Kassandra
A. Papadopoulou, Jyoti K Sinha
224
ME2018_1141 Reliability of Composite Materials
based on Accelerated Life Tests
J. Sobral, S. Rodrigues
236
ME2018_1142 Identification of Outliers in Failure
Data
J. Sobral, C. Guedes Soares
247
ME2018_1143 New Maintenance Methodology
Implemented For Wells Re-manifolding
Mohammed Alnewaihel
262
ME2018_1144 SGPD Best Maintenance Practice:
Flange Weld Test Plug
Piyush Pandey
266

11
ME2018_1145 The Internalisation of the Maintenance
Function – A Strategic Vision
Pedro Viegas
268
ME2018_1146 Vibration-based diagnosis for different bear-
ing clearances in a gear transmission system
Xiuquan Sun, Tie Wang, Ruiliang Zhang,
Fengshou Gu, Andrew D. Ball
281
ME2018_1147 A Study of Diagnosing Reciprocating
Compressor Faults using EMD-entropy
of the Airborne Acoustic Signals
Debanjan Mondal, Xiuquan Sun,
Fengshou Gu, Andrew Ball
293
ME2018_1148 Educational building technical system
retrofitting - IAQ and maintenance
considerations
Ana C. V. Vieira, Flávio Chaves
308
ME2018_1149 An iterative process to extract value
from maintenance projects
Carolina Mejía Niño, Michele Albano,
Erkki Jantunen, Pankaj Sharma, Jaime
Campos, David Baglee
319
ME2018_1151 Poly-Coherent Composite Bispectrum
Analysis for fault diagnosis in Rotating
Machines
Kenisuomo C. Luwei, Jyoti K. Sinha, Akilu
Yunusa-Kaltungo
336
ME2018_1152 New Maximo configuration for Marine
Fleet Maintenance
Nilesh Soni, Ahmad Al-Aseeri
345
ME2018_1153 Investigation of explosion on scavenge
airline of a 4 stroke Marine Engine Nilesh Soni, Ahmad Al-Aseeri
354

12
ME2018_K02:
Life Cycle Cost versus Life Cycle Investment, a
New Paradigm
José Torres Farinha
CEMMPRE - Centre for Mechanical Engineering, Materials and Processes and ISEC - Instituto
Superior de Engenharia de Coimbra, Portugal.
Email: [email protected]; [email protected]
Abstract The first of approach of this paper is to present an overview of all
phases of the physical assets life cycle. Based on this, it is discussed a new meth-
odology to evaluate the financial life cycle of the assets.
The investment analysis in physical assets is usually done based only in the per-
spective of Economist view, considering the initial investment, the expected bene-
fits throughout time and the functioning and maintenance costs throughout time.
Regardless of the first approach, it is extremely important to consider the mainte-
nance policy and the overall Life Cycle Cost (LCC) throughout the entire life of
the physical asset. These costs may be extremely variable and they may change
dramatically the time for the Return of Investment (ROI).
However, the preceding involves an enormous contradiction because of the fol-
lowing: the initial cost of the physical asset is called investment, but the remaining
costs throughout its life are only called costs.
It is important to clarify these concepts, calling the initial cost the Initial Invest-
ment and the remaining costs throughout time as the Variable Investments which
implies changing the acronym LCC to Life Cycle Investment (LCI).
Key words: Physical Assets; Life Cycle Cost; LCC; Life Cycle Investment; LCI;
Return on Investment; ROI.
1.0 Introduction
This paper makes a global approach of the Life Cycle of Physical Assets struc-
tured in two parts: the first one analyses the management of their global Life Cy-
cle, since acquisition to withdrawal; the second one presents a new approach for
their financial life cycle, based on econometric specific models, called Life Cycle
Investment (LCI).

13
About the econometric models to evaluate the LCI, i.e., all costs and benefits are
considered, since the initial investment until the withdrawal, including all the vari-
able investments (usually called costs) to guarantee their normal functioning.
The paper is structured in the following way:
Section 2 describes the State of the Art;
Section 3 describes a global vision of the Physical Assets Life Cycle;
Section 4 describes The Life Cycle Cost, i.e., The traditional Investment
Analysis;
Section 5 describes the new approach called Life Cycle Investment;
Section 6 presents the conclusions.
2.0 State of The Art
The interest about the Physical Asset Management area is increasing more and
more, namely after the publication of ISO 5500X (ISO 55000, ISO 55001, ISO
55002), and previously encouraged by the PAS 55.
Farinha [1] presents, in his most recent book, a global view of the Life Cycle of
Physical Assets integrating the preceding standards.
According to Ljiljana, Dragutin & Zelimir, “Asset Management is a relatively new
discipline that provides methods and tools for effective management of Physical
Assets to maximize their utilization during entire Life Cycle. Asset Management
evolved from Maintenance Management to provide a holistic approach to manag-
ing the life of a physical asset. This management is important for the performance
of any organization, particularly Physical Asset intensive organizations. There-
fore, it is no wonder that asset management professionals around the world work
on the development of new models and concepts such as engineering asset man-
agement, integrated strategic asset management or asset governance, in order to
find the best solutions to meet the changing nature and challenges of organizations
and society… Today, we recognize that asset governance is a key point for leading
role in the development and implement asset management in the company and it is
evidence in PAS 55 and the ISO 55000 standards”, [2].
Stimie & Vlok present a mechanism that can assist Physical Asset Management
(PAM) experts and academics with the early detection and management of PAM
Strategy Execution Failure (PAMSEF). The authors present a mechanism to assist
experts with the early detection and prevention of PAMSEF. The mechanism is re-
ferred to as a “Physical Asset Management Strategy Execution Enforcement
Mechanism” (PAMSEEM), which corresponds to a double–loop feedback system
consisting of: four iterative phases; four major decisions; and a number of imple-
mentation processes or steps, [3].

14
The relevance of evaluating the Life Cycle of the Physical Assets is referred by
Eicher in the following way: “Investing in hospital infrastructure is not just a fi-
nancing activity. It is important to consider the whole life cycle of an asset. For
example, it is necessary to think about the operating life of an asset before build-
ing it, because this can influence investment costs and follow-up costs substantial-
ly”. There are several models of investments in assets. Regardless of this case be-
ing based in a hospital, he presents 12 investment models from which some
models can be extrapolated to other types of business. The paper also discusses the
models for assets maintenance, namely the option insourcing versus outsourcing,
[4].
Katicic, Lisjak & Dulcic (2014) say that Asset Management is a new discipline
that provides methods and tools for management of Physical Assets to maximize
their use during the entire lifecycle. The Physical Asset Management evolved
from the Maintenance Management to provide a holistic view to manage the Life
of the Physical Asset. The authors also mention that nowadays it is recognized that
Physical Asset governance is a key point for a leading role in the development and
implementation of Asset Management in the companies and in according to the
ISO 5500X standards, [5].
Banyani & Then (2014) present a study that shows how the Physical Facilities
Management in an industry can be perceived at different levels of maturity based
on personal judgement. This situation is due to a lack of a tool that can be used in
assessing maturity levels. The study proposed an Integrated Feeder Factors
Framework (I3F) as a yardstick, [6].
Volker, Telli & Ligtvoet (2011) refer that an asset management system for the
transportation sector requires system-level performance measures, models, in-
teroperable databases used by asset groups to make evidence-based decisions, [7].
About passenger urban transport, the following references emphasize the im-
portance of maintenance included in several econometric models, [8], [9].
According to the Center for Transportation Research and Education (CTRE), the
transportation agencies are facing many of the same challenges and could benefit
from the adoption of asset management principles. The organizations lack the re-
sources and/or experience that allow them to initiate and grow an asset manage-
ment program. To face this challenge, the document presented by CTRE shows a
guide to support transportation organizations in their implementation of Physical
Asset management program. The document also presents a guide focused on the
various levels of the transportation organization’s maturity in undertaking the ac-
tivities that comprise the asset management framework. The levels of maturity
presented are the following [10]:
Organizational goals and objectives;
Inventory of pavements, bridges, and other major infrastructure assets;
Knowledge of the age, condition, and deterioration of these assets;

15
Availability of information to undertake Life Cycle cost analysis for all
major asset types and asset classes;
Information to undertake risk management analysis at the enterprise and
program level;
Information to develop the organization’s financial plan to support in-
vestment;
Development of investment strategies to manage the network for its
whole life.
3.0 The Global Physical Assets Life Cycle Analysis
Farinha presents, in his book, a new integrated vision for the Physical Asset Man-
agement and emphasizes some tools to manage the entire life cycle of Physical
Assets [1]. The author’s approach for all phases of Physical Assets life cycle can
be summarized in the followings times and steps:
t1 - Decision for Acquisition;
t2 - Terms of Reference;
t3 - Market consultation;
t4 – Acquisition;
t5 – Commissioning;
t6 - Starting Production / Starting Maintenance;
t7 - Economic / Lifespan;
t8 - Renewal / Withdrawal.
Additionally, the author establishes the relation between Life Cycle of Physical
Assets, the standards ISO 5500X (55000, 55001, 55002) and some maintenance
standards, like the NP4492 and the associated ones, [1].
Figure 1 represents the author’s graphical approach for the Life Cycle of Physical
Assets including the referred standards.

16
Figure 1 – Times of a Physical Asset life cycle
4.0 The Life Cycle Cost
The LCC is the sum of all capital spent in support of that asset from its design and
manufacture, through the operation and until the end of its useful life. It is under-
stood that the life time goes from the physical asset commissioning to the equip-
ment withdrawal.
The LCC of a physical asset can be significantly higher than the value of the ini-
tial investment and, in many cases, it is already set in the design phase.
One of the main objectives of the LCC analysis is to support decisions about the
alternatives of investment by estimating the total cost of the physical asset during
its life cycle. This calculation increases the visibility of the equipment total costs
and helps to choose the best solution.
The Table 1 and Figure 2 show a simulation of an initial investment with variable
costs (investments) of functioning and maintenance during 20 years. The Interest
Rate is of 25%.

17
Table 1 – Values of investment and Functioning of an initial investment
Figure 2 – Graphical variation of the values represented on Table 1
5.0 The Life Cycle Investment
It is important to clarify the usual contradiction between investment and costs of
physical assets, namely the following:
The initial cost of the Physical Asset is called Investment, but the re-
maining costs along its life are, usually, called Costs.
It is important to clarify these concepts and to call the Initial Cost the Initial In-
vestment and the Remaining Costs throughout time as Variable Investments which
implies changing the acronym LCC to Life Cycle Investment (LCI).
Time 0 1 2 3 4 5 6 7 8 9 10 11 12 13 14 15 16 17 18 19 20
Initial Investment 1200
Functioning 200 200.00 250.00 250.00 250.00 250.00 250.00 250.00 250.00 250.00 250.00 250.00 250.00 250.00 250.00 250.00 250.00 250.00 250.00 250.00 250.00
Present Value (FPV) 160.00 160.00 128.00 102.40 81.92 65.54 52.43 41.94 33.55 26.84 21.47 17.18 13.74 11.00 8.80 7.04 5.63 4.50 3.60 2.88
Acumulated FPV 1360.00 1520.00 1648.00 1750.40 1832.32 1897.86 1950.28 1992.23 2025.78 2052.63 2074.10 2091.28 2105.02 2116.02 2124.82 2131.85 2137.48 2141.99 2145.59 2148.47
Maintenance 250 250.00 300.00 360.00 432.00 518.40 622.08 746.50 895.80 1074.95 1289.95 1547.93 1857.52 2229.03 2674.83 3209.80 3851.76 4622.11 5546.53 6655.83 7987.00
Present Value (MPV) 200.00 192.00 184.32 176.95 169.87 163.07 156.55 150.29 144.28 138.51 132.97 127.65 122.54 117.64 112.93 108.42 104.08 99.92 95.92 92.08
Acumulated MPV 200.00 392.00 576.32 753.27 923.14 1086.21 1242.76 1393.05 1537.33 1675.84 1808.80 1936.45 2058.99 2176.63 2289.57 2397.99 2502.07 2601.98 2697.90 2789.99
Acumulated Total Costs 1560.00 1912.00 2224.32 2503.67 2755.46 2984.07 3193.05 3385.28 3563.11 3728.46 3882.90 4027.73 4164.02 4292.65 4414.38 4529.84 4639.55 4743.97 4843.49 4938.46
Benefit 2000 1200.00 1200.00 1200.00 1200.00 1200.00 1200.00 1200.00 1200.00 1200.00 1200.00 1200.00 1200.00 1200.00 1200.00 1200.00 1200.00 1200.00 1200.00 1200.00 1200.00
Present Value (BPV) 960.00 768.00 614.40 491.52 393.22 314.57 251.66 201.33 161.06 128.85 103.08 82.46 65.97 52.78 42.22 33.78 27.02 21.62 17.29 13.84
Acumulated Total Benefits 960.00 1728.00 2342.40 2833.92 3227.14 3541.71 3793.37 3994.69 4155.75 4284.60 4387.68 4470.15 4536.12 4588.89 4631.12 4664.89 4691.91 4713.53 4730.82 4744.66
BPV-FPV -600.00 -184.00 118.08 330.25 471.68 557.64 600.32 609.41 592.64 556.14 504.78 442.41 372.10 296.24 216.73 135.05 52.37 -30.44 -112.67 -193.80
-1000
0
1000
2000
3000
4000
5000
6000
1 2 3 4 5 6 7 8 9 10 11 12 13 14 15 16 17 18 19 20 21
Investment Analysis
Acumulated FPV Acumulated MPV
Acumulated Total Costs Acumulated Total Benefits
BPV-FPV

18
Taking into consideration this concept, some simulations over the data on Table 1,
that considered the following values, were made:
Internal Rate of Return - 0.25;
Availability - 0.89.
Based on these values, a positive cycle of results can be observed since the 3rd
year until the 17th
year.
However, if we consider a diminishing in the Maintenance Investment of the
Physical Asset, reaching an Availability only of 0.82, the results are presented in
Table 2 and Figures 3 and 4, showing that the positive cycle of results is shorted in
three years, i.e., it occurs between the 2nd
year and the 12nd
year.
These results demonstrate the importance of the maintenance activity and, by con-
sequence, the importance of the maintenance investment to maximize the profits
of a Physical Asset.
Table 2 – Values of investment, several costs and benefits, with an Availability=0.82
The detailed mathematical analysis of the models that support the simulations pre-
sented in the sections 4 and 5 can be found in the references [1], [8], [9] and [11].
Figure 4 shows the financial flows throughout time for a value of Availability of
0.82.
6.0 Conclusions
The Physical Assets were always very important investments to the Organizations
and Society. However, time after time they become strategic and more and more
complex to analyse.
The paper has discussed and proposed three key points for Physical Asset analysis:
The several steps throughout its life, from acquisition to withdrawal; the
traditional Life Cycle Cost; A new approach called Life Cycle Investment.
Time 0 1 2 3 4 5 6 7 8 9 10 11 12 13 14 15 16 17 18 19 20
Initial Investment 1200
Functioning (F) 200 200.00 250.00 250.00 250.00 250.00 250.00 250.00 250.00 250.00 250.00 250.00 250.00 250.00 250.00 250.00 250.00 250.00 250.00 250.00 250.00
Present Value (FPV) 160.00 160.00 128.00 102.40 81.92 65.54 52.43 41.94 33.55 26.84 21.47 17.18 13.74 11.00 8.80 7.04 5.63 4.50 3.60 2.88
Acumulated FPV 1360.00 1520.00 1648.00 1750.40 1832.32 1897.86 1950.28 1992.23 2025.78 2052.63 2074.10 2091.28 2105.02 2116.02 2124.82 2131.85 2137.48 2141.99 2145.59 2148.47
Maintenance (M) 250 250.00 300.00 360.00 432.00 518.40 622.08 746.50 895.80 1074.95 1289.95 1547.93 1857.52 2229.03 2674.83 3209.80 3851.76 4622.11 5546.53 6655.83 7987.00
Present Value (MPV) 200.00 192.00 184.32 176.95 169.87 163.07 156.55 150.29 144.28 138.51 132.97 127.65 122.54 117.64 112.93 108.42 104.08 99.92 95.92 92.08
Acumulated MPV 200.00 392.00 576.32 753.27 923.14 1086.21 1242.76 1393.05 1537.33 1675.84 1808.80 1936.45 2058.99 2176.63 2289.57 2397.99 2502.07 2601.98 2697.90 2789.99
Non Production (NP) 250 250.00 300.00 360.00 432.00 518.40 622.08 746.50 895.80 1074.95 1289.95 1547.93 1857.52 2229.03 2674.83 3209.80 3851.76 4622.11 5546.53 6655.83 7987.00
Present Value (NPPV) 200.00 192.00 184.32 176.95 169.87 163.07 156.55 150.29 144.28 138.51 132.97 127.65 122.54 117.64 112.93 108.42 104.08 99.92 95.92 92.08
Acumulated NPPV 200.00 392.00 576.32 753.27 923.14 1086.21 1242.76 1393.05 1537.33 1675.84 1808.80 1936.45 2058.99 2176.63 2289.57 2397.99 2502.07 2601.98 2697.90 2789.99
Acumulated Total Costs 1760.00 2304.00 2800.64 3256.93 3678.59 4070.28 4435.81 4778.33 5100.44 5404.30 5691.71 5964.18 6223.01 6469.29 6703.95 6927.82 7141.61 7345.95 7541.40 7728.45
Benefit (B) 2000 1639.34 1639.34 1639.34 1639.34 1639.34 1639.34 1639.34 1639.34 1639.34 1639.34 1639.34 1639.34 1639.34 1639.34 1639.34 1639.34 1639.34 1639.34 1639.34 1639.34
Present Value (BPV) 1311.48 1049.18 839.34 671.48 537.18 429.74 343.80 275.04 220.03 176.02 140.82 112.65 90.12 72.10 57.68 46.14 36.91 29.53 23.63 18.90
Acumulated Benefits BPV 1311.48 2360.66 3200.00 3871.48 4408.66 4838.40 5182.20 5457.23 5677.26 5853.28 5994.10 6106.76 6196.88 6268.98 6326.66 6372.80 6409.72 6439.25 6462.88 6481.78
BPV-FPV-MPV-NPPV -448.52 56.66 399.36 614.54 730.06 768.12 746.39 678.90 576.82 448.98 302.40 142.57 -26.13 -200.31 -377.29 -555.02 -731.90 -906.70 -1078.52 -1246.67

19
The paper also demonstrates the relevance of the maintenance investment
throughout the Life Cycle of Physical Assets through the Availability indicator
that is one of the most pragmatic ways to measure the maintenance efficacy.
Figure 3 – Values of investment, several costs and benefits
Figure 4 – Annual financial results of a physical asset investment
-2000
0
2000
4000
6000
8000
10000
1 2 3 4 5 6 7 8 9 10 11 12 13 14 15 16 17 18 19 20 21
Investment Analysis
Acumulated FPV Acumulated MPV
Acumulated Total Costs Acumulated Benefits BPV
BPV-FPV-MPV-NPPV
-1500
-1000
-500
0
500
1000
1500
1 2 3 4 5 6 7 8 9 101112131415161718192021
Investment Analysis
BPV-FPV-MPV-NPPV

20
References
[1] Farinha, J. M. T. (2018): “Asset Maintenance Engineering Methodolo-
gies”. CRC Press; 1st edition (May 29, 2018). English. Printed in USA.
ISBN-10: 1138035890. ISBN-13: 978-1138035898.
[2] Ljiljana, K.; Dragutin, L.; Zelimir, D. (2014): “Asset governance as strat-
egy for physical asset”. 7th
International Conference of the School of
Economics and Business Conference Proceedings, 13.-14.09.2014., Sara-
jevo, Bosna i Hercegovina. Pp208-221. https://www.bib.irb.hr/728091
[3] Stimie, J.E.; Vlok, P.J. (2016): “A Mechanism for the Early Detection
and Management of Physical Asset Management Strategy Execution
Failure”. South African Journal of Industrial Engineering November
2016 Vol 27(3) Special Edition, pp 158-173.
http://dx.doi.org/10.7166/27-3-1651
[4] Eicher, B. (2016): “Selection of asset investment models by hospitals:
examination of influencing factors, using Switzerland as an example”. In-
ternational Journal of Health Planning and Management 2016; 31: 554–
579. Published online 20 May 2016 in Wiley Online Library.
wileyonlinelibrary.com. DOI: 10.1002/hpm.2341
[5] Katicic, L.; Lisjak, D.; Dulcic, Z. (2014): “Asset governance as strategy
for physical asset”. 7th
International Conference of the School of Eco-
nomics and Business Conference Proceedings, 13.-14.09.2014., Sarajevo,
Bosna i Hercegovina. Pp208-221. https://www.bib.irb.hr/728091
[6] Banyani, M. A.; Then, D. S. S. (2014): “A Model for Assessing the Ma-
turity of Facility Management as an Industry Sector”. CIB W070 Interna-
tional Conference in Facilities Management. Proceedings of CIB Facili-
ties Management Conference “Using facilities in an Open World –
Creating Value for all Stakeholders”. 21-23 May Copenhagen. Pp99-110.
[7] Volker, L.; Telli van der Lei; Ligtvoet, A. (2011): “Developing a maturi-
ty model for infrastructural asset management systems”. 10th
Conference
on Applied Infrastructure Research - Infraday 2011.
http://www.infraday.tu-
ber-
lin.de/fileadmin/fg280/veranstaltungen/infraday/conference_2011/papers
_presentations/paper---volker_vanderlei_ligtvoet.pdf, accessed on
2018.08.14
[8] Raposo, H.; Farinha, J.; Ferreira, L.; Galar, D. (2017): “Dimensioning
Reserve Bus Fleet using Life Cycle Cost Models and Condition Based /
Predictive Maintenance - a Case Study”. Public Transport. Volume 10
Number 1. Springer Berlin Heidelberg. pp 1–22. DOI
https://doi.org/10.1007/s12469-017-0167-x. Print ISSN 1866-749X.
Online ISSN 1613-7159.

21
[9] Raposo, H.; Farinha, J.; Ferreira, L.; Galar, D. (2017): “An integrated
econometric model for bus replacement and spare reserve based on a
condition predictive maintenance model”. Maintenance and Reliability.
Eksploatacja i Niezawodnosc - Maintenance and Reliability 2017; 19 (3):
358-368, http://dx.doi.org/10.17531/ein.2017.3.6. Pp358-368. ISSN
1507-2711.
[10] CTRE (2018): “Importance of Maturity in Implementing Asset Manage-
ment”. CTRE, Iowa State University center, administered by the Institute
for Transportation. http://www.ctre.iastate.edu/piarc/, accessed on
2018.05.15.
[11] Farinha, J. M. T. (2011): “Manutenção – A Terologia e as Novas
Ferramentas de Gestão”. MONITOR, Lisboa, Portugal. ISBN 978-972-
9413-82-7.
Authors’ Biography
José Torres Farinha
José Manuel Torres Farinha is Full Professor at ISEC
(Coimbra's Higher Institute of Engineering), Aggregat-
ed in Electrical and Computer Engineering, PhD in
Mechanical Engineering and Bachelor in Electrical
Engineering.
He is President of ISEC's Scientific Area of Engineer-
ing and Industrial Management.
He is Coordinator of the MSc in Engineering and In-
dustrial Management at ISEC.
He has published three books.
He has more than 160 publications (international and
national Journals and Conferences Proceedings).
He was President, for two terms, of the Polytechnic In-
stitute of Coimbra (IPC).
He is National Defence Auditor.

22
ME2018_1103
Rotating Equipment Energy Conservation
Initiatives
Mohammed AlTamimi, Faisal Al-Jamhoor
Aramco Riyadh Refinery, Riyadh, Saudi Arabia.
Email: [email protected],
Abstract Riyadh refinery has developed separate comprehensive program for
each of the following categories: Compressor re-rates, Fin Fan Blade Upgrade
Hydraulic Re-rates & Non-metallic Wear Parts. This paper aims to highlight com-
prehensive energy assessment carried out on different types rotating equipment to
identify energy saving opportunities and candidate equipment under each catego-
ry. Successful cases histories are also shared in brief to highlight the benefits real-
ized in terms of energy saving and improvement in equipment reliability.
Key words Rotating Machines, Energy Efficiency, Energy Conservation.
1.0 Introduction
With the surge in local demand for energy and higher capital cost of new energy
generation projects, energy conservation has become an area of high importance
for the industry as a whole and the Oil and Gas processing industry in particular.
In refineries, energy cost may reach up to 50% of the total plant operating cost.
There is an ever growing need to find out on constant basis where the energy
dollars are going and how to save it as much as possible. Rotating equipment are
the largest consumers of the energy in a Refinery and studies have shown that over
20% of the energy consumed by these systems could be saved through equipment
or control system changes. At Saudi Aramco Riyadh Refinery, Reliability Unit has
embarked on a drive to improve rotating equipment reliability and efficiency as a
part of ongoing efforts by refinery to improve its Energy Intensity index (EII).
Rotating equipment energy conservation initiatives are broadly categorized as
under:
1. Compressor re-rates
2. Fin-fan Upgrades
3. Hydraulic re-rates of pumps
4. Use of non-metallic wear parts in pumps

23
2.0 Compressor re-rates
This program is basically focusing on compressors potential saving by surveying
the plant compressors and analyzing the power consumption.
Any potential improvement of power consumption, it will be evaluated to select
proper technique based on the study outcomes.
2.1 Case Study: Wet Gas Compressor
This is a case study of rerating one of the compressors in RRD which is Wet Gas
Compressor.
The compressor was being significantly due to crude specification changed. The
crude stabilisation was being processed in CSF in RRD where the compressor is
handling the rated flow, but since the crude source changed, it became stabilized
before feeding the refinery, hence the gases reduced as shown in Table 1.
Max 48,000 Nm3/h
Min 24,000 Nm3/h
Normal Flow 12,000 Nm3/h
Recycled flow 12,000 Nm3/h
Power Consumption 3.1 MW
Suction Pressure 0.9 Kg/cm2
Discharge Pressure 5.0 Kg/cm2 Table 1 Previous Parameters
Reverse engineering was carried out for the compressor, and as a result rotor &
diaphragms were changed along with the inter-stage seals. Figure 1 shows a com-
parison of new & old shaft size.
Figure 1 Old shaft & the new shaft
24
As result of rerating, the compressor recycled flow reduced 12000 to 4000 m3/h.
Power consumption reduced by 45% to b
1.7 MW instead of 3.1 MW.
Total power saving is 1.4 MW equivalent to 0.5mm $ annual cost saving.
Another Benefits:
Avoid surge problems.
Avoid flaring in summer. $200M/Y
Total Project Cost: $2.5 MM
The project payback period is 2.5 years
3. Fin Fan Upgrade
This initiative aims to reduce energy consumption in fin fans by improving the
aerodynamic performance. This would be done by upgrading the fan blades from
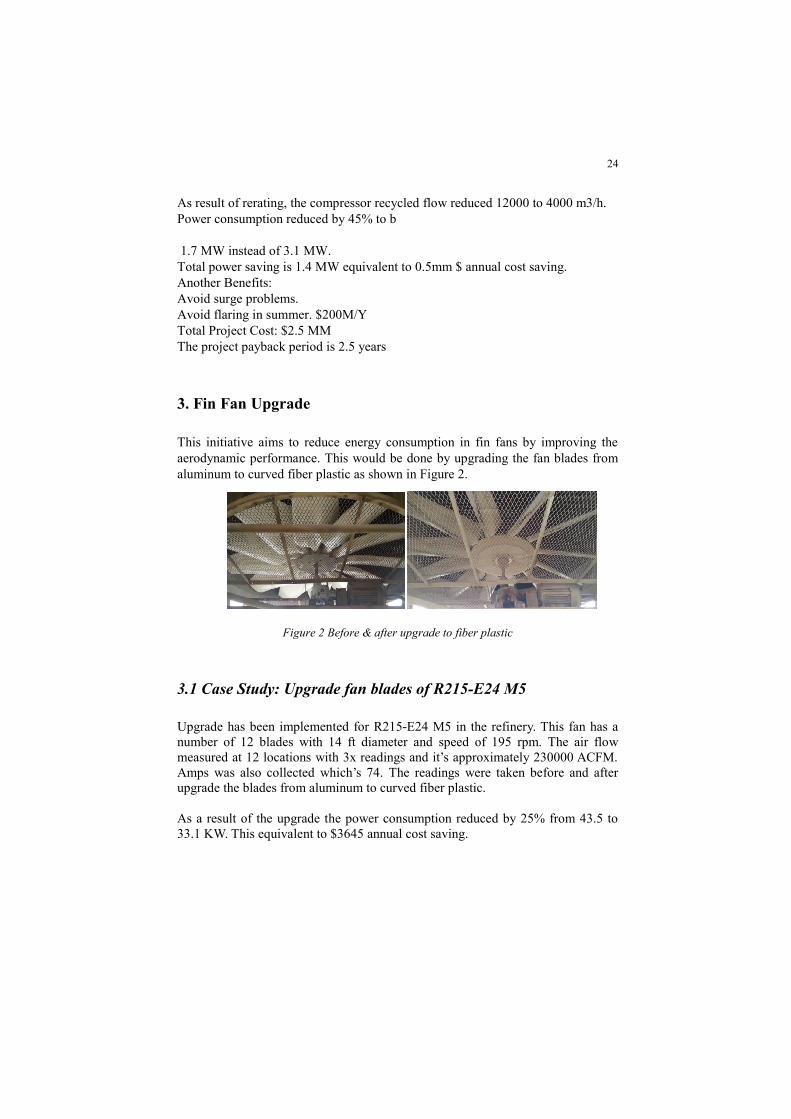
aluminum to curved fiber plastic as shown in Figure 2.
Figure 2 Before & after upgrade to fiber plastic
3.1 Case Study: Upgrade fan blades of R215-E24 M5
Upgrade has been implemented for R215-E24 M5 in the refinery. This fan has a
number of 12 blades with 14 ft diameter and speed of 195 rpm. The air flow
measured at 12 locations with 3x readings and it’s approximately 230000 ACFM.
Amps was also collected which’s 74. The readings were taken before and after
upgrade the blades from aluminum to curved fiber plastic.
As a result of the upgrade the power consumption reduced by 25% from 43.5 to
33.1 KW. This equivalent to $3645 annual cost saving.

25
4.0 Hydraulic Re-rates & Power Optimisation
The main objective of this initiative is to go over all plant’s pumps and evaluate
for energy losses such as recycled flow or throttling or even possibility of
optimisation. Based on the study outcomes, the proper technique will be selected
either trim, upgrade or replace if needed. There are five pumps were upgraded
form 27 potential pumps.
4.1 Case Study: Re-rate of Hydrocracker Debutanizer Feed Pump
This is a case study of Debutanizer feed pump, in Hydrocracker unit. The pump
was oversized and suspected high recirculation and vibration. Table 2 shows the
pump specification. It’s centrifugal, between bearings. It is pumping hydrocarbon
with capacity of 350 m3/h, and bhp is about 214 KW.
Type Centrifugal, b/w Bearing
Capacity 319.3/350.9 m3/hr
TDH 218.9 m
Sp. Gr. 0.727
Pressure Suc./Disch 7.1/23 kg/cm2
Liquid Hydrocarbon
Driver Motor, 3560 RPM
BHP 214.2 KW Table 2 Pump specification
An outside engineering company was contacted to proceed with reverse
engineering, hence new impeller & shaft were manufactured along with wear
rings. Table 3 shows the old & new material of the manufactured parts.
# Description Original material Upgraded material
1 Shaft Carbon Steel SCM4 AISI 4140 HT
2 Impeller Cast iron FC25 CA6NM
3 Impeller wear ring SUS420 J2 HT SUS420 J2 HT
4 Casing wear ring SUS420 J2 HT SUS420 J2 HT
Table 3 The old & new materials

26
Figure 3
As a result of the re-rate, the flow reduced from 350 to 150 m3/h, which is less
than 50% reduction of original flow, with minor reduction in the head as shown in
Table 4.
The change in parameters, result in power consumption, where it reduced by 55%
from 200 to 90 KW. Annual cost saving is $16,000.
Performance Data Before After
Flow m3/h 350 150
Head m 219 200
Impeller OD mm 362 360
NPSHr m 4.6 4
*Consumed power KW 200 90
Table 4 results after reverse engineering
5.0 Non-metallic Wear Parts
As an ongoing effort to improve centrifugal pump reliability and efficiency,
Reliability Unit has developed a program that utilizes non-metallic materials as
replacement wear components in place of commonly used metals (such as wear
rings, throat bushing etc.) in Figure 4. The use of non-metallic material can
improve pump efficiency and reliability through utilisation of reduced running
clearances and by taking advantage of significantly reduced friction. The unique
properties of the material can reduce vibration and significantly decrease repair
cost when a failure does occur. These improvements could help to achieve lower
maintenance cost, increased mean time between failure, and reduced equipment

27
downtime. The centrifugal pump improvement would also result in reduced
energy cost too.
Figure 4 Non-metallic Wear Parts
There are 71 candidate pumps where they’re grouped into three groups, based on
S.G & the specific speed.
5.1 Case Study: Crude De-salter Water Pump
As a pilot project, Crude Unit De-salter water Pump (Z05-P3B) stationary wear
rings were recently upgraded to PEEK based WR-525 non-metallic material. For
Z05-P3B metal wear rings, API 610 recommends minimum diametral clearance of
0.48 mm, however with use of non-metallic material clearance was reduced by
55% to 0.21 mm. As a result of this upgrade, there is a significant reduction of
52% in vibration levels from previous baseline (3.057 to 1.477 mm/sec rms). Also,
there is a noticeable increase in pump hydraulic efficiency by 5% over design
which corresponds to ~10 KW of power saving. On comparison with sister pump
(w/ metallic wear rings), P3B pump is drawing 17% lower current than P3A (134
Amp as against 161 Amp in P3A).

28
Figure 5 Cross section drawing
6.0 Conclusion
Table 5 shows the overall summary of the program for each mentioned category.
The total power saved is 1800 KW with the target is to reach more than 3 MW.
Initiatives Power Saving KW Progress
% Completed Plan
Compressor Re-rates & Power
Optimisation
1400 - 100%
Fin Fan Upgrade 215 212.5 45%
Hydraulic Re-rates & Power
Optimisation
176 950 25%
Non-metallic Wear Parts 12 303 25%
Table 5 Overall summary
Authors’ Biography
Mohammed AlTamimi
Mohammed AlTamimi is mechanical engineer working
in Riyadh refinery as rotating equipment engineer. He
has five years of experience on maintenance filed and
certified as maintenance and reliability professional.

29
Faisal Al-Jamhoor
Faisal Al-Jamhoor has been involved in rotating
equipment maintenance engineering for more than 15
years, he has been assigned at various roles throughout
Aramco organisation. He is currently Maintenance
Engineering Specialist at Aramco Riyadh Refinery, and
assume Riyadh Refinery Reliability Unit Supervisor

30
ME2018_1107:
Potential risks in implementation of
maintenance outsourcing projects (Case study
for Russia and CIS)
Boris Kryukov
Research and Consulting Group GmbH, Scheibenstr. 47, Düsseldorf, 40479, Germany.
Email: [email protected]
Abstract Due to drastic changes in process engineering and business organisation
that have occurred in recent decades, outsourcing has become a key success factor
in many industries. These changes have affected the conditions of managerial de-
cision-making processes where primary focus has been shifted toward the promo-
tion of organisation competitiveness that, in turn, requires continuous assessment
of available technologies and for ways of performance improvement. Outsourcing
is one possible solution that could help with business challenges in terms of ensur-
ing the company competitiveness.
Key words Maintenance outsourcing, Outsourcing core team, Horizontal polarisa-
tion, Blaming culture, Equipment ownership, Human resource risks, Managerial
risks, Process risks, Pre-contract work.
1.0 Introduction
A rule of thumb states: if a company is not best in-world in doing something and is
doing it in-house, it is turning down competitive edge. This is precisely why
nowadays outsourcing is an essential part of the business strategy for most of
organisations, which enables, if handled properly, cost savings and improves
processes and product quality.
Nevertheless, outsourcing is not a quick solution for the processes that have been
poorly managed. There is no reason to believe that somebody else will be able to
fix overnight the problems that an organisation has got for months or even years.
First and foremost, it must be considered as a long-term strategic management
tool.
Outsourcing activity in Russia and CIS brings a significant set of risks for service
providers. Most companies recognize this and respond by adopting a thorough risk
analysis process.

31
A purpose of the paper is to give a spotlight on some potential risks associated
with outsourcing relationships within the Russian and CIS market and draw up a
few ideas based on a theoretical and practically researched foundation for
implementation of projects dedicated to maintenance outsourcing from the
perspective of service providers, which may be used to assist companies in
making informed decisions on the issue of strategic outsourcing.
The research represents three categories of risks: human resource, managerial and
process.
2.0 Human resource risks
Prior to commencing any activities, it is vital to have a core team comprising of
well-trained, motivated players that can keep the process positively moving for-
ward. There are several characteristics to look for when assembling an outsourcing
core team. These include diversity of skills and opinion—the team must be cross-
functional, and members should have multidiscipline backgrounds. The team
should be made up of people who will challenge themselves and others. The teams
should contain the skills required to plan, analyse risks, negotiate effectively, de-
sign and execute comprehensive and effective contracts, customer relationships
and controls. They should be self-directed and should not easily accept the status
quo. The customer, product/service, and process-specific knowledge must be rep-
resented on the team. They must be able to work with people at all levels of an or-
ganisation, internally and externally.
Therefore, in organizing of the long-term collaborative partnership service provid-
ers should realistically assess capacity and capability of the local labour market,
especially when considering cost savings, they could provide as a sales argument.
If the local labour market suffers from shortage of skilled craftspeople and the
outsourcer has no possibility to turn a wage factor to an advantage, he will find
himself sooner or later, in a very difficult situation, i.e. will be faced with a prob-
lem of staff turnover. As a result, the efficiency of collaborative partnership will
tend to be zero, deliverables of the project will counter with the initial plan and the
service provider will start to lose customer loyalty due to staff rotation which
takes the client time and effort to find a way of agreed co-operation. Whereas,
employee turnover is expensive – recruitment, replacement, and training costs are
measured in multiples of annual salaries or wages. A hidden expense is lowered
productivity while a new employee learns how to do a job an experienced em-
ployee has left [1].
An alternative source of labour for company-outsourcer, in addition to the one
from local labour market and as set out in terms and conditions of the contract, is
customer manpower. In this case, the company-service provider, like the process

32
of selection of external manpower, should conduct interviews with each of the
personnel to be transferred to assess their level of competence during prepara-
tion/transition period, and should on no condition rely on the results of a customer
audit.
There is a common misconception that the transfer of customer manpower has an
advantage over any manpower taken from outside and does not need to be as-
sessed by skill level and professionalism. This opinion has been formed based on
the following assumptions:
• Personnel has enough skills and experience of the working in the industry in
which the company-client operates.
• Management of the company-supplier is interested in improving equipment
reliability and maintenance service level therefore transfers only the most
skilled and experienced employees.
Practice shows that these assumptions are far from reality. The rationale is below.
As described above there are various scenarios of outsourcing projects:
• OEM Company concludes maintenance contract with the customer immedi-
ately after the commissioning of the new equipment, so called "greenfield"
project.
• Company outsourcer (it could be OEM as well) concludes maintenance con-
tract with the customer of the existing plant or equipment, so called "brown-
field" project.
Accordingly, there are risks common to both types of projects:
1. The customer does not transfer or delays the moment of transfer of per-
sonnel, whereas it is stated in the maintenance contract. Quantitative and
qualitative composition of the personnel to be transferred should be negotiated
and agreed in the early phases and must be fixed in the contract. Sometimes the
customer may insist to include in the contract only the identification of em-
ployees’ transfer, whereas quantity and quality will be addressed in due course
after commencement of the project. Such a decision is unacceptable for the ser-
vice provider because it can lead to procrastination of the preparation period for
transferring (the staff should be aware of transition in advance, and each of
them must be interviewed), as well as the personnel reshuffle. That sort of ac-
tivity is typical for "greenfield" projects when the company-client expects to
obtain from the erection and commissioning of new production facilities the re-
placement of old plants by preserving the latter and transferring the existing
staff to new jobs. Accordingly, personnel who are engaged in maintenance of
old production facilities are transferred into the company-outsourcer who then
becomes the custodian of that function. However, if there are any changes in
the erection of main or auxiliary facilities or in reaching of contractual produc-
tion capacities, a customer can change his mind on the continuation of maintain
old production facilities and keep the most qualified personnel to him to deliver

33
all the contracted orders to their customers. In a worst-case scenario, the com-
pany-outsourcer becomes hostage to a situation where, under the contract it
must provide jobs to employees of the client but does not have sufficient re-
sources to provide accomplishment of its own services.
If, eventually, the transfer of employees has happened, but preparatory work
has not been carried out and the new terms were not announced, it leads to the
situation when transferred personnel suffer lower morale - resenting and resist-
ing the change and they find their position less secure. They feel that they have
little in common with the outsourcer trade force and are unwilling to work in
the new team.
2. Maintenance culture within the customer entity. It has been defined as ‘the
collective mental programming of people in an environment’. It is not a charac-
teristic of individuals; it encompasses several people who are conditioned by
the same education and life experience [2].
The environment which most Russian and CIS companies' employees work in
can be characterized by strong horizontal polarisation, the definition of which is
shown in Figure 1.
Figure 1 Horizontal Polarisation in an Administrative Structure
The horizontal polarisation indicates the presence of opposite views and atti-
tudes across departmental boundaries. Conflict builds up across the boundaries
of the main departments—viz. Production, Maintenance, Engineering, Stores—
and to a lesser extent across the sub-departments, e.g., Electrical Maintenance
and Mechanical Maintenance [2].
The Production–Maintenance conflict is the most well-known, when mainte-
nance view considers that production staff only can mal-operate and never let
them have the equipment for proper maintenance. The production view is that
they produce money and maintenance staff does not understand their objectives
when production give them the plant for a shift and they keep it for a day [2].
• Stores
Them
• Production
Them • Engineering
Them
• Electrical
Them • Mechanical
Us

34
Thus, moving to a new environment, employees are trying to apply the same
patterns of behaviour, carrying the syndrome of "us and them" into the new or-
ganisation.
Another common feature of Russian and CIS companies' work environment is
the 'blaming' culture when each level in the hierarchy tries as little as possible
to inform the superior level about faults or mal-operation therefore avoiding
punishment. This approach educates employees with the wrong idea about the
methods and principles of work, but as well, unfortunately, the lack of such in-
formation at the first stage of the feasibility study of outsourcing services, usu-
ally comes to light whilst the project matures.
The last, but not least, feature of Russian companies' maintenance culture is the
little sense of plant or equipment ownership. Equipment Ownership is a factor
which involves the degree to which trade force and/or operators and/or the team
feel a sense of personal ownership for equipment or an area of plant. This is
probably the most important single factor in achieving a high level of equip-
ment reliability. Where ownership exists, the equipment tends to be operated
and maintained correctly [1].
Thus, when auditing it is important to recognise and understand the culture of
the company, establish trust-based relations with the personnel of the customer
to get the most accurate picture of the current environment.
3. Sense of subordination between the management of the customer and their
former employees. Many managers and line managers are of the habit of con-
tinuing to control the work and give instructions to employees who prior to the
outsourcing implementation, were their subordinates. Such continuity cuts
across with new organisational structure, and often does harm to the project.
The challenge for management of the company-service provider is to bring
about understanding of the boundaries of responsibilities between the client and
the company.
The advantage of recruiting from the open labour market is its independence
from management and cultural sensitivities of company-client, but there some
risks still exist:
• The incoming personnel lack both process and equipment knowledge and
any form of goodwill towards the company-client.
• The incoming personnel have little sense of plant or equipment ownership
(as in the case of transferred personnel).

35
3.0 Managerial risks
In terms of relationship between a client and outsourcer a Murphy's Law ("if it can
go wrong it will go wrong") works in the best way possible: things that might be
understood wrong - will be understood wrong. In other words, any misinterpreta-
tions and understatements of contractual issues have a detrimental effect.
Distribution of authorities and processes
As a rule of thumb, a predominant hot spot in the relationship between a client and
the outsourcer becomes a difference in opinions in relation to distribution of the
authorities and processes since contract initiation. As a result, a relationship loses
coordination, project deadlines are to be reconsidered, services cannot be deliv-
ered in a proper manner, and both parties remain dissatisfied. Such problems arise
if in pending the completion of the agreement the principles of outsourcing rela-
tionships and authority distribution for decision taking have not been established
and communicated to all stakeholders. There must be no implied or generally ac-
cepted issues between client and outsourcer. All working protocols must be re-
flected in a contract or a service level agreement, or in any other official docu-
ments.
Lack of executive management support within company-client
A lack of executive support within a company-client in an outsourcing project
may cause an active or passive resistance of client's personnel which in turn leads
to a project failure. Frequently, executive management do not go too much in
detail during working out contract and profitability assessment of outsourcing,
relying solely on the opinions of subordinates and not on fact-based analysis.
There are two hot spots of such a situation because of non-participation of
management in the process mentioned: either the leader himself ends up with an
inability to implement changes or the team that are carrying on negotiations may
misunderstand the value of service and its end goal.
Misinterpretation of contractual issues
Here are issues that may occur early in a project: unprepared team of the client
may interpret terms and conditions of the contract in its own way, while as
outsourcing team may operate in the way they know and trust to operate not taking
into consideration the specific nature of client's business.
It may also happen that too many people are involved in the implementation of
any outsourcing project that are forced in a shortest time to commence
performance of new functions without the adaptation period required. In turn, this
results in misinterpretation of contractual issues.

36
Understaffed or poorly managed client's team
There is a case when a client's team that is involved in outsourcing project is too
small or poorly managed. Such a situation occurs when company-client
management is concentrated solely on the commercial terms of the contract but
not on the performance conditions; therefore, management does not spend enough
time to foresee potential shortcomings of the project during the preparation phase
to establish a proper team.
Unskilled client's team
There is a case when client staff that stays in-house has an insufficient skill base to
fulfil new functions within the framework of the project. Frequently, signing
maintenance outsourcing contract the management neglect the necessity to train its
local team to operate in new conditions or learn new procedures. Experience
shows that 60% of employees that must deal with the service providers suffer
from lack of such experience; 40% of companies do not provide any preparatory
training courses for their employees responsible for contract performance; and
only 20% of companies consider providing training to staff.
Inability of a client to catch up with a backlog
It happens that during the pre-contract phase organisations try to postpone the
solution to some issues planning to cut costs on themselves in the future by using
support of outsourcer. However, most of the projects are overwhelmed with
current issues hence there is no time left to catch up with a backlog at the end.
Resistance to change
Frequently, Russian organisations apply for outsourcing contracts for
implementation of new approaches or changes. However, along with willingness
to apply changes and get return on investments as soon as possible companies
disregard that most of the success depends upon how strictly the new procedures
and methods will be followed by them in the first place.
Cultural clash
By cultural clash is meant the communication within internal organisational
culture as well as issues related to involvement of foreign companies in terms of
outsourcing projects. There are issues concerning determination of deadlines of
tasks, decisions-making styles in respect of which the outsourcer has one idea and
the customer may have absolutely the opposite ideas. Working with Non-
Nationals there are issues of miscommunication due to discrepancies in languages
and norms of nonverbal communication and translation.
Changes do not take roots
Old habits die hard. Therefore, even if the customer provides preparatory training
of its personnel the outsourcer may still has difficulties in bringing new
approaches. Over time, companies give less attention to have tracking of the
change to implementation and assume that positive changes may happen by

37
themselves. The point is that companies pay less attention to the areas that impact
the success of both outsourcing project and business.
4.0 Process risks
Even poor performers have processes, albeit these are often informal and
disorderly. High performers have both efficient and effective processes that serve
the needs of their people in delivering a high level of availability of their assets
[3].
Two examples below show how discrepancies in the processes may impact the
relationships between a client and outsourcer.
1. Company-client does not have its own well-developed processes required for
management of outsourcing project, i.e. quality assurance process, continuous
improvement process, scope changes management process, project
management process, etc. When applied it results in the following effects:
• Process execution of outsourcer is blocked by a lack of corresponding pro-
cedures of the customer. The simple example is a customers' inability to de-
fine performance assurance requirements (or approve requirements that
were preliminary provided by service supplier) that allow reaching required
level of availability of equipment.
• Due to lack of its own sustainable processes the outsourcing process is de-
fined and inaccurately understood by customer inaccurate. It leads to un-
foreseen division of authorities and responsibilities when an outsourcer
finds itself responsible for the tasks that he could not accomplish.
•
2. Company-client cannot assess properly the level of development of its
processes and chose an outsourcer with higher process requirements. As a
result, the efficiency improvements of several processes are inconsistent. It
contradicts the seamless transition of outsourcing when firstly, a consistent plan
of process improvement is to be made; secondly, assessment is to be carried
out; finally, the plan is to be revised and approved. In the absence of such plans
there are gaps in between internal and outsourced processes.
5.0 Development of effective approach
To mitigate contract management risk, it is best to develop a contract and negotia-
tion plan to proactively document all aspects of the agreement including service
level agreements (SLA), escalation procedures, product specifications, transitional
requirements, roles and responsibilities, and exceptions. The more successful or-

38
ganisations have developed comprehensive approaches to project planning and
decision making; have employed rigorous tools, frameworks, and methodologies;
have demanded excellent cross-functional and cross-company teamwork; and have
implemented highly effective risk management, performance management, com-
pliance and control techniques, and disciplines.
Pre-contract consultancy also can sometimes be justified where the provider is
very concerned about the risks involved. In such circumstances the provider senior
management may feel that any additional cost (for much of the work would need
to be done anyway if the contract goes ahead) is well justified.
If pre-contract consultancy is agreed upon, then typically, it will cover:
• The documentation of existing maintenance systems at all relevant sites to
confirm the final scope of work for the outsourced services.
• A risk assessment to identify major areas of potential failure or delay in
both service delivery and any new approach implementation.
• The production of detailed specification for each function to be transferred
and, if relevant, a detailed project implementation plan.
However, the provider could find himself being caught-up in a lengthy pre-
contract period during which time it requires to put in a great deal of resources for
which the he does not get paid. The last case scenario has never been fully avoided
but counter-balanced.
6.0 Conclusion
Before proceeding to the outsourcing project, a time- and resource-consuming
campaign of negotiation, contracting and preparation lies ahead, where success of
the latter depends upon various factors as sales strategy, outsourcing teamwork
and thorough analysis of customers' internal environment and procedures.
The customer environment is a given. Unless an outsourcer is by being the OEM
build a new facility, the plant, technology, in most cases the people are already
there. Customer's current practices, both positive and negative, or somewhere in
between are also a given. If they do not match outsourcer's vision they have to be
considered for adjustment or change. When the gap between the customer present
reality and the supplier vision is understood, it can be closed. Closing that gap will
require a collectively agreed plan that gets the client and outsourcer there, and the
plan must include all the people, behaviour, system and process that will be in-
volved in the adjustments or changes. The outsourcer should understand what
drives behaviour in a client's organisation to influence changes in that behaviour.
These activities are the performance drivers for delivering the change happen.
They will require the most work.

39
References
1. Book: John D. Campbell, James V. Reyes-Pick Nell, 2006, Uptime: strategies
for excellence in maintenance management (2 Ed.) Productivity Press ISBN 1-
56327-335-7.
2. Book: Kelly, Anthony, Maintenance management: its auditing and benchmark-
ing Industrial Press ISBN 0-8311-3267-1.
3. Book: Nyman, Don, Maintenance planning, scheduling, and coordination In-
dustrial Press, ISBN 978-0-8311-3418-1
Authors’ Biography
Boris Kryukov
2012 / 2015 Graduated as MSc, School of MACE, The
University of Manchester.
2017-12 to Present Senior Consultant in Research and
Consulting Group GmbH (International management
consulting company specialized in the metals &
mining industry): • Structuring, execution and completion of national and international
management consulting projects on own responsibility. • Management of international teams with staff responsibility.
• Support in the acquisition of new consulting projects.
• Expansion and development of consultancy approaches.
• Management of challenging and diversified projects, such as map-
ping and optimisation of business processes as well as implementa-
tion support of identified measures; development and implementation of business strategies; elaboration and execution of investment strate-
gies, Feasibility studies and Due Diligence etc.
2010-07 / 2017-12 Senior Project Manager in SMS
Group • Management of multi-faced projects (development of project plans,
management of individual deadlines and goals).
• Management of project scope by assessing requirements changes, de-termining and conveying impact on budget, time and risk. Identifica-
tion of issues and problems, generation of solutions and/or approach-
ing of appropriate alternatives.
• Project Management of Reliability Approaches Implementation in terms of outsourcing rendering services.

40
ME2018_1108
Method for a qualitative cost benefit evaluation
of process standardisation for industrial services
Achim Kampker, Maximilian Lukas, Tobias Leiting, Philipp Jussen
FIR e.V. at the RWTH Aachen University. Campus-Boulevard 55, 52074 Aachen, Germany.
Email: [email protected]; [email protected];
[email protected]; [email protected]
Abstract Industrial service providers deliver complex technical services (e.g.
inspection, maintenance, repair, improvement, installation and turnarounds) for a
wide range of technical assets in process industries such as the chemical industry.
Due to the versatility of assets and industries, there is also a variety of the
corresponding service offerings. The demand for a high service quality and the
general cost pressure leads to the need of a more efficient and standardized design
of the service processes. However, cost-benefit ratio related decisions regarding
the questions where and how service processes should be standardized entail great
challenges for small and medium-sized enterprises. This is because there is often a
lack of understanding of cost savings through process standardisation, which is
caused by a lack of understanding of the correlations between process
characteristics and process target values. Because of this, the goal of this paper is
to develop a method for a quantitative evaluation of the cost-benefit ratio of
process standardisation measures. Within this method, the relevant service
performance processes are selected first. Next, the process data will be recorded
with the help of questionnaires. These are then analyzed by looking for
correlations between the process characteristics and the process target values.
Afterwards standardisation measures are derived on the basis of these findings in
order to improve deficit characteristics and thus target values. Finally, the
method´s practical applicability is tested and validated by applying it to an
industrial service in the chemical industry.
Key words Industrial Services, Process Standardisation, Cost Benefits, Lean Ser-
vices
1.0 Introduction and Objective
Companies belonging to the industrial service sector of the process industry (in-
spection, maintenance, repair, improvement, installation, turnarounds) are faced

41
with major market-related challenges in the provision of complex technical ser-
vices [1]. On the one hand, process industry companies outsource their services,
which do not belong to the direct value creation, more and more to external ser-
vice providers. These service providers, most of them are small and medium-sized
enterprises (SMEs), usually do not deliver individual services but extensive solu-
tions which include a guarantee of plant availability [2–6]. On the other hand, the
fact that the market is dominated by a few large customers leads to a high cost
pressure for the small service suppliers [3,7,8]. In addition to the general competi-
tive pressure on the market, industrial services in the process industry are subject
to a high technical complexity. The service objects (machines and plants) vary
greatly in type, function, configuration and wear condition. Combined with differ-
ent requirements on the service creation process, this leads to a high process diver-
sity [1,9–11].
In order to keep a strong position in this competitive market environment, indus-
trial service companies must find a balance between high efficiency and effective-
ness in the service provision whilst also offering a broad range of services [3,12].
Increasing the degree of standardisation of the service processes offers the poten-
tial of improving the competitive position of industrial services providers. The
standardisation of service processes aims at minimising process variance and in-
creasing process control [13]. This entails an increase in customer satisfaction and
a decrease in wastage [14]. An improvement of the process predictability and the
realisation of process optimisations can be achieved with a high degree of process
control, a high process stability [15,16]. A study has shown that large industrial
service providers who standardize their processes to a high degree are more suc-
cessful than those who do not work with standardized processes yet [17,18]
In contrast to the large service providers, SMEs rarely repeat individual service
process variants and thereby the standardisation of individual process variations
only leads to small increases in efficiency for them. Furthermore, decision-makers
cannot usually quantify in advance without major efforts which cost-benefit-
relation results from standardisations. Thus, SMEs can only initiate standardisa-
tion measures on the basis of subjective assumptions [19]. Due to the subjective
decision, there is a risk that costs and benefits will be misinterpreted. Because
SMEs only have limited resources in general, they cannot afford to initiate stand-
ardisation projects that do not promise a positive return on investment. The high
effort required to estimate the cost-benefit-relationship and the high risk of failure
due to lack of information often keeps SMEs from driving process standardisation
forward and from implementing improvements and thus enhancing their competi-
tive situation [10].
Consequently, industrial service SMEs for the process industries often lack a well-
founded, practicable and efficient method based on quantitative process data for
the evaluation of standardisation potentials and the derivation of standardisation
measures. To close this research gap, the aim of this paper is to develop such a
method. Using this method, the existing service process is recorded, relevant pro-

42
cess data is collected and analyzed with regard to standardisation potentials and as
a last step, standardisation measures are derived from this data-based information.
2.0 Theoretical Framework
2.1 Industrial services
In this paper, industrial services in general are defined based on their process
characteristics [20]: They are independent, marketable outputs which are provided
at an external factor (e.g. an object of the customer) specified by the customer.
The external factor is integrated into the creation process of the service provider.
This service process is beneficial for the external factor [21]. Industrial services
are investment services which, as opposed to consumptive services, are not con-
sumed by the end user, but instead are an investment into industrial companies
[22]. Thus, industrial services are usually product- and machine-related services
which are provided to technical objects of commercial clients [23]. Like produc-
tion processes also service processes contain a logically and substantially com-
plete chain of activities with defined input values (inputs) and process results
(outputs) [24].
2.2 Standardisation of industrial services
In general, the term standardisation refers to all forms of unification of objects.
With regard to processes, standardisation is commonly understood as the antici-
pated thinking through of activity sequences, which allows these sequences to be
performed more routinely and uniformly when repeated [25]. The integration of
the external factor as the process characteristic of services prevents a complete
standardisation of services [26]. The possible degree of standardisation of a ser-
vice process first and foremost depends on the heterogeneity and the requirements
of the external factor [27]. In the technical literature, there is no commonly ac-
cepted measure for a direct evaluation of the standardisation degree of service
processes. Frequently, the degree of standardisation is distinguished only qualita-
tively, for example by the means of the values low, medium and high [17,20]. In
the process of transferring methods of lean management, Six Sigma and Lean Six
Sigma, to the service sector, first approaches for a quantitative recording of the
stability and quality of service processes have been developed and applied [23,28–
30]. Examples for this are the recording of the cycle time, first fulfilment propor-
tion, timeliness and query frequency [23,30]. These quantitative values, usually
called key performance indicators (KPI), provide information on the quality of the
regarded service process in comprised form [23]. However, the actual degree of
standardisation cannot be measured by these KPI.

43
3.0 Method
The aim of this paper is to develop a method that can be used to investigate the
predominant stability of execution processes in industrial services and to derive
effective standardisation measures to increase process control.
Process-related methodological requirements are derived from the industry and
application reference. First, a large number of similar but not congruent execution
processes have to be analysed using the method on the basis of service orders ac-
tually performed. In addition, service orders have to be recorded using suitable
characteristics with disjoint characteristics and target values of cost, time and
quality dimensions. From a scientific point of view, the method has to be charac-
terised by practicability, a high cost-benefit ratio and the use of quantitative pa-
rameters.
The method described in this paper is a solution system that models the reality by
using representative data, analysis tools and measures. In practice, it is common to
design such a method on the basis of a framework. The generic phases of process
management are the used framework for this method. This framework consist of
(1) the process identification, (2) the actual process analysis, (3) the target process
design and (4) the change programme [31–33]. During the process identification
phase, the core processes are identified and the area of examination is narrowed
down with an evaluation of process effectiveness and efficiency. During the sec-
ond phase, the selected processes are investigated further with the help of analyti-
cal methods. Making the employees a part of this analysis is an essential factor in
developing problem awareness and recognizing improvement opportunities. Dur-
ing the third phase, possible target process scenarios are outlined based on the
previously identified weaknesses. For this purpose, company-specific characteris-
tics such as the existing organisational structure or the degree of the employees’
qualifications need to be considered. In the fourth phase, measures for the realisa-
tion of the target processes are developed, prioritized and organised according to a
hierarchy for further processing [31].
4. Results
Following the four phases of general process analysis, the developed method also
consists of four individual steps to be performed one by one (cf. figure 1). During
the first step, it is to be decided which area of the process is to be focused during
the analysis. In a second step, the collection of process data is prepared and data is
conducted. A standardized questionnaire serves as a tool for the data conduction.
In the third step, the collected process data is analysed with the help of statistical
methods. In a fourth step, suitable measures for process standardisation are de-
fined based on the data analysis results, prioritized and transferred to a hierarchy.
Subsequently, the applicability of the resulting standardisation method is validated
in practice.

44
4.1 Identification of processes
In practice, industrial service companies find themselves confronted with a low
process stability of the services they offer. Because of this lack of stability, it is
not advisable to decide which specific area of the process should be inspected be-
forehand. Instead, the first sub step of the process analysis (sub step I.1) is used to
identify the process section of the company involved that holds the biggest poten-
tial for standardisation measures. In order to do this, the processes are recorded.
Based on these records, each of the services is evaluated with regard to its profit
share and execution frequency. The evaluated processes are all arranged in a port-
folio to provide an overview. From this overview, those services are selected that
are repeated frequently and contribute to a large share of the general turnover. In a
second sub step (sub step I.2), the execution processes are narrowed down further
with the help of nine pre-defined process characteristics with a morphology. The
evaluated process characteristics are (1a) incoming type of order, (2a) information
II
Training of Employees and Definition of Sample Size
Recording of Process Data
II.1
II.2
1
2
3
4
Conduct of the Process Data Collection
1
2
3
4
1
2
3
4
IV
Design of Standardization Measures
Design of the Change Program
IV.1
IV.2
Derivation of Standardization Measures
a.
b.
c.
d.
Measure
a.
b.
c.
d.
Measure
High Medium Low
1
2
6
5
3
4
7
Cost
Utilit
y
Hig
hM
ediu
mLow
I Identification of Processes
B
E
CA
FD
G
Recording and Evaluation of the Service ProgramEfficacy
Efficiency
Process Significance:
Great
Medium
Small
F
D
E
C
A
GB
Narrowing of the Execution Processes
I.1
I.2 FIII
Preparation of Process Data Analysis
Statistical Analysis of Process Data
III.1
1
2
3
4
Analysis of the Process Data
Analysis of Causes
III.3
III.2
Figure 1: Scheme of the sequence of the individual steps of the method

45
quality regarding resources, (3a) information quality regarding location, (4a) in-
formation quality regarding the order, (5a) informative value of the customer, (6a)
type of interaction, (7a) availability of technical documents, (8a) task routine and
(9a) object routine. The seven target values are (1b) on-schedule performance,
(2b) external inquiry rate, (3b) internal inquiry rate, (4b) interruption rate, (5b)
complaint rate, (6b) internal error rate and (7b) rework rate. These characteristics
and values help to describe different service scenarios clearly. They also help to
ensure the comparability of the services that are analysed.
4.2 Conduct of the process data collection
As a first sub step (sup step II.1), the sample size to be analysed for statistically
significant evidence need to be calculated and which processes are to be included.
Following this, it is necessary to train the operative employees who will be in
charge of the process data collection. The training they receive is aimed at estab-
lishing a better understanding of the process analysis background as well as pass-
ing on knowledge on how to collect the process data required for the analysis, so
that the data of various employees documented in the questionnaire is as objective
as possible. After the employees have received the training, the process data will
be collected as part of the overall second sub step of the conduct of the process da-
ta collection (sub step II.2). Depending on the service requests of the service
company, this can take weeks. In this sub step, operative employees evaluate per-
formed service orders with the help of the questionnaire subsequently to the per-
formed process and submit the questionnaire to an independent analyser.
4.3 Analysis of the process data
In the first sub step of the third part (sub step III.1), the collected process data is
prepared for the following statistical data analysis. First the questionnaires are
checked for completeness. Questionnaires that fall short of a previously defined
degree of completeness are not used for the analysis. If questionnaires need to be
excluded, the overall size of the analysis sample will have to be reconsidered in
order to ensure that it remains representative. If the minimal sample size is not
reached, further the data of additional processes need to be collected.
In the second sub step (sub step III.2), the statistical analysis of the process data
is performed with the help of a contingency analysis. The aim of this is to identify
and evaluate correlations between process characteristics and process target val-
ues. For this, variables pairs, consisting of one process characteristic and one pro-
cess target value, are examined. In order to keep the analysis effort on an adequate
level, the process characteristics with a high degree of variance and the process
target values with a low degree of target achievement are identified. Subsequently,
the statistical analysis is conducted for the selected process characteristics and
process target values. Therefore, contingency tables are compiled and the statisti-
cal independence of the variables is examined. If the independence of the varia-
bles can calculated, a statistic dependence will be assumed. Afterwards the corre-

46
lations between process characteristics and target values are evaluated using the
test values 𝜙 (Phi), Cramer’s V, the contingency coefficient 𝐶𝐶 and Pearson’s 𝑟.
The test values help to judge the strength and a possible linearity of the correla-
tion. In the third sub step (sub step III.3), the causes for insufficient process per-
formance are analysed by derivation from the time- and cost-related effects of low
process performance. This sub step aims to identify the biggest improvement po-
tentials and to uncover the reasons for low process performance. The fundamental
causes for low process performance can be identified with the Ishikawa diagram
method.
4.4 Derivation of standardisation measures
As the first sub step of the fourth phase, a workshop is organised in order to use
the previously identified causes of low process performance to derive standardisa-
tion measures (sub step IV.1). When applied, the measures must decrease the var-
iation of the process characteristics and, as a result, increase the overall process
stability. For each fundamental cause, at least one standardisation measure should
be derived. The designed measures then need to be evaluated with regard to the
preferences of the affected stakeholders, the approach and the anticipated benefit.
In the second sub step of this phase (sub step IV.2), the interdependencies be-
tween the measures are identified. Afterwards, the benefit and the effort of the
measures with regard to the previously identified improvement potentials are es-
timated. Finally, the measures are compiled to a change program under considera-
tion of their interdependencies and their effort-benefit relation.
4.5 Practice Validation of the method
In order to prove that the developed method fulfils the previously defined re-
quirements, a validation was carried out in practice. Real data (i.e. service orders)
from industrial services for the chemical process industry were used for this pur-
pose. With the help of the method we established before, 84 service orders from
the day-to-day business of industrial service companies were examined. Amongst
these, most services regarded the topic of technical maintenance in accordance
with DIN 31051, but some were also related to plant, container and pipeline con-
struction [34]. Questionnaires for these processes were given to the responsible
service employees., Out of a sample of 84 filled out questionnaires 76 had a suffi-
cient extent and were used for the further analysis of the processes. The applica-
tion of the designed method lead to the following results: The investigation has
shown that 13 (17,1 %) of the processes didn’t met the scheduled time, there were
external inquiries in 15 (19,7 %) processes, internal inquiries in 10 (13,2 %) of the
processes and 21 (27.6%) of the processes had to be interrupted. This deficient led
to 3906 working hours per year which were not used as effectively and efficiently
as possible, because processes do not yet meet the anticipated process targets.
Within the analysis of the process data the process characteristics (1a) incoming
type of the order, (2a) information quality regarding resources, (4a) information

47
quality regarding the order and (7a) availability of technical documents correlated
significant with the deficient process targets. That means this characteristics have
the highest standardisation potential. Based on this outcome, five suitable stand-
ardisation measures could be derived and the quantitative benefit of each possible
measure was estimated. The two most beneficial of these measures are (I) a devel-
opment of a standardized order acceptance form and (II) an external customer or-
der program. If only these two measures were implemented, approx. 2100 working
hours per year could already be saved and used more efficient.
5.0 Discussion and Conclusion
In this paper, a method for the analysis of service provision processes in the indus-
trial service industry was developed. The four-phase structure of the method meets
the industry- and process-related requirements. As the validation with real indus-
trial process data proved, the method can be easily applied in an industrial context.
The results of this validation showed that the application of the suggested method
does lead to a very high benefit for the company involved: precise standardisation
potentials were identified and quantitatively evaluated. The effort required to ap-
ply this method was less than that needed to apply conventional methods such as a
fundamental standardisation of the complete service portfolio, because a large
number of similar process variants could be investigated in one analysis step and
only standardise the most significant characteristics for insufficient process target
values, making our method quicker to use and more efficient. The requirement to
use quantitative parameters for analysis for a cost-benefit assessment was also ful-
filled by providing process target variables of the three dimensions cost, time and
quality. By applying the method in the validation within a industrial service envi-
ronment, more than half of the wasted working hours could be attributed to pro-
cess characteristics and reduced by only a few standardisation measures. Re-
strictions of the method are, however, that typically only parts of the execution
processes of a company can be analysed, since the method cannot be used parallel
or sequentially to the execution of the performance processes. Furthermore, the ef-
fort for the application of the method itself should be further reduced. Designing
and using the questionnaire (handing it out, filling it out and collecting it again) is
time consuming and the statistical analysis should be automated for a wide use in
the industry. A third challenging aspect is that the quality of the process data col-
lected depends on the accuracy of the information provided by the surveyed em-
ployees who complete these questionnaires.
In the future, the method should be tested in other companies in the industrial ser-
vices sector and other sectors and improved on the basis of this experience. The
data acquisition and data evaluation should be further improved. For example, an
efficient and parallel process data input and direct evaluation of the entered data
would be conceivable. In conclusion, however, it should be noted that the devel-
oped method has clear advantages for the field of application of the industrial ser-

48
vices industry compared to other, already more common methods of process opti-
misation. It is a self-contained and practical approach.
6.0 Acknowledgement
This work has been funded by the “Allianz von Forschungsvereinigungen” (AiF)
within the program “Förderung der industriellen Gemeinschaftsforschung und -
entwicklung” (IGF) by the German Federal Ministry of Research and Technology
(support code: 19388N). The authors wish to acknowledge the AiF for their
support.
References
[1] T.A. Cook & Partner Consultants GmbH (Ed.), Jahrbuch Maintenance 2014, Berlin,
2014.
[2] T. Ball, E. Sprockamp, Lünendonk®-Liste 2017: Führende Industrie-Unternehmen in
Deutschland, 2017.
[3] WVIS, WVIS-Branchenmonitor 2015: Befragung Industrieservice in Deutschland,
Düsseldorf, 2015.
[4] WVIS, WVIS-Branchenmonitor 2016: Industrieservice bleibt in der Erfolgsspur,
Düsseldorf, 2016.
[5] Hossenfelder, Schramm, IndustrieserviceGuide 2014: Instandhaltung in der
Prozessindustrie, 2014.
[6] Bain & Company, Winning in industrial service: The hallmarks of a service champi-
on, 2015.
[7] T. Ball, J. Hossenfelder, e | Site Services: Standorteffizienz mit engineered Site
Services: Wertschöpfungssteigerung durch profeddionelle Service- und Technik-
Partner, Kaufbeuren, 2015.
[8] T. Ball, L. Holzmann, Lünendonk®-Whitepaper 2014 Industrial FM: Service im
industriellen Umfeld, 2014.
[9] J. Reichel, G. Müller, J. Haeffs, Betriebliche Instandhaltung. 2. Auflage, Springer,
Wiesbaden, 2018.
[10] M. Lukas, A. Kampker, P. Jussen, Process characteristics and process performance
indicators for analysis of process standardisation, WCEAM 2017 (2017) 25–41.
[11] T. Fleiter, Energieverbrauch und CO2-Emissionen industrieller Prozesstechnologien.
Einsparpotenziale, Hemmnisse und Instrumente, Fraunhofer-Verlag, Stuttgart, 2013.
[12] WVIS, WVIS-Branchenmonitor 2014: Befragung Industrieservice in Deutschland
Ergebnisbericht, Düsseldorf, 2014.
[13] W.A. Shewhart, Economic control of quality of manufactured product, D. Van Nos-
trand Company, New York, 1931.
[14] L.A. Kasiri, K.T. Guan Cheng, M. Sambasivan, Integration of standardisation and
custimisation. Impact on service quality, customer satisfaction, and loyalty, Journal of
Retailing and Consumer Services (2017) 91–97.

49
[15] W. Sihin, K. Matyas, Lean Maintenance. Standardisierung und Optimierung von
Instandhaltungsprozessen, Praxiswissen Instandhaltung (2011) 59–77.
[16] M. Mĺkva, V. Prajová, B. Yakimovich, Standardisation - One of the Tools of Contin-
uous Improvement, Procedia Engineering (2016) 329–332.
[17] M. Honné, Erklrungsmodell ausgewhlter Lean-Prinzipien für industrielle
Dienstleistungen, Apprimus Verlag, Aachen, 2016.
[18] G. Schuh, M. Honné, M. Lukas, Konsortial-Benchmarking "Leand Services 2014",
Aachen, 2014.
[19] G. Schuh, Change management - Prozesse strategiekonform gestalten, Springer,
Berlin, 2006.
[20] H. Corsten, R. Gössinger, Dienstleistungsmanagement. Vol. 5, Oldenbourg,
München, 2007.
[21] H. Meffert, M. Bruhn, K. Hadwich, Dienstleistungsmarketing, Springer Fachmedien,
Wiesbaden, 2015.
[22] C. Homburg, B. Garbe, Industrielle Dienstleistungen: Bestandsaufnahme und
Entwicklungsrichtungen, Journal of business economics 66 (1996) 253–282.
[23] C. Fabry, P. Jussen, M. Honné, P. Stüer, Nachhaltige Effizienzsteigerung im Service:
Verschwendungen vermeiden - Prozesse optimieren. Vol. 1, Beuth, Berlin, 2015.
[24] M. Schulte-Zurhausen, Organisation. Vol. 6, Vahlen, München, 2014.
[25] W. Hill, R. Fehlbaum, P. Ulrich, Organisationslehre 1. Vol. 5, Paul Haupt, Bern,
1994.
[26] M. Gersch, Die Standardisierung integrativ erstellter Leistungen, Institut für
Unternehmensführung und Unternehmensforschung der Ruhr-Universität, Bochum,
1995.
[27] S. Fließ, Dienstleistungsmanagement: Kundenintegration gestalten und steuern. Vol.
1, Gabler, Wiesbaden, 2009.
[28] P. Jussen, Betriebskennlinien für industrielle Dienstleistungen. Vol. 1, Apprimus
Verlag, Aachen, 2016.
[29] A. Laureani, Lean Six Sigma in the Service Industry, InTech, Rijeka, Croatia, 2012.
[30] A. Laureani, J. Antony, A. Douglas, Lean six sigma in a call centre. A case study, In-
ternational Journal of Productivity and Performance Management 59 (2010) 757–768.
[31] G. Schuh, A. Kampker, Strategie und Management produzierender Unternehmen:
Prozessmanagement, Springer, Berlin, 2011.
[32] M. Rittstieg, Methodik zur Prozesssynchronisierung in der Auftragsabwicklung des
industriellen Werkzeugbaus, Apprimus Verlag, Aachen, 2012.
[33] K.K. Kuhlmann, Methodik zur Gestaltung von Geschäftsprozessen im industriellen
Werkzeugbau, Apprimus Verlag, Aachen, 2011.
[34] DIN Deutsches Institut für Normung e. V., Grundlagen der Instandhaltung (31051),
Beuth Verlag, Berlin, 2012.

50
Authors’ Biography
Achim Kampker
Achim Kampker studied mechanical engineering at RWTH Aachen University
from 1995 to 2000, in production engineering. He graduated with his doctorate at
the chair of Production Systematics at the RWTH Aachen University under the
lead of Günther Schuh. From 2009 to 2013, Kampker was professor and holder of
the Chair of Production Management at the Machine Tool Laboratory (WZL) at
RWTH Aachen University. Since 2014 he has headed the newly founded Chair of
Production Engineering of E-Mobility Components (PEM). In 2015 he took over
the joint board of directors of the FIR e.V. at RWTH along with Günther Schuh.
Maximilian Lukas
Maximilian Lukas studied industrial engineering, raw material and materials
technology at RWTH Aachen University with a focus on raw material extraction
and innovation management. Since 2013 he has been working as a research
assistant and project manager at FIR e.V. at RWTH and is a member of the Lean
Services group. His activities at FIR include the development of an industry 4.0
maturity model for manufacturing companies together with a globally active IT
company. In addition, Mr. Lukas deals with the topic of service performance
measurement in various industries, such as the wind energy industry and
industrial services, as well as the professionalisation of after-sales service,
maintenance and industrial services with established methods from the material
goods industry.
Tobias Leiting
Tobias Leiting studied mechanical engineering with a focus production
engineering and economic science at RWTH Aachen University. Since 2017 he
has been working as a research assistant and project manager at FIR e.V. at
RWTH. As part of the Lean Services group, Mr. Leiting is dedicated to the
systematic improvement of (data-based) services by optimizing services with a
focus on value added. In addition, he supervises studies on services in the context
of digitisation.
Philipp Jussen
From 2004 to 2011 Philipp Jussen studied mechanical engineering and
management at the RWTH Aachen with a focus on production engineering and
financial services. Since 2011 he is project manager at FIR e.V. at RWTH Aachen
(FIR) in the field of service management. The focus of his work in the Lean
Services group was on the design and optimisation of service processes. Since
2013, he has headed the Lean Services division. Since 2015, he has headed the
services management division of FIR. The Department researches and advises
compies on the design and implementation of data-based services.
51
ME2018_1109
Creating Competitive Advantage by
Transforming Maintenance Organisation
F. Lesmeister,1 A. Costa,
2 G. Papandrea
2
1The Boston Consulting Group GmbH, Koenigsallee 2, 40212 Düsseldorf, Germany
2The Boston Consulting Group Chile Ltda., Av. Costanera Sur 2730, 8th Floor, Las Condes,
Santiago, Chile.
Email: [email protected]; [email protected];
Abstract Process industry is typically characterized by high capital expendi-
ture (CAPEX) needs, complex sites with thousands of pieces of equipment, long
distances, and a large degree of interdependency between those pieces of equip-
ment. The main aim of a site is to achieve high overall equipment effectiveness
(OEE) and to achieve a healthy return on capital employed (ROCE). Maintenance
is the main driver for attaining the required OEE level. The characteristics of a
process site like a pulp mill make it difficult to carry out efficient and effective
maintenance. This requires a well-designed manufacturing organisation, efficient
processes, and a practical reliability strategy.
Key words Process industry, maintenance organisation, reliability-centered
maintenance, OEE improvement.
1.0 Introduction
A newly built site in process industry requires high CAPEX. The necessary
investment to develop and build a new line of a pulp mill can often be more than
$2 billion. Shareholders expect a substantial ROCE; a typical ROCE in this kind
of industry is higher than 6%, best in class companies reach above 10%.
Maintenance is an important driver for reaching this target. On the one hand,
maintenance strategy and execution have an important impact on OEE, which
translates to how effectively the installed capacity is used and therefore how much
a site can produce and sell. On the other hand, the cost of maintenance, especially
for regular turnarounds (TAR), reflects a high share of operational expenditures
(OPEX).

52
Process sites are typically characterized as follows:
1. Flow production: Nearly all equipment is linked. A problem in one item
often leads to a problem for the whole site, even resulting in needing to
stop of the whole production line with a highly negative impact on the
total OEE.
2. Substantial amount of equipment: A process site often has more than
10,000 pieces of equipment installed
3. Large size of site: A process site often covers several square kilometers;
the BASF site in Ludwigshafen, for instance, covers around 10 km2.
These points make it challenging to carry out effective and efficient maintenance.
Two key issues need to be addressed.
1. How to structure the maintenance organisation to cover the size of the
site and the immense complexity of equipment
2. How to ensure high site reliability with a manageable effort given the
high number of equipment
2.0 Case Study
One of the largest pulp mills located in Chile wanted to increase EBIT by over
20%, the main drivers being total OEE improvement and a reduction in mainte-
nance cost.
The site covers 1.7 km2, produces about 750,000 tons per year, has an installed
base of more than 18,000 pieces of equipment, and employs more than 200 people
in maintenance.
To achieve the target a program with three main pillars was launched (see figure
1).
1. Improve maintenance governance by implementing a best-in-class
maintenance organisation as a foundation for efficient processes and ef-
fective maintenance strategy.
2. Improve maintenance execution by optimizing routine maintenance pro-
cesses, eliminating root causes for equipment failures and optimisation of
turnaround to reduce maintenance cost and improve OEE.
3. Improve maintenance strategy by focusing on reliability and moving to-
wards predictive maintenance as the main driver for OEE improvement.

53
Figure 1 Maintenance transformation program
2.1 Maintenance Governance
The structure of maintenance organisations sets the foundation for high efficiency
in processes and enables an effective maintenance strategy. Defining a
maintenance organisation at complex production sites typically found in process
industries requires the optimisation of three dimensions.
1. Focus
Three main maintenance roles can be distinguished, each role has
different aims and needs different skill profiles: strategy, planning, and
execution. The maintenance strategy defines what equipment should be
maintained in what way to increase reliability: run to failure, planned
maintenance, or predictive maintenance. Maintenance planning develops
the detailed maintenance plans, in other words detailed steps and
processes, tools, and spare parts. Maintenance execution goes through the
processes according to maintenance plans. The organisation must allow
for these activities to be focused on.
2. Specialisation
If there are a lot of different kinds of equipment installed at a site, special
technical skills are required to maintain them. The maintenance
organisation must then reflect these requirements.
3. Proximity
The size of the site may dictate a compromise between proximity and
bundling of activities and skills. Long travel distances between pieces of
equipment lead to more non-value-adding time and therefore low
productivity. So local maintenance teams in close proximity to the areas

54
and equipment in question are better off in terms of wrench time and
people management. However, this would require a high number of
employees to cover the skills required, which often leads to low
utilisation, thus increasing cost. Ultimately, it’s necessary to strike a
balance between bundling and local teams.
The Chilean pulp mill decided to structure their maintenance organisation along
the three main roles,
strategy with a reliability department,
planning with a dedicated planning department, and
execution with two central maintenance workshops (electrical and
mechanic) and two field maintenance departments (liquid and pulp
areas).
Execution already reflects the proximity and specialisation topic on the first
organisational level. Within all departments the next levels are structured along
required skill profiles (specialisation)—see figure 2.
Figure 2 Maintenance organisation chosen by a pulp mill
2.2 Maintenance Execution
Maintenance execution greatly influences overall maintenance costs and also has a
significant impact on OEE. To improve both—reduction in cost and improvement
in OEE—three levers can be addressed.
1. Improve routine maintenance processes
In maintenance, more than 50% of maintenance activities are typically
recurring activities like inspections or regular replacement of parts.

55
Optimizing these activities can reduce the cost of maintenance
significantly. In routine maintenance, a lot of waste is hidden: long travel
distances to installed equipment, missing tools and spare parts, high
variance in process times and quality, and lack of knowledge of standard
times in planning, all of which lead to low utilisation. Lean
manufacturing [1, 2] offers a set of valuable levers that can also be
transferred to maintenance. Recurring tasks can be standardized. Detailed
standard operation procedures (SOP) describe step-by-step in an easily
understandable way how an activity has to be done, which tools and
spare parts need to be used, what the standard duration is, and which
activities need close attention to avoid safety risks and quality issues.
SOPs should define best practices; they are the basis for continuous
improvement based on plan-do-check-act (PDCA) [3]; following is not
optional, it is mandatory. To avoid stockouts in spare parts, a pull system
based on kanbans can be used. Holding daily meetings within
maintenance departments, as well as in cooperation with operations,
delivering performance, addressing key issues, and discussing root causes
and improvement activities all form the foundation for continuous
improvement.
2. Establish routines for continuous improvement to eliminate root causes
for failures
At process-industry production sites, many “bad actors” can be found. A
bad actor is an item of equipment with either a high cost—repair costs
plus cost due to downtime per single intervention—or high total cost due
to high number of interventions. A typical bad actor analysis for a pulp
mill is shown in figure 3.
Figure 3 Bad actor analysis at a pulp mill
The reduction in cost caused by bad actors requires a systematic process
for identifying and eliminating the root causes. The process has to be easy
and fast because this is not a one-time effort—it has to be gone through

56
regularly to improve site performance step by step. A simple and proven
approach is to employ a combination of an Ishikawa diagram [4] and the
5 Whys [2]. Within the first step, all failures of bad actors will be
statistically analyzed and prioritized, and potential root causes will be
identified in a combined maintenance/operations workshop facilitated by
reliability engineers and using an Ishikawa diagram. For the second step,
these potential root causes will be prioritized and drilled down by using
the 5 Whys to find the primary root causes. Measures to prevent these
root causes will be defined in the last step. Eliminating these root causes
leads to a reduced cost of maintenance and higher OEE due to less
breakdowns and production stops.
3. Optimize turnaround management
Cost of turnarounds are by far the highest share of maintenance costs,
TAR often represents 50% of total maintenance cost. Furthermore, TAR
means a regular production stop of several weeks, which leads to a loss in
OEE and therefore to a loss of contribution margin. TAR optimisation has
to focus on two main topics.
Reduction of duration and frequency
For TAR, production must be stopped. The more time is spent
for TARs each year, the more OEE losses are. To reduce TAR
time, the duration per TAR or frequency of TARs can be
reduced. Improvement in TAR management is the biggest lever
to reduce duration. A TAR needs to be well planned. For
preparation, every activity must be defined, the required spare
parts must be ordered, and contractors must be assigned and
trained (e.g., safety training). During TARs, all activities must be
monitored regarding time to plan and budget to plan.
Responsible are the TAR planner and scheduler; due to their
dedication to TAR they can focus on these activities. The
frequency of TAR can sometimes be challenged: for example,
the pulp mill changed the frequency from 12 months to 18
months without a negative impact on reliability.
Reduction of cost per TAR
The scope of a TAR is the main driver for cost per TAR. Some
planned task are often not required. The implementation of a
gate-keeping process (figure 4) is a powerful lever for reducing
the scope to the required level. A clearly defined decision tree
should be used to reduce the scope to the required level without
increasing the risk for reliability of the site. The decision should
be aligned between maintenance and operations.

57
Figure 4 Reduction of scope of TAR
2.3 Maintenance Strategy
Reliability-centered maintenance
High OEE is key for process-industry production sites, as explained above. That
means reducing unplanned shutdowns as much as possible. A traditional approach
for reducing all kinds of risk is reliability-centered maintenance (RCM). The aim
of RCM is to minimize the risks for safety, health, and environment, as well as the
sum of maintenance costs and loss in contribution margins due to shutdowns.
Therefore for each piece of equipment, the function of the equipment is defined
and potential malfunctions and root causes are identified. Each cause has to be
classified based on its potential severity and probability. Significant risks have to
be mitigated by countermeasures, which can include inspections or preventive or
predictive maintenance activities; for low-risk equipment, run-to-failure can be the
right strategy—in theory at least.
As described above, a process-industry production site can have thousands of im-
plemented pieces of equipment, following the aforementioned approach would
take considerable effort that will never be paid back. For practical reasons a lighter
approach is required.

58
Not every piece of equipment requires the same depth of analysis. Most compa-
nies start with RCM at a site where maintenance plans are already in place and
have been followed for years. This leads to four different strategies; the decision
tree in figure 5 supports the decision about strategy
Critical, single pieces of equipment
If equipment is critical (safety/health/environmental [SHE] risks,
risks of production losses) a full RCM should be done to miti-
gate risks.
Critical equipment families (SHE risks, cost risks)
Similar equipment, for which differences in specific functions
are negligible, can be treated as a group. RCM will be done for
this group instead of each single piece of equipment.
Critical equipment (SHE risks, but low cost risk)
A general review, which means monitoring the equipment, is the
right strategy; this means collecting data based on inspections
and failure reports and treating them as bad actors.
Noncritical equipment with low costs and no failures in the past
This kind of equipment does not need a special analysis, the cur-
rent maintenance strategy can be kept. Monitoring this equip-
ment will show if additional analysis is required in the future.
Figure 5 Decision tree for reliability-centered maintenance strategy
Predictive maintenance
The aim of predictive maintenance is to predict equipment failure and to prevent
it. This is much more efficient than traditional preventive maintenance where parts
are changed simply based on time of usage or similar strategies; sometimes that is
too late, which leads to breakdowns, or too early, which leads to high cost. In

59
predictive maintenance, the condition of individual pieces of equipment is
monitored to identify the right time for intervention. Monitoring can be done by
visual inspections or by measuring parameters with sensors. At process-industry
sites, there is typically a plethora of sensors in place, but data is not utilized
effectively. Some reasons include a lack of data collection and sharing due to
limitations in technology or capabilities for analyzing the data, which can easily
reach the dimension of tera- or petabytes. New technologies, like cloud-enhanced
sensors and edge technology that preanalyze data, and advanced analytics models
offer options for getting more out of the data and enable an organisation to adopt
predictive maintenance approaches. To test the power of predictive maintenance,
data from pumps where collected and analyzed. The result is impressive: by using
that data and developing a predictive maintenance model, 85% of failures could be
predicted, which translates to a reduction of 15% in material cost and 20% in labor
and service cost (see figure 6). To anchor predictive maintenance within an
organisation, a specific skill set is required that is normally not to found in
maintenance organisations. A dedicated position for predictive maintenance is
defined in reliability departments for an engineer with data scientist background.
Figure 6 Decision tree for reliability-centered maintenance strategy
4.0 Conclusion
The pulp mill decided to run a full maintenance transformation program given the
complexity of the manufacturing processes and site. The expected improvement of
EBIT over the next years is more than 20% (figure 7). To achieve this, rigorous
project management is required with close monitoring of the status and the
involvement of whole organisation. A culture change is required. This can only be

60
achieved if you mobilize the whole organisation and change the boundaries people
are used to working in. People generally act rationally [5]. If the aim is to change
their behavior, the context they work in needs to change (figure 8). Some
examples of how the work context was changed at the paper mill include
introducing new performance metrics, implementing new daily cross-functional
meetings, and introducing new roles in the organisation.
Figure 7 Financial results of transformation program
Figure 8

61
References
[1] James P. Womack, Daniel T. Jones, Daniel Roos: “The Machine That Changed
The World”, Simon & Schuster, 1990
[2] Taiichi Ohno: “Toyota Production System: Beyond Large-Scale Production”,
Productivity Press, 1988
[3] Nancy R. Tague: “The Quality Tool Box, Second Edition”, ASQ Quality
Press, 2010
[4] Kaoru Ishikawa: “Guide To Quality Control”, Asian Productivity Organisa-
tion, 1991
[5] Morieux, Y.: “Resistance to Change or Error in Change Strategy?,” The Mul-
timedia Encyclopedia of Organisation Theory: From Taylor to Today, Erhard
Friedberg , Research & Organisation, 2011.
Authors’ Biography
Dr. Frank Lesmeister
Dr. Frank Lesmeister studied mechanical
engineering and received his doctorate in quality
management at the Laboratory for Machine Tools
and Production Engineering (WZL) of the RWTH
Aachen University (Germany).
Dr. Lesmeister has worked in the Düsseldorf office
of the international management consultancy The
Boston Consulting Group for 11 years and has
been responsible for a variety of maintenance
projects in various industries. As Associate
Director, he also coleads the quality management
topic globally.
Agustin Costa
Agustin Costa is a MSc. in Industrial Engineering
(ITBA, Buenos Aires Institute of Technology), and
received his Master in Business Administration
degree with distinction from Harvard Business
School.
Mr. Costa has been with the international
management consultancy The Boston Consulting
Group (BCG) since 2005 and is now a Partner &
Managing Director. He leads BCG’s Operational
Excellence Practice within Materials and Process
Industries (MPI)

62
Gabriel Papandrea
Gabriel Papandrea studied electronic engineering
at the Kyushu Institute of Technology in
Kitakyushu, Japan and completed a master’s in
business administration at the Massachusetts
Institute of Technology. Mr. Papandrea has worked
for 4 years in the Santiago office of the
international management consultancy The Boston
Consulting Group, currently as Principal. He
previously held various executive positions at
LATAM Airlines, where he led the company’s lean
transformation program.

63
ME2018_1110
Forest Maintenance Management centred on
Biomass Collection
Filipe Didelet Pereira
Polytechnics Institute of Setubal, Portugal.
Email: [email protected]
Abstract This work intends to present a way of planning the preventive logis-
tics management (in which the fires occurrence is concerned) similar to the
maintenance work orders management. In fact the preventive actions on the for-
ests ground must be always understood as maintenance actions.
In fact, in Portugal the problem with forest wildfires increases partially because of
the consequences of climate changes. Throughout the years, the number of fires
and area burned has increased. In this work the maintenance actions to be carried
out upstream are focused on biomass collection and use.
Two different work orders flowcharts are presented both municipality centred be-
ing one of them initialized in the municipality forest management service and the
other by forests owners’ initiative.
Key words Biomass Collection, Work Order, Flowchart, Preventive Maintenance
1.0 Introduction
According to [1], consensus on the need for international co-operation to combat
climate change has resulted in increased attention to the role of forests in storing
carbon and the large quantity of C02 emissions that could be avoided if deforesta-
tion was halted. Deforestation and forest degradation are the second leading hu-
man cause of CO2 emissions contributing to global warming. [1]
Furthermore climate changes press towards urgent solutions to get a better forest
management and a preventive action in two steps. The second step concerns the
forest security and the first step includes all the actions leading to the forest treat-
ment and management in order to decrease the probability of fire deflagration.
This work is focused only on the first step. On the other hand [2] states that forest

64
wildfires are a major problem to Portugal. And, of course, forest wildfires are a
main type of forest degradation.
This problem requires a strong policy of prevention. The prevention can be done
by two different approaches. The first concerns the public fire education and
awareness, since more than 50% of the wildfires in Portugal are due to careless or
criminal behaviour. The second depends directly on preventive silviculture, with
fuel reduction, selection of species and many others actions [2]. Among these ac-
tions, preventive collection of biomass must be encouraged but prior to that a
complete information system must be conceived in order to assure collection lo-
gistics, storage, analysis and, depending on analysis results, biomass processing
for use (burning, incorporation as raw material for pellets, etc.).
The author intends to show how this information system can be managed as a
maintenance management information system. Needs for biomass collection will
be treated as maintenance work orders.
Biomass use can be a way for income generation, both for forest owners and mu-
nicipalities but this is not the aim of this work and so it will not be discussed here
even if the author agrees that forest owner’s stimulation for biomass collection is a
major factor to achieve a good result in fire prevention.
2.0 The Municipality Centred Preventive Action
Recently in Portugal the Government transferred to the municipalities the coordi-
nation of the above called first step preventive actions. So, the forest management
information system is centred, at this level, in the municipalities.
All the actions to be performed by the municipality are from now on called inter-
nal actions. Most of them are new challenges and new services are needed to per-
form them. However some other actions must also be managed by the municipali-
ty. If so these actions must be outsourced to several external entities.
The internal services and the general outsourced entities are characterized in the
following. The names used here can be different from others already used in sev-
eral regions and situations.

65
2.1 Internal Services
A specific service for preventive maintenance forestry management must be
charged of all municipality logistics (including the collected biomass storage
between the collection and the processing moments) and work preparation closely
linked with the forest owners and the external companies and laboratories evolved
in the process. This service will be called, for instance, “Municipal Maintenance
Forestry Management Service” –M3F. Under this service or under a general
maintenance service a “Municipal Forestry Brigade” (MFB) must be created for
the work execution on place (forest). Some other “municipal services” (MS) can
be called to work in this process but may be they already exist (services already
using biomass, transport services, etc.).
2.2 External Services and Plants
Besides the internal services, some external services (EXT) and process plants
must cooperate in the process on a regular basis. Among these and first of all the
analysis laboratory is crucial for the process. This laboratory must be charged of
the collected biomass analysis in order to decide of the recommended uses.
Together with laboratory, external outsourced collection brigades (work suppliers)
must be included, if necessary, when advisable in the process. The maintenance
management software must be conceived in such a way that all these situations
can be possible and easily managed.
The other entities to work with are the different kind of biomass users, namely
boilers users, several types of process transformation plants (pellets, for instance)
and so on.
All these intervenients are indicated in the next section in the flowcharts aside the
actions representation.
3.0 Information System and Flowcharts
For the information system illustration two situations are represented under the
form of flowcharts, the first being the work orders automatically initiated by M3F
and concerning the regular and predicted forest maintenance biomass collection
actions. The second type of situation is a non-predicted situation to be initiated by

66
the forest owner by calling to M3F and asking for the biomass non-regular collec-
tion. This can be made by phone or e-mail and always must be validated by M3F.
As these are non-predicted actions they probably are completely outsourced and
so the first flowchart is represented as on site action being carried out by munici-
pal services and in the second these are represented as outsourced actions.
Figure 1 M3F regular work order
67
Figure 2 Forest owner request

68
4.0 Conclusion
The information system for a preventive forest biomass collection was designed.
For the first step of prevention the action centred on the municipalities is advisable
and so, the work orders can be managed according to a maintenance management
system and service and through a maintenance management software. There is no
need of a specific management software being possible to find completely
marketed solutions.
References
[1] Colaço, Mº Conceição; Castro Rego, Francisco; Meira, Pablo; Santos, Teresa.
What are the Opinions of Foresters in Portugal regarding Fire? Results of a
Questionnaire. ISA, Lisboa, Portugal, 2005.
[2] Susane Morrison-Métois, Hans Lundgren. Forests and Suatainable Forest
Management. Evaluation Insights, Number 11, OECD, 2016
Authors’ Biography
Filipe Didelet Pereira
Dr. Filipe Didelet Pereira is an Associate Professor at
Technology College, Setubal Polytechnics. He works
normally in the reliability prediction of thermal and
process equipment by means of mathematical and
functional models and in maintenance management
methodologies. He has two books published on
Maintenance Management and Reliability.

69
ME2018_1111
Solving Gearbox Frequent Failure Problem
Keri Elbhbah1, Jyoti K. Sinha
1, W. Hahn
2
1School of Mechanical, Aerospace and Civil Engineering (MACE); The University of
Manchester; Oxford Road; Manchester; M13 9PL; UK.
2 HPC Nuclear New Build; EDF Energy; Bristol; UK.
Email: [email protected]; [email protected];
Abstract Power plant contains three water–cooling towers with a total of 30
fans. 27 out of the 30 fans experience frequent failures on their gearboxes. It is ob-
served that the frequent failures lead to high maintenance cost. Vibration meas-
urement can predict the presence of a fault at early stage so that maintenance ac-
tivity can be planned before failure. Operation Deflection Shape (ODS) used to
analyse the gearboxes problem and based on the observation the root cause of the
frequent failure was found. Paper also highlights the findings after implementation
of the modification to all fans.
Key words Power Generation; Combined Cycle Gas Turbine; Gearbox; Condition
Monitoring; Operation Deflection Shape
1.0 Introduction
Power station consists of three identical turbines with total power energy of
1135MW. Each unit has its own condensate cooling tower which contains ten fans
(five per row) for forced cooling of the condenser water. Figure 1(a) and 1(b)
shows pictorial representation of the complete cooling tower as well as the fan and
its gearbox. Each fan has 6 blades and driven by an electric motor which is
situated outside the fans’ stack. The electric motor is connected to the fan through
a gearbox. The schematic diagram of the gearbox together with the motor and fan
shafts is shown in Figure 2.

70
Figure 1 (a) Cooling tower, (b) a motor-gearbox-fan assembly
Figure 2 Schematic diagram of the gearbox
2.0 Vibration measurements & analysis
Several vibration measurements were carried out including online and offline
measurements, so as to develop a robust understanding of the dynamic
characteristics of the entire structure.
2.1 Spectrum analysis
Vibration data was collected at a number of locations on one of the Unit-1 cooling
fans’ gearboxes and its supporting steel frame. The measurement was conducted
while the fan was running at its normal rotating speed [1]. Figure 3 shows the
measurement locations on the gearbox as well as the supporting steel frame.
(a) The gearbox (b) The supporting steel frame
Figure 3 Vibration measurement locations
V
H
A

71
The vibration acceleration spectra were computed for the measured vibration data
acquired from all the measurement locations. Figure 4 shows the computed spectra
for the measured vibration data at location 1V1 for a frequency range up to
2000Hz. The amplitude spectra for the vibration data measured at the steel frame
at both vertical and horizontal directions show dominant peaks at the high gear
mesh frequency (HGMF) 348Hz with its higher harmonics (696Hz; 1044Hz;
1392Hz….etc.)..
Figure 4 Typical spectrum for the vibration measured at 1V1 for frequency range 0-2000Hz
The zoomed spectra for the low frequency range up to 30Hz presented in Figure
5(a) shows the appearance of peaks at the fan blades passing frequency
(6x1.4=8.4Hz); its second harmonics (16.88Hz) as well as the motor speed
(24.75Hz).
Figure 5 Zoomed view of Figure 4, (a) 0-30Hz, (b)323.3-366.7Hz
The zoomed spectrum about the HGMF (348Hz) shown in Figure 5(b), clearly
shows the HGMF peak and side band peaks spaced at equal distance of 6.2Hz (in-
termediate shaft frequency) or motor speed (24.8Hz), hence this indicates the de-
fect/damage in these shafts
a b
1*BPF
2*BPF HGMF

72
2.2 Operation Deflection Shape (ODS)
The collected data while the fan was on operation used to compute the averaged
amplitude spectrum are used here to plot the Operation Deflection Shapes (ODS)
in order to understand the motion of the supporting steel frame when the fan oper-
ates under normal condition [2]. The ODS of the steel frame were plotted at: the
motor speed (24.75Hz); the low gear mesh frequency (92.4Hz) and at the high
gear mesh frequency (346.5Hz). Figure 6(a) shows the steel frame’s ODS at the
motor speed where both legs moving in phase with low displacement near the
gearbox region which may not cause any stress in the gearbox. The ODS at both
gear mesh frequencies (LGMF & HGMF) shown in Figures 6(b) and 6(c), clearly
indicate that both frame legs are moving out of phase at the LGMF and in phase at
the HGMF with relatively high displacement near the gearbox which may induce
stress in the gear box as well as the motor and intermediate shafts.
Figure 6 Steel frame ODS at: (a) 24.75Hz; (b) LGMF 93Hz and (c) HGMF 346Hz
3.0 Modal Tests
The modal test was conducted on the support steel frame using the impulse-
response method [3], where the frame was excited using instrumented hammer,
when the entire tower was under static condition (zero speed) and the vibration
response was collected at the 16 locations on the steel frame shown in Figure 3.
Gearbox Side
a
c
b

73
Figure 7 shows typical FRF plot for the vibration data collected at location 1V1, it
is very clear that two identified natural frequencies at 97.5Hz and 345Hz are close
to the LGMF (92.4Hz) and HGMF (346.5). This confirms that both gear mesh
frequencies are always in resonance during fan operation.
Figure 7 Typical FRF plot
4.0 Possible Solutions & Plant Implementation
This problem can be sorted by changing the structure’ natural frequencies, in order
to avoid any resonance in the system or replacing the existing gearboxes with dif-
ferent gear ratio to shift the gear mesh frequencies away from the structures’ natu-
ral frequencies.
In 2015, the gearboxes were replaced with new gearbox with significantly differ-
ent gear ratios as shown in Figure 8. Table 1 shows comparison between the old
and new gearboxes.
50 100 150 200 250 300 350 4000
0.02
0.04
0.06
X: 97.5
Y: 0.0006902
Frequency, Hz
Accel./F
orc
e (
m/s
2/N
)
1V1X: 345
Y: 0.04396
50 100 150 200 250 300 350 400-200
-100
0
100
200
X: 97
Y: -88.19
Frequency, Hz
An
gle
,deg
.

74
Figure 8 Schematic diagram of the new gearbox
Table 1. Old and new gearboxes configurations
Modal tests were again conducted on the support steel frame with the new gearbox
in both vertical and horizontal directions. The modal tests confirm that none of its
natural frequencies coincide with the gear mesh frequencies. Figure 9 shows FRF
plot for the new gearbox.
Running speeds/frequencies Old Gear Box New Gear Box
Motor speed 1485 RPM, 4.75Hz 1485 RPM, 24.75Hz
Fan speed 84.38 RPM, 1.4Hz 85.22RPM, 1.42Hz
Intermediate shaft speed 371.2 RPM, 6.18Hz 465.88RPM, 7.76Hz
Low GMF (between fan and in-
termediate gear shaft)
92.4Hz 116.44Hz
High GMF (between motor and
intermediate gear shaft)
346.5Hz 396.8Hz
Number of fan blades 6 6
Fan Blade Passing Frequency 8.43Hz 8.52Hz

75
Figure 9. Typical FRF plot for the new gearbox structure
It is clear that none of the new structures’ natural frequencies coincides with the
gear mesh frequencies. Since the gearboxes were replaced, no more vibration is-
sues have been observed on the cooling towers.
5.0 Conclusion
A Combined Cycle Gas Turbine with 3 identical units with total power of
1135MW has 3 cooling towers. Upon the observation of the repeated frequent
failures in 27 out of the 30 cooling fans, vibration measurements (under static and
rotational conditions) were conducted to ascertain the root cause(s) of the failure.
Data analysis show high possibility of resonance phenomena. Also, the ODS anal-
ysis clearly indicate that both frame legs are moving out of phase at the LGMF
and in phase but different vibration amplitudes at the HGMF which cause stress
on to the motor as well as the intermediate shafts and hence the meshing teeth.
The old gearboxes were replaced with new ones with different gear ratios in order
to shift the gear mesh frequencies away from the earlier values. There were no
natural frequencies were found close to the gear mesh frequencies and hence no
failure since then.
0 100 200 300 400 5000
0.01
0.02
0.03
X: 230
Y: 0.02807
Frequency, Hz
1V1A
cc
el./F
orc
e (
m/s
2/N
)
X: 353
Y: 0.02714
X: 466.5
Y: 0.01684
0 100 200 300 400 500-200
-100
0
100
200
Frequency, Hz
An
gle
,de
g.

76
6.0 Acknowledgment
Authors would like to acknowledge the support of the innovative KTP Project
No. 9227. Also, they want to acknowledge Mr. Christopher Williams and Mr. Kev-
in Sharp, EDF-UK for providing information and support at site during the meas-
urements and experiments
References
[1] Ebersbach, S., Peng, P., and Kessissogloub, N., 2006. The investigation of the
condition and faults of a spur gearbox using vibration and wear debris analysis
techniques. Wear, Volume 260, Issues 1–2, January 2006, pp. 16-24.
[2] Sinha, J.K., 2014. Vibration Analysis, Instruments, and Signal Processing
CRC Press, Florida, 1st Edition.
[3] Ewins, D.J., 2000. Modal Testing–Theory, Practice and Application. Research
Studies Press, UK, 2nd
Edition.
Authors’ Biography
Keri Elbhbah
Dr Keri Elbhbah is a Research Associate at the school of
Mechanical; Aerospace & Civil Engineering (MACE),
The University of Manchester, UK. Dr Elbhbah was
involved in a number of projects related to vibration-
based condition monitoring of steam turbines’ blades. Dr
Elbhbah is an author of more than 20 technical papers
(Journal and peer reviewed conferences). Actively
involved in solving number of rotating machines and
structures vibration issues.
Jyoti K. Sinha, BSc(Mech), MTech(Aero), PhD, CEng, FIMechE
Prof Jyoti K. Sinha is Programme Director of Reliability
Engineering and Asset Management (REAM) MSc course
and Head, Dynamics Laboratory, School of Mechanical,
Aerospace and Civil Engineering, The University of
Manchester UK. The REAM course is an industrially

77
focused professional course on Maintenance which is
accredited by the IMechE UK. This course is now
completely on the international mission under his
leadership. Prof. Sinha is involved in and solved a number
of industrially applied research projects related to
Vibration-based Condition Monitoring and Maintenance
of Machines and Structures in last 28 years. Prof. Sinha is
the author of more than 250 publications (Journals and
conferences), technical reports and books and gave a
number of keynote/invited lectures. Prof. Sinha is the
associate editor of 3 international journals, editorial board
member of 2 journals, and members of several
international conferences. Prof Sinha has started a series
of an International Conference of Maintenance
Engineering (IncoME) and the Journal of Maintenance
Engineering (JoME) from August 2016. He is also
technical committee member of IFTOMM
Rotordynamics.
Dr. Wolfgang Hahn
I am employed by EDF Energy, United King-
dom working on the HPC Nuclear project as
part of the commissioning team for the new Eu-
ropean Pressurized Reactor designed power sta-
tion units. Previously worked for EDF Energy
as Head of Engineering in the Central Technical
Organisation for Coal, Gas and Renewable as-
sets. The portfolio of assets support consisted of
plant reliability, maintainability, risk, integrity
and life extension management. I hold a BEng
degree, a MSc degree in Maintenance Engineer-
ing and Asset management and a PhD degree
Mechanical Engineering specializing in plant
life cycle engineering.

78
ME2018_1114
Shortcomings of applying standalone
Conventional Reliability Method for Rolling
Stock Risk Assessment
Frederick Appoh
RAMS Engineering & Asset Management Consultancy Limited, 113 Monument Court,
Woolners Way, Stevenage, SG1 3AE, UK.
Email: [email protected]; [email protected]
Abstract Reliability and risk analysis methods can allow for systematic eval-
uations of these uncertainties supporting effective decision making associated with
reducing the consequences in case of unexpected results. However, it has become
a common practice in the rolling stock industry that standalone conventional
methods are used for the evaluation of performance and risk. This approach often
leads to inconclusive decision-making process regarding risk and reliability man-
agement. This paper focuses on a systematic literature review of the limitations by
adopting single conventional tools and techniques for reliability and risk manage-
ment. Traditional methods including Failure Mode Effects Analysis, Fault Tree
Analysis, Reliability Block Diagram, Event Tree Analysis are reviewed and limi-
tations assessed using a pneumatic brake unit as a case study. Finally, an integrat-
ed approach using these traditional standalone methods is proposed to address the
shortcomings of each technique for effective assessment of reliability and risk.
Key words Reliability, Quantitative, Qualitative, Failure Mode Effect Analysis,
Fault Tree Analysis
1.0 Introduction
Unforeseen failures and incidences of rolling stock operated in major cities could
result in severe delays affecting the daily commute of passengers leading to high
financial losses. This drives the point of focus towards exclusive reliability and
risk assessment of rolling stock. Risk is defined as the effect of uncertainty on
objectives and risk management is the coordinated activities to direct and control
an organisation about risk [1]. Risk management can be managed through the
influence of factors such as reliability. Reliability is commonly perceived as the
ability of a product to give long periods of satisfactory performance without

79
failure in use [2]. And it is widely defined as the ability of an item to perform a
required function under given conditions for a given time interval [3].
Traditional methods mainly Fault Tree Analysis (FTA), Event Tree Analysis
(ETA), Failure Mode Effects Analysis (FMEA) and Reliability Block Diagram
(RBD) have been the focus tools in systems modelling in risk, reliability, and
safety applications [4]. An integrated approach using more than one of the
conventional reliability methods for risk management providing a robust
assessment of risk is proposed. Also, a case study using Pneumatic Brake Unit
PBU of a rolling stock system is used as a demonstration throughout this paper.
2.0 A simple overview of the Pneumatic Brake Unit PBU
The primary purpose of the PBU is to provide the necessary brake effort to stop
the train using friction, emergency and parking braking methods as shown in Fig-
ure 1.
Table 1 PBU subsystem functions and failure rates
Figure 1 Illustration of the PBU as part of an overall rolling stock vehicle

80
3.0 Failure Mode Effects Analysis FMEA
FMEA is a bottom-up method to prevent the happening of undesirable situations.
The method estimates the magnitude of the effects upon the system by the
potential failure modes of the lowest level components of a system. It also
analyses the detection method of a failure mode [5]. FMEA analysis is
successfully performed preferably early in the development cycle so that the
removal or mitigation of the failure mode is most cost-effective [6]. The
traditional FMEA uses three factors, i.e. likelihood of Occurrence (O), Severity of
potential effect (S), and difficulty for Detection (D), to determine the Risk Priority
Number (RPN), which can address and priorities the potential failures rapidly.
This criticality is then translated into risk, which can decide whether or not the
corrective action will be taken [7]. FMECA and FMEA can be considered as
quantitative and qualitative reliability methods respectively. For example, a simple
overview of the FMECA for non-return valve (NRV) subsystem of the PBU is
shown in Table 2; The risk priority number (RPN) is the product of the
occurrence, severity and detection ratings as shown in Equation 1 [8]. Table 2
shows that the RPN values for the two failure modes associated with the NRV
have the same value of 8, where the severity, occurrence and detection have the
same rating. Thus, failure mode prioritisation between “the leaks to the
atmosphere” and “valve fails to close” become complicated and challenging to
address adequately.
Therefore, RPN is unable to assess the weighting to the three factors, which may
exist during the analysis process and needed by the participants to effectively
allocate required resources to the failure modes [9–12]. Other limitations of the
FMECA include the following [13]; (i)Interdependencies of failure modes and
effects on the same and different levels are not considered. Consequently, the risk
of a failure can be underestimated when it has multiple impacts on others [10,12]
;(ii) Different sets of the three factors can produce the same value for RPN as
shown in Table 2. However, the hidden implications may be entirely different
[9,14] ;(iii) High intensiveness of resources or the allocation of sufficient
resources for the implementation of FMEA (material, facilitator support, sponsor
support etc.) is required. Thus, FMEA is time-consuming and tedious to trace
failure through FMEA charts [15]. Due to these limitations associated with
FMEA/FMECA as a standalone method, other tools should be considered.
RPN S O D ((1)

81
Table 2 FMECA for non-return valve NRV
4.0 Fault Tree Analysis FTA
FTA is a top-down approach to analyse failures and risks, and it is used to define a
failure mode and to identify potential root causes for the failure mode. Those
potential causes are logically added to the fault tree using logic gate symbols, such
as OR, AND, NOT, etc. It is vital to obtain Cut Sets and Minimal Cut Sets (MCS)
for an FTA [7]. A quantitative FTA can be used when the probabilities of primary
events are known [16]. The probability of an unfavourable outcome of an OR and
AND gate (“system”) consisting of n independent input gates or events are
shown in Equations 2 and 3[16]:
1 2( ) 1 1 ( ) (1 ( )) . (1 ( )) .. (1 ( ))s i nt F t F t F t F tF (2)
1
( )n
s i
i
t F tF
(3)
Now considering the PBU with top event failure as “Failure of train braking sys-
tem” with information from Figure 1 and Table 1, overall failure rate and the MCS
can be estimated as shown in the FTA diagram in Figure 2 with an assumed mean
time to repair (MTTR = 2 hours) during the annual operating regime of 6,400
hours.
Function Failure Mode
Causes of Failure Mode
Effects on system
Effects on vehicle
Part Quantity in Enti
re System
[1/OH] Part Failure Rate [failures per 10^6
hours]
Severity (S
)
Detection (D
)
Occurrenc
e (O)
RPN
(S*D
*O)
Fault Detection Method
Failure Management
To prevent air backflow into the dryer
Leaks to atmosphere
Seat failure
Reduced air pressure output from Air Supply
Built-in redundancy with the 2nd compressor
2 4.68 E-08
0.00468 2 2 2 8 Audible venting during six monthly maintenance check
Replace Non-Return Valve
To prevent air backflow into the dryer
Fails to close.
Wear or contamination.
Reverse air flow is causing reduced pressure in the Main Reservoir.
Built-in redundancy with the 2nd compressor
2 4.68 E-08
0.03042 2 2 2 8 During blow down of Air Supply for maintenance work
Replace Non-Return Valve
82
Using Equations 2 and 3, the overall failure rate of the top event “Failure of train
braking system”, TF , is estimated as ( 53.106 10TF ) and the qualitative
Minimal cut sets MCS; 1 2RV RV , 1 2CV CV , NRV , MAC and AF are
determined. That means the occurrence of any of these would fail the brake sys-
tem. The limitations of the FTA include the following; (i) the usual quantification
methods for classical fault trees do not consider uncertainty in failure data[17; (ii)
FTA can only evaluate the safety and reliability of static systems and it becomes a
challenge for large complex systems [17]; (iii) FTAs are not suitable for analysing
redundant failures, common cause failures, or mutually exclusive primary events
[18]; (iv) Events in an FTA are assumed independent, which is not usually a valid
assumption [19–21]
5.0 Reliability Block Diagram RBD
The RBD Method is based on the representation of a system into blocks linked to-
gether (configurations serial, parallel, etc.) in terms of influence on the reliability
of the overall system [22]. The modelling techniques described are intended to be
applied primarily to systems without repair and where the order in which failures
occur does not matter [23]. In general, RBDs can be classified into the following
two categories: Series-Parallel RBDS and Non-series-parallel RBDs [24]. RBD
Figure 2 FTA diagram for failure of the brake system

83
can be used as a standalone reliability tool which shows clear areas of vulnerabil-
ity when nodes are arranged in a series structure, whereas relatively safe areas are
noticed when nodes are in parallel [25].
PBU data shown in Figure 1 and data contained in Table 1, the unavailability of
the PBU for the annual operating time of 6400 hours is 0.001553 per cent equiva-
lent to the availability of 99.998447 per cent using Equation 4 as shown in Figure
3(a), 3(b) and 3(c). Similarly, the PBU ’s reliability is ( ) 0.8197R t .
However, RBD as a standalone method for reliability and risk management has its
limitations such as [25]; (i) Failure probabilities of components are statistically in-
dependent;(ii) The interconnections within the RBD do not necessarily show how
the basic events/ component failures are physically connected; (iii)The complexity
of component inter-dependence should be low. These limitations inhibit RBD to
be implemented as a standalone technique.
6.0 Events Tree Analysis ETA
Event tree analysis (ETA) is an inductive procedure to model the possible out-
comes that could ensue from an initiating event and the status of the mitigating
factors as well as to identify and assess the frequency or probability of the various
possible outcomes of a given initiating event [26]. The Event Tree Analysis (ETA)
shows the sequences of events related to the success or failure of the system [27].
Event tree analysis (ETA) is a rather straightforward method for modelling of im-
pact pathways (impact scenarios) and consequences [28].
Figure 3(a) Overall RBD for PBU
system
Figure 3(b) Parallel Relay Valve Figure 3(c) Parallel Check Valve
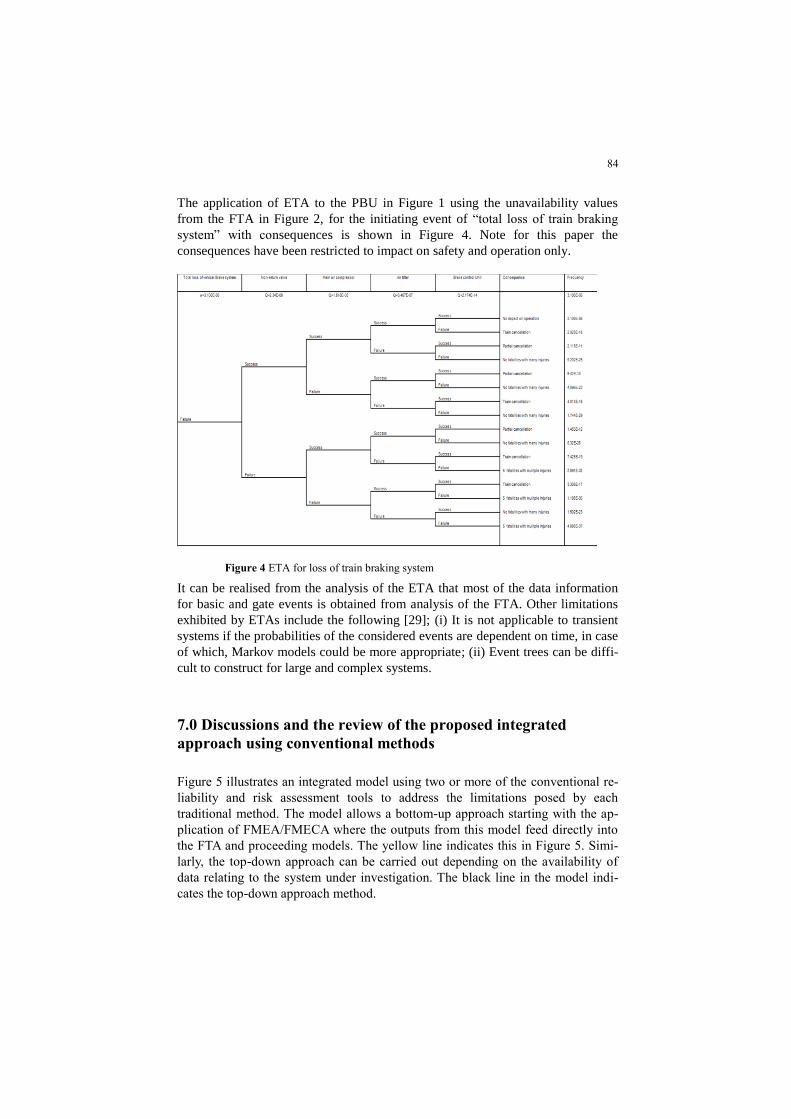
84
The application of ETA to the PBU in Figure 1 using the unavailability values
from the FTA in Figure 2, for the initiating event of “total loss of train braking
system” with consequences is shown in Figure 4. Note for this paper the
consequences have been restricted to impact on safety and operation only.
It can be realised from the analysis of the ETA that most of the data information
for basic and gate events is obtained from analysis of the FTA. Other limitations
exhibited by ETAs include the following [29]; (i) It is not applicable to transient
systems if the probabilities of the considered events are dependent on time, in case
of which, Markov models could be more appropriate; (ii) Event trees can be diffi-
cult to construct for large and complex systems.
7.0 Discussions and the review of the proposed integrated
approach using conventional methods
Figure 5 illustrates an integrated model using two or more of the conventional re-
liability and risk assessment tools to address the limitations posed by each
traditional method. The model allows a bottom-up approach starting with the ap-
plication of FMEA/FMECA where the outputs from this model feed directly into
the FTA and proceeding models. The yellow line indicates this in Figure 5. Simi-
larly, the top-down approach can be carried out depending on the availability of
data relating to the system under investigation. The black line in the model indi-
cates the top-down approach method.
Figure 4 ETA for loss of train braking system
showing

85
8.0 Conclusion
This paper provided a systematic literature review of the limitations posed by
standalone conventional reliability and risk methods used for risk assessments
within the rolling stock industry. The constraints posed by traditional methods;
FMEA/FMECA, FTA, RBD and ETA were investigated to ascertain the impact of
these limitations and effects on the output of the assessment. An integrated model
was proposed that addresses the shortcomings of each of the standalone method.
The singular utilisation of the conventional method does not effectively address
reliability and risk assessments for a rolling stock system.
References
[1] BS ISO 31000: 2018 BSI Standards Publication Risk management Guide-
lines 2018.
[2] Quality vocabulary 1991.
[3] BS 4778-3.2-1991--[2018-07-16--09-27-48 PM].pdf n.d.
[4] Wang C. Qualitative-Quantitative Bayesian Belief Networks for Reliability
and Risk Assessment 2010.
[5] Analysis FT, Mode F, Analysis E, Estimation C. Fault Tree Analysis and
Failure Mode Effects Analysis Based on Multi-level Flow Modeling and
Causality Estimation 2006:497–500.
[6] DIN EN 60812:2006, Analysis techniques for system reliability-Procedure
for failure mode and effects analysis (FMEA) 2006;3.
[7] Wei Dai, Paul G. Maropoulos, Wai Ming Cheung XT. Decision-making in
product quality based on failure knowledge Wei. Int J Prod Lifecycle Manag
2011:143–63.
Figure 5 Integrated conventional reliability and risk model
86
[8] Shahin A. Integration of FMEA and the Kano model. Int J Qual Reliab
Manag 2011.
[9] Liu, H.C., You, J.X., Meng, M. and Shao LN. Failure mode and effects anal-
ysis using intuitionistic fuzzy hybrid TOPSIS approach. Softw Comput 2015;
19:1085–98.
[10] Liu, H.C., You, J.X., Ding, X.F. and Su Q. Improving risk evaluation in
FMEA with a hybrid multiple criteria decision making method. Int J Qual
Reliab Manag 2015; 32:763–82.
[11] Bragila, M., Frosoline, M. and Montanari R. Fuzzy TOPSIS approach for
failure mode, effects and criticality analysis. Qual Reliab Eng. Int 2003;
19:425–43.
[12] Adhikary, D.D. Bose, G.K., Bose, D. and Mitra S. Multi-criteria FMECA for
coal-fired thermal power pants using COPRAS-G. Int J Qual Reliab Manag
2014;31:601–14.
[13] Laurentti, R., Villari BD and RH. FMEA problems and improvements: a sys-
tematic literature review. Res Dev Prod Eng. 2012; 10:59–70.
[14] Sankar, N.R. and Prabhu BS. Modified approach for prioritisation of failures
in a system failure mode and effects analysis. Int J Qual Reliab Manag 2000;
18:324–36.
[15] Hassan, A., Siadat, A., Dantan, J.Y. and MP. Interoperability of QFD,
FMEA, and KCs methods in the product development process. Ind. Eng.
Eng. Manag. IEEE Int. Conf., 2009, p. 403–7.
[16] En BS. Fault tree analysis (FTA) 2007;3.
[17] Kabir S. An overview of fault tree analysis and its application in model-based
dependability analysis. Expert Syst Appl 2017; 77:114–35.
[18] Khakzad N, Khan F, Amyotte P. Safety analysis in process facilities: Com-
parison of fault tree and Bayesian network approaches. Reliab Eng. Syst Saf
2011; 96:925–32.
[19] Simon C, Weber P LE. Bayesian networks and evidence theory to model
complex systems reliability. J Comput 2007; 2:33–43.
[20] Bobbio A, Portinale L, Minichino M CE. Improving the analysis of
dependable systems by mapping FTS into Bayesian networks. J Reliab Eng.
Syst Saf 2001; 71:249–60.
[21] Torres-Toledano JG SL. Bayesian networks for reliability analysis of com-
plex systems. Lect. Notes Comput. Sci., 1998, p. 195–206.
[22] Bourouni K. Availability assessment of a reverse osmosis plant: Comparison
between Reliability Block Diagram and Fault Tree Analysis Methods. Desal-
ination 2013; 313:66–76.
[23] En BS. Reliability of systems, equipment and components-1994.
[24] Kim MC. Annals of Nuclear Energy Reliability block diagram with general
gates and its application to system reliability analysis. Ann Nucl Energy
2011; 38:2456–61.

87
[25] Labib A, Read M. Not Just Rearranging the Deckchairs on the Titanic: Learn-
ing from Failures Through Risk and Reliability Analysis *. Vol. 51. Elsevier
Inc.; n.d.
[26] BSI Standards Publication Analysis techniques for dependability-Event tree
analysis (ETA) 2011.
[27] Raiyan A, Das S, Islam MR. Event Tree Analysis of Marine Accidents in
Bangladesh. Procedia Eng. 2017; 194:276–83
[28] Rosqvist T, Molarius R, Virta H, Perrels A. Event tree analysis for flood pro-
tection-An exploratory study in Finland. Reliab Eng. Syst Saf 2013; 112:1–7.
[29] QAMAR MAHBOOB EZ. Handbook of RAMS in Railway Systems Theory
and Practice. 2018.
Authors’ Biography
Frederick Appoh
Frederick Appoh is an experienced Senior RAMS
Consultant and has worked for several rolling stock
manufacturing organisations including; Bombardier
Transportation, Alstom Transport and Hitachi Rail
Europe in different senior reliability management roles.
Before joining the railway industry, Mr Appoh was a
soldier in the British Army as an aircraft engineer. He
holds an MSc in Reliability engineering and asset
management from the University of Manchester and a
bachelor’s degree in mechanical engineering from the
Kwame Nkrumah University of Science and Technology
(Ghana), and Higher National Certificate in electrical
and electronic engineering from the University of
Teesside. He is a Chartered Engineer (CEng), a member
of the Institution of Engineering and Technology,
Certified Maintenance and Reliability Professional
(CMRP) and Certified Reliability Engineer with
American Society of Quality (ASQ). He is also a part-
time PhD candidate at the University of Manchester

88
ME2018_1115
Hybrid model for maintenance frequency
extension using Weibull and wear analysis
Frederick Appoh
RAMS Engineering and Asset Management Consultancy Limited. 113 Monument Court,
Stevenage, Hertfordshire, SG1 3AE, UK.
Email: [email protected]
Abstract Maintenance optimisation has become a common endeavour among
rolling stock organisations via the qualitative risk assessment techniques. Fur-
thermore, it is a common practice where the inability to apply the quantitative sta-
tistical approach to support risk management is replaced by experience and
knowledge of personnel who are oblivious to imminent risk. Thus, maintenance
extension for safety-critical systems such as collector shoegear, brake disc etc.
dictates for both qualitative and quantitative evaluations of potential risk. There-
fore, this paper proposes a unique quantitative hybrid model utilising Weibull
analysis to estimate the failure rate via historical data and wear analysis by cumu-
lative density function of degradation data to evaluate wear levels. Outputs from
both quantitative techniques provide the basis for a recommendation regarding
maintenance periodicity extensions. A case study using a collector shoe compo-
nent of a rolling stock vehicle is demonstrated using the hybrid model.
Key words Maintenance frequency, Weibull Analysis, wear analysis, Rolling
stock
1.0 Introduction
Risk assessments via identification and proposed mitigation actions of potential
hazards are undertaken to inform and address any unexpected risk. However, in
the rolling stock industry, most risk assessments for maintenance extension is
carried out qualitatively often without any quantitative analysis. Mostly RCM and
total productive maintenance (TPM) can play an essential role in maintenance
optimisation projects. However, they are more qualitatively driven nature. Also,
data analysis and statistical modelling techniques that are valuable tools that
engineers can implement to optimise the maintenance frequency of assets are not
readily available [1,2]. Also, the qualitative approaches of RCM miss the what-if-
analysis options which are so needed robust risk assessment [1].They can be
implemented via a previous case study, strategic decision support system and

89
operational decision support system [1]. Based on the selected option, it is
imperative the underlying quantitative analysis based on the historical and
performance data of the assets is considered where the impact on reliability and
cost can be obtained effectively [3]. Quantitative models are relatively complex,
and maintenance analysts have been slow to apply them since the data are scarce
[1,2]. It is vital that the right quantitative approach is selected for optimisation
data such as Bayesian parametric model for bathtub failure rates [4]. Quantitative
risk assessment requires a great deal of data both in the evaluation of probabilities
and assessment of consequences [5].
2.0 Weibull statistical methods
There are different forms of Weibull distribution; however, in this paper, only the
2-parameter is considered. Failure rate for Weibull demonstration is as shown be-
low;
1
( ) . 1, 0t
t
(4)
Where ( )t denotes the failure rate at time t, is the shape parameter and
the scale parameter [6]. Suppose the survival time T has Weibull distribution with
probability density function (pdf) and the corresponding hazard rate function is
given as follows[7];
1
( : , ) exp , 0T
t tt tf
(5)
Hazard function,
1
( ; , )t
H t
(6)
The failure probability at a given time t can be determined from the cumulative
distribution probability and the mean time between failure (MTBF) as shown in
Equations (4) and (5) below;

90
( ) 1 expt
F t
(4)
1. 1MTBF
(5)
where (x) is the gamma function. The values of the two parameters and
can be obtained from failure and maintenance records using maximum likelihood
estimations [6]. The reliability function is as shown in Equation (6);
( ) expR tt
(6)
where is the characteristic life [8]. The times between failures of a non-
repairable system are independent and identically distributed ( iid ), and this is the
most common assumption made when analysing time-to-failure data, but in some
situations, it might be unrealistic [9,10]. The Weibull parameters are determined in
the Least-squares Regression method by minimising the sum of squared residuals
of the x values as shown [11];
1 1 1
22
1 1
( ) ( ) ( )
( ) ( )
n n n
i i i ii i i
n n
i ii i
n In y In y
n In In
(7)
1 1( ) ( )
n n
i ii iy In
Inn
(8)
where is the shape parameter, is the scale parameter and is the location pa-
rameter but with 2-parameter Weibull = 0.
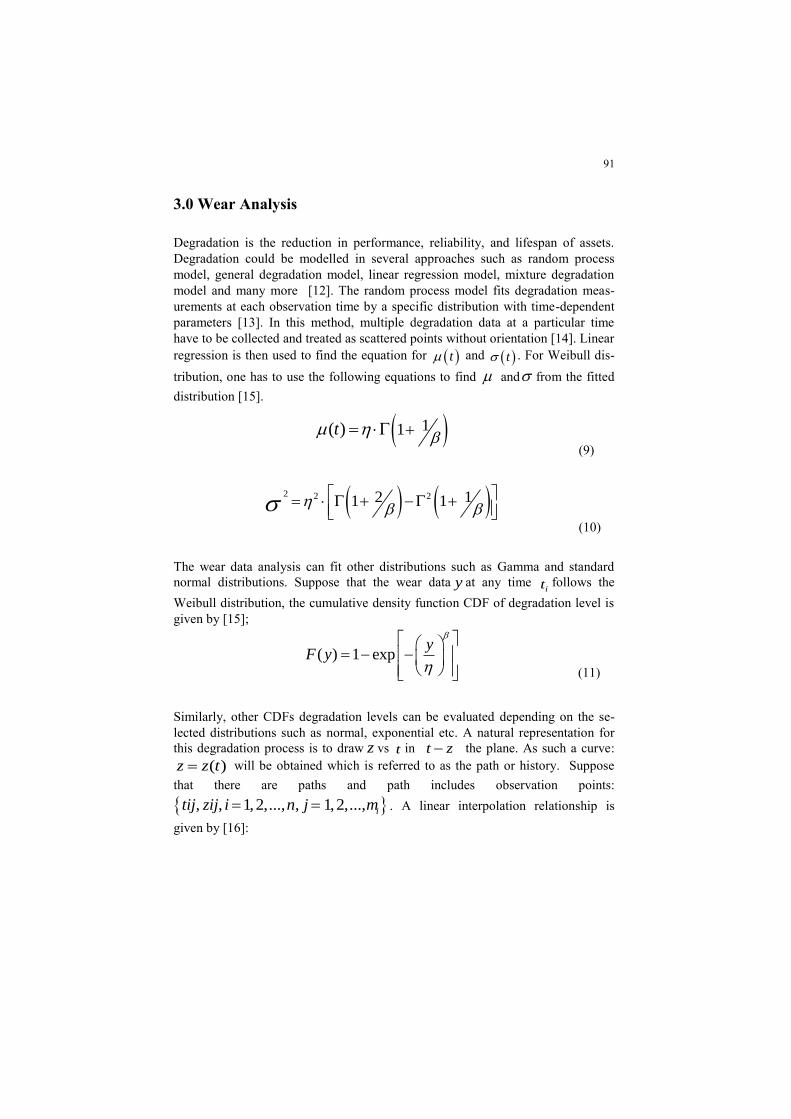
91
3.0 Wear Analysis
Degradation is the reduction in performance, reliability, and lifespan of assets.
Degradation could be modelled in several approaches such as random process
model, general degradation model, linear regression model, mixture degradation
model and many more [12]. The random process model fits degradation meas-
urements at each observation time by a specific distribution with time-dependent
parameters [13]. In this method, multiple degradation data at a particular time
have to be collected and treated as scattered points without orientation [14]. Linear
regression is then used to find the equation for t and t . For Weibull dis-
tribution, one has to use the following equations to find and from the fitted
distribution [15].
11( )t
(9)
2 2 22 11 1
(10)
The wear data analysis can fit other distributions such as Gamma and standard
normal distributions. Suppose that the wear data y at any time it follows the
Weibull distribution, the cumulative density function CDF of degradation level is
given by [15];
( ) 1 expy
F y
(11)
Similarly, other CDFs degradation levels can be evaluated depending on the se-
lected distributions such as normal, exponential etc. A natural representation for
this degradation process is to draw z vs t in t z the plane. As such a curve:
( )z z t will be obtained which is referred to as the path or history. Suppose
that there are paths and path includes observation points:
, , 1,2,..., , 1,2,..., itij zij i n j m . A linear interpolation relationship is
given by [16]:

92
( 1)
( 1)
( 1)
( ) ( ) ,iJi j
i ij ij ij i j
iji j
z zz t z t t t t t
t t
(12)
Without loss of generality, let T be the time when the degradation level reaches a
critical threshold D and assuming Weibull distribution is used for this illustra-
tion. T is assumed to follow the Weibull distribution as a linear model as shown
[15] :
( ) exp y
yR t t
(13)
,y y are functions of y D and must be determined based on the degrada-
tion data. For the n observations, all time points are arranged in ascending order
as: 1 2 ..... ...j nt t t t .The corresponding degradation data observed at
these ordered points are: 1, 2, ,......, ....,j ny y y y .
4.0 Hybrid model for maintenance frequency extension using
Weibull and Wear
The hybrid model considers two outcomes from the Weibull and wears data analy-
sis.
• Step 1: Condition using Weibull analysis
Assuming a 2-parameter Weibull analysis, the condition for meeting the proposed
frequency is dependent on the probabilistic results of the survival and hazard rate
as shown below in Equation 14:
( ) ( )proposed proposed proposedR t m H t
1
expt t
m
(14)
• Step 2: Condition for wear analysis
The wear analysis uses a combination or mixture from random process, linear and
general path degradation models. Considering the wear values at specified times
1 2, ,...., nt t t at the degradation values 1, 2,...., ny y y can be estimated based on
Equation 12 as;

93
2 1
12
1 2
wy y
t t
(15)
where 12w is the wear value between times 1t and 2t degradation values 1y and
2y . Subsequent wear values can be estimated based on the specified time and
degradation data as. 1 2 2 3 1, , . . . . . ,n nw w w
The CDF for an equivalent standard
normal distribution based on Equation 11 is as shown below;
2
221( , , )
2
w
f w e
(16)
where is the mean of the normal time-to-failures also noted by °T , and is
the standard deviation of time-to-failure for the normalised CDF wear value w .
The maximum allowable degradation value at the degradation level w for a de-
fined manufacturing tolerance level or theoretical threshold level 0D is given by:
° °0
( )p T w T z D (17)
Where z is the proposed maintenance frequency extension value in distance,
time or cycles. Overall the hybrid model for a system or task can be extended
based on the conditions that the requirement of Equations 14 and 17 as shown be-
low,
( ) ( )proposed proposed proposedR t m H t and 0wearm D , and °wearm T z
5.0 A case study using a collector shoegear of rolling stock
The case study illustrates quantitative analysis using the hybrid model to arrive at
recommendations for extending the maintenance frequency of a collector shoe
from 14,000 Km to 20,000 Km with no more than 5% of failures (i.e. “B-life “ of
5%) expected at the proposed frequency. Five-year historical data for the
shoegear was analysed using Isograph software as shown in Figure 1 and Figure 2
for the survival probability and Hazard rate respectively;

94
The average wear value w for the normalised CDF for the shoegear was estimated,
and it could last up to the fourth inspection with the critical threshold value 0D at
5 mm as Figure 3 and 4 respectively.
Figure 1 Cumulative frequency probability of shoegear
Figure 3 CDF for positive collector shoe showing mean wear rate
Figure 2 Hazard rate of the collector shoegear

95
6.0 Analysis of results
Weibull analysis of the collector shoegear with a “B” life of five per cent (5%)
was estimated as 44,490 Km with correlation coefficient and goodness of fit
parameters at 0.9302 and 0.09471 respectively demonstrating a proper distribution
fit for the failure data and far exceeded the proposed periodicity extension (i.e.
20,000Km). Similarly, the hazard rate is constant up to the 40,000 Km where it
begins to increase. Also, the average wear rate value was estimated as 0.00089
Km/mm. The total wear value over the proposed maintenance frequency of 20,000
Km was
determined as 1.78 mm (i.e. °wearm T z ). Thus, provided the shoegear is new,
the next replacement will occur on the fourth inspection (at 80,000 Km), and this
means the critical wear threshold 0D , ( 0 5D mm ) will be reached at the fourth
inspection. In summary, the quantitative analysis showed ( ) 44,490R t Km ,
( ) 40,000H t Km and 1.78wearm mm showed the collector shoegear met
the conditions set for the hybrid mode.
7.0 Conclusion
This study has systematically investigated the hybrid model using Weibull and
wear degradation analysis for maintenance frequency extension using a
Figure 4 Collector shoegear wear rate against inspection intervals

96
quantitative approach. The hybrid model allows the survival and the hazard rate
probabilities of the system to be estimated using the Weibull distribution together
with establishing the wear rate value at the proposed extended periodicity for the
same system using a combination of degradation models. The degradation analysis
uses a mixture of models including; random process, general path and linear
models to arrive at the final hypothesis for hybrid wear model. The normal
distribution technique was adopted to establish the CDF for the hybrid model.
Further, the hybrid model was applied to a case study for maintenance frequency
extension of a collector shoegear where the technique was used to extend the
maintenance frequency from 14,000Km to 20,000Km. In summary, the hybrid
model is a versatile model combining Weibull and wear degradation analysis for
robust extension of maintenance frequency using quantitative techniques.
References
[1] Dekker R, Scarf PA. On the impact of optimisation models in maintenance de-
cision making: state of the art. Reliab Eng Syst Saf 1998; 60:111–9.
[2] Louit DM, Pascual R, Jardine AKS. A practical procedure for the selection
of time-to-failure models based on the assessment of trends in maintenance
data. Reliab Eng Syst Saf 2009; 94:1618–28.
[3] Nguyen DT, Dijoux Y, Fouladirad M. Analytical properties of an imperfect
repair model and application in preventive maintenance scheduling. Eur J
Oper Res 2017; 256:439–53.
[4] Belyi D, Popova E, Morton DP, Damien P. Bayesian failure-rate model-ling
and preventive maintenance optimisation. Eur J Oper Res 2017; 262:1085–
93.
[5] Khan FI, Haddara MM. Risk-based maintenance (RBM): A quantitative ap-
proach for maintenance/inspection scheduling and planning. J Loss Prev
Process Ind 2003; 16:561–73.
[6] Wang Y, Cheng G, Hu H, Wu W. Development of a risk-based maintenance
strategy using FMEA for a continuous catalytic reforming plant. J Loss Prev
Process Ind 2012; 25:958–65.
[7] Yan Z, Zhu T, Peng X, Li X. Reliability analysis for multi-level stress testing
with Weibull regression model under the general progressively Type-II cen-
sored data. J Comput Appl Math 2018; 330:28–40.
[8] Ghosh D, Roy S. Maintenance optimisation using probabilistic cost-benefit
analysis. J Loss Prev Process Ind 2009; 22:403–7.
[9] Parra C, Crespo A, Kristjanpoller F, Viveros P. Stochastic model of
reliability for use in the evaluation of the economic impact of a failure using
life-cycle cost analysis. Case studies on the rail freight and oil industries.
Proc Inst Mech Eng Part O J Risk Reliab 2012; 226:392–405.
[10] Saldanha PLC DSE and Fe MP. An application of non-homogeneous Poisson
point processes to the reliability analysis of service water pumps. Nucl Eng
Des 2001:125–33.

97
[11] Datsiou KC, Overend M. Weibull parameter estimation and goodness-of-fit
for glass strength data. Struct Saf 2018; 73:29–41.
[12] Nima Gorjan, Lin Ma, Murthy Mittinty, Prasad Yarlagadda YS. A REVIEW
ON DEGRADATION MODELS IN RELIABILITY ANALYSIS. Proc.
Fourth World Congr. Eng. Asset Manag., 2009, p. 369–84.
[13] J YK& X. Continuous state reliability analysis. Annu. Reliab. Maintainab.
Symp.,1996, p. 251–7.
[14] H L. Degradation models and design of accelerated degradation testing plans,
Rutgers The.State University of New Jersey-New Brunswick: 2004.
[15] Zuo MJ, Ieee M. Approaches for of Continuous Modeling devices
1999;48:9–18.
[16] Jiang R, Jardine AKS. Health state evaluation of an item: A general
framework and graphical representation 2008; 93:89–99.
Authors’ Biography
Frederick Appoh
Frederick Appoh is an experienced Senior RAMS
Consultant and has worked for several rolling stock
manufacturing organisations including; Bombardier
Transportation, Alstom Transport and Hitachi Rail
Europe in different senior reliability management roles.
Before joining the railway industry, Mr. Appoh was a
soldier in the British Army as an aircraft engineer. He
holds an MSc in Reliability engineering and asset
management from the University of Manchester and a
bachelor’s degree in mechanical engineering from the
Kwame Nkrumah University of Science and
Technology (Ghana), and Higher National Certificate
in electrical and electronic engineering from the
University of Teesside. He is a Chartered Engineer
(CEng), a member of the Institution of Engineering and
Technology, Certified Maintenance and Reliability
Professional (CMRP) and Certified Reliability
Engineer with American Society of Quality (ASQ). He
is also a part-time PhD candidate at the University of
Manchester.
98
ME2018_1120
The Importance of Reliability and Maintenance
for the Circular Economy
Luís Ferreira1, José Sobral
2
1Faculdade de Engenharia da Universidade do Porto, Rua Dr. Roberto Frias, s/n, 4200-465 Porto,
Portugal.
2Instituto Superior de Engenharia de Lisboa, Rua Conselheiro Emídio Navarro, 1, 1959-007
Lisboa, Portugal.
Email: [email protected]; [email protected]
Abstract The Circular Economy is today considered a factor of extreme im-
portance for the organisations that inevitably are inserted in a context of competi-
tiveness and innovation. It is a strategic concept based on the reduction, reuse, re-
covery and recycling of materials and energy, replacing the concept of end-of-life
normally used in a linear economy. The Circular Economy aims at promoting an
economic model where the production and consumption systems articulated in an
organized way. It is a dynamic process, where the economic and social aspects are
combined with the technical requirements and the engineering activities to reach
the proposed objectives. This concept goes beyond the simple actions of waste
management and recycling, being broader and more comprehensive, and based
largely on an optimisation and use of all available resources, taking maximum ef-
ficiency of their technical cycles. Maintenance thus assumes a preponderant role
in achieving most of the objectives of a Circular Economy, being fundamental in
the physical assets exploration phase, but also taking an active part in other stages,
such as during the decommissioning or dismantling phase where the circle is not
closed, turning waste into resources. Keywords used in the explanation and defini-
tion of Circular Economy, such as "repair", "reuse", "maintain" or "extend", show
how the Maintenance function plays an active role in this strategic concept. This
paper aims to present the concept of Circular Economy and its current relevance,
and within this context to show how the Reliability of systems and equipment, as
well as their Maintenance throughout their life cycle, play a decisive role for their
success. The demonstration goes on to show how the inherent reliability of sys-
tems and equipment, according to the objectives defined in the design phase, al-
lows its use according to its specifications and with controlled risks for the user,
and how the correct maintenance of systems and equipment allows less consump-
tion of materials and energy, thus allowing it to normally extend its useful life at
controlled costs (lower OPEX). The application of maintenance techniques such
as CBM (Condition Based Maintenance), as a support for TPM (Total Productive
Maintenance) and RCM (Reliability Centred Maintenance) policies, always per-

99
formed in a Lean perspective, have allowed improving equipment performance
and its circularity, through greater availability, avoiding failures with serious con-
sequences. Its application allows the use of other resources, such as Predictive
Analytics, thus also fitting in recent developments in the industrial sector, as it is
the concept of "Industry 4.0". All these concepts have led to new forms of busi-
ness, with consequences for Maintenance, on which a brief reference will be made
in this paper.
Key words Circular Economy, Maintenance, Reliability.
1.0 Introduction
Sustainable development is a type of society development in which we live where
we try to meet the needs of the present without compromising the ability of future
generations to meet their own needs. Contains two key concepts [1, 2]:
- The concept of "needs", in particular the essential needs of the world's most
deprived, to which priority must be given priority; and
- The idea of limitations imposed by the state of technology and social
organization on the ability of the environment to meet current and future needs.
In essence, sustainable development is a process of change in which resource
exploitation, investment direction, technological development orientation and
institutional change should all be in harmony and enhance the current and future
development potential to meet the needs and human aspirations. Within this
concept of sustainable development, organisations must take into account not only
the economic objectives, but also have environmental and social objectives in
carrying out their activities, whether commercial or otherwise. It is within the
scope of this concept of sustainable development that the concept of circular
economy originates.
2.0 The concept of the Circular Economy and its current
importance
According to the Ellen MacArthur Foundation [1], “A circular economy is an
industrial system that is restorative or regenerative by intention and design. It
replaces the ‘end-of-life’ concept with restoration, shifts towards the use of
renewable energy, eliminates the use of toxic chemicals, which impair reuse, and
aims for the elimination of waste through the superior design of materials,

100
products, systems, and, within this, business models.”. Also, “As predicted by its
creators, a circular economy is a continuous cycle of positive development that
preserves and enhances natural capital, optimizes the yields of the resources used,
and minimizes system risks through the management of finite stocks and
renewable flows. It works effectively on all scales. "
As can be seen in Figure 1, this contrasts with a so-called linear economy which is
a resource utilisation model of "raw materials, production, distribution,
consumption and disposal". Circular Economy can be defined as a regenerative
system in which the inflow of resources and the loss of waste, emissions and
energy are minimized by the slowing, closing and reduction of circles of use of
raw materials and energy. This can be achieved through design, maintenance,
repair, reuse, remanufacturing, renovation and long-term recycling.
This economy concept is based on some simple principles [1]. First, at its core, a
circular economy aims to "project" useful products without waste. Waste "does not
exist", the products are designed and optimized for a cycle of disassembly and
reuse. These improved component and product cycles define the circular economy
and differentiate from disposal and even recycling, where large amounts of built-
in energy and labor are lost. Secondly, circularity introduces a rigorous
differentiation between consumable and durable components of a product.
Contrary to what is happening today, consumables in the circular economy are
largely made up of biological ingredients or "nutrients" that are at least non-toxic
and possibly even beneficial and can be safely returned to the biosphere either
directly or in cascades of consecutive uses. Goods, such as engines or computers,
on the other hand, are made of technical "nutrients" unsuitable for the biosphere,
such as metals and most plastics. In a Circular Economy these are designed from
the beginning for reuse. Third, the energy needed to power this cycle must be
renewed by nature, again to lessen dependence on resources and increase the
resilience of the system (for example, to withstand oil shocks).
For technical nutrients, circular economy largely replaces the concept of consumer
with that of user.

101
CIRCULAR ECONOMY
Figure 1: Generic concepts of Linear Economics and Circular Economics
3.0 The relevance of Maintenance in the Circular Economy
The principles of circular economy allow not only a description of how the
economy should function as a whole, but also outlines specific sources of
economic potential value creation [3].
The economy and the comparative proposal of different circular configurations
(eg, reuse versus remanufacturing versus recycling) may differ significantly for
different products, components or types of material in any particular segment of
the supply chain. However, there are some simple principles of circular value
creation that are easy to understand.
Thus we have the power of the inner circle: in general, the tighter the circles, the
greater the cost savings in terms of material, labor, energy, capital and other costs
associated with externalities such as emissions, water, etc. Tighter circles will also
benefit from a comparatively higher substitution effect of new raw materials (less
use of new materials, considering process inefficiencies along the linear chain).

102
This possibility that is emphasized when comparing linear and circular
configuration is the core of its relative value creation potential. Whenever the cost
of collecting, reprocessing and returning the product, component or material for
the economy is lower than the linear alternative (including the prevention of end-
of-life treatment costs), the creation of circular systems becomes economically
meaningful. With rising resource prices and higher end-of-life treatment costs, this
option becomes more attractive, especially at in the early stages of design, when
economies of scale and the benefit from higher productivity gains can be achieved
(because of the low starting base).
Figure 2: Circular economy - an industrial system that is restorative by design
[adapted from [1]
We also have what is designated by the power of circulation for a longer time: a
second potential of value creation stems from the maintenance of products,
components and materials in use for longer periods in the circular economy. This
can be done through more consecutive cycles (for example, not just a remodeling
of one subset of the equipment, but several) or by spending more time within a
cycle (for example, extending the usage time of an equipment through a more
robust design). This extension of use will replace virgin material intakes to combat
the inevitable loss of materials. Here, too, rising resource prices make this lever of
value creation more attractive.

103
However, a possible increase in operating and maintenance costs or efficiency
gains due to rapid product innovation can lead to this longer circulating power
losing its competitive advantage.
This power of circulation, with the optimum use of resources, fits into a
perspective of "Lean Thinking", whose main objective is to eliminate the wastes in
the productive processes. The most common causes of waste in process industries
can be described as [4]:
- Condition of the equipment: Equipment that is not in its proper functional
condition has low availability, produces products of insufficient quality and in less
than necessary quantities. Also, they operate inefficiently (usually with high
energy costs and poor use of raw materials). To avoid this happening, there is a
need to apply maintenance systems that have a Kaizen effect (continuous
improvement) in the long term, such as the RCM and the TPM.
- Non-optimized operation: Typically, a manufacturing process involves a
combination of several physical parameters: temperature, pressure, density, flow
rate, vapor level, chemical concentration, ..., which are programmed into the
equipment to process the material. If these parameters are not optimized (often
due to equipment failures), the process will lose efficiency and quality.
- Project and technology: Often the equipment is obsolete or not technologically
adapted to the products requested by the customers. Sometimes they are degraded
and it becomes necessary to do a revamping of the installation.
- Availability of equipment: Availability may be affected by loss of equipment
reliability, a complex set-up to change the product type, or long maintenance
interventions. Equipment starting may be difficult and long after maintenance
interventions. TPM or RCM actions and SMED (Single Minute Exchange of Die)
techniques can lead to significant improvements.
The Kaizen philosophy is of Japanese origin and means continuous improvement.
Continuous improvement involves the participation of all employees and has as
main objective to improve the processes and performances of the organisation,
implementing improvements that involve low investments. To obtain a Kaizen
effect in maintenance with an impact on the circular economy the application of
the principles of TPM - Total Productive Maintenance appears as immediate. It is
a process of continuous improvement, which aims to maximize equipment
performance, establish a rational system of Preventive Maintenance throughout
the life of the equipment, is implemented by various sectors of the company
(engineering, production and maintenance) and involves all personnel from the
company. It is based on the promotion of Preventive Maintenance for the
motivation and management of small autonomous groups. Its indicator is OEE -
Overall Equipment Effectiveness, which is the product of availability, quality
achieved and speed of production.

104
Figure 3: Potential economic gains of the circular economy
In turn, the RCM also appears as a privileged partner for the implementation of
the Lean Thinking philosophy, as described by the Toyota Way [4], Figure 4, and
within a perspective of circular economy.
Figure 4: TOYOTA Way - Lean Thinking [4].

105
The Reliability-centred Maintenance (RCM) methodology is a structured approach
that has been applied in a wide variety of industries, with emphasis on its
application in the process industries. The RCM is a methodology used to
determine the maintenance requirements of a system or equipment in its
operational context to ensure that it will continue to achieve the specified
operational performance objectives [5]. Its objective will be to allocate the means
of maintenance where they are really needed, with a minimum use of human and
material resources, which is in line with the objectives of the circular economy.
Both TPM and RCM, applied separately or in a complementary manner as
maintenance methodologies, result in better resource utilisation and equipment
longevity, allowing a greater number of "inner circles" as described in Figure 2.
4.0 The Circular Economy in a context of Big Data and Internet
of Things
The combination of circular economics principles with the exponential increase
we have witnessed of the so-called "smart" and interconnected devices can
drastically increase resource efficiency and lead to significant social and economic
benefits [6]. As we have already seen, there is a very important evolution in the
design of systems and equipment, which with the possibility of using all the
available knowledge and the sensitisation / monitoring of the equipment allowed
the development of systems in the concept of Digital Twin Factory [7].
Within this concept, the design of the equipment or product / machine is
conceived as a mechatronic system that can be digitally tested, developed and
validated. This allows the concepts to be tested and developed before actual
manufacturing starts. The "real machine" data is preloaded into the model during
the design phase. This gives rise to a digital twin that allows the simulation of
production operations and product flow throughout the "machine" life cycle.
Thus, digitization allows to increase efficiency in all phases of the "machine" life
cycle. It is possible to pre-validate projects and test the configuration of the
control system of equipment and digital systems scanned from real equipment
installed in real environments. Configuration analyzes, manufacturing process
and checks take place before the actual engineering process is started, which
reduces the risk of failures and errors in critical life cycle phases, such as during
installation and commissioning, which previously only could be eliminated with
great effort and under time pressure. If machine information is available on an
integrated data platform, later modifications can be tested and verified in exactly
the same way, thus accelerating the introduction of technological changes or a new
product. In addition, with the help of models, the machine's operational data can
also be used to optimize the feature parameters for its redesign and production -
from power consumption to operating error rates and maintenance cycles.

106
The use of these twin digital systems also allows for interactive testing of
maintenance cycles, optimizing the CBM - Condition Based Maintenance
processes and giving rise to what is now called intelligent maintenance or CBM +,
which can be defined as [8]: the application and integration of appropriate
processes, technologies, and knowledge-based resources to improve the reliability
and maintenance effectiveness of systems and components. At its core, CBM + is
the maintenance performed from the evidence of need provided by the RCM
analysis and other knowledge processes of the equipment. CBM + uses a systems
engineering approach to collect data, enable analysis, and support decision-
making processes for procurement, maintenance, and system operations. Thus,
monitoring sensor devices can transmit performance data to the manufacturer,
enabling the development of predictive maintenance programs and, at the same
time, twin digital software upgrades.
As can be seen, these concepts take advantage of all the knowledge developed
with the application of methodologies such as the RCM and TPM, in which
regularly scheduled maintenance intervals, whenever possible supported by the
knowledge of the condition state of the equipment or component, have ensured
less downtime and a more disciplined approach to the use of human resources and
maintenance materials.
However, inefficiencies continue to exist, since in the process of controlling the
traditional condition we have the application of the so-called "instantaneous"
maintenance concept, in which whenever an evaluation parameter of the condition
state is exceeded an intervention process is triggered. Today, the wide availability
of sensors and monitoring platforms, integrated in IIoT systems – Industrial
Internet of Things and Big Data Analytics, allows to evolve technologically into
maintenance for condition based maintenance plus (CBM +) or proactive
maintenance. Under the concept of CBM +, the maintenance data obtained in real
time are permanently analyzed and standardized to give rise to indicators of
degradation of the condition, allowing better knowledge of the development of an
incipient fault that later would lead to the loss of function of an equipment. As
CBM + improves the knowledge of the P - F interval (P - Initial point of detection
of functional failure, F - Point in which functional failure occurs), this results in a
more efficient use of human and material resources and decreases the time of asset
inactivity, which allows better maintenance with a more rational use of the
"products" and leads to a greater longevity of the “products” taking in
consideration the length of service actually provided, allowing to improve its
management and its circularity.

107
5.0 The evolution of business characteristics in a Circular
Economy
The concepts of circular economy with the application of the concept of user
instead of consumer, has led to the development of new concepts of business
organisation and new types of business, namely new business models. In these
new business models, we can highlight [9, 10]:
- Establishment of so-called "inverse" logistics networks:
The potential total value of the circular economy goes far beyond the simple
recycling of used materials. This value results from the reuse, maintenance,
renewal and reprocessing of components and products, from materials considered
by users as being at the end of life. That is why it is equally important to
strengthen the so-called "inverse" logistics networks, just as global product
production and distribution networks have been developed.
- Extended product life:
The extended product lifecycle, achieved through a more robust design or through
actions during its use life cycle, allows organisations to extend the product and
asset lifecycle. Values that would otherwise be lost through wasted materials are
instead maintained or even improved through maintenance, repair, upgrade,
reprocessing, or remarketing actions. With this practice, a company can help
ensure that products are economically useful for the longest possible time and that
product updates are more targeted (for example, an out-of-date component is
replaced rather than the entire product).
Looking from a commercial point of view, selling less may seem disadvantageous.
But when looking at the business set of longer term, it turns out that the final
balance is positive. Thus, one can improve customer loyalty and maintain a
relationship with the customer called "circular" through the maintenance work,
which is much more about a partnership relationship than a linear and unique
transaction. It also allows the customer to lower costs, which easily transforms
existing customers into marketing products and services and ambassadors on
behalf of the company. This illustrates how the circular design of systems /
equipment usually involves changes to the business model as well as technical
product innovations.
- Sharing Platforms:
The business model of the sharing platforms promotes the existence of a
collaboration platform between the users of the products, be they individuals or
organisations. This facilitates sharing unused resource capabilities, avoiding
underutilisation, increasing productivity, and creating value for users. This model,

108
which helps maximize utilisation, can benefit companies whose assets have a low
utilisation rate by sharing ownership.
- Products as services:
The product business model as a service provides an alternative to the traditional
"buy and own" model. Products are used by one or more customers through a
lease or pay-per-use agreement. This business model encourages durability and
lifecycle upgrading of products by changing their design from "volume" to
"performance." With a business model of the product as a service, product
longevity, reuse and sharing are no longer viewed as risks of cannibalisation, but
rather drivers of revenue and reduced costs. This model is particularly attractive to
companies whose shared operating costs are high and have a qualification
advantage over their customers in product maintenance management (giving them
an advantage in the sale of services and recovery of residual value at the end of
life).
By prioritizing access to ownership, these models drive change from consumers to
users. On the other hand, by adopting a product-as-a-service model, companies are
encouraged to develop products of longer duration. And by getting used products
back, companies are motivated to ensure through material design and selection
that they can be reprocessed as raw materials for the manufacture of similar new
products or something completely different. Also, maintainability is usually
improved.
All of these models imply new customer relationships, long-term relationships that
will be vital to facilitate maintenance processes, product upgrades, and other
product-related services, and driving customers to return products at the end of
each cycle of use.
6.0 Conclusions
The circular economy in a more or less evident way has been developing, above
all with the evolution of the social conscience of the need to preserve raw
materials, which are known to be finite and not always easy to obtain. Its
advantages, through existing examples, are the evidence of more sustained
economic growth, substantial saving of raw material and energy costs, creation of
employment opportunities and increased innovation.
The total potential value of the circular economy goes far beyond the simple
recycling of materials used. This value is incorporated into the reuse, maintenance,
renewal and reprocessing of components and products. With the use of new
technological means and through a more efficient maintenance, it becomes
possible to better monetize the use of systems / components.
109
This is achieved through new business models, with which we are currently
confronted and in which maintenance appears as an essential factor.
References
[1] Ellen MacArthur Foundation, 2013. Towards the circular economy, Econom-
ic and business rationale for an accelerated transition. Retrieved from the in-
ternet.
[2] World Economic Forum, 2014. Towards the Circular Economy: Accelerating
the scale-up across global supply chains, Prepared in collaboration with the
Ellen MacArthur Foundation and McKinsey & Company. Retrieved from the
internet.
[3] European Union Publication, 2013. Eco-innovation and competitiveness, En-
abling the transition to resource-efficient circular economy. Annual Report
2013, Luxembourg, doi: 10.2779/58269
[4] Smith, R. and Hawkins, B., 2004. Lean Maintenance, Elsevier Butterworth–
Heinemann, London, ISBN: 0-7506-7779-1
[5] Moubray, J., 1997. Reliability-Centered Maintenance. Industrial Press. New
York, ISBN 9780-8311-3146-3
[6] orld Economic Forum, 2015. Intelligent Assets Unlocking the Circular Econ-
omy Potential. Retrieved from the internet.
[7] Siemens, 2017. Digitalisation in machine building, Twins with potential. The
Magazine, Retrieved from the internet.
[8] Department of Defense Instruction 4151.22, 2012. Condition Based Mainte-
nance Plus (CBM+) for Materiel Maintenance. DOD, Washington, DC.
[9] Planing, P., 2017. Business Model Innovation in a Circular Economy Rea-
sons for NonAcceptance of Circular Business Models. Open Journal of Busi-
ness Model Innovation. In Press.
[10] COTEC, 2016. Circular Economy – To preserve, optimize and ensure essen-
tial resources for our future (in portuguese). Retrieved from the internet
http://www.cotecportugal.pt/imagem/20161122_EC_Booklet_Exposição.pdf

110
Authors’ Biography
Luís Ferreira
Current Position: Associate Professor, Faculty of
Engineering, University of Porto (FEUP)
Main research interests: He is involved in research,
teaching and consulting in: Tribology and Maintenance
of Physical Assets (lubrication, surface failure analysis);
Safety, Reliability and Maintenance Models and
Applications (RCM, RBI, Physical Asset Management).
He has over 200 scientific publications, being 32 in
journal papers (ISI). He supervised 54 graduated
students, being 6 PhD’s.
Director of the MSc Industrial Maintenance at FEUP
(1997-2010); ; President of the Board of Directors of
ESReDA; author of two books on Tribology and
Maintenance (in portuguese); editor of “Manutenção”.
José Sobral
Current position: Assistant Professor at ISEL. PhD in
Mechanical Engineering by the Faculty of Engineering
of University of Porto.
Researcher at the Center for Engineering and Naval and
Oceanic Technology (CENTEC) of Instituto Superior
Técnico. The areas of interest in R & D focus on Asset
Management, namely in the areas of Maintenance,
Reliability, Maneuverability, Availability and Security
(Risk)

111
ME2018_1122
Maintenance Management and Design of
Experiments
Nuno R. Costa1,2
, Filipe D. Pereira1
1Departamento de Engenharia Mecânica, Instituto Politécnico de Setúbal-ESTSetubal, PT
2Unidade de Investigação em Engenharia Mecânica e Industrial, FCTUNL, PT
Email: [email protected]; [email protected].
Abstract The design and analysis of experiments is an effective tool that must
be integrated in the tools portfolio of maintenance management. To support this
sentence, a diversity of case studies published in the literature are presented as ex-
amples. To foster the Design of Experiments (DoE) usage, the most common mis-
takes and what researchers and practitioners should consider for a successful ap-
plication of this tool in process / equipment’s and product’s quality (reliability,
availability, performance, robustness, productivity, etc.) improvement are high-
lighted.
Key words: ANOVA, Errors, Quality, Randomization, Reliability, Replication.
1.0 Introduction
Maintenance management policies and practices impacts on organizations
performance significantly. Low quality of products or services, high
manufacturing costs, low process / equipment capability and productivity, short
times between failures or low availability, and accidents or health problems are
common reasons by which maintenance management has to be efficient and not
just effective. This requires a permanent valorization (education and training) of
human resources, availability of suitable technologies, and use of appropriate
methodologies and tools to achieve the best performance. The design and analysis
of experiments (hereafter termed DoE) is one of the most widely used tools to
design and improve processes/equipment’s and product’s quality (reliability,
availability, performance, robustness, productivity, etc.). There are many case
studies showing the vast field of application and benefits resulting from the
application of DoE in various types of industry, including aeronautics, chemistry,
pharmaceuticals, automotive and biomedical industries. However, national and
international studies show that DoE is far from being pervasive in industry (and
academy) [1-3]. In fact, the trial-and-error approach is often used in industry and

112
academy. This unstructured (empirical) practice is more expensive in terms of
time and cost, besides the desired or expected results are achieved only under very
special conditions [4]. DoE is a much more effective tool and cannot be ignored
by maintenance managers. To encourage and help them design experiments and
achieve the desired process / equipment’s and product’s quality, bad practices and
common mistakes on DoE usage are revisited, and guidelines for avoiding them
are highlighted.
2.0 DoE in Maintenance Management
The Statistical design and analysis of experiments is a technique widely tested and
validated in various settings. It can be adjusted to several characteristics of the
phenomena and variables under study, as well as to the type of information that is
intended to be collected from an experimental study. Thus, DoE can be integrated
in the set of tools that can be used within the scope of maintenance management.
According to [5], DoE has been increasingly used for improving the reliability of
products and processes / equipment, and it is neither limited to single response
improvement nor process / equipment’s and product’s lifetime maximization [6-7].
The set of works referred to in this section is only a very small part of what could
be presented and would result from a further search in the main academic data-
bases (WoS and Scopus). This work is underway, but it is already possible to high-
light various distinctive works as examples, namely: a) robustness and perfor-
mance maximization of projectiles used in grenade launchers [8]; b) reliability
improvement of integrated circuits [9]; c) Capacitors lifetime maximization [10];
d) rupture faults minimization of pipes subjected to external hydrostatic pressure
[11]; e) asphalt fatigue resistance maximization [12]; f) breakage faults minimiza-
tion of couplers for railway carriages [13]; g) reliability improvement of aircraft
landing gears door lock mechanism [14]; h) maximization of pulley’s lifetime in
automotive air-conditioning compressors [15]; i) reliability improvement of alu-
minum packaging equipment for the beverage industry [16]; j) redefinition of the
preventive maintenance strategy for locomotive wheels [17]; k) simultaneous op-
timization of the volume and lifetime of mechanical devices [18]; l) lifetime max-
imization of diamond-tipped drills [19]; m) simultaneous optimization of the mean
and the variance of fatigue life of a lorry cab [20].
Regardless of the scope or areas of activity in which DoE is employed, this tool is
particularly appropriate and highly recommendable in the initial phase of
experimental studies, the so-called screening phase, where many variables exist
and the objective is to identify those with significant effect on the response with a
minimum number of experiments and involving the lowest number of resources.
DoE is also useful for understanding the relationship between the variables and the
response, as well as for optimization purposes. However, several arguments are
used to justify the non-use of DoE. The most common are the following: i) human
and technological resources are scarce or nonexistent; ii) run experiments is not

113
feasible due to technical and / or economic reasons; iii) its application is useless or
unnecessary; iv) there are no resources with competence to design experiments
and analyze their results. These arguments and others listed in [21] show a lack of
strategic clairvoyance and a clear ignorance of what the DoE is, so they will be
explored in a future work.
3.0 Errors in DoE Usage
It is often said, with some irony, that the best time to draw experiences is after
they have been performed. In fact, this sentence means that any experimental
study must be both iterative and sequential: a hypothesis is formulated, experi-
ments are run, and from the collected information and/or the achieved conclusions
the hypothesis is reformulated, restarting the cycle. Bad practices in the planning
and execution phases of DoE are a rich source of learning and an effective way to
get confidence and successfully use this tool. Among the most common bad prac-
tices are the following:
- Wanting to solve (extremely) complicated problems. In fact, the minimization of
the particles deposition inside the heat exchangers of a black liquor recovery boil-
er is an example of what should not be a priority problem, because most likely this
will be a less successful or impossible task to perform in an industrial context for
technical and economic reasons associated with the operation of this equipment
and its implications in the production process. It is preferable to start with simple
problems so that the team involved gains and conveys the necessary confidence to
apply DoE in other problems. Nevertheless, complex or more difficult problems,
like that of the boiler problem, can be minimized or solved through the so-called
Computer Experiments (simulation), as shown by Costa et al. [22].
Solving problems misaligned with the objectives and priorities of an organization
or for which it is not possible to estimate the financial return it is also a non-
recommended practice. Moreover, to ensure the engagement and availability of re-
sources by management, the estimate financial return that can be obtained from
the DoE usage cannot be omitted.
- Poorly defined objective and response. To increase the time interval between
preventive maintenance actions on a given equipment by 15% is not necessarily
the best way to express the expected result with an experimental study. To achieve
this objective could be time consuming and difficult to validate. So this is an un-
appealing objective. Reducing the mass of accumulated particles on the heat trans-
fer panels of a black liquor combustion boiler would also not be a good response
because it would be very difficult to quantify, if not impracticable. The mass of
particles entrained by the flowing gases would be an easier response to measure
and would even be in line with the above-mentioned hypothetical objective, as the
minimization of the mass of particles will increase the time interval between
cleaning operations of the boiler heat exchangers may increase and the associated

114
costs will decrease. Note that popular business drivers are money, timeliness, qual-
ity (reliability, safety, …), and productivity so study objective and expected results
must be set in “this language”. The overlap between the objective and the response
(process or product quality characteristic / output variable that must be measured)
in an experimental study is not uncommon. Study objectives must be clear, suc-
cinct, achievable, realistic, relevant, and measurable. Response variable must cap-
ture, as much as possible, a quantity or quality of interest for the experimental unit
while providing guidelines for measurement accuracy and precision.
- Measurement devices are uncalibrated or inoperative. This issue is (very) usual
and invalidates all measurements obtained with the devices. Its correctness is deci-
sive before the experiments are performed.
- Omitting variables and / or assigning less favorable values to variable levels. No
problem will be solved if all the variables impacting the response are not consid-
ered and their values properly set. To gather a multidisciplinary team to address
the problem is fundamental, including the identification and assignment of values
to the variables levels, which must be duly substantiated. Testing a variable with
an excessively large values range may bias the variable effect and the effect of its
interaction with other variables on the response. This problem also occurs when
variables range is too small. No less usual is the impossibility of running some ex-
periments. Therefore, a critical analysis of the values assigned to the variables and
running test experiments are advisable.
- The number of designed experiments is low. When a too small fraction of the to-
tal number of variable levels combination is run, one cannot expect that analysis
method yield reliable solutions. This will happen because the effect of some varia-
bles and / or their interactions is masked or skewed by the effect of other variables
or interactions. To (statistically) design a set of additional experiments is always
possible to unmask effects and achieve reliable solutions.
- Randomization and Blocking are ignored. To run the designed experiments under
the standard order is violating a DoE’s principle. The randomization of experi-
ments helps to minimize the effect of unknown variables, which can be appropri-
ately estimated and taken into account in the analysis of the results if replicates of
each experimental run (treatment or combination of variable levels) are per-
formed. Replications should not be confused with repeated reads of the result of
an experiment at a given time. Replicating experiments (doing the same experi-
ment at different time under similar conditions) is another DoE’s principle. The
replicas allow us to obtain an estimate of the experimental error and an estimate of
the effect of the variables (and their interactions) on the location and the disper-
sion of the response, the latter being directly related to what is known as system
(product / equipment / process) robustness.
Restrictions on randomization due to inability to perform all experiments under
homogeneous conditions (without being subject to disturbances introduced by
known and controllable variables, like batches of raw material, people, machines,
factories, etc.) or because it is convenient due to technical and economic condi-
tions to keep the value of one or more variables fixed are very common occur-

115
rences in industrial contexts. For example, to randomly perform a set of experi-
ments designed in which the value of one of the variables (the temperature of a
furnace) does not change because it is time consuming and / or costly to change its
value (the temperature of that furnace) from experiment to experiment, it is trans-
lated into what will be called a Split-plot experiment. This is different from the
case where, for example, it is not possible to perform all designed experiments
with the same lot of raw material, whose effect on the response is not in the inter-
est of the researcher but is known to be a bias factor of the experimental results. In
this case it is said that the experiments must be performed in blocks, and the anal-
ysis method is different from that of split-plot experiments.
Violation of any of the DoE’s principles (Randomization, Blocking and Replica-
tion) will bias the experimental results and, most likely, the study conclusions.
Therefore, in contrast of what often happens in practice, none of these principles
must be ignored or overlooked.
-Analysis methods assumptions are not validated. Statistical techniques are used in
the belief that analysis methods assumptions are irrelevant, so their checking is
sometimes omitted or ignored [3]. However, all formal statistical analyses require
certain assumptions to hold in order to be valid. As examples, most analysis meth-
ods of unreplicated two-level factorial designs used in the screening phase of ex-
perimentation assume that data follow a normal distribution and do not include
outliers; results of the Analysis of Variance (ANOVA) method, which is used in
characterization and optimization phases of experimentation, are sound if the fol-
lowing assumptions are validated: i) each sample (observations of a treatment or
combination of factor levels) approximate a normally distributed population (or
dependent variable approximates a multivariate normal distribution); ii) all sam-
ples have a common variance (or error variances of all data points of the depend-
ent variable are equal or homogenous throughout the sample); iii) All samples are
drawn independently of each other; iv) Within each sample, the observations are
sampled randomly and independently of each other. Residual analysis is recom-
mended for this purpose (see [23], as example).
- Incorrect choice of response modelling methods. The relation between the varia-
bles and the response should not always be established with the Ordinary Least
Squares (OLS) method nor must the adequacy of the model fitted to response be
assessed only with the popular Pearson Coefficient (𝑅2). It is advisable to consider
the adjusted 𝑅2 and the predicted 𝑅2 as well, though other metrics and the analysis
of residuals must be used. Operating times up to the occurrence of a failure (life or
use) of a product, equipment or component is an example of a response that
should not be modeled with the OLS method. For this kind of responses, or any
others in which the statistical distribution that best fits the results of the experi-
ments is not Normal, but Weibull, Exponential, lognormal or Gamma, the identifi-
cation of variables with a significant effect on the response cannot be done with
ANOVA and the response modeling has to be performed with an alternative meth-
od to OLS method. For example, the Generalized Least Squares method must be
used when the residuals variance is not constant and / or the residuals are not in-

116
dependent. The Weigthed Least Squares method is another alternative when the
residuals variance is not constant. Either of these two methods can be used when
response values are censored. For this type of data, the ML (Maximum Likeli-
hood) method can also be an alternative, especially when the amount of data
(sample) is large [24]. When there are restrictions on randomization of experi-
ments, the Generalized Linear Mixed Model is the most appropriate response
modeling method [25].
- Properties of optimal solutions are ignored. For problems with multiple respons-
es there is not a unique (optimal) solution. So solutions reproducibility cannot be
ignored in the solution selection procedure in order to assure that product or pro-
cess will perform as expected when theoretical results are implemented in produc-
tive environments. As alternative to the current practice of identifying an optimal
solution based on the value of optimization criterion used, usually a desirability-
based criterion, metrics and graphical tools for qualitative and quantitative as-
sessment of optimal or Pareto solutions are available and recommended [26].
- Undesired or unplanned events are omitted. A detailed planning is crucial to ob-
tain reliable conclusions from experimental studies so no statistical and non-
statistical issues can be omitted in the experimental plan. Nevertheless, undesired
or unplanned events may occur during the experiment, such as changes in the en-
vironmental and/or technical conditions under which the experiments should be
performed, namely changes in the runs order, in the factor settings, and the re-
placement of machines or people. All the unplanned events have to be recorded
because they can help to find solutions for avoiding them in future experiments
and need to be taken into consideration in the data analysis. In any case, efforts
(training and checking practices) should be undertaken to avoid any kind of
changes in both the planned activities and procedures for running, collecting and
recording data.
4.0 Conclusion
The design and analysis of experiments is useful for designing and improving
products and processes / equipment. It allows the generation of data in a structured
way to understand the phenomena and achieve solutions to problems with a
minimum use of resources and in the shortest time period. Bad practices (common
errors or bad practices) at the planning and execution stages of DoE are also
revisited and recommendations to avoid them are provided. This way, criticisms or
depreciation of DoE usefulness as consequence of disappointing study results
become meaningless.
This work intends to foster the DoE usage in problems faced by maintenance
managers as well as researchers and practitioners in industry and academy.
Various case studies validate the applicability and usefulness of this tool in the

117
maintenance field, without assuming that DoE is a magic wand that applies and
solves all problems, namely those of product and process /equipment quality
(reliability, availability, performance, robustness, productivity, etc.) improvement.
It is also important to highlight that existing software considerably facilitates
calculation tasks, but it does not exempt the user from having theoretical
knowledge on DoE and subject matter to support their options and to be critical
about the results achieved. Today it is widely accepted that many of the studies
where DoE is employed fail due to lack of planning. It is therefore necessary to
ensure that DoE users will be sensitized to criticality of non-statistical activities to
be considered before, during, and after running the experiments, especially those
activities highlighted in the previous section of this article.
For future work the authors leave as suggestions a further review on the literature
and illustration of some (easy-to-use) analysis methods to solve problems that are
found in the scope of maintenance management. We also notice that although
many researchers are using computer experiments (simulation) to solve many
types of problem, DoE will keep a key role in this approach, both in identifying
the variables with significant effect on the response(s) and building metamodels
for (multi)response optimization purposes in a structured and faster way.
References
[1] Ilzarbe, L., Alvarez, M., Viles, E., Tanco, M. (2008). Practical applications of
design of experiments in the field of engineering: A bibliographical review.
Quality and Reliability Engineering International, 24: 417-428.
[2] Saraiva, P., d’ Orey, J., Sampaio, P., Reis, M., Cardoso, C., Pinheiro, J., Tomé,
L. (2010). O Futuro da Qualidade em Portugal. APQ.
[3] Sheil, J., Hale, D. (2012). The ‘Democratisation’ of Statistics: Parastatisticians
in Manufacturing. Quality and Reliability Engineering International, 28: 524-
534.
[4] Frey, D., Wang, H. (2006). Adaptive one-factor-at-a-time experimentation and
expected value of improvement. Technometrics, 48: 418-431.
[5] Freeman, L., Vining, G. (2010). Reliability data analysis for life test
experiments with subsampling. Journal of Quality Technology, 42: 233-241.
[6] Shanshan, L., He, Z., Vining, G. (2017). Simultaneous Optimization of Quality
and Reliability Characteristics through Designed Experiment. Quality
Engineering, in press.
[7] Lv, S., Niu, Z., Cui, Q., He, Z., Wang, G. (2017). Reliability improvement
through designed experiments with random effects. Computers & Industrial
Engineering, 112: 231–237
[8] Ray, D., Roberts, T. DOE for Product and Process Optimization, Robustness,
and Tolerance Design: 40mm IR Illumination Grenade. 2017 Annual
Reliability and Maintainability Symposium, IEEE.

118
[9] Cheng, L., Xu, X., Yang, S., Chien, W-T. Employing Optimal Experimental
Design to Optimize the Accelerated Life Test Plan for TDDB. 2015 Annual
Reliability and Maintainability Symposium, IEEE.
[10] Sünetci, Ö. Determination of the Effects for Capacitor Lifetime with Six
Sigma DoE. 2014 Annual Reliability and Maintainability Symposium, IEEE.
[11] Cai, B., Liu, Y., Liu, Z., Tian, X., Ji, R., Zhang, Y. (2012). Probabilistic
analysis of composite pressure vessel for subsea blowout preventers.
Engineering Failure Analysis Volume 19: 97-108.
[12] Soltani, M., Moghaddam, T., Karim, M., Baaj, H. (2015). Analysis of fatigue
properties of asphalt mixtures using response surface methodology.
Engineering Failure Analysis, 58: 238-248.
[13] Chunduru, S., Kim, M., Mirman, C. (2011). Failure analysis of railroad
couplers of AAR type E. Engineering Failure Analysis, 18: 374-385.
[14] Guo, W., Cui, W., Shi, Y., Liu, J., Song, B. (2016). Function failure and
failure boundary analysis for an aircraft lock mechanism. Engineering Failure
Analysis, 70: 428-442.
[15] Shim, H-J, Kim, J-K (2009). Cause of failure and optimization of a V-belt
pulley considering fatigue life uncertainty in automotive applications.
Engineering Failure Analysis, 16: 1955-1963.
[16] Besseris, G. (2010). A methodology for product reliability enhancement via
saturated–unreplicated fractional factorial designs. Reliability Engineering &
System Safety, 95: 742-749.
[17] Lin, J., Pulido, J., Asplund, M. (2015). Reliability analysis for preventive
maintenance based on classical and Bayesian semi-parametric degradation
approaches using locomotive wheel-sets as a case study. Reliability
Engineering & System Safety, 134: 143-156.
[18] Lv, S., He, Z., Vining, G. (2017). Simultaneous optimization of quality and
reliability characteristics through designed experiment. Quality Engineering,
29: 344-357.
[19] Fang, J., He, Z., Zhang, Z., He, S. (in press). Reliability improvement of
diamond drill bits using design of experiments. Quality Engineering.
[20] Fang, J., Gao, Y., Sun, G., Xu, C., Li, Q. (2015). Multiobjective robust design
optimization of fatigue life for a truck cab. Reliability Engineering & System
Safety, 135: 1-8.
[21] Tanco, M., Viles, E., Álvarez, M., Ilzarbe, L. (2010). Why is not design of
experiments widely used by engineers in Europe? Journal of Applied Statistics,
37: 1961-1977.
[22] Costa, N., Pires, R., Fontes, P. (2009). Computer experiments: application to
the case of a recovery boiler. International Journal of Productivity and Quality
Management, 4: 418-436.
[23] Vining, G. (2011). Technical Advice: Residual Plots to Check Assumptions.
Quality Engineering, 23, 105-110.
[24] Kantar, Y. (2015). Generalized Least Squares and Weighted Least Squares
Estimation Methods For Distributional Parameters. REVSTAT – Statistical
Journal, 13: 263-282.

119
[25] Kensler, J., Freeman, L., Vining, G. (2014). A Practitioner's Guide to
Analyzing Reliability Experiments with Random Blocks and Subsampling.
Quality Engineering, 26: 359-369.
[26] Costa, N., Lourenço, J. (2017). Reproducibility of nondominated solutions.
Chemometrics and Intelligent Laboratory Systems, 168: 1-9.
Authors’ Biography
Nuno Ricardo Costa
Dr Nuno Ricardo Costa is a professor at Instituto
Politécnico de Setúbal – ESTSetubal. He is a
researcher at UNIDEMI (http://unidemi.com) and
holds five international awards. His research works
have been presented in international events and
published in journals. Costa has also published book
chapters, acted as reviewer for several journals, and
has experience in implementing Quality Management
Systems (ISO 9001). His research interests include
Response Surface Methodology; Lean Six Sigma;
Statistical Quality Control; Quality and Operations
Management.
Filipe Didelet Pereira
Dr. Filipe Didelet Pereira is an Associate Professor
at Technology College, Setubal Polytechnics. He
works normally in the reliability prediction of thermal
and process equipment by means of mathematical and
functional models and in maintenance management
methodologies. He has two books published on
Maintenance Management and Reliability.

120
ME2018_1123
Pipeline inspection and maintenance via
acoustic methods and tools
Kassandra A. Papadopoulou1, Saeed Abdullah Alzahrani
2, Jyoti Sinha
2
1Alliance Manchester Business School& School of Mechanical, Aerospace and Civil
Engineering. The University of Manchester, Oxford Road, Manchester, M13 9PL, UK.
2 Aerospace and Civil Engineering. The University of Manchester, Oxford Road, Manchester,
M13 9PL, UK.
Email: [email protected]; [email protected];
Abstract There is a wide variety of pipeline inspection tools and each one has
its advantages and limitations. This paper presents a study used for the develop-
ment of a novel pipeline inspection tool for the oil and gas industry using acoustic
reflectometry. A review of inspection techniques is presented with a focus on
acoustic techniques as reliable and accurate inspection methods. A set of experi-
ments is carried out to investigate acoustic reflectometry as a pipeline inspection
tool. Inspection of a single leakage, a fault 1.5 mm in diameter, in a 30 m straight
pipeline is carried out in order to detect and locate it as accurately as possible with
the acoustic wave being injected from one side of the pipeline. Then a relation be-
tween the reflected leakage signal amplitude and the leakage size is established
and described so that the leakage size can be estimated if the signal amplitude for
the particular pipeline setting is known. In order to obtain a high amplitude re-
flected signal to maximise energy input, an injected signal frequency needs to be
properly chosen. This helps to read the fault signal easily and precisely. This ex-
periment was repeated each time on a single leakage (1.5 mm in diameter) for five
different distances from the signal injected. This was then repeated for the same
distances from the acoustic wave injected with additional sized leakages: 1.5 mm,
2 mm, 2.5 mm and 3 mm in diameter. Hence, the fault signal amplitude which re-
sulted from various injected signals is analysed and presented with respect to the
injected acoustic signal injected.
Key words acoustics, pipeline, maintenance, inspection tool, acoustic reflectome-
try, leakage detection.

121
1.0 Introduction
Over the years, pipelines have been subjected to various forms of failure due to in-
ternal or external factors. In other words, in some cases, pipelines might be affect-
ed by unusual working conditions which result in leakages, blockages or even
damage. Besides, corrosion affecting pipelines, could also be a result of environ-
mental influence. As a consequence, the pipeline deteriorates and then fails. Fur-
thermore, poor manufacturing processes may sometimes, result in defects which in
turn develop into failures. For example, non-uniformity in pipeline wall thickness
may lead to a breakage or crack.
In the case of oil and gas industry, deterioration and failure of pipelines is of criti-
cal importance mainly due to the fatalities, injuries and costs [1]. Data from [1]
indicates that material, weld or equipment failure has the highest percentage of re-
peated failure causes, which would include various types of leaks in the pipeline.
The EGIG conducts a failure frequencies analyses for gas pipelines and describes
the failures in relation to type and size of leak. The highest percentage of detection
of incidents is a combination of pinhole/crack and hole type leaks at approximate-
ly 85% [2]. The industry is open to methods including detection and inspections
techniques that can improve the reliability of the systems [3]. The need for accu-
rate and quick inspection tools becomes necessary, especially when pipelines ex-
tend for long distances.
Pipelines are susceptible to breakdowns, for this reason, different studies are car-
ried out to locate the pipe fault like Acoustic Ranger tool (AR) [4], Impact Echo
Technique [5], EMAT technique [6] and Acoustic Reflectometry Technique [7],
but even more focus is required to study the relation between fault signal proper-
ties and fault size and location.
Visual image inspection technique is the traditional tool [8] which depends mainly
on monitoring the pipeline and provides an image illustrating the location of the
defect. This technique is not applicable for some pipelines that are installed in wa-
ter depths, buried under soil and extended for hundreds of miles. In these cases, it
is difficult to visually decide where failures occur, and in order to monitor them it
is not feasible and economical to mount sensors along the whole length of the
pipeline. For these reasons, there is a need for advanced and effective inspection
tools like acoustic inspection techniques [7, 9-13].
Pipeline length, material and configuration play an important role when choosing
the inspection method. For this reason, a set of experiments have been carried out
to investigate the appropriate inspection tools for such pipelines [6, 14]. Analysis
of a reflected signal is used to identify the defect mode and location [5, 15]. The
detailed theory and methodology of the acoustic reflectometry used is described in
[7, 15-17]. There is a strong relationship between acoustic waves, pipe size and
working conditions. According to different experiments that have been carried out,
it was found that the transmitted wave’s properties, such as velocity, wave length
and signal strength, can be used to identify the type of material from which the
pipe was made [18].

122
The current study again investigates the acoustics as pipeline inspection tools to
find a better method so that the size of the leakage and blockage can be estimated
based on the associated frequency peak and its amplitude in the reflected leakage
acoustic signal. The short time Fourier transformation (STFT) is applied to the
track the different frequencies presence in the signal with respect to time.
2.0 Experimental set-up
Experiments were carried out based on acoustic signal generation and then obser-
vation is made on its propagation, reflection and behaviour along a pipe. This was
done using the apparatus arrangement shown in Figure 1 [16] and pipeline ar-
rangement as in Figure 2. The rig consists of a PVC pipe, with an internal diame-
ter of 42 mm and 4 mm wall thickness filled with stagnant air at 17.2 0C (for the
multi leaks at 16 0C). The pipe is an open-ended pipe at 30.14 m, which is verified
using the reflectometry technique as well. The experiments were carried out by in-
troducing a number of circular holes with different hole diameters and the re-
flected leakage acoustic signals generated for all cases were recorded for the fur-
ther analysis.
Figure 1 Experiment’s apparatus including function generator, oscilloscope, da-
ta acquisition card, laptop and microphone amplifier [16]
Figure 2 The pipeline arrangement for the simulated leakage at 27 m
3.0 Observations and results
The measured signals are analysed in time domain analysis initially and then in
frequency domain for both a single leakage and multiple leakages.

123
3.1 Time domain analysis
Time domain illustrates the relation between the signal amplitude and the time it
needs to reach the pipe defect and reflect back. The first task is to establish a sig-
nature signal. This is to inject the initial signal inside the healthy pipe in the ab-
sence of defects and then repeat the same process and send the same signal in
presence of defects. The interrupted signal will be reflected back from the fault
and appears in the leakage signal recorded. This is typically shown in Figure 3 for
the different injected frequencies ranging from 55 Hz to 20,000 Hz. Hereafter the
only 4 injected frequencies 880 Hz, 1000 Hz, 3000 Hz, 7000 Hz are discussed fur-
ther in the frequency domain analysis.
Figure 3 Leakage signal illustrated on time and voltage coordinates
3.2 Frequency domain analysis
Having determined the leakage location, the following step is to find the frequen-
cy associated with the leakage signal. The aim of this step evaluates if there is a
relation between the hole size and the leakage signal frequency so that the leakage
size can be estimated. Both spectrum and the short time Fourier transformations
(STFT) analyses were carried out.
Two types of experiments are carried out on the same pipeline, one with a single
leakage hole and other with a single leaking hole but at 5 different locations in the
pope and of 4 different hole sizes. The observations and results are discussed here.
3.2.1 Single leakage location
The signal is sent using a loudspeaker that is fixed on the pipe inlet and the leak-
age signal is picked by a microphone located at a distance of 9.97 m from the
loudspeaker (pipe inlet). Figure 4 shows the spectrum of the reflected leakage sig-
nal for an injected signal of 880 Hz and the leakage hole of 1.5 mm.

124
As observed, the frequency around the leakage location is at the region of 200 Hz
which is assumed to be the frequency of the leakage signal. The STFT analysis
was also carried to further understand that whether this 200 Hz is appearing at the
pulse location or not. The spectrogram contour plot of the STFT analysis is shown
in Figure 5 which clearly shows the frequency peak at around 200 Hz at the pulse
location in the leakage signal. Therefore, it can be assumed that the frequency of
200 Hz represents the defect size of 1.5 mm in the pipe.
Figure 4 Spectrum of the reflected leakage signal for the input injected signal at
880 Hz and leakage hole size 1.5 mm
Figure 5 Spectrogram contour plot of the reflected leakage signal for the input
injected signal at 880 Hz and leakage hole size 1.5 mm
In further strengthening this observation, the reflected leakage signals for the in-
jected signals at 1000 Hz, 3000 Hz, and 7000 Hz were also analysed. The spec-
trogram contour plots are shown in Figure 6 that again indicates the presence of
200 Hz irrespective of the injected signal frequencies. Hence the frequency at
around 200 Hz can be considered as the indicator of 1.5 mm leakage hole for the
pipe used in the experiment.

125
Figure 6 Spectrogram contour plots for of the reflected leakage signals for the
leakage hole size 1.5mm in the pipe but the input injected signals of frequencies
(a) 1000 Hz, (b) 3000 Hz and (c) 7000 Hz
3.2.2 A single leakage hole at different locations and of different sizes
The experimental setup shown in Figure 2 was then modified pipes having a sin-
gle hole at different locations and different sizes, as shown in Figure 7. In this
part of the experiments, the different hole sizes of 1.5 mm, 2 mm, 2.5 mm, 3 mm
and different locations noted as L1, L2, L3, L4, L5 (at 13 m, 16 m , 19 m, 22 m
and 25 m from the loud speaker location) were used.
(
a)
(
b)
(
c)

126
Figure 7 Experiment set up showing different hole locations and their sizes
Figure 8 provides the spectrogram contour plots for a single hole at the location
L3 (19 m) the hole sizes used were 1.5 mm, 2 mm, 2.5 mm and 3 mm and the in-
put injection signal of 110 Hz was used for all cases. As seen in Figure 8, the fre-
quency at around 180 Hz is appearing for all cases irrespective of the hole sizes.
The variation in the frequency is due to the change of the fluid properties where in
the single leak inspection, the temperature was 17.2 0C for the first set of experi-
ments (as in sections 3.1 and 3.2.1), and 16 0C for the second set of experiments.
Exactly similar observations were also made for a single hole of different sizes
but at the different locations in the pipe. This indicates the presence of frequency
around 180-200 Hz which is the leakage frequency. However the amplitudes of
the leakage frequency peak around 180-200 Hz were different for the different
sizes holes which highlights the possibility of estimating hole sizes.
4.0 Concluding remarks
The study clearly indicates the appearance of frequency peak at around 180-200
Hz (depending upon the fluid properties) if there is a leakage hole in the pipe. This
observation was consistent irrespective of the hole sizes, hole locations and the in-
put injected signal frequencies. The amplitude of the frequency peak may provide
the information for the determination of hole size which is underway.
It is likely that the poor resolution in the STFT analysis for such transient signals
was not able to show the shift in the frequency depending upon the size of the
holes so different signal processing techniques such as the wavelet analysis should
be looked into.
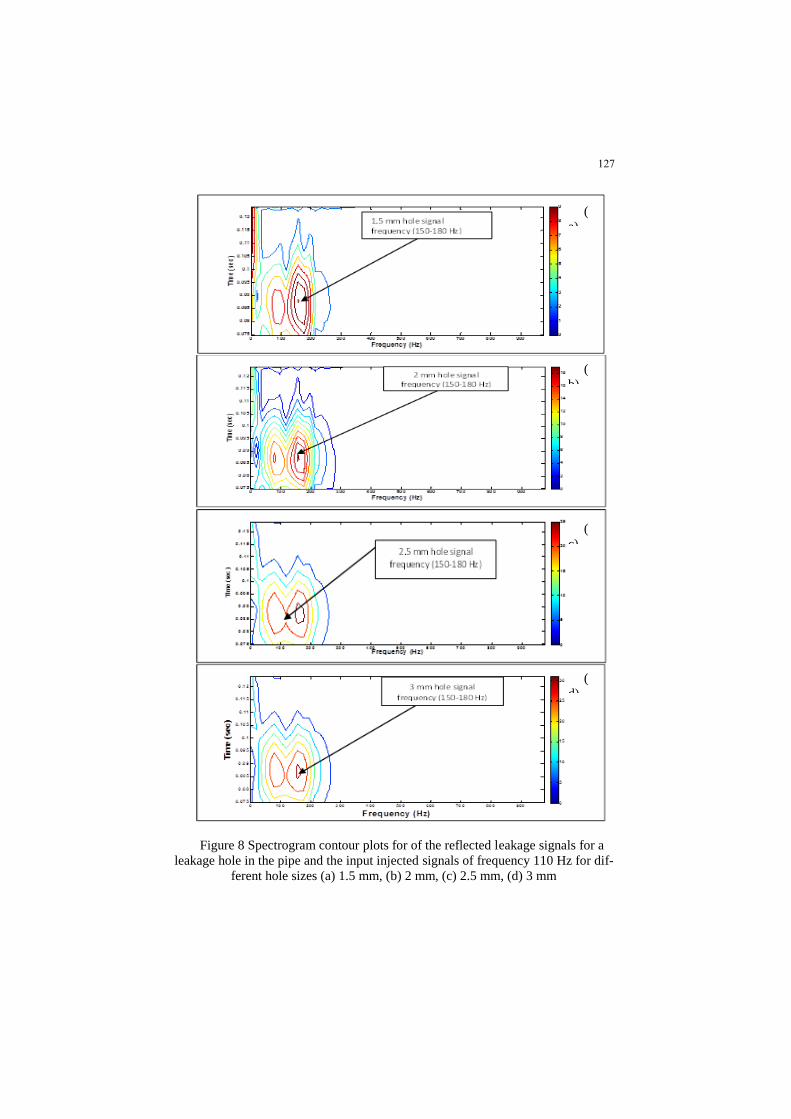
127
Figure 8 Spectrogram contour plots for of the reflected leakage signals for a
leakage hole in the pipe and the input injected signals of frequency 110 Hz for dif-
ferent hole sizes (a) 1.5 mm, (b) 2 mm, (c) 2.5 mm, (d) 3 mm
(
a)
(
b)
(
c)
(
d)

128
References
[1] Pipeline and Hazardous Material Safety Administration (PHMSA), (2017).
All Reported Pipeline Incidents by Cause, Washington DC: PHMSA.
[2] European Gas Pipeline Incident Group (2018) 10th Report of the European
Gas Pipeline Incident Data Group (period 1970 – 2016).
[3] Beele, F. V. D. & Denis, R., (2012) Numerical Modelling and Analysis for
Offshore Pipeline Design, Installation and Operation. Journal of Pipeline In-
tegrity, 12(4), pp. 273-286.
[4] Holroyd, T. (2000), “Acoustics emission and ultrasonic”. Oxford: Coxmoor
publishing company.
[5] Rajani, B. and Kleiner, Y., (2004), “Non-destructive inspection techniques to
determine structural distress indicators in water mains”, working paper
[NRCC-47068], National Research Council, Canada, June.
[6] Damaschke, J., Beuker, T., Alqahtani H., (2008), “In-line Inspection with
High Resolution (EMAT) Technology Crack Detection and Coating Dis-
bondmen”, paper presented at 20th
international Pipeline Pigging, Integrity
Assessment & Repair conference, Houston Marriott Westchase Hotel, Hou-
ston, TX, February 12-13.
[7] Papadopoulou, K. A., Shamout, M., Lennox, B., Mackay, D., Taylor, A.,
Turner, J. T., Wang, X., (2007), “An evaluation of acoustic reflectometry for
leakage and blockage detection”, Proceedings of the Institution of Mechani-
cal Engineers, part C: Journal of Mechanical Engineering Science, 222(6):
pp. 959–966.
[8] Teitsma, A., (2004), “Technology assessment for delivery reliability for nat-
ural gas - inspection technologies”, technical report, US Department of En-
ergy, National Energy Technology Laboratory, Morgantown, November.
[9] Morgan, E. and Crosse, P., (1978), “The Acoustic Ranger, a new instrument
for tube and pipe inspection”, working paper [0308-9126/78/1104-01], NDT
international, United Kingdom, August.
[10] Sharp, D. B. and Campbell, D. M. (1997). “Leak detection in pipes using
acoustic pulse reflectometry”, Acta Acustica united with Acustica, 83 (3),
pp.560-566(7).
[11] Russell, D., Dawson, K., Lingard, L., Lennox B. and Papadopoulou K.
(2016). "Acoustic Determination of Remote Sub-Sea Valve Status". [257/79]
POMME 2016 - Pipeline Operations and Management - Middle East confer-
ence 12-14 April, 2016, Kingdom of Bahrain.
[12] Groves, K.H., Lennox, B. (2017) Directional wave separation in tubular
acoustic systems – The development and evaluation of two industrially ap-
plicable techniques, Applied Acoustics, Volume 116, Pages 249-259, ISSN
0003-682X, https://doi.org/10.1016/j.apacoust.2016.09.003.
[13] Owowo, J., Olutunde Oyadiji, S. (2017) "Finite element analysis and exper-
imental measurement of acoustic wave propagation for leakage detection in
an air-filled pipe", International Journal of Structural Integrity, Vol. 8 Issue:
4, pp.452-467, https://doi.org/10.1108/IJSI-12-2015-0061.

129
[14] Jin, Y. and Eydgahi, A. (2008), “Monitoring of Distributed Pipeline Systems
by Wireless Sensor Networks”, working paper [978-1-60643-379-9], De-
partment of Engineering and Aviation Sciences, University of Maryland
Eastern Shore.
[15] Wang, X., Lewis, K., Papadopoulou, K., Lennox, B., and Turner, J. (2011),
“Detection of hydrate and other blockages in gas pipelines using acoustic re-
flectometry”, Proceeding of The Institution of Mechanical Engineers, Part C:
Journal of Mechanical Engineering Science, pp.1–11.
[16] Papadopoulou, K. A., (2008), “Leakage and blockage detection in pipelines
using an acoustic inspection tool”, A thesis submitted to The University of
Manchester for the degree of Doctor of Philosophy in the Faculty of Engi-
neering and Physical Sciences.
[17] Kinsler, L., Frey, A., Coppens, A., and Sanders, J., (1980), “Fundamentals of
Acoustics”. New York: John Wiley and Sons.
[18] Long, R., Cawley, P., and Lowe, M., (2003), “Acoustic wave propagation in
buried iron water pipes”, in mathematical, physical and engineering science
2003 Proceeding of the Royal Society, London, 2003, pp. 2749-2770.
Authors’ Biography
Kassandra A. Papadopoulou
Dr Kassandra A. Papadopoulou is a lecturer in Enterprise,
and Master of Enterprise programme director in the Alli-
ance Manchester Business School in The University of
Manchester. Previously she was a lecturer in Reliability &
Maintenance Engineering in the School of Mechanical,
Aerospace and Civil Engineering. Her experience includes
technology development in collaboration with universities
and industrial partners. She developed an acoustic inspec-
tion reflectometry tool, Acoustek®, an award winning tool
that was patented, commercialised and licensed to Pipeline
Engineering - CIRCOR Energy. Her areas of research and
teaching include: Innovation Management, Commerciali-
sation of Research, Reliability & Maintainability Engineer-
ing Design, Risk Management, Acoustic Monitoring and
Blockchain Applications in the Oil & Gas. She lectured on
the BP Engineering Management Executive Education
Programme and worked closely with BP on her research.
She collaborates with the British University in Dubai. She
is a reviewer for the Journal of Applied Acoustics and for
the Journal of Marine Engineering & Technology.

130
Alzahrani Saeed Abdullah
Alzahrani Saeed Abdullah is a mechanical engineer and
had his BSc in Mechanical Engineering from King Saud
University at Riyadh. He obtained his MSc in Maintenance
Engineering and Asset Management from The University
of Manchester, in the field of pipeline inspection via
acoustic methods and techniques. He has been working at
Saudi MODA for around 15 years supervising all the
maintenance tasks in his or organisation. He is interested in
doing researches that are related to maintenance trying to
apply the advanced maintenance strategies and techniques.
Jyoti K. Sinha, BSc(Mech), MTech(Aero), PhD, CEng, FIMechE
Prof Jyoti K. Sinha is Programme Director of Reliability
Engineering and Asset Management (REAM) MSc course
and Head, Dynamics Laboratory, School of Mechanical,
Aerospace and Civil Engineering, The University of
Manchester UK. The REAM course is an industrially
focused professional course on Maintenance which is
accredited by the IMechE UK. This course is now
completely on the international mission under his
leadership. Prof. Sinha is involved in and solved a number
of industrially applied research projects related to
Vibration-based Condition Monitoring and Maintenance of
Machines and Structures in last 28 years. Prof. Sinha is the
author of more than 250 publications (Journals and
conferences), technical reports and books and gave a
number of keynote/invited lectures. Prof. Sinha is the
associate editor of 3 international journals, editorial board
member of 2 journals, and members of several
international conferences. Prof Sinha has started a series of
an International Conference of Maintenance Engineering
(IncoME) and the Journal of Maintenance Engineering
(JoME) from August 2016. He is also technical committee
member of IFTOMM Rotordynamics.

131
ME2018_1124
A Decision Support Framework for Human
Reliability Analysis
Mohammed Almatani, Moray Kidd, Ahmed Khezam
School of Mechanical, Aerospace and Civil Engineering. The University of Manchester, Oxford
Road, Manchester, M13 9PL, UK.
Email: [email protected]; [email protected];
Abstract Human behaviour is often a root or significant contributing cause of a
system failure. This observation has been known for more than 30 years and it has
been recognised that the role of human operations is critical in risk assessment of
plant operations. This has led to the development of more than 70 methods which
are known as human reliability analysis (HRA). HRA accounts for the effects of
human error in risk and reliability analysis. This paper reviews and discusses HRA
methodologies, suggesting that there is a need for considerable further research
and development before they meet the needs of modern risk and reliability
analyses. In addition, there is a need that HRA methods are able to provide
decision-makers with the guidance they need to manage complex systems
effectively. Therefore, the aim of this study is to propose a Decision Support
Framework for Human Reliability Analysis which helps analysts and decision-
makers to consider and manage risk in a complex system more effectively.
.
Key words Human Reliability Analysis; Decision Support System; Risk
Assessment.
1.0 Introduction
Human error is a major contributor to the risk in industry. For example, 37.64% of
the US railways accidents are caused by human errors [1]. Additionally, 80% of
marine fatalities and shipping accidents are caused by human errors [2, 3]. This
has led to catastrophic consequences which urge the need to study, understand,
analyse and evaluate human errors in order to help designers and engineers to
eliminate or reduce risk.
Traditionally, human reliability is not considered in the design and risk analysis
processes. This could be due the lack of data in a particular industry. During the

132
design stage a thorough assessment of human factors is key for optimising the
design and ensuring high levels of reliability and safety during operation. The
consideration of human factors; however, can be a challenge during the design
stage especially where there is a high level of innovation, very little applicable
historical data and a high level of uncertainty. One of the ways in which human
factors can be considered is by including the end users and all other key
stakeholders within the design process. There are several design methodologies
that integrate human factors within the design process [4]. However, the collection
and assessment of the necessary data remains a challenge [5]. Despite the current
issues with data collection, consistency of analysis and accuracy, such issues can
be slowly addressed as industry moves into the big data era. This opens a bigger
scope for the integration of human factors within the design development process
at an early stage. There is a need for defining the data requirements in terms of
human factors as well as the analytical process. There are many areas where HRA
can be used. First, in the design of a system when human is involved and their
behaviour can affect the overall system. Second, during the licencing discussion in
order to show that a system can meet safety or legislations requirements. Third,
HRA can be used during the modification of a system [6]. It can be concluded
from this that HRA can be a powerful assessment in any stages of a plant life-
cycle.
The aim of this study is to propose a decision support framework for human
reliability analysis which helps analysts and decision-makers to consider and
manage risk in a complex system more effectively.
This paper is structured as follows. Section 1 introduces the problem statement
and objective of this study. Section 2 reviews briefly common HRA methods,
human error classification, and some of the decision – making methods that can be
used later in the study. Section 3 illustrates the general steps which are required to
conduct a HRA, and proposes the decision support framework for human
reliability analysis. Section 4 discusses some of the attributes, strengths and
weaknesses which are considered in selecting and evaluating a HRA method.
Section 5 concludes this study and highlight some of the future research
directions.
2.0 Literature Review
Human Reliability Analysis (HRA) is a section of the reliability discipline where
an overall human performance is studied [7]. There are more than 70 HRA
methods have been developed in the past 50 years. Some of these methods are not
publicly available which make them difficult to review. It is estimated that 35 of
these HRA methods are used in various industries [6]. Initially, most of these

133
methods are developed for the use in the nuclear power industry [8 - 11]. Later,
these methods are utilised in pharmaceutical industry [12], aviation industry,
railway [1], and maritime industry [3, 8, 13]. HRA were developed differently
because of the fact that a particular method can differ in terms of the purpose,
scope, level of task decomposition, human errors, quantification of human error
opposability (HEP), and how to represent the results. This has led to a lack of
consistency which has led to different results and different HEPs [6]. Human
reliability analysis can be defined as the probability of a person to correctly
perform an activity, and perform no extraneous activity (with no connection with
the task) that can degrade the system [10]. This human error probability (HEP)
can be calculated by Equation 1. Human performance can be represented as
Performance shaping Factors (PSF), Performing Influence Factors (PIF), and
Error Producing Conditions (EPC).
𝐻𝐸𝑃 = 𝑁𝑢𝑚𝑏𝑒𝑟 𝑜𝑓 𝑒𝑟𝑟𝑜𝑟𝑠
𝑁𝑢𝑚𝑏𝑒𝑟 𝑜𝑓 𝑜𝑝𝑝𝑜𝑟𝑡𝑢𝑛𝑖𝑡𝑖𝑒𝑠 𝑓𝑜𝑟 𝑒𝑟𝑟𝑜𝑟 Equation 1
In literature, researchers classify HRA methods into two generations. The HRA
first generation is developed based on the study of human error probability and
does not consider the cause of behaviour [14]. Some of these methods are:
Technique for Human Error Rate Prediction (THERP) [10], Accident Sequence
Evaluation Program (ASEP) [15], Human Error Assessment and Reduction
Technique (HEART) [16], and Simplified Plant Analysis Risk Human Reliability
Assessment (SPAR-H) [17]. These methods break a task into component parts to
calculate the HEPs and later consider potential impact of modifying factors such
as pressure and stress [7]. The model of the human behaviour in the HRA first
generation is shown in Figure. 1.
Perception Information Processing
Activity Operation
Task Behavior
Figure. 3 A model of human behaviour in HRA first generation [7]
The second generation methods consider the context as a factor affecting human
performance failure and later evaluate the relationship between the context and
HEPs [2]. Some of these methods are: A Technique for Human Event Analysis
(ATHEANA) [18], and Cognitive Reliability and Error Analysis Method
(CREAM) [19]. These methods consider cognitive behaviour of the human. The
activities of the human are assumed as performed for specific purpose, which is
illustrated in Figure. 2.

134
Perception Information Processing
Activity Operation
Task Behavior
Purpose Aim
Figure 4 A model of human behaviour in HRA second generation [7]
Some researchers have added a third generation in HRA methods, which considers
dynamic simulation system with a virtual representation of human to determine
challenging human performance situations [14]. The following subsection review
some of the most used HRA methods in the 1st and 2
nd generations.
2.1 Human Reliability Analysis (HRA) Methods
Firstly, the following methods are considered as 1st generation HRA. A)
Technique for Human Error Rate Prediction (THERP) which was developed in
the Sandia Laboratories for the US Nuclear Regulatory Commission [10]. It is a
very well-known and structured tool based on event-tree approach for evaluating
the probability of a human error. This method builds a tree of events and it
quantifies the associating scenarios to each outcome a nominal error probability.
The method can be developed in the form of procedures and may be applied in
several areas. B) Success Likelihood Index Method (SLIM) which assesses the
likelihood of error, based on indicators defined by the experts, with a
computerized procedure [14]. C) Human error assessment and reduction
technique (HEART) was developed by Williams in 1986 for use in overall
engineering systems [16]. HEART considers all of the factors that adversely affect
the performance and the execution of an activity, each independently, in order to
obtain a total error probability. There are 9 Generic Task Types (GTTs) described
in HEART, each with an associated nominal human error potential (HEP), and 38
Error Producing Conditions (EPCs) that may affect task reliability, each with a
maximum amount by which the nominal HEP can be multiplied. D) Standardized
Plant Analysis Risk – Human RA (SPAR-H) was developed for the US Nuclear
Research Commission, Office of Regulatory Research [17]. This method divides
causes of error into diagnosis and action. The model considers the context through
the use of 8 PSFs namely: Available time, Stress and stressors, Experience and
training, Complexity, Ergonomics and Human Machine Interface, Procedures,

135
Fitness for duty, Work processes. The model is simple, quick and easy to use. It
can be extended to other sectors.
Secondly, the following methods are considered as 2nd
generation HRA. A)
Cognitive Reliability and Error Analysis Method (CREAM) was first proposed
by Hollnagel in 1998, which was originally developed for nuclear power plant
applications [19]. This method evaluates the effect of the context of risk of error
and pays great attention to the control of the scenario in which the operator works.
The method integrates individual factors, technological and organisational.
CREAM encompasses the influence of human reliability into 9 factors which are
called Common Performance Conditions (CPCs) namely: 1.Adequacy of
organisation. 2.Working conditions. 3.Adequacy of the man-machine interface and
operational support. 4.Availability of procedures/plans. 5.Number of simultaneous
goals. 6.Available time. 7.Time of day. 8.Adequacy of training and experience.
9.Quality of crew collaboration [19]. According to human cognition and action,
there are four characteristic control modes which are determined by the CPCs,
namely: “Scrambled”, “Opportunistic”, “Tactical” and “Strategic” [19]. The
control modes are linked to different failure probability intervals representing
human action failure probabilities. B) A Technique for Human Event Analysis
(ATHEANA) was developed for the US NRC [18]. This methods identifies faults
and their causes. The method considers human errors can be occurred as a result
of “error-forcing contexts” (EFCs). It does not decompose actions under activities,
but it describes the basic process of the operators [14]. These methods will be
more analysed and reviewed in a greater depth in the future; Section 4 shows
strengths and weaknesses of some selected HRA methods.
2.2 Human Error Classification
A human error can be defined as an action that goes beyond the acceptable limits,
those being defined by the system [10]. Human error can be categorised as skilled
– based, rule – based, and knowledge – based. First, skilled – based behaviour
requires little or no mental effort such as cycling or switching gears when driving.
The error probability in this type can be estimated from 1/200 – 1/20,000. Second,
rule – based behaviour is when performing an activity needs to follow a specific
procedure or guidelines. For example, when an operator conducts an infrequent
test. The error probability in this type can be estimated from 1/20 – 1/2,000. Third,
knowledge – based behaviour (i.e. cognitive behaviour) requires significant
mental activity to process and solve a problem or take a decision. The error
probability in this type can be estimated from 1/2 – 1/200 [6]. Alternatively,
human error can be classified as omission and commission errors, which can be
seen in Figure. 3 [10]. An omission error is when a person does not perform a

136
task at all or not on time. A commission error is when a person perform a task
incorrectly, poorly, or with wrong parameters.
Figure. 5 Representation of the classification via an event tree [10].
2.3 Decision – Making Methods
Engineering problems can be solved by decision – making methods which include
three main groups: Multi – Criteria Decision – Making (MCDM) methods [20],
Problem Structuring Methods (PSMs) [21], and Decision – Making Problem –
Solving (DMPS) methods [22]. Each of these group has its characteristics,
applications, strengths and weaknesses. The MCDM can be further divided into:
Multi-Attribute decision-making (MADM) methods which deal with a finite
number of alternatives and a discrete solution space; and Multi-Objective decision-
making (MODM) methods searches within an infinite (and unknown) set of
solutions in a continuous space [22]. Methods of MADM are the Multi-Attribute
Utility Theory (MAUT), the Analytic Hierarchy Process (AHP) [23], the Analytic
Network Process (ANP) [24], the VIKOR method [25], Goal Programming (GP)
[26], and Technique for Order Preference by Similarity to Ideal Solution
(TOPSIS) [27]. On this stage of this study, the focus will be only on the first group
which is MCDM. Later, there will be further review and analysis to select which
MCDM will be chosen and why.
3.0 Methodology
Different HRA methods have different approaches in order to complete both the
quantitative and qualitative phase of the analysis and then calculate the HEPs for a
task and later perform a human error management. Generally, most HRA methods
follow the following 10 steps which include: 1) Examining the system in detail, 2)
Reviewing existing risks, 3) brainstorming human activities that could lead to a

137
potential failure in performing a task, 4) detailing activities that could lead to
commission or omission errors, 5) assigning a HEP for each activity, 6) modifying
the HEP by applying PSFs, 7), assessing probabilistic dependences between
human activities, 8) calculating the overall HEP system for the task, 9) considering
recovery actions to eliminate, mitigate, or reduce risks, 10) conducting sensitivity
analyses [28].
The proposed framework in this paper, which can be seen in Figure. 4, is
conceptual model that can meet the objective of this study. The framework
consists of seven main processes which will help analysts and engineers to
conduct a HRA more efficiently and effectively. First, the initial scope of this
study is to consider generic maintenance tasks which can be performed in various
industries. Therefore, the first step is define the problem and determine the scope
of the analysis in order to formulate a maintenance task. Second, a maintenance
task is broken down into steps and human activities. These activities could include
physical activity or cognitive activity. This step is also known as task
decompositions. Third, since there are a number of GTTs, EPCs, PSFs, and
different maintenance scenarios, a MCDM method will be used in order to
calculate the importance weight of the criteria and to obtain relative performance
measures of the alternatives, i.e. a maintenance task will be assigned and analysed
by the optimum method. The framework considers THERP, HEART, CREAM,
and ATHEANA on its analysis. These selected methods are based on a number of
attributes which will be mentioned on Section 4. Fourth, human errors will be
identified in this process. It is important to identify both commission and omission
errors in this step. Fifth, human errors will be represented and modelled in order to
help the analysts to understand the relationships of all factors that could generate
risk. Sixth, each human error will be quantified by assigning a probability of
failure. This will help to determine which human errors are the significant
contributors to the overall HEP. This step heavily depends on the availability of
data and the used method. Seven, if the overall HEP value is acceptable and does
not generate risk, a maintenance task can be performed. If the overall HEP value is
not acceptable, a human error management should be conducted. This step is the
most important process in the whole HRA. In this process, a recovery actions can
be taken in order to eliminate, reduce or mitigate risk. This can be done by
including barriers to prevent errors, or provide means to perform a task correctly.
Finally, the result of this analysis will be reported back in order to update the
original maintenance procedure. This will help to continuously improve the
system.

138
Start
Maintenance task
Maintenance procedures
HEART
Select the optimum HRA method
CREAM
HRA method accepted?
Error
identification
Error
representation
(modeling)
THERP
ATHENA
YES
HE
P q
ua
nti
fica
tio
n m
od
el
Task Analysis
MCDM tool
NO
HEP
Quantification
HEP level accepted?
Perform task
End
Human error
management
NO
HRA methods
YES
Feedback and update
Figure. 6 The proposed Decision Support Framework for Human Reliability
Analysis

139
4.0 Discussion
Since there is no a single HRA method that can solve most engineering problems,
there is a need to understand the capabilities, strengths and weaknesses of each
method. This has motivated the author to provide this decision support framework
in order to carefully choose a method that not only to simplify the selection
process, but also to use the selected HRA method effectively.
This study considers four HRA methods including: 1st generation (THERP and
HEART), and 2nd generation (CREAM and ATHEANA). These methods are
selected based on the following attributes: 1.purpose of the method, 2.screening
3.capability, 4.task decomposition, 5.list of PSFs, 6.errors coverage (i.e. data
availability), 7.HEP calculation procedure, 8.task dependency and recovery,
9.HEP uncertainty bounds, 10.level of knowledge required, 11.validation,
12.reproducibility, 13.sensitivity, and 14.availability of the method in the public
domain.
There are many challenges in performing a HRA [29]. First, there is still a lack of
empirical data to model and validate a method. Second, there is a large variability
in implementation. This is one of the motivated reasons to develop this proposed
framework. Third, there is a great reliance on expert opinions in selecting PSFs.
This could be limited when performing an unfamiliar task. Fourth, some of the
HRA methods does not specify how to complete a task analysis or quantify an
error [30]. This is why the proposed framework will guide the user on how to
conduct the analysis. Last, Table.1 and Table.2 briefly highlights the strengths
and weaknesses of the selected HRA methods.
Table.6 Strengths and weaknesses of the selected HRA methods [9]
Human Reliability
Analysis method
Strength Weaknesses
1st
Gen.
THERP
Used in design stages.
It can be audited.
It is well-used in practice.
It is a time consuming.
Level of detail can be
extensive.
Modelling a scenario is not
guided.
HEART
It is easy and quick to
perform.
It uses limited resources.
It suggests how to reduce
errors.
Error dependency modelling
is not included.
It needs more clarification to
help the user to distinguish
between GTTs and EPCs.

140
Table.7 Strengths and weaknesses of the selected HRA methods [9] (Cont.)
Human Reliability
Analysis method
Strength Weaknesses
2nd
Gen.
CREAM
It is well structured.
It follows a well laid out
procedure.
It allows for a direct
quantification of HEP.
It uses principles of
predictive analyses.
It is time consuming.
It needs high level of
resources.
It potentially fails to provide
means to reduce errors.
ATHEANA
Key risks are likely to be
identified.
It helps to identify of
human factor(s) is a
cause of an accident.
It considers a wider range
of PSFs.
HEPs can be estimated in
this method by a variety
of factors and
combinations.
It does not prioritise human
factors that contributed to an
accident.
The quantification is weak in
this method.
The guidance in this method
is complex.
5.0 Conclusion
It has been found that human behaviour is a significant contributing cause of a
system failure. 80% of marine accidents are caused by human factors. This paper
has introduced the concept of HRA and presented why there is a great need to
perform such an analysis. Currently, there are more than 70 HRA methods that
have different characteristics and different procedures. As a result of the discussed
limitations and challenges in Section 4, the aim of this study was to propose a
decision support framework for human reliability analysis which helps analysts
and decision-makers to consider and manage risk in a complex system more
effectively. The proposed framework has a systematic processes which can be
easily followed. This framework has considered four HRA methods including:
THERP, HEART, CREAM, and ATHEANA. The reasons of this selection was
based on the number of attributes mentioned on the discussion section. Since this
is still a conceptual framework, the study will identify which MCDM method can
be used, formulate a number of maintenance scenarios, conduct and validate the
proposed framework.

141
References
[1] A. Ferlin, S. Qiu, P. Bon, M. Sallak, S. Dutilleul, W. Schön and Z. Cherfi-Boulanger,
“An Automated Method for the Study of Human Reliability in Railway Supervision
Systems,” IEEE Transactions on Intelligent Transportation Systems, vol. PP, no. 99,
pp. 1 - 16, 2018.
[2] Q. Zhou, Y. Wong, H. Loh and K. Yuen, “A fuzzy and Bayesian network CREAM
model for human reliability analysis – The case of tanker shipping,” Safety Science,
vol. 105, p. 149–157, 2018.
[3] R. Islam, R. Abbassi, V. Garaniya and F. Khan, “Development of a human reliability
assessment technique for the maintenance procedures of marine and offshore
operations,” Journal of Loss Prevention in the Process Industries, vol. 50, p. 416–428,
2017.
[4] X. Sun, R. Houssin, J. Renaud and M. Gardoni , “A review of methodologies for
integrating human factors and ergonomics in engineering design,” International
Journal of Production Research, 2018.
[5] D. Smith, Reliability Maintainability and Risk, 8th ed., Oxford: Butterworth
Heinemann, 2011.
[6] J.-M. Flaus, Risk Analysis: Socio-technical and Industrial Systems, London: ISTE
Ltd., 2013.
[7] M. Havlikova, M. Jirgl and Z. Bradac, “Human Reliability in Man-Machine Systems,”
in 25th DAAAM International Symposium on Intelligent Manufacturing and
Automation, Vienna, 2015.
[8] E. Akyuz, M. Celik and S. Cebi, “A phase of comprehensive research to determine
marine-specific EPC values in human error assessment and reduction technique,”
Safety Science, vol. 87, p. 63–75, 2016.
[9] B. S. Dhillon, Human Reliability, Error, and Human Factors in Power Generation,
Cham, Switzerland: Springer International Publishing, 2014.
[10] A. D. Swain and H. E. Guttmann, Handbook of human reliability analysis with
emphasis on nuclear power plant applications, Washington, DC.: US Nuclear
Regulatory Commission, 1983.
[11] X. Pan, C. He and T. Wen, “A review of factor modification methods in human
reliability analysis,” in 10th International Conference on Reliability, Maintainability
and Safety (ICRMS), Guangzhou, China, 2014.
[12] F. Castiglia, M. Giardina and E. Tomarchio, “THERP and HEART integrated
methodology for human error assessment,” Radiation Physics and Chemistry, vol.
116, p. 262–266, 2015.
[13] R. Islam, F. Khan, R. Abbassi and V. Garaniya, “Human Error Probability Assessment
During Maintenance Activities of Marine Systems,” Safety and Health at Work, vol. 9,
no. 1, pp. 42-52, 2018.

142
[14] A. Petrillo, D. Falcone, F. De Felice and F. Zomparelli, “Development of a risk
analysis model to evaluate human error in industrial plants and in critical
infrastructures,” International Journal of Disaster Risk Reduction, vol. 23, p. 15–24,
2017.
[15] A. D. Swain, Accident Sequence Evaluation Program Human, Washington, DC.: US
Nuclear Regulatory Commission, 1987.
[16] J. C. Williams, “HEART – a proposed method for assessing and reducing human
error,” in 9th Advances in Reliability, University of Bradford, 1986.
[17] D. Gertman, H. Blackman, J. Marble, J. Byers and C. Smith, “The SPAR-H Human
Reliability Analysis Method,” Idaho National Laboratory, Idaho Falls, Idaho , 2005.
[18] S. Cooper, A. Ramey-Smith, J. Wreathall, G. Parry, D. Bley, W. Luckas, J. Taylor and
M. Barriere, “A Technique for Human Error Analysis (ATHEANA) - Technical Basis
and Methodological Description,” NUREG/CR-6350 Brookhaven National
Laboratory, Upton, NY, 1996.
[19] E. Hollnagel, Cognitive Reliability and Error Analysis Method (CREAM), Oxford :
Elsevier Ltd, 1998.
[20] V. Belton and T. J. Stewart, Multiple Criteria Decision Analysis: An Integrated
Approach, Boston: Kluwer Academic, 2002.
[21] J. Rosenhead and J. Mingers, Rational Analysis for a Problematic World Revisited,
Chichester: Wiley, 2001.
[22] C. Renzi, F. Leali and L. Di Angelo, “A review on decision-making methods in
engineering design for the automotive industry,” Journal of Engineering Design, vol.
28, no. 2, pp. 118-143, 2017.
[23] T. L. Saaty, The Analytic Hierarchy Process, New York: McGraw-Hill, 1980.
[24] T. L. Saaty, “Fundamentals of the Analytic Network Process – Dependence and
Feedback in Decision-Making with a Single Network,” Journal of Systems Science
and Systems Engineering, vol. 13, no. 2, p. 129–157, 2004.
[25] S. Opricovic, “Multicriteria Optimisation of Civil Engineering Systems,” Faculty of
Civil Engineering, vol. 2, no. 1, p. 5–21, 1998.
[26] A. Kharrat, S. Dhouib, H. Chabchoub and B. Aouni, “Decision-maker’s Preferences
Modelling in the Engineering Design Through the Interactive Goal-Programming,”
International Journal of Data Analysis Techniques and Strategies, vol. 3, no. 1, p. 85–
104, 2011.
[27] C. L. Hwang and K. L. Yoon, Multiple Attribute Decision Making: Methods and
Applications, New York: Springer, 1981.
[28] S. French, T. Bedford, S. Pollard and E. Soane, “Human reliability analysis: A critique
and review for managers,” Safety Science, vol. 49, no. 6, pp. 753-763, 2011.
[29] V. Di Pasquale, R. Iannone, S. Miranda and S. Riemma, “An Overview of Human
Reliability Analysis Techniques in Manufacturing Operations,” 13 03 2013. [Online].
Available: https://www.intechopen.com/books/operations-management/an-overview-

143
of-human-reliability-analysis-techniques-in-manufacturing-operations. [Accessed 25
06 2018].
[30] M. Philippart, “Chapter 12 - Human reliability analysis methods and tools,” in Space
Safety and Human Performance, Oxford, Butterworth-Heinemann, 2018, pp. 501-568.
[31] V. Garg, T. Santhosh, P. Antony and G. Vinod, “Development of a BN framework for
human reliability analysis through virtual simulation,” Life Cycle Reliability and
Safety Engineering, vol. 6, p. 223–233, 2017.
[32] A. C. Ribeiro, A. L. Sousa, J. P. Duarte and P. F. Frutuoso e Melo, “Human reliability
analysis of the Tokai-Mura accident through a THERP–CREAM and expert opinion
auditing approach,” Safety Science, vol. 87, p. 269–279, 2016.
[33] F. De Felice, A. Petrillo and F. Zomparelli, “A Hybrid Model for Human Error
Probability Analysis,” IFAC-PapersOnLine, vol. 49, no. 12, p. 1673–1678, 2016.
[34] R. B. Shirley, C. Smidts, M. Li and A. Gupta, “Validating THERP: Assessing the
scope of a full-scale validation of the Technique for Human Error Rate Prediction,”
Annals of Nuclear Energy, vol. 77, p. 194–211, 2015.
[35] E. Akyuz and M. Celik, “Computer-Based Human Reliability Analysis Onboard
Ships,” Procedia - Social and Behavioral Sciences, vol. 195, p. 1823 – 1832, 2015.
[36] R. Abbassia, F. Khan, V. Garaniya, S. Chai, C. Chin and K. Abul Hossain, “An
integrated method for human error probabilityassessment during the maintenance of
offshore facilities,” Process Safety and Environmental Protection, vol. 94, p. 172–179,
2015.
[37] A. Noroozi, F. Khan, S. MacKinnon, P. Amyotte and T. Deacon, “Determination of
human error probabilities in maintenance procedures of a pump,” Process Safety and
Environmental Protection, vol. 92, p. 131–141, 2014.
[38] I. S. Kim, “Human reliability analysis in the man-machine interface design review,”
Annals of Nuclear Energy, vol. 28, pp. 1069-1081, 2001.
[39] K. T. Kazimierz, “Issues of the Human Reliability Analysis in the Context of
Probabilistic Safety Studies,” International Journal of Occupational Safety and
Ergonomics, vol. 1, no. 3, pp. 276-293, 1995.
[40] J. C. Williams, “A data-based method for assessing and reducing human error to
improve operational performance,” in Proceedings of the IEEE, 4th Conference on
Human Factors, Monterey, CA, 1988.

144
Authors’ Biography
Mohammed Almatani
Mr. Almatani is a full – time postgraduate researcher
in Human Reliability Engineering, School of MACE,
University of Manchester, UK. In 2016, he earned a
MSc. degree Reliability Engineering and Asset
Management form the University of Manchester. He
is an experienced teaching assistant with a
demonstrated history of working in the higher
education. Mohammed is a sponsored staff from
Industrial Engineering Department, college of
engineering, King Saud University, Saudi Arabia.
Moray Kidd
Dr Kidd has a wealth of experience gained working
in various professional mechanical engineering roles
for companies including ABB, GE and BAE Systems.
His special interests include Reliability Engineering,
Mechanical Design and Project Management. In his
previous role as Deputy Director, Dr Kidd managed
the BP Engineering Management for the past ten
years for the University of Manchester. Dr Kidd
teaches Reliability Engineering, Mechanical Design
and Project Management. He is actively involved in
Research, Consultancy and CPD in all these subject
areas.
Ahmed Khezam
Mr. Khezam is a project and reliability engineer
having worked on several projects in the
manufacturing and pharmaceutical industries. Having
graduated from the University of Manchester with a
first class degree in Mechanical Engineering as well
as Management Studies. He is now completing a PhD
researching developments within Industry 4.0 and the
big data era.

145
ME2018_1125
A Structural Model of the Impact of
Organisational Culture on Participation of
Autonomous Maintenance in the Power
Industry
Abdulla Y. Alseiari1, Peter Farrell
2
1Departement of Energy-Abu Dhabi, Najda Street, Al Markaziyah area, 6120, Abu Dhabi, United
Arab Emirates.
2School of Engineering. The University of Bolton, Deane Road, Bolton, BL3 5AB, UK.
Email: [email protected]; [email protected]
Abstract The implementation of modern maintenance strategies has a positive
impact on improving industrial assets. There are examples of asset high perfor-
mance, quality, and reliability being achieved through successful maintenance ap-
proaches. Total Productive Maintenance (TPM) is an ideal approach to support the
development and implementation of operation performance improvement. It sys-
tematically aims to understand the function of equipment, service quality relation-
ship with equipment and probable critical equipment failure conditions. Imple-
mentation of TPM programme need strategic planning and there has been little
research applied in this area within Middle-East power plants. Employee Empow-
erment is one of the main criteria in TPM implementation. TPM programme will
not work without empowering the operators or the production workers to carry out
the autonomous maintenance. However, there is a clear lack of literature that ex-
plores the influence of employee empowerment on autonomous maintenance par-
ticipation and therefore, this research aims to examine the impact of organisation
culture on the participation of autonomous maintenance within power plants using
a structural equation modeling approach. Hofstede’s (1980) dimensions of culture
(power distance, collectivism/individualism, masculinity/femininity, and uncer-
tainty avoidance) were used to inform the theoretical framework. Data were col-
lected from 124 professionals in the Abu Dhabi power industry using a postal
questionnaire. Structural equation modelling, using partial least squares path anal-
ysis (SmartPLS software version 3.0), was performed to test the hypothesised
model. Participants in the study were requested to answer three main question-
naires: Hofstede’s cultural dimensions questionnaire, structural employee empow-
erment questionnaire, and participation of autonomous maintenance questionnaire.
Findings indicated that power distance and masculinity/femininity dimensions had
a direct negative and meaningful effect on employee empowerment. On the other
hand, collectivism had a direct positive effect on employee empowerment. Fur-
thermore, structural empowerment had a direct positive impact on autonomous
146
maintenance participation in the power industry. Besides, the effect of uncertainty
avoidance on structural empowerment was not statistically significant. In short,
the findings confirmed the role of organisational culture and structural employee
empowerment in participation of autonomous maintenance. This research will
contribute to bridge the current gap in knowledge.
Key words Total Productive Maintenance (TPM); Participation of Autonomous
Maintenance; Structural Employee Empowerment; Structural Equation Modelling
1.0 Introduction
The implementation of modern maintenance strategies has a positive impact on
improving industrial assets. There are examples of asset high performance, quality,
and reliability being achieved through successful maintenance approaches. Total
Productive Maintenance (TPM) is an ideal approach to support the development
and implementation of operation performance improvement. Principally, TPM
empowers employees by giving them mutual responsibilities and a sense of
ownership and only companies that have been able to recognise this fact have
managed to succeed in TPM adoption [1]. For accelerating this success, teams
should have the authority to determine their individual tasks without the
interference of management. Hence, it ensures more active involvement in taking
decisions and accepting responsibilities. However, at times, the meaning of the
word ‘employee empowerment’ is misinterpreted. The assumption that it signifies
that all decisions must be taken by employees can result in complete chaos. This is
why rules and policies play an integral part in preventing or eliminating the
confusion. Furthermore, what is most difficult is ascertaining decisions that must
be taken by management and the ones that must be taken by employees, alongside
the ones that must be mutually considered. Similarly, this misinterpretation can
also lead to the incorrect decision of not giving adequate responsibilities to
workers [2].
Several authors have acknowledged the significance of TPM implementation in
the power industry Aljanabi et al. [3]; Wai Foon and Terziovski [4]; Reiman and
Oedewald [5] and in the service sector Mad Lazim and Ramayah [6].
Correspondingly, Nasurdin et al. [7] opined that empowerment remains one of the
most important philosophies entrenched in TPM which is expected to enhance
employees’ sense of autonomy. For example, in autonomous maintenance,
operators are not merely permitted to oversee the efficacy of the
machines/equipment within their care, but are also given the opportunity of
deciding and initiating corrective actions in order to prevent unscheduled
breakdowns [8]. In the same context, operators or shop floor workers are likely to
enjoy greater autonomy. Therefore, Nasurdin et al. [7] advocated the concept of
empowerment amongst employees in organisations performing TPM programmes.

147
Under such circumstances, employees’ flexibility and autonomy will be increased.
Furthermore, as noted by Nakajima [9], operators are required to participate in
giving suggestions to improve the production line in the form of small group
activities, which in turn, guide them to experience greater autonomy. Thus, it can
be concluded that involvement in TPM activities paves the way for heightened
autonomy amongst employees. This evidences the importance of participation of
autonomous maintenance for successful implementation of TPM programmes
within power plants, and empowerment can be a significant to the development of
such programmes. Employee Empowerment is one of the main criteria in TPM
implementation. TPM programme will not work without empowering operators or
production workers to carry out the autonomous maintenance. However, there is a
clear lack of literature that explores the influence of employee empowerment on
the autonomous maintenance participation and therefore, this research aims to
examine the impact of organisation culture on the participation of autonomous
maintenance within power plants.
2.0 TPM
Innovative TPM maintenance strategies are utilised for affecting an increase in
overall equipment effectiveness. This is achieved by setting up inclusive produc-
tive maintenance schemes that cater for the complete life-cycle of equipment [10].
Correspondingly, for the entire lifespan of equipment, TPM allows the establish-
ment of thorough PM systems [9]. It motivates maintenance staff and operators to
collectively design high standard good working procedures, focused on improve-
ment and teamwork, which in turn augment equipment and process effectiveness
[11] – [12]. Nakajima [9], the chairman of the Japanese Institute of Plant Mainte-
nance (JIPM) in 1971 introduced TPM in Japan and today this system exhibits
wide scale adoption, particularly in the manufacturing sectors. Directed towards
increased performance, availability, and quality, TPM aims to ensure zero defects,
zero accidents, and zero equipment failures. TPM is underpinned by principle
practices known as ‘pillars’, specifically: autonomous maintenance; education and
training; focused improvement; development management; office TPM; planned
maintenance; quality maintenance; and safety, health, and the environment. Corre-
spondingly, an explanation about TPM processes can be found in Nakajima [9],
and Reiman and Oedewald [5]. To support the achievement of a TPM philosophy,
maintenance staff and operators need to exhibit high knowledge levels, which sub-
sequently allows for job function sharing between colleagues, and new skill de-
velopment [12]. Implementation of TPM is not easy and faces many obstacles; de-
tails about its barriers are articulated by Ahuja and Khamba [13]. However,
according to Waeyenbergh and Pintelon [14], there is a lack of clarity in standard
maintenance rules and utilisation of simple maintenance policies, and TPM can be
limited in providing complete maintenance concepts. Therefore in the power in-
dustry, whether participation of autonomous maintenance can result in robust TPM
strategies needs to be further explored. In maintenance, the TPM approach aims at

148
continuous performance improvement through increased efficiency and effective-
ness of certain industrial activities. This is evaluated through the Overall Equip-
ment Effectiveness (OEE), which is computed through the product of quality, per-
formance, and availability. In its calculation, “six big losses” [quality losses (1)
process defects, (2) reduced yield; performance losses (3) minor stoppages, (4)
slow cycles or speed; availability losses (5) plant failure, (6) set-up and adjust-
ments] are measured to systematically reduce 100% theoretical availability to
achieve maximum equipment effectiveness. However, according to Waeyenbergh
and Pintelon [14], this calculation does not provide a complete analysis as it ne-
glects the component of profits and cost, thus limiting its applicability in compari-
son of competitive systems or machines. This further evidences the incomplete na-
ture of TPM as a maintenance concept in the power industry. It could be argued
that a wider classification of losses is necessary for OEE to help improved ma-
chine utilisation understanding. Also, diverse industries and business domains are
affected by different OEE measurement levels and factors. Correspondingly, the
first country that utilised the 5S approach was Japan in the mid-1950s in manufac-
turing sector organisations [15]. As corroborated by Gupta and Jain [16], 5S im-
plementation in organisations ensures continuous improvement. The 5S approach
signifies, Shitsuke (sustain), Seiketsu (standardize), Seiso (sweep), Seiton (set in
order), and Seiri (sorting) [16]. This 5S system is oriented towards productivity
and quality optimisation and waste reduction that is achieved by orderly work-
place maintenance and ensuring consistency in operational outcomes through vis-
ual cues. This evidences TPM implementation promotion, by forming a funda-
mental base for 5S in the TPM pillars. Furthermore, autonomous maintenance is
one of the most critical barriers that could affect the successful implementation of
TPM [7].
2.1 Autonomous Maintenance
The contributions of autonomous maintenance and planned maintenance pillars
enable production operators to run equipment effectively, thus also preventing de-
terioration [6-9]. Prickett [17] argued that it must be recognised in developing ful-
ly autonomous maintenance systems that all relevant data pertaining to the state
and performance of machine systems should be recorded. This can then be ana-
lysed and results used to support more effective maintenance. This process will re-
ly on skilled operators who have the ability to increase machine performance. Mad
Lazim and Ramayah [6] discussed that all activities related to cleaning, inspec-
tions, lubrications, adjusting of equipment and so forth should be recorded and
maintained for regular analysis. Through regular analysis, the results can be
shared among all employees and performance can be observed accordingly for
further improvements. Wai Foon and Terziovski [4] discovered that maintenance
practices of keeping records, total preventive maintenance, and collection and
analysis of information, have significant impact on power plant performance.
Moreover, Ben Daya [10] argues that in TPM implementation, the active involve-

149
ment of operators results in permanent improvement in the overall effectiveness of
equipment. Thus, employee empowerment and equipment management are two
fundamental features of TPM. It is pertinent for mechanics and operators to coop-
erate and work in teams towards the same goals, since there is high significance
placed upon the involvement of operators in successful TPM implementation. This
can be pragmatically achieved through a systematic approach of learning by
properly trained and certified operators and vice-versa skill training to enable op-
erators to perform mechanical tasks. There are several benefits of these operation
and maintenance partnerships:
Multi-skilling of mechanics and operators results in improved worker
flexibility and job enrichment;
A sense of ownership, pride, and responsibility is inculcated as operators
are involved in routine maintenance tasks;
Results in an increase in productivity and reduction in delay times;
Operations and maintenance staff develop improved teamwork qualities.
To achieve this, participation of autonomous maintenance need to be performed
effectively to ensure optimal overall equipment effectiveness and hence enable
operators to perform their tasks easily. Empowerment of operators can play a sig-
nificant part in driving successful participation.
2.2 Organisation Culture and Employee Empowerment
In this study, the authors propose a shift away from the direct and narrow concept
of environment (like the workplace) to a broader framework as well as a concept
of the indirect environment (like organisational culture). The reason behind this
proposal is that culture is one of the most significant, stable and long-lasting
factors that impacts upon behaviour and well as cognition. Furthermore, cultural
issues also serve as barriers towards successful implementation of TPM. Thus, the
current research takes an essential step in the development of proactively
integrating culture into the realm and constructs of employee empowerment.
Hofstede’s theory [22] also assumes that cultural values and dimensions impact on
employee empowerment. Moreover, employee empowerment are intrinsic needs
for operators to participate in maintenance activities [23]. The element of
empowerment is closely related to the emphasis to acquire organisational efficacy
through effective and discerning human resource utilisation. Furthermore,
empowerment techniques play a key role in improving group development as well
as maintenance [18]. Kanter [19] was one of the oldest proponents of the concept
of empowerment. She discussed that the organisation characteristics and structures
determine the element of empowerment. More specifically formal job
characteristics as well as informal partnerships affect the employees’ ability to
complete their work successfully. Based on the structural empowerment
framework of Kanter [19], the researchers evaluated the effect of access to

150
support, power, resources, opportunities and information on the autonomous
maintenance (operators) participation in power plants. Kanter [19] defined that
power is the ability to organise and secure resources in order to let the workforce
complete their job in appropriate way. Employees get empowered (power is 'on')
when they are able to access support, resources, information, as well as other
opportunities to grow and learn. In case these lines become unavailable (power is
'off'), employees’ ability to work effectively reduces drastically. The power lines
are 'structural' empowerment sources in the concerned organisation. Kanter points
out that these lines emanate from formal as well as informal systems within
organisations. According to Orgambídez-Ramos and Yolanda Borrego-Alés [18],
formal power can be obtained from job characteristics such as flexibility,
adaptability, making discretionary decisions, visibility, as well as alignment with
overarching organisational goals and purpose. Furthermore, informal power can
be sourced from social links, information communication channels with sponsors,
friends, bosses, subordinates, and other assistive groups. Accessing these
structures result in heightened levels of structural empowerment [18-19]:
1. Opportunity access implies that there is possibility of growth within the
company as well as the opportunity of growth through obtaining wider
skills/knowledge.
2. Resource access means the ability to source pertinent materials, financial
support and other necessary supplies need to execute a function.
3. Information access implies the necessary informal and formal knowledge
that helps the one to remain efficacious in the workplace.
4. Support access entails obtaining guidance and feedback from peers,
superiors and subordinates.
2.3 Development of Conceptual Framework
This research paper is concerned with examining the impact of organisational cul-
ture and employee empowerment on the participation of autonomous maintenance.
Organisation culture that has bad practices may affect the empowerment of em-
ployees. Furthermore, workplaces in the UAE have not widely considered organi-
sational culture [20]. According to Al-Khalifa and Aspinwall [21], the quality im-
plementations in organisations are impacted by national cultures, which affects
organisational culture, as it is representative of commonly shared society/country
values. Correspondingly, the culture differences amongst clustered cultures and
nations have four dimensions [22]; and are categorised as (1) "Masculinity-
Femininity”; (2) "Power-distance"; (3) "Individualism-collectivism"; and (4) "Un-
certainty avoidance" on high or low level positioning of these dimensions.

151
Masculinity – Femininity: According to Hofstede in Masculine cul-
tures men and women display discernibly different social roles and
correspondingly, in feminine cultures, there is an obvious significant
overlap in social roles where women are considered as supporters.
Power-distance: This culture represents the acceptance of power dis-
tance based on high or low power. In high power societies, the mem-
bers show high respect to senior management, while in low power
societies, there is an equality in distribution of authority and hence
establish a democracy culture as social control.
Individualism-collectivism: In individualist cultures, an individual
assumes the role of responsibility to his/her immediate family as a
natural course of action; alternatively in collectivist cultures, an in-
dividual belongs to a group by birth permanently.
Uncertainty avoidance: As the name indicates, in this cultural scenar-
io, the people introduce and establish strict behaviour codes with ab-
solute truths belief to avoid situations deemed unclear, and unstruc-
tured.
On the other hand, employees are of the opinion that any work environment ena-
bling access to these points is on their way to empowerment. Kanter’s theory [19]
pertains to the perception of employees concerning the real working conditions, as
opposed to the manner in which they psychologically interpret this information.
Thus, the authors took into consideration, the concept of 'structural' empowerment
to forecast the participation of operators in the power plants’ maintenance activi-
ties. Meanwhile they employed these dimensions: (senior management commit-
ment, management style and empowerment, communication and coordination, re-
wards and motivation, and knowledge sharing) in the research model that was
premised on Kanter's structural empowerment framework.
Senior Management Commitment
According to Hooi and Leong [24], senior management roles are critical in the
early phases in order determine the master plan whilst commencing the entire pro-
gram’s for TPM implementation. Senior leadership’s involvement provides direc-
tion for their power plants and ensure that operators are empowered, which in turn
leads to continuous improvement and enhances the participation of operators in
maintenance activities [6].
Management Style and Empowerment
TPM is a technology-driven concept; the justification for any event of failure is
often denoted as organisational matters, and is a reflection of the style of man-
agement [25]. Wai Foon and Terziovski [4] reported that management style has an
impact on employee empowerment in power plants.

152
Communication and Coordination
According to Park and Han [26], a frequent process that involves effective coordi-
nation and communication across organisations may pave the way for great com-
mitment, involvement, as well as cooperation from all employees. Without doubt,
this fosters a strong association amongst participants and creates a motivating en-
vironment.
Rewards and Motivation
According to Poduval et al. [27], rewards and motivation became an effective fac-
tor for successful TPM implementation. They specified that senior management
should be able to prevent attrition by offering world-class remuneration as well as
employee benefits. Positive attention from senior managers is arguably the most
important reward at the workplace. However, individual perspectives concerning
the punishments as well as rewards may vary; managers also need to recognise
what is it that suits their requirements [28]. On the other hand, positive employee
motivation is a key intangible consequence as TPM builds a sense of ownership
through autonomous maintenance operators [24].
Knowledge Sharing
According to Poduval et al. [27], lack of knowledge sharing is one the major caus-
es of TPM failure since the staff is not well aware of TPM and consequently, is not
adequately motivated to implement it. Moreover, a continuous sharing/learning
program promotes a knowledge-based organisation wherein employees are well
equipped with the knowledge to undertake maintenance tasks with greater effi-
ciency [24]. Refaiy and Labib [29] elaborated that knowledge sharing has a posi-
tive effect on the performance level of maintenance activities based on three
measures of maintenance performance: mean waiting time (MWT), mean time to
repair (MTTR), and mean time between failures (MTBF). However, they found
the impact of knowledge sharing is stronger in the UK compared to Arabic coun-
tries.
Hofstede’s Cultural Dimensions Model
By introducing dimensions of cultural (power distance, masculinity/femininity,
collectivism/individualism, and ambiguity avoidance), Hofstede [22] posited that
the degree to which the culture of organisations curtails members’ freedom
through initiation and action plays a key role in preventing employee empower-
ment. Excessive organisational regulations, high power distance and avoidance of
ambiguity have been known to curtail individual freedom [30]. In a similar man-
ner, insufficient focus on individual viewpoints in collective organisations has also
been known to affect freedom of action [31]. Likewise, an overbearing focus of
competition in masculine organisations results in heightened pressure and cur-
tailed productivity in individuals, which then results in external motivation and the
destruction of internal satisfaction [32]. Considering all these points aforemen-
tioned, the present research plans to investigate the relationship between cultural
organisation based on Hofstede’s cultural dimensions as well as employee em-
powerment.

153
Furthermore, there is no research which has tackled the issue of how culture af-
fects the employee empowerment with autonomous maintenance (operators) par-
ticipation in the power industry. Carrying out such a study will make a contribu-
tion towards building upon the existing body of knowledge and hence
understanding of the way culture affects the employee empowerment with auton-
omous maintenance (operators) participation. Based on the aforementioned theo-
retical framework (Figure 1), the following hypotheses can be postulated:
H1: Employee empowerment has a direct impact on participation of autonomous
maintenance (operators) in the power plants.
H2: Power distance has a direct impact on employee empowerment.
H3: Collectivism versus individualism has a direct impact on employee empow-
erment.
H4: Masculinity versus femininity has a direct impact on employee empower-
ment.
H5: Avoidance of uncertainty has a direct impact on employee empowerment.
Figure 1 Theoretical Model of the Research

154
3.0 Research Methodology
Many industries have shown an understanding of the needs and significance of
TPM. However, participation of autonomous maintenance is one of the most criti-
cal barriers for implementing TPM due to organisational culture issues. Converse-
ly, within Abu Dhabi power plants, there is little literature to evidence research
application in this specific area. Thus, this research paper aims to examine the im-
pact of organisation culture on the participation of autonomous maintenance with-
in Abu Dhabi power plants using a structural equation modeling approach.
3.1 Procedure and Design of Data Collection Tool
Data were collected from 124 professionals in the Abu Dhabi power plants using a
postal questionnaire. A sample comprising of three participant organisations was
selected based on their experience in operations and maintenance of power plants,
particularly in the power sector and included power generation, transmission as
well as distribution organisations. A response rate of 82.67% was achieved with
the receipt of 124 out of 150 responses. Snowball sampling was used for this
study; it is a famous methodology of survey sample selection frequently used to
trace hidden populations. The authors used this strategy to recruit people who are
often difficult to identify due to critical issues shown in the questionnaire that
asked them about current maintenance practices and organisation culture. Struc-
tural equation modelling, using partial least squares path analysis (SmartPLS
software version 3.0), was performed to test the hypothesised model. Participants
in the study were requested to answer three main questionnaires: Hofstede’s cul-
tural dimensions questionnaire, structural employee empowerment questionnaire,
and participation of autonomous maintenance questionnaire. The authors included
multiple items for each construct in addition to a seven Likert scale by deploying
declarative statements along with a list of response categories. These statements
were rated on a Likert-scale with the range being from 1 (which means strongly
disagree) to 7 (which means strongly agree). Participation of autonomous mainte-
nance construct was measured using 3 items, each adapted from previous studies
[6 and 33]. Hofstede’s cultural dimensions construct was measured using 17 items
adapted from Sadeghi et al. [31]. Employee empowerment construct was meas-
ured using 20 items, each adapted from previous studies [33, 34, and 35]. In order
to measure this construct, the authors used Kanter’s theory [19] for structural em-
ployee empowerment. This construct is made of 20 statements measuring five
types of empowerments: senior management commitment (4 items), management
style and empowerment (4 items), communication and coordination (4 items), re-
wards and motivation (3 items), and knowledge sharing (5 items). Furthermore, in
this study, modifications followed an articulate process to check the grammar,
spelling of statements and the content validity through the feedback of consultees,
which included an academic professional as well as an experienced professional

155
practitioner who was experienced in the power industry. Based on their sugges-
tions, a few grammatical and structural modifications were made to some of the
statements.
3.2 Analytical Methods
This research used statistical techniques to undertake the analysis of data sourced
from the questionnaires in order to interpret and analyse the research’s results.
Statistical and numerical analysis was undertaken through SmartPLS (version
3.2.4) software that employs the concept of partial least squares-structural equa-
tion modelling (PLS-SEM) was utilised for examining the relationship between
independent variables (signified by organisation culture factors) and the sole de-
pendent variable (participation of autonomous maintenance in power plants). This
analysis is based on a correlational design, employing a structural equation model-
ing (SEM) approach. SEM refers to second-generation multivariate data analysis
method and it has gained popularity in engineering management researches owing
to its ability to theoretically test linear as well as additive causal model. PLS-SEM
is mainly utilised to develop theories in the context of an exploratory research
with an emphasis on explaining the variance (R square) in dependent variables
whilst examining the model. PLS-SEM also handles all data types, ranging from
nonmetric to metric by making minimal assumptions about the data characteristics
[37]. Furthermore, PLS-SEM has high flexibility compared to the multiple regres-
sion (older method) and it primarily focuses on variances explanation (instead of
covariances), thus implying that it entails prediction-oriented approach [38]. It has
also the capability of examining the complex relationship with multiple independ-
ent and dependent variables.
In this study, the authors considered PLS-SEM due to exploratory nature of the
present study [37]. Also they used this approach to test new theory since there is
no literature that examines the casual relationship between cultural dimensions,
structural employee empowerment and participation of autonomous maintenance
in the power industry. The second reason for considering PLS-SEM is focus on
prediction [40]. Furthermore, the authors adopted a two-step approach related to
PLS-SEM, based on the findings of Anderson and Gerbing [39]. The first step is
an evaluation of measurement model that is used to check the reliability and valid-
ity of research constructs and measuring instruments within the research model.
The second step is an evaluation of structural model that is utilised to examine
path coefficients (hypotheses) between the model’s constructs thereby highlight-
ing the path significance of the research model. This research used the SmartPLS
3.0 software to perform the analysis using the bootstrapping technique (with 1000
sub-samples) [31]. This bootstrapping technique is also used to enhance the meas-
urement and structural research’s model.

156
4.0 Results and Analysis
The authors analysed the research model into two stages. In the first part, the
measurement model is studied in order to determine the reliability (internal con-
sistency) and validity (discriminant validity) of the constructs and research in-
struments. In the second stage, the structural model is analysed in order to test the
hypotheses of the research model.
4.1 Results of Measurement Model
Firstly, the measurement model was assessed in order to underpin and meet the
convergent validity. This was examined through the average variance extracted
(AVE), composite reliability (CR), and factor loadings [40]. In concurrence with
Hair et al. [40] the Composite Reliability (CR) was used to measure the con-
structs’ internal consistency. A threshold criterion of 0.70 has been reported for
CR [38] and in this study all the included latent variables were found to exceed
this threshold criterion. In addition, the assessment of both the parameters of Fac-
tor Loadings, and Average Variance Extracted (AVE) were used to assess the con-
structs’ convergent validity. It has been reported by Hair et al. that for social sci-
ence studies the acceptable factor loadings are between 0.6-0.7 [40]. Similarly, an
adequate convergent validity is suggested for cases with AVE value above 0.5 [37,
38, 40]. In this study all the involved latent variables demonstrated AVEs and fac-
tor loadings, which were above the recommended levels. Correspondingly, for all
the constructs, the results of CR, Cronbach’s alpha, and AVE as well as the factor
loadings are presented in Table 1.
Table 1 Assessment of Factor Loadings, Cronbach’s Alpha, CR, and AVE
Constructs Items Factor
Loadings
Cronbach's
Alpha
Composite
Reliability
Average
Variance
Extracted
(AVE)
Power Distance
PD1 0.77
0.87 0.90 0.65
PD2 0.82
PD3 0.85
PD4 0.79
PD5 0.81
Uncertainty
Avoidance
UA1 0.66
0.82 0.86 0.55
UA2 0.80
UA3 0.81
UA4 0.69
UA5 0.74
Collectivism
HC1 0.74
0.71 0.82 0.60 HC2 0.76
HC3 0.83
Masculinity MAS1 0.64 0.76 0.84 0.58

157
MAS2 0.86
MAS3 0.86
MAS4 0.64
Senior Man-
agement Com-
mitment
SMC1 0.72
0.70 0.83 0.55 SMC2 0.74
SMC3 0.74
SMC4 0.78
Management
Style and Em-
powerment
MSE1 0.76
0.70 0.84 0.58 MSE2 0.74
MSE3 0.80
MSE4 0.73
Communication
and Coordina-
tion
CC1 0.80
0.75 0.83 0.56 CC2 0.72
CC3 0.82
CC4 0.63
Rewards and
Motivation
RM1 0.77
0.72 0.82 0.60 RM2 0.78
RM3 0.70
Knowledge
Sharing
KS1 0.82
0.80 0.88 0.63
KS2 0.84
KS3 0.74
KS4 0.80
KS5 0.83
Participation of
Autonomous
Maintenance
PAM1 0.88
0.81 0.89 0.73 PAM2 0.83
PAM3 0.84
Forner-Lacker criterion was used to assess the discriminant validity as suggested
by Hair et al. [40]. According to this criterion each latent variables’ square root of
AVE is supposed to be more than its correlation with other latent variable. The au-
thors in the current paper, as such, inferred a higher correlation with other latent
variable of each latent variables’ square root of AVE with the application of this
approach. The correlation matrix and square root of AVE is presented in Table 2.
Table 2 Correlation Matrix and Square Root of AVE (Fornell-Larcker Criterion)
The values on the matrix diameter show the correlation for the square root of AVE
* p < 0.01; ** p < 0.05
VARIABLE 1 2 3 4 5 6 7 8 9 10
1. PD 0.81
2. UA 0.68** 0.74
3. HC 0.39** 0.41** 0.77
4. MAS 0.24** 0.25** 0.39** 0.76
5. SMC -0.35** -0.26** 0.28** -0.23** 0.74
6. MSE -0.30** -0.15* 0.31** -0.29** 0.57** 0.76
7. CC -0.16* -0.18* 0.28** -0.27** 0.47** 0.54** 0.75
8. RM -0.14 -0.12 0.18* -0.22** 0.37** 0.44** 0.51** 0.77
9. KS -0.12 -0.09 0.13 -0.20** 0.31** 0.37** 0.41** 0.48** 0.79
10. PAM -0.10 -0.04 0.07 -0.17* 0.30** 0.33** 0.35** 0.43** 0.38** 0.85

158
4.2 Results of Structural Model
The relative importance is highlighted through the significance of each indicator’s
weight. Also through boot-strapping process, one can examine the absolute im-
portance, which is represented by the loading. The bootstrapping procedure needs
at least equivalent cases as original samples’ observation [40]. In the current
study, the boot-strap technique with 1000 sub-samples was utilised to estimate T
statistic and hence indicate the path coefficients’ significance [38]. Furthermore,
for the determination of each predictor variable’s share in deriving an explanation
of the variable variance the criteria of path coefficients are applied as per Hair et
al. [40]. Also, using predictor variables the explained variance of criterion variable
is indicated by the R2 amount [38]. The authors in this study were used SmartPLS
3 software for modeling and examining the significance of indicators’ weights and
relevance. The tested model is illustrated in Figure 2.
Figure 2 Tested Model of the Research (* p < 0.01; ** p < 0.001)
As Figure 2 specifies, the impact of employee empowerment on participation of
autonomous maintenance in the power industry is positive and significant at 0.001
(0.47). The impact of power distance (-0.24) and masculinity (-0.22) on employee
empowerment is negative and significant at 0.01. However, the impact of collec-
tivism (0.18) on employee empowerment is positive and significant at 0.01. On
the other hand, the impact of uncertainty avoidance on structural empowerment
was not statistically significant. Furthermore, employee empowerment explains
25% of changes in participation of autonomous maintenance; and cultural dimen-

159
sions in general explain 22% of changes in employee empowerment. Table 3
shows the results of testing the research hypotheses. According to the Table 3, hy-
potheses 1, 2, 3, and 4 are supported but hypothesis 5 is rejected.
Table 3 Testing of Research Hypotheses
5.0 Discussion and Conclusion
The aim of this study is to examine in-depth the impact of organisation culture on
the participation of autonomous maintenance within power plants based on the
context of Kanter's structural empowerment framework and cultural dimensions of
Hofstede’s model. To achieve this purpose, the study proposed a conceptual mod-
el, which was underpinned by a cohesive theory and practice review and further
structural equation modelling was used on it for a thorough examination. Accord-
ing to study results, in autonomous maintenance participation 25% of the changes
were attributed to ensuring employee empowerment. Moreover, in employee em-
powerment with the use of Hofstede’s cultural dimension 22% of the changes
were predicted. In addition, it was inferred that employee empowerment had a di-
rect effect on participation of autonomous maintenance, which in turn, signified
that empowerment is achieved through: senior management support, association
with maintenance team, inter-departmental communication and coordination, re-
wards and motivation, information sharing and analysing. This furthermore affects
positive organisational behaviour with high self-esteem. In addition, employees as
regards their day-to-day equipment operation presented higher inclination towards
developing a sense of ownership. Herein, for the assurance of TPM success an
ownership towards this equipment constitutes a crucial factor. This can be at-
tributed to individual attention and focus of every operator to maintain the equip-
ment through cleaning, tightening, and lubrication in order to keep equipment in
good condition and hence achieve the target of as good as new condition. These
study inferences are in alignment with the proposed research’s theoretical model,
which envisages the significant positive effect of meeting employee empowerment
on autonomous maintenance participation in the power industry. Another impera-
Hypothesis Path Coeffi-
cient
T
Value Significance Result
Employee Empowerment >> Participa-
tion of Autonomous Maintenance 0.47 8.20 0.001 Supported
Power Distance >> Employee Empower-
ment -0.24 -3.14 0.01 Supported
Collectivism >> Employee Empowerment 0.18 2.88 0.01 Supported
Masculinity >> Employee Empowerment -0.22 -3.02 0.01 Supported
Uncertainty >> Employee Empowerment -0.10 -1.08 - Not
Supported

160
tive study finding reveals that power distance negatively impacts employee em-
powerment. These findings demonstrate the resultant effect of forced compliance
to supervisors’ directives, authorities taking technical decisions and authorities’
perception of restraint on operators for expression of their maintenance issues
views. It was found that under these conditions, operators will get less opportunity
for growth and they are challenged with limited materials and resources in order to
contribute within maintenance activities, limited sharing and analysing of power
plants’ failure data with the lack of support in form of superiors, peers and subor-
dinate oriented feedback and guidance. This observation can be attributed to the
restriction and limitation of freedom of action amongst personnel. As a matter of
fact, power companies having higher power distance levels provide limited oppor-
tunities to their operators for demonstrating their freedom of action, initiation, and
competence. In addition, Ramayah et al. [41] state that with concerns of avoiding
damage to expensive equipment, managers in some organisations do not trust on
the operators’ capability and restrict operators from engaging in machine adjust-
ments and repairs. This has been evident in organisations not prepared or inclined
towards TPM programme implementation. Moreover, a decrease in trust, confi-
dence, and sense of ownership is seen in power plants, which have hierarchical
systems, in combination with managers/supervisors having more power in power
utilities. This can be explained by the fact that subordinated relationships lead to
more power and associated increase in control, which further deteriorate relation-
ships between members. This finding is in line with Kanter's theory “structural
empowerment framework” that highlights the negative effect of a controlling envi-
ronment on employee empowerment [19]. The study also significantly highlights
that employee empowerment is negatively impacted by masculinity/femininity.
Progress and competition are over-emphasised with the external motivation pro-
moted through higher masculinity levels in power utilities. According to Sadeghi
et al. [31], external motivation is directly related to restrictions in the environment
that impacts employee empowerment negatively [19]. Conversely, it is observed
that power companies demonstrating lower masculinity levels offer increased op-
portunities towards employee empowerment. This is attributed to supportive and
friendly peer relationships. Also, higher autonomy and augmented sense of owner-
ship in power companies is evidenced amongst operators who support each other
as per Nasurdin et al. [42].
On the other hand, the study significantly highlighted that employee empower-
ment is positively impacted by collectivism. It is inferred that employees in power
utilities with higher levels of collectivism have: high loyalty for organisations to
achieve their goals, high sense of interdependence, and joint responsibility to sys-
tems. This kind of loyalty results in patterns of cooperation between groups and
increasing the work productivity. Moreover, high collectivism fosters more infor-
mal coordination and communication mechanisms between operators and mainte-
nance staff [43]. According to Kirkman and Shapiro [44], collectivism leads to
team empowerment and hence improves work performance through reducing re-
sistance to team participation. Mad Lazim and Ramayah [6] highlighted that
communication and coordination between operators and other departments is the
161
critical success factor that may empower autonomous maintenance participation
positively.
The current study takes into consideration the correlation matrix, which highlights
a negative relationship of Hofstede’s cultural dimensions (excluding collectivism
dimension) with employee empowerment. This is manifested through senior man-
agement commitment, management style and empowerment, communication and
coordination, rewards and motivation, and knowledge sharing. This means that the
higher the ambiguity avoidance, power distance and masculinity in power organi-
sations, the less the staff will feel autonomous and skilled. Furthermore, power or-
ganisations with high profiles for power distance, ambiguity avoidance, and mas-
culinity have the distinctive characteristic of limiting individual freedom of action,
which in turn affects operator’s autonomy adversely. In addition, the efficacy feel-
ing is negatively impacted in such organisations due to the power gap between
members. The use of initiative also prevents high ambiguity avoidance rates. This
is primarily observed in power organisations displaying an adherence to traditional
characteristics that impact competence and efficacy of members negatively. Oper-
ator competence similarly is adversely influenced from gaps in focus on innova-
tive activities by individuals, as well as the emphasis on collectivism. Likewise, in
masculine societies efficacy feelings can be negatively affected with competition
overemphasis resulting in increased pressure on operators’ participation within
maintenance activities.
According to Hofstede [22] in organisations, change is often resisted due to the
cultural values that represent organisation most stable aspects. Also, resistance to
change is further augmented due to individual organisational values presented as a
subculture in the form of social values. Hofstede also defines the improbability of
organisations undergoing direct change in their values as these are in fact, a sem-
blance of a hidden mental software that regulates the behaviour of members. Cor-
respondingly, at a power utility the organisational culture displaying a controlling
characteristic and employee empowerment confinement will encounter a challenge
in changing such values and regulating the environment’s controlling power. Ac-
cording to Hofstede [22] a change in explicit behaviours is the ideal mechanism to
affect a change in values. For example, introducing changes in rules and regula-
tions of power companies, with the purpose of impacting a reduction in the envi-
ronment’s controlling power. Such changes, moreover can lead to provision of in-
creased initiation and freedom of action to operators, self-esteem promotion in
operators’ maintenance participation and also active decision-making as regards
maintenance activities. It also validates: (i) system regulations and control; (ii)
augmented cooperation within operators; (iii) emphasised freedom of action; (iv)
initiative use; and (v) de-emphasis of progress and competition. Notably, in the
Abu Dhabi power sector, the centralisation system imposes a reduction in manag-
ers’ extent of power and assets performance planners. Within the company TPM
ideally should be directed and managed by full-time employees with qualities of
expertise and enthusiasm according to Park and Han [26]. These coordinators
should be equipped to implement TPM methodology with adequate educational

162
qualifications, motivational and persevering temperament, and necessary skills for
seamless change process management.
Findings from this study reveal an inversely proportional relationship between
power distance and masculinity in an organisation with fulfilment experience of
organisation members as regards basic employee empowerment. This will lead to
a lower level of operators participation within maintenance activities, which can
be a serious threat to the success of implementing a TPM programme within pow-
er industry. These findings thus recommend an inculcation of cooperativeness and
support amongst members in the power sector by managers and authorities to
drive progress and competitiveness with a singular focus on individual needs.
Moreover, rather than focusing on the end products of action, it is recommended
to encourage members to address the process. With this process oriented focus,
members experience a higher internal motivation with satisfactory workplace.
Thus, it is recommended that in organisations to lower the power distance the or-
ganisations should adopt moderate hierarchical structure, motivate direct work as-
sociations between managers and their staff members. Also, concurrently bureau-
cracy should be avoided. Moreover, transparent, real-time and sharing of relevant
information has been observed to be critical to employee empowerment, as such
information sharing is directly proportional to organisational performance. The
main deterrents to information sharing are lack of trust and power distance. Thus,
organisations should encourage staff and managers to foster workplace relation-
ships which are control-free, direct and more friendly. For employee empower-
ment support, a two-way communication which is well-structured and developed
is crucial. Improved involvement and commitment results in frequent and open
communication. This communication can be achieved via formal and/or informal
modes and the following personnel should be included in this communication at a
power utility: employees, supervisors, shop floor executives, engineers and man-
agers. Such open communication stimulates an augmented understanding of the
motives underpinning TPM implementation. Furthermore, operators within
maintenance activities participation can be propelled with adoption of various
mechanisms of employee empowerment like: rewards and incentive, recognition
of the efforts, training for skill improvement, promotion of knowledge and cross
functionality. Thus, it can be inferred that empowering operators constitutes a sig-
nificant criteria in successful implementation of a TPM strategy and their empow-
erment is necessary to foster a high sense of power plant ownership.
References
[1] Willmott, P., and McCarthy, D., 2001. TPM: a route to world class perfor-
mance. Butterworth-Heinemann, Oxford.
[2] Ginder, A., Robinson, A., and Robinson, C.J., 1995. Implementing TPM: the
North American experience. Productivity Press, Portland.

163
[3] Aljanabi, Darkam., Birkett, Martin., and Connor, Chris., 2016. Investigating
the need of Total Productive Maintenance (TPM) Framework Development
for Deployment within the Iraqi Power Generation Industry. Journal of
Maintenance Engineering. 1 (2016), pp. 437-446.
[4] Wai Foon, S., and Terziovski, M., 2014. The impact of operations and mainte-
nance practices on power plant performance. Journal of Manufacturing
Technology Management, 25 (2014), pp. 1148-1173.
[5] Reiman, T., and Oedewald, P., 2004. Measuring maintenance culture and
maintenance core task with CULTURE-questionnaire–a case study in the
power industry. Safety Science. 42 (2004), pp. 859-889.
[6] Mad Lazim, H., and Ramayah, T., 2010. Maintenance strategy in Malaysian
manufacturing companies: a total productive maintenance (TPM) approach.
Business Strategy Series, 11 (2010), pp. 387-396.
[7] Nasurdin, A.M., Jantan, M., Peng, W.W., and Ramayah, T., 2005. Influence
of Employee Involvement in Total Productive Maintenance Practices on Job
Characteristics: The Malaysian Scenario. Gadjah Mada International Journal
of Business. 7 (2005), pp. 287-300.
[8] Al-Hassan, K., Chan, J.F., and Metcalfe, A.V., 2000. The role of total pro-
ductive maintenance in business excellence. Total Quality Management. 11
(2000), pp. 596-601.
[9] Nakajima, S., 1988. Introduction to TPM. Productivity Press, Cambridge.
[10] Ben-Daya, M., 2000. You may need RCM to enhance TPM implementation.
Journal of Quality in Maintenance Engineering. 6 (2000), pp. 82-85.
[11] Labib, A.W., 1999. A frame work for benchmarking appropriate productive
maintenance. Management Decision. 37 (1999), pp 792-799.
[12] Lee Cooke, F., 2000. Implementing TPM in plant maintenance: some organi-
sational barriers. International Journal of Quality and Reliability Manage-
ment. 17 (2000), pp. 1003-1016.
[13] Ahuja I.P.S., and Khamba, J.S., 2008. Strategies and success factors for over-
coming challenges in TPM implementation in Indian manufacturing industry.
Journal of Quality in Maintenance Engineering. 14 (2008), pp. 123-147.
[14] Waeyenbergh, G., and Pintelon, L., 2002. A framework for maintenance con-
cept development. International Journal of Production Economics. 77 (2002),
pp. 299-313.
[15] Korkut, D.S., Cakicier, N., Erdinler, E.S., Ulay, G., and Dogan, A.M., 2009.
5S activities and its application at a sample company. African Journal of Bio-
technology. 8 (2009), pp 1720 - 1728.
[16] Gupta, S., and Jain, S.K., 2015. An application of 5S concept to organize the
workplace at a scientific instruments manufacturing company. International
Journal of Lean Six Sigma. 6 (2015), pp73-88.
[17] Prickett, P.W., 1999. An integrated approach to autonomous maintenance
management. Integrated Manufacturing Systems. 10 (1999), pp. 233-243.
[18] Orgambídez-Ramos, A., and Borrego-Alés, Y., 2014. Empowering Employ-
ees: Structural Empowerment as Antecedent of Job Satisfaction in University
Settings. Psychological Thought. 7 (2014), pp. 28-36.

164
[19] Kanter, R.M., 1993. Men and women of the Corporation. Basic Books, New
York, 2nd
Edition.
[20] Al-Ali, J., 2008. Emiratisation: drawing UAE nationals into their surging
economy, International Journal of Sociology and Social Policy. 28 (2008),
pp. 365-379.
[21] Al-Khalifa, K.N., and Aspinwall, E.M., 2001. Using the competing values
framework to investigate the culture of Qatar industries. Total Quality Man-
agement, 12 (2001), pp. 417-428.
[22] Hofstede, G., 2003. Culture's Consequences: Comparing Values, Behaviors,
Institutions and Organisations Across Nations. Sage Publications, Thousand
Oaks.
[23] Mad Lazim, H., Ramayah, T., and Ahmad, N., 2008. Total productive
maintenance and performance: a Malaysian SME experience. International
review of business research papers, 4 (2008), pp. 237-250.
[24] Hooi, L.W., and Leong, T.Y., 2017. Total productive maintenance and manu-
facturing performance improvement. Journal of Quality in Maintenance En-
gineering. 23 (2017), pp. 2-21.
[25] Rolfsen, M., and Langeland, C., 2012. Successful maintenance practice
through team autonomy. Employee Relations. 34 (2012), pp. 306-321.
[26] Park, K.S., and Han, S.W., 2001.Total Productive Maintenance: Impact on
competitiveness and a framework for successful implementation. Human
Factors and Ergonomics in Manufacturing. 11 (2001), pp. 321-338.
[27] Poduval, P.S., Pramod, V.R., and V. P, J.R., 2015. Interpretive Structural
Modeling (ISM) and its application in analyzing factors inhibiting implemen-
tation of Total Productive Maintenance (TPM). International Journal of
Quality & Reliability Management. 32 (2015), pp. 308-331.
[28] Leflar, J.A., 2001. Practical TPM: successful equipment management at Ag-
ilent Technologies. Productivity Press, Portland.
[29] Refaiy, M., and Labib, A., 2009. The effect of applying tacit knowledge on
maintenance performance: an empirical study of the energy sector in the UK
and Arab countries. Knowledge Management Research and Practice. 7
(2009), pp. 277-288.
[30] Srite, M.D., 2000. The influence of national culture on the acceptance and use
of information technologies: An empirical study. Doctoral Dissertation Pub-
lishing. Florida State University.
[31] Sadeghi, K., Amani, J. & Mahmudi, H., 2013. A Structural Model of the Im-
pact of Organisational Culture on Job Satisfaction Among Secondary School
Teachers. The Asia-Pacific Education Researcher. 22 (2013), pp. 687-700.
[32] Deci, E.L., and Ryan, R.M., 2000. The "What" and "Why" of Goal Pursuits:
Human Needs and the Self-Determination of Behavior. Psychological In-
quiry. 11 (2000), pp. 227-268.
[33] Wai Foon, S., and Terziovski, M., 2014. The impact of operations and
maintenance practices on power plant performance. Journal of Manufactur-
ing Technology Management, 25 (2014), pp. 1148-1173.
[34] Irwin, A., Taylor, S., Laugerud, E., and Roberts, D., 2016. Investigating Non-
Technical Skills in Scottish and English Aircraft Maintenance Teams Using
165
a Mixed Methodology of Interviews and a Questionnaire. The International
Journal of Aviation Psychology. 26 (2016), pp. 105.
[35] Tsai, Y., 2011. Relationship between organisational culture, leadership be-
havior and job satisfaction. BMC health services research. 11 (2011), pp. 98.
[36] Nunnally, J., 1978. Psychometric Theory. McGraw-Hill, New York, 2nd Edi-
tion.
[37] Richter, N.F., Sinkovics, R.R., Ringle, C.M., and Schlägel, C., 2016. A criti-
cal look at the use of SEM in international business research. International
Marketing Review. 33 (2016), pp. 376-404.
[38] Ali, F., Rasoolimanesh, S.M., Sarstedt, M., Ringle, C.M., and Ryu Kisang.,
2018. An assessment of the use of partial least squares structural equation
modeling (PLS-SEM) in hospitality research. International Journal of Con-
temporary Hospitality Management. 30 (2018), pp. 514-538.
[39] Anderson, J.C., and Gerbing, D.W., 1988. Structural equation modeling in
practice: A review and recommended two-step approach. Psychological Bul-
letin. 103 (1988), pp. 411-423.
[40] Hair, J.F., Hult, G.T.M., Ringle, C.M., and Sarstedt, M., 2017. A Primer on
Partial Least Squares Structural Equation Modeling (PLS-SEM). SAGE, Los
Angeles, 2nd Edition.
[41] Ramayah, T., Jantan, M., and Hassan, M.M., 2002. Change management and
implementation of Total Productive Maintenance: An exploratory study of
Malaysian manufacturing companies. Utara Management Review. 3 (2002),
pp.1-17.
[42] Nasurdin, A.M., Jantan, M., Peng, W.W., and Ramayah, T., 2005. Influence
of employee involvement in total productive maintenance practices on job
characteristics: The Malaysian scenario. Gadjah Mada International Journal
of Business. 7 (2005), pp.287-300.
[43] Noordin, F., and Jusoff, K., 2010. Individualism-collectivism and job satis-
faction between Malaysia and Australia. International Journal of Educational
Management, 24 (2010), pp. 159-174.
[44] Kirkman, B.L., and Shapiro, D.L., 2001. The Impact of Team Members’ Cul-
tural Values on Productivity, Cooperation, and Empowerment in Self-
Managing Work Teams. Journal of Cross-Cultural Psychology, 32 (2001),
pp. 597-617.

166
Authors’ Biography
Abdulla Y. Alseiari
Eng. Abdulla Alseiari received his B.Sc. degree in Elec-
trical Engineering (Networks and Communications Engi-
neering) from Al Ain University of Science and Technol-
ogy at United Arab Emirates and his MSc. in Maintenance
Management from Glasgow Caledonian University at
Scotland in the UK. He is currently pursuing his PhD de-
gree at University of Bolton in improving asset manage-
ment and development of maintenance strategies in the
Abu Dhabi power utilities. His current research is with Dr.
Peter Farrell investigating the critical factors that affecting
the successful implementation of TPM strategy in the
Middle-East power industry. Eng. Alseiari is working at
Department of Energy-Abu Dhabi. He has more than 12
years experience in operation and maintenance manage-
ment for power distribution networks.
Peter Farrell
Dr Peter Farrell has sixteen years’ industry experience
and over twenty-five years in higher education. He is a
Reader at the University of Bolton, and has over ninety
publications, including four textbooks. His early industry
work was as a quantity surveyor; then as contractor’s site
manager, responsible for multi-million pound new-build
construction projects. He has been an External Examiner
at seven institutions, including internationally, and is aca-
demic journal referee and book reviewer. Peter is a Fel-
low of both the Chartered Institute of Building (FCIOB)
and the Royal Institution of Chartered Surveyors (FRICS),
and formerly acted for three years as Chair of the CIOB
Greater Manchester Branch. His current work includes
leading the development of a new Asset Management de-
gree programme.

167
ME2018_1126
The Impact of Effective Model of Maintenance
Optimisation (Predicting Remaining Useful
Life) on Successful Participation of Autonomous
Maintenance in the Power Industry
Abdulla Y. Alseiari1, Peter Farrell
2
1Departement of Energy-Abu Dhabi, Najda Street, Al Markaziyah area, 6120, Abu Dhabi, United
Arab Emirates.
2School of Engineering. The University of Bolton, Deane Road, Bolton, BL3 5AB, UK.
Email: [email protected]; [email protected]
Abstract The power industry has recognised the impact of implementing Total
Productive Maintenance (TPM) as a maintenance strategy to enhance its proactive
techniques and improve power asset reliability. The needs and significance of
prognostic techniques (predictive maintenance strategy) within TPM implementa-
tion is well understood in many different industries. However, there has been al-
most no research applied in this area within Middle-East power plants. Intelligent
techniques within power plants are being used to integrate and interpret data from
multiple sensors to predict wear and life of equipment. Thus, successful power
utilities have sufficient failure data that predicts accurate times to failure of their
power assets, based on condition monitoring techniques. Power transformers are
the most expensive elements and their faults are particularly costly. Therefore, de-
tection of power transformer failures at an early stage is important to assure relia-
ble and efficient operation. The aim of this research is to investigate the critical
role of prognostic techniques based on maintenance optimisation models and how
they can drive successful participation of autonomous maintenance (operators) in
the maintenance activities through a planned maintenance pillar. The research pre-
sents an innovate technique that enables operators to detect and diagnose early
faults in power transformers based on paper degradation analysis. This method us-
es measurements obtained from the Abu Dhabi power distribution network of the
degradation factor of power transformer paper insulation (degree of polymerisa-
tion - DP values) over time, from condition monitoring data that is obtained
through dissolved-gas analysis (DGA). The mathematical exponential model uses
degradation measurements DP values of paper insulation for multiple power trans-
formers to extrapolate these measurements over time, and hence predicts potential
failure times before they occur. This is based on a prognostic technique that utilis-
es ReliaSoft's Weibull++ software. The results of this research show that success-
ful implementation of TPM in the power industry can be achieved through appro-

168
priate techniques of predictive maintenance within the planned maintenance pillar
of TPM, thus increasing availability, performance, quality and reliability rates by
preventing sudden failure of power transformers. The major result achieved in this
study is the development of a conceptual framework that integrates a maintenance
optimisation model (predicting remaining useful life) with autonomous mainte-
nance participation, for early fault detection of paper insulation of power trans-
formers.
Key words Total Productive Maintenance (TPM); Participation of Autonomous
Maintenance; Condition Monitoring (CM); Predictive Maintenance (PdM); Dis-
solved-Gas Analysis (DGA); Degradation Analysis; Remaining Useful Life
(RUL)
1.0 Introduction
Maintenance has a significant impact on the business strategy of power
organisations. Maintenance of power plants aims to promote safe, cost effective,
and reliable electricity supplies. This kind of maintenance has complex activities
and requires highly skilled maintenance staff; therefore, proper utilisation of
technology is critical to achieve both plant safety and availability [1]. Power
companies have recognised the importance of implementing Total Productive
Maintenance (TPM) as a maintenance strategy to optimise their proactive
techniques and improve power asset reliability. Further, successful power utilities
need to have robust data management procedures such as computerised
maintenance management systems (CMMSs), that include sufficient failure data.
Otherwise, utilities cannot predict accurate times to failure of their power assets
through condition monitoring (CM) techniques. CM systems lead the power
industry to better maintenance management performance and higher reliability.
CM can monitor the critical parts of power plants such as transformers, and
determine the optimal period for particular maintenance [2]. Preventive
maintenance involves the systematic scheduling of inspection, detection, and
prevention of incipient faults before they occur as major or actual failures.
Predictive maintenance (PdM) is a distinctive type of preventive maintenance that
can be performed at intervals or continuously, based on the requirements to
diagnose the condition of equipment. PdM plays an essential role to generate
improvement in safety, availability, performance, quality of equipment and
reduced maintenance costs. Implementation of PdM becomes significant where
security of power plants is critical. Thus, it has been utilised as a strategic
decision-making technique that consists of predictive tools as well cost-effective
methods (e.g. dissolved-gas analysis, vibration monitoring, and thermography) to
obtain real time data and hence measure the physical condition of equipment
during its operation. According to this, all activities of maintenance are organised
and scheduled, based on priority and criticality analysis of equipment [3]. The aim

169
of this paper is to investigate the critical role of prognostic techniques based on
maintenance optimisation models and determine how they can drive successful
participation of autonomous maintenance (operators) in the maintenance activities
through a planned maintenance pillar. With high demands on quality, productivity,
and availability, power plants become more complex and costly. Developing a
maintenance programme is not an easy process, and it faces many obstacles during
its implementation; it often lacks a systematic and reliable methodology. The
authors intend to integrate the participation of autonomous maintenance with
using optimisation a mathematical model that employs the concept of planned
maintenance pillar on critical power plant; e.g. power transformers in order to
drive successful implementation of TPM within power industry. The finding in
this paper is that there is a need to apply effective prognostic techniques to drive
successful implementation of TPM in the power industry, through enabling
autonomous maintenance (operators) to carry out planned maintenance pillar
effectively.
2.0 Literature Review
In this section, there is a review of the literature pertaining to TPM, followed by a
review of literature on multiple concepts that may influence the integration of
TPM strategies, particularly autonomous maintenance within the application of
maintenance optimisation models in the power industry.
2.1 Total Productive Maintenance (TPM)
TPM is an innovative maintenance strategy employed to increase overall
equipment effectiveness by establishing an inclusive productive maintenance
scheme covering the entire life-cycle of equipment [4]. It brings operators and
maintenance staff together through creating a combination of good working
procedures with high standards, team working, and focused improvement, thus
increasing the effectiveness of processes and equipment [5] – [6]. It was
introduced in Japan 1971 by Nakajima [4] who was the chairman of the Japanese
Institute of Plant Maintenance (JIPM) and is extensively adopted in manufacturing
sectors today. TPM aims to achieve zero equipment failures, zero accidents, and
zero defects in order to have high availability, performance, and quality. The
principle TPM practices are named the pillars of TPM, specifically: planned
maintenance; focused improvement; autonomous maintenance; development
management; office TPM; education and training; quality maintenance; and safety,
health and environment. An explanation about TPM process can be found in
Nakajima [4] - Reiman and Oedewald [1]. Operators and maintenance staff need
to have high levels of knowledge, be able to share each other’s job and sometimes

170
develop new skills to achieve the TPM philosophy [6]. Its implementation is not
easy and faces many obstacles; details about its barriers are articulated by Ahuja
and Khamba [7]. Waeyenbergh and Pintelon [8] argued that TPM does not reflect
a maintenance concept because it has no clear maintenance rules and policies to
decide which simple maintenance policy will be utilised. Thus, building a robust
planned maintenance pillar in the power industry needs to be investigated to
promote TPM implementation through predictive maintenance tools. Introducing
the TPM methodology in power industry is considered a major challenge due to
cultural issues [1]. One of the most critical barriers of TPM implementation is
participation of autonomous maintenance [6] that may affect also successful
implementation of this maintenance strategy within power industry. According to
Nakajima [4] successful participation of autonomous maintenance needs expert
operators who have wider technical knowledge about their equipment and hence
they can carry out the light maintenance activities such as inspection and condition
monitoring techniques besides operating machines. On the other hand, planned
maintenance is one of the eight pillars of TPM programme [7] and its effective
utilisation by operators may drive impact on optimising the industrial assets
through detecting the potential failures signs and hence preventing the catastrophic
failures. Planned maintenance pillar aims to achieve zero breakdowns through
preventing unpredicted failures and equipment deterioration. It involves activities
related to predictive maintenance in order to predict equipment lifespan [4].
2.2 Predictive Maintenance (PdM)
Predictive maintenance techniques have become the foundation for most modern
maintenance methods. Predictive maintenance programs involve different methods
of problem diagnosis in order to predict equipment faults before they occur. This
diagnosis involves several types of equipment testing to deliver results that can be
compared with standard results, and based on results, correct maintenance action
can be taken [9]. Condition monitoring techniques are: vibration analysis, acoustic
analysis, thermography-infra-red radiation, oil analysis and human senses among
others. Further, the Dissolved-Gas Analysis (DGA) technique examines the oil and
its chemical composition in order to predict failure modes. The results of this test
will determine the following: high content of silicon thus indicating contamination
of grit; and high levels of iron indicating a wearing of components, and iron or
aluminium presence indicating worn piston rings. Right fault classification is
significant in power transformers to minimise power quality (PQ) disturbances.
Partial discharge (PD), corona, arcing and thermal heating cause PQ disturbances
and hence may lead to catastrophic failures (e.g. interruption of power supply,
damaged equipment, increase maintenance costs, and high safety risks to operators
and technicians). Gases generate when faults get dissolved in the oil of power
transformers. DGA is widely utilised by power utilities as an effective tool for
fault diagnosis of transformers. Since the late 1970s, DGA interpretation has used
standards such as IEC 60599, IEEE C57.104-1991, etc [10]. In addition, a number

171
of new methods have also been designed and have been described in the literature
- Ghoneim and Taha [11] – Li et al. [12] – Mansour [13].
2.3 Degradation Model in Reliability Analysis
Failures have different causes which can be categorized either as external or
internal. Internal failures happen due to internal system faults (e.g. ageing of
materials). External failures are caused by environmental conditions (e.g.
pollution, vibrations, and humidity). In general, failures can be divided into two
groups: degradation failures and sudden failures. Degradation failures can be
predicted by a single condition monitoring indicator or by several indicators.
Furthermore, the degradation process effects and reduces the reliability of assets.
Sudden failure cannot be predicted through condition monitoring techniques or the
measurement of asset age. Figure 1 shows how assets reach the degradation level
(failure threshold) and hence fail. Degradation has two types: natural degradation
and forced degradation. Natural degradation occurs due to age, or is time-
dependent. Forced degradation occurs due to external causes to the system (e.g.
due to high demand of power, the load of power transformers increases
significantly and reaches the failure threshold level and hence the transformer can
no longer safely take the load) [14].
Figure 1 Degradation Process. Source: [14]
2.4 Paper Degradation of Power Transformer
Power systems have many different elements; the power transformer is the most
expensive element and its faults can be very costly [11]. Power transformers are
responsible for power transmission and distribution. The main function of

172
transformers is to step-up or step-down voltage levels of substations. Negative
economic impacts in electrical networks are often caused by unplanned outage of
power transformers. It is important to determine any problems from an early stage,
before disastrous failure occurs. Accurate identification of problems supports
reliable power transformer operation. Alongside predictive and corrective
maintenance, preventive maintenance may be considered more important, and it
should be implemented to guarantee as far as possible the highest performance and
reliability of power transformers. Condition monitoring in electrical networks
provides useful data to maintenance staff to support activities such as: the
planning of operation and maintenance activities; assessments of condition of
equipment; predicting the remaining life of electrical assets, and discovering areas
of further development and improvement. Power transformers have two windings:
high voltage winding and low voltage winding, shown in Figure 2. The material
used in the insulation system of these copper windings is Kraft paper immersed in
mineral oil. The aging transformer under load can lead to oil and paper insulation
degrades. The result of this situation will lead to catastrophic failure in electrical
networks.
Figure 2 Failure of Paper Insulation of Power Transformer, Source [15]
The power transformer tank contains paper, and its function is to insulate the two
windings (high and low). This paper is made from a cellulosic material such as
wood pulp. Over a period of time, high temperatures, water, and oil acids could
potentially degrade the paper and hence the windings of the transformer could
eventually fail. This paper has polymer chains and glucose rings which are linked
together and repeated. Moreover, monomer is shaped from the repeating unit of
glucose and has an average number of glucose per chain; this is known as the
degree of polymerisation (DP). Figure 3 shows how the paper is produced from
long-chain molecules.

173
Figure 3 Cellulose Chain, Source [15]
The state of paper insulation is very strong (electrical and mechanical strength)
when the DP value of the power transformer is 1000 and above. On other hand,
when the DP value is around 200 or less, it reflects the weak condition of paper
insulation and the paper is unable to perform its required functions; therefore the
power transformer could fail within a short period of time. Furthermore, there are
many factors that can affect paper insulation age: high temperatures (pyrolysis),
moisture around the paper (hydrolysis), and acid and oxygen (oxidation) within
the transformer oil [15]. Over many decades, oil-paper insulation has been used
inside transformer tanks due to its good reliability and performance. However,
over a long period of operation, transformer paper could degrade as a result of
many factors (its ageing, rising energy consumption, electrical and thermal
stresses). These factors therefore could result in a reduction in the DP value as
well as a reduction in electrical and mechanical strength of power transformers
[16]. Paper insulation is therefore an important element in power transformers and
its DP value gives an indication of when there are problems within internal parts.
Condition monitoring of paper insulation, including its age (cellulose) helps to
predict the remaining useful life of power transformers, and also identifies
problems in their early stages, hence increasing transformer availability and
reliability. In this way, asset managers can make informed decisions when
authorising optimum asset replacements [17]. Figure 2 shows failure of paper
insulation of power transformer.
2.5 Maintenance Optimisation Model
Dekker [26] explained that condition monitoring techniques were used in the
1970's in order to predict potential failure utilising data on the actual condition of
equipment (e.g., vibration monitoring, oil analysis, debris analysis). Moreover,
Garg and Deshmukh [27] discussed the reliability concept established in the
1980's based on the RCM characteristics. Nowadays, many scholars are
developing various models of mathematical maintenance to predict the measures
of reliability and determine the optimal maintenance strategies and policies.
However, these different types of optimisation models may be only suitable for
capable maintenance engineers who can incorporating information about the

174
failure mechanisms, failure detection methods, maintenance strategy, and the
repair policies, etc. Therefore, those capable engineers can give reasonable
justification of assumptions and the applicability of using these models within
specific environments, which can deliver greater confidence in predictions or
estimates on the basis of production data.
Dekker [26] highlighted that the significant of successful application of
maintenance optimisation models on problems and challenges of maintenance. He
argued that maintenance an optimisation model can be used in several ways such
as it can be utilised with real data to generate advice to senior assets managers on
real problems. Also it can be used to overview real applications, or suggest
applications that present examples with real information/data. The last type of
model can be used as an expert system or decision support system. Further, there
are numerous industries and areas in which these models have been implemented;
popular industries are maintenance scheduling of power stations and road
maintenance, whereas popular areas are vehicle replacements, equipment, and
inspection optimisation. Furthermore, Garg and Deshmukh [27] discussed that
equipment with different conditions may have various failure patterns, therefore it
is not permanently possible to employ an optimisation model. Another challenge is
the constant entrance of new equipment that leads to records of historical data
being obsolete and hence affects replacement decisions. On the other hand, there
are problems encountered in implementing models of maintenance optimisation
mentioned in the previous case studies, concerning collection and analysis of data
as well as difficulty in interpreting results [26-27].
Furthermore, in order to ensure TPM implementation is a success, Lawrence [28]
states the significance of mathematical modeling in essential in introducing
cultural change. According to Ng et al. [29] the use of integer programming, linear
programming, and other methods and measurements (like mean time to repair
“MTTR”, mean time between failure “MTBF”, degradation data, and other
historical data) can optimise maintenance management processes and also define
how such optimisation models and tools might be utilised to support cultural
change by emphasizing the tangibility and objectivity of the TPM benefits to all
employees. Mathematical models serve as an additional boost to speed up the
implementation and success of TPM [28-29].
2.6 Prognostic Techniques for Predicting Remaining Useful Life
Prognostic is a predictive method that defines an asset’s remaining useful life
(RUL). It also estimates the time to failure and failure modes in the future. Failure
prognosis includes predicting asset degradation based on condition monitoring
techniques [18]. Figure 4 shows the fundamentals of prognostic techniques for
degradation failure.

175
Figure 4 Prognostic Process. Source: [18]
RUL has four main models that can be seen in Figure 5; each model has a sub-
model. Knowledge-based models assess the comparison between an observed
condition and a database (failure event) of previous events in order to assume the
life expectancy. It has two systems: expert and fuzzy systems. Life expectancy
models define the life of single equipment components as well as determining
expected risks from equipment deterioration. There are two models: stochastic
models (Aggregate reliability functions and Conditional probability methods) and
statistical models (Trend extrapolation, Auto-regressive moving average, and
Proportional hazards modelling). Artificial neural network models calculate
estimates for the remaining life of machines based on a mathematical
representations from observation data. It has two models: direct RUL prediction,
and estimation of parametrics for other models. Physical models calculate the
estimation output for the remaining life of machines based on a mathematical
representation of degradation processes [18].
Figure 5 Main model categories for prediction of remaining useful life,
Source: [18]
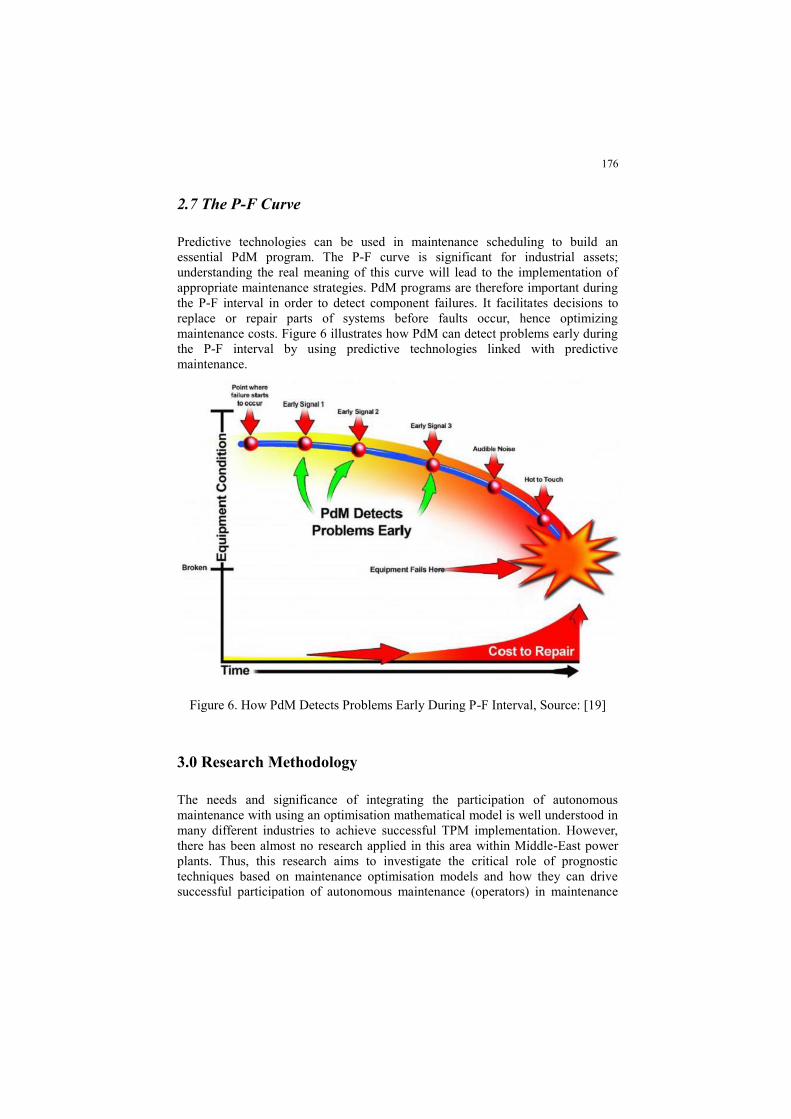
176
2.7 The P-F Curve
Predictive technologies can be used in maintenance scheduling to build an
essential PdM program. The P-F curve is significant for industrial assets;
understanding the real meaning of this curve will lead to the implementation of
appropriate maintenance strategies. PdM programs are therefore important during
the P-F interval in order to detect component failures. It facilitates decisions to
replace or repair parts of systems before faults occur, hence optimizing
maintenance costs. Figure 6 illustrates how PdM can detect problems early during
the P-F interval by using predictive technologies linked with predictive
maintenance.
Figure 6. How PdM Detects Problems Early During P-F Interval, Source: [19]
3.0 Research Methodology
The needs and significance of integrating the participation of autonomous
maintenance with using an optimisation mathematical model is well understood in
many different industries to achieve successful TPM implementation. However,
there has been almost no research applied in this area within Middle-East power
plants. Thus, this research aims to investigate the critical role of prognostic
techniques based on maintenance optimisation models and how they can drive
successful participation of autonomous maintenance (operators) in maintenance

177
activities, through planned maintenance pillar. A power organisation in Abu Dhabi
power industry was used as a case study to source data for the study to determine
the successful TPM implementation [20]. Historical data (degradation
measurements) from power transformers for five critical power distribution
substations was collated. Furthermore, this power organisation conducts dissolved
gas analysis (DGA) as an off-line condition monitoring technique to measure the
power transformer’s paper insulation by determining the degree of polymerisation
(DP) values. Inspection is conducted yearly to gather the DP values of paper
insulation. The paper is considered failed if the DP value is less than 200 (this is
equal to the “F” point in the P-F curve). Moreover, a warning paper degradation
level of 300 DP has been identified as a critical degradation. If the DP values less
than 300, this is considered to be a sign of potential failure (this is equal to the “P”
point in the P-F curve).
Power transformer paper degradation DP values were taken from condition
monitoring data for a five year period, to perform required simulation analysis of
prognostic techniques. The analysis required the application of ReliaSoft's
Weibull++ 9 software (degradation analysis) in order to estimate the potential
failure time of power transformers and hence select the correct maintenance policy
based on a TPM strategy. The following steps give a brief description about how
the paper degradation analysis was conducted through ReliaSoft's Weibull++ 9
software:
1. Select the degradation analysis from the main control panel tab of the
Weibull++9 software.
2. Extract the condition monitoring data of the paper insulation (DP values)
for these critical substations from 2006 until 2011.
3. Insert DP values of these critical power transformers in the Weibull++ 9
software (degradation analysis).
4. According to this failure mode (failure of paper insulation), select the
suitable degradation model (Exponential Distribution) from the main
control panel tab of the Weibull++9 software (degradation analysis).
5. Set the critical degradation to 300 in the main control panel tab of the
Weibull++9 software (degradation analysis).
6. Run the simulation in order to generate a plot of degradation versus time
that shows the warning limit (“P” point of P-F curve) and functional fail-
ure of paper insulation (“F” point of P-F curve).
After running the simulation, results will be generated to allow the P-F interval
values to be estimated. When P-F interval is predicted, and based on criticality
analysis, operators can allocate the right maintenance tasks. Before the simulation

178
analysis was applied it was essential to first evaluate the reliability and validity of
this instrument to confirm that the findings would be valid and reliable.
4.0 Results and Analysis
As illustrated in Figure 7, ReliaSoft's Weibull++ 9 software is shown the
prediction of warning limit (potential failure time in month) of power transformers
paper insulation for five critical substations at Abu Dhabi power orgainsation. This
warning limit is equal to the “P” point in the P-F curve and its prediction is based
on a prognostic technique (Statistical Trend Extrapolation). Further, these paper
insulations degrade over a long period of time due to poor maintenance practices,
and they reach functional failure when DP values are less than 200. In this
situation, the power transformers are replaced. Due to the power transformer
renewal process and constant failure rate of paper insulation, the exponential
distribution is adequate for this kind of failure mode (degradation of paper
insulation). Therefore, exponential distribution is selected here to model the
degradation data of paper insulation. After running the simulation, the Weibull++
9 generates the potential failure predication time (P point in month) of the paper
insulation for five critical power transformers at the Abu Dhabi power
organisation, and it can be seen in Table 1.
Figure 7 Estimating the P-F Interval of Power Transformer Paper Insulation at
Abu Dhabi Power Organisation.

179
After running the simulation, the Weibull++ 9 software generates the above
results, that can be seen in Figure 7which shows prediction potential failures time
(in months) of power transformer paper insulation for multiple units at Abu Dhabi
power organisation.
P-F interval values can be estimated based on the above results (prediction of
potential failures time “P” and functional failure time “F”). These results can be
used to calculate the P-F interval based on the below equation:
P-F interval = “F” values – “P” values (1)
“P” values = “F” values – P-F interval (2)
where, F is functional failure time and P is the potential failure time.
Table 1 Prediction Potential Failure Time of Power Transformer Paper Insulation
The authors calculated the P-F interval using equation (1). According to Table 2
the average P-F interval value for multiple units of power transformers is (12.07
Month) and the functional failure of most critical paper insulation for multiple
units of power transformer is (60 Month) which can be seen in the above Figure 7.
The authors calculated the potential failures time (using equation, 2) to be
detectable at (60-12.07 = 47.93 Month). This means that the power transformer
needs to be protected before its paper insulation reaches the functional failure
level (DP less than 200) at estimated potential failure time 47.93 Month.
Participation of operators in inspection activities as well as implementing
condition monitoring technique (DGA) on power transformers will lead to create
rich and accurate database through recoding historical degradation data. Also these
data can be analysed by operators regularly to detect any abnormality and hence

180
early actions can be taken by them to prevent unpredicted failures and paper
insulation deterioration. Moreover, maintenance costs (downtime, labours and
materials) will be optimised by predicting the potential failure of paper insulation.
Table 2 Estimating the Average P-F Interval of Power Transformer Paper Insula-
tion
5.0 Discussions
Successful electrical power companies have sufficient failure data that involves
accurate prediction of time to failure of power assets based on condition
monitoring data. These data can estimate the potential failure time of their assets
and hence select correct maintenance strategies. In this research, the authors
define that warning limits (critical degradation) need to be selected carefully
because if critical degradation is too high, it could cause failures to occur before
they are predicted [18]. Furthermore, the aim of the planned maintenance is to
enable both maintenance engineers and equipment operators to analyse the root
cause of system or equipment failures, and based on this analysis they can develop
a system of planned maintenance in order to modify or repair the equipment and
hence optimise maintainability of systems [4, 30]. Thus, the planned maintenance
pillar of TPM can play a significant role by utilising predictive maintenance tools
such as prognostic techniques and analysis through autonomous maintenance
(operators). However, they should have the right skills, training and capability to
use prognostic tools as well interpret historical data of power plants, and hence
establish proper maintenance tasks to overcome any technical problems in early
stages. Operator needs to understand the function, structure and inspection
methods for each part of equipment [21-22]. Moreover, the usage of advanced
technologies in order to predict and identify any abnormality or equipment
deterioration also enhances the principle of predictive maintenance. Mad Lazim
and Ramayah [30] stated that TPM combines both the predictive and preventive
maintenance strategies with more focus on participation of operators. Parida and
Kumar (2006) explained that a mixture of both predictive and preventive

181
maintenance approaches can lead to detection of potential early failures as well as
avoid equipment deterioration through utilising effective inspection technology of
CBM such as DGA for oil analysis, thermography, spectroscopy, vibration, and
other different tools.
This research has recognised how effective prognostic techniques can lead to
successful implementation of TPM through the planned maintenance pillar, as
well highlighting that operators should collect, record and analyse data of power
plants in order to predict potential failures before occurrence. Kodali et al. [23]
elaborated that the TPM framework advocates the use of predictive maintenance,
as it was promoted as one of the main pillar of Nakajima’s framework. The
authors realize that abnormalities, equipment deterioration, and failures can be
detected as well as predicted by operators through integrating the autonomous
maintenance pillar with utilision and application of maintenance optimisation
mathematical models that employ the operational steps of the planned
maintenance pillar; therefore daily operations will be improved through obtaining
high equipment availability and performance. In this study, the authors find out
that the documentations process is a key point that needs to be addressed clearly
when an organisation’s target is to obtain the benefits of continuous improvement.
Thus, activities that related to continuous improvement and light maintenance
tasks such as cleaning, lubricating, and tightening should be maintained and
recorded for regular analysis. This kind of consistent and steady analysis will lead
to significant results that can be shared between all staff and hence enable them to
observe the performance of equipment for further improvements. Mad Lazim and
Ramayah [30] advocated that when developing entire systems of autonomous
maintenance, all important data relating to the performance and state of the
equipment should be recorded in order to enable the skilled operators to analyse
the recording of data and hence the results utilised to enhance more effective
maintenance. Furthermore, maintenance costs involve direct and indirect
expenses; direct costs relate to materials and labour and indirect associated with
six big losses [21] – [24]. According to the prognostic techniques utilised by
operators, it will allow maintenance engineers and operators to use proposed
maintenance tasks to create effective solutions and optimise maintenance costs
[24] – [25]. Based on experience and identified potential failure during prognosis
analysis, suitable tasks can be selected from maintenance policies and producers.
Persons (operators or maintenance engineers) to perform tasks are identified
according to complexity, and maintenance costs are calculated. This determines
appropriate actions and resources (labour, tools, parts or instruments) required to
implement the maintenance polices. The case study organisation needs to
understand the crucial role of prognosis techniques and it has to integrate the
participation of autonomous maintenance with using optimisation a mathematical
model that employs the concept of planned maintenance pillar on critical power
plants in order to drive successful implementation of TPM within power industry.

182
6.0 Conclusion
The research has revealed that electric power organisations have recognised a
strongly held perception that a reactive maintenance system works when the
equipment is repaired at the same time of failure. However, the cost of fixing
equipment in reactive mode can be three times greater than preventive
maintenance costs. It seems that inherent maintenance practices, which reinforce
reactive maintenance, also affect any changes towards implementation of world
class maintenance practices. Furthermore, an organisation aspiring to employ
world-class maintenance such as TPM will need to build a robust teamwork
culture and utilise predictive maintenance concepts and tools such as prognostics
techniques in order to predict failures before occurrence. The current practices
within the Abu Dhabi power companies are static, not dynamic, and are
underpinned by many obstacles and barriers. The results of this research have
shown that effective prognostic techniques can lead electric power companies in
Abu Dhabi to develop a TPM approach through planned maintenance,
autonomous maintenance, training and education on the job, and focused
improvement pillars. In addition, the results have proven that collection and
analysis of historical data through operators is possible by using effective
prognostic tools. However, implementing this new maintenance strategy (TPM) in
the Abu Dhabi power industry may be challenging. Whilst TPM strategies will
allow operators to conduct maintenance tasks and prognosis analysis, maintenance
engineer responsibilities will need to change to enhance and support equipment
operators. These changes will significantly affect the responsibilities and roles of
operation staff. This research confirms that prognostic techniques can have a
positive impact towards successful TPM implementation in the power industry.
References
[1] Reiman, T., Oedewald, P., 2004. Measuring maintenance culture and mainte-
nance core task with CULTURE-questionnaire–a case study in the power in-
dustry. Safety Science, 42 (2004), pp. 859-889.
[2] Nilsson, J., Bertling, L., 2007. Maintenance Management of Wind Power Sys-
tems Using Condition Monitoring Systems-Life Cycle Cost Analysis for
Two Case Studies. IEEE Transactions on Energy Conversion, 22 (2007), pp.
223-229.
[3] Bana E Costa, Carlos A., Carnero, M.C., Oliveira, M.D., 2012. A multi-criteria
model for auditing a predictive maintenance programme. European Journal
of Operational Research, 217 (2012), pp. 381-393.
[4] Nakajima, S., 1988 Introduction to TPM. Productivity Press, Cambridge.
[5] Labib, A.W., 1999. A frame work for benchmarking appropriate productive
maintenance. Management Decision, 37 (1999), pp. 792-799.

183
[6] Lee Cooke, F., 2000. Implementing TPM in plant maintenance: some organi-
sational barriers. International Journal of Quality and Reliability Manage-
ment, 17 (2000), pp. 1003-1016.
[7] Ahuja I.P.S., Khamba, J.S., 2008. Total productive maintenance: Literature re-
view and directions. International Journal of Quality and Reliability Man-
agement, 25 (2008), pp. 709-756.
[8] Waeyenbergh, G., Pintelon, L., 2002. A framework for maintenance concept
development. International Journal of Production Economics, 77 (2002), pp.
299-313.
[9] Schmidt, B., Wang, L., 2016. Cloud-enhanced predictive maintenance. The In-
ternational Journal of Advanced Manufacturing Technology, ISSN:0268-
3768.
[10] Malik, H., Mishra, S., 2016. Application of Gene Expression Programming
(GEP) in Power Transformers Fault Diagnosis Using DGA. IEEE Transac-
tions on Industry Applications, 52 (2016), pp. 4556-4565.
[11] Ghoneim, S.S.M., Taha, I.B.M., 2016. A new approach of DGA interpreta-
tion technique for transformer fault diagnosis. International Journal of Elec-
trical Power and Energy Systems, 81 (2016), pp. 265-274.
[12] Li, X., Wu, H., Wu, D., 2011. DGA Interpretation Scheme Derived From
Case Study. IEEE Transactions on Power Delivery, 26 (2011), pp. 1292-
1293.
[13] Mansour, D.A., 2015. Development of a new graphical technique for dis-
solved gas analysis in power transformers based on the five combustible gas-
es. IEEE Transactions on Dielectrics and Electrical Insulation, 22 (2015), pp.
2507-2512.
[14] Gorjian, N., Ma, L., Mittinty, M., Yarlagadda, P., Sun, Y., 2009. A review on
degradation models in reliability analysis. Engineering Asset Lifecycle Man-
agement - Proceedings of the 4th World Congress on Engineering Asset
Management, pp. 369.
[15] Lelekakis, N., Guo, W., Martin, D., Wijaya, J., Susa, D., 2012. A field study
of aging in paper-oil insulation systems. IEEE Electrical Insulation Maga-
zine, 28 (2012), pp. 12-19.
[16] Wang, S., Zhang, G., Mu, H., Wang, D., Lei, M., Suwarno, S., Tanaka,
Y.,Takada, T., 2012. Effects of paper-aged state on space charge characteris-
tics in oil-impregnated paper insulation. IEEE Transactions on Dielectrics
and Electrical Insulation, 19 (2012), pp. 1871-1878.
[17] Baird, P.J., Herman, H., Stevens, G.C., Jarman, P.N., 2006. Non-destructive
measurement of the degradation of transformer insulating paper. IEEE
Transactions on Dielectrics and Electrical Insulation, 13 (2006), pp. 309-318.
[18] Sikorska, J.Z., Hodkiewicz, M., Ma, L., 2011. Prognostic modelling options
for remaining useful life estimation by industry. Mechanical Systems and
Signal Processing, 25 (2011), pp. 1803-1836.
[19] Gehloff, M., 2013. P-F Curve 101- The Basics Maintenance Phoenix. Availa-
ble: http://maintenancephoenix.com/2013/10/02/pf-curve-101-keeping-it-
simple/.

184
[20] Yin, R.K., 2014. Case study research: design and methods. SAGE, Los Ange-
les.
[21] Baglee, D., Knowles, M., 2010. Maintenance strategy development within
SMEs: The development of an integrated approach. Control and Cybernetics,
39 (2010), pp. 275-303.
[22] Bamber, C.J., Sharp, J.M., Hides, M.T., 1999. Factors affecting successful
implementation of total productive maintenance: a UK manufacturing case
study. Journal of Quality in Maintenance Engineering, 5 (1999), pp. 162-81.
[23] Kodali, R., Prasad Mishra, R., Anand, G., 2009. Justification of world-class
maintenance systems using analytic hierarchy constant sum method. Journal
of Quality in Maintenance Engineering, 15 (2009), pp. 47-77.
[24] Moubray, J., 1997. Reliability-centred maintenance. Butterworth-Heinemann,
Oxford.
[25] Singh, J., Sood, Y.R., Jarial, R.K., 2008. Condition Monitoring of Power
Transformers - Bibliography Survey. IEEE Electrical Insulation Magazine,
24 (2008), pp. 11-25.
[26] Dekker, R., 1996. Applications of maintenance optimisation models: a review
and analysis. Reliability Engineering and System Safety, 51 (1996), pp. 229-
240.
[27] Garg, A., and Deshmukh, S.G., 2006. Maintenance management: literature
review and directions. Journal of Quality in Maintenance Engineering, 12
(2006), pp. 205-238.
[28] Lawrence, J.J., 1999. Use mathematical modeling to give your TPM imple-
mentation effort an extra boost. Journal of Quality in Maintenance Engineer-
ing, 5 (1999), pp. 62-69.
[29] Ng, K.C., Goh, G.G.G., and Eze, U.C., 2011. Critical success factors of total
productive maintenance implementation: A review. In Industrial Engineering
and Engineering Management (IEEM), IEEE International Conference on
IEEE, pp. 269-273
[30] Mad Lazim, H., and Ramayah, T., 2010. Maintenance strategy in Malaysian
manufacturing companies: a total productive maintenance (TPM) approach.
Business Strategy Series, 11 (2010), pp. 387-396.

185
Authors’ Biography
Abdulla Y. Alseiari
Eng. Abdulla Alseiari received his B.Sc. degree in Electrical
Engineering (Networks and Communications Engineering)
from Al Ain University of Science and Technology at United
Arab Emirates and his MSc. in Maintenance Management from
Glasgow Caledonian University at Scotland in the UK. He is
currently pursuing his PhD degree at University of Bolton in
improving asset management and development of maintenance
strategies in the Abu Dhabi power utilities. His current research
is with Dr. Peter Farrell investigating the critical factors that af-
fecting the successful implementation of TPM strategy in the
Middle-East power industry. Eng. Alseiari is working at De-
partment of Energy-Abu Dhabi. He has more than 12 years ex-
perience in operation and maintenance management for power
distribution networks.
Peter Farrell
Dr Peter Farrell has sixteen years’ industry experience and
over twenty-five years in higher education. He is a Reader at
the University of Bolton, and has over ninety publications, in-
cluding four textbooks. His early industry work was as a quan-
tity surveyor; then as contractor’s site manager, responsible for
multi-million pound new-build construction projects. He has
been an External Examiner at seven institutions, including in-
ternationally, and is academic journal referee and book review-
er. Peter is a Fellow of both the Chartered Institute of Building
(FCIOB) and the Royal Institution of Chartered Surveyors
(FRICS), and formerly acted for three years as Chair of the
CIOB Greater Manchester Branch. His current work includes
leading the development of a new Asset Management degree
programme.

186
ME2018_1129
High Pressure Gas Compressor Dry Gas Seal
System Enhancement Case Study
Faisal Al Dossary1, Abdullah Al Turiki
2
1Reliability Engineer, Khurais Producing Department, Saudi Aramco
2 Technical Advisor, Khurais Producing Department, Saudi Aramco
Email: [email protected]; [email protected]
Abstract The paper describes Saudi Aramco’s, Khurais Producing Depart-
ment’s (KhPD) experience with their high pressure gas compressor (HP) dry gas
seal (DGS) system issues. Throughout the paper, issue investigation will be ex-
plored as well as recommendations and findings.
Key words Rotating Machines, Condition Monitoring, dry gas seal, compressor.
1.0 Introduction
Khurais producing department (KhPD) consists of four oil trains, each oil train is
responsible of receiving the crude oil from the wells, stabilize, and purify by re-
moving sand, water, gas and H2S contents to become ready for use and shipment
to refineries. Each oil train rely on a high pressure (HP) gas compressor for its
process, making the compressor an important part of the production process.
The HP compressors are fit with a dry gas sealing (DGS) system. The DGS sys-
tem consists of two entering gases, fuel gas to the primary seal and nitrogen to the
separation seal as seen in below Figure 1. There are two leakage lines, primary
and secondary. The primary leak line directs the fuel gas to the flare system. The
secondary leak line directs the injected nitrogen and partially leaked fuel gas from
the secondary seal to an atmospheric vent. To create a convenient path for the gas,
pressures at each seal location varies. Therefore, the primary leakage line has a
lower pressure value than the fuel gas. The secondary leakage line has even a low-
er value than the primary leakage line.

187
Figure 1: Cross sectional drawing of the installed dry gas seal with description.
KhPD DGS system depends mainly on the fuel gas as main supply gas, though the
compressor media gas is connected to the DGS system as a backup and safety op-
tion in case of any disturbance occurrence on the supply of the main fuel gas (Fig-
ure 2). The backup gas is connected to the same fuel gas line, but regulated by
pressures difference; the main fuel gas is designed to be 9 PSI higher than the
backup gas at all time, to restrict the flow of the backup gas to the DGS system.
Figure 2: P&ID of the dry gas seal system highlighted the compressor and fuel
gas lines.

188
As for the leakage protection system, the DGS is designed with a designated high
flow alarm on the secondary leakage line. The primary leakage line contains both
high and trip flow alarms as shown in Figure 3.
Figure 3: Seal leakage alarm setting on both primary and secondary leakage lines.
2.0 Background
After normal shutdown of the plant for scheduled maintenance activities, one of
the compressors was started with normal parameters. Then it was noticed that the
primary leakage of the inboard seal was increasing gradually reaching the alarm
point. Consequently, operations decreased the nitrogen pressure from 7 to around
2.5 PSI, as shown in Figure 4, to reduce the primary leakage and prevent compres-
sor tripping. The secondary leakage flow indicator is giving a “Bad” reading, indi-
cating out of range while the alarm limit is 3.5 SCFM (the flowmeter range is 0-
3.5 SCFM) while the primary showed low values at all time.
The nitrogen injection into the DGS’s separation seal, as seen in Figure 1, is main-
ly responsible to create the carbon ring’s lift, since it’s an aerostatic carbon ring
design. In addition, the nitrogen pressure plays a major role in minimizing and en-
suring no oil or contamination is entering the DGS from the journal radial bear-
ings.

189
Figure 4: Trend of HP compressor’s dry gas seal leakage system.
3.0 Investigation:
From analysis and investigation of trends, the following observations can be con-
cluded:
The secondary leakage line flow indicator is indicating high, out of range
flow.
The primary leakage line flow indicator is indicating low flow. This is con-
sidered abnormal since the primary leakage line is supposed to contain most
of the gas leakages.
The gas is directed to the most convenient route (less pressure). Currently,
most of the gas is passing through the secondary leakage line (vent).
Passing the secondary seal face to the vent shall occur only if the seal face is
worn or in hang up condition.
o Hang up may result from contamination/oil reaching the face spring.
o Worn out condition may result from gas contamination.
Visual inspection of the secondary leakage line was conducted during a recent
shutdown and revealed oil traces, as shown in Figure 5. This indicates possibility
of contamination reaching the secondary face. Therefore, hang up condition is ex-
pected to occur due to contamination reaching the DGS thrust ring and resisting its
closure, its normal operational movement.

190
Figure 5: Oil traces found in the secondary leakage line.
This explained the experienced scenario where the reduction of nitrogen pressure
increased the leakage of the primary line, for which increasing the nitrogen pres-
sure will result in increase of leakage resistance through the secondary leakage
line (Figure 6).
Figure 6: Oil traces found in the secondary leakage line.

191
In addition, the secondary vent line to atmosphere was found with a vertical open
end design, Figure 8. Such design increases the risk line blockage and water/dust
contamination entering the seal.
4.0 Recommendation:
The high pressure compressor role in KhPD plant production process is vital since
there are no redundant equipment available. When the compressor is shutdown,
the oil train is recommended to be shutdown, since high gas flaring is forbidden.
Therefore a failure mode effect analysis was conducted to ensure taking the right
decision.
4.1 Failure Mode Effect Analysis:
Based on above investigation of the situation, it’s suspected that the secondary
seal face is in a hung up, on open position.
Operating with DGS secondary face in hung up condition.
If primary seal fails.
The high differential pressure will return the secondary seal to its normal position.
The secondary seal will stay at its current hung up condition.
All the gas will flow to the vent (secondary leakage line).
Some gas will flow through the saparation seal to the lube oil (ignition source).

192
4.2 Rectification Actions:
Throughout the above brief FMEA chart, it can be concluded that a safety risk is
associated with running the compressor with its current existing situation. There-
fore
the compressor was recommended to stop and perform the following recommen-
dations:
1- Perform dry gas seal replacement:
Since the dry gas seal was suspected to be in hang-up condition, it was recom-
mended to replace the seal and inspect its internals.
2- Rectify secondary leakage vent line end design.
The secondary leakage vent line-end design by adding a bent sleeve to restrict
contamination during rainy and dusty weather conditions. Figure 8, shows the vent
line design before and after rectification.
Figure 8: Dry gas seal secondary seal leakage vent line before and after
modification.
3- Add secondary labyrinth seal on the radial bearings.
Since oil contamination was found within the seal leakage line, it indicated oil
contamination migration from the labyrinth into the seal. Therefore it was
reemphasized to operations the importance of keeping the nitrogen pressure at the
recommended value at all times. In addition, another layer of oil vapor restriction
was added through adding additional labyrinth seal on the radial bearings.

193
Figure 9: Dry gas seal found with oil contamination leakage during replacement.
4- Repair backup gas supply valve.
When the pressure of the backup gas supply was trended against the primary fuel
gas supply, it was found that the fuel gas supply pressure have decreased multiple
times to values lower than the backup gas pressure. Indicating that the DGS de-
pended on the compressor media to feed the DGS, which is not recommended
since the media is expected to carry impurities.
Figure 10: Dry gas seal secondary seal leakage vent line, before and after
modification.

194
Figure 10 shows inspection of the DGS with dust contamination appearance.
Therefore it was recommended to check the integrity of the regulating valve and
rectify prior to equipment startup.
5- Change DGS leakage protection system.
Since the decision of compressor shutdown required human investigation and in-
teraction, it was recommended to alter the protection system to a human-free in-
teractive system.
Therefore with the support of Saudi Aramco Consulting Services Department spe-
cialists’ consultation, the protection system was changed by eliminating automatic
compressor trip on high-high primary seal leakage. Instead, the condition was
made as a high-high alarm. For which a high alarm or high-high alarm on primary
seal leakage, combined with a high alarm or high-high alarm on secondary seal
leakage should trip the compressor automatically. In addition the seal leakage set-
tings were changed as below:
Primary New Recommended
Setting
Secondary New Recommended
Setting
DGS H Setting 12 SCFM H Setting 8 SCFM
HH Setting 16 SCFM HH Setting 12 SCFM
Therefore with the increase of seal settings and having such voting system, pro-
duction operation unnecessary interruption is expected to decrease. Furthermore
human interaction is not required during DGS hung up condition.
5.0 Conclusion
Within completion of all recommended actions, the compressor was started and
returned to service with healthy readings. Throughout the performed
recommendations and system enhancement, the compressors dry gas seal life
longevity was achieved. In addition to reduction of unnecessary operational
interruptions through equipment trip, the plant safety and reliability was improved
by achieving a human-free interactive protective system.
6.0 Acknowledgement
The DGS protection system modification mentioned in this paper was accomplished by par-
ticipation of Saudi Aramco Consulting Services Department (CSD) Engineer Tariq Al-
shaikh, CSD Sr. Consultant.

195
Authors’ Biography
Faisal Al Dossary
Saudi Aramco Khurais Producing Department re-
liability engineer. Graduated from Oregon State
University with honors in Bachelors of Science in
Mechanical Engineering. He joined Saudi Ar-
amco Consulting Services Department in 2015,
and joined Khurais Producing Department on an
assignment with Reliability Unit as an area Reli-
ability Engineer. Currently he is working as a ro-
tating equipment commissioning specialist to
support the ongoing Khurais increment project.
Faisal’s experienced responsibilities include reli-
ability programs, such as vibration monitoring
and condition monitoring, troubleshooting,
equipment design improvement, reverse engi-
neering, project support and commissioning.

196
ME2018_1131
Frailty Models for Survival Data applied to
Maintenance Management
Sílvia Madeira1, Paulo Infante2, Filipe Didelet3
1IIFAof University of Évora, Sílvia Madeira, Portugal
2CIMA/DMAT – IIFA and ECT of University of Évora, Paulo Infante, Portugal
3EST-IPS Setúbal, Filipe Didelet, Portugal
E-mail: [email protected]; [email protected]; [email protected]
Abstract Due to large number of equipment in industrial companies, maintenance management may not always be able to identify and quantify assets heterogeneity concerning failure data. Several statistical and mathe-matical methods are being developed in the last years looking for an im-provement on the system reliability. We’ve been working on survival analysis applied to equipment failure data using Cox proportional hazards, however, we notice that individualization with respect to the risk must be considered. Frailty models allowed us to identify equipment not following patterns of identical distributed times to failure. Although there exist some controversy around frailty models, claiming its poor contribution to the model, the truth is that when clustering our equipment by its id with a non-observed frailty component, we quickly identify those with higher influence on the hazard. This is particularly useful whether the intention is to find a homogeneous sample or work with all samples considering frailty component, contributing either way, to an enhanced and adaptive maintenance management.
Key words reliability, maintenance, time between failures, Cox proportional haz-
ards, frailty models.
1.0 Introduction
Within the scope of a joint project between Galp Energia, namely Sines’ refinery
(RS), the Portuguese Oil Company, and the Portuguese Foundation for Science
and Technology (FCT), it has been proposed to study several equipment at Sines’
refinery. Times to failure were at stake in order to improve efficiency on reliability
issues together with an RCM (Reliability Centered Management) target, a
methodology that has born in the 70’s with Moubray [1] and helps organizations

197
to find and focus on the real problems. In order to do this, it is fundamental that
companies have reliable failure registries data. ISO 14224:2006 [2] is a petroleum
and petrochemical standard that indicates the better way to achieve quality data
and normalizes equipment boundaries to report failures, statistical parameters,
among others. Getting close to the standard will be useful for the Company to
compare itself with others in the same industry. However, despite differences
between taxonomic notation for equipment among GE and ISO 14224:2006, we
decided to investigate behavior for some RS equipment classes. In this paper, we
will show a particular class of pumps restricted to a factory plant that is subject to
adverse environmental conditions: Alkylation unit. Ordinary survival analysis
assumes that all individuals in a group have the same risk, however, when dealing
with such a kind of environmental adversities, heterogeneity may be quite relevant
on influencing the hazard. OREDA 2015 is the latest compilation on Oil reliability
data from several offshore companies, and they hardly refer the particular
relevance of heterogeneity on reliability parameters estimation. They purpose
there to apply an analytical estimator to the failure rate (usually described by
λ = 𝑛/𝑇, with n the number of failures in the total period of time 𝑇), which they
call multi-sample estimator-�̂�, and contemplate a heterogeneity component, which
is described in detail in the compilation. We propose here to reveal the extent of
the contribution of a random effect in each equipment to influence, by a non-
observed way the hazard function under a theoretical and mathematical survival
point of view. For that, we’ve used survival models as Cox proportional hazards as
well as parametric models including a frailty component that could measure the
influence of that specific equipment in the hazard of the system. Following that
way, it’s easier to identify which are the equipment falling out of regular patterns,
making possible to identify eventual homogeneous subgroups, previously defined
or not, and using that information to infer, for each equipment of a given category,
a different hazard curve and a reliability curve with respect to its own frailty value.
Dynamic inspection instead of periodic identical one for all equipment can then be
adopted if a significant costs reduction is verified based on the hazard curve,
where a constant cumulative hazard policy [3] could be applied.
2.0 Related matters
This study is part of a larger project where hundreds of equipment were tested re-
garding its failure times. RS is composed of five main plants represented in figure
1. Each plant is composed itself by several other units. Failure data for all pumps
were collected and several categories of RS pumps were tested, but let’s focus first
on the main two: Centrifugal and Positive Displacement. From simple statistics we
notice that Plant II was responsible for the larger part of those failures in centrifu-
gal pumps, our target group, in which its Alkylation unit responds for more than
27% of total. Survival analysis using Kaplan-Meier (KM) curves [4] and paramet-

198
ric survival regression (wide known methods to estimate hazard curves), were
used and discussed, and examples of usage are illustrated in [5]. The proportional
hazard model of Cox [9] is used here with no covariates. Lack of covariates is a
common place in this study, which has made our work difficult. However we have
tried to use a component that could explain heterogeneity among identical equip-
ment.
Figure 1 – Sines’ refinery composition
A first approach was to use a non-parametric approach (Kaplan-Meier and Cox
Proportional Hazards) to understand the real behavior of times to failure. Of
course we are in the presence of repairable systems and recent developments have
been made regarding imperfect repair models, including aging simulation [6], but
we rather wanted to evaluate the already existing system, and most of all, times to
failure behavior. We assume that we are in the presence of a good as new repair
and although we know the risk of assuming that, we intended also to verify if the
error of that assumption was enough mitigated with frailty component associated
to each equipment id. With this method it was intended to identify in a global con-
text, equipment with lower and higher reliability and its contribution for the sys-
tem reliability and also allowing splitting data into homogeneous groups with spe-
cific characteristics. Following maintenance management staff advises and know-
how was fundamental as well to achieve good sense results.
3.0 Methodology
In a first approach, we consider quite relevant evidences that we could took from a
simple production of a cumulated failure plot – N(t).The way the curve defined by
this function changes over time and highlight periods of higher or lower stress that
could be evaluated in order to understand what have led to its occurrence. Adopt-
ed methodology involved either non-parametric models, as already mentioned,
and complemented with semi-parametric approaches as Cox PH, not in its usual
form because of nonexistence of covariates. Parametric approaches using well
Plant II
Plant III
Off-sites
Utilities
Plant I

199
known distribution as Exponential, Weibull, Log-logistic and Lognormal were
tried as well, so the best model could be obtained to make failure prediction and
simulation. Failure collection was not always an easy task once information does
not respect standard formats or were simply inexistent. However, with gather in-
formation it was possible to analyze mechanical intrinsic failures (recurrence
events less than 30 days after an event were re-interventions instead of failures). It
was adjusted a censor formulation to our real data as represented in figure 2.
Figure 2 Sines’ refinery composition
According to that formulation, times are not left truncated, avoiding that way
noise made by equipment that possibly may have been out of service or having
long reparation times. Time counts since the first failure subsequently to 01-01-
200x and later failures are then registered. Test period ends on 01-01-201x being
right censored. Equipment not revealing any kind of failure was subject to other
kind of analysis even if it is not assured they really have not had any failure at all
(hidden failures). Cumulated failures plot is depicted in figure 3 and it allows
identification of sad and happy periods as defined in [7] and relates it somehow,
with failures/improvements in the system along time. A careful management
should question what have happened in critical periods. This plot allows, beyond
evaluate critical periods, to understand that we are not in the presence of a system
where times are not independent and identically distributed because of its nonline-
ar form.
Event Plot for Pump Failures
t0 t1 t2 ... tn
01-01-200x 01-01-201x
Pum
p 1
Pum
p 2
Pum
p 3
...
______ - tbf'sx x
Pum
p n
o
x
- 1st
failure ocurrence
- failures
xo
xx x |
x
o
|
xo
x x |
xo
x |

200
Figure 3 – N(t) for Centrifugal pumps
Consequently, models that include recurrence factor were studied according An-
dersen and Gill formulation [8]. With gather data it was possible to identify in
those two major categories of pumps, the really impact of some of those sub-
groups in the global context, with plant II giving an already expected higher slope
on reliability curve for centrifugal pumps according a stratified survival curve for
each plant (figure 4). Knowing that Alkylation unit has the highest number of cen-
trifugal pumps’ failures, a deeper analysis was made for that specific group of
equipment’s. Using R software [10], Cox model as well as parametric models with
frailty component were tested and shown next. Different distributions can fit for
frailty component and different mixed models can be obtained.
Figure 4 – Stratified survival curve by plant
Time
N(t
)
01-01-200x 01-01-201xt3 t2
Time
R(t
)
0.5
Kaplan-Meier, CP
Plant I
Plant II
Utilities
Off-Sites

201
3.1 Tested models
Description of frailty models can be found in [11] or [12], in adaptation to Cox
proportional hazards. We have a frailty component following some distribution,
influencing the baseline hazard as expressed by (1).
ℎ𝑖𝑗(𝑡|𝑢𝑖) = 𝑢𝑖ℎ0(𝑡) 𝑒𝑥𝑖𝑗𝛽
𝑇 (1)
with 𝑖 ∈ 𝐼 = {1, … , 𝐺} and 𝑗 ∈ 𝐽𝑖 = {1,… , 𝑛𝑖}, where 𝜆0( ) is the baseline hazard
function and 𝑢𝑖 is the frailty term of the group 𝑖, and 𝑥𝑖 is the vector of covariates
for subject 𝑗 in the group 𝑖 and 𝛽 is the vector of regression coefficients. This is
the shared frailty model, once all subjects of the same cluster share the same frail-
ty 𝑢𝑖. As in our case we are in the presence of no covariates, so we can resume the
frailty model as being:
ℎ𝑖(𝑡|𝑢𝑖) = 𝑢𝑖ℎ0(𝑡) (2)
that is a description for the univariate model irrespective of the baseline hazard
distribution. In our specific case, we have 𝑖 groups, which means, 𝑖 equipments
with respective frailty 𝑢𝑖. 𝑛𝑖 is 1 for all groups and we have then, the univariate
case. We have instead, 𝑖 pumps with 𝑛 events. Frailties were tested for three dis-
tributions (Gamma, Positive Stable and Inverse Gaussian) and for four parametric
models (Exponential, Weibull, Lognormal and Log-logistic), which are briefly de-
scribed in equations (3), (4), (5) and (6).
Exponential: ℎ0(𝑡) = 1/𝜆, 𝜆 > 0 (3)
Weibull: ℎ0(𝑡) =1
𝜆𝜌 𝜌𝑡𝜌−1, 𝜆, 𝜌 > 0 (4)
Loglogistic: ℎ0(𝑡) =𝜌(
1
𝜆𝜌)𝑡𝜌−1
[1+(𝑡
𝜆)𝜌], 𝜆, 𝜌 > 0 (5)
Lognormal: ℎ0(𝑡) =ϕ(
log𝑡−𝜇
𝜎)
𝜎𝑡Φ(1−log𝑡−𝜇
𝜎) , 𝜎 > 0, 𝜇 ∈ ℝ (6)
Criteria for choosing best fit models were AIC and BIC as resumed in [13]. Figure
5 resumes AIC and BIC values for tested models when using all sample data with
a better AIC and BIC values for Lognormal and Log-logistic distribution for all
equipment on test. We must refer here that equipment with zero failures on test
period was not considered, as it was not possible to ensure that it was really in
service, even for a short period of time. Gamma and Inverse Gaussian revealed,
according to the same figure, a good approach for frailty distribution, so we can
arguably choose either one. Let’s now make a prediction for frailty component us-
ing Gamma distribution, just because of its versatility. We can take now a deeper
look on predicted frailties for each equipment id, illustrated in figure 6. It gave us
a different perspective on equipment influence on the global hazard. All tested dis-

202
tributions have given similar results, revealing for all id’s an identical risk level
for predictions. Nevertheless, the true is that even though an interval for the frailty
value be considered, let’s say [0.8; 1.2], we notice a higher discrepancy for the
five last equipments, which not necessarily may be those with more recurrence.
Thus, we must be careful when considering higher frailty values corresponding to
equipment with more events. Indeed, when using Andersen and Gill [8] formula-
tion for recurrent events, frailty values are exactly one for all pumps population,
giving us the idea that recurrence is identically distributed for clusters, and con-
sidering all population at once may not incur in a large bias.
Figure 5 – AIC and BIC values for the parametric tested values
Frailty component indicates the level of risk of that specific equipment has when compared
with others regarding global sample. It indicates that times between failures of a specific id
traduce higher/shorter risk and thus, a higher/lower probability to occur an event. In short,
we know that the frailty value indicates that:
{𝑢𝑖 > 1, increased individual level hazard𝑢𝑖 < 1, decreased individual level hazard
So, we’ll have a homogeneous sample whenever frailties values are around one,
revealing a lower risk level over the reference risk. A different criterion was also
made to confirm if bad actors match id’s with higher frailty predicted value, that
is, equipment with a higher influence on the hazard. When making an isolated
analysis to the slope of the Kaplan-Meier curve for all equipment, we notice that a
few ones reach less than 50% of reliability before the Kaplan-Meier median for
the global model (with all pumps). We think that is reasonable to think in those
ones as being bad actors. Of course these are as well equipment with more of
events. When we took off those five equipment out of the sample, we obtain the
predicted values for frailty component, illustrated in figure 7. For bad actors, a
1660
1665
1670
1675
1680
1685
1690 AIC
Ga IG PS
exponentialWeibullloglogisticlognormal
Ga = gammaIG = inverse GaussianPS = positive stable
1670
1675
1680
1685
1690
1695
BIC
Ga IG PS

203
homogeneous sample was achieved either as proved by figure 8. For all distribu-
tions it’s clear that homogeneous samples were achieved in both cases, revealing
that bad actors actually match id’s automatically identified by the frailty model.
Figure 6 – Gamma frailty for all AL sample
AIC and BIC values revealed as well same distribution with better fit for all sub-
groups: Lognormal. We have no doubts that two homogeneous samples were
found and serve the purpose to make prediction with their fitted parametric mod-
els.
Figure 7 – Gamma frailty values for different distributions (AL sample removing
bad actors)
0.0
0.5
1.0
1.5
Exponential
id
90
110
96
120
113
87
95
105
122
88
123
126
115
109
1681
106
99
104
103
101
97
93
102
0.0
0.5
1.0
1.5
2.0
Weibull
id
Pre
dic
ted f
railt
y v
alu
e
90
110
96
120
113
87
105
95
122
88
126
123
115
109
1681
106
99
104
101
103
97
93
102
0.0
0.5
1.0
1.5
Lognormal
90
110
96
120
113
95
87
88
105
122
123
115
126
109
1681
106
99
104
103
101
97
93
102
0.0
0.5
1.0
1.5
Loglogistic
Pre
dic
ted f
railt
y v
alu
e
90
110
120
96
113
95
87
88
122
123
105
115
126
109
1681
106
99
104
103
101
97
93
102
0.9
01.0
01.1
0 Exponential
id
90
110
96
120
113
87
95
105
122
88
123
115
1681
126
109
106
99
104
0.9
01.0
01.1
0 Weibull
id
Pre
dic
ted f
railt
y v
alu
e
90
110
96
120
113
87
105
95
122
88
123
126
115
1681
109
106
99
104
0.9
01.0
01.1
0 Lognormal
90
110
96
120
113
95
87
105
88
122
123
115
1681
126
109
106
99
104
0.9
01.0
01.1
0 Loglogistic
Pre
dic
ted f
railt
y v
alu
e
90
110
96
120
113
95
87
88
105
122
123
115
1681
126
109
106
99
104

204
But we are now interested on focus if large differences on the hazard are found
when using ONLY the global frailty model, with the heterogeneous sample. Shall
global model be a good approach with frailty components, with an acceptable er-
ror with respect to reliability values to homogeneous samples? [11] mention quite
relevant information about homogeneity in subgroups, which show that caution is
needed if heterogeneity is present through the existence of two subpopulations,
each of them assuming to be homogeneous. They alert that “…can lead to quite
unexpected results at the population level.” Examples for two subpopulations are
there provided with an approach to mixture models, where ℎ1,𝑝(𝑡) and ℎ2,𝑝(𝑡) are
the hazards for respective subpopulations, and 𝜋(𝑡) the proportion of equipments
that are still working at time 𝑡 in the first subpopulation:
𝜋(𝑡) =𝜋(0)𝑆1,𝑝(𝑡)
𝜋(0)𝑆1,𝑝(𝑡)+(1−𝜋(0))𝑆2,𝑝(𝑡) (7)
with 𝜋(0) the proportion of equipments in the first subpopulation at time zero.
Figure 8 – Gamma frailty values for different distributions (for AL bad actors)
The hazard can then be given by:
ℎ𝑝(0) = 𝜋(𝑡)ℎ1,𝑝(𝑡) + (1 − 𝜋(𝑡))ℎ2,𝑝(𝑡) (8)
Approach to mixture models will not be discussed here, but a slightly different
procedure for hazard calculation using mixture models when heterogeneity is re-
vealed is discussed in [14] with good results for parameters and models estima-
tion. We are, for the present case, focused on risk contribution of each individual
in the model for the global hazard and understand if there is room for using frail-
ties in a realistic perspective. Let’s first observe behavior for population as well as
0.9
01.0
01.1
0 Exponential
id
103
101
97
93
102
0.9
01.0
01.1
0 Weibull
id
Pre
dic
ted f
railt
y v
alu
e
101
103
97
93
102
0.9
01.0
01.1
0 Lognormal
103
101
97
93
102
0.9
01.0
01.1
0 Loglogistic
Pre
dic
ted f
railt
y v
alu
e
103
101
97
93
102

205
for samples. Parameters of tested models are shown for the three distinct situations
in table 1: global model (all pumps - heterogeneous), bad actors (sample 1) and
without bad actors (sample 2).
Table 1 – Parameters for parametric frailty models using different samples.
Large differences are observed, if we consider logarithm scale, however, we no-
tice some consistence for Weibull model concerning both parameters against
higher differences between parameters for other models even though AIC value is
not the smaller. Lognormal distribution in turn, presents a consistent lower AIC
for all models as well as its 𝜃 parameter for frailty variance is also lower (𝜃 is ob-
viously next to zero in homogeneous samples). A visual perception may also help
decision as well as some practical results. Figure 9 illustrates how frailties influ-
ence the hazard with Lognormal parametric frailty model, which had lower AIC
for all samples. For each pump there is a corresponding 𝑢𝑖 random component in-
fluencing the hazard, and reliability curves for each one can be derived and plot-
Glo
bal
mo
del
Distr. 𝜽 𝒍𝒐𝒈𝝀 (se) 𝝆 (se) AIC
Exp. 0.24 6.459 0.131 - - 1675.41
Weib. 0.318 7.238 0.462 1.119 0.087 1675.42
Loglog. 0.199 5.953 0.768 1.596 0.134 1667.08
𝝁 (se) 𝝈 (se)
Lognor. 0.21 5.97 0.13 1.07 0.08 1662.5
Sam
ple
1
Distr. 𝜽 𝒍𝒐𝒈𝝀 (se) 𝝆 (se) AIC
Exp. 0 5.728 0.125 - - 757.534
Weib. 0 7.191 0.57 1.243 0.125 755.402
Loglog. 0 5.372 1.177 1.954 0.215 750.916
𝝁 (se) 𝝈 (se)
Lognor. 0 5.365 0.113 0.874 0.083 748.827
Sam
ple
2
Distr. 𝜽 𝒍𝒐𝒈𝝀 (se) 𝝆 (se) AIC
Exp. 0.001 6.845 0.125 - - 898.278
Weib. 0.002 7.362 0.592 1.119 0.114 899.826
Loglog. 0.000 6.378 1.023 1.489 0.16 898.131
𝝁 (se) 𝝈 (se)
Lognor. 0.001 6.372 0.138 1.129 0.108 895.756

206
ted. We are going now to compare some reliability results and medians (rather
than means, once it’s a more robust estimator) between global model with frailty
and each sample (sample 1 and 2) with its respective fitted distributions whose pa-
rameters are from table 1. Table 2 illustrates for all equipment, their frailty param-
eter (𝑢𝑖), the respective median (𝑀𝑒𝑑𝑖) and three reliability moments (𝑅(𝑡𝑗),=
30𝑜𝑡, 90𝑜𝑡, 150𝑜𝑡), with ot = operational time with non-disclosed units.
3.2 Models validation
A graphical perception and an overview on models fit with frailty component in-
fluencing the hazard are made and conceptual results will be shown. Frailties for
sample 1 were one for all equipment while for sample 2 they were not strictly one,
but differences were considered negligible. Since we know that that frailty has a
multiplicative effect over the hazard, if we divide the global median by each indi-
vidual frailty, we are then supposed to obtain an approximation of the respective
individual median. Of course we found differences in some equipment, reaching
from 30 to 44%, but again, we must not forget that it is the median that is men-
tioned, which may result in higher differences related with sample dimensions.
Let’s now consider pump 1 from sample 1 and pump 20 from sample 2. Reliabil-
ity for instant 30ot for both equipment using global model of table 1 (Lognormal)
with frailty parameters can be expressed as:
𝑅1(30𝑜𝑡) = (Φ(− log30ot + 5.97
1.07))
1.76
= 0.41
𝑅20(30𝑜𝑡) = (Φ(− log 30ot + 5.97
1.07))
0.7
= 0.7
If no frailty is considered, then we’ll have, using sample 1 and 2 parameters from
table 1:
𝑅1(30𝑜𝑡) = Φ (− log 30ot + 5.365
0.874) = 0.35
𝑅20(30𝑜𝑡) = (− log 30ot + 6.372
1.129).
= 0.72
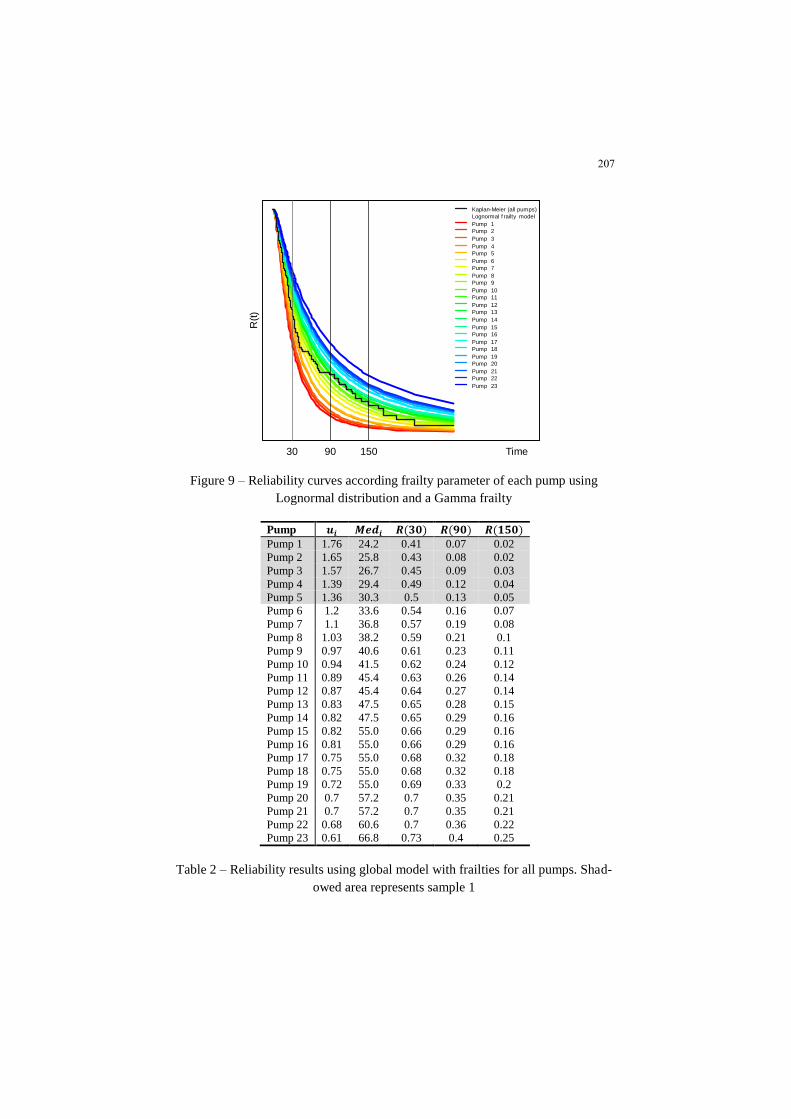
207
Figure 9 – Reliability curves according frailty parameter of each pump using
Lognormal distribution and a Gamma frailty
Table 2 – Reliability results using global model with frailties for all pumps. Shad-
owed area represents sample 1
Kaplan-Meier (all pumps)
Lognormal f railty model
Pump 1
Pump 2
Pump 3
Pump 4
Pump 5
Pump 6
Pump 7
Pump 8
Pump 9
Pump 10
Pump 11
Pump 12
Pump 13
Pump 14
Pump 15
Pump 16
Pump 17
Pump 18
Pump 19
Pump 20
Pump 21
Pump 22
Pump 23
30 90 150 Time
R(t
)
Pump 𝒖𝒊 𝑴𝒆𝒅𝒊 𝑹(𝟑𝟎) 𝑹(𝟗𝟎) 𝑹(𝟏𝟓𝟎)
Pump 1 1.76 24.2 0.41 0.07 0.02
Pump 2 1.65 25.8 0.43 0.08 0.02
Pump 3 1.57 26.7 0.45 0.09 0.03
Pump 4 1.39 29.4 0.49 0.12 0.04
Pump 5 1.36 30.3 0.5 0.13 0.05
Pump 6 1.2 33.6 0.54 0.16 0.07
Pump 7 1.1 36.8 0.57 0.19 0.08
Pump 8 1.03 38.2 0.59 0.21 0.1
Pump 9 0.97 40.6 0.61 0.23 0.11
Pump 10 0.94 41.5 0.62 0.24 0.12
Pump 11 0.89 45.4 0.63 0.26 0.14
Pump 12 0.87 45.4 0.64 0.27 0.14
Pump 13 0.83 47.5 0.65 0.28 0.15
Pump 14 0.82 47.5 0.65 0.29 0.16
Pump 15 0.82 55.0 0.66 0.29 0.16
Pump 16 0.81 55.0 0.66 0.29 0.16
Pump 17 0.75 55.0 0.68 0.32 0.18
Pump 18 0.75 55.0 0.68 0.32 0.18
Pump 19 0.72 55.0 0.69 0.33 0.2
Pump 20 0.7 57.2 0.7 0.35 0.21
Pump 21 0.7 57.2 0.7 0.35 0.21
Pump 22 0.68 60.6 0.7 0.36 0.22
Pump 23 0.61 66.8 0.73 0.4 0.25

208
Table 3 represents the medians for the three cases and we can conclude that each
individual median calculated within the global model is closer to the median of the
subgroup (sample 1) than to the median of the global model. This may indicate
that using frailty technique could be a good bet when the balance for decisions
over a set of equipment is needed.
Table 3 – Medians for all 3 samples using Lognormal distribution
Figure 10 shows differences between frailty model and Kaplan-Meier curves.
Kaplan-Meier with highest slope refers to sample 1 and we can observe high dif-
ferences for both samples. As we have referred, KM only uses punctual time in-
formation, discarding cluster effect, which we think to be, for the case, considera-
bly relevant.
Figure 10 – Kaplan-Meier curves for sample 1 and 2 and reliability curves using
global frailty model
Model Median
Global 39.15
Sample 1 21.37
Sample 2 58.53
Sample 1
Sample 2
Kaplan-Meier (Sample 1 and 2)Kaplan-Meier (Sample 1 and 2)
Sample 1
Sample 2
Time
R(t
)

209
4.0 Conclusion
We found frailty information very useful in quickly detecting heterogeneous sam-
ples, including bad actors, although a previous analysis shall dismiss some
equipment only with censors, which we’ve verified to cause models bad estima-
tions and bias for frailties. We found this models very effective on homogeneous
groups identification, allowing to work either with global model with frailties, or
in turn, with homogeneous subgroups. However, for this specific case, it was im-
portant for maintenance management to evaluate each element risk. When associ-
ated with other maintenance information, as costs, spare parts, availability, among
others, it may reveal a more realistic statistic than using a single model for all
equipment. Frailty models have thus, a great potential and can also be used in oth-
er context. Some investigations on costs association with frailty value have been
made, but so far, no emphasis results were found. However, we strongly believe
that an accurate analysis is possible if a frailty component were added. Another in-
teresting investigation might include associating frailty as a risk level with spare
parts components on maintenance stock.
Acknowledgements Thanks to Galp Energia, the insertion company for this study, and to FCT, that fi-
nances the study.
References [1] Moubray, J. (1992). RCM II. Industrial Press.
[2] ISO (2006). Petroleum and natural gas industries - Collection and exchange
of reliability and maintenance data for equipment. International Standard Or-
ganization.
[3] Rodrigues Dias, J., Infante, P. (2008). Control charts with predetermined
sampling intervals.International Journal of Quality and Reliability Manage-
ment, 25 (4): 423‐435.
[4] Kaplan, E. L. and Meier, P. (1958). Non-parametric estimation from incom-
plete observations. Journal of the American Statistical Association,
53(282):457–481.
[5] Rausand, M., Hoyland, A. (2004). System Reliability Theory - Models, Sta-
tistical Methods and Applications. Second Edition. Wiley.
[6] Tanwar, M., Rai, R. N., and Bolia, N. (2014). Imperfect repair modeling us-
ing kijima type generalized renewal process. Reliability Engineering and
Safety, 124:24–31.
[7] Ascher, H., Feingold, H. (1984). Repairable Systems Reliability. New York:
Marcel Dekker, Inc.
[8] Andersen, PK., Gill, RD. (1982). Cox regression model for counting pro-
cesses: a large sample study. Ann Math Stats.
[9] Cox D, Oakes D. (1984). Analysis of survival data. Chapman and Hall. Lon-
don.

210
[10] R Core Team (2014). R: A language and environment for statistical compu-
ting. R Foundation for Statistical Computing. Vienna, Austria. ISBN 3-
900051-07. URL: http://www.R-project.org/
[11] Duchateau L, Janssen P (2008). The Frailty Model. Springer-Verlag.
[12] Wienke A. (2010). Frailty models in Survival Analysis. Chapman &
Hall/CRC Biostatistics Series.
[13] Hu, S. (2007). Akaike information criterion. Center for Research in Scientific
Computation
[14] Madeira, S.; Infante; P.; Didelet;F. (2016). Application of Mixture Models to
Survival Data. In Journal of Maintenance Engineering. 1 ed., Vol. 1: 366-
374. Aylesbury, Buckinghamshire: ShieldCrest Publishing.
Authors’ Biography
Sílvia Parreira
Dr. Sílvia Parreira was developing her PhD investigation
work on Galp Energia, a Portuguese oil & gas company.
She was part of Reliability department and has been
involved in RCM procedures and prepared reliability
analysis. She’s accompanied by the Department of
Mathematic of University of Évora as well as by the
Department of Mechanic of the Polytechnic Institute of
Setúbal.
Paulo Infante
Dr. Paulo Infante is an Assistant Professor at Department
of Mathematics of University of Évora and member of the
Research Centre in Mathematics and Applications (CIMA-
UE). Ph.D. in Mathematics, his current research interests
are focused in the areas of Quality Control, Reliability,
Survival Analysis, Design of Experiments, Generalized
Linear Models and Demography. He has published several
papers in several national and international journals. Cur-
rently he is adviser of several PhD and Masters theses.
Filipe Didelet
Dr. Filipe Didelet is an Associate Professor at Technology
College, Setubal Polytechnics. He works normally in the reliability prediction of thermal equipment by means of
mathematical and functional models and in maintenance
management methodologies.

211
ME2018_1136
Non-dimensional pattern recognition approach
for the faults classification in rotating machines
Natalia F. Espinoza Sepulveda, Jyoti K. Sinha
School of Mechanical, Aerospace and Civil Engineering. The University of Manchester, Oxford
Road, Manchester, M13 9PL, UK.
Email: [email protected]; [email protected]
Abstract Maintenance industry has become more challenging and demanding,
having an impact in technologies and engineering developments. The application
of intelligent systems has arisen from the need of improved mechanisms for diag-
nosis generation. In literature, it is possible to find a wide range of methods devel-
oped for fault identification and diagnosis in rotating machines. Nevertheless, they
have a narrow scope and their industrial application cannot be directly assessed.
This work presents a machine learning application for the pattern recognition and
fault classification in rotating machines through vibration signals. The proposed
method is characterised by simple data preparation required with no need of high
human proficiency in dynamics and vibration analysis, and its testing at different
rotating speeds. Results obtained with non-dimensional features extracted in time
domain are compared with frequency domain ones, suggesting a future possibility
for centralised condition based maintenance according the Internet of things (IoT)
of Industry 4.0.
Key words Rotating Machines, Fault Detection, Fault Diagnosis, Condition Moni-
toring, Pattern Recognition, Artificial Neural Networks.
1.0 Introduction
The increased interest in industrial maintenance has resulted into the permanent
search for new and improved applications and techniques which provide the better
practices to optimise the productive processes and achieve the desire performances
by the organisations. Nowadays, the aim of the companies is to opt for
maintenance strategies that allow them to have a permanent control over all the
assets involved in their processes, avoiding unexpected and catastrophic failures.
An opportune and adequate diagnosis at an early stage is essential to achieve this
objective, and adds high value to the business. In this frame, it emerges the
application of intelligent systems, such as machine learning applications, which

212
can identify certain patterns of failure and generate potential diagnoses, regardless
of the human expertise.
Supervised machine learning methods are based on computational intelligence,
and are trained through data with pre-assigned labels or targets for a fixed number
of classes. A wide range of techniques have been developed under this classifica-
tion, being the most popularly used for pattern recognition: support vector ma-
chine (SVM), fuzzy logic, principal component analysis (PCA) and artificial neu-
ral network (ANN).
ANNs are based in the human brain operation, being able to memorise and learn
from external inputs, with the capability of adapting to produce consistent
responses. It has been evidenced, by Nahvi and Esfahanian [2], the capability of
ANNs of dealing with a high number of features and provide acceptable results for
the fault detection, however the 100% of accuracy is not achieved at any of the
conducted experiments by them. Bearing faults have been also studied by this
method [3], [4], demonstrating an ability for damage detection at an early stage.
Other researchers have focused their studies into localise the failures as well into
quantify the damage [5], [6].
These models have simplified the fault identification stage through the
introduction of learning assessment. However, the revised works still present a
high dependency on complex data preparation procedures due pre and post signal
processing. Additionally, most of them are focused in the identification of a unique
fault. With the aim of eliminate the human expertise need, a simple non-
dimensional approach is proposed in this study, which uses as input the vibration
signal and provides as output a potential diagnosis, based on healthy condition and
selected typical rotor faults. Computational tools supply the support required to
conduct the study.
2.0 Experimental rig and data
Data collection is conducted in an experimental rig at the University of Manches-
ter, United Kingdom. This rig represents a multi-stage rotating machine (Figure 1).
It consists in two shafts connected by a rigid coupling (C2). The driven shaft (Sh1)
has a length of 1000 𝑚𝑚 and it is coupled by a flexible unit (C1) to a three-phase
electric motor (0.75 𝑘𝑊). This shaft, has installed two balancing discs (D1, D2),
while the shorter shaft (Sh2) of a length of 500 𝑚𝑚 has one balancing disc (D3).
The assembly is mounted over a total of four grease lubricated ball bearings (B1,
B2, B3, B4). The bearings are mounted on bearing pedestals (P1, P2, P3, P4),
which are secured by bolts to a steel base that acts as foundation of the machinery
within a high mass.

213
Figure 1. Experimental rig [7]
There are four faulty conditions considered for this study, in addition to a fifth
class, corresponding to the ‘healthy’ condition. The ‘healthy’ condition provides
the baseline to identify the changes on vibration patterns when additional failures
are introduced. The base condition presents, as in industry, residual misalignment
and residual unbalance. The four failures are considered occurring independently
one from another, and they are misalignment, loose in bearings, bow and rub. It is
important to note that each failure is introduced twice into the rotor, at different
locations and/or within a different severity.
Vibration signals are acquired simultaneously from four uniaxial accelerometers,
located in each of the four bearings at 45º from the horizontal line in anticlockwise
direction. Data are collected at a sampling frequency of 104 Hz, with the rotor
running under steady state, at a speed of 1800 RPM or 30 Hz and at 2400 RPM or
40 Hz.
3.0 Proposed approach
3.1. Features extraction
Samples of 5 seconds length, with an 80% overlap, are extracted from data in
steady state. Since the used datasets do not have a uniform length, the number of
samples is variable for each rotor condition, being extracted the maximum possi-
ble amount (Table 1). From the samples, features are separately extracted in time
and frequency domains.
Table 1. Number of samples per class studied, per bearing
Healthy Misalignment Bow Looseness Rub Total
1800 RPM 86 121 204 192 114 717
2400 RPM 45 82 104 92 58 381
From time domain, four scalar features have been selected to form the features
vectors. The first value is root mean square (RMS), typically used on engineering.
It is defined in Equation (1), where 𝑁 is the number of points contained in the
sample and 𝑧𝑖 is the i-element of the sample 𝑧. The variance (𝑉), contains infor-
mation due the signal power [8] and it is defined as it is shown in Equation (2) [9],

214
with 𝑧̅ =1
𝑁∑ 𝑧𝑖
𝑁𝑖=1 the mean of the data sample. Taking as reference value the
sample mean 𝑧̅ , the asymmetry of the measurement is represented by skewness
(𝑆). Its definition [10] is in Equation (3), where 𝐸() denotes mathematical expec-
tation, and 𝜎 = √1
𝑁−1 ∑ (𝑧𝑖 − 𝑧)̅2
𝑁
𝑖=1 is the standard deviation. The last feature se-
lected, kurtosis (𝐾), also provides information about the shape distribution of the
sample and it is defined in Equation (4) [10].
𝑅𝑀𝑆 = √1
𝑁∑ 𝑧𝑖
2𝑁𝑖=1 (1)
𝑉 =1
𝑁 ∑ (𝑧𝑖 − 𝑧̅)2
𝑁
𝑖=1 (2)
𝑆 =𝐸(𝑧−�̅�)3
𝜎3 (3)
𝐾 =𝐸(𝑧−�̅�)4
𝜎4 (4)
Those values are calculated for each sample of vibration data at the four bearing
simultaneously and used to build the inputs of the network. For instance, in Equa-
tion (5) it is shown the j-input in time domain.
inputTj=[RMS1j RMS2j RMS3j RMS4j V1j V2j V3j V4j S1j S2j S3j S4j K1j K2j K3j K4j]’ (5)
Besides, in order to obtain the features from frequency domain, the frequency
spectrum is calculated from each data set using the fast Fourier transform (FFT).
The amplitude values at 0.5x, 1x, 1.5x … 4x times the rotational speed (30 Hz or
40 Hz) are extracted, accordingly the studied scenario, and divided by the ampli-
tude value at the same frequencies when healthy condition. By this, non-
dimensional values which represent the variations of the samples from the base-
line condition are used. Similarly to time domain, the calculated values from sam-
ples acquired simultaneously at the four bearings are organised as shown in Equa-
tion (6) to create the input vectors, where, for instance, FF10.5x, j represents the
frequency feature from B1 at 0.5 times the operating speed, and so on.
inputFj=[FF10.5x, j …FF14x, j FF20.5x, j …FF24x, j …FF30.5x, j …FF34x, j FF40.5x, j …FF44x, j]’
(6)
3.2. ANN’s architecture
A multilayer perceptron (MLP) is used in this study to perform the pattern recog-
nition task. This is a feedforward network where signal components pass the input

215
layer and move forward along the four hidden layers, finishing with the result de-
livery from the decision layer. Each hidden layer has a variable number of nonlin-
ear neurons, 𝑚1, 𝑚2, 𝑚3 𝑚4, which varies regarding time or frequency domains.
The proposed architecture is in Figure 2, with 𝑚𝑖 the size of the input vectors and
5 classes in the output representing the rotor conditions.
Figure 2. Neural network architecture proposed
In this work, supervised learning is used for training the network, therefore the
processed data have already set the wanted outputs. The weights are adjusted ac-
cording the actual error of the outputs against de desired ones during this process.
The error is calculated through the performance function, being for both domains
cross-entropy. The details of each study are shown in Table 2.
Table 2. Specifications of ANN architectures for time and frequency domains
Time domain Frequency domain
Hidden
layer
number
No. of
Neurons
Hidden
layer
number
No. of
neurons
ANN Parameter
1 1000 1 1000
2 100 2 1000
3 100 3 100
4 10 4 10
Transfer function
hidden neurons Hyperbolic tangent sigmoid Hyperbolic tangent sigmoid
Transfer function
output neurons Softmax Softmax
Training function Bayesian Regulation Back-
propagation
Scaled Conjugate Gradient
Backpropagation
Performance
Function Cross-entropy performance Cross-entropy performance
During the training process, the network could be subject of overfitting. In this
work, early stopping method is used to avoid this occurs. By this process a cross-
validation of independent data is carried out [8], grouping the total available in 3
sets. This is applied to the samples at 1800 RPM and 2400 RPM separately, where
the first set of data (70% of samples) is used for training the network, modifying
the weights according the learning rule. The second set (15% of samples) is for
validation, processing conducted by testing in the trained network these data until
their classification error reaches a desired point of minimum error, giving the or-
der to stop the training process. At this point, the weights correspond to the opti-

216
mal for the network and the last group of unknown data (15% of samples) is test-
ed, providing the generalisation of the network [11].
Afterwards, the network already trained and validated with data at 1800 RPM is
tested with the inputs made from data at 2400 RPM, in order to verify the capabil-
ity of the model of being applied when operational conditions change, i.e. the rota-
tional speed.
4.0 Results
The overall performances obtained using non-dimensional features extracted from
time and frequency domain at 1800 RPM and 2400 RPM are summarised in Table
3. At 1800 RPM, the highest accuracy obtained is 100% when features only from
time domain are used and a slightly lower value of 99.7%, when frequency do-
main features made the input vectors. The high performances are explained by the
consistent and complete information provided about the machine during its opera-
tion, mapping the dynamics along the rotor through the calculated features from
the vibration signals.
The proposed method has shown its adaptability when it is processed with values
acquired at a different rotating speed, namely 2400 RPM. When the entire process
is carried out with this data, the obtained results are similar to the ones at 1800
RPM, achieving a 100% of successful classifications in time domain and a slightly
lower performance of 96.6% in frequency domain.
Table 3. Performance achieved, with features extracted from time and frequency
domains at 1800 RPM and 2400 RPM
1800 RPM 2400 RPM
Time Frequency Time Frequency
Training 100.0% 100.0% 100.0% 97.8%
Validation 100.0% 99.1% 100.0% 94.7%
Testing 100.0% 99.1% 100.0% 93.0%
Overall 100.0% 99.7% 100.0% 96.6%
At both speeds in frequency domain there are false healthy diagnoses identified,
made by 0.56% of the samples at 1800 RPM and 0.79% at 2400 RPM. Thus, the
method does not perform in a reliable manner in this domain, implying a high risk
not just because of the lack of accuracy in the classification of the rotor condi-
tions, but also because there are detected hidden faults among the misclassified
pieces of data. Those cases are critical because they are hiding a failure, whose

217
certain effects are unknown, being possible even the occurrence of catastrophic
events. All the misclassified faults belong to misalignment samples.
Table 4. Performance achieved in testing at 2400 RPM, with learning process car-
ried out at 1800 RPM Features
domain
Class 1
Healthy
Class 2
Misalignment
Class 3
Bow
Class 4
Looseness
Class 5
Rub Overall
Time 100.0% 0.0% 100.0% 100.0% 100.0% 78.5%
Frequency 44.4% 1.2% 0.0% 45.7% 36.2% 22.0%
A third setup is tested regarding the operational speed of the machine. This con-
sists on carrying out the learning process with data taken at 1800 RPM, and then
providing to the network input vectors generated with data acquired at 2400 RPM.
In this opportunity, it is observed a considerable better performance with time do-
main features. The detailed results are shown in Table 4.
On the one hand, for time domain, it is seen that none of the samples of misalign-
ment was identified as itself, being confused with other faulty conditions. None-
theless, the model could separate with a 100% of accuracy the healthy from the
not healthy samples, independently of the specific type of defect. On the other
hand, the classification carried out with features from frequency domain presents
an extremely poor performance, having just a 22.00% of success in the classifica-
tion task, with a large number of hidden faults made by 52.23% of the tested sam-
ples. On Figure 3 are visible the hidden faults at all the studied scenarios for both
proposed domains.
Figure 3. False healthy diagnoses rate per studied scenario
0% 0% 0% 0.56% 0.79%
52.23%
0%
10%
20%
30%
40%
50%
60%
Learning & Testing at
1800 RPM
Learning & Testing at
2400 RPM
Learning at 1800 RPM;
Testing at 2400 RPM
Hidden Faults
Time domain Frequency domain

218
5.0 Conclusions
The application of a supervised artificial neural network resulted suitable for pat-
tern recognition and classification of faulty states in a rotating machine. The usage
of data sets acquired simultaneously from different locations along the machines
allows the extraction of features that could represent the machine condition, being
possible a proper separation and differentiation among the set classes, therefore
the classification of the analysed samples. The maximum reliability of the model
is obtained when features from time domain are used, achieving a 100% of accu-
racy in the fault diagnoses when the entire process, learning and testing, are con-
ducted with samples acquired at the same speed. This means the network is adapt-
able for being processed with sets of data at different speeds, nevertheless further
studied are required to extend this statement. When the network is tested at a
speed different from the one used in the learning process, even though the model
cannot identify all the specific failures, it is capable of separate into two categories
the samples, healthy and faulty, with a 100% of accuracy.
The proposed intelligent approach could be applied under the concept of Internet
of Things (IoT). The implementation of IoT could help to overcome the limitation
of supervised methods regarding the vast amount of data required. Moreover, it al-
lows an optimisation of the resources, avoiding the redundancy of tasks related
with fault diagnosis and offering a standard procedure among the organisation.
6.0 Acknowledgment
This study was supported by CONICYT (Comisión Nacional de Investigación
Científica y Tecnológica/Chilean National Commission for Scientific and Techno-
logical Research) “Becas Chile” Master’s Fellowship programme; Grant No.
73160059 to Natalia Fernanda Espinoza Sepúlveda. Prof Sinha acknowledges his
PhD students then Dr Keri Elbhbah for the development of the rig, and Dr Akilu
Kaltungo and Dr Adrian Nembhard for the experiments and experimental data that
are used in this study.
References
[1] Dai, X., and Gao, Z., 2013. From Model, Signal to Knowledge: A Data-
Driven Perspective of Fault Detection and Diagnosis. IEEE Transactions on
Industrial Informatics, 9 (4), pp. 2226–2238.
[2] Nahvi, H., and Esfahanian, M., 2005. Fault identification in rotating machin-
ery using artificial neural networks. Proceedings of the Institution of Me-

219
chanical Engineers, Part C: Journal of Mechanical Engineering Science, 219
(2), pp. 141–158.
[3] Vyas, N., 2001. Artificial neural network design for fault identification in a
rotor-bearing system. Mechanism and Machine Theory, 36 (2), pp. 157–175.
[4] Ben, J., Fnaiech, N., Saidi, L., Chebel-morello, B., and Fnaiech, F., 2015.
Application of empirical mode decomposition and artificial neural network
for automatic bearing fault diagnosis based on vibration signals. Applied
Acoustics, 89, pp. 16–27.
[5] Walker, R. B., Vayanat, R., Perinpanayagam, S., and Jennions, I. K., 2014.
Unbalance localisation through machine nonlinearities using an artificial
neural network approach. Mechanism and Machine Theory, 75, pp. 54–66.
[6] Mohammed, A. A., Neilson, R. D., Deans, W. F., and MacConnell, P., 2014.
Crack detection in a rotating shaft using artificial neural networks and PSD
characterisation. Meccanica, 49 (2), pp. 255–266.
[7] Nembhard, A. D., Sinha, J. K., and Yunusa-Kaltungo, A., 2015. Development
of a generic rotating machinery fault diagnosis approach insensitive to ma-
chine speed and support type. Journal of Sound and Vibration, 337, pp. 321–
341.
[8] Worden, K., Staszewski, W. J., and Hensman, J. J., 2011. Natural computing
for mechanical systems research: A tutorial overview. Mechanical Systems
and Signal Processing. 25 (1), pp. 4–111.
[9] Roberts, M., and Russo, R., 2014. A Student’s Guide to Analysis of Variance.
Routledge.
[10] Shanmugam, R., and Chattamvelli, R., 2015. Statistics for Scientists and En-
gineers. Hoboken, New Jersey: John Wiley & Sons, Inc..
[11] Tarassenko, L., 1998. A Guide to Neural Computing Applications. Arnold.

220
Authors’ Biography
Natalia F. Espinoza Sepulveda
Natalia F. Espinoza Sepulveda is a Reliability
Engineering & Asset Management MSc graduate from
the School of Mechanical, Aerospace and Civil
Engineering, The University of Manchester. Her
professional career has been developed in the
maintenance field of large-scale copper mining in Chile.
Miss Espinoza has awarded two fellowships from the
Chilean National Commission for Scientific and
Technological Research, CONICYT, to continue
postgraduate studies.
Jyoti K. Sinha, BSc(Mech), MTech(Aero), PhD, CEng, FIMechE
Prof Jyoti K. Sinha is Programme Director of
Reliability Engineering and Asset Management
(REAM) MSc course and Head, Dynamics Laboratory,
School of Mechanical, Aerospace and Civil
Engineering, The University of Manchester UK. The
REAM course is an industrially focused professional
course on Maintenance which is accredited by the
IMechE UK. This course is now completely on the
international mission under his leadership. Prof. Sinha is
involved in and solved a number of industrially applied
research projects related to Vibration-based Condition
Monitoring and Maintenance of Machines and
Structures in last 29 years. Prof. Sinha is the author of
more than 250 publications (Journals and conferences),
technical reports and books and gave a number of
keynote/invited lectures. Prof. Sinha is the associate
editor of 3 international journals, editorial board
member of 2 journals, and members of several
international conferences. Prof Sinha has started a series
of an International Conference of Maintenance
Engineering (IncoME) and the Journal of Maintenance
Engineering (JoME) from August 2016. He is also
technical committee member of IFTOMM
Rotordynamics.

221
ME2018_1138
Journey Towards Vessels Replacement Program Ahmad Al-Abdulqader South Ghawar producing Department, South Ghawar Maintenance Services Division,
Building 598, Saudi Aramco,
‘Udhailiyah-31311
Saudi Arabia
E mail: [email protected]
Abstract Saudi Aramco/ South Ghawar Producing Department has exerted sub-
stantial efforts towards executing a seldom project of replacing numbers of ex-
traordinary vessels (e.x: Weight: 160 ton, Dimensions: 150 ft long x 13 ft dia.)
during turnarounds. Several horizontal pressure vessels were recommended for re-
placement due to major and excessive Step Wise Cracking, irregular blister, inclu-
sions identified in several courses of the old non HIC (Hydrogen Induced Crack-
ing) resistance vessels. The presentation summarizes the most challenges and
obstacles experienced during execution phase and optimal way to handle such
mega project safely and successfully. Throughout the presentation, full implemen-
tations of the Re-Engineered Shutdown Process, maintaining a strong quality as-
surance plan, Planning and scheduling ahead of time, Managing work scope, con-
trolling the maintenance cost and setting a detailed on-site execution strategies ,
which are major factors to accomplish this critical millstone on time and with no
safety infractions, are addressed. Furthermore, several safety best practices that
have been implemented during the replacement program will be shared. Those
safety best practices have proven their effectiveness during such major events and
since then, they have been practiced and implemented in several turnaround across
different organisations. Saudi Aramco/ South Ghawar Producing Department be-
lieves that sharing such experience will be beneficial to all organisations.
Key words: Vessels replacement, HIC, T&I
1.0 Introduction
South Ghawar Producing Department (SGPD) operates 14 GOSPs extending
across a distance of 180 km from Haradh area to Mubarraz and going through
Uthmaniyah and Hawiyah.
Within these (14) facilities, around (121) vessels operating are in sour service.
Given the sour service and the material of construction, these vessels are suscepti-
ble to Hydrogen Induced Cracking, known as (HIC).

222
2.0 Types of Hydrogen Induced Cracking (HIC)
HIC is a subsurface crack parallel to the surface due to hydrogen blistering in Wet
Sour Service.
There are three types of HIC that could impact vessels:
1. First is the Linear HIC:-
Usually occurs when the H2 atoms start diffusing in the metallic structure.
2. The second type is the SWC, which is the most critical type of HIC damage. It
starts as multiple HIC’s, usually at 45 degree from each other and with time and
permeation of hydrogen, they form the step wise crack.
3. Third and usually at the base of the vessel, is the blister. All blisters start as an
HIC, but with time and the immigration of hydrogen it will transform into a blis-
ter.
To identify any development of these types of HIC in our vessels, SGPD, in col-
laboration with CSD and Inspection Department, was one of the first departments
in the company to complete a full assessment program during 2011 and 2014
3.0 Assessment Program The assessment program includes: Advanced NDT scanning, engineering evalua-
tion and fitness for service tests.
The comprehensive assessment revealed that 30 vessels out of our 121 vessels are
impacted with different types of HIC:
21 vessels as having SWC (step-wise cracking) and 9 vessels as having linear
HIC. In addition, some minor blisters.
The identification of this high number of impacted vessels generate several chal-
lenges to SGPD. Some of these challenges are:
1- The safe and reliable operation of these vessels which has always been
our first priority.
2- Continuation of production from these vessels
3- Also, controlling further development of HIC in the impacted and un-
impacted vessels
To overcome these challenges, we developed a robust action plan which consists
of two parts:
Long Term Plan … which is replacing the impacted vessels
And Short Term Plan to continue the safe and reliable operation of our impacted
vessels until the vessels are replaced.
4.0 Long Term Plan: For the long term plan, The major recommendation is to Replace (16) vessels out
of the (28) SWC impacted vessels. These 16 vessels have shown consistent HIC
growth.

223
As a result, BI-10-01522 was initiated with FPD to handle the replacement. The
cost of the BI is $ 124 MM with an ERA and ERC of October 2016 and October
2018 respectively.
It is worth noting that in 2013, the LPPT vessel at UGOSP-4 was in critical condi-
tion and required immediate action, SGPD led the engineering and execution of
the replacement in house. The vessel was purchased as part of a BI-19 project. It
cost around $ 2.3 MM and required (45) days of S/D.
This is an example of our vigilance to mitigate HIC issues without affecting our
safety or production continuity.
5.0 Short Term Plan It was very important to confirm that we can continue our production SAFELY
and RELIABLY until these vessels are replaced. To fulfill this:
1. De-rated all HIC affected vessels in accordance to Fitness of Service tests.
2. Conducted a detailed in-house relief study and accordingly we adjusted more
than 100 RVs’ set points, and all applicable ESD and operating set points, without
affecting our production capacity.
3. Increased the frequency of internal coating to extend the operating lives of these
vessels.
4. Established a semi-annual and annual ANDT testing, to closely monitor HIC
growth in the impacted and un-impacted vessels.
With the short and long term action plan, we controlled HIC concern in SGPD
vessels.
6.0 Conclusion
As Replacement program will continue till 2021. SGPD have established solid
program and control measures to manage and monitor HIC growth which is part
of SGPD commitment toward maintaining its production and preventing property
loss. Although the project considered as one of the challenge milestone, the execu-
tion phase was managed smoothly and safely with no incident that would not be
happen without well-developed execution plan and effective synergy between the
T&I l and project leaders.

224
ME2018_1140
Mono Sensor Empirical Curve-Fitting
Determination of Acoustic Attenuation
Coefficient for Pipeline Monitoring
Mohd S A M Yusoff1, P Mandal
1, Kassandra A. Papadopoulou
2,
Jyoti K Sinha1
1School of Mechanical, Aerospace and Civil Engineering. The University of Manchester, Oxford
Road, Manchester, M13 9PL, UK.
2Alliance Manchester Business School & School of Mechanical, Aerospace and Civil
Engineering. The University of Manchester, Oxford Road, Manchester, M13 9PL, UK.
Email: [email protected]; [email protected];
[email protected]; [email protected]
Abstract Acoustic pulse reflectometry is a monitoring method that offers non-
destructive detection by measuring the echo from leakages and blockages in pipe-
lines. In this paper, we present the fundamental study of wave propagation model
in a plane wave region for pipelines with different diameters and excitation fre-
quency of input pulse. The theoretical attenuation coefficient is established and
compared with attenuation coefficient obtained using single sensor acoustic pulse
reflectometry experiment and then proposed a modified equation.
Key words: acoustics; pulse reflectometry; attenuation coefficient, pipeline,
maintenance, inspection tool, leakage detection.
1.0 Introduction
Over the years, pipeline networks worldwide grow with the demand of energy and
are regarded as one of the integral parts of world economy. In 2014 the estimated
data on pipeline network in over 120 countries the world, gives a staggering total
of up 3.5 million km length of pipeline laid at various terrains around the world
[1]. In assuring a high standard of service, the conditions of these pipelines are to
maintain at the highest standard through multiple asset management procedures.
Although various method of non-destructive testing were introduced over the
years [2-4], the acoustic method offers many advantages as it offers a robust solu-
tion based on propagation model of sound wave in the fluid and acoustic media.
The fundamental of acoustic inspection application in pipelines rely on the infor-
mation of input signal and the responses from test object. Comparative analysis of

225
the input signal to the reflections permits to create a reconstruction model of the
defects within a remote section of any duct entity. Not only limited to engineering
solutions, method such as the ‘layer peeling algorithm’ is also used to reconstruct
musical instrument by analyzing the impulse response [5].
As sound travels along a medium, the losses occur depending on the travelling
media conditions. These losses will be the determining factors to the travelling po-
tential of an input signal used in the investigation. Studies on the propagation
model were carried out in two types of media i.e. the solid and the fluid domain of
the pipeline. Working in the solid media, the propagation model often deals with
greater complexity due to the occurrence of dispersion as the wave travel in its ul-
trasonic frequencies [6]. Identifying the responses in time domain is a difficult
process as the signal is often buried in the dispersive modes of propagation. The
time domain method is also limited to only detection of defects within solid do-
main of the pipe and limited length of investigation.
In maintaining pipeline integrities, early detections of blockages and leakages can
reduce the risk of failures [7]. Leakages due to severe corrosions or hydrates
blockages in gas pipeline have been detected by previous researchers using the
acoustic pulse reflectometry (APR) method [8]. A straight forward flight time cal-
culation will indicate the location of blockage, however, the severity such as the
percentage of blockage to the pipe diameter needs an additional signal processing
method. Contradictory to the ultrasonic method, the signal processing complexity
reduced in the APR. The less dispersive propagation is apparent in time domain
and would simply be truncated for further frequency based analysis.
Amir et al. [9-10] revealed that the presence of corrosion can be observed using
the APR method with findings such that the negative and positive reflections are
due to the constriction and dilation respectively. One of the most recent blockage
reconstruction methods is the use of power reflection ratio of the incident and the
reflections pulse to determine the geometry of blockage. Researcher established
that additional information of the blockage length can be reconstructed using the
phase change information of the incident wave and the reflection [11]. The factor
of attenuation used in the prediction was obtained from mathematical model and
can be improve with an empirical solution.
The APR method relies heavily on the input pulse signal or often referred as the
incident waves. It is a transient’s pulse where the width of the pulse determines
the frequency of signal. Although it is obvious from recent literature that lower
frequencies offer greater potential in term of inspection length[12] there are limi-
tations due to the dependencies of attenuation to the diameter of inspected pipe
and the cut-off frequency of plane wave propagation. It is very important for oper-
ators in real industrial application to understand the effect of attenuation during in-
spection apart from only the reflection from blockage’s impedance.
The effect of attenuation can be modelled by deriving the wave equation of sound
propagation in cylindrical duct. With the introduction of damping due to losses,
the decay of peak amplitude along the longitudinal distance from the source can
be established. This paper presents the analytical model of propagation within the
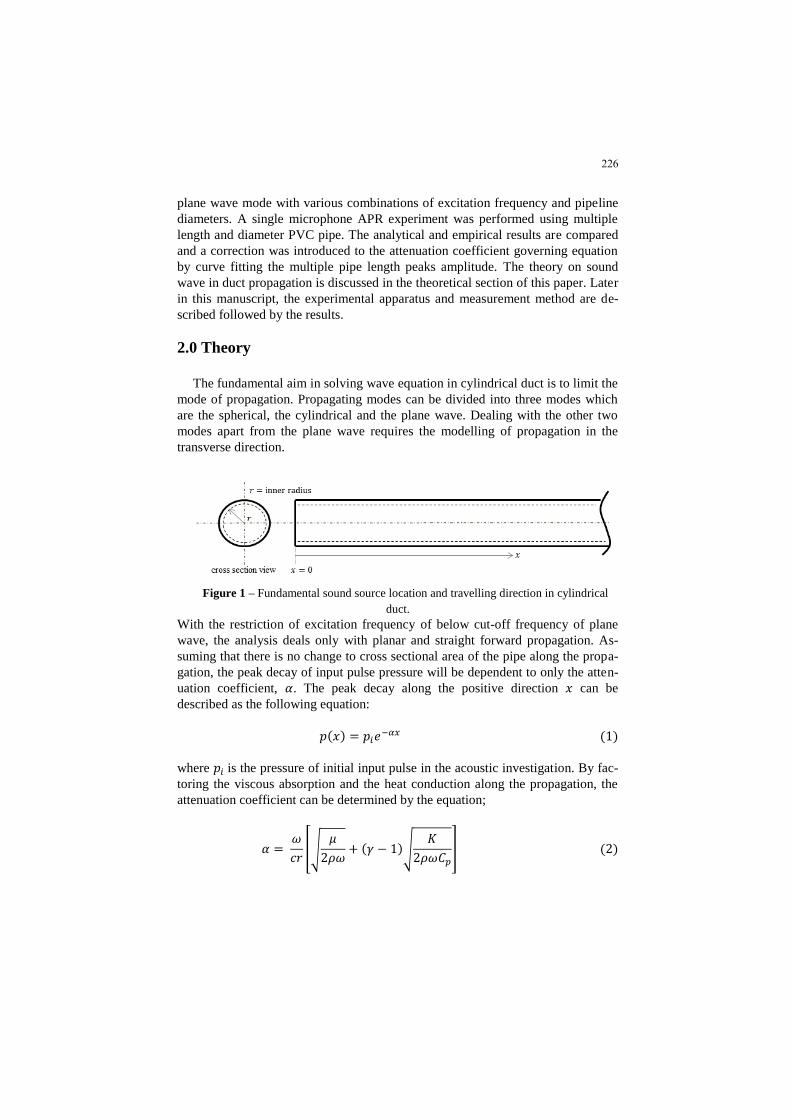
226
plane wave mode with various combinations of excitation frequency and pipeline
diameters. A single microphone APR experiment was performed using multiple
length and diameter PVC pipe. The analytical and empirical results are compared
and a correction was introduced to the attenuation coefficient governing equation
by curve fitting the multiple pipe length peaks amplitude. The theory on sound
wave in duct propagation is discussed in the theoretical section of this paper. Later
in this manuscript, the experimental apparatus and measurement method are de-
scribed followed by the results.
2.0 Theory
The fundamental aim in solving wave equation in cylindrical duct is to limit the
mode of propagation. Propagating modes can be divided into three modes which
are the spherical, the cylindrical and the plane wave. Dealing with the other two
modes apart from the plane wave requires the modelling of propagation in the
transverse direction.
Figure 1 – Fundamental sound source location and travelling direction in cylindrical
duct.
With the restriction of excitation frequency of below cut-off frequency of plane
wave, the analysis deals only with planar and straight forward propagation. As-
suming that there is no change to cross sectional area of the pipe along the propa-
gation, the peak decay of input pulse pressure will be dependent to only the atten-
uation coefficient, 𝛼. The peak decay along the positive direction 𝑥 can be
described as the following equation:
𝑝(𝑥) = 𝑝𝑖𝑒−𝛼𝑥 (1)
where 𝑝𝑖 is the pressure of initial input pulse in the acoustic investigation. By fac-
toring the viscous absorption and the heat conduction along the propagation, the
attenuation coefficient can be determined by the equation;
𝛼 = 𝜔
𝑐𝑟[√
𝜇
2𝜌𝜔+ (𝛾 − 1)√
𝐾
2𝜌𝜔𝐶𝑝
] (2)

227
where 𝜔 is the angular frequency, 𝑐 being the speed of sound of the medium
sound wave travelling in, 𝑟 is the pipe radius, 𝜇 is the shear viscosity, 𝜌 is the den-
sity, 𝛾 is the ratio of specific heat, 𝐾 is the thermal conductivity and 𝐶𝑝 is the heat
capacity. By determining the coefficient of attenuation, the peak decay rate of any
frequency of input sound wave signal can be obtained along the travelling time at
any particular distance from the source. As a result, the travelling potential of each
input pulse can be determine with the knowledge of excitation frequency and di-
ameter of the pipe.
3.0 Experimental set-up
A detailed study is conducted to determine the attenuation coefficient by exper-
iment. This experiment concentrated on the acquisition of responses from the var-
ious frequencies of input pulse. There are two variables that determine the attenua-
tion rate, which are the inner diameter of the pipe and the frequency of excitations.
In designing the experiment a clear aim was put in place for those two parameters,
diameter size and injected frequency. The experimental measurements are taken at
room temperature of 24 degree Celsius in isolated laboratory to eliminate the noise
during data acquisition (Figure 2). In validating the pipe end reflections, the speed
of sound, 𝑐 is taken to be 343.2 m/s with the density of air in the pipe 𝜌 =1.225 kg/m
2.
The signals are acquired through the microphone at sampling frequency of 40 kHz
using data acquisition program designed in LabVIEW software. Every test is taken
at a sampling period of 0.5𝑠. The excitation signals designed for every 𝑑𝑛𝐿𝑛 starts
at 𝑓𝑖 = 200 Hz up to 2 kHz for all tests. Subsequently, the attenuation rate of em-
pirical model is established from the rate of decay over time and distance based on
the speed of sound with assumption that there is zero damping from the loud-
speaker. The test is done on five different pipe lengths shown in Figure 3 for all
different pipe diameters with the travelling distance for every single reflection
measured as 2𝐿𝑛.
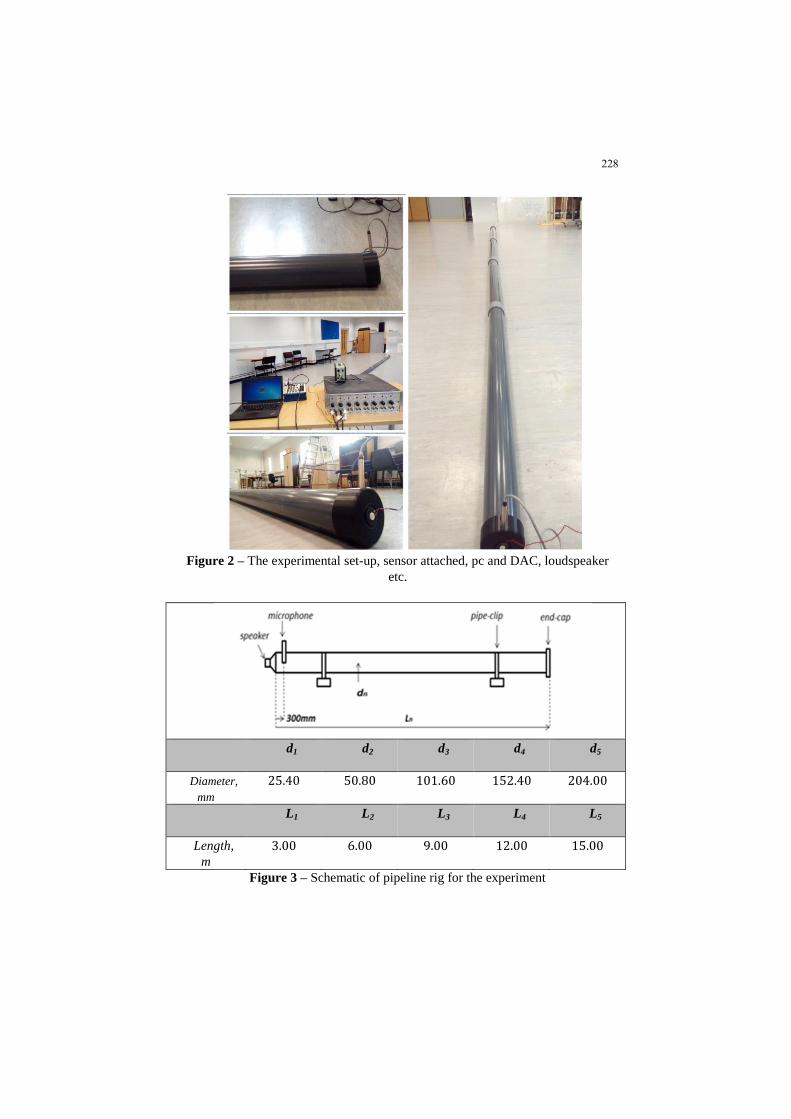
228
Figure 2 – The experimental set-up, sensor attached, pc and DAC, loudspeaker
etc.
d1 d2 d3 d4 d5
Diameter,
mm
25.40 50.80 101.60 152.40 204.00
L1 L2 L3 L4 L5
Length,
m
3.00 6.00 9.00 12.00 15.00
Figure 3 – Schematic of pipeline rig for the experiment

229
4.0 Results
With single microphone, it is shown that detection of propagation is possible with-
in time domain. All flight time calculations based on the speed of sound confirmed
that the visible reflections cross correlate to the experimentally acquired respons-
es. By observing the time domain responses, it was established that the first reflec-
tion peak as the incident wave and the following reflections were caused from the
pipe end. With no changes of cross sectional area, the losses from impedance at
the pipe end are assumed to be zero. From Figure 4 it can be observed that the
peak of reflection signal reduce over time and the rate of losses is less at lower
frequency excitation throughout the experiment.
Figure 4 – The typical time domain responses of 𝑑1𝐿2 at 300 Hz excitation[13]
From the peak amplitude acquired in Figure 5 and the exponential curve fit in Fig-
ure 6 the attenuation coefficient values for 𝑑1 based on the excitation frequency
are determined. With the establishment of the coefficient, 𝛼 by experiment, a cor-
rection factor can be introduced to the values obtained in analytical model. This
can be achieved by solving a non-linear regression of the variance (𝛼𝑒 − 𝛼) be-
tween the analytical solution and the experimental results against the frequency of
the excitation, where 𝛼𝑒 is the experimentally obtained coefficient. The variance
can be observed in Figure 7. However, the correction can only be accurate for a
particular 𝑑𝑛 due to the dependency of the attenuation to both, frequency and ra-
dius of pipe. For 𝑑5, as the frequency exceeded the plane wave limit, the attenua-
tion coefficient is influenced by higher order modes of excitation within the pipe.

230
Figure 5 – Peak amplitude acquired in experiment for 𝑑1 at sensor location
with consistent initial input pulse amplitude measured by distance travel,
Figure 6 – Typical exponential curve fit for 𝑑1 at 900 Hz

231
Figure 7 – Variance (𝛼𝑒 − 𝛼) between the analytical solution and the experi-
mental results [13].
Considering the variance of experimental and the analytical results, the correction
𝛽 to the initial equation (2) can be introduced for every frequency of excitation.
Therefore, an introduction of curve fit to the initial 𝛽 values for different 𝑑𝑛, yield
the modification to the attenuation equation, 𝛼𝑚.
𝛼𝑚 = (𝛼 + 𝛽) (3)
where 𝛽 is the different between the theory and experimental decay of peak from
table 3, which yield the new equation;
𝛽 = (0.0395 − 0.0001𝑟)𝑒−0.0012𝜋𝜔
(4)
5.0 Conclusions
The understanding of input pulse frequency is critical to the distance of investiga-
tion in APR application. Although the choices of lower frequency offers extended
distance of detection, the longer wavelength will reduce the sensitivity of detec-
tion. It is also shown through the experiments that the attenuation coefficient can
be observed with single sensor experiment for different pipe diameters and center

232
frequency of excitation. Hence, the determination of attenuation coefficient can be
made by exponential curve of peak decay along travelling distance with the as-
sumption that impedance from transceiver assembly is zero.
The attenuation coefficient obtained from empirical solution is higher than the
theoretical prediction; therefore the travelling input pulse energy dissipation is
higher in the experiment. This could be due to the laboratory condition that can
vary from the condition established for input used in the theoretical model. The
modified attenuation coefficient value can be factored into the acquired response
during pipeline detection for a better classification based on the amplitude change.
For real industrial applications, the determination procedure of attenuation coeffi-
cient introduced can be applied practically by having reasonable length of healthy
pipe and the future work is to include the losses from joints and other standard
components.
References
[1]
Oliver, M.E. (2015). Economies of scale and scope in expansion of the U.S.
natural gas pipeline network. Energy Economics, vol 52: pp.265–276.
[2] Morgan, E.S. and Crosse, P.A.E. (1978). The acoustic ranger, a new in-
strument for tube and pipe inspection. NDT International, vol 11(4) :
pp.179–183.
[3] Sharp, D.B.and Campbell D.M. (1997). “Leak detection in pipes using
acoustic pulse reflectometry”. Acta Acustica United Acustica, vol 83 :pp.
560–566.
[4] Lee, L.H., Rajkumar R., Lo, L. H., Wan C. H., and Isa D. (2013). Oil and
gas pipeline failure prediction system using long range ultrasonic transduc-
ers and Euclidean-Support Vector Machines classification approach. Expert
Systems with Applications, vol 40(6): pp.1925–1934.
[5] Sharp, D.B., (1996). Acoustic pulse reflectometry for the measurement of
musical wind instruments. PhD thesis University of Edinburgh
[6] Cawley, P. and Alleyne, D (1996). “The use of Lamb waves for the long
range inspection of large structures”. Ultrasonic, vol 34(2–5) : pp.287–290.
[7] Datta, S. and Sarkar, S. (2016). “A review on different pipeline fault detec-
tion methods”. Journal of Loss Prevention in the Process Industries, vol 41:
pp.97–106.
[8] Wang, X., Lewis, K.M., Papadopoulou, K.A., Lennox, B. and Turner, J.T.
(2012) Detection of hydrate and other blockages in gas pipelines using
acoustic reflectometry. Proceedings of the Institution of Mechanical Engi-
neers, Part C: Journal of Mechanical Engineering Science, vol 226(7):
pp.1800–1810.

233
[9] Amir, N., Rosenhouse, G., and Shimony, U. (1996). “Losses in tubular
acoustic systems - theory and experiment in the sampled time and frequen-
cy domains”. Acustica, vol 82(1): pp. 1-8
[10] Kirby, R. (2008), Modeling sound propagation in acoustic waveguides us-
ing a hybrid numerical method, Journal of Acoustical Society of America
vol 124: pp. 1930-1940
[11] Duan, W., Kirby R., Prisutova J. and Horoshenkov K.V. (2015). “On the
use of power reflection ratio and phase change to determine the geometry
of a blockage in a pipe”. Applied Acoustics, vol 87: pp.190–197.
[12] Loureiro Silva LL, Monteiro PC, Vidal JA, Netto TA. (2014) Acoustic Re-
flectometry for Blockage Detection in Pipeline. ASME. International Con-
ference on Offshore Mechanics and Arctic Engineering, Volume 6A: Pipe-
line and Riser Technology: V06AT04A027.
[13] Yusoff, M.S.A.M., (2018). Defect Detection in Pipeline Using Acoustic
Pulse Reflectometry. PhD thesis, The University of Manchester
Authors’ Biography
Mohd S A M Yusoff
Mohd S A M Yusoff is a Senior Engineer at Standard
and Research Institution of Malaysia (SIRIM) with over
17 year experience in the industry. Currently in his final
stage of PhD at The University of Manchester, UK. His
PhD research is in acoustic pipeline defect detection.
Parthasarathi Mandal
Dr Partha Mandal is a Reader at the University of
Manchester. His current research interest is primarily in
the area of bioengineering including tissue engineering.
He has supervised several PhD students on various
biological and clinically relevant medical problems. He
leads the Bio-engineering research theme within the
School of Mechanical, Aerospace and Civil Engineering.
He is also one of the co-directors of Manchester Institute
of Collaborative Research on Ageing (MICRA).

234
Kassandra A. Papadopoulou
Dr Kassandra A. Papadopoulou is a lecturer in Enter-
prise, in the Alliance Manchester Business School in The
University of Manchester. Previously she was a lecturer
in Reliability & Maintenance Engineering in the School
of Mechanical, Aerospace and Civil Engineering. Her
experience includes technology development in collabo-
ration with universities and industrial partners. She de-
veloped an acoustic inspection reflectometry tool,
Acoustek®, an award winning tool that was patented,
commercialised and licensed to Pipeline Engineering -
CIRCOR Energy. Her areas of research and teaching in-
clude: Innovation Management, Commercialisation of
Research, Reliability & Maintainability Engineering De-
sign, Risk Management, Acoustic Monitoring and
Blockchain Applications in the Oil & Gas. She lectured
on the BP Engineering Management Executive Educa-
tion Programme and worked closely with BP on her re-
search. She collaborates with the British University in
Dubai. She is a reviewer for the Journal of Applied
Acoustics and for the Journal of Marine Engineering &
Technology.
Jyoti K. Sinha, BSc(Mech), MTech(Aero), PhD, CEng, FIMechE
Prof Jyoti K. Sinha is Programme Director of Reliability
Engineering and Asset Management (REAM) MSc
course and Head, Dynamics Laboratory, School of
Mechanical, Aerospace and Civil Engineering, The
University of Manchester UK. The REAM course is an
industrially focused professional course on Maintenance
which is accredited by the IMechE UK. This course is
now completely on the international mission under his
leadership. Prof. Sinha is involved in and solved a
number of industrially applied research projects related
to Vibration-based Condition Monitoring and
Maintenance of Machines and Structures in last 28 years.
Prof. Sinha is the author of more than 250 publications
(Journals and conferences), technical reports and books
and gave a number of keynote/invited lectures. Prof.
Sinha is the associate editor of 3 international journals,
editorial board member of 2 journals, and members of
several international conferences. Prof Sinha has started
a series of an International Conference of Maintenance
Engineering (IncoME) and the Journal of Maintenance

235
Engineering (JoME) from August 2016. He is also
technical committee member of IFTOMM
Rotordynamics.

236
ME2018_1141
Reliability of Composite Materials based on
Accelerated Life Tests
J. Sobral1,2
, S. Rodrigues1
1Mechanical Engineering Department, ISEL - Instituto Superior de Engenharia de Lisboa,
Instituto Politécnico de Lisboa, Lisboa, Portugal.
2Centre for Marine Technology and Ocean Engineering (CENTEC), Instituto Superior Técnico,
Universidade de Lisboa, Lisbon, Portugal.
Email: [email protected]; [email protected]
Abstract As the demand for reliability information is increasingly frequent,
and sometimes mandatory, accelerated life tests are often used to obtain failure da-
ta on reduced time to forecast failures over longer usage periods.
The present work describes the main methods usually applied for accelerated life
tests, following models such as the Arrhenius model, Eyring model, the Inverse
Power Law model and the Temperature-Nonthermal model.
In order to implement the concepts it is presented a case study using a composite
material subjected to accelerated UV radiation. A degradation of its mechanical
properties was recorded over the exposure time through uniaxial tensile tests. With
the results obtained by accelerated life tests it was possible to understand failure
behaviour and to describe reliability prognostics for normal operating conditions
of such material. The methodology presented in this work can be applied to other
materials, components or systems in order to anticipate failures and give a com-
plete knowledge of their reliability over time without being necessary to wait for
real failure data.
Key words Reliability, Accelerated Life Test, UV Radiation, Fiberglass-Epoxy,
Accelerated degradation.
1.0 Introduction
One of the main concerns of maintenance activity is related to items or system
failures. The knowledge of reliability may be obtained by testing under normal
conditions or under accelerated conditions. The tests carried out under normal
conditions of use are carried out in conditions close to those of use of the items.
However, these tests are time-consuming since they require long periods of
testing. On the other hand, accelerated life tests allow faster results. They also

237
allow the determination of the life characteristics of an item in a few hours, days
or weeks which in normal conditions of use would take months or years to be
determined. Therefore, accelerated life testing is an added value to meet the
expectations concerning reliability, maintainability and availability.
In the present work it was performed a reliability analysis of composite materials
subjected to ultraviolet solar radiation based on accelerated life tests. The
importance of such study relies on the fact that composite materials under weather
conditions suffer a notorious degradation of their mechanical characteristics that is
important to know in the field of reliability and maintenance.
The paper is organized into 6 sections. Section 1refers to a brief introduction of
the topic, Section 2 deals with reliability and accelerated life tests and Section 3
presents some characteristics of composite materials and their mechanical
degradation mechanism under ultraviolet exposure. Section 4 presents the case
study performed and the results obtained regarding a reliability forecast based on
some models. In Section 5 are stated some conclusions and future works that can
be developed in the follow-up of the present study.
2.0 Reliability and Accelerated Life Tests
The maintenance and reliability of components and systems have become more
important than ever. Global competition and other associated factors have made
manufacturers to produce highly reliable and easily maintained engineering items.
Nowadays, the reliability of engineering systems has become an important issue
because of the increasing reliance on the satisfactory functioning of these systems
[1] [2]. The following paragraphs present some information about the most
common reliability models and about accelerated life tests and some models
usually used for reliability determination.
Reliability means the probability of success (or probability of non-occurrence of a
failure) of an item within a certain time horizon. It results from the design and the
quality (intrinsic characteristics) and, on the other hand, on the loading and
environmental conditions in which its operation will take place (extrinsic
characteristics) [3].Reliability is then the probability of a component, product or
system to perform its designed functions without fail, in a specified environment,
for a desired period, in a given confidence interval [4]. The Mean Time to Failure
(MTTF) can be determined by the statistical mean of the failure times of the
various components of the sample tested, and can be mathematically defined as
[5]:
𝑀𝑇𝑇𝐹 = ∫ 𝑅(𝑡)𝑑𝑡∞
0 (1)
There are several probability distribution functions that allow to describe the fault
characteristics of components. The most frequently probability distributions used
to represent component life phenomena are:

238
Weibull distribution;
Normal distribution;
Exponential distribution;
Lognormal distribution.
Each one of these distributions is characterized by a probability density function
f(t) that represents an instantaneous probability. This function represents the
percentage of components that are failing per unit time, relative to initial
population N0, at time t (or time interval dt). By integrating the function f(t)
between zero and a time t, it is obtained the cumulative probability of failure F(t)
as:
𝐹(𝑡) = ∫ 𝑓(𝑡)𝑑𝑡𝑡
0 (2)
Thus, for the reliability point of view the difficulty is to obtain information about
failures (life data) that allows adjusting the most appropriate distribution.
Life data analysis usually involves the analysis of times to failure obtained under
normal operating conditions. However, obtaining these life data can be difficult.
As it is fundamental to observe product failures for a better understanding of
failure modes and their characteristic life, that is, to obtain reliable data, it was
necessary to develop methods to force products to fail earlier, that is, to accelerate
their failures.
These methods are called Accelerated Life Tests (ALT), which aims to accelerate
faults for the purpose of quantifying the life characteristics of a product under
normal service conditions.
According to Hietala et al. [6] accelerated life tests refer to "a deterioration /
aging induced in a component to cause normal failures, operating at levels of
requests much greater than would be expected under normal conditions of use".
According to Pallerosi [7] the accelerated tests are tests in which the applied levels
of request are chosen so as to exceed the values specified in the reference
conditions, in order to reduce the time required to observe the reaction of the
component or to amplify this reaction over a period of time.
To be valid, the accelerated test shall not change the basic failure modes and
failure mechanisms.
The main objective of quantitative accelerated life tests is to obtain information
about the time to failure to understand and predict the failure modes and to be able
to proactively act on them [8].
Escobar [9] defines that accelerated life tests are divided into qualitative
accelerated life tests and quantitative accelerated life tests. Accelerated qualitative
life tests only identify failures and failure modes that potentially may occur
without making any predictions of product life under normal conditions of use. On
the other hand, quantitative accelerated life tests allow making predictions of the
life of an item under its normal operating conditions, with data obtained on
accelerated life tests.
Table 1 shows the main differences between the quantitative and qualitative
accelerated life tests.

239
Table 1 Main difference between qualitative and quantitative accelerated life tests
Qualitative
Accelerated
Life Test
Objective:
- Failure detection on design and product development - Improvement of product reliability
Test requirements:
- Detailed knowledge about the item under test
- Personal experience about life tests
Mathematical models:
- No mathematical/statistical models
Quantitative
Accelerated
Life Test
Objective:
- Determination of time to failure distribution - Obtain information about degradation process
- Identify the dominant failure mechanisms
Test requirements:
- Detailed test plan (duration, number of samples, confidence
interval, acceleration factors and test environment)
Mathematical models:
- Stress-life relationship: Arrhenius, Eyring, Coffin-Manson, Norris-Lanzberg, …
- Probability distribution: Weibull, Lognormal, Exponential, …
The quantitative tests can be divided into two main methods, namely regarding the
one that increase the operating rate and the one regarding the increase in the wear
rate. For items that do not operate in a continuous way, the time is accelerated
until failures appear, increasing the utilisation rate of these items. This type of test
is called "Usage Rate Acceleration". On the other hand, it is possible to increase
the level of stress to which the component is exposed. This type of test is called
"Overstress Acceleration" [8]. The interpretation of the data obtained through
accelerated tests requires models that relate acceleration variables (such as
temperature, radiation, voltage or pressure) with the acceleration of time. The
general idea is to test the acceleration variable(s) at high levels to accelerate the
fault process and then to extrapolate to lower stress levels [9]. According to
Pallerosi [7] there are several mathematical models of accelerated tests, being the
most common the Arrhenius relationship, the Eyring relationship, the Inverse
Power Law, the Temperature-Humidity Ratio and the Non-Thermal Thermal
Ratio.
According to Elsayed [5] there are four types of models to relate the fault data in
accelerated conditions with reliability measures:
• Parametric statistical models;
• Non-parametric statistical models;
• Physical-statistical models;
• Physical-experimental models.
When using any of the models it is necessary to verify that components operating
under normal conditions have the same failure mechanism as those under
accelerated test conditions.

240
3.0 Composite Materials and Degradation
Currently composite materials are used in applications where it is desired to obtain
improved properties than those achieved with common heterogeneous materials.
According to ASTM D3878 [10], composite materials are defined as "a substance
consisting of two or more materials, insoluble in each other, which are combined
to form an engineered material with mechanical properties different from its
phases constituents".
In general, composite materials consist of two materials: a reinforcing material
called fibre and a matrix material. These two materials differ in shape, chemical
composition and properties. Their union provides a different set of constituent
parts, maintaining their individuality, that is, they do not completely dissolve or
merge into one another, although they act together, forming a material with the
best mechanical properties of its constituents than the materials conventional
methods [11]. The resulting material has heterogeneous and anisotropic properties,
ie, it presents more than one phase and its mechanical properties depend on the
direction of the fibres [12].
Stiffness, mechanical strength, low weight, corrosion resistance, adjustable
thermal properties, fatigue life and wear resistance are some of the properties that
can be improved through the formation of composite materials.
Taking into account all these advantages of using composite materials, its
application has grown and has covered several areas such as aeronautics,
shipbuilding, automotive and biomedical applications, among others, making its
application advantageous over traditional materials [13].
When composite materials are in an outdoor environment, they are subject to
various environmental conditions, from high and low temperatures, solar
radiation, rain, moisture and erosion. These conditions can directly affect
mechanical properties and endanger structures and components. In certain
materials the degradation caused by solar radiation is determinant.
The UV radiation present in the solar spectrum and the humidity are the two main
environmental factors that directly affect the physicochemical properties of the
composite materials, causing the molecular structure to break down [14].
UV radiation represents a portion of the solar spectrum and plays a very important
role in many processes in the biosphere. It has many benefits, but can be quite
harmful when in excessive values. UV radiation is an electromagnetic radiation
with a wavelength between 100 and 400 nm [15] and has wavelengths shorter than
visible light and larger than X-rays. UV radiation constitutes about 10% of the
total light emitted by the sun.
UV radiation is usually divided into UVA, UVB and UVC radiation [16]. UVA
radiation constitutes 99% of the solar radiation that reaches the ground. The UVB
radiation constitutes the remaining 1%, being the radiation that causes the greater
visible damages in the skin of humans. The C component of UV radiation does not
reach the ground as it is absorbed by the ozone layer and oxygen.

241
The knowledge of the degradation of composite materials is of the utmost
importance for the full knowledge of its behaviour when subjected to the
conditions of use.
The degradation caused by solar radiation is called photodecomposition and
involves the degradation of the material through UV rays. This degradation arises
as discoloration, loss of brightness, cracks, loss of mechanical resistance or
disintegration of the material. The effects of UV attack increase with exposure
time and the intensity of sunlight. This degradation can be reduced with the use of
UV absorbers inhibiting its effect.
In order to evaluate the degradation of composite materials under normal service
conditions, they can be subjected to accelerated life tests or to tests under normal
operating conditions. For composite materials, the temperature, UV radiation and
humidity are normally used as stress variables.
Next Section presents a case study performed on composite material using
accelerated life tests and for reliability and maintenance purposes.
4.0 Case Study
The main objective of the study is to analyse the accelerated degradation of
polymeric materials through the rapid aging caused by the simulation of sunlight
obtained by ultraviolet radiation lamps.
In a more detailed way, it is intended to make samples of glass fibre mat and
polymer matrix (epoxy resin) that will be subjected to solar radiation emitted by
UV lamps simulating the radiation emitted by the sun. These samples will be
exposed to different exposure times (32, 64, 96 and 128 hours). The light emitted
by the lamps will physically and chemically degrade the samples, causing colour
change, cracking and degradation of the mechanical properties of the samples. To
prove this, they will be subjected to tensile tests, where it is intended to compare
the mechanical properties of the samples at different exposure times.
After obtaining the different values of the mechanical properties for the different
exposure times it is intended to carry out a study about reliability. Through the
results obtained in the accelerated life tests it is possible to extrapolate reliable
data for normal exposure (sun).
For the acquisition of UV intensity value it was used the ML8511 sensor. The
ML8511 is equipped with an internal amplifier that converts photo-current to
voltage depending on the UV intensity. The sensor produces an analogic voltage
that is linearly related to the measured UV intensity [mW/cm2].
It was also necessary to build a chamber to place the samples of composite
materials under the effect of the UV lamps.
The samples were manufactured taking into account the standards ASTM 3039
[17] and ISO 527-1 [18].
Taking into account the ASTM D 3039 [17], it is defined that at least five samples
should be used in a tensile test for each test condition. Table 2 describes a
compilation of the conditions of the UV radiation test.

242
Table 2 Test conditions Temperature inside test chamber 50.8 ºC
Temperature outside test chamber 27 - 29 ºC Relative Humidity inside test chamber 10.1 %
UV radiation intensity inside test chamber 17.7 W/m2
At the end of the exposure time for each group of samples an evaluation is
performed to determine the properties as a function of the exposure time. These
properties are analysed through tensile tests, where the specimens were tested until
fracture occurs. To obtain the corresponding data referred to normal conditions it
is necessary to have knowledge of the real UV intensity to which a sample would
be exposed. In the case study were used values of UV Index in the city of Lisbon
for 2016. The value used for the analysis performed in the work was the average
UV intensity so that it can be compared with the intensity of the UV emission
lamps.
In order to ensure the reproducibility of results, the test conditions and procedures
are in accordance with the standards or specifications and shall be recorded in the
test report whenever deviations occur. With the monitoring of the test it is possible
to obtain the tension-extension response, such as tensile strength, tensile modulus
of elasticity and Poisson's coefficient. The tensile strength, also known as the
ultimate tensile force, is given by the division between the maximum load just
before the failure and the cross-sectional area of the specimen.
After carrying out all the tensile tests and obtaining the mechanical properties of
the samples for the different exposure times to the test conditions, an analysis of
the obtained results is then possible. Table 3 shows the different values of the
ultimate tensile force obtained for the different samples as a function of the
exposure time.
Table 3 Results
Exposure
Time [h] Ultimate Tensile Force [MPa]
Mean
[MPa]
Standard
Deviation
[MPa]
0 90.76 97.85 117.08 116.31 108.67 106.13 11.02
32 95.23 124.55 99.76 91.34 85.88 99.35 13.40
64 94.10 89.44 77.56 91.32 88.91 88.27 5.65
96 82.11 81.73 86.43 90.21 83.80 84.86 3.15
128 71.17 70.87 78.76 85.35 74.07 76.04 5.45
With the increase of the time of exposure simulated by the UV radiation lamps, it
is verified that the mechanical resistance decreases progressively, that is, as
expected the specimen breaks down in smaller tensile forces with the increase of
the exposure time. Another important change that also occurred in the material
was the change in its colour. This change of colour is caused by photo oxidation
achieved by UV radiation that degrades the epoxy resin making it less resistant.

243
Then it is time to proceed to the application of the accelerated life test model and
present the conclusions about reliability prognosis for the composite materials
under analysis. Reliability analysis will be performed taking into account two
approaches. The first approach aims at implementing the Inverse Power Law
model, where UV radiation is considered the stress variable. The second approach
involves the use of the Non-Thermal Thermal model that considers two variables
(the temperature and the UV radiation).
To determine the statistical distribution that best characterizes the data used, were
used adherence tests (Kolmogorov-Smirnov test, correlation coefficient test,
likelihood value test) to determine which one best fits the considered data set.
Taking into account the data obtained in the accelerated tests, the Lognormal
distribution is the one that best fits the input data. After choosing the statistical
distribution, it is necessary to define the most appropriate degradation model
(linear, exponential, power, logarithm, Lloyd-Lipow) to represent the change of
the location parameter with time. These models can be used to predict when the
degradation of a particular unit reaches a default level of failure.
Table 4 shows the different estimated times for different values of reliability,
namely for 90%, 75% and 50% for different stress levels (5, 10, 15, 20, 25, 30, 35,
40, 45, 50, 55, 60, 65, 70, 75, 80 MPa).
Table 4 Times related to several critical tension and reliability requirements R(t)=0.90 R(t)=0.75 R(t)=0.50
Crit
ical
Ten
sio
n [
MP
a]
5 1222.5 1243.5 1266.9
10 935.1 956.1 979.5
15 767.0 788.0 811.4
20 647.7 668.7 692.1
25 555.2 576.2 599.6
30 479.6 500.6 524.4
35 415.7 436.7 460.1
40 360.3 381.3 404.7
45 311.4 332.5 355.9
50 267.8 288.8 312.2
55 228.2 249.3 272.7
60 192.2 213.2 236.6
65 159.0 180.0 203.4
70 128.3 149.3 172.7
75 99.6 120.7 144.1
80 72.9 93.9 117.3
It was also simulated the same approach but considering two variables of stress
(UV radiation and temperature). The model of extrapolation that contemplates
these two variables is the Thermal Non-Thermal model. This model considers two
variables, one thermal and the other non-thermal, and results in the combination of
the Arrhenius model and the Inverse Power Law model.
It was observed that the statistical distribution that best fits the data is again the
Lognormal distribution and the degradation model is again the Linear one.

244
A comparison between the two simulations shows that the results obtained are
very similar, with a deviation lower than 10%. It is verified that the life
expectancy using the Inverse Power Law model is higher than when using the
Thermal Non-Thermal model. This was expected once in the second approach the
material faces two variables of stress. However, it is noticeable that temperature
has not a great influence on material life expectancy.
5.0 Conclusions
The use of accelerated life tests is very important for the development of new
materials and new solutions for engineering because in this way it is possible to
make predictions of materials life.
However when carrying out the accelerated life tests, it is necessary to make sure
that the stresses that are induced in the items under study do not cause different
failure modes than those that would happen in normal conditions of usage.
The main objective of the present study was to obtain degradation data of the
mechanical properties of composed material exposed to UV radiation. This
degradation was achieved through two UV lamps that simulate the effect of solar
radiation in an accelerated way. The degradation of the materials was achieved by
tensile tests.
In the tensile tests it was possible to prove the degradation of the mechanical
properties of the samples when exposed to UV radiation.
It was verified that the analysed properties (ultimate stress and modulus of
elasticity) degraded with the time of exposure to UV radiation. The UV radiation
directly degrades the epoxy resin that is present in the samples also causing photo-
oxidation. The main objective of the work was to demonstrate that is possible to
obtain reliable data for normal conditions based on accelerated life tests.
After defining the distribution that best fits, the degradation model and the
mathematical model it was possible to obtain reliability data for normal
conditions.
A special comment should be done once the results obtained with the accelerated
tests were different from those initially expected. It was found that the reliability
for the samples under normal conditions of use is very low, values which were
expected to be higher taking into account that the UV radiation achieved in the
chamber using two UV lamps was about 99.83 times higher than the radiation that
a sample would be exposed under normal conditions of use. In order to validate
these results obtained it will be necessary to expose the samples to normal
conditions of use during the referred time and analyse their degradation in order to
be able to prove the results achieved and prove the advantages of accelerated life
tests.

245
References
[1] Dhillon, B. S., 2006. Maintainability, Maintenance, and Reliability for Engi-
neers. ISBN 9781420006780. Boca Raton: CRC Press.
[2] Dhillon, B. S., 2002. Engineering Maintenance – A modern approach. ISBN
9781420031843.Boca Raton: CRC Press.
[3] Assis, R., 1997. Manutenção Centrada na Fiabilidade – Economia das decisões
(in portuguese). ISBN 9789727570379. LIDEL.
[4] Kececioglu, D., 2002. Reliability Engineering Handbook - Volume1. ISBN
978-1-932078-00-8. DEStech Publications Inc.
[5] Elsayed, E.A., 1996. Reliability Engineering 2nd
Edition. ISBN 978-
1118137192. Wiley.
[6] Hietala, J.P., Ojala, P., Multanen, P., Miettinen, J. and Saarenrinne, P., 2017.
Development of process for adaptive lifetime estimation of mechanical as-
semblies using accelerated testing methods. Risk, Reliability and Safety: In-
novating Theory and Practice: Proceedings of ESREL 2016, Glasgow, Scot-
land. CRC Press; Taylor & Francis.
[7] Pallerosi, C.A., 2007 Confiabilidade, a Quarta Dimensão da Qualidade Ensaios
Acelerados. 1st Edition. Reliasoft Brasil.
[8] Müller, A., and Hinz, M., 2017. Optimisation of the dental implant testing
based on FEM simulation of fatigue and accelerated life. Risk, Reliability
and Safety: Innovating Theory and Practice: Proceedings of ESREL 2016,
Glasgow, Scotland. CRC Press; Taylor & Francis.
[9] Escobar, L.A., and Meeker, W.Q., 2007. A Review of Accelerated Test Mod-
els. Statistical Science, 21(4), pp. 552–577.
[10] ASTM D3878, 2015. Standard Terminology for Composite Materials. ASTM
International, West Conshohocken, PA.
[11] Reddy, J.N., 2004. Mechanics of Laminated Composite Plates and Shells:
Theory and Analysis. ISBN 9780849315923. CRC Press; Taylor & Francis.
[12] Gay, D., and Hoa, S.V., 2003. Composite Materials – Design and Applica-
tions – 2nd
Edition. ISBN 978-1420045192. CRC Press; Taylor & Francis.
[13] Adams, R., and Advani, S., 2001. ASM Handbook - Composites – Vol. 21.
ISBN 978-0-87170-703-1. ASM International, Ohio.
[14] Kumar, B.G., and Singh, R.P., 2002. Degradation of Carbon Fiber-reinforced.
Journal of Composite Materials, 36(24), pp. 2713–2733.
[15] ISO 21348, 2007. Space environment (natural and artificial) - Process for de-
termining solar irradiances. International Organisation for Standardisation.
[16] Fioletov, V., and Kerr, J.B., 2010. The UV index: Definition, distribution and
factors affecting it. Canadian Journal of Public Health, 101(4), pp. 15–19.
[17] ASTM D3039 / D3039M-17, 2017. Standard Test Method for Tensile Proper-
ties of Polymer Matrix Composite Materials. ASTM International, West
Conshohocken, PA
[18] ISO 527-1, 2012. Plastics - Determination of tensile properties - Part 1: Gen-
eral principles. International Organisation for Standardisation.

246
Authors’ Biography
José Sobral
José Sobral is an Assistant Professor in the Mechanical
Engineering Department of Instituto Superior de
Engenharia de Lisboa (ISEL) since 2005. He has a PhD
in Mechanical Engineering and a MSc on Industrial
Maintenance. The main areas of investigation are
Maintenance, Asset Management and Reliability,
Availability, Maintainability and Safety. Currently José
Sobral is a researcher of CENTEC (Centre for Marine
Technology and Ocean Engineering). He is author and
co-author of several scientific publications and
communications in international scientific meetings.
José Sobral is supervisor of several MSc thesis in the
Maintenance, Reliability and Safety area.
Sara Rodrigues
Sara Rodrigues is graduated from Instituto Superior de
Engenharia de Lisboa (ISEL) and finished her master’s
degree in Mechanical Engineering in the 2018. For 2
years (2015-2017) she was Monitor in the Instituto
Superior de Engenharia de Lisboa collaborating in
activities to support teachers and students. She is
currently a Junior Engineer at Ahlers Lindley Lda. (1
year), where she plans, organizes and develops projects
in development of floating solutions for marinas and
docks as well as navigation aids.

247
ME2018_1142
Identification of Outliers in Failure Data
J. Sobral1,2
, C. Guedes Soares2
1Mechanical Engineering Department, ISEL - Instituto Superior de Engenharia de Lisboa,
Instituto Politécnico de Lisboa, Lisboa, Portugal.
2Centre for Marine Technology and Ocean Engineering (CENTEC), Instituto Superior Técnico,
Universidade de Lisboa, Lisbon, Portugal.
Email: [email protected]; [email protected]
Abstract A review of tests that can be used to identify outliers from failure data
is conducted. The tests allow performing a more accurate analysis of maintenance
related data, as required to define the best maintenance strategies. This is im-
portant for condition based maintenance in particular for predictive analytics. On
the other hand, the increasing use of Big Data and the necessity to select only the
“good data” through the implementation of intelligent algorithms brings up the
importance of these methodologies. Tests like the Simple Test, the Grubbs Outlier
Test, the Natrella-Dixon Outlier Test, the Rank Limits Test or the Modified
Thompson Tau Test are presented showing inherent characteristics and describing
how to apply them. Based on these tests it is possible to clean erroneous data usu-
ally mixed with important failure data and understand their influence on the accu-
racy of the estimation of reliability and life characteristics.
Key words reliability, statistical distributions, outliers, data quality.
1.0 Introduction
Reliability analysis is often performed to estimate the behaviour of items in time
and give inherent information as for example the probability of failure in a given
period or the failure rate on a given instant. This type of analysis allows to under-
stand items characteristics and to define strategies for maintenance and operation
of such items. Industry, and particularly some areas such as the nuclear or the pe-
troleum, petrochemical and natural gas industries, pay great attention to equipment
safety, availability, reliability and maintainability. The unavailability and related
costs are sometimes very high and some failures can have a huge impact on safety.
Thus, failure data, failure mechanisms and the operational data are crucial to de-
velop accurate analysis and define the adequate strategic decisions. To be effective
and decisive, a good quality of data is vital.

248
For managers and engineers data collection can be seen as an investment because
for most of the installations it can be necessary to have data covering several years
of operation to give confident analysis results. To perform more accurate reliabil-
ity analysis it is fundamental to have data that can be given by manufacturers, be
collected in the field or even simulated. Field data is undoubtedly more adequate
and realistic once it interprets the real conditions of operation of the item and thus
more appropriate to use in the analysis.
However, field data is not always faithful due to some human and technologic dif-
ficulties when gathering the condition or degradation parameter under observation.
To overcome this situation it must be looked the quality of data by identifying
possible outliers.
The quality of data undoubtedly plays a great role on a successful data analysis,
mainly when the results of such analysis are the basis for technical and strategic
decisions in the maintenance field. This has a special importance when data analy-
sis gives information to define maintenance activities upon a condition based
maintenance (CBM) strategy applied to physical assets. This allows predicting the
right moment to perform maintenance. Assuming the importance of good data as
the primary objective it is fundamental to describe how to achieve this goal
through some tests just to discard bad data (outliers).
Based on this, the paper is structured into four sections. The first one is an intro-
duction about the theme and the importance of having a good quality data, section
2 refers to data quality and data characteristics, section 3 presents and details some
tests to identify possible outliers and section 5 presents some conclusions about
the developed work.
2.0 Quality of data
In accordance to ISO 14224 [1] the confidence in the collected reliability and
maintenance data, and further analysis using the gathered information, is highly
dependent on the quality of the data collected. According to this standard high-
quality data are characterized by the following:
• Completeness of data in relation to specification;
• Compliance with definitions of reliability parameters, data types and formats;
• Accurate input, transfer, handling and storage of data (manually or electronic);
• Sufficient population and adequate surveillance period to give statistical confi-
dence;
• Relevance of the data to the need of the users.
There are some measures that should be taken prior to the starting of the data col-
lection process, which will be important for the achievement of the objectives of
any study or analysis. The data collected must be relevant taking into account the
objective or purpose of the analysis to be performed, no matter if it is a Quantita-
tive Risk Analysis (QRA), a Reliability, Availability and Maintainability Analysis

249
(RAM), the development of a Reliability-Centred Maintenance (RCM) or a Life
Cycle Cost Analysis (LCCA). Then, the sources of such data must be checked to
see their quality. The taxonomical information to be included in the database must
be defined, as well as other important information (population, operating period,
etc.). It is also very important to define the boundaries for equipment and use clear
definitions for failure and their classification.
Merino et al. [2] refer that in a Big Data environment the management of quality
of the data becomes a challenge. They refer that despite the existence of data qual-
ity models, none of them have been adapted to the reality of Big Data. In fact, re-
cent developments regarding the fourth industrial revolution bring new challenges
for the management of cyber-physical systems and data analytics.
Big data brings lots of “big errors” in data quality and data usage. This felling was
presented by Liu et al. [3] that summarize the problems faced by current big data
studies with regard to data collection, processing and analysis. The authors refer
these problems where include inauthentic data collection, information incomplete-
ness and noise of big data, unrepresentativeness, consistency and reliability, and
ethical issues.
Song et al. [4] point out that the issue of data quality is common in any cyber-
physical system bringing great challenges to its efficient operation referring in
their work how to deal with defective data generated by improper operation. Re-
garding equipment (cyber-physical or not) and the data related to their operation
and maintenance there are some works where data quality is referred as fundamen-
tal to achieve good analysis and good decisions. Madhikermi et al. [5] present a
paper where state that the quality of enterprise maintenance services are closely
linked to the quality of maintenance data and associate the poor reported data to
wrong decisions and loss of money. Based on this the authors developed a mainte-
nance reporting quality assessment dashboard allowing to assess or rank mainte-
nance data quality. Bicalho et al. [6] focus the role of an organisation in the Life
Cycle Assessment data collection process and investigate the adequacy of this
process on data quality. In fact, data quality has a fundamental role in a positive
analysis. In industry, regarding maintenance and reliability, the main categories of
data to be collected are [1]:
• Equipment data (e.g. equipment taxonomy, equipment attributes);
• Failure data (e.g. failure cause, failure consequence);
• Maintenance data (e.g. maintenance action, resources used, maintenance con-
sequence, down time).
The main areas where such data are used are reliability (e.g. failure events and
failure mechanisms), availability/efficiency (e.g. equipment availability, system
availability, plant production availability), maintenance (e.g. corrective and pre-
ventive maintenance, maintenance plan, maintenance supportability) and safety
and environment (e.g. equipment failures with adverse consequences for safety
and/or environment).
The importance of data quality and the inherent data analysis is illustrated in Fig-
ure 1 showing the feedback and impact of that analysis on design and manufactur-

250
ing, on the improvement of a concept or on adjustments and modifications from
operation and maintenance.
DESIGN / MANUFACTURING
OPERATION AND MAINTENANCE
FAILURE AND MAINTENANCE
EVENTS DATA
ANALYSISADJUSTMENTS AND
MODIFICATIONSCONCEPT
IMPROVEMENT
Figure 1 Feedback of data analysis (adapted from [1])
3.0 Outliers and identification methods
For the quantitative evaluation of a system reliability and maintainability it is im-
portant to estimate accurate distribution parameters using the observed equipment
collected data using statistical techniques. In failure analysis, and regarding times
to failure (TTF) or times to repair (TTR) it is common to have in data some mis-
leading data or outliers. Once cleaned of these outliers the data will be purified for
subsequent parametrically analysis and better results for reliability or maintaina-
bility will be achieved. The process that usually is used to perform a reliability
analysis is shown in Figure 2.
DISTRIBUTION ASSUMPTION
PARAMETER ESTIMATION
GOODNESS-OF-FIT TEST
ACCEPT
NODISTRIBUTION CANDIDATES
YESBEST
DISTRIBUTION
RELIABILITY ANALYSIS
DATA ANALYSIS
DATA COLLECTION
FIELD DATA
MANUFACTURER DATA
Figure 2 Reliability analysis process (adapted from [7])
To find the best or most appropriate distribution that describes the data there are
several steps to be taken into account:

251
1. The first step refers to data collection given by the manufacturer or gathered
from field by manual or automatic means;
2. Follows an analysis of the data collected in a way to “clean” it from possible
errors reflected by the existence of outliers;
3. After data analysis one can establish some distributions a priori as potentially
candidates for the reliability analysis. These distributions, referred by their
probability density functions, usually include distributions as the Exponen-
tial, Normal, Lognormal, Weibull, Gamma, or others. A single distribution
will be assumed at this stage just to pursue the next steps;
4. The estimation of the parameters for the assumed distribution can be per-
formed using methods as the least squares, the matching moments, the modi-
fied moments, the maximum likelihood or probability plotting.
5. There are several goodness-of-fit tests that can be used to find out if the as-
sumed distribution fits the sample data as the chi-squared, the Kolmogorov-
Smirnov, the correlation coefficient, the likelihood ratio and the Anderson-
Darling or Cramer-von Mises tests, among others. If the assumed distribution
is accepted it will be placed as a candidate for the analysis and steps 3, 4 and
5 must be repeated choosing a different distribution in step 3. If the assumed
distribution is rejected it will be discarded and steps 3, 4 and 5 are repeated
until all the distributions be evaluated;
6. The best distribution is selected comparing the sample values of the good-
ness-of-fit statistic of all distribution candidates. The goodness of the estima-
tors can be, for example, measured by their consistency, biasedness, efficien-
cy or variance;
7. The selected distribution will be used to evaluate the item reliability.
The present work is focused in step 2 of the reliability analysis process presenting
some tests to identify outliers in a sample data. With this procedure a more accu-
rate estimation of all life characteristics is determined. The objective is to identify
outliers in a sample of a set of time to failure observations (TTF). The outliers are
observations points that are distant from other observations and appears to deviate
markedly from other members of the sample in which it occurs [8] or is an obser-
vation that is far removed from the rest of the observations [9].
These outliers are values that are very low or very high in the set of observations
and may be the result from the faulty data, variability of measurement, human er-
ror when calculating or recording the numerical value or even related to a failure
that occurred in special conditions that should not be mixed with regular failures.
It can also point out that an experimental error is occurring or be the result of
gross deviation from prescribed experimental procedure. It can also be verified in
a plotting paper where some points are substantially below or above the fitted line.
For heavy-tailed distributions with high skewness one must be cautious if using
tools or methods that assume a normal distribution. Thus, it is very important to
discard these outliers and promote a better quality of the data for the further steps
illustrated in Figure 2, avoiding a naive interpretation of the results of a reliability
analysis.

252
Several studies and publications can be referred where the issue outliers is dis-
cussed. Some of them present tests and methods while others propose new tools or
modifications for the existing ones. Angiulli [10] published a paper where an
overview of unsupervised data mining outlier detection techniques is provided.
The author considers different families of approaches, including statistical-based,
distance-based, density-based, isolation-based, angle-based, subspace-based, en-
sembles, and methods providing explanations. Advantages, drawbacks and poten-
tial applicative scenarios are also highlighted.
Sample data can be classified as complete or incomplete (truncated or censored)
sample. The present work only deals with complete samples. Some methods to
treat truncated or censored data can be observed in literature [11] [12 [13] [14].
3.1 Simple Test (ST)
The first test to be described is called Simple Test due to its simplicity. This test
gives relatively accurate results when the values of the collected data are normally
(or approximately normally) distributed or when data are Weibull distributed with
a shape parameter () between 2.6 and 3.7, where the probability density function
has an approximate Gaussian shape [7]. The normality of the values can be previ-
ously checked with other tools and methods as the Shapiro-Wilk test or the Kol-
mogorov-Smirnov test. The schema for Simple Test is shown in Figure 3.
DETERMINE “z”
DETERMINE DETERMINE
CORRESPONDENT “”
USETTF1 OR TTFn
<1/n
EXCLUDE TTF FROM SAMPLE
MAINTAIN TTF IN SAMPLE
NOYES
Figure 3 Simple Teste schema

253
Firstly it must be determined the sample mean () and sample standard deviation
() based on the complete set of observations (times to failure). Then, it must be
seen if the suspected outlier observation is between [-k.; +k.] or not. If not, it
means that there is a chance of that specific observation be an outlier and thus be
discarded. Next, must be calculated the value of “z” through expression (1), that
represents the quantity of standard deviations of the observed time to failure (TTF)
regarding the sample mean and standard deviation values.
𝑧 = |𝑇𝑇𝐹𝑖−𝜇
𝜎| (1)
To this value of “z” will correspond a cumulative probability (cumulative normal
distribution) of “”. Ordering the sample data from TTF1 to TTFn in a set of “n”
times to failure collected it is possible to see, for example, that TTF1 is an outlier
if “” is less or equal to “1/n” (that represents the probability of any TTF be an
outlier in “n” observations).
It can also be studied through percentiles. For example, five percentile value will
correspond “z=1.64485”, as represented in Figure 4.
+1 +2 +3-1-2-3
95.00%
Z=1.645
5.00%
Figure 4 Percentile five
Based on that value and using expression (1) it can be seen which time to failure
will correspond to that percentile (TTF5%). Thus, if TTF1 is lower than TTF5% it
means that the probability of TTF1 is an outlier is over 95% or, in other words, the
risk of assuming TTF1 as an outlier is less than 5%.

254
3.2 Natrella-Dixon Test (ND)
This test may be used when the sample mean and sample standard deviation are
unknown [7]. Again, the observed times to failure must be ordered in an increas-
ing way (TTF1<TTF2<…<TTFn) and the statistic of the test “rij” described in Ta-
ble 1 can be determined.
Table 1 – Statistic of test for Natrella-Dixon test
N rij TTFn is suspect TTF1 is suspect
3 to 7 r10 (TTFn-TTFn-1)/(TTFn-TTF1) (TTF2-TTF1)/(TTFn-TTF1)
8 to 10 r11 (TTFn-TTFn-1)/(TTFn-TTF2) (TTF2-TTF1)/(TTFn-1-TTF1)
11 to 13 r21 (TTFn-TTFn-2)/(TTFn-TTF2) (TTF3-TTF1)/(TTFn-1-TTF1)
14 to 25 r22 (TTFn-TTFn-2)/(TTFn-TTF3) (TTF3-TTF1)/(TTFn-2-TTF1)
With a sample size of “n” times to failure, assuming a confidence level of “” and
regarding the Tables developed by Natrella and Dixon, the critical value of “r/2“
is selected. Then we must compare the value of “rij” with the value of “r/2“. If
“rij” is higher than “r/2“ it means that the suspected observation is an outlier with
a confidence of “100(1-)” percent if there are suspect observations in both sides
of the sample and a confidence of “100(1-/2)” percent if the suspect observation
is only at one side of the sample. Figure 5 illustrates the schema for the Natrella-
Dixon test.
SAMPLE SIZE “n”
TTF1 SUSPECT
TTFn SUSPECT
DETERMINE “rij”
SAMPLE SIZE “n”
CONFIDENCE LEVEL “”
CORRESPONDENT CRITICAL VALUE
“r/2”
rij>ra/2? NOEXCLUDE TTF
FROM SAMPLE
MAINTAIN TTF IN SAMPLE
YES
Figure 5 Natrella-Dixon test
For example, for “n=20” and 5% risk level (confidence level of 95%) where only
the lowest value of the sample (TTF1) is suspect to be an outlier, the statistic of
test “r22” is determined by:

255
𝑟22 =𝑇𝑇𝐹3−𝑇𝑇𝐹1
𝑇𝑇𝐹18−𝑇𝑇𝐹1 (2)
Then, with “/2=0.05” using Natrella and Dixon Tables is achieved a critical val-
ue of “r/2=r0.05=0.450”. To complete the test we must compare the value of “r22”
determined by (2) with the value of “r0.05” and if “r22> r0.05” it is assumed that
TTF1 is an outlier with 95% of confidence.
3.3 Grubbs Test (GB)
To use Grubbs test it is also necessary to order the “n” observations of time to
failure in an increasing way. Then, the statistics of test “𝜐2”, “𝜐12” and “𝜐𝑛
2” must
be determined according to (3), (4) and (5), respectively [7].
𝜐2 = ∑ (𝑇𝑇𝐹𝑖 − 𝜇)2𝑛𝑖=1 (3)
𝜐12 = ∑ (𝑇𝑇𝐹𝑖 − 𝜇1)
2𝑛𝑖=2 (4)
𝜐𝑛2 = ∑ (𝑇𝑇𝐹𝑖 − 𝜇𝑛)
2𝑛−1𝑖=1 (5)
Where:
𝜇 =∑ 𝑇𝑇𝐹𝑖
𝑛𝑖=1
𝑛 (6)
𝜇1 =∑ 𝑇𝑇𝐹𝑖
𝑛𝑖=2
𝑛−1 (7)
𝜇𝑛 =∑ 𝑇𝑇𝐹𝑖
𝑛−1𝑖=1
𝑛−1 (8)
Using Grubbs Table for a sample size of “n” observations the critical value for a
confidence level of “(1-)” is selected. Then, depending on the suspect observed
value being TTF1 or TTFn it must be calculated “𝜐12/𝜐2” or “𝜐𝑛
2/𝜐2”, respectively,
and compare with the critical value. If the critical value is higher the observed
value is considered as an outlier with the specific confidence level. The schema
for Grubbs test is shown in Figure 6.

256
DETERMINE DETERMINE 1 DETERMINE n
DETERMINE u2DETERMINE u12 DETERMINE un
2TTF1 SUSPECT
TTFn SUSPECT
DETERMINEu1
2/u2DETERMINE
un2/u2
SAMPLE SIZE “n”
CORRESPONDENT CRITICAL VALUE ”r”
FOR (1-)
u12/u2>r un
2/u2>r
MAINTAIN TTF IN SAMPLE
NO NO
EXCLUDE TTF1 FROM SAMPLE
EXCLUDE TTFn FROM SAMPLE
YES YES
Figure 6 Schema for Grubbs test
3.4 Rank Limits Test (RL)
In a way to overcome some limitations of the previous tests, as being normally
distributed, be limited to a certain number of observations or analysing only the
lowest and highest values of time to failure observations, it was proposed the Rank
Limits test.
This test can look for the lowest and the highest TTF or any TTF in between those
two observations. Figure 7 shows the schema to apply the Rank Limits test.
In this test time to failure observations are also put in an increasing order of values
and it will start checking for the lowest and highest value (TTF1 and TTFn) to see
if they are considered as outliers. To do that it is determined the parameters of the
most common distributions without knowing which one is the most adequate. Af-
ter that, for each distribution are determined the cumulative probability of failure
for TTF1 and TTFn. Assuming a significance level “” the lower and the upper
one side rank limit (“r1,n,” and “rn,n,1-”) are determined using rank tables [7].

257
CHECK TTF1 AND TTFn
TTF1 IS OUTLIER?
EXCLUDE TTF1 FROM SAMPLE
EXCLUDE TTFn FROM SAMPLE
TTFn IS OUTLIER?
YES YES
BOTH OUTLIERS?
EXCLUDE BOTH FROM SAMPLE
YES
n’=n-1 n’=n-1n’=n-2
NO NO NO
CHECK FOR OUTLIERS BETWEEN TTF1 AND TTFn WITH “n”, “n-1” OR “n-2”
Figure 7 Schema for Rank Limits test
To analyse if the limit observations are considered as outliers one must compare
the values, and if:
F(TTF1) ≤ r1,n,, then TTF1 is an outlier at a confidence level of (1-)%
F(TTFn) ≥ rn,n,1-, then TTFn is an outlier at a confidence level of (1-)%
After this stage we are able to check if any other TTF (in between TTF1 and TTFn)
are outliers. To pursue the method the dimension of the sample data regarding ob-
servations of time to failure is updated (or not). In this step “n” remains the same
if neither TTF1 and TTFn were previously considered as outliers, “n” assumes the
value of “n-1” if only one of them was considered outlier and “n” assumes the
value of “n-2” if both were considered outliers.
In the case it is concluded that neither TTF1 nor TTFn are outliers the cumulative
probability of failure for each one of the remaining TTF is determined. For a di-
mension of “n” observations and a significance level “” the two sided rank limits
are found for each observation (“ri,n,/2” and “ri,n,1-/2”). Then, all pairs of individu-
al values are compared, and if:
F(TTFi) [ ri,n,/2ri,n, 1-/2] then TTFi is an outlier at a confidence level of (1-)%
In the case of prior having discarded one or both limit observations as outliers the
method is quite similar. It is only needed to update the estimation of distribution
parameters with the new sample data dimension.

258
3.5 Modified Thompson Tau Test (TT)
The Modified Thompson Tau test is used to determine if an outlier exists in a
sample data of “n” observations taking into account the sample standard deviation
and the sample average giving a statistically zone of rejection. The first step is to
determine the referred standard deviation and average. Then, the absolute devia-
tion between each observation and the sample average are determined. The Region
of Rejection is determined using (9):
𝑡∝/2(𝑛−1)
√𝑛.√𝑛−2+𝑡∝/22
(9)
Where t/2 is the critical value selected from t-Student distribution with “n-2” de-
grees of freedom. A TTF is an outlier if “” ≤ Region of Rejection, being “” de-
termined by expression (10):
𝛿 = |𝑇𝑇𝐹−𝜇
𝜎| (10)
Similarly to Rank Limit test, if the TTF1 or TTFn are outliers, they are removed
from sample and the test is repeated with a new average, standard deviation and
Region of Rejection, until no outliers are identified in the sample data.
3.6 Other Methods
Other methods can be referred to determine if an observation is outlier. Some are
more graphical (e.g. normal probability plotting) and others are based on models
assuming that the sample data is approximately normally distributed as for exam-
ple the referred Grubbs test and Natrella-Dixon test or others like Chauvenet’s cri-
terion and the practice recommended in ASTM E178-16a [15]. In descriptive sta-
tistics are used box plots that are a hybrid solution once they are model based
where it is graphically possible to depict groups of numerical data through their
quartiles. It displays the behaviour of data in the middle as well as at the ends of
the distributions using the median and the lower and upper quartiles (25th
and 75th
percentiles).
In data mining processes related to Big Data projects other approaches are used
such as the distance based and density based. In this processes it is common to ob-
serve methods based on the k-nearest neighbours [16]. The Local Outlier Factor is
a method that is based in an algorithm for finding anomalous data points by meas-
uring the local deviation of a given data point with respect to its neighbours [17].
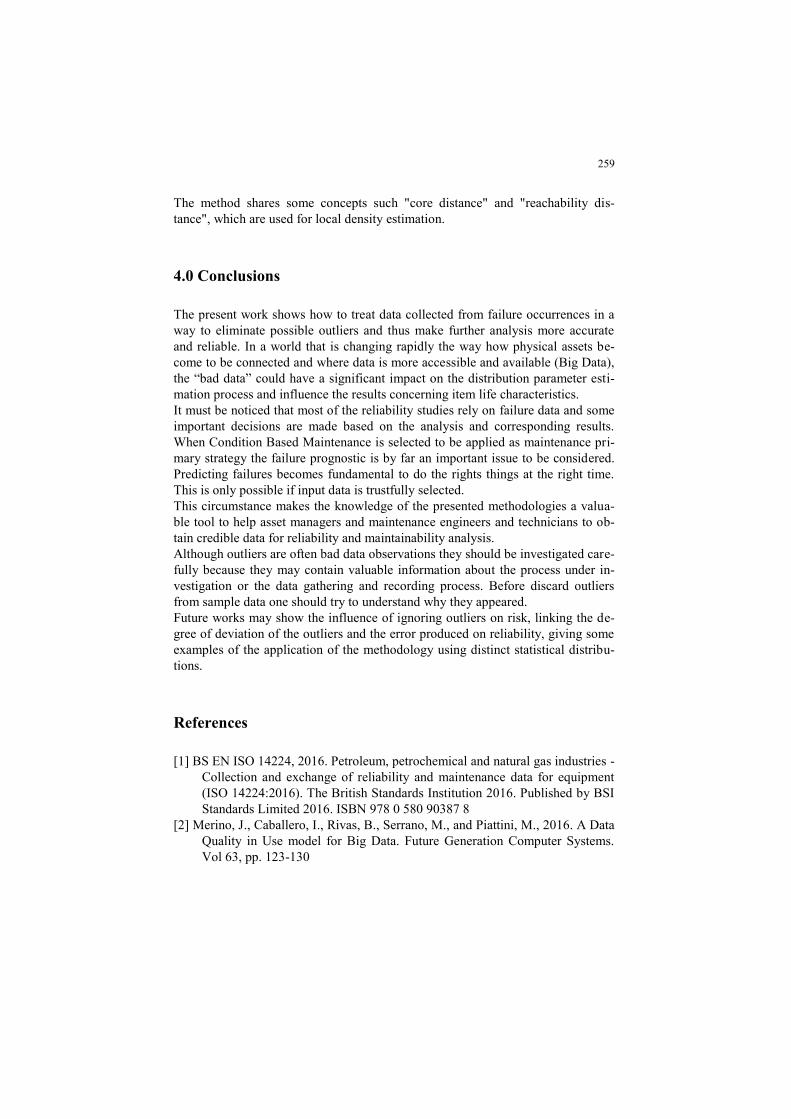
259
The method shares some concepts such "core distance" and "reachability dis-
tance", which are used for local density estimation.
4.0 Conclusions
The present work shows how to treat data collected from failure occurrences in a
way to eliminate possible outliers and thus make further analysis more accurate
and reliable. In a world that is changing rapidly the way how physical assets be-
come to be connected and where data is more accessible and available (Big Data),
the “bad data” could have a significant impact on the distribution parameter esti-
mation process and influence the results concerning item life characteristics.
It must be noticed that most of the reliability studies rely on failure data and some
important decisions are made based on the analysis and corresponding results.
When Condition Based Maintenance is selected to be applied as maintenance pri-
mary strategy the failure prognostic is by far an important issue to be considered.
Predicting failures becomes fundamental to do the rights things at the right time.
This is only possible if input data is trustfully selected.
This circumstance makes the knowledge of the presented methodologies a valua-
ble tool to help asset managers and maintenance engineers and technicians to ob-
tain credible data for reliability and maintainability analysis.
Although outliers are often bad data observations they should be investigated care-
fully because they may contain valuable information about the process under in-
vestigation or the data gathering and recording process. Before discard outliers
from sample data one should try to understand why they appeared.
Future works may show the influence of ignoring outliers on risk, linking the de-
gree of deviation of the outliers and the error produced on reliability, giving some
examples of the application of the methodology using distinct statistical distribu-
tions.
References
[1] BS EN ISO 14224, 2016. Petroleum, petrochemical and natural gas industries -
Collection and exchange of reliability and maintenance data for equipment
(ISO 14224:2016). The British Standards Institution 2016. Published by BSI
Standards Limited 2016. ISBN 978 0 580 90387 8
[2] Merino, J., Caballero, I., Rivas, B., Serrano, M., and Piattini, M., 2016. A Data
Quality in Use model for Big Data. Future Generation Computer Systems.
Vol 63, pp. 123-130

260
[3] Liu, J., Li, J., Li, W., and Wu, J., 2016. Rethinking big data: A review on the
data quality and usage issues. ISPRS Journal of Photogrammetry and Remote
Sensing. Vol. 115, pp. 134-142
[4] Song, Z., Sun, Y., Wan, J., and Liang, P., 2017. Data quality management for
service-oriented manufacturing cyber-physical systems. Computers & Elec-
trical Engineering. Vol 64, pp. 34-44
[5] Madhikermi, M., Kubler, S., Robert, J., Buda, A., and Främling, K., 2016. Da-
ta quality assessment of maintenance reporting procedures. Expert Systems
with Applications. Vol. 63, pp. 145-164
[6] Bicalho, T., Sauer, I., Rambaud, A., and Altukhova, Y., 2017. LCA data quali-
ty: A management science perspective. Journal of Cleaner Production. Vol
156, pp. 888-898
[7] Kececioglu, D., 2002. Reliability & Life Testing Handbook – Vol. 1. Depart-
ment of Aerospace and Mechanical Engineering. The University of Arizona.
ISBN 1-932078-02-9. DESTech Publications. Pennsylvania
[8] Grubbs, F.E., 1969. Procedures for detecting outlying observations in samples.
Technometrics. Vol. 11, pp. 1–21
[9] Maddala, G.S., 1992. "Outliers". Introduction to Econometrics (2nd ed.). New
York: MacMillan. pp. 88–96. ISBN 0-02-374545-2
[10] Angiulli, F., 2017. Data Mining: Outlier Detection. Reference Module in Life
Sciences. doi.org/10.1016/B978-0-12-809633-8.20386-5
[11] Cohen, A.C., 1991. Truncated and Censored Samples, Marcel Dekker, Inc.,
New York, 312, pp. 1991
[12] Wang, H., Dai, H., Restaino, M., and Bao, Y., 2018. Linear transformation
models for censored data under truncation. Journal of Statistical Planning
and Inference. Vol. 193, pp. 42-54
[13] Maximov, S., Coria, V.H., Rivas-Davalos, F., Escarela-Perez, R. and Oliva-
res-Galvan, J.C., 2018. New analytical method for estimating mean life of
electric power equipment based on complete and right-censored failure data.
Electric Power Systems Research. Vol. 154, pp. 311-318
[14] Xun, L., Shao, Li, and Zhou, Y., 2017. Efficiency of estimators for quantile
differences with left truncated and right censored data. Statistics & Probabil-
ity Letters. Vol. 121, pp. 29-36
[15] ASTM E178-16a, 2016. Standard Practice for Dealing with Outlying Obser-
vations. ASTM International, 100 Barr Harbor Drive, PO BOX C700, West
Conshohoceken, PA 19428-2959, USA.
[16] Schubert, E., Zimek, A., and Kriegel, H.P., 2012. Local outlier detection re-
considered: A generalized view on locality with applications to spatial, vid-
eo, and network outlier detection. Data Mining and Knowledge Discovery.
doi:10.1007/s10618-012-0300-z
[17] Breunig, M.M., Kriegel, H.P., Ng, R.T., and Sander, J., 2000. LOF: Identify-
ing Density-based Local Outliers. Proceedings of the 2000 ACM SIGMOD
International Conference on Management of Data. SIGMOD. pp. 93–104

261
Authors’ Biography
José Sobral
José Sobral is an Assistant Professor in the Mechanical
Engineering Department of Instituto Superior de
Engenharia de Lisboa (ISEL) since 2005. He has a PhD
in Mechanical Engineering and a MSc on Industrial
Maintenance. The main areas of investigation are
Maintenance, Asset Management and Reliability,
Availability, Maintainability and Safety. Currently José
Sobral is a researcher of CENTEC (Centre for Marine
Technology and Ocean Engineering). He is author and
co-author of several scientific publications and
communications in international scientific meetings.
José Sobral is supervisor of several MSc thesis in the
Maintenance, Reliability and Safety area.
Carlos Guedes Soares
Carlos Guedes Soares is a Distinguished Professor of
the Engineering School (Instituto Superior Tecnico) of
the University of Lisbon and is the Head of CENTEC,
Centre for Marine Technology and Ocean Engineering.
He did his postgraduate education at the Massachusetts
Institute of Technology, and the Norwegian Institute of
Technology, of the University of Trondheim. He has
different research interests among which risk based
maintenance.

262
ME2018_1143
New Maintenance Methodology Implemented
For Wells Re-manifolding
Mohammed Alnewaihel
South Ghawar producing Department, South Ghawar Maintenance Services Division,
Building 598, Saudi Aramco,
Udhialiyah-31311
Saudi Arabia
E mail: [email protected]
Abstract:
Saudi Aramco/South Ghawar Producing Department has exerted substantial ef-
forts to achieve significant reduction in turnaround time for re-manifolding of the
oil and water wells. After completion of workover activities, the wells are con-
nected to the oil manifold through the oil flowlines and after final inspection, the
wells are put into production. The turnaround time for re-manifolding of the wells
is critical in terms of the locked potential of the wells and oil producing capacity.
Re-manifolding involves many activities and resources which need to be planned,
aligned, and implemented in the shortest possible time, ensuring safe execution.
This presentation summarizes the new maintenance methodology, which resulted
in a significant reduction of turnaround days against the set KPI. Saudi Ar-
amco/South Ghawar Producing Department believes that sharing such experiences
will be beneficial to all organisations.
Key words Re-manifolding, oil manifold, turnaround time of re-manifolding, Wellhead Spool,
Anchor Spool, Well pad.
1.0 Introduction The re-manifolding process is a set of activities starting after a workover rig is re-
leased from a well. By leveling of the well pad area, installation of wellhead pip-
ing spools and flowline piping spools, anchor foundation, and the well pad acces-
sories, the well becomes mechanically completed, with the exception of swinging
the blinds at the tie-in point.
A total of 24 activities are involved during the re-manifolding process of a well
with modification of the wellhead and flowline piping spools.
After completion of workover activities, the wells will be connected to the oil
manifold through the oil flowlines and put into production.
263
Saudi Aramco/South Ghawar Producing Department has exerted extensive efforts
to achieve a significant reduction in the turnaround time for re-manifolding oil and
water wells, and unlock potential wells.
2.0 Involved Organisations for Re-manifolding Completion Eight organisations are involved in re-manifolding activities.
3.0 Challenges Coordination among several organisations
Remote locations and sand encroachment
Major pipeline modification
Materials requirements
Engineering procedures issuance for each repair
Variation of wellhead height after workover rig release
Resources availability such as heavy equipment
Delay remanifolding and longer duration result in:
Locked potential of the oil /water well
Difficulties to achieve production priority compliance
Noncompliance of production targets
Corrosion due to delayed cathodic protection (CP)
The challenge is to maintain a continuous workflow between several organisations
to complete the re-manifolding in 21 days for a well requiring piping spools modi-
fication, and 9 days for a well requiring no piping spools modification, despite the
fact that the different organisations may have other work priorities.
4.0 Enhancements
Assigned the responsibility of completing the re-manifolding activi-
ties to South Ghawar Maintenance Service Division (SGMSD), in-
cluding installation of wellhead piping spools, flowline piping spools
and well accessories. This is one of the several benefits of re-
organisation of the task by management. Developed and implemented Long Form Contract (LFC).
Assigned a contract coordinator for coordination, follow-up and exe-
cution of re-manifolding activities in timely manner.
Closely monitored and ensured contractor’s compliance with safety
procedures and safe execution.
Advanced planning and modification of flowline sections during
workover rig operation.
Advanced planning by tracking the workover rigs movements.
Cooperation between the team members.
Continuously monitoring and implementation on areas of improve-
ment/lessons learned.

264
Regular follow-ups, meetings and better planning with all the con-
cerned organisations.
Conducted Lean Six Sigma Study to minimize the re-manifolding
turnaround time and came out with these recommendations.
Developed a checklist to be filled out during the KICK OFF meeting
with all the concerned parties.
Developed effective tracking and follow-up reports to monitor the
progress and the contractors’ payment release.
Generated Re-manifolding Tracking System (RTS).
5.0 New Methodology Outcome The average number of days is 21 days for the Modified wells. This is accord-
ing to the Key Performance Indicator (KPI) for the re-manifolding with pip-
ing modification.
• The new maintenance methodology resulted in a significant turnaround
day’s reduction from 2009 to 2017, against the set KPI.
• For example, in 2017, the team successfully managed to reduce the turna-
round days for Modified re-manifoloding activities by 57% from the set
KPI turnaround time. In other words, in 2009, the re-manifolding activi-
ties took 71 days to be completed 100%, whereas it took only 9 days to
be completed 100% in 2017.
The average number of days is 9 days for the Non-Modified wells. This is ac-
cording to the Key Performance Indicator (KPI) for the re-manifolding with-
out piping modification.
• The new maintenance methodology resulted in a significant turnaround
day’s reduction from 2009 to 2017, against the set KPI.
• For example, in 2017, the team successfully could manage to reduce the
turnaround days for Non-Modified re-manifoloding activities by 78%
from the set KPI turnaround time. In other words, in 2009, the re-
manifolding activities took 45 days to be completed 100%, whereas it
took only 2 days to be completed 100% in 2017.
6.0 Main factors assisted for Success Study Plan Procure Execute
Of course, there are other factors that assisted in getting wells producing in a very
competitive turnaround time, such as:
Awareness and training sessions to the crafts and implementers for the Operation
Instructions Manuals and Procedures.
Appling the best practices and continues management engagement to assure high
performance were also major contributors of this success.
On employees’ level, weekly meetings were conducted to assess performance and
bridge the gaps.
Utilizing effective tools to monitor performance and forecast targets.

265
Finally, our continuous collaboration to maintain a solid platform of understanding
for the requirements.
7.0 Conclusion The re-manifolding team is continuously exploring ways to sustain the reliability
of wells, to run safe and smooth operations. As a result, the re-manifolding team
has set more challenging goals and objectives for 2018 and future years, and is ex-
erting more efforts to ensure much more success is achieved.
It must be noted that the workforce has proven to be the most valuable pillar in
the success of our re-manifolding efforts.

266
ME2018_1144
SGPD Best Maintenance Practice: Flange Weld
Test Plug Piyush Pandey
South Ghawar producing Department, South Ghawar Maintenance Services Division,
Building 598, Saudi Aramco,
‘Udhailiyah-31311
Saudi Arabia
E mail: [email protected]
Abstract:
As one of the best maintenance practices, Saudi Aramco/ South Ghawar Produc-
ing Department uses an approved tool, the High Lift Flange Weld Test Plug, to
conduct hydrotesting of pipe to flange weld joints. This approved technology is
replacing the old conventional way of hydrotesting the flange to pipe weld joints,
without the need to fill the entire piping system with water, and without pressuriz-
ing the whole system. This tool has proven its merit in many aspects by improving
safety, saving time, effort, conserving water, and eliminating associated costs.
This presentation summarizes the benefits of implementing this best practice
through a case study. South Ghawar Producing Department believes that sharing
such experience will be beneficial to all organisations.
Key words: Flange and Pipe weld joint, Hydrotest, Flange Weld Hydrotest
1.0 Introduction
Piping repairs and welding new flanges to the piping spools are one of the major
and time consuming activities during Turnarounds and Shutdowns.
After welding a flange on to the pipe, the integrity of the weld joint is established
by conducting a hydrotest, where the conventional methods involve filling the
pipe spools, and sometimes the whole piping system, with water. An approved
technology, the Flange Weld Test Plug, is replacing the old traditional way of hy-
drotesting the new welded joints at the site, without the need to fill the entire sys-
tem with water.
As one of the best maintenance practices, Saudi Aramco/ South Ghawar Produc-
ing Department uses the High Lift Flange Weld Test Plug to conduct hydrotesting
of Pipe to Flange weld joints.

267
2.0 Case Study; Hydrotest at Oil Trunk Line
The flange to pipe weld joint, on a 12” diameter trunk line, required hydrotesting
during a turnaround inspection. The required hydrotest pressure was 1500 psig and
the length of the line is 2 km. To conduct hydrotesting to establish the integrity of
the weld joint, the whole line was required to be filled with 145,738 liters (38,500
gallons) of water, and subjected to a pressure up to 1500 psig.
Instead of using the conventional hydrotest, it was decided to use the Flange Weld
Test Plug. The implementation of this best practice resulted in:
Cost savings of $40,800.00.
Water requirement reduced from 145,738 liters (38,500 gallons) to 30 li-
ters (8 gallons)
Down time of turnaround reduced from 2 weeks to 1 week
Reduced preparation time from 3 days to the same day
Hydrotest time came down from 12 Hrs. to ½ hr.
Considerable reduction in the amount of work required
Enhanced safety
Disposal of less water, conserving natural resources
3.0 Conclusion
Using the Flange Weld Test Plug for hydrotesting is very economical, quick, and
an environment friendly solution for testing requirements. This tool has proven its
merit in many aspects, by improving safety, saving time, efforts, conserving water,
and eliminating associated costs.
Authors’ Biography
Piyush Pandey
Piyush Pandey has 10 years’ experience in field
of mechanical maintenance in upstream Oil &
Gas industries and 12 years’ experience in me-
chanical maintenance of rotating and static
equipment’s in Petrochemical and Refinery.
Currently he is working as Maintenance Engi-
neer in Saudi Aramco, South Ghawar Producing
Department, South Ghawar Maintenance Ser-
vices Division.

268
ME2018_1145
The Internalisation of the Maintenance
Function – A Strategic Vision
Pedro Viegas1,2
1O&M Asset Management Contracts
thyssenkrupp Industrial Solutions AG
Rellinghauser Straße 1, 45128 Essen, Germany
2PRL Consulting – Maintenance Management Consultants
Sesimbra, Portugal
Email: [email protected]; [email protected]
Abstract The future of the maintenance function has a new paradigm, concen-
trating his concerns about the right approach and format, how organisations should
organize their maintenance structures, in order to ensure that best operational and
maintenance practices are applied and adopted. Ensure and perform all operational
or maintenance activities, by using in-house maintenance solutions have proven
that in most part of the cases, it didn´t lead to the desired results, either due to the
lack of commitment with the business risk and their consequences, or due to the
decision to celebrate traditional maintenance service contracts using the unit price
system, where specifications are simple in their structure and implementation. The
implementation of prescriptive-based specifications reduces though the flexibility
of the agreements and limits the possibilities of the internal maintenance structures
or traditional service contractor to improve asset/plant performance. Furthermore,
the management of the contract faces difficulties such as poor performance of the
assets and ineffective follow of the best maintenance management processes. Per-
formance Maintenance Based Contracts (PMBC) attains an alternative means for
outsourcing of operation or maintenance based on a win-win approach. The strate-
gy for PMBC attains high potential of cost-savings in TCO (2-10% minimum) and
improved Overall Plant/Asset performance. A clear Asset Management program
adopted by the organisation, allows and provide the opportunity for the implemen-
tation of a performance scheme to incentive maintenance function, it should be
considered as a vehicle to set the right level of reference , regarding the implemen-
tation of the maintenance best practices and to set the right roadmap to move for-
ward, particular in those competitive times organisations are facing, and where
the search for optimisation and up-time becomes one of the key-success factors.
Key words Maintenance Function, Best Maintenance Management Practices, Per-
formance Maintenance Based Contracts (PMBC), Win-Win, TCO Optimisation,
Key Success Factors, and Asset Management Program.

269
1.0 Introduction
These days, maintenance services contracts based on operational and maintenance
performance are at the center of the organisations attention and at the agenda of
CEO´s, the main objective is the achievement of desired results according world-
class business performance and an overall increase of competitiveness in com-
parison with his commercial competitors. The decision to outsource the mainte-
nance function and the application of an asset management program, allows or-
ganisation to increase performance, optimize costs and mitigate the business risks.
The application of consolidated processes, following the implementation of best
practices and the comparison of the obtained results, with international references
(benchmarking), promotes a continuous improvement culture which can lead the
organisation to the success and to sustainable results.
2.0 The Maintenance and Organisational Context
Nowadays, we are increasingly seeing a reduction in maintenance budgets, provid-
ing in many cases several constraints and bottleneck about the strategies those
maintenance departments have, in order to implement corrective actions for defect
elimination and achieve the desired reliability.
Other cases are known, even with additional financial resources the results do not
achieve the expectations or reflect the use of best maintenance practices, resulting
in most part of the cases on, a high turnover of the maintenance staff. The
maintenance activity must be self-sustaining and must be "economical fed”, ac-
cording his results and qualitative excellence, being an extension of the operation-
al function, in general maintenance provides a "service" for the business. In this
increasingly competitive world any service company only survives, when as the
capacity to deliver a service and results according excellence by earning profits or
losses from those same results. This approach shall be extended to maintenance
and it reflects the difference, with rare exceptions, from an internal maintenance
structure in an organisation and a maintenance service provider. The first will
hardly recognize the need to deliver a quality service, simply because the main
core business of the organisation is not the maintenance activity, it was adopted or
implemented only because there is a need to keep the asset in operational condi-
tions and technology demands it. Several organisations have tried to standardize
working methodologies and processes, oriented to ensure a better control and per-
formance of the maintenance, such methodologies and processes have not resulted
and will never result in general, since the maintenance should be considered as a
business with very specific processes, that requires own strategies, different from
others operational management processes.
The future of maintenance activity according the international context , particular-
ly for medium-large organisations, must pass in the coming decades through the

270
total outsourcing of the maintenance services , but not under the traditional service
models, the vision must be more comprehensive and global, it means converting
the traditional provision of maintenance services in a closer relationship between
organisation and external entities, based on a mutual relationship and in a win-win
approach, in sum adopting performance base contracts , with transparent costs ,
gains and losses
3.0 Best Practices and Key Success Factors in Maintenance
Below are listed some of the areas and "key success factors“, that requires an on-
going improvement analysis, strategy, and consequent action plan to “boost” the
maintenance performance;
Maintenance Organisation and Structure aligned with the business plan
and suitable to implement a pro-active maintenance approach;
Staff skills and competences , supported by an adequate recruitment
strategy and training program;
Workflow management process;
Planning and Scheduling best practices;
Implementation, use and optimisation of the suitable CMMS;
Shutdown and Turnaround Strategy;
Preventive and Predictive Maintenance Program , based on criticality as-
sessment;
Materials/Interchangeable management and materials procurement strat-
egies;
Promote the culture of autonomous maintenance and basic maintenance
practices;
Subcontractors Management;
Performance Management;
Root Cause Analysis routines , based on a defect elimination approach
and a clear Reliability Program;
Asset Life Cycle Cost Projection;
Asset Data Management;
Maintenance Process Audits (MPA).
The use of a “benchmarking culture” develops a stimulus for continuous im-
provement in the organisations, promoting the assessment of the results, identify-
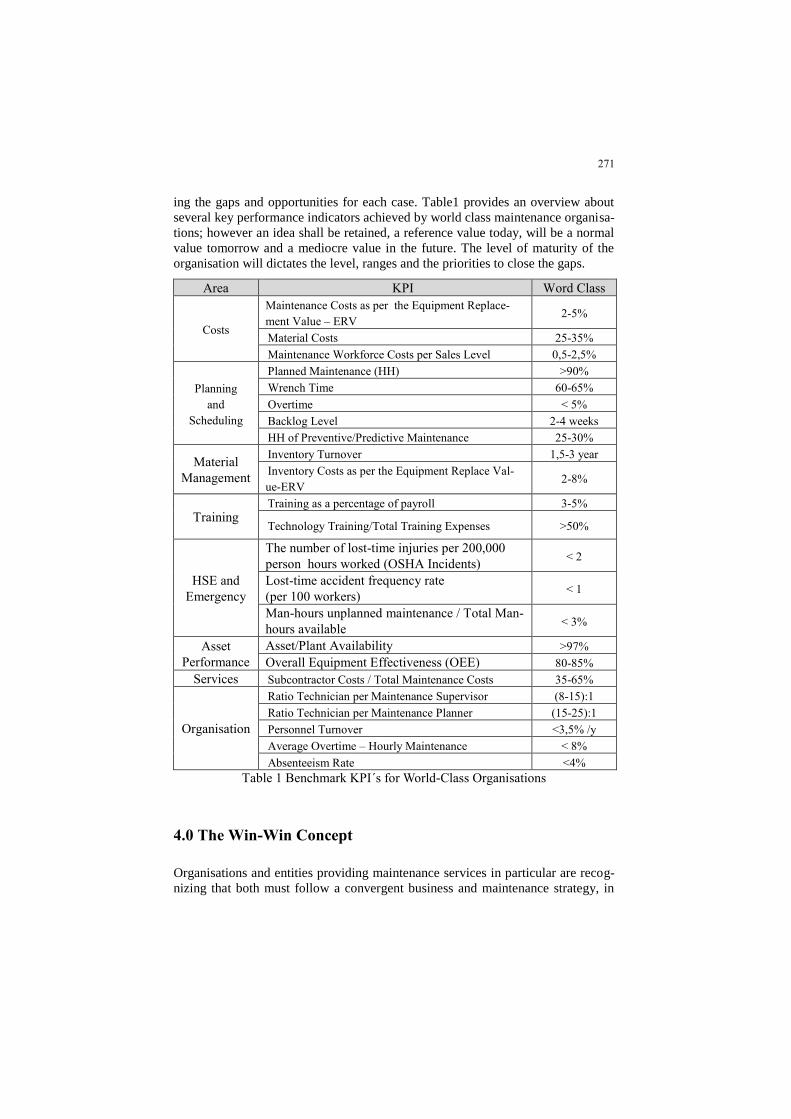
271
ing the gaps and opportunities for each case. Table1 provides an overview about
several key performance indicators achieved by world class maintenance organisa-
tions; however an idea shall be retained, a reference value today, will be a normal
value tomorrow and a mediocre value in the future. The level of maturity of the
organisation will dictates the level, ranges and the priorities to close the gaps.
Area KPI Word Class
Costs
Maintenance Costs as per the Equipment Replace-
ment Value – ERV 2-5%
Material Costs 25-35%
Maintenance Workforce Costs per Sales Level 0,5-2,5%
Planning
and
Scheduling
Planned Maintenance (HH) >90%
Wrench Time 60-65%
Overtime < 5%
Backlog Level 2-4 weeks
HH of Preventive/Predictive Maintenance 25-30%
Material
Management
Inventory Turnover 1,5-3 year
Inventory Costs as per the Equipment Replace Val-
ue-ERV 2-8%
Training Training as a percentage of payroll 3-5%
Technology Training/Total Training Expenses >50%
HSE and
Emergency
The number of lost-time injuries per 200,000
person hours worked (OSHA Incidents) < 2
Lost-time accident frequency rate
(per 100 workers) < 1
Man-hours unplanned maintenance / Total Man-
hours available < 3%
Asset
Performance
Asset/Plant Availability >97%
Overall Equipment Effectiveness (OEE) 80-85%
Services Subcontractor Costs / Total Maintenance Costs 35-65%
Organisation
Ratio Technician per Maintenance Supervisor (8-15):1
Ratio Technician per Maintenance Planner (15-25):1
Personnel Turnover <3,5% /y
Average Overtime – Hourly Maintenance < 8%
Absenteeism Rate <4%
Table 1 Benchmark KPI´s for World-Class Organisations
4.0 The Win-Win Concept
Organisations and entities providing maintenance services in particular are recog-
nizing that both must follow a convergent business and maintenance strategy, in

272
which both will obtain the results if the objectives are setup common and focus in
the business plan of the organisations and clients.
These objectives generate the opportunity for the organisation to choose an out-
sourcing strategy, sharing the challenges, risks and obtain the commitment of ex-
ternal entities, where their core business is the maintenance services, partners with
consolidated processes, technical knowledge, and qualified human resources. It is
therefore important to define the most appropriate collaboration model for both
parties, but always based on a performance concept , where the profits/losses are
directly connected to the objectives of the organisation, thus ensuring that the in-
terest to obtain the best performance is mutual (Win-Win: both parties win follow-
ing the same strategy), something that in many organisation may be more difficult
to obtain through internal solutions , or between operational and maintenance de-
partments.
Figure 1 Win-Win Alignment Strategy
In the past, organisations only thought of getting the best prices from their mainte-
nance service providers, smashing their profit margins, consequence of that, they
did not promote any interest for invest and consequently could not improve their
productivity, performance and quality related to the services provided, mainte-
nance contracts with fixed cost budget are a risk and a barrier to the continuous
improvement and generates economical conflicts and lower transparency between
organisations and partners.
The Win-Win strategy aims on the development and optimisation of organisations
and their service providers/partners, based in the old maxim that “together we are
stronger, alone more weak.”

273
5.0 TCO Optimisation – The Objective
The optimisation of the total cost of ownership of an asset (Total Cost Ownership-
TCO) is the main objective of the organisations, to achieve this goal is essential
the contribution of the maintenance function, improving the reliability and opera-
tional availability of the assets. The maintenance function impacts many areas, ei-
ther it is normally responsible for managing different activities, achieve excellence
requires a direct linked between the performance level and the benefits organisa-
tions would acquiring from that.
An optimisation of the maintenance function can represents a gain of 2-10% (Fig-
ure 2) in the business, increasing the profit by the difference of the results ob-
tained in the improvement of the performance and the reduction and optimisation
of the costs. In most part of the cases the hidden costs are the basis of the profit,
looking for the “big picture”, instead of the standard direct maintenance costs, the
iceberg model, presented in figure 3 is a great example of the concept and ap-
proach.
Figure 2 Maintenance Optimisation Saving for TCO

274
Figure 3 Iceberg Model – Maintenance Costs
6.0 Maintenance Services Portfolio
At the current times, maintenance service providers offer portfolios that cover dif-
ferent models of collaboration with between them and the organisations, the deci-
sions are mainly based on two factors, the trust level existing both parties (in
many cases based on past business relationships, e.g. Machinery provid-
er/manufacture or by the experience and knowledge of the partner) and based on
the “factor value” it would represents, i.e., what additional value, the collaboration
provides.
Figure 4 Maintenance Services Portfolio
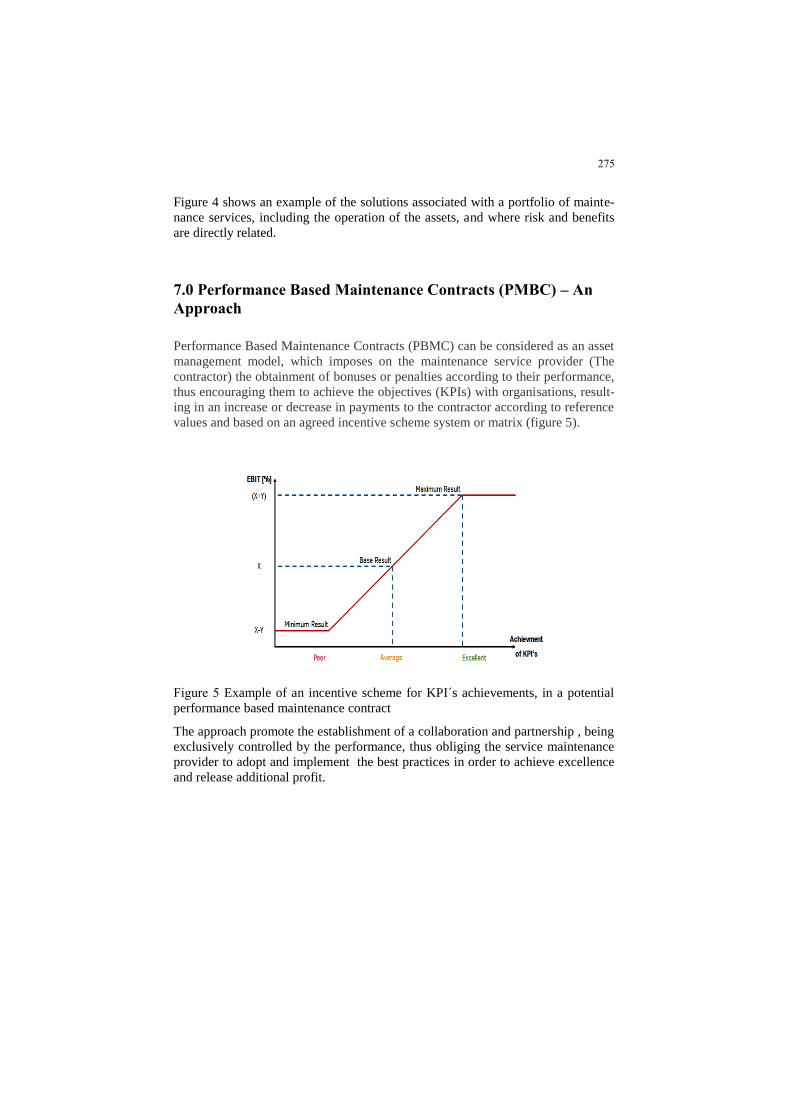
275
Figure 4 shows an example of the solutions associated with a portfolio of mainte-
nance services, including the operation of the assets, and where risk and benefits
are directly related.
7.0 Performance Based Maintenance Contracts (PMBC) – An
Approach
Performance Based Maintenance Contracts (PBMC) can be considered as an asset
management model, which imposes on the maintenance service provider (The
contractor) the obtainment of bonuses or penalties according to their performance,
thus encouraging them to achieve the objectives (KPIs) with organisations, result-
ing in an increase or decrease in payments to the contractor according to reference
values and based on an agreed incentive scheme system or matrix (figure 5).
Figure 5 Example of an incentive scheme for KPI´s achievements, in a potential
performance based maintenance contract
The approach promote the establishment of a collaboration and partnership , being
exclusively controlled by the performance, thus obliging the service maintenance
provider to adopt and implement the best practices in order to achieve excellence
and release additional profit.

276
Figure 6: Example of payment system associated to a PBMC
The celebration of performance maintenance based contracts, particularly at the
industrial level, presents advantages and disadvantages to the organisations, as the
ones listed below;
Benefit(s)
Low needs for specialized knowledge;
Long-term financial risk reduction;
Significant cost reduction;
Improved performance and service.
Stimulates the use of new technology and processes according
to the best practices;
Reduction of the bureaucracy level.
Disadvantage(s)
Requires a strategy based on medium / long term contracts be-
tween organisations and maintenance service providers;
8.0 Implementation of Performance Based Maintenance
Contracts - Challenges
There are some challenges that organisations and service maintenance providers
should consider and identify before and during the implementation of a perfor-
mance based maintenance contract, in order to mitigate the risks of potential barri-
ers that are in many cases responsible for the failure of an operation & mainte-
nance contract or by the successfully implementation of a asset management

277
program, that everyone would like to see as long-term collaboration. Some of the
most common challenges regarding the implementation of an asset management
program, including a possible maintenance outsourcing contract, are explained by
the following factors;
Wrong Organisation Setup and inflexible local labor laws;
Lack of resources with adequate skills and training, as well as the inca-
pacity of the organisations and service providers to define upfront a clear
strategy and a training program to close-out the gaps;
Lack of a clear workflow process and procedures, developed according
to best practices and adjusted to the business;
Inadequate use of management and control/reporting tools;
Monitoring strategy and commercial relationship between organisations
and service providers;
Lack of understanding about the cultural and ethnic context of the organ-
isations according the geographic location;
Poor Logistic Plan ;
Upfront understanding and clear strategy about the existing of hard
working conditions and accessibility to material, Interchangeable and
consumables;
Adaptation of the procurement and financial processes to respond to the
requirements and characteristics of the operating and maintenance areas;
Definition and control of key performance indicators non-adequate to the contract,
based on baselines defined in assumptions or wrong projections.
9.0 The Asset Management Strategy as a Vehicle to Set a Global
Maintenance Service Level
The implementation of an asset management program requires the total involve-
ment of the maintenance function in order to achieve the desired an excellent per-
formance. Figure 7 presents an overview of the "great journey" that organisations
and service maintenance providers must consider and walk together, in the sense
of achieving the major following objectives
Improve performance;
Optimize costs;
Mitigation and control the risks.

278
Figure 7 The Asset Management Journey and the main objectives of the mainte-
nance function
In general there are six main stages which must be consolidated, to achieve a suc-
cessful implementation of an asset management program, and where the mainte-
nance functions as a key-role. Below are listed the baselines that require the total
focus of organisations;
Strategy and Planning;
Organisation and Personnel
Decision Making
Asset Life Cycle , based on a clear maintenance and operational risk
analysis;
Asset Information;
Continuous Improvement Process;
10.0 Conclusion
The worldwide demand for business optimisation based and focus on an asset per-
formance strategy bring organisation to the need, about the mission and involve-
ment of the maintenance function as a key success factor to achieve the objectives,
279
what in many cases leads to a conclusion to challenge internal maintenance organ-
isations or for a common decision for a close agreement with a partner expert on
that matter. The partner is seen as someone that has and can implement the best
practices, in order to achieve the best indicators, with focus in TCO optimisation,
and consequently increase business margins.
Select the right maintenance service portfolio offered by different maintenance
service providers, is directly connected with the thrust level existent between both
parties and the add value it represents. The result might origins a performance
maintenance/operational based contract, established in a clear incentive scheme
that measure on a fair way the performance of the contract and goes aligned with
the goals and targets of the organisations, based on a win-win concept.
Challenges regarding the implementation of an agreement or partnership should be
target of a clear strategic plan, in order to mitigate the risks and monitor the suc-
cess. These strategic plans are part of the overall asset management program, that
can support in many cases the change process, yes because that is all about, the
paradigm of a unique and clear “change management process”.
References
[1] Wilson, A., PhD. Asset Maintenance Management: A Guide to Developing
Strategy and Improving Performances, Second Edition. Industrial Press Inc.,
June 2002.
[2] Cody Frampton, Benchmarking Word-Class Maintenance, Charles Brooks
Associates Inc.
[4] Terry Wireman, World Class Maintenance Management, Industrial Press
Inc., 1990.
[5] Operation and Maintenance Service Contracts, Dec.1997, PECI-Portland En-
ergy Conservation, Inc.
[6] MAME – Book-of-Knowledge, Asset Management Business, tkIS Service,
2014.

280
Authors’ Biography
Pedro Viegas
Certified Reliability and Maintenance Engineer by Es-
cola Superior de Tecnologia de Setubal/Portugal – IPS,
with almost 20 years’ experience in Maintenance Man-
agement, training and over the last years on the imple-
mentation of operation and maintenance service con-
tracts (O&M Outsourcing) worldwide, supported by
Asset Management Programs. Across his professional
experience he has been working in several industrial
sectors as, but not limited, mining, cement, material
handling/harbor operations, fertilizer industry, etc…
The professional career has been driven and conducted
by the delivery of excellence & performance results,
through the implementation of the best maintenance
management practices and processes in many organisa-
tions. Experience in industrial management projects is
highlighted, as well as, about the improvement and op-
timisation of operational/maintenance departments, sup-
ported by joints Operational and Maintenance audits/gap
analyses (MPA), and the technical/commercial support
in several performance maintenance based contracts ne-
gotiations.
.

281
ME2018_1146
Vibration-based diagnosis for different bearing
clearances in a gear transmission system
Xiuquan Sun1,2
, Tie Wang1, Ruiliang Zhang
1, Fengshou Gu
2, Andrew D. Ball
2
1School of Mechanical Engineering, Taiyuan University of Technology, Taiyuan, 030024, China
2Centre for Efficiency and Performance Engineering, University of Huddersfield, Huddersfield,
HD1 3DH, UK
Email: [email protected]; [email protected]; [email protected]; [email protected];
Abstract-Bearing is an essential component in a gear transmission system. Due to
the harsh working conditions such as extreme loads and inadequate lubrication,
bearing wear is inevitable, which could aggravate the bearing clearance, and sub-
sequently alter vibration characteristics of gear transmission system. This study
aims at investigating the influence of bearing clearance on gear vibration charac-
teristics for gearbox condition monitoring. Based on gear dynamics, mesh forces
due to enlarged bear clearances are studied, which gains understanding that inade-
quate bearing clearance can lead to inappropriate mesh position and radial fluctua-
tion, then induce extra force component at tangential direction and alter the distri-
bution of friction force. Experimental studies based on three incremental bearing
clearances show that with the increase of bearing clearance, vibration changes can
be observed at the third and fourth mesh components, which are significant and
consistent with the predicted effects of radial fluctuation and friction excitation,
therefore, these components can be an effective diagnostic feature to indicate dete-
riorations in bearing health conditions.
Key words Vibration, Fault diagnosis, Bearing clearance, Helical gearbox.
1.0 Introduction
Gear transmission systems are the most important applications which are widely
used in various fields for transmitting power and movement. Gear transmission
systems are always subjected to high speed and load which could result in various
types of failure, such as gear failures, bearing faults, broken shaft and lubricant
pollution which may result in catastrophic accidents and huge economic losses.
According to the incomplete statistic studied in [1], bearing failure takes up nearly
70% of all failures occurred in gear transmission system. Therefore, conducting
condition monitoring of bearings are very meaningful for extending gearbox ser-
vice life, preventing failure occurrence and reduce economic losses.

282
Bearing clearance is essential to provide the proper lubrication between roller and
inner race and outer race [2]. However, in some harsh working conditions like in-
adequate lubrication, high speed and load, dusty and humid environment, the rota-
tional components in a bearing could get inevitable wear which could result in im-
proper bearing clearance. While improper clearance, large or small, will affect the
dynamic performance of working bearing, further will result in abnormal opera-
tion state and tremendous vibration of the whole system. Especially for precision
transmission device and machine field, large clearance will lead to the inaccurate
transmission and major machining error, and small clearance will aggravate the
wear process and shorten the service life of bearings. Ref [3] studied the effects of
bearing clearance on dynamic performance in a turbocharger, the results suggest
that the variations of bearing clearance induced by working temperature shouldn’t
be ignored. Moreover, the nonlinearity effects of bearing clearance will generate
more translational vibration. The nonlinearity and chaotic behaviour induced by
bearing clearance has been investigated in some studies [3–6] while most of which
are carried out on rotor, wind turbine or turbocharger. Ref [7,8] investigated the
interactions between bearing clearance and gear backlash, which resulted in that
when mesh and bearing modes coupled with each other, bearing clearance will in-
fluence gear dynamic characteristics.
Usually, when a fault occurs in a bearing, some additional vibration will be moti-
vated, and such vibration could pass onto the body of gearbox which can be de-
tected by accelerometer mounted onto the gearbox. For some typical faults like
pitting, spalling and crack, modern techniques for condition monitoring can detect
such failure successfully. While as for improper bearing clearance caused by in-
stallation or progressive wear, the signal induced by such bearing fault are usually
very weak, which also increases the difficulties for fault diagnosis and condition
monitoring. Some simulated analysis [9–12] have been conducted to investigate
the bearing clearance, while most of which are just simulation studies without ex-
perimental validations.
Based on the analysis above, this study concentrates the influence of bearing
clearance on gear vibration characteristics. To achieve this, dynamic responses of
a gear mesh process were analysed by taking into account the bearing clearances.
Then, and a dedicated test was carried out under three incremental bearing clear-
ances based on a helical gearbox test rig. Furthermore, the vibration characteristics
of gearbox was studied by employing TSA analysis.
2.0 Gear mesh process analysis
Bearing clearance can induce the radial fluctuation of the gear shaft, which alters
the contact point of mating gears and cause changes in contact forces. Not only
does the change happen in the contact stiffness but also in the friction force. As
shown in Figure 1 (a), under the static state, bearing clearance of both side are

283
symmetrical and are at half of its value. However, when the bearing is under oper-
ating condition, a dynamic fluctuation induced by bearing clearance is generated
due to the dynamic mesh force, as shown in Figure 7 (b), the clearance at one side
could be reduced to zero, and the other side could be increased to δg,y correspond-
ingly. Because of this effect, the gear axle centre can be changed from Og to Og1 or
Og2, thereby the deviation of mesh geometry is formed. Therefore, there will be a
non-zero component Fpx of the contact forces in the tangential direction (x-
direction) induced by the deviation. Similarly, there also will be a non-zero com-
ponent Ffx of the frictional force in the tangential direction. In addition, with the
rotation of a meshing gear pair, the direction of friction force will change to the
opposite direction when the mesh line passes through the pitch line, correspond-
ingly, the directions of tangential components will also be changed. Both these
changes of the forces induced by bearing clearance need to be considered when
analysing the gear mesh process.
e(t)
Og
Op
Ff-Ff
Fp
β
Og1Og2
km cm
kpx
cpx
kpy cpy
Tg
Tp
Og
Op
β kpx
cpx
kpy cpy
kgx
kgy cgy
cgx
Tg
Tp
rptanβ
rgtanβ
H
(a) Static position (b) Dynamic fluctuation
x
y
kgy cgy
kgx
cgx
0.5δg,y
0.5δg,y
0.5δg,x0.5δg,x
δg,y
δg,x
P P
γ Fpx
Fp
Fpy
FfFfy
Ffx
Figure 7 Schematic of gear dynamics with bearing clearances
According to Figure 7, the coordinate vector of dynamic model for the 6 degrees
of freedom can be described as
, , , , ,g g g p p px y x y (1)
where θg, θp are the rotational angle of gear (g) and pinion (p); xi, yi (i=p, g) are
the translation displacements.

284
Correspondingly, the mesh force and friction force will be influenced due to the
fluctuation of the axle centre, according to the force diagram shown in Figure 7
(b), the mesh force Fp can be expressed as:
,0.5 ( )p m g bg g g x p bp pF k y r y r e t
,0.5 ( )m g bg g g x p bp pc y r y r e t & && & & (2)
where km is the gear mesh stiffness; cm is the gear mesh damping coefficient; rbg,
rbp are the base radius of gear and pinion; δg,x, δg,y respectively represents the x-
radial displacement and y-radial displacement of the gear; e(t) is the dynamic
transmission error.
Time-varying frictional force at the mesh point can be calculated based on the fol-
lowing equation in which a time-varying coefficient μ(t) is considered as men-
tioned in [13],
f pF t t F (3)
where η(t) is the sign function of the direction of frictional force.
According to the rotational angle of the mesh line induced by the fluctuation, the
projection of mesh force (Fpx, Fpy) and friction force (Ffx, Ffy) in x and y direction
can be calculated as follows:
sin
cos
sin
cos
px p
py p
fx f
fy f
F t F
F F
F F
F F
(4)
where γ is the rotational angle of mesh line induced by the offset of gear axle cen-
tre.
A 6-freedom nonlinear dynamic model by taking into account the effects of bear-
ing clearance and frictional force can be defined as

285
,
, , ,
, , ,
,
tan 0.5
0.5 0.5 0.5
0.5 0.5 0.5
tan 0.5
g g g p bg f bg g y
g g g x gx g g x gx g g x px fx
g g g y gy g g y gy g g y py fy
p p p p bp f bg g y
p p px p
I T F r F r t H
m x c x k x F F
m y c y k y F F
I T F r F r t H
m x c x
&&
&& & &&& &
&& & &&& &
&&
&& &px p px fx
p p py p py p py fy
k x F F
m y c y k y F F
&& &
(5)
where Ii (i=p, g) is the gear inertia; Tg, Tp are the input and out torque respectively;
mi (i=p, g) is the gear mass; β is the pressure angle; H is the distance from the
mesh point to pitch point which is illustrated in Figure 7 (a).
According to the analysis of gear mesh process, bearing clearance has a significant
influence on gear mesh characteristics. As shown in Figure 7, under the effect of
gear mesh force and friction force, the radial fluctuation of the shaft will be ampli-
fied with the increase of bearing clearance. This radial fluctuation will induce ex-
tra gear mesh impact, and thereby results in more vibration. Additionally, it can
also alter the distribution of frictional force along the gear tooth face and acceler-
ate the gear wear process. Therefore, it is essential to investigate the influence of
bearing clearance on gear vibration characteristics.
3.0 Test rig setup and procedure
In order to investigate the influences of bearing clearance on gear vibration fea-
tures, three bearings with different clearances were tested on a gearbox test rig,
which is illustrated in Figure 8 and Figure 9.

286
3.1 Test rig setup
AC motor Generator
Variable
Speed drive
Touch
Screen
GB 2GB 1
ComputerData Acquisition System
Accelerometers
Encoder
Bearing replacedElectrical
Measurement
Figure 8 Schematic diagram of the test rig
The schematic diagram of the gearbox test rig utilised in this study is shown in
Figure 8. Two two-stage helical gearboxes are installed back-to-back, Gearbox 1
(GB1) is used as speed reducer while Gearbox 2 (GB2) is used as speed increaser.
The operational speeds needed are provided by a three-phase induction motor
which is controlled by a variable speed drive (VSD), and the loads applied onto
the test rig are provided by a DC generator which also connected to the VSD. Two
accelerometers are employed to detect the vibration characteristics of GB1 and
GB2 respectively, and both the lubricant temperature of GB1 and GB2 are moni-
tored simultaneously to supervise the operational conditions of the gears.
GB 2GB 1
Zr1=49
Zr2=55
Zr4=59
Zr3=13 Zi3=47
Zi1=59
Zi2=13
Zi4=58
fr1
fr2
fr3
fr5
fm1fm2
fr4
fm3fm4
Bearing replaced
Figure 9 Schematic diagram of two gearboxes

287
Notes: the fri (i=1,2…) represents the rotational frequency of the ith shaft; the fmj
(j=1,2…) represents the mesh frequency of the jth stage in each gearbox, Zrp, Zip
(p=1,2…) represents the tooth number of the pth gear in each gearbox.
3.2 Test procedure
Table 1 Specifications of ball bearings
Clearance grade C2 C3 C5
Bearing Type 6207 Deep Groove Ball Bearing
Bore Dia (mm) 35
Outer Dia (mm) 72
Width (mm) 17mm
Clearance (mm) 0.006 0.028 0.051
Notation Small-C2 Midium-C3 Large-C5
The position of the replaced ball bearing and the tooth number of the gears are
shown in Figure 9. The first set of tests was conducted with the recommended ball
bearing C3 which was used for supporting the input shaft of GB2. Then bearing
C2 and bearing C5 with different bearing clearances were assembled to replace
bearing C3 respectively. The specification of each ball bearing used in this study
is shown in Table 1.
4.0 TSA analysis
Time synchronous averaging (TSA) is an effective method for reducing random
noise or incoherence components in signals and widely used for vibration-based
gear monitoring and diagnosis [14,15].

288
Figure 10 Spectrum of GB2 vibration at 70% speed and different loads
To extract the vibrations from the 3rd
mesh gear pair, TSA is applied to the vibra-
tion signal measured from GB2. Based on the angular pulse train from the AC mo-
tor, instantaneous angles of shaft 2 are calculated and the time domain vibration
signals is then decomposed onto instantaneous angles with a cubic spline interpo-
lation. The TSA signal obtained thus can show the mesh components for both
stages of gear transmits in GB2, allowing a comparison between them for showing
the effects of the bearing clearances. Moreover, with the data length available the
average times can be over 100 times, which is sufficient to suppress the random
noise and interference components. This obtain a more accurate TSA signal, com-
pared to that of less averages when decomposing the signal into shaft 3.
Figure 10 shows the TSA spectrum of GB2 vibration under 70% speed of the AC
driving motor under different loads. Clearly, it shows that random noise is signifi-
cantly suppressed, which make the mesh components much more outstanding. Ac-
cording to the position of the testing bearings, the vibration behaviours at the mesh
frequency of the first stage in GB2 (fm3 for brevity) should be mostly influenced as
analysis in Section2. As shown in Figure 10 the orders with multiple integers of
289
Zi2=13, which is associated with shaft 3, at 13, 26 ,…130 do show clear differ-
ences among different bearing clearance cases across the tested loads. On the oth-
er hands, the vibration at fm4 or at the orders of Zi3=47, 94 and 141 show little vari-
ation. This observation shows that the small amount of bearing clearances can
cause a significant influence on gear dynamics and hence mesh quality.
Figure 11 Amplitudes of the first four harmonics of fm3 and fm4
To gain more detail of the changes in vibrations, the spectral components at the
first four harmonics of mesh frequencies are extracted and presented in Figure 11.
It can be seen from Figure 11 (a1) to (d1) that there are significant differences be-
tween different clearance cases. For the small clearance, the 1st harmonic and the
4th
harmonic i.e. at 4fm3 show higher amplitudes. This may be attributed to gear
eccentricity that is more sensitively reflected by gear dynamics due to less toler-
ances of the tight clearance. In addition, this too small clearances also likely cause
more metal-to-metal contact and induce more friction forces [16]. Particularly,
once the clearances become sufficiently large such as Medilum-C3 and Large-C5
the vibrations at the 1st and the 4
th harmonics are significantly reduced. Moreover,
the amplitudes at the 3rd
harmonic, shown in Figure 11 (c1) increases with the
clearance values, which is consistent with the analysis made in Section 2 in that
the higher loads can cause more dynamic forces. Therefore, this consistent feature
can be a useful indicator for making differences between bearing clearances.
Comparatively, the amplitudes at the first four harmonics, shown Figure 11 (a2) to
(d2) show little differences between different tests, which confirms that the exper-
imental study is accurate and reliable.

290
5.0 Conclusion
This study focuses on the influence of different bearing clearances on vibration
characteristics of gear transmission system. Both analytic analysis and experi-
mental study have shown that vibration increases when the bearing clearances be-
come too large as a results of progress wear during gear lifetime. In particular,
TSA analysis of vibration signals obtained based on a general purpose two stage
helical gearbox shows that:
1) Improper bearing clearance could affect the gear mesh process, like large bear-
ing clearance could induce extra impact due to the tangential component projected
from the mesh force and friction force. Meanwhile, too small bearing clearance
could also cause more vibration due to high frictional forces of more the metal-to-
metal contact and over-sensitive to gear errors.
2) According to the variation of 3fm3, when gearbox is working at low load, the
small bearing clearance generates more vibration due to the metal-to metal contact
and gear errors and the influence become smaller with the increase of clearances.
When working at high load, the impact induced by bearing clearance will be en-
hanced due to the radial fluctuation effect. A clear increase of 3fm3 can be noticed
in the TSA spectrum which can be used for monitoring the increase of bearings
clearance.
3) The variation of 4fm3 also implies that with the increase of bearing clearance,
the amplitude of 4fm3 reduce gradually. This illustrates that the 4fm3 is mainly in-
fluenced by the friction of bearing components, and the friction excitation induced
by small bearing clearance could transmit to the mating gears, thereby influence
the mesh frequency.
6.0 Acknowledge
The authors are thankful for the support from China Scholarship Council, Univer-
sity of Huddersfield and Taiyuan University of Technology.
References
[1] S. Sheng, “Gearbox Typical Failure Modes, Detection and Mitigation Meth-
ods,” p. 24.
[2] Y. Guo and R. G. Parker, “Dynamic Analysis of Planetary Gears with Bear-
ing Clearance,” J. Comput. Nonlinear Dyn., vol. 7, no. 4, p. 041002, 2012.

291
[3] L. Smolík, M. Hajžman, and M. Byrtus, “Investigation of bearing clearance
effects in dynamics of turbochargers,” Int. J. Mech. Sci., vol. 127, pp. 62–72,
Jul. 2017.
[4] H. Diken, “Non-Linear Vibration Analysis and Subharmonic Whirl Frequen-
cies of The Jeffcott Rotor Model,” J. Sound Vib., vol. 243, no. 1, pp. 117–
125, May 2001.
[5] R. Ganesan, “Dynamic response and stability of a rotor-support system with
non-symmetric bearing clearances,” Mech. Mach. Theory, vol. 31, no. 6, pp.
781–798, Aug. 1996.
[6] F. F. Ehrich, “High Order Subharmonic Response of High Speed Rotors in
Bearing Clearance,” J. Vib. Acoust. Stress Reliab. Des., vol. 110, no. 1, p. 9,
1988.
[7] A. Kahraman and R. Singh, “Non-linear dynamics of a geared rotor-bearing
system with multiple clearances,” J. Sound Vib., vol. 144, no. 3, pp. 469–506,
Feb. 1991.
[8] N. E. Gürkan and H. N. Özgüven, “Interactions Between Backlash and Bear-
ing Clearance Nonlinearity in Geared Flexible Rotors,” 2007, pp. 459–468.
[9] B. M. Bahgat, M. O. M. Osman, and T. S. Sankar, “On the Effect of Bearing
Clearances in the Dynamic Analysis of Planar Mechanisms,” J. Mech. Eng.
Sci., vol. 21, no. 6, pp. 429–437, Dec. 1979.
[10] S.-K. Choi and S. T. Noah, “Mode-Locking and Chaos in a Jeffcott Rotor
with Bearing Clearances,” J. Appl. Mech., vol. 61, no. 1, pp. 131–138, Mar.
1994.
[11] Y. Guo and R. G. Parker, “Dynamic modeling and analysis of a spur plane-
tary gear involving tooth wedging and bearing clearance nonlinearity,” Eur. J.
Mech. - ASolids, vol. 29, no. 6, pp. 1022–1033, Nov. 2010.
[12] Y. B. Kim and S. T. Noah, “Bifurcation analysis for a modified Jeffcott rotor
with bearing clearances,” Nonlinear Dyn., vol. 1, no. 3, pp. 221–241, May
1990.
[13] H. Xu, A. Kahraman, N. E. Anderson, and D. G. Maddock, “Prediction of
Mechanical Efficiency of Parallel-Axis Gear Pairs,” J. Mech. Des., vol. 129,
no. 1, p. 58, 2007.
[14] F. Combet and L. Gelman, “An automated methodology for performing time
synchronous averaging of a gearbox signal without speed sensor,” Mech.
Syst. Signal Process., vol. 21, no. 6, pp. 2590–2606, Aug. 2007.
[15] P. D. Mcfadden and M. M. Toozhy, “Application of Synchronous Averaging
to Vibration Monitoring of Rolling Element Bearings,” Mech. Syst. Signal
Process., vol. 14, no. 6, pp. 891–906, Nov. 2000.
[16] E. Keith, “Understanding bearing internal clearance,” Machine Design, 01-
Jun-2000. [Online]. Available: https://www.machinedesign.com/mechanical-
drives/understanding-bearing-internal-clearance.

292
Authors’ Biography
Xiuquan Sun
Mr Xiuquan Sun is a Ph.D. candidate in Taiyuan
University of Technology, China and currently studies in
University of Huddersfield as a joint Ph.D. student on
condition monitoring of gear transmission system.
Tie Wang
Pro. Tie Wang is the academic leader in Department of
Vehicle Engineering in Taiyuan University of Technology,
China. His current research interests include mechanical
transmission, dynamics, machinery diagnostics, and the
modern automobile design method.
Ruiliang Zhang
Dr Ruiliang Zhang is the head of Department of Vehicle
Engineering in Taiyuan University of Technology, China.
His current research interests include mechanical
transmission, vibro-acoustic analysis and machinery
diagnosis.
Fengshou Gu
Dr Fengshou Gu is a principal research fellow and head
of measurement and data analysis research group in Uni-
versity of Huddersfield, UK. His current research interests
include mechanical transmission, machine dynamics, tri-
bology, and advanced signal processing techniques.
Andrew D. Ball
Pro. Andrew D. Ball is a professor of Diagnostic Engi-
neering at the University of Huddersfield, UK. His current
research interests include machinery condition monitoring,
fault detection and diagnosis.

293
ME2018_1147
A Study of Diagnosing Reciprocating
Compressor Faults using EMD-entropy of the
Airborne Acoustic Signals
Debanjan Mondal1, Xiuquan Sun
2, Fengshou Gu
1, Andrew Ball
1
1Centre of Efficiency and Performance Engineering, University of Huddersfield, Queensgate,
Huddersfield HD1 3DH, UK
2School of Mechanical Engineering, Taiyuan University of Technology, Taiyuan, 030024, China
Email: [email protected]; [email protected]; [email protected];
Abstract For more effectively and less-costly monitoring of reciprocating
compressors, this paper focuses on the developing of a new monitoring method
based on airborne sounds which can be easily obtained in and remote way and
contains richer information of an entire machine. Possible sound sources of the
compressor have been examined according to the working process of mechanical
motions and fluid dynamics in order to understand the sound characteristics under
different operating conditions. Especially, the sound signal from the compressor is
highly non-stationary due to the periodic excitation resulted by the combined ef-
fect of gas dynamics and the mechanical forces acting on the compressor associat-
ed with the random disturbances of valve motions and flow turbulence and the
variations of discharge pressures. In addition, the acoustic signals are also verita-
bly influenced by background noises which often are of unsteady. To characterise
such signals for fault detection and diagnosis, Empirical Mode Decomposition
(EMD), an effective tool for non-stationary signal analysis, is used to find and en-
hance the inherent information that correlates more to the various acoustic events
involved in compressor operations. Experimental studies, carried out based on a
two-stage reciprocating compressor, have shown that Intrinsic Mode Functions
(IFM) from EMD can depict more of the signals to indicate the conditions of the
machine. In particular, using EMD- entropy as a diagnostic parameter allows
common faults such as inter-cooler leakage (ICL) and discharge valve leakage
(DVL) to be discriminated and separated from the baseline operation over a wider
range of discharge pressures, demonstrating that the proposed EMD acoustic sig-
natures can be an effective approach for monitoring reciprocating machines.
Key words Condition monitoring, Reciprocating compressor, Airborne acoustic,
EMD-entropy.

294
1.0 Introduction
Condition monitoring of a compressor based on airborne sound analysis is diffi-
cult to perform due to its high level of noise associated with it. There are many
traditional approaches including cylinder pressure monitoring, valve temperature
monitoring, and vibration measuring for crosshead cylinders to diagnose any ab-
normal behaviour of the compressor. But all these techniques are depended on in-
stalling the respective sensors to the compressor body. Acoustic measurement can
be useful in this case as it can remotely record airborne sound from the compres-
sor and cost effective as well due to its use of minimum numbers of transducer
microphones compared to the other sensors. There are many approaches to look
into the airborne signal for its characteristic behaviour like time domain analysis,
statistical parameter estimation, frequency domain analysis, time frequency do-
main analysis and advanced signal processing technique.
Elhaj et al. [1] used instantaneous angular speed (IAS signal) in order to find out
the faults from a two-stage reciprocating compressor and validated their model
with the test results obtained from the analysis. Toprak and Iftar [2] placed several
microphones at different places of a virtual hemi-sphere and used sound power
level as a raw data input for their analysis. Analysis shows that the obtained re-
sults from the artificial neural network and multilayer perception model is capable
of finding faults from the compressor. Elhaj et al. [3] proposed a new method for
diagnosing of valve faults in a reciprocating compressor by using time domain,
frequency domain and continuous wavelet transform (CWT) of the acoustic sound
signals. Lowson [4] presented a theoretical analysis of the noise from axial-flow
fans and compressor. Ball et al. [5] analysed the acoustic signals from a diesel en-
gine using the smoothed pseudo-Wigner-Ville distribution (SPWVD) and contin-
uous wavelet transform (CWT) and successfully detected the faults from their
analysis.
Huang et al. [6] introduced a new signal processing technique called Empirical
Mode Decomposition (EMD), a noise assisted data analysis method, completely
dependent on the local characteristics of a signal. This made the analysis of the
non-stationary and no-linear signals very easy and can be successfully diagnose
the faults in rotating machineries [7-9]
Information entropy can be used as a successful tool in the signal processing point
of view. Huang et al. [10] developed an intelligent fault diagnosis method of high
voltage circuit breaker using improved EMD energy entropy and multiclass sup-
port vector machine. Cui et al. [11] used information entropy and support vector
machine to diagnose the valve faults from a reciprocating compressor.
From the literature review it is found that the EMD method is very effective for
the analysis of non-stationary signal and entropy can be a good choice as an effec-
tive feature tool in the diagnosing of the faults in a machine. Thus, combining
these two methods might be effective for diagnosing the compressor faults by ana-
lysing the airborne sound signal recorded from the compressor.
Initially this paper focuses on the finding the noise sources generated from the
compressor with clear understanding of the fluid dynamic interaction with the me-
chanical components and keeping in mind the non-stationarity behaviour of the

295
compressor noise signal, the developing of a robust fault feature extraction method
based on EMD entropy to diagnose the different health conditions of the double
stage single acting reciprocating compressor.
2.0 Acoustic sources associated with the compressor
To utilise acoustic signals for monitoring and diagnosis, it is necessary to under-
stand the possible sound sources of a reciprocating compressor and their primary
characteristics associating with common faults.
2.1 Basics of Sources
According to the working process of a reciprocating compressor, the acoustics can
be broadly caused by aerodynamic and mechanical forces. The piston moving
back and forth in a cylinder forms zones of compression and rarefaction, which
formalises acoustic periodic pulsation waves that propagate through the system at
the speed of sound of the gas [12]. In addition, the mass flow through the dis-
charge or suction is further modulated to cause the pulsations and produces turbu-
lent noise. These acoustic waves propagate through the system and are reflected
due to the impedance inequality. This incident and reflected waves correspond to
not only one cylinder but the other cylinder as well, which often cause acoustic
resonances. The pulsation is a function of speed of sound of the gas and the fre-
quency of the pulsation [13].
c f (1)
where c= speed of the sound; f = frequency and is the wavelength.
From more study, it can be found that there is a linear relationship between the ve-
locity of the face of the piston and the resultant pressure. As the motion of the pis-
ton is nearly sinusoidal, the pressure wave also follows the same trend. In general,
the pulsating flow responsible for the results in the increment of sound level of the
compressor.
The inertia forces produced by the motion of the pistons and related part give rise
to the level of vibration and noise in the RC. Imbalance of con-rod and crank
mechanism is also another cause to produce vibration in compressor. Static and
dynamic unbalances produced by the unbalance masses accumulated in the rotat-
ing parts of the machine is also considered as a major exciting factor that causes
the vibration hence noises from the compressor body. Another major source of
noise from the cylinder is the knocking sound produced by the pistons and crank
con-rod system during crossover. The gap between the piston and cylinder liner
permits the piston to move with a certain velocity in the transverse direction, im-
pacting against the wall of the cylinder. These contribute to an intense vibration of
the cylinder walls at their resonant frequency.
One other important acoustic source in a reciprocating compressor is its suction
and discharge valves. The valve noise has oscillatory energy transmitted to the

296
outside through pipes and the housing shell. The compressor valve produces flow
oscillations, even if it does not flutter. The suction and discharge valve system of
the air compressor consist of a stainless-steel ring plate of high tensile strength
riveted to a valve assembly block. During the compression and expansion cycle air
is forced through a set of ports located in the valve assembly block and directed
against the valve element. The valves open, dump mass into the discharge system
or take it from the suction system, close, and after one cycle, open again. As a re-
sult a valve knocking sound is produced.
Although these mechanical and aerodynamic forces are dominant, the driving mo-
tors and transmission system also contribute to the overall acoustics of a compres-
sor.
2.2 The effect of faults on acoustics
One of common faults in compressors is the air leakage, which usually happen on
various valves and pipeline joints. In this study, intercooler leakage (ICL) and dis-
charge valve leakage (DVL), which are more typical due to the high vibration and
thermal shocks, are examined for the evaluation of acoustic based condition moni-
toring.
Influence of ICL:
If there is a leakage in intercooler, the pressure drops in the system. The intercool-
er leakage causes a significant pressure drop in the first stage cylinder and reduces
the force to keep the discharge valve closed. As a result, the discharge valve opens
earlier for the first stage and causes delay in the opening of discharge and suction
valves for the second stage. Insufficient pressure causes the second stage suction
valve improper lifting and results in valve fluttering. The insufficient gas flow
pressure causes the valve descending back to its closed position very late com-
pared to its rise time and Flutter occurs. This phenomenon creates an audible noise
which can be heard as a clattering sound generated from the compressor. Moreo-
ver, the leakage flow streams also create broad band sound due to turbulences.
Influence of DVL:
In case of discharge valve leakage, the mass flow takes place across the cylin-
der through the leakage because of the constant area of opening in the form of
leaking area. Hence this leaking mass flow rate depends on the pressure difference
across the valve. Until the valve is closed this area remains constant. During this
time the pulsating pressure increases as the compressed pressure passes through
the discharge valve and increases the air pressure in the pipe resulting an increas-
ing pressure difference between reservoir and pipe. The fluid flows in the opposite
direction to its regular state. The back flow in this case can contribute to the turbu-
lence of the gas flow resulting in pulsation. Valve also generates pressure pulsa-
tion because of its vibration and the resulting pressure will mainly be in the natural
frequency range of the valve. As a result, resonance of the valve occurs. Due to
the pulsation the impact velocity of the valve plate against the seat increases. Short

297
pulsation can cause high valve impact. These resonating sound and valve impacts
have a rich influence for the radiation of noise through the compressor shell.
The acoustic signal from the compressor is highly non-stationary due to the peri-
odic excitation resulted by the combined effect of the gas dynamics and the me-
chanical forces acting on the compressor associated with the random disturbances
of valve motions, flow turbulences and the variations of discharge pressures. This
phenomenon gives rise in the randomness or complexity in the airborne signal
recorded from the compressor.
3.0 Experimental set up
The experiment is carried out on a two-stage single acting reciprocating compres-
sor identified as the Broom Wade TS9 and is represented in Figure 1 below. This
machine has proven suitable for condition monitoring purposes over the years.
The V-shaped reciprocating compressor chamber is made up of two cylinders po-
sitioned at an angle of 90° to each other giving it the V-shape. These cylinders are
tailored to deliver compressed air between 5.5 bar (0.55Mpa) to 8.3 bar (0.8Mpa)
to a horizontally positioned receiver tank with a maximum capacity of 13.8 bar
(1.38Mpa). Also included in the compressor chamber is an intercooler coil con-
nected from the first stage cylinder (after discharge) to the second stage cylinder
(before suction). The compressor chamber is powered by a 2.5KW three-phase in-
duction motor, which transfers electrical current to the compressor pulley to me-
chanical move the crankshaft.
Two different faults have been simulated: inter-cooler leakage fault and discharge
valve leakage fault. One microphone sensor has been used to record the airborne
signals placed at 60 cm distant from the main compressor body.
298
Figure 12 Schematic diagram of the compressor test rig.
The noise from the compressor propagates as longitudinal waves through the elas-
tic air medium. The sound waves cause changes in the air pressure and can be rec-
orded with pressure sensitive instrument like microphone. The sound pressure that
we heard is dependent on the distance from the source and the acoustic environ-
ment in which sound propagates [12]. If the sound comes contact with a surface
some portion of the sound is reflected and some is absorbed. Hence the measured
sound pressure is partly consisting of sound that generates from source and partly
of the sound that is reflected by surrounding surfaces. As sound propagates out-
wards from the source its’ energy get dissipated and becomes weaker the further it
travels from the source. The shape of the sound wave with no obstacles in its way
is approximately spherical. This condition is often termed as ‘free field’ condition
where the energy emitted at a given time will diffuse in all directions and, one
second later, will be distributed over the surface of a sphere of 340 m radius [13].
A simple point source radiates uniformly in all directions. In general, however, the
radiation of sound from a typical source is directional, being greater in some direc-
tions than in others. The directional properties of a sound source may be quanti-
fied by the introduction of a directivity factor describing the angular dependence
of the sound intensity. To avoid the near field effect the sound measurements are
made at a sufficient distance from the source which is usually greater than 1m
[13].
Whenever sound waves encounter an obstacle, such as when a noise source is
placed within boundaries, part of the acoustic energy is reflected, part is absorbed

299
and part is transmitted. The relative amounts of acoustic energy reflected, ab-
sorbed and transmitted greatly depend on the nature of the obstacle. Different sur-
faces have different ways of reflecting, absorbing and transmitting an incident
sound wave. The higher the proportion of the incident sound reflected, the higher
the contribution of the reflected sound to the total sound in the closed space. As
the surfaces become less reflective, and more absorbing of noise, the reflected
noise becomes less and the situation tends to a "free field" condition where the on-
ly significant sound is the direct sound. In practice, there is always some absorp-
tion at each reflection and therefore most work spaces may be considered as semi-
reverberant. The phenomenon of reverberation has little effect in the area very
close to the source, where the direct sound dominates [13].
Due to the physics behind the propagation of sound it is very important to place
the microphone sensor in a proper position. Keeping in the mind, the reverbera-
tion, directional propagation property of the sound, the microphone sensor has to
be placed at some position where the direct sound dominates and nearly free field
property exists. As well as from a study of the proper placement of microphone
sensors for identification of RC noise it has been found, that there are three loca-
tions where noise response found to be good: first is over the cylinder head, sec-
ond is at NRV (Non-Return Valve) side, third one is at opposite of NRV side and
fourth one is at the opposite side of the flywheel [14].
In this present investigation one microphone sensor was placed at a distance of
60cm from the compressor body at the side opposite to the flywheel minimising
the effect of directional propagation and reverberation property of the sound.
4.0 Methodology
In this study, EMD based entropy method has been used to find out the difference
between the health conditions of the compressor under a range of operating dis-
charge pressures like 60 psi, 70 psi, 80 psi, 90 psi, 100 psi, 110 psi and 120 psi.
An adaptive signal processing method Empirical Mode Decomposition has been
used in this investigation. EMD decomposes a time domain signal into several in-
trinsic mode functions preserving the frequency components from the original sig-
nal in each mode of oscillatory function. As the name suggests the process is em-
pirical which implies that the decomposition is based on the local characteristics
of the signal. Thus, it can be effective for non-stationary signals like the airborne
signal from the compressor body. The method is found to be superior and different
from the traditional techniques like Short Time Fourier Transform (STFT) and
Wavelet transform (WT) used for non-stationary signal analysis. The STFT pro-
cess assumes some portion of the signal as stationary and performs FFT for the
windowed segments of the signal and in Wavelet transform there are different
types of wavelets available that are used to match the signal behaviour. The WT
method is based on the basis functions. Therefore, prior knowledge about the ac-
quired signal is necessary to apply this method, whereas EMD does not require
any basis function and is purely adaptive in nature. This kind of data driven tech-

300
nique makes it easier to analyse any kind of signal whether it is non-stationary or
non-linear.
EMD splits a raw signal into several subsets of IFMs. More details can be investi-
gated with these IFMs, which allows key features to be extracted for discriminat-
ing different scenarios for fault diagnosis.
Step 1: If C1, C2, ..,Ci, .., CN be the IMF components obtained by the EMD method
for different datasets, then the energy and energy ratio of these IMF components
are calculated as follows:
1
2
1
( )N
i i
n
E C n
(2)
1
iEi N
i
i
EP
E
(3)
where iE is the energy of the ith
IMF component; N1 is the number of sample
points present in the IMF; EiP is the energy ratio for ith
IMF component; N is the
total number of IMFs generated by the EMD process.
Step 2: Form the energy ratio vector EP by putting all the energy ratios for in-
dividual IMFs.
1 2 3[ , , ,..., ]E E E E ENP P P P P (4)
Step 3: Find the entropy of the energy ratio vector entropyE .
2
1
logN
entropy Ei Ei
i
E P P
( 5)
Step 4: Consider four different datasets for each machine condition and
determine the average entropy value for respective tank pressure.
5.0 Results and Discussion
5.1 Change of cylinder pressure
The effect of the simulated faults on in-cylinder pressure at 120 psi is shown in
Figure 2. The intercooler and discharge valve leakage faults cause a change in the
pressure waveform in both stages.
When the intercooler leakage occurs the pressure inside the 1st stage cylinder is
lower than the baseline one. This causes a reduction of force to keep the 1st stage
discharge valve closed. Thus, the discharge valve opens earlier in 1st stage cylin-
der with intercooler leakage fault.
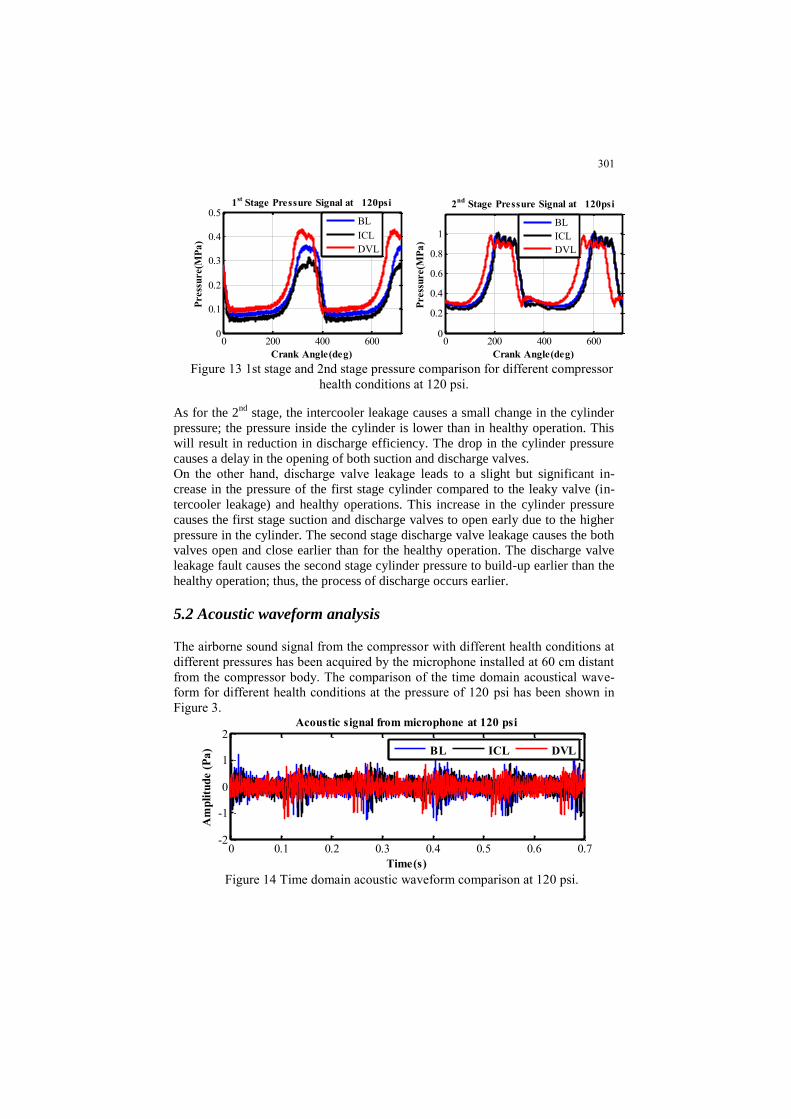
301
Figure 13 1st stage and 2nd stage pressure comparison for different compressor
health conditions at 120 psi.
As for the 2nd
stage, the intercooler leakage causes a small change in the cylinder
pressure; the pressure inside the cylinder is lower than in healthy operation. This
will result in reduction in discharge efficiency. The drop in the cylinder pressure
causes a delay in the opening of both suction and discharge valves.
On the other hand, discharge valve leakage leads to a slight but significant in-
crease in the pressure of the first stage cylinder compared to the leaky valve (in-
tercooler leakage) and healthy operations. This increase in the cylinder pressure
causes the first stage suction and discharge valves to open early due to the higher
pressure in the cylinder. The second stage discharge valve leakage causes the both
valves open and close earlier than for the healthy operation. The discharge valve
leakage fault causes the second stage cylinder pressure to build-up earlier than the
healthy operation; thus, the process of discharge occurs earlier.
5.2 Acoustic waveform analysis
The airborne sound signal from the compressor with different health conditions at
different pressures has been acquired by the microphone installed at 60 cm distant
from the compressor body. The comparison of the time domain acoustical wave-
form for different health conditions at the pressure of 120 psi has been shown in
Figure 3.
Figure 14 Time domain acoustic waveform comparison at 120 psi.
0 200 400 6000
0.1
0.2
0.3
0.4
0.51
st Stage Pressure Signal at 120psi
Press
ure(M
Pa
)
Crank Angle(deg)
BL
ICL
DVL
0 200 400 6000
0.2
0.4
0.6
0.8
1
2nd
Stage Pressure Signal at 120psi
Press
ure(M
Pa
)
Crank Angle(deg)
BL
ICL
DVL
0 0.1 0.2 0.3 0.4 0.5 0.6 0.7-2
-1
0
1
2
Time(s)
Am
pli
tud
e (
Pa
)
Acoustic signal from microphone at 120 psi
BL ICL DVL

302
From the analysis of the above figure it can be shown that the waveforms of the
baseline (BL), intercooler leakage (ICL) and discharge valve leakage (DVL) has
some differences with each other. The time differences between the excitation of
the signals shows a clear difference between the machine conditions. These excita-
tions are caused by the opening and closing of the valves. From the time domain
waveform representation, it can be seen that opening of the valves with different
machine conditions follows the same trend obtained from the pressure analysis in
the previous subsection. Result shows that the opening of the valve in case of dis-
charge valve leakage is the earliest whereas, for intercooler leakage the delay time
for opening the valve is maximum. Though it is hard to reach a conclusion about
the machine conditions because the opening and closing of the valves also depend
on other factors, the time domain waveform analysis is not sufficient to differenti-
ate between the compressor conditions. Further advanced signal processing meth-
od is required to diagnose the faults in a compressor.
5.3 EMD of the acoustic signal
As the compressor sound signal is highly non-stationary due to the periodic excita-
tion resulted by the combined effect of gas dynamics and the mechanical forces
acting on the compressor associated with the random disturbances of valve mo-
tions and flow turbulences and the variations of discharge pressures, from the lit-
erature review it has been found that the data driven technique EMD is very effec-
tive for non-stationary and non-linear application hence the proposed method
based on EMD has been applied to find out the faults from the compressor. Figure
4 shows the first five intrinsic mode functions (IMFs) obtained from the EMD
process for different machine conditions at the pressure of 120 psi.

303
Figure 15 Decomposed IMF signals for three different compressor conditions
at the pressure of 120 psi
From the Figure 4 it has been seen that the decomposed IMFs from EMD show
the randomness of the signals whereas, normal time domain signals fail to show
the property. Randomness is a phenomenon which gives an indication of how ran-
domly a signal changes over the time. Generally, the sound signal from the com-
pressor has a periodic behaviour due to the steady rotational motion of the me-
chanical systems. This periodic phenomenon can be seen in Figure 3. Due to the
instable and turbulent fluid force the sound signals contain some sort of random-
ness which cannot be identified from the time domain analysis, whereas, EMD
analysis makes it possible to identify that property in the IMFs generated by the
process (Figure 4). In both occasion, the baseline and the faulty conditions with
ICL and DVL show some sort of randomness in signal information obtained from
the decomposed IMFs by EMD process. Especially if the 5th
IMF for different ma-
chine conditions are plotted separately with less time duration the randomness of
the signals are clearly visible in Figure 5.
0 0.1 0.2 0.3 0.4 0.5 0.6 0.7-2
0
2Acoustic signal from microphone at 120 psi
BL ICL DVL
0 0.1 0.2 0.3 0.4 0.5 0.6 0.7-0.5
0
0.5IMF 1
0 0.1 0.2 0.3 0.4 0.5 0.6 0.7-0.5
0
0.5IMF 2
0 0.1 0.2 0.3 0.4 0.5 0.6 0.7-1
0
1IMF 3
0 0.1 0.2 0.3 0.4 0.5 0.6 0.7-1
0
1IMF 4
0 0.1 0.2 0.3 0.4 0.5 0.6 0.7-2
0
2IMF 5
Time(s)
Am
pli
tud
e (
Pa
)

304
Figure 16 Decomposed third IMF at 120 psi show its randomness property for different
compressor conditions.
5.4 EMD-Entropy calculation
Entropy is a parameter which measures the randomness of the signal. More ran-
domness means less information, less organized which results in an increase of en-
tropy values in this case. Provided that a faulty compressor can cause more ran-
domness in acoustic signals due to turbulence flows, the entropy of the
decomposed IMFs has been chosen as a feature parameter in this analysis. Though
the concept of entropy and RMS looks like same, but there is an obvious differ-
ence between the two. The statistical parameter RMS of an acoustic signal pro-
vides an average loudness. This describes the strength of a signal. The RMS value
is only related to the signal amplitude. The root-mean-square pressure is most of-
ten used to characterize a sound wave because it is directly related to the energy
carried by the sound wave, which is called the intensity. The intensity of a sound
wave is the average amount of energy transmitted per unit time through a unit area
in a specified direction. The RMS pressure is most often used to characterize
sound waves that have the simple shape. Not all sound waves have such simple
shapes, which contain only one frequency. Especially in compressor the non-
stationary behaviour of the sound signal and its change in amplitudes over time
gives an overall energy content of the signals while measure the RMS value. The
results obtained from the RMS and entropy values are compared and shown in
Figure 6.
Four sets of data for each condition have been considered in the analysis. Finally,
the average RMS and entropy values from the four datasets for baseline, inter-
cooler leakage and discharge valve leakage faults have been calculated for a broad
range of pressures from 60 psi to 120 psi and are shown in Figure 6. From the re-
0 0.1 0.2 0.3 0.4 0.5 0.6 0.7-1
0
1BL-IMF 5
0 0.1 0.2 0.3 0.4 0.5 0.6 0.7-1
0
1ICL-IMF 5
0 0.1 0.2 0.3 0.4 0.5 0.6 0.7-1
0
1
Time(s)
Am
pli
tud
e (
Pa
)
DVL-IMF 5
Enropy: 0.51619
Enropy: 0.52873
Enropy: 0.53017

305
a
) b
)
sults it has been shown that there is a clear separation of the compressor machine
conditions while analysing entropy values whereas, RMS value does not give the
clear indication of the machine conditions as it’s not reliable.
Figure 17 (a) RMS values with changing tank pressure, (b) Entropy values correspond
to the tank pressure for different conditions.
From the Figure 6(b), the physics behind the noise generation for different ma-
chine conditions can be explained by the change of energy entropy with the in-
creasing tank pressure.
At low pressure, the performance of the compressor is not stable and this is re-
flected in the pressure range of 60-70 psi. The energy entropy in the particular low
pressure zone for different machine conditions is inconsistent. At the intermediate
pressure zone (70-90 psi), the working of the compressor system is normal and the
energy entropies for the respective machine conditions almost follow a straight
line path. There are no abrupt changes of the entropy values in this pressure re-
gion. At high pressure (>90 psi), the severity increases and it is noticeable that the
entropy values for ICL and DVL are much higher compared to the baseline and an
increasing trend in entropies for both the fault conditions is recorded with the cor-
responding pressure whereas, when the compressor works in a normal condition
the sound generated from it is more organized and as the pressure increases it
works more smoothly. That indicates the decreasing of entropy values with the
pressure in case of baseline condition.
The sound mechanism in the presence of ICL and DVL can also be explained
from the results obtained from the analysis.
Presence of ICL fault: The presence of this kind of fault causes a significant pres-
sure drop in the first stage cylinder and can be shown in Figure 2. As a result, a
delay is caused in the opening of the suction valve and can be shown in the time

306
domain waveform of the acoustic signal (Figure 3). Any presence of fault increas-
es the randomness of the signal and the entropy values go up. The same thing is
noticeable in Figure 6(b), where the ICL fault has the higher entropy values than
the normal baseline condition.
Presence of DVL fault: The presence of this kind of fault increases the pulsating
pressure as the compressed pressure passes through the discharge valve. This in-
creases the air pressure in the pipe resulting an increasing pressure difference be-
tween reservoir and pipe. The back flow in this case can contribute to the turbu-
lence of the gas flow resulting in pulsation and produces noise. This turbulence
results in the increase of entropy values for the airborne signal recorded with this
seeded fault and from Figure 6(b) it can be found that this kind of fault has the
highest entropy values due to the pulsation occurred.
From the analysis, it is confirmed that the entropy values change with the increase
of pressure conditions. The increasing value of the entropy with the increase of
tank pressure indicates the severity of the simulated faults with the pressure
change. The entropy values for three conditions of the compressor show a clear
separation among them. From the analysis result, the proposed method based on
EMD-entropy is found to be effective for diagnosing faults in the reciprocating
compressor.
6.0 Conclusion
This paper focuses on the study of airborne sound signal characteristics for the di-
agnosis of faults in a reciprocating compressor. The experimental results have
shown that the acoustic signal contains rich information reflecting the differences
of simulated fault cases but it is highly non-stationary due to a combination of dif-
ferent sources including various noises. An effective signal processing method,
EMD, is used to detail the insight of the signal where the randomness is clearly
identified, and therefore EMD-entropy is used to quantify the amount of random-
ness present in the signals for three different cases. The diagnostic results show
that the entropy values provide a better separation between the faulty cases, com-
pared with the conventional RMS analysis, demonstrating acoustic based condi-
tion monitoring can be more efficient, along with its simplicity of signal acquisi-
tion.
References
[1] Elhaj, M., Gu, F., Ball, A.D., Albarbar, A., Al-Qattan, M. and Naid, A.,
2008. Numerical simulation and experimental study of a two-stage recipro-
cating compressor for condition monitoring. Mechanical Systems and Sig-
nal Processing, 22(2), pp.374-389.

307
[2] Toprak, S. and Iftar, A., 2007, October. Fault Diagnosis on Hermetic Com-
pressors Based on Sound Measurements. In Control Applications, 2007.
CCA 2007. IEEE International Conference on (pp. 783-788). IEEE.
[3] Elhaj, M., Gu, F., Shi. J., and Ball. A. (2001). Early Detection of Leakage
in Reciprocating Compressor Valves using Vibration and Acoustic Contin-
uous Wavelet Features. Proc. 14th Int. COMADEM Conference, Manches-
ter University, pp 749 -756.
[4] Lowson, M.V., 1970. Theoretical analysis of compressor noise. The Jour-
nal of the Acoustical Society of America, 47(1B), pp.371-385.
[5] Ball, A.D., Gu, F. and Li, W., 2000. The condition monitoring of diesel en-
gines using acoustic measurements part 2: fault detection and diagno-
sis (No. 2000-01-0368). SAE Technical Paper.
[6] Wu, Z. and Huang, N.E., 2004, June. A study of the characteristics of white
noise using the empirical mode decomposition method. In Proceedings of
the Royal Society of London A: Mathematical, Physical and Engineering
Sciences(Vol. 460, No. 2046, pp. 1597-1611). The Royal Society.
[7] Su, W.S., Wang, F.T., Zhang, Z.X., Guo, Z.G. and Li, H.K., 2010. Applica-
tion of EMD denoising and spectral kurtosis in early fault diagnosis of roll-
ing element bearings. Zhendong yu Chongji(Journal of Vibration and
Shock), 29(3), pp.18-21.
[8] Wu, F. and Qu, L., 2009. Diagnosis of subharmonic faults of large rotating
machinery based on EMD. Mechanical Systems and Signal Pro-
cessing, 23(2), pp.467-475.
[9] Zhang, C., Chen, J.J. and Guo, X., 2010. A gear fault diagnosis method
based on EMD energy entropy and SVM. Zhendong yu Chongji(Journal of
Vibration and Shock), 29(10), pp.216-220.
[10] Huang, J., Hu, X. and Geng, X., 2011. An intelligent fault diagnosis meth-
od of high voltage circuit breaker based on improved EMD energy entropy
and multi-class support vector machine. Electric Power Systems Re-
search, 81(2), pp.400-407.
[11] Cui, H., Zhang, L., Kang, R. and Lan, X., 2009. Research on fault diagno-
sis for reciprocating compressor valve using information entropy and SVM
method. Journal of loss prevention in the process industries, 22(6), pp.864-
867.
[12] Copco, A. (2018). What is Sound? - AtlasCopco. [online] Atlas Copco.
Available at: https://www.atlascopco.com/en-
in/compressors/wiki/compressed-air-articles/what-is-sound [Accessed 23
May 2018].
[13] Hansen, C.H., 2001. Fundamentals of acoustics. Occupational Exposure to
Noise: Evaluation, Prevention and Control. World Health Organisation,
pp.23-52.
[14] Verma, N.K., Kadambari, J., Abhijit, B., Tanu, S. and Salour, A., 2011,
September. Finding sensitive sensor positions under faulty condition of re-
ciprocating air compressors. In Recent Advances in Intelligent Computa-
tional Systems (RAICS), 2011 IEEE (pp. 242-246). IEEE.

308
ME2018_1148
Educational building technical system
retrofitting - IAQ and maintenance
considerations
Ana C. V. Vieira 1,2,3
, Flávio Chaves 1,2,4
1Polytechnic Institute of Tomar, Estrada da Serra, P – 2300-313 Tomar, Portugal.
2CISE - Electromechatronic Systems Research Centre, Universidade da Beira Interior, Calçada
Fonte do Lameiro, P – 6201-001 Covilhã, Portugal.
3C2I2 - Smart Cities Research Center, Polytechnic Institute of Tomar, Estrada da Serra, P –
2300-313 Tomar, Portugal.
4ADAI - Association for the Development of Industrial Aerodynamics, Coimbra, Portugal.
Email: [email protected]; [email protected]
Abstract Specially since the beginning of the century, buildings, their systems
and equipment have evolved becoming progressively complex, which stresses the
importance of buildings infrastructures maintenance and its role in cost control,
savings in materials, and lifetime enlarging of equipment and facilities.
Concurrently, much of our time is spent inside buildings, and over the last years
users became more demanding and aware on issues related to Health, Safety and
Comfort. Subsequently, Indoor Air Quality (IAQ) have become increasingly im-
portant, not only when considering the existence and concentration of pollutants
but also by taking into account the level of comfort and the perception of users
about the quality of the air one breathes. The effects of a poor IAQ are usually
translated with complaints or symptoms such as headaches, fatigue, nose and
throat irritation, eye inflammation, allergies or concentration difficulties.
For the particular case of educational buildings, both for new buildings and for
school facilities framed in some retrofitting state programs, active systems for in-
door air-conditioning play an important role promoting the right conditions for
IAQ and thermal comfort. The indoor air conditions can have a significant impact
on health, student learning as well as on staff members’ performance, and there-
fore the adequate management of spaces, installations and equipment has a signif-
icant contribute for the educational and scholar success of each student.
In this context, holistic retrofit solutions must always take into account the promo-
tion of IAQ, energy efficiency and energy-savings opportunities as well as main-
tainability or restrictions related to assets management.
This paper presents some results of an IAQ analysis carried out following requests
from a local administration, as well as some of the corrective measures suggested
for a school building.

309
The full version of this paper presents a comparison between the IAQ conditions
before and after the implementation of some proposed corrective measures, con-
sidering the comparative discussion between the measured values and the legal
framework, namely the Decree Law nº. 118/2013, concerning the System for En-
ergy and Indoor Air Quality Certification. It is also presented a study regarding the
passive performance of some spaces with respect to the air renewal passively
achieved.
Key words Asset Management, Health, Safety & Environment, Indoor Air Quali-
ty, Maintenance Organisation, Maintainability.
1.0 Introduction
According to the Portuguese law for the Educational System, the dimensions of
educational buildings must provide the possibility to receive a reasonable number
of students, in order to guaranty the necessary conditions for a good pedagogical
practice and to promote a true scholar community. Simultaneously, the
management of spaces, installations and equipment, human and material
resources, as well as financial and administrative management, should contribute
to the education and scholarly success of each student. To accomplish that,
fundamental areas such as Fixed Equipment, Building Structure, Safety,
Technology and Maintenance must be considered in a well-balanced way. [1,2].
Portuguese educational system has changed significantly over the last decades,
and for preparatory and primary schools the Portuguese policy led to a major
transfer of responsibilities to municipalities or townships. Such responsibilities are
related, not only to educational planning and financing of constructions, but also
to maintenance and material operation of educational buildings, their technical
systems and equipment [3].
Economic factors often tend to regulate options, but it must be undertaken that
public expenditure control measures do not stand only in financial ones. Without
an effective coordination regarding planning and administration, and without the
necessary investments in school preservation, keeping them in good state of
conservation, their progressive degradation will inevitably lead to assets
precociously degradation and the need for their substitution [2]. Even when
considering new edifications, it must be considered the evident need for an
adequate budget for maintaining schools in good state of conservation, preventing
deferred work, which results in a progressive deterioration of existing school
buildings and equipment, and in some cases precocious degradation, until a state
that requires their substitution [2, 3].
An equipment failure, bad dimensioning or bad operation conditions may interfere
directly in the organisation economics. Moreover, in addition to reducing the
overall availability of buildings installations and technical systems and equipment,

310
it may simultaneously interfere with occupants’ safety (students, teachers and
other personnel), as well as occasional users (for example students’ guardians).
Concurrently, in our days much of our time is spent inside buildings, and over the
last years users became more demanding and aware on issues related to Health,
Safety and Comfort. The effects of a poor IAQ are usually translated with
complaints or symptoms such as [4]:
• Sleepiness or fatigue,
• Headaches, dizziness,
• Irritation of mucous membranes,
• Irritation and/or inflammation of the eyes,
• Irritation of nose and/or throat,
• Coughing or sneezing,
• Rhinitis or nasal congestion,
• Nausea,
• Lack of concentration,
• Poor physical and psychological disposition.
Subsequently, Indoor Air Quality (IAQ) have become increasingly important, not
only when considering the existence and concentration of pollutants but also by
taking into account the level of thermal comfort and the perception of users about
the quality of the air one breathes.
An adequate dimensioning of both passive and active systems, their operation, but
also the user’s behavior when using them, is critical to guaranty the proper IAQ,
reason why the maintenance of such systems pay such an important role.
Simultaneously, since the beginning of the century, buildings, their systems and
equipment have evolved becoming progressively complex, which stresses the
importance of buildings infrastructures maintenance and its role in cost control,
savings in materials, and lifetime enlarging of equipment and facilities.
All physical assets, namely equipment, go over several phases during their life
cycle, as referred in Table 1. To be implemented in an ideal way, the maintenance
should therefore be taken into account from the initial phase of any project or
installation, being thus possible to study and analyze the assets previously,
ensuring their proper functioning during the operational phase.
Table 1. Stages in the life cycle of an asset [3] [5][6]
Lif
e cy
cle
Sta
ges
Preparatory Idea, Conception and Designing
Manufacturing and Assembly
Procurement and Installation Test
Acceptamce and Commissioning
Operational Service / Use
Maintenance
Promotion
Planning Closure
Disposal
311
It is important for managers to improve maintenance performance of educational
facilities, focusing on areas such as maintenance, building systems, safety
improvements and technology, if possible anticipating problems and opportunities
in time. To accomplish all these goals, educational and teaching organisations
must be determined to manage their available resources effectively, and to seek
improvements for increased efficiency. At the same time, it’s vital that they
implement a regularly scheduled detailed maintenance plan for all assets [7].
For the case of educational buildings, both for new buildings and for school
facilities framed in some retrofitting state programs, active systems for indoor air-
conditioning play an important role promoting the right conditions for IAQ and
thermal comfort. The indoor air conditions can have a significant impact on
health, student learning as well as on staff members’ performance, and therefore
the adequate management of spaces, installations and equipment has a significant
contribute for the educational and scholar success of each student.
Considering the complexity of the Educational System, there is an obvious need to
review management and administration models, applying the principles of the
Educational System Foundation Law published in 1986, particularly the principle
of institutional autonomy [3, 7-12].
In this context, holistic retrofit solutions must always take into account the pro-
motion of IAQ, energy efficiency and energy-savings opportunities as well as
maintainability or restrictions related to assets management.
The information presented here refers to a study developed following the request
of a local administration, which requested an IAQ study in one of its buildings,
after receiving complaints from the occupants, referring to two distinct spaces:
library and free time activities room (ATL room).
This paper presents some results of the IAQ analysis carried out, as well as some
of the corrective measures suggested for a school building.
The full version of this paper presents a comparison between the IAQ conditions
before and after the implementation of some proposed corrective measures,
considering the comparative discussion between the measured values and the legal
framework, namely the Decree Law nº. 118/2013, concerning the System for
Energy and Indoor Air Quality Certification. It is also presented a study regarding
the passive performance of some spaces with respect to the air renewal passively
achieved.
2.0 Technical Conditions and Legal Framework for IAQ
When contaminated, the air inside buildings is responsible for a high percentage
of respiratory problems, skin allergies and infectious diseases. There may be
specific and non-specific symptoms but usually the signs and symptoms involved
in poor Indoor Air Quality (IAQ) are usually translated with complaints or
symptoms such as headaches, fatigue, nose and throat irritation, eye inflammation,
allergies or concentration difficulties, as aforementioned. Although these
symptoms and complaints may often be attributed to colds, noise, overcrowding,

312
improper lighting, ergonomic conditions and professional stress, it is important to
note that in most cases the symptoms are due to poor indoor air quality.
The protection thresholds and reference conditions are set out in tables I.08 and
I.09 of the Ordinance 353-A/2013 [13, 14]. The methodology used for the analysis
of Indoor Air Quality is described as follows [4]:
1. Definition of measuring points;
2. Measurement of the following parameters:
• Suspended particles in the air: PM10 - Limit value 50 μg/m3;
PM2,5 - Limit value 25 μg/m3. Tolerance Margin (TM) of 100%.
• Carbon Dioxide (CO2) - Limit Value 2250 mg/m3; 1250 ppm. TM of 30%
• Carbon Monoxide (CO) - Limit Value 10 mg/m3; 9 ppmv.
• Total Volatile Organic Compounds (TVOC's) - Limit Value 600 μg/m3;
TM of 100%.
The assessment of the conditions for Thermal Comfort (TC) and IAQ was based
on the Portuguese legal framework [4, 13-19]:
• Article 273º of Law 99/2003 of 27 August, which establishes the general
obligations of the employer [15];
• Decree Law nº. 118/2013 of 20 August, which approves the Buildings
Energy Certification System, the Energy Performance Regulations for Housing
and Buildings Regulation of Energy Performance of Buildings Trade and Services
[13].
• The evaluation of IAQ focused on the parameters set by the abovementioned
Ordinance 353-A/2013[14];
• Decree-Law 243/86 of 20 August, approving the General Regulation of
Health and Safety at Work in Commercial Establishments, Offices and Services
[16];
• ISO 7730, which establishes an objective criterion for evaluation of thermal
comfort using calculation of the PMV and PPD indices [17];
• NT-SCE-02, which presents a Methodology for periodic audits of IAQ in
existing services buildings, within the RSECE [18];
• ISO 8995-1: 2002 (CIE S OO8/E:2001), which establishes the regulation on
lighting of indoor work places [19].
3.0 Case Study
The requested audit to the IAQ was preceded by a third-party evaluation. Based on
their former results it was decided to adjust the methodology proposed by law [13,
18]. Although it was technically possible to follow this methodology, the present
study was carried out in a complementary way to the one that would be drawn
without this information [20].
The overall study was conducted in three distinct periods as resumed in Table 2:

313
Table 2. Data collection periods [4][20][21]
Year month days
2016 March 14, 15 and 16
2018 April 10, 11, 12, 13 and 14
2018 June 26 and 27
3.1 The Educational Building and the study approach
Figure 1 shows the top view of the school (satellite photography) with indication
of the cardinal points for a better perception of the orientation of the school [4, 20,
21].
Continuous and punctual measurements were carried out inside the school:
• Continuous Measurements: Library and 2nd
ATL Room;
• Spot measurements: Corridor, rainwater box, 1st floor room, sanitary facilities,
cafeteria, gymnasium.
Complementary measures were taken outside, in the spot metering locations
presents in Figure 1, namely in: Stormwater boxes around the school grounds
(next to the library and ATL rooms, next to the stairs and gymnasium, access ramp
to the back of the school, playground next to the orange room, school management
site), roof drop tubes and boiler chimney.
a) b)
Figure 1. School Center under analysis: a) Spot metering locations; b) Measur-
ing sites (Spot metering locations) in coverage.

314
3.3 Some suggested Retrofitting and some Results
The corrective measures recommended and implemented, however, are:
• Ventilation of the Pluvial Net with the installation of secondary ventilation tube
next to the pluvial box next to the gas tank, as illustrated in Figure 2.
• Siphon installation in the sewage of the fan coils. According to information
provided, all the fancoil units in the building were submitted to this correction.
• Sealing covers rainwater boxes. All boxes were sealed with a mastic type
solution.
• Two drop tubes were identified as the preferred inputs of the pollutant, on the
roof near the entrance door / access to the playground and above the multipurpose
window. The option in this case was to cut the discharge pipe, shown in Figure 3.
The implementation of the above corrective measures proved to be effective in
improving indoor air quality, minimizing the effect of previously identified
external contamination.
Figure 2. Secondary ventilation tube
of the rainwater network.
Figure 3. Polyvalent drop tubes.
Although the results obtained are encouraging in relation to the infiltration of
pollutants inside the school space, the tests carried out here should be repeated at
the time of the rains, as well as in a school period with normal functioning of the
establishment, suggesting in this case that the scope of be extended to thermal
comfort [20, 21].
To achieve sustainable results, it is essential to ensure that behavioral and
preventive measures are taken: the involvement, participation and effort of all
stakeholders will be crucial [4, 20, 21].
In order for the results to be achieved over time, special attention should be paid to
the following recommendations: [20, 21]:
• The recommendation to create a suitable maintenance record system and a
suitable preventive maintenance plan;
• The renovation of air (through the opening of doors and windows), whenever
possible in order to ensure good air quality - this measure was identified as a rule
meanwhile implemented in the school center and recommended to be maintained.

315
• To study the need to implement a mechanical system in order to make air
renewals viable, considering the ideal minimum airflow rates, according to the
Annex to Administrative Rule no. 353-A / 2013;
• Adopt procedures to ensure the minimisation of paper storage, as well as
selecting "ecologically clean" furniture and decoration materials
• Periodic checks of indoor air quality, taking into account the characteristics of
the building. Such checks shall include at least: i) measuring the concentrations of
the pollutants covered I.08 and I.09 tables Order No. 353-A / 13 of December 4, as
well as, where appropriate, additional measurements from other hazardous
pollutants; (ii) assessment of HVAC cleaning conditions, including maintenance
actions such as checking the condition / effectiveness of the filters and visual
inspection / measurement of dirt (dust).
4.0 Conclusion
The list of health problems and symptomatologies associated with poor indoor air
quality are important factors that justify inspections and analyzes to measure
compliance with the air quality indexes we breathe inside buildings. In order to
meet the legal requirements for the reduction of possible risks to public health,
there is a need to control sources of pollution, to take appropriate preventative
measures, both at the design and rehabilitation of buildings, and that preventive
measures are taken in the operation of buildings and technical installations during
their operation.
Therefore, it is important to focus on areas such as maintenance, technology,
safety improvements, infrastructure and building systems, leading managers to
improve maintenance performance of these organisations, if possible anticipating
in time problems and opportunities.
This paper presents the results of a study regarding an Educational Buildings,
specifically the ones concerning retrofitting actions to improve the IAQ. It
identifies some areas needing improvements, as well as the suggestions made to
improve maintainability, regarding technical solutions but also management,
decision making and strategies employed in maintenance management, among
others.
For the particular under analysis, the correct functioning of the air conditioning
units of the space is fundamental to guarantee the thermal comfort of its
occupants, to maintain acceptable levels of energy efficiency of the air
conditioning systems and, in addition, to allow the interior spaces are not
contaminated by the rainwater network.

316
5.0 Acknowledgement
This work was supported by the Portuguese Foundation for Science and
Technology (FCT) under Project UID/EEA/04131/2013.
Special thanks must be given to Fernando Varela Oliveira and Duarte Gaspar, who
cooperatively contributed to the study on behalf of the company OCTOGRAU.
Our thanks are extended to the Mayor of Constância Municipality, Sérgio Oliveira,
the Alderman Jorge Pereira, the Coordinator of the School Center, the Engineer
Marco Russo, the Teaching and Auxiliary Personnel, as well as to the Technical
Maintenance Team of the Municipality of Constância.
References
[1] Law n.º 46/86 of October 14th; “Educational System Foundation Law” (in Por-
tuguese); Diary of the Republic – I Series, n.º 237 (1986), pp. 3068-3081;
Portugal.
[2] Vieira, A.C.V., and Cardoso, A. J.M., 2011. Asset Management of Portuguese
Educational Facilities. Definitions, Concepts and Scope of Engineering Asset
Management -1st Edition (EAMR - Engineering Asset Management Review,
Volume 1, Part V). Amadi-Echendu, J.E., Brown, K., Willet, R., Mathew, J.
(Editors), pp 277- 295. Springer-Verlag.
[3] Vieira, A.C.V., 2013. Maintenance Management and Organisation in Educa-
tional Institutions (in Portuguese), PhD Theses. FCTUC, Portugal.
[4] Chaves, F.R. F., Vieira, A. C. V., and Oliveira, F.V., 2016. Audit Report of In-
door Air Quality - Centro Escolar de Santa Margarida, April 2016 (in Portu-
guese). IPT, Portugal.
[5] NP EN 13306:2007 (Ed.1), 2007. Maintenance Terminology (in Portu-
guese). Portugal.
[6] Conceição, J.L.F., Vieira, A.C.V, and Santos, R.M.P, 2018. Maintenance
Management Challenges for the region of Médio Tejo. Proceedings of the
Maintenance Performance Measurement and Management (MPMM) Confer-
ence 2018. José Torres Farinha and Diego Galar (Editors), pp. 45-50.
FCTUC-DEM, Coimbra, Portugal.
[7] Vieira, A.C.V., and Cardoso A. J.M., 2014. Maintenance conceptual models
and their relevance in the development of maintenance auditing tools for
school buildings’ assets: an overview; Proceedings of Maintenance Perfor-
mance Measurement and Management (MPMM) Conference 2014, J. Torres
Farinha and Diego Galar (Editors), pp. 3-10. Imprensa da Universidade de
Coimbra, Coimbra, Portugal.
[8] Law n.º 46/86 of October 14th; “Educational System Foundation Law” (in Por-
tuguese); Diary of the Republic – I Series, n.º 237, pp. 3068-3081; Portugal,
1986.

317
[9] Law n.º 49/2005 of August 30th; "Second amendment to the Educational Sys-
tem Foundation Law and the first amendment to the Law on the Financing of
Higher Education" (in Portuguese); Diary of the Republic - I Series A, n.º
166, pp. 5122-5138; Portugal, 2005.
[10] Decree-law n.º 137/2012 of July 2nd; "Second amendment to the Autonomy,
Administration and Management Regimen for Public Establishments of Pre-
school education and Basic and Secondary Education" (in Portuguese); Diary
of the Republic – I Series, n.º 126, pp. 3340-3364; Portugal , 2012.
[11] Ministerial Dispatch n.º 7503/2006 of Abril 4th (in Portuguese); Diary of the
Republic – II Series, n.º 67, pp. 5049-5050; Portugal ,2006.
[12] General Board for Educational Administration, Office Board for Educational
Equipment Quality, 2003. Schools Operation, Maintenance and Safety
Handbook (in Portuguese); Board of Education; Portugal.
[13] Decree-Law 118/2013. Energy Certification of Buildings (SCE) and part of
the Energy Performance Regulation for residential buildings (REH) and the
regulation of energy performance of buildings and Commercial Services
(RECS) (in Portuguese). Diary of the Republic - I Series, n. º 159 (2013), pp.
4988-5005. Portugal.
[14] Ordinance 353-A/2013.Supplement of Decree-Law 118/2013.
[15] Law 99/2003 of 27 August. General obligations of the employer (in Portu-
guese). Diary of the Republic - I Series-A, n. º 197, pp. 5558-5656. Portugal.
[16] Decree-Law 243/86. General Regulation of Health and Safety at Work in
Commercial Establishments, Offices and Services (in Portuguese). Diary of
the Republic - I Series, n. º 190 (1986), pp. 2099-2106. Portugal.
[17] ISO 7730, 2005. Ergonomics of the thermal environment - Analytical deter-
mination and interpretation of thermal comfort using calculation of the PMV
and PPD indices and the local thermal comfort criteria.
[18] NT-SCE-02, 2011. Methodology for periodic audits of IAQ in existing ser-
vices buildings within the RSECE (in Portuguese).
[19] ISO 8995-1: 2002 (CIE S OO8/E:2001). Lighting of work places -- Part 1:
Indoor. 2nd
edition 15/05/2002.
[20] Chaves, F.R. F., Vieira, A. C. V., and Gaspar, D., 2018. Audit Report of In-
door Air Quality - Centro Escolar de Santa Margarida, May 2018 (in Portu-
guese). IPT, Portugal.
[21] Chaves, F.R. F., Vieira, A. C. V., and Gaspar, D., 2018. Audit Report of In-
door Air Quality - Centro Escolar de Santa Margarida, July 2018 (in Portu-
guese). IPT, Portugal.

318
Authors’ Biography
Ana C. V. Vieira
Ana C. V. Vieira received the Eng. Dipl., the M.Sc.
and the PhD degree in Electrical Engineering, in the
domain of Asset and Maintenance Management, from
the University of Coimbra, Portugal, in 1996, 2004
and 2014, respectively. She is an Adjunct Professor at
the Polytechnic Institute of Tomar, Portugal. Her
teaching interests cover maintenance management,
energy performance in buildings, energy savings and
power quality. Her research interests include energy
and maintenance management, maintenance audits,
and maintenance strategies in asset management.

319
ME2018_1149
An iterative process to extract value from
maintenance projects
Carolina Mejía Niño1, Michele Albano
2, Erkki Jantunen
3, Pankaj Sharma
4,
Jaime Campos5 , David Baglee
6
1Innovation and Technology Department, Mondragon Corporation, Spain
2CISTER, ISEP, Polytechnic Institute of Porto, Portugal
3VTT Technical Research Centre of Finland, Finland
4Dept. of Industrial Systems Engineering and Management, National University of Singapore,
Singapore
5Department of Informatics, Linnaeus University, Sweden
6Faculty of Engineering and Advanced Manufacturing, University of Sunderland, UK
Email: [email protected]; [email protected]; [email protected];
[email protected]; [email protected]; [email protected]
Abstract Research and development projects are producing novel maintenance
strategies and techniques. Anyway, it is not straightforward to transfer results
from the lab to the real world, and thus many projects, both internal to a company
and in cooperation between the members of a consortium, speculate how to per-
form this feat, called “exploitation” in the context of European projects. This pa-
per discusses the necessity of novel techniques in modern maintenance, and then
introduces a novel approach to the problem of transferring innovation from the lab
to the market. The novel approach spawns from the “spiral software development”
process and proceeds as a set of iterations that bring together different stakehold-
ers to increase the number of products, techniques and results in general that can
survive the end of a research and development project. The approach was ap-
pliedto a large European project, which is described as use case, and the paper re-
ports on the encouraging results that were attained.
Key words Exploitation, Research Projects, Machine Maintenance, Case Study;
Advanced Maintenance.

320
1.0 Introduction
Maintenance came to prominence, in the last few year, as an important activity
that can benefit companies, instead of a “necessary evil”. In fact, novel approaches
such as maintenance-as-a-service (MaaS) and condition based maintenance
(CBM) can provide new sources of income and save a great deal of time and mon-
ey respectively.
Many research activities are currently active all over the world to advance current
techniques for maintenance, and are advancing state-of-the-art by great lengths.
On the other hand, there is an intrinsic gap between the lab and the real world,
since the acceptance by the industry of new techniques depends on the existence
of real-world applications of the techniques, which on its part requires the stake-
holders to commit to creating applications and thus investing in them. Finally, to
invest in a novel technique, the stakeholders must have accepted it, which creates
a vicious circle. The problem appears in both research and development projects
internal to a company, and to collaboration between multiple stakeholders.
To break this vicious circle, one solution is implemented by the Ecsel Agency of
the Horizon 2020 program for European international research projects. Its ap-
proach is to finance collaboration between different international partners that end
up being stakeholders to the project, with the financing depending on the creation
of applications of the techniques in real environments. Anyway, in many cases the
lifespan of a research project is not enough to ensure the creation of products, and
there is no assurance that a company will provide continuity to the innovation cre-
ated by a project. Therefore, most research and development project have, among
their activities, the study of the potential exploitation of the project’s results.
Current processes to identify exploitable results are either ad-hoc, or based on a
very rigid structure, and sub-optimal, since the number and extent of identified
exploitable results end up being limited.
Inspired by modern software development processes, this paper proposes a novel
approach to the problem of identifying exploitable results in a research and devel-
opment project. The proposed approach is iterative, and considers to repeat a
number of steps for multiple iterations, to grow and refine the list of potential ex-
ploitable results periodically, and measure their potential, until reaching conver-
gence over further iterations. In each iteration, different stakeholders are brought
together to analyze the exploitation list, with the goal of maximizing the number
of products, techniques and results that can survive the end of a research and de-
velopment project. The approach was applied to a large European project on
maintenance called MANTIS (Albano, Papa, Jantunen, & Zurutuza, 2018), and
the paper reports on the results from the exploitation point of view.
The rest of the paper provides background information in section 2 on the poten-
tial for advanced maintenance. Section 3 describes the MANTIS project, which
aims at pushing forward the state-of-the-art of collaborative and proactive mainte-
nance, and advanced maintenance in general. Section 4 describes and provides

321
motivation for the proposed iterative process, and Section 5 describes how it was
applied to the MANTIS project, and the results it provided. Finally, Section 6
discusses the results and provides a preliminary comparison to different approach-
es applied in similar projects, and concludes the paper.
2.0 Applying Maintenance advances in the Real World
This section discusses the importance of maintenance, and in particular starts from
an analysis of current maintenance practices and their importance for the industry.
Thus, it motivates the execution of research and development projects to push
forward innovations in maintenance that can provide value.
Later on, the section delves into details regarding advanced maintenance practices.
It turns out that many activities are pushing forward the state-of-the-art, and thus
we can be on a turning point for maintenance.
Anyway, extracting exploitable results from research and development projects is
not trivial. The last subsection considers software development life cycles, which
are used as inspiration to study novel processes to bring novel products, strategies,
and techniques for advanced maintenance from the lab to real-world pilots, to pro-
duction environments such as the shop floor, up to the market.
2.1. The Value of Advanced Maintenance Practices
The Operation and Maintenance (O&M) phase in a machine’s life cycle requires
large expenses and more efforts than the installation (construction) phase, because
in its long useful life, any accident of an asset can result in catastrophic damage to
the entire company. Maintenance has gained lot of importance as the technical
complexity of the machines has increased. Maintenance is defined as all technical
and managerial actions taken during usage period to maintain or restore the re-
quired functionality of a product or an asset (Shin and Jun, 2015). Maintenance
has been classified by various researchers and practitioners in the past. Most wide-
ly acknowledged classification defines maintenance as per the instant that it is ex-
ecuted, i.e., whether after the breakdown (corrective maintenance) or before the
breakdown (predictive maintenance). Predictive maintenance concerns with the
prediction of degradation process of the product, which is based on the assumption
that most abnormalities do not occur suddenly, and usually there are some kinds of
degradation process from normal states to abnormalities (Fu et al., 2004). This
degradation process is characterized by certain responses that the machine pro-
vides to the sensors. These changes in the measured parameters can indicate that
the machine is moving towards a possible failure in the future. The method can be
used to reduce the uncertainty of maintenance activities and is carried out accord-

322
ing to the requirements indicated by the equipment condition (Peng et al., 2010).
A large number of advanced maintenance methods are being used today as the
cost of failure is becoming increasingly prohibitive or simply catastrophic.
The need for implementing advanced maintenance strategies is no more a choice.
Companies have no option but to implement them in order to remain competitive.
These advanced maintenance strategies like CBM give prior warning of impend-
ing failure and increase the probability of accurately predicting the kind of failure.
Some other machines, where the personnel safety is at stake, have CBM as the on-
ly viable option. Modern maintenance practices also enable the maintenance pro-
viders to better plan their resources. Resources like skilled manpower, spare parts,
specialized tools, etc. can be placed at pre-planned locations to both optimize their
usage as well as make them available in the shortest possible time to reduce ad-
ministrative delays.
Implementation of modern maintenance methods was a costly exercise a few dec-
ades back. However, the reducing costs of sensors and computational resources,
coupled with increase in computational power and decrease in the size of the sen-
sors has made it a more technically and economically viable approach. It can lead
to a decrease in the maintenance budget (Bengtsson, 2004). Modern advanced
maintenance practices have the capability to optimize the production process and
improve its productivity. It provides the ability for the system to continue operat-
ing as long as it is performing within predefined performance limits (Prajapati et
al., 2012).
2.2. Advanced maintenance in real-world scenarios
Application of modern maintenance methods in real-world scenarios is not a very
easy process. There are a number of technical issues that inhibit the free use of
such advanced maintenance practices. First and foremost, the organizations must
select the assets that require condition monitoring. CBM is supposed to be applied
where appropriate, not as an overall policy as some techniques are expensive and
it would not be cost effective to implement them everywhere (Starr, 1997). This
selection should be based on technical and economic feasibility analysis. The ma-
chine should be critical enough to warrant large investments in a CBM system.
Also, the selected asset must be such that it has parameters that matter for its func-
tioning and that can be monitored with sensors. Most CBM implementations fail
because the organisations start to measure ‘what can be measured’ rather than
‘what should be measured’. The first challenge is to obtain effective features from
many candidate features to reflect health degradation propagation in the whole life
of machines (Yu, 2012). In machine-learning-based defect detection, the accuracy
of prognostics and diagnostics models subsequently dependents on the sensitivity
of the features used to estimate the condition and propagation of the defects.
Therefore, it is critical to devise a systematic scheme that is capable of selecting

323
the most representative features for current machine health states (Yu, 2012; Mal-
hi et al., 2004). The complexity of selecting a suitable measure can be gauged
from an example. Some research shows that the use of acoustic signal is better
than vibration signal due to its sensitivity and accuracy (Al-Ghamd & Mba, 2006;
Baydar & Ball, 2001; Tandon et al., 2007). However, in practice, the application
of acoustic signal may not be appropriate due to the significant effects of noise
(unwanted signals) from other equipment. In addition, alternative sources of in-
formation are important contributors to health monitoring. These sources include
the OEM, ISO standards, experience of the workers, etc. The new challenge is to
find ways to use these alternative sources of information in order to achieve better
monitoring of assets and correct decision making (Ahmad and Kamaruddin,
2012).
Choice of a correct sensor with appropriate sensitivity is an important step. Select-
ing a costlier sensor when it is not required will make the CBM system unneces-
sarily expensive which will not be able to justify the cost-benefit argument. On the
other hand, selecting a cheaper non-sensitive sensor when the data being measured
has minute variations that require high quality sensor can also upset the cost-
benefit balance as the diagnosis of the fault may not be correct. Other ICT chal-
lenges include sensor data quality related to gathering frequency, noise, and level
of details of sensor data, data availability, wireless communication problem, fre-
quency of diagnostics and prognostics, and so on (Shin and Jun, 2015). In addi-
tion, the technologies and technical methods for the CBM approach are still in
their infancy. It means that there are some limitations in ensuring the accuracy of
diagnostics and prognostics (Shin and Jun, 2015). Numerous different techniques
and technologies exist but choosing the correct one, or even remembering to make
the decision in due time can be a troublesome activity which can put an entire im-
plementation effort at risk (Bengtsson, 2007).
The condition monitoring practice is based on the fact that a sensor is used to
measure a parameter. When the value of the measured parameter crosses a pre-
determined threshold, suitable maintenance actions are initiated. In practice how-
ever, deciding on the threshold is a complex process. The failure of each equip-
ment may be defined and classified in different ways. Some organisations consider
failure as the physical event such as a breakage that stops production. The ma-
chine stops to function as a result of such a failure. In some other cases, a func-
tional failure may occur which results in the final product of the machine to have
quality flaws but the machine may continue to work. It is necessary for the organi-
sations to determine threshold based on their requirements. The definition and de-
termination of failure limits should be considered from both the entire machining
process perspective (system/sub-system) and the overall output of the system (e.g.,
product quality characteristics) (Ahmad and Kamaruddin, 2012).
Analysing waveform data is an intricate process because of noise effects, which
are unwanted signals generated by other equipment. Noise must be minimised or
eliminated from the data (Ahmad and Kamaruddin, 2012). Some noise also gets
generated due to the transmission medium. It is necessary to identify which data

324
transmission type (wire or wireless) is effective in terms of cost and reliability
with least noise (Shin and Jun, 2015). Large data sets are required for effective da-
ta analysis and modelling. This collected data needs to be cleaned before any
analysis. This is a complex task, especially for waveform-type data. Newly com-
missioned systems have no historical data. Even the OEM is not aware of the fail-
ure patters or failure rates. In such cases, it is not possible to identify the trends or
failure thresholds. Such situations are no-data situations (Si et al., 2011). The
quantity and completeness of data are insufficient to fit the full statistical models.
Hence, it may be a better choice to develop physics-based models with the help of
subjective expert knowledge from design and manufacturing (Si et al., 2011).
2.3. Software Development Life Cycles
In the Information and communication technology (ICTs) projects, there is a
need to have an information technology approach for its project management
phases, i.e. the use of a software development life cycle (SDLC). Brewer and
Dittman, (2013) highlight different project variances between disciplines, such as
requirement changes, sources of changes, requirements specification, etc., where
requirements changes are slow and incremental for engineering while rapid and
unplanned for information technology projects, for instance. The sources of
changes are for engineering known and predictable while for ICTs projects many
times unknown. Requirements are other factors that are different, namely for en-
gineering it is an explicit plan while for ICTs projects normally ambiguous (Brew-
er & Dittman, 2013).
The SDLC approaches, such as the waterfall model, highlight the processes,
namely the different phases of a system development process. Some reports high-
light the death of the Waterfall Life-cycle Model, which are greatly exaggerated
(Laplante and Neill, 2004), since it forms essential practices and might be seen as
the pillars of the area of the methodologies in the area of system development.
Hence, a methodology is defined as a system of methods used in a particular area
of study or activity (Kuosa, 2016). The waterfall model is a sequential progressive
process, whose development is a steadily downwards, i.e. resembling a waterfall
through its stages. In the waterfall model, the requirements are evident before the
next step of design is started. The testing of the code is done when the application
is completely developed (Leau et al. 2012). This can be compared with the so-
called V- model, which characterises a different SDLC process can be reflected as
an extension of the waterfall model. The difference is that as an alternative of
progressing linearly in its process paces, it is curved upwards after the program-
ming phases and is, namely, the reason it is called the V – model, i.e. because it
forms a V shape. Another well-known approach is the Agile methodology that
emphases adaptive teams that are capable of reacting quickly to the changing re-
quirements’ specifications. In addition, it also accepts requirements update late in

325
development phases. Hence, the software is typically delivered frequently, i.e.
within weeks instead of months. The key principle of the approach is customer
satisfaction by providing rapid and constant delivery of its software applications.
However, to design and develop ICT applications for the domain of interest there
is a need for a detailed and comprehensive understanding of the different algo-
rithms suitable for analysing the different parts of the equipment. In other words,
there is a need for an approach that considers the key aspects of the domain.
Still, organisations that are developing software applications are challenged with
the difficulties of choosing the relevant SDLC or methodology and included
methods (Balaji and Murugaiyan, 2012). The different aspects of the SDLC mod-
els among other are documented in Ruparelia (2010). New development life cy-
cles have been suggested with the aim to increase the customer satisfaction (Ku-
mar et al. 2013). In the suggested model such features as the understanding of
requirements, costs, risk involvement, etc., are highlighted. The proposed SDLC
plan attempts to achieve the objectives of an ICT project through the illustration of
the requirements in a prototype to the clients to discover deviations from the
planned order as well as to estimate the costs, schedule and work time invested
more precisely, among other aspects. Another work that discusses improvements
of the existent agile developments methods and traditional SDLC is (Leau et al.,
2012). The different aspects of SDLC, such as the Waterfall model on large pro-
jects, are discussed in Petersen et al. (2009). A comparison between different
SDLC methods in different scenarios are presented in Mishra and Dubey (2013).
In brief, there is a need of a SDLC or project manamement methodology that
contemplates the important aspects of the specific domain it inteds to be imple-
mented in, i.e. that is flexible enough to fit into the required aspects of the
particular domain.
It is, however, recommended that before deciding the model to be used it is essen-
tial to understand certain crucial aspects, namely how stable the requirements are,
who are the end users of the system, the size of the project, and where the project
teams are located, etc (Balaji and Murugaiyan, 2012). In the case that the re-
quirements are volatile, i.e. that they frequently change, and it is about a smaller
projects where there is a need to deliver the product in short time which includes
skilled resources, then the Agile methods are of preference. In the case that the
requirements are stable as well as precise, and it involves a larger project, then it is
proper to choose approaches similar to the Waterfall model. In addition, in the
case that the requirement specifications changes in a larger project where proper
validation needs to be taken at each stage, as well as to have testers to be part of
the project in early phases of the development process, then the approaches alike
the V-model are proper.
In addition, aspects of the Rational unified process (RUP) and the Spiral method-
ology are discussed in (Mateen et al., 2016). The authors propose a new method-
ology for the development of software applications that overcomes the weakness
of the waterfall, agile, spiral, RUP and RAD development life cycle. The life cycle
models are complex because they involves rigorous processes and there is no “sil-

326
ver bullet” in software development methodologies (Zykov, 2016). In addition, the
Agile methodologies entail distinct methods and a high level of discipline; else,
they can end in a low-quality software application.
Consequently, the business analysis, as well as other aspects of the development
life cycle, becomes crucial to evaluate in any ICT project. It results in a need of a
project methodology or SDLC that consider among other aspects the essential as-
pects of the specific domain to understand and develop project management pro-
cesses in order to be successful in the ICTs implementation of the industrial
maintenance area.
3.0 The MANTIS project
The MANTIS Project (Albano, Papa, Jantunen, & Zurutuza, 2018) was a Europe-
an initiative focused on innovation on advanced maintenance practices. The pro-
ject was alive in the period 2015-2018, and studied many sides of maintenance,
spanning from sensors and Cyber Physical Systems to collect data on the ma-
chines and the shop floor, to the communication middleware (Albano, Sharma,
Campos, & Jantunen, 2018) to transport the data to the cloud in an efficient and
secure manner, to the machine learning techniques that can be used to provide
CBM to the machines using the collected data, to advanced data visualisation sys-
tems to help the technicians make sense of the high volume of information that is
collected in the machines and produced by the machine learning algorithms.
The MANTIS Project was driven by its real-life pilots. All studied techniques
were applied to machines, and had to be validated as integrated in production en-
vironments. Many important industrial fields were tackled by the project, such as
automotive, energy production and manufacturing. In this sense, the pilots are the
testing ground for the innovative functionalities of the proactive maintenance ser-
vice platform architecture and for its future exploitation in the industrial world.
Among the results of the project, there is the reference architecture for advanced
maintenance techniques. This is the underlying architecture of the service plat-
forms that were implemented in the different pilots, and is based on three tiers.
The Edge Tier is on the production floors, and close to the machines in general,
and its goals are to collect data from the environment and the machines; to prepro-
cess the data; to transport the data to the cloud. The Enterprise Tier is close to the
customer and/or to the personnel that operates and maintain the machines, and it
allows for the visualisation of the data, analyze it from a technical and economic
points of view. It is also able to issue control commands to the other tiers. Finally,
between these two tiers there is the Platform tier, which receives the streams of te-
lemetry data from the Edge tier, and the control commands coming from the En-
terprise tier. This tier consolidates the data flows by means of external data; ana-
lyzes the data by means of machine learning techniques; offers non-domain
specific services such as data query and analytics.

327
The MANTIS Project was able to investigate a large number of matters related to
maintenance. Anyway, the benefits in the real world depend on a process to ex-
tract the best results, corroborate them by integration in different scenarios, and
package them for future usage. This process is called exploitation, and it was of
the utmost importance to maximize the benefits of the MANTIS Project to the in-
dustry. Given the large size of the MANTIS Project, the exploitation process was
target to innovation to be able to cope with the task at hand.
4.0 An Iterative process for defining exploitable results
Exploitation activities are characterized by identification, experimentation, charac-
terisation and investigation, which can result in new knowledge. This new
knowledge or exploitable results, can be applied as an internal institution asset for
new research projects, as such for the creation of new goods (products or ser-
vices). The speed, cost efficiency and successfulness in the market of the exploita-
ble results development depend on the extent to which the exploitation activities
are completed in the project (Lantos, 2006).
The usual approach to exploitation is based on the creation of a list of potential re-
sults at some time in the project, and a refining at the end of the project. This tra-
ditional approach is similar to the waterfall SDLC, but it can be sub-optimal for
large projects whose complexity does not allow for a clear vision of the whole
project at once.
A novel approach can be based on an adaptive exploration/exploitation tradeoff
that helps to identify and get the exploitable results to the market in an iterative
and retrofitting approach.
The methodology follows a planned process of transferring the successful results
of the project to useful exploitable results, based on diverse innovation processes
and management tools such as Effectuation, Exploit, FoF-Impact, Value Chain,
Innovation Radar, etc., giving a constant interaction and feedback all over the
course of the project.
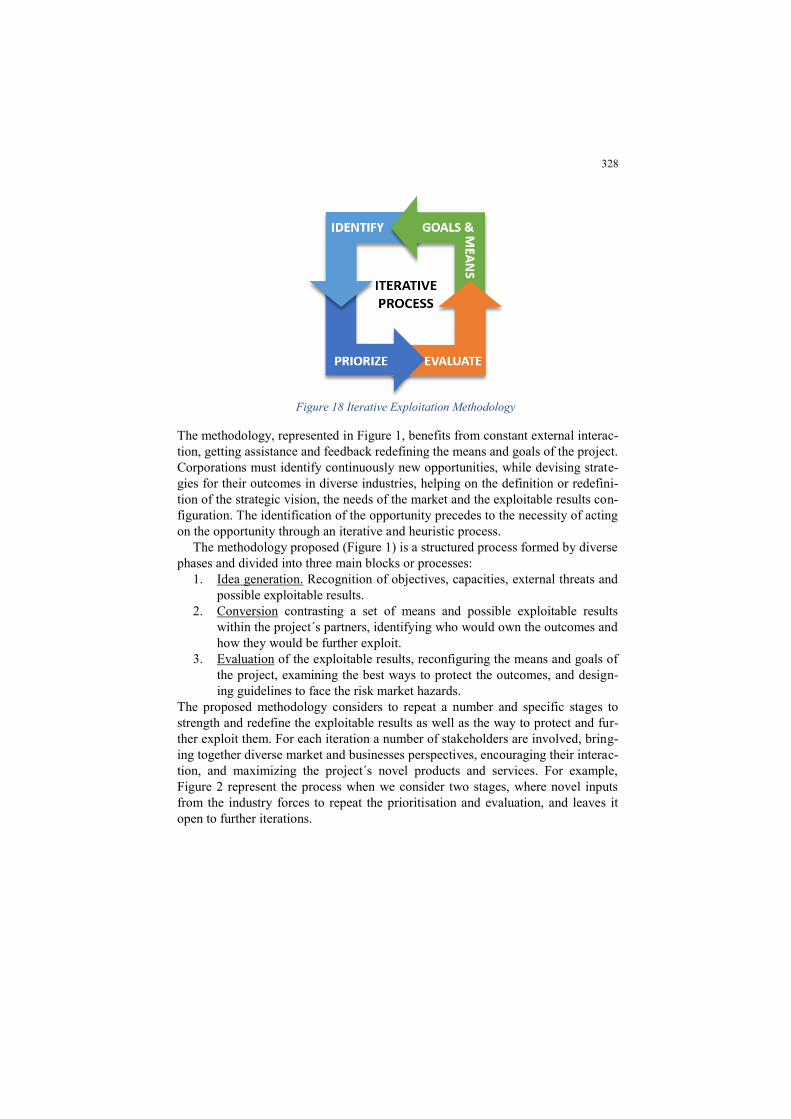
328
Figure 18 Iterative Exploitation Methodology
The methodology, represented in Figure 1, benefits from constant external interac-
tion, getting assistance and feedback redefining the means and goals of the project.
Corporations must identify continuously new opportunities, while devising strate-
gies for their outcomes in diverse industries, helping on the definition or redefini-
tion of the strategic vision, the needs of the market and the exploitable results con-
figuration. The identification of the opportunity precedes to the necessity of acting
on the opportunity through an iterative and heuristic process.
The methodology proposed (Figure 1) is a structured process formed by diverse
phases and divided into three main blocks or processes:
1. Idea generation. Recognition of objectives, capacities, external threats and
possible exploitable results.
2. Conversion contrasting a set of means and possible exploitable results
within the project´s partners, identifying who would own the outcomes and
how they would be further exploit.
3. Evaluation of the exploitable results, reconfiguring the means and goals of
the project, examining the best ways to protect the outcomes, and design-
ing guidelines to face the risk market hazards.
The proposed methodology considers to repeat a number and specific stages to
strength and redefine the exploitable results as well as the way to protect and fur-
ther exploit them. For each iteration a number of stakeholders are involved, bring-
ing together diverse market and businesses perspectives, encouraging their interac-
tion, and maximizing the project´s novel products and services. For example,
Figure 2 represent the process when we consider two stages, where novel inputs
from the industry forces to repeat the prioritisation and evaluation, and leaves it
open to further iterations.

329
5. Results of the iterative process in a case study
The approach presented in Section 4 was applied in an ECSEL predictive mainte-
nance project called MANTIS (see Section 3), whose implementation is represent-
ed in Figure 3 and comprised the execution of six main workshops in a three-years
period:
- 1st and 2
nd workshop had the goal to advance in the search of servitisation
business models around predictive/proactive maintenance solutions. The
ultimate goal was to establish a baseline for consortium members to start
an early definition of their new business model and start identifying the
possible exploitable results.
- 3rd
and 4th
workshop had the objective of characterizing the potential ex-
ploitable results, analyzing the possible ownership and exploitation
claims.
- 5th
workshop first exploitable results prioritisation, identifying the most
relevant outcomes for each institution.
- 6th
workshop aim to identify, evaluate and respond to the critical market
entry hasards of the exploitable results.
Figure 19 Repetition of stages in defining exploitable results

330
- 7th
workshop aim to recheck the exploitability, ownership, prioritisation
and intellectual property protection status of each of the reconfigured re-
sults.
The characterisation of the iterative process for the exploitable results definition
improved the consortium commitment in the exploitation process, providing con-
stant interaction and feedback all over the project course. The workshop method
revealed its effectiveness since it is easier to transmit a message with the goals and
purpose of the survey, together with the data collection of the answers provided by
the participating partners.
As part of the evolution and the iterative process, the MANTIS consortium identi-
fied 97 exploitable results at the middle of the project, readjusting to 76 in the last
months. Some of the eliminated items couldn´t been tested due to the lack of base
line data, they need to be verified in other uses in order that the entities are entire-
ly sure to exploit them or they don´t fulfil the criteria for specific exploitation.
6.0 Discussion and conclusions
The outputs generated during a project can create an important impact during and
after the project´s lifecycle. The further exploitation of the results, such as creating
and marketing a product or process, or creating and providing a service, or even
for internal usage activities, reveal the external impact of the project.
On preliminary industry 4. 0 projects, the exploitable results were identified at the
beginning of the project, and weren´t exploit/used by the partners after the pro-
ject´s lifecycle. The number of identified exploitable results differ from type of
project and kind of products, MANTIS had a high number of exploitable results
(estimated at 76) that can be transferred into 13 successful business cases taking
into account the industrial and software partners. In previous projects of size com-
parable to MANTIS, a mean of 12 exploitable results were identified, and they
had less impact in the entities´ business cases or could not be used afterwards.
Figure 20 Iterative process for the exploitable results definition

331
In other projects, the exploitation process relied on a theoretical approach from the
first months, and did not take into account the industrial process feedback to iden-
tify new exploitable results or to eliminate the ones that will not be exploited.
Future work will perform a final inventory of exploited results one year after the
end of the MANTIS project, to provide a final evaluation. Anyway, the current
number (76) is already the result of multiple iterations and refinement, and most
exploitable results are already employed in production environment, thus there
will probably be no surprises. Moreover, we plan to perform a thorough
comparison between older projects that had no specific and explicit exploitation
activities (work packages), traditional projects with a waterfall/ad-hoc exploitation
process, and MANTIS and future project that adopt our proposed iterative process.
7.0 Achnowledgment
This work was partially supported by National Funds through FCT/MEC (Portu-
guese Foundation for Science and Technology), Finnish Funding Agency for In-
novation Tekes, and co-financed by ERDF (European Regional Development
Fund) under the PT2020 Partnership, within the CISTER Research Unit
(CEC/04234); also by FCT/MEC and the EU ECSEL JU under the H2020
Framework Programme, within project ECSEL/0004/2014, JU grant nr. 662189
(MANTIS).
References
Ahmad, R. & Kamaruddin, S. (2012). An overview of time-based and condition-
based maintenance in industrial application. In Computers & Industrial Engineer-
ing, Vol. 63, pp. 135–149.
Albano, M., Papa, G., Jantunen, E. & Zurutuza, U. (2018). The MANTIS book:
Cyber Physical System Based Proactive Maintenance. River Publishers ed.
Albano, M., Sharma, P., Campos, J. & Jantunen, E. (2018). Blockchain Technolo-
gy Helps Maintenance to Stop Climate Change. In Proceedings of Maintenance
Performance Measurement and Management (MPMM) Conference 2018. Im-
prensa da Universidade de Coimbra.
Al-Ghamd, A.M. & Mba, D.A. (2006). Comparative experimental study on the
use of acoustic emission and vibration analysis for bearing defect identification
and estimation of defect size. In Mechanical System and Signal Process, Vol. 20,
pp. 1537–1571.

332
Balaji, S. & Murugaiyan, M. S. (2012). Waterfall vs. V-Model vs. Agile: A com-
parative study on SDLC. In International Journal of Information Technology and
Business Management, 2(1), 26-30.
Baydar, N. & Ball, A. (2001). A comparative study of acoustic and vibration sig-
nals in detection of gear failures using Wigner-Ville distribution. In Mechanical
System and Signal Process, Vol. 15, No. 6, pp. 1091–1107.
Bengtsson M. (2004). Condition Based Maintenance Systems: an Investigation of
Technical Constituents and Organisational Aspects. Malardalen University Licen-
tiate Thesis.
Bengtsson, M. (2007). Decision Making During Condition Based Maintenance
Implementation. In Proceedings: The 20th Congress on Condition Monitoring and
Diagnostic Engineering Management, Faro, Portugal, June 13-15, pp. 235-244.
Brewer, J. L. & Dittman, K. C. (2013). Methods of IT project management. Pur-
due University Press.
Fu, C., Ye, L., Liu, Y., Yu, R., Iung, B. & Cheng, Y. (2004). Predictive mainte-
nance in intelligent control-maintenance-management system for hydroelectric
generating unit. In IEEE Transactions on Energy Conversion 2004;19(1)179–86.
Kumar, N., Zadgaonkar, A. S. & Shukla, A. (2013). Evolving a new software
development life cycle model SDLC-2013 with client satisfaction. In International
Journal of Soft Computing and Engineering (IJSCE), 3(1), 2231-2307.
Kuosa, T. (2016). The evolution of strategic foresight: navigating public policy
making. Routledge.
Lantos, G. P. (2006). Resolving the Capability–Rigidity Paradox in New Product
Innovation. In Journal of Product Innovation Management, 23: 289-291.
doi:10.1111/j.1540-5885.2006.00200.x
Laplante, P. A. & Neill, C. J. (2004). The demise of the waterfall model is immi-
nent. In Queue, 1(10), 10.
Leau, Y. B., Loo, W. K., Tham, W. Y. & Tan, S. F. (2012). Software development
life cycle AGILE vs traditional approaches. In International Conference on Infor-
mation and Network Technology (Vol. 37, No. 1, pp. 162-167).

333
Malhi, A., Yan, R. & Gao, R.X. (2004), PCA-based feature selection scheme for
machine defect classification. In IEEE Transactions on Instrumentation and
Measurement, Vol. 53, No. 6, pp. 1517–1525.
Mateen, A., Azeem, M. & Shafiq, M. (2016). AZ Model for Software Develop-
ment. arXiv preprint arXiv:1612.08811.
Mishra, A. & Dubey, D. (2013). A comparative study of different software devel-
opment life cycle models in different scenarios. In International Journal, 1(5), 64-
69.
Peng, Y., Dong, M. & Zuo, M.J. (2010). Current status of machine prognostics in
condition-based maintenance: a review. In International Journal of Advanced
Manufacturing Technology 2010; 50:297–313.
Petersen, K., Wohlin, C. & Baca, D. (2009). The waterfall model in large-scale
development. In International Conference on Product-Focused Software Process
Improvement (pp. 386-400). Springer, Berlin, Heidelberg.
Prajapati, A., Bechtel, J. & Ganesan, S. (2012). Condition based maintenance: a
survey. In Journal of Quality in Maintenance Engineering 2012;18(4) 384–400.
Ruparelia, N. B. (2010). Software development lifecycle models. In ACM
SIGSOFT Software Engineering Notes, 35(3), 8-13.
Shin, J.H. & Jun, H.B. (2015). On Condition Based Maintenance. In Journal of
Computational Design and Engineering 2(2015)119–127.
Si, X., Wang, W., Hua, C. & Zhou, D. (2011). Remaining useful life estimation: a
review on the statistical data driven approaches. In European Journal of Opera-
tional Research, Vol. 213, pp. 1–14.
Starr, A. (1997). A Structured Approach to the Selection of Condition Based
Maintenance. In Proceedings of the 5th International Conference on Factory, pp.
131-138.
Tandon, N., Yadava, G.S. & Ramakrishna, K.M. (2007) A comparison of some
condition monitoring techniques for the detection of defect in induction motor ball
bearings. In Mechanical Systems and Signal Processing, Vol. 21, pp. 244–256.
Yu, J. (2012). Health Condition Monitoring of Machines Based on Hidden Mar-
kov Model and Contribution Analysis. In IEEE Transactions on Instrumentation
and Measurement, Vol. 61, No. 8.

334
Zykov, S. V. (2016). Software Methodologies: Are Our Processes Crisis-Agile? In
Crisis Management for Software Development and Knowledge Transfer (pp. 51-
68). Springer, Cham.
Authors’ Biography
Carolina Mejía Niño
Carolina Mejía Niño is an Innovation Technician in the
Innovation and Technology Department of
MONDRAGON Corporation, Spain. Her research
focuses on the development of an accurate and complete
exploitation methodology, helping to translate
innovation results to market for Industry 4.0, Smart
Cities, Raw Material and Big Data projects. The
Innovation and Technology Department of
MONDRAGON Corporation aim to facilitate and
promote the innovation activity of the more than 100
cooperatives related to the group.
Carolina received her degree from the Universidad de
los Andes, Colombia, and her masters from Universitat
Politécnica de Catalunya and Mondragon Unibersitatea.
She has been a researcher at the
UIA-CIMES Programme and participated in Proactive
Maintenance and Smart Cities European projects.
Michele Albano
Dr Michele Albano is a Research Associate in the CISTER
Research Unit of the Polytechnic of Porto, Portugal, and
Adjunct Professor at Polytechnic Institute of Cavado e Ave,
Portugal. His research focuses on Cyber Physical Systems and
Communication Middleware, in particular for the application
areas of industrial maintenance, smart grids, and vehicular
networks.
Michele received his degrees from the University of Pisa,
Italy, and he was researcher at Universidad de Malaga, Spain,
at University of New York at Stony Brook, and at Instituto de
Telecomunicações in Aveiro, Portugal. He has been involved
in more than 10 international research projects, and he is
currently active in the context of European projects Productive
4.0 and MANTIS, and in the latter he is Work Package leader
for WP3 "Smart sensing and data acquisition technologies"
and for WP8 "Dissemination of knowledge and exploitation".
His works have been published in more than 70 international
conferences and journals, and he is the editor of the book The

335
MANTIS book: Cyber Physical System Based Proactive
Maintenance. Since 2015, Michele is the Editor in Chief for
the Journal of Green Engineering, River Publishers.
Erkki Jantunen
Dr Erkki Jantunen is principal scientist at VTT Technical
Research Centre of Finland. He has been a member of the edi-
torial board and acted as a reviewer of a number of scientific
journals. He has been project manager of many research pro-
jects. He is the author and co-author of several books and
more than 150 research papers in the field of condition moni-
toring, diagnosis and prognosis and e-maintenance. He has a
position as a visiting professor at the University of Sunder-
land.
Pankaj Sharma
Pankaj Sharma is a doctorte from Indian Institute of Tech-
nology Delhi, India. His PhD thesis is in the field of Spare
Parts forecasting and Selective Maintenance Optimisation. He
is an MTech from the same Institute in Industrial Engineering.
His research interests are in Maintenance Strategy Develop-
ment, Supply Chain Management and Logistics. He had par-
ticipated in project e-Mari at VTT Finland as an inter-
university exchange student. He is currently working as a Re-
search Fellow with the National University Singapore.
Jaime Campos
Dr. Jaime Campos is an associate professor at the
Department of Informatics, Linnaeus University, Sweden. His
main research interests include the Information and
Communication Technologies in the industrial domain, mainly
in asset management.
David Baglee
Dr David Baglee is a Reader in Advanced Maintenance at the
University of Sunderland UK, a Visiting Professor of Opera-
tions and Maintenance at the University of Lulea Sweden and
a Visiting Associate Research Professor at the University of
Maryland USA. His research interests include the use of ad-
vanced maintenance techniques, Industry 4 and big data anal-
yses to support maintenance strategy development within a
range of industries.

336
ME2018_1151
Poly-Coherent Composite Bispectrum Analysis
for fault diagnosis in Rotating Machines
Kenisuomo C. Luwei, Jyoti K. Sinha, Akilu Yunusa-Kaltungo
School of Mechanical, Aerospace and Civil Engineering. The University of Manchester, Oxford
Road, Manchester, M13 9PL, UK.
Email: [email protected]; [email protected].;
Abstract The poly-coherent composite higher order spectra (pCCHOS) were
used earlier for faults diagnosis in the rotating machine. Earlier research studies
have also suggested the unified multi-speeds approach for identical machines but
with different operating speeds. However the studies were only tested at several
machine speeds but below the first critical speed. In the present study, the same
unified method using the poly-coherent composite bispectrum (pCCB) is further
tested when the experimental rig runs below and above the machine’s first critical
speed. The results and observations are presented here.
Key words Rotating Machines, Bispectrum Analysis, Data Fusion, Fault Diagno-
sis
1.0 Introduction
Fault diagnosis in rotating machine using vibration-based condition monitoring
(VCM) techniques is well accepted. In order to meet production demand through
availability and reliability, various techniques to diagnose and predict machine
conditions are being developed [1-2]. Recent research studies show increasing in-
terest in the use of higher order spectra (HOS) in the VCM approach for fault di-
agnosis (FD) in rotating machines [3-10]. These studies has shown the complexity
of HOS [6] but also presented proof of its usefulness in fault diagnosis especially
on non-linear signals as expressed by Sinha [5] A justification for using HOS is
the ability to retain both amplitude and phase in its analysis and also the potential
of combining various frequency components of measured vibration signals as

337
against the traditional power spectrum density (PSD) which contains only harmon-
ic component with the phase information lost [5-6].
The poly-coherent composite higher order spectra (pCCHOS) were used in earlier
studies for diagnosing faults in the rotating machines [8-9], thus reducing the rigor
of analyzing large vibration data due from individual bearings. The studies fo-
cused on vibration data measured below first critical speed. However, most large
machines function in such a way that they run above their critical speeds [11]. In
the present study, the use of the poly-coherent composite bispectrum (pCCB) in
machine fault diagnosis is further tested when the experimental rig runs below and
above the machine’s first critical speed. The results and observations are presented
here.
2.0 poly-Coherent Composite Bispectrum (pCCB)
The poly-coherent composite bispectrum B is represented mathematically as [8-9]
𝐁(𝑓𝑙𝑓𝑚 ) =∑𝑟=1
𝑛𝑠 (XpCCSr (𝑓𝑙)XpCCS
r (𝑓𝑚)XpCCSr∗ (𝑓𝑙+𝑓𝑚))
𝑛𝑠 (1)
where 𝑋pCCS𝑟 in equation (1) is the poly-coherent composite Fourier Transform
(FT) for the rth segment of the measured vibration data from ‘b’ bearing location
at frequency 𝑓𝑘 and 𝑛𝑠 is the number of equal segment used for the FT computa-
tion. Hence 𝑋pCCS𝑟 is computed as [8-9]
X𝑝𝐶𝐶𝑆𝑟 (𝑓𝑘) =
( ∑𝑟=1𝑛𝑠 X1
𝑟(𝑓𝑘)𝛾122 X2
𝑟(𝑓𝑘)𝛾232 X3
𝑟(𝑓𝑘)𝛾342 X4
𝑟(𝑓𝑘)… X(𝑏−1)𝑟 (𝑓𝑘)𝛾(𝑏−1)𝑏
2 X𝑏𝑟(𝑓𝑘))
1
𝑏 (2)
where X1𝑟(𝑓𝑘), X2
𝑟(𝑓𝑘), X3𝑟(𝑓𝑘), X4
𝑟(𝑓𝑘), … , X𝑏−1𝑟 (𝑓𝑘) 𝑎𝑛𝑑 X𝑏
𝑟(𝑓𝑘) respectively repre-
sents the FT of the rth segment at frequency 𝑓𝑘 of the vibration responses at bear-
ings 1, 2, 3, 4, …, (b-1) and b [8]. Also, 𝛾122 , 𝛾23
2 , … 𝛾(𝑏−1)𝑏,2 respectively represents
the coherence between bearing 1-2, 2-3…, (b-1)b (where b = 1, 2, …, b), and the
SpCCS(𝑓𝑘) is the pCCS at frequency 𝑓𝑘 [8-9].
The measure of the combination of the frequencies at 𝑓𝑙 , 𝑓𝑚, and 𝑓𝑙+𝑓𝑚 explains
the characteristics of the bispectrum. The correlation of various harmonic compo-
nents in bispectrum of found to be useful for robust and effective diagnosis espe-
cially in rotating machines [9].
3.0 Experimental Rig and Test Conditions
The experimental rig for this study is represented pictorially in Figure 1 and is lo-
cated in the Dynamic laboratory at the University of Manchester. The rig support

338
structure has been redesigned for this study to accommodate a more flexible sys-
tem. It consist of a motor, two shaft (1000 mm and 500 mm long respectively)
joined by a rigid coupler. The long shaft is connected to the motor by a flexible
coupler. Four anti-friction bearing is connected to the bearing pedestal using four
spring per bearing (Figure 2) with each spring having a of stiffness 4.69 N/mm.
Three balance disc (125 mm diameter x 14 mm thickness) hangs on the shaft with
two of the disc on the long shaft and one on the shorter shaft. All of these are bolt-
ed to a lathe bed place on dampers. Modal testing carried out on the experimental
rig to determine its dynamic characteristics presented a number of natural fre-
quencies. The first few identified are 11.52 Hz, 18.62Hz, 30.75 Hz, 49.13 Hz and
85.83 Hz. Details of the experimental rig and dynamic characterisation are pre-
sented in previous work [12].
Figure 1 Picture of Experimental Rig.
Figure 2 Picture showing bearing pedestal of experimental rig with spring
connection (flexible).

339
3.1 Test condition and data acquisition
In this experiment, 10 sets of data were collected at a sampling frequency of
10,000 Hz for each condition at three different speeds i.e. 450 rpm (7.5 Hz), 900
rpm (15 Hz) and 1350 rpm (22.5 Hz) which were selected based on the machine’s
natural frequencies. The first speed is below machine’s first critical speed and the
two other speeds are above the machine’s first critical speed. Table one below
gives clear description of the simulated conditions. The pCCB analysis plots,
observation and discussion is presented in section 4.0.
Table 1 Showing description of test conditions
No Condition Code Description
1 Healthy RMRU Residual Misalignment Residual Unbal-
ance.
2 Crack near
Bearing1
CBg1 0.34mm wide x 4mm deep notch with
0.33mm shim glued (on rotor near Bg1).
3 Crack near
Bearing2
CBg2 0.34mm wide x 4mm deep notch with
0.33mm shim glued (on rotor near Bg2).
4 Rub near Disc1 RubD1 Perspex blade on rotor near Disc1.
4.0 Observation and Discussion
Figure 3 shows the pCCB plots at 900 rpm (15 Hz). In the plots signals from all
four bearings are fused into a single analysis. Observation of the pCCB plots
showed the presence of B11, B12= B21, B13 = B31 at all speeds and all conditions.
The RMRU had very little B12. All other faults had the presence of B22, B23 = B32,
and B33. Similarly, the 450 rpm has its features with lower components. However,
the 1350 rpm analysis showed higher peaks in all conditions. Therefore it is diffi-
cult to do the diagnosis based on visual observations on the pCCB plots.

340
Figure 3 Typical pCCB plots at 900 rpm (15 Hz) for (a) RMRU (b) CBg1 (c)
CBg2 (d) RubD1

341
5.0 Faults classification
Since it is difficult to do the diagnosis manually, hence the mathematical approach
is used based on the pattern recognition method. In this study, three pCCB
components i.e B11, B12 = B21, B13 = B31 at all the 3 speeds were selected and then a
data matrix was built. Equations (3) and (4) provide the details of the data matrix
construction.
𝐵𝐶1𝑆1 = [
𝑏11𝐷1⋯ 𝑏13𝐷1
⋮ ⋱ ⋮𝑏11𝐷10
⋯ 𝑏13𝐷10
]
𝐶1𝑆1
(3)
𝐁 = [
𝐵𝐶1𝑆1⋯ 𝐵𝐶1𝑆3
⋮ ⋱ ⋮𝐵𝐶4𝑆1 ⋯ 𝐵𝐶4𝑆3
] (4)
where C is the machine condition, S is the operating speed and D is the number of
data set. The matrix was built in such a way that at a particular condition and
speed, say𝐵𝐶1𝑆1 , a 10 x 3 data matrix is formed. Therefore the data matrix of 40 x
9 is developed for all 4 conditions and 3 speeds. The principal component analysis
(PCA) [13] is then applied to this data matrix as the pattern recognition tool for
classification of the different fault conditions of the rotor in the rig.
Figure 4 Classification of experimental rig fault conditions at multiple speeds
The result presented in this section shows data fusion of multiple speeds from
components of pCCB analysis. Figure 4 showed good clusters of data set between

342
PC1 and PC2, each cluster represents one fault condition of the rotor. However it
has also been observed that 2 crack conditions CBg1 and CBg2 shows separation
between their clusters but they are close to each other. Hence it is good indication
that clusters of the similar faults may appear close by but their fault locations may
be different.
6.0 Conclusion
The use of the pCCB once again is found to be a useful tool for the classification
of different rotor faults even when the machine is running above or below the crit-
ical speed. Currently only 3 rotor fault conditions are used together with a healthy
condition. However the results are encouraging but it needs to be tested further
with more different fault conditions.
7.0 Acknowledgement
First author likes to acknowledge Dr Keri Elbhbah for his support during set up
and modal testing of the experimental rig and also his contribution at various stag-
es of the study.
References
[1] Al-Badour, F., Sunar, M. And Cheded, L. (2011). Vibration Analysis of
Rotating Machinery using Time-Frequency Analysis and Wavelet
Techniques. Mechanical Systems and Signal Processing 25(6) (2011), pp.
2083-2101.
[2] Sinha, J.K., and Elbhbah, K., 2013. A Future Possibility of Vibration based
Condition Monitoring of rotating machines. Mechanical Systems and Signal
Processing (MSSP), 34 (2013), pp. 231–240.
[3] Wang, G., Gu, F., Rehab, I., et al. 2018. A Sparse Modulation Signal Bispec-
trum Analysis Method for Rolling Element Bearing Diagnosis. Mathematical
Problems in Engineering. Vol. (2018), ID. 2954094, pp. 12.
[4] Hamomd, O, Alabied, S, Xu, Y., et al. 2017. Vibration based centrifugal
pump fault diagnosis based on Modulation Signal Bispectrum Analysis. In-
ternational Conference on Automation and Computing (2017). IEEE.
[5] Sinha, J.K., 2007. Higher Spectra for crack and misalignment Identification
in the shaft of a Rotating Machine. Structural Health monitoring. (2007),
Vol. 6(4), pp. 325-334.
343
[6] Rivola, A., White, P.R., 1999. Use of Higher Order Spectra in Condition
Monitoring; Simulation and Experiments. ASME Design Engineering Tech-
nical Conferences (1999), pp.1-12.
[7] Elbhbah, K.A., and Sinha, J.K., 2013. Fault Diagnosis in Rotating Machine
using Composite Bispectrum. RASD (2013), pp. 1-7.
[8] Yunusa-Kaltungo, A., Sinha, J.K., Nembhard, A.D., 2015. A novel Fault Di-
agnosis Technique for enhancing maintenance and Reliability of Rotating
Machines. Structural Health Monitoring. (2015)Vol. 14(6), pp. 604-621.
[9] Yunusa-Kaltungo, A., Sinha, J.K., Elbhbah, K. 2014. An Improved Fusion
Technique for Fault Diagnosis in Rotating Machines. Measurement 58
(2014) pp. 27-32.
[10] Elbhbah, K.A., and Sinha, J.K., 2012. Bispectrum: A Tool for Distinguishing
different Faults in Rotating Machine. ASME TurboExpo (2012), June 11-15.
Copenhagen, Denmark.
[11] Sinha, J.K. 2015.Vibration Analysis, Instruments, and Signal Processing.
(2015) CRC Press, Florida.
[12] Luwei, K.C., Sinha, J.K., Yunusa-Kaltungo, A., 2018. Data Fusion of
Acceleration and velocity features for Fault Diagnosis in Rotating Machines.
International Conference on Vibration Engineering and Technology
Machinery. (2018), pp. 6.
[13] Jolife, I.T. 2002. Principal Component Analysis. 2nd Edition. Springer, New
York, NY (2002).
Authors’ Biography
Kenisuomo C. Luwei
Mr. Kenisuomo C. Luwei is a PhD student at the
University of Manchester having his research work on
Vibration Monitoring of rotating machines with condition
monitoring for plant safety, integrity and reliability. He is
also a lecturer in Mechatronics Engineering at the Federal
University Otuoke, Nigeria. He holds a MSc in
Maintenance Engineering and Asset Management from
The University of Manchester and bachelor degree in
Electro-Mechanical Technology from Nnamdi Azikiwe
University, Nigeria.
Jyoti K. Sinha
Prof. Jyoti K. Sinha is Programme Director, Reliability
Engineering and Asset Management MSc and Head,
Dynamics Laboratory, School of Mechanical, Aerospace
and Civil Engineering. The University of Manchester,
Manchester, M13 9PL, UK. Dr Sinha is involved in and

344
solved a number of industrially applied research projects
related to Vibration-based Condition Monitoring and
Maintenance of Machines and Structures in last 26 years.
Prof. Sinha is the author of more than 60 technical
reports, nearly 150 technical papers (Journals and
conferences) and gave a number of keynote/invited
lectures. Prof. Sinha is also the associate editor of two
international journals, Structural Health Monitoring: An
International Journal and Journal of Vibration
Engineering and Technologies, editorial board member of
the journal Structural Monitoring and Maintenance,
author of a book “Vibration Analysis, Instruments and
Signal Processing” and co-author of two books. He is
also technical committee member of IFTOMM
Rotordynamics.
Akilu Yunusa-Kaltungo
Dr. Akilu Yunusa-Kaltungo is a lecturer in plant relia-
bility and asset management at the University of Man-
chester. His main research interest lies in condition moni-
toring and maintenance optimisation. He has served as
the maintenance manager, health & safety manager as
well as the training & development manager for
LafargeHolcim Cement PLC (Ashaka Plant, Nigeria). He
holds a PhD in mechanical engineering (University of
Manchester), MSc in maintenance engineering & asset
management (University of Manchester) and a bachelor’s
degree in mechanical engineering (University of Maidu-
guri, Nigeria). He holds several professional certifica-
tions including chartered engineer (CEng.) and member-
ship of the Institution of Mechanical Engineers
(IMechE). Akilu has published several research articles
in vibration-based condition monitoring of rotating ma-
chines and a book titled “Condition Monitoring: A Sim-
ple and Practical Approach”.

345
ME2018_1052:
New Maximo configuration for Marine Fleet
Maintenance
Nilesh Soni, Ahmad Al-Aseeri
Marine Maintenance Team, Marine Operation Group, Kuwait Oil Company
Email: [email protected]; [email protected];
Abstract In an oil major like Kuwait Oil Company (KOC), the maintenance
management system is a centralized process for all company's operations like
drilling, production, export and marine. All processes have stationary assets at
shore and maintenance is performed by the shore team, except marine. In marine
the assets (ships) are operating (moving) from one place to another, whereas the
maintenance is performed by shore based maintenance team.
Designing a maintenance management system for marine fleet was a challenging
task, as it has to meet with marine industry requirements and yet communicate
with other maintenance management processes of the company outside marine
like procuring materials through a centralized system, sending internal service re-
quests to different departments, processing service orders for contractors and third
parties etc.
This paper presents various modules (Vessel Logsheet, Service Bulletins, Cost
Benefit Analysis, Risk Assessment, Class Survey & Certification etc.) developed
in the new marine maintenance management system to cater the need of marine at
KOC and ensured that the communication with company maintenance manage-
ment system (IBM Maximo) is carried out smoothly..
Key words Marine Maintenance, IBM Maximo, Maintenance system customiza-
tion
1.0 Introduction
Kuwait is situated at the Gulf of Hormuz, through which more than a third of
world’s oil is exported. Kuwait Oil Company (KOC) is a State Oil Company
established in 1934 for upstream oil and gas business including exploration,
drilling, production, operations and export. KOC is world’s 7th
largest crude oil
producer. Export & Marine Operation is an integral part of KOC and was
undergoing expansion and modernization to replace ageing fleet and to meet up
with the growing oil export of the company.

346
KOC is using IBM Maximo Oil & Gas Module for all its facilities. However,
marine group has different challenges. Other facilities have stationary assets at
land, whereas marine assets (ships & equipment) are moving at sea. Yet, the
maintenance system has to communicate with other facilities processes like
procuring materials, contract orders, service orders for third parties, service
requests for internal teams etc. The team designed a holistic maintenance
management system, which fulfilled needs of marine and at the same time
communicated with other teams in the organization.
2.0 Maintenance Management System at KOC
In Kuwait Oil Company, IBM Maximo was used as Computerized Maintenance
Management System (CMMS) for handling short term/long term maintenance ac-
tivities and planning. Being an upstream oil company with versatile operations at
various locations and different model of performing/reporting work, it was very
difficult to have a uniform CMMS throughout Company’s operation.
Oil rigs generally have different approach towards maintenance of machines as the
machines are very large & critical, most of the routine maintenance is outsourced
to Original Equipment Manufacturer (OEM). On the other hand, maintenance of
offshore vessels (operation is in sea but maintenance is performed on land) is per-
formed in house with skilled workforce. Hierarchy for location and asset in drill-
ing rigs is based on ISO 14224, whereas hierarchy for location/asset in marine is
based on SFI (Skipsteknisk Forsknings Institutt: A Norwegian company) coding
and IMPA (International Marine Purchasing Association) coding. Also, the usual
work order approval process is also different in marine as compared to oil rigs.
This has prompted the team to reconfigure IBM Maximo to meet marine require-
ments. The maintenance management system (IBM Maximo) at KOC has follow-
ing business aspects:
2.1 Types of Assets
Following are the assets which KOC has across the teams. Except Marine Team &
Transport Team assets, all other assets are stationary.
Sub surface facilities: Reservoir, Wells
Surface facilities: Gathering centers, Booster stations, Water treatment
and Injection Plants
Export facilities: Tank farms, Export terminals
Infrastructure: Pipe line, cables, Roads, Facilities, Office Buildings, Staff
Accommodation
Workshop: Machining, Welding, Fabrication, Repairs

347
Transports: Heavy Equipment, Light Vehicles, Mobile Cranes
Information Technology (IT): Communication, Servers, Workstations,
Accessories, Software
Medical: Assets of Hospital
Marine: Tug boats, Crane Workboats, Pilot Boats, Dry-Dock facilities,
Catenary Anchor Leg Mooring (CALM) Buoys, Mooring Boats
2.2 Business Processes
Different business processes work synchronously to produce the end result. Some
of the processes are discussed here.
Horizontally: From capital project to Asset write off.
Vertically: Work Management, Inventory, Purchasing, Contracts,
eBusiness, Financials.
3. New Maximo Approach
The project was taken as a novel idea. This means that the team has to unlearn of
whatever Maximo and Marine standards knowledge they had and start from the
scratch by building blocks step by step. The objective of the project was to
achieve Computerized Maintenance Management System for marine vessels,
whose operation is at sea and maintenance is done at land. Marine Maintenance
Process is shown in Figure 1, which covers all the activities of the team.
Figure 1: Marine Maintenance Process Cycle

348
3.1 Evaluate
A team was formed using Maximo experts, IT experts and Marine Experts. A
consultant (with experience in Marine & Maximo) was engaged with in-depth
expertise in configuring and support Maximo for Marine Industry to carry out the
project.
3.2 Initiate & Plan
The project was divided into eight (8) stages and in two phases. First phase was to
implement the system data/procedures on a pilot vessel and phase two was to im-
plement the data on all other vessels.
Project was divided into 8 stages viz. Initiation and Planning, Analysis and Con-
figuration, Data Templates, Data Model and Data Load – Phase I, Testing and Us-
er Acceptance, Training and Procedures, Cutover, Go Live and error free period
and Data Load – Phase II.
Initiation and Planning
A kick off meeting conducted among all parties involved. Project plan was
developed by the Contractor and presented to the Company. After minor
modification, project plan was accepted. Time line to complete the project
was nine (9) months. Roles and responsibilities were discussed and agreed
upon.
3.3 Analyze
There were numerous workshops with the consultant to understand how IBM
Maximo can be modified to match marine requirements. During workshops,
there was a lot of discussion about how the current process is and how can it
be improved.
Data Templates
First job was to understand IBM Maximo Oil & Gas Module. There were se-
ries of brainstorming workshops with the Contractor to discuss the “As-Is
processes”. “To-Be Processes” were developed based upon discussions dur-
ing workshops.
Locations-assets hierarchy were defined as per technical taxonomy i.e. sys-
tematic classification of items into generic groups based on factors possibly
common to several of the items using by consulting ISO 14224, SFI Coding
and IMPA standard codes for marine. We defined the Locations-Assets based

349
on their physical presence and on common system. For example, first level
was the type of boat, second level was 50TBP Tug Boats, third level was Port
Propulsion System, fourth level was the Port Main Engine, fifth level was
unit number and so on. The team grouped all system under one reference,
like all components related to lube oil system were under one group viz. lube
oil pump, lube oil cooler, lube oil filter etc.
3.4 Configure & Test
Data Model and Data Load – Phase I
The first step in any maintenance system is to report defects through various
teams/groups. This was established by process shown in figure 2.
Figure 2: Defect Reporting
Work order type was defined as “Planned”, “Corrective” and “Emergency”.
Planned work order generates automatically, corrective work orders can be
created by user for corrective maintenance work and emergency work order
is for emergency use only, which will by-pass the regular approval process
and can also be generated retrospectively.
Further work order was divided in sub work type of “Warrantee”, “Condition
Monitoring”, “Insurance”, “Standard Work”, “Survey” and “Service Bulle-
tin”. Warrantee WO is for machinery under warranty and the cost for man-
power/spares will be paid by third party. Condition monitoring WO is for
carrying out work before the equipment fails by analyzing its condition by
vibration monitoring or thermal inspection or pressure monitoring etc. Insur-
ance WO is for insurance claims raised by the user and the cost would be re-

350
covered through insurance in recoverable account. Survey WO is for any
classification society or flag state survey and inspection work.
Service Bulletin WO is for the work carried out as per the modification sug-
gested by OEM. Standard WO is for any standard work which is not any of
above. Service Bulletin Work flow is explained in Figure 3
Figure 3: Service Bulletin
Survey & Certification process of Marine Assets was achieved as shown in
Figure 4.
Figure 4: Survey & Certification Process

351
Each marine vessel has its own log sheet, which records all the parameters
(temperature, pressure, tank levels etc.) for each operation or every four
hours. During workshops, the idea of setting up log sheet application in the
Maximo was coined and accepted widely. The order of readings sat up exact-
ly as in ship’s computer. On ship’s computer readings are automatically
logged on to Propulsion Control Monitoring System (PCMS) in the excel
sheet. Readings were copied from the excel sheet and sent to office via email.
These readings are entered into the system via macros in the excel sheet. The
historical trend analysis for each of the log sheet reading were set up. This
feature allows to perform Root Cause Analysis (RCA) of any problem with
the machine.
Insurance process was set up as shown in figure 5
.
Figure 5: Insurance Claim Process
Risk Assessment module was build up using our company’s Health Safety
Environment Maintenance (HSEMS) Procedures and marine best practices.
There were 3 categories of hazards, Health, Safety and Environment. Each
hazard has it’s precautions as listed in the marine standards. With these pre-
cautions, Risk category is defined. If the risk category is in unacceptable re-
gion of the matrix then additional control measures have to be taken, based
on our group’s risk register, till the time risk comes down to acceptable re-
gion. The application is made user friendly. The user has to select a Hazard
and the precautions pops up automatically. Any Material Safety Data Sheet
(MSDS) is populated automatically as per the hazard selection. Instead of do-
ing manual tedious Risk Assessment, with this application user can perform

352
Risk assessment just by knowing hazards and few control measures as per the
requirements. This application has saved a lot of man-hours.
Marine assets goes for Dry-Dock to repair any underwater area repair or any
other major repair which can be repaired only when ship is out of water. Fig-
ure 6 depicts the Dry Dock process.
Figure 6: Dry Dock Process
Testing and User Acceptance, Training and Procedures
After establishing data and processes, system was tested and necessary train-
ing was provided to the end user team. Any minor adjustments were done at
this stage.
3.5 Training & Deployment
Employees were imparted with training to use New Maximo Marine Module.
There were many doubts raised by the operations and maintenance team members,
which were incorporated in the system.
3.6 Certification
The reconfigured Maximo Marine Maintenance Module was tested and certified
by International Classification Society Lloyd’s Register UK.

353
3.7 Maintain
The challenge ahead is to maintain the system and build good data base to gener-
ate reports, which eventually will ameliorate the Marine Maintenance Business
Processes.
4.0 Key Benefits
Automation of manual maintenance process for marine operations
Streamlined marine operations processes in accordance with ship
classification society standards and ensuring regulatory compliance.
Improved productivity, enhanced performance, timely management
reporting and informed decision making.
The use of standard IBM Maximo with Marine configuration without
affecting company core Maximo processes.
Authors’ Biography
Ahmad Al-Aseeri
Mr. Ahmad Al-Aseeri is working as Team Leader
Marine Maintenance with Kuwait Oil Company. He
holds a Bachelor Degree in Marine Engineering. He
has diverse experience in marine, CALM Buoys,
maintenance and operations. His two papers got
published in 2nd
International Conference for
Maintenance Engineering 2017.
Nilesh Soni
Mr. Nilesh Soni is working with Kuwait Oil Com-
pany as Marine Engineer. He holds Master Degree in
Engineering Management from Pennsylvania State
University, USA. He is Vibration Category III certi-
fied analyst. He has done Project Management from
Indian Institute of Management-Ahmedabad (India),
Marine Engineering from UK and Bachelor in Me-
chanical Engineering from Jiwaji University India.
He has 20 years of rich experience in marine, off-
shore oil fields & upstream oil companies.

354
ME2018_11053:
Investigation of explosion on scavenge airline of
a 4 stroke Marine Engine
Nilesh Soni, Ahmad Al-Aseeri
Marine Maintenance team, Marine Operation group, Kuwait Oil Company
Email: [email protected]; [email protected]
Abstract This study is about the explosion on scavenge airline of a 4-stroke
marine engine on ship during operation. The maximum scavenge airline pressure
is 2.5 bar at full load of the engine. The exploded pipe/elbow was made of Alumi-
num alloy metal with significant thickness, which has almost zero probability of
failure at such low pressure. The explosion has caused metal pipe/elbow to break
down into tiny metal particles of varying dimensions.
The impact of the explosion was so strong that anyone in the vicinity could have
been killed by the flying debris of metal. Metal particles were found all over in the
machinery room. During operation nobody was in the machinery space and hence
there was no casualty.
Various possibilities were explored during investigation of the cause of the explo-
sion. Metal debris (varying dimensions), reverse engineering, process cycle etc.
were investigated in deep. The paper is about exploring individual cause and rule
out based on the process logic and/or metal particle analysis and arrive at the root
cause of problem.
Key words 4 Stroke Engines, Explosion Scavenge Air, Fatigue in metal
1.0 Introduction
Kuwait is situated at the Gulf of Hormuz, through which more than a third of
world’s oil is exported. To facilitate the oil export operation, Kuwait Oil Company
(KOC) has a fleet of 52 vessels consisting of Tugboats, Workboats, Mooring
boats, Crew/Pilot boats, Oil Spill Recovery Vessels, Barges etc.
One of such Tugs, Tug Sabahi built in year 1990, was doing her regular offshore
operation when the Turbocharger blower side elbow exploded and metal pieces
were thrown all around machinery spaces. Fortunately, no one was hurt. The
elbow was part of Main Engine Caterpillar 4 stroke Engine 3608, which had
54,314 operating hours on it. The elbow was between Turbocharger (blower side)
and the air cooler. There was an emergency shut down valve just after the elbow.

355
The emergency shut down valve rod was found bent under closed condition. The
valve was broken into pieces. This suggest that the emergency shut down must
have activated accidently, as there was no alarm during the incident. The broken
elbow was 8 mm thick, 7” diameter, was made of Aluminum alloy and the
medium was compressed air. The operating pressure of the line was 1.0 Bar and
maximum air temperature was 80°C. It was hard to understand how the elbow can
be broken into pieces at such low pressure and temperature. Investigations were
performed and all possibilities were considered. After further investigation,
different possibilities were ruled out to reach the conclusion.
2.0 Investigation
Explosion of 7 inch diameter, 8mm Aluminum Alloy elbow is highly unlikely on a
compressed air medium with pressure 1.8 Bar & temperature 80°C.
Figure 1 shows the location of the incidence on the Turbocharger blower side
elbow.
Figure 1: Elbow (7.5”), 8mm thickness Exploded
Turbocharger, all cylinder heads, pistons, connecting rods were removed. No visu-
al fault could be found from all components.

356
2.1 Immediate Cause Analysis:
Following unsafe conditions were observed:
Oil in inlet manifold: Came from inlet valves lubrication lines.
Corrective Action: Pump flow to be adjusted after boxing back the En-
gine.
Bent rod of Emergency Shut Down valve, suggesting explosion occurred
from Turbocharger side.
7” Elbow of 8mm thickness made of Aluminum alloy (which is ductile)
broken into pieces.
Elbow pieces became very fragile & weak.
Possible causes: Fatigue failure, Fire/Explosion in the line, High Pres-
sure, High Temperature.
2.2 Root Cause Analysis:
In order to find out root cause of the explosion, Fire Triangle of Oxygen, Fuel &
Ignition Source were explored independently.
1. Oxygen:
There’s lot of Oxygen available as air is compressed in the Turbocharger
& travels through air cooler, inlet manifold & then through inlet valves
into the combustion space, where fuel is burn.
We cannot eliminate Oxygen from entering the Engine.
2. Fuel:
There are two possibilities of Fuel entering the scavenge air system:
i) Lub oil passing through seals of Turbocharger.
Seals of Turbocharger checked, found OK. So, this option is ruled
out.
ii) Lub oil through Inlet valve lubrication, which comes in the inlet
manifold directly.
But the flash point of Lub oil is between 160°C to 180°C.
This is quite unlikely that temperature of this magnitude might have
reached in the elbow.
Suspect Diesel oil contamination in the lub oil. Flash point of diesel
oil is 60°C to 100°C.
Air is compressed in the turbocharger blower & if it doesn’t find way
out, air temperature might have reached up to 90-100°C. This could
have caused the explosion.
We will individually take reasons for obstruction of air flow:
(a) Dirty Air Cooler:

357
Air cooler was removed & found moderately dirty with lub
oil. This is not enough to cause compression & temperature
of that sort.
(b) Inlet valves not operating:
All Cylinder Heads were removed & function of all in-
let/exhaust valves tested: Found satisfactory. This option is
ruled out.
(c) Emergency Shut off Valve Operated:
Emergency Shut off valve is operated by Air, which comes
from solenoid valve (Figure 3) on activation of any shut
down alarm such as Lube Oil pressure low-low, jacket wa-
ter temperature high-high etc. but at the time of incident no
alarm was observed.
Other possibility of operation of the valve is malfunction of
solenoid: Solenoid function tested & found satisfactory.
Malfunction of the valve itself: This is probable cause as we
can see that the rod holding the flap is bent in direction of
air flow, as shown in Figure 2.
Direction of Air Flow Flap Rod Bent
Figure 2: Emergency Shut Off Valve Bent

358
Emergency Shut off Device (Expecting Flap Operated)
Figure 3: Emergency Shut-Off Valve Activation Device
3. Ignition Source:
Three possible causes of ignition source are
i) Leak of combustion gases through Inlet valve
All cylinder heads were removed & inlet valves were checked.
There was Carbon deposits on #4 & #5 unit valves but not enough to
let exhaust gas pass through, as depicted in Figure 4 and 5.

359
Figure 4: #4 Cylinder Head
Figure 5: #5 Cylinder Head

360
ii) Leak of exhaust gases through Turbocharger
Turbocharger was removed in workshop & end deflection found
within range.
End Play: 0.12 mm (Range 0.1 to 0.3 mm)
Radial Play: 0.35 mm (Range 0.44 to 0.87 mm)
Turbocharger seal were found intact. So, possibility of exhaust gases
leaking through the seal is ruled out.
iii) High compression of air causing temperature to rise.
High compression can be caused by obstruction in the air flow &
Turbocharger continuously pumping air into the system.
As explained above, possibly Emergency Shut off valve might have
operated & obstructed the air flow & hence temperature of the air
rose up to the flash point of mixture of lube oil mixture.
During normal operation, the charge air pressure is 1.8 Bar, maxi-
mum air temperature in the elbow was 80°C (approximately as there
was no means to measure it in the elbow) but in case of any obstruc-
tion (like activation of emergency shut down) could have resulted in-
to pressure near to fatigue failure. Also, as the blower was running
continuously this could have caused high temperature inside the el-
bow, which had diesel-lube oil mixture & would have reached near
the auto ignition point.
Broken metal particles were sent to metallurgy lab test to determine composition
of the metal. Following were the results.
Elbow
%Al % Si %
Cu % Zn % Fe % Ni
Aluminium
Die -Cast A-
380
86.2 7.52 2.86 0.52 0.82 0.37
%
Ti
%
Mn
%
Mg
0.21 0.32 0.13
Endurance limit of Aluminum decreases with the number of cycles as shown in
figure 6.

361
Figure 6: Aluminum Fatigue Life
Based on above the Kuwait has huge temperature difference between summers
and winters. Highest temperature recorded was 54°C and the lowest was -6°C. The
elbow was under constant reversal cycles of compression and tension as per the
frequent operations of engine and also as per the frequent load change in the ex-
treme weather conditions. This has exaggerated the extremities of fatigue life of
the material (high stress ratio).
3.0 Conclusion
Critical Factors Analysis:
Fatigue of the material: Material was more than 23 years old under continuous
load reversal cycles (>1 X 10⁸). This along with emergency shut down valve acti-
vation has caused the air temperature inside charge airline to rise above the auto
ignition point of Diesel-Lube oil mixture.
The combination of both of these events has resulted into explosion of 7” diameter
8mm thick Aluminum alloy elbow of the charge air side of turbocharger.

362
References
[1] Aluminum A380.0-F Die Casting Alloy. (n.d.). Retrieved from
http://www.matweb.com/search/datasheet_print.aspx?matguid=5f92a8f7d6ad4
16c8ce9398cae14a363&n=1
[2] Yahr, G.T. Fatigue design curves for 6061-T6 aluminum. J. Press. Vessel Technol.
1997, 119, 211–215
[3] (n.d.). Retrieved from http://www.kockw.com/
Authors’ Biography
Ahmad Al-Aseeri
Mr. Ahmad Al-Aseeri is working as Team Leader
Marine Maintenance with Kuwait Oil Company. He
holds a Bachelor Degree in Marine Engineering. He
has diverse experience in marine, CALM Buoys,
maintenance and operations. His two papers got
published in 2nd
International Conference for
Maintenance Engineering 2017.
Nilesh Soni
Mr. Nilesh Soni is working with Kuwait Oil Company
as Marine Engineer. He holds Master Degree in Engi-
neering Management from Pennsylvania State Univer-
sity, USA. He is Vibration Category III certified ana-
lyst. He has done Project Management from Indian
Institute of Management-Ahmedabad (India), Marine
Engineering from UK and Bachelor in Mechanical En-
gineering from Jiwaji University India. He has 20 years
of rich experience in marine, offshore oil fields & up-
stream oil companies.