
HDFC Life/CA/2021-22/27 Listing Department Listing ... - NSE
83
July 19, 2021 Ref. No.: HDFC Life/CA/2021-22/27 Listing Department Listing Department National Stock Exchange of India Limited BSE Limited Exchange Plaza, Plot No C/1, Block G, Sir PJ Towers, Bandra-Kurla Complex, Dalal Street, Bandra (East), Fort, Mumbai- 400 051 Mumbai – 400 001 NSE Symbol: HDFCLIFE BSE Security Code: 540777 Dear Sir/ Madam, Subject: Outcome of the Board Meeting held on July 19, 2021 Pursuant to Regulation 30 of SEBI (Listing Obligations and Disclosure Requirements) Regulations, 2015, we wish to inform that the Board of Directors of the Company at their meeting held today i.e. Monday, July 19, 2021, have approved the audited standalone and unaudited consolidated financial results of the Company for the quarter ended June 30, 2021. In this regard, please find enclosed herewith the following:- (i) Copy of the audited standalone financial results along with auditors report (ii) Copy of the unaudited consolidated financial results along with limited review report (iii) Press Release We wish to inform that the trading window for dealing in securities of the Company will be open from Thursday, July 22, 2021, for all the Designated Persons (i.e. Identified Employees, Directors and KMPs) including their Immediate Relatives and Promoters of the Company. The meeting of the Board of Directors of the Company commenced at 12:00 Noon and concluded at 02:00 p.m. This is for your information and appropriate dissemination. Thanking you, For HDFC Life Insurance Company Limited Narendra Gangan General Counsel, Chief Compliance Officer & Company Secretary Encl.: As above
-
Upload
khangminh22 -
Category
Documents
-
view
1 -
download
0
Transcript of HDFC Life/CA/2021-22/27 Listing Department Listing ... - NSE
July 19, 2021 Ref. No.: HDFC Life/CA/2021-22/27 Listing Department Listing Department National Stock Exchange of India Limited BSE Limited Exchange Plaza, Plot No C/1, Block G, Sir PJ Towers, Bandra-Kurla Complex, Dalal Street, Bandra (East), Fort, Mumbai- 400 051 Mumbai – 400 001
NSE Symbol: HDFCLIFE BSE Security Code: 540777 Dear Sir/ Madam, Subject: Outcome of the Board Meeting held on July 19, 2021 Pursuant to Regulation 30 of SEBI (Listing Obligations and Disclosure Requirements) Regulations, 2015, we wish to inform that the Board of Directors of the Company at their meeting held today i.e. Monday, July 19, 2021, have approved the audited standalone and unaudited consolidated financial results of the Company for the quarter ended June 30, 2021. In this regard, please find enclosed herewith the following:- (i) Copy of the audited standalone financial results along with auditors report
(ii) Copy of the unaudited consolidated financial results along with limited review report
(iii) Press Release We wish to inform that the trading window for dealing in securities of the Company will be open from Thursday, July 22, 2021, for all the Designated Persons (i.e. Identified Employees, Directors and KMPs) including their Immediate Relatives and Promoters of the Company.
The meeting of the Board of Directors of the Company commenced at 12:00 Noon and concluded at 02:00 p.m.
This is for your information and appropriate dissemination.
Thanking you,
For HDFC Life Insurance Company Limited
Narendra Gangan General Counsel, Chief Compliance Officer & Company Secretary Encl.: As above
Price Waterhouse Chartered Accountants LLP G. M. Kapadia & Co. Chartered Accountants Chartered Accountants 252, Veer Savarkar Marg, 1007, Raheja Chambers, Opp Shivaji Park, 213 Nariman Point, Dadar (W), Mumbai 400028 Mumbai – 400021 Auditor’s Report on Standalone Financial Results for the quarter ended June 30, 2021 of HDFC Life Insurance Company Limited To, The Board of Directors of HDFC Life Insurance Company Limited
1. We have audited the accompanying standalone financial results of HDFC Life Insurance Company Limited as at and for the quarter ended June 30, 2021 being submitted by the Company, which has been digitally signed by us for identification purposes, pursuant to the requirement of Regulation 33 of the SEBI (Listing Obligations and Disclosure Requirements) Regulations, 2015 and IRDA Circular reference: IRDAI/F&I/ REG/ CIR/208/10/2016 dated 25th October 2016 (“Standalone financial results”) and which have been approved by the Board of Directors on July 19, 2021.
2. These Standalone financial results have been prepared on the basis of the interim condensed financial statements prepared in accordance with the measurement and recognition principles specified in paragraph 3 below, which is the responsibility of the Company’s management. The management’s responsibility also includes the design, implementation and maintenance of internal control relevant to the preparation of the standalone financial results that is free from material misstatement, whether due to fraud or error.
3. Our responsibility is to express an opinion on these quarterly Standalone financial results based on our audit of such interim condensed financial statements, which have been prepared by the Company’s Management in accordance with the recognition and measurement principles laid down in Accounting Standard (“AS”) 25, “Interim Financial Reporting”, specified under Section 133 of the Companies Act, 2013 (“the Act”), including the relevant provisions of the Insurance Act, 1938 (the “Insurance Act”), the Insurance Regulatory and Development Authority Act, 1999 (the “IRDA Act”) and other accounting principles generally accepted in India, to the extent considered relevant and appropriate for the purpose of quarterly financial results and which are not inconsistent with the accounting principles as prescribed in the Insurance Regulatory and Development Authority (Preparation of Financial Statements and Auditors’ Report of Insurance Companies) Regulations, 2002 (the “Regulations”) and orders/directions/circulars issued by the Insurance Regulatory and Development Authority of India (“IRDAI”) to the extent applicable.
4. We conducted our audit in accordance with the Standards on Auditing and other applicable
authoritative pronouncements issued by the Institute of Chartered Accountants of India. Those standards require that we plan and perform the audit to obtain reasonable assurance about whether the financial results are free of material misstatements. An audit includes examining, on a test basis, evidence supporting the amounts disclosed as financial results. An audit also includes assessing the accounting principles used and significant estimates made by management. We believe that our audit provides a reasonable basis for our opinion.
5. In our opinion and to the best of our information and according to the explanations given to us
these quarterly Standalone financial results:
I) are presented in accordance with the requirements of Regulation 33 of the SEBI (Listing
Obligations and Disclosure Requirements) Regulations, 2015 and IRDAI- IRDA Circular reference: IRDAI/F&I/REG/CIR/208/10/2016 dated 25th October 2016 in this regard; and
II) give a true and fair view of the net profit and other financial information for the quarter ended June 30, 2021.
Emphasis of Matter
6. We draw your attention to Note 5 to the Standalone financial results which describe the management’s assessment of the impact of the outbreak of Coronavirus (COVID-19) on the business operations of the Company. In view of the uncertain economic environment, a definitive assessment of the impact on the subsequent periods is highly dependent upon circumstances as they evolve. Our opinion is not modified in respect of this matter.
Other Matter
7. The actuarial valuation of liabilities (including excess mortality reserve) for life policies in force and for policies in respect of which premium has been discontinued but liability exists is the responsibility of the Company’s Appointed Actuary (the “Appointed Actuary”). The actuarial valuation of these liabilities as at June 30, 2021 has been duly certified by the Appointed Actuary and in his opinion, the assumptions for such valuation are in accordance with the guidelines and norms issued by the Insurance Regulatory and Development Authority of India (“IRDAI”) and the Institute of Actuaries of India in concurrence with the Authority. We have relied upon the Appointed Actuary’s certificate in this regard for forming our opinion on the valuation of liabilities for life policies in force and for policies in respect of which premium has been discontinued but liability exists, as contained in the interim condensed financial statements of the Company.
For Price Waterhouse Chartered Accountants LLP For G.M.Kapadia & Co. Chartered Accountants Chartered Accountants Firm Registration No.012754N/N500016 Firm Registration No.104767W
__________________ ____________________ Alpa Kedia Rajen Ashar Partner Partner Membership No. 100681 Membership No. 048243
UDIN: 21100681AAAAEK5469 UDIN: 21048243AAAADV2145 Place: Mumbai Date: July 19, 2021
ALPA KEDIA
Digitally signed by ALPA KEDIA Date: 2021.07.19 12:59:10 +05'30'
Rajen Ratansi Ashar
Digitally signed by Rajen Ratansi Ashar Date: 2021.07.19 13:25:46 +05'30'

(₹ in Lakhs)Year ended / As at
June 30, 2021 March 31, 2021 June 30, 2020 March 31, 2021
(Audited) (Audited) (Audited) (Audited)POLICYHOLDERS' A/C
Gross premium income First Year Premium 128,556 238,921 102,183 685,843 Renewal Premium 388,932 635,040 323,912 1,847,687 Single Premium 248,106 417,058 160,161 1,324,820
2 Net premium income1 753,848 1,286,801 572,184 3,812,230 3 Income from investments (Net)2 696,356 601,542 874,910 3,267,757 4 Other income 2,175 6,661 3,800 18,339 5 Contribution of funds from Shareholders’ A/c 8,051 24,128 - 25,856 6 Total (2 to 5) 1,460,430 1,919,132 1,450,894 7,124,182
Commission onFirst Year Premium 21,707 43,447 17,894 126,612 Renewal Premium 4,966 9,215 4,818 27,708 Single Premium 2,836 5,351 1,097 13,302
Rewards 717 1,738 184 3,418 8 Net Commission1 30,226 59,751 23,993 171,040
Operating Expenses related to insurance business (a+b)Employees remuneration and welfare expenses 43,756 53,103 31,197 167,558 Other operating expenses* 51,367 97,908 35,524 291,039
10 Expenses of Management (8+9) 125,349 210,762 90,714 629,637 11 Provisions for doubtful debts (including bad debts written off) - - - - 12 Provisions for diminution in value of investments5 (20,284) (9,010) (5,709) (18,854) 13 Goods & Services Tax on linked charges 8,662 9,575 8,244 35,675 14 Provision for taxes (181) 18,381 3,156 27,439 15 Benefits Paid3 (Net)1 580,143 883,757 279,885 2,257,478 16 Change in actuarial liability 760,820 762,268 1,049,429 4,082,963 17 Total (10+11+12+13+14+15+16) 1,454,509 1,875,733 1,425,719 7,014,338 18 Surplus/Deficit (6-17) 5,921 43,399 25,175 109,844
AppropriationsTransferred to Shareholders A/c 12,489 28,659 34,688 99,090 Funds for Future Appropriations (6,568) 14,740 (9,513) 10,754
Details of Surplus / DeficitInterim bonus paid 10,081 11,715 1,819 20,182 Terminal bonus paid 15,461 22,280 12,885 59,228 Allocation of bonus to policyholders - 74,153 - 74,153 Surplus shown in the Revenue Account 5,921 43,399 25,175 109,844
Total Surplus 31,463 151,547 39,879 263,407 SHAREHOLDERS’ A/C
21 Transfer from Policyholders' Account 12,489 28,659 34,688 99,090 Total income under Shareholders’ Account
Investment Income2 25,933 27,130 9,645 64,757 Other income - - - -
23 Expenses other than those related to insurance business4 1,448 2,405 682 6,373 24 Transfer of funds to Policyholders’ Account 8,051 24,128 - 25,856 25 Provisions for doubtful debts (including write off) - - - - 26 Provisions for diminution in value of investments5 (1,750) (1,652) (1,469) (3,731) 27 Profit before tax 30,673 30,908 45,120 135,349 28 Provisions for tax 438 (886) 11 (661) 29 Profit after tax and before Extraordinary items 30,235 31,794 45,109 136,010 30 Profit after tax and Extraordinary items 30,235 31,794 45,109 136,010
Dividend per share (₹) (Nominal value ₹ 10 per share)Interim Dividend - - - - Final Dividend - - - -
32 Profit carried to Balance Sheet6 623,175 592,940 502,038 592,940 33 Paid up equity share capital 202,214 202,094 201,917 202,094 34 Reserve & Surplus (excluding Revaluation Reserve) 675,450 640,737 542,628 640,737 35 Fair Value Change Account and Revaluation Reserve (Shareholders) 17,627 20,744 (5,529) 20,744
Total Assets:Investments:- Shareholders' 897,066 854,211 629,539 854,211 - Policyholders Fund excluding Linked Assets 9,412,625 9,053,783 7,214,943 9,053,783 - Assets held to cover Linked Liabilities (Linked Assets) 7,817,551 7,475,950 6,152,996 7,475,950 Other Assets (Net of current liabilities and provisions) (56,278) (77,361) (103,618) (77,361)
Advertisement and publicity 27,280 44,315 17,083 141,011 Business development expenses 1,809 29,428 1,326 66,590
1 Net of reinsurance2 Net of amortisation and losses (including capital gains)3 Inclusive of interim and terminal bonus4 Includes Remuneration of MD/CEOs/WTDs over specifed limits and Interest on Non-convertible debentures5 Inclusive of provision for standard and non-standard assets6 Represents accumulated surplus
HDFC Life Insurance Company LimitedStatement of Standalone Audited Results for the Quarter ended June 30, 2021
Sr. No. Particulars
Three Months ended / As at
1(a)(b)(c)
7(a)(b)(c)
9(a)(b)
19(a)(b)
22(a)(b)
20(a)(b)(c)(d)
*Details of Expenses contributing more than 10% of the expense of management are as below -
Foot notes :
The joint statutory auditors have digitally signed this statement for identification purposes only and this Statement should be read in conjunction with their report dated July 19, 2021.
36(a)
(b)
31(a)(b)
ALPA KEDIA
Digitally signed by ALPA KEDIA Date: 2021.07.19 12:59:56 +05'30'
Rajen Ratansi Ashar
Digitally signed by Rajen Ratansi Ashar Date: 2021.07.19 13:23:41 +05'30'
(₹ in Lakhs)Year ended / As at
June 30, 2021 March 31, 2021 June 30, 2020 March 31, 2021
(Audited) (Audited) (Audited) (Audited)Analytical Ratios:
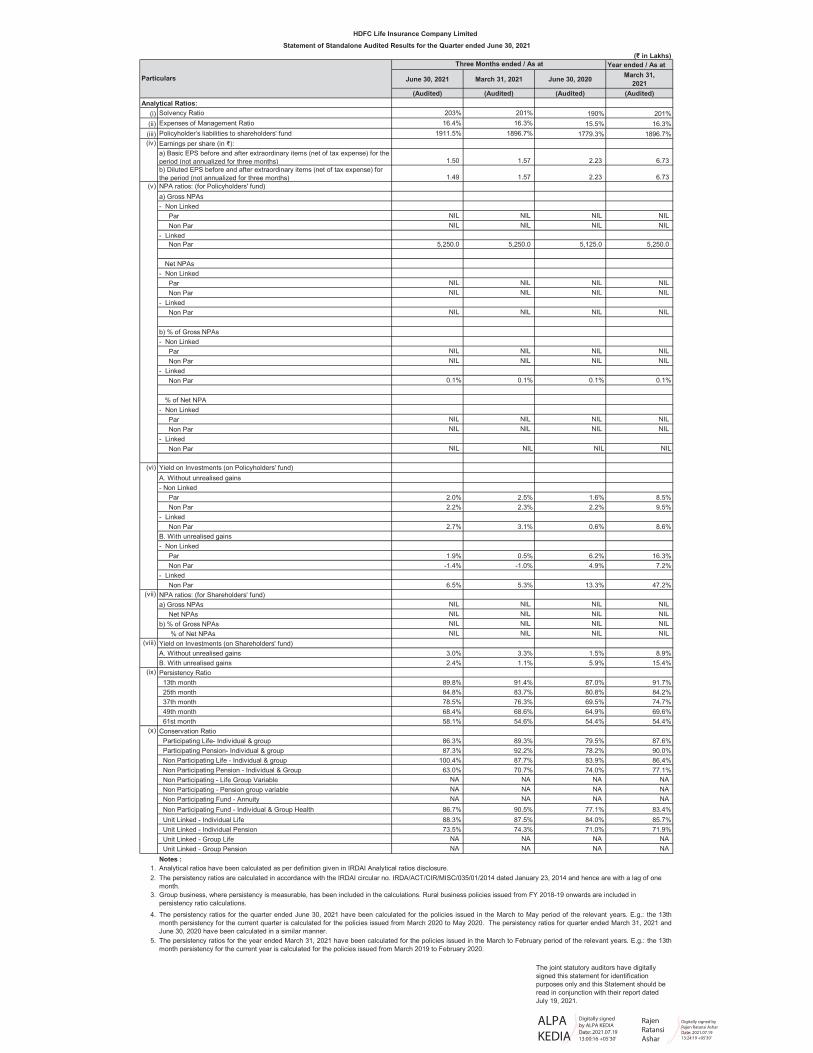
(i) Solvency Ratio 203% 201% 190% 201%(ii) Expenses of Management Ratio 16.4% 16.3% 15.5% 16.3%(iii) Policyholder’s liabilities to shareholders' fund 1911.5% 1896.7% 1779.3% 1896.7%
Earnings per share (in ₹):a) Basic EPS before and after extraordinary items (net of tax expense) for the period (not annualized for three months) 1.50 1.57 2.23 6.73 b) Diluted EPS before and after extraordinary items (net of tax expense) for the period (not annualized for three months) 1.49 1.57 2.23 6.73 NPA ratios: (for Policyholders' fund)a) Gross NPAs- Non Linked Par NIL NIL NIL NIL Non Par NIL NIL NIL NIL- Linked Non Par 5,250.0 5,250.0 5,125.0 5,250.0
Net NPAs- Non Linked Par NIL NIL NIL NIL Non Par NIL NIL NIL NIL- Linked Non Par NIL NIL NIL NIL
b) % of Gross NPAs- Non Linked Par NIL NIL NIL NIL Non Par NIL NIL NIL NIL- Linked Non Par 0.1% 0.1% 0.1% 0.1%
% of Net NPA- Non Linked Par NIL NIL NIL NIL Non Par NIL NIL NIL NIL- Linked Non Par NIL NIL NIL NIL
Yield on Investments (on Policyholders' fund)A. Without unrealised gains- Non Linked Par 2.0% 2.5% 1.6% 8.5% Non Par 2.2% 2.3% 2.2% 9.5%- Linked Non Par 2.7% 3.1% 0.6% 8.6%B. With unrealised gains- Non Linked Par 1.9% 0.5% 6.2% 16.3% Non Par -1.4% -1.0% 4.9% 7.2%- Linked Non Par 6.5% 5.3% 13.3% 47.2%NPA ratios: (for Shareholders' fund)a) Gross NPAs NIL NIL NIL NIL Net NPAs NIL NIL NIL NILb) % of Gross NPAs NIL NIL NIL NIL % of Net NPAs NIL NIL NIL NILYield on Investments (on Shareholders' fund)A. Without unrealised gains 3.0% 3.3% 1.5% 8.9%B. With unrealised gains 2.4% 1.1% 5.9% 15.4%Persistency Ratio 13th month 89.8% 91.4% 87.0% 91.7% 25th month 84.8% 83.7% 80.8% 84.2% 37th month 78.5% 76.3% 69.5% 74.7% 49th month 68.4% 68.6% 64.9% 69.6% 61st month 58.1% 54.6% 54.4% 54.4%Conservation Ratio Participating Life- Individual & group 86.3% 89.3% 79.5% 87.6% Participating Pension- Individual & group 87.3% 92.2% 78.2% 90.0% Non Participating Life - Individual & group 100.4% 87.7% 83.9% 86.4% Non Participating Pension - Individual & Group 63.0% 70.7% 74.0% 77.1% Non Participating - Life Group Variable NA NA NA NA Non Participating - Pension group variable NA NA NA NA Non Participating Fund - Annuity NA NA NA NA Non Participating Fund - Individual & Group Health 86.7% 90.5% 77.1% 83.4% Unit Linked - Individual Life 88.3% 87.5% 84.0% 85.7% Unit Linked - Individual Pension 73.5% 74.3% 71.0% 71.9% Unit Linked - Group Life NA NA NA NA Unit Linked - Group Pension NA NA NA NANotes :
1.2.
3.
4.
5.
(viii)
HDFC Life Insurance Company LimitedStatement of Standalone Audited Results for the Quarter ended June 30, 2021
Particulars
Three Months ended / As at
(iv)
(v)
(vi)
(vii)
The persistency ratios for the year ended March 31, 2021 have been calculated for the policies issued in the March to February period of the relevant years. E.g.: the 13thmonth persistency for the current year is calculated for the policies issued from March 2019 to February 2020.
(ix)
(x)
Analytical ratios have been calculated as per definition given in IRDAI Analytical ratios disclosure.The persistency ratios are calculated in accordance with the IRDAI circular no. IRDA/ACT/CIR/MISC/035/01/2014 dated January 23, 2014 and hence are with a lag of one month.Group business, where persistency is measurable, has been included in the calculations. Rural business policies issued from FY 2018-19 onwards are included in persistency ratio calculations.
The persistency ratios for the quarter ended June 30, 2021 have been calculated for the policies issued in the March to May period of the relevant years. E.g.: the 13thmonth persistency for the current quarter is calculated for the policies issued from March 2020 to May 2020. The persistency ratios for quarter ended March 31, 2021 andJune 30, 2020 have been calculated in a similar manner.
The joint statutory auditors have digitally signed this statement for identification purposes only and this Statement should be read in conjunction with their report dated July 19, 2021.
ALPA KEDIA
Digitally signed by ALPA KEDIA Date: 2021.07.19 13:00:16 +05'30'
Rajen Ratansi Ashar
Digitally signed by Rajen Ratansi Ashar Date: 2021.07.19 13:24:19 +05'30'

(₹ in Lakhs)Year ended
June 30, 2021 March 31, 2021 June 30, 2020 March 31, 2021
(Audited) (Audited) (Audited) (Audited)1 Segment IncomeA) Policyholders :
Segment A - Participating - Individual & Group Life : Net Premium 128,086 273,045 105,133 746,872 Income from Investments2 79,519 90,556 50,839 267,499 Transfer of Funds from shareholders' account - - - - Other Income 647 4,841 2,599 12,207 Segment B - Participating - Individual & Group Pension : Net Premium 2,450 6,037 2,805 18,281 Income from Investments2 10,327 5,288 5,372 22,704 Transfer of Funds from shareholders' account - - - - Other Income 2 258 42 493 Segment C - Non Participating - Individual & Group Life : Net Premium 260,957 406,920 152,266 1,150,509 Income from Investments2 61,818 59,428 41,102 208,452 Transfer of Funds from shareholders' account 7,560 24,544 - 24,544 Other Income 817 810 338 2,535 Segment D - Non Participating - Life Group Variable : Net Premium 8,961 9,703 3,224 46,244 Income from Investments2 6,156 6,159 5,812 24,188 Transfer of Funds from shareholders' account - - - - Other Income - - - - Segment E - Non Participating - Individual & Group Pension : Net Premium 13,452 36,498 20,788 174,408 Income from Investments2 12,141 9,957 8,874 38,867 Transfer of Funds from shareholders' account - - - - Other Income 4 10 8 29 Segment F - Non Participating - Pension Group Variable : Net Premium 39,142 40,830 39,444 155,676 Income from Investments2 7,941 7,375 7,081 28,928 Transfer of Funds from shareholders' account 491 731 - 1,312 Other Income - - - - Segment G - Non Participating - Individual & Group Annuity : Net Premium 99,120 130,672 61,440 392,720 Income from Investments2 23,729 21,129 17,388 77,754 Transfer of Funds from shareholders' account - (1,147) - - Other Income 19 19 12 68 Segment H - Non Participating - Individual & Group Health : Net Premium 852 1,549 1,018 5,291 Income from Investments2 119 124 210 573 Transfer of Funds from shareholders' account - - - - Other Income 3 4 (1) 16 Segment I - Unit Linked - Individual Life : Net Premium 182,047 342,854 166,869 982,517 Income from Investments2 457,060 381,980 628,756 2,280,991 Transfer of Funds from shareholders' account - - - - Other Income 681 714 801 2,986 Segment J - Unit Linked - Individual Pension : Net Premium 8,092 16,881 9,990 51,797 Income from Investments2 36,867 24,284 71,663 226,325 Transfer of Funds from shareholders' account - - - - Other Income 2 3 1 7 Segment K - Unit Linked - Group Life : Net Premium 9,526 20,044 7,616 79,985 Income from Investments2 17,958 3,657 36,860 93,501 Transfer of Funds from shareholders' account - - - - Other Income - - - - Segment L - Unit Linked - Group Pension : Net Premium 1,162 1,767 1,590 7,930 Income from Investments2 3,047 763 6,655 17,027 Transfer of Funds from shareholders' account - - - - Other Income - - - -
B) Shareholders : Income from Investments2 27,683 28,781 11,114 68,488 Other Income - - - -
HDFC Life Insurance Company LimitedSegment Reporting (Standalone) for the Quarter ended June 30, 2021
Sr. No. Particulars
Three Months ended
(₹ in Lakhs)
HDFC Life Insurance Company LimitedSegment Reporting (Standalone) for the Quarter ended June 30, 2021
Year ended / As at
June 30, 2021 March 31, 2021 June 30, 2020 March 31, 2021
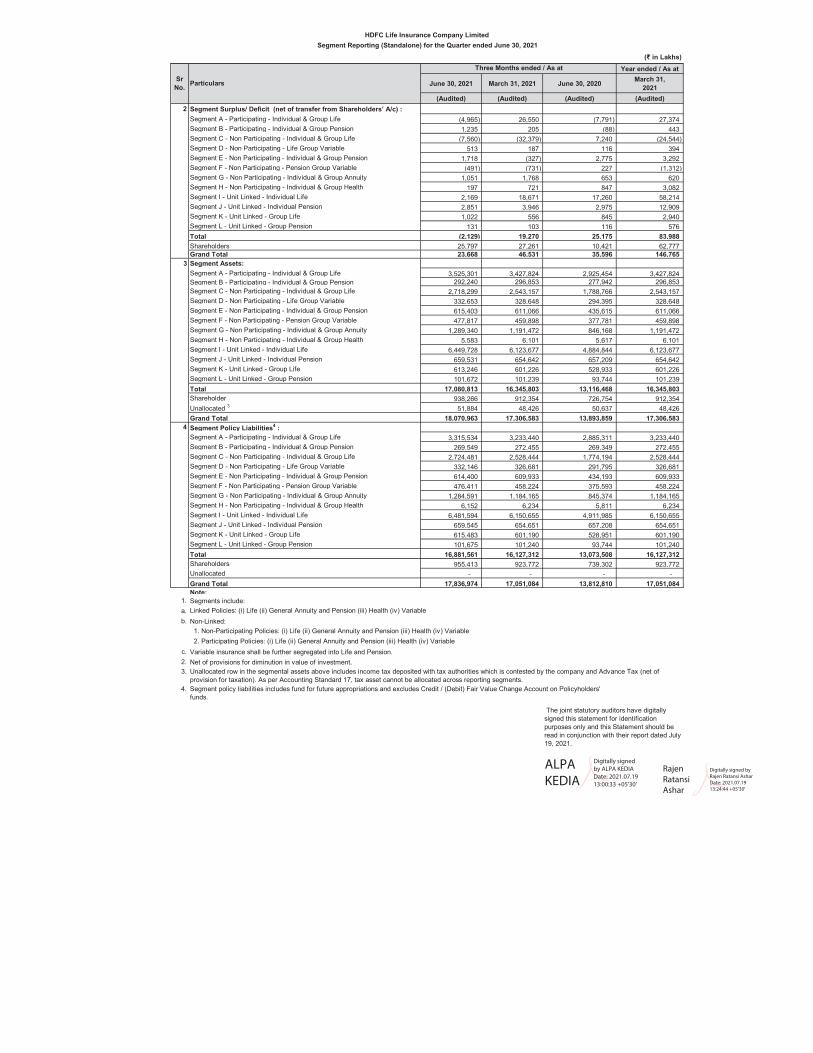
(Audited) (Audited) (Audited) (Audited)2 Segment Surplus/ Deficit (net of transfer from Shareholders’ A/c) :
Segment A - Participating - Individual & Group Life (4,965) 26,550 (7,791) 27,374 Segment B - Participating - Individual & Group Pension 1,235 205 (88) 443 Segment C - Non Participating - Individual & Group Life (7,560) (32,379) 7,240 (24,544) Segment D - Non Participating - Life Group Variable 513 187 116 394 Segment E - Non Participating - Individual & Group Pension 1,718 (327) 2,775 3,292 Segment F - Non Participating - Pension Group Variable (491) (731) 227 (1,312) Segment G - Non Participating - Individual & Group Annuity 1,051 1,768 653 620 Segment H - Non Participating - Individual & Group Health 197 721 847 3,082 Segment I - Unit Linked - Individual Life 2,169 18,671 17,260 58,214 Segment J - Unit Linked - Individual Pension 2,851 3,946 2,975 12,909 Segment K - Unit Linked - Group Life 1,022 556 845 2,940 Segment L - Unit Linked - Group Pension 131 103 116 576 Total (2,129) 19,270 25,175 83,988 Shareholders 25,797 27,261 10,421 62,777 Grand Total 23,668 46,531 35,596 146,765
3 Segment Assets:Segment A - Participating - Individual & Group Life 3,525,301 3,427,824 2,925,454 3,427,824 Segment B - Participating - Individual & Group Pension 292,240 296,853 277,942 296,853 Segment C - Non Participating - Individual & Group Life 2,718,299 2,543,157 1,788,766 2,543,157 Segment D - Non Participating - Life Group Variable 332,653 328,648 294,395 328,648 Segment E - Non Participating - Individual & Group Pension 615,403 611,066 435,615 611,066 Segment F - Non Participating - Pension Group Variable 477,817 459,898 377,781 459,898 Segment G - Non Participating - Individual & Group Annuity 1,289,340 1,191,472 846,168 1,191,472 Segment H - Non Participating - Individual & Group Health 5,583 6,101 5,617 6,101 Segment I - Unit Linked - Individual Life 6,449,728 6,123,677 4,884,844 6,123,677 Segment J - Unit Linked - Individual Pension 659,531 654,642 657,209 654,642 Segment K - Unit Linked - Group Life 613,246 601,226 528,933 601,226 Segment L - Unit Linked - Group Pension 101,672 101,239 93,744 101,239 Total 17,080,813 16,345,803 13,116,468 16,345,803 Shareholder 938,266 912,354 726,754 912,354 Unallocated 3 51,884 48,426 50,637 48,426 Grand Total 18,070,963 17,306,583 13,893,859 17,306,583
4 Segment Policy Liabilities4 : Segment A - Participating - Individual & Group Life 3,315,534 3,233,440 2,885,311 3,233,440 Segment B - Participating - Individual & Group Pension 269,549 272,455 269,349 272,455 Segment C - Non Participating - Individual & Group Life 2,724,481 2,528,444 1,774,194 2,528,444 Segment D - Non Participating - Life Group Variable 332,146 326,681 291,795 326,681 Segment E - Non Participating - Individual & Group Pension 614,400 609,933 434,193 609,933 Segment F - Non Participating - Pension Group Variable 476,411 458,224 375,593 458,224 Segment G - Non Participating - Individual & Group Annuity 1,284,591 1,184,165 845,374 1,184,165 Segment H - Non Participating - Individual & Group Health 6,152 6,234 5,811 6,234 Segment I - Unit Linked - Individual Life 6,481,594 6,150,655 4,911,985 6,150,655 Segment J - Unit Linked - Individual Pension 659,545 654,651 657,208 654,651 Segment K - Unit Linked - Group Life 615,483 601,190 528,951 601,190 Segment L - Unit Linked - Group Pension 101,675 101,240 93,744 101,240 Total 16,881,561 16,127,312 13,073,508 16,127,312 Shareholders 955,413 923,772 739,302 923,772 Unallocated - - - - Grand Total 17,836,974 17,051,084 13,812,810 17,051,084 Note:
1. Segments include:a.b. Non-Linked:
c. Variable insurance shall be further segregated into Life and Pension.2. Net of provisions for diminution in value of investment.3.
4.
Sr No. Particulars
Three Months ended / As at
The joint statutory auditors have digitally signed this statement for identification purposes only and this Statement should be read in conjunction with their report dated July 19, 2021.
Linked Policies: (i) Life (ii) General Annuity and Pension (iii) Health (iv) Variable
1. Non-Participating Policies: (i) Life (ii) General Annuity and Pension (iii) Health (iv) Variable 2. Participating Policies: (i) Life (ii) General Annuity and Pension (iii) Health (iv) Variable
Unallocated row in the segmental assets above includes income tax deposited with tax authorities which is contested by the company and Advance Tax (net of provision for taxation). As per Accounting Standard 17, tax asset cannot be allocated across reporting segments.Segment policy liabilities includes fund for future appropriations and excludes Credit / (Debit) Fair Value Change Account on Policyholders' funds.
ALPA KEDIA
Digitally signed by ALPA KEDIA Date: 2021.07.19 13:00:33 +05'30'
Rajen Ratansi Ashar
Digitally signed by Rajen Ratansi Ashar Date: 2021.07.19 13:24:44 +05'30'
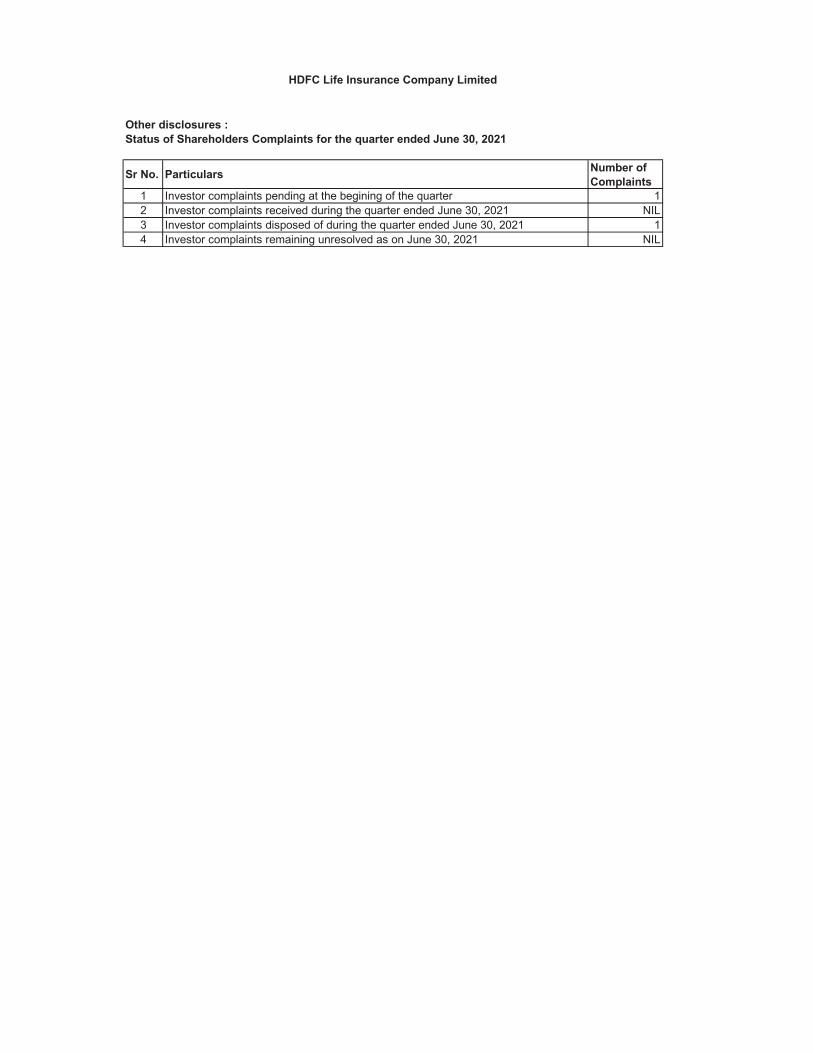
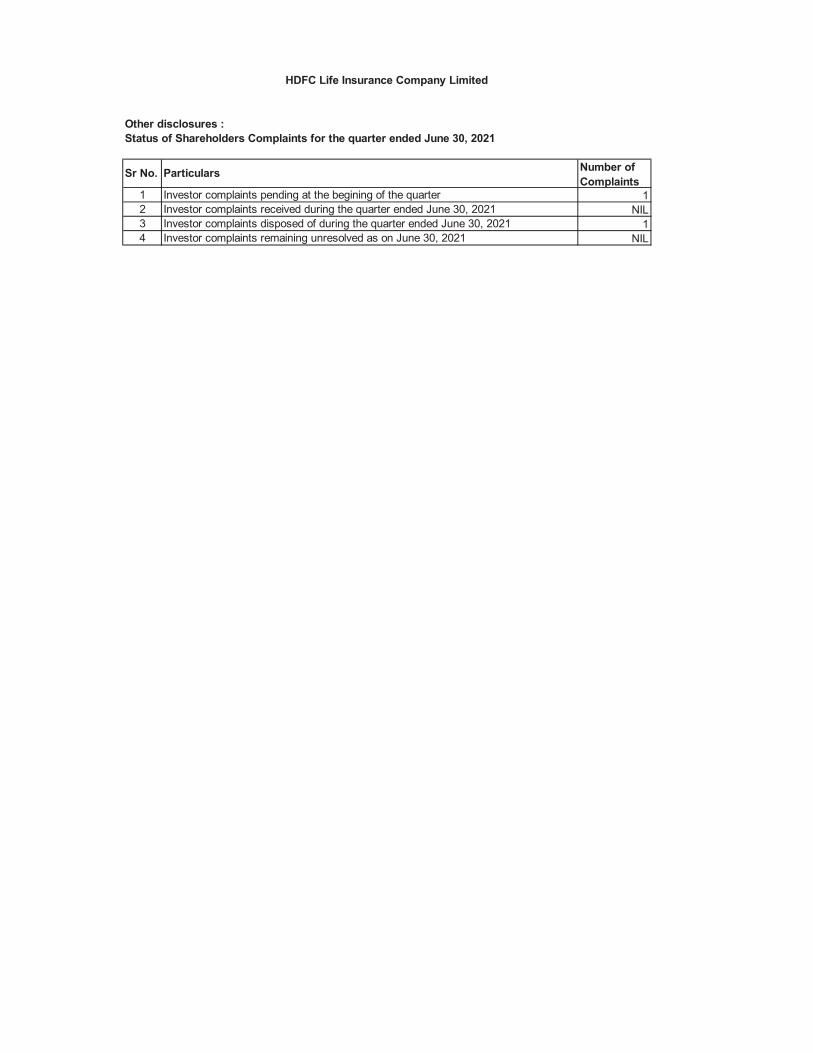
Other disclosures :Status of Shareholders Complaints for the quarter ended June 30, 2021
Sr No. Particulars Number of Complaints
1 Investor complaints pending at the begining of the quarter 12 Investor complaints received during the quarter ended June 30, 2021 NIL3 Investor complaints disposed of during the quarter ended June 30, 2021 14 Investor complaints remaining unresolved as on June 30, 2021 NIL
HDFC Life Insurance Company Limited
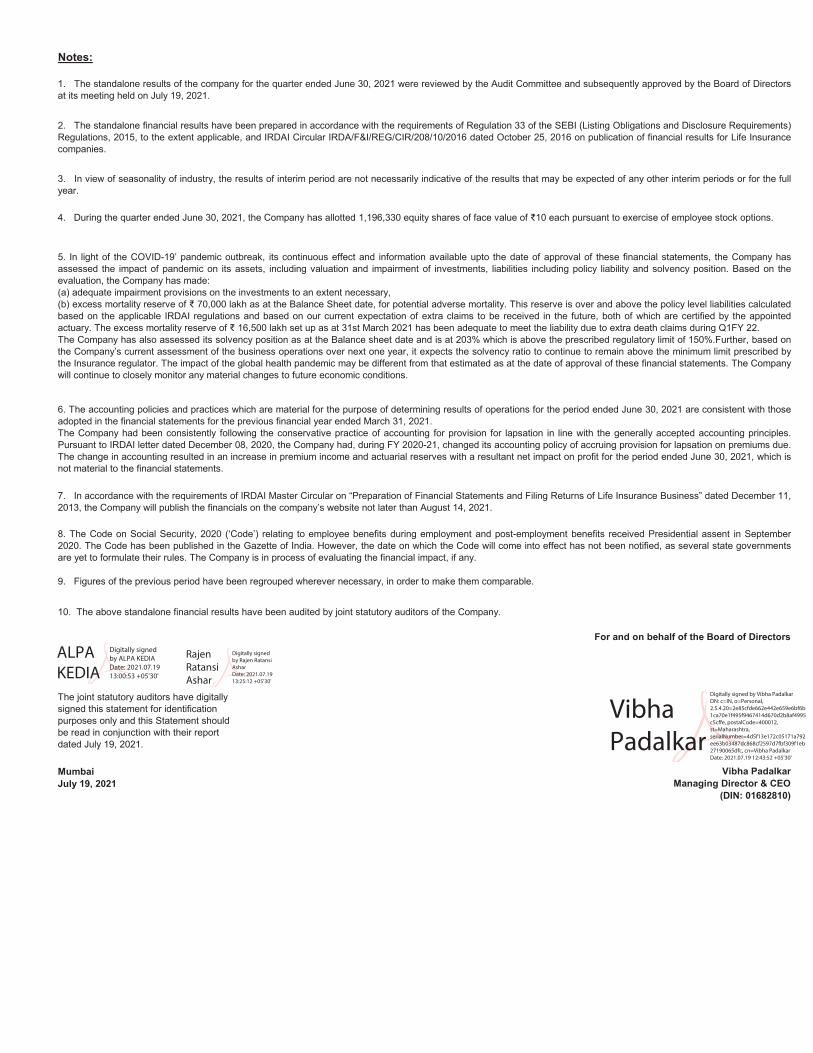
Notes:
The joint statutory auditors have digitally signed this statement for identification purposes only and this Statement should be read in conjunction with their report dated July 19, 2021.
MumbaiJuly 19, 2021
5. In light of the COVID-19’ pandemic outbreak, its continuous effect and information available upto the date of approval of these financial statements, the Company hasassessed the impact of pandemic on its assets, including valuation and impairment of investments, liabilities including policy liability and solvency position. Based on theevaluation, the Company has made:(a) adequate impairment provisions on the investments to an extent necessary,(b) excess mortality reserve of ₹ 70,000 lakh as at the Balance Sheet date, for potential adverse mortality. This reserve is over and above the policy level liabilities calculatedbased on the applicable IRDAI regulations and based on our current expectation of extra claims to be received in the future, both of which are certified by the appointedactuary. The excess mortality reserve of ₹ 16,500 lakh set up as at 31st March 2021 has been adequate to meet the liability due to extra death claims during Q1FY 22.The Company has also assessed its solvency position as at the Balance sheet date and is at 203% which is above the prescribed regulatory limit of 150%.Further, based onthe Company’s current assessment of the business operations over next one year, it expects the solvency ratio to continue to remain above the minimum limit prescribed bythe Insurance regulator. The impact of the global health pandemic may be different from that estimated as at the date of approval of these financial statements. The Companywill continue to closely monitor any material changes to future economic conditions.
1. The standalone results of the company for the quarter ended June 30, 2021 were reviewed by the Audit Committee and subsequently approved by the Board of Directorsat its meeting held on July 19, 2021.
2. The standalone financial results have been prepared in accordance with the requirements of Regulation 33 of the SEBI (Listing Obligations and Disclosure Requirements)Regulations, 2015, to the extent applicable, and IRDAI Circular IRDA/F&I/REG/CIR/208/10/2016 dated October 25, 2016 on publication of financial results for Life Insurancecompanies.
3. In view of seasonality of industry, the results of interim period are not necessarily indicative of the results that may be expected of any other interim periods or for the fullyear.
4. During the quarter ended June 30, 2021, the Company has allotted 1,196,330 equity shares of face value of ₹10 each pursuant to exercise of employee stock options.
Vibha PadalkarManaging Director & CEO
(DIN: 01682810)
6. The accounting policies and practices which are material for the purpose of determining results of operations for the period ended June 30, 2021 are consistent with thoseadopted in the financial statements for the previous financial year ended March 31, 2021.The Company had been consistently following the conservative practice of accounting for provision for lapsation in line with the generally accepted accounting principles.Pursuant to IRDAI letter dated December 08, 2020, the Company had, during FY 2020-21, changed its accounting policy of accruing provision for lapsation on premiums due.The change in accounting resulted in an increase in premium income and actuarial reserves with a resultant net impact on profit for the period ended June 30, 2021, which isnot material to the financial statements.
7. In accordance with the requirements of IRDAI Master Circular on “Preparation of Financial Statements and Filing Returns of Life Insurance Business” dated December 11,2013, the Company will publish the financials on the company’s website not later than August 14, 2021.
8. The Code on Social Security, 2020 (‘Code’) relating to employee benefits during employment and post-employment benefits received Presidential assent in September2020. The Code has been published in the Gazette of India. However, the date on which the Code will come into effect has not been notified, as several state governmentsare yet to formulate their rules. The Company is in process of evaluating the financial impact, if any.
9. Figures of the previous period have been regrouped wherever necessary, in order to make them comparable.
10. The above standalone financial results have been audited by joint statutory auditors of the Company.
For and on behalf of the Board of Directors
Vibha Padalkar
Digitally signed by Vibha Padalkar DN: c=IN, o=Personal, 2.5.4.20=2e85cfde662e442e659e6bf6b1ca70e1f495f9467414d670d2b8af4995c5cffe, postalCode=400012, st=Maharashtra, serialNumber=4d5f13e172c05171a792ee63b03487dc868cf2597d7fbf309f1eb27190065dfc, cn=Vibha Padalkar Date: 2021.07.19 12:43:52 +05'30'
ALPA KEDIA
Digitally signed by ALPA KEDIA Date: 2021.07.19 13:00:53 +05'30'
Rajen Ratansi Ashar
Digitally signed by Rajen Ratansi Ashar Date: 2021.07.19 13:25:12 +05'30'
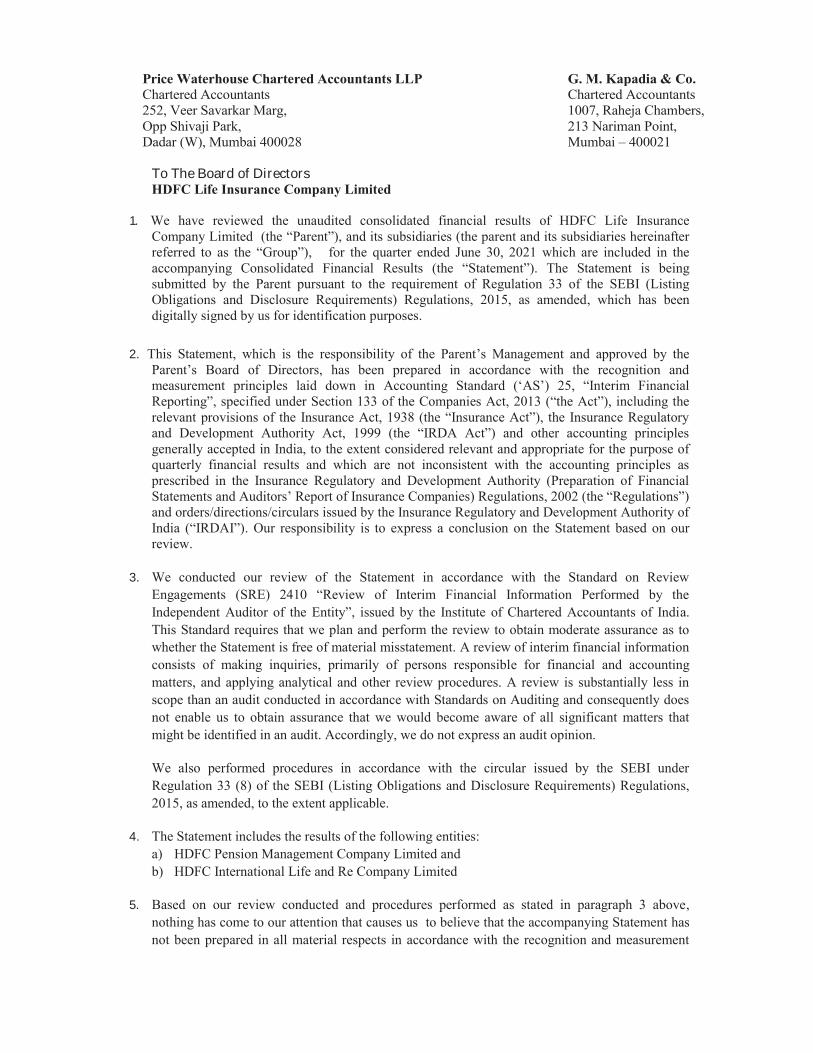
Price Waterhouse Chartered Accountants LLP G. M. Kapadia & Co. Chartered Accountants Chartered Accountants 252, Veer Savarkar Marg, 1007, Raheja Chambers, Opp Shivaji Park, 213 Nariman Point, Dadar (W), Mumbai 400028 Mumbai – 400021
To The Board of Directors HDFC Life Insurance Company Limited
1. We have reviewed the unaudited consolidated financial results of HDFC Life Insurance Company Limited (the “Parent”), and its subsidiaries (the parent and its subsidiaries hereinafter referred to as the “Group”), for the quarter ended June 30, 2021 which are included in the accompanying Consolidated Financial Results (the “Statement”). The Statement is being submitted by the Parent pursuant to the requirement of Regulation 33 of the SEBI (Listing Obligations and Disclosure Requirements) Regulations, 2015, as amended, which has been digitally signed by us for identification purposes.
2. This Statement, which is the responsibility of the Parent’s Management and approved by the Parent’s Board of Directors, has been prepared in accordance with the recognition and measurement principles laid down in Accounting Standard (‘AS’) 25, “Interim Financial Reporting”, specified under Section 133 of the Companies Act, 2013 (“the Act”), including the relevant provisions of the Insurance Act, 1938 (the “Insurance Act”), the Insurance Regulatory and Development Authority Act, 1999 (the “IRDA Act”) and other accounting principles generally accepted in India, to the extent considered relevant and appropriate for the purpose of quarterly financial results and which are not inconsistent with the accounting principles as prescribed in the Insurance Regulatory and Development Authority (Preparation of Financial Statements and Auditors’ Report of Insurance Companies) Regulations, 2002 (the “Regulations”) and orders/directions/circulars issued by the Insurance Regulatory and Development Authority of India (“IRDAI”). Our responsibility is to express a conclusion on the Statement based on our review.
3. We conducted our review of the Statement in accordance with the Standard on Review Engagements (SRE) 2410 “Review of Interim Financial Information Performed by the Independent Auditor of the Entity”, issued by the Institute of Chartered Accountants of India. This Standard requires that we plan and perform the review to obtain moderate assurance as to whether the Statement is free of material misstatement. A review of interim financial information consists of making inquiries, primarily of persons responsible for financial and accounting matters, and applying analytical and other review procedures. A review is substantially less in scope than an audit conducted in accordance with Standards on Auditing and consequently does not enable us to obtain assurance that we would become aware of all significant matters that might be identified in an audit. Accordingly, we do not express an audit opinion.
We also performed procedures in accordance with the circular issued by the SEBI under Regulation 33 (8) of the SEBI (Listing Obligations and Disclosure Requirements) Regulations, 2015, as amended, to the extent applicable.
4. The Statement includes the results of the following entities: a) HDFC Pension Management Company Limited and b) HDFC International Life and Re Company Limited
5. Based on our review conducted and procedures performed as stated in paragraph 3 above, nothing has come to our attention that causes us to believe that the accompanying Statement has not been prepared in all material respects in accordance with the recognition and measurement

principles laid down in the aforesaid Insurance Act, IRDA Act, and other accounting principles generally accepted in India and to the extent considered relevant and appropriate for the purpose of these consolidated financial results and which are not inconsistent with the accounting principles as prescribed in the Regulations and orders/directions/circulars issued by IRDAI to the extent applicable and has not disclosed the information required to be disclosed in terms of Regulation 33 of the SEBI (Listing Obligations and Disclosure Requirements) Regulations, 2015, as amended, including the manner in which it is to be disclosed, or that it contains any material misstatement.
6. We draw your attention to Note 5 to the consolidated financial results which describe the management’s assessment of the impact of the outbreak of Coronavirus (COVID-19) on the business operations of the Company. In view of the uncertain economic environment, a definitive assessment of the impact on the subsequent periods is highly dependent upon circumstances as they evolve. Our opinion is not modified in respect of this matter.
7. The actuarial valuation of liabilities (including excess mortality reserve) for life policies in force
and for policies in respect of which premium has been discontinued but liability exists is the responsibility of the Parent Company’s Appointed Actuary (the “Appointed Actuary”). The actuarial valuation of these liabilities as at June 30, 2021 has been duly certified by the Appointed Actuary and in his opinion, the assumptions for such valuation are in accordance with the guidelines and norms issued by the Insurance Regulatory and Development Authority of India (“IRDAI”) and the Institute of Actuaries of India in concurrence with the Authority. We have relied upon the Appointed Actuary’s certificate in this regard for forming our opinion on the valuation of liabilities for life policies in force and for policies in respect of which premium has been discontinued but liability exists, as contained in the consolidated unaudited financial results of the Group.
8. The consolidated unaudited financial results includes the financial results of two subsidiaries
which have not been reviewed by their auditors or by us, whose interim financial results reflect total revenue of Rs. 274,491 (‘000) and total net loss of Rs. 328, 060 (‘000) for the quarter ended June 30, 2021 as considered in the consolidated unaudited financial results. According to the information and explanations given to us by the Management, financial results are not material to the Group. Our conclusion on the Statement is not modified in respect of the above matter.
For Price Waterhouse Chartered Accountants LLP For G.M.Kapadia & Co. Chartered Accountants Chartered Accountant Firm Registration No.012754N/N500016 Firm Registration No.104767W
__________________ ____________________ Alpa Kedia Rajen Ashar Partner Partner Membership No. 100681 Membership No. 048243
UDIN: 21100681AAAAEL1859 UDIN: 21048243AAAADW2929 Place: Mumbai Date: July 19, 2021
ALPA KEDIA
Digitally signed by ALPA KEDIA Date: 2021.07.19 13:01:54 +05'30'
Rajen Ratansi Ashar
Digitally signed by Rajen Ratansi Ashar Date: 2021.07.19 13:28:31 +05'30'
(₹ in Lakhs)Year ended/As at
June 30, 2021 March 31, 2021 June 30, 2020 March 31, 2021
(Unaudited) (Unaudited) Refer Note 8 (Unaudited) (Audited)
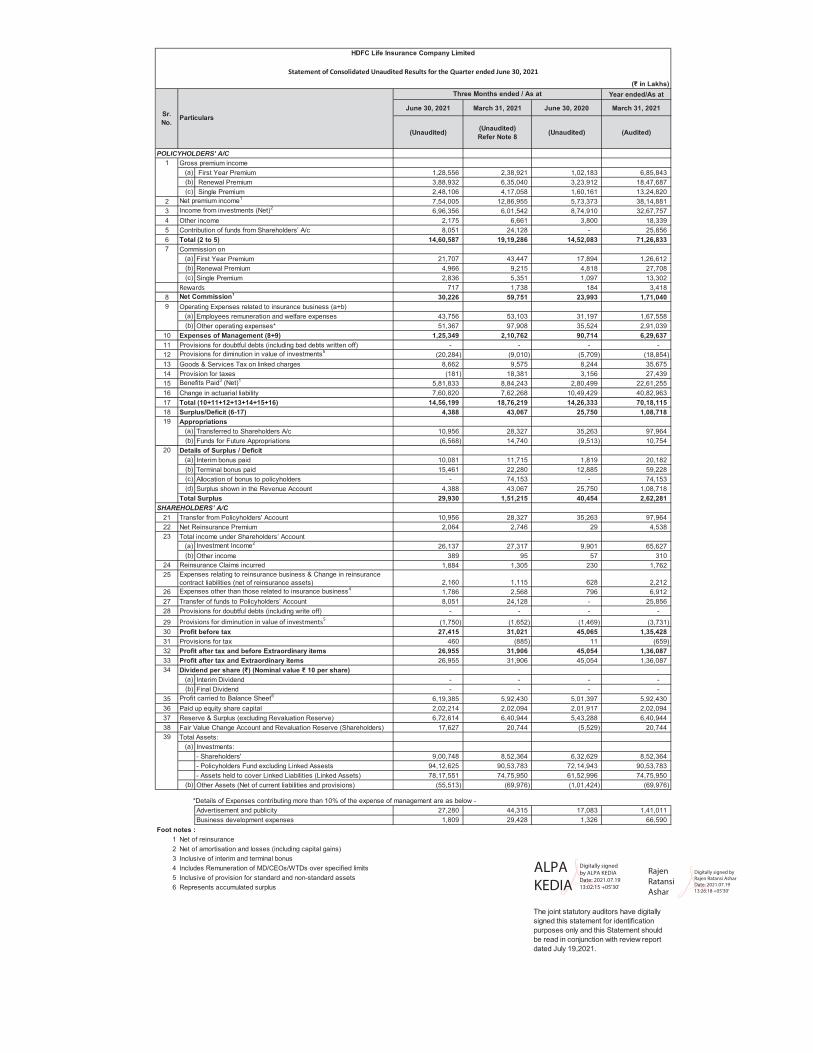
POLICYHOLDERS' A/CGross premium income
First Year Premium 1,28,556 2,38,921 1,02,183 6,85,843 Renewal Premium 3,88,932 6,35,040 3,23,912 18,47,687 Single Premium 2,48,106 4,17,058 1,60,161 13,24,820
2 Net premium income1 7,54,005 12,86,955 5,73,373 38,14,881 3 Income from investments (Net)2 6,96,356 6,01,542 8,74,910 32,67,757 4 Other income 2,175 6,661 3,800 18,339 5 Contribution of funds from Shareholders’ A/c 8,051 24,128 - 25,856 6 Total (2 to 5) 14,60,587 19,19,286 14,52,083 71,26,833
Commission onFirst Year Premium 21,707 43,447 17,894 1,26,612 Renewal Premium 4,966 9,215 4,818 27,708 Single Premium 2,836 5,351 1,097 13,302
Rewards 717 1,738 184 3,418 8 Net Commission1 30,226 59,751 23,993 1,71,040
Operating Expenses related to insurance business (a+b)Employees remuneration and welfare expenses 43,756 53,103 31,197 1,67,558 Other operating expenses* 51,367 97,908 35,524 2,91,039
10 Expenses of Management (8+9) 1,25,349 2,10,762 90,714 6,29,637 11 Provisions for doubtful debts (including bad debts written off) - - - - 12 Provisions for diminution in value of investments5 (20,284) (9,010) (5,709) (18,854) 13 Goods & Services Tax on linked charges 8,662 9,575 8,244 35,675 14 Provision for taxes (181) 18,381 3,156 27,439 15 Benefits Paid3 (Net)1 5,81,833 8,84,243 2,80,499 22,61,255 16 Change in actuarial liability 7,60,820 7,62,268 10,49,429 40,82,963 17 Total (10+11+12+13+14+15+16) 14,56,199 18,76,219 14,26,333 70,18,115 18 Surplus/Deficit (6-17) 4,388 43,067 25,750 1,08,718
AppropriationsTransferred to Shareholders A/c 10,956 28,327 35,263 97,964 Funds for Future Appropriations (6,568) 14,740 (9,513) 10,754
Details of Surplus / DeficitInterim bonus paid 10,081 11,715 1,819 20,182 Terminal bonus paid 15,461 22,280 12,885 59,228 Allocation of bonus to policyholders - 74,153 - 74,153 Surplus shown in the Revenue Account 4,388 43,067 25,750 1,08,718
Total Surplus 29,930 1,51,215 40,454 2,62,281 SHAREHOLDERS’ A/C
21 Transfer from Policyholders' Account 10,956 28,327 35,263 97,964 22 Net Reinsurance Premium 2,064 2,746 29 4,538
Total income under Shareholders’ AccountInvestment Income2 26,137 27,317 9,901 65,627 Other income 389 95 57 310
24 Reinsurance Claims incurred 1,884 1,305 230 1,762 25
2,160 1,115 628 2,212 26 Expenses other than those related to insurance business4 1,786 2,568 796 6,912 27 Transfer of funds to Policyholders’ Account 8,051 24,128 - 25,856 28 Provisions for doubtful debts (including write off) - - - - 29 Provisions for diminution in value of investments5 (1,750) (1,652) (1,469) (3,731) 30 Profit before tax 27,415 31,021 45,065 1,35,428 31 Provisions for tax 460 (885) 11 (659) 32 Profit after tax and before Extraordinary items 26,955 31,906 45,054 1,36,087 33 Profit after tax and Extraordinary items 26,955 31,906 45,054 1,36,087
Dividend per share (₹) (Nominal value ₹ 10 per share)Interim Dividend - - - - Final Dividend - - - -
35 Profit carried to Balance Sheet6 6,19,385 5,92,430 5,01,397 5,92,430 36 Paid up equity share capital 2,02,214 2,02,094 2,01,917 2,02,094 37 Reserve & Surplus (excluding Revaluation Reserve) 6,72,614 6,40,944 5,43,288 6,40,944 38 Fair Value Change Account and Revaluation Reserve (Shareholders) 17,627 20,744 (5,529) 20,744
Total Assets:Investments:- Shareholders' 9,00,748 8,52,364 6,32,629 8,52,364 - Policyholders Fund excluding Linked Assests 94,12,625 90,53,783 72,14,943 90,53,783 - Assets held to cover Linked Liabilities (Linked Assets) 78,17,551 74,75,950 61,52,996 74,75,950 Other Assets (Net of current liabilities and provisions) (55,513) (69,976) (1,01,424) (69,976)
*Details of Expenses contributing more than 10% of the expense of management are as below -Advertisement and publicity 27,280 44,315 17,083 1,41,011 Business development expenses 1,809 29,428 1,326 66,590
1 Net of reinsurance2 Net of amortisation and losses (including capital gains)3 Inclusive of interim and terminal bonus4 Includes Remuneration of MD/CEOs/WTDs over specified limits5 Inclusive of provision for standard and non-standard assets6 Represents accumulated surplus
(a)
(a)(b)
The joint statutory auditors have digitally signed this statement for identification purposes only and this Statement should be read in conjunction with review report dated July 19,2021.
19
20
(b)
(b)
(a)
(a)
9
Foot notes :
(c)
(b)
34
39(a)
23
(d)
(a)
(b)
(b)
Expenses relating to reinsurance business & Change in reinsurance contract liabilities (net of reinsurance assets)
Statement of Consolidated Unaudited Results for the Quarter ended June 30, 2021
HDFC Life Insurance Company Limited
7
Sr. No.
Three Months ended / As at
(a)(b)(c)
1(a)(b)(c)
Particulars
ALPA KEDIA
Digitally signed by ALPA KEDIA Date: 2021.07.19 13:02:15 +05'30'
Rajen Ratansi Ashar
Digitally signed by Rajen Ratansi Ashar Date: 2021.07.19 13:26:18 +05'30'
(₹ in Lakhs)Year ended/As at
June 30, 2021 March 31, 2021 June 30, 2020 March 31, 2021
(Unaudited) (Unaudited) Refer Note 8 (Unaudited) (Audited)
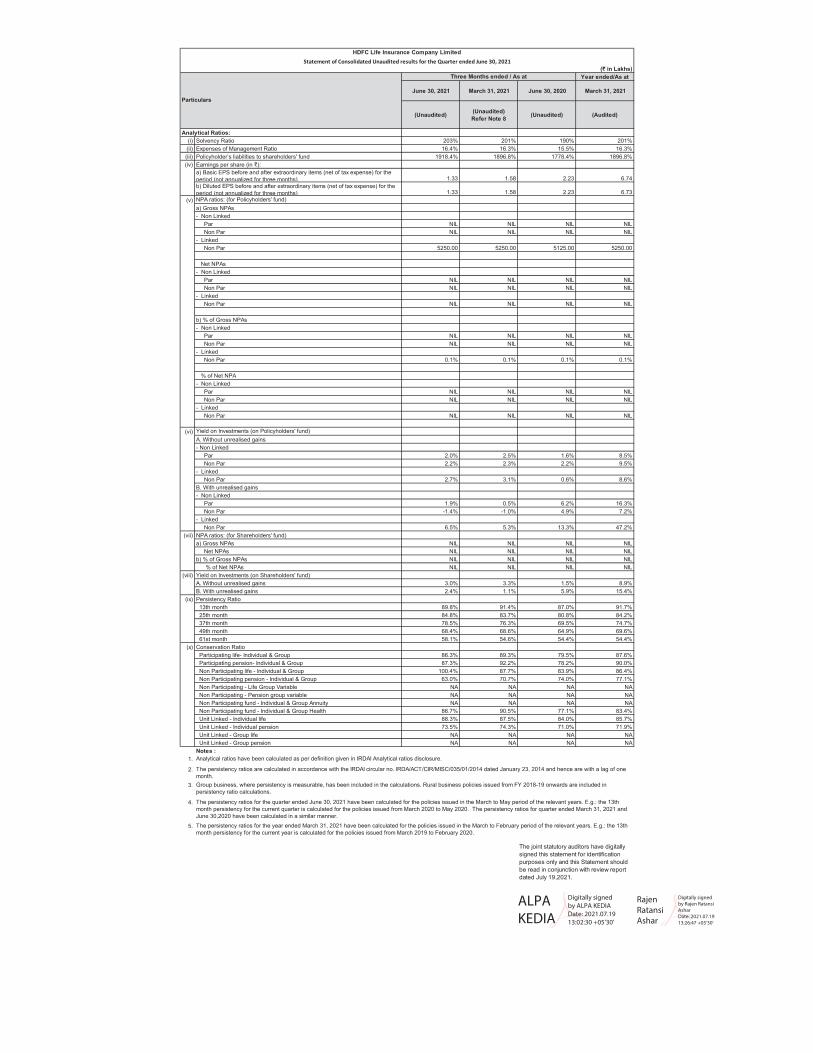
Analytical Ratios:(i) Solvency Ratio 203% 201% 190% 201%(ii) Expenses of Management Ratio 16.4% 16.3% 15.5% 16.3%(iii) Policyholder’s liabilities to shareholders' fund 1918.4% 1896.8% 1778.4% 1896.8%
Earnings per share (in ₹):a) Basic EPS before and after extraordinary items (net of tax expense) for the period (not annualized for three months) 1.33 1.58 2.23 6.74b) Diluted EPS before and after extraordinary items (net of tax expense) for the period (not annualized for three months) 1.33 1.58 2.23 6.73NPA ratios: (for Policyholders' fund)a) Gross NPAs- Non Linked Par NIL NIL NIL NIL Non Par NIL NIL NIL NIL- Linked Non Par 5250.00 5250.00 5125.00 5250.00
Net NPAs- Non Linked Par NIL NIL NIL NIL Non Par NIL NIL NIL NIL- Linked Non Par NIL NIL NIL NIL
b) % of Gross NPAs- Non Linked Par NIL NIL NIL NIL Non Par NIL NIL NIL NIL- Linked Non Par 0.1% 0.1% 0.1% 0.1%
% of Net NPA- Non Linked Par NIL NIL NIL NIL Non Par NIL NIL NIL NIL- Linked Non Par NIL NIL NIL NIL
Yield on Investments (on Policyholders' fund)A. Without unrealised gains- Non Linked Par 2.0% 2.5% 1.6% 8.5% Non Par 2.2% 2.3% 2.2% 9.5%- Linked Non Par 2.7% 3.1% 0.6% 8.6%B. With unrealised gains- Non Linked Par 1.9% 0.5% 6.2% 16.3% Non Par -1.4% -1.0% 4.9% 7.2%- Linked Non Par 6.5% 5.3% 13.3% 47.2%NPA ratios: (for Shareholders' fund)a) Gross NPAs NIL NIL NIL NIL Net NPAs NIL NIL NIL NILb) % of Gross NPAs NIL NIL NIL NIL % of Net NPAs NIL NIL NIL NILYield on Investments (on Shareholders' fund)A. Without unrealised gains 3.0% 3.3% 1.5% 8.9%B. With unrealised gains 2.4% 1.1% 5.9% 15.4%Persistency Ratio 13th month 89.8% 91.4% 87.0% 91.7% 25th month 84.8% 83.7% 80.8% 84.2% 37th month 78.5% 76.3% 69.5% 74.7% 49th month 68.4% 68.6% 64.9% 69.6% 61st month 58.1% 54.6% 54.4% 54.4%Conservation Ratio Participating life- Individual & Group 86.3% 89.3% 79.5% 87.6% Participating pension- Individual & Group 87.3% 92.2% 78.2% 90.0% Non Participating life - Individual & Group 100.4% 87.7% 83.9% 86.4% Non Participating pension - Individual & Group 63.0% 70.7% 74.0% 77.1% Non Participating - Life Group Variable NA NA NA NA Non Participating - Pension group variable NA NA NA NA Non Participating fund - Individual & Group Annuity NA NA NA NA Non Participating fund - Individual & Group Health 86.7% 90.5% 77.1% 83.4% Unit Linked - Individual life 88.3% 87.5% 84.0% 85.7% Unit Linked - Individual pension 73.5% 74.3% 71.0% 71.9% Unit Linked - Group life NA NA NA NA Unit Linked - Group pension NA NA NA NANotes :
1.
2.
3.
4.
5.
(iv)
(v)
Particulars
Three Months ended / As at
Statement of Consolidated Unaudited results for the Quarter ended June 30, 2021HDFC Life Insurance Company Limited
Analytical ratios have been calculated as per definition given in IRDAI Analytical ratios disclosure.
(vi)
(vii)
(viii)
(ix)
(x)
The joint statutory auditors have digitally signed this statement for identification purposes only and this Statement should be read in conjunction with review report dated July 19,2021.
The persistency ratios are calculated in accordance with the IRDAI circular no. IRDA/ACT/CIR/MISC/035/01/2014 dated January 23, 2014 and hence are with a lag of one month.Group business, where persistency is measurable, has been included in the calculations. Rural business policies issued from FY 2018-19 onwards are included in persistency ratio calculations.
The persistency ratios for the quarter ended June 30, 2021 have been calculated for the policies issued in the March to May period of the relevant years. E.g.: the 13th month persistency for the current quarter is calculated for the policies issued from March 2020 to May 2020. The persistency ratios for quarter ended March 31, 2021 and June 30,2020 have been calculated in a similar manner.The persistency ratios for the year ended March 31, 2021 have been calculated for the policies issued in the March to February period of the relevant years. E.g.: the 13th month persistency for the current year is calculated for the policies issued from March 2019 to February 2020.
ALPA KEDIA
Digitally signed by ALPA KEDIA Date: 2021.07.19 13:02:30 +05'30'
Rajen Ratansi Ashar
Digitally signed by Rajen Ratansi Ashar Date: 2021.07.19 13:26:47 +05'30'
(₹ in Lakhs)
Year ended
June 30, 2021 March 31, 2021 June 30, 2020 March 31, 2021
(Unaudited) (Unaudited) Refer Note 8 (Unaudited) (Audited)
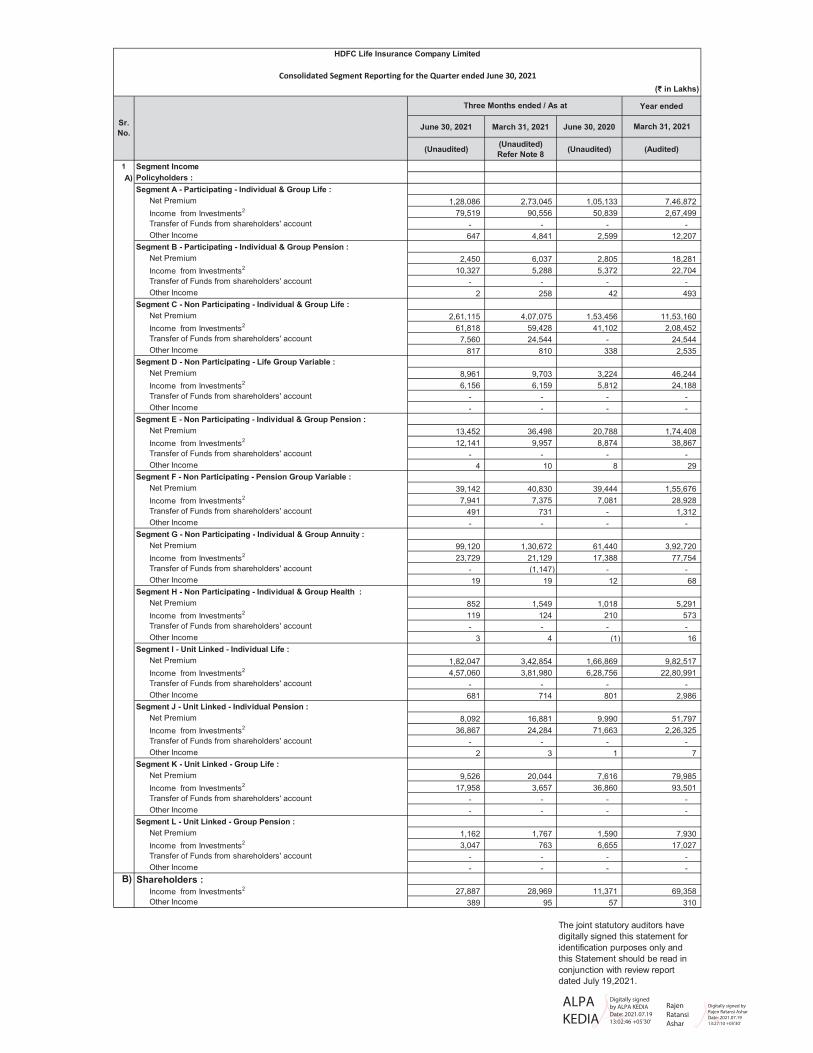
1 Segment IncomeA) Policyholders :
Segment A - Participating - Individual & Group Life : Net Premium 1,28,086 2,73,045 1,05,133 7,46,872 Income from Investments2 79,519 90,556 50,839 2,67,499 Transfer of Funds from shareholders' account - - - - Other Income 647 4,841 2,599 12,207 Segment B - Participating - Individual & Group Pension : Net Premium 2,450 6,037 2,805 18,281 Income from Investments2 10,327 5,288 5,372 22,704 Transfer of Funds from shareholders' account - - - - Other Income 2 258 42 493 Segment C - Non Participating - Individual & Group Life : Net Premium 2,61,115 4,07,075 1,53,456 11,53,160 Income from Investments2 61,818 59,428 41,102 2,08,452 Transfer of Funds from shareholders' account 7,560 24,544 - 24,544 Other Income 817 810 338 2,535 Segment D - Non Participating - Life Group Variable : Net Premium 8,961 9,703 3,224 46,244 Income from Investments2 6,156 6,159 5,812 24,188 Transfer of Funds from shareholders' account - - - - Other Income - - - - Segment E - Non Participating - Individual & Group Pension : Net Premium 13,452 36,498 20,788 1,74,408 Income from Investments2 12,141 9,957 8,874 38,867 Transfer of Funds from shareholders' account - - - - Other Income 4 10 8 29 Segment F - Non Participating - Pension Group Variable : Net Premium 39,142 40,830 39,444 1,55,676 Income from Investments2 7,941 7,375 7,081 28,928 Transfer of Funds from shareholders' account 491 731 - 1,312 Other Income - - - - Segment G - Non Participating - Individual & Group Annuity : Net Premium 99,120 1,30,672 61,440 3,92,720 Income from Investments2 23,729 21,129 17,388 77,754 Transfer of Funds from shareholders' account - (1,147) - - Other Income 19 19 12 68 Segment H - Non Participating - Individual & Group Health : Net Premium 852 1,549 1,018 5,291 Income from Investments2 119 124 210 573 Transfer of Funds from shareholders' account - - - - Other Income 3 4 (1) 16 Segment I - Unit Linked - Individual Life : Net Premium 1,82,047 3,42,854 1,66,869 9,82,517 Income from Investments2 4,57,060 3,81,980 6,28,756 22,80,991 Transfer of Funds from shareholders' account - - - - Other Income 681 714 801 2,986 Segment J - Unit Linked - Individual Pension : Net Premium 8,092 16,881 9,990 51,797 Income from Investments2 36,867 24,284 71,663 2,26,325 Transfer of Funds from shareholders' account - - - - Other Income 2 3 1 7 Segment K - Unit Linked - Group Life : Net Premium 9,526 20,044 7,616 79,985 Income from Investments2 17,958 3,657 36,860 93,501 Transfer of Funds from shareholders' account - - - - Other Income - - - - Segment L - Unit Linked - Group Pension : Net Premium 1,162 1,767 1,590 7,930 Income from Investments2 3,047 763 6,655 17,027 Transfer of Funds from shareholders' account - - - - Other Income - - - -
B) Shareholders : Income from Investments2 27,887 28,969 11,371 69,358 Other Income 389 95 57 310
The joint statutory auditors have digitally signed this statement for identification purposes only and this Statement should be read in conjunction with review report dated July 19,2021.
Sr. No.
Three Months ended / As at
Consolidated Segment Reporting for the Quarter ended June 30, 2021
HDFC Life Insurance Company Limited
ALPA KEDIA
Digitally signed by ALPA KEDIA Date: 2021.07.19 13:02:46 +05'30'
Rajen Ratansi Ashar
Digitally signed by Rajen Ratansi Ashar Date: 2021.07.19 13:27:10 +05'30'
Year ended / As at June 30, 2021 March 31, 2021 June 30, 2020 March 31, 2021
(Unaudited) (Unaudited) Refer Note 8 (Unaudited) (Audited)
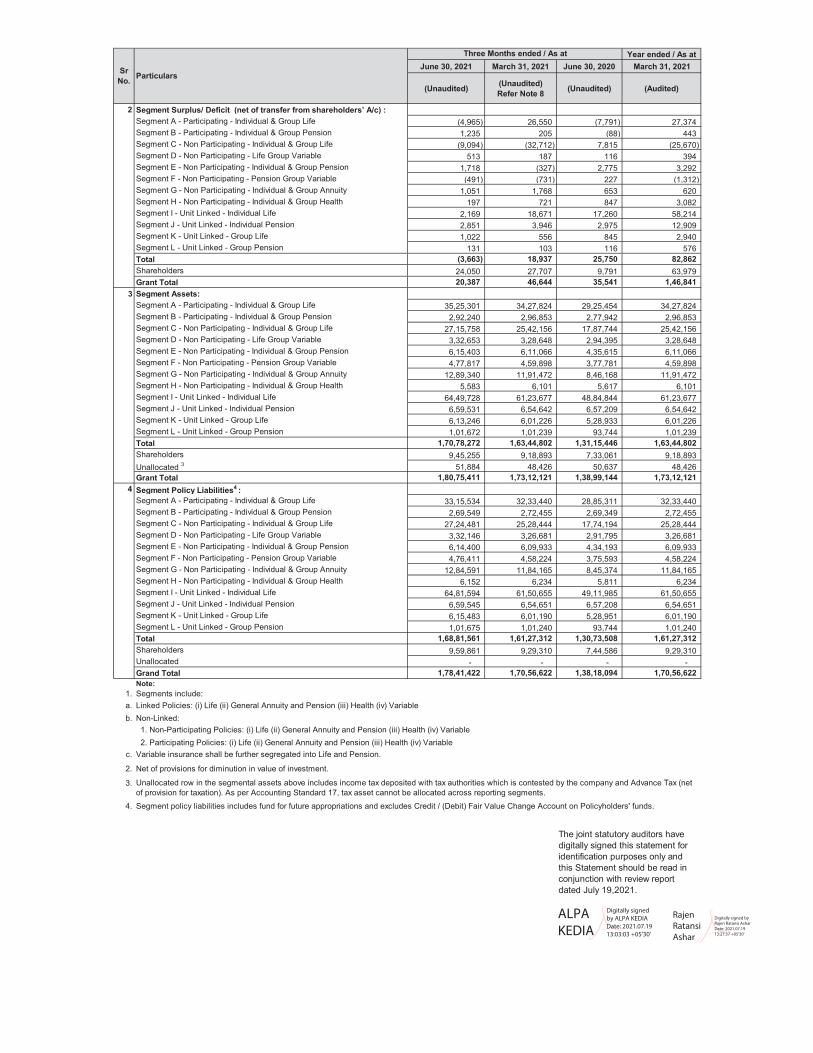
2 Segment Surplus/ Deficit (net of transfer from shareholders’ A/c) :Segment A - Participating - Individual & Group Life (4,965) 26,550 (7,791) 27,374 Segment B - Participating - Individual & Group Pension 1,235 205 (88) 443 Segment C - Non Participating - Individual & Group Life (9,094) (32,712) 7,815 (25,670) Segment D - Non Participating - Life Group Variable 513 187 116 394 Segment E - Non Participating - Individual & Group Pension 1,718 (327) 2,775 3,292 Segment F - Non Participating - Pension Group Variable (491) (731) 227 (1,312) Segment G - Non Participating - Individual & Group Annuity 1,051 1,768 653 620 Segment H - Non Participating - Individual & Group Health 197 721 847 3,082 Segment I - Unit Linked - Individual Life 2,169 18,671 17,260 58,214 Segment J - Unit Linked - Individual Pension 2,851 3,946 2,975 12,909 Segment K - Unit Linked - Group Life 1,022 556 845 2,940 Segment L - Unit Linked - Group Pension 131 103 116 576 Total (3,663) 18,937 25,750 82,862 Shareholders 24,050 27,707 9,791 63,979 Grant Total 20,387 46,644 35,541 1,46,841
3 Segment Assets:Segment A - Participating - Individual & Group Life 35,25,301 34,27,824 29,25,454 34,27,824 Segment B - Participating - Individual & Group Pension 2,92,240 2,96,853 2,77,942 2,96,853 Segment C - Non Participating - Individual & Group Life 27,15,758 25,42,156 17,87,744 25,42,156 Segment D - Non Participating - Life Group Variable 3,32,653 3,28,648 2,94,395 3,28,648 Segment E - Non Participating - Individual & Group Pension 6,15,403 6,11,066 4,35,615 6,11,066 Segment F - Non Participating - Pension Group Variable 4,77,817 4,59,898 3,77,781 4,59,898 Segment G - Non Participating - Individual & Group Annuity 12,89,340 11,91,472 8,46,168 11,91,472 Segment H - Non Participating - Individual & Group Health 5,583 6,101 5,617 6,101 Segment I - Unit Linked - Individual Life 64,49,728 61,23,677 48,84,844 61,23,677 Segment J - Unit Linked - Individual Pension 6,59,531 6,54,642 6,57,209 6,54,642 Segment K - Unit Linked - Group Life 6,13,246 6,01,226 5,28,933 6,01,226 Segment L - Unit Linked - Group Pension 1,01,672 1,01,239 93,744 1,01,239 Total 1,70,78,272 1,63,44,802 1,31,15,446 1,63,44,802 Shareholders 9,45,255 9,18,893 7,33,061 9,18,893 Unallocated 3 51,884 48,426 50,637 48,426 Grant Total 1,80,75,411 1,73,12,121 1,38,99,144 1,73,12,121
4 Segment Policy Liabilities4 : Segment A - Participating - Individual & Group Life 33,15,534 32,33,440 28,85,311 32,33,440 Segment B - Participating - Individual & Group Pension 2,69,549 2,72,455 2,69,349 2,72,455 Segment C - Non Participating - Individual & Group Life 27,24,481 25,28,444 17,74,194 25,28,444 Segment D - Non Participating - Life Group Variable 3,32,146 3,26,681 2,91,795 3,26,681 Segment E - Non Participating - Individual & Group Pension 6,14,400 6,09,933 4,34,193 6,09,933 Segment F - Non Participating - Pension Group Variable 4,76,411 4,58,224 3,75,593 4,58,224 Segment G - Non Participating - Individual & Group Annuity 12,84,591 11,84,165 8,45,374 11,84,165 Segment H - Non Participating - Individual & Group Health 6,152 6,234 5,811 6,234 Segment I - Unit Linked - Individual Life 64,81,594 61,50,655 49,11,985 61,50,655 Segment J - Unit Linked - Individual Pension 6,59,545 6,54,651 6,57,208 6,54,651 Segment K - Unit Linked - Group Life 6,15,483 6,01,190 5,28,951 6,01,190 Segment L - Unit Linked - Group Pension 1,01,675 1,01,240 93,744 1,01,240 Total 1,68,81,561 1,61,27,312 1,30,73,508 1,61,27,312 Shareholders 9,59,861 9,29,310 7,44,586 9,29,310 Unallocated - - - - Grand Total 1,78,41,422 1,70,56,622 1,38,18,094 1,70,56,622 Note:
1. Segments include:a. Linked Policies: (i) Life (ii) General Annuity and Pension (iii) Health (iv) Variableb. Non-Linked:
2. Participating Policies: (i) Life (ii) General Annuity and Pension (iii) Health (iv) Variablec. Variable insurance shall be further segregated into Life and Pension.
2. Net of provisions for diminution in value of investment.
3.
4. Segment policy liabilities includes fund for future appropriations and excludes Credit / (Debit) Fair Value Change Account on Policyholders' funds.
Unallocated row in the segmental assets above includes income tax deposited with tax authorities which is contested by the company and Advance Tax (net of provision for taxation). As per Accounting Standard 17, tax asset cannot be allocated across reporting segments.
1. Non-Participating Policies: (i) Life (ii) General Annuity and Pension (iii) Health (iv) Variable
Particulars
The joint statutory auditors have digitally signed this statement for identification purposes only and this Statement should be read in conjunction with review report dated July 19,2021.
Sr No.
Three Months ended / As at
ALPA KEDIA
Digitally signed by ALPA KEDIA Date: 2021.07.19 13:03:03 +05'30'
Rajen Ratansi Ashar
Digitally signed by Rajen Ratansi Ashar Date: 2021.07.19 13:27:37 +05'30'
Other disclosures :Status of Shareholders Complaints for the quarter ended June 30, 2021
Sr No. Particulars Number of Complaints
1 Investor complaints pending at the begining of the quarter 12 Investor complaints received during the quarter ended June 30, 2021 NIL3 Investor complaints disposed of during the quarter ended June 30, 2021 14 Investor complaints remaining unresolved as on June 30, 2021 NIL
HDFC Life Insurance Company Limited
Notes:
MumbaiJuly 19,2021
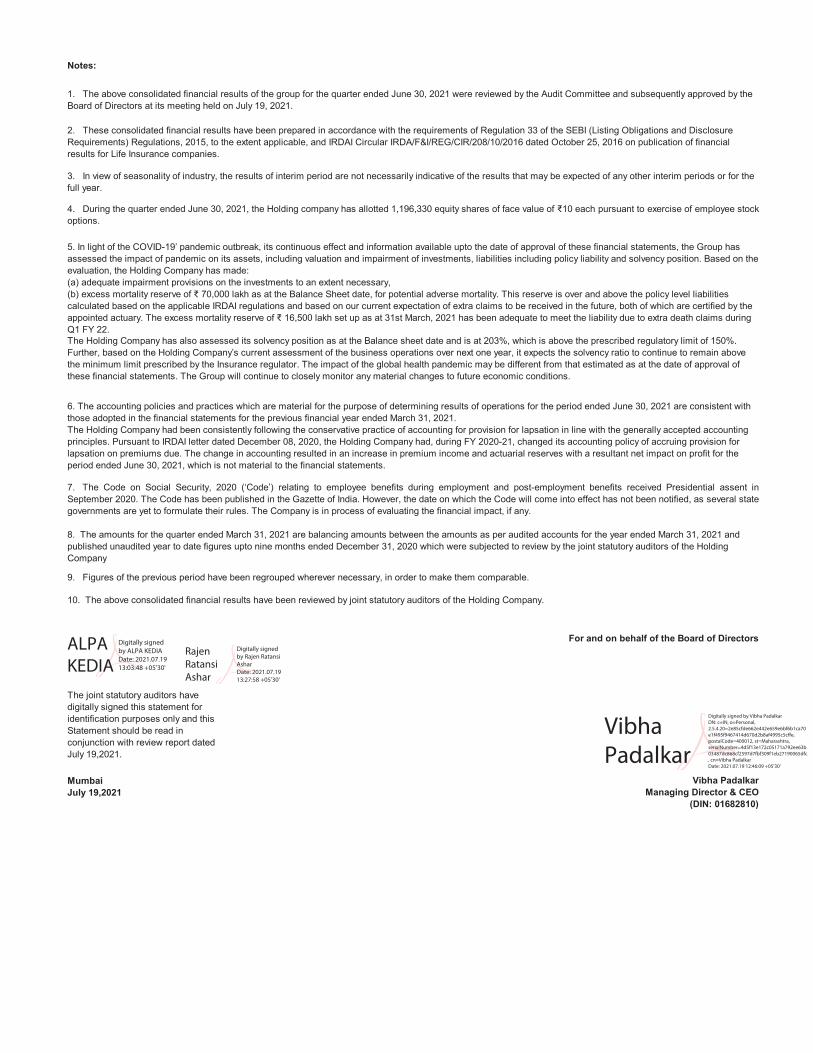
6. The accounting policies and practices which are material for the purpose of determining results of operations for the period ended June 30, 2021 are consistent with those adopted in the financial statements for the previous financial year ended March 31, 2021.The Holding Company had been consistently following the conservative practice of accounting for provision for lapsation in line with the generally accepted accounting principles. Pursuant to IRDAI letter dated December 08, 2020, the Holding Company had, during FY 2020-21, changed its accounting policy of accruing provision for lapsation on premiums due. The change in accounting resulted in an increase in premium income and actuarial reserves with a resultant net impact on profit for the period ended June 30, 2021, which is not material to the financial statements.
The Holding Company has also assessed its solvency position as at the Balance sheet date and is at 203%, which is above the prescribed regulatory limit of 150%. Further, based on the Holding Company’s current assessment of the business operations over next one year, it expects the solvency ratio to continue to remain above the minimum limit prescribed by the Insurance regulator. The impact of the global health pandemic may be different from that estimated as at the date of approval of these financial statements. The Group will continue to closely monitor any material changes to future economic conditions.
5. In light of the COVID-19’ pandemic outbreak, its continuous effect and information available upto the date of approval of these financial statements, the Group has assessed the impact of pandemic on its assets, including valuation and impairment of investments, liabilities including policy liability and solvency position. Based on the evaluation, the Holding Company has made: (a) adequate impairment provisions on the investments to an extent necessary, (b) excess mortality reserve of ₹ 70,000 lakh as at the Balance Sheet date, for potential adverse mortality. This reserve is over and above the policy level liabilities calculated based on the applicable IRDAI regulations and based on our current expectation of extra claims to be received in the future, both of which are certified by the appointed actuary. The excess mortality reserve of ₹ 16,500 lakh set up as at 31st March, 2021 has been adequate to meet the liability due to extra death claims during Q1 FY 22.
1. The above consolidated financial results of the group for the quarter ended June 30, 2021 were reviewed by the Audit Committee and subsequently approved by the Board of Directors at its meeting held on July 19, 2021.
2. These consolidated financial results have been prepared in accordance with the requirements of Regulation 33 of the SEBI (Listing Obligations and Disclosure Requirements) Regulations, 2015, to the extent applicable, and IRDAI Circular IRDA/F&I/REG/CIR/208/10/2016 dated October 25, 2016 on publication of financial results for Life Insurance companies.
3. In view of seasonality of industry, the results of interim period are not necessarily indicative of the results that may be expected of any other interim periods or for the full year.
4. During the quarter ended June 30, 2021, the Holding company has allotted 1,196,330 equity shares of face value of ₹10 each pursuant to exercise of employee stockoptions.
7. The Code on Social Security, 2020 (‘Code’) relating to employee benefits during employment and post-employment benefits received Presidential assent inSeptember 2020. The Code has been published in the Gazette of India. However, the date on which the Code will come into effect has not been notified, as several stategovernments are yet to formulate their rules. The Company is in process of evaluating the financial impact, if any.
(DIN: 01682810)
9. Figures of the previous period have been regrouped wherever necessary, in order to make them comparable.
10. The above consolidated financial results have been reviewed by joint statutory auditors of the Holding Company.
For and on behalf of the Board of Directors
Vibha PadalkarManaging Director & CEO
The joint statutory auditors have digitally signed this statement for identification purposes only and this Statement should be read in conjunction with review report dated July 19,2021.
8. The amounts for the quarter ended March 31, 2021 are balancing amounts between the amounts as per audited accounts for the year ended March 31, 2021 and published unaudited year to date figures upto nine months ended December 31, 2020 which were subjected to review by the joint statutory auditors of the Holding Company
Vibha Padalkar
Digitally signed by Vibha Padalkar DN: c=IN, o=Personal, 2.5.4.20=2e85cfde662e442e659e6bf6b1ca70e1f495f9467414d670d2b8af4995c5cffe, postalCode=400012, st=Maharashtra, serialNumber=4d5f13e172c05171a792ee63b03487dc868cf2597d7fbf309f1eb27190065dfc, cn=Vibha Padalkar Date: 2021.07.19 12:46:09 +05'30'
ALPA KEDIA
Digitally signed by ALPA KEDIA Date: 2021.07.19 13:03:48 +05'30'
Rajen Ratansi Ashar
Digitally signed by Rajen Ratansi Ashar Date: 2021.07.19 13:27:58 +05'30'
1
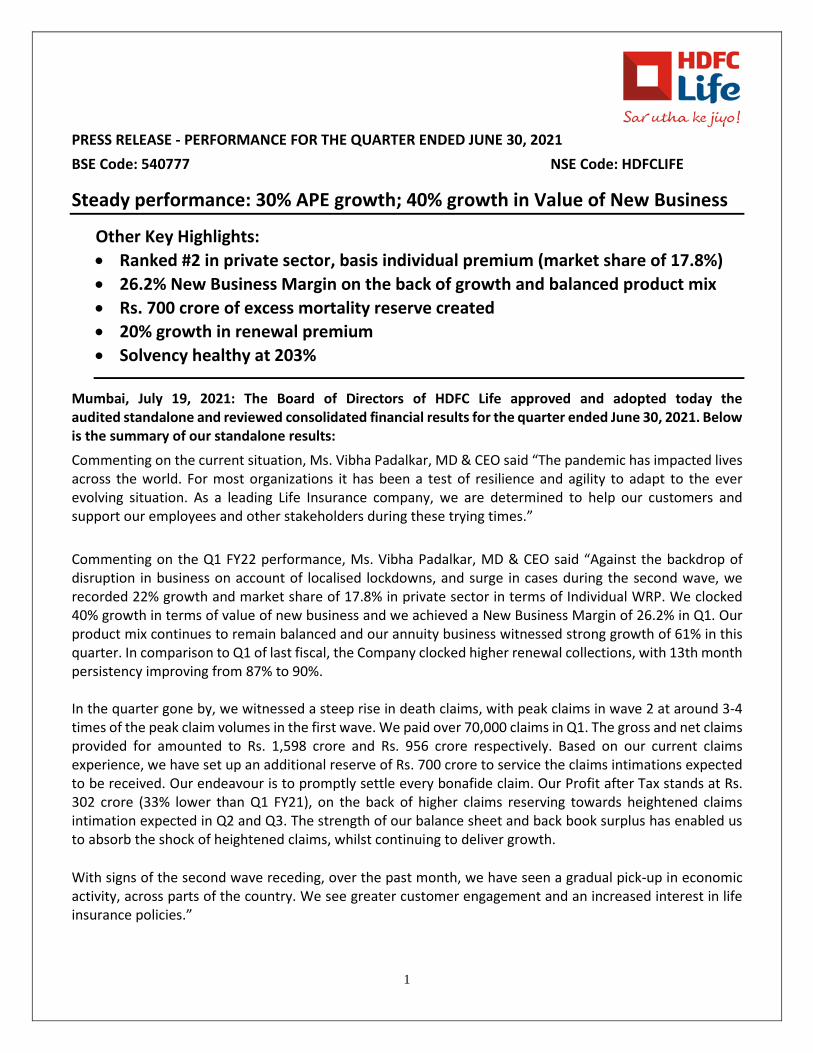
PRESS RELEASE - PERFORMANCE FOR THE QUARTER ENDED JUNE 30, 2021
BSE Code: 540777 NSE Code: HDFCLIFE
Steady performance: 30% APE growth; 40% growth in Value of New Business
Other Key Highlights: • Ranked #2 in private sector, basis individual premium (market share of 17.8%) • 26.2% New Business Margin on the back of growth and balanced product mix • Rs. 700 crore of excess mortality reserve created • 20% growth in renewal premium • Solvency healthy at 203%
Mumbai, July 19, 2021: The Board of Directors of HDFC Life approved and adopted today the audited standalone and reviewed consolidated financial results for the quarter ended June 30, 2021. Below is the summary of our standalone results:
Commenting on the current situation, Ms. Vibha Padalkar, MD & CEO said “The pandemic has impacted lives across the world. For most organizations it has been a test of resilience and agility to adapt to the ever evolving situation. As a leading Life Insurance company, we are determined to help our customers and support our employees and other stakeholders during these trying times.”
Commenting on the Q1 FY22 performance, Ms. Vibha Padalkar, MD & CEO said “Against the backdrop of disruption in business on account of localised lockdowns, and surge in cases during the second wave, we recorded 22% growth and market share of 17.8% in private sector in terms of Individual WRP. We clocked 40% growth in terms of value of new business and we achieved a New Business Margin of 26.2% in Q1. Our product mix continues to remain balanced and our annuity business witnessed strong growth of 61% in this quarter. In comparison to Q1 of last fiscal, the Company clocked higher renewal collections, with 13th month persistency improving from 87% to 90%. In the quarter gone by, we witnessed a steep rise in death claims, with peak claims in wave 2 at around 3-4 times of the peak claim volumes in the first wave. We paid over 70,000 claims in Q1. The gross and net claims provided for amounted to Rs. 1,598 crore and Rs. 956 crore respectively. Based on our current claims experience, we have set up an additional reserve of Rs. 700 crore to service the claims intimations expected to be received. Our endeavour is to promptly settle every bonafide claim. Our Profit after Tax stands at Rs. 302 crore (33% lower than Q1 FY21), on the back of higher claims reserving towards heightened claims intimation expected in Q2 and Q3. The strength of our balance sheet and back book surplus has enabled us to absorb the shock of heightened claims, whilst continuing to deliver growth. With signs of the second wave receding, over the past month, we have seen a gradual pick-up in economic activity, across parts of the country. We see greater customer engagement and an increased interest in life insurance policies.”
2
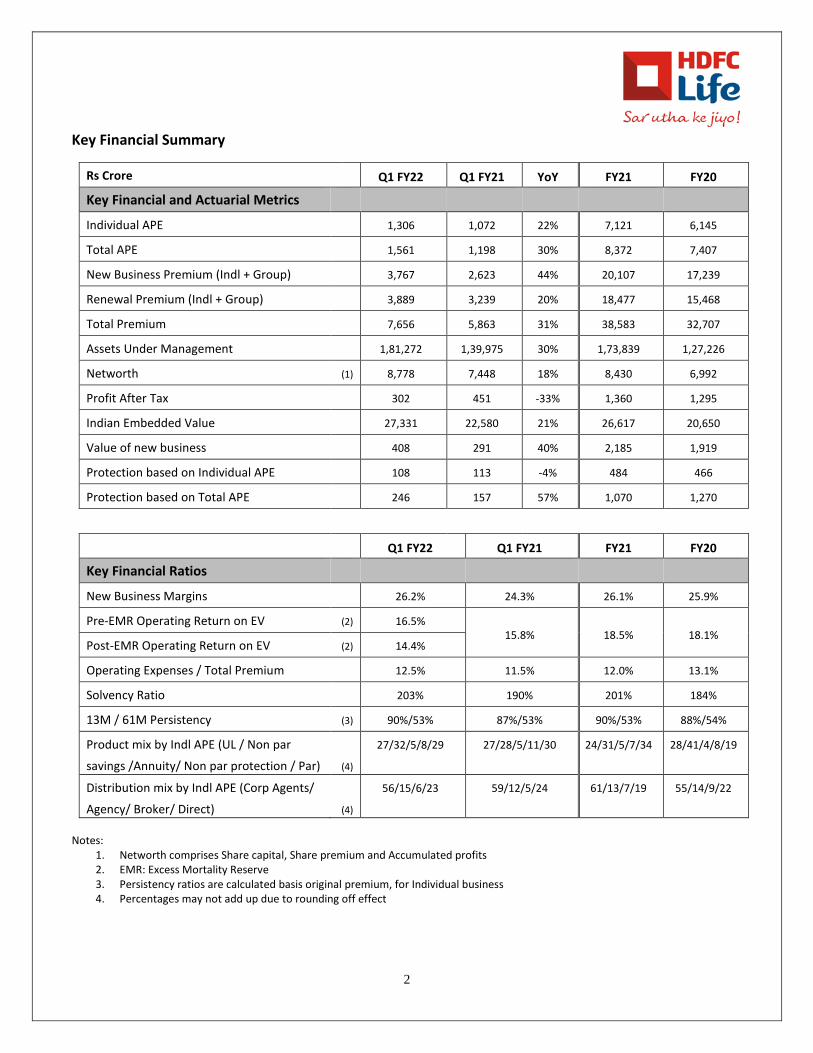
Key Financial Summary
Rs Crore Q1 FY22 Q1 FY21 YoY FY21 FY20
Key Financial and Actuarial Metrics
Individual APE 1,306 1,072 22% 7,121 6,145
Total APE 1,561 1,198 30% 8,372 7,407
New Business Premium (Indl + Group) 3,767 2,623 44% 20,107 17,239
Renewal Premium (Indl + Group) 3,889 3,239 20% 18,477 15,468
Total Premium 7,656 5,863 31% 38,583 32,707
Assets Under Management 1,81,272 1,39,975 30% 1,73,839 1,27,226
Networth (1) 8,778 7,448 18% 8,430 6,992
Profit After Tax 302 451 -33% 1,360 1,295
Indian Embedded Value 27,331 22,580 21% 26,617 20,650
Value of new business 408 291 40% 2,185 1,919
Protection based on Individual APE 108 113 -4% 484 466
Protection based on Total APE 246 157 57% 1,070 1,270
Q1 FY22 Q1 FY21 FY21 FY20
Key Financial Ratios
New Business Margins 26.2% 24.3% 26.1% 25.9%
Pre-EMR Operating Return on EV (2) 16.5% 15.8% 18.5% 18.1%
Post-EMR Operating Return on EV (2) 14.4%
Operating Expenses / Total Premium 12.5% 11.5% 12.0% 13.1%
Solvency Ratio 203% 190% 201% 184%
13M / 61M Persistency (3) 90%/53% 87%/53% 90%/53% 88%/54%
Product mix by Indl APE (UL / Non par
savings /Annuity/ Non par protection / Par) (4)
27/32/5/8/29 27/28/5/11/30 24/31/5/7/34 28/41/4/8/19
Distribution mix by Indl APE (Corp Agents/
Agency/ Broker/ Direct) (4)
56/15/6/23 59/12/5/24 61/13/7/19 55/14/9/22
Notes:
1. Networth comprises Share capital, Share premium and Accumulated profits 2. EMR: Excess Mortality Reserve 3. Persistency ratios are calculated basis original premium, for Individual business 4. Percentages may not add up due to rounding off effect

3
Other key highlights for the year ending June 30, 2021:
• Overall Market Share: Ranked #1 in terms of Overall New Business Premium in private sector with market share expanding by 160 bps from 20.7% to 22.3%. Our share within the group and individual new business segment stood at 25.9% and 17.8% respectively
• Product Portfolio: We continue to maintain a balanced product mix with share of participating
savings, non participating savings, ULIPs, protection and annuity accounted for 29%, 32%, 27%, 8% and 5% of Individual APE respectively. Our focus on the protection segment resulted in 57% growth basis overall APE
• Distribution Mix: Our diversified distribution mix is evidenced by the wide access to our customers
with nearly 300 partners and 1 lakh+ agents as on June 30, 2021. This is further supplemented by our 390 branches spread across the country
• Assets Under Management: As on June 30, 2021, our AUM was Rs. 1.8 lakh Cr. (Debt:Equity mix –
63:37); over 98% of debt investments were in G-Secs and AAA bonds as on June 30, 2021
Definitions and abbreviations
• Annualized Premium Equivalent (APE) - The sum of annualized first year regular premiums and 10% weighted single premiums and single premium top-ups
• Assets under Management (AUM) - The total value of Shareholders’ & Policyholders’ investments managed by the insurance company
• Embedded Value Operating Profit (EVOP) - Embedded Value Operating Profit (“EVOP”) is a measure of the increase in the EV during any given period, excluding the impact on EV due to external factors like changes in economic variables and shareholder-related actions like capital injection or dividend pay-outs
• First year premium - Premiums due in the first policy year of regular premiums received during the financial year. For example, for a monthly mode policy sold in March 2021, the first monthly instalment received would be reflected as First year premiums for 2020-21 and the remaining 11 instalments due in the first policy year would be reflected as first year premiums in 2021-22, when received
• New business received premium - The sum of first year premium and single premium, reflecting the total premiums received from the new business written
• Operating expense - It includes all expenses that are incurred for the purposes of sourcing new business and expenses incurred for policy servicing (which are known as maintenance costs) including shareholders’ expenses. It does not include commission
• Operating expense ratio - Ratio of operating expense (including shareholders’ expenses) to total premium

4
• Operating return on EV - Operating Return on EV is the ratio of EVOP (Embedded Value Operating Profit) for any given period to the EV at the beginning of that period
• Persistency - The proportion of business renewed from the business underwritten. The ratio is measured in terms of number of policies and premiums underwritten
• Premium less benefits payouts - The difference between total premium received and benefits paid (gross of reinsurance)
• Renewal premium - Regular recurring premiums received after the first policy year
• Solvency ratio - Ratio of available solvency margin to required solvency margin
• Total premium - Total received premiums during the year including first year, single and renewal premiums for individual and group business
• Weighted received premium (WRP) - The sum of first year premium received during the year and 10% of single premiums including top-up premiums
About HDFC Life
HDFC Life Insurance Company Limited ('HDFC Life' / ‘Company’) is a joint venture between HDFC Ltd., India’s leading housing finance institution and Standard Life Aberdeen, a global investment company.
Established in 2000, HDFC Life is a leading long-term life insurance solutions provider in India, offering a range of individual and group insurance solutions that meet various customer needs such as Protection, Pension, Savings, Investment, Annuity and Health. As on June 30, 2021, the Company had 37 individual and 13 group products in its portfolio, along with 7 optional rider benefits, catering to a diverse range of customer needs.
HDFC Life continues to benefit from its increased presence across the country having a wide reach with 390 branches and additional distribution touch-points through several new tie-ups and partnerships. The count of our partnerships is around 300, comprising traditional partners such as NBFCs, MFIs and SFBs, and including new-ecosystem partners. The Company has a strong base of financial consultants.
For more information, please visit our website, www.hdfclife.com. You may also connect with us on Facebook, Twitter, YouTube and LinkedIn.

5
Disclaimer
Except for the historical information contained herein, statements in this release which contain words or phrases such as 'will', 'would', ‘indicating’, ‘expected to’ etc., and similar expressions or variations of such expressions may constitute 'forward-looking statements'. These forward-looking statements involve a number of risks, uncertainties and other factors that could cause actual results to differ materially from those suggested by the forward-looking statements. These risks and uncertainties include, but are not limited to our ability to successfully implement our strategy, our growth and expansion in business, the impact of any acquisitions, technological implementation and changes, the actual growth in demand for insurance products and services, investment income, cashflow projections, our exposure to market risks, policies and actions of regulatory authorities; impact of competition; experience with regard to mortality and morbidity trends, lapse rates and policy renewal rates; the impact of changes in capital , solvency or accounting standards , tax and other legislations and regulations in the jurisdictions as well as other risks detailed in the reports filed by HDFC Limited, our holding company, with the United States Securities and Exchange Commission. HDFC Life undertakes no obligation to update forward-looking statements to reflect events or circumstances after the date thereof. None of Company or any of its directors, officers, employees, agents or advisers, or any of their respective affiliates, advisers or representatives, undertake to update or revise any forward-looking statements, whether as a result of new information, future events or otherwise and none of them shall have any liability (in negligence or otherwise) for any loss howsoever arising from any use of this press release or its contents or otherwise arising in connection. Further, nothing in this press release should be construed as constituting legal, business, tax or financial advice or a recommendation regarding the securities. Although Company believes that such forward-looking statements are based on reasonable assumptions, it can give no assurance that such expectations will be met. You are cautioned not to place undue reliance on these forward-looking statements, which are based on current view of Company’s management on future events. Forecasts and hypothetical examples are subject to uncertainty and contingencies outside Company’s control. Past performance is not a reliable indication of future performance. Before acting on any information you should consider the appropriateness of the information having regard to these matters, and in particular, you should seek independent financial advice.

Investor Presentation – Q1 FY22
2
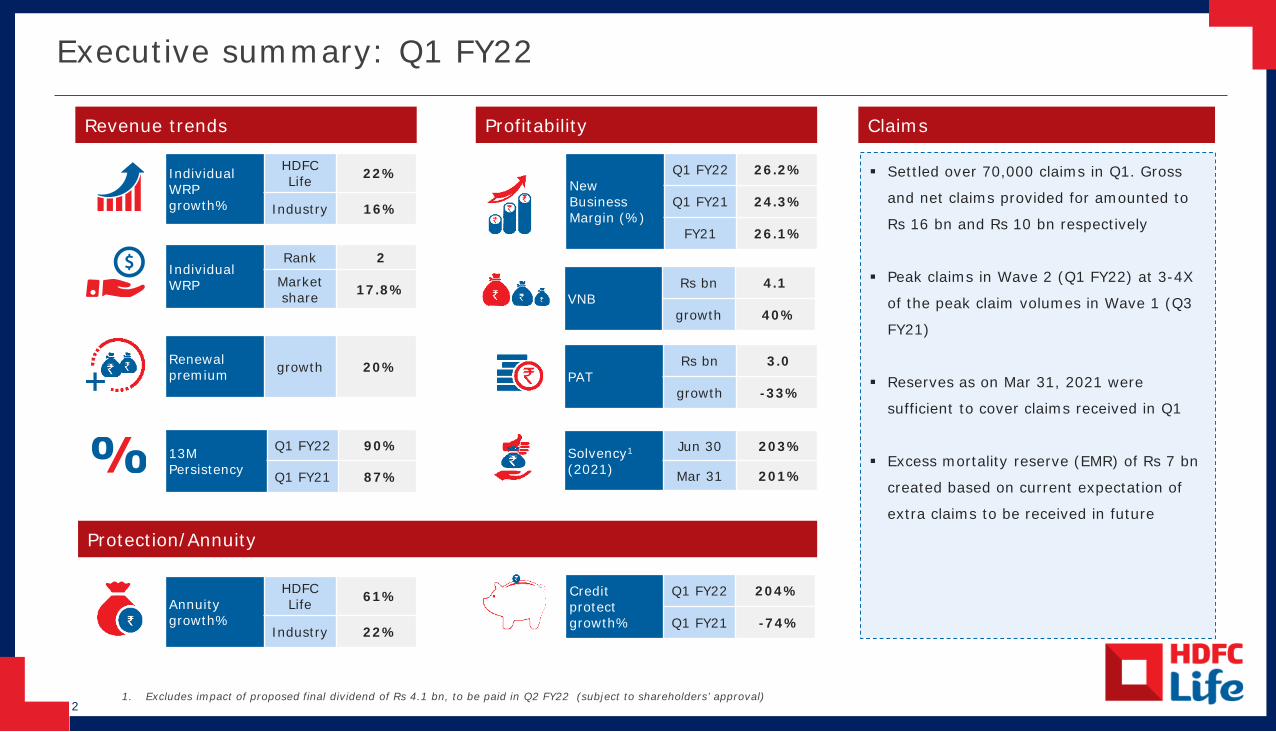
Executive summary: Q1 FY22
1. Excludes impact of proposed final dividend of Rs 4.1 bn, to be paid in Q2 FY22 (subject to shareholders’ approval)
Revenue trends
Individual WRP
Rank 2
Marketshare 17.8%
Renewal premium growth 20%
13M Persistency
Q1 FY22 90%
Q1 FY21 87%
Individual WRP growth%
HDFC Life 22%
Industry 16%
Protection/Annuity
Annuity growth%
HDFC Life 61%
Industry 22%
Profitability
VNBRs bn 4.1
growth 40%
New Business Margin (%)
Q1 FY22 26.2%
Q1 FY21 24.3%
FY21 26.1%
PAT Rs bn 3.0
growth -33%
Solvency1
(2021)
Jun 30 203%
Mar 31 201%
Settled over 70,000 claims in Q1. Gross
and net claims provided for amounted to
Rs 16 bn and Rs 10 bn respectively
Peak claims in Wave 2 (Q1 FY22) at 3-4X
of the peak claim volumes in Wave 1 (Q3
FY21)
Reserves as on Mar 31, 2021 were
sufficient to cover claims received in Q1
Excess mortality reserve (EMR) of Rs 7 bn
created based on current expectation of
extra claims to be received in future
Creditprotectgrowth%
Q1 FY22 204%
Q1 FY21 -74%
Claims

Page 3
Agenda
1
2
3
4
5
Performance Snapshot
Managing Covid-19
Annexures
6
Our Strategy
Customer Centricity
India Life Insurance

Page 4
Performance Snapshot
Performance Snapshot
Our Strategy
Annexures
India Life Insurance
Managing Covid-19
Customer Centricity
1
5
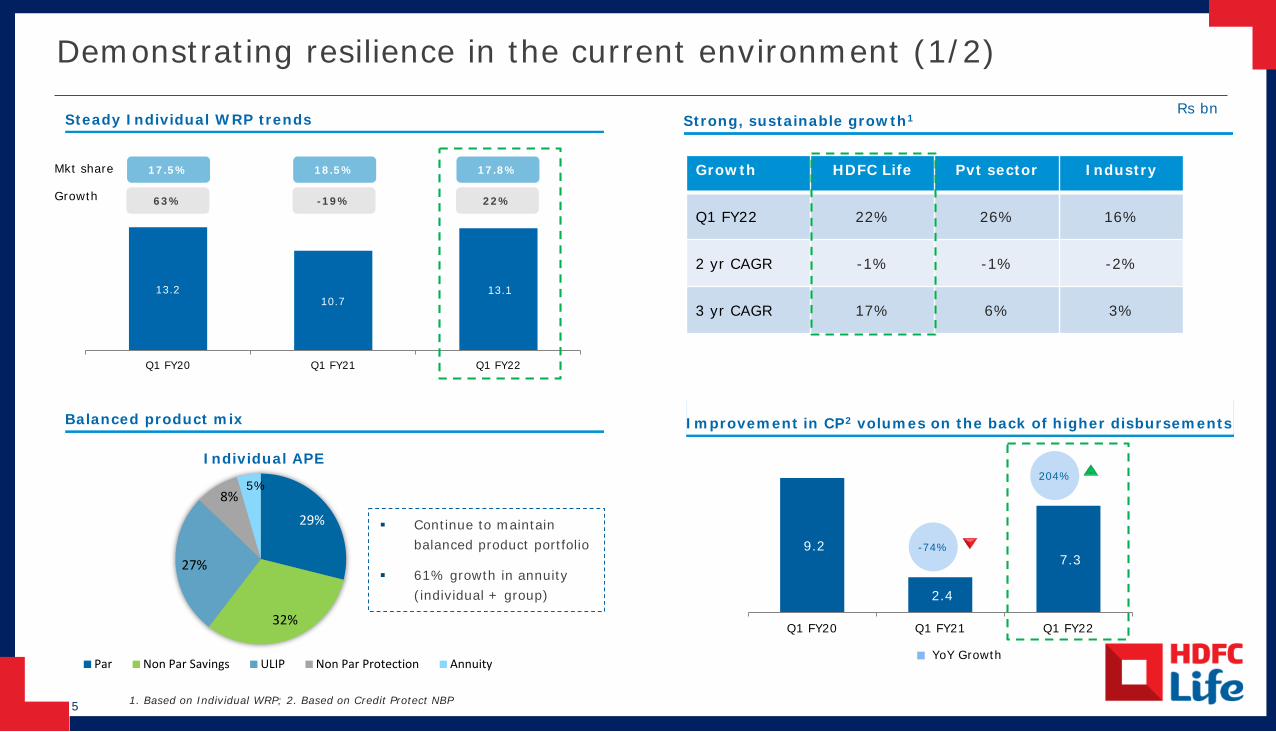
Demonstrating resilience in the current environment (1/2)
Strong, sustainable growth1
Balanced product mix Improvement in CP2 volumes on the back of higher disbursements
Rs bn
13.210.7
13.1
Q1 FY20 Q1 FY21 Q1 FY22
29%
32%
27%
8%
Individual APE
Par Non Par Savings ULIP Non Par Protection Annuity
9.2
2.4
7.3
Q1 FY20 Q1 FY21 Q1 FY22
1. Based on Individual WRP; 2. Based on Credit Protect NBP
Growth HDFC Life Pvt sector Industry
Q1 FY22 22% 26% 16%
2 yr CAGR -1% -1% -2%
3 yr CAGR 17% 6% 3%
Continue to maintain balanced product portfolio
61% growth in annuity(individual + group)
Steady Individual WRP trends
Growth
5%
YoY Growth
204%
63% -19% 22%
17.5% 18.5% 17.8%Mkt share
-74%

6
64% 55% 61% 56%
19%22% 19% 23%
13%14% 13% 15%
4% 9% 7% 6%
FY19 FY20 FY21 Q1 FY22
Bancassurance Direct Agency Brokers and others
_
Focus on diversified channel mix1
Healthy solvency position
Rs bn
1. Basis Individual APE2. Excludes impact of proposed final dividend of Rs 4.1 bn, to be paid in Q2 FY22 (subject to shareholders’ approval)
Profitable growth
190%201% 203%
Jun 30,2020
Mar 31,2021
Jun 30,2021
Solvency margin2
Strong growth in renewal premium
Improvement in overall persistency
32.438.9
Q1 FY21 Q1 FY22
20%
24.3%
26.1% 26.2%
Q1 FY21 12M FY21 Q1 FY22
New business margin
Maintained stable solvency ratio
VNB Growth
40%
VNB growth of 40% on the back of higher volumes and balanced product mix
Demonstrating resilience in the current environment (2/2)

Page 7
Our Strategy
Performance Snapshot
Our Strategy
Annexures
India Life Insurance
Managing Covid-19
Customer Centricity
2

8
Key elements of our strategy
“Our continuous focus on technology and customer-centricity has enabled us to maintain business continuity even through the second wave of Covid-19”
Focus on profitable growth
Ensuring sustainable and
profitable growth by identifying and tapping new profit
pools
1
Diversified distribution mix
Developing multiple channels of growth to drive need-based
selling
2
Market-leading innovation
Creating new product
propositions to cater to the
changing customer behaviour and needs
3
Reimagining insurance
Market-leading digital capabilities
that put the customer first, shaping the
insurance operating model of tomorrow
4
Quality of Board and management
Seasoned leadership guided by an independent
and competent Board; No secondees
from group companies
5
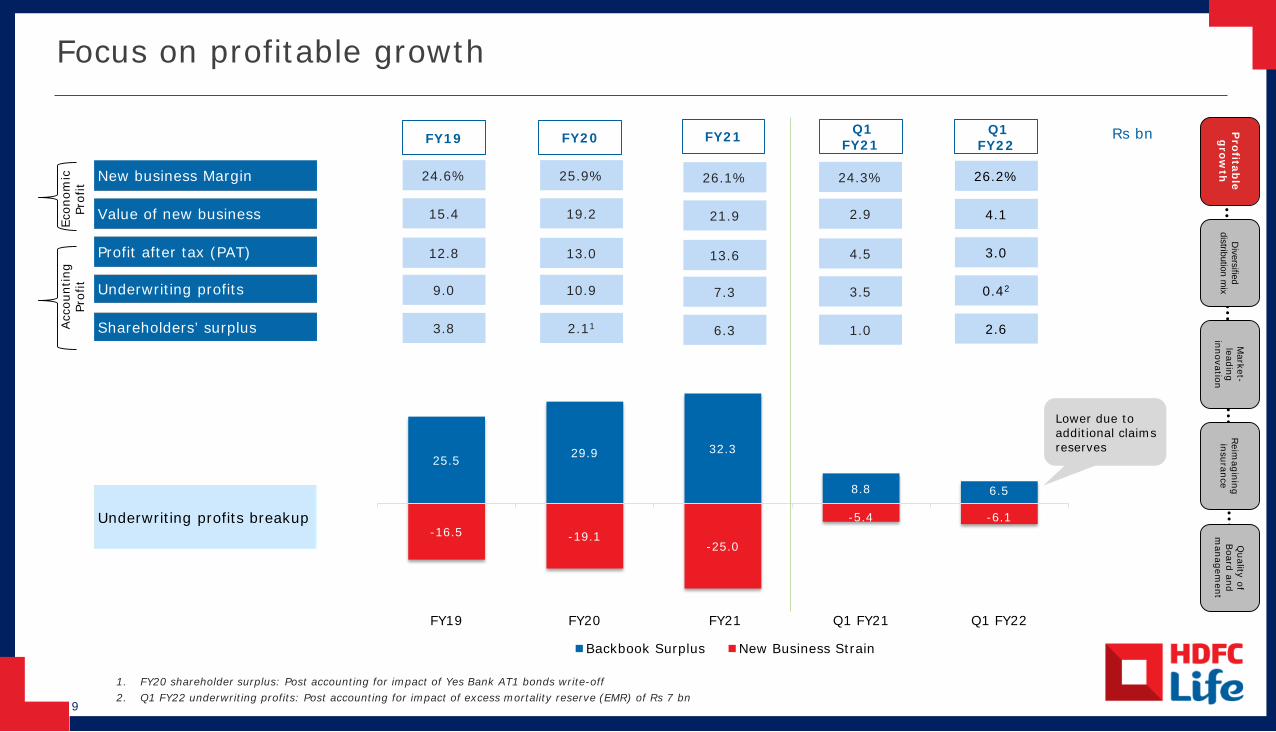
9
Focus on profitable growth
Rs bn
Underwriting profits breakup
12.8
3.8
9.0
24.6%
FY19 FY20
15.4
Profit after tax (PAT)
Shareholders’ surplus
Underwriting profits
New business Margin
Value of new business
Profitab
le g
rowth
Diversified
distribution mix
Market-
leading innovation
Reim
agining insurance
Quality of
Board and
managem
entEc
onom
ic
Prof
itAcc
ount
ing
Prof
it
13.0
2.11
10.9
25.9%
FY21
19.2
4.5
1.0
3.5
24.3%
Q1 FY21
2.9
25.5 29.9 32.3
8.8 6.5
-16.5 -19.1-25.0
-5.4 -6.1
FY19 FY20 FY21 Q1 FY21 Q1 FY22
Backbook Surplus New Business Strain
1. FY20 shareholder surplus: Post accounting for impact of Yes Bank AT1 bonds write-off2. Q1 FY22 underwriting profits: Post accounting for impact of excess mortality reserve (EMR) of Rs 7 bn
3.0
2.6
0.42
26.2%
Q1 FY22
4.1
13.6
6.3
7.3
26.1%
21.9
Lower due to additional claims reserves
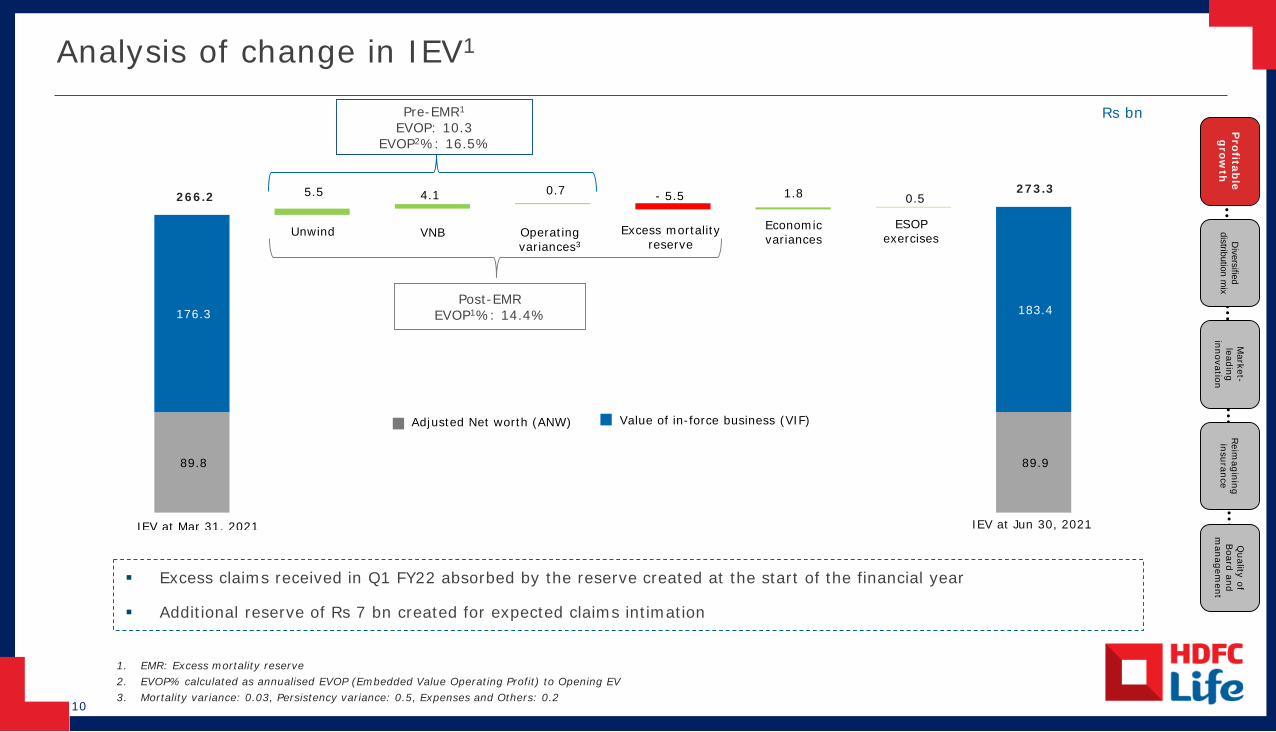
10
89.8 89.9
176.3
5.5 4.1 0.7 - 5.5 1.8 0.5
183.4
IEV at Jun 30, 2021IEV at Mar 31, 2021
Unwind Operating variances3
Economic variances
Excess mortality reserve
ESOP exercisesVNB
Analysis of change in IEV1
1. EMR: Excess mortality reserve2. EVOP% calculated as annualised EVOP (Embedded Value Operating Profit) to Opening EV3. Mortality variance: 0.03, Persistency variance: 0.5, Expenses and Others: 0.2
Excess claims received in Q1 FY22 absorbed by the reserve created at the start of the financial year
Additional reserve of Rs 7 bn created for expected claims intimation
Rs bn
Profitab
le g
rowth
Diversified
distribution mix
Market-
leading innovation
Reim
agining insurance
Quality of
Board and
managem
ent
Pre-EMR1
EVOP: 10.3EVOP2%: 16.5%
Value of in-force business (VIF)Adjusted Net worth (ANW)
Post-EMREVOP1%: 14.4%
266.2273.3
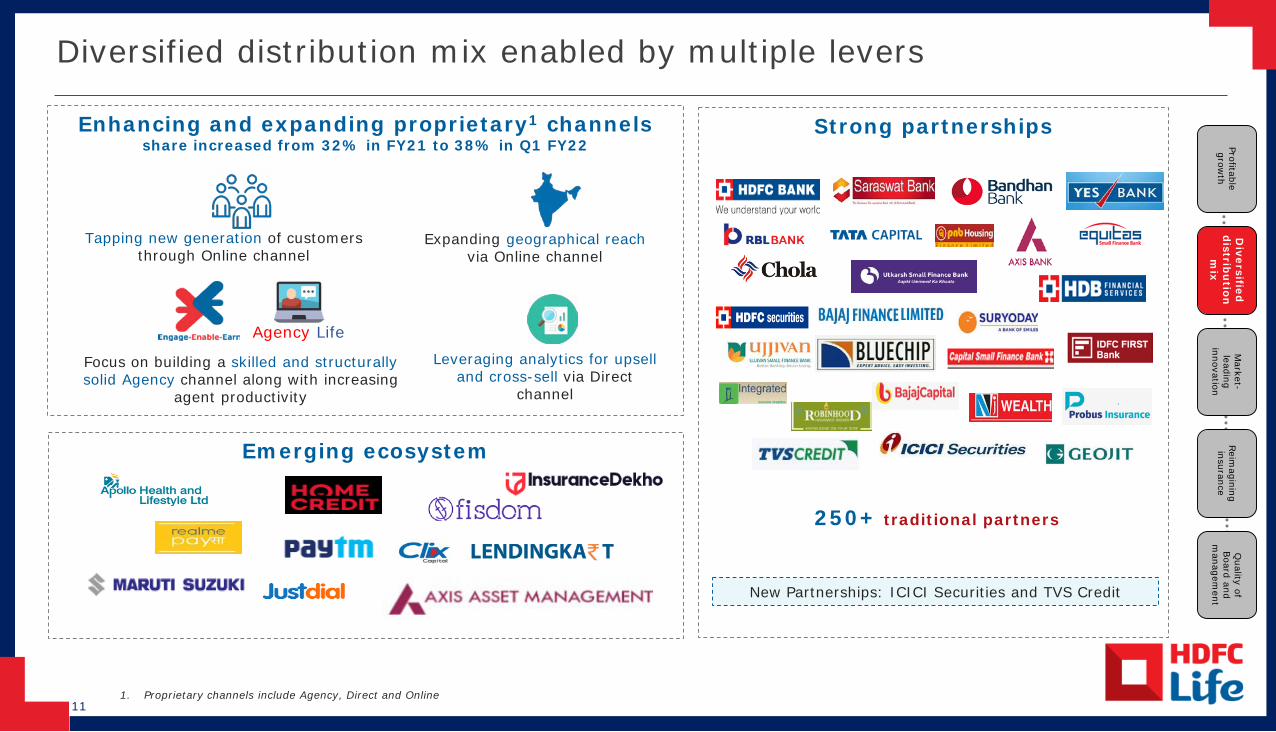
11
Diversified distribution mix enabled by multiple levers
1. Proprietary channels include Agency, Direct and Online
Profitable grow
th
Diversified
d
istribu
tion
mix
Market-
leading innovation
Reim
agining insurance
Quality of
Board and
managem
ent
Enhancing and expanding proprietary1 channelsshare increased from 32% in FY21 to 38% in Q1 FY22
Strong partnerships
Tapping new generation of customers through Online channel
Expanding geographical reach via Online channel
Focus on building a skilled and structurally solid Agency channel along with increasing
agent productivity
Emerging ecosystem
250+ traditional partners
Leveraging analytics for upsell and cross-sell via Direct
channel
New Partnerships: ICICI Securities and TVS Credit
Agency Life
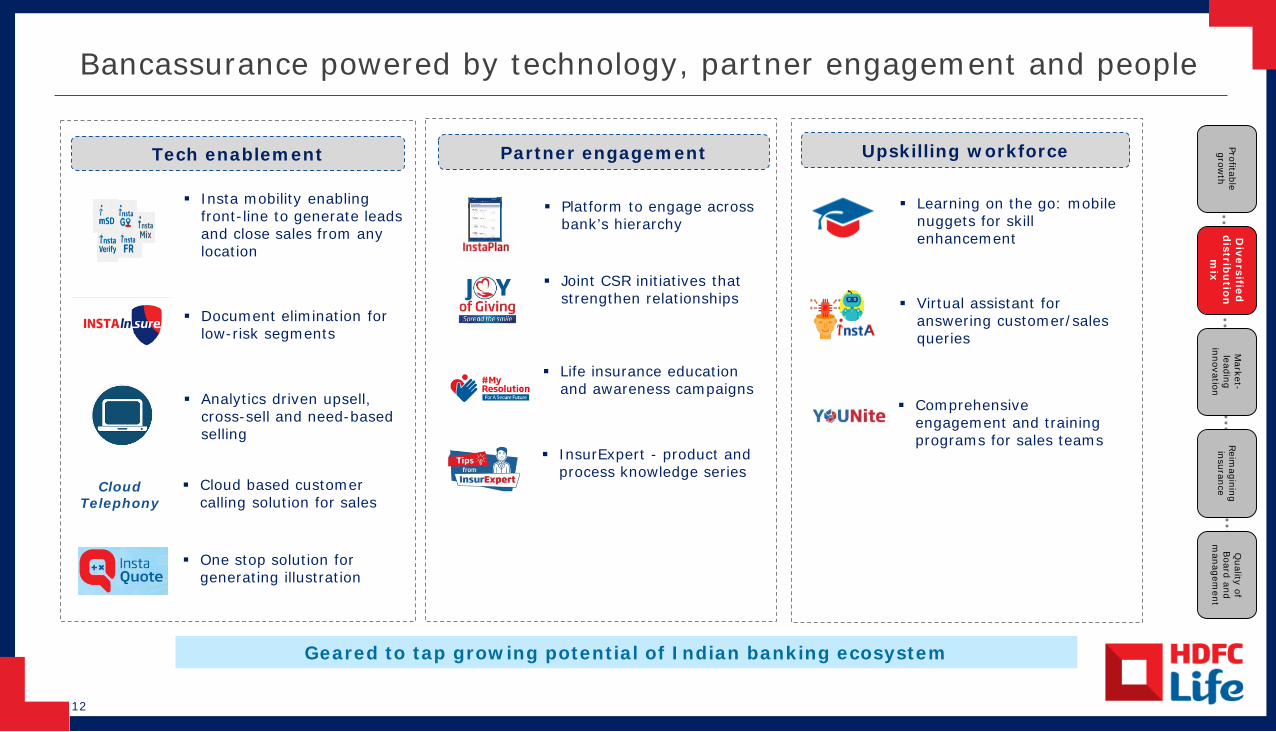
12
Virtual assistant for answering customer/sales queries
Tech enablement Partner engagement
Geared to tap growing potential of Indian banking ecosystem
Bancassurance powered by technology, partner engagement and people
Document elimination for low-risk segments
Analytics driven upsell, cross-sell and need-based selling
Cloud based customer calling solution for sales
CloudTelephony
One stop solution for generating illustration
Platform to engage across bank’s hierarchy
Insta mobility enabling front-line to generate leads and close sales from any location
Upskilling workforce
Learning on the go: mobile nuggets for skill enhancement
Life insurance education and awareness campaigns
Joint CSR initiatives that strengthen relationships
InsurExpert - product and process knowledge series
Comprehensive engagement and training programs for sales teams
Profitable grow
th
Diversified
d
istribu
tion
mix
Market-
leading innovation
Reim
agining insurance
Quality of
Board and
managem
ent
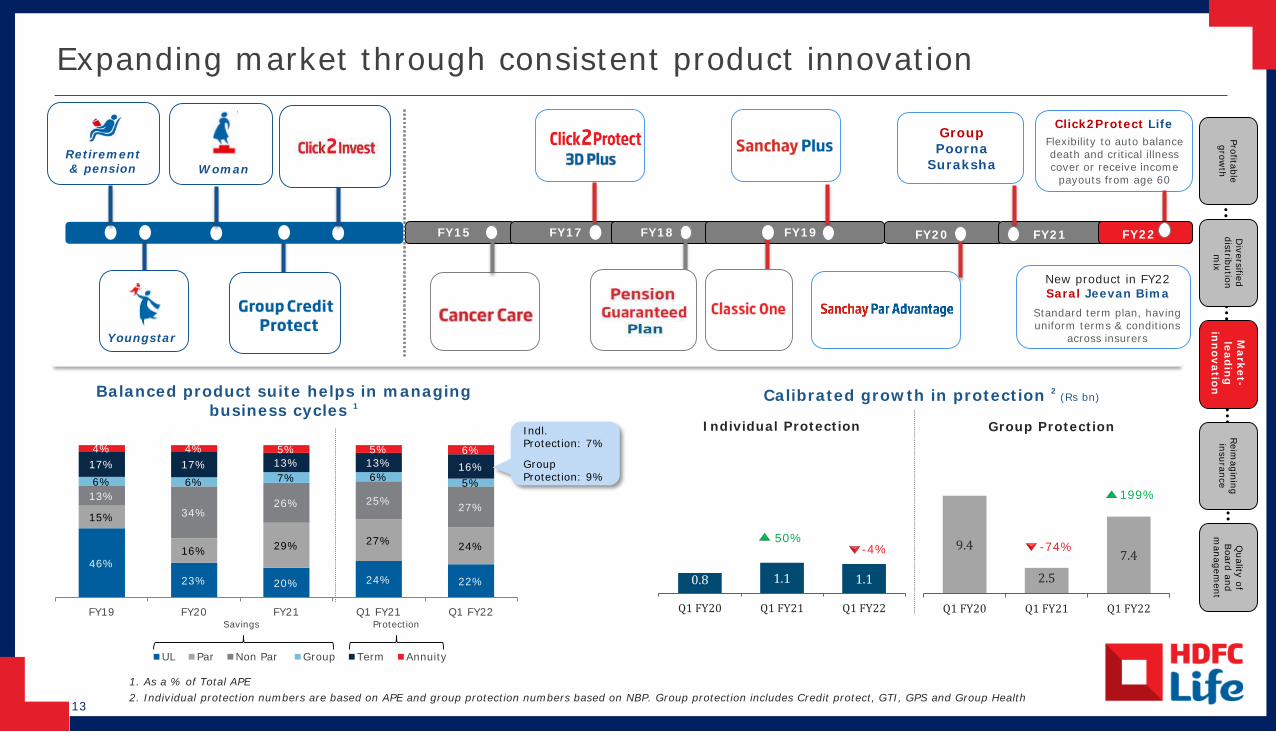
13
Flexibility to auto balance death and critical illness cover or receive income
payouts from age 60
Expanding market through consistent product innovation
Balanced product suite helps in managing business cycles 1
1. As a % of Total APE2. Individual protection numbers are based on APE and group protection numbers based on NBP. Group protection includes Credit protect, GTI, GPS and Group Health
Profitable grow
th
Diversified
distribution m
ix
Market-
leadin
g
inn
ovation
Reim
agining insurance
Quality of
Board and
managem
ent
Calibrated growth in protection 2 (Rs bn)
FY15 FY17 FY18 FY19 FY20
Retirement & pension
Youngstar
Woman
9.4
2.5
7.4
Q1 FY20 Q1 FY21 Q1 FY22
Group Protection
0.8 1.1 1.1
Q1 FY20 Q1 FY21 Q1 FY22
Individual Protection
FY21
GroupPoorna
Suraksha
Click2Protect Life
46%23% 20% 24% 22%
15%
16% 29% 27% 24%
13%34%
26% 25% 27%
6% 6% 7% 6% 5%
17% 17% 13% 13% 16%
4% 4% 5% 5% 6%
FY19 FY20 FY21 Q1 FY21 Q1 FY22
UL Par Non Par Group Term Annuity
Savings Protection
Indl. Protection: 7%
Group Protection: 9%
New product in FY22Saral Jeevan Bima
Standard term plan, having uniform terms & conditions
across insurers
FY22
199%
-74%50%
-4%
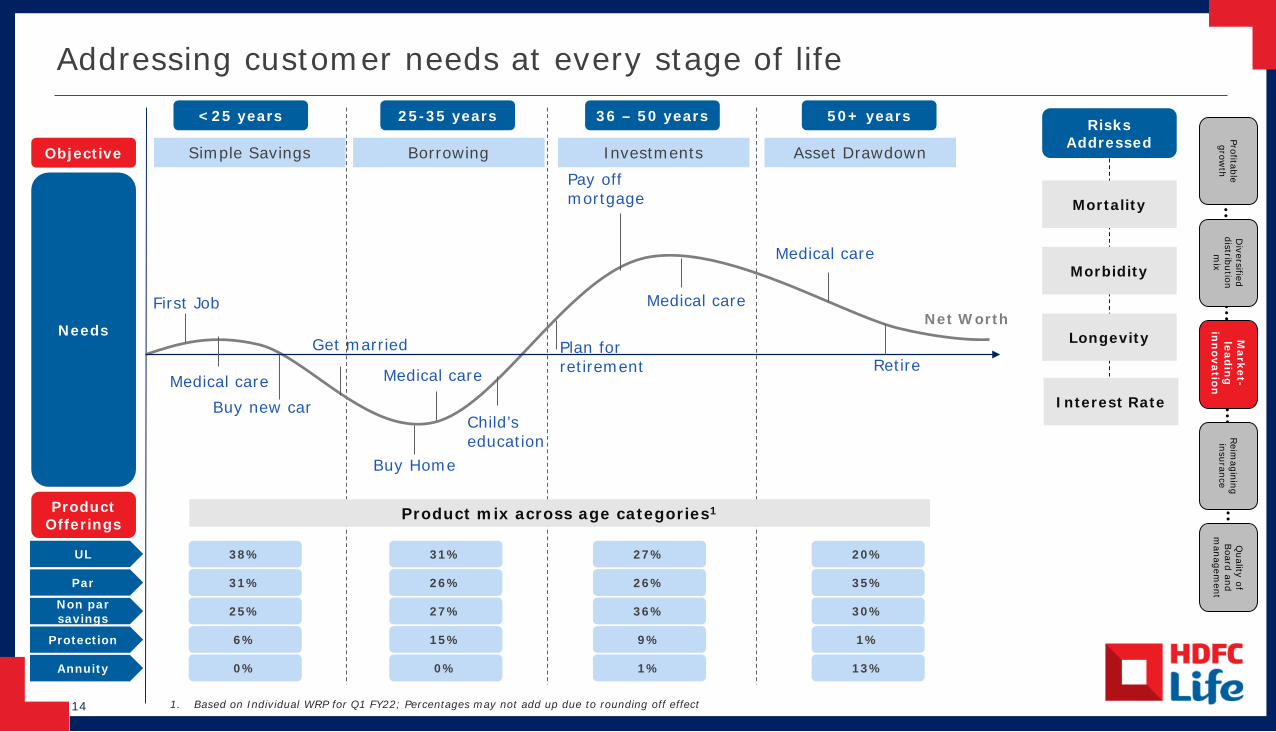
14
Addressing customer needs at every stage of life
Product Offerings
<25 years 25-35 years 36 – 50 years 50+ years
Objective Simple Savings Borrowing Investments Asset Drawdown
Needs
First Job
Buy new car
Get married
Buy Home
Child’s education
Plan for retirement
Pay off mortgage
Medical care
Medical care Medical care
Net Worth
Medical care
Retire
Risks Addressed
Mortality
Morbidity
Longevity
Interest Rate
Profitable grow
th
Diversified
distribution m
ix
Market-
leadin
g
inn
ovation
Reim
agining insurance
Quality of
Board and
managem
ent
UL
Par
Protection
Annuity
Non par savings
38%
31%
25%
6%
0%
31%
26%
27%
15%
0%
27%
26%
36%
9%
1%
20%
35%
30%
1%
13%
Product mix across age categories1
1. Based on Individual WRP for Q1 FY22; Percentages may not add up due to rounding off effect
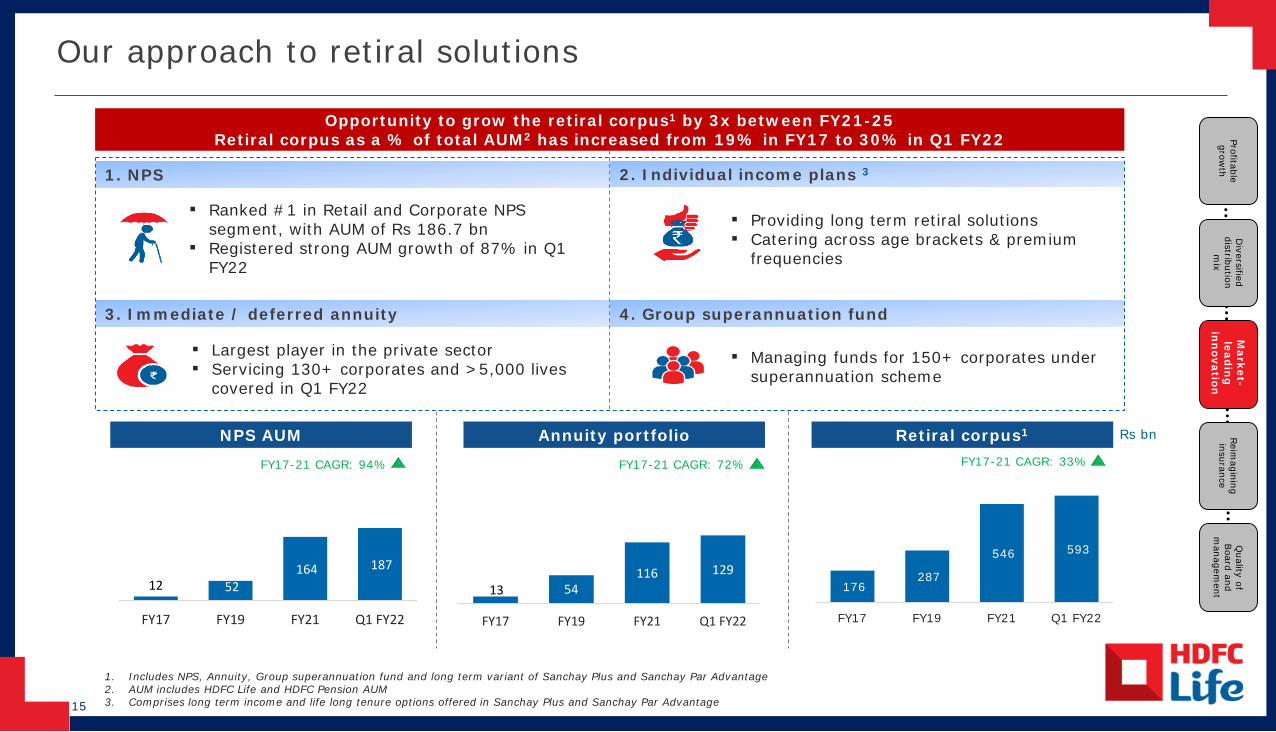
15
Opportunity to grow the retiral corpus1 by 3x between FY21-25Retiral corpus as a % of total AUM2 has increased from 19% in FY17 to 30% in Q1 FY22
Our approach to retiral solutionsProfitable grow
th
Diversified
distribution m
ix
Market-
leadin
g
inn
ovation
Reim
agining insurance
Quality of
Board and
managem
ent12 52 164 187
FY17 FY19 FY21 Q1 FY22
1. Includes NPS, Annuity, Group superannuation fund and long term variant of Sanchay Plus and Sanchay Par Advantage2. AUM includes HDFC Life and HDFC Pension AUM3. Comprises long term income and life long tenure options offered in Sanchay Plus and Sanchay Par Advantage
Rs bn
1. NPS
4. Group superannuation fund
2. Individual income plans 3
3. Immediate / deferred annuity
▪ Ranked #1 in Retail and Corporate NPS segment, with AUM of Rs 186.7 bn
▪ Registered strong AUM growth of 87% in Q1 FY22
▪ Largest player in the private sector▪ Servicing 130+ corporates and >5,000 lives
covered in Q1 FY22
▪ Providing long term retiral solutions ▪ Catering across age brackets & premium
frequencies
▪ Managing funds for 150+ corporates under superannuation scheme
13 54116 129
FY17 FY19 FY21 Q1 FY22
Annuity portfolio
FY17-21 CAGR: 72%
NPS AUM
FY17-21 CAGR: 94%
176 287
546 593
FY17 FY19 FY21 Q1 FY22
Retiral corpus1
FY17-21 CAGR: 33%
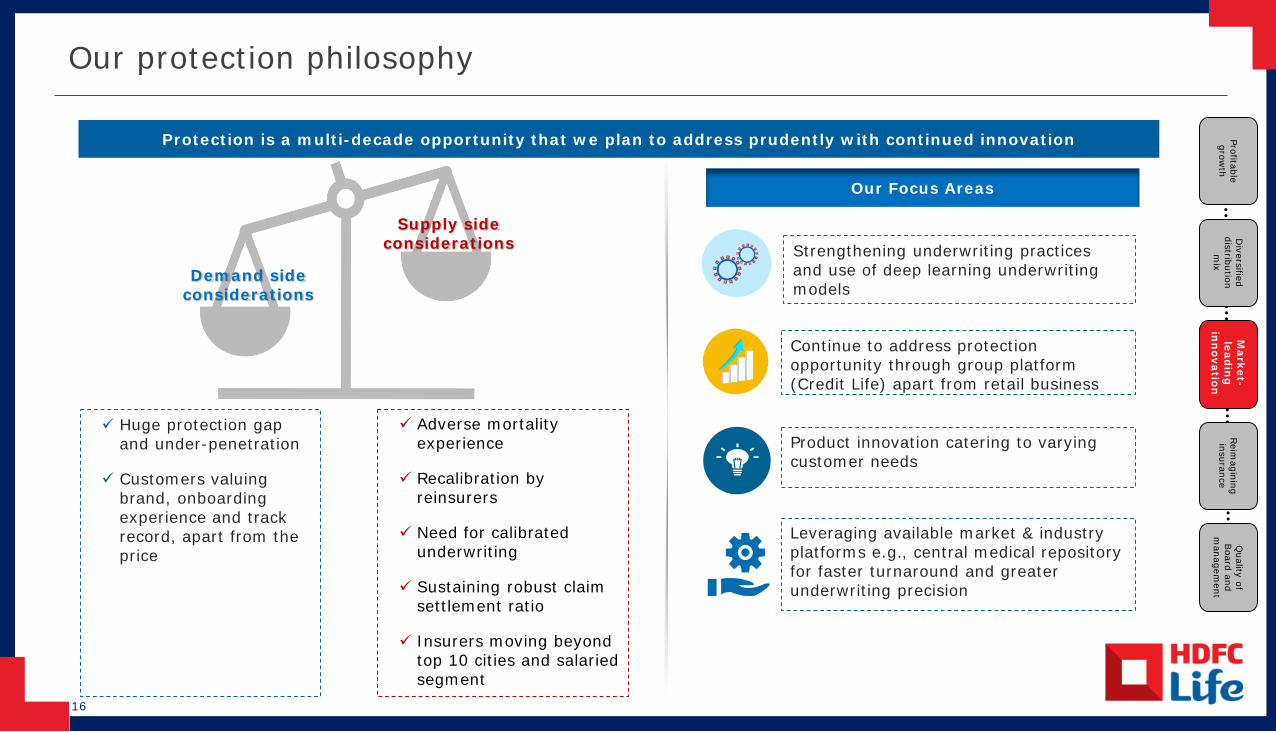
16
Our protection philosophy
Protection is a multi-decade opportunity that we plan to address prudently with continued innovation
Product innovation catering to varying customer needs
Continue to address protection opportunity through group platform (Credit Life) apart from retail business
Strengthening underwriting practices and use of deep learning underwriting models
Demand side considerations
Supply side considerations
Adverse mortality experience
Recalibration by reinsurers
Need for calibrated underwriting
Sustaining robust claim settlement ratio
Insurers moving beyond top 10 cities and salaried segment
Huge protection gap and under-penetration
Customers valuing brand, onboardingexperience and track record, apart from the price
Our Focus Areas
Leveraging available market & industry platforms e.g., central medical repository for faster turnaround and greater underwriting precision
Profitable grow
th
Diversified
distribution m
ix
Market-
leadin
g
inn
ovation
Reim
agining insurance
Quality of
Board and
managem
ent
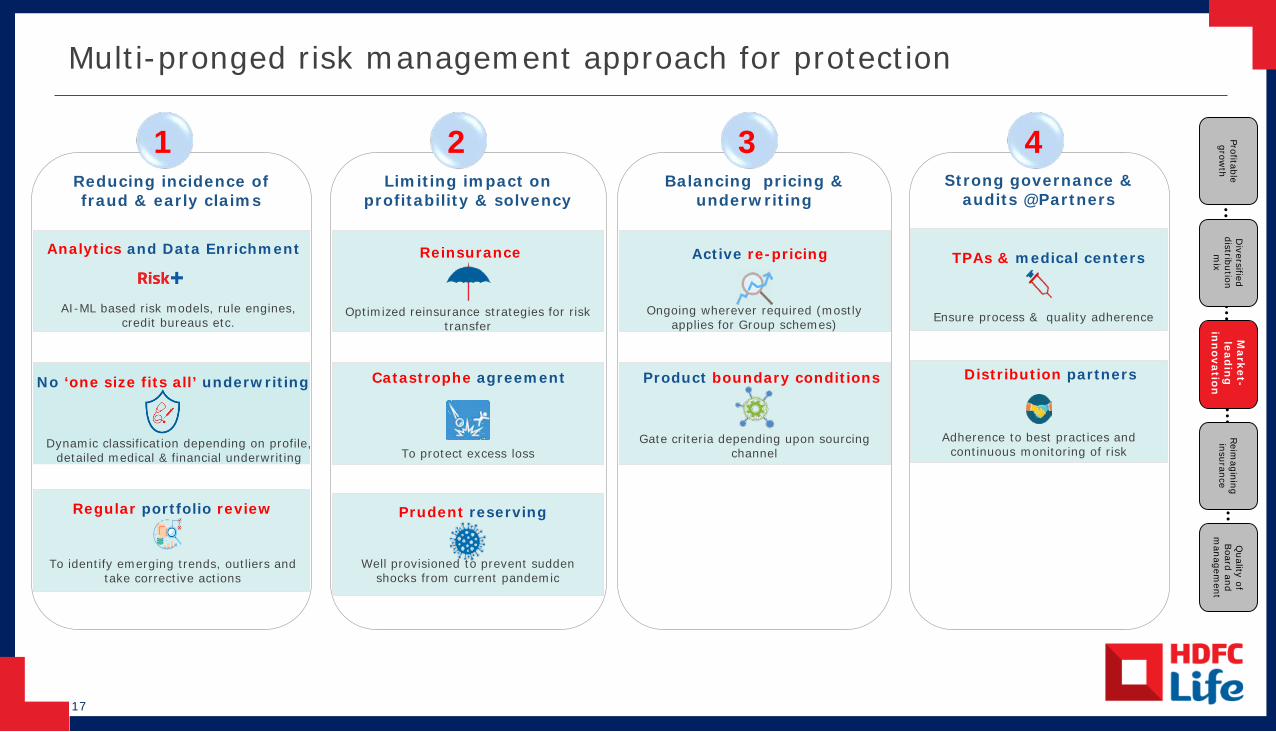
17
Multi-pronged risk management approach for protection
Reducing incidence of fraud & early claims
Regular portfolio review
To identify emerging trends, outliers and take corrective actions
Dynamic classification depending on profile, detailed medical & financial underwriting
Analytics and Data Enrichment
AI-ML based risk models, rule engines, credit bureaus etc.
No ‘one size fits all’ underwriting
Limiting impact on profitability & solvency
Prudent reserving
Well provisioned to prevent sudden shocks from current pandemic
Catastrophe agreement
To protect excess loss
Reinsurance
Optimized reinsurance strategies for risk transfer
Balancing pricing & underwriting
Product boundary conditions
Gate criteria depending upon sourcing channel
Active re-pricing
Ongoing wherever required (mostly applies for Group schemes)
Strong governance & audits @Partners
TPAs & medical centers
Ensure process & quality adherence
Distribution partners
Adherence to best practices and continuous monitoring of risk
1 2 3 4 Profitable grow
th
Diversified
distribution m
ix
Market-
leadin
g
inn
ovation
Reim
agining insurance
Quality of
Board and
managem
ent

18
Product mix across key channels1
1. Basis Individual APE, Term includes health business. Percentages are rounded off2. Includes banks, other corporate agents and online business sourced through banks / corporate agents 3. Includes business sourced through own website and web aggregators
Ban
ca 2
Ag
ency
Dir
ect
On
lin
e3
Com
pan
y
Pro
tect
ion
Segment FY19 FY20 FY21 Q1 FY22UL 64% 32% 27% 30%Par 13% 18% 37% 34%Non par savings 17% 44% 30% 29%Term 4% 4% 4% 5%Annuity 3% 2% 2% 2%
UL 50% 33% 29% 27%Par 8% 14% 17% 13%Non par savings 12% 20% 16% 22%Term 6% 4% 3% 4%Annuity 24% 29% 35% 34%
Segment FY19 FY20 FY21 Q1 FY22UL 26% 12% 10% 13%Par 40% 34% 37% 29%Non par savings 17% 40% 39% 41%Term 12% 12% 11% 13%Annuity 5% 3% 3% 3%
UL 62% 44% 39% 39%Par 2% 1% 1% 1%Non par savings 1% 18% 29% 29%Term 35% 37% 30% 29%Annuity 1% 1% 2% 2%
Segment FY19 FY20 FY21 Q1 FY22UL 55% 28% 24% 27%Par 18% 19% 34% 29%Non par savings 15% 41% 31% 32%Term 7% 8% 7% 8%Annuity 5% 4% 5% 5%
FY19 FY20 FY21 Q1 FY22
Basis APE 17% 17% 13% 16%
Basis NBP 27% 27% 20% 22%
FY19 FY20 FY21 Q1 FY22
Basis APE 4% 4% 5% 6%
Basis NBP 17% 16% 20% 26%
Profitable grow
th
Diversified
distribution m
ix
Market-
leadin
g
inn
ovation
Reim
agining insurance
Quality of
Board and
managem
ent
An
nu
ity
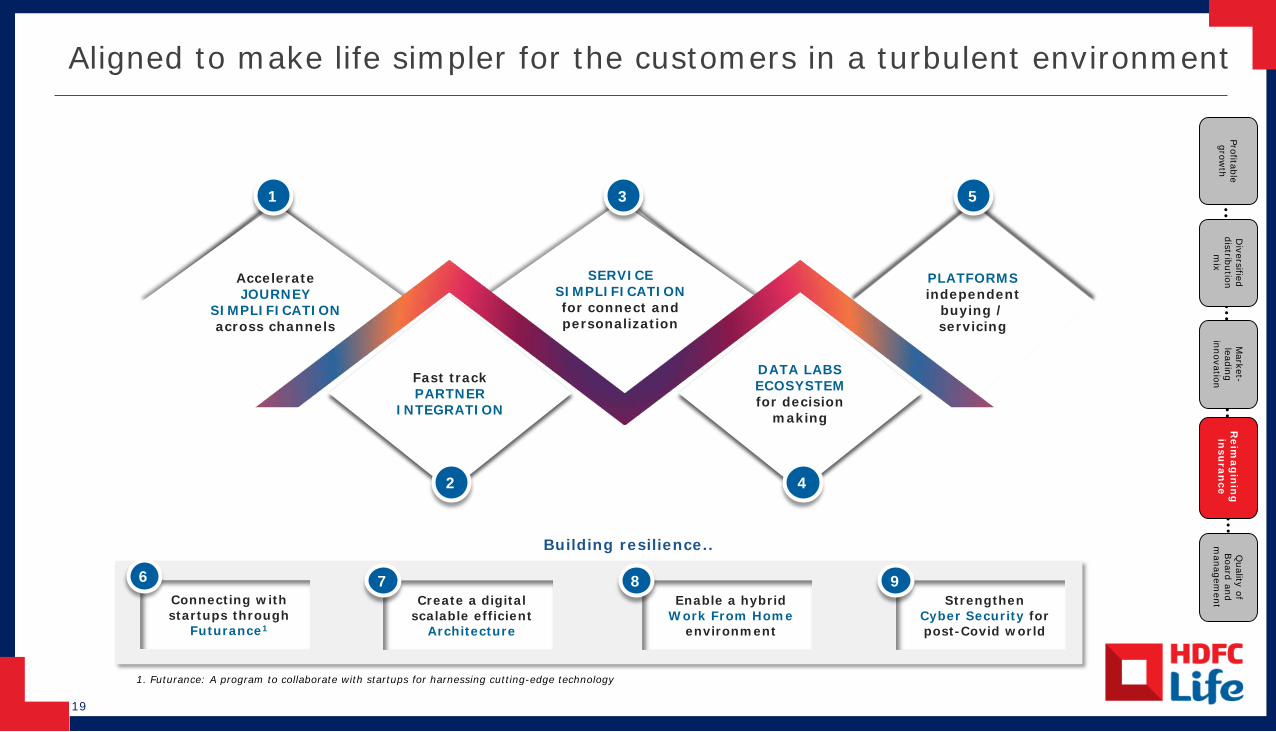
19
Give me a simple journey from purchase
to payout
Give me an integratedexperience
Give me frictionless
service
Personalize my experiences
DATA LABS ECOSYSTEM for decision
making
SERVICESIMPLIFICATIONfor connect and personalization
Fast trackPARTNER
INTEGRATION
Nudge me in my world
PLATFORMS independent
buying / servicing
Accelerate JOURNEY
SIMPLIFICATIONacross channels
1
2
3
4
5
Strengthen Cyber Security for post-Covid world
Enable a hybrid Work From Home
environment
Create a digital scalable efficient
Architecture
7 8 9Connecting with startups through
Futurance1
6
Building resilience..
1. Futurance: A program to collaborate with startups for harnessing cutting-edge technology
Aligned to make life simpler for the customers in a turbulent environmentProfitable grow
th
Diversified
distribution m
ix
Market-
leading innovation
Reim
agin
ing
in
suran
ce
Quality of
Board and
managem
ent
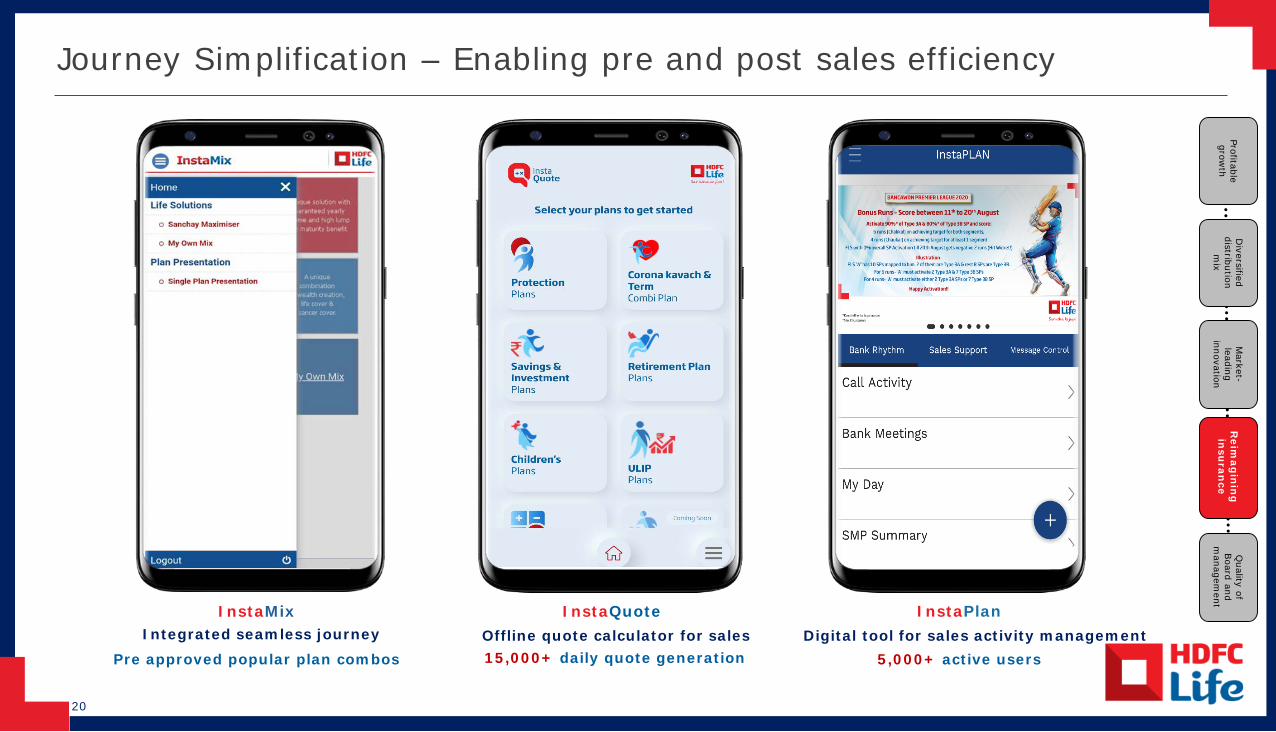
20
InstaPlanInstaMix InstaQuoteIntegrated seamless journey Offline quote calculator for sales Digital tool for sales activity management
15,000+ daily quote generationPre approved popular plan combos 5,000+ active users
Profitable grow
th
Diversified
distribution m
ix
Market-
leading innovation
Reim
agin
ing
in
suran
ce
Quality of
Board and
managem
entJourney Simplification – Enabling pre and post sales efficiency
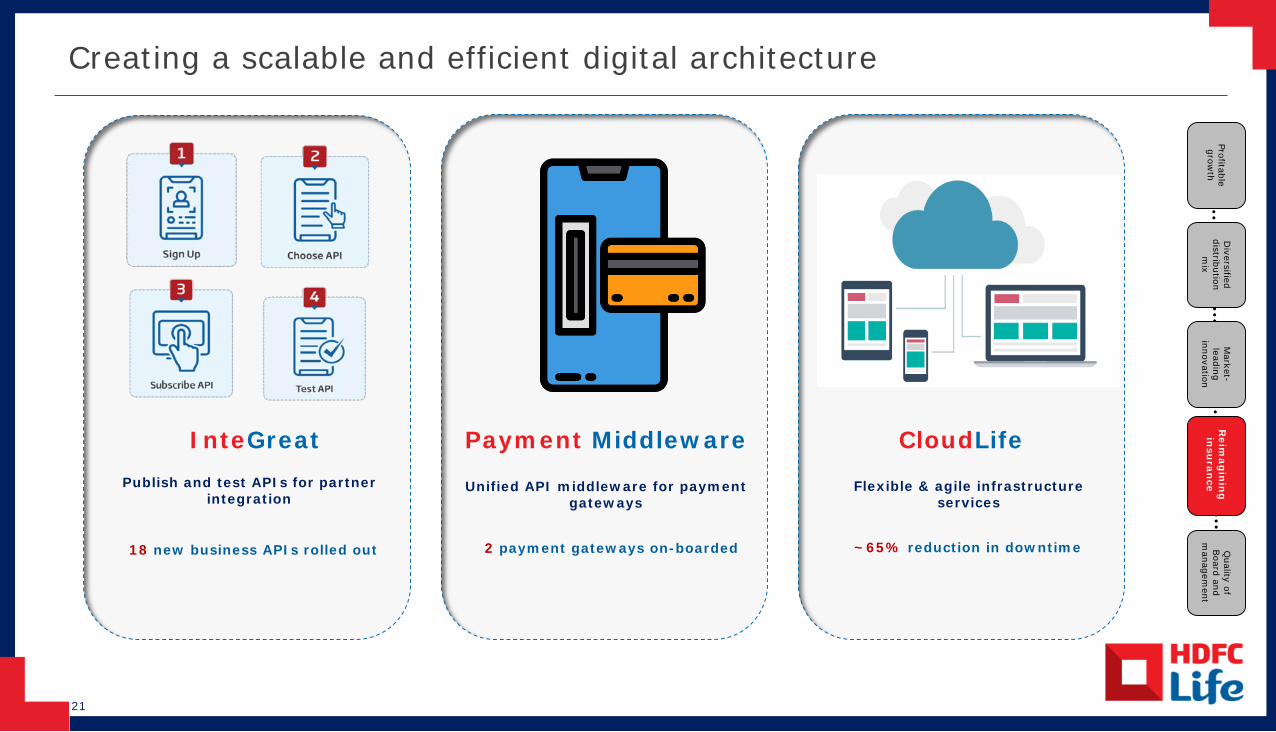
21
Flexible & agile infrastructure services
~65% reduction in downtime
Unified API middleware for payment gateways
2 payment gateways on-boarded
Publish and test APIs for partner integration
18 new business APIs rolled out
Creating a scalable and efficient digital architectureProfitable grow
th
Diversified
distribution m
ix
Market-
leading innovation
Reim
agin
ing
in
suran
ce
Quality of
Board and
managem
ent
InteGreat Payment Middleware CloudLife
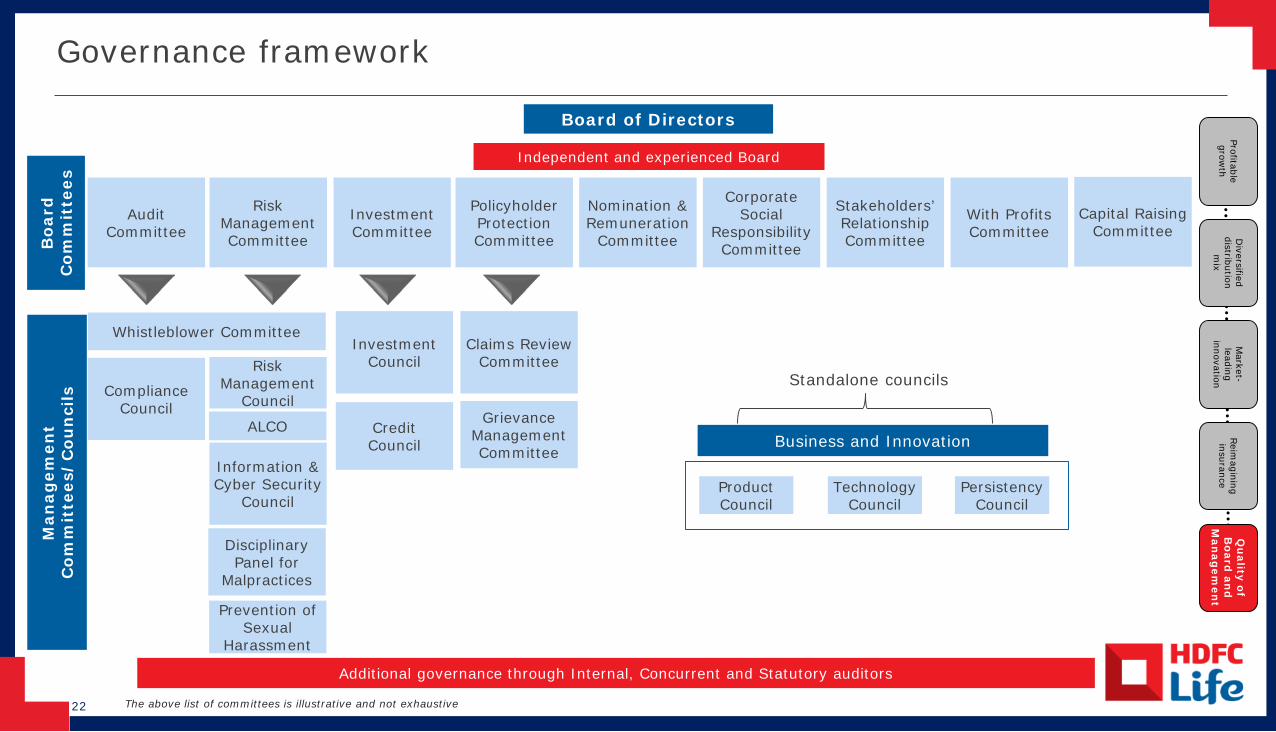
22
Governance framework
Audit Committee
Risk Management Committee
InvestmentCommittee
Policyholder Protection Committee
With ProfitsCommittee
Corporate Social
Responsibility Committee
Nomination & Remuneration
Committee
Stakeholders’ Relationship Committee
Compliance Council
Information & Cyber Security
Council
InvestmentCouncil
Claims Review Committee
Disciplinary Panel for
Malpractices
Prevention of Sexual
Harassment
Grievance Management Committee
Whistleblower Committee
Bo
ard
C
om
mit
tees
Man
agem
ent
Co
mm
itte
es/
Co
un
cils
Standalone councils
Additional governance through Internal, Concurrent and Statutory auditors
The above list of committees is illustrative and not exhaustive
Business and Innovation
Independent and Experienced Board Product Council
TechnologyCouncil
Persistency Council
Profitable grow
th
Diversified
distribution m
ix
Market-
leading innovation
Reim
agining insurance
Qu
ality of B
oard an
d
Man
agem
ent
CreditCouncil
ALCO
Risk Management
Council
Capital RaisingCommittee
Board of Directors
Independent and experienced Board

23
Financial risk management framework
Natural hedges Product design & mix monitoring
ALM approach Residual strategyManaging
Risk
▪ Protection and longevity businesses
▪ Unit linked and non par savings products
▪ Prudent assumptions and pricing approach
▪ Return of premium annuity products (>95% of annuity); Average age at entry ~59 years
▪ Deferred as % of total annuity business < 30%, with average deferment period <4 yrs
▪ Regular monitoring of interest rates and business mix
▪ Target cash flow matching for non par savings plus group protection portfolio to manage non parallel shifts and convexity
▪ Immunise overall portfolio to manage parallel shifts in yield curve (duration matching)
▪ External hedging instruments such as FRAs, IRFs, swaps amongst others
▪ Reinsurance
Sensitivity Overall Non par 1 Overall Non par 1
Scenario EV VNB Margin EV VNB
Margin EV VNB Margin EV VNB
Margin
Interest Rate +1% (2.2%) (1.5%) (2.3%) (2.9%) (2.2%) (1.6%) (2.5%) (2.9%)
Interest Rate -1% 1.6% 0.9% 1.2% 1.8% 1.9% 1.1% 2.0% 2.1%
Sensitivity remains range-bound on the back of calibrated risk management
FY21 Q1 FY22
1. Comprises Non par savings (incl Annuity) plus Protection

Page 24
3 Managing Covid
Performance Snapshot
Our Strategy
Annexures
India Life Insurance
Managing Covid-19
Customer Centricity
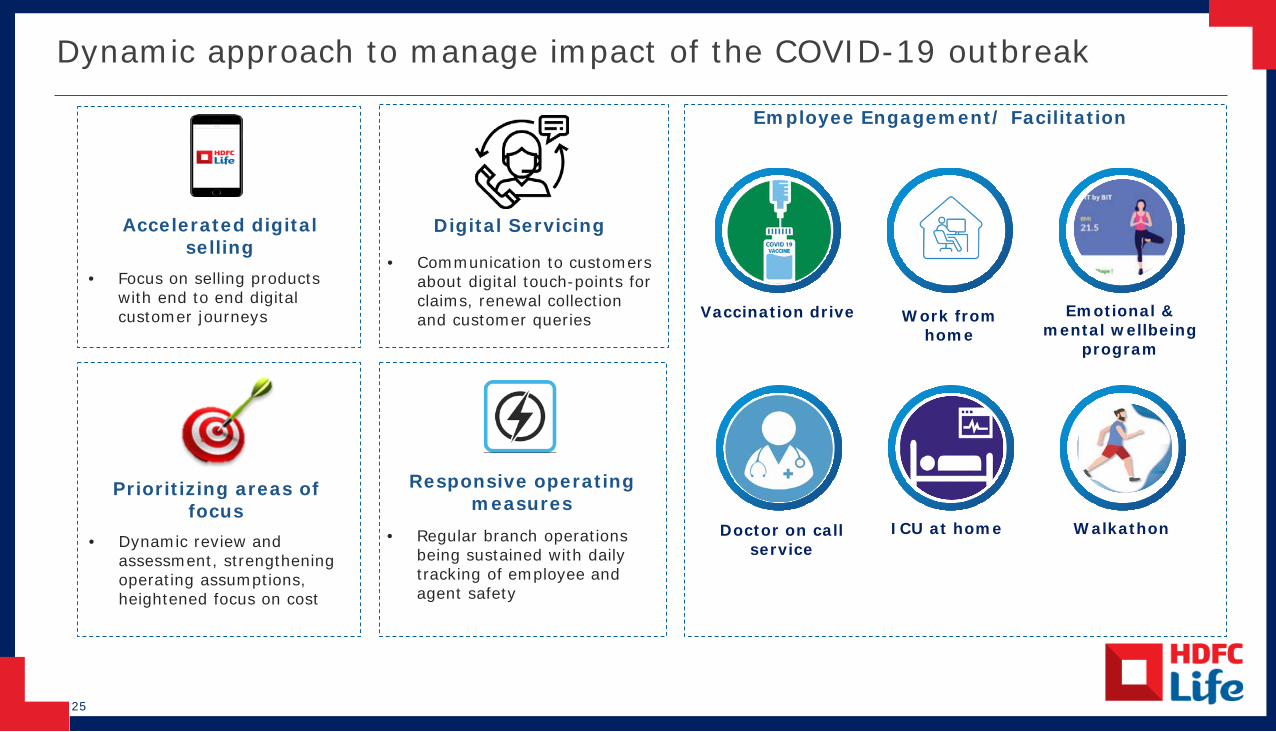
25
Dynamic approach to manage impact of the COVID-19 outbreak
Accelerated digital selling
• Focus on selling products with end to end digital customer journeys
Prioritizing areas of focus
• Dynamic review and assessment, strengthening operating assumptions, heightened focus on cost
Digital Servicing
• Communication to customers about digital touch-points for claims, renewal collection and customer queries
Responsive operating measures
• Regular branch operations being sustained with daily tracking of employee and agent safety
Employee Engagement/ Facilitation
Vaccination drive
Doctor on callservice
Emotional & mental wellbeing
program
Work from home
ICU at home Walkathon

26
▪ Chat PCV and eCCD - No dependence on salesperson or call center. ~45% digital pre-conversionverification (through chat and eCCD)
Emphasis on digital across customer touch-points
▪ Seamless support experience -~1.8 mn monthly queries handled by instA (virtual assistant)
▪ Use of mobile app – Over 41%increase in mobile app usage
▪ InstaServe - OTP based policy servicing tool to handle customer queries
▪ Branches - Daily tracking of employee and agent safety
Customer interactions
▪ 24*7 self-service options -~97% of chats are self-serve via chat-bot
New business / purchase
▪ Digital sales journey - End-to-end digital sales, from prospecting till conversion, including customer interactions
▪ Telemedicals – 64% of the medicals done through tele-medicals
▪ InstaInsure - Simplified insurance buying through a 3-click journey
▪ Uninterrupted customer assistance - Work from home enabled across the organization;Access to Microsoft Teams, Citrix
▪ Digital Renewal collections -87% based on renewal premiums and 96% based on no. of policies; SVAR (voice bot for renewal calling) and use of Cloud telephony
▪ Maturity payouts - Email, Whatsapp and customer portal 'My Account‘ enabled to upload necessary docs
▪ LifeEasy - Simple '3 click claim' process, 100%1 eligible claims settled in 1 day. Claims initiation process also enabled through Whatsapp
▪ Contact centres - Branch staff replacing call centre agents
Policy servicing
▪ RPA –Robotic Process automation handled ~300 processes remotely
▪ e-learning platform – 7,000+ agents attending training programs daily through Agency Life Platform
▪ Gamified contests - Launched to drive adoption of digital engagement initiatives
▪ Agent on-boarding - Insta PRL enabling digital on-boarding of agents – 20,000+ applicationslogged in Q1 FY22
▪ Partner trainings - Conducted via digital collaboration tools
▪ Employee engagement - VC based skill building sessions with digital partners (Twitter, Google, Facebook)
Employee / Partner engagement
New initiatives launched to manage volatile business environment due to the Covid-19 outbreak
eCCD
1. Claim settlement ratio through LifeEasy (online) platform, as on 31st March 2021

Page 27
Customer Centricity
Performance Snapshot
Our Strategy
Annexures
India Life Insurance
Managing Covid-19
Customer Centricity
4
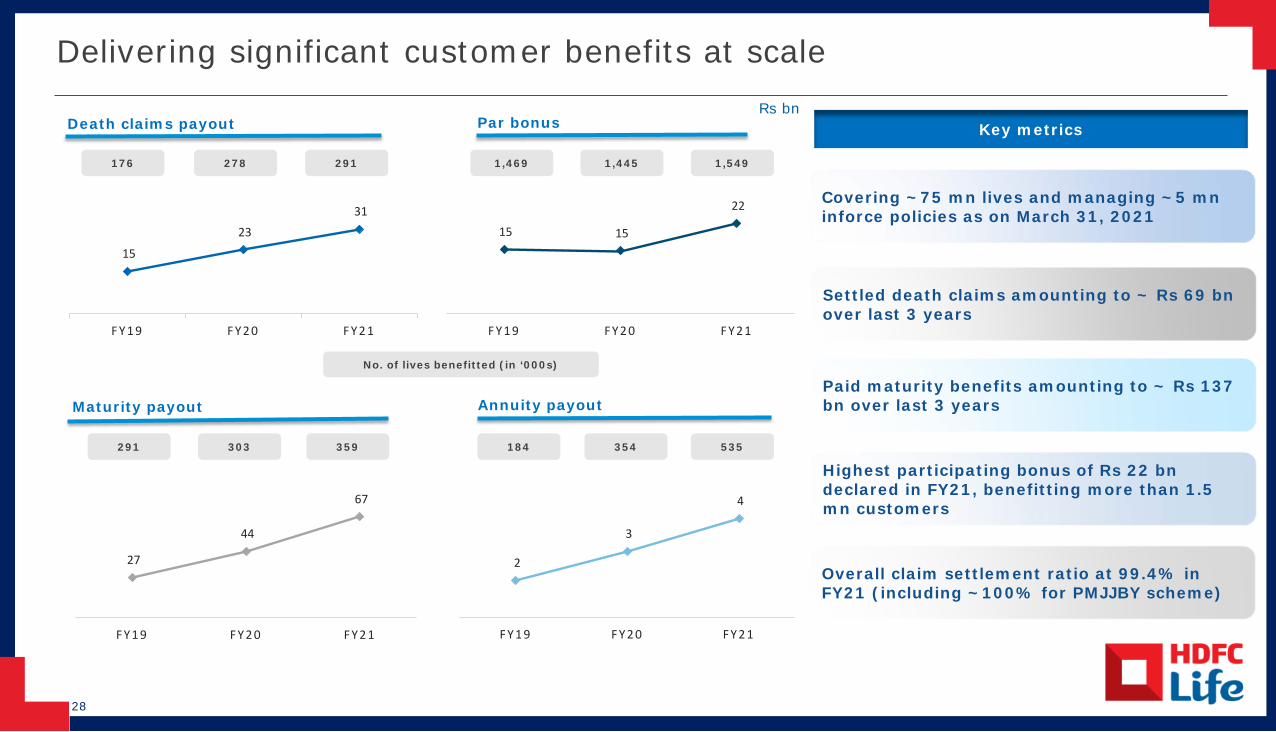
28
Delivering significant customer benefits at scale
15
23 31
F Y 1 9 F Y 2 0 F Y 2 1
15 15
22
F Y 1 9 F Y 2 0 F Y 2 1
27
44
67
F Y 1 9 F Y 2 0 F Y 2 1
2
3
4
F Y 1 9 F Y 2 0 F Y 2 1
Death claims payout Par bonus
Maturity payout Annuity payout
Covering ~75 mn lives and managing ~5 mn inforce policies as on March 31, 2021
Settled death claims amounting to ~ Rs 69 bn over last 3 years
Paid maturity benefits amounting to ~ Rs 137 bn over last 3 years
Highest participating bonus of Rs 22 bn declared in FY21, benefitting more than 1.5 mn customers
Overall claim settlement ratio at 99.4% in FY21 (including ~100% for PMJJBY scheme)
176 278 291 1,469 1,445 1,549
291 303 359 184 354 535
No. of lives benefitted (in ‘000s)
Key metricsRs bn

Page 29
Annexures
Performance Snapshot
Our Strategy
Annexures
India Life Insurance
Managing Covid-19
Customer Centricity
5
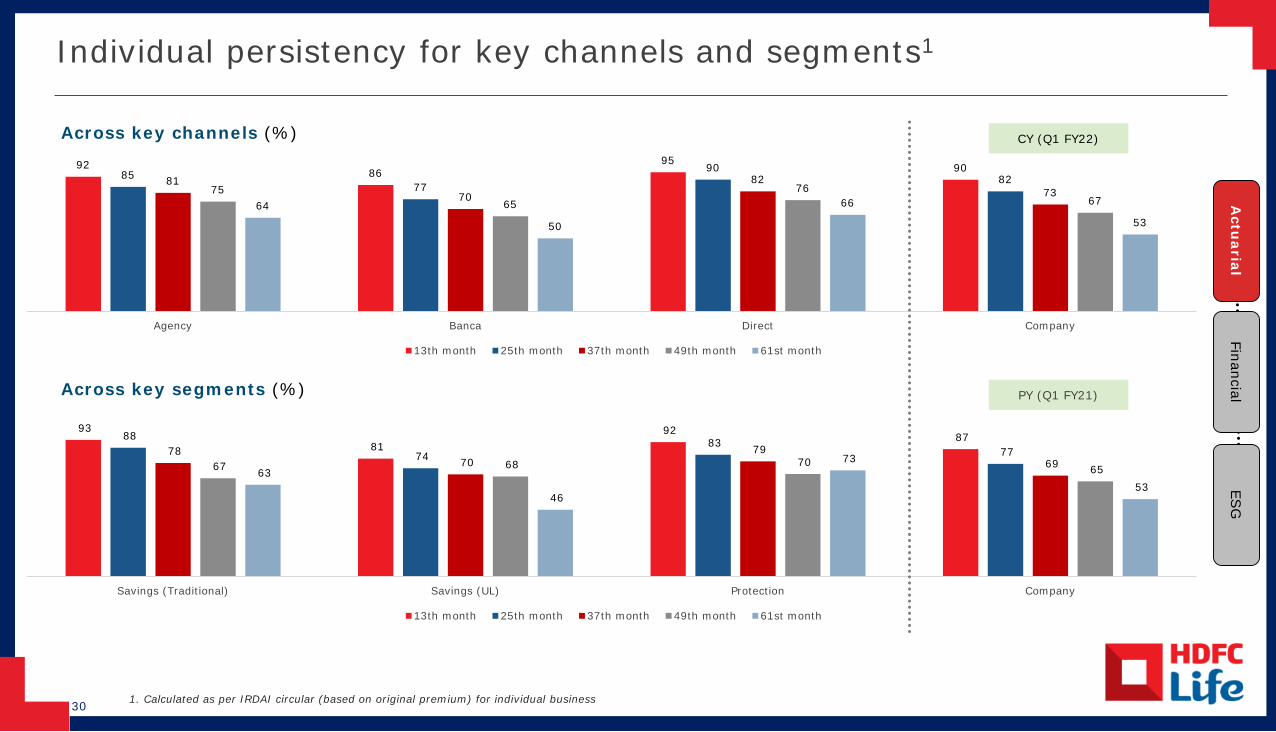
30
Individual persistency for key channels and segments1
1. Calculated as per IRDAI circular (based on original premium) for individual business
Across key channels (%)
9286
959085
77
908281
7082
737565
766764
50
66
53
Agency Banca Direct Company
13th month 25th month 37th month 49th month 61st month
Across key segments (%)
93
81 92 87 88
74 83
77 78 70
79 69 67 68 70
65 63
46
73
53
Savings (Traditional) Savings (UL) Protection Company
13th month 25th month 37th month 49th month 61st month
CY (Q1 FY22)
PY (Q1 FY21)
Actu
arialFinancial
ESG
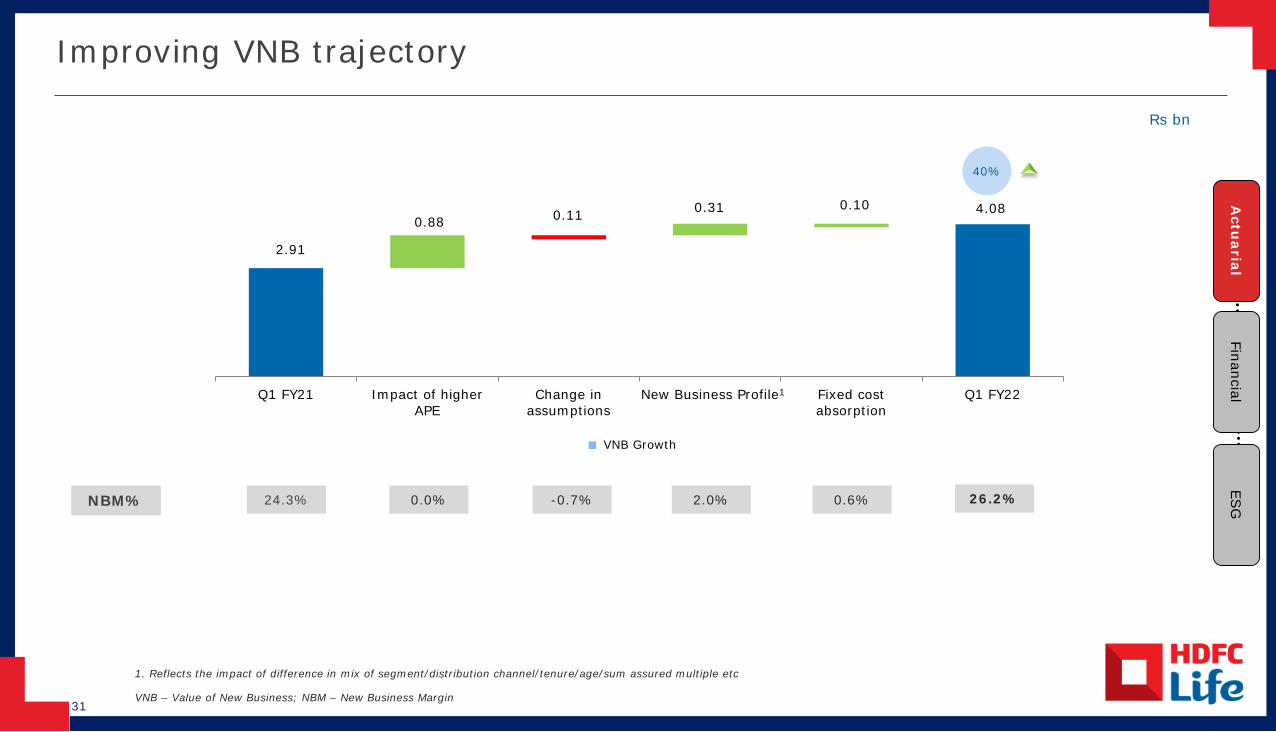
31
NBM% 0.0%
2.91
4.08 0.88 0.11 0.31 0.10
Q1 FY21 Impact of higherAPE
Change inassumptions
New Business Profile Fixed costabsorption
Q1 FY22
-0.7% 2.0% 26.2%24.3% 0.6%
Rs bn
Improving VNB trajectory
1. Reflects the impact of difference in mix of segment/distribution channel/tenure/age/sum assured multiple etc
VNB – Value of New Business; NBM – New Business Margin
Actu
arialFinancial
ESG
1
40%
VNB Growth
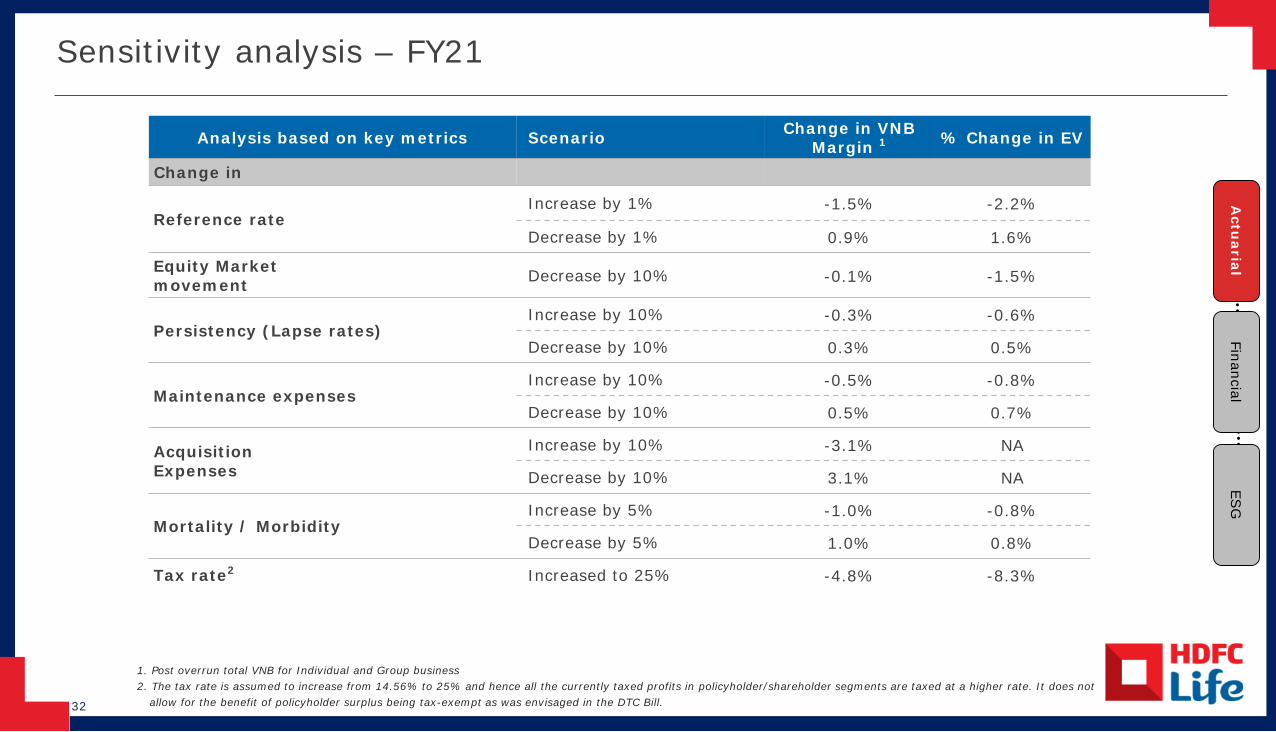
32
Sensitivity analysis – FY21
1. Post overrun total VNB for Individual and Group business2. The tax rate is assumed to increase from 14.56% to 25% and hence all the currently taxed profits in policyholder/shareholder segments are taxed at a higher rate. It does not
allow for the benefit of policyholder surplus being tax-exempt as was envisaged in the DTC Bill.
Analysis based on key metrics Scenario Change in VNB Margin 1 % Change in EV
Change in
Reference rateIncrease by 1% -1.5% -2.2%
Decrease by 1% 0.9% 1.6%
Equity Market movement Decrease by 10% -0.1% -1.5%
Persistency (Lapse rates)Increase by 10% -0.3% -0.6%
Decrease by 10% 0.3% 0.5%
Maintenance expensesIncrease by 10% -0.5% -0.8%
Decrease by 10% 0.5% 0.7%
AcquisitionExpenses
Increase by 10% -3.1% NA
Decrease by 10% 3.1% NA
Mortality / MorbidityIncrease by 5% -1.0% -0.8%
Decrease by 5% 1.0% 0.8%
Tax rate2 Increased to 25% -4.8% -8.3%
Actu
arialFinancial
ESG
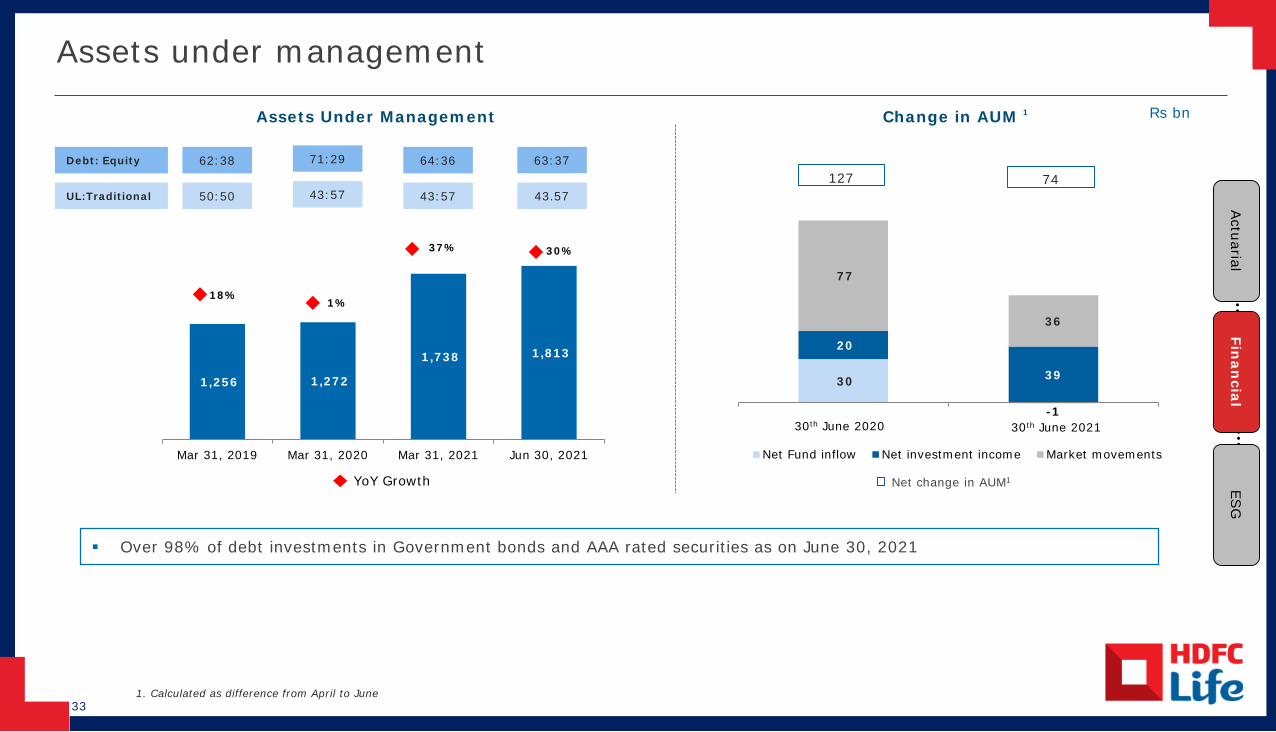
33
30
-1
20
39
77
36
Net Fund inflow Net investment income Market movements
30th June 2020 30th June 2021
127 74
Assets under management
Rs bn
Over 98% of debt investments in Government bonds and AAA rated securities as on June 30, 2021
1. Calculated as difference from April to June
Assets Under Management Change in AUM 1
Net change in AUM1
1,256 1,272
1,738 1,813
150
350
550
750
950
1,150
1,350
1,550
1,750
1,950
Mar 31, 2019 Mar 31, 2020 Mar 31, 2021 Jun 30, 2021
71:29Debt: Equity
43:57UL:Traditional
62:38
50:50
64:36
43:57 Actuarial
Finan
cialES
G
YoY Growth
18%1%
37% 30%
63:37
43.57

34
Stable capital position
Stable solvency ratio, augmented by steady accretion to backbook
1. ASM represents Available solvency margin and RSM represents Required solvency margin2. Investment in subsidiaries not considered in solvency margin; Excludes impact of proposed final dividend of Rs 4.1 bn, to be paid in Q2 FY22 (subject to shareholders’
approval)
Rs bn32% 17%15% 44%NB premium growth
Actuarial
Finan
cialES
G
33.3 38.5 46.9 48.5
16.7 19.2
23.4 24.212.7
13.1
24.0 25.9
188%184%
201% 203%
50%
70%
90%
110%
130%
150%
170%
190%
210%
-
20.0
40.0
60.0
80.0
100.0
120.0
Mar 31, 2019 Mar 31, 2020 Mar 31, 2021 Jun 30, 2021
RSM @100% Incremental RSM @150% Surplus Capital Solvency margin
62.770.8
94.3 98.6
ASM1 2
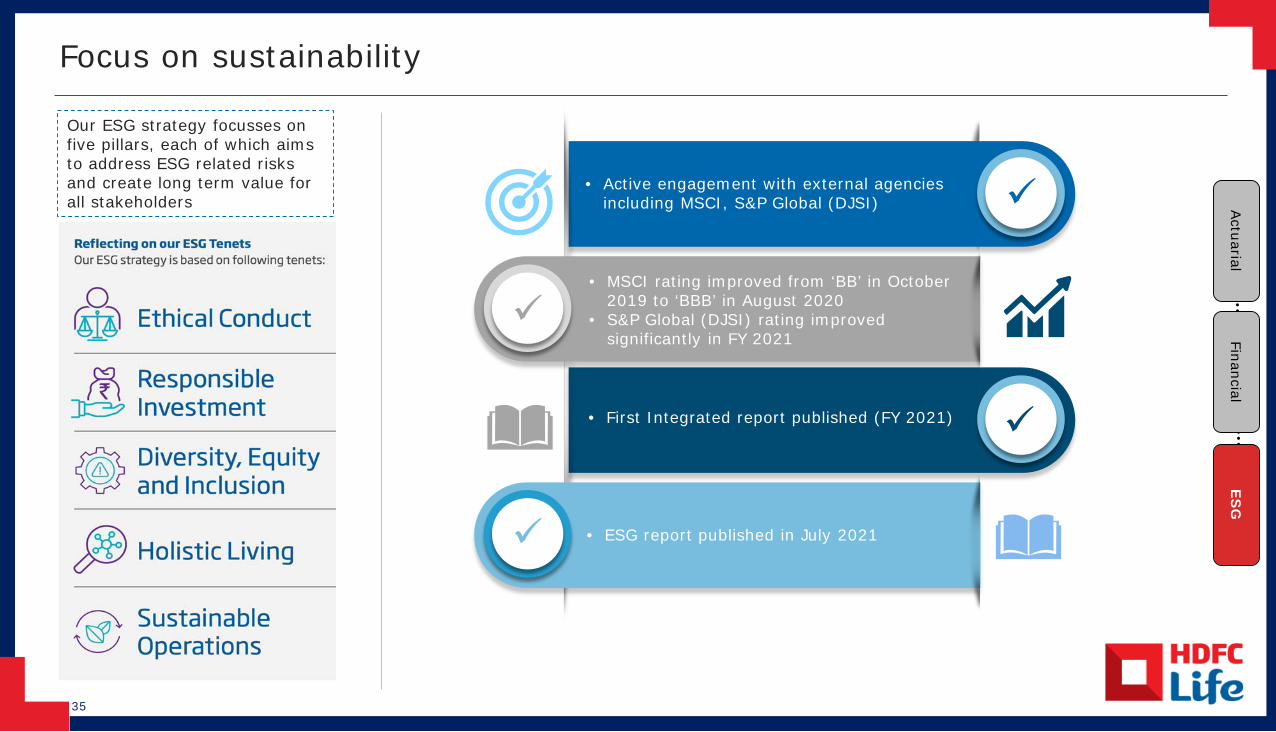
35
Focus on sustainabilityActuarial
FinancialES
G
Our ESG strategy focusses on five pillars, each of which aims to address ESG related risks and create long term value for all stakeholders
• Active engagement with external agencies including MSCI, S&P Global (DJSI)
• MSCI rating improved from ‘BB’ in October 2019 to ‘BBB’ in August 2020
• S&P Global (DJSI) rating improved significantly in FY 2021
• First Integrated report published (FY 2021)
• ESG report published in July 2021

36
1. PRSH: Prevention of Sexual Harassment2. BRR: Business Responsibility Report3. AML: Anti Money Laundering
5 pillarsof ESG
Ethical Conduct
Responsible Investment
Diversity, Equity & Inclusion
Holistic Living
Sustainable Operations
Information/Cyber Security Responsible Investment (RI)
Board Diversity policy
o 27% women as on 30th June, 2021
Board evaluation & independence
o Six independent directors
o ‘Fit and Proper’ as per regulation
o ISO 27001:2013 and ISMS assessment program
o Data Privacy Policy
o Enterprise risk management (ERM) framework ‘Three Lines of Defense
approach’ Reviewed and approved by
the Board
Remuneration policy Seeks to balance the
fixed and incentive pay
Performance Management System based on the principles of balanced scorecard
Corporate governance policy
o Commitment to ethical business practices
o Includes Corporate structure and stakeholder management
Governance structure Risk management and BCM
o Risk oversight by Board of Directors
o Review in multiple management forums
Risk management policy
o Business Continuity Management (BCM)-Creation of a recovery plan for critical business activities
o Modes of Risk awareness Trainings, E-mailers, Seminars,
Conferences, Quizzes and Special awareness Drives
o Sensitivity analysis and stress testing
Mitigating & Managing Risk
Disclosure of managerial
remuneration
in the annual report
Compensation framework
Business ethics and compliances
Code of Conduct
BRR2 & Stewardship
Code
Whistle blower Policy
PRSH1 Human Rights
Anti Bribery & Corruption
PolicyAML3 Privacy
Policy
o Generate optimal risk adjusted returns over the long term
o RI framework applicable to all major asset
classes including equity and bonds
integrated into investment analysis
Environment Social Governance

37
Attracting talent
o Virtual hiring and on-boarding process without compromising on quality
o Robust employee referral schemes (>50% of the hiring through referrals)
o Flexi job program and flexi hours to promote WFH, attract gig workers
o Hire–train-deploy model through tie-up with reputed learning institutions
Employee engagement
o Online yoga, meditation sessions, fitness challenges (Walkathon, Fit by Bit), Click2Wellness app
o Emotional and well being assistance program for employees
o Engagement programs for employees and their families
o Talk to Doctor for unlimited free consultation
o Strong Reward and Recognition framework
Training & development
o Mandatory and optional learning programs for employees, contractors, channel partners
o Mobile learning app for self-paced learning
o Virtual training of employees during Covid
o Access to curated online trainingprograms from reputed universities
o Career coaching and development interventions
Employee diversity
o Actively promoting diversity and inclusiono 25% women employees (maternity transition
program, mentoring program for women, Economic Times Femina Best Workplaces for women)
o Promoting diverse talent pool (work profiles for second career women, specially-abled)
o LGBTQ+ friendly organisationo Promoting diverse talent pool - #MyJobMyRules
o Fast track growth path for special categories of employees - Management Trainees & Graduate Trainees, etc.
o Potential review and talent development interventions for leadership
o Robust, transparent and objective performance management system
o Career microsite, job portal to educate employees on career opportunities within the company
o Higher increments, bonuses for those exceeding expectations
o Long term incentive plans in the form of ESOPs and cash to attract, retain and motivate good talent
o Elaborate succession planning for Key Managerial Personnel, critical senior roles
Talent management/retention
Environment Social Governance
5 pillarsof ESG
Ethical Conduct
Responsible Investment
Diversity, Equity & Inclusion
Holistic Living
Sustainable Operations

38
Inclusive growth Customer centricity
o The Corporate Social Responsibility wing is aligned with the UN Sustainable Development Goals (SDGs) with focus on Education, Health, Environment, Livelihood & Disaster Relief
FY21: 22 CSR projects across 24 states and 3 Union Territories impacting >233K beneficiaries in India
Support 10 out of the 17 UN Sustainable Development Goals
o Contribution to PM Cares Fund
o Medical supplies, nutritional meals for frontline healthcare workers
o Distribution of Happiness Box consisting of immunity boosting supplements, hygiene support material and educational workbooks for underprivileged school children
COVID-19 Response in FY21
Leveraging technology
o To simplify life insurance for customers through their journey across issuance, claims, servicing, or any other engagement
Artificial Intelligence (AI) for text and speech recognition;
Machine Learning (ML) to improve persistency;
Cognitive bots (software robots) for 24x7 customer service; and
Alternate data to enhance underwriting
o Grievance Redressal Policy
o Complaints per 10K reduced from 47 in FY20 to 35 in FY21
o 13th month persistency improved to 90%
o Improvement in overall Customer Satisfaction (CSAT) Scores
Customer Satisfaction
Financial Inclusion
o In line with the Government’s social scheme ‘Pradhan Mantri Jeevan Jyoti Bima Yojana’, HDFC Life offers HDFC Life Pradhan Mantri Jeevan Jyoti Bima Yojana Plan, which is a pure group term insurance product
o Group Jeevan Suraksha and Group Term Insurance are micro insurance products that have been designed for the members of micro finance institutions, co-operatives, self-help groups, etc.
o Under these plans, the Company covered a total of 2.1 cr lives till March 31, 2021
Environment Social Governance
5 pillarsof ESG
Ethical Conduct
Responsible Investment
Diversity, Equity & Inclusion
Holistic Living
Sustainable Operations
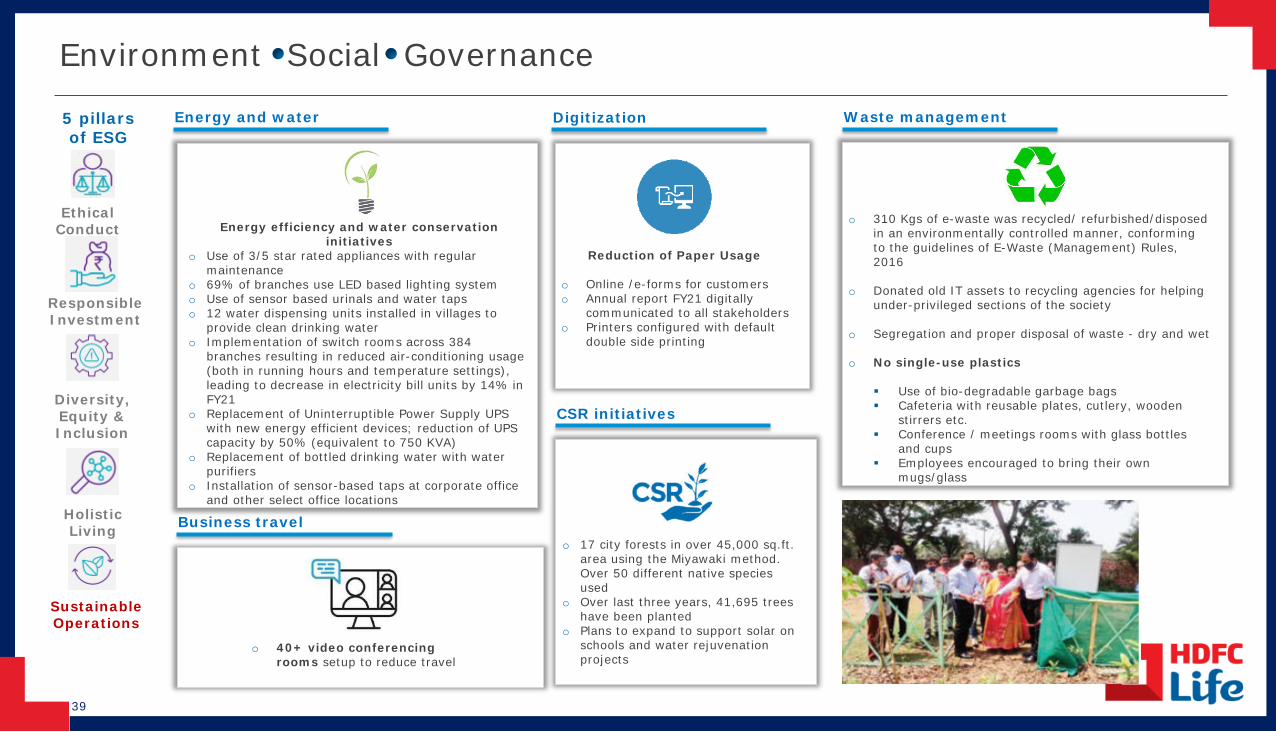
39
Energy and water Waste management
Energy efficiency and water conservation initiatives
o Use of 3/5 star rated appliances with regular maintenance
o 69% of branches use LED based lighting system o Use of sensor based urinals and water tapso 12 water dispensing units installed in villages to
provide clean drinking watero Implementation of switch rooms across 384
branches resulting in reduced air-conditioning usage (both in running hours and temperature settings), leading to decrease in electricity bill units by 14% in FY21
o Replacement of Uninterruptible Power Supply UPS with new energy efficient devices; reduction of UPS capacity by 50% (equivalent to 750 KVA)
o Replacement of bottled drinking water with water purifiers
o Installation of sensor-based taps at corporate office and other select office locations
Reduction of Paper Usage
o Online /e-forms for customerso Annual report FY21 digitally
communicated to all stakeholderso Printers configured with default
double side printing
Digitization
CSR initiatives
o 310 Kgs of e-waste was recycled/ refurbished/disposed in an environmentally controlled manner, conforming to the guidelines of E-Waste (Management) Rules, 2016
o Donated old IT assets to recycling agencies for helping under-privileged sections of the society
o Segregation and proper disposal of waste - dry and wet
o No single-use plastics
Use of bio-degradable garbage bags Cafeteria with reusable plates, cutlery, wooden
stirrers etc. Conference / meetings rooms with glass bottles
and cups Employees encouraged to bring their own
mugs/glass
Business travelo 17 city forests in over 45,000 sq.ft.
area using the Miyawaki method. Over 50 different native species used
o Over last three years, 41,695 trees have been planted
o Plans to expand to support solar on schools and water rejuvenation projects
o 40+ video conferencing rooms setup to reduce travel
Environment Social Governance
5 pillarsof ESG
Ethical Conduct
Responsible Investment
Diversity, Equity & Inclusion
Holistic Living
Sustainable Operations

Page 40
Performance Snapshot
Our Strategy
Annexures
India Life Insurance
Managing Covid-19
Customer Centricity
India Life Insurance6
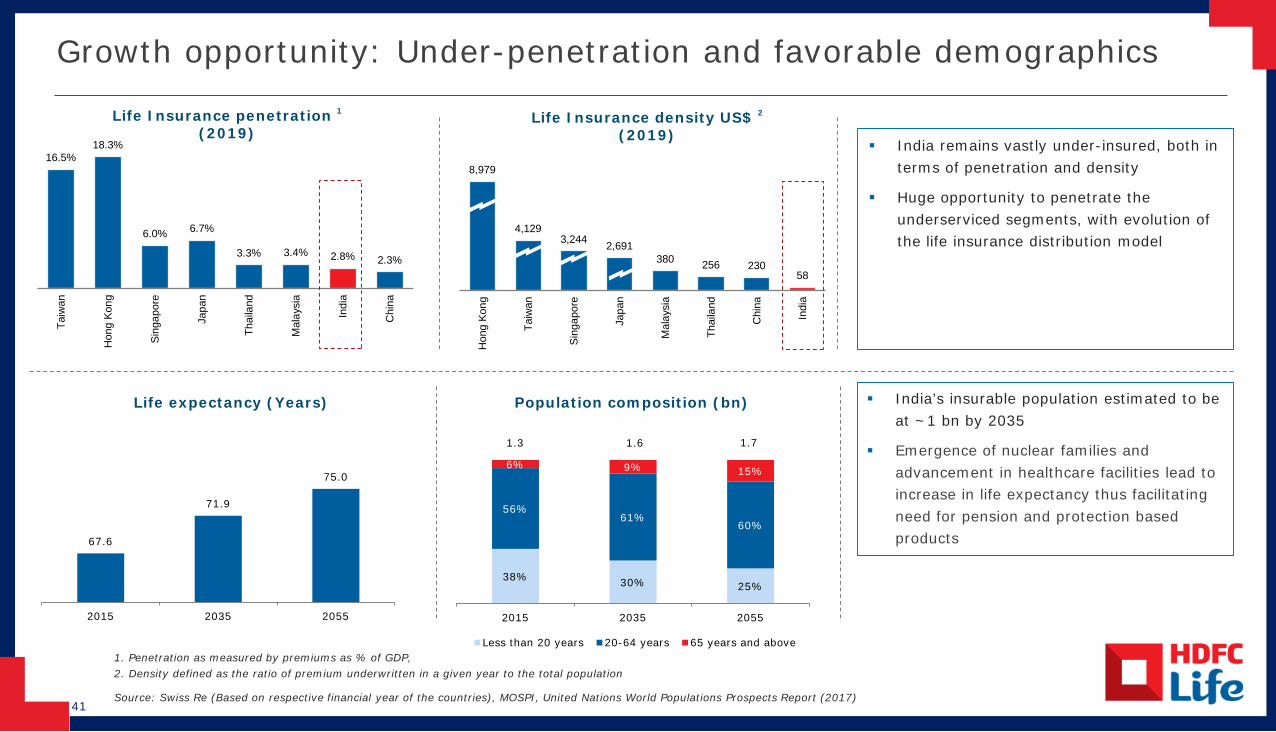
41
Growth opportunity: Under-penetration and favorable demographics
8,979
4,1293,244 2,691
380 256 23058
Hon
g Ko
ng
Taiw
an
Sing
apor
e
Japa
n
Mal
aysi
a
Thai
land
Chi
na
Indi
a
India remains vastly under-insured, both in terms of penetration and density
Huge opportunity to penetrate the underserviced segments, with evolution of the life insurance distribution model
1. Penetration as measured by premiums as % of GDP,2. Density defined as the ratio of premium underwritten in a given year to the total population
Source: Swiss Re (Based on respective financial year of the countries), MOSPI, United Nations World Populations Prospects Report (2017)
Life Insurance penetration 1(2019)
16.5%18.3%
6.0% 6.7%
3.3% 3.4% 2.8% 2.3%
Taiw
an
Hon
g Ko
ng
Sing
apor
e
Japa
n
Thai
land
Mal
aysi
a
Indi
a
Chi
na
Life Insurance density US$ 2
(2019)
67.6
71.9
75.0
2015 2035 2055
Life expectancy (Years) Population composition (bn)
38% 30% 25%
56%61%
60%
6% 9% 15%
2015 2035 2055
Less than 20 years 20-64 years 65 years and above
1.3 1.6 1.7
India’s insurable population estimated to be at ~1 bn by 2035
Emergence of nuclear families and advancement in healthcare facilities lead to increase in life expectancy thus facilitating need for pension and protection based products
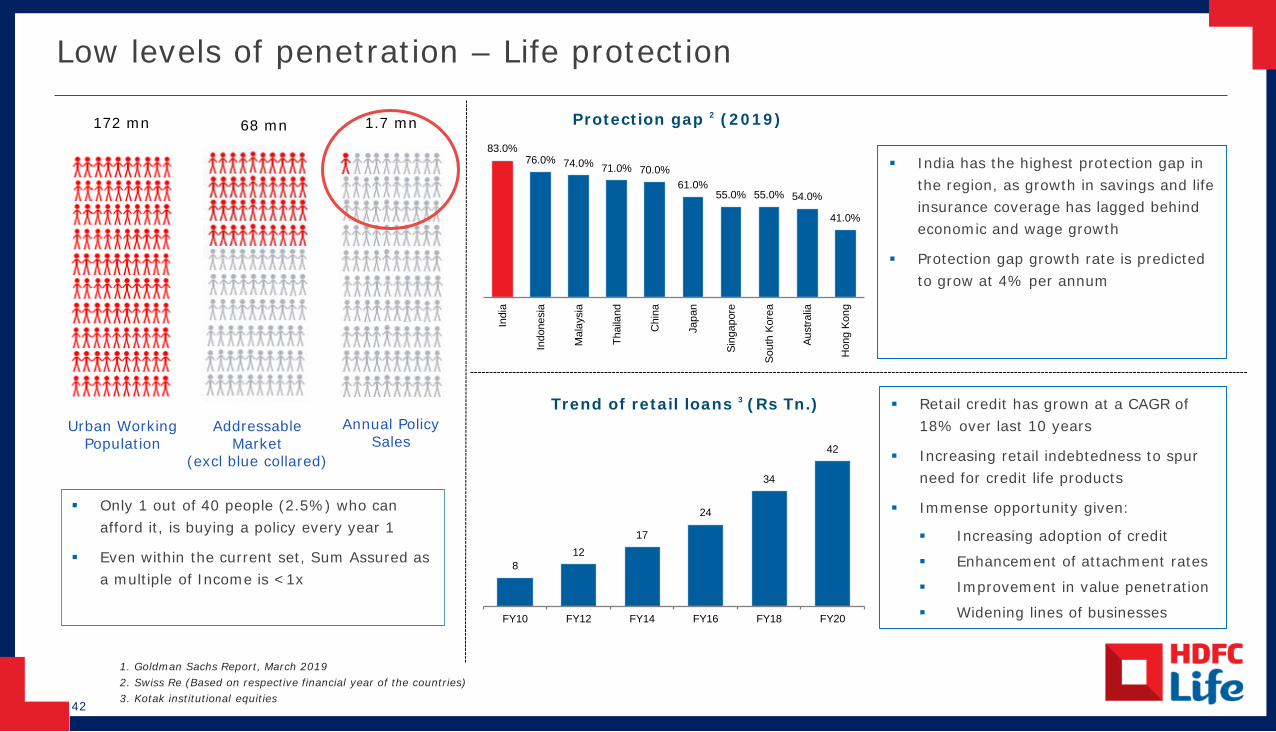
42
Low levels of penetration – Life protection
Urban Working Population
172 mn 68 mn
AddressableMarket
(excl blue collared)
1.7 mn
Annual Policy Sales
Only 1 out of 40 people (2.5%) who can afford it, is buying a policy every year 1
Even within the current set, Sum Assured as a multiple of Income is <1x
1. Goldman Sachs Report, March 2019 2. Swiss Re (Based on respective financial year of the countries) 3. Kotak institutional equities
India has the highest protection gap in the region, as growth in savings and life insurance coverage has lagged behind economic and wage growth
Protection gap growth rate is predicted to grow at 4% per annum
83.0%76.0% 74.0% 71.0% 70.0%
61.0% 55.0% 55.0% 54.0%
41.0%
Indi
a
Indo
nesi
a
Mal
aysi
a
Thai
land
Chi
na
Japa
n
Sing
apor
e
Sout
h Ko
rea
Aust
ralia
Hon
g Ko
ng
Protection gap 2 (2019)
812
17
24
34
42
FY10 FY12 FY14 FY16 FY18 FY20
Trend of retail loans 3 (Rs Tn.) Retail credit has grown at a CAGR of 18% over last 10 years
Increasing retail indebtedness to spur need for credit life products
Immense opportunity given:
Increasing adoption of credit
Enhancement of attachment rates
Improvement in value penetration
Widening lines of businesses

43
Macro opportunity – Retiral solutions
Improvements in life expectancy will lead to an average post retirement period of 20 years
India’s pension market is under-penetrated at 4.8% of GDP
4.8
43.256.4 60.8
120.5130.7
India Hong Kong South Africa Japan USA Australia
Pension Assets / GDP Ratio
India Hong Kong South Africa Japan USA Australia
Source: Milliman Asia Retirement Report 2017; Survey by NSSO, Ministry of statistics and Programme implementation Crisil PFRDA, Census of India, UN Population Estimates
Average household size has decreased from 4.6 in 2001 to 3.9 in 2018
Total Pension AUM is expected to grow to Rs 118 Tn by 2030 (about 1/4th accounted by NPS)
Mandatory schemes to increase coverage for both unorganized and organized sectors
16 17
19 20
18 18
22 22
1995-2000 2000-05 2011-12 2030E
Life expectancy at age 60
Males FemalesElderly population is expected to almost triple by 2050
26% 23% 19%
67% 68% 68%
7% 9% 14%
2020 2030 2050
Ageing population
Age <15 Yrs Age 15-65 Yrs Age >65 Yrs
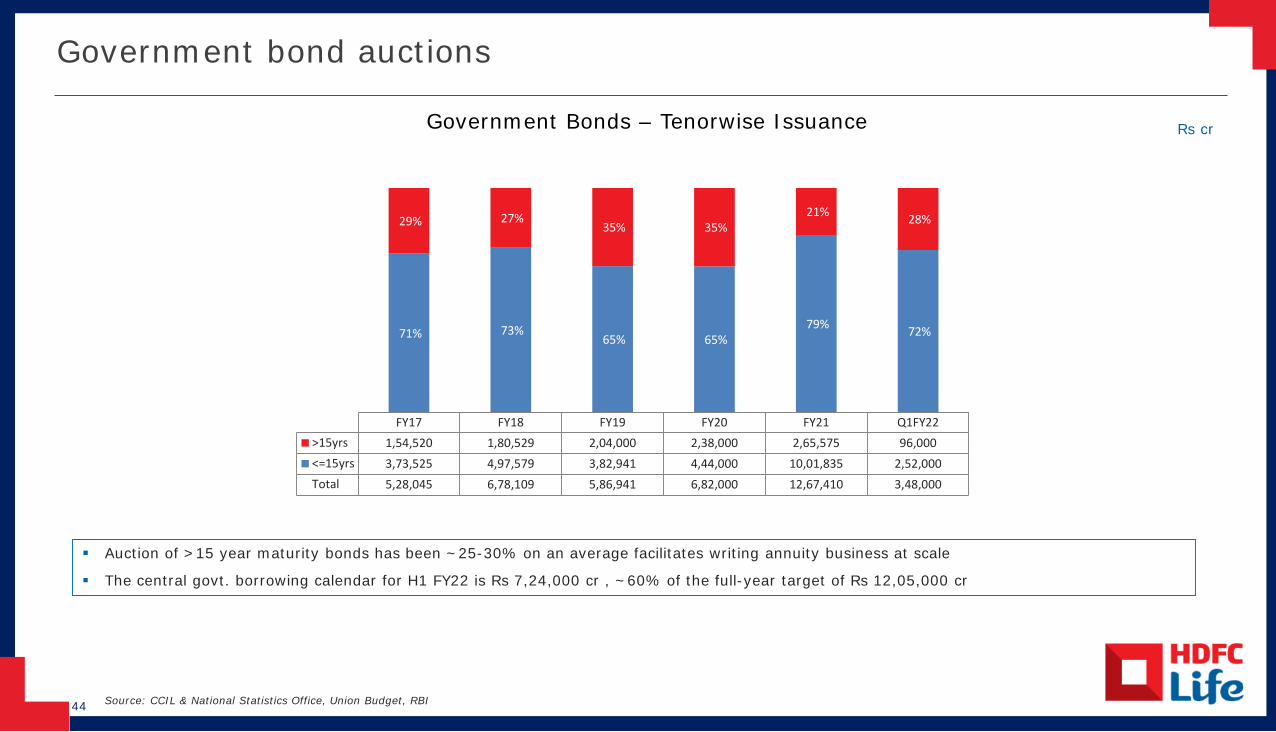
44
Government bond auctions
Source: CCIL & National Statistics Office, Union Budget, RBI
Auction of >15 year maturity bonds has been ~25-30% on an average facilitates writing annuity business at scale
The central govt. borrowing calendar for H1 FY22 is Rs 7,24,000 cr , ~60% of the full-year target of Rs 12,05,000 cr
Rs crGovernment Bonds – Tenorwise Issuance
FY17 FY18 FY19 FY20 FY21 Q1FY22>15yrs 1,54,520 1,80,529 2,04,000 2,38,000 2,65,575 96,000<=15yrs 3,73,525 4,97,579 3,82,941 4,44,000 10,01,835 2,52,000Total 5,28,045 6,78,109 5,86,941 6,82,000 12,67,410 3,48,000
71% 73%65% 65%
79% 72%
29% 27%35% 35%
21% 28%
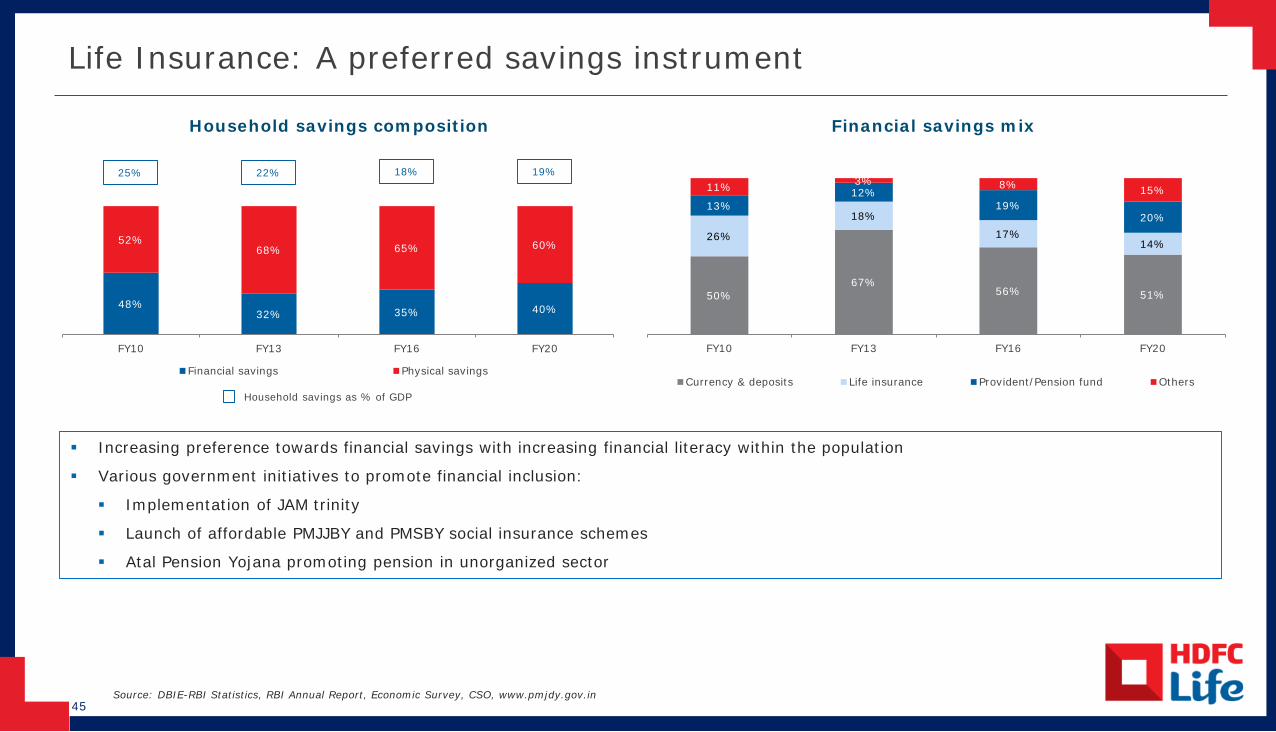
45
Life Insurance: A preferred savings instrument
Source: DBIE-RBI Statistics, RBI Annual Report, Economic Survey, CSO, www.pmjdy.gov.in
Financial savings mix
Increasing preference towards financial savings with increasing financial literacy within the population
Various government initiatives to promote financial inclusion:
Implementation of JAM trinity
Launch of affordable PMJJBY and PMSBY social insurance schemes
Atal Pension Yojana promoting pension in unorganized sector
Household savings composition
48%32% 35% 40%
52%68% 65% 60%
FY10 FY13 FY16 FY20
Financial savings Physical savings
25% 22%
Household savings as % of GDP
50%67%
56% 51%
26%
18%
17%14%
13%12%
19%20%
11% 3% 8% 15%
FY10 FY13 FY16 FY20
Currency & deposits Life insurance Provident/Pension fund Others
18% 19%
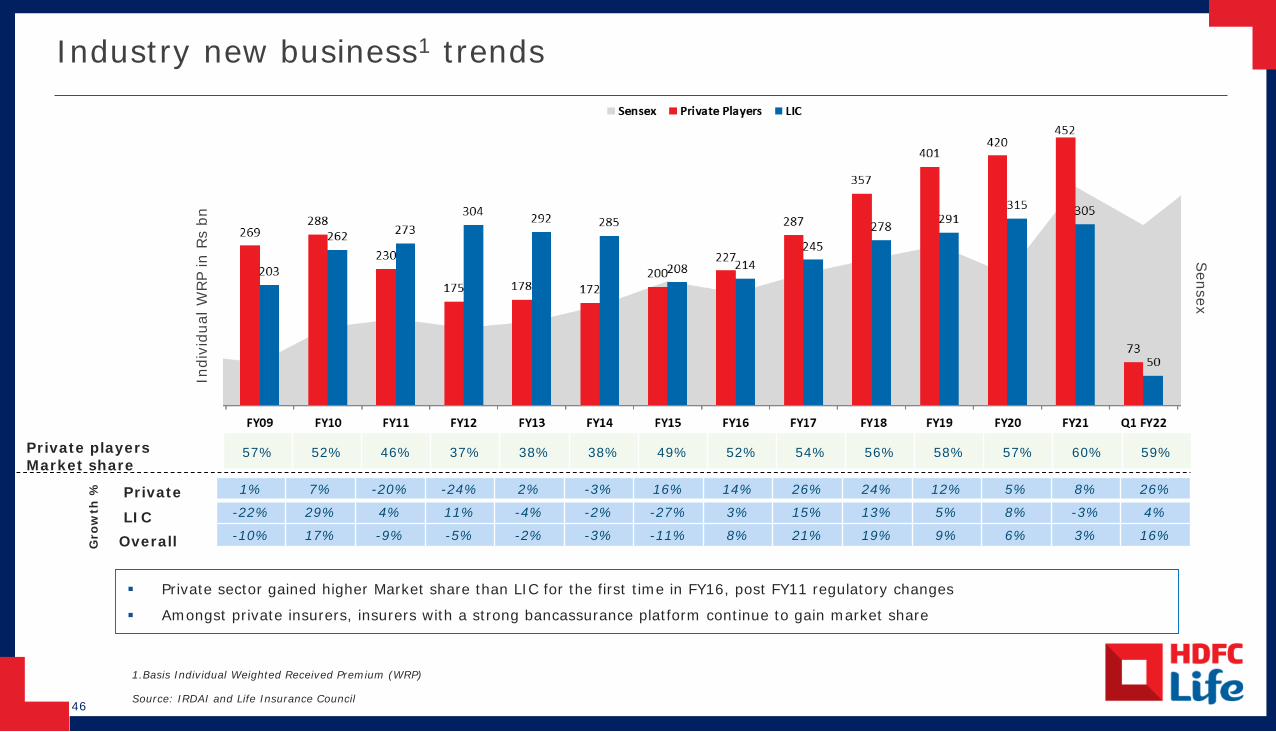
46
Industry new business1 trends
1.Basis Individual Weighted Received Premium (WRP)
Source: IRDAI and Life Insurance Council
Private sector gained higher Market share than LIC for the first time in FY16, post FY11 regulatory changes
Amongst private insurers, insurers with a strong bancassurance platform continue to gain market share
57% 52% 46% 37% 38% 38% 49% 52% 54% 56% 58% 57% 60% 59%Private players Market share
1% 7% -20% -24% 2% -3% 16% 14% 26% 24% 12% 5% 8% 26%
-22% 29% 4% 11% -4% -2% -27% 3% 15% 13% 5% 8% -3% 4%
-10% 17% -9% -5% -2% -3% -11% 8% 21% 19% 9% 6% 3% 16%
Gro
wth
% PrivateLICOverall
Indi
vidu
al W
RP
in R
s bn
Sensex
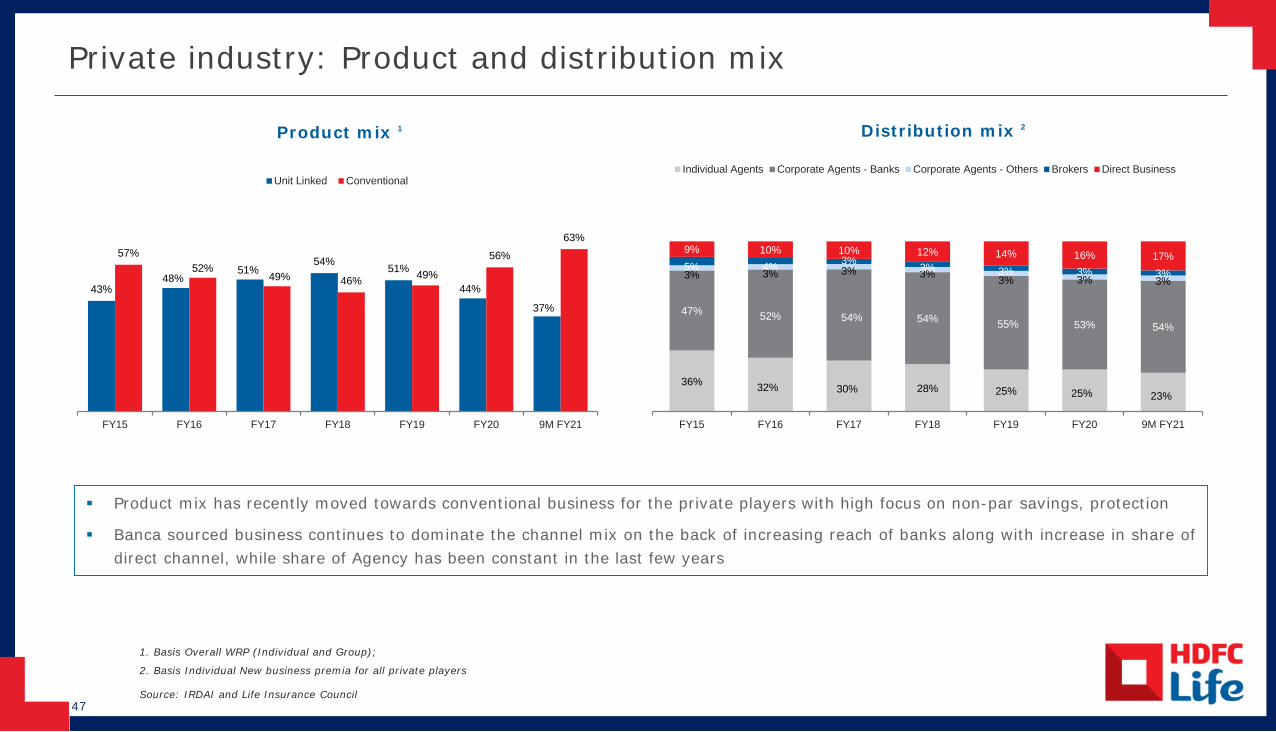
47
Private industry: Product and distribution mix
43%48%
51%54% 51%
44%
37%
57%52%
49% 46% 49%
56%63%
FY15 FY16 FY17 FY18 FY19 FY20 9M FY21
Unit Linked Conventional
Product mix has recently moved towards conventional business for the private players with high focus on non-par savings, protection
Banca sourced business continues to dominate the channel mix on the back of increasing reach of banks along with increase in share ofdirect channel, while share of Agency has been constant in the last few years
1. Basis Overall WRP (Individual and Group);
2. Basis Individual New business premia for all private players
Source: IRDAI and Life Insurance Council
Distribution mix 2Product mix 1
36% 32% 30% 28% 25% 25% 23%
47% 52% 54% 54% 55% 53% 54%
3% 3% 3% 3% 3% 3% 3%5% 4% 3% 3% 3% 3% 3%
9% 10% 10% 12% 14% 16% 17%
FY15 FY16 FY17 FY18 FY19 FY20 9M FY21
Individual Agents Corporate Agents - Banks Corporate Agents - Others Brokers Direct Business

Appendix
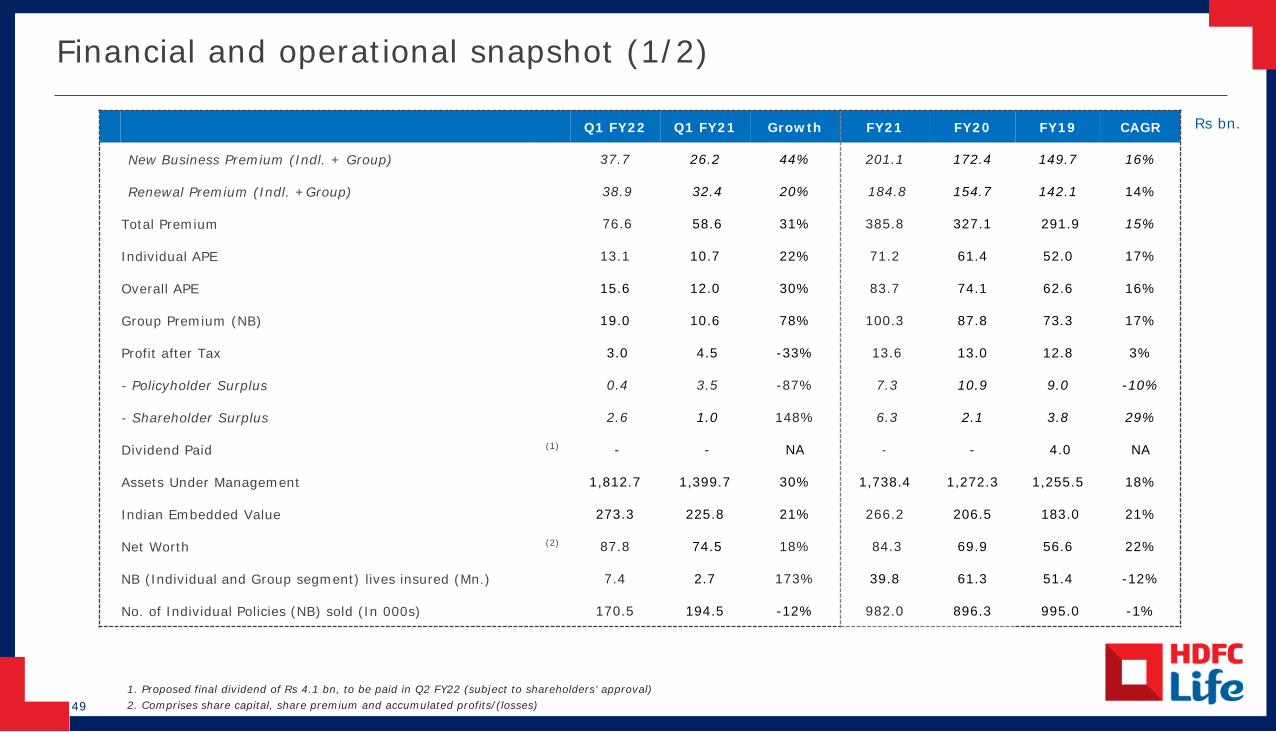
49
Financial and operational snapshot (1/2)
1. Proposed final dividend of Rs 4.1 bn, to be paid in Q2 FY22 (subject to shareholders’ approval)2. Comprises share capital, share premium and accumulated profits/(losses)
Rs bn.Q1 FY22 Q1 FY21 Growth FY21 FY20 FY19 CAGR
New Business Premium (Indl. + Group) 37.7 26.2 44% 201.1 172.4 149.7 16%
Renewal Premium (Indl. +Group) 38.9 32.4 20% 184.8 154.7 142.1 14%
Total Premium 76.6 58.6 31% 385.8 327.1 291.9 15%
Individual APE 13.1 10.7 22% 71.2 61.4 52.0 17%
Overall APE 15.6 12.0 30% 83.7 74.1 62.6 16%
Group Premium (NB) 19.0 10.6 78% 100.3 87.8 73.3 17%
Profit after Tax 3.0 4.5 -33% 13.6 13.0 12.8 3%
- Policyholder Surplus 0.4 3.5 -87% 7.3 10.9 9.0 -10%
- Shareholder Surplus 2.6 1.0 148% 6.3 2.1 3.8 29%
Dividend Paid (1) - - NA - - 4.0 NA
Assets Under Management 1,812.7 1,399.7 30% 1,738.4 1,272.3 1,255.5 18%
Indian Embedded Value 273.3 225.8 21% 266.2 206.5 183.0 21%
Net Worth (2) 87.8 74.5 18% 84.3 69.9 56.6 22%
NB (Individual and Group segment) lives insured (Mn.) 7.4 2.7 173% 39.8 61.3 51.4 -12%
No. of Individual Policies (NB) sold (In 000s) 170.5 194.5 -12% 982.0 896.3 995.0 -1%
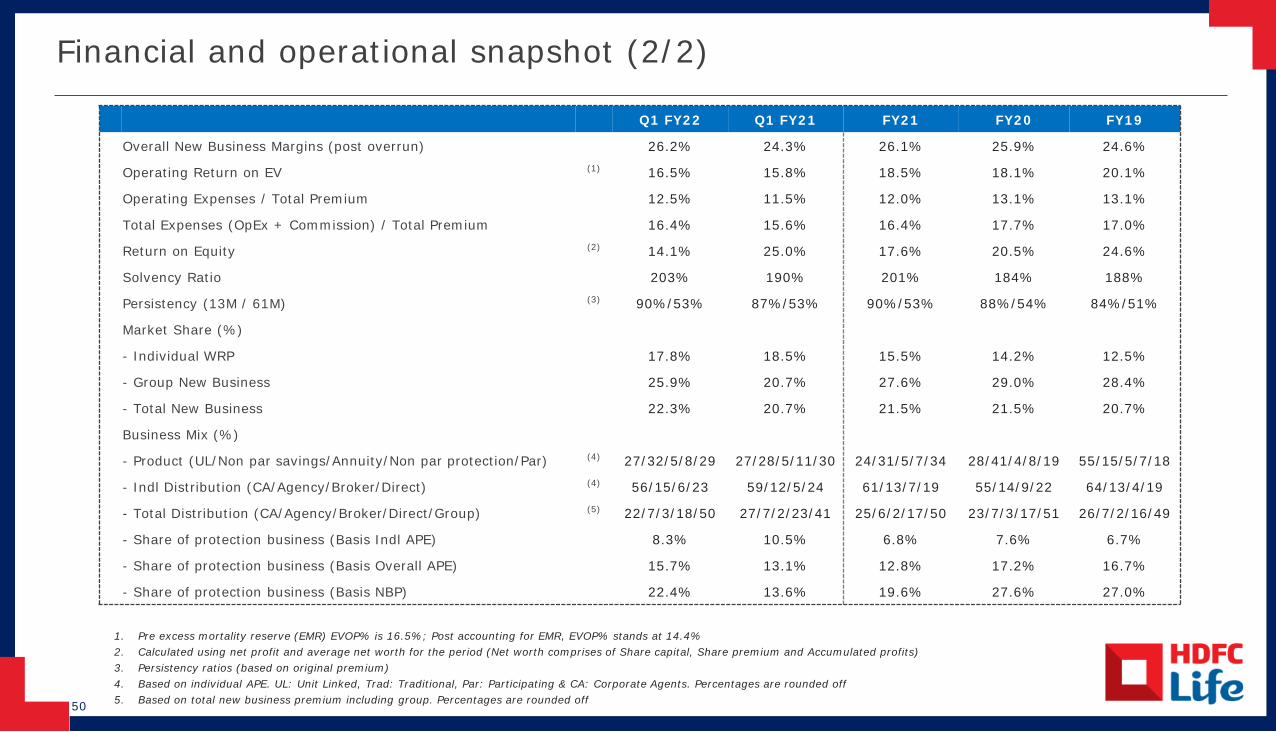
50
Financial and operational snapshot (2/2)
1. Pre excess mortality reserve (EMR) EVOP% is 16.5%; Post accounting for EMR, EVOP% stands at 14.4%2. Calculated using net profit and average net worth for the period (Net worth comprises of Share capital, Share premium and Accumulated profits)3. Persistency ratios (based on original premium)4. Based on individual APE. UL: Unit Linked, Trad: Traditional, Par: Participating & CA: Corporate Agents. Percentages are rounded off 5. Based on total new business premium including group. Percentages are rounded off
Q1 FY22 Q1 FY21 FY21 FY20 FY19
Overall New Business Margins (post overrun) 26.2% 24.3% 26.1% 25.9% 24.6%
Operating Return on EV (1) 16.5% 15.8% 18.5% 18.1% 20.1%
Operating Expenses / Total Premium 12.5% 11.5% 12.0% 13.1% 13.1%
Total Expenses (OpEx + Commission) / Total Premium 16.4% 15.6% 16.4% 17.7% 17.0%
Return on Equity (2) 14.1% 25.0% 17.6% 20.5% 24.6%
Solvency Ratio 203% 190% 201% 184% 188%
Persistency (13M / 61M) (3) 90%/53% 87%/53% 90%/53% 88%/54% 84%/51%
Market Share (%)
- Individual WRP 17.8% 18.5% 15.5% 14.2% 12.5%
- Group New Business 25.9% 20.7% 27.6% 29.0% 28.4%
- Total New Business 22.3% 20.7% 21.5% 21.5% 20.7%
Business Mix (%)
- Product (UL/Non par savings/Annuity/Non par protection/Par) (4) 27/32/5/8/29 27/28/5/11/30 24/31/5/7/34 28/41/4/8/19 55/15/5/7/18
- Indl Distribution (CA/Agency/Broker/Direct) (4) 56/15/6/23 59/12/5/24 61/13/7/19 55/14/9/22 64/13/4/19
- Total Distribution (CA/Agency/Broker/Direct/Group) (5) 22/7/3/18/50 27/7/2/23/41 25/6/2/17/50 23/7/3/17/51 26/7/2/16/49
- Share of protection business (Basis Indl APE) 8.3% 10.5% 6.8% 7.6% 6.7%
- Share of protection business (Basis Overall APE) 15.7% 13.1% 12.8% 17.2% 16.7%
- Share of protection business (Basis NBP) 22.4% 13.6% 19.6% 27.6% 27.0%
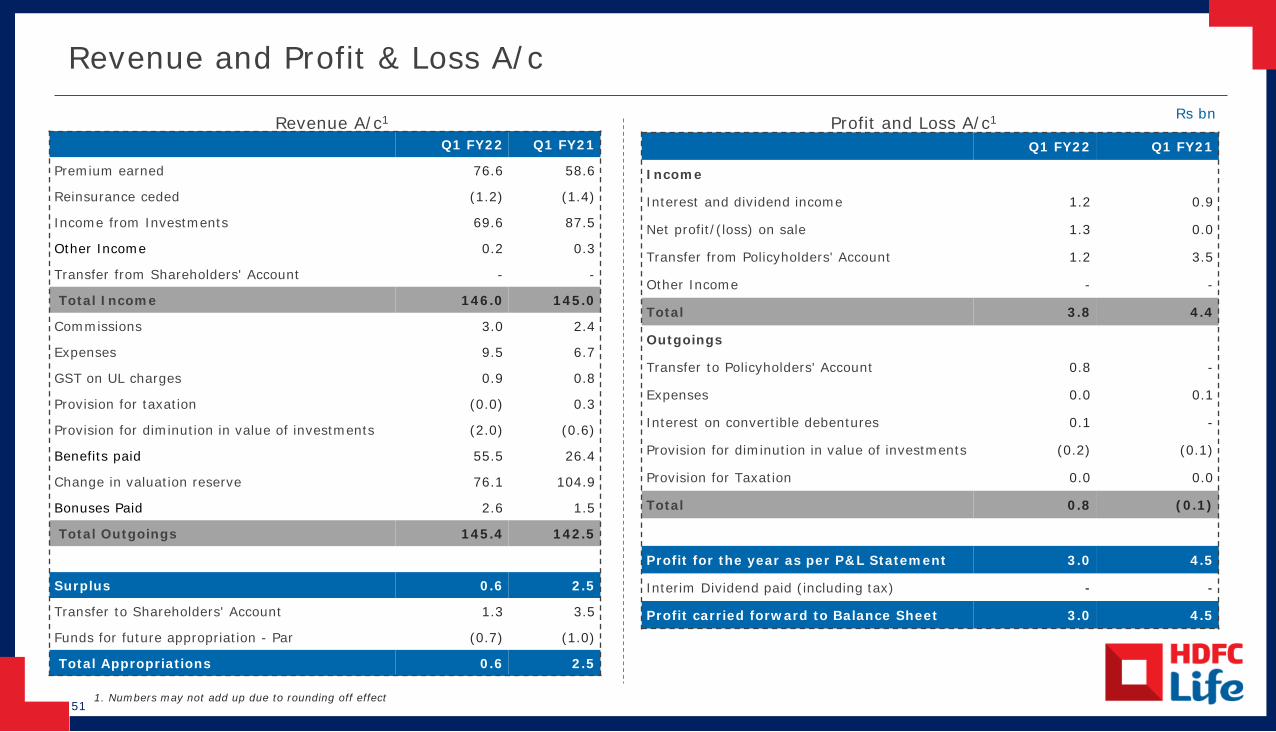
51
Revenue and Profit & Loss A/cRs bnRevenue A/c1 Profit and Loss A/c1
1. Numbers may not add up due to rounding off effect
Q1 FY22 Q1 FY21
Premium earned 76.6 58.6
Reinsurance ceded (1.2) (1.4)
Income from Investments 69.6 87.5
Other Income 0.2 0.3
Transfer from Shareholders' Account - -
Total Income 146.0 145.0
Commissions 3.0 2.4
Expenses 9.5 6.7
GST on UL charges 0.9 0.8
Provision for taxation (0.0) 0.3
Provision for diminution in value of investments (2.0) (0.6)
Benefits paid 55.5 26.4
Change in valuation reserve 76.1 104.9
Bonuses Paid 2.6 1.5
Total Outgoings 145.4 142.5
Surplus 0.6 2.5
Transfer to Shareholders' Account 1.3 3.5
Funds for future appropriation - Par (0.7) (1.0)
Total Appropriations 0.6 2.5
Q1 FY22 Q1 FY21
Income
Interest and dividend income 1.2 0.9
Net profit/(loss) on sale 1.3 0.0
Transfer from Policyholders' Account 1.2 3.5
Other Income - -
Total 3.8 4.4
Outgoings
Transfer to Policyholders' Account 0.8 -
Expenses 0.0 0.1
Interest on convertible debentures 0.1 -
Provision for diminution in value of investments (0.2) (0.1)
Provision for Taxation 0.0 0.0
Total 0.8 (0.1)
Profit for the year as per P&L Statement 3.0 4.5
Interim Dividend paid (including tax) - -
Profit carried forward to Balance Sheet 3.0 4.5
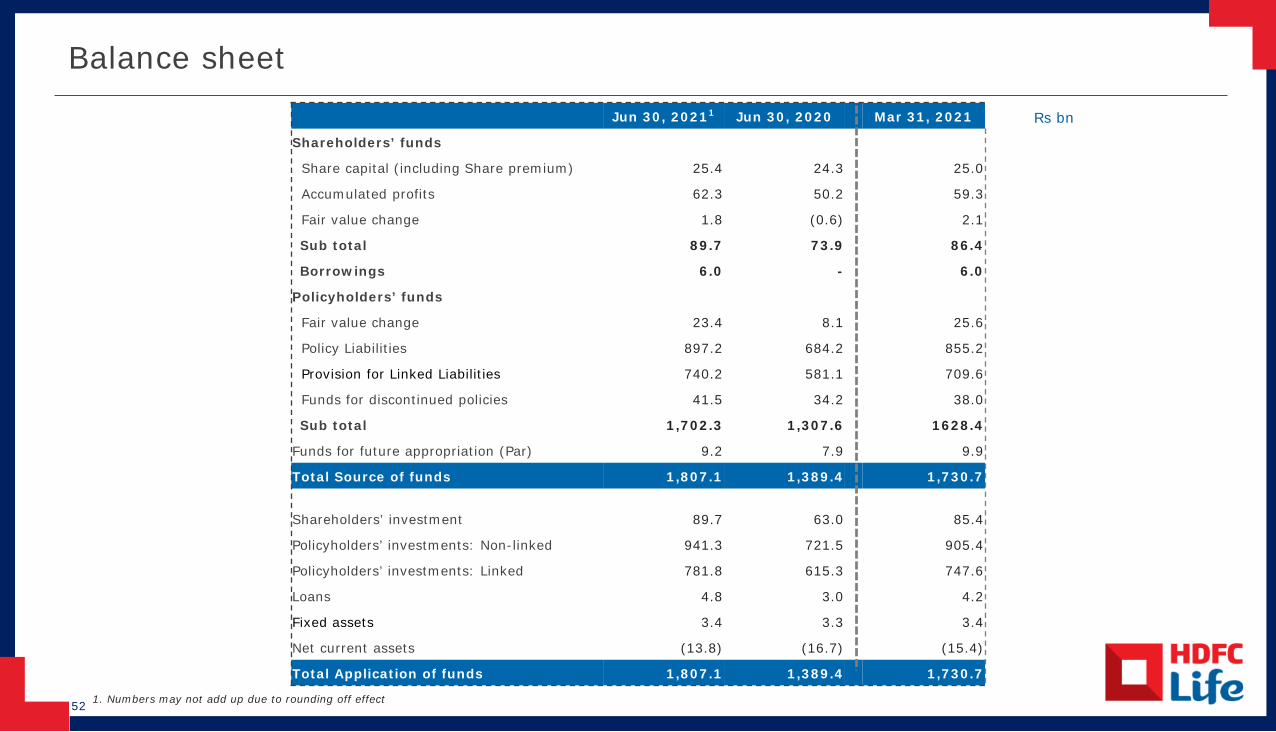
52
Balance sheet
Rs bn
1. Numbers may not add up due to rounding off effect
Jun 30, 20211 Jun 30, 2020 Mar 31, 2021
Shareholders’ funds
Share capital (including Share premium) 25.4 24.3 25.0
Accumulated profits 62.3 50.2 59.3
Fair value change 1.8 (0.6) 2.1
Sub total 89.7 73.9 86.4
Borrowings 6.0 - 6.0
Policyholders’ funds
Fair value change 23.4 8.1 25.6
Policy Liabilities 897.2 684.2 855.2
Provision for Linked Liabilities 740.2 581.1 709.6
Funds for discontinued policies 41.5 34.2 38.0
Sub total 1,702.3 1,307.6 1628.4
Funds for future appropriation (Par) 9.2 7.9 9.9
Total Source of funds 1,807.1 1,389.4 1,730.7
Shareholders’ investment 89.7 63.0 85.4
Policyholders’ investments: Non-linked 941.3 721.5 905.4
Policyholders’ investments: Linked 781.8 615.3 747.6
Loans 4.8 3.0 4.2
Fixed assets 3.4 3.3 3.4
Net current assets (13.8) (16.7) (15.4)
Total Application of funds 1,807.1 1,389.4 1,730.7
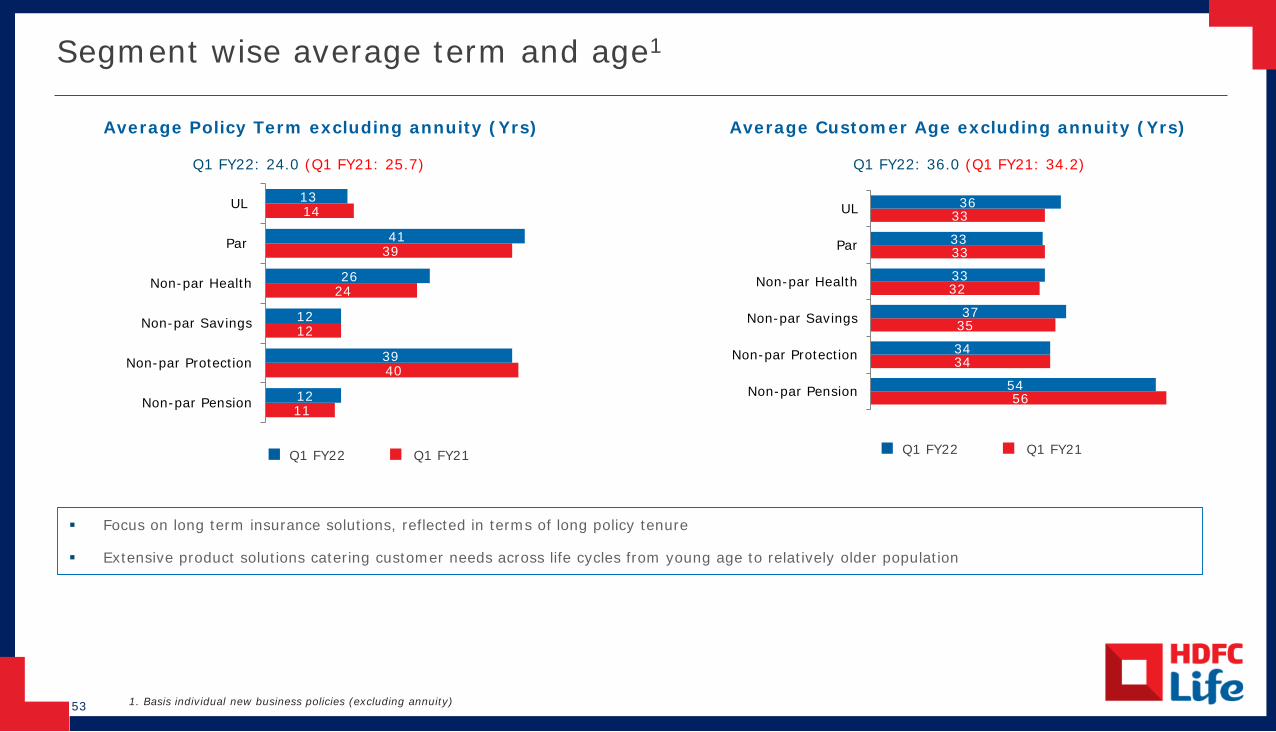
53
Segment wise average term and age1
Focus on long term insurance solutions, reflected in terms of long policy tenure
Extensive product solutions catering customer needs across life cycles from young age to relatively older population
1. Basis individual new business policies (excluding annuity)
Average Policy Term excluding annuity (Yrs) Average Customer Age excluding annuity (Yrs)
Q1 FY22: 24.0 (Q1 FY21: 25.7) Q1 FY22: 36.0 (Q1 FY21: 34.2)
Q1 FY22 Q1 FY21
56
34
35
32
33
33
54
34
37
33
33
36
Non-par Pension
Non-par Protection
Non-par Savings
Non-par Health
Par
UL
Q1 FY22 Q1 FY21
11
40
12
24
39
14
12
39
12
26
41
13
Non-par Pension
Non-par Protection
Non-par Savings
Non-par Health
Par
UL
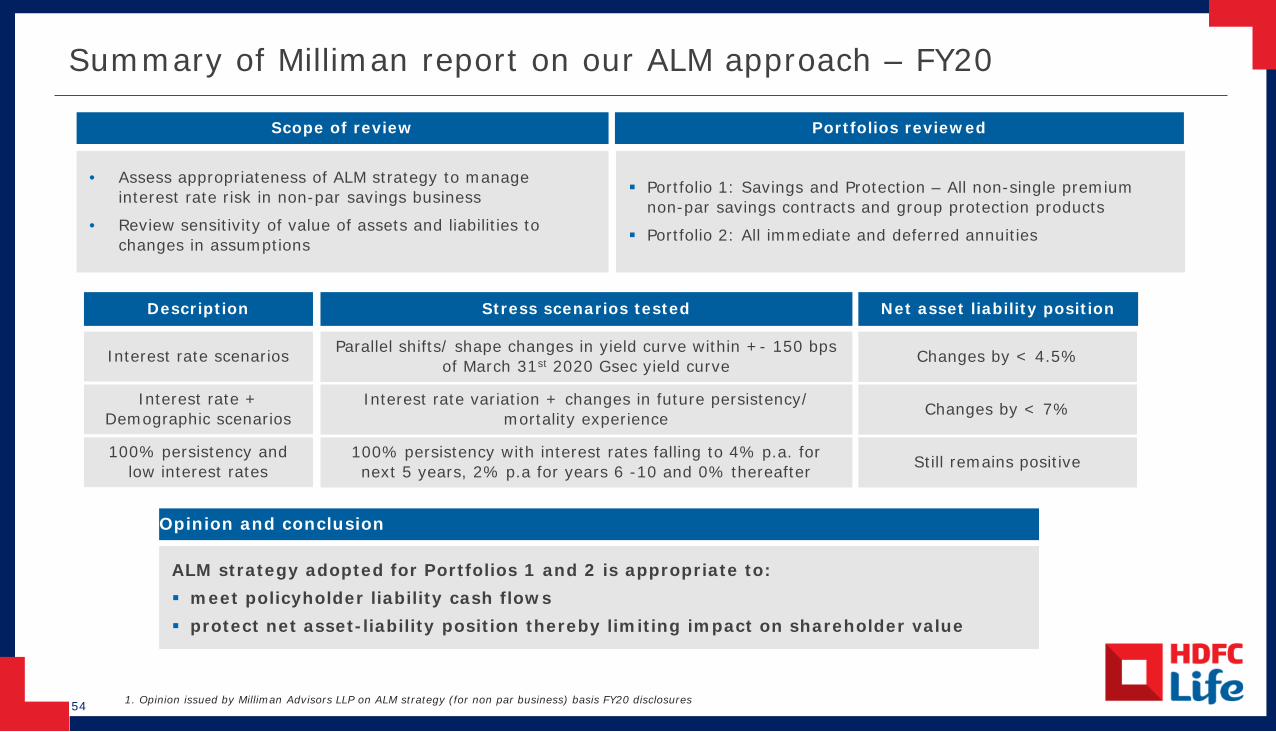
54
Summary of Milliman report on our ALM approach – FY20
• Assess appropriateness of ALM strategy to manage interest rate risk in non-par savings business
• Review sensitivity of value of assets and liabilities to changes in assumptions
Scope of review Portfolios reviewed
ALM strategy adopted for Portfolios 1 and 2 is appropriate to: meet policyholder liability cash flows protect net asset-liability position thereby limiting impact on shareholder value
Opinion and conclusion
1. Opinion issued by Milliman Advisors LLP on ALM strategy (for non par business) basis FY20 disclosures
Portfolio 1: Savings and Protection – All non-single premium non-par savings contracts and group protection products
Portfolio 2: All immediate and deferred annuities
Stress scenarios tested
Parallel shifts/ shape changes in yield curve within +- 150 bps of March 31st 2020 Gsec yield curve
Interest rate variation + changes in future persistency/ mortality experience
100% persistency with interest rates falling to 4% p.a. for next 5 years, 2% p.a for years 6 -10 and 0% thereafter
Description
Interest rate scenarios
Interest rate + Demographic scenarios
100% persistency and low interest rates
Changes by < 4.5%
Changes by < 7%
Net asset liability position
Still remains positive
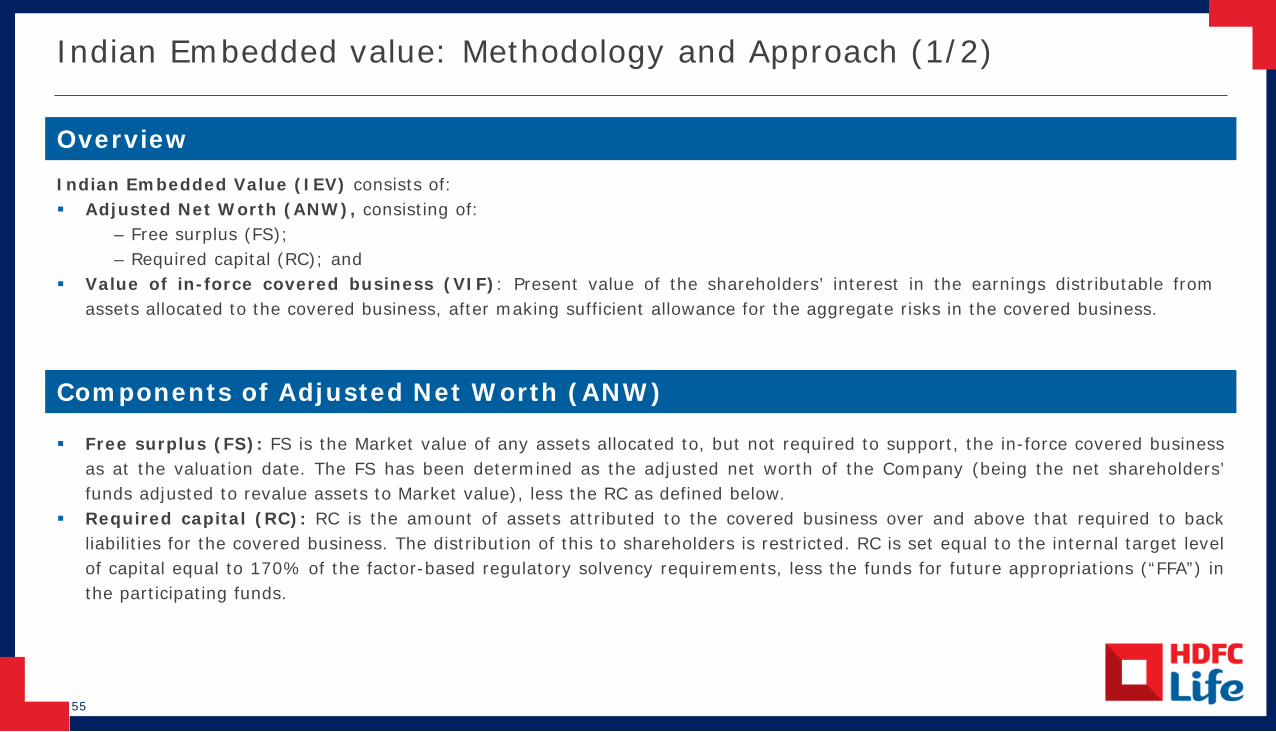
55
Indian Embedded value: Methodology and Approach (1/2)
Overview Indian Embedded Value (IEV) consists of: Adjusted Net Worth (ANW), consisting of:
– Free surplus (FS);– Required capital (RC); and
Value of in-force covered business (VIF): Present value of the shareholders’ interest in the earnings distributable fromassets allocated to the covered business, after making sufficient allowance for the aggregate risks in the covered business.
Free surplus (FS): FS is the Market value of any assets allocated to, but not required to support, the in-force covered businessas at the valuation date. The FS has been determined as the adjusted net worth of the Company (being the net shareholders’funds adjusted to revalue assets to Market value), less the RC as defined below.
Required capital (RC): RC is the amount of assets attributed to the covered business over and above that required to backliabilities for the covered business. The distribution of this to shareholders is restricted. RC is set equal to the internal target levelof capital equal to 170% of the factor-based regulatory solvency requirements, less the funds for future appropriations (“FFA”) inthe participating funds.
Components of Adjusted Net Worth (ANW)
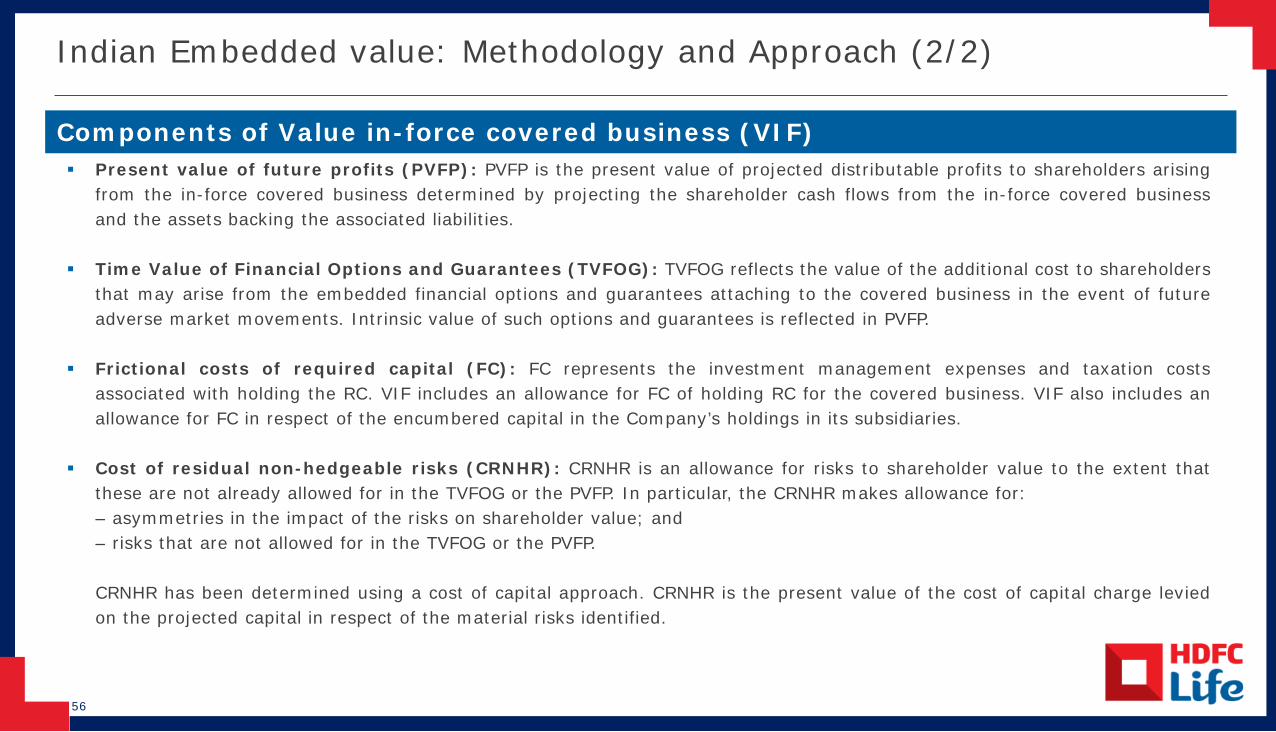
56
Indian Embedded value: Methodology and Approach (2/2)
Present value of future profits (PVFP): PVFP is the present value of projected distributable profits to shareholders arisingfrom the in-force covered business determined by projecting the shareholder cash flows from the in-force covered businessand the assets backing the associated liabilities.
Time Value of Financial Options and Guarantees (TVFOG): TVFOG reflects the value of the additional cost to shareholdersthat may arise from the embedded financial options and guarantees attaching to the covered business in the event of futureadverse market movements. Intrinsic value of such options and guarantees is reflected in PVFP.
Frictional costs of required capital (FC): FC represents the investment management expenses and taxation costsassociated with holding the RC. VIF includes an allowance for FC of holding RC for the covered business. VIF also includes anallowance for FC in respect of the encumbered capital in the Company’s holdings in its subsidiaries.
Cost of residual non-hedgeable risks (CRNHR): CRNHR is an allowance for risks to shareholder value to the extent thatthese are not already allowed for in the TVFOG or the PVFP. In particular, the CRNHR makes allowance for:– asymmetries in the impact of the risks on shareholder value; and– risks that are not allowed for in the TVFOG or the PVFP.
CRNHR has been determined using a cost of capital approach. CRNHR is the present value of the cost of capital charge leviedon the projected capital in respect of the material risks identified.
Components of Value in-force covered business (VIF)
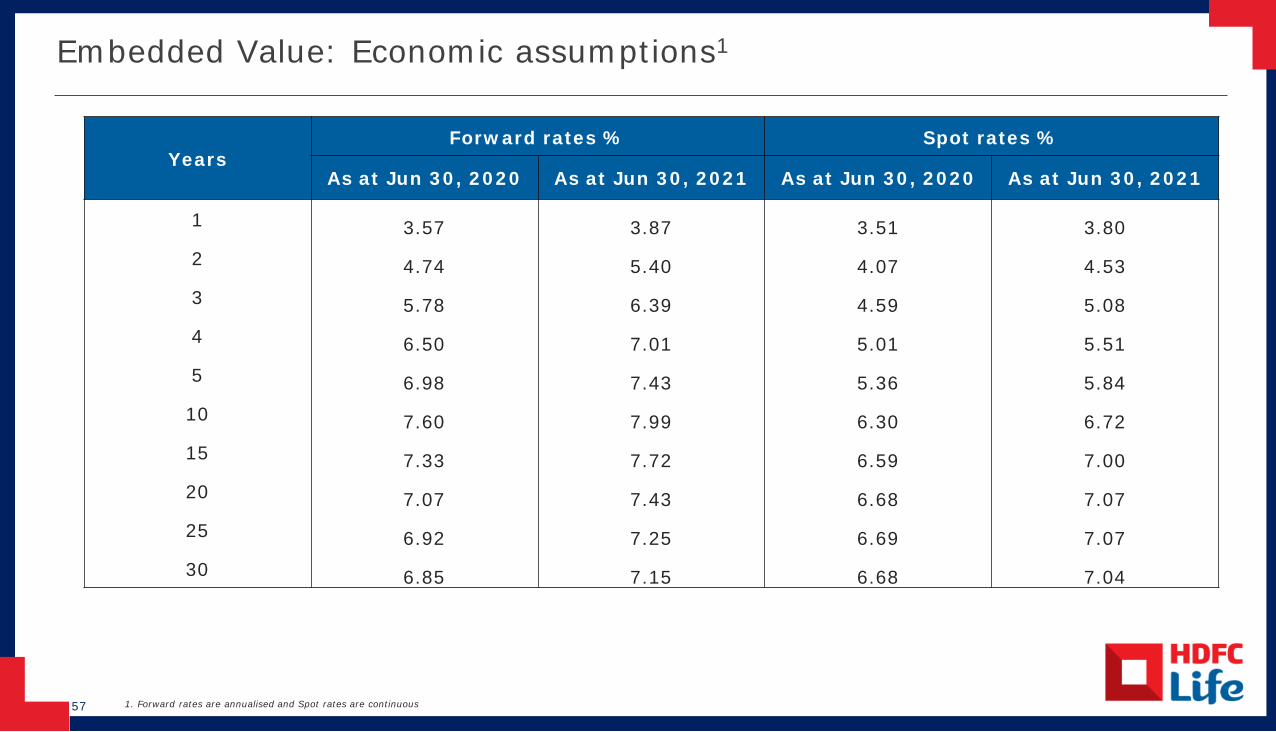
57
Embedded Value: Economic assumptions1
YearsForward rates % Spot rates %
As at Jun 30, 2020 As at Jun 30, 2021 As at Jun 30, 2020 As at Jun 30, 2021
1 3.57 3.87 3.51 3.802 4.74 5.40 4.07 4.533 5.78 6.39 4.59 5.084 6.50 7.01 5.01 5.515 6.98 7.43 5.36 5.8410 7.60 7.99 6.30 6.7215 7.33 7.72 6.59 7.0020 7.07 7.43 6.68 7.0725 6.92 7.25 6.69 7.0730 6.85 7.15 6.68 7.04
1. Forward rates are annualised and Spot rates are continuous

58
Glossary (Part 1)
APE (Annualized Premium Equivalent) - The sum of annualized first year regular premiums and 10% weighted single premiums and single premium top-ups
Backbook surplus – Surplus accumulated from historical business written
Conservation ratio - Ratio of current year renewal premiums to previous year's renewal premium and first year premium
Embedded Value Operating Profit (“EVOP”) – Measure of the increase in the EV during any given period, excluding the impact on EV due to external factors like changes in economic variables and shareholder-related actions like capital injection or dividend pay-outs.
First year premiums - Regular premiums received during the year for all modes of payments chosen by the customer which are still in the first year. For example, for a monthly mode policy sold in March 2021, the first instalment would fall into first year premiums for 2020-21 and the remaining 11 instalments in the first year would be first year premiums in 2021-22
New business received premium - The sum of first year premium and single premium.
New business strain – Strain on the business created due to revenues received in the first policy year not being able to cover for expenses incurred
59
Glossary (Part 2)
Operating expense - It includes all expenses that are incurred for the purposes of sourcing new business and expenses incurred for policy servicing (which are known as maintenance costs) including shareholders’ expenses. It does not include commission.
Operating expense ratio - Ratio of operating expense (including shareholders’ expenses) to total premium
Proprietary channels – Proprietary channels include agency and direct
Protection Share - Share of protection includes annuity and health
Persistency – The proportion of business retained from the business underwritten. The ratio is measured in terms of number of policies and premiums underwritten.
Renewal premiums - Regular recurring premiums received after the first year
Solvency ratio - Ratio of available solvency Margin to required solvency Margins
Total premiums - Total received premiums during the year including first year, single and renewal premiums for individual and group business
Weighted received premium (WRP) - The sum of first year premium and 10% weighted single premiums and single premium top-ups
60
Disclaimer
This presentation is for information purposes only and does not constitute an offer or invitation to sell or the solicitation of an offer or invitation to purchase any securities (“Securities”) of HDFCLife Insurance Company Limited (“HDFC Life” or the “Company”) in India, the United States, Canada, the People’s Republic of China, Japan or any other jurisdiction. This presentation is not forpublication or distribution, directly or indirectly, in or into the United States (including its territories and possessions, any state of the United States and the District of Columbia). The securities ofthe Company may not be offered or sold in the United States in the absence of registration or an exemption from registration under the U.S. Securities Act of 1933, as amended. The Companydoes not intend to register any securities in the United States. You confirm that you are either: (i) a “qualified institutional buyer” as defined in Rule 144A under the U.S. Securities Act of 1933,as amended, or (ii) outside the United States. By receiving this presentation, you are agreeing to be bound by the foregoing and below restrictions. Any failure to comply with these restrictionswill constitute a violation of applicable securities laws.
This presentation should not, nor should anything contained in it, form the basis of, or be relied upon in any connection with any contract or commitment whatsoever. The information containedin this presentation is strictly confidential and is intended solely for your reference and shall not be reproduced (in whole or in part), retransmitted, summarized or distributed to any otherpersons without Company’s prior written consent.
The Company may alter, modify or otherwise change in any manner the contents of this presentation, without obligation to notify you or any person of such revision or changes. This presentationmay contain forward‐looking statements that involve risks and uncertainties. Forward‐looking statements are based on certain assumptions and expectations of future events. Actual futureperformance, outcomes and results may differ materially from those expressed in forward‐looking statements as a result of a number of risks, uncertainties and assumptions. Although Companybelieves that such forward‐looking statements are based on reasonable assumptions, it can give no assurance that your expectations will be met. Representative examples of factors that couldaffect the accuracy of forward-looking statements include (without limitation) the condition of and changes in India’s political and economic status, government policies, applicable laws, theinsurance sector in India, international and domestic events having a bearing on Company’s business, particularly in regard to the regulatory changes that are applicable to the life insurancesector in India, and such other factors beyond our control. You are cautioned not to place undue reliance on these forward-looking statements, which are based on knowledge, experience andcurrent view of Company’s management based on relevant facts and circumstances.
The data herein with respect to HDFC Life is based on a number of assumptions, and is subject to a number of known and unknown risks, which may cause HDFC Life’s actual results orperformance to differ materially from any projected future results or performance expressed or implied by such statements. Forecasts and hypothetical examples are subject to uncertainty andcontingencies outside Company’s control. Past performance is not a reliable indication of future performance.
This presentation has been prepared by the Company. No representation, warranty, express or implied, is made as to, and no reliance should be placed on, the fairness, accuracy , completenessor correctness of the information and opinions in this presentation. None of Company or any of its directors, officers, employees, agents or advisers, or any of their respective affiliates, advisersor representatives, undertake to update or revise any forward-looking statements, whether as a result of new information, future events or otherwise and none of them shall have any liability (innegligence or otherwise) for any loss howsoever arising from any use of this presentation or its contents or otherwise arising in connection with this presentation. Further, nothing in thispresentation should be construed as constituting legal, business, tax or financial advice or a recommendation regarding the securities. Before acting on any information you should consider theappropriateness of the information having regard to these matters, and in particular, you should seek independent financial advice.

Thank you