TRIDENT/CS/2019 August 3, 2019 The Manager Listing ... - NSE
12
TRIDENT/CS/2019 August 3, 2019 The Manager Listing Department National Stock Exchange of India Limited Exchange Plaza, Plot No. C/1, G Block Bandra Kurla Complex, Bandra (E) Mumbai – 400 051 The Manager Listing Department BSE Limited Phiroze Jeejeebhoy Towers Dalal Street Mumbai – 400 001 Scrip Code:- TRIDENT Scrip Code:- 521064 Dear Sir/ Madam Sub: Industry Outlook & Earnings Frequently asked questions Pursuant to Regulation 30 and other applicable provisions of SEBI (Listing Obligations and Disclosure Requirements) Regulations, 2015, we wish to inform you that to remain committed and transparent towards our stakeholders and maintain high corporate governance, the Company is providing herewith the latest updates on the Financial Results for Quarter ended on June 30, 2019, industry outlook, way forward and response to the specific questions that may be helpful to answer the queries regarding the business and financials of the Company. The document is attached herewith for your information and records please. A copy of the same is also available on the official website of the company at: https://www.tridentindia.com/webroot/reports/5d4582973c0f6_1564836503_Trident%20Ltd%20- %20Q1%20FY20%20FAQs%20and%20Industry%20Outlook.pdf This is for your information and records please. Thanking you Yours faithfully For Trident Limited (Ramandeep Kaur) Company Secretary ICSI Membership No.: F9160 Encl: As above
-
Upload
khangminh22 -
Category
Documents
-
view
5 -
download
0
Transcript of TRIDENT/CS/2019 August 3, 2019 The Manager Listing ... - NSE

TRIDENT/CS/2019 August 3, 2019
The Manager Listing Department
National Stock Exchange of India Limited
Exchange Plaza, Plot No. C/1, G Block Bandra Kurla Complex, Bandra (E)
Mumbai – 400 051
The Manager Listing Department
BSE Limited
Phiroze Jeejeebhoy Towers Dalal Street
Mumbai – 400 001
Scrip Code:- TRIDENT Scrip Code:- 521064
Dear Sir/ Madam
Sub: Industry Outlook & Earnings Frequently asked questions
Pursuant to Regulation 30 and other applicable provisions of SEBI (Listing Obligations and
Disclosure Requirements) Regulations, 2015, we wish to inform you that to remain committed
and transparent towards our stakeholders and maintain high corporate governance, the Company
is providing herewith the latest updates on the Financial Results for Quarter ended on June 30,
2019, industry outlook, way forward and response to the specific questions that may be helpful
to answer the queries regarding the business and financials of the Company.
The document is attached herewith for your information and records please. A copy of the same
is also available on the official website of the company at:
https://www.tridentindia.com/webroot/reports/5d4582973c0f6_1564836503_Trident%20Ltd%20-%20Q1%20FY20%20FAQs%20and%20Industry%20Outlook.pdf
This is for your information and records please.
Thanking you
Yours faithfully For Trident Limited
(Ramandeep Kaur) Company Secretary ICSI Membership No.: F9160
Encl: As above

1 | TRIDENT LTD Q1 FY20| INDUSTRY OUTLOOK AND FAQS
EXCELLENCE IN NATURE
Trident Limited Q1 FY 2019-20
“Industry Outlook & Earnings Frequently Asked Questions”
August 3, 2019
Disclaimer: Certain statements that are made or discussed may be forward looking statements. Such
forward-looking statements are subject to certain risks and uncertainties like government actions, local
political or economic developments, technological risks, and many other factors that could cause our
actual results to differ materially from those contemplated by the relevant forward-looking statements.
Trident Limited will not be in any way responsible for any action taken based on such statements and
discussions and undertakes no obligation to publicly update these forward-looking statements to reflect
subsequent events or circumstances.

2 | TRIDENT LTD Q1 FY20| INDUSTRY OUTLOOK AND FAQS
Business
Segment Unit Q1 FY 20
Bath Linen Metric Tons 12558
Bed Linen Million Metres 5.005
Yarn Metric Tons 28460
Paper Metric Tons 38777
Business Performance and Outlook:
We will be providing you with the latest updates on the financial results, industry outlook and then
answer specific questions that may be helpful to answer the queries regarding the business and
financials of the company and way forward. This information has been collated by taking inputs from
the senior management, including the business leaders who have the ownership of their business
performance thereby presenting you with financial as well as insightful and pragmatic data points.
We remain committed and transparent towards our stakeholders and always maintain high
corporate governance.
Further, if you have any queries, please feel free to get in touch with the Investor Relations team.
After registering a strong performance in FY 2019, the Home Textile business looks to continue the
momentum in FY20. The company has registered a positive growth in the current quarter with an
increase of 15% in Revenue on a Y-o-Y basis.
Bath Linen business had 56% capacity utilization in Q1FY20 whereas the Bed Linen business
achieved a capacity utilization of 46% in the first quarter.
Capacity Utilisation: Production:
Trident has delivered strong performance in the quarter with both Home Textile and Paper
business delivering a strong Y-o-Y growth in Q1 FY20.
We continue to remain optimistic to sustain this growth in Home Textile business
Business
Segment
FY19
(Full Year) Q4 FY19 Q1 FY20
Bath Linen 49% 49% 56%
Bed Linen 63% 74% 46%
Yarn 98% 99% 99%
Paper 89% 88% 89%

3 | TRIDENT LTD Q1 FY20| INDUSTRY OUTLOOK AND FAQS
In terms of financials for the quarter ended 30 June 2019:
• Net Revenue in Q1 FY20 grew by 15.2% Y-o-Y to INR 1313.1 crores compared to INR
1140.0 crores in Q1 FY19
o Y-o-Y Bath Linen sales volume grew by 24 % in Q1 FY20
o Captive consumption of Yarn stood at 48.2% in Q1 FY20
• EBIDTA Q1 FY20 stood at INR 303.9 crores which translates into 23.1% margin
• Profit after tax for the quarter stood at INR 123.2 crores translating to EPS of INR 2.42
• The employee cost for the quarter stood at INR 148.6 Crores which is at a
similar level on Y-o-Y basis. The run rate will be around INR 145 – INR 150 crores on
a quarterly basis going forward.
• Finance cost for Q1 FY20 has stands at INR 35.8 crore which is higher by 10.8% compared to
Q4 FY19.
• Net Debt came down by INR 420 Crores to INR 1924 Crores as on 30th June 2019; Net Debt
to Equity ratio stood at 0.6x and Net Debt to EBITDA at 1.6x.
o Net reduction in Long Term debt by INR 93 Crores to INR 1201 Crores as on 30th
June 2019.
Coming to the segment wise performance:
Textile Segment:
• Q1 FY20 Revenue has grown by 15.5% to INR 1057.4 crores compared to INR 915.8crores
in Q1 FY19.
• EBIT for the segment has jumped to INR 144.9 crores Y-o-Y as compared to 38.5 Crores in Q1
FY19.
Paper & Chemicals Segment:
• Q1 FY20 Revenue has grown by 15.1% to INR 248.0 crores as compared to INR 215.5 crores
in Q1 FY19.
• EBIT for the segment during the quarter jumped by 27.3% and stands at INR 98.5 crores Y-
o-Y as compared to INR 77.4 Crores in Q1 FY19.
4 | TRIDENT LTD Q1 FY20| INDUSTRY OUTLOOK AND FAQS
Home Textile Outlook:
The Home Textile business registered growth in FY 2019 and has delivered a strong Y-o-Y growth
in Q1FY20. Once again we would again like to highlight that India will continue to hold competitive
advantage as our industry is characterized by high entry barriers in terms of scale, capital
availability, skilled labor, customer relationships, sustainability as well as availability of raw material
thereby maintaining high quality standards which is one of the key parameters for customer
stickiness. Accelerated growth, higher spending power with customers in US and currency support
will help us to deliver better results going forward. Also, as per SBI Trade Report, the ongoing trade
war between US and China has been moderately beneficial to India as the cotton imports from US
to China have declined whereas imports from India have gone up.
We believe that the currency will continue to witness volatility. The upward revision in Duty
Drawback by 0.5% in Yarn Business and 0.6% in Bath/Bed Linen business in Dec 2018 and revision
in ROSCTL from 2.2% to 8.2% for Bed as well as Bath Linen business from Mar 2019 has certainly
provided boost to the Indian Textile Industry.
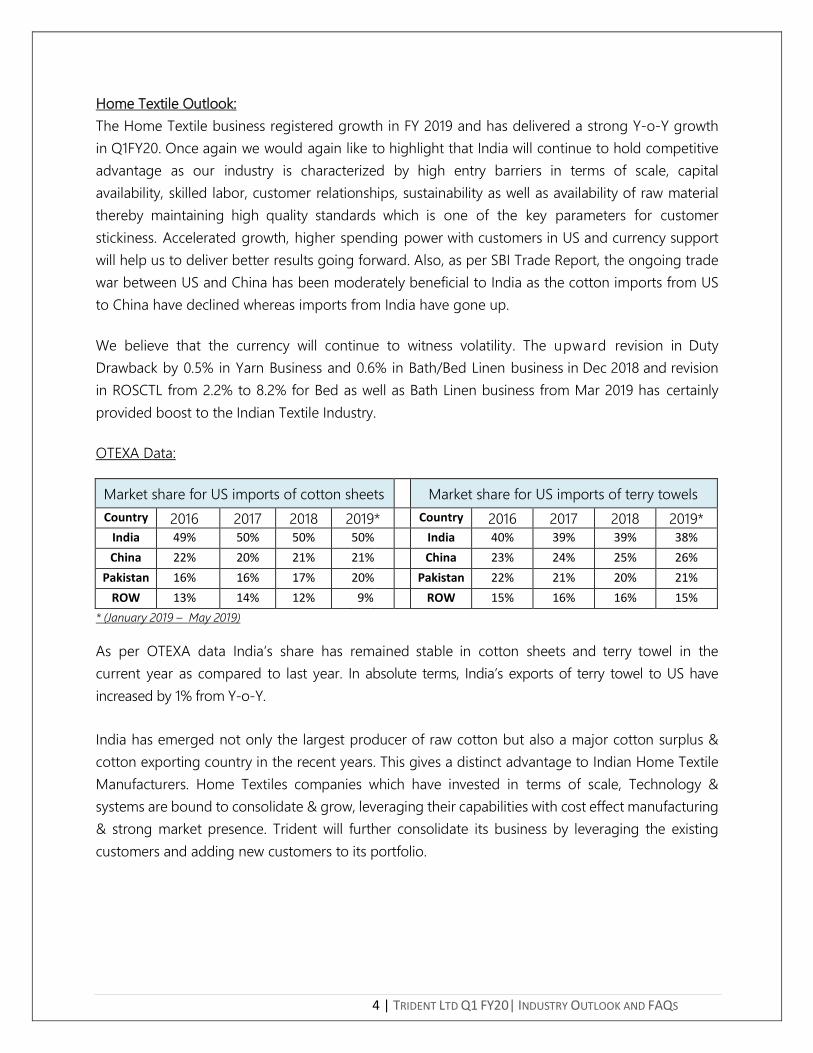
OTEXA Data:
Market share for US imports of cotton sheets Market share for US imports of terry towels
Country 2016 2017 2018 2019* Country 2016 2017 2018 2019* India 49% 50% 50% 50% India 40% 39% 39% 38%
China 22% 20% 21% 21% China 23% 24% 25% 26%
Pakistan 16% 16% 17% 20% Pakistan 22% 21% 20% 21%
ROW 13% 14% 12% 9% ROW 15% 16% 16% 15%
* (January 2019 – May 2019)
As per OTEXA data India’s share has remained stable in cotton sheets and terry towel in the
current year as compared to last year. In absolute terms, India’s exports of terry towel to US have
increased by 1% from Y-o-Y.
India has emerged not only the largest producer of raw cotton but also a major cotton surplus &
cotton exporting country in the recent years. This gives a distinct advantage to Indian Home Textile
Manufacturers. Home Textiles companies which have invested in terms of scale, Technology &
systems are bound to consolidate & grow, leveraging their capabilities with cost effect manufacturing
& strong market presence. Trident will further consolidate its business by leveraging the existing
customers and adding new customers to its portfolio.

5 | TRIDENT LTD Q1 FY20| INDUSTRY OUTLOOK AND FAQS
Paper Industry Outlook:
• Actual production of Indian Paper Industry in FY18 stands roughly at over 16 million tones
which are roughly 4% of global 400 million tons. Capacity utilization rate is around 86%.
• As per CARE report, the Indian paper industry has continued to witness steady growth in FY18
and the domestic demand grew from 9.3 million tonnes in FY08 to 17.1 million tonnes in FY18
at a CAGR of 6.3%
• CARE Ratings expects that the overall paper demand is expected to grow at a CAGR of 6.7%
to touch 20.8 million tonnes in FY21. Writing and Printing segment demand is expected to
grow at a CAGR of 4.5% and reach 5.8 million tons in FY 21.
• Factors leading to growth are
i) Rising income levels
ii) Growing per capita expenditure and low domestic per capita paper consumption
iii) Increasing FMCG and packaged food industries
iv) Rapid Urbanisation
• We expect the volume growth and realizations to sustain momentum going forward
Cotton Outlook:
• According to CARE Ratings Global Cotton outlook, India is set to be the leading cotton
producer with 23% of global cotton production followed by China and US at 22% and 17%
respectively. According to the USDA projection for 2019-20 for the world production of
cotton is set to increase by 5% over 2018-19 figures to 125.8 million bales
• China and India are set to remain the largest users of cotton with 53% of total world
consumption. As per the CARE Report, cotton exports from India are forecasted at 4.4
million bales in 2019-20.
• According to the latest estimate of the cotton crop, The Cotton Association of India (CAI)
has estimated production for 2018-19 season (Oct’18- Sept’19) at 312 Lakh Bales of 170 Kgs
each which is lower by 3 lakh bales than its previous estimate of 315 lakh bales.
• The CAI estimate for the Northern Zone is at the same level as in its previous month’s
estimate of 59 lakh bales. The Cotton crop estimate for the Central Zone has been
increased by 30000 bales.
• The estimate for the Southern Zone has been decreased by 3.25 Lakh bales to 68.50 lakh
bales compared to the estimate of 71.25 lakh bales made during the last month.

6 | TRIDENT LTD Q1 FY20| INDUSTRY OUTLOOK AND FAQS
• The estimate for Gujarat state was increased by 3.5 lakh bales whereas the estimated for
Maharashtra and Madhya Pradesh were revised down by 2.88 lakh bales and 7 thousand
bales respectively compared to the previous month estimate.
• The imports estimated by CAI stands at 31 lakh bales till the end of the cotton season (30th
September 2019). This stands higher by 16 lakh bales compared to the previous year’s
estimated imports of 15 lakh bales.
.
Dividend:
With strong emphasis to reward the shareholders, the Board has recommended First Interim
dividend of INR 0.90 per fully paid share of INR 10 each.

7 | TRIDENT LTD Q1 FY20| INDUSTRY OUTLOOK AND FAQS
Frequently asked questions and their responses
What was the average realization (USD/INR) rate in Q1FY20?
Our average negotiated rate for the current quarter has been at around INR 70.61 per
USD.
What is the hedging strategy/policy of the company?
For hedging export receivables, forward covers are taken for a maturity up to 6-12
months. The hedging strategy division wise is as under:
• Terry Towel Division: Hedging is done on monthly rolling basis at 40%-60% of
sales replenishment.
• Yarn/ Paper division: Hedging is done on order to order basis. Whenever any order
is confirmed, it is hedged by forward cover.
As a policy when do we start hedging for FY20?
We are hedging systematically. We hedge foreign exchange based on the hedging
policy approved by the BOD of 6-12 months tenor.
What is the current hedging rate for FY20?
Average Forward Hedged Rate for FY20 is around INR 72.32 per USD.
What is the other income besides the FOREX gain or loss that you are showing in the P&L
account?
New accounting standard does not allow to net the interest expenditure with the
interest income. But this is broadly the treasury income in terms of our investments into
Liquid / FD based current investments.
How do you see cotton price movement in the international markets and what is the current
gap between Indian prices and international prices? What’s your outlook on Cotton Prices
going forward?
According to the US Department of Agriculture (USDA) projection for 2019-20 for the
world production of cotton is set to increase by 5% over 2018-19 figures to 125.8 million
bales. Due to higher production, the cotton prices have remained under pressure

8 | TRIDENT LTD Q1 FY20| INDUSTRY OUTLOOK AND FAQS
globally. India’s cotton imports are set to double in the current cotton season to
around 31 lakh bales. Despite this the cotton price in India has come down by 5-6%.
Due to the ongoing trade war between US and China, the cotton prices have come
under pressure as China has not been buying cotton from US. Current price of cotton
in international future market has reduced to ~64 cents/lbs which is down by 19% from
the highs of 76 cents about three months ago. We expect cotton prices to remain
subdued going forward due to increased import cotton unless any demand pick up
from current levels due to geo-political trade issues
What kind of maintenance capex and quantum are we expecting for the in FY20?
We will maintain our guidance for maintenance capex at approximately INR 100 crores
for FY20 and the same will be utilized towards small maintenance CAPEXs in the form
of de-bottlenecking/ upgradation of capacities.
Any Capex Plans for in next two years. If yes, in which business and what would be the size of
the capacity?
The company is undertaking an expansion project in yarn segment at Budni, Madhya
Pradesh at a total cost of INR 1140.0 crores. The project cost is to be funded through
mix of debt of INR 855.0 crores and equity of INR 285.0 crores. The proposed yarn
project will provide backward integration support to the enhanced capacity utilization
of Home Textile segment as well for outside sales. The plant is scheduled to become
operational in 2021. Post expansion the installed capacity of yarn segment will increase
by 48482 TPA. Based on outside sales, the plant will add approx. INR 1170 crore of
revenue to the existing topline of the company.
The company is also undertaking a De-bottlenecking & Modernization of its existing
paper units at Dhaula Plant, Punjab at total cost of INR 222.0 crores. The project cost is
to be funded through debt of INR 148.0 crores and internal accruals of INR 74.0 crores.
The proposed project shall help to strengthen the existing paper units of the company
and shall further increase the market presence. Post expansion the installed capacity of
paper segment will increase by 20000 TPA.

9 | TRIDENT LTD Q1 FY20| INDUSTRY OUTLOOK AND FAQS
What is revenue from Bed and Bath Linen in Q1FY20?
Bed and Bath Linen contributed more than 55% of the Total Revenue in Q1FY20 which
stands at INR 730 crores.
What utilization level are we envisaging for Bed & Bath Linen by FY20?
For Bed Linen we are targeting 75% (+-5%) utilization levels in FY20 and for Bath Linen
we expect 60% (+-5%) utilization levels in FY20.
Can you provide guidance on EBITDA & Revenue growth for FY20 & FY21?
On a full year basis, the company’s EBITDA margins will be around 18% to 22% on a
sustainable basis with double digit growth in revenue.
What are the key initiatives have been taken by marketing team to sustain the volume growth?
The company is undertaking the following initiatives for the US market to sustain and
increase the volume growth across Bath Linen and Bed Linen segment:
• Targeting key retailers among top 10 US retailers and addition of two top US retailers in
our customer profile during the quarter
• Further in order to develop Trident as a Brand, we have started exploring direct sales
through various e-com platforms
• We have tied up with a warehousing company in US for drop shipment of merchandize
to various e-retailers of US
• Customer face time has been increased through dedicated US marketing team enabling
quick turnaround of orders
• Focusing on having more patents and trademarks through dedicated
innovation/designing team
The company is undertaking the following initiatives for EU/UK market to sustain and
increase the volume growth across Bath Linen and Bed Linen categories
• Targeting top key retailers country wise especially in EU market
• Identifying and targeting back wall programs (with volumes) for continuous/sustainable
growth
• Focusing to increase customer face time through Europe based marketing

10 | TRIDENT LTD Q1 FY20| INDUSTRY OUTLOOK AND FAQS
representatives enabling quick turnaround of enquiries/orders
What are the key initiatives we have taken to increase our market share in EU and Japan?
We are focusing on major markets in Europe; mainland including Germany, France,
Switzerland, Poland & Norway, Denmark & Sweden in Scandinavia
• Working and focusing to enter the supermarket segment in UK to drive potential
customers
• Leveraging relationships built on existing clients of Towel business to expand business
to sheeting
• Working closely with major European retailers, to increase production matrix with
Trident thus supplying worldwide
• Exploring and focusing on Loyalty & Promotional Programs in Mainland Europe.
• Exploring possibility for partnering with hospitality chains to increase Trident’s share in
their towel and sheeting requirements
• In Japan market since we have already completed the first big drop of recent orders, it
have given us edge and helpful in promoting our name in that market. We are focusing
more on new retailers and hospitality segment, already made required changes in the
infrastructure to meet the quality requirement of this market
Do we pass on the impact of currency fluctuation to the customers?
Prices for most of the programs are agreed for at least a year in advance irrespective of
the currency fluctuation. However, the prices can be negotiated within this period if
there is substantial change in the currency or input cost. Both the parties do understand
the impact (short term or long term) and decides mutually. We address it by conducting
market & consumer surveys which helps us in bringing unique & innovative products to
our partners & customers that helps them to grow their business & keep us ahead of
competition which keeps us to remain competitive. In case of Europe the prices usually
agreed on yearly basis for replenishment programs and on half yearly/seasonal basis
for promotional programs irrespective of the currency fluctuation. However, the prices
can be negotiated during the next year/season considering actual currency fluctuation
and freeze the same accordingly

11 | TRIDENT LTD Q1 FY20| INDUSTRY OUTLOOK AND FAQS
Any updates on MEIS which is likely to go away?
The government is supporting Textile sector and overall exports by various schemes
which the government has introduced considering the need of the industry. With the
MEIS expected to be withdrawn soon, the government has introduced enhanced
benefits under ROSCTL scheme for the industry which will provide additional impetus
to textile sector.
What is the reason for the increase in finance cost in the current quarter?
The increase in finance cost is due to an increase in proportion of Non-TUFS loan in Q1
FY20 as compared to Q1 FY19.
What is the guidance on tax rate for FY20/21?
The Company will pay taxes as per the regular rate of income tax, i.e. 33%.
What is the rationale behind the stock split decision taken by the company?
The board has taken the decision of stock split in order to improve the liquidity of the
Company’s equity shares and to make equity shares more affordable for the small retail
investors.
For more information, please visit www.tridentindia.com OR contact:
Pawan Jain/ Abhinav Gupta
Trident Limited
Tel: +91 161 5039 999
Fax: +91 161 5039 900
Email: [email protected], [email protected]