Hang Lung Properties: comeback time? - IIS Windows Server
76
See important disclosures, including any required research certifications, beginning on page 75 Hong Kong Real Estate 21 May 2018 Hang Lung Properties: comeback time? Q&A on the prospect of the market reassessing HLP’s ambitious wealth-building effort
-
Upload
khangminh22 -
Category
Documents
-
view
0 -
download
0
Transcript of Hang Lung Properties: comeback time? - IIS Windows Server

See important disclosures, including any required research certifications, beginning on page 75
Hong Kong Real Estate
21 May 2018
Hang Lung Properties: comeback time?
Q&A on the prospect of the market reassessing HLP’s ambitious wealth-building effort
2
Hang Lung Properties: comeback time?: 21 May 2018
Table of contents
Page
1 Is there lasting value in malls in this age of e-commerce?
5
2 Are malls in China structurally undermined by oversupply and e-commerce?
17
3 Has HLP found the best way to manage its retail properties?
31
4 Can HLP execute well in tier-2 cities? 49
5 Can HLP make a comeback? 61
Company Section:
Hang Lung Properties 69

3
Hang Lung Properties: comeback time?: 21 May 2018
Contributing Daiwa Analysts:
Jonas Kan, CFA
(852) 2848 4439
Thoughts on the prospect of the market reassessing HLP’s ambitious wealth-building effort
About 13 years ago, Hang Lung Properties (HLP) embarked on an ambitious wealth-
building venture in the property space. The move involved using the over HKD22bn in
profit the company stands to realise from Hong Kong’s residential property sector to
fund a series of investments in China which, if successful, have the potential to
transform the company. If the company can become a leading player in the commercial
property sector in Greater China, it will also be an important stock in global property or
even global equities.
It is clear to us that this effort warrants investors’ attention. But there have been
pendulum swings in terms of how this ambition has been priced into HLP shares. From
2005-11, HLP traded like a rising star in global property; since then, its valuation has
been notably derated. Although the company’s gross rentals and BVPS rose at CAGRs
of 7.2% and 4.2%, respectively, from 2011-17, HLP’s current share price of HKD18.58
is down 54% from its 2010 peak of HKD40.30.
Have the fundamentals determining HLP’s earnings and business prospects really
swung so much? Either way, our view is that HLP’s response to the China retail
property downcycle over the past few years has been anything but passive. We believe
it has made considerable efforts to strengthen its platform to execute its ambitious
plans (see Question 3, page 31), which could potentially put it on a much stronger
footing when the industry environment improves. In this regard, we think the retail sales
environment in China started to get under way in Shanghai in 2H16 and has spread to
other cities. Most importantly, we have seen improvement in the results of a number of
its malls.
In this report, we spell out our thoughts on the major issues that we think investors
need to consider in assessing whether HLP shares are still undergoing a structural
derating — or whether now is the time to buy into the turnaround of an ambitious, yet
safe and reliable vehicle through which to play the long-term potential associated with
having a network of prime commercial property assets in major cities across Greater
China.
There are 2 additional issues that we believe are relevant to HLP’s credentials as a
turnaround stock: 1) whether the Hong Kong family-run property companies can
integrate into the global capital market, and 2) whether the global investing world will
regard China stocks, or companies offering solid exposure to China, much more
seriously in the years to come.
In our view, HLP shares now offer global investors a safe and attractive way to play our
highlighted investment themes.
Jonas Kan, CFA, Head of HK/China Property Research

4
Hang Lung Properties: comeback time?: 21 May 2018

5
Hang Lung Properties: comeback time?: 21 May 2018
Question 1
Is there lasting value in malls in this
age of e-commerce?

6
Hang Lung Properties: comeback time?: 21 May 2018
“Market economies are driven by what Professor Joseph Schumpeter, a number of decades ago, called “Creative Destruction”. By this he meant newer ways of doing things, newer products, and novel engineering and architectural insights that induce the continuous obsolescence and retirement of factories and equipment and a reshuffling of workers to new and different activities. Market economies in that sense are continuously renewing themselves... ”
- Alan Greenspan That e-commerce is now a major factor in the world of retailing is beyond dispute. E-commerce has really taken off in China and many other parts of the world. With continuous improvements in Internet technology, payment security and efficiency, logistics support, as well as the rise of consumers born post-2000, e-commerce is only going to grow in importance. Indeed, retail property stocks in the US have been sold down notably in recent years. We note that major internet giants such as Amazon continue to buy offline assets, which could pose a threat to the incumbent owners of bricks-and-mortar assets. At the same time, large retailers in the US have been bargaining hard with landlords on leasing terms, such that the leasing terms that some US retail landlords can realise are far less favourable than before. Conventional wisdom has it that what is happening now in the US is likely to play out in other parts of the world over time. By extension, the argument goes that the world’s retail property stocks should be avoided as this continued derating of retail property assets has the makings of a structural trend.
China: online retail transaction value as % of total retail value
China: e-commerce gross merchandise value (GMV)
Source: iResearch, Daiwa forecasts Source: iResearch, Daiwa forecasts
We can see the logic in this argument, and it is important not to underestimate the impact of the disruption and creative destruction associated with Internet technology on retailing and, by extension, the retail property sector. E-commerce will certainly take a share of the overall retail pie. But history tells us that economic reality often develops in ways more subtle and complex than a linear extrapolation of existing trends might indicate. After all, there are certain things that e-commerce can’t do. One cannot eat online, for example. But service, experience, human touch, “to see and to-be-be-seen”, face-to-face interaction, socialising with friends and peers, among others, are other elements that cannot be provided, or as effectively provided, by an online platform. All of which begs the question: are online and offline necessarily mutually exclusive? Is it too simplistic to divide the retail landscape into merely online and offline?
4.2%
6.3%7.9%
10.7%
13.3%
15.5%
19.5%
21.5%23.6%
25.4%
0%
5%
10%
15%
20%
25%
30%
2011 2012 2013 2014 2015 2016 2017 2018E 2019E 2020E
757 1,311
1,848
2,815
3,877
5,156
7,148
8,654
10,410
12,279
200
2,200
4,200
6,200
8,200
10,200
12,200
14,200
2011 2012 2013 2014 2015 2016 2017 2018E 2019E 2020E
(CNYbn)
E-commerce is set to disrupt the retailing and retail property landscape
But are online and offline mutually exclusive propositions?

7
Hang Lung Properties: comeback time?: 21 May 2018
Ultimately, the fundamentals of the business are that retailers make money from selling products to consumers, and hence retailers must be prepared to pay whomever and whatever can help them generate sales revenue from consumers. There are aspects where the offline platform can have an edge over the online platform. Equally, there are areas where the offline platform is hard to replace.
Fundamentals of the retailing business
Source: Daiwa
It is also instructive to look at how some of the most successful operators of online platforms (eg, Apple and Amazon) have actively moved to secure quality offline platforms. We see these companies’ moves as evidence of our view that offline and online platforms are complementary in certain ways, ie, that the strongest operators of online platforms recognise that they need offline platforms to take their businesses to the next level. Retailers of the future are unlikely to be purely online or offline. To be successful, in sustained fashion, retailers will need to do well online and offline, in our view. As such, we expect the coming years to be characterised by convergence, where offline platforms go more offline, and offline ones take on more online elements.
Against this backdrop, the real question is not whether online will replace offline altogether. As pointed out by Professor Joseph Schumpeter, the capitalist process is driven by a process of “creative destruction.” Some offline assets will be rendered outdated because of the advent of e-commerce. Equally, some online platforms might become outdated, too. At the same time, some offline assets might become stronger after taking on more online elements, and vice-versa. We believe that technology and the Internet are so pervasive that probably every property asset, offline or online, will be affected one way or another. As such, perhaps the more pertinent question is this: which offline assets can constantly reinvent themselves and evolve with the advent of technology? In other words, we believe that property assets need to face up to the fact that the development of technology and use of the Internet will have lasting implications for retailing and consumption habits. It is now a question of who can adapt best to these changing circumstances. Some property assets will be more insulated from the impact than others; those that can leverage the resulting changes might do much better than others; and those that are complacent may gradually lose relevance.
Will malls that can re-invent themselves do even better?
8
Hang Lung Properties: comeback time?: 21 May 2018
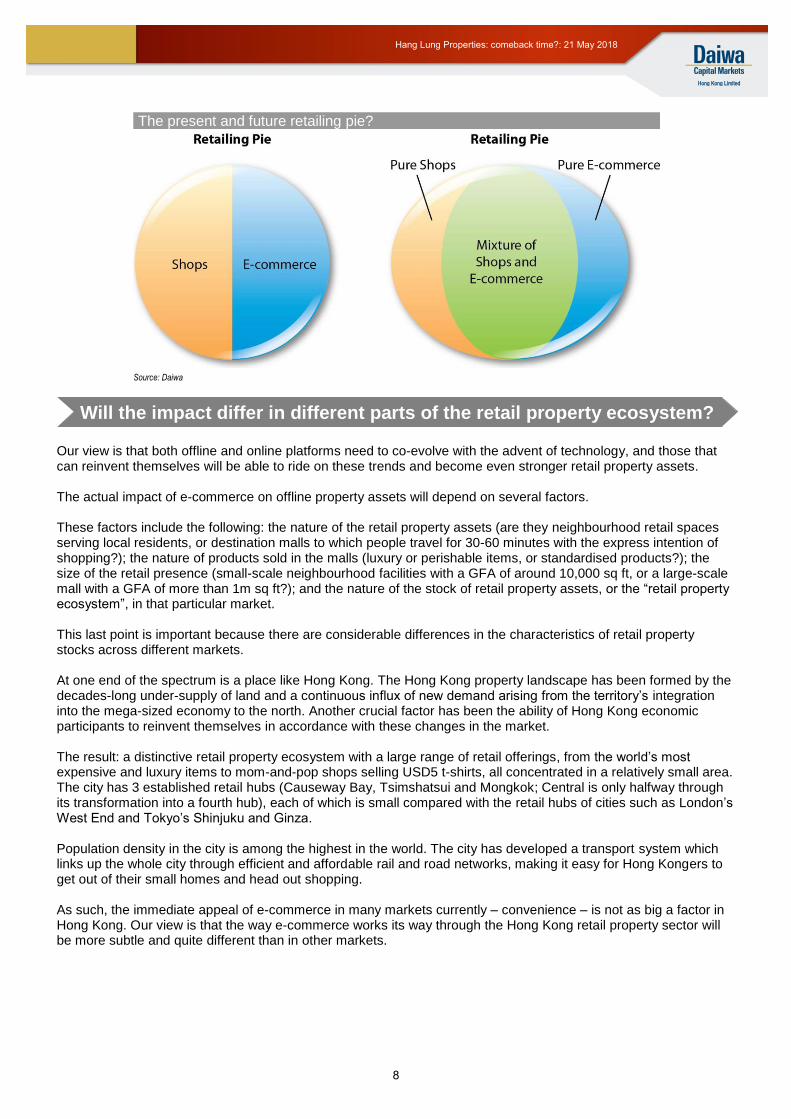
The present and future retailing pie?
Source: Daiwa
Our view is that both offline and online platforms need to co-evolve with the advent of technology, and those that can reinvent themselves will be able to ride on these trends and become even stronger retail property assets. The actual impact of e-commerce on offline property assets will depend on several factors. These factors include the following: the nature of the retail property assets (are they neighbourhood retail spaces serving local residents, or destination malls to which people travel for 30-60 minutes with the express intention of shopping?); the nature of products sold in the malls (luxury or perishable items, or standardised products?); the size of the retail presence (small-scale neighbourhood facilities with a GFA of around 10,000 sq ft, or a large-scale mall with a GFA of more than 1m sq ft?); and the nature of the stock of retail property assets, or the “retail property ecosystem”, in that particular market. This last point is important because there are considerable differences in the characteristics of retail property stocks across different markets. At one end of the spectrum is a place like Hong Kong. The Hong Kong property landscape has been formed by the decades-long under-supply of land and a continuous influx of new demand arising from the territory’s integration into the mega-sized economy to the north. Another crucial factor has been the ability of Hong Kong economic participants to reinvent themselves in accordance with these changes in the market. The result: a distinctive retail property ecosystem with a large range of retail offerings, from the world’s most expensive and luxury items to mom-and-pop shops selling USD5 t-shirts, all concentrated in a relatively small area. The city has 3 established retail hubs (Causeway Bay, Tsimshatsui and Mongkok; Central is only halfway through its transformation into a fourth hub), each of which is small compared with the retail hubs of cities such as London’s West End and Tokyo’s Shinjuku and Ginza. Population density in the city is among the highest in the world. The city has developed a transport system which links up the whole city through efficient and affordable rail and road networks, making it easy for Hong Kongers to get out of their small homes and head out shopping. As such, the immediate appeal of e-commerce in many markets currently – convenience – is not as big a factor in Hong Kong. Our view is that the way e-commerce works its way through the Hong Kong retail property sector will be more subtle and quite different than in other markets.
Will the impact differ in different parts of the retail property ecosystem?

9
Hang Lung Properties: comeback time?: 21 May 2018
The retail property ecosystem in the US is very different. As a result of the abundant availability of land, many US cities are spread out. While Hong Kong might be an extreme example of urbanisation, US cities as a whole are not so urbanised. Apart from cities of the size of New York, San Francisco, Chicago, and Miami, most US cities are spread out and not as urbanised as the likes of Singapore and Tokyo. Hence, while the major malls in Hong Kong are concentrated in a small area within a handful of districts, the US has many large-scale malls, mainly in suburban areas.
Characteristics of different “retail property ecosystems”
Source: Daiwa
Whereas a country such as Japan is linked by rail, the US is all about roads. Most people in the US commute by car rather than use large-scale public transport, and many people are prepared to travel for 60-90 minutes by car to shop at a large-scale suburban mall. Also, the rise of credit cards since the 1960s had a major impact on the development of the US retail sector, as it provided a big boost to retail spending. In other words, the retail property ecosystems of Hong Kong and the US differ in many fundamental ways. As such, it is reasonable to expect the development of e-commerce to have a different impact in each market.
The “retail property ecosystem” in the US today is a result of decades of evolution and adaptations to various factors, some of which may longer apply. Indeed, the US might have been “over-retailed” in some respects for some time. As a market with abundant land, and one where the advent of credit cards spurred retail spending, the US boasts many large-scale malls, many located outside the central parts of cities. At the time these malls were built, shopping alone was thought to be enough to compel consumers to accept the commute times to visit them. In fact, the US ranks very high in terms of retail space per capita. Although there are some variances in the available data, roughly speaking, US retail space per capita stands at over 2 sq m, compared with about 1 sq m in Australia and about 0.3 sq m in China.
Is e-commerce likely to play out differently across different “retail
property ecosystems”?

10
Hang Lung Properties: comeback time?: 21 May 2018
Retail space per capita of major retail markets in the world
Source: Matasii, GGP, Zero Hedge
In any case, many retail facilities in the US are well over 1m sq ft in size. More importantly, many of these malls offer visitors little to do other than shop, and basic F&B (like food courts) and entertainment (like cinemas). This approach was probably fine back in the days when consumers had fewer ways to spend their time (and money), but the world has changed. Today’s consumers have multiple ways to shop, with the Internet offering generally lower prices and e-commerce logistics having improved to the extent that same-day delivery is viable in many cities. Not surprisingly, some consumers prefer to shop online, making a few “clicks” on their smartphones and receiving the items shortly afterwards rather than travelling long distances just to buy something. Another important factor is the position of the retailers relative to the landlords. In our opinion, the relative position of retail landlords in Hong Kong is probably among the highest in the world, if not the highest. Indeed, Hong Kong has many ingredients to be a landlord market in retail property – there are only a handful of major retail landlords in Hong Kong and they generally have strong bargaining over retail tenants. By contrast, large retailers in the US have arguably just as much bargaining power as large landlords. Indeed, many of the large retailers have been leveraging the rise of e-commerce to bargain for lower rents and more flexible leasing terms from landlords. All things considered, the predicament faced by some US retail landlords could be also partly related to the structural characteristics of the US market and we may need to exercise caution while extrapolating from the US situation. Meanwhile, despite the challenges being faced by many malls in the US, some prime retail property assets in the US are holding up and the situation faced by the strongest retail landlords in the US is still notably better than the average. As such, we think it is too early, and probably misguided, to argue that e-commerce will completely replace bricks-and-mortar stores. We believe that the roles of e-commerce and bricks-and-mortar stores will continue to evolve and adapt to each other. In short, we still see lasting value in physical malls, notwithstanding our view that e-commerce is here to stay and is likely to flourish over time.
Ultimately, we believe that the debate between online and offline boils down to the question of what retail property management is really about. Our view is that retail property management is still a relatively young industry. We have seen many different models of retail property management, and it is not yet clear which one will become the industry benchmark — if indeed it is possible to have such a benchmark (also see Question 3, page 31). We like to view the retail property management business as a 3-legged stool, with the retail manager facing consumers on the one hand and retailers on the other. Seen in this light, the role of the retail property manager is about creating 2 virtuous cycles: 1) between consumers and the mall, and 2) between retailers and the mall. Once these virtuous cycles have been established, a third virtuous cycle — one encompassing retailers, the mall, and consumers — can be established, which should result in a growing number of quality consumers and retailers gravitating to the mall. In turn, this third cycle can continue to drive expansion of the overall retail pie in that market, allowing the mall to take market share from other players.
0
1
2
3
US Canada Australia UK China
(sq m)
The roles of online and offline: further thoughts

11
Hang Lung Properties: comeback time?: 21 May 2018
We believe that an important part of the business involves the creation of a virtuous cycle driving consumer spending in malls either directly (through direct spending in the malls) or indirectly (through spending online after visiting the malls or developing trust and confidence about the shop and products after visiting the mall). In our opinion, this virtuous cycle involves 4 major steps and hence requires considerable time and effort to establish. We envisage that in the future, virtually all retailers will need to have both offline and online platforms. In the table on the next page, we summarise what retailers’ online and offline platforms can do.
The virtuous cycle driving consumer spending in a mall
Source: Daiwa

12
Hang Lung Properties: comeback time?: 21 May 2018
The 4 major processes in the virtuous cycle Offline dimension Online dimension
1. Getting potential customers to first try visiting the mall
- The attraction can come from the city and the districts they are in, the ambience inside the malls, as well as the variety and quality of the retailers
- The attraction comes from ease of access and time savings
- Still there are human needs which need to be satisfied by a social setting like malls (eg, dining, eating, friends, seeing and being seen)
- While one can chat and interact online, this is not a substitute for face-to-face meetings. Nor can one eat online
- Can appeal to the 5 senses of human beings - Cannot appeal to the 5 senses of human beings
- Looks a richer platform to offer some new products and experiences to consumers
- Looks inferior in these respects. That said, once the consumer is familiar with the products (say, has tried them before) and has developed sufficient trust in the shops, it would be more convenient to place new orders online than taking the time to go to the physical shop to buy and then line up to pay
- Managers can launch promotional activities (say, performances by celebrities, special shows) to attract potential customers
- Hard to match the physical store in the area of launching promotional events and activities
- Offers many advantages in terms of launching new products - Looks more convenient to buy established and familiar products
2. Getting customers to shop in the mall
- Can make use of the environment, atmosphere and sales techniques of sales staff to stimulate sales
- More difficult to "create" demand. Spending likely to come more from people who already have desires to buy and some specific items to look for
- Can have impulse buying and emotional purchases - Harder to stimulate" impulse buying" and "emotional purchases"
- Can use "sales services" and persuasion to stimulate sales and leverage on sales techniques and customer-sales relationship to stimulate sales
- Hard to use services to stimulate sales
- Assurance of after-sale service and venues where customers can complain and change products are important to stimulate sales
- Online platform can make after-sales service more efficient and effective, but probably cannot completely replace human services
- Offer many ways to help consumers become aware of the product and develop interest in buying that product
- Useful platform for customers to place orders on products they are aware of and want to buy
3. Getting customers to come to the mall repeatedly to shop
- More ways to get consumers to develop sentimental attachment to/positive impression of the mall
- More difficult to get the customers to develop sentimental attachment. That said, the messages and reminders offered by offline platforms can help reinforce such feelings among consumers. If utilised effectively, the mall could become akin to another online friend of customers.
- More ways to get consumers to feel they are being taken care of - More difficult to get customers to develop such feelings. Again, the offline platform can have ways to reinforce such feelings after they have formed (messages, discount coupons, etc).
- More ways to get consumers to feel they can access the most trendy items and get a sense of the trends of the day by visiting the mall
- More difficult for this to be done. However, the offline platform can offer ways to reinforce such feelings.
4. Getting customers to get more of their friends to try visiting the mall
- The physical mall allows customers to meet and socialise with their friends - More difficult for this to be done. That said, messages, coupons and other offers can be forwarded by the offline platform to reinforce the socialising effects resulting from meeting in the mall.
- The mall becomes a place customers are familiar with and have an emotional attachment to
- More difficult for this to be done. That said, there are many ways in which the offline platform can help in facilitating customers to introduce the place to his/her friends.
Source: Daiwa
Meanwhile, we believe that another important part of the retail property management business involves the creation of another virtuous cycle, whereby an increasing number of strong retailers and up-and-coming retailers are compelled to enter the mall. In our opinion, this virtuous cycle also involves 4 major steps and would likewise take time and effort to establish. At this stage, we see the virtuous cycle between the mall and retailers as being mainly about developing a strong partnership so that both parties become long-term stakeholders in each other’s businesses.

13
Hang Lung Properties: comeback time?: 21 May 2018
The virtuous cycle driving retailers’ leasing demand for mall spaces
Source: Daiwa
While we think that retailers will pay increased attention to the importance of offline platforms, our take is that at this stage the creation of this virtuous cycle is driven more by the interaction between mall manager and retailers, as well as the mall manager’s ability to kick-start a virtuous cycle between the mall and the consumers. As we see it, the impact of e-commerce and the advent of Internet technology on this part of retail property management will not be as pronounced on the consumer side. However, the mall manager’s ability to leverage on technology to improve the competitiveness of the mall and develop a virtuous cycle between the mall and consumers would be of great significance in getting retailers to develop a long-term commitment to the mall and partner with the mall to weather challenging times.
The virtuous cycle between the mall, consumers and retailers
Source: Daiwa
Based on the above factors, we believe that the impact of e-commerce on the retail property sector is more multi-dimensional and complex than it may first appear, and that both the online and offline platforms have roles to play in the retail property management process. While the offline platform is powerful and will likely become more powerful over time, we do not think that it will replace the offline dimension completely, on the 4 aspects noted above, any time soon. At the same time, we contend that the mall-retailer relationship will remain an important part of the mall management business — one that may not be directly impacted by e-commerce and Internet technology.

14
Hang Lung Properties: comeback time?: 21 May 2018
In any case, we foresee the relative roles of online and offline platforms continuing to evolve.
Reasons to visit the mall
Source: Daiwa
We have established our view that there is lasting value in malls, even in this age of e-commerce. Based on the above analysis, the continued development of e-commerce has the potential to make strong malls even more productive, with the online platform serving to strengthen the appeal of the offline platform which has already built up in the 4 aspects we have outlined. Indeed, one implication of the rise of e-commerce is that the number of physical malls required by the market is likely to shrink considerably. Creating and then maintaining an offline platform is costly. Given that some functions previously performed by a physical mall can now be taken up by the offline platform, and that it is so costly and risky to develop and maintain a mall, we would expect the strong physical malls that have also developed strong online platforms to continue to erode the market share of weaker malls. In other words, while the mall industry is inherently a “winner takes all” business, in that there is a tendency for retail spending to gravitate to the strongest malls, we expect these characteristics to become more pronounced in the age of e-commerce. In this light, strong physical malls that can also develop a strong offline dimension have the potential to become even stronger. As such, we believe that the advent of e-commerce could result in a redistribution of retail spending among different types of mall on the offline platform. Hence, rather than merely thinking in terms of the online platform gaining market share from the offline platform, we might see strong offline malls accelerating their market-share expansion by expanding their online platforms. Below we outline our preliminary thoughts on the future structure of the mall industry.
Could strong malls become much stronger by leveraging on the opportunities provided by e-commerce and offline platforms?

15
Hang Lung Properties: comeback time?: 21 May 2018
Potential future landscape of the mall industry
Source: Daiwa
Seen in this light, we expect that the impact of e-commerce will be multi-dimensional, with the respective roles and importance of online and offline platforms, as well as different types of offline and online platforms, continuing to evolve in accordance with the retail property ecosystems they operate in. As such, one needs to closely examine the retail property ecosystems of the respective markets to gain insight into how the retail property landscape of each market is going to evolve. Investor concerns about the ramifications for China’s retail property sector of an oversupply of commercial property space and the rise of e-commerce prompt us to tackle 2 questions. How does the retail property ecosystem of China look today? And how is China’s retail property sector positioned in the face of the challenges posed by e-commerce?

16
Hang Lung Properties: comeback time?: 21 May 2018

17
Hang Lung Properties: comeback time?: 21 May 2018
Question 2
Are malls in China structurally
undermined by oversupply and
e-commerce?

18
Hang Lung Properties: comeback time?: 21 May 2018
“The future is never clear; you pay a very high price in the stock market for a cheery consensus. Uncertainty actually is the friend of the buyer of long-term values.”
- Warren Buffett It is important to bear in mind when assessing China’s shopping mall sector that this is still a young industry. At this stage, no-one can offer a definitive view of how the sector will end up, in our opinion. Before China adopted its Open Door Policy and Economic Reform in 1978, private consumption beyond daily necessities was nearly non-existent. And in the 2 decades after China embarked on these reforms, income levels were still low and no single Chinese city had attained a critical mass of retailing spending by the middle class or high-income groups. During this period, China’s retail property ecosystem consisted mainly of high-street shops, similar to how Hong Kong was during the 1970s. Looking back, private consumption first became a meaningful commercial industry in China in about 2002, by which time 2 decades of foreign investment and the country’s then-recent accession to the World Trade Organization gave Shanghai a critical mass of retail spending powered by the middle class, expatriates, wealthy individuals, and high-income groups. Department stores (mostly state-owned) were the first retail format to benefit from the take-off of private consumption in China, as at the time they were the dominant format in China as a whole. This dominance still holds, though it has waned as a result of the rise of shopping malls and online platforms. In this light, the shopping mall segment has only a 15- to 20-year history in Shanghai and a shorter history in other cities. The early 2000s saw the first generation of retail malls being established in China. Many of these malls were developed by Hong Kong property companies, including major malls such as Grand Gateway 66, Plaza 66, and Oriental Plaza.
The China retail property sector
Source: Daiwa
The China retail property sector is still a young industry, isn't it?

19
Hang Lung Properties: comeback time?: 21 May 2018
The relatively short history of China’s retail property sector is an important factor, since it takes time for any industry to mature. The formative years of an industry are often characterised by problems and setbacks. But, after a period of consolidation, improvement, and refinement, the strongest industry players come to the fore and then work to consolidate the market and become even stronger over time. Against this backdrop, we hold to our view that China commercial property is a challenging sector to play since it is still in its formative phase. In fact, most cities in China are situated on flat land, which allows them to continue to expand. Indeed, many cities in China now exceed 10,000 sq km in area, or 10x the area of Hong Kong as a whole and over 30x the size of Hong Kong’s urban area. Hence, retail spending in China has to be spread over a much larger territory. Meanwhile, many cities in China appear to view commercial developments as symbols of prosperity, and there seems to be a tendency for them to sell more commercial land and develop more commercial GFA than their stage of development might justify. More fundamentally, we believe that China has yet to develop a proper mechanism to price and allocate capital. At the same time, many developers have come to view commercial developments as a “necessary evil”, one that allows them to get the residential GFA that they need to generate sufficient profits to cover the costs associated with commercial developments. As a result of these factors, excessive capital has been allocated to commercial developments, which explains the widespread over-supply of commercial property in many cities in China. It is beyond dispute that nearly all Chinese cities have faced some degree of oversupply of commercial property space during their development. But the answer to the question of whether Chinese cities face a permanent oversupply of commercial property spaces is more subtle and complex.
China’s 4 autonomous municipalities and provincial capitals Provincial capitals Population (m) City area (sq km)
Shanghai* 24.2 6,340
Beijing* 21.7 16,411
Tianjin* 15.6 11,917
Chongqing* 30.8 82,374
Guangzhou 14.5 7,249
Hangzhou 9.5 16,596
Nanjing 8.3 6,587
Jinan 7.3 7,998
Changsha 7.9 11,816
Chengdu 15.9 14,335
Fuzhou 7.7 12,675
Wuhan 10.9 8,494
Hohhot 3.1 17,200
Zhengzhou 9.9 7,446
Taiyuan 4.4 6,988
Shenyang 8.3 12,860
Shijiazhuang 10.9 13,056
Changchun 7.5 20,594
Nanchang 5.5 7,402
Harbin 10.9 53,076
Guiyang 4.8 8,043
Hefei 8.0 11,445
Xi'an 8.8 10,097
Kunming 6.7 21,013
Haikou 2.2 2,304
Urumqi 3.5 13,788
Lhasa 0.5 29,518
Nanning 7.1 22,112
Yinchuan 2.2 8,875
Lanzhou 3.7 13,086
Xining 2.4 7,660
Source: CEIC Note: *the 4 autonomous municipalities
China retail property is a challenging sector to play

20
Hang Lung Properties: comeback time?: 21 May 2018
Despite the clear evidence of the oversupply of commercial property space in China, the total stock of commercial property space in many Chinese cities does not seem excessive relative to these cities’ likely populations and scale when they reach a mature stage of development. In fact, retail space per capita in the US today is over 7x the equivalent figure for China. In this context, we think the problem may stem as much from the pace at which commercial property space comes out as from the total stock of retail properties and the absolute supply figures. As such, it can be argued that, to a certain extent, the central problem facing China’s commercial property sector is that many players and local governments are trying to accomplish in 5-10 years what it took Western cities 5 decades or more to do. As such, we think the commercial property sector in China has a digestion problem. While oversupply characterised Chaoyang in Beijing, Luijiazui, Nanjing Road and Hu Hai Road in Shanghai, and Futian in Shenzhen at certain times during the past 3 decades, this ceased to be true a few years ago and office rents in these cities have been on the rise for quite some time.
China: retail property stock in major cities
Source: Savills
Of course, not all commercial districts in China can weather the challenges related to oversupply during their formative stages. Our take is that many districts have faced a vicious cycle, whereby quality companies and retailers continue leaving and vacancy rates keep rising. In our view, this is one of the major risks in the China commercial property sector. However, some districts, after navigating this challenging digestion period, have managed to attract a growing number of companies and retailers. Of course, governments can always come up with ambitious plans for new CBDs, whereby construction of a new CBD is commissioned before the existing CBD has been taken up. Given there is so much flat land in Chinese cities, there is a risk that oversupply will exist somewhere in certain cities for years to come.
We are not suggesting that investors should not own China commercial property; rather, we are advocating a selective approach to investing in a sector that can be challenging to play. For example, we do see value in prime commercial property in established central locations in Chinese cities. Among the reasons such property appeals to us are poor city planning and the sheer number of people who want to live in major cities. Generally speaking, cities in China lack robust city planning and highly efficient public transport systems. Moreover, redeveloping existing buildings has become costly and difficult due to the strong bargaining position of the existing inhabitants.
0
2
4
6
8
10
12
Beijing Shanghai Shenyang Chengdu Chongqing Guangzhou Wuhan Tianjin Shenzhen Hangzhou
(m sq m)
To what extent is the oversupply issue a digestion problem?
Is China commercial property worth owning?
21
Hang Lung Properties: comeback time?: 21 May 2018
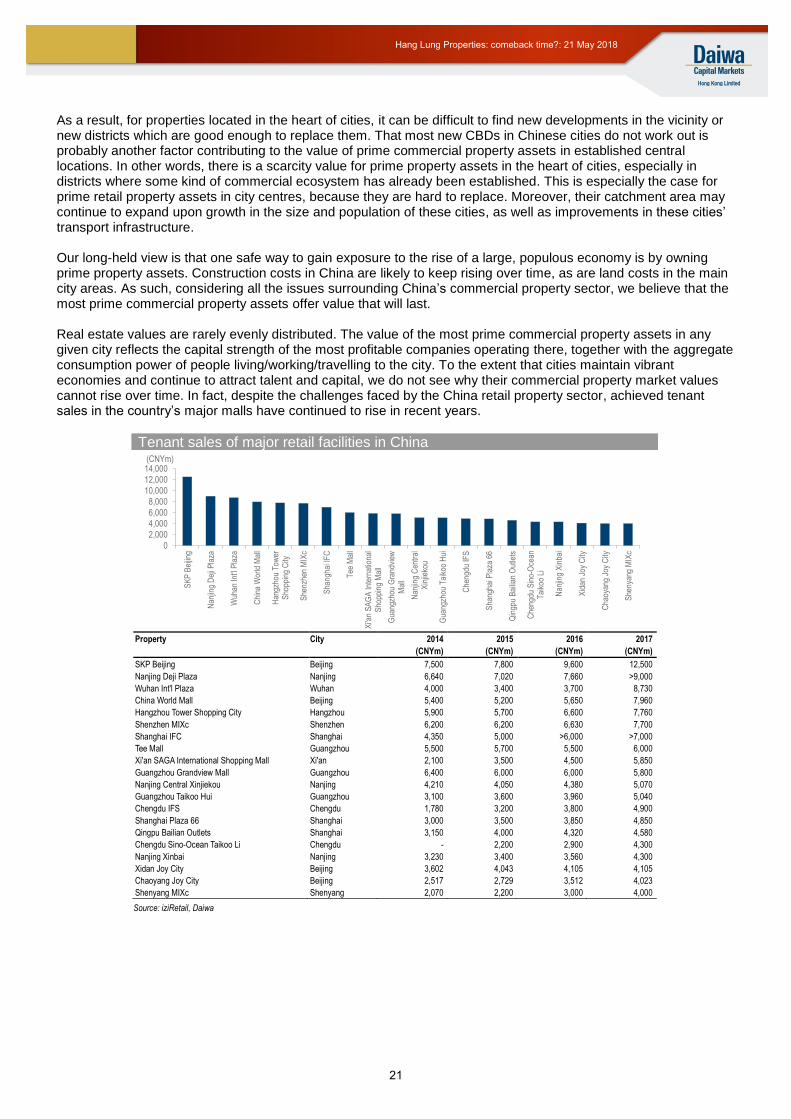
As a result, for properties located in the heart of cities, it can be difficult to find new developments in the vicinity or new districts which are good enough to replace them. That most new CBDs in Chinese cities do not work out is probably another factor contributing to the value of prime commercial property assets in established central locations. In other words, there is a scarcity value for prime property assets in the heart of cities, especially in districts where some kind of commercial ecosystem has already been established. This is especially the case for prime retail property assets in city centres, because they are hard to replace. Moreover, their catchment area may continue to expand upon growth in the size and population of these cities, as well as improvements in these cities’ transport infrastructure. Our long-held view is that one safe way to gain exposure to the rise of a large, populous economy is by owning prime property assets. Construction costs in China are likely to keep rising over time, as are land costs in the main city areas. As such, considering all the issues surrounding China’s commercial property sector, we believe that the most prime commercial property assets offer value that will last. Real estate values are rarely evenly distributed. The value of the most prime commercial property assets in any given city reflects the capital strength of the most profitable companies operating there, together with the aggregate consumption power of people living/working/travelling to the city. To the extent that cities maintain vibrant economies and continue to attract talent and capital, we do not see why their commercial property market values cannot rise over time. In fact, despite the challenges faced by the China retail property sector, achieved tenant sales in the country’s major malls have continued to rise in recent years.
Tenant sales of major retail facilities in China
Property City 2014 2015 2016 2017
(CNYm) (CNYm) (CNYm) (CNYm)
SKP Beijing Beijing 7,500 7,800 9,600 12,500
Nanjing Deji Plaza Nanjing 6,640 7,020 7,660 >9,000
Wuhan Int'l Plaza Wuhan 4,000 3,400 3,700 8,730
China World Mall Beijing 5,400 5,200 5,650 7,960
Hangzhou Tower Shopping City Hangzhou 5,900 5,700 6,600 7,760
Shenzhen MIXc Shenzhen 6,200 6,200 6,630 7,700
Shanghai IFC Shanghai 4,350 5,000 >6,000 >7,000
Tee Mall Guangzhou 5,500 5,700 5,500 6,000
Xi'an SAGA International Shopping Mall Xi'an 2,100 3,500 4,500 5,850
Guangzhou Grandview Mall Guangzhou 6,400 6,000 6,000 5,800
Nanjing Central Xinjiekou Nanjing 4,210 4,050 4,380 5,070
Guangzhou Taikoo Hui Guangzhou 3,100 3,600 3,960 5,040
Chengdu IFS Chengdu 1,780 3,200 3,800 4,900
Shanghai Plaza 66 Shanghai 3,000 3,500 3,850 4,850
Qingpu Bailian Outlets Shanghai 3,150 4,000 4,320 4,580
Chengdu Sino-Ocean Taikoo Li Chengdu - 2,200 2,900 4,300
Nanjing Xinbai Nanjing 3,230 3,400 3,560 4,300
Xidan Joy City Beijing 3,602 4,043 4,105 4,105
Chaoyang Joy City Beijing 2,517 2,729 3,512 4,023
Shenyang MIXc Shenyang 2,070 2,200 3,000 4,000
Source: iziRetail, Daiwa
0
2,000
4,000
6,000
8,000
10,000
12,000
14,000
SK
P B
eijin
g
Nan
jing
Dej
i Pla
za
Wuh
an In
t'l P
laza
Chi
na W
orld
Mal
l
Han
gzho
u T
ower
Sho
ppin
g C
ity
She
nzhe
n M
IXc
Sha
ngha
i IF
C
Tee
Mal
l
Xi'a
n S
AG
A In
tern
atio
nal
Sho
ppin
g M
all
Gua
ngzh
ou G
rand
view
Mal
l
Nan
jing
Cen
tral
Xin
jieko
u
Gua
ngzh
ou T
aiko
o H
ui
Che
ngdu
IFS
Sha
ngha
i Pla
za 6
6
Qin
gpu
Bai
lian
Out
lets
Che
ngdu
Sin
o-O
cean
Tai
koo
Li
Nan
jing
Xin
bai
Xid
an J
oy C
ity
Cha
oyan
g Jo
y C
ity
She
nyan
g M
IXc
(CNYm)

22
Hang Lung Properties: comeback time?: 21 May 2018
The threat posed by e-commerce is arguably greater in China than many other parts of the world, since Chinese consumers have led the way in embracing a cashless society. In China, hundreds of millions of people now use their smartphones to manage their daily lives and make payments for purchases using services such as Alipay and WeChat. In these circumstances, it is logical to assume that offline property assets face a genuine threat.
China: market size forecasts of digital payment market transaction volume (2011-20E)
China: digital payment user forecasts (2013-20E)
Source: iResearch, Analysys, Daiwa forecasts Source: iResearch, Analysys, Daiwa forecasts
As a result, we are cautious about the prospects for department stores in China, which run the risk of becoming an outdated format. However, when it comes to shopping malls, we think the situation is more complex. In our opinion, it is fortunate for China’s retail property sector that e-commerce has come to prominence before the total stock of retail property space has become too great. E-commerce has emerged as a force to be reckoned with at a time when China’s retail property ecosystem is still in its formative stages, ie, the ecosystem has time to come to terms with the ramifications of e-commerce before stock within the sector becomes too big to digest. In any case, we take the view that offline and online platforms in China retail are not mutually exclusive. Rather, we believe that the relationship will be multi-dimensional and evolve over time. Although we expect e-commerce to take an increasingly prominent role in the China retail property ecosystem, this does not necessarily mean that the offline components will suffer. Indeed, we believe that some offline property assets could strengthen as a result of e-commerce. One way to assess the impact of e-commerce in China is to determine whether its expansion necessarily spells market-share losses for shopping malls. As argued in Questions 1 and 2, we don’t believe that to be the case. We break the China retail property sector’s development into 5 phases and reiterate that department stores still make up the bulk of the country’s retail space. Shopping malls are a young retail format, and e-commerce is even newer. Against this backdrop, the situation today is not all about e-commerce eating into the market share of shopping malls. Instead, we focus on a scenario where e-commerce and shopping malls together erode the market share of department stores. Rather than viewing e-commerce and shopping malls as head-on competitors, we believe there is scope for them to form alliances in order to win share from department stores.
2,284 3,810 6,593 14,069
24,063
53,851
81,089
105,536
127,040
146,302
0
20,000
40,000
60,000
80,000
100,000
120,000
140,000
160,000
2011 2012 2013 2014 2015 2016 2017E 2018E 2019E 2020E
CNYbn
260 304
416
475 525
565 599
621
0
100
200
300
400
500
600
700
2013 2014 2015 2016 2017E 2018E 2019E 2020E
in million
Is e-commerce really a threat to China’s mall industry?

23
Hang Lung Properties: comeback time?: 21 May 2018
China still has more retail space than it needs right now, as reflected in the low sales productivity of many retail property assets. But we would point out that it takes time for a new retail format to gain acceptance, and there is also a possibility that the low sales productivity of some malls is a result of immature retail management or the inherent pitfalls of the mall format. In any case, many parties in China — property companies, industry professionals and even the general public —are cognisant of the threat posed by e-commerce to the China mall industry, which we think explains the apparent reluctance of many developers to build large-scale malls in China. In fact, we believe that China’s retail mall industry is now at a stage where the owners and market are seeking to accommodate the rise of e-commerce and digest the retail space that has been built. Relative to consumers’ purchasing power today, China does appear over-built in terms of retail space. It will take time for the country to work through this issue, but we argue that it is too early to conclude that China’s mall industry is in a permanent state of oversupply. One important factor is that China is undergoing urbanisation at a scale that has never been seen before. If we had to summarise Hong Kong property in a single sentence, it would be this: a phenomenon created by the decades-long undersupply of land. If we had to do the same for China property, our sentence would be: a phenomenon centring on the building of metropolitan cities, underpinned by urbanisation at an unprecedented scale. In our opinion, the ongoing construction of the high speed rail system promises to have a transformational impact on the structure of China’s property ecosystem, which the investment world may not yet fully appreciate.
China e-commerce: market size forecasts
2011 2012 2013 2014 2015 2016 2017 2018E 2019E 2020E CAGR 17-20E
Total Retail Market Size
China Real GDP Growth % 9.2% 7.8% 7.7% 7.4% 6.9% 6.7% 6.9% 6.5% 6.4% 6.3%
China CPI Change % 5.4% 2.7% 2.6% 2.1% 1.5% 1.3% 4.3% 1.0% 0.9% 0.7%
China Nominal GDP 48,930 54,037 59,524 64,397 68,905 74,413 82,712 88,916 95,406 102,085 7.3%
YoY change % 18.5% 10.4% 10.2% 8.2% 7.0% 8.0% 11.2% 7.5% 7.3% 7.0%
Total Retail Value (CNY bn) 18,123 20,717 23,438 26,239 29,047 33,231 36,626 40,289 44,156 48,263 9.6%
YoY change % 17.3% 14.3% 13.1% 12.0% 10.7% 10.3% 10.3% 10.0% 9.6% 9.3%
Online Shopper Size
Total Population (m) 1,347 1,354 1,361 1,368 1,375 1,383 1,390 1,397 1,404 1,410 0.5%
YoY change % 0.48% 0.50% 0.49% 0.52% 0.50% 0.59% 0.53% 0.50% 0.47% 0.45%
Internet User Penetration % 38.1% 41.7% 45.4% 47.4% 50.1% 52.9% 55.5% 58.3% 61.2% 64.1%
Total Internet Users (m) 513 564 618 649 688 731 772 814 858 904 5.4%
YoY change % 12.2% 9.9% 9.5% 5.0% 6.1% 6.3% 5.6% 5.5% 5.4% 5.3%
Online shopper penetration (%) 37.8% 42.9% 48.9% 55.6% 60.1% 63.8% 69.0% 71.0% 73.0% 74.0%
Total Online Shopper (m) 194 242 302 361 413 467 533 578 627 669 7.9%
YoY change % 20.8% 24.8% 24.7% 19.6% 14.5% 12.9% 14.2% 8.5% 8.4% 6.7%
Average annual spending per online shopper (CNY) 3,901 5,417 6,120 7,798 9,382 11,048 13,411 14,967 16,613 18,357 11.0%
YoY change % 19.7% 38.9% 13.0% 12.5% 12.5% 12.1% 12.1% 11.6% 11.0% 10.5%
Online Retail Market Size
Total Online Retail Value (bn RMB) 757 1,311 1,848 2,815 3,877 5,156 7,148 8,654 10,410 12,279 19.8%
YoY change % 44.6% 73.3% 40.9% 52.4% 37.7% 33.0% 38.6% 21.1% 20.3% 18.0%
Online Penetration % 4.2% 6.3% 7.9% 10.7% 13.3% 15.5% 19.5% 21.5% 23.6% 25.4%
Mobile Online Retail Value (bn RMB) 12 63 170 930 2,016 3,094 5,075 6,491 8,120 9,823 24.6%
YoY change %
425.0% 169.8% 447.1% 116.8% 53.4% 64.1% 27.9% 25.1% 21.0%
Mobile Online Retail Penetration % 1.6% 4.8% 9.2% 33.0% 52.0% 60.0% 71.0% 75.0% 78.0% 80.0%
Total C2C GMV (CNY bn) 589 929 1,203 1,526 1,931 2,269 2,945 3,315 3,748 4,150 12.1%
YoY change %
57.8% 29.4% 26.9% 26.6% 17.5% 29.8% 12.6% 13.1% 10.7%
C2C as % of Online Retail 77.8% 70.9% 65.1% 54.2% 49.8% 44.0% 41.2% 38.3% 36.0% 33.8%
Total B2C GMV (CNY bn) 196 391 648 1,289 1,946 2,887 4,203 5,340 6,663 8,129 24.6%
YoY change %
99.2% 65.6% 99.1% 51.0% 48.3% 45.6% 27.0% 24.8% 22.0%
B2C as % of Online Retail 25.9% 29.8% 35.0% 45.8% 50.2% 56.0% 58.8% 61.7% 64.0% 66.2%
Source: iResearch, CNNIC, Daiwa forecasts
Is retail space in China in a state of permanent over-supply?

24
Hang Lung Properties: comeback time?: 21 May 2018
China’s high-speed railway network
Source: Daiwa
China’s situation may be a difficult to grasp from a US perspective, given the US is linked primarily by roads and planes. For a sense of how China’s property landscape will be in the future, it is worth looking at Japan, a country linked by a rail system that facilitates the movement of people on a very large scale. Many people who work in Tokyo were not born in the city. As a result, Tokyo’s population tends to be much smaller than usual over the New Year holiday as millions of people return to their home towns to celebrate. We believe that it is a similar story in many Chinese cities, though perhaps at even larger scale. On the issue of metropolitanisation, it is illuminating to look at the proportion of a country’s population that lives in its largest city. The development of cities can resemble the development of shopping malls, in that there is a tendency for the largest and strongest to continue to gain market share until it has reached its full potential. This certainly holds true in China, because for people moving from rural areas to cities, every city is new and it is natural to head for the one offering the most opportunities. Hence, as long as the major cities have the necessary land and infrastructure facilities, they can continue to expand. However, while China’s population in tier-1 cities is huge in absolute terms, it does not seem large relative to the overall population. In many countries, the largest city accounts for 10% of the country’s population. Some cities, such as Seoul and Tokyo, account for 20-30% of the population. But in China, the biggest cities (such as Beijing and Shanghai) account for only 2-3% of the country’s population.

25
Hang Lung Properties: comeback time?: 21 May 2018
China: the potential 5 great metropolitan zones
Source: Daiwa
From this perspective, we believe there is considerable room for the populations of major Chinese cities to expand further. Our view is that having a well-established rail system will be conducive to the largest cities gaining population from the rest of the country. However, if Shanghai or Beijing have only 5% of the country’s population, the quantum of population involved would probably put a significant strain on the physical and social infrastructure of the affected cities. In this context, while the existing stock of retail space in many Chinese cities seems large relative to their purchasing power, the balance could be restored as more people migrate to major cities, especially if the income and wealth levels of people continue to rise. Another factor to consider is the threshold effect. As we see it, many people in China are still below the threshold for middle-class retail spending. But they are not that far from the threshold. Once the threshold is passed, the increment could be very substantial, with potentially millions of people entering the bracket for middle-class retail spending. Still another factor to bear in mind is that, when it comes to retail spending, it is never about equalisation. Rather, it is about polarisation, in that the largest and strongest retail assets can always take market share from the smaller ones. As such, even if there is an oversupply of retail space in the industry as a whole, this might be a problem mainly for fringe and under-managed assets. The strongest assets could be quite insulated from this oversupply, in other words. In conclusion, we believe that it is wrong to assume that China’s retail property sector will be in a permanent state of oversupply, and in this regard the challenges faced by the strongest malls are likely to be fairly benign.

26
Hang Lung Properties: comeback time?: 21 May 2018
We have established our view that China retail property has to be seen for what it is: a relatively young industry which has a range of possibilities open to it. E-commerce has taken hold in China, which the market absolutely needs to come to terms with. But we think the impact of e-commerce on China’s retail market could be quite fluid. As discussed in Question 1, the relationship between offline and online platforms may end up being multi-dimensional, as there are certain elements of the offline shopping experience that cannot be duplicated online. More importantly, investors have to recognise that there are many areas where online and offline are complementary. More broadly, we believe that the world is still in the early stages of understanding what drives Chinese consumers. For example, while movies and book stores are regarded in the West as being among the types of trade most impacted by e-commerce, both still look to be flourishing in China. In any case, for all that has been said about Chinese consumers’ willingness to embrace technology, it is hard to imagine them being content to stay at home for hours each day in front of their computers or smartphones. After all, human beings have a fundamental need to go out to see and be seen, and to socialise with friends. While the central role of malls as places to buy goods may be affected by e-commerce, we expect the malls of the future to feature more places to eat, drink, see, play and meet. In short, our take is that China’s retail property ecosystem is in its formative stages and it is not a given that e-commerce will undermine the country’s mall industry. Indeed, based on our analysis (Question 1, page 5), if managers can leverage it well, e-commerce might even enhance the competitiveness of physical malls. Still, with the growing penetration of the Internet and the rise of e-commerce, the world likely won’t need as many malls as it once did. Shown below are our initial thoughts about how the retail property industry as a whole might evolve. We believe that our thesis is likely to hold up for China’s retail property ecosystem as well. Our central argument is that China’s road to having a more stable and sustainable retail property ecosystem may well turn out to be smoother and more pleasant than the US’ road, if only for the reason that China is far from being over-retailed right now (its retail space per sq m is well below 20% of the US equivalent). While many cities in China do face an oversupply of retail space in the near term, we view this primarily as a digestion issue and believe that China’s major cities of the future will still be able to accommodate the construction of many more retail properties.
Reasons to visit a mall
Source: Daiwa
How will China’s retail property ecosystem play out?

27
Hang Lung Properties: comeback time?: 21 May 2018
Potential landscape of the mall industry
Source: Daiwa
If China’s major cities of the future can accommodate many more retail properties, then China’s retail property ecosystem could ultimately be very large and rich, accommodating a large range of retail concepts. Moreover, there could be significant scope for competent retail property managers to exercise their creativity and professional skills, both online and offline. Much depends on the style and quality of China’s retail property managers and developers. If they follow the crowd and build similar developments the length and breadth of the country, we could see many malls in China ending up more like food halls or family entertainment centres. But we contend that the China retail property market is large enough to accommodate at least a handful of top-prime and productive shopping malls. We are of the view that eventually there will be at least 20 of these malls in the country (see our China property sector report of 28 March 2017: Why 20 is the magic number), each with tenant sales in excess of USD1bn. Indeed, China already has at least 7 malls where tenant sales have surpassed USD1bn.

28
Hang Lung Properties: comeback time?: 21 May 2018
Tenant sales of major retail facilities in China
Property City 2014 2015 2016 2017
(CNY m) (CNY m) (CNY m) (CNY m)
SKP Beijing Beijing 7,500 7,800 9,600 12,500
Nanjing Deji Plaza Nanjing 6,640 7,020 7,660 >9,000
Wuhan Int'l Plaza Wuhan 4,000 3,400 3,700 8,730
China World Mall Beijing 5,400 5,200 5,650 7,960
Hangzhou Tower Shopping City Hangzhou 5,900 5,700 6,600 7,760
Shenzhen MIXc Shenzhen 6,200 6,200 6,630 7,700
Shanghai IFC Shanghai 4,350 5,000 >6,000 >7,000
Tee Mall Guangzhou 5,500 5,700 5,500 6,000
Xi'an SAGA International Shopping Mall Xi'an 2,100 3,500 4,500 5,850
Guangzhou Grandview Mall Guangzhou 6,400 6,000 6,000 5,800
Nanjing Central Xinjiekou Nanjing 4,210 4,050 4,380 5,070
Guangzhou Taikoo Hui Guangzhou 3,100 3,600 3,960 5,040
Chengdu IFS Chengdu 1,780 3,200 3,800 4,900
Shanghai Plaza 66 Shanghai 3,000 3,500 3,850 4,850
Qingpu Bailian Outlets Shanghai 3,150 4,000 4,320 4,580
Chengdu Sino-Ocean Taikoo Li Chengdu - 2,200 2,900 4,300
Nanjing Xinbai Nanjing 3,230 3,400 3,560 4,300
Xidan Joy City Beijing 3,602 4,043 4,105 4,105
Chaoyang Joy City Beijing 2,517 2,729 3,512 4,023
Shenyang MIXc Shenyang 2,070 2,200 3,000 4,000
Source: iziRetail, Daiwa
Broadly speaking, we believe that tier-1 cities like Shanghai could accommodate more than 5 major malls over time, while in tier-2 cities there should be room for at least 2 major players, in our view. Hence, players should be safe if they are within these top 2 spots, in our view.
However challenging the situation being faced by malls in China, we think there are mitigating factors to consider. First, land costs in China are not prohibitive; this is especially the case for players which bought land in the early days. The exhibit on the next page shows the cost of land for Hang Lung Properties’ major projects in China, which appear low by most measures. It is very hard to acquire sites with GFAs of multi-million sq ft in the world’s major cities, and the days of being able to do the same in China look to have passed. Second, construction costs in China are not yet prohibitive. While construction costs in China have increased by a great deal in recent years, in the grand scheme of things they do not seem too expensive. For example, a construction cost of CNY10,000/sq m is probably the going rate for prime commercial property assets in China now, while the equivalent figure in Hong Kong is likely to be 5-6x higher. Third, total retail sales in China don’t appear to have reached their limit when considering the population and catchment area of the country’s most prime malls. In fact, the achieved tenant sales of Hong Kong’s major malls are still notably higher than those of China’s major malls. Of course, there are special factors which tend to boost tenant sales in major retail assets in Hong Kong, such as population density and limited stock size. However, given that the populations of many cities in China could end up being many times that of Hong Kong, and that the high-speed rail network should help retail spending gravitate to the strongest mall(s) in major Chinese regions, we think annual sales in the most productive malls in China could ultimately reach USD1-2bn or more.
0
2,000
4,000
6,000
8,000
10,000
12,000
14,000
SK
P B
eijin
g
Nan
jing
Dej
i Pla
za
Wuh
an In
t'l P
laza
Chi
na W
orld
Mal
l
Han
gzho
u T
ower
Sho
ppin
g C
ity
She
nzhe
n M
IXc
Sha
ngha
i IF
C
Tee
Mal
l
Xi'a
n S
AG
A In
tern
atio
nal
Sho
ppin
g M
all
Gua
ngzh
ou G
rand
view
Mal
l
Nan
jing
Cen
tral
Xin
jieko
u
Gua
ngzh
ou T
aiko
o H
ui
Che
ngdu
IFS
Sha
ngha
i Pla
za 6
6
Qin
gpu
Bai
lian
Out
lets
Che
ngdu
Sin
o-O
cean
Tai
koo
Li
Nan
jing
Xin
bai
Xid
an J
oy C
ity
Cha
oyan
g Jo
y C
ity
She
nyan
g M
IXc
(CNYm)
Favourable economics for the top malls in China

29
Hang Lung Properties: comeback time?: 21 May 2018
As the following table shows, a mall with 20,000 purchases a day and an average ticket size of HKD200 would generate annual tenant sales of c. HKD1.5bn. Given the population bases of major Chinese cites and the number of wealthy people in these cities, these figures don’t strike us as unattainable. Indeed, SKP Beijing recorded tenant sales of USD1.8bn in 2017, according to IZI Retail. Based on an occupancy cost assumption of about 18%, the annual gross rental generated by these malls could be in a range of USD180-360m.
Annual retail sales sensitivity analysis
Avg. no. of purchases per day
5,000 10,000 15,000 20,000 25,000 30,000 35,000 40,000 45,000 50,000
Avg
. val
ue
per
pu
rch
ase
(HK
D)
200 0.4bn 0.7bn 1.1bn 1.5bn 1.8bn 2.2bn 2.5bn 2.9bn 3.3bn 3.6bn
300 0.5bn 1.1bn 1.6bn 2.2bn 2.7bn 3.3bn 3.8bn 4.4bn 4.9bn 5.4bn
400 0.7bn 1.5bn 2.2bn 2.9bn 3.6bn 4.4bn 5.1bn 5.8bn 6.5bn 7.3bn
500 0.9bn 1.8bn 2.7bn 3.6bn 4.5bn 5.4bn 6.4bn 7.3bn 8.2bn 9.1bn
600 1.1bn 2.2bn 3.3bn 4.4bn 5.4bn 6.5bn 7.6bn 8.7bn 9.8bn 10.9bn
700 1.3bn 2.5bn 3.8bn 5.1bn 6.4bn 7.6bn 8.9bn 10.2bn 11.4bn 12.7bn
800 1.5bn 2.9bn 4.4bn 5.8bn 7.3bn 8.7bn 10.2bn 11.6bn 13.1bn 14.5bn
900 1.6bn 3.3bn 4.9bn 6.5bn 8.2bn 9.8bn 11.4bn 13.1bn 14.7bn 16.3bn
1,000 1.8bn 3.6bn 5.4bn 7.3bn 9.1bn 10.9bn 12.7bn 14.5bn 16.3bn 18.2bn
1,200 2.2bn 4.4bn 6.5bn 8.7bn 10.9bn 13.1bn 15.2bn 17.4bn 19.6bn 21.8bn
1,400 2.5bn 5.1bn 7.6bn 10.2bn 12.7bn 15.2bn 17.8bn 20.3bn 22.9bn 25.4bn
1,600 2.9bn 5.8bn 8.7bn 11.6bn 14.5bn 17.4bn 20.3bn 23.2bn 26.1bn 29.0bn
1,800 3.3bn 6.5bn 9.8bn 13.1bn 16.3bn 19.6bn 22.9bn 26.1bn 29.4bn 32.7bn
2,000 3.6bn 7.3bn 10.9bn 14.5bn 18.2bn 21.8bn 25.4bn 29.0bn 32.7bn 36.3bn
2,200 4.0bn 8.0bn 12.0bn 16.0bn 20.0bn 24.0bn 28.0bn 31.9bn 35.9bn 39.9bn
2,400 4.4bn 8.7bn 13.1bn 17.4bn 21.8bn 26.1bn 30.5bn 34.8bn 39.2bn 43.6bn
2,600 4.7bn 9.4bn 14.2bn 18.9bn 23.6bn 28.3bn 33.0bn 37.8bn 42.5bn 47.2bn
2,800 5.1bn 10.2bn 15.2bn 20.3bn 25.4bn 30.5bn 35.6bn 40.7bn 45.7bn 50.8bn
3,000 5.4bn 10.9bn 16.3bn 21.8bn 27.2bn 32.7bn 38.1bn 43.6bn 49.0bn 54.5bn
Source: Daiwa
Sales value of luxury goods in China
Source: Statista
Chinese consumers like luxury goods. Sales of luxury items to Chinese consumers are believed to account for over one-third of such sales globally, though a large proportion of these transactions are done overseas. However, as and when these sales shift to China, or the number of wealthy and middle-class individuals in China continues to grow, we see considerable room for retail sales of luxury goods in China to rise. Luxury goods are an important part of the story because they tend to carry the highest margins. At the end of the day, we believe that the rents that can be collected by retail landlords will tend towards the sustainable occupancy cost of each particular trade. And we think the sustainable occupancy cost of different trades tends to vary significantly, according to the operating profit per sq ft of each trade. Due to the high operating margins, we believe that luxury items will remain the trade that can pay the highest unit rents. Hence, in terms of sales productivity, the contribution from the luxury trades should not be underestimated. In sum, our view is that the China retail property ecosystem is still evolving and it is too early to pass a definitive judgment on it. We do know that what China is experiencing now, in terms of urbanisation and acceptance of a cashless society, is unprecedented in human history. There are no past examples to draw on in analysing these factors. We think it would be sensible to at least allow for the possibility that China will provide upside surprises, just as it has done before.
0
10
20
30
40
50
60
70
80
2010 2011 2012 2013 2014 2015 2016 2017 2018E 2019E 2020E
(EURbn)

30
Hang Lung Properties: comeback time?: 21 May 2018
In any case, we believe that the malls in the established city centres of major Chinese cities are well protected from the rise of e-commerce and concern about the oversupply of retail space in the country. We see real potential for this market. The question is: who has the vision and capability to navigate the challenges in the sector and get the most from it. Is Hang Lung Properties the way to play the potential of the China retail property sector? And has Hang Lung Properties found the best way to manage its retail properties in China?

31
Hang Lung Properties: comeback time?: 21 May 2018
Question 3
Has HLP found the best way to
manage its retail properties?

32
Hang Lung Properties: comeback time?: 21 May 2018
“Look at stocks as businesses, look for businesses you understand, run by people you trust and are comfortable with, and leave them alone for a long time.”
- Warren Buffett Before we address the question of whether HLP has found a way to manage its retail properties, we first examine the different philosophies of the retail property management business. We believe looking at the philosophies provides the context through which investors can assess how HLP has evolved over the years and how its credentials have strengthened. While it is typical for the stock market to use a conventional demand and supply analysis to analyse the prospects for all property asset classes, we do not think this approach is enough to analyse the retail property sector. While we do not dispute the importance of a conventional demand and supply analysis, we would caution that the way demand and supply factors work for retail properties or shopping malls is more subtle and complex than for other property segments such as offices. In our opinion, one of the most important factors determining the value of retail properties is their management. We see 2 opposing philosophies in the running of retail property business. At one end of the spectrum, retail property management is seen as simply a landlord business, while at the other end, it is seen as more as a partnership (between the owner of the property and its retail tenant clients).
The “landlord business” versus the “partnership business” Landlord business Partnership business
Focus Minimising vacant space Maximising tenant sales
Tenant mix No special strategy, other than maximising the achieved rent
Creating an environment which is most conducive to repeat shoppers and to facilitate the malls becoming more popular and more relevant
Tenant sales No special attention. Caring mainly whether the tenants pay rent on time
Closely monitoring changes in tenant sales, their distribution, etc., to get a pulse on the most current situation of the mall
Positioning No special attention paid to fine-tuning the mall's positioning
Constant fine-tuning to search for an optimal positioning in the prevailing retail environment
Tenant relationship Getting tenants to pay the maximum rent Work as partners with tenants to create a larger pie for all
No special attention paid to the tenant or working team on major retail groups
Dedicated teams to work with major retail groups to facilitate the execution of their retail strategy
Customer traffic Wait passively for shoppers to come Using active promotions to attract its repeat visits by target shoppers
Source: Daiwa
Overall, retail property management is still a relatively young industry, and as such, has required different players to seek and experiment with different models for the business. In general, most property companies (not only in Hong Kong but in other parts of the world as well) tend to start off primarily adopting the “landlord business” approach for ease and simplicity. If an owner of a property sees itself just as a landlord, its priorities are generally just that of minimising vacancy rates and making sure space is leased to the highest bidders, while the operating cost for managing the property is minimised. This way to manage the business is relatively straightforward and simple, though the trade-off is that, if a retail property is managed in such a way, its aggregate tenant sales growth would not be much better than that of the overall market. This management approach allows the asset to ride on the growth of the overall market or the growing importance of the district where it is located, but may not allow the mall to demonstrate exceptional resilience during difficult times – nor outperform peers in the same district in a consistent and sustained manner. By way of contrast, under a partnership business, the priorities and focus of the landlord are very different as its focus is on growing the pie of aggregate tenant sales rather than merely filling up the space. Instead of merely trying to fill up the space, the priority is to ensure the tenant mix is right, that more shoppers prefer to shop in the mall and that they return repeatedly so that they gradually form a habit to shop in the mall instead of going to other malls in other districts or buying online.
What are the different ways to manage retail property?

33
Hang Lung Properties: comeback time?: 21 May 2018
In our view, if a retail property is managed in this way, then considerable importance needs to be placed on: 1) monitoring how consumer behaviour in the mall and the broader retail market changes, 2) the overall positioning of the mall, 3) the appropriate trade mix inside the mall, 4) the store management strategies of the retailers, 5) the changing merchandise and positioning of each of the retailers inside the mall, and most importantly, 6) how to continue to fine-tune and modify the various aspects of the mall so that the mall can stay strong and relevant in terms of being able to attract the most popular retailers and the biggest spenders. In short, instead of being a passive landlord collecting rent determined by the market, a retail property owner can also become an active manager, providing a crucial link between the retailers and shoppers, and bringing its own input (such as promotions, hardware improvements, changes in positioning and tenant mix, etc.) to work to drive up retail sales at the mall to get a larger portion of the city’s overall retail pie. As such, we believe retail property management is a management-intensive business and that landlords play an important and leading role in the development of a mall and the growth of retail sales for tenants in the mall. We believe there are significant differences between the achieved retail sales – and hence retail rental income performance – of malls under these 2 different models. While most property owners/developers tend to adopt the traditional landlord model to run their business, our read is that the strongest players in the industry tend to be those that lean more towards the latter model.
In our opinion, retail property companies need to build an effective and productive partnership with both their tenants and their customers, thus creating what we refer to as the 3 virtuous cycles (between consumers and the mall; between retailers and the mall; and between customers and the tenants of the mall) as explained on page 13. We think this approach constitutes the ideal management style retail property managers should move towards over time. However, as to how this form of management can be executed, we do not think there is a ready formula. As far as we can discern, there are 4 different models under which to achieve an effective and productive partnership with tenants and customers, which we examine below before moving on to look at how HLP has fared in this regard.
1) Systematic and professional management of retail property assets The first model focuses on the systematic and professional management of retail property assets. In our opinion, the value that can be created by systematic and professional management of retail property assets is significant. Retail is essentially a fragmented industry everywhere, with retail sales in a city being spread around easily hundreds, if not thousands, of retail properties; and very often a typical mall’s share of the city’s retail pie tends to be very small, often well under 0.5%. What this means is that there is often substantial room for a popular mall or a network of well-managed malls to continue to take market share from the less-well-managed retail property assets. We think what commercial real-estate companies like the US’s Simon Property (Not rated) and Australia’s Westfield (Not rated) have demonstrated is that retail property can be a scalable business, and that once a company has got a proper system in place (eg, with specialised teams dedicated to leasing, development; effective communication and co-ordination among the different brands, etc.), the number of malls it is capable of running at the same time can be expanded significantly to possibly well over 100. Moreover, through building up a proper and effective system, retail landlords can ensure that each of the malls within a large portfolio can maintain a certain minimum standard and that the time required for nurturing new malls can be shortened. Needless to say, having a large retail mall network and professional team in place is conducive to expanding through M&A. We can see that the building up of a system to manage retail property assets in a systematic and professional way would significantly enhance the potential of a retail landlord. It appears to us that property companies in the US, Europe and Australia appreciate this aspect better than those in smaller markets, probably because their markets are much larger in geographical reach and they can have a large number of malls in their portfolio.
What are the 4 different models for retail property management?

34
Hang Lung Properties: comeback time?: 21 May 2018
2) Maximising sales productivity Another model is to focus on maximising sales productivity. It appears to us that the property companies in Hong Kong, and Asia historically, tend to put less emphasis on the creation and building of a proper and effective system to run their businesses. We think this is understandable because most property companies in Hong Kong and Asia do not generally have many malls to manage. As such, having the right key person in place to manage each major mall can be more important and effective than developing a proper and effective system. In any case, our read is that while Western companies appear to excel more in the scale they can manage, when it comes to the sales productivity of individual malls, the property companies in Hong Kong are more advanced. As a matter of fact, the sales productivity demonstrated by some of the malls in Hong Kong, such as Harbour City, is notably higher than that of their Western counterparts and we believe this mall has placed considerable emphasis on maximising its sales productivity, one main objective a retail mall should aim to achieve, in our view.
Retail sales at Harbour City versus the Hong Kong retail sector since 2003 2003 2004 2005 2006 2007 2008 2009 2010 2011 2012 2013 2014 2015 2016 2017
Harbour City retail sales (HKDbn) 4.7 6.8 7.8 8.9 11.4 13.5 15.5 20.1 27.1 30.8 33.8 35.0 30.7 27.7 30.2
YoY change (%) 44.7% 14.7% 14.1% 28.1% 18.4% 14.8% 29.7% 34.8% 13.7% 9.7% 3.6% -12.1% -9.7% 9.1%
HK overall retail sales (HKDbn) 172.9 191.5 204.4 219.0 247.0 273.1 274.7 325.0 405.7 445.5 494.4 493.2 475.2 436.6 446.1
YoY change (%) 10.8% 6.7% 7.2% 12.8% 10.6% 0.6% 18.3% 24.9% 9.8% 11.0% -0.2% -3.7% -8.1% 2.2%
Market share (%) 2.7% 3.6% 3.8% 4.1% 4.6% 4.9% 5.6% 6.2% 6.7% 6.9% 6.8% 7.1% 6.5% 6.3% 6.8%
Source: Company, Daiwa
Retail sales per sq ft at Harbour City versus the top players in the US
Source: Wharf REIC
3) Using mixed development to underpin long-term and sustainable growth
Other than focusing on driving sales productivity, another model we have seen in the market emphasises the mixed development model. As we see it, when it comes to the phenomenon of urbanisation, Asia is probably more advanced than many Western counterparts, and that large-scale mixed development property projects is probably more of an Asian product than a Western one. In our opinion, mixed developments offer considerable benefits to the mall portion of the development, while the hotel, office, and serviced apartment components of the development would attract captive (and often high-end) customers. In our opinion, such a setup is conducive to the sustained growth of the mall over the long term and would help to provide it with greater protection during times of weakness in the overall market.

35
Hang Lung Properties: comeback time?: 21 May 2018
As far as we can discern, Pacific Place mall is probably one of the first examples of a mixed development in Asia or possibly globally, in that it is probably one of the first property projects that, from the very beginning, was designed to have various different components that could bring synergies to the development of the mall. Such a design helps ensure a property is strongly positioned to withstand the nurturing period and that there are factors in place to drive the sustained growth of the mall over time, in our view.
The Pacific Place mixed development property project of Swire Properties
Office Retail Hotel Serviced Total Cumulative No. No. of
Properties Area Year of completion
GFA (sq ft)
GFA (sq ft)
GFA (sq ft) ##
apts GFA (sq ft)
GFA (sq ft)
GFA (sq ft)
of rooms
car parks
One Pacific Place Admiralty 1988 863,266 - - - 863,266 863,266 - -
The Mall, Pacific Place Admiralty 1988 - 711,182 - - 711,182 1,574,448 - 470
JW Marriott HK Admiralty 1988 - - 515,904 - 515,904 2,090,352 602 -
Two Pacific Place Admiralty 1990 695,510 - - - 695,510 2,785,862 - -
Pacific Place apartments Admiralty 1990 - - - 443,075 443,075 3,228,937 - -
Conrad HK Admiralty 1990 - - 555,590 - 555,590 3,784,527 513 -
Island Shangri-La HK Admiralty 1991 - - 605,728 - 605,728 4,390,255 565 -
Three Pacific Place Wanchai 2004 627,657 - - - 627,657 5,017,912 - 111
21-29 Wing Fung Street Wanchai 2006 - 14,039 - - 14,039 5,031,951 - -
The Upper House Admiralty 2009 - - 158,738 - 158,738 5,190,689 117 -
Star Crest, 9 Star Street Admiralty 2009 - 13,112 - - 13,112 5,203,801 - -
28 Hennessy Road Wanchai 2012 145,390 - - - 145,390 5,349,191 83 -
8 Queen's Road East Wanchai 2012 81,346 - - - 81,346 5,430,537 - -
2,413,169 738,333 1,835,960 443,075 5,430,537
1,880 581
Three Pacific Place extension?* Wanchai
Four and Five Pacific Place?# Wanchai
Source: Company, Daiwa Note: *Subject to government approval
#From the redevelopment of the many sites Swire has assembled in the area over the past two decades ##Based on the full size of these hotels, which better illustrates the scale of Pacific Place. However, Swire Properties wholly owns only the Upper
House and has 20% stakes in the other 3 hotels
4) Using technology to enhance the appeal of a mall to both consumers and retailers
The 4
th model we highlight involves using modern technology to enhance the appeal of a mall. However, unlike the
3 models above, this approach is still in the early stage of development. What we know is that many of the largest property companies in the world, such as Simon Property and Westfield, seem serious about exploring how to integrate technology into the retail property management business, though we have yet to see many concrete examples as to how this model works. That said, based on our analysis, we see technology as a parameter that will grow in importance for the retail property management business, and that there are many areas where the offline and online platforms can complement each other. As such, we believe retail property companies that can successfully leverage on technology to strengthen their malls would be favourably positioned in the years ahead.
The present and future retailing pie?
Source: Daiwa
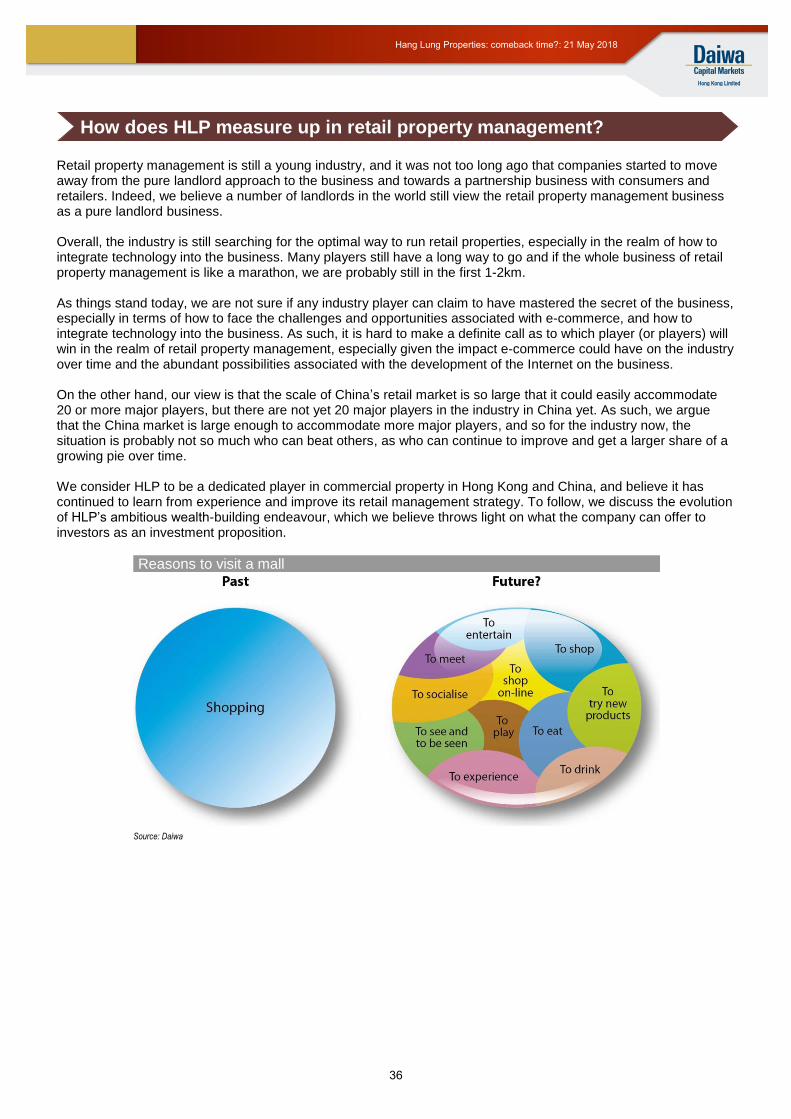
36
Hang Lung Properties: comeback time?: 21 May 2018
Retail property management is still a young industry, and it was not too long ago that companies started to move away from the pure landlord approach to the business and towards a partnership business with consumers and retailers. Indeed, we believe a number of landlords in the world still view the retail property management business as a pure landlord business. Overall, the industry is still searching for the optimal way to run retail properties, especially in the realm of how to integrate technology into the business. Many players still have a long way to go and if the whole business of retail property management is like a marathon, we are probably still in the first 1-2km. As things stand today, we are not sure if any industry player can claim to have mastered the secret of the business, especially in terms of how to face the challenges and opportunities associated with e-commerce, and how to integrate technology into the business. As such, it is hard to make a definite call as to which player (or players) will win in the realm of retail property management, especially given the impact e-commerce could have on the industry over time and the abundant possibilities associated with the development of the Internet on the business. On the other hand, our view is that the scale of China’s retail market is so large that it could easily accommodate 20 or more major players, but there are not yet 20 major players in the industry in China yet. As such, we argue that the China market is large enough to accommodate more major players, and so for the industry now, the situation is probably not so much who can beat others, as who can continue to improve and get a larger share of a growing pie over time. We consider HLP to be a dedicated player in commercial property in Hong Kong and China, and believe it has continued to learn from experience and improve its retail management strategy. To follow, we discuss the evolution of HLP’s ambitious wealth-building endeavour, which we believe throws light on what the company can offer to investors as an investment proposition.
Reasons to visit a mall
Source: Daiwa
How does HLP measure up in retail property management?

37
Hang Lung Properties: comeback time?: 21 May 2018
Granted, HLP was not known in the past for its retail property management expertise. Indeed, retail property management was not its core business in earlier days. In retrospect, HLP started off in the 1960s as mainly a residential property developer in Hong Kong and it was only in the late 1980s and early 1990s that it began to expand its commercial property portfolio. However, the most prime commercial properties in Hong Kong are generally owned by the old British companies and HLP has never owned a trophy commercial property asset in Hong Kong. In common with many other property companies, HLP has adopted more of a landlord approach to the retail property management business. In this light, it appears logical for some investors to ask: is retail property management in HLP’s DNA? We think it is fair to say that HLP did not originally have such DNA, but may have acquired it over time; and this has something to do with its experience in Shanghai. In our opinion, there are few companies that are truly dedicated to retail property management, mainly because this business requires a lot of effort and patience, while there can be a long wait for the payback. Generally, our observation is that it is hard for companies to develop a strong vision for retail property management and to build up a dedicated team to focus on the retail property management business, because for companies that have not owned trophy retail property assets, it is often hard for them to foresee the kind of returns that can be generated by a retail property management business when virtuous cycles work in their favour. But for HLP, we believe it did realise how strong the returns could be when malls enter a sustained virtuous cycle because of its experience in Shanghai. Although both Grand Gateway 66 and Plaza 66 did not perform that well when they first opened, they have been able to ride on the take-off of private consumption in Shanghai and the coming of major foreign luxury brands to the Shanghai market.
HLP: yield on cost of Shanghai properties
Source: Daiwa estimates
Gross rental income at Grand Gateway 66
Source: Company, Daiwa
0%
10%
20%
30%
40%
50%
60%
2001 2002 2003 2004 2005 2006 2007 2008 2009 2010 2011 2012 2013 2014 2015 2016 2017
Grand Gateway 66 Plaza 66
0
200
400
600
800
1,000
1,200
1,400
2001 2002 2003 2004 2005 2006 2007 2008 2009 2010 2011 2012 2013 2014 2015 2016 2017
(HKDm)
1st lease
3rd lease
2nd lease
4th lease
6th lease5th lease
Is retail property management in HLP’s DNA?

38
Hang Lung Properties: comeback time?: 21 May 2018
Gross rental income at Plaza 66
Source: Company, Daiwa
Our answer is yes. We think what happened with HLP in its China ambition is that it bought several major residential property sites in Hong Kong during the 1999-2001 period, and while the total amount involved was only about HKD5.9bn for the land, we estimate HLP eventually realised over HKD22bn in pre-tax profits from these projects.
Major residential sites acquired by HLP over the 1999-2001 period
No. of units GFA (m sq ft) Year of land acquisition Total land cost (HKDm)
The HarbourSide 1,122 1.4 1999 2,172
AquaMarine 1,616 1.3 2000 850
Carmel-on-the-Hill 188 0.1 2000 251
The Long Beach 1,829 1.7 2001 2,580
4,755 4.5
5,853
Source: Company, Daiwa estimates
In this light, we contend that HLP essentially did an asset swap, ie, it used the profits it realised from its Hong Kong residential property projects to fund an ambitious transformation into a premier commercial property landlord in China. Hence, in the 5 years after 2005, HLP engaged in a buying spree of prime commercial property sites in major cities in China, mostly through negotiations with the government. And we believe the greatest achievement of HLP during this period was that it made use of the special time-window to buy a number of prime sites in major cities, at very low prices. Although it paid more for the Kunming and Wuhan sites than its other sites in China, we believe it would be hard to acquire such sites at these prices now.
0
200
400
600
800
1,000
1,200
2002 2003 2004 2005 2006 2007 2008 2009 2010 2011 2012 2013 2014 2015 2016 2017
(HKDm)
1st lease
3rd lease
2nd lease
4th lease
5th lease
6th lease
HLP: summary of its 10 commercial property projects in China Project Grand Gateway 66 Plaza 66 Palace 66 Parc 66 Forum 66 Center 66 Riverside 66 Olympia 66 Spring City 66 Heartland 66 Total
City Shanghai Shanghai Shenyang Jinan Shenyang Wuxi Tianjin Dalian Kunming Wuhan
Land acquisition time Dec 1992 Dec 1993 Sep 2005 Feb 2007 Aug 2006 Dec 2006/ May 2009
Feb 2005 May 2009 Sep 2011 Feb 2013
Year of completion 2000 2001 2010 2011 2012 2013 2014 2015 2018 2019
Retail 0.9 0.5 1.2 1.8 1.1 1.3 1.6 2.4 1.7 1.9 14.4
Office - 1.4 - - 8.8 1.6 - - 1.9 1.6 15.3
Serviced apt/ hotels - - - - 0.6 1.6 - - 1.1 1.4 4.7
Sub-total 0.9 1.9 1.2 1.8 10.5 4.5 1.6 2.4 4.7 4.9 34.4
Car parks 0.3 0.5 0.8 0.9 2.1 1.2 1.2 1.6 2 2.6 13.2
Total 1.2 2.4 2.0 2.7 12.6 5.7 2.8 4.0 6.7 7.5 47.6
Source: Company, Daiwa Note: shaded areas refer to areas that may be converted for residential use
Does HLP have the requisite capital to fund its China ambition?

39
Hang Lung Properties: comeback time?: 21 May 2018
HLP: China portfolio
Source: Company, Daiwa
In our view, HLP’s wealth-building endeavours in China retail can be divided into 2 phases. Phase 1 was between 2005 and 2011 when HLP engaged in a buying spree of prime commercial property sites in major cities in China, which was followed by a continuous construction of large-scale property projects across various major Chinese cities. Then it entered phase 2 (2010-17) which was characterised by a continuous opening of property projects from sites it acquired from 2005-11. In our opinion, the period 2010-17 was very important in terms of understanding HLP’s China ambition and how the group responded to the challenges it faced. This period exposed the fact that the execution related to its malls outside Shanghai was more difficult than it had conceived initially. At the same time, it was also during this period that some important changes took place in the China retail market. While in the past, there was a small group of big spenders in China providing strong support to luxury retail sales in the country, such spending disappeared fast during the 2010-17 period, triggered by the government’s anti-corruption measures. In hindsight, the challenges faced by HLP during this period were considerable, stemming from: 1. The company’s focus shifting from construction and land purchases to execution, leasing and new mall
openings. 2. A decline in luxury spending as a result of the anti-corruption campaign and rapid dissolution of big-ticket
spending from a small group of ephemeral consumers. 3. The strategy for its new malls did not seem to work well and needed continuous refinement and revitalisation. 4. The group’s home base, the Shanghai market, was also under threat due to new competition and a decline in
luxury sales in the city. HLP’s response to these challenges was anything but passive. The company focused intently on addressing these issues. Outlined below are what we see as its main achievements during this period, which we think shed light on the group’s resolve and determination to pursue its ambition in the commercial property business.
Has HLP encountered setbacks and has it emerged from them?
China projects of Hang Lung Properties

40
Hang Lung Properties: comeback time?: 21 May 2018
One of the most important achievements of HLP in our view is that it managed to maintain Plaza 66 as a premier pure luxury mall in Shanghai despite all the competition from new malls in Shanghai and the notable fall in overall luxury spending in the city. The challenges faced by Plaza 66 were indeed significant. All along, this mall did not have a lot of traffic and its strong tenant sales came from a small group of big-ticket spenders. But given the plunge in luxury retail sales in China since 2012, and the competition from all the new malls in Shanghai, it was conceivable that tenant sales in Plaza 66 could fall sharply at any time in the subsequent years and that the mall would enter a vicious cycle driving a multi-year downturn. However, this situation did not happen. And we think this has a lot to do with HLP’s ability to instil confidence in the major luxury brands in the mall of the group’s long-term commitment to the property, which was reflected in its asset enhancement initiative (AEI) programme designed to strengthen the mall’s status as the premier luxury mall, not only in Shanghai but in the whole country.
AEI at Plaza 66 AEI at Plaza 66
Source: Company Source: Company
AEI at Plaza 66 AEI at Plaza 66
Source: Company Source: Company
Of note is that during the most difficult period in the luxury goods market in Shanghai (2012-16), several major brands at Plaza 66 expanded their shop sizes and also renovated their stores, which we see as a demonstrated commitment on the part of both the landlord and its major tenants in terms of maintaining the mall’s status as a premier luxury mall in the country. We discuss the concept of a virtuous cycle between the mall and tenants in retail property management on page 13 and think what occurred at Plaza 66 during this period can be seen as a manifestation of such a virtuous cycle.
Plaza 66 has held up as a pure luxury mall despite headwinds

41
Hang Lung Properties: comeback time?: 21 May 2018
AEI at Plaza 66 AEI at Plaza 66
Source: Company Source: Company
AEI at Plaza 66 AEI at Plaza 66
Source: Company Source: Company
Meanwhile, Plaza 66 seems to have been able to keep many big spenders as loyal customers during the most difficult period of luxury retailing in Shanghai. More importantly, the offspring of some traditional wealthy families in Shanghai and the vicinity seem to have developed an attachment to Plaza 66 which has provided the mall with renewed purchasing power and new customers. One feature of the Plaza 66 AEI was to make the mall feel warmer and younger, while at the same time making it more luxurious and elegant than it was previously. We believe the mall has succeeded in winning the support of new and younger customers and has evolved to offer more luxury and designer products for the younger generation, which is important to help it sustain its status as a pure luxury mall. In recent years, Plaza 66 has introduced a very important customer (VIC) scheme, which resembles a premier airline loyalty programme. It has also opened a VIC lounge and bespoke services for its most important customers in the mall, which should help it maintain its top customers.

42
Hang Lung Properties: comeback time?: 21 May 2018
AEI at Plaza 66 AEI at Plaza 66
Source: Company Source: Company
In our opinion, pure luxury malls that are over 200,000 sq ft in size are an anomaly (Plaza 66 is 600,000 sq ft in GFA). They seldom work because there are usually not enough cities with enough wealthy people to sustain such a large mall. Bal-Harbour in Miami is well-known as one of the few successful luxury malls globally, but we believe Plaza 66 is even more luxurious than Bal-Harbour. Pure luxury malls are difficult to manage and the fact that Plaza 66 has been able to remain a pure luxury mall even during the most severe downturn in the Shanghai luxury retail market and emerge stronger once the overall environment improved (tenant sales in Plaza 66 rose 26% YoY in 2017) attests to HLP’s capability in retail property management, in our view. We believe Plaza 66 defended its position well during the most difficult period in luxury retailing in Shanghai and has been able to build up a fan base of loyal customers among both the traditional wealthy and younger generation of the wealthy in Shanghai and the vicinity. These qualities should help underpin its position in the luxury segment of the Shanghai retail market. Admittedly, there will continue to be new malls opened in Shanghai and some would attract luxury brands to open stores. However, we expect the cluster of retail space between Plaza 66 on Nanjing Road and Hui Hai Road to the east to remain the most sophisticated and luxurious retail cluster in Shanghai, and do not anticipate any of the new malls to position themselves as pure luxury malls. Overall, our view is that Plaza 66 can hold on to its position as the No.1 pure luxury mall in Shanghai (and probably the country), which would anchor HLP’s rental income from China.
Other than Plaza 66, we believe another important indicator with which to assess HLP’s retail management capability is Grand Gateway 66. Admittedly, Grand Gateway 66 was designed in the 1990s and it looks somewhat outdated by today’s standards. Nevertheless, this mall has managed to consistently remain one of the top 10 malls in Shanghai in terms of tenant sales despite the competition from all the new malls opened in Shanghai over the past 20 years. We see these as signs that the mall and tenants operating inside have been able to build up a fair number of loyal customers who have decided to continue to shop there despite having a lot more choice than before. At the same time, we think Xujiahui has the ingredients to become the strongest mass market retail hub in Shanghai, resembling Causeway Bay in Hong Kong and Shinjuku in Tokyo. As a retail hub, one of the strengths of Xujiahui in our view is that it already has a critical mass of retail assets in the district, as Grand Gateway 66 is surrounded by many department stores and smaller shopping malls. The Xujiahui Station, which is linked to Grand Gateway 66, is well-connected to other subway lines in Shanghai and in recent years, a number of the middle class and well-to-do class in Shanghai have relocated to the western side of Shanghai (to districts such as Min Hang and Changning) which should only strengthen Xujiahui’s attraction as a retail hub.
Grand Gateway 66’s positon is stronger than many feared

43
Hang Lung Properties: comeback time?: 21 May 2018
Various scenarios on the future competitive landscape in Xujiahui
The evolution of the Shanghai commercial property market
Scenarios Characteristics Other remarks
Head-on competition
Fierce competition emerges between Grand Gateway 66 and Shanghai Xujiahui
A zero-sum game, where the advance of one means the retreat of the other as the district does not succeed in realising any incremental retail spending despite a more than doubling in the amount of retail space in the district. However, as the largest and the most important part of Shanghai Xujiahui (called Lot 3) likely won't be completed until at least 2021, head-on competition should not emerge until then.
Between head-on competition and a Greater Xujiahui
Between the head-on-competition scenario and the Greater Xujiahui scenario
The Xujiahui district's scale expansion has enabled the whole district to attract more shoppers and corporations. As phases one and two of Shanghai Xujiahui involve many office spaces, the initial impact created by Shanghai Xujiahui could well be beneficial to GG66 and the whole Xujiahui district. Shanghai Xujiahui would more than double the scale of the existing Xujiahui commercial hub and much depends on whether new properties can have a kind of “magnetic effect”, drawing shoppers and major
corporations from other districts to Xujiahui.
A Greater Xujiahui
The Xujiahui district becomes a larger, stronger commercial hub
The Chunxi Road cluster in Chengdu is one main example, with Chengdu IFS and Sino-Ocean Taikoo Li complementing each other and making the whole district a stronger commercial hub that gains market share at the expense of weaker districts.
Period Phases Characteristics Other remarks
1990-2010 Build-up phase
Rapid rise in commercial properties throughout the entire Shanghai city
A chaotic situation, with many different districts competing for the status of the city's CBD
2011-2016 Formative phase
Some initial structure and hierarchy began to form
Gradually, some districts have emerged as stronger and started gathering critical mass. We see Nanjing Road West, Huahai Road, Pudong Lujiazui as among the examples of this.
2017-2022 Assertive phase
Some districts and properties begin to establish their own characteristics and a structure begins to take shape
Some districts or properties would stand out as the strongest in their respective segments
Source: Daiwa Source: Daiwa
Competition in retail is often more district-based than property-based. As such, new supply in a strong area may not be a bad thing in so far as the new supply could further strengthen the appeal of the area as a retail hub so that more retail spending, which previously would have gone to other districts, might be directed there. This could be one of the scenarios created by the opening (in phases, from 2019-23, though for the largest site, Lot 3, that seems unlikely before 2021) of SHK Properties’ International Technology Centre (ITC) right next to Grand Gateway 66. Admittedly, ITC will be a mega-sized mall with some 3m sq ft GFA and could well attract shoppers to move from Grand Gateway 66 to it. However, at the same time, it is conceivable that ITC will attract shoppers from other parts of Xujiahui or, better still, other districts in Shanghai, and some might stop by Grand Gateway 66 and become new Gateway 66 customers. In our view, appearances and age are only 2 of the many dimensions of a mall. We believe the most important determining factor for the sales productivity of a mall is how many big spenders like shopping there for whatever reason. Sogo HK and Harbour City generate very high sales productivity even by global standards but these 2 retail facilities are not outstanding in terms of appearance and age. In any case, a strong retail hub (which we expect Xujiahui to become) should be able to accommodate 2 or more strong retail properties. In Causeway Bay, both Sogo HK and Times Square have done well, while in Central, the opening of IFC and its strong performance does not seem to have affected Landmark that much. And in Tokyo’s Shinjuku, retail spending there is so high and deep that several players can do well at the same time and the existence of several strong players might have actually strengthened the competitiveness of Shinjuku as a retail hub. Closer to home, in China, 2 important case studies are Chengdu IFS and Sino Ocean Taikoo Li in Chun Xi Road. While both are mega-sized retail property assets and are located right next to each other, both have done very well ever since opening. We think these case studies lend support to our long-held view that in retail property, competition is more between districts than between properties. In the case of Chengdu, we think the existence of 2 mega-sized malls right at the heart of the city’s centre has resulted in a loss of retail spending in the weaker districts. But for the Chun Xi Road area as well as Chengdu IFS and Sino-Ocean Taikoo Li, having a strong neighbour right next to it seems to have turned out to be more of a blessing than a curse. As such, our view is that for a retail hub with sufficient scale and depth, it is not a bad thing to see newcomers as long as a mall can remain within the top-2. Grand Gateway 66 is currently the No.1 mall in Xujiahui district. Even if it slips into No.2 position, it may still do better than before, if the opening of ITC can make Xujiahui notably stronger as a retail hub.

44
Hang Lung Properties: comeback time?: 21 May 2018
We think it’s still too early to discount too much the risk associated with Grand Gateway 66 due to the opening of SHKP’s Shanghai ITC. In terms of SHKP’s leasing and marketing strategy, we believe the company is not trying to compete head-on with Grand Gateway 66. The completion of Shanghai ITC will be in phases with the most important phase (which accounts for over 70% of the retail GFA in the project) not due to open until 2021 or later. And before this section of the mall opens, SHKP will likely have completed at least 3m sq ft of Grade A office space there first, and the employees and visitors to these Grade A offices should be new and incremental customers for the retail facilities in Xujiahui and Grand Gateway 66. As such, retail facilities in Xujiahui (Grand Gateway 66 included) may see benefits from the Shanghai ITC opening first before they feel the competitive threat. At the same time, we think it is important to highlight that Grand Gateway 66 started an ambitious and large-scale AEI programme in 2016, which promises to result in a major facelift and modernisation of Grand Gateway 66. Nevertheless, we believe there are considerable habitual elements in consumer spending and that being new and modern may not be enough to take market share from others.
AEI at Grand Gateway 66 AEI at Grand Gateway 66
Source: Company Source: Company
AEI at Grand Gateway 66 AEI at Grand Gateway 66
Source: Company Source: Company

45
Hang Lung Properties: comeback time?: 21 May 2018
AEI at Grand Gateway 66 AEI at Grand Gateway 66
Source: Company Source: Company
AEI at Grand Gateway 66 AEI at Grand Gateway 66
Source: Company Source: Company
The whole process would take time and we think SHKP’s Parc Central mall in Guangzhou’s Tinhe district illustrates that taking market share from other retail facilities is not a simple and easy task – it would at least take time. While few would doubt that SHKP’s Parc Central mall in Tinhe is large-scale and impressive in terms of its design and appearance, it appears that so far, it has not affected other retail facilities in the district that much. While there appear to be a number of concerns among investors about the potential impact of Shanghai ITC on Grand Gateway 66, we think such concerns have been over-played, especially if Grand Gateway 66’s renovation works out well. We expect to start to see evidence of its actual progress in a few months’ time.
While the AEI that HLP has completed on its Hong Kong assets has not caught that much investor attention, we believe its AEI is important in terms of understanding HLP’s commitment and determination to improving its retail property management capability and its credentials, and potential to make continuous improvements over time. On the whole, HLP has made considerable improvements to its retail property assets in Causeway Bay, Mongkok, and Kornhill and has done a lot of minor work across almost the entire portfolio. While there is always room for improvement, these enhancements are important in so far as they demonstrate the group’s commitment and determination to keep on enhancing the quality of its property assets.
HLP has succeeded in revitalising its Hong Kong property assets

46
Hang Lung Properties: comeback time?: 21 May 2018
It’s no secret that the retail property management capability of a property company improves through continuous hard work and by having a team of people who are dedicated to the cause and would not stop improving the asset even if the direct impact may not be that visible. Overall, we think the results HLP has achieved for its various Hong Kong assets in recent years suggest that the group has begun to establish a culture and system to drive a continuous improvement in the quality and performance of its assets. And we see this as an important sign to note in terms of assessing how far HLP can go over time in terms of advancing its retail property management capability.
Hang Lung Centre
Source: Company
Fashion Walk
Source: Company
Amoy Plaza
Source: Company

47
Hang Lung Properties: comeback time?: 21 May 2018
Retail property management is still a young industry, and all the players are likely still on a learning curve, especially in the realm of how to make use of technology and online platforms to strengthen the competitiveness of the malls. In terms of years of experience in retail property management, HLP is not the longest in Hong Kong. Nor does it own the largest amount of trophy commercial property assets. However, over the past 10 years, it has demonstrated considerable commitment, in our view, to learn and improve. In retrospect, the management challenge it faced in the early 2010s was not small, especially given that it had to keep on constructing sizeable projects while at the same time deal with fine-tuning its new malls and coping with the challenges to its Shanghai properties. While what HLP has done in terms of AEI may not be perfect and there is probably still work to be done, we believe a lot of the work has focused on ensuring the group would have a proper platform to underpin a sustained and continuous improvement in its performance in the years to come. And we see these moves as an indication that the group has demonstrated considerable resolve and commitment to continue to improve. In the beginning of this section, we discussed the 4 ways to strengthen a property company’s retail property management capability, notably:
1) Systematic and professional management of retail property assets
2) Maximising sales productivity
3) Using mixed development to underpin long-term and sustainable growth
4) Using technology to enhance the appeal of a mall to both consumers and retailers Based on how the group has responded to the various challenges it faced in the 2010s and how it has managed the AEI for its Hong Kong and Shanghai assets, HLP has shown its commitment and determination to improve its property management in a sustained fashion. At the same time, we reckon the group has been gradually shifting from a strategy of emphasising its retail property assets in the early days (the payoff is the highest if the luxury units can be sold to wealthy individuals, especially given that hotels often do not generate high returns while the office sector in China is like a commodity) to more of a mixed development model (allocating some areas to hotels and offices to create captive customers for the malls during the nurturing phase). In our opinion, an increased emphasis on the mixed development model is one of the ways HLP can shorten the nurturing period for its malls in tier-2 cities. We believe it has been achieving progress on this front and how far it can go constitutes one important factor determining whether the market would re-assess the longer-term earnings prospects of HLP. We focus on this topic in the next section.
HLP has demonstrated a commitment to learn and improve

48
Hang Lung Properties: comeback time?: 21 May 2018

49
Hang Lung Properties: comeback time?: 21 May 2018
Question 4
Can HLP execute well in tier-2
cities?

50
Hang Lung Properties: comeback time?: 21 May 2018
“A great investment opportunity occurs when a marvellous business encounters a onetime huge but solvable problem.”
- Warren Buffett Executing large-scale premier malls in tier-2 cities in China is invariably difficult. After all, China was still a poor country until quite recently. Moreover, many shopping malls were completed at about the same time, and the shopping mall concept is a relatively new retail format for China, and has to compete with department stores, pedestrian streets, and in recent years, e-tailing for retail spending in cities. Even in a modern metropolis like Shanghai, it wasn’t until around the mid 2000s that retail spending started to reach a level that could allow retail landlords to start making some returns. Against this background, it is probably fair to say that the large-scale premier shopping mall is probably a product ahead of its time in many tier-2 cities. Outside of Shanghai and Beijing, few cities in China have a strong and expanding white-collar middle class workforce. Some very wealthy people, and a fair amount of private enterprises and small businesses can be found in most Chinese cities these days. But generally China’s middle class is still in the formative stage, while the mass public are generally not used to parting with too much of their discretionary income outside of spending it on F&B. Having said this, however, China can also change rapidly, and at an astonishing pace. While almost all major international brands have a presence in Shanghai now, when Grand Gateway 66 first opened in 2001, it struggled to attract any foreign brands as tenants and eventually got only one – Giordano Lady, which is arguably a Hong Kong brand rather than an international brand. While quality consumers may be few and far between in many tier-2 cities currently, their incomes may not be that much below the threshold beyond which their propensity to consume could significantly improve. At the same time, the attitude towards consumer spending among China’s younger generation seems to differ from that of their parents or grandparents. Now many young people in China seem willing to spend and may even borrow to enable them to spend – a concept that was foreign to their forefathers.
Retail properties in tier-2 cities with annual tenant sales exceeding CNY3bn Property City 2017 tenant sales
(CNY m)
Nanjing Deji Plaza Nanjing >9,000
Wuhan Int'l Plaza Wuhan 8,730
Hangzhou Tower Shopping City Hangzhou 7,760
Shenzhen MIXc Shenzhen 7,700
Tee Mall Guangzhou 6,000
Xi'an SAGA International Shopping Mall Xi'an 5,850
Guangzhou Grandview Mall Guangzhou 5,800
Nanjing Central Xinjiekou Nanjing 5,070
Guangzhou Taikoo Hui Guangzhou 5,040
Chengdu IFS Chengdu 4,900
Chengdu Sino-Ocean Taikoo Li Chengdu 4,300
Nanjing Xinbai Nanjing 4,300
Shenyang MIXc Shenyang 4,000
Source: iziRetail, Daiwa
On our estimates, 20,000 purchases a day at an average of CNY250 per ticket would translate into annual tenant sales of CNY1.8bn, which is probably enough to generate a reasonable initial gross yield of over 15% for a 1m sq ft mall as long as the developer keeps the land cost under control (at below CNY7,000/sq m). While this level of sales is not easy to achieve, neither is it unrealistic or inconceivable, in our view. In any case, HLP’s average land cost in tier-2 cities is about CNY4,390/sq m, which would fall to CNY2,860/sq m if we exclude Spring City 66 in Kunming and Heartland 66 in Wuhan. Retail property assets would be an investment that lasts for around 50 years or more. As such, property developers that secured low entry prices years ago for prime sites that were scarce and not available on the market for long (which was viewed by many as unthinkable at the time), could prove to have made a smart business decision.
Is there any future at all for large-scale premier malls in tier-2 cities?

51
Hang Lung Properties: comeback time?: 21 May 2018
Our observation is that, globally, it is often hard to buy a large piece of land right in the centre of a decent-sized city with a population of over 5m. In many cities in the world, it just cannot be done, however much one is willing to pay. China is probably one of the few examples in the world where it has been possible during certain periods in the past to buy prime, city-centre sites in tier-1 or tier-2 Chinese cities. But this window appears to now be narrowing. Against this background, buying large-scale prime sites in major tier-2 city centres could be a worthwhile business proposition for companies that can afford the holding and waiting period required to see the gradual maturing of these cities. None of China’s tier-2 cities are likely to become a New York or a London. But if they turn out to even somewhat resemble a Chicago, Boston or San Francisco eventually, it is probably not a bad deal to pay just about USD60/sq ft for any large-scale prime sites in a tier-2 city centre.
As a matter of fact, for all the problems and challenges associated with executing large-scale premier malls in tier-2 cities, and all the factors constraining retail spending in tier-2 cities, we have started to see a few cases of tenant sales in the major malls of some tier-2 cities exceeding CNY3bn or even CNY5bn (like Chengdu IFS in Chengdu). For all the problems associated with the Shenyang market (such as over-supply, poor economic prospects, etc.), China Resources Land’s (CRL) MIXc in Shenyang achieved annual tenant sales of over CNY4bn in 2017, according to IZI Retail, while its MIXc mall in Nanning (which is arguably more like a 2.5-tier city) achieved annual tenant sales of CNY1.8bn in its first full year of operation (2013). In our opinion, achieving annual tenant sales of CNY1.8bn or more isn’t unrealistic for a top mall in a tier-2 city. As mentioned above, we estimate that 20,000 purchases a day at an average of CNY250 per ticket would already translate into annual tenant sales of CNY1.8bn, which we regard as a level where a mall would start to generate a decent return for the developer as long as the developer has managed the cost side sensibly. While 20,000 purchases a day at CNY250/ticket (Sogo HK records about 30,000 per day) might seem on the high side for a high-end tier-2 city mall presently, we think there are probably 1,000 or more wealthy people in every tier-2 city in China whose average ticket size would be much higher than CNY250/sq ft. Hence, for malls that are one of the top-2 and can get a decent share of the market of the wealthy in tier-2 cities, achieving annual sales of CNY1.8bn or more would not be unrealistic. Note that for a mall that can generate CNY1.8bn in annual sales, it should be able to generate annual gross rental income of CNY270m based an occupancy cost assumption of 15%. As long as the developer can keep the land cost at CNY7,000/sq m or below, we estimate the gross yield generated by the project would be over 15%. Seen in this light, we argue that there is still a case for investing in malls in tier-2 cities, with the key provisos being whether the mall can be positioned within the top-2, and how long it would take for the city’s retail market scale to become like Shanghai 10-15 years ago.
In sum, we still see a sound commercial case for HLP having entered tier-2 cities over the 2005-11 period, especially given that land prices at that time were considerably lower than today and that the sites HLP acquired are all prime sites right at the heart of the established centres of these cities, which would be unlikely to be replaced even if these cities have new CBDs in the years ahead. More importantly, we believe opportunities to acquire such types of sites are rare globally (and likely to become more costly and difficult over time) and that the scale of these cities will only become larger in the next 5-10 years both in terms of population and the scale of their economies, which would trickle down into real estate values over time. To recap, we are of the view that one of the safest and most reliable ways to play the rise of a populous and mega-sized economy is through owning its prime real estate. As such, in terms of land acquisition, we think HLP scores high marks and has made wise decisions during opportune time periods to secure large-scale prime sites that could command significantly higher commercial value
Running a profitable mall in a tier-2 city should be easy as long as
you’re within the top 2, right?
What are the lessons learned so far from HLP’s tier-2 city experience?

52
Hang Lung Properties: comeback time?: 21 May 2018
over time if managed and executed well. Moreover, in terms of physical location and size, we believe these sites have good potential to be built into top-tier malls in these cities. As far as the construction of these property assets goes, while there might have been opportunities for HLP to reduce its costs somewhat, in the grand scheme of things, we do not see cost as a major issue, especially given that construction costs in China are on the rise. For example, HLP probably spent more than others to dig further underground to make way for more car parking spaces, which we believe is a sensible and affordable investment for the long term. Indeed, having more car parking spaces is already an important factor that enhances the relative attractiveness of HLP’s malls versus other malls, especially for those who commute from areas outside the city. Admittedly, the initial performance of HLP’s malls outside of Shanghai was not very encouraging. Palace 66, Parc 66, Forum 66 and Center 66 all ran into the same kind of teething problems and experienced a tenant outflow and reduction in rents when their first leases expired. In hindsight, it could be said that HLP’s initial leasing and marketing strategy in these tier-2 cities malls was influenced too much by the company’s success in Shanghai and the still-strong luxury retail market in the country when these malls formulated their leasing and tenant strategies. With Plaza 66 and Grand Gateway 66 as showcases, and given their prime locations, HLP appears to have done well in terms of pre-leasing: Palace 66 and Parc 66 were both about fully leased when they first opened in 2010 and 2011, respectively, and all 4 malls above have been able to attract prominent brands paying premium rents to secure space – and this is especially the case for Forum 66 in Shenyang.
HLP: gross rental income at its tier-2 city malls
Source: Company, Daiwa forecasts
HLP: gross rental income of its various malls in their different years of operation
Source: Company, Daiwa
As such, for the first leases at these malls, many tenants came in with high expectations and committed to premium rents. However, luxury retail sales in China have suffered over the past 6 years, with the continuation and intensification of the country’s anti-corruption campaign, and hence some tenants that came in during the first wave of leases subsequently decided to move out when consumer spending at these malls did not turn out to be as strong as they expected.
0
500
1,000
1,500
2,000
2,500
3,000
2002 2003 2004 2005 2006 2007 2008 2009 2010 2011 2012 2013 2014 2015 2016 2017 2018E 2019E 2020E
(HKDm)
Palace 66 Parc 66 Forum 66 (mall) Center 66 (mall) Center 66 (office)
Riverside 66 Forum 66 (office) Olympia 66 Spring City 66 Heartland 66
0
200
400
600
800
1,000
1,200
1,400
Yr 1 Yr 2 Yr 3 Yr 4 Yr 5 Yr 6 Yr 7 Yr 8 Yr 9 Yr 10 Yr 11 Yr 12 Yr 13 Yr 14 Yr 15 Yr 16 Yr 17
(HKDm)
Grand Gateway 66 Plaza 66 Palace 66 Parc 66
Forum 66 Center 66 Riverside 66 Olympia 66
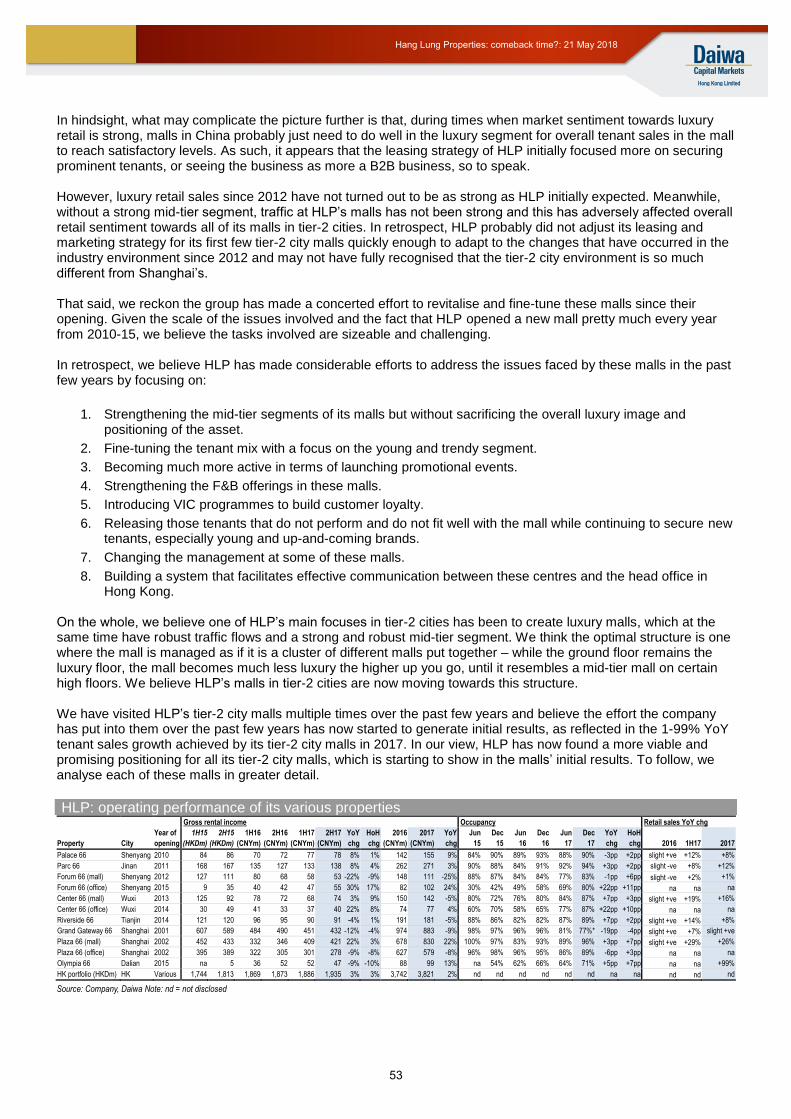
53
Hang Lung Properties: comeback time?: 21 May 2018
In hindsight, what may complicate the picture further is that, during times when market sentiment towards luxury retail is strong, malls in China probably just need to do well in the luxury segment for overall tenant sales in the mall to reach satisfactory levels. As such, it appears that the leasing strategy of HLP initially focused more on securing prominent tenants, or seeing the business as more a B2B business, so to speak. However, luxury retail sales since 2012 have not turned out to be as strong as HLP initially expected. Meanwhile, without a strong mid-tier segment, traffic at HLP’s malls has not been strong and this has adversely affected overall retail sentiment towards all of its malls in tier-2 cities. In retrospect, HLP probably did not adjust its leasing and marketing strategy for its first few tier-2 city malls quickly enough to adapt to the changes that have occurred in the industry environment since 2012 and may not have fully recognised that the tier-2 city environment is so much different from Shanghai’s. That said, we reckon the group has made a concerted effort to revitalise and fine-tune these malls since their opening. Given the scale of the issues involved and the fact that HLP opened a new mall pretty much every year from 2010-15, we believe the tasks involved are sizeable and challenging. In retrospect, we believe HLP has made considerable efforts to address the issues faced by these malls in the past few years by focusing on:
1. Strengthening the mid-tier segments of its malls but without sacrificing the overall luxury image and positioning of the asset.
2. Fine-tuning the tenant mix with a focus on the young and trendy segment.
3. Becoming much more active in terms of launching promotional events.
4. Strengthening the F&B offerings in these malls.
5. Introducing VIC programmes to build customer loyalty.
6. Releasing those tenants that do not perform and do not fit well with the mall while continuing to secure new tenants, especially young and up-and-coming brands.
7. Changing the management at some of these malls.
8. Building a system that facilitates effective communication between these centres and the head office in Hong Kong.
On the whole, we believe one of HLP’s main focuses in tier-2 cities has been to create luxury malls, which at the same time have robust traffic flows and a strong and robust mid-tier segment. We think the optimal structure is one where the mall is managed as if it is a cluster of different malls put together – while the ground floor remains the luxury floor, the mall becomes much less luxury the higher up you go, until it resembles a mid-tier mall on certain high floors. We believe HLP’s malls in tier-2 cities are now moving towards this structure. We have visited HLP’s tier-2 city malls multiple times over the past few years and believe the effort the company has put into them over the past few years has now started to generate initial results, as reflected in the 1-99% YoY tenant sales growth achieved by its tier-2 city malls in 2017. In our view, HLP has now found a more viable and promising positioning for all its tier-2 city malls, which is starting to show in the malls’ initial results. To follow, we analyse each of these malls in greater detail.
HLP: operating performance of its various properties Gross rental income Occupancy Retail sales YoY chg
Year of 1H15 2H15 1H16 2H16 1H17 2H17 YoY HoH 2016 2017 YoY Jun Dec Jun Dec Jun Dec YoY HoH
Property City opening (HKDm) (HKDm) (CNYm) (CNYm) (CNYm) (CNYm) chg chg (CNYm) (CNYm) chg 15 15 16 16 17 17 chg chg 2016 1H17 2017
Palace 66 Shenyang 2010 84 86 70 72 77 78 8% 1% 142 155 9% 84% 90% 89% 93% 88% 90% -3pp +2pp slight +ve +12% +8%
Parc 66 Jinan 2011 168 167 135 127 133 138 8% 4% 262 271 3% 90% 88% 84% 91% 92% 94% +3pp +2pp slight -ve +8% +12%
Forum 66 (mall) Shenyang 2012 127 111 80 68 58 53 -22% -9% 148 111 -25% 88% 87% 84% 84% 77% 83% -1pp +6pp slight -ve +2% +1%
Forum 66 (office) Shenyang 2015 9 35 40 42 47 55 30% 17% 82 102 24% 30% 42% 49% 58% 69% 80% +22pp +11pp na na na
Center 66 (mall) Wuxi 2013 125 92 78 72 68 74 3% 9% 150 142 -5% 80% 72% 76% 80% 84% 87% +7pp +3pp slight +ve +19% +16%
Center 66 (office) Wuxi 2014 30 49 41 33 37 40 22% 8% 74 77 4% 60% 70% 58% 65% 77% 87% +22pp +10pp na na na
Riverside 66 Tianjin 2014 121 120 96 95 90 91 -4% 1% 191 181 -5% 88% 86% 82% 82% 87% 89% +7pp +2pp slight +ve +14% +8%
Grand Gateway 66 Shanghai 2001 607 589 484 490 451 432 -12% -4% 974 883 -9% 98% 97% 96% 96% 81% 77%* -19pp -4pp slight +ve +7% slight +ve
Plaza 66 (mall) Shanghai 2002 452 433 332 346 409 421 22% 3% 678 830 22% 100% 97% 83% 93% 89% 96% +3pp +7pp slight +ve +29% +26%
Plaza 66 (office) Shanghai 2002 395 389 322 305 301 278 -9% -8% 627 579 -8% 96% 98% 96% 95% 86% 89% -6pp +3pp na na na
Olympia 66 Dalian 2015 na 5 36 52 52 47 -9% -10% 88 99 13% na 54% 62% 66% 64% 71% +5pp +7pp na na +99%
HK portfolio (HKDm) HK Various 1,744 1,813 1,869 1,873 1,886 1,935 3% 3% 3,742 3,821 2% nd nd nd nd nd nd na na nd nd nd
Source: Company, Daiwa Note: nd = not disclosed

54
Hang Lung Properties: comeback time?: 21 May 2018
As things stand today, we consider Wuxi Center 66 (opened in 2013) to have the best potential in terms of retail sales and profitability. We think the main reason is that it is the No.1 large-scale high-end mall in the city so far, and as such has a first-mover advantage in the high-end mall segment in Wuxi. In tier-2 cities, we believe that if a mall is the dominant mall in that market, usually it does reasonably well. We can draw comparisons between HLP’s Center 66 mall and CRL’s experience with its MIXc mall in Nanning. While Nanning is not a top city in China, since MIXc is the first and only premier mall in the city, almost all the retail spending of the wealthy and well-to-do class in the city gravitates towards that mall. As a result, the mall achieved annual tenant sales of CNY1.8bn in its first year of operation in 2013. In our view, Center 66 in Wuxi has the credentials to be the dominant and leading mall in the city. However, initially the mall faced the problem of the ground-floor luxury brands being the only stores that did reasonably well, while those on the upper floors lacked traffic flow. In response to this issue, HLP focused on fine-tuning its tenant mix on the higher floors and becoming much more active in terms of promotions to attract a greater number of young and trendy tenants to the mall. At the same time, we believe the openings of the city’s first subway line (which has a station under Centre 66) in 2014, and more importantly, the first office tower in Centre 66 (in 2015), have helped considerably in terms of improving the traffic flow and vibrancy of the mall. Moreover, HLP has strengthened the F&B and other offerings at the basement level of the mall, which is linked to the subway lines of the city. As such, traffic flow at the basement level has improved significantly over the past 2 years versus the 2014-16 period, with some of the improved traffic flowing up to the higher floors.
Center 66 in Wuxi
Source: Company
In our opinion, this mall was at risk of entering a vicious cycle when its first lease was about to expire in 2016, which could have led to an outflow of tenants and the mall starting going downhill in terms of traffic flow and image. However, we believe such a risk has now been averted and the mall appears to be on track to enter a virtuous cycle, with improving traffic and also a rise in retail sales on the higher floors since 2017. At the same time, the recovery in luxury retail sales first seen in Shanghai in 2H16 appears to have continued spreading in the vicinity of Shanghai and to other major cities in the country. Our read is that the ground floor of Center 66 saw an acceleration in tenant sales growth in 2017, and that such a rebound in luxury retail sales is likely to have a positive impact on overall tenant sales in the mall.
Center 66 – showing promise

55
Hang Lung Properties: comeback time?: 21 May 2018
Meanwhile, construction of the second office tower in the development is ongoing and is due to be completed in 2019. Our understanding is that the first office tower of Center 66 has successfully established an image of being the most prestigious address in the city, and we believe the solid performance in terms of rental and occupancy of the office towers of Center 66 will bring positive synergies to its malls. In our view, the benefits of a mixed development to HLP’s malls in tier-2 cities are most clearly typified by Center 66 in Wuxi. In sum, we believe Center 66 has already turned the corner and will only grow stronger with the opening of the second office tower and as overall middle class and luxury retail spending in the city continues to improve. As such, we expect Center 66 to be an important driver of improved sales and rental income for HLP’s tier-2 city projects in the next few years.
Among the 6 malls HLP has opened in tier-2 cities so far, we think Palace 66 (opened in 2010) occupies a special position, in that: it was the first mall opened in HLP’s portfolio, the first to encounter teething problems when its first lease was about to end, and the first to show a positive turnaround in terms of tenant sales trend. For all the problems that have been cited by market observers about HLP’s subpar execution in tier-2 cities and the Shenyang market, after its initial teething problems, Palace 66 has achieved positive tenant sales growth since 2014. The initial image of Palace 66 was probably as a luxury mall. While the Middle Street area where it is located has long been a robust retail area in the city, it is more a market for the mass public. As such, we believe the large Cartier flagship store in the mall has turned out to be somewhat intimidating for the typical shopper in the area. That said, HLP seems to have developed a conscious strategy to fine-tune the positioning of this mall to become more like a mall for the young and trendy. As such, the company has stepped up promotions at the mall over the past 6 years, to attract traffic and bring in retailers in the young and trendy segments.
Palace 66 in Shenyang
Source: Company
In our opinion, HLP is on the right track with this mall and we expect the Middle Street area retail hub to be gradually transformed over the next 5 years from a lower-end and mass-market oriented retail hub to one that has more young and trendy elements and an area where the younger generation of the city would frequent. As things stand today, Lifestyle has already closed its retailing operation in the street while some other department stores nearby have also ceased to operate. We think this kind of market consolidation is conducive to the strong players becoming even stronger as the industry environment in the city continues to improve. With Palace 66 lacking many luxury elements and the benefits provided by mixed developments, we expect the improvement in tenant sales at the mall to be steady and gradual, rather than steep and fast. However, our read is that this mall is now on track after facing problems after it was opened in 2010, and will ride on the gradual transformation of the Middle Street area into a more vibrant retail hub that has a stronger young and trendy flavour. If such a trend continues, we expect Palace 66 to attract more attention from tenants in the higher end and affordable luxury segments, which generally have higher rental payment capacity.
Palace 66 – tenant sales have improved steadily for 4 straight years

56
Hang Lung Properties: comeback time?: 21 May 2018
We also see this mall as one that could experiment with concepts related to e-commerce given that its customers are mostly young and trendy and hence more receptive to technology and e-commerce than older generations. If HLP can continue to strengthen its retail sales in this market segment, we would expect to see a positive spill-over to the performance of the higher floors of HLP’s malls which cater more to the mass market and young people.
In our opinion, Parc 66 in Jinan (opened in 2011) has considerable potential longer term given that it is the largest mall in the centre of Jinan city, and hence could become the dominant mall in the city, like MIXc in Nanning and Center 66 in Wuxi. One main challenge Parc 66 has faced is that the department store next to it still maintains a strong hold on the luxury segment partly because it has been the strongest player in the luxury segment for many years and has had a close relationship with the major brands in the city for a long time. That said, over the medium to long term, we believe the future of luxury retailing lies more in premier malls than department stores, which we see as a retail format that is going to fade out over time. As such, while this mall seemed to have decent traffic from the beginning and seems to have done quite well in terms of F&B, its tenant sales have not yet seen a major positive breakthrough. This could be related to the fact that its size is large (at 1.8m sq ft GFA) and its image is more mid-to-high end, which is a competitive segment with a high turnover of tenants.
Parc 66 in Jinan
Source: Company
That said, after several years, the mall now seems to have a more stable and loyal tenant and customer base (as shown in its rising occupancy rate since 2H16) and we think it’s poised to gradually improve its positioning in the Jinan retail market. We expect HLP to continue to move some of its F&B tenants in Parc 66 to the higher floors which would pave the way for it to attract more fashionable and trendy tenants, which tend to have higher rent-paying capability and make a bigger contribution to tenant sales in the mall over time. We expect the corridor currently separating the 2 sections of the malls to turn more upmarket over time and become the area where more prominent brands in fashion are located. As the mall continues to move up and HLP’s reputation in executing luxury malls in tier-2 cities continues to improve, we envisage some of the luxury malls in the department store nearby (where the luxury brands are located at now) to eventually move to Parc 66, which would then provide a stronger driver for an improvement in tenant sales and rental income in the mall. But on the whole, we believe this mall has now built up a solid foundation and is ready to see an improved retail sales performance in the years ahead.
Parc 66 – full potential yet to be unleashed

57
Hang Lung Properties: comeback time?: 21 May 2018
In contrast to HLP’s previous 4 malls, the Tianjin mall (opened in 2014) did not experience any major problems when its first lease was about to expire. That Riverside 66 was able to avoid the pitfalls faced by its predecessors we believe reflects the fact that HLP started to fine-tune its strategy in tier-2 cities before the mall was opened. Compared with its 4 predecessors, Riverside 66 was not positioned as a luxury mall from the outset, with brands like Michael Kors being among its highest-end tenants. We believe HLP has strived to position this mall as more of a lifestyle, trendy mall, with major tenants being brands like Abercrombie & Fitch and Armani Collezioni.
Riverside 66 in Tianjin
Source: Company
While Riverside 66 has not shown particularly strong results so far, its tenant sales have been holding up despite the competition; and on the whole, we believe it has been building up a foundation in preparation for the opportunities to come. We note that from the outset it allocated certain areas in the mall to luxury trades and has so far been waiting for sentiment toward luxury retail to improve. The opportunity may have arrived as tenant sales in this mall rose more notably by 8% YoY in 2017. Over the next few years, we expect Riverside 66 to attract more higher-end tenants which would help drive its tenant sales and rental income over the next few years.
Olympia 66 opened a year after Riverside 66 (in 2015) and like Riverside 66 in Tianjin, Olympia 66 seems to have avoided the issues faced by the first 4 malls opened by HLP in tier-2 cities. We think this situation attests to the fact that HLP has been fine-tuning its strategy in tier-2 cities since before Olympia was opened, and such adjustments have been working.
Olympia 66 in Dalian
Source: Company
Riverside 66 – has held up and seems to be improving
Olympia 66 – waiting for the opportunity to emerge

58
Hang Lung Properties: comeback time?: 21 May 2018
Among all of HLP’s malls in tier-2 cities, Olympia 66 is the largest, covering some 2.4m sq ft in GFA. Given that the whole northeast of China has been facing economic difficulties in recent years, HLP was not over-ambitious with Olympia 66 when it first opened. Like Riverside 66, HLP appears to be positioning the mall more for the lifestyle as well as young and trendy segments. That said, we believe HLP has ambitions to turn Olympia 66 into a luxury mall and aims to give certain portions of the mall (likely to be phase 2) a luxury flavour. We note that tenant sales at Olympia 66 rose by 99% YoY for 2017, and that its occupancy rate increased to 71% at end 2017 (versus 64% at June 2017). These should bode well for its prospects in making a greater contribution to HLP’s tenant sales and rental income in the years ahead – especially when luxury retail sales in Dalian City and the country further improve. Given that the northeast is such an important area to China from both a military and economic perspective, we would not be surprised if the Central government provides some policy support to this area at some point.
Among all of HLP’s malls in tier-2 cities, the challenge faced by Forum 66 is probably the greatest. And this challenge lies in the fact that this mall is high-end by design, yet occupies a GFA of 1.1m sq ft, which is large for a high-end mall given that Plaza 66 has a GFA of only 0.6m sq ft. At the same time, CRL’s MIXc Shenyang also has considerable luxury elements and opened before Forum 66. As such, from the very beginning, Forum 66 has had to split the luxury tenant pie with MIXc Shenyang. At the same time, since the pre-leasing of Forum 66 was done at a time when luxury retail sales in Shenyang and the country were still strong, HLP managed to achieve high rents for its first leases; but this only meant that the landlord faced larger problems when luxury retail sales in Forum 66 did not turn out to be as strong as expected when it opened. We believe HLP has been trying all sorts of ways to revitalise Forum 66 over the past few years, which culminated in the reshuffle of its management team in 2016. We think the challenges faced by Forum 66 are greater than for HLP’s other malls, but believe it is still possible for the mall to generate satisfactory returns for HLP over time given that the land cost for this project is the lowest among all of HLP’s malls in China. In our opinion, the size of Forum 66 is too large for a pure luxury mall. Having said that, it is not inconceivable, in our view, that overall tenant sales in the mall could still reach a satisfactory level of CNY1.8bn or more over time, if luxury retail sales in Shenyang continue to improve – in 2017, annual tenant sales for MIXcs were CNY4bn, according to IZI Retail.
Forum 66 in Shenyang
Source: Company
One feature of the Shenyang market is that it is home to a group of very wealthy people, albeit their numbers are limited. However, based on industry sources, there are shoppers in Shenyang who can fork out as much as CNY30m in a year, while there are other residents of the Shenyang city who spend CNY10m or more a year. As such, if a mall can get a decent market share of this special market, it is possible that overall tenant sales could still reach a satisfactory level of about CNY1.8bn or more per year. As far as we can discern, one aspect of Forum 66’s current direction is to evolve into a pure luxury mall catering to a small group of very wealthy consumers as the core, with supplementary tenant sales from white-collar workers from the surrounding areas.
Forum 66 – most challenging but a strategy seems to be taking shape

59
Hang Lung Properties: comeback time?: 21 May 2018
On our estimates, there is not enough demand for luxury fashion brands in Shenyang to fill up a 1.1m sq ft mall. However, space in the mall could be used for trades such as yoga, education, furniture and kitchen accessories, which would appeal to different members of wealthy families. Generally, the above trades do not generate high tenant sales and rent, and yet if they can help attract and retain the most wealthy shoppers to the mall, it is possible that they would still make an important contribution to the mall. In our opinion, for a luxury mall, the key is not so much traffic as customer loyalty and ticket size. Theoretically, we think HLP is on the right track with its strategy to turn Forum 66 into a luxury mall serving local wealthy families. It is likely that some wealthy shoppers might find MIXc too crowded and would prefer a more exclusive place to shop. We estimate it would only take 330 customers spending CNY3m a year to generate tenant sales of about CNY1bn for Forum 66. In any case, we believe Forum 66’s nature of being a mixed development project would help its prospects in the years ahead. The opening of the subway line in 2013 has already helped bring more foot traffic to the mall and we expect the opening of the office tower in late 2018 and Conrad Hotel in 2019 to also have a positive impact on foot traffic and Forum 66’s appeal as a mall for the very wealthy. In this connection, we think Forum 66 office tower’s image as the most prestigious address in the city will help establish the mall’s image as a destination for the very wealthy. We also note that the total GFA (including the office space as well as the mall, hotel, serviced apartments, etc.) for Forum 66 is as much as 9m sq ft and that some of its remaining GFA could be used for developing serviced apartments which could be marketed and sold as luxury apartment units like the Cullinan in West Kowloon, Hong Kong. Such a move would generate extra cash flow and earnings for HLP, on top of further strengthening the property’s image as being for the very wealthy, in our view.
Since both Spring 66 in Kunming and Heartland 66 in Wuhan have not yet opened, we are unable to comment much on their leasing strategies, positioning and tenant profiles. However, we believe HLP has been shifting its business model towards mixed developments in recent years and would note that when HLP formulates the leasing and positioning plans for Spring 66 and Heartland 66, it would likely already have a good grasp of the issues that have arisen in its other malls. In this light, HLP’s execution of these projects would likely throw light on the latest execution capability of the group in tier-2 cities. Furthermore, for Spring 66 and Heartland 66, both have GFAs that could be used for building serviced apartments suitable to be sold as luxury apartments. We see these as potential developments which could bring extra earnings and cash flow to HLP in the next few years.
Spring City 66 in Kunming
Source: Company
Spring 66 and Heartland 66 – more like mixed developments

60
Hang Lung Properties: comeback time?: 21 May 2018
Heartland 66 in Wuhan
Source: Company

61
Hang Lung Properties: comeback time?: 21 May 2018
Question 5
Can HLP make a comeback?
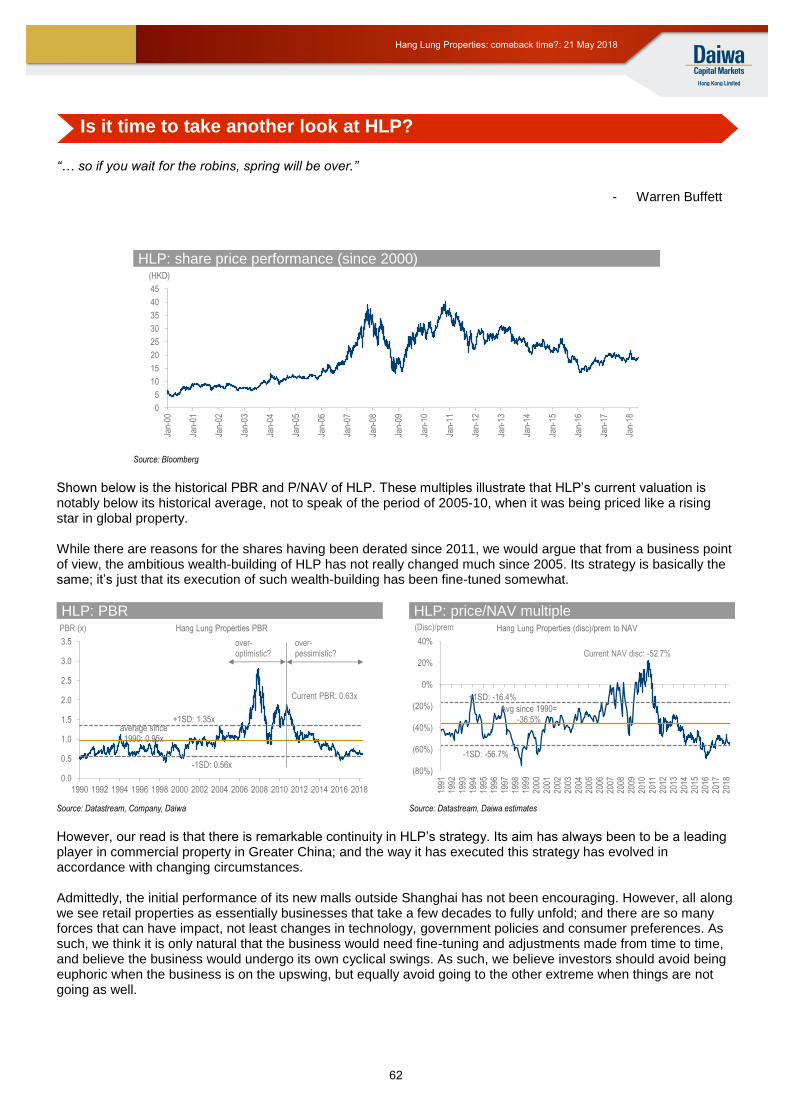
62
Hang Lung Properties: comeback time?: 21 May 2018
“… so if you wait for the robins, spring will be over.”
- Warren Buffett
HLP: share price performance (since 2000)
Source: Bloomberg
Shown below is the historical PBR and P/NAV of HLP. These multiples illustrate that HLP’s current valuation is notably below its historical average, not to speak of the period of 2005-10, when it was being priced like a rising star in global property. While there are reasons for the shares having been derated since 2011, we would argue that from a business point of view, the ambitious wealth-building of HLP has not really changed much since 2005. Its strategy is basically the same; it’s just that its execution of such wealth-building has been fine-tuned somewhat.
HLP: PBR HLP: price/NAV multiple
Source: Datastream, Company, Daiwa Source: Datastream, Daiwa estimates
However, our read is that there is remarkable continuity in HLP’s strategy. Its aim has always been to be a leading player in commercial property in Greater China; and the way it has executed this strategy has evolved in accordance with changing circumstances. Admittedly, the initial performance of its new malls outside Shanghai has not been encouraging. However, all along we see retail properties as essentially businesses that take a few decades to fully unfold; and there are so many forces that can have impact, not least changes in technology, government policies and consumer preferences. As such, we think it is only natural that the business would need fine-tuning and adjustments made from time to time, and believe the business would undergo its own cyclical swings. As such, we believe investors should avoid being euphoric when the business is on the upswing, but equally avoid going to the other extreme when things are not going as well.
0
5
10
15
20
25
30
35
40
45
Jan-
00
Jan-
01
Jan-
02
Jan-
03
Jan-
04
Jan-
05
Jan-
06
Jan-
07
Jan-
08
Jan-
09
Jan-
10
Jan-
11
Jan-
12
Jan-
13
Jan-
14
Jan-
15
Jan-
16
Jan-
17
Jan-
18
(HKD)
average since 1990: 0.95x
+1SD: 1.35x
-1SD: 0.56x
0.0
0.5
1.0
1.5
2.0
2.5
3.0
3.5
1990 1992 1994 1996 1998 2000 2002 2004 2006 2008 2010 2012 2014 2016 2018
Hang Lung Properties PBRPBR (x)
Current PBR: 0.63x
over-optimistic?
over-pessimistic?
Avg since 1990= -36.5%
+1SD: -16.4%
-1SD: -56.7%
(80%)
(60%)
(40%)
(20%)
0%
20%
40%
1991
1992
1993
1994
1995
1996
1997
1998
1999
2000
2001
2002
2003
2004
2005
2006
2007
2008
2009
2010
2011
2012
2013
2014
2015
2016
2017
2018
Hang Lung Properties (disc)/prem to NAV(Disc)/prem
Current NAV disc: -52.7%
Is it time to take another look at HLP?

63
Hang Lung Properties: comeback time?: 21 May 2018
More importantly, however challenging the situation faced by HLP has been in the past and is currently, we contend that HLP has made considerable efforts to address the challenges it faced during 2011-17, and that it has already achieved discernible progress in a number of areas, not least being that nearly all its malls have started to show positive YoY change in tenant sales since 2017 (ranging from 1% to 99%).
We also believe that with the progress it has made over the past 8 years, fundamentally, HLP now has a much more solid platform – in terms of company structure and systems, human resources and experience – from which to execute its ambitious wealth-building endeavours than it did a few years ago. This development, however, does not yet appear to have been fully captured by the stock market. In other words, we see a large and important disconnect between the fundamentals of the company and how it is being priced in the capital market, and such a disconnect deserves the attention of longer-term oriented investors, in our view. Below we take a closer look at what we see as the risk and potential upside for HLP shares.
Based on HLP’s current PBR and P/NAV, we estimate considerable pessimism or neglect has already been built into the current valuation of its shares. We think the greatest risk it faces is that its malls outside Shanghai would enter a kind of vicious cycle typified by a continuous outflow of quality tenants and declining sales, so that its investments in tier-2 cities would become like a black hole and a permanent drag on its balance sheet. However, as we set forth in Question 4, our view is that HLP has taken considerable effort to address the challenges it is facing in tier-2 cities and our read is that it has already solved all the problems. All its malls outside Shanghai have reported positive YoY growth in tenant sales for 2017 (ranging from 1% to 99% YoY), and the uncertainty lies mainly with how quickly and how much this rise in tenant sales will translate into an increase in its rental income. Even for Forum 66, which we believe is the most problematic asset it has currently, we think the worst is more or less over, and that HLP now at least has a strategy that could see the mall overcome its problems. Additionally, more than 80% of HLP’s rental income is still derived from Hong Kong and Shanghai, for which we see little risk. We believe Plaza 66 has already established itself as a strong pure luxury mall in Shanghai, and that the market’s concerns about the competitive threat faced by Grand Gateway 66 have been significantly overplayed. And we expect the market to come to realise that it has overplayed the risk faced by Grand Gateway 66 when the results of its AEI programme for the Grand Gateway 66 become more visible by the end of 2018.
HLP: operating performance of its various properties Gross rental income Occupancy Retail sales YoY chg
Year of 1H15 2H15 1H16 2H16 1H17 2H17 YoY HoH 2016 2017 YoY Jun Dec Jun Dec Jun Dec YoY HoH
Property City opening (HKDm) (HKDm) (CNYm) (CNYm) (CNYm) (CNYm) chg chg (CNYm) (CNYm) chg 15 15 16 16 17 17 chg chg 2016 1H17 2017
Palace 66 Shenyang 2010 84 86 70 72 77 78 8% 1% 142 155 9% 84% 90% 89% 93% 88% 90% -3pp +2pp slight +ve +12% +8%
Parc 66 Jinan 2011 168 167 135 127 133 138 8% 4% 262 271 3% 90% 88% 84% 91% 92% 94% +3pp +2pp slight -ve +8% +12%
Forum 66 (mall) Shenyang 2012 127 111 80 68 58 53 -22% -9% 148 111 -25% 88% 87% 84% 84% 77% 83% -1pp +6pp slight -ve +2% +1%
Forum 66 (office) Shenyang 2015 9 35 40 42 47 55 30% 17% 82 102 24% 30% 42% 49% 58% 69% 80% +22pp +11pp na na na
Center 66 (mall) Wuxi 2013 125 92 78 72 68 74 3% 9% 150 142 -5% 80% 72% 76% 80% 84% 87% +7pp +3pp slight +ve +19% +16%
Center 66 (office) Wuxi 2014 30 49 41 33 37 40 22% 8% 74 77 4% 60% 70% 58% 65% 77% 87% +22pp +10pp na na na
Riverside 66 Tianjin 2014 121 120 96 95 90 91 -4% 1% 191 181 -5% 88% 86% 82% 82% 87% 89% +7pp +2pp slight +ve +14% +8%
Grand Gateway 66 Shanghai 2001 607 589 484 490 451 432 -12% -4% 974 883 -9% 98% 97% 96% 96% 81% 77%* -19pp -4pp slight +ve +7% slight +ve
Plaza 66 (mall) Shanghai 2002 452 433 332 346 409 421 22% 3% 678 830 22% 100% 97% 83% 93% 89% 96% +3pp +7pp slight +ve +29% +26%
Plaza 66 (office) Shanghai 2002 395 389 322 305 301 278 -9% -8% 627 579 -8% 96% 98% 96% 95% 86% 89% -6pp +3pp na na na
Olympia 66 Dalian 2015 na 5 36 52 52 47 -9% -10% 88 99 13% na 54% 62% 66% 64% 71% +5pp +7pp na na +99%
HK portfolio (HKDm) HK Various 1,744 1,813 1,869 1,873 1,886 1,935 3% 3% 3,742 3,821 2% nd nd nd nd nd nd na na nd nd nd
Source: Company, Daiwa Note: nd = not disclosed
What is the risk of pessimism towards the shares rising further?

64
Hang Lung Properties: comeback time?: 21 May 2018
Gross rental income by geography
Source: Company, Daiwa forecasts
We would also highlight that, based on its current share price, HLP offers a dividend yield of 4% and further share-price weakness would mean that its dividend yield would be well over 4%, which we consider to be an attractive level, based on our view that rising rental income will underpin its DPS growth over the next few years. As such, we do not see much risk of pessimism towards the shares increasing further. However, as for the scenario that the market would turn more positive toward the stock, we see a number of potential factors and catalysts in place for sentiment to reverse, an issue we now turn to.
We believe there are many factors that could incite increased interest and optimism towards HLP shares, at both the macro and company level. One issue of note is how the global investing community will see China over the next few years. The MSCI has just started to include A shares and we believe one issue the global investing world will face over the next few years is whether and how to put China stocks into portfolios. We do not think that as yet the China A share market has too many companies into which global investors would have a lot of confidence putting sizeable amounts of capital. However, it’s unlikely that the global investing world can ignore China forever. Against this background, we believe companies like HLP would appeal to certain investors given that it offers a relatively safe way to get China exposure, with its uncomplicated earnings and company structure and a management with which global investors are familiar. At the same time, it appears that China has been making progress in terms of building up private consumption as its growth engine. Our view is that the China retail sector has, since 2012, been driven by 2 opposing forces. One is the negative impact resulting from the phasing out of big-ticket spending by some ephemeral consumers in China; and the other is natural consumption from the country’s middle class and wealthy. While the first force has been stronger in the past, we believe the latter force finally over-took the former in Shanghai during 2H16; and since then, the trend has been spreading to other cities in China.
0
2,000
4,000
6,000
8,000
10,000
12,000
2002 2003 2004 2005 2006 2007 2008 2009 2010 2011 2012 2013 2014 2015 2016 2017 2018E 2019E 2020E
(HKDm)
Hong Kong Shanghai total Tier-2 cities total
What are the factors that could drive more optimism towards the shares?

65
Hang Lung Properties: comeback time?: 21 May 2018
The two opposing forces in China retail in recent years
Source: Daiwa
As we see it, the younger generation in China seems to be much more willing to spend than their parents’ generation, and we see a fair chance that middle class consumption in China will become a more important theme in global investing going forward. Such a trend would put companies like HLP in a more interesting and favourable position than they are now, in our view. Admittedly, while retail landlord stocks in the US have fallen out of favour, we contend that the threat posed by e-commerce to US retail landlords does not apply to the Hong Kong China context. In our view, the global investing world will gradually come to accept that the position of retail landlords in Hong Kong and China is different from those in the US, and that Hong Kong/China retail landlords that can leverage on the opportunities offered by technology and e-commerce, may end up being even net beneficiaries of e-commerce. If some of the capital that had previously been allocated to US retail landlords were to shift to retail landlords in the Greater China area, we would expect HLP to be a beneficiary. At the company level, our view is that HLP has demonstrated considerable resolve and commitment to transform itself into a leading force in prime commercial property in Greater China. We believe it has continued to hone and improve its operations, and is one of the few Asian family companies with a clear vision and business strategy that has demonstrated considerable commitment and resolve to execute well its strategy and vision of becoming a premier commercial landlord in China.
HLP: DPS history HLP: BVPS history
Source: Company, Daiwa Source: Company
0.11
0.11
0.11
0.13
0.13
0.13
0.15
0.15
0.17
0.17
0.17
0.17
0.17
0.17
0.17
0.17
0.29
0.29
0.33
0.37
0.38
0.43
0.51
0.51
0.54
0.54
0.57
0.58
0.59
0.58
0.58
0.58
0.0
0.1
0.2
0.3
0.4
0.5
0.6
0.7
0.8
2002
2003
2004
2005
2006
2007
2008
2009
2010
2011
2012
2013
2014
2015
2016
2017
(HKD)
1H 2H
0
5
10
15
20
25
30
35
2003
2004
2005
2006
2007
2008
2009
2010
2011
2012
2013
2014
2015
2016
2017
(HKD)

66
Hang Lung Properties: comeback time?: 21 May 2018
In terms of dividend policy, HLP has proven itself to be stable and transparent. We believe it has considerable credentials to deliver growing DPS over the next few years, underpinned by organic growth of its underlying businesses, plus various other factors, like completion of AEI on Grand Gateway 66, increased contributions from offices in Forum 66 and Center 66, and new contributions from Spring 66 and Heartland 66. Meanwhile, we see its dividend payment capability being augmented further by potential gains from the sale of non-core assets or a new round of property sales projects from China.
Our current views on HLP’s various malls and offices in China Asset Comments
Plaza 66 mall The strongest pure luxury mall in Shanghai.
Grand Gateway 66 Looks to be on its way to become one of the two major malls in the Xujiahui area which could become the largest retail hub in Shanghai inner ring.
Plaza 66 office Tenant adjustment was over by end-2017; remains a prestigious office building in the Nanjing Road West cluster of the Shanghai office market.
Palace 66, Shenyang Has kept on progressing as a mall for the mass market, especially young families and the middle class.
Forum 66, Shenyang Repositioning continues and could gradually evolve into a luxury mall serving more comprehensive needs (including education, gym, etc.) of a select group of wealthy, as well as the professionals working and living in the complex.
Center 66, Wuxi Re-positioning seems to have worked and now with solid credentials to become the number one mall in Wuxi, with a luxury component but also other floors serving the mass as well.
Parc 66, Jinan Repositioning is going on, with solid credentials to become the number one mall in Jinan, being gradually upgraded to take in higher-end tenants. Could have some luxury components eventually.
Riverside 66, Tianjin Able to avoid issues faced by Forum 66 and Center 66 when the first lease expires. Could evolve into like Grand Gateway 66 in Tianjin, and may eventually have some luxury components.
Olympia 66, Dalian Able to avoid issues faced by Forum 66 and Center 66 when the first lease expires. Solid credentials to become the number one mall in Dalian, with some luxury components alongside with more floors for the mass market.
Center 66 office Solid credentials to be a top-tier office building in Wuxi.
Forum 66 office Solid credentials to be a top-tier office building in Shenyang.
Source: Daiwa
Finally, we think another angle from which to view HLP shares is under the theme of the modernisation of Hong Kong family business groups or Hong Kong family property companies. It is well-known that Hong Kong property companies have been trading at lower valuations than their global peers for a long time, and we maintain the view that one main reason for this lower valuation is global investors’ perception about and confidence in Hong Kong family property companies. Among Hong Kong family property companies, HLP so far has been more successful than many in terms of building up a shareholder base of major global investors. Seen in this light, we contend that if global investor interest in Hong Kong China property companies were to rise, HLP would be a beneficiary.
HLP: snapshot of major shareholders (May 2018) HLP: snapshot of major shareholders (Dec 2012) Name No. of
shares held
%
interest
Hang Lung Group 2,547,496,340 56.6%
First Eagle Investment Mgmt 269,877,183 6.0%
Blackrock 74,347,388 1.7%
Vanguard 68,854,437 1.5%
Standard Life Aberdeen 56,176,376 1.3%
State Street 49,828,660 1.1%
Credit Agricole Groupe 48,907,877 1.1%
Seafarer Capital Partners 48,247,000 1.1%
T Rowe Price 30,702,000 0.7%
Dimensional Fund Advisors 30,578,488 0.7%
Dreyfus Corp 25,701,000 0.6%
Prudential 25,278,022 0.6%
Sun Life Financial 21,643,200 0.5%
Norges Bank 21,165,987 0.5%
Schroders 21,064,000 0.5%
Cohen & Steers 19,122,000 0.4%
Govt Pension Inv Fund Japan 16,524,200 0.4%
Chan Chichung 16,330,000 0.4%
Matthews Intl Capital Mgmt 15,220,920 0.3%
Hang Seng Bank 13,013,878 0.3%
Name No. of
shares held
%
interest
Hang Lung Group 2,295,542,670 51.3%
JP Morgan Chase 225,512,905 5.0%
Standard Life Aberdeen 138,233,302 3.1%
Carmignac Gestion 95,934,986 2.1%
Mass Mutual Life Ins 69,402,450 1.6%
Alliance Bernstein 61,086,000 1.4%
EII Capital Management 49,702,908 1.1%
Harbor Capital Advisors 48,738,000 1.1%
T Rowe Price 30,558,000 0.7%
Norges Bank 29,121,820 0.7%
Vanguard 27,763,413 0.6%
Sun Life Financial 24,781,200 0.6%
Schroders 22,605,900 0.5%
Matthews Intl Capital Mgmt 21,426,920 0.5%
Janus Henderson 19,818,992 0.4%
State Street 18,886,859 0.4%
Danske Bank 16,475,547 0.4%
Dodge & Cox 15,464,000 0.3%
Prudential 12,884,425 0.3%
Voya Investment Mgmt 11,426,222 0.3%
Source: Bloomberg, Daiwa Source: Bloomberg, Daiwa

67
Hang Lung Properties: comeback time?: 21 May 2018
HLP: snapshot of major shareholders (Dec 2009) HLP: snapshot of major shareholders (Dec 2003) Name No. of
shares held
%
interest
Hang Lung Group 2,214,005,670 53.4%
JP Morgan Chase 210,108,666 5.1%
Janus Henderson 175,361,515 4.2%
Dodge & Cox 77,060,700 1.9%
Carmignac Gestion 70,514,720 1.7%
Third Avenue Management 43,519,000 1.0%
Mass Mutual Life Ins 36,300,000 0.9%
EII Capital Management 34,580,733 0.8%
Cole Ltd 28,333,100 0.7%
Standard Life Aberdeen 26,345,162 0.6%
FMR 22,078,098 0.5%
State Street 21,836,946 0.5%
Capital Group 16,885,000 0.4%
Morgan Stanley 15,003,000 0.4%
Matthews Intl Capital Mgmt 13,199,920 0.3%
Hartford Financial Serv Grp 9,776,084 0.2%
Thornburg Investment Mgmt 9,514,000 0.2%
Hang Seng Bank 8,946,468 0.2%
Cohen & Steers 8,705,600 0.2%
Voya Investment Mgmt 8,609,288 0.2%
Name No. of
shares held
%
interest
Hang Lung Group 1,820,400,670 63.0%
Capital Group 465,233,430 16.1%
HSBC 196,586,505 6.8%
Franklin Resources 14,051,000 0.5%
Tiaa-Cref 11,179,000 0.4%
FIM Advisers 8,336,000 0.3%
FIL 4,886,000 0.2%
Invesco 3,500,000 0.1%
Mass Mutual Life Ins 2,915,000 0.1%
Transamerica Inv Services 2,374,000 0.1%
Nordea Bank 1,980,000 0.1%
Vanguard 1,825,000 0.1%
SEI Investments 1,674,000 0.1%
FMR 1,543,423 0.1%
AIG International Management 1,291,000 0.0%
Fideuram-Intesa Sanpaolo Priv 1,129,000 0.0%
BNY Mellon 1,060,000 0.0%
KBC Group 998,100 0.0%
Robeco Groep 811,000 0.0%
Ally Insurance 779,000 0.0%
Source: Bloomberg, Daiwa Source: Bloomberg, Daiwa
Disclosable purchases of HLP’s share on the open market by HLG
Value of HLG's stake in HLP divided by HLG's share price
Date No. of shares bought
Avg price
(HKD)
Total amount
(HKDm)
Shareholding after the event
3-May-04 5,293,000 10.580 56.0 56.13%
16-Jun-11 2,000,000 29.300 58.6 49.01%
5-Aug-11 10,467,000 28.192 295.1 50.23%
13-Jun-13 3,012,000 25.432 76.6 51.04%
7-Aug-13 2,000,000 25.080 50.2 52.02%
17-Feb-14 1,000,000 21.846 21.8 53.02%
2-Oct-15 1,694,000 17.321 29.3 54.01%
16-Jun-16 2,176,000 14.376 31.3 55.01%
21-Mar-18 1,819,000 18.480 33.6 56.01%
Source: HKEx, Daiwa Source: Bloomberg, Daiwa
HLP: group structure HLP: share price performance (since 2000)
Source: Company, Daiwa Source: Bloomberg
Avg. = 122%
60%
80%
100%
120%
140%
160%
180%
Jan
00
Jan
01
Jan
02
Jan
03
Jan
04
Jan
05
Jan
06
Jan
07
Jan
08
Jan
09
Jan
10
Jan
11
Jan
12
Jan
13
Jan
14
Jan
15
Jan
16
Jan
17
Jan
18Chan family
Hang Lung Group (10 HK)
- investment holding
Hang Lung Properies (101 HK)
- property development and investment in Hong Kong and China
36.6%
56.0% 0
5
10
15
20
25
30
35
40
45
Jan-
00
Jan-
01
Jan-
02
Jan-
03
Jan-
04
Jan-
05
Jan-
06
Jan-
07
Jan-
08
Jan-
09
Jan-
10
Jan-
11
Jan-
12
Jan-
13
Jan-
14
Jan-
15
Jan-
16
Jan-
17
Jan-
18
(HKD)

68
Hang Lung Properties: comeback time?: 21 May 2018
HLP: NAV breakdown
Total Per share
(HKDm) (HKD)
Completed investment properties in Hong Kong 92,367 20.6
Properties for sale/ under development in Hong Kong 5,055 1.1
Hong Kong assets 97,422 21.8
Completed investment properties in China 76,644 17.1
Properties under development in China
- Malls 9,038 2.0
- office 4,261 1.0
- Serviced apartments/ luxury residential 1,815 0.4
- Car parks 671 0.1
15,785 3.5
China assets 92,429 20.6
Enterprise value 189,850 42.4
Net debt (2,714) (0.6)
NAV 187,136 41.8
Source: Daiwa

See important disclosures, including any required research certifications, beginning on page 75
Hong Kong Real Estate
What's new: We have examined in depth the path Hang Lung Properties
(HLP) has undergone, and looked at various issues that we think will
determine whether the stock will come to be seen as a turnaround story.
What's the impact: pessimism over the shares looks unlikely to rise
further, as Plaza 66 seems to be back on a growth path while almost all of
HLP’s malls in tier-2 cities returned to positive YoY tenant sales growth of
1-99% YoY for FY17. Many premier malls in China reported encouraging
tenant sales during 1Q18, and we think widespread concerns about the
competitive threat faced by Grand Gateway 66 are overplayed; the market
will likely pay more attention to this factor when the results of the Grand
Gateway’s asset enhancement initiative (AEI) become more visible, likely
from late 2018 onwards.
Plaza 66 is strong and HLP appears to have found the way forward for
its assets outside Shanghai. While pure luxury malls seldom work in
most markets, we take the view that Plaza 66 is an exception and will
remain the strongest pure luxury mall in Shanghai. Meanwhile, after having
visited nearly all of HLP’s malls outside Shanghai in the past few months,
we believe the group has finally turned around its assets outside Shanghai,
achieving YoY tenant sales growth of 1-99% for 2017. Overall, we expect to
see improved news flow related to HLP’s ex-Shanghai malls and offices in
the next few years, as well as a gradual turning around of the market’s
perception about its assets outside Shanghai over the next 6-12 months.
We see stronger prospects for HLP’s rental business in the years
ahead, as its rental properties in Hong Kong and China achieved sustained
sales growth in 2017 and it has many projects in place (such as the
completion of Grand Gateway’s AEI, an increased contribution from offices
in Forum 66 and Centre 66, and a new contribution from Spring 66 and
Heartland 66) to supplement its organic rental income growth. This
acceleration in sales growth could be supplemented further by gains from
the disposal of non-core assets or a new round of property sales projects
from China, in our opinion.
What we recommend: We reaffirm our Buy (1) rating and 12-month TP of
HKD25.10, still based on a 40% discount to our end-2018E NAV of
HKD41.80. Key risk: an inability to ramp up mall sales in tier-2 cities.
How we differ: We have visited most of HLP’s malls in recent months and
believe they have overcome many of the challenges they had faced. While
it takes time for such progress to manifest itself in the company’s results,
we think the strides HLP has made have yet to be fully recognised.
21 May 2018
Hang Lung Properti es
Will pessimism toward the stock recede?
Pessimism over the shares seems unlikely to increase further
In fact, many factors could drive increased optimism
Reiterating our Buy (1) rating and TP of HKD25.10
Source: Daiwa forecasts
Source: FactSet, Daiwa forecasts
Hang Lung Properties (101 HK)
Target price: HKD25.10 (from HKD25.10)
Share price (18 May): HKD18.58 | Up/downside: +35.1%
Jonas Kan, CFA(852) 2848 4439
Forecast revisions (%)
Year to 31 Dec 18E 19E 20E
Revenue change - - -
Net profit change - - -
Core EPS (FD) change - - -
75
84
93
101
110
17.0
18.3
19.5
20.8
22.0
May-17 Aug-17 Nov-17 Feb-18 May-18
Share price performance
HLung Prop (LHS) Relative to HSI (RHS)
(HKD) (%)
12-month range 17.36-21.65
Market cap (USDbn) 10.60
3m avg daily turnover (USDm) 9.56
Shares outstanding (m) 4,479
Major shareholder Hang Lung Group (56.0%)
Financial summary (HKD)
Year to 31 Dec 18E 19E 20E
Revenue (m) 10,080 10,329 11,229
Operating profit (m) 7,704 7,845 8,473
Net profit (m) 4,955 5,030 5,476
Core EPS (fully-diluted) 1.106 1.123 1.223
EPS change (%) (10.4) 1.5 8.9
Daiwa vs Cons. EPS (%) 3.8 9.5 16.5
PER (x) 16.8 16.5 15.2
Dividend yield (%) 4.1 4.2 4.3
DPS 0.770 0.780 0.800
PBR (x) 0.6 0.6 0.6
EV/EBITDA (x) 12.2 12.2 11.4
ROE (%) 3.6 3.6 3.9

70
Hang Lung Properties: comeback time?: 21 May 2018 Hang Lung Properties (101 HK): 21 May 2018
Financial summary
Key assumptions
Profit and loss (HKDm)
Cash flow (HKDm)
Source: FactSet, Daiwa forecasts
Year to 31 Dec 2013 2014 2015 2016 2017 2018E 2019E 2020E
Gross rental income (HKDm) 6,642 7,216 7,751 7,737 7,779 8,231 8,939 9,839
Rental EBIT (HKDm) 5,286 5,589 5,704 5,710 5,672 5,941 6,427 7,077
Property sales profit (HKDm) 1,511 7,419 844 3,209 2,238 1,303 978 978
Year to 31 Dec 2013 2014 2015 2016 2017 2018E 2019E 2020E
Rental income 6,642 7,216 7,751 7,737 7,779 8,231 8,939 9,839
Property sales 2,496 9,814 1,197 5,322 3,420 1,849 1,390 1,390
Other Revenue 0 0 0 0 0 0 0 0
Total Revenue 9,138 17,030 8,948 13,059 11,199 10,080 10,329 11,229
Other income 829 922 1,104 1,002 1,097 1,058 1,060 1,081
COGS (2,301) (3,995) (2,400) (4,140) (3,289) (2,836) (2,924) (3,174)
SG&A (642) (644) (622) (572) (544) (560) (581) (623)
Other op.expenses 0 0 (33) (35) (36) (38) (39) (40)
Operating profit 7,024 13,313 6,997 9,314 8,427 7,704 7,845 8,473
Net-interest inc./(exp.) (437) (698) (1,041) (1,111) (1,202) (1,155) (1,218) (1,267)
Assoc/forex/extraord./others 96 75 59 63 78 83 88 93
Pre-tax profit 6,683 12,690 6,015 8,266 7,303 6,632 6,715 7,299
Tax (1,088) (2,146) (1,184) (1,513) (1,352) (1,227) (1,209) (1,314)
Min. int./pref. div./others (545) (522) (444) (412) (421) (450) (476) (509)
Net profit (reported) 5,050 10,022 4,387 6,341 5,530 4,955 5,030 5,476
Net profit (adjusted) 5,050 10,022 4,387 6,341 5,530 4,955 5,030 5,476
EPS (reported)(HKD) 1.128 2.238 0.979 1.416 1.235 1.106 1.123 1.223
EPS (adjusted)(HKD) 1.128 2.238 0.979 1.416 1.235 1.106 1.123 1.223
EPS (adjusted fully-diluted)(HKD) 1.128 2.238 0.979 1.416 1.235 1.106 1.123 1.223
DPS (HKD) 0.750 0.760 0.750 0.750 0.750 0.770 0.780 0.800
EBIT 7,024 13,313 6,997 9,314 8,427 7,704 7,845 8,473
EBITDA 7,024 13,313 7,030 9,349 8,463 7,742 7,884 8,513
Year to 31 Dec 2013 2014 2015 2016 2017 2018E 2019E 2020E
Profit before tax 6,683 12,690 6,015 8,266 7,303 6,632 6,715 7,299
Depreciation and amortisation 29 31 33 35 36 38 39 40
Tax paid (1,088) 1,741 (1,650) (1,513) (1,352) (1,227) (1,209) (1,314)
Change in working capital 314 740 (486) (560) 2,456 1,125 646 732
Other operational CF items 266 543 897 958 1,032 978 1,035 1,078
Cash flow from operations 6,204 15,745 4,809 7,186 9,475 7,546 7,226 7,835
Capex (9,274) (6,620) (7,380) (4,555) (5,478) (5,658) (5,020) (5,035)
Net (acquisitions)/disposals 0 0 0 0 0 0 0 0
Other investing CF items 134 136 140 145 148 149 150 152
Cash flow from investing (9,140) (6,484) (7,240) (4,410) (5,330) (5,509) (4,870) (4,883)
Change in debt 0 0 0 0 0 0 0 0
Net share issues/(repurchases) 0 0 0 0 0 0 0 0
Dividends paid (3,582) (3,313) (3,582) (3,582) (3,626) (3,671) (3,716) (3,761)
Other financing CF items (430) (442) (317) (470) (475) (478) (482) (485)
Cash flow from financing (4,012) (3,755) (3,899) (4,052) (4,101) (4,149) (4,198) (4,246)
Forex effect/others 0 0 0 0 0 0 0 0
Change in cash (6,947) 5,506 (6,330) (1,276) 44 (2,112) (1,842) (1,294)
Free cash flow (3,070) 9,125 (2,571) 2,631 3,997 1,888 2,206 2,800

71
Hang Lung Properties: comeback time?: 21 May 2018 Hang Lung Properties (101 HK): 21 May 2018
Financial summary continued …
Balance sheet (HKDm)
Key ratios (%)
Source: FactSet, Daiwa forecasts
As at 31 Dec 2013 2014 2015 2016 2017 2018E 2019E 2020E
Cash & short-term investment 34,321 39,946 31,289 24,325 22,106 22,172 19,922 19,560
Inventory 5,695 4,046 3,830 2,352 1,612 1,010 502 0
Accounts receivable 2,865 1,916 1,173 3,939 2,036 1,505 1,320 0
Other current assets 0 0 0 0 214 0 0 0
Total current assets 42,881 45,908 36,292 30,616 25,968 24,687 21,744 19,560
Fixed assets 138,354 146,048 146,470 143,030 156,256 161,254 165,364 170,317
Goodwill & intangibles 0 0 0 0 0 0 0 0
Other non-current assets 1,045 1,223 1,256 1,261 1,362 1,390 1,420 1,430
Total assets 182,280 193,179 184,018 174,907 183,586 187,331 188,528 191,307
Short-term debt 1,657 5,657 4,693 568 2,112 368 352 340
Accounts payable 5,977 7,906 6,806 6,327 6,673 6,817 7,023 7,045
Other current liabilities 633 1,581 501 932 504 531 542 550
Total current liabilities 8,267 15,144 12,000 7,827 9,289 7,716 7,917 7,935
Long-term debt 33,322 29,441 28,078 26,514 22,708 26,630 26,238 27,181
Other non-current liabilities 9,524 9,591 9,048 8,421 9,344 9,450 9,512 9,580
Total liabilities 51,113 54,176 49,126 42,762 41,341 43,796 43,667 44,696
Share capital 4,479 4,479 4,479 4,479 4,479 4,479 4,479 4,479
Reserves/R.E./others 120,055 127,848 124,510 122,086 131,679 132,963 134,277 135,992
Shareholders' equity 124,534 132,327 128,989 126,565 136,158 137,442 138,756 140,471
Minority interests 6,633 6,676 5,903 5,580 6,087 6,093 6,105 6,140
Total equity & liabilities 182,280 193,179 184,018 174,907 183,586 187,331 188,528 191,307
EV 90,511 85,048 90,605 91,557 92,021 94,139 95,993 97,321
Net debt/(cash) 658 (4,848) 1,482 2,757 2,714 4,826 6,668 7,961
BVPS (HKD) 27.816 29.544 28.799 28.257 30.399 30.686 30.979 31.362
Year to 31 Dec 2013 2014 2015 2016 2017 2018E 2019E 2020E
Sales (YoY) 24.0 86.4 (47.5) 45.9 (14.2) (10.0) 2.5 8.7
EBITDA (YoY) (11.0) 89.5 (47.2) 33.0 (9.5) (8.5) 1.8 8.0
Operating profit (YoY) (11.0) 89.5 (47.4) 33.1 (9.5) (8.6) 1.8 8.0
Net profit (YoY) (18.3) 98.5 (56.2) 44.5 (12.8) (10.4) 1.5 8.9
Core EPS (fully-diluted) (YoY) (18.3) 98.4 (56.2) 44.5 (12.8) (10.4) 1.5 8.9
Gross-profit margin 74.8 76.5 73.2 68.3 70.6 71.9 71.7 71.7
EBITDA margin 76.9 78.2 78.6 71.6 75.6 76.8 76.3 75.8
Operating-profit margin 76.9 78.2 78.2 71.3 75.2 76.4 76.0 75.5
Net profit margin 55.3 58.8 49.0 48.6 49.4 49.2 48.7 48.8
ROAE 4.2 7.8 3.4 5.0 4.2 3.6 3.6 3.9
ROAA 2.9 5.3 2.3 3.5 3.1 2.7 2.7 2.9
ROCE 4.4 7.8 4.1 5.7 5.2 4.6 4.6 4.9
ROIC 4.7 8.3 4.2 5.6 4.9 4.3 4.3 4.5
Net debt to equity 0.5 n.a. 1.1 2.2 2.0 3.5 4.8 5.7
Effective tax rate 16.3 16.9 19.7 18.3 18.5 18.5 18.0 18.0
Accounts receivable (days) 82.6 51.2 63.0 71.4 97.4 64.1 49.9 21.5
Current ratio (x) 5.2 3.0 3.0 3.9 2.8 3.2 2.7 2.5
Net interest cover (x) 16.1 19.1 6.7 8.4 7.0 6.7 6.4 6.7
Net dividend payout 66.5 34.0 76.6 53.0 60.7 69.6 69.5 65.4
Free cash flow yield n.a. 11.0 n.a. 3.2 4.8 2.3 2.7 3.4
Company profile
Hang Lung Properties (HLP) is the property arm of Hang Lung Group, which is one of the most
established property developers in Hong Kong. In the 1990s, it invested in 2 major commercial
property projects in Shanghai, which later became among the most popular commercial property
assets in Shanghai and China. Since the early 2000s, it has been pursuing a strategy of focusing
on the commercial property sector in China, and has subsequently acquired 8 major sites outside
Shanghai. It now has a stated strategy to transform itself into a leading player in commercial
property in Greater China.

72
Hang Lung Properties: comeback time?: 21 May 2018 Hang Lung Properties (101 HK): 21 May 2018

73
Hang Lung Properties: comeback time?: 21 May 2018 Hang Lung Properties (101 HK): 21 May 2018
Daiwa’s Asia Pacific Research Directory
HONG KONG
Takashi FUJIKURA (852) 2848 4051 [email protected]
Regional Research Head
Jiro IOKIBE (852) 2773 8702 [email protected]
Co-head of Asia Pacific Research
John HETHERINGTON (852) 2773 8787 [email protected]
Co-head of Asia Pacific Research
Craig CORK (852) 2848 4463 [email protected]
Regional Head of Asia Pacific Product Management
Paul M. KITNEY (852) 2848 4947 [email protected]
Chief Strategist for Asia Pacific; Strategy (Regional)
Kevin LAI (852) 2848 4926 [email protected]
Chief Economist for Asia ex-Japan; Macro Economics (Regional)
Olivia XIA (852) 2773 8736 [email protected]
Macro Economics (Hong Kong/China)
Kelvin LAU (852) 2848 4467 [email protected]
Head of Automobiles; Transportation and Industrial (Hong Kong/China)
Jay LU (852) 2848 4970 [email protected]
Automobiles and Components (Hong Kong/China)
Leon QI (852) 2532 4381 [email protected]
Regional Head of Financials; Banking; Diversified financials; Insurance (Hong Kong/China)
Anson CHAN (852) 2532 4350 [email protected]
Consumer (Hong Kong/China)
Adrian CHAN (852) 2848 4427 [email protected]
Consumer (Hong Kong/China)
Jamie SOO (852) 2773 8529 [email protected]
Gaming and Leisure (Hong Kong/China)
John CHOI (852) 2773 8730 [email protected]
Head of Hong Kong and China Internet; Regional Head of Small/Mid Cap
Fiona LIANG (852) 2532 4341 [email protected]
Industrial (Hong Kong/China)
Dennis IP (852) 2848 4068 [email protected]
Regional Head of Power, Utilities, Renewable and Environment (PURE); PURE (Hong Kong/China)
Daniel YANG (852) 2848 4443 [email protected]
Power, Utilities, Renewable and Environment (PURE) – Solar and Nuclear (China)
Don LAU (852) 2848 4469 [email protected]
Power, Utilities, Renewable and Environment (PURE) – Utilities (Hong Kong)
Jonas KAN (852) 2848 4439 [email protected]
Head of Hong Kong and China Property
Cynthia CHAN (852) 2773 8243 [email protected]
Property (China)
Carlton LAI (852) 2532 4349 [email protected]
Small/Mid Cap (Hong Kong/China)
Michelle WANG (852) 2773 8842 [email protected]
Transportation (Hong Kong/China)
Fan LI (852) 2773 8741 [email protected]
Custom Products Group
PHILIPPINES
Renzo CANDANO (63) 2 737 3022 [email protected]
Consumer
Micaela ABAQUITA (63) 2 737 3021 [email protected]
Property
Gregg ILAG (63) 2 737 3023 [email protected]
Utilities; Energy
SOUTH KOREA
Sung Yop CHUNG (82) 2 787 9157 [email protected]
Pan-Asia Co-head/Regional Head of Automobiles and Components; Automobiles; Shipbuilding; Steel
Mike OH (82) 2 787 9179 [email protected]
Banking; Capital Goods (Construction and Machinery)
Josh RHEE (82) 2 787 9124 [email protected]
Chemicals
Iris PARK (82) 2 787 9165 [email protected]
Consumer/Retail
SK KIM (82) 2 787 9173 [email protected]
IT/Electronics – Semiconductor/Display and Tech Hardware
Thomas Y KWON (82) 2 787 9181 [email protected]
Pan-Asia Head of Internet & Telecommunications; Software – Internet/On-line Games
TAIWAN
Rick HSU (886) 2 8758 6261 [email protected]
Head of Regional Technology; Head of Taiwan Research; Semiconductor/IC Design (Regional)
Nora HOU (886) 2 8758 6249 [email protected]
Banking; Diversified financials; Insurance
Steven TSENG (886) 2 8758 6252 [email protected]
IT/Technology Hardware (PC Hardware)
Kylie HUANG (886) 2 8758 6248 [email protected]
IT/Technology Hardware (Handsets and Components)
Helen CHIEN (886) 2 8758 6254 [email protected]
Small/Mid Cap
INDIA
Punit SRIVASTAVA (91) 22 6622 1013 [email protected]
Head of India Research; Strategy; Banking/Finance
Saurabh MEHTA (91) 22 6622 1009 [email protected]
Capital Goods; Utilities
SINGAPORE
Ramakrishna MARUVADA (65) 6228 6742 [email protected]
Head of Singapore Research; Telecommunications (China/ASEAN/India)
David LUM (65) 6228 6740 [email protected]
Banking; Property and REITs
Royston TAN (65) 6228 6745 [email protected]
Oil and Gas; Capital Goods
Jame OSMAN (65) 6228 6744 [email protected]
Transportation – Road and Rail; Pharmaceuticals and Healthcare; Consumer (Singapore)
JAPAN
Yukino YAMADA (81) 3 5555 7295 [email protected]
Strategy (Regional)

74
Hang Lung Properties: comeback time?: 21 May 2018 Hang Lung Properties (101 HK): 21 May 2018
Daiwa’s Offices
Office / Branch / Affiliate Address Tel Fax
DAIWA SECURITIES GROUP INC
HEAD OFFICE Gran Tokyo North Tower, 1-9-1, Marunouchi, Chiyoda-ku, Tokyo, 100-6753 (81) 3 5555 3111 (81) 3 5555 0661
Daiwa Securities Trust Company One Evertrust Plaza, Jersey City, NJ 07302, U.S.A. (1) 201 333 7300 (1) 201 333 7726
Daiwa Securities Trust and Banking (Europe) PLC (Head Office) 5 King William Street, London EC4N 7JB, United Kingdom (44) 207 320 8000 (44) 207 410 0129
Daiwa Europe Trustees (Ireland) Ltd Level 3, Block 5, Harcourt Centre, Harcourt Road, Dublin 2, Ireland (353) 1 603 9900 (353) 1 478 3469
Daiwa Capital Markets America Inc. New York Head Office Financial Square, 32 Old Slip, New York, NY10005, U.S.A. (1) 212 612 7000 (1) 212 612 7100
Daiwa Capital Markets America Inc. San Francisco Branch 555 California Street, Suite 3360, San Francisco, CA 94104, U.S.A. (1) 415 955 8100 (1) 415 956 1935
Daiwa Capital Markets Europe Limited, London Head Office 5 King William Street, London EC4N 7AX, United Kingdom (44) 20 7597 8000 (44) 20 7597 8600
Daiwa Capital Markets Europe Limited, Frankfurt Branch Neue Mainzer Str. 1, 60311 Frankfurt/Main, Germany (49) 69 717 080 (49) 69 723 340
Daiwa Capital Markets Europe Limited, Paris Representative Office 17, rue de Surène 75008 Paris, France (33) 1 56 262 200 (33) 1 47 550 808
Daiwa Capital Markets Europe Limited, Geneva Branch 50 rue du Rhône, P.O.Box 3198, 1211 Geneva 3, Switzerland (41) 22 818 7400 (41) 22 818 7441
Daiwa Capital Markets Europe Limited, Moscow Representative Office
Midland Plaza 7th Floor, 10 Arbat Street, Moscow 119002, Russian Federation
(7) 495 641 3416 (7) 495 775 6238
Daiwa Capital Markets Europe Limited, Bahrain Branch 7th Floor, The Tower, Bahrain Commercial Complex, P.O. Box 30069, Manama, Bahrain
(973) 17 534 452 (973) 17 535 113
Daiwa Capital Markets Hong Kong Limited Level 28, One Pacific Place, 88 Queensway, Hong Kong (852) 2525 0121 (852) 2845 1621
Daiwa Capital Markets Singapore Limited 7 Straits View, Marina One East Tower, #16-05 & #16-06, Singapore 018936, Republic of Singapore
(65) 6387 8888 (65) 6282 8030
Daiwa Capital Markets Australia Limited Level 34, Rialto North Tower, 525 Collins Street, Melbourne, Victoria 3000, Australia
(61) 3 9916 1300 (61) 3 9916 1330
DBP-Daiwa Capital Markets Philippines, Inc 18th Floor, Citibank Tower, 8741 Paseo de Roxas, Salcedo Village, Makati City, Republic of the Philippines
(632) 813 7344 (632) 848 0105
Daiwa-Cathay Capital Markets Co Ltd 14/F, 200, Keelung Road, Sec 1, Taipei, Taiwan, R.O.C. (886) 2 2723 9698 (886) 2 2345 3638
Daiwa Securities Capital Markets Korea Co., Ltd. 20 Fl.& 21Fl. One IFC, 10 Gukjegeumyung-Ro, Yeongdeungpo-gu, Seoul, Korea
(82) 2 787 9100 (82) 2 787 9191
Daiwa Securities Co. Ltd., Beijing Representative Office Room 301/302,Kerry Center,1 Guanghua Road,Chaoyang District,
Beijing 100020, People’s Republic of China
(86) 10 6500 6688 (86) 10 6500 3594
Daiwa (Shanghai) Corporate Strategic Advisory Co. Ltd. 44/F, Hang Seng Bank Tower, 1000 Lujiazui Ring Road, Pudong, Shanghai China 200120 , People’s Republic of China
(86) 21 3858 2000 (86) 21 3858 2111
Daiwa Securities Co. Ltd., Bangkok Representative Office 18th Floor, M Thai Tower, All Seasons Place, 87 Wireless Road,
Lumpini, Pathumwan, Bangkok 10330, Thailand (66) 2 252 5650 (66) 2 252 5665
Daiwa Capital Markets India Private Ltd 10th Floor, 3 North Avenue, Maker Maxity, Bandra Kurla Complex, Bandra East, Mumbai – 400051, India
(91) 22 6622 1000 (91) 22 6622 1019
Daiwa Securities Co. Ltd., Hanoi Representative Office Suite 405, Pacific Palace Building, 83B, Ly Thuong Kiet Street, Hoan Kiem Dist. Hanoi, Vietnam
(84) 4 3946 0460 (84) 4 3946 0461
DAIWA INSTITUTE OF RESEARCH LTD
HEAD OFFICE 15-6, Fuyuki, Koto-ku, Tokyo, 135-8460, Japan (81) 3 5620 5100 (81) 3 5620 5603
MARUNOUCHI OFFICE Gran Tokyo North Tower, 1-9-1, Marunouchi, Chiyoda-ku, Tokyo, 100-6756 (81) 3 5555 7011 (81) 3 5202 2021
New York Research Center 11th Floor, Financial Square, 32 Old Slip, NY, NY 10005-3504, U.S.A. (1) 212 612 6100 (1) 212 612 8417
London Research Centre 3/F, 5 King William Street, London, EC4N 7AX, United Kingdom (44) 207 597 8000 (44) 207 597 8550

75
Hang Lung Properties: comeback time?: 21 May 2018 Hang Lung Properties (101 HK): 21 May 2018
Important Disclosures and Disclaimer
This publication is produced by Daiwa Securities Group Inc. and/or its non-U.S. affiliates, and distributed by Daiwa Securities Group Inc. and/or its non-U.S. affiliates, except to the extent expressly provided herein. This publication and the contents hereof are intended for information purposes only, and may be subject to change without further notice. Any use, disclosure, distribution, dissemination, copying, printing or reliance on this publication for any other purpose without our prior consent or approval is strictly prohibited. Neither Daiwa Securities Group Inc. nor any of its respective parent, holding, subsidiaries or affiliates, nor any of its respective directors, officers, servants and employees, represent nor warrant the accuracy or completeness of the information contained herein or as to the existence of other facts which might be significant, and will not accept any responsibility or liability whatsoever for any use of or reliance upon this publication or any of the contents hereof. Neither this publication, nor any content hereof, constitute, or are to be construed as, an offer or solicitation of an offer to buy or sell any of the securities or investments mentioned herein in any country or jurisdiction nor, unless expressly provided, any recommendation or investment opinion or advice. Any view, recommendation, opinion or advice expressed in this publication may not necessarily reflect those of Daiwa Securities Group Inc., and/or its affiliates nor any of its respective directors, officers, servants and employees except where the publication states otherwise. This research report is not to be relied upon by any person in making any investment decision or otherwise advising with respect to, or dealing in, the securities mentioned, as it does not take into account the specific investment objectives, financial situation and particular needs of any person.
Daiwa Securities Group Inc., its subsidiaries or affiliates, or its or their respective directors, officers and employees from time to time have trades as principals, or have positions in, or have other interests in the securities of the company under research including market making activities, derivatives in respect of such securities or may have also performed investment banking and other services for the issuer of such securities. Daiwa Securities Group Inc., its subsidiaries or affiliates do and seek to do business with the company(s) covered in this research report. Therefore, investors should be aware that a conflict of interest may exist. The following are additional disclosures. Ownership of Securities
For “Ownership of Securities” information, please visit BlueMatrix disclosure link at https://daiwa3.bluematrix.com/sellside/Disclosures.action. Investment Banking Relationship
For “Investment Banking Relationship”, please visit BlueMatrix disclosure link at https://daiwa3.bluematrix.com/sellside/Disclosures.action. Japan Daiwa Securities Co. Ltd. and Daiwa Securities Group Inc.
Daiwa Securities Co. Ltd. is a subsidiary of Daiwa Securities Group Inc. Investment Banking Relationship
Within the preceding 12 months, the subsidiaries and/or affiliates of Daiwa Securities Group Inc. * has lead-managed public offerings and/or secondary offerings (excluding straight bonds) of the securities of the following companies: PT Totalindo Eka Persada Tbk (TOPS IJ), PT Integra Indocabinet Tbk (WOOD IJ), PT Buyung Putera Sembada (HOKI IJ), Cromwell European REIT (CERT_SP), Beijing Enterprises Water Group Ltd (371 HK), Mirae Asset Daewoo Co Ltd (006800 KS).
*Subsidiaries of Daiwa Securities Group Inc. for the purposes of this section shall mean any one or more of: Daiwa Capital Markets Hong Kong Limited (大和資本市場香港有限公司), Daiwa
Capital Markets Singapore Limited, Daiwa Capital Markets Australia Limited, Daiwa Capital Markets India Private Limited, Daiwa-Cathay Capital Markets Co., Ltd., Daiwa Securities Capital Markets Korea Co., Ltd. Hong Kong
This research is distributed in Hong Kong by Daiwa Capital Markets Hong Kong Limited (大和資本市場香港有限公司) (“DHK”) which is regulated by the Hong Kong Securities and Futures
Commission. Recipients of this research in Hong Kong may contact DHK in respect of any matter arising from or in connection with this research. Relevant Relationship (DHK) DHK may from time to time have an individual employed by or associated with it serves as an officer of any of the companies under its research coverage.
Singapore This research is distributed in Singapore by Daiwa Capital Markets Singapore Limited and it may only be distributed in Singapore to accredited investors, expert investors and institutional investors as defined in the Financial Advisers Regulations and the Securities and Futures Act (Chapter 289), as amended from time to time. By virtue of distribution to these category of investors, Daiwa Capital Markets Singapore Limited and its representatives are not required to comply with Section 36 of the Financial Advisers Act (Chapter 110) (Section 36 relates to disclosure of Daiwa Capital Markets Singapore Limited’s interest and/or its representative’s interest in securities). Recipients of this research in Singapore may contact Daiwa Capital Markets Singapore Limited in respect of any matter arising from or in connection with the research. Australia
This research is distributed in Australia by Daiwa Capital Markets Australia Limited and it may only be distributed in Australia to wholesale investors within the meaning of the Corporations Act. Recipients of this research in Australia may contact Daiwa Capital Markets Stockbroking Limited in respect of any matter arising from or in connection with the research. India This research is distributed in India to Institutional Clients only by Daiwa Capital Markets India Private Limited (Daiwa India) which is an intermediary registered with Securities & Exchange Board of India as a Stock Broker, Merchant Bank and Research Analyst. Daiwa India, its Research Analyst and their family members and its associates do not have any financial interest save as disclosed or other undisclosed material conflict of interest in the securities or derivatives of any companies under coverage. Daiwa India and its associates, may have received compensation for any products other than Investment Banking (as disclosed)or brokerage services from the subject company in this report or from any third party during the past 12 months. Daiwa India and its associates may have debt holdings in the subject company. For information on ownership of equity, please visit BlueMatrix disclosure Link at https://daiwa3.bluematrix.com/sellside/Disclosures.action.
There is no material disciplinary action against Daiwa India by any regulatory authority impacting equity research analysis activities as of the date of this report.
Associates of Daiwa India, registered with Indian regulators, include Daiwa Capital Markets Singapore Limited and Daiwa Portfolio Advisory (India) Private Limited. Taiwan
This research is solely for reference and not intended to provide tailored investment recommendations. This research is distributed in Taiwan by Daiwa-Cathay Capital Markets Co., Ltd. and it may only be distributed in Taiwan to specific customers who have signed recommendation contracts with Daiwa-Cathay Capital Markets Co., Ltd. and non-customers including (i) professional institutional investors, (ii) TWSE or TPEx listed companies, upstream and downstream vendors, and specialists that offer or seek advice, and (iii) potential customers with an actual need for business development in accordance with the Operational Regulations Governing Securities Firms Recommending Trades in Securities to Customers. Recipients of this research including non-customer recipients of this research shall not provide it to others or engage in any activities in connection with this research which may involve conflicts of interests. Neither Daiwa-Cathay Capital Markets Co., Ltd. nor its personnel who writes or reviews the research report has any conflict of interest in this research. Since Daiwa-Cathay Capital Markets Co., Ltd. does not operate brokerage trading business in foreign markets, this research is prepared on a “without recommendation” to any foreign securities basis and Daiwa-Cathay Capital Markets Co., Ltd. does not accept orders from customers to trade in such foreign securities that are without recommendation. Recipients of this research in Taiwan may contact Daiwa-Cathay Capital Markets Co., Ltd. in respect of any matter arising from or in connection with the research. Philippines This research is distributed in the Philippines by DBP-Daiwa Capital Markets Philippines, Inc. which is regulated by the Philippines Securities and Exchange Commission and the Phil ippines Stock Exchange, Inc. Recipients of this research in the Philippines may contact DBP-Daiwa Capital Markets Philippines, Inc. in respect of any matter arising from or in connection with the research. DBP-Daiwa Capital Markets Philippines, Inc. recommends that investors independently assess, with a professional advisor, the specific financial risks as well as the legal, regulatory, tax, accounting, and other consequences of a proposed transaction. DBP-Daiwa Capital Markets Philippines, Inc. may have positions or may be materially interested in the securities in any of the markets mentioned in the publication or may have performed other services for the issuers of such securities.
For relevant securities and trading rules please visit SEC and PSE links at http://www.sec.gov.ph and http://www.pse.com.ph/ respectively. Thailand
This research is distributed to only institutional investors in Thailand primarily by Thanachart Securities Public Company Limited (“TNS”).
This report is prepared by analysts who are employed by Daiwa Securities Group Inc. and/or its non-U.S. affiliates. This report is provided to you for informational purposes only and it is not, and is not to be construed as, an offer or an invitation to make an offer to sell or buy any securities. Neither TNS, Daiwa Securities Group Inc. nor any of their respective parent, holding, subsidiaries or affiliates, nor any of their respective directors, officers, servants and employees accept any liability whatsoever for any direct or consequential loss arising from any use of this research or its contents.
The information and opinions contained herein have been compiled or arrived at from sources believed to be reliable. However, TNS, Daiwa Securities Group Inc. nor any of their respective parent, holding, subsidiaries or affiliates, nor any of their respective directors, officers, servants and employees make no representation or warranty, express or implied, as to their accuracy or completeness. Expressions of opinion herein are subject to change without notice. The use of any information, forecasts and opinions contained in this report shall be at the sole discretion and risk of the user.
TNS, Daiwa Securities Group Inc., their respective parent, holding, subsidiaries or affiliates, their respective directors, officers, servants and employees may have positions and financial interest in securities mentioned in this research. Thanachart Securities Public Company Limited, Daiwa Securities Group Inc., their respective parent, holding, subsidiaries or affiliates may from time to time perform investment banking or other services for, or solicit investment banking or other business from, any entity mentioned in this research. Therefore, investors should be aware of conflict of interest that may affect the objectivity of this research.

76
Hang Lung Properties: comeback time?: 21 May 2018 Hang Lung Properties (101 HK): 21 May 2018
United Kingdom This research report is produced by Daiwa Securities Co. Ltd. and/or its affiliates and is distributed in the European Union, Iceland, Liechtenstein, Norway and Switzerland. Daiwa Capital Markets Europe Limited is authorised and regulated by The Financial Conduct Authority (“FCA”) and is a member of the London Stock Exchange and Eurex. This publication is intended for investors who are not Retail Clients in the United Kingdom within the meaning of the Rules of the FCA and should not therefore be distributed to such Retail Clients in the United Kingdom. Should you enter into investment business with Daiwa Capital Markets Europe’s affiliates outside the United Kingdom, we are obliged to advise that the protection afforded by the United Kingdom regulatory system may not apply; in particular, the benefits of the Financial Services Compensation Scheme may not be available. Daiwa Capital Markets Europe Limited has in place organisational arrangements for the prevention and avoidance of conflicts of interest. Our conflict management policy is available at http://www.uk.daiwacm.com/about-us/corporate-governance-regulatory. Germany This document is distributed in Germany by Daiwa Capital Markets Europe Limited, Niederlassung Frankfurt which is regulated by BaFin (Bundesanstalt fuer Finanzdienstleistungsaufsicht) for the conduct of business in Germany. Bahrain This research material is distributed in Bahrain by Daiwa Capital Markets Europe Limited, Bahrain Branch, regulated by The Central Bank of Bahrain and holds Investment Business Firm – Category 2 license and having its official place of business at the Bahrain World Trade Centre, South Tower, 7th floor, P.O. Box 30069, Manama, Kingdom of Bahrain. Tel No. +973 17534452 Fax No. +973 535113 United States
This research is distributed into the United States directly by Daiwa Capital Markets Hong Kong Limited and indirectly by Daiwa Capital Markets America Inc. (DCMA), a U.S. Securities and Exchange Commission registered broker-dealer and FINRA member firm, exclusively to “major U.S. institutional investors”, as defined under Rule 15a-6 promulgated under the U.S. Securities Exchange Act of 1934, as amended, and as interpreted by the staff of the U.S. Securities and Exchange Commission (SEC). This report is not an offer to sell or the solicitation of any offer to buy securities. U.S. customers wishing to effect transactions in any designated investment discussed in this report should do so through a qualified salesperson of DCMA. Non-U.S. customers wishing to effect transactions in any designated investment discussed in this report should contact a Daiwa entity in their local jurisdiction. The securities or other investment products discussed in this report may not be eligible for sale in some jurisdictions.
Analysts employed outside the U.S., as specifically indicated elsewhere in this report, are not registered as research analysts with FINRA. These analysts may not be associated persons of DCMA, and therefore may not be subject to FINRA Rule 2241 restrictions on communications with a subject company, public appearances and trading securities held by a research analyst account.
ADDITIONAL IMPORTANT DISCLOSURES CAN BE FOUND AT:
https://daiwa3.bluematrix.com/sellside/Disclosures.action
Ownership of Securities For “Ownership of Securities” information please visit BlueMatrix disclosure link at https://daiwa3.bluematrix.com/sellside/Disclosures.action.
Investment Banking Relationships For “Investment Banking Relationships” please visit BlueMatrix disclosure link at https://daiwa3.bluematrix.com/sellside/Disclosures.action.
DCMA Market Making For “DCMA Market Making” please visit BlueMatrix disclosure link at https://daiwa3.bluematrix.com/sellside/Disclosures.action. Research Analyst Conflicts For updates on “Research Analyst Conflicts” please visit BlueMatrix disclosure link at https://daiwa3.bluematrix.com/sellside/Disclosures.action. The principal research analysts who prepared this report have no financial interest in securities of the issuers covered in the report, are not (nor are any members of their household) an officer, director or advisory board member of the issuer(s) covered in the report, and are not aware of any material relevant conflict of interest involving the analyst or DCMA, and did not receive any compensation from the issuer during the past 12 months except as noted: no exceptions. Research Analyst Certification For updates on “Research Analyst Certification” and “Rating System” please visit BlueMatrix disclosure link at https://daiwa3.bluematrix.com/sellside/Disclosures.action. The views about any and all of the subject securities and issuers expressed in this Research Report accurately reflect the personal views of the research analyst(s) primarily responsible for this report (or the views of the firm producing the report if no individual analyst is named on the report); and no part of the compensation of such analyst (or no part of the compensation of the firm i f no individual analyst is named on the report) was, is, or will be directly or indirectly related to the specific recommendations or views contained in this Research Report. The following explains the rating system in the report as compared to relevant local indices, unless otherwise stated, based on the beliefs of the author of the report. "1": the security could outperform the local index by more than 15% over the next 12 months. "2": the security is expected to outperform the local index by 5-15% over the next 12 months. "3": the security is expected to perform within 5% of the local index (better or worse) over the next 12 months. "4": the security is expected to underperform the local index by 5-15% over the next 12 months. "5": the security could underperform the local index by more than 15% over the next 12 months.
Disclosure of investment ratings
Rating Percentage of total
Buy* 68.4%
Hold** 21.2%
Sell*** 10.4%
Source: Daiwa
Notes: data is for single-branded Daiwa research in Asia (ex Japan) and correct as of 31 March 2018. * comprised of Daiwa’s Buy and Outperform ratings. ** comprised of Daiwa’s Hold ratings. *** comprised of Daiwa’s Underperform and Sell ratings. Additional information may be available upon request. Japan - additional notification items pursuant to Article 37 of the Financial Instruments and Exchange Law
(This Notification is only applicable where report is distributed by Daiwa Securities Co. Ltd.) If you decide to enter into a business arrangement with us based on the information described in materials presented along with this document, we ask you to pay close attention to the following items.
In addition to the purchase price of a financial instrument, we will collect a trading commission* for each transaction as agreed beforehand with you. Since commissions may be included in the purchase price or may not be charged for certain transactions, we recommend that you confirm the commission for each transaction.
In some cases, we may also charge a maximum of ¥ 2 million (including tax) per year as a standing proxy fee for our deposit of your securities, if you are a non-resident of Japan.
For derivative and margin transactions etc., we may require collateral or margin requirements in accordance with an agreement made beforehand with you. Ordinarily in such cases, the amount of the transaction will be in excess of the required collateral or margin requirements.
There is a risk that you will incur losses on your transactions due to changes in the market price of financial instruments based on fluctuations in interest rates, exchange rates, stock prices, real estate prices, commodity prices, and others. In addition, depending on the content of the transaction, the loss could exceed the amount of the collateral or margin requirements.
There may be a difference between bid price etc. and ask price etc. of OTC derivatives handled by us.
Before engaging in any trading, please thoroughly confirm accounting and tax treatments regarding your trading in financial instruments with such experts as certified public accountants. *The amount of the trading commission cannot be stated here in advance because it will be determined between our company and you based on current market conditions and the content of each transaction etc.
When making an actual transaction, please be sure to carefully read the materials presented to you prior to the execution of agreement, and to take responsibility for your own decisions regarding the signing of the agreement with us. Corporate Name: Daiwa Securities Co. Ltd. Financial instruments firm: chief of Kanto Local Finance Bureau (Kin-sho) No.108 Memberships: Japan Securities Dealers Association, The Financial Futures Association of Japan Japan Securities Investment Advisers Association Type II Financial Instruments Firms Association